Northwest Harbor, NY Map & Demographics
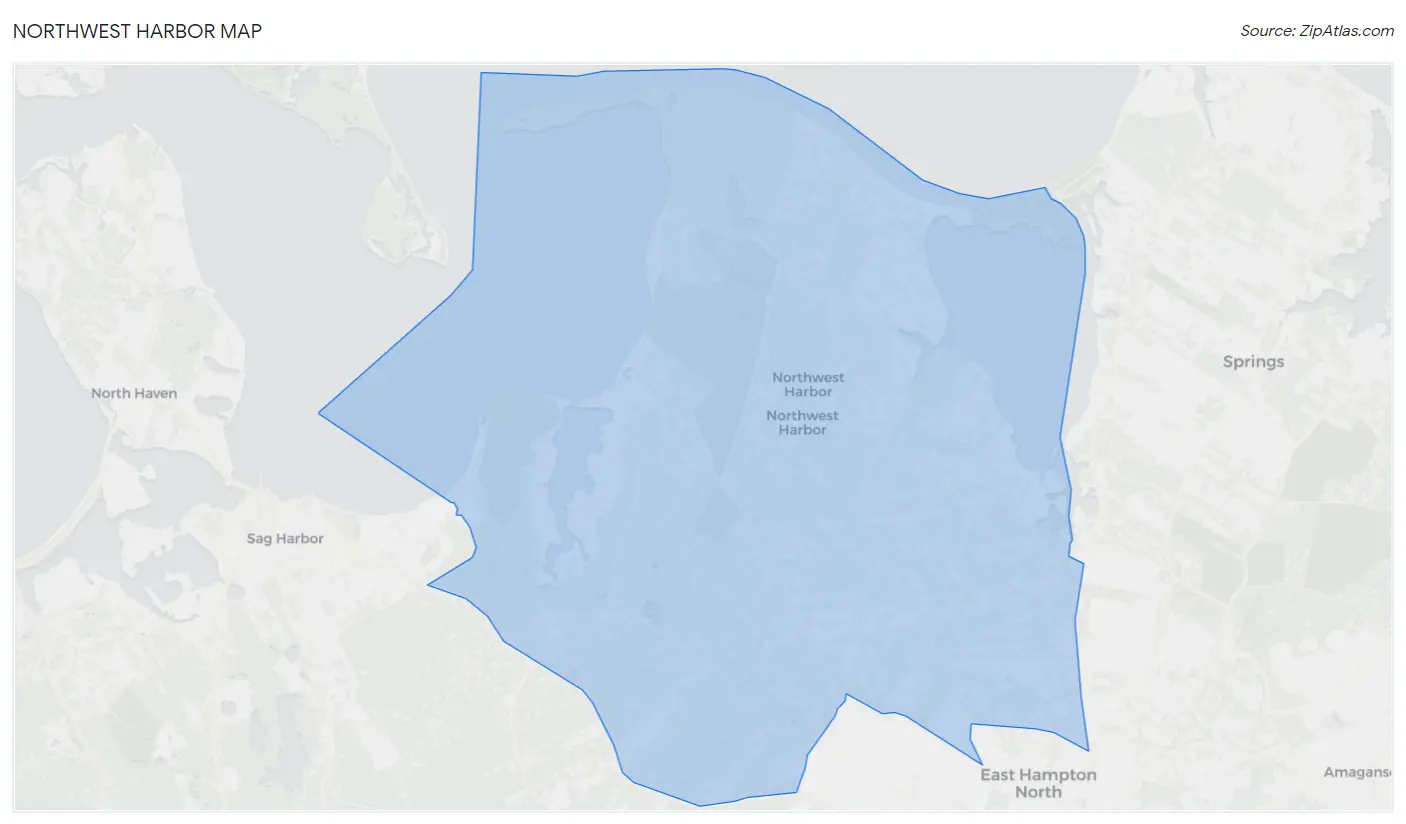
Northwest Harbor Map
Northwest Harbor Overview
$94,458
PER CAPITA INCOME
$147,266
AVG FAMILY INCOME
$127,315
AVG HOUSEHOLD INCOME
0.58
INEQUALITY / GINI INDEX
4,771
TOTAL POPULATION
2,176
MALE POPULATION
2,595
FEMALE POPULATION
83.85
MALES / 100 FEMALES
119.26
FEMALES / 100 MALES
47.5
MEDIAN AGE
2.8
AVG FAMILY SIZE
2.2
AVG HOUSEHOLD SIZE
2,447
LABOR FORCE [ PEOPLE ]
61.9%
PERCENT IN LABOR FORCE
7.0%
UNEMPLOYMENT RATE
Income in Northwest Harbor
Income Overview in Northwest Harbor
Per Capita Income in Northwest Harbor is $94,458, while median incomes of families and households are $147,266 and $127,315 respectively.
| Characteristic | Number | Measure |
| Per Capita Income | 4,771 | $94,458 |
| Median Family Income | 1,363 | $147,266 |
| Mean Family Income | 1,363 | $231,061 |
| Median Household Income | 2,110 | $127,315 |
| Mean Household Income | 2,110 | $212,937 |
| Income Deficit | 1,363 | $0 |
| Wage / Income Gap (%) | 4,771 | 0.00% |
| Wage / Income Gap ($) | 4,771 | 100.00¢ per $1 |
| Gini / Inequality Index | 4,771 | 0.58 |
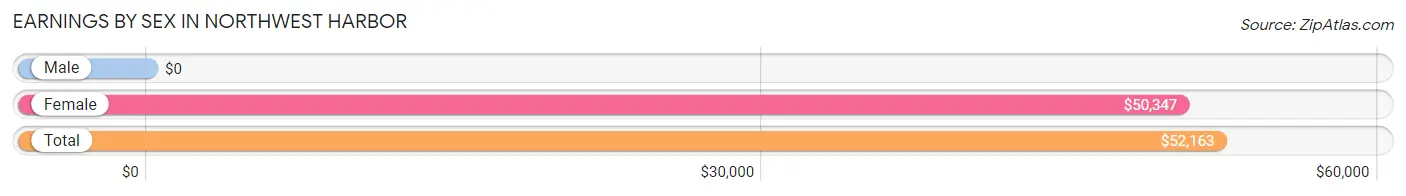
Earnings by Sex in Northwest Harbor
| Sex | Number | Average Earnings |
| Male | 1,315 (52.5%) | $0 |
| Female | 1,188 (47.5%) | $50,347 |
| Total | 2,503 (100.0%) | $52,163 |
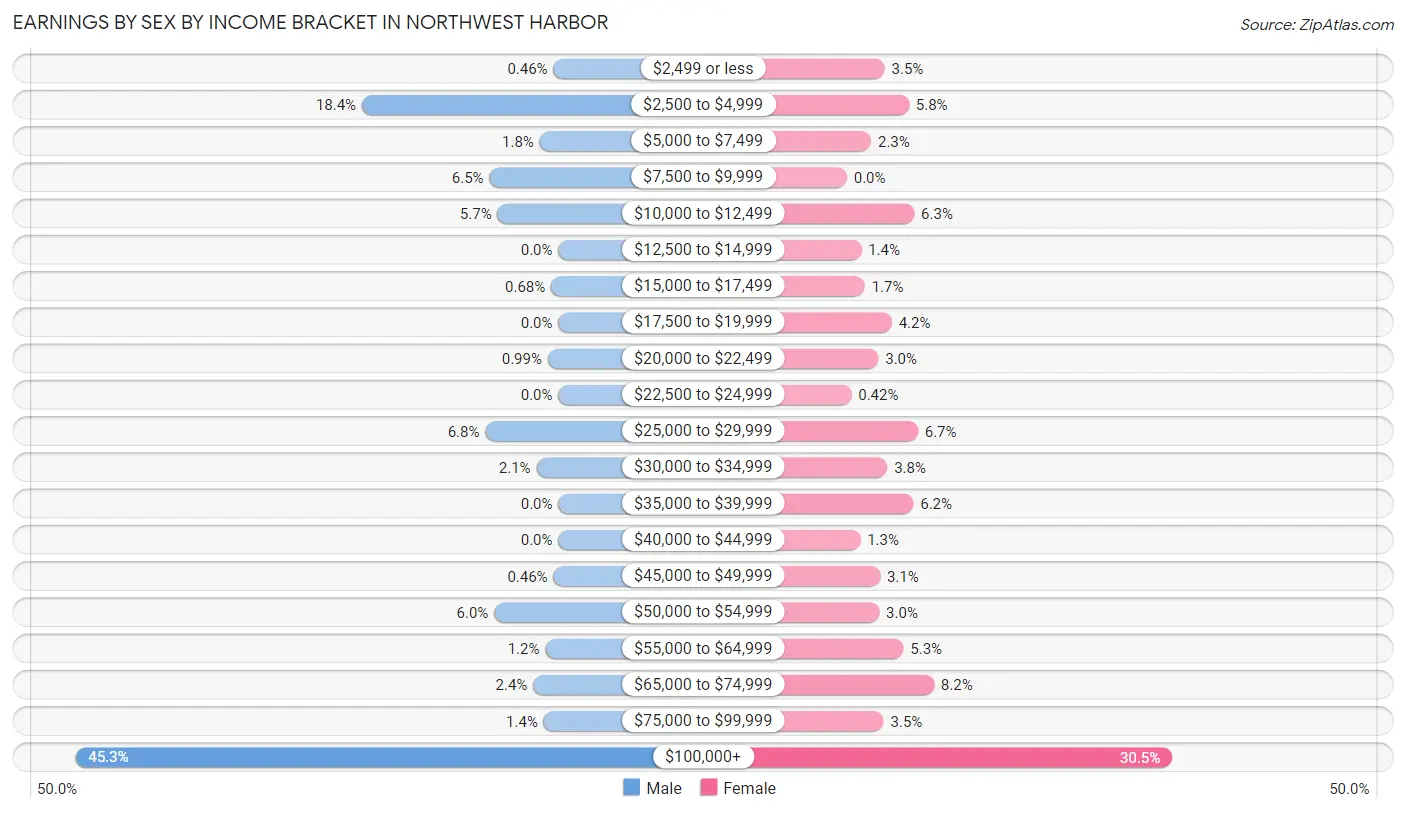
Earnings by Sex by Income Bracket in Northwest Harbor
The most common earnings brackets in Northwest Harbor are $100,000+ for men (595 | 45.3%) and $100,000+ for women (362 | 30.5%).
| Income | Male | Female |
| $2,499 or less | 6 (0.5%) | 42 (3.5%) |
| $2,500 to $4,999 | 242 (18.4%) | 69 (5.8%) |
| $5,000 to $7,499 | 23 (1.8%) | 27 (2.3%) |
| $7,500 to $9,999 | 85 (6.5%) | 0 (0.0%) |
| $10,000 to $12,499 | 75 (5.7%) | 75 (6.3%) |
| $12,500 to $14,999 | 0 (0.0%) | 16 (1.3%) |
| $15,000 to $17,499 | 9 (0.7%) | 20 (1.7%) |
| $17,500 to $19,999 | 0 (0.0%) | 50 (4.2%) |
| $20,000 to $22,499 | 13 (1.0%) | 35 (2.9%) |
| $22,500 to $24,999 | 0 (0.0%) | 5 (0.4%) |
| $25,000 to $29,999 | 90 (6.8%) | 79 (6.7%) |
| $30,000 to $34,999 | 27 (2.1%) | 45 (3.8%) |
| $35,000 to $39,999 | 0 (0.0%) | 74 (6.2%) |
| $40,000 to $44,999 | 0 (0.0%) | 15 (1.3%) |
| $45,000 to $49,999 | 6 (0.5%) | 37 (3.1%) |
| $50,000 to $54,999 | 79 (6.0%) | 36 (3.0%) |
| $55,000 to $64,999 | 16 (1.2%) | 63 (5.3%) |
| $65,000 to $74,999 | 31 (2.4%) | 97 (8.2%) |
| $75,000 to $99,999 | 18 (1.4%) | 41 (3.5%) |
| $100,000+ | 595 (45.3%) | 362 (30.5%) |
| Total | 1,315 (100.0%) | 1,188 (100.0%) |
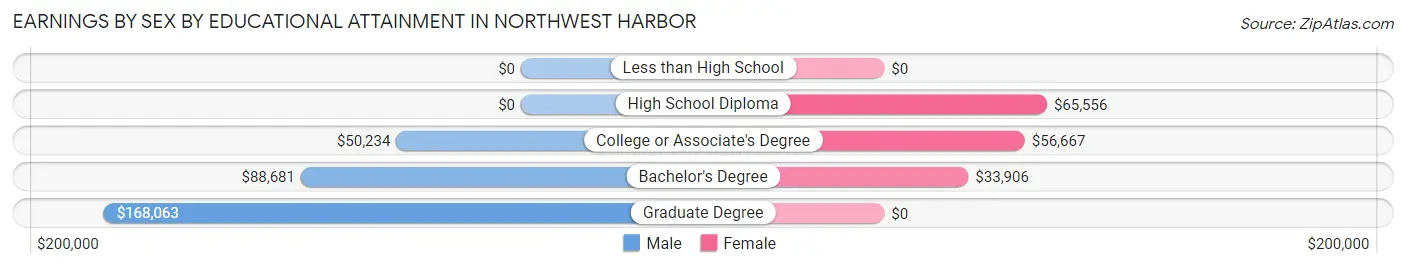
Earnings by Sex by Educational Attainment in Northwest Harbor
| Educational Attainment | Male Income | Female Income |
| Less than High School | - | - |
| High School Diploma | - | - |
| College or Associate's Degree | $50,234 | $56,667 |
| Bachelor's Degree | $88,681 | $33,906 |
| Graduate Degree | $168,063 | $0 |
| Total | - | - |
Family Income in Northwest Harbor
Family Income Brackets in Northwest Harbor
According to the Northwest Harbor family income data, there are 466 families falling into the $200,000+ income range, which is the most common income bracket and makes up 34.2% of all families. Conversely, the $10,000 to $14,999 income bracket is the least frequent group with only 12 families (0.9%) belonging to this category.
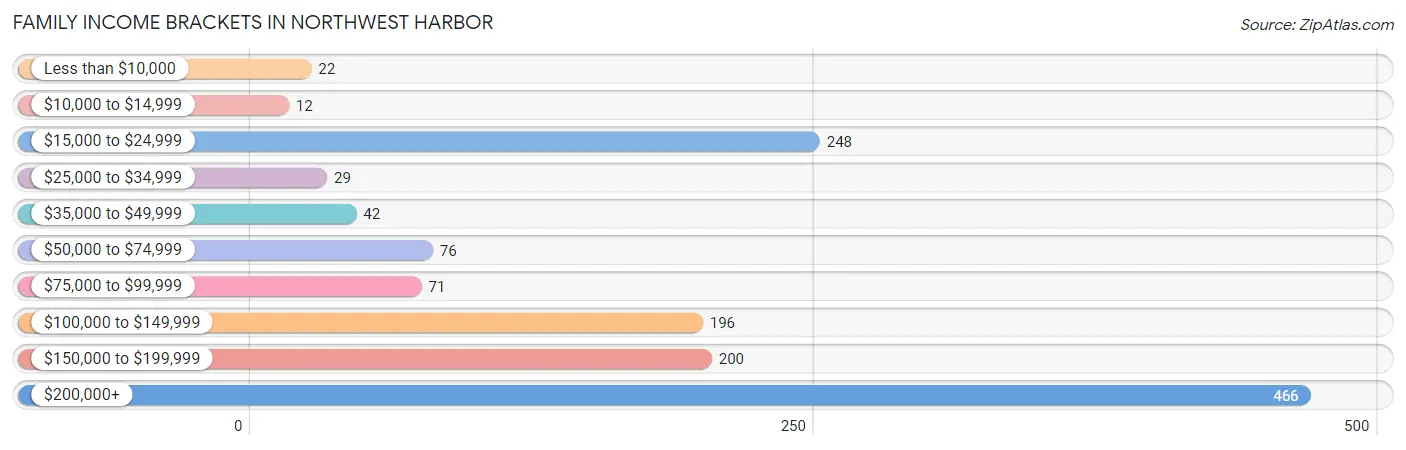
| Income Bracket | # Families | % Families |
| Less than $10,000 | 22 | 1.6% |
| $10,000 to $14,999 | 12 | 0.9% |
| $15,000 to $24,999 | 248 | 18.2% |
| $25,000 to $34,999 | 29 | 2.1% |
| $35,000 to $49,999 | 42 | 3.1% |
| $50,000 to $74,999 | 76 | 5.6% |
| $75,000 to $99,999 | 71 | 5.2% |
| $100,000 to $149,999 | 196 | 14.4% |
| $150,000 to $199,999 | 200 | 14.7% |
| $200,000+ | 466 | 34.2% |
Family Income by Famaliy Size in Northwest Harbor
4-person families (53 | 3.9%) account for the highest median family income in Northwest Harbor with $250,001 per family, while 2-person families (824 | 60.5%) have the highest median income of $77,426 per family member.
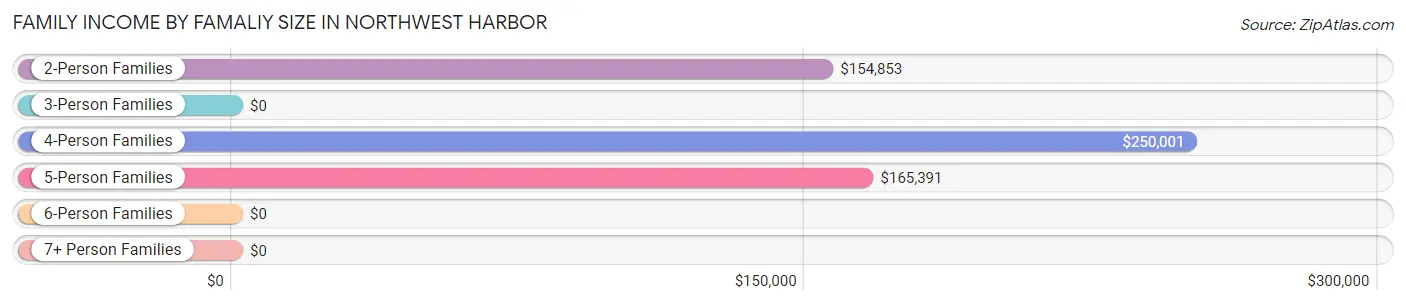
| Income Bracket | # Families | Median Income |
| 2-Person Families | 824 (60.5%) | $154,853 |
| 3-Person Families | 335 (24.6%) | $0 |
| 4-Person Families | 53 (3.9%) | $250,001 |
| 5-Person Families | 65 (4.8%) | $165,391 |
| 6-Person Families | 86 (6.3%) | $0 |
| 7+ Person Families | 0 (0.0%) | $0 |
| Total | 1,363 (100.0%) | $147,266 |
Family Income by Number of Earners in Northwest Harbor
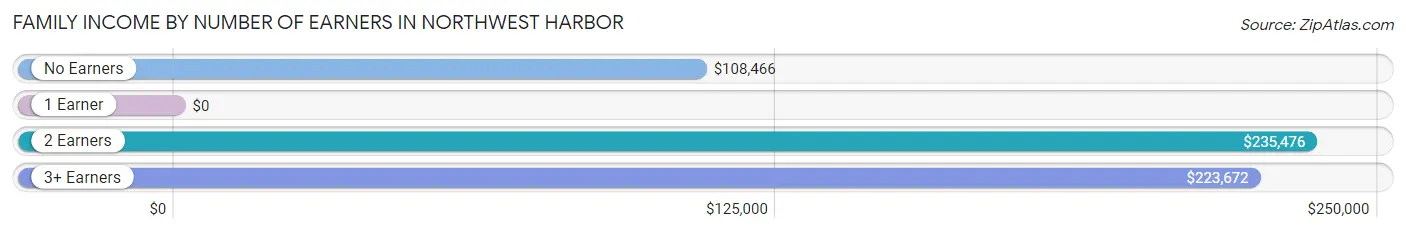
| Number of Earners | # Families | Median Income |
| No Earners | 303 (22.2%) | $108,466 |
| 1 Earner | 417 (30.6%) | $0 |
| 2 Earners | 570 (41.8%) | $235,476 |
| 3+ Earners | 73 (5.4%) | $223,672 |
| Total | 1,363 (100.0%) | $147,266 |
Household Income in Northwest Harbor
Household Income Brackets in Northwest Harbor
With 715 households falling in the category, the $200,000+ income range is the most frequent in Northwest Harbor, accounting for 33.9% of all households. In contrast, only 46 households (2.2%) fall into the $25,000 to $34,999 income bracket, making it the least populous group.
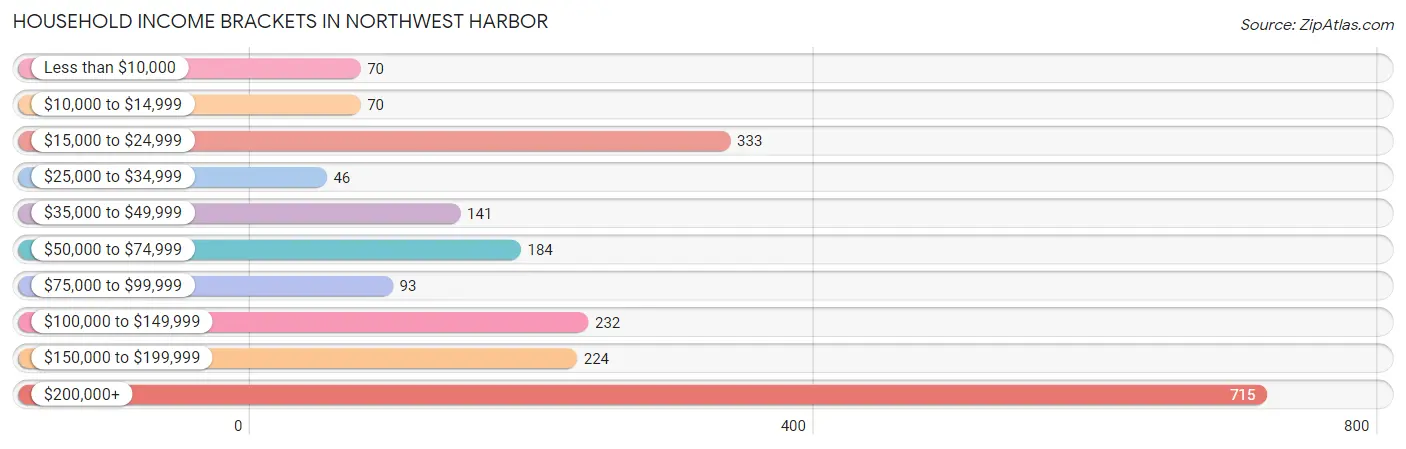
| Income Bracket | # Households | % Households |
| Less than $10,000 | 70 | 3.3% |
| $10,000 to $14,999 | 70 | 3.3% |
| $15,000 to $24,999 | 333 | 15.8% |
| $25,000 to $34,999 | 46 | 2.2% |
| $35,000 to $49,999 | 141 | 6.7% |
| $50,000 to $74,999 | 184 | 8.7% |
| $75,000 to $99,999 | 93 | 4.4% |
| $100,000 to $149,999 | 232 | 11.0% |
| $150,000 to $199,999 | 224 | 10.6% |
| $200,000+ | 715 | 33.9% |
Household Income by Householder Age in Northwest Harbor
The median household income in Northwest Harbor is $127,315, with the highest median household income of $160,329 found in the 45 to 64 years age bracket for the primary householder. A total of 893 households (42.3%) fall into this category. Meanwhile, the 15 to 24 years age bracket for the primary householder has the lowest median household income of $0, with 23 households (1.1%) in this group.
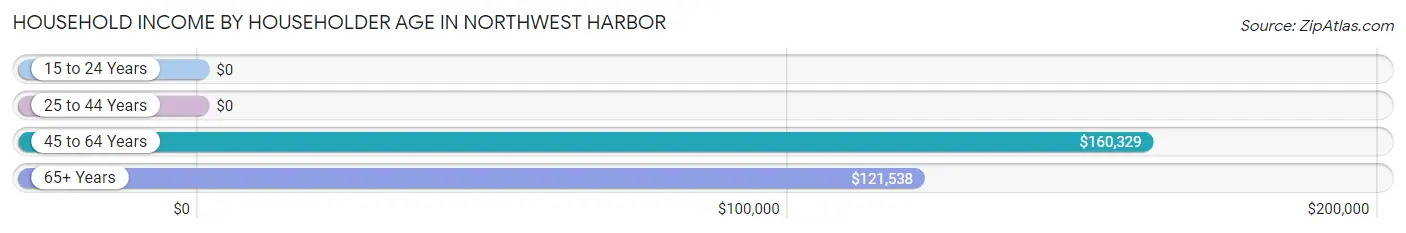
| Income Bracket | # Households | Median Income |
| 15 to 24 Years | 23 (1.1%) | $0 |
| 25 to 44 Years | 440 (20.8%) | $0 |
| 45 to 64 Years | 893 (42.3%) | $160,329 |
| 65+ Years | 754 (35.7%) | $121,538 |
| Total | 2,110 (100.0%) | $127,315 |
Poverty in Northwest Harbor
Income Below Poverty by Sex and Age in Northwest Harbor
With 17.4% poverty level for males and 28.0% for females among the residents of Northwest Harbor, 35 to 44 year old males and under 5 year old females are the most vulnerable to poverty, with 229 males (56.1%) and 250 females (66.0%) in their respective age groups living below the poverty level.
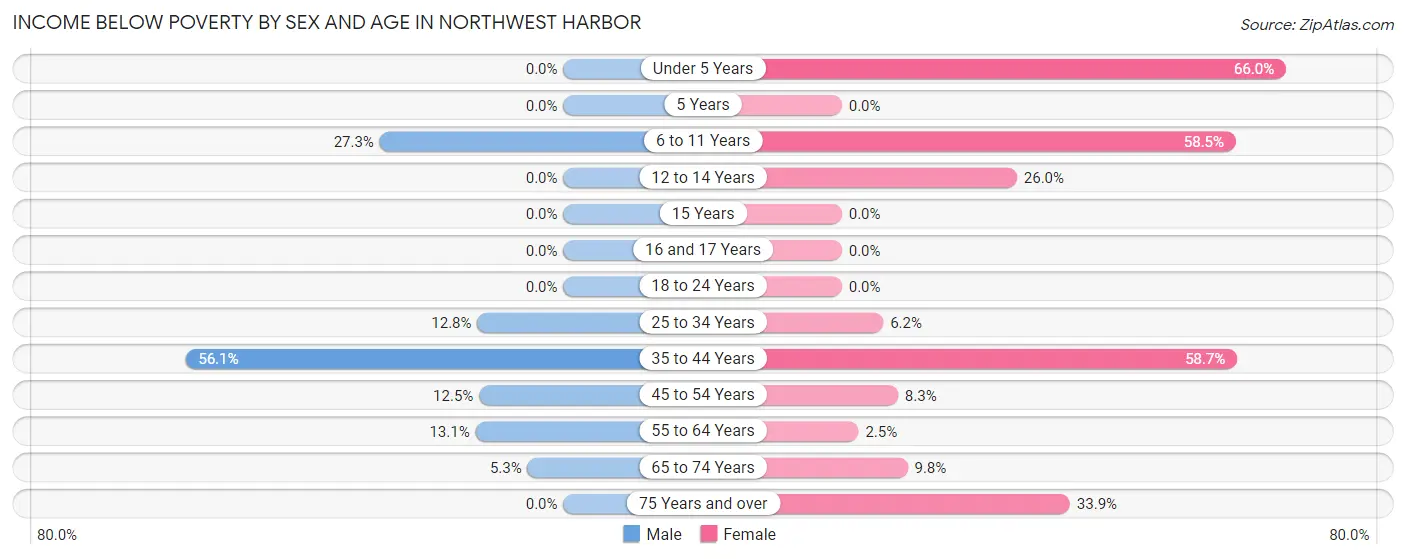
| Age Bracket | Male | Female |
| Under 5 Years | 0 (0.0%) | 250 (66.0%) |
| 5 Years | 0 (0.0%) | 0 (0.0%) |
| 6 to 11 Years | 27 (27.3%) | 55 (58.5%) |
| 12 to 14 Years | 0 (0.0%) | 26 (26.0%) |
| 15 Years | 0 (0.0%) | 0 (0.0%) |
| 16 and 17 Years | 0 (0.0%) | 0 (0.0%) |
| 18 to 24 Years | 0 (0.0%) | 0 (0.0%) |
| 25 to 34 Years | 18 (12.8%) | 12 (6.1%) |
| 35 to 44 Years | 229 (56.1%) | 246 (58.7%) |
| 45 to 54 Years | 22 (12.5%) | 23 (8.3%) |
| 55 to 64 Years | 62 (13.1%) | 11 (2.5%) |
| 65 to 74 Years | 21 (5.3%) | 40 (9.8%) |
| 75 Years and over | 0 (0.0%) | 63 (33.9%) |
| Total | 379 (17.4%) | 726 (28.0%) |
Income Above Poverty by Sex and Age in Northwest Harbor
According to the poverty statistics in Northwest Harbor, males aged under 5 years and females aged 15 years are the age groups that are most secure financially, with 100.0% of males and 100.0% of females in these age groups living above the poverty line.
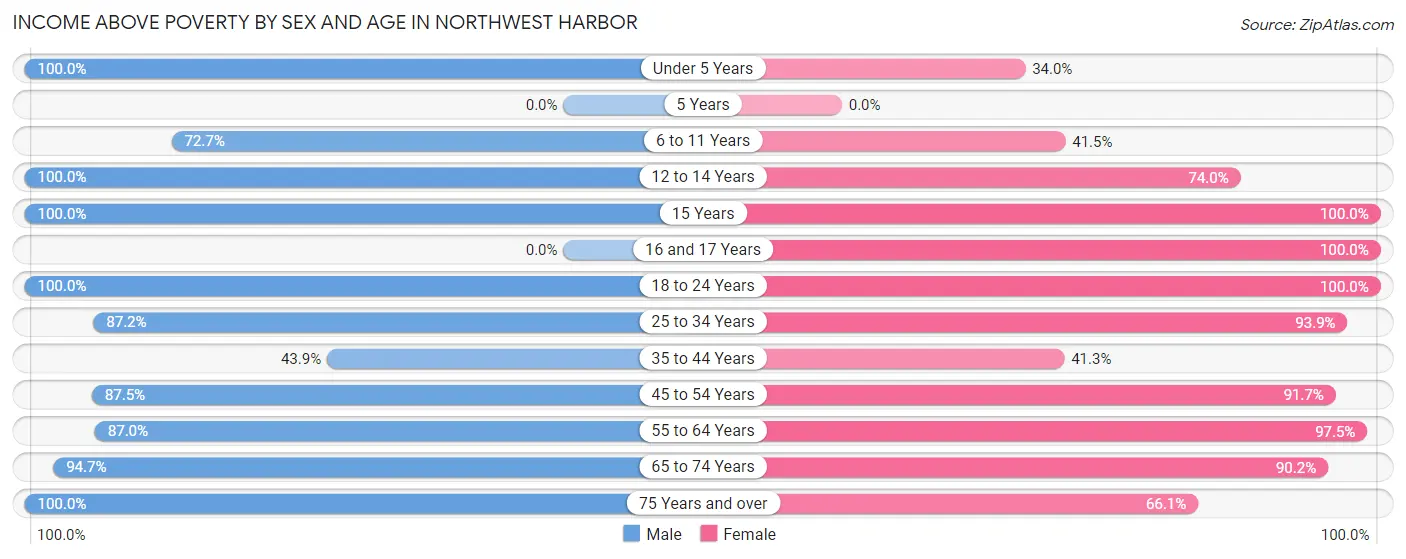
| Age Bracket | Male | Female |
| Under 5 Years | 54 (100.0%) | 129 (34.0%) |
| 5 Years | 0 (0.0%) | 0 (0.0%) |
| 6 to 11 Years | 72 (72.7%) | 39 (41.5%) |
| 12 to 14 Years | 65 (100.0%) | 74 (74.0%) |
| 15 Years | 13 (100.0%) | 14 (100.0%) |
| 16 and 17 Years | 0 (0.0%) | 16 (100.0%) |
| 18 to 24 Years | 130 (100.0%) | 63 (100.0%) |
| 25 to 34 Years | 123 (87.2%) | 183 (93.9%) |
| 35 to 44 Years | 179 (43.9%) | 173 (41.3%) |
| 45 to 54 Years | 154 (87.5%) | 253 (91.7%) |
| 55 to 64 Years | 413 (87.0%) | 432 (97.5%) |
| 65 to 74 Years | 374 (94.7%) | 370 (90.2%) |
| 75 Years and over | 220 (100.0%) | 123 (66.1%) |
| Total | 1,797 (82.6%) | 1,869 (72.0%) |
Income Below Poverty Among Married-Couple Families in Northwest Harbor
The poverty statistics for married-couple families in Northwest Harbor show that 22.8% or 270 of the total 1,187 families live below the poverty line. Families with 1 or 2 children have the highest poverty rate of 76.9%, comprising of 227 families. On the other hand, families with no children have the lowest poverty rate of 2.6%, which includes 21 families.
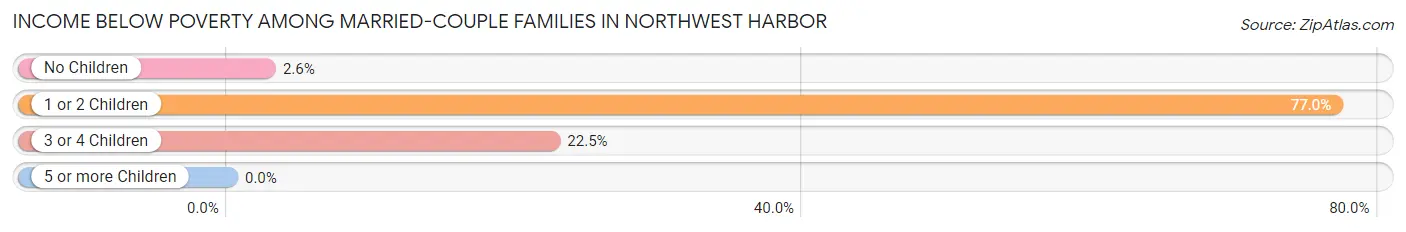
| Children | Above Poverty | Below Poverty |
| No Children | 773 (97.4%) | 21 (2.6%) |
| 1 or 2 Children | 68 (23.1%) | 227 (76.9%) |
| 3 or 4 Children | 76 (77.5%) | 22 (22.5%) |
| 5 or more Children | 0 (0.0%) | 0 (0.0%) |
| Total | 917 (77.2%) | 270 (22.8%) |
Income Below Poverty Among Single-Parent Households in Northwest Harbor
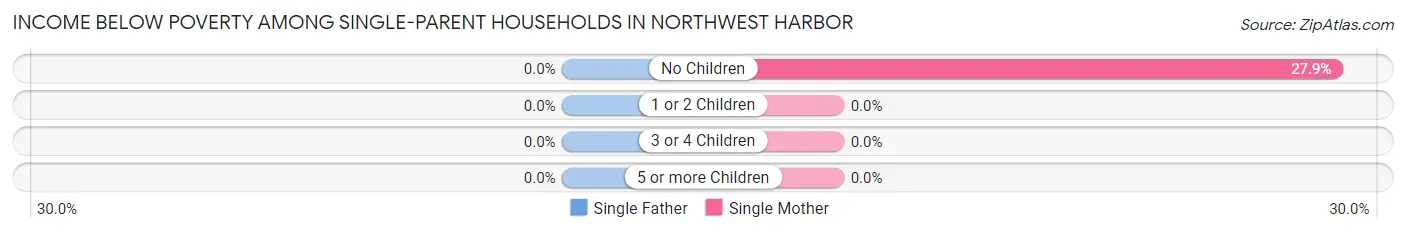
| Children | Single Father | Single Mother |
| No Children | 0 (0.0%) | 12 (27.9%) |
| 1 or 2 Children | 0 (0.0%) | 0 (0.0%) |
| 3 or 4 Children | 0 (0.0%) | 0 (0.0%) |
| 5 or more Children | 0 (0.0%) | 0 (0.0%) |
| Total | 0 (0.0%) | 12 (10.0%) |
Income Below Poverty Among Married-Couple vs Single-Parent Households in Northwest Harbor
The poverty data for Northwest Harbor shows that 270 of the married-couple family households (22.8%) and 12 of the single-parent households (6.8%) are living below the poverty level. Within the married-couple family households, those with 1 or 2 children have the highest poverty rate, with 227 households (76.9%) falling below the poverty line. Among the single-parent households, those with no children have the highest poverty rate, with 12 household (18.2%) living below poverty.
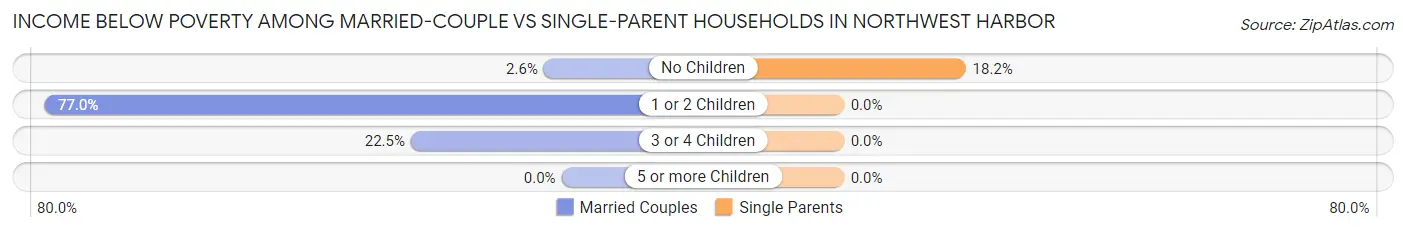
| Children | Married-Couple Families | Single-Parent Households |
| No Children | 21 (2.6%) | 12 (18.2%) |
| 1 or 2 Children | 227 (76.9%) | 0 (0.0%) |
| 3 or 4 Children | 22 (22.5%) | 0 (0.0%) |
| 5 or more Children | 0 (0.0%) | 0 (0.0%) |
| Total | 270 (22.8%) | 12 (6.8%) |
Race in Northwest Harbor
The most populous races in Northwest Harbor are White / Caucasian (3,175 | 66.5%), Hispanic or Latino (1,374 | 28.8%), and Two or more Races (828 | 17.3%).
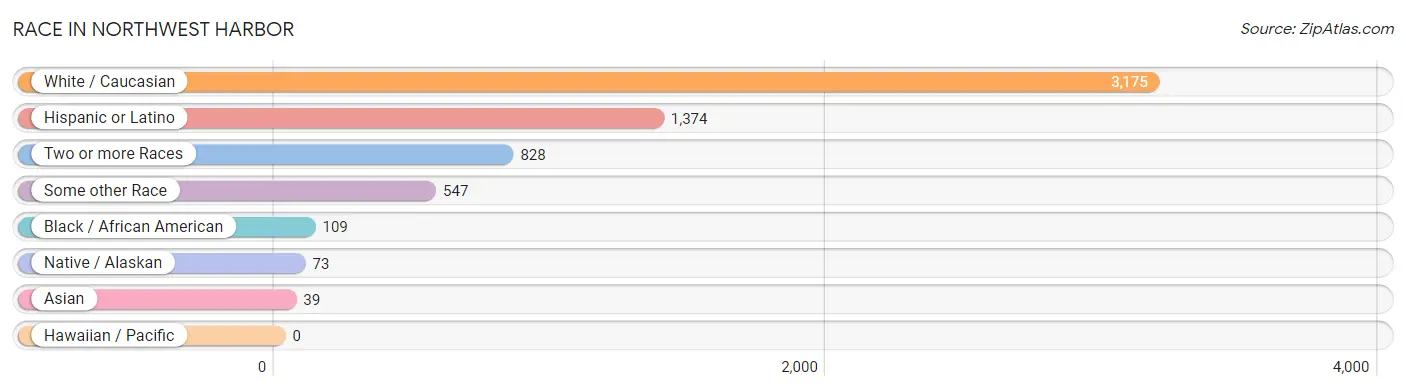
| Race | # Population | % Population |
| Asian | 39 | 0.8% |
| Black / African American | 109 | 2.3% |
| Hawaiian / Pacific | 0 | 0.0% |
| Hispanic or Latino | 1,374 | 28.8% |
| Native / Alaskan | 73 | 1.5% |
| White / Caucasian | 3,175 | 66.5% |
| Two or more Races | 828 | 17.3% |
| Some other Race | 547 | 11.5% |
| Total | 4,771 | 100.0% |
Ancestry in Northwest Harbor
The most populous ancestries reported in Northwest Harbor are Irish (765 | 16.0%), Central American (726 | 15.2%), Costa Rican (706 | 14.8%), German (625 | 13.1%), and Italian (567 | 11.9%), together accounting for 71.0% of all Northwest Harbor residents.
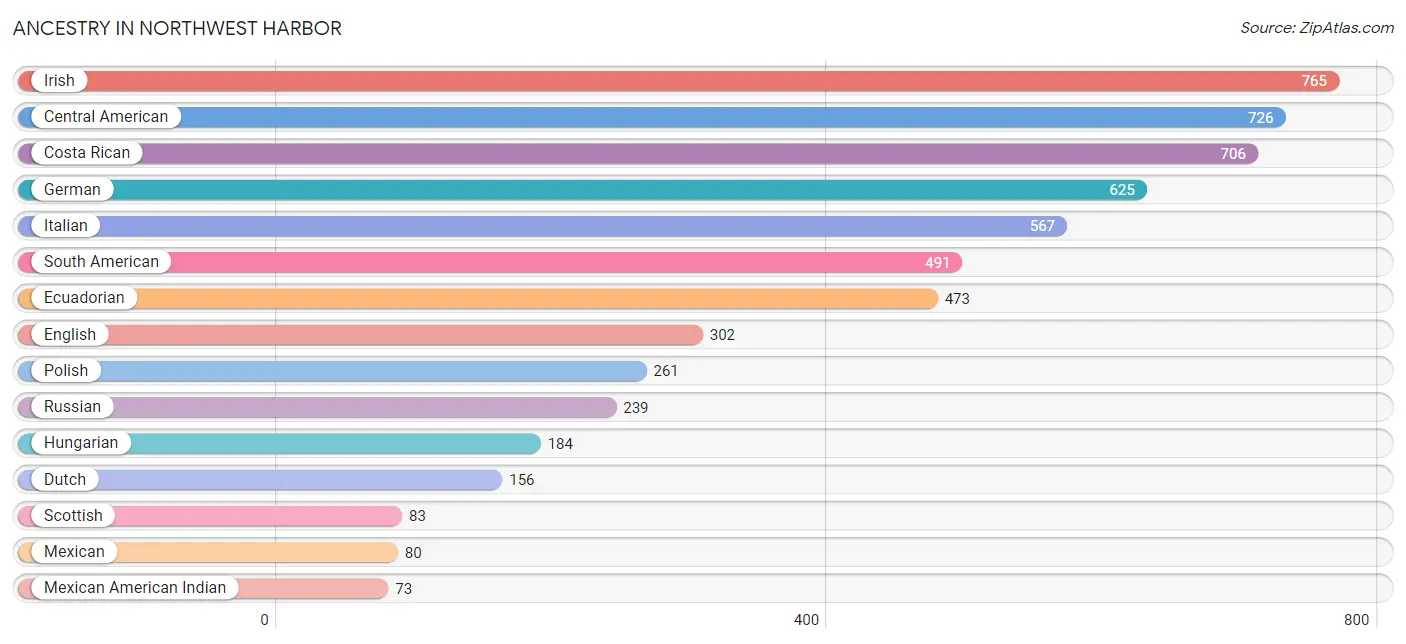
| Ancestry | # Population | % Population |
| African | 23 | 0.5% |
| Alsatian | 13 | 0.3% |
| American | 63 | 1.3% |
| Arab | 70 | 1.5% |
| Austrian | 11 | 0.2% |
| British | 35 | 0.7% |
| Celtic | 23 | 0.5% |
| Central American | 726 | 15.2% |
| Colombian | 18 | 0.4% |
| Costa Rican | 706 | 14.8% |
| Dominican | 13 | 0.3% |
| Dutch | 156 | 3.3% |
| Eastern European | 60 | 1.3% |
| Ecuadorian | 473 | 9.9% |
| English | 302 | 6.3% |
| European | 20 | 0.4% |
| Finnish | 23 | 0.5% |
| French | 53 | 1.1% |
| French Canadian | 16 | 0.3% |
| German | 625 | 13.1% |
| Greek | 64 | 1.3% |
| Guatemalan | 20 | 0.4% |
| Hungarian | 184 | 3.9% |
| Indian (Asian) | 37 | 0.8% |
| Irish | 765 | 16.0% |
| Italian | 567 | 11.9% |
| Lebanese | 64 | 1.3% |
| Lithuanian | 16 | 0.3% |
| Mexican | 80 | 1.7% |
| Mexican American Indian | 73 | 1.5% |
| Mongolian | 34 | 0.7% |
| Moroccan | 6 | 0.1% |
| Norwegian | 36 | 0.7% |
| Okinawan | 34 | 0.7% |
| Polish | 261 | 5.5% |
| Puerto Rican | 64 | 1.3% |
| Romanian | 5 | 0.1% |
| Russian | 239 | 5.0% |
| Scotch-Irish | 33 | 0.7% |
| Scottish | 83 | 1.7% |
| South American | 491 | 10.3% |
| Subsaharan African | 23 | 0.5% |
| Swedish | 73 | 1.5% |
| Thai | 19 | 0.4% |
| Trinidadian and Tobagonian | 37 | 0.8% |
| Ukrainian | 35 | 0.7% |
| Welsh | 19 | 0.4% | View All 47 Rows |
Immigrants in Northwest Harbor
The most numerous immigrant groups reported in Northwest Harbor came from Latin America (862 | 18.1%), Central America (556 | 11.7%), Costa Rica (456 | 9.6%), South America (306 | 6.4%), and Ecuador (288 | 6.0%), together accounting for 51.7% of all Northwest Harbor residents.
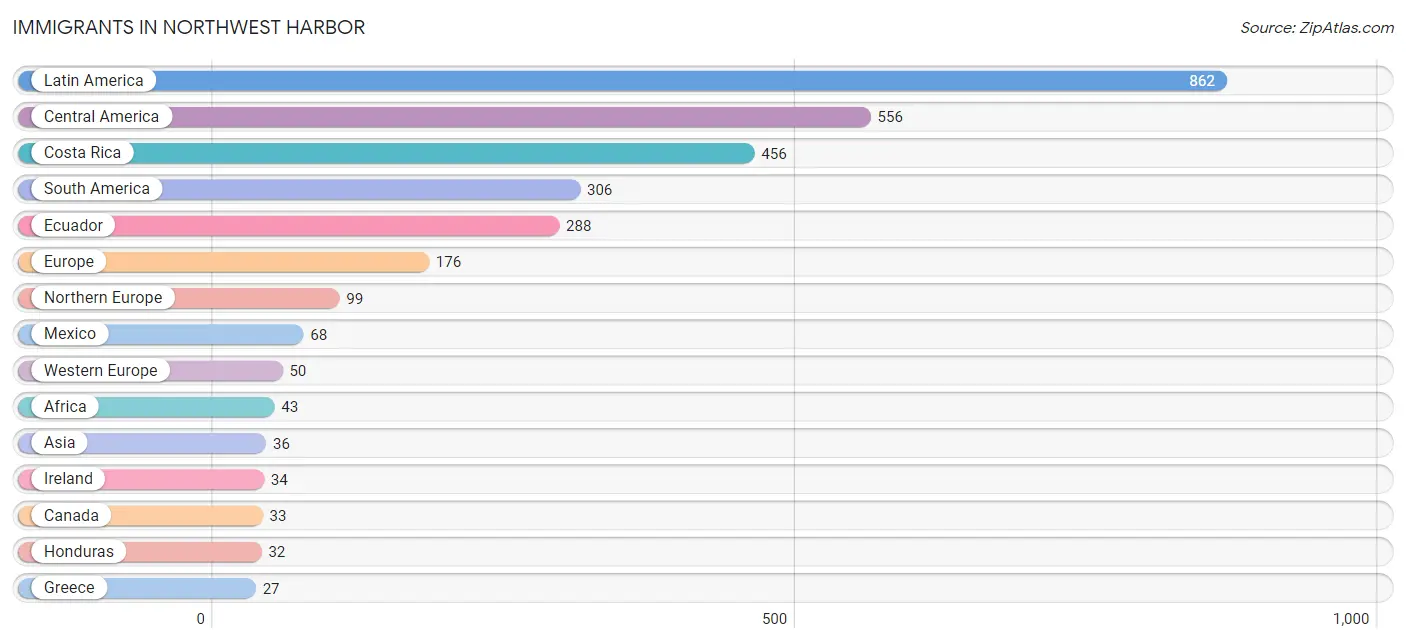
| Immigration Origin | # Population | % Population |
| Africa | 43 | 0.9% |
| Asia | 36 | 0.7% |
| Canada | 33 | 0.7% |
| Central America | 556 | 11.7% |
| Colombia | 18 | 0.4% |
| Costa Rica | 456 | 9.6% |
| Eastern Africa | 23 | 0.5% |
| Ecuador | 288 | 6.0% |
| England | 18 | 0.4% |
| Europe | 176 | 3.7% |
| France | 19 | 0.4% |
| Germany | 19 | 0.4% |
| Greece | 27 | 0.6% |
| Honduras | 32 | 0.7% |
| India | 19 | 0.4% |
| Ireland | 34 | 0.7% |
| Israel | 17 | 0.4% |
| Latin America | 862 | 18.1% |
| Mexico | 68 | 1.4% |
| Northern Europe | 99 | 2.1% |
| South Africa | 20 | 0.4% |
| South America | 306 | 6.4% |
| South Central Asia | 19 | 0.4% |
| Southern Europe | 27 | 0.6% |
| Sweden | 23 | 0.5% |
| Switzerland | 12 | 0.3% |
| Uganda | 23 | 0.5% |
| Western Asia | 17 | 0.4% |
| Western Europe | 50 | 1.1% | View All 29 Rows |
Sex and Age in Northwest Harbor
Sex and Age in Northwest Harbor
The most populous age groups in Northwest Harbor are 40 to 44 Years (338 | 15.5%) for men and Under 5 Years (379 | 14.6%) for women.
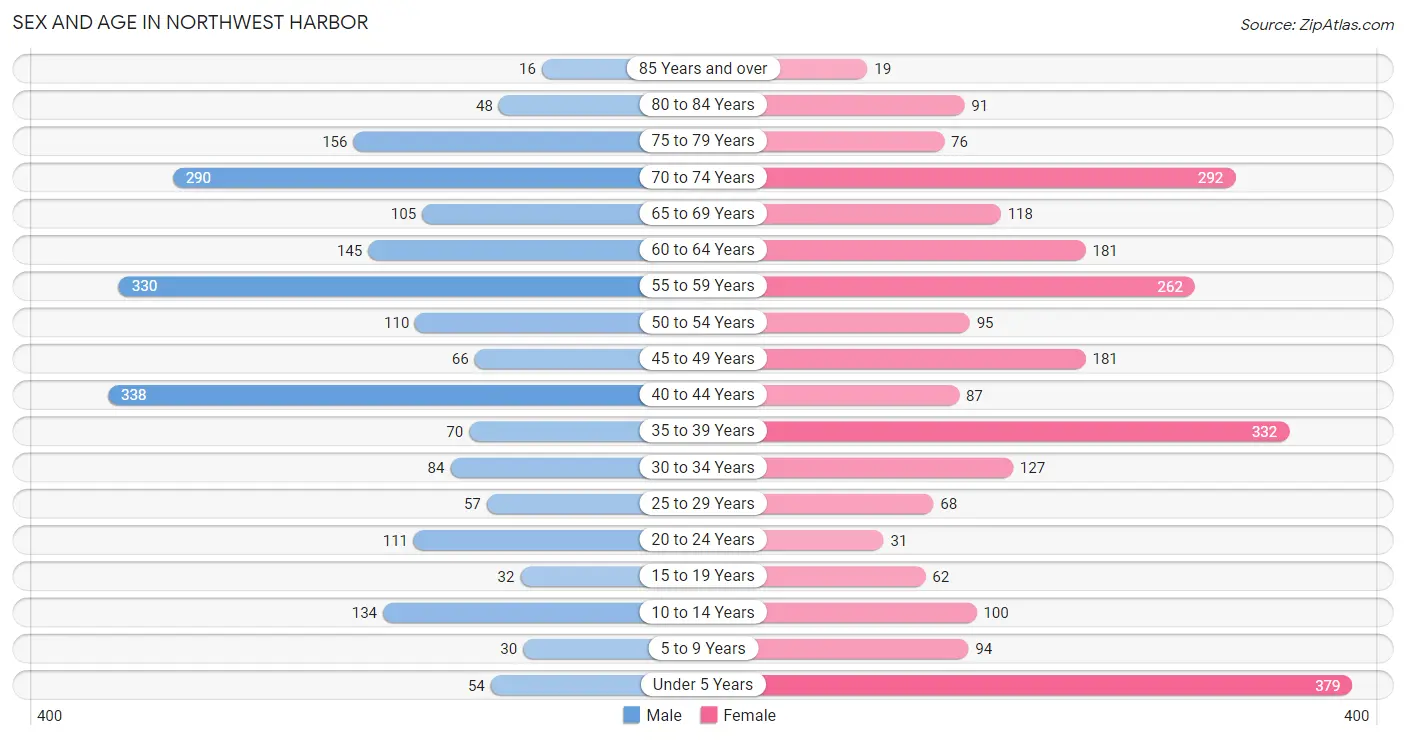
| Age Bracket | Male | Female |
| Under 5 Years | 54 (2.5%) | 379 (14.6%) |
| 5 to 9 Years | 30 (1.4%) | 94 (3.6%) |
| 10 to 14 Years | 134 (6.2%) | 100 (3.8%) |
| 15 to 19 Years | 32 (1.5%) | 62 (2.4%) |
| 20 to 24 Years | 111 (5.1%) | 31 (1.2%) |
| 25 to 29 Years | 57 (2.6%) | 68 (2.6%) |
| 30 to 34 Years | 84 (3.9%) | 127 (4.9%) |
| 35 to 39 Years | 70 (3.2%) | 332 (12.8%) |
| 40 to 44 Years | 338 (15.5%) | 87 (3.4%) |
| 45 to 49 Years | 66 (3.0%) | 181 (7.0%) |
| 50 to 54 Years | 110 (5.1%) | 95 (3.7%) |
| 55 to 59 Years | 330 (15.2%) | 262 (10.1%) |
| 60 to 64 Years | 145 (6.7%) | 181 (7.0%) |
| 65 to 69 Years | 105 (4.8%) | 118 (4.5%) |
| 70 to 74 Years | 290 (13.3%) | 292 (11.3%) |
| 75 to 79 Years | 156 (7.2%) | 76 (2.9%) |
| 80 to 84 Years | 48 (2.2%) | 91 (3.5%) |
| 85 Years and over | 16 (0.7%) | 19 (0.7%) |
| Total | 2,176 (100.0%) | 2,595 (100.0%) |
Families and Households in Northwest Harbor
Median Family Size in Northwest Harbor
The median family size in Northwest Harbor is 2.79 persons per family, with married-couple families (1,187 | 87.1%) accounting for the largest median family size of 2.83 persons per family. On the other hand, single male/father families (56 | 4.1%) represent the smallest median family size with 2.23 persons per family.
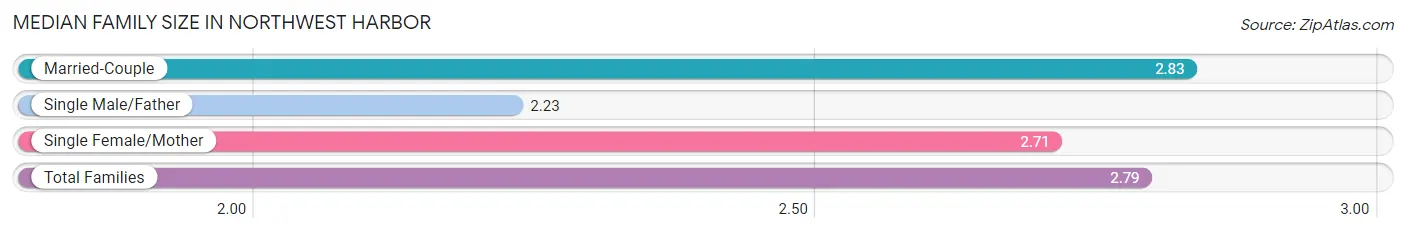
| Family Type | # Families | Family Size |
| Married-Couple | 1,187 (87.1%) | 2.83 |
| Single Male/Father | 56 (4.1%) | 2.23 |
| Single Female/Mother | 120 (8.8%) | 2.71 |
| Total Families | 1,363 (100.0%) | 2.79 |
Median Household Size in Northwest Harbor
The median household size in Northwest Harbor is 2.25 persons per household, with married-couple households (1,187 | 56.3%) accounting for the largest median household size of 2.88 persons per household. non-family households (747 | 35.4%) represent the smallest median household size with 1.12 persons per household.
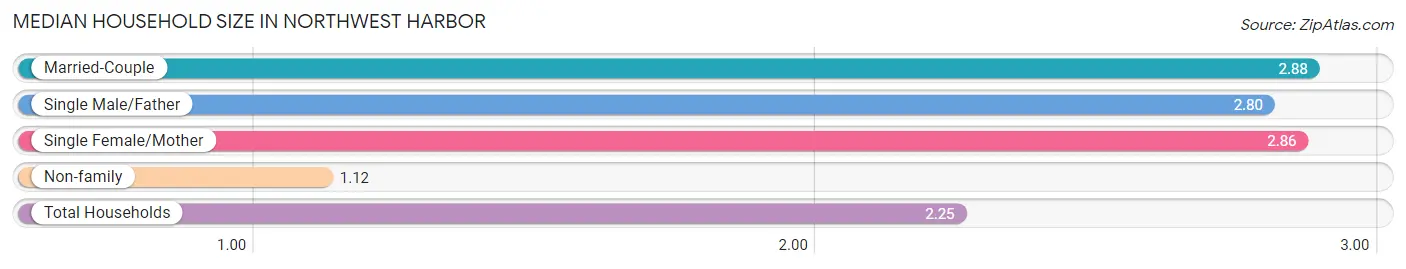
| Household Type | # Households | Household Size |
| Married-Couple | 1,187 (56.3%) | 2.88 |
| Single Male/Father | 56 (2.6%) | 2.80 |
| Single Female/Mother | 120 (5.7%) | 2.86 |
| Non-family | 747 (35.4%) | 1.12 |
| Total Households | 2,110 (100.0%) | 2.25 |
Household Size by Marriage Status in Northwest Harbor
Out of a total of 2,110 households in Northwest Harbor, 1,363 (64.6%) are family households, while 747 (35.4%) are nonfamily households. The most numerous type of family households are 2-person households, comprising 774, and the most common type of nonfamily households are 1-person households, comprising 671.
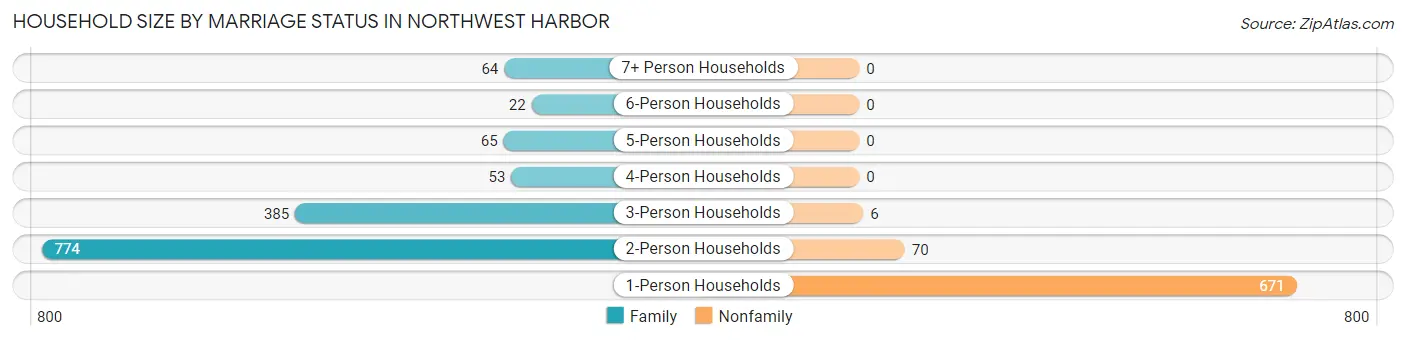
| Household Size | Family Households | Nonfamily Households |
| 1-Person Households | - | 671 (31.8%) |
| 2-Person Households | 774 (36.7%) | 70 (3.3%) |
| 3-Person Households | 385 (18.2%) | 6 (0.3%) |
| 4-Person Households | 53 (2.5%) | 0 (0.0%) |
| 5-Person Households | 65 (3.1%) | 0 (0.0%) |
| 6-Person Households | 22 (1.0%) | 0 (0.0%) |
| 7+ Person Households | 64 (3.0%) | 0 (0.0%) |
| Total | 1,363 (64.6%) | 747 (35.4%) |
Female Fertility in Northwest Harbor
Fertility by Age in Northwest Harbor
Average fertility rate in Northwest Harbor is 24.0 births per 1,000 women. Women in the age bracket of 35 to 50 years have the highest fertility rate with 35.0 births per 1,000 women. Women in the age bracket of 35 to 50 years acount for 100.0% of all women with births.
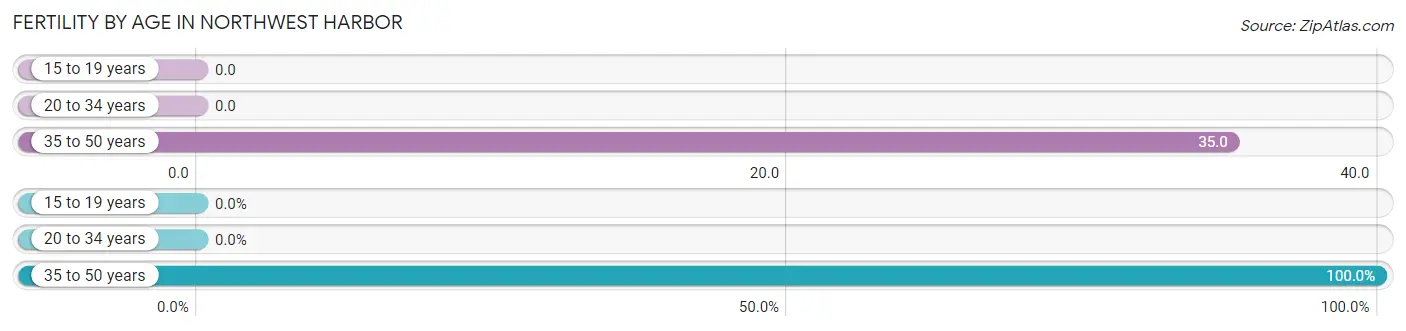
| Age Bracket | Women with Births | Births / 1,000 Women |
| 15 to 19 years | 0 (0.0%) | 0.0 |
| 20 to 34 years | 0 (0.0%) | 0.0 |
| 35 to 50 years | 21 (100.0%) | 35.0 |
| Total | 21 (100.0%) | 24.0 |
Fertility by Age by Marriage Status in Northwest Harbor
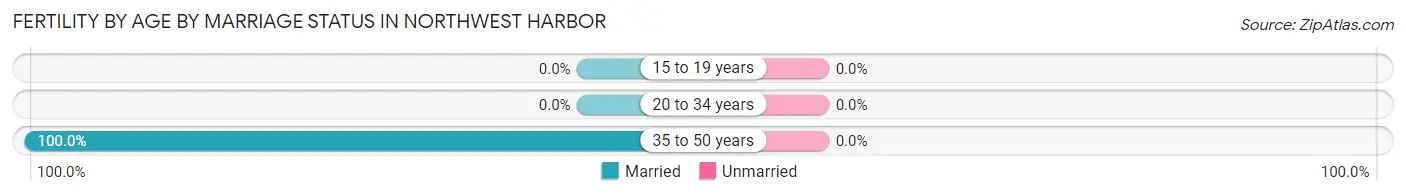
| Age Bracket | Married | Unmarried |
| 15 to 19 years | 0 (0.0%) | 0 (0.0%) |
| 20 to 34 years | 0 (0.0%) | 0 (0.0%) |
| 35 to 50 years | 21 (100.0%) | 0 (0.0%) |
| Total | 21 (100.0%) | 0 (0.0%) |
Fertility by Education in Northwest Harbor
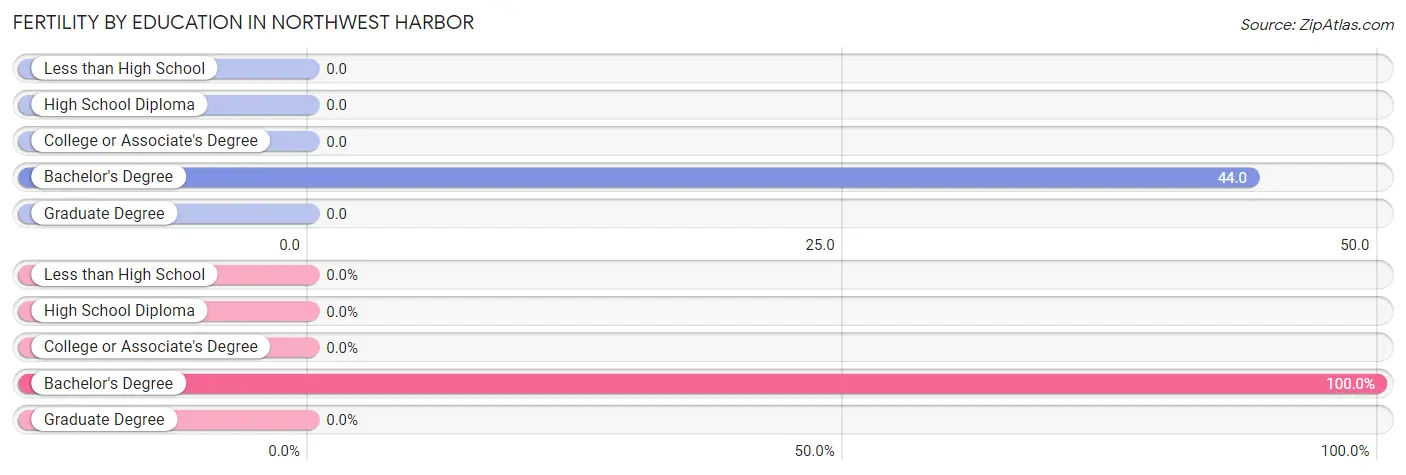
| Educational Attainment | Women with Births | Births / 1,000 Women |
| Less than High School | 0 (0.0%) | 0.0 |
| High School Diploma | 0 (0.0%) | 0.0 |
| College or Associate's Degree | 0 (0.0%) | 0.0 |
| Bachelor's Degree | 21 (100.0%) | 44.0 |
| Graduate Degree | 0 (0.0%) | 0.0 |
| Total | 21 (100.0%) | 24.0 |
Fertility by Education by Marriage Status in Northwest Harbor
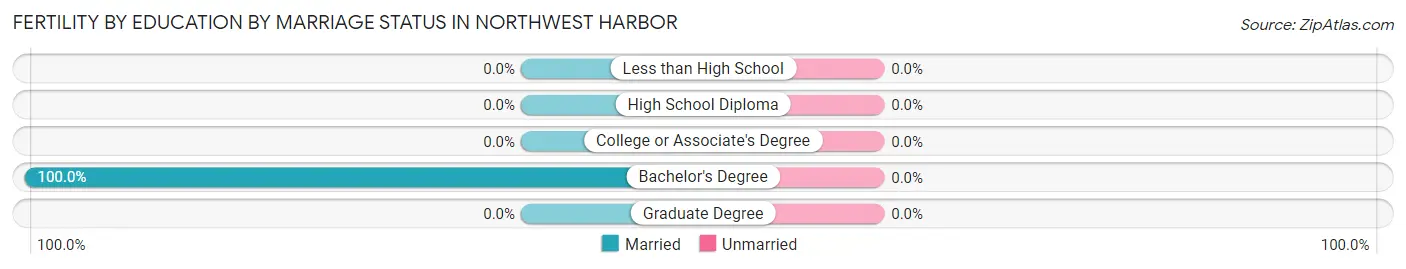
| Educational Attainment | Married | Unmarried |
| Less than High School | 0 (0.0%) | 0 (0.0%) |
| High School Diploma | 0 (0.0%) | 0 (0.0%) |
| College or Associate's Degree | 0 (0.0%) | 0 (0.0%) |
| Bachelor's Degree | 21 (100.0%) | 0 (0.0%) |
| Graduate Degree | 0 (0.0%) | 0 (0.0%) |
| Total | 21 (100.0%) | 0 (0.0%) |
Employment Characteristics in Northwest Harbor
Employment by Class of Employer in Northwest Harbor
Among the 2,027 employed individuals in Northwest Harbor, private company employees (1,045 | 51.5%), not-for-profit organizations (292 | 14.4%), and self-employed (incorporated) (286 | 14.1%) make up the most common classes of employment.
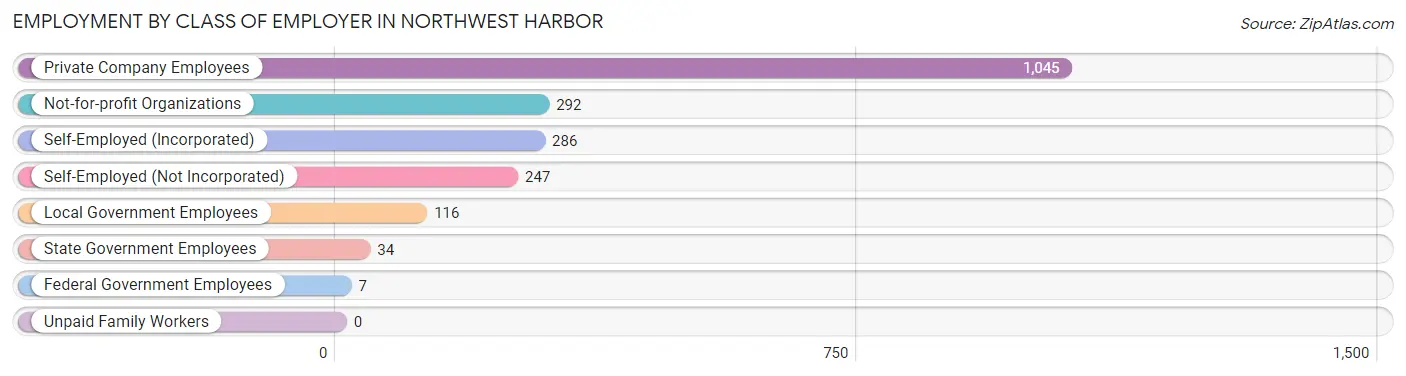
| Employer Class | # Employees | % Employees |
| Private Company Employees | 1,045 | 51.5% |
| Self-Employed (Incorporated) | 286 | 14.1% |
| Self-Employed (Not Incorporated) | 247 | 12.2% |
| Not-for-profit Organizations | 292 | 14.4% |
| Local Government Employees | 116 | 5.7% |
| State Government Employees | 34 | 1.7% |
| Federal Government Employees | 7 | 0.4% |
| Unpaid Family Workers | 0 | 0.0% |
| Total | 2,027 | 100.0% |
Employment Status by Age in Northwest Harbor
According to the labor force statistics for Northwest Harbor, out of the total population over 16 years of age (3,953), 61.9% or 2,447 individuals are in the labor force, with 7.0% or 171 of them unemployed. The age group with the highest labor force participation rate is 25 to 29 years, with 100.0% or 125 individuals in the labor force. Within the labor force, the 20 to 24 years age range has the highest percentage of unemployed individuals, with 100.0% or 112 of them being unemployed.
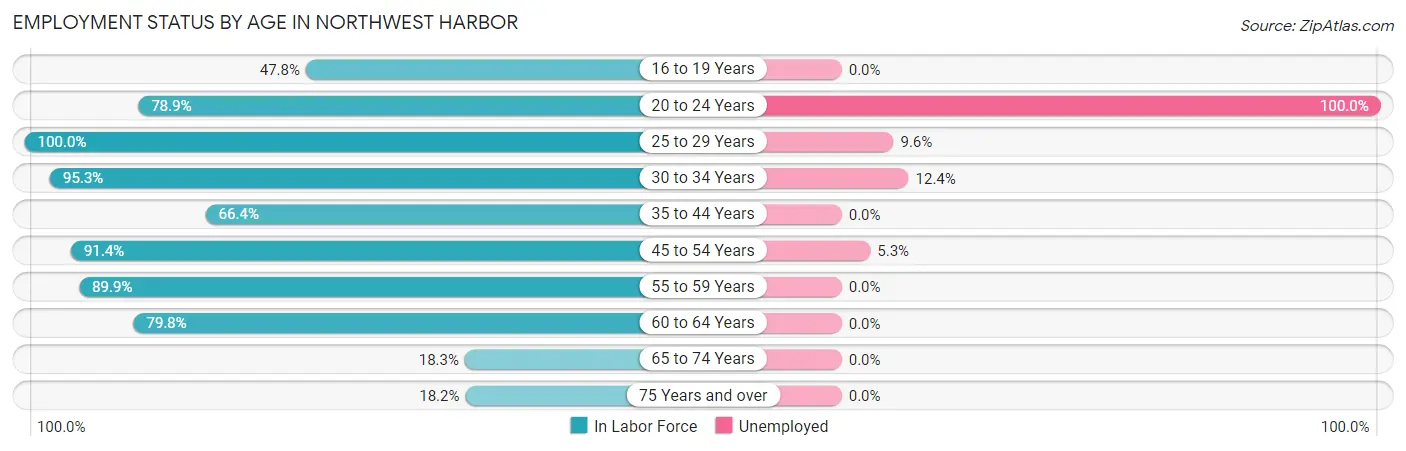
| Age Bracket | In Labor Force | Unemployed |
| 16 to 19 Years | 32 (47.8%) | 0 (0.0%) |
| 20 to 24 Years | 112 (78.9%) | 112 (100.0%) |
| 25 to 29 Years | 125 (100.0%) | 12 (9.6%) |
| 30 to 34 Years | 201 (95.3%) | 25 (12.4%) |
| 35 to 44 Years | 549 (66.4%) | 0 (0.0%) |
| 45 to 54 Years | 413 (91.4%) | 22 (5.3%) |
| 55 to 59 Years | 532 (89.9%) | 0 (0.0%) |
| 60 to 64 Years | 260 (79.8%) | 0 (0.0%) |
| 65 to 74 Years | 147 (18.3%) | 0 (0.0%) |
| 75 Years and over | 74 (18.2%) | 0 (0.0%) |
| Total | 2,447 (61.9%) | 171 (7.0%) |
Employment Status by Educational Attainment in Northwest Harbor
According to labor force statistics for Northwest Harbor, 82.1% of individuals (2,080) out of the total population between 25 and 64 years of age (2,533) are in the labor force, with 2.8% or 58 of them being unemployed. The group with the highest labor force participation rate are those with the educational attainment of less than high school, with 100.0% or 102 individuals in the labor force. Within the labor force, individuals with bachelor's degree or higher education have the highest percentage of unemployment, with 4.5% or 47 of them being unemployed.
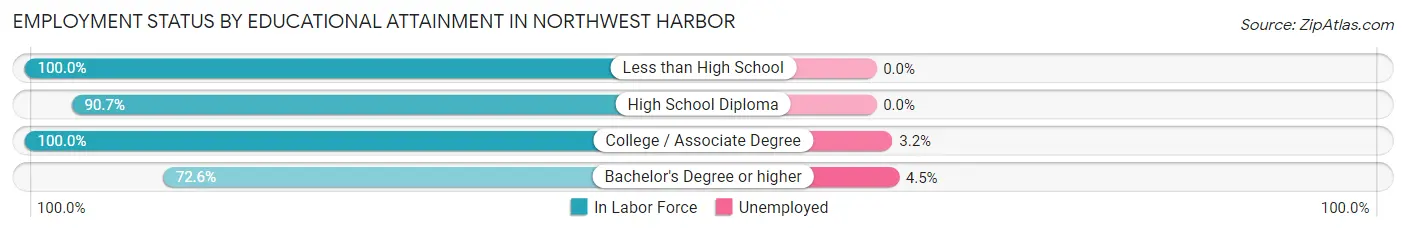
| Educational Attainment | In Labor Force | Unemployed |
| Less than High School | 102 (100.0%) | 0 (0.0%) |
| High School Diploma | 548 (90.7%) | 0 (0.0%) |
| College / Associate Degree | 379 (100.0%) | 12 (3.2%) |
| Bachelor's Degree or higher | 1,051 (72.6%) | 65 (4.5%) |
| Total | 2,080 (82.1%) | 71 (2.8%) |
Employment Occupations by Sex in Northwest Harbor
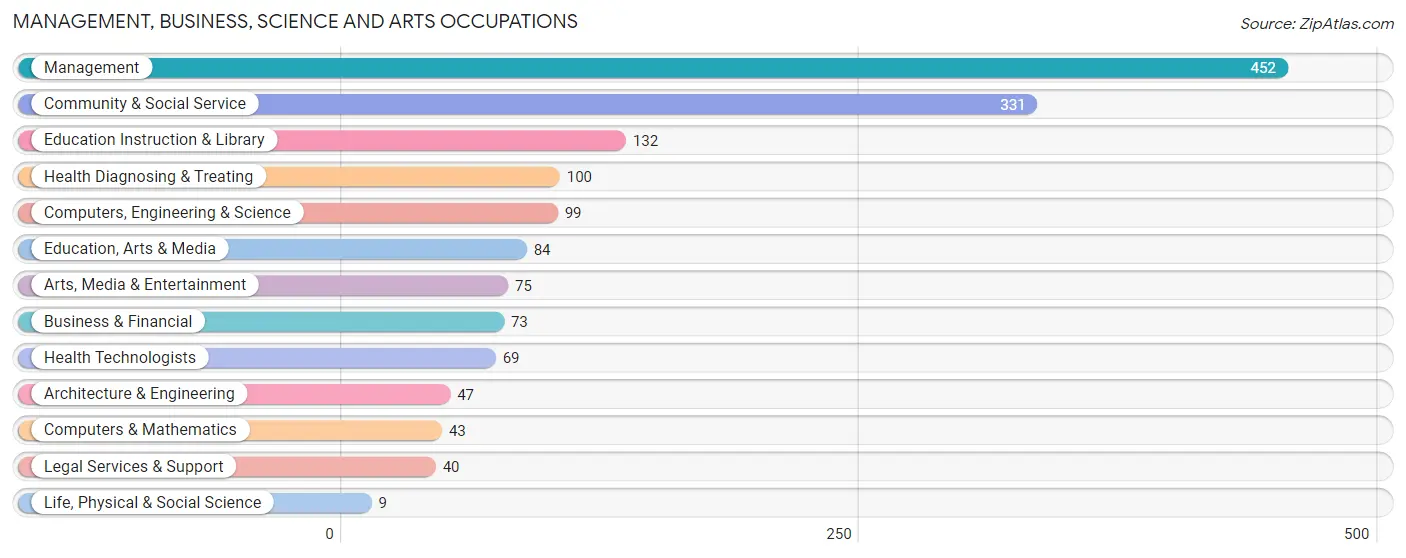
Management, Business, Science and Arts Occupations
The most common Management, Business, Science and Arts occupations in Northwest Harbor are Management (452 | 19.9%), Community & Social Service (331 | 14.6%), Education Instruction & Library (132 | 5.8%), Health Diagnosing & Treating (100 | 4.4%), and Computers, Engineering & Science (99 | 4.3%).
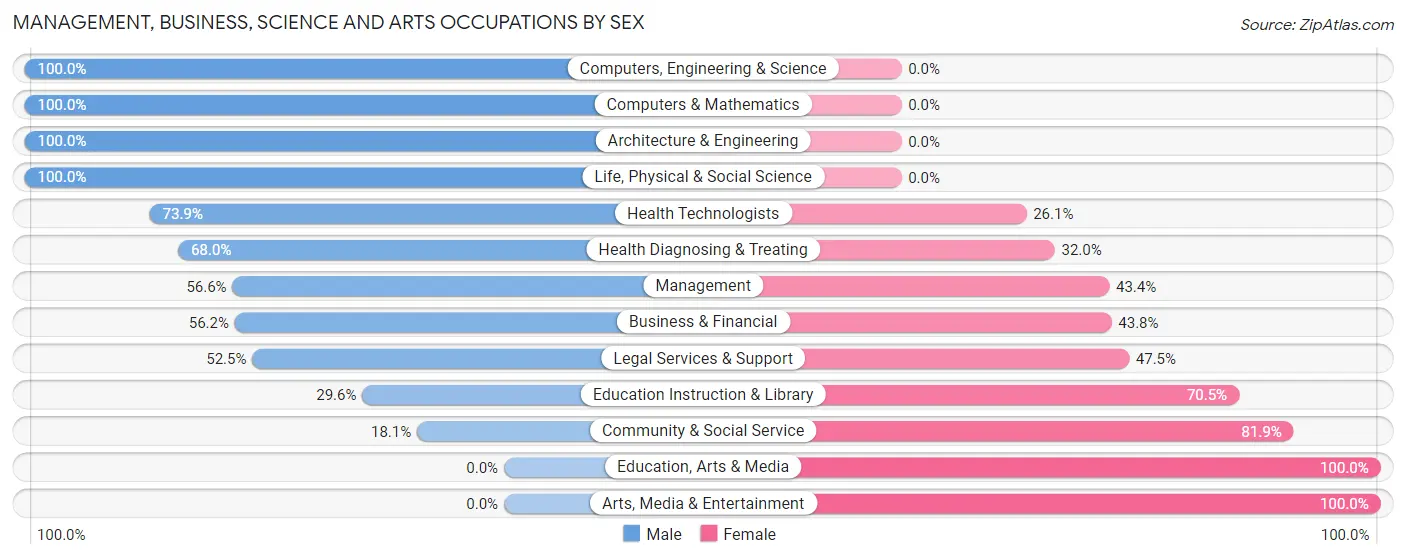
Management, Business, Science and Arts Occupations by Sex
Within the Management, Business, Science and Arts occupations in Northwest Harbor, the most male-oriented occupations are Computers, Engineering & Science (100.0%), Computers & Mathematics (100.0%), and Architecture & Engineering (100.0%), while the most female-oriented occupations are Education, Arts & Media (100.0%), Arts, Media & Entertainment (100.0%), and Community & Social Service (81.9%).
| Occupation | Male | Female |
| Management | 256 (56.6%) | 196 (43.4%) |
| Business & Financial | 41 (56.2%) | 32 (43.8%) |
| Computers, Engineering & Science | 99 (100.0%) | 0 (0.0%) |
| Computers & Mathematics | 43 (100.0%) | 0 (0.0%) |
| Architecture & Engineering | 47 (100.0%) | 0 (0.0%) |
| Life, Physical & Social Science | 9 (100.0%) | 0 (0.0%) |
| Community & Social Service | 60 (18.1%) | 271 (81.9%) |
| Education, Arts & Media | 0 (0.0%) | 84 (100.0%) |
| Legal Services & Support | 21 (52.5%) | 19 (47.5%) |
| Education Instruction & Library | 39 (29.5%) | 93 (70.5%) |
| Arts, Media & Entertainment | 0 (0.0%) | 75 (100.0%) |
| Health Diagnosing & Treating | 68 (68.0%) | 32 (32.0%) |
| Health Technologists | 51 (73.9%) | 18 (26.1%) |
| Total (Category) | 524 (49.7%) | 531 (50.3%) |
| Total (Overall) | 1,225 (53.9%) | 1,049 (46.1%) |
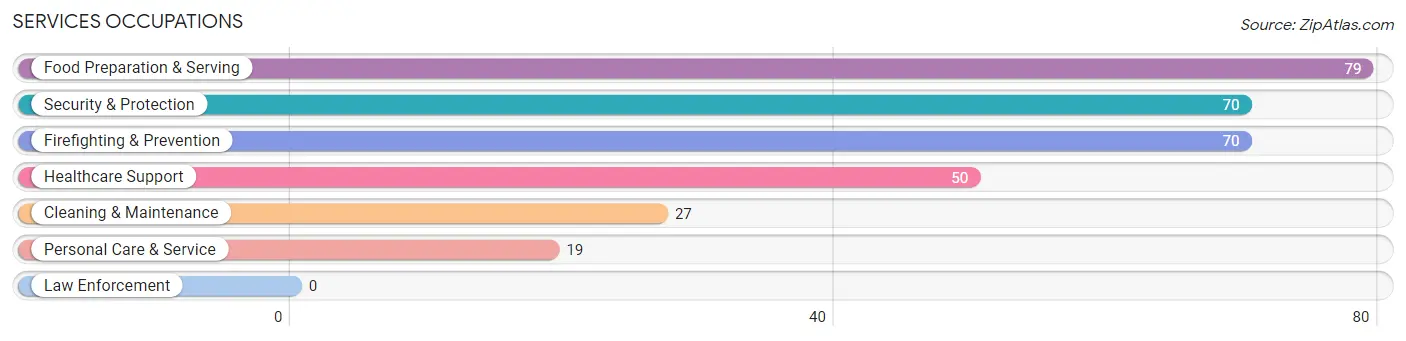
Services Occupations
The most common Services occupations in Northwest Harbor are Food Preparation & Serving (79 | 3.5%), Security & Protection (70 | 3.1%), Firefighting & Prevention (70 | 3.1%), Healthcare Support (50 | 2.2%), and Cleaning & Maintenance (27 | 1.2%).
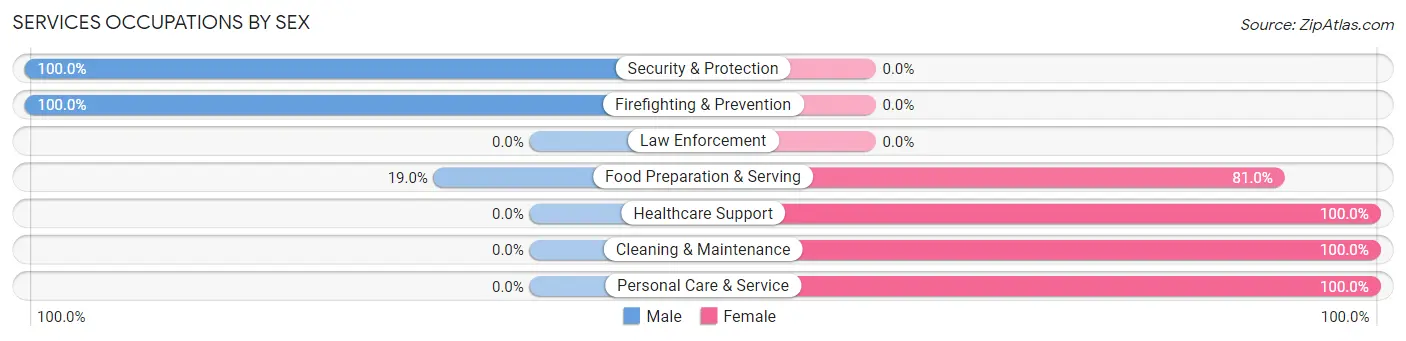
Services Occupations by Sex
Within the Services occupations in Northwest Harbor, the most male-oriented occupations are Security & Protection (100.0%), Firefighting & Prevention (100.0%), and Food Preparation & Serving (19.0%), while the most female-oriented occupations are Healthcare Support (100.0%), Cleaning & Maintenance (100.0%), and Personal Care & Service (100.0%).
| Occupation | Male | Female |
| Healthcare Support | 0 (0.0%) | 50 (100.0%) |
| Security & Protection | 70 (100.0%) | 0 (0.0%) |
| Firefighting & Prevention | 70 (100.0%) | 0 (0.0%) |
| Law Enforcement | 0 (0.0%) | 0 (0.0%) |
| Food Preparation & Serving | 15 (19.0%) | 64 (81.0%) |
| Cleaning & Maintenance | 0 (0.0%) | 27 (100.0%) |
| Personal Care & Service | 0 (0.0%) | 19 (100.0%) |
| Total (Category) | 85 (34.7%) | 160 (65.3%) |
| Total (Overall) | 1,225 (53.9%) | 1,049 (46.1%) |
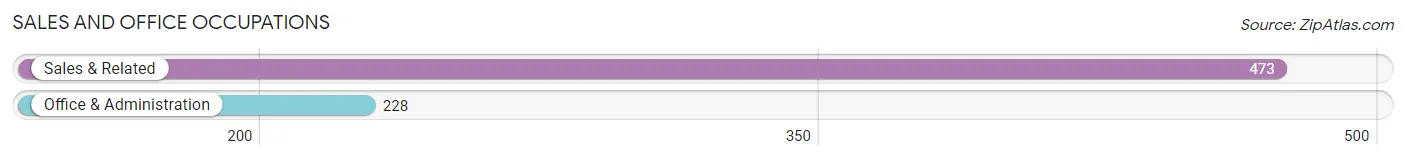
Sales and Office Occupations
The most common Sales and Office occupations in Northwest Harbor are Sales & Related (473 | 20.8%), and Office & Administration (228 | 10.0%).
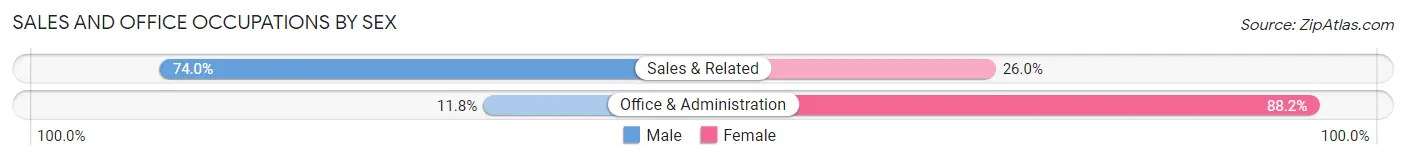
Sales and Office Occupations by Sex
| Occupation | Male | Female |
| Sales & Related | 350 (74.0%) | 123 (26.0%) |
| Office & Administration | 27 (11.8%) | 201 (88.2%) |
| Total (Category) | 377 (53.8%) | 324 (46.2%) |
| Total (Overall) | 1,225 (53.9%) | 1,049 (46.1%) |
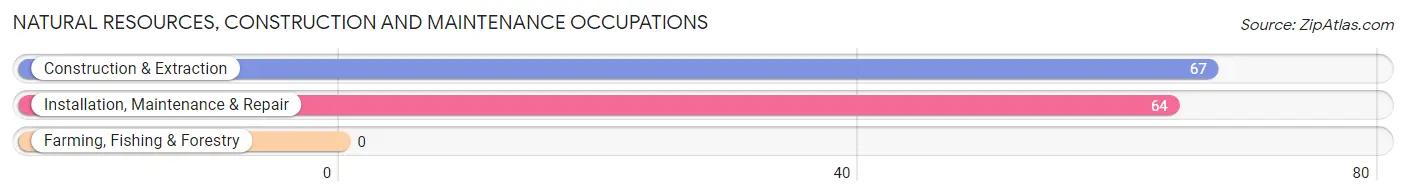
Natural Resources, Construction and Maintenance Occupations
The most common Natural Resources, Construction and Maintenance occupations in Northwest Harbor are Construction & Extraction (67 | 2.9%), and Installation, Maintenance & Repair (64 | 2.8%).
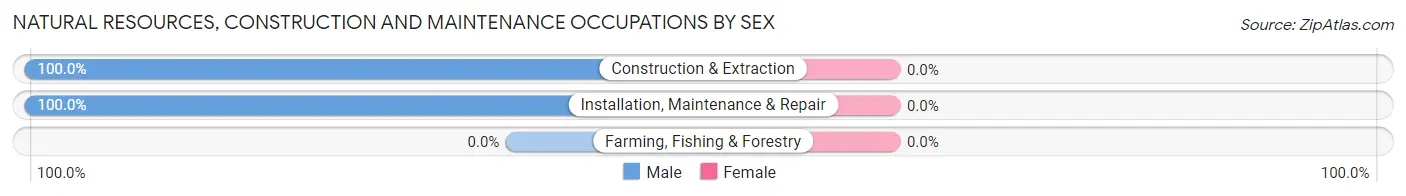
Natural Resources, Construction and Maintenance Occupations by Sex
| Occupation | Male | Female |
| Farming, Fishing & Forestry | 0 (0.0%) | 0 (0.0%) |
| Construction & Extraction | 67 (100.0%) | 0 (0.0%) |
| Installation, Maintenance & Repair | 64 (100.0%) | 0 (0.0%) |
| Total (Category) | 131 (100.0%) | 0 (0.0%) |
| Total (Overall) | 1,225 (53.9%) | 1,049 (46.1%) |
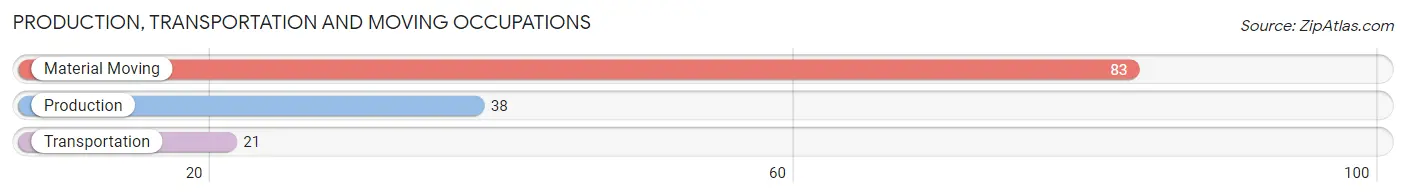
Production, Transportation and Moving Occupations
The most common Production, Transportation and Moving occupations in Northwest Harbor are Material Moving (83 | 3.6%), Production (38 | 1.7%), and Transportation (21 | 0.9%).
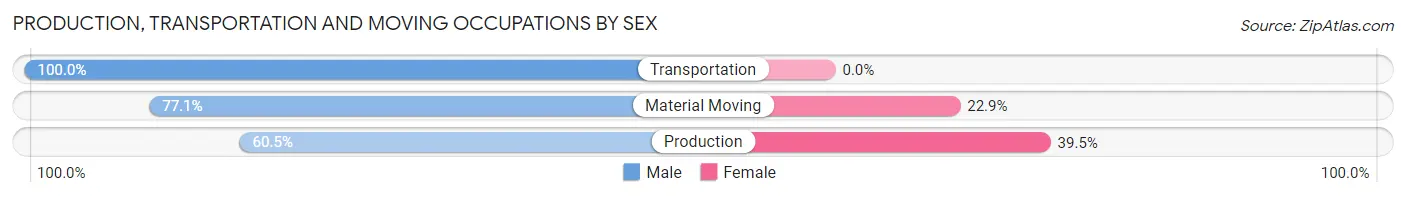
Production, Transportation and Moving Occupations by Sex
| Occupation | Male | Female |
| Production | 23 (60.5%) | 15 (39.5%) |
| Transportation | 21 (100.0%) | 0 (0.0%) |
| Material Moving | 64 (77.1%) | 19 (22.9%) |
| Total (Category) | 108 (76.1%) | 34 (23.9%) |
| Total (Overall) | 1,225 (53.9%) | 1,049 (46.1%) |
Employment Industries by Sex in Northwest Harbor
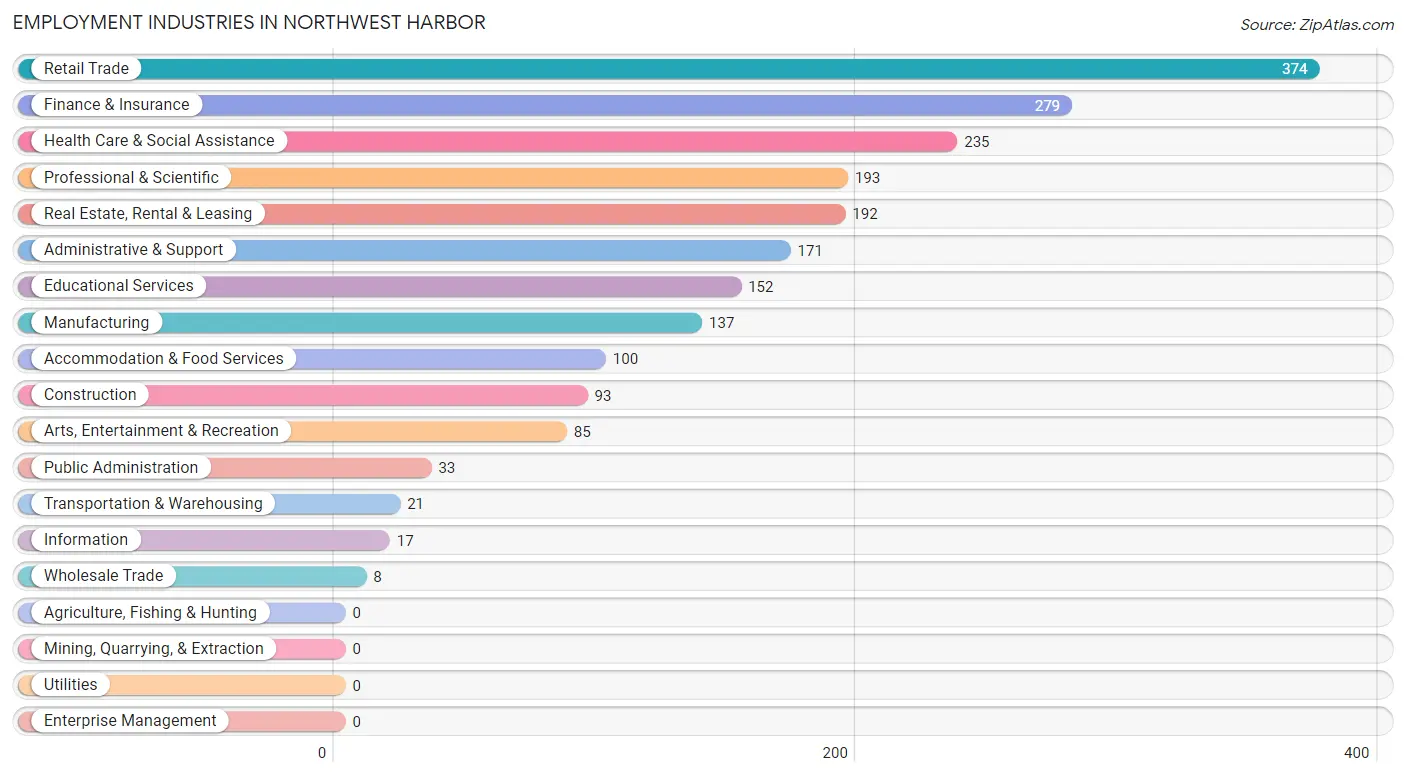
Employment Industries in Northwest Harbor
The major employment industries in Northwest Harbor include Retail Trade (374 | 16.5%), Finance & Insurance (279 | 12.3%), Health Care & Social Assistance (235 | 10.3%), Professional & Scientific (193 | 8.5%), and Real Estate, Rental & Leasing (192 | 8.4%).
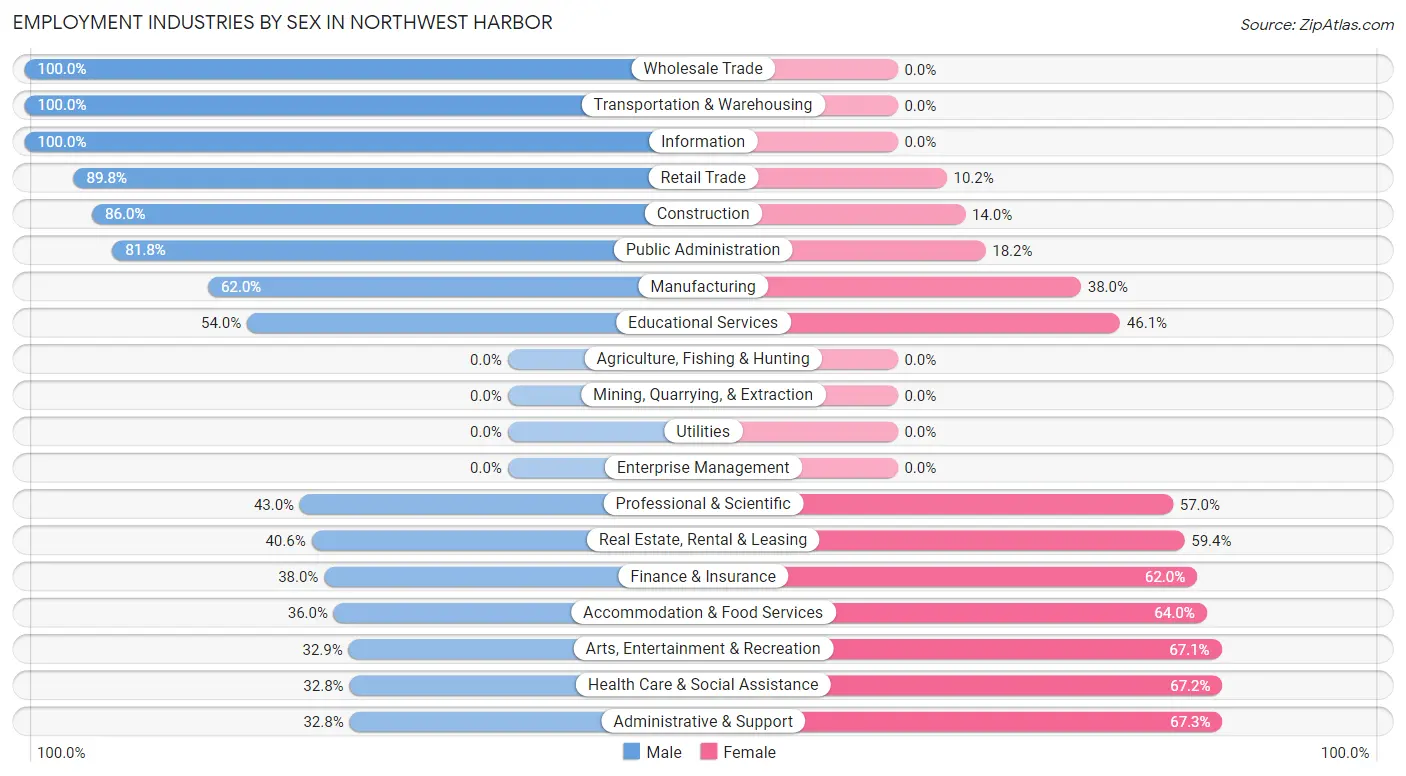
Employment Industries by Sex in Northwest Harbor
The Northwest Harbor industries that see more men than women are Wholesale Trade (100.0%), Transportation & Warehousing (100.0%), and Information (100.0%), whereas the industries that tend to have a higher number of women are Administrative & Support (67.2%), Health Care & Social Assistance (67.2%), and Arts, Entertainment & Recreation (67.1%).
| Industry | Male | Female |
| Agriculture, Fishing & Hunting | 0 (0.0%) | 0 (0.0%) |
| Mining, Quarrying, & Extraction | 0 (0.0%) | 0 (0.0%) |
| Construction | 80 (86.0%) | 13 (14.0%) |
| Manufacturing | 85 (62.0%) | 52 (38.0%) |
| Wholesale Trade | 8 (100.0%) | 0 (0.0%) |
| Retail Trade | 336 (89.8%) | 38 (10.2%) |
| Transportation & Warehousing | 21 (100.0%) | 0 (0.0%) |
| Utilities | 0 (0.0%) | 0 (0.0%) |
| Information | 17 (100.0%) | 0 (0.0%) |
| Finance & Insurance | 106 (38.0%) | 173 (62.0%) |
| Real Estate, Rental & Leasing | 78 (40.6%) | 114 (59.4%) |
| Professional & Scientific | 83 (43.0%) | 110 (57.0%) |
| Enterprise Management | 0 (0.0%) | 0 (0.0%) |
| Administrative & Support | 56 (32.8%) | 115 (67.2%) |
| Educational Services | 82 (53.9%) | 70 (46.1%) |
| Health Care & Social Assistance | 77 (32.8%) | 158 (67.2%) |
| Arts, Entertainment & Recreation | 28 (32.9%) | 57 (67.1%) |
| Accommodation & Food Services | 36 (36.0%) | 64 (64.0%) |
| Public Administration | 27 (81.8%) | 6 (18.2%) |
| Total | 1,225 (53.9%) | 1,049 (46.1%) |
Education in Northwest Harbor
School Enrollment in Northwest Harbor
The most common levels of schooling among the 536 students in Northwest Harbor are middle school (160 | 29.8%), high school (130 | 24.2%), and elementary school (124 | 23.1%).
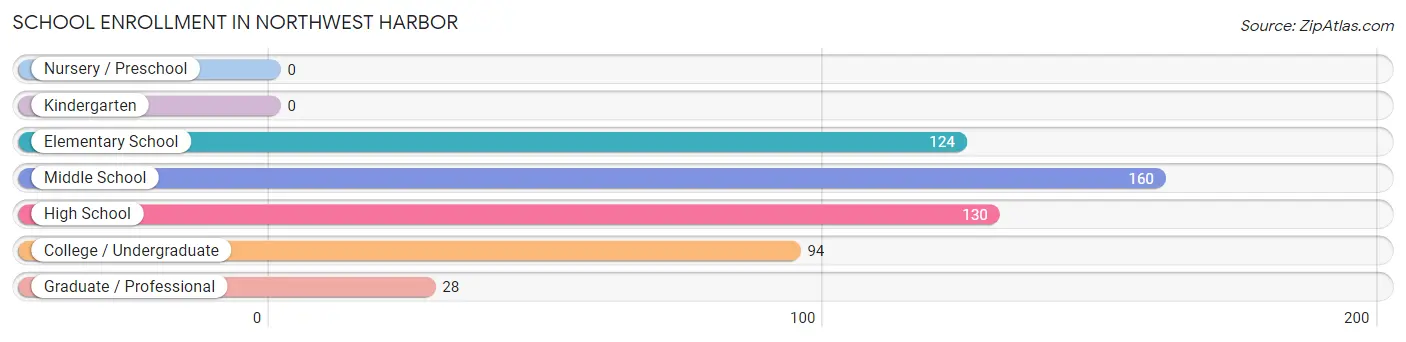
| School Level | # Students | % Students |
| Nursery / Preschool | 0 | 0.0% |
| Kindergarten | 0 | 0.0% |
| Elementary School | 124 | 23.1% |
| Middle School | 160 | 29.8% |
| High School | 130 | 24.2% |
| College / Undergraduate | 94 | 17.5% |
| Graduate / Professional | 28 | 5.2% |
| Total | 536 | 100.0% |
School Enrollment by Age by Funding Source in Northwest Harbor
Out of a total of 536 students who are enrolled in schools in Northwest Harbor, 80 (14.9%) attend a private institution, while the remaining 456 (85.1%) are enrolled in public schools. The age group of 20 to 24 year olds has the highest likelihood of being enrolled in private schools, with 61 (72.6% in the age bracket) enrolled. Conversely, the age group of 10 to 14 year olds has the lowest likelihood of being enrolled in a private school, with 234 (100.0% in the age bracket) attending a public institution.
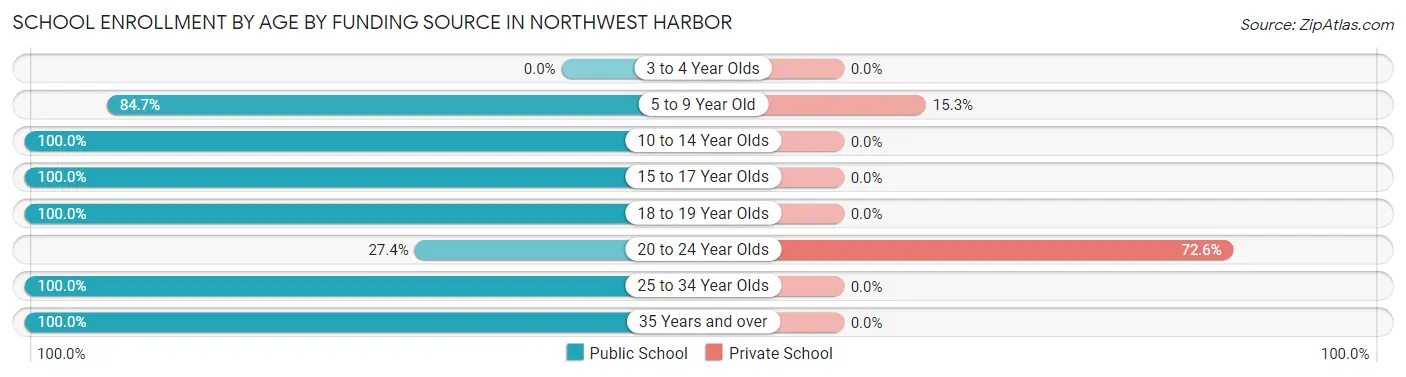
| Age Bracket | Public School | Private School |
| 3 to 4 Year Olds | 0 (0.0%) | 0 (0.0%) |
| 5 to 9 Year Old | 105 (84.7%) | 19 (15.3%) |
| 10 to 14 Year Olds | 234 (100.0%) | 0 (0.0%) |
| 15 to 17 Year Olds | 43 (100.0%) | 0 (0.0%) |
| 18 to 19 Year Olds | 29 (100.0%) | 0 (0.0%) |
| 20 to 24 Year Olds | 23 (27.4%) | 61 (72.6%) |
| 25 to 34 Year Olds | 17 (100.0%) | 0 (0.0%) |
| 35 Years and over | 5 (100.0%) | 0 (0.0%) |
| Total | 456 (85.1%) | 80 (14.9%) |
Educational Attainment by Field of Study in Northwest Harbor
Business (534 | 22.1%), science & technology (353 | 14.6%), social sciences (332 | 13.8%), visual & performing arts (245 | 10.1%), and literature & languages (205 | 8.5%) are the most common fields of study among 2,415 individuals in Northwest Harbor who have obtained a bachelor's degree or higher.
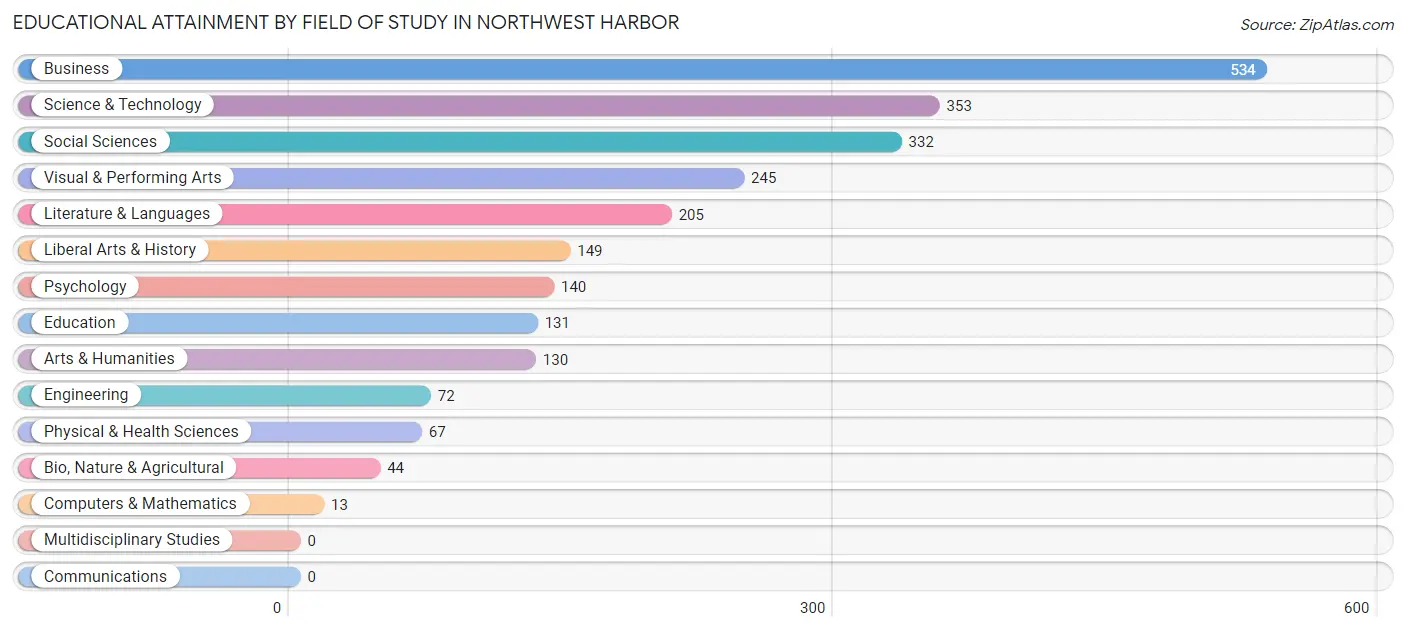
| Field of Study | # Graduates | % Graduates |
| Computers & Mathematics | 13 | 0.5% |
| Bio, Nature & Agricultural | 44 | 1.8% |
| Physical & Health Sciences | 67 | 2.8% |
| Psychology | 140 | 5.8% |
| Social Sciences | 332 | 13.8% |
| Engineering | 72 | 3.0% |
| Multidisciplinary Studies | 0 | 0.0% |
| Science & Technology | 353 | 14.6% |
| Business | 534 | 22.1% |
| Education | 131 | 5.4% |
| Literature & Languages | 205 | 8.5% |
| Liberal Arts & History | 149 | 6.2% |
| Visual & Performing Arts | 245 | 10.1% |
| Communications | 0 | 0.0% |
| Arts & Humanities | 130 | 5.4% |
| Total | 2,415 | 100.0% |
Transportation & Commute in Northwest Harbor
Vehicle Availability by Sex in Northwest Harbor
The most prevalent vehicle ownership categories in Northwest Harbor are males with 1 vehicle (380, accounting for 38.9%) and females with 1 vehicle (514, making up 36.4%).
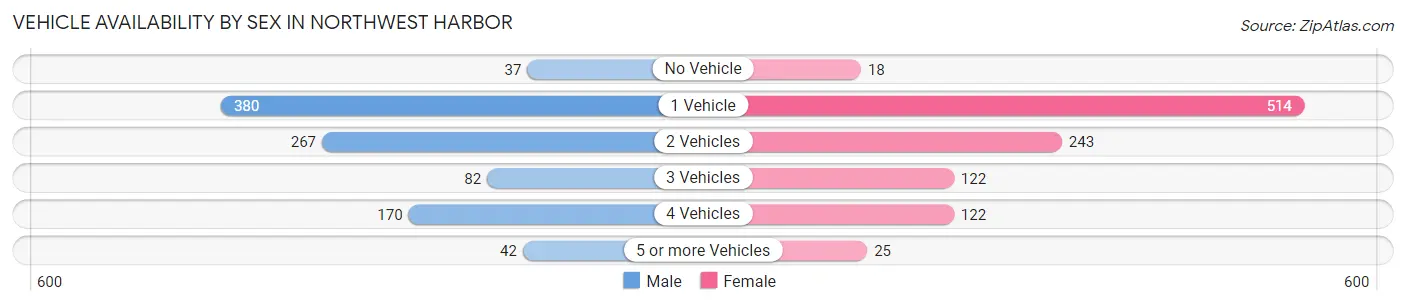
| Vehicles Available | Male | Female |
| No Vehicle | 37 (3.8%) | 18 (1.7%) |
| 1 Vehicle | 380 (38.9%) | 514 (49.2%) |
| 2 Vehicles | 267 (27.3%) | 243 (23.3%) |
| 3 Vehicles | 82 (8.4%) | 122 (11.7%) |
| 4 Vehicles | 170 (17.4%) | 122 (11.7%) |
| 5 or more Vehicles | 42 (4.3%) | 25 (2.4%) |
| Total | 978 (100.0%) | 1,044 (100.0%) |
Commute Time in Northwest Harbor
The most frequently occuring commute durations in Northwest Harbor are 5 to 9 minutes (292 commuters, 20.0%), 30 to 34 minutes (291 commuters, 19.9%), and 10 to 14 minutes (268 commuters, 18.3%).
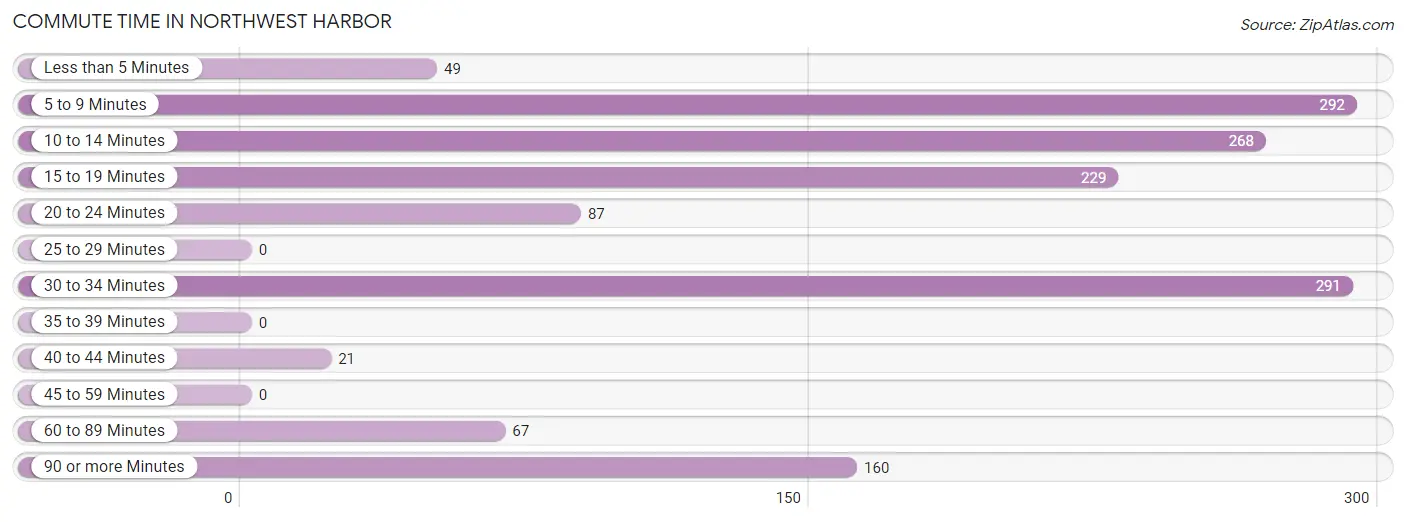
| Commute Time | # Commuters | % Commuters |
| Less than 5 Minutes | 49 | 3.4% |
| 5 to 9 Minutes | 292 | 20.0% |
| 10 to 14 Minutes | 268 | 18.3% |
| 15 to 19 Minutes | 229 | 15.6% |
| 20 to 24 Minutes | 87 | 5.9% |
| 25 to 29 Minutes | 0 | 0.0% |
| 30 to 34 Minutes | 291 | 19.9% |
| 35 to 39 Minutes | 0 | 0.0% |
| 40 to 44 Minutes | 21 | 1.4% |
| 45 to 59 Minutes | 0 | 0.0% |
| 60 to 89 Minutes | 67 | 4.6% |
| 90 or more Minutes | 160 | 10.9% |
Commute Time by Sex in Northwest Harbor
The most common commute times in Northwest Harbor are 5 to 9 minutes (214 commuters, 27.1%) for males and 10 to 14 minutes (202 commuters, 29.9%) for females.
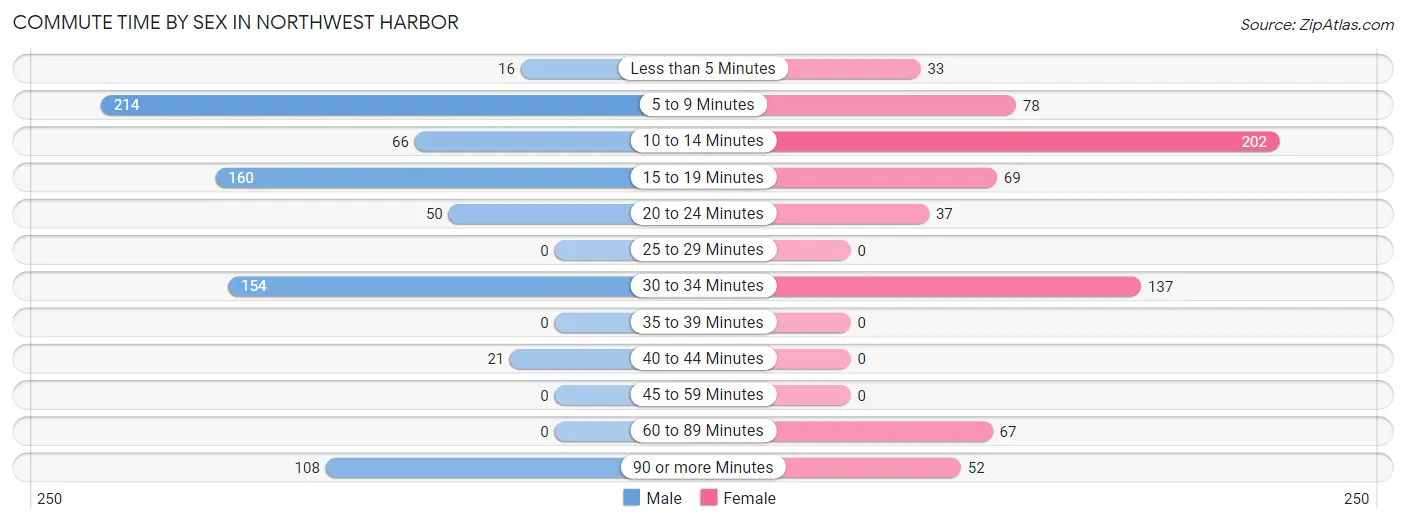
| Commute Time | Male | Female |
| Less than 5 Minutes | 16 (2.0%) | 33 (4.9%) |
| 5 to 9 Minutes | 214 (27.1%) | 78 (11.6%) |
| 10 to 14 Minutes | 66 (8.4%) | 202 (29.9%) |
| 15 to 19 Minutes | 160 (20.3%) | 69 (10.2%) |
| 20 to 24 Minutes | 50 (6.3%) | 37 (5.5%) |
| 25 to 29 Minutes | 0 (0.0%) | 0 (0.0%) |
| 30 to 34 Minutes | 154 (19.5%) | 137 (20.3%) |
| 35 to 39 Minutes | 0 (0.0%) | 0 (0.0%) |
| 40 to 44 Minutes | 21 (2.7%) | 0 (0.0%) |
| 45 to 59 Minutes | 0 (0.0%) | 0 (0.0%) |
| 60 to 89 Minutes | 0 (0.0%) | 67 (9.9%) |
| 90 or more Minutes | 108 (13.7%) | 52 (7.7%) |
Time of Departure to Work by Sex in Northwest Harbor
The most frequent times of departure to work in Northwest Harbor are 7:30 AM to 7:59 AM (244, 30.9%) for males and 8:00 AM to 8:29 AM (213, 31.6%) for females.
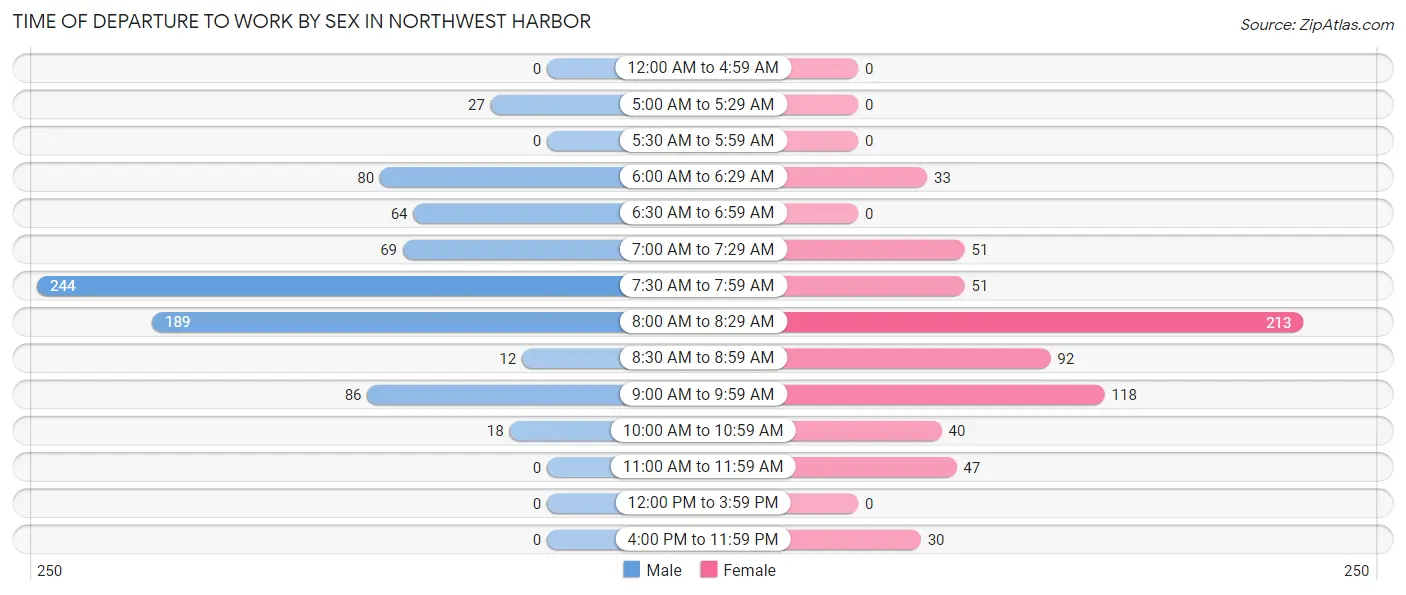
| Time of Departure | Male | Female |
| 12:00 AM to 4:59 AM | 0 (0.0%) | 0 (0.0%) |
| 5:00 AM to 5:29 AM | 27 (3.4%) | 0 (0.0%) |
| 5:30 AM to 5:59 AM | 0 (0.0%) | 0 (0.0%) |
| 6:00 AM to 6:29 AM | 80 (10.1%) | 33 (4.9%) |
| 6:30 AM to 6:59 AM | 64 (8.1%) | 0 (0.0%) |
| 7:00 AM to 7:29 AM | 69 (8.7%) | 51 (7.6%) |
| 7:30 AM to 7:59 AM | 244 (30.9%) | 51 (7.6%) |
| 8:00 AM to 8:29 AM | 189 (23.9%) | 213 (31.6%) |
| 8:30 AM to 8:59 AM | 12 (1.5%) | 92 (13.6%) |
| 9:00 AM to 9:59 AM | 86 (10.9%) | 118 (17.5%) |
| 10:00 AM to 10:59 AM | 18 (2.3%) | 40 (5.9%) |
| 11:00 AM to 11:59 AM | 0 (0.0%) | 47 (7.0%) |
| 12:00 PM to 3:59 PM | 0 (0.0%) | 0 (0.0%) |
| 4:00 PM to 11:59 PM | 0 (0.0%) | 30 (4.4%) |
| Total | 789 (100.0%) | 675 (100.0%) |
Housing Occupancy in Northwest Harbor
Occupancy by Ownership in Northwest Harbor
Of the total 2,110 dwellings in Northwest Harbor, owner-occupied units account for 1,761 (83.5%), while renter-occupied units make up 349 (16.5%).
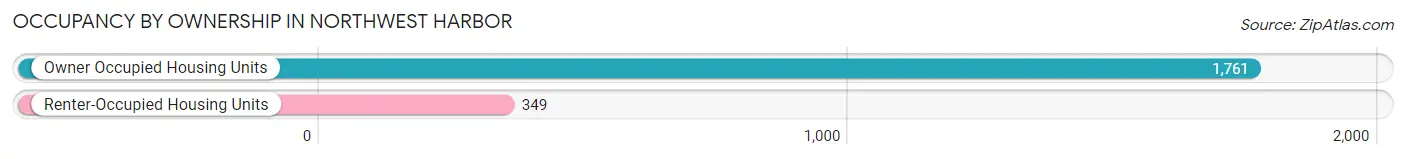
| Occupancy | # Housing Units | % Housing Units |
| Owner Occupied Housing Units | 1,761 | 83.5% |
| Renter-Occupied Housing Units | 349 | 16.5% |
| Total Occupied Housing Units | 2,110 | 100.0% |
Occupancy by Household Size in Northwest Harbor
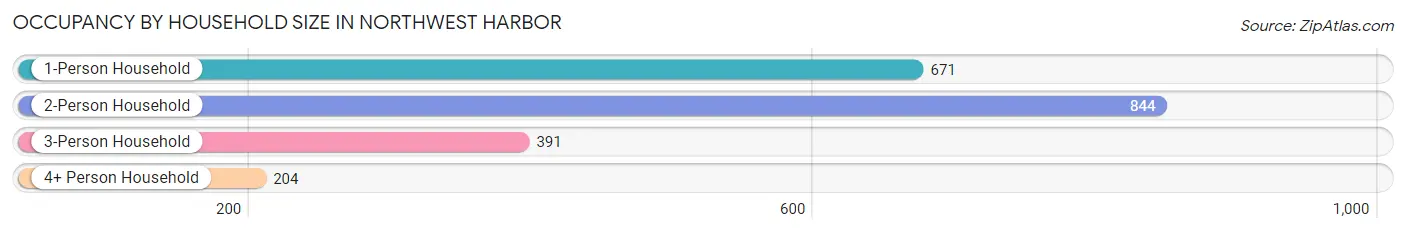
| Household Size | # Housing Units | % Housing Units |
| 1-Person Household | 671 | 31.8% |
| 2-Person Household | 844 | 40.0% |
| 3-Person Household | 391 | 18.5% |
| 4+ Person Household | 204 | 9.7% |
| Total Housing Units | 2,110 | 100.0% |
Occupancy by Ownership by Household Size in Northwest Harbor
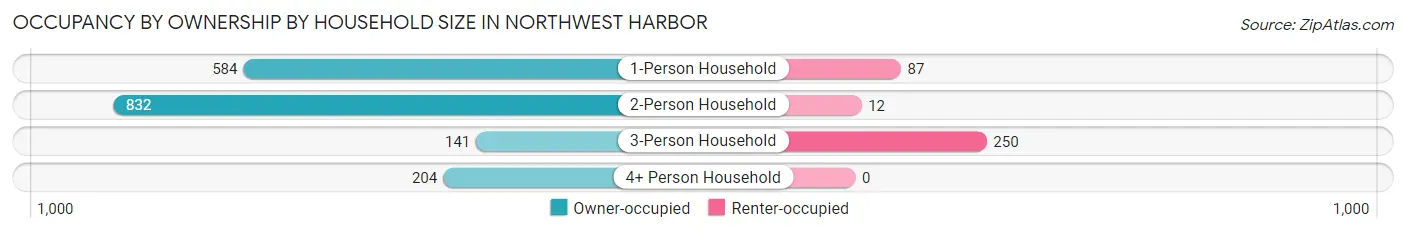
| Household Size | Owner-occupied | Renter-occupied |
| 1-Person Household | 584 (87.0%) | 87 (13.0%) |
| 2-Person Household | 832 (98.6%) | 12 (1.4%) |
| 3-Person Household | 141 (36.1%) | 250 (63.9%) |
| 4+ Person Household | 204 (100.0%) | 0 (0.0%) |
| Total Housing Units | 1,761 (83.5%) | 349 (16.5%) |
Occupancy by Educational Attainment in Northwest Harbor
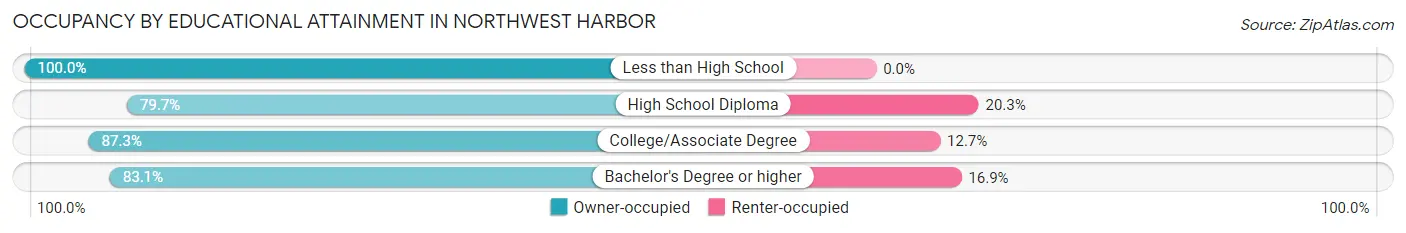
| Household Size | Owner-occupied | Renter-occupied |
| Less than High School | 43 (100.0%) | 0 (0.0%) |
| High School Diploma | 263 (79.7%) | 67 (20.3%) |
| College/Associate Degree | 241 (87.3%) | 35 (12.7%) |
| Bachelor's Degree or higher | 1,214 (83.1%) | 247 (16.9%) |
Occupancy by Age of Householder in Northwest Harbor
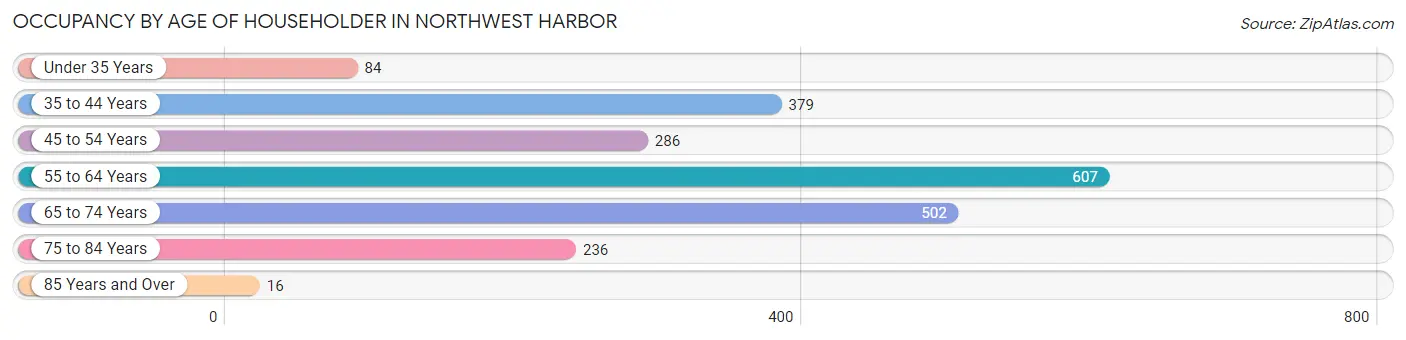
| Age Bracket | # Households | % Households |
| Under 35 Years | 84 | 4.0% |
| 35 to 44 Years | 379 | 18.0% |
| 45 to 54 Years | 286 | 13.6% |
| 55 to 64 Years | 607 | 28.8% |
| 65 to 74 Years | 502 | 23.8% |
| 75 to 84 Years | 236 | 11.2% |
| 85 Years and Over | 16 | 0.8% |
| Total | 2,110 | 100.0% |
Housing Finances in Northwest Harbor
Median Income by Occupancy in Northwest Harbor
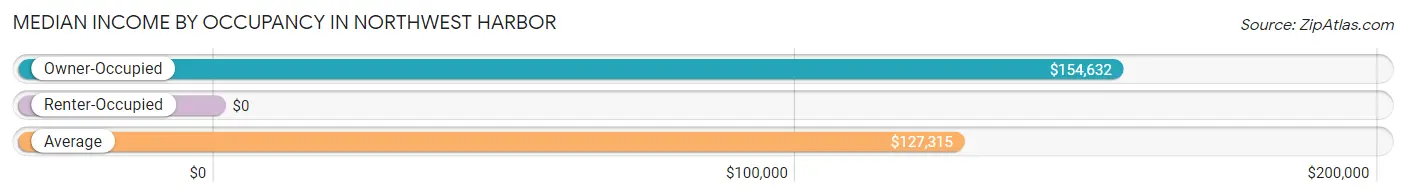
| Occupancy Type | # Households | Median Income |
| Owner-Occupied | 1,761 (83.5%) | $154,632 |
| Renter-Occupied | 349 (16.5%) | $0 |
| Average | 2,110 (100.0%) | $127,315 |
Occupancy by Householder Income Bracket in Northwest Harbor
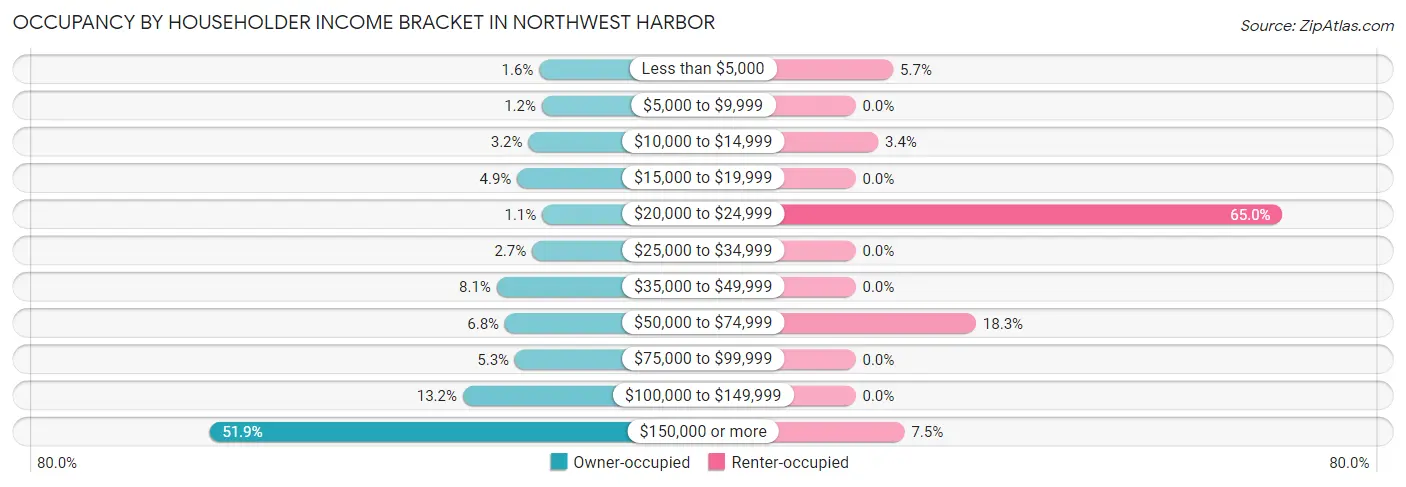
| Income Bracket | Owner-occupied | Renter-occupied |
| Less than $5,000 | 28 (1.6%) | 20 (5.7%) |
| $5,000 to $9,999 | 21 (1.2%) | 0 (0.0%) |
| $10,000 to $14,999 | 57 (3.2%) | 12 (3.4%) |
| $15,000 to $19,999 | 87 (4.9%) | 0 (0.0%) |
| $20,000 to $24,999 | 20 (1.1%) | 227 (65.0%) |
| $25,000 to $34,999 | 47 (2.7%) | 0 (0.0%) |
| $35,000 to $49,999 | 142 (8.1%) | 0 (0.0%) |
| $50,000 to $74,999 | 120 (6.8%) | 64 (18.3%) |
| $75,000 to $99,999 | 93 (5.3%) | 0 (0.0%) |
| $100,000 to $149,999 | 233 (13.2%) | 0 (0.0%) |
| $150,000 or more | 913 (51.8%) | 26 (7.4%) |
| Total | 1,761 (100.0%) | 349 (100.0%) |
Monthly Housing Cost Tiers in Northwest Harbor
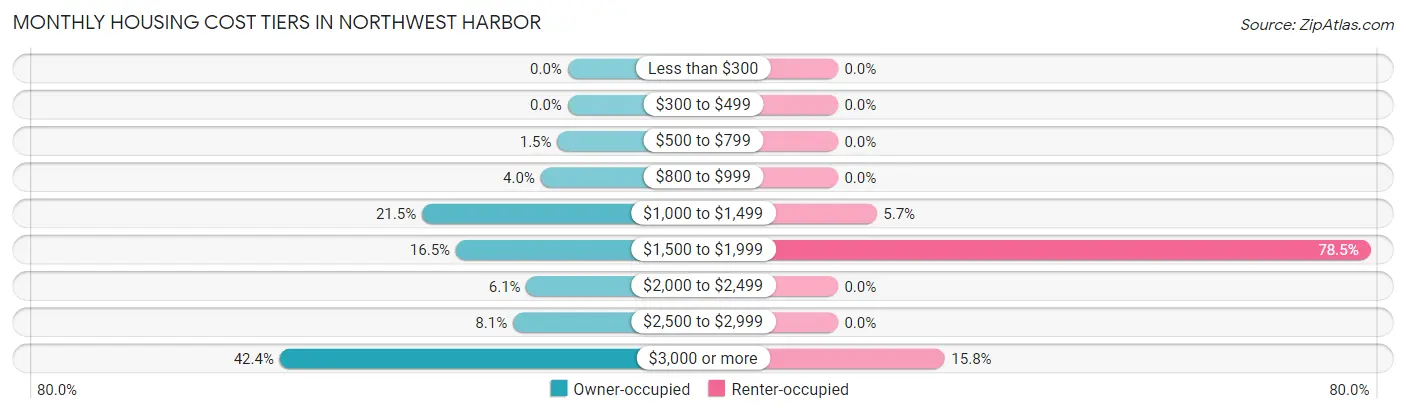
| Monthly Cost | Owner-occupied | Renter-occupied |
| Less than $300 | 0 (0.0%) | 0 (0.0%) |
| $300 to $499 | 0 (0.0%) | 0 (0.0%) |
| $500 to $799 | 27 (1.5%) | 0 (0.0%) |
| $800 to $999 | 70 (4.0%) | 0 (0.0%) |
| $1,000 to $1,499 | 378 (21.5%) | 20 (5.7%) |
| $1,500 to $1,999 | 290 (16.5%) | 274 (78.5%) |
| $2,000 to $2,499 | 107 (6.1%) | 0 (0.0%) |
| $2,500 to $2,999 | 142 (8.1%) | 0 (0.0%) |
| $3,000 or more | 747 (42.4%) | 55 (15.8%) |
| Total | 1,761 (100.0%) | 349 (100.0%) |
Physical Housing Characteristics in Northwest Harbor
Housing Structures in Northwest Harbor
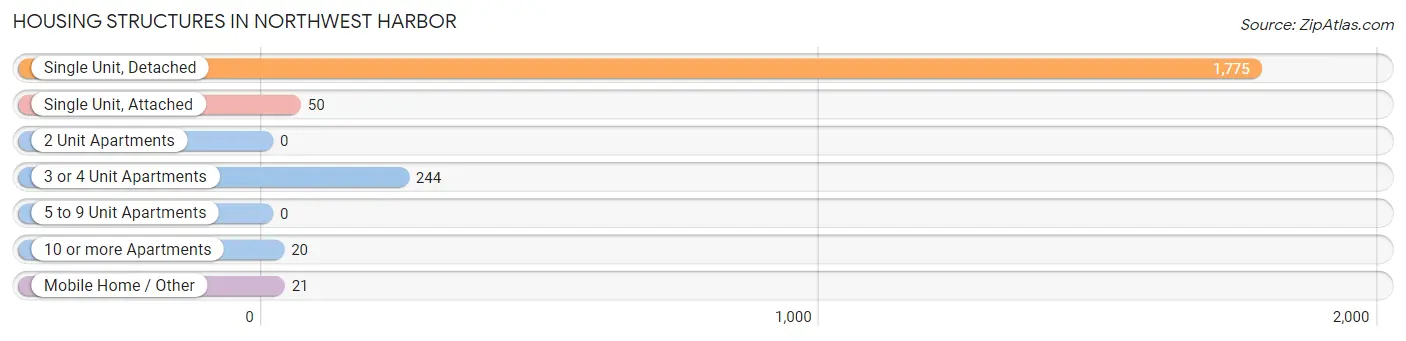
| Structure Type | # Housing Units | % Housing Units |
| Single Unit, Detached | 1,775 | 84.1% |
| Single Unit, Attached | 50 | 2.4% |
| 2 Unit Apartments | 0 | 0.0% |
| 3 or 4 Unit Apartments | 244 | 11.6% |
| 5 to 9 Unit Apartments | 0 | 0.0% |
| 10 or more Apartments | 20 | 0.9% |
| Mobile Home / Other | 21 | 1.0% |
| Total | 2,110 | 100.0% |
Housing Structures by Occupancy in Northwest Harbor
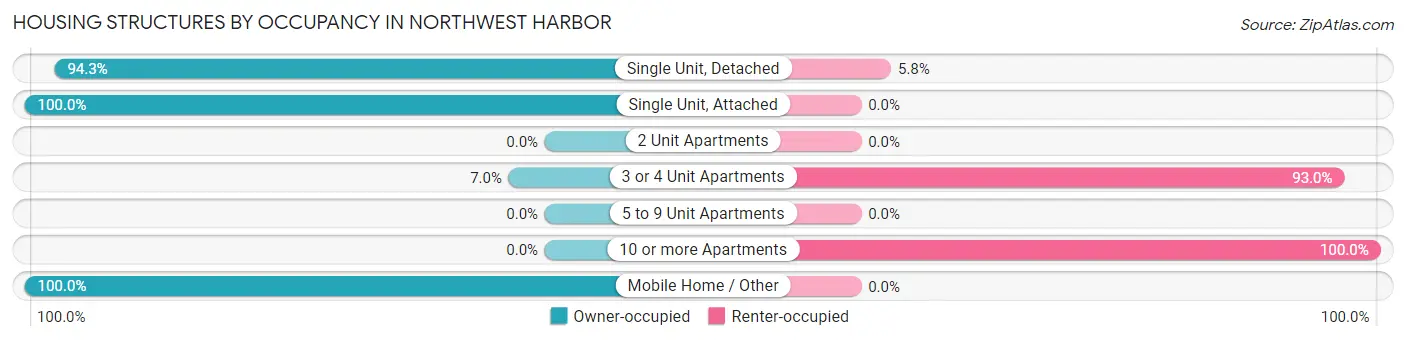
| Structure Type | Owner-occupied | Renter-occupied |
| Single Unit, Detached | 1,673 (94.3%) | 102 (5.8%) |
| Single Unit, Attached | 50 (100.0%) | 0 (0.0%) |
| 2 Unit Apartments | 0 (0.0%) | 0 (0.0%) |
| 3 or 4 Unit Apartments | 17 (7.0%) | 227 (93.0%) |
| 5 to 9 Unit Apartments | 0 (0.0%) | 0 (0.0%) |
| 10 or more Apartments | 0 (0.0%) | 20 (100.0%) |
| Mobile Home / Other | 21 (100.0%) | 0 (0.0%) |
| Total | 1,761 (83.5%) | 349 (16.5%) |
Housing Structures by Number of Rooms in Northwest Harbor
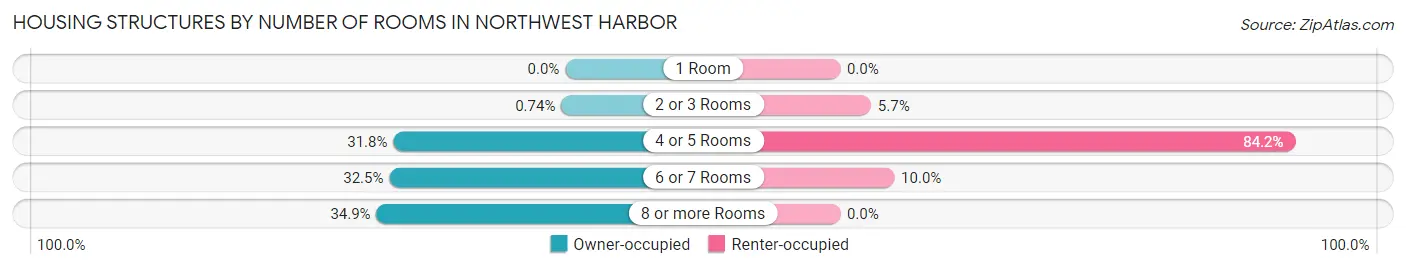
| Number of Rooms | Owner-occupied | Renter-occupied |
| 1 Room | 0 (0.0%) | 0 (0.0%) |
| 2 or 3 Rooms | 13 (0.7%) | 20 (5.7%) |
| 4 or 5 Rooms | 560 (31.8%) | 294 (84.2%) |
| 6 or 7 Rooms | 573 (32.5%) | 35 (10.0%) |
| 8 or more Rooms | 615 (34.9%) | 0 (0.0%) |
| Total | 1,761 (100.0%) | 349 (100.0%) |
Housing Structure by Heating Type in Northwest Harbor
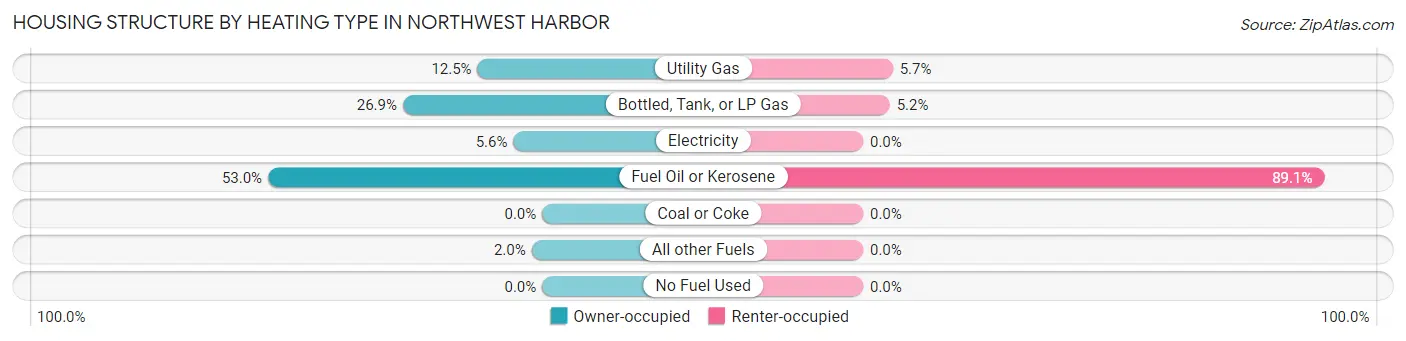
| Heating Type | Owner-occupied | Renter-occupied |
| Utility Gas | 220 (12.5%) | 20 (5.7%) |
| Bottled, Tank, or LP Gas | 474 (26.9%) | 18 (5.2%) |
| Electricity | 98 (5.6%) | 0 (0.0%) |
| Fuel Oil or Kerosene | 933 (53.0%) | 311 (89.1%) |
| Coal or Coke | 0 (0.0%) | 0 (0.0%) |
| All other Fuels | 36 (2.0%) | 0 (0.0%) |
| No Fuel Used | 0 (0.0%) | 0 (0.0%) |
| Total | 1,761 (100.0%) | 349 (100.0%) |
Household Vehicle Usage in Northwest Harbor
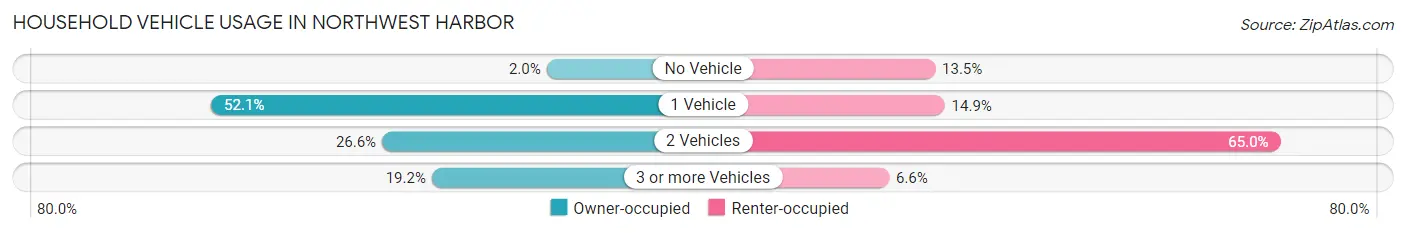
| Vehicles per Household | Owner-occupied | Renter-occupied |
| No Vehicle | 36 (2.0%) | 47 (13.5%) |
| 1 Vehicle | 918 (52.1%) | 52 (14.9%) |
| 2 Vehicles | 469 (26.6%) | 227 (65.0%) |
| 3 or more Vehicles | 338 (19.2%) | 23 (6.6%) |
| Total | 1,761 (100.0%) | 349 (100.0%) |
Real Estate & Mortgages in Northwest Harbor
Real Estate and Mortgage Overview in Northwest Harbor
| Characteristic | Without Mortgage | With Mortgage |
| Housing Units | 738 | 1,023 |
| Median Property Value | $1,166,100 | $1,093,800 |
| Median Household Income | $134,741 | $576 |
| Monthly Housing Costs | $1,450 | $720 |
| Real Estate Taxes | $8,129 | $0 |
Property Value by Mortgage Status in Northwest Harbor
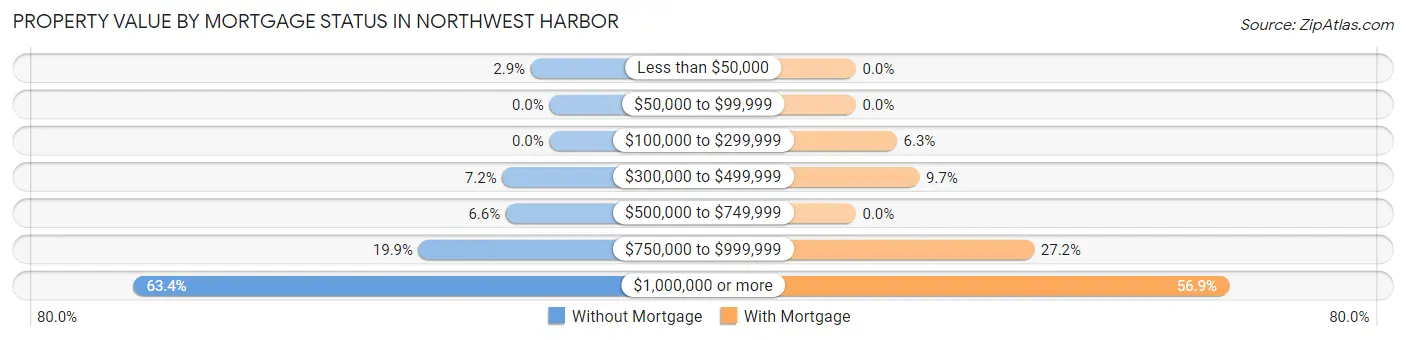
| Property Value | Without Mortgage | With Mortgage |
| Less than $50,000 | 21 (2.9%) | 0 (0.0%) |
| $50,000 to $99,999 | 0 (0.0%) | 0 (0.0%) |
| $100,000 to $299,999 | 0 (0.0%) | 64 (6.3%) |
| $300,000 to $499,999 | 53 (7.2%) | 99 (9.7%) |
| $500,000 to $749,999 | 49 (6.6%) | 0 (0.0%) |
| $750,000 to $999,999 | 147 (19.9%) | 278 (27.2%) |
| $1,000,000 or more | 468 (63.4%) | 582 (56.9%) |
| Total | 738 (100.0%) | 1,023 (100.0%) |
Household Income by Mortgage Status in Northwest Harbor
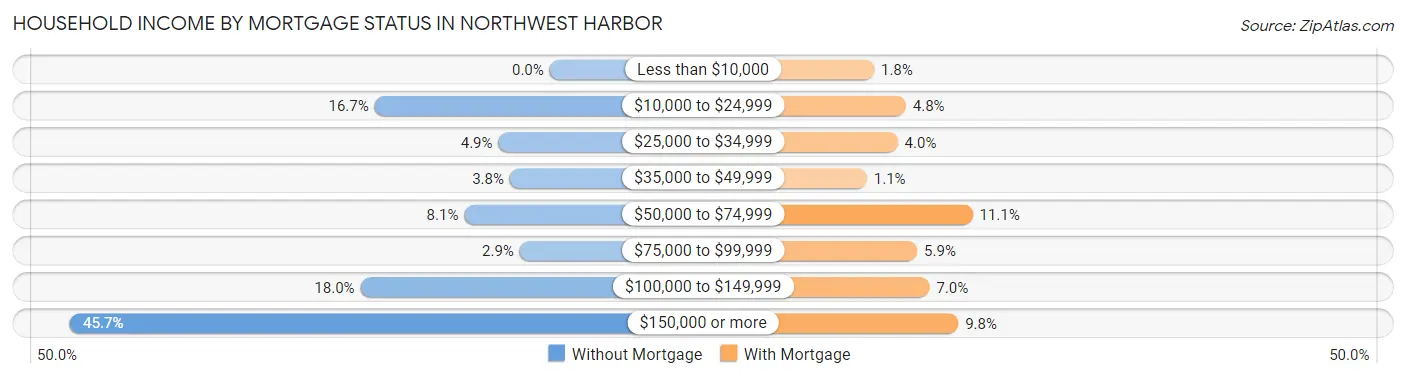
| Household Income | Without Mortgage | With Mortgage |
| Less than $10,000 | 0 (0.0%) | 18 (1.8%) |
| $10,000 to $24,999 | 123 (16.7%) | 49 (4.8%) |
| $25,000 to $34,999 | 36 (4.9%) | 41 (4.0%) |
| $35,000 to $49,999 | 28 (3.8%) | 11 (1.1%) |
| $50,000 to $74,999 | 60 (8.1%) | 114 (11.1%) |
| $75,000 to $99,999 | 21 (2.9%) | 60 (5.9%) |
| $100,000 to $149,999 | 133 (18.0%) | 72 (7.0%) |
| $150,000 or more | 337 (45.7%) | 100 (9.8%) |
| Total | 738 (100.0%) | 1,023 (100.0%) |
Property Value to Household Income Ratio in Northwest Harbor
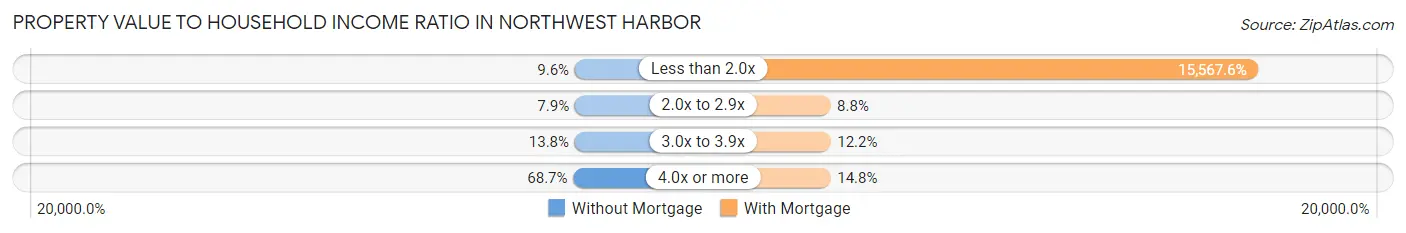
| Value-to-Income Ratio | Without Mortgage | With Mortgage |
| Less than 2.0x | 71 (9.6%) | 159,256 (15,567.5%) |
| 2.0x to 2.9x | 58 (7.9%) | 90 (8.8%) |
| 3.0x to 3.9x | 102 (13.8%) | 125 (12.2%) |
| 4.0x or more | 507 (68.7%) | 151 (14.8%) |
| Total | 738 (100.0%) | 1,023 (100.0%) |
Real Estate Taxes by Mortgage Status in Northwest Harbor
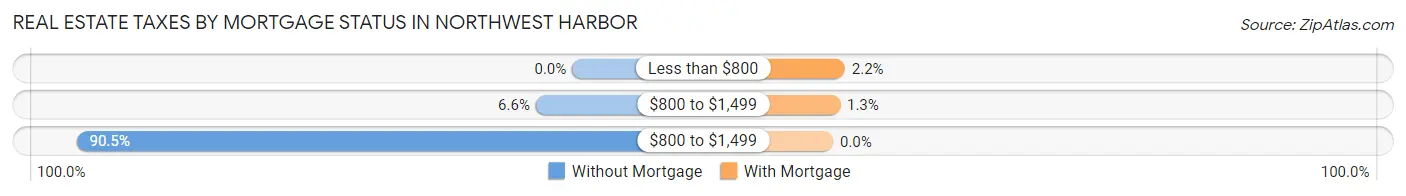
| Property Taxes | Without Mortgage | With Mortgage |
| Less than $800 | 0 (0.0%) | 22 (2.1%) |
| $800 to $1,499 | 49 (6.6%) | 13 (1.3%) |
| $800 to $1,499 | 668 (90.5%) | 0 (0.0%) |
| Total | 738 (100.0%) | 1,023 (100.0%) |
Health & Disability in Northwest Harbor
Health Insurance Coverage by Age in Northwest Harbor
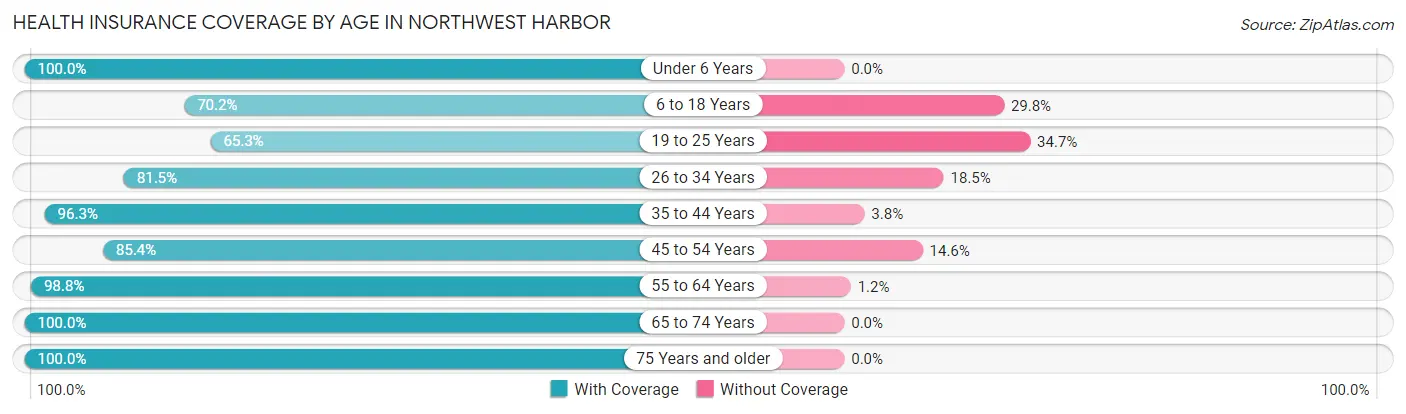
| Age Bracket | With Coverage | Without Coverage |
| Under 6 Years | 433 (100.0%) | 0 (0.0%) |
| 6 to 18 Years | 302 (70.2%) | 128 (29.8%) |
| 19 to 25 Years | 115 (65.3%) | 61 (34.7%) |
| 26 to 34 Years | 264 (81.5%) | 60 (18.5%) |
| 35 to 44 Years | 796 (96.3%) | 31 (3.7%) |
| 45 to 54 Years | 386 (85.4%) | 66 (14.6%) |
| 55 to 64 Years | 907 (98.8%) | 11 (1.2%) |
| 65 to 74 Years | 805 (100.0%) | 0 (0.0%) |
| 75 Years and older | 406 (100.0%) | 0 (0.0%) |
| Total | 4,414 (92.5%) | 357 (7.5%) |
Health Insurance Coverage by Citizenship Status in Northwest Harbor
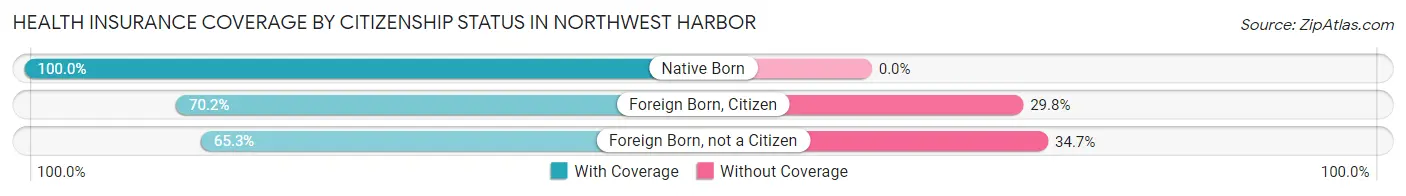
| Citizenship Status | With Coverage | Without Coverage |
| Native Born | 433 (100.0%) | 0 (0.0%) |
| Foreign Born, Citizen | 302 (70.2%) | 128 (29.8%) |
| Foreign Born, not a Citizen | 115 (65.3%) | 61 (34.7%) |
Health Insurance Coverage by Household Income in Northwest Harbor
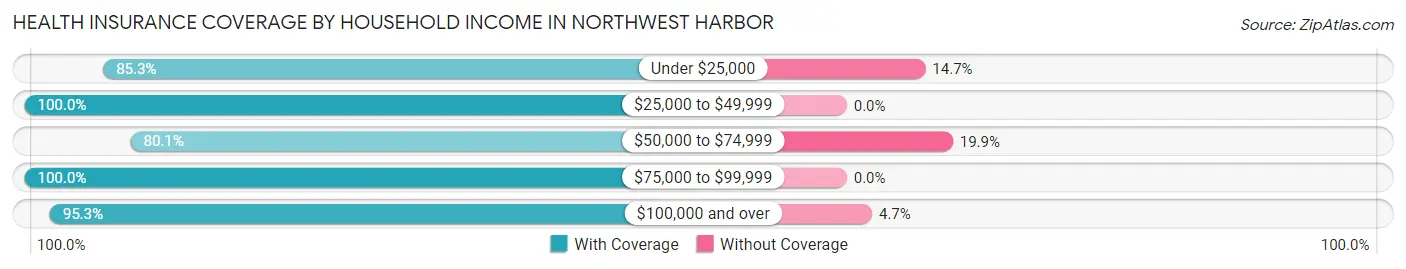
| Household Income | With Coverage | Without Coverage |
| Under $25,000 | 949 (85.3%) | 164 (14.7%) |
| $25,000 to $49,999 | 269 (100.0%) | 0 (0.0%) |
| $50,000 to $74,999 | 222 (80.1%) | 55 (19.9%) |
| $75,000 to $99,999 | 179 (100.0%) | 0 (0.0%) |
| $100,000 and over | 2,777 (95.3%) | 138 (4.7%) |
Public vs Private Health Insurance Coverage by Age in Northwest Harbor
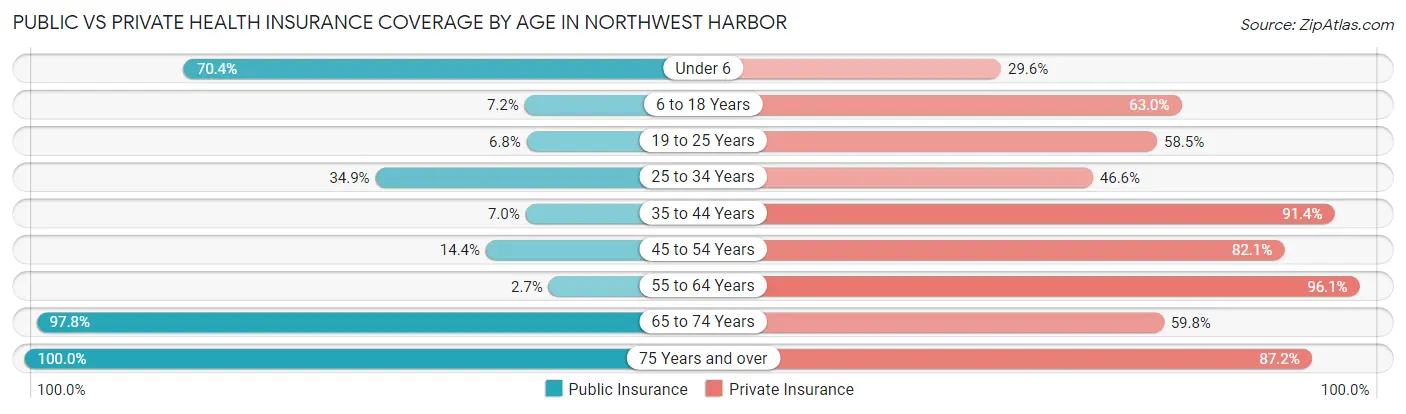
| Age Bracket | Public Insurance | Private Insurance |
| Under 6 | 305 (70.4%) | 128 (29.6%) |
| 6 to 18 Years | 31 (7.2%) | 271 (63.0%) |
| 19 to 25 Years | 12 (6.8%) | 103 (58.5%) |
| 25 to 34 Years | 113 (34.9%) | 151 (46.6%) |
| 35 to 44 Years | 58 (7.0%) | 756 (91.4%) |
| 45 to 54 Years | 65 (14.4%) | 371 (82.1%) |
| 55 to 64 Years | 25 (2.7%) | 882 (96.1%) |
| 65 to 74 Years | 787 (97.8%) | 481 (59.8%) |
| 75 Years and over | 406 (100.0%) | 354 (87.2%) |
| Total | 1,802 (37.8%) | 3,497 (73.3%) |
Disability Status by Sex by Age in Northwest Harbor
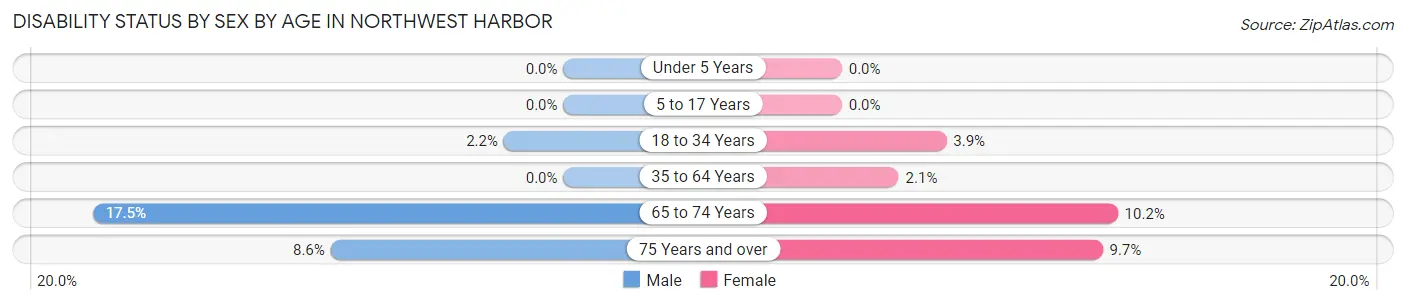
| Age Bracket | Male | Female |
| Under 5 Years | 0 (0.0%) | 0 (0.0%) |
| 5 to 17 Years | 0 (0.0%) | 0 (0.0%) |
| 18 to 34 Years | 6 (2.2%) | 10 (3.9%) |
| 35 to 64 Years | 0 (0.0%) | 24 (2.1%) |
| 65 to 74 Years | 69 (17.5%) | 42 (10.2%) |
| 75 Years and over | 19 (8.6%) | 18 (9.7%) |
Disability Class by Sex by Age in Northwest Harbor
Disability Class: Hearing Difficulty
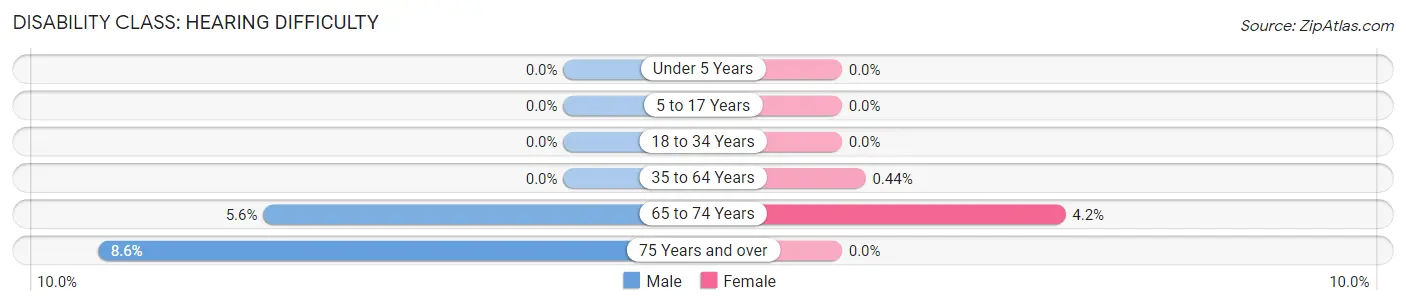
| Age Bracket | Male | Female |
| Under 5 Years | 0 (0.0%) | 0 (0.0%) |
| 5 to 17 Years | 0 (0.0%) | 0 (0.0%) |
| 18 to 34 Years | 0 (0.0%) | 0 (0.0%) |
| 35 to 64 Years | 0 (0.0%) | 5 (0.4%) |
| 65 to 74 Years | 22 (5.6%) | 17 (4.2%) |
| 75 Years and over | 19 (8.6%) | 0 (0.0%) |
Disability Class: Vision Difficulty
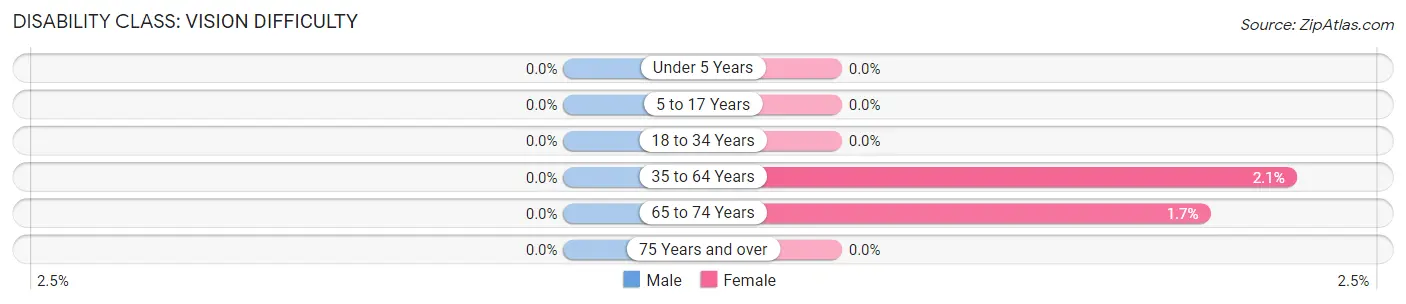
| Age Bracket | Male | Female |
| Under 5 Years | 0 (0.0%) | 0 (0.0%) |
| 5 to 17 Years | 0 (0.0%) | 0 (0.0%) |
| 18 to 34 Years | 0 (0.0%) | 0 (0.0%) |
| 35 to 64 Years | 0 (0.0%) | 24 (2.1%) |
| 65 to 74 Years | 0 (0.0%) | 7 (1.7%) |
| 75 Years and over | 0 (0.0%) | 0 (0.0%) |
Disability Class: Cognitive Difficulty
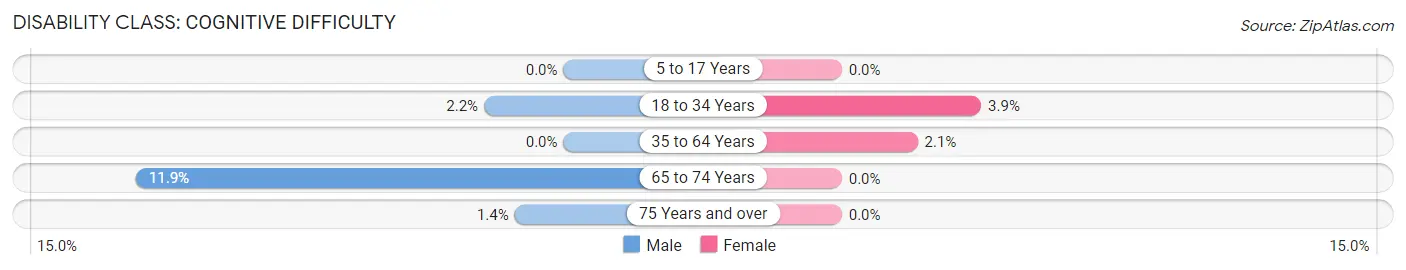
| Age Bracket | Male | Female |
| 5 to 17 Years | 0 (0.0%) | 0 (0.0%) |
| 18 to 34 Years | 6 (2.2%) | 10 (3.9%) |
| 35 to 64 Years | 0 (0.0%) | 24 (2.1%) |
| 65 to 74 Years | 47 (11.9%) | 0 (0.0%) |
| 75 Years and over | 3 (1.4%) | 0 (0.0%) |
Disability Class: Ambulatory Difficulty
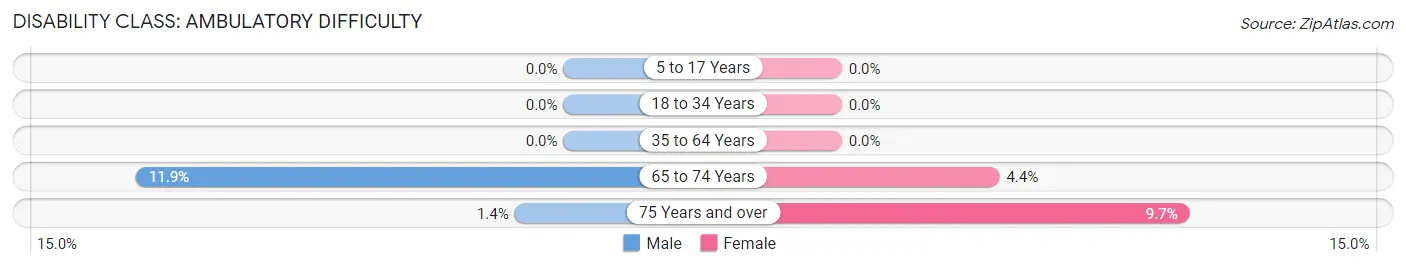
| Age Bracket | Male | Female |
| 5 to 17 Years | 0 (0.0%) | 0 (0.0%) |
| 18 to 34 Years | 0 (0.0%) | 0 (0.0%) |
| 35 to 64 Years | 0 (0.0%) | 0 (0.0%) |
| 65 to 74 Years | 47 (11.9%) | 18 (4.4%) |
| 75 Years and over | 3 (1.4%) | 18 (9.7%) |
Disability Class: Self-Care Difficulty
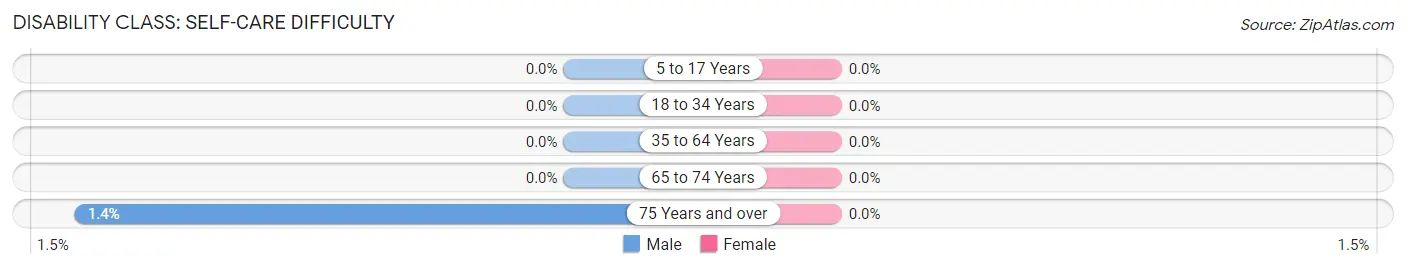
| Age Bracket | Male | Female |
| 5 to 17 Years | 0 (0.0%) | 0 (0.0%) |
| 18 to 34 Years | 0 (0.0%) | 0 (0.0%) |
| 35 to 64 Years | 0 (0.0%) | 0 (0.0%) |
| 65 to 74 Years | 0 (0.0%) | 0 (0.0%) |
| 75 Years and over | 3 (1.4%) | 0 (0.0%) |
Technology Access in Northwest Harbor
Computing Device Access in Northwest Harbor
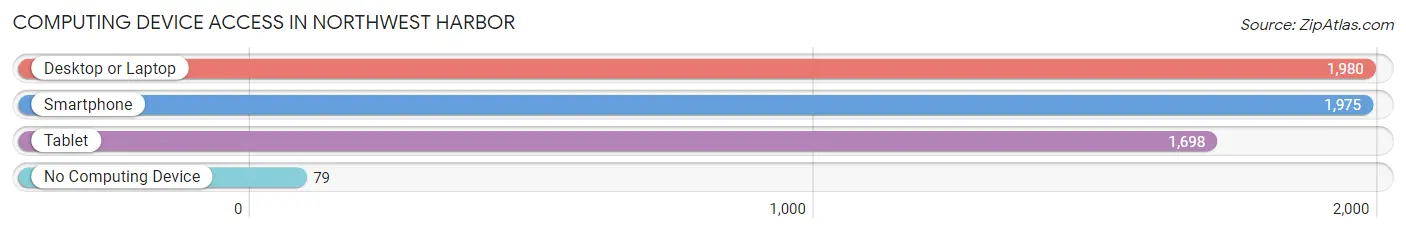
| Device Type | # Households | % Households |
| Desktop or Laptop | 1,980 | 93.8% |
| Smartphone | 1,975 | 93.6% |
| Tablet | 1,698 | 80.5% |
| No Computing Device | 79 | 3.7% |
| Total | 2,110 | 100.0% |
Internet Access in Northwest Harbor
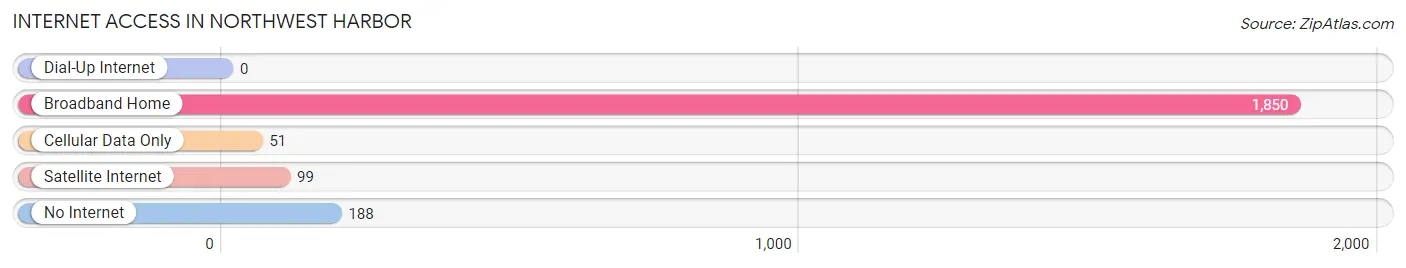
| Internet Type | # Households | % Households |
| Dial-Up Internet | 0 | 0.0% |
| Broadband Home | 1,850 | 87.7% |
| Cellular Data Only | 51 | 2.4% |
| Satellite Internet | 99 | 4.7% |
| No Internet | 188 | 8.9% |
| Total | 2,110 | 100.0% |
Northwest Harbor Summary
Northwest Harbor is a hamlet located in the Town of East Hampton in Suffolk County, New York, United States. It is located on the eastern end of Gardiner's Bay, a part of the Atlantic Ocean. The hamlet is situated between the villages of East Hampton and Sag Harbor.
History
Northwest Harbor was first settled in the late 17th century by English settlers. The area was originally known as Northwest Creek, and was part of the Town of East Hampton. The hamlet was officially established in 1790, and was named after the harbor located at the mouth of Northwest Creek.
In the 19th century, the hamlet was a popular summer destination for wealthy New Yorkers. The area was home to several large estates, including the estate of William K. Vanderbilt, which was later purchased by the U.S. Navy and used as a training facility during World War II.
Geography
Northwest Harbor is located on the eastern end of Gardiner's Bay, a part of the Atlantic Ocean. The hamlet is situated between the villages of East Hampton and Sag Harbor. The area is characterized by rolling hills, woodlands, and wetlands. The hamlet is home to several small creeks, including Northwest Creek, which flows into the harbor.
Economy
The economy of Northwest Harbor is largely based on tourism and fishing. The area is home to several marinas, which offer boat rentals and fishing charters. The hamlet is also home to several restaurants, shops, and galleries.
Demographics
As of the 2010 census, the population of Northwest Harbor was 1,845. The median age was 48.7 years, and the median household income was $90,917. The racial makeup of the hamlet was 94.3% White, 1.2% African American, 0.3% Native American, 0.7% Asian, 0.1% Pacific Islander, and 3.4% from other races. The population was spread out, with 25.3% under the age of 18, 5.2% from 18 to 24, 28.2% from 25 to 44, 28.2% from 45 to 64, and 13.1% who were 65 years of age or older.
Conclusion
Northwest Harbor is a small hamlet located in the Town of East Hampton in Suffolk County, New York. The hamlet was first settled in the late 17th century, and was officially established in 1790. The area is characterized by rolling hills, woodlands, and wetlands, and is home to several small creeks. The economy of Northwest Harbor is largely based on tourism and fishing, and the population of the hamlet was 1,845 as of the 2010 census.
Common Questions
What is Per Capita Income in Northwest Harbor?
Per Capita income in Northwest Harbor is $94,458.
What is the Median Family Income in Northwest Harbor?
Median Family Income in Northwest Harbor is $147,266.
What is the Median Household income in Northwest Harbor?
Median Household Income in Northwest Harbor is $127,315.
What is Inequality or Gini Index in Northwest Harbor?
Inequality or Gini Index in Northwest Harbor is 0.58.
What is the Total Population of Northwest Harbor?
Total Population of Northwest Harbor is 4,771.
What is the Total Male Population of Northwest Harbor?
Total Male Population of Northwest Harbor is 2,176.
What is the Total Female Population of Northwest Harbor?
Total Female Population of Northwest Harbor is 2,595.
What is the Ratio of Males per 100 Females in Northwest Harbor?
There are 83.85 Males per 100 Females in Northwest Harbor.
What is the Ratio of Females per 100 Males in Northwest Harbor?
There are 119.26 Females per 100 Males in Northwest Harbor.
What is the Median Population Age in Northwest Harbor?
Median Population Age in Northwest Harbor is 47.5 Years.
What is the Average Family Size in Northwest Harbor
Average Family Size in Northwest Harbor is 2.8 People.
What is the Average Household Size in Northwest Harbor
Average Household Size in Northwest Harbor is 2.2 People.
How Large is the Labor Force in Northwest Harbor?
There are 2,447 People in the Labor Forcein in Northwest Harbor.
What is the Percentage of People in the Labor Force in Northwest Harbor?
61.9% of People are in the Labor Force in Northwest Harbor.
What is the Unemployment Rate in Northwest Harbor?
Unemployment Rate in Northwest Harbor is 7.0%.