Shinnecock Hills, NY Map & Demographics
Shinnecock Hills Map
Shinnecock Hills Overview
$74,785
PER CAPITA INCOME
$177,663
AVG FAMILY INCOME
$156,833
AVG HOUSEHOLD INCOME
14.2%
WAGE / INCOME GAP [ % ]
85.8¢/ $1
WAGE / INCOME GAP [ $ ]
0.44
INEQUALITY / GINI INDEX
2,135
TOTAL POPULATION
1,197
MALE POPULATION
938
FEMALE POPULATION
127.61
MALES / 100 FEMALES
78.36
FEMALES / 100 MALES
48.4
MEDIAN AGE
3.2
AVG FAMILY SIZE
2.6
AVG HOUSEHOLD SIZE
948
LABOR FORCE [ PEOPLE ]
51.7%
PERCENT IN LABOR FORCE
6.8%
UNEMPLOYMENT RATE
Income in Shinnecock Hills
Income Overview in Shinnecock Hills
Per Capita Income in Shinnecock Hills is $74,785, while median incomes of families and households are $177,663 and $156,833 respectively.
| Characteristic | Number | Measure |
| Per Capita Income | 2,135 | $74,785 |
| Median Family Income | 539 | $177,663 |
| Mean Family Income | 539 | $234,379 |
| Median Household Income | 758 | $156,833 |
| Mean Household Income | 758 | $205,036 |
| Income Deficit | 539 | $0 |
| Wage / Income Gap (%) | 2,135 | 14.17% |
| Wage / Income Gap ($) | 2,135 | 85.83¢ per $1 |
| Gini / Inequality Index | 2,135 | 0.44 |
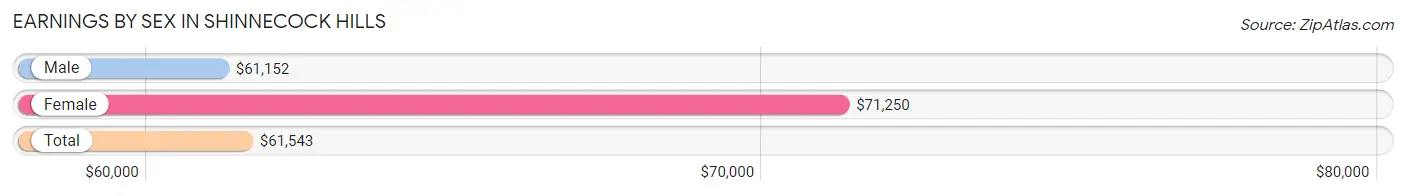
Earnings by Sex in Shinnecock Hills
Average Earnings in Shinnecock Hills are $61,543, $61,152 for men and $71,250 for women, a difference of 14.2%.
| Sex | Number | Average Earnings |
| Male | 754 (68.3%) | $61,152 |
| Female | 350 (31.7%) | $71,250 |
| Total | 1,104 (100.0%) | $61,543 |
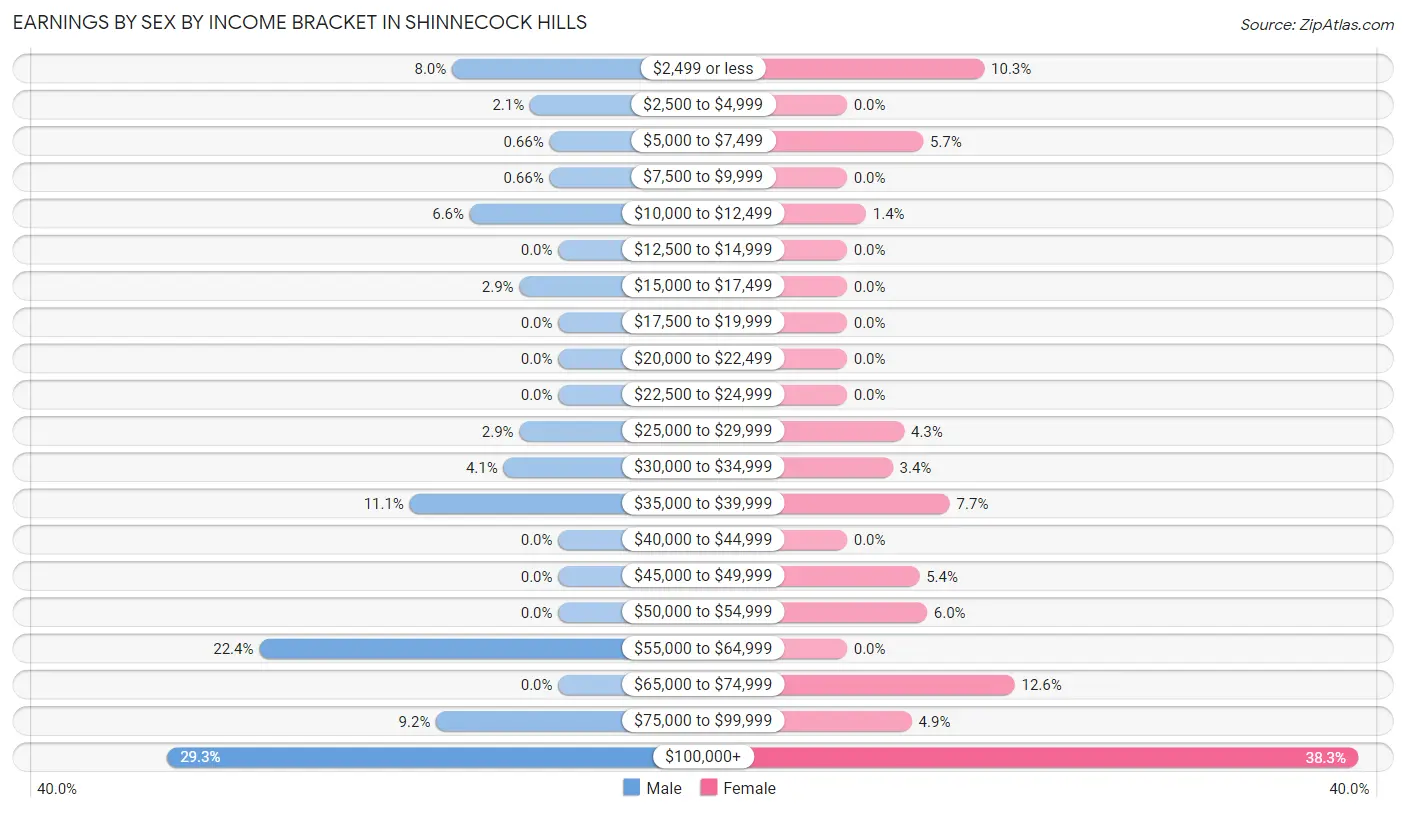
Earnings by Sex by Income Bracket in Shinnecock Hills
The most common earnings brackets in Shinnecock Hills are $100,000+ for men (221 | 29.3%) and $100,000+ for women (134 | 38.3%).
| Income | Male | Female |
| $2,499 or less | 60 (8.0%) | 36 (10.3%) |
| $2,500 to $4,999 | 16 (2.1%) | 0 (0.0%) |
| $5,000 to $7,499 | 5 (0.7%) | 20 (5.7%) |
| $7,500 to $9,999 | 5 (0.7%) | 0 (0.0%) |
| $10,000 to $12,499 | 50 (6.6%) | 5 (1.4%) |
| $12,500 to $14,999 | 0 (0.0%) | 0 (0.0%) |
| $15,000 to $17,499 | 22 (2.9%) | 0 (0.0%) |
| $17,500 to $19,999 | 0 (0.0%) | 0 (0.0%) |
| $20,000 to $22,499 | 0 (0.0%) | 0 (0.0%) |
| $22,500 to $24,999 | 0 (0.0%) | 0 (0.0%) |
| $25,000 to $29,999 | 22 (2.9%) | 15 (4.3%) |
| $30,000 to $34,999 | 31 (4.1%) | 12 (3.4%) |
| $35,000 to $39,999 | 84 (11.1%) | 27 (7.7%) |
| $40,000 to $44,999 | 0 (0.0%) | 0 (0.0%) |
| $45,000 to $49,999 | 0 (0.0%) | 19 (5.4%) |
| $50,000 to $54,999 | 0 (0.0%) | 21 (6.0%) |
| $55,000 to $64,999 | 169 (22.4%) | 0 (0.0%) |
| $65,000 to $74,999 | 0 (0.0%) | 44 (12.6%) |
| $75,000 to $99,999 | 69 (9.1%) | 17 (4.9%) |
| $100,000+ | 221 (29.3%) | 134 (38.3%) |
| Total | 754 (100.0%) | 350 (100.0%) |
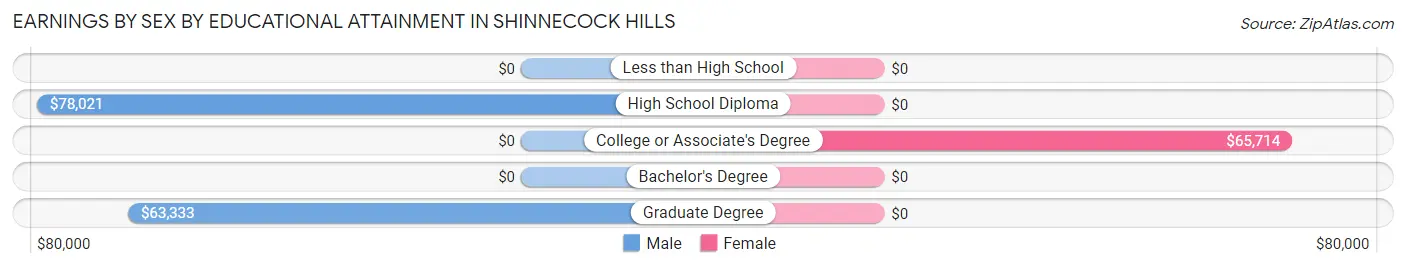
Earnings by Sex by Educational Attainment in Shinnecock Hills
Average earnings in Shinnecock Hills are $62,051 for men and $74,514 for women, a difference of 16.7%. Men with an educational attainment of high school diploma enjoy the highest average annual earnings of $78,021, while those with graduate degree education earn the least with $63,333. Women with an educational attainment of college or associate's degree earn the most with the average annual earnings of $65,714, while those with college or associate's degree education have the smallest earnings of $65,714.
| Educational Attainment | Male Income | Female Income |
| Less than High School | - | - |
| High School Diploma | $78,021 | $0 |
| College or Associate's Degree | - | - |
| Bachelor's Degree | - | - |
| Graduate Degree | $63,333 | $0 |
| Total | $62,051 | $74,514 |
Family Income in Shinnecock Hills
Family Income Brackets in Shinnecock Hills
According to the Shinnecock Hills family income data, there are 222 families falling into the $200,000+ income range, which is the most common income bracket and makes up 41.2% of all families.
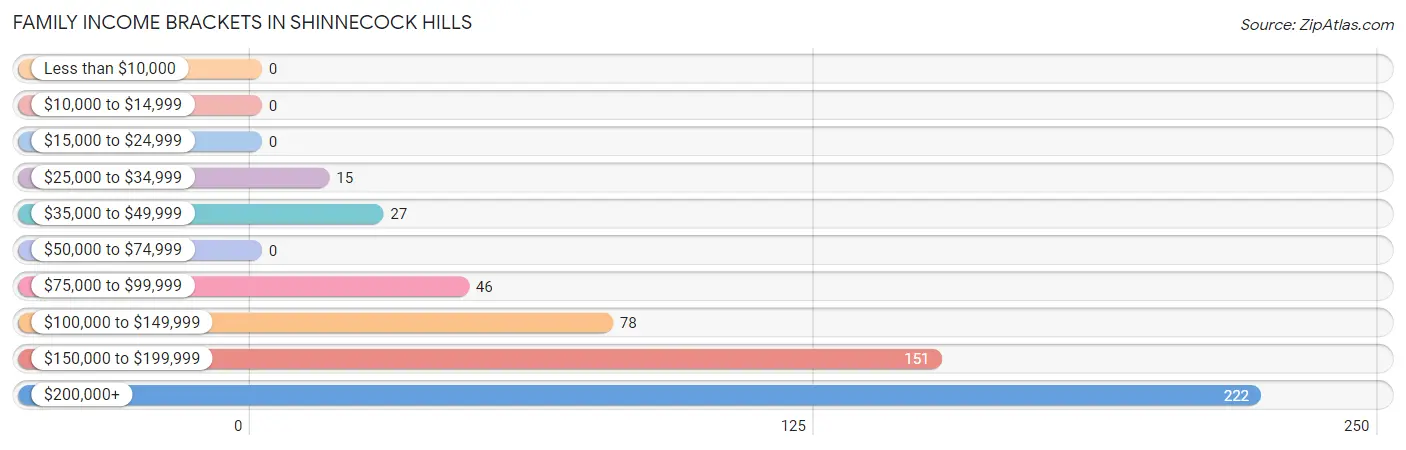
| Income Bracket | # Families | % Families |
| Less than $10,000 | 0 | 0.0% |
| $10,000 to $14,999 | 0 | 0.0% |
| $15,000 to $24,999 | 0 | 0.0% |
| $25,000 to $34,999 | 15 | 2.8% |
| $35,000 to $49,999 | 27 | 5.0% |
| $50,000 to $74,999 | 0 | 0.0% |
| $75,000 to $99,999 | 46 | 8.5% |
| $100,000 to $149,999 | 78 | 14.5% |
| $150,000 to $199,999 | 151 | 28.0% |
| $200,000+ | 222 | 41.2% |
Family Income by Famaliy Size in Shinnecock Hills
4-person families (102 | 18.9%) account for the highest median family income in Shinnecock Hills with $250,001 per family, while 2-person families (291 | 54.0%) have the highest median income of $88,777 per family member.
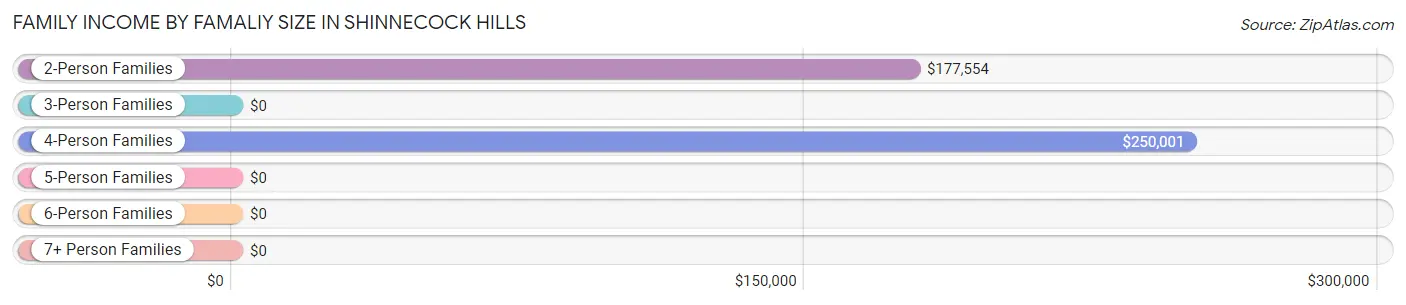
| Income Bracket | # Families | Median Income |
| 2-Person Families | 291 (54.0%) | $177,554 |
| 3-Person Families | 60 (11.1%) | $0 |
| 4-Person Families | 102 (18.9%) | $250,001 |
| 5-Person Families | 26 (4.8%) | $0 |
| 6-Person Families | 60 (11.1%) | $0 |
| 7+ Person Families | 0 (0.0%) | $0 |
| Total | 539 (100.0%) | $177,663 |
Family Income by Number of Earners in Shinnecock Hills
The median family income in Shinnecock Hills is $177,663, with families comprising 2 earners (173) having the highest median family income of $234,345, while families with no earners (61) have the lowest median family income of $97,750, accounting for 32.1% and 11.3% of families, respectively.
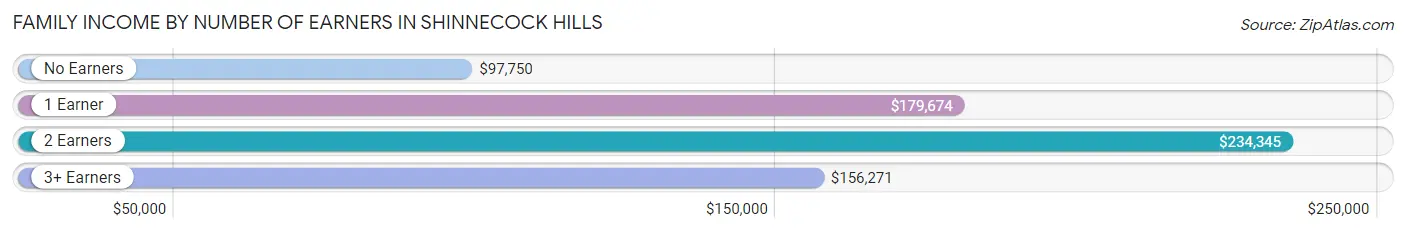
| Number of Earners | # Families | Median Income |
| No Earners | 61 (11.3%) | $97,750 |
| 1 Earner | 222 (41.2%) | $179,674 |
| 2 Earners | 173 (32.1%) | $234,345 |
| 3+ Earners | 83 (15.4%) | $156,271 |
| Total | 539 (100.0%) | $177,663 |
Household Income in Shinnecock Hills
Household Income Brackets in Shinnecock Hills
With 273 households falling in the category, the $200,000+ income range is the most frequent in Shinnecock Hills, accounting for 36.0% of all households.
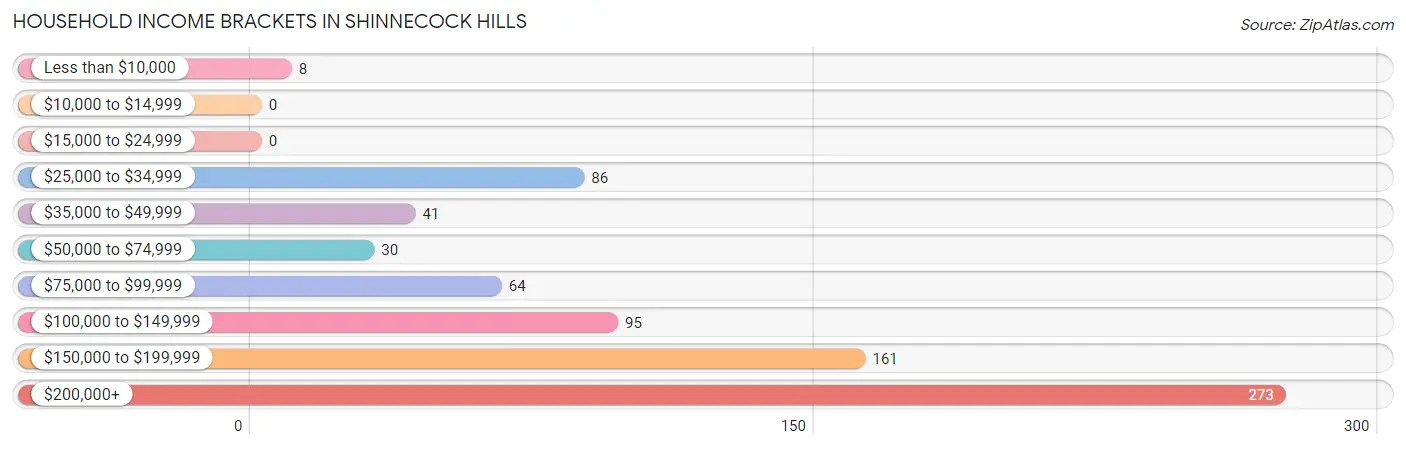
| Income Bracket | # Households | % Households |
| Less than $10,000 | 8 | 1.1% |
| $10,000 to $14,999 | 0 | 0.0% |
| $15,000 to $24,999 | 0 | 0.0% |
| $25,000 to $34,999 | 86 | 11.3% |
| $35,000 to $49,999 | 41 | 5.4% |
| $50,000 to $74,999 | 30 | 4.0% |
| $75,000 to $99,999 | 64 | 8.4% |
| $100,000 to $149,999 | 95 | 12.5% |
| $150,000 to $199,999 | 161 | 21.2% |
| $200,000+ | 273 | 36.0% |
Household Income by Householder Age in Shinnecock Hills
The median household income in Shinnecock Hills is $156,833, with the highest median household income of $233,929 found in the 25 to 44 years age bracket for the primary householder. A total of 116 households (15.3%) fall into this category.
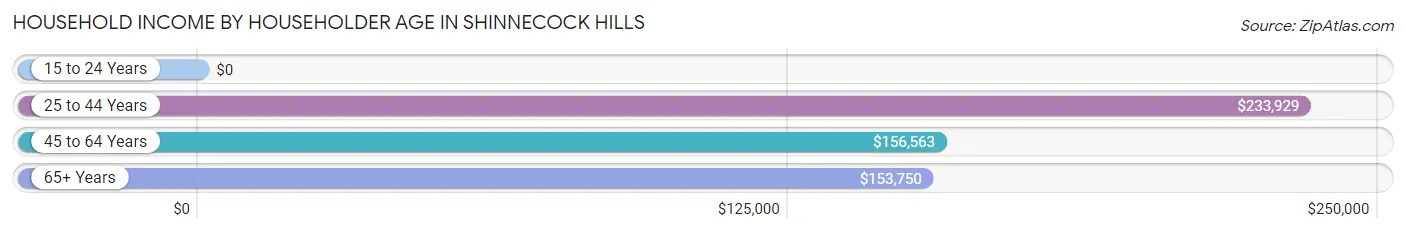
| Income Bracket | # Households | Median Income |
| 15 to 24 Years | 0 (0.0%) | $0 |
| 25 to 44 Years | 116 (15.3%) | $233,929 |
| 45 to 64 Years | 303 (40.0%) | $156,563 |
| 65+ Years | 339 (44.7%) | $153,750 |
| Total | 758 (100.0%) | $156,833 |
Poverty in Shinnecock Hills
Income Below Poverty by Sex and Age in Shinnecock Hills
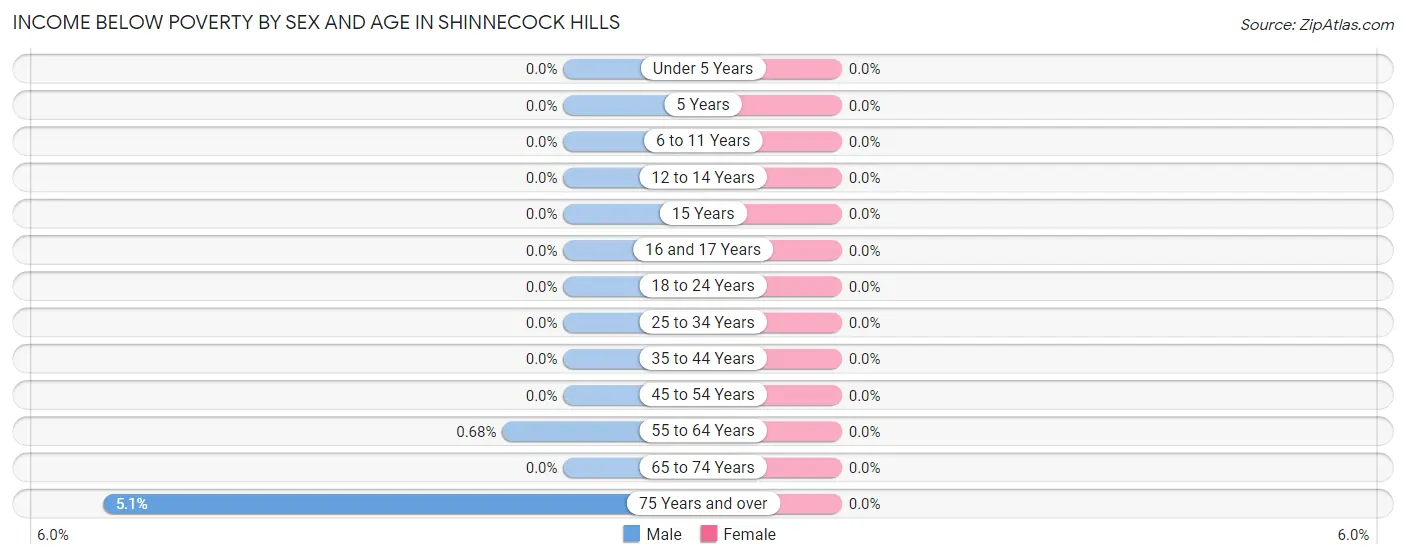
| Age Bracket | Male | Female |
| Under 5 Years | 0 (0.0%) | 0 (0.0%) |
| 5 Years | 0 (0.0%) | 0 (0.0%) |
| 6 to 11 Years | 0 (0.0%) | 0 (0.0%) |
| 12 to 14 Years | 0 (0.0%) | 0 (0.0%) |
| 15 Years | 0 (0.0%) | 0 (0.0%) |
| 16 and 17 Years | 0 (0.0%) | 0 (0.0%) |
| 18 to 24 Years | 0 (0.0%) | 0 (0.0%) |
| 25 to 34 Years | 0 (0.0%) | 0 (0.0%) |
| 35 to 44 Years | 0 (0.0%) | 0 (0.0%) |
| 45 to 54 Years | 0 (0.0%) | 0 (0.0%) |
| 55 to 64 Years | 1 (0.7%) | 0 (0.0%) |
| 65 to 74 Years | 0 (0.0%) | 0 (0.0%) |
| 75 Years and over | 8 (5.1%) | 0 (0.0%) |
| Total | 9 (0.8%) | 0 (0.0%) |
Income Above Poverty by Sex and Age in Shinnecock Hills
According to the poverty statistics in Shinnecock Hills, males aged under 5 years and females aged under 5 years are the age groups that are most secure financially, with 100.0% of males and 100.0% of females in these age groups living above the poverty line.
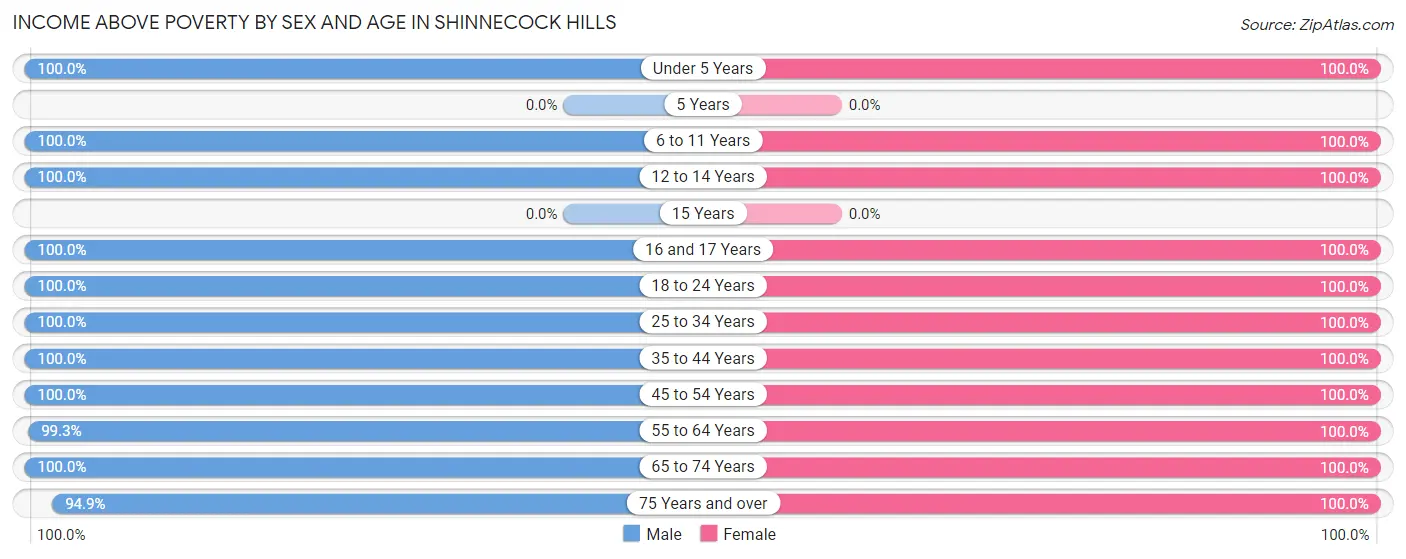
| Age Bracket | Male | Female |
| Under 5 Years | 47 (100.0%) | 16 (100.0%) |
| 5 Years | 0 (0.0%) | 0 (0.0%) |
| 6 to 11 Years | 69 (100.0%) | 70 (100.0%) |
| 12 to 14 Years | 73 (100.0%) | 27 (100.0%) |
| 15 Years | 0 (0.0%) | 0 (0.0%) |
| 16 and 17 Years | 64 (100.0%) | 24 (100.0%) |
| 18 to 24 Years | 56 (100.0%) | 60 (100.0%) |
| 25 to 34 Years | 150 (100.0%) | 27 (100.0%) |
| 35 to 44 Years | 110 (100.0%) | 87 (100.0%) |
| 45 to 54 Years | 101 (100.0%) | 130 (100.0%) |
| 55 to 64 Years | 145 (99.3%) | 164 (100.0%) |
| 65 to 74 Years | 158 (100.0%) | 121 (100.0%) |
| 75 Years and over | 148 (94.9%) | 137 (100.0%) |
| Total | 1,121 (99.2%) | 863 (100.0%) |
Income Below Poverty Among Married-Couple Families in Shinnecock Hills
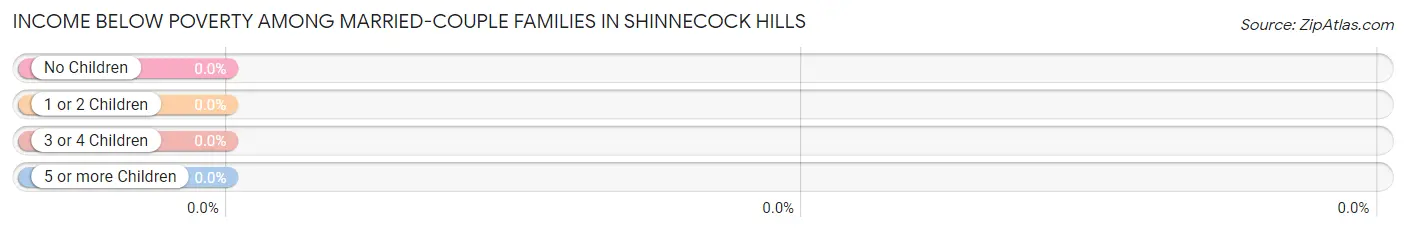
| Children | Above Poverty | Below Poverty |
| No Children | 281 (100.0%) | 0 (0.0%) |
| 1 or 2 Children | 145 (100.0%) | 0 (0.0%) |
| 3 or 4 Children | 26 (100.0%) | 0 (0.0%) |
| 5 or more Children | 0 (0.0%) | 0 (0.0%) |
| Total | 452 (100.0%) | 0 (0.0%) |
Income Below Poverty Among Single-Parent Households in Shinnecock Hills
| Children | Single Father | Single Mother |
| No Children | 0 (0.0%) | 0 (0.0%) |
| 1 or 2 Children | 0 (0.0%) | 0 (0.0%) |
| 3 or 4 Children | 0 (0.0%) | 0 (0.0%) |
| 5 or more Children | 0 (0.0%) | 0 (0.0%) |
| Total | 0 (0.0%) | 0 (0.0%) |
Income Below Poverty Among Married-Couple vs Single-Parent Households in Shinnecock Hills
| Children | Married-Couple Families | Single-Parent Households |
| No Children | 0 (0.0%) | 0 (0.0%) |
| 1 or 2 Children | 0 (0.0%) | 0 (0.0%) |
| 3 or 4 Children | 0 (0.0%) | 0 (0.0%) |
| 5 or more Children | 0 (0.0%) | 0 (0.0%) |
| Total | 0 (0.0%) | 0 (0.0%) |
Race in Shinnecock Hills
The most populous races in Shinnecock Hills are White / Caucasian (1,983 | 92.9%), Hispanic or Latino (593 | 27.8%), and Two or more Races (61 | 2.9%).
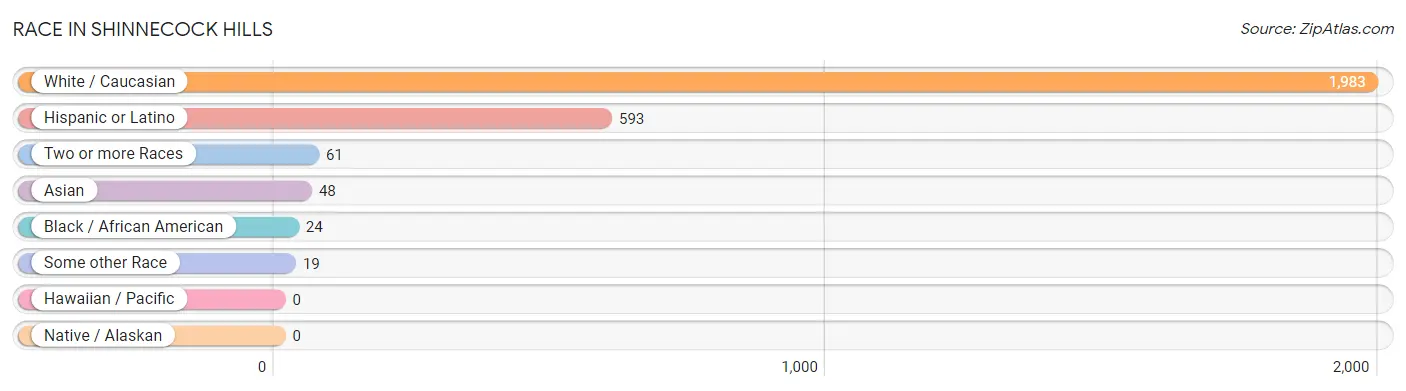
| Race | # Population | % Population |
| Asian | 48 | 2.2% |
| Black / African American | 24 | 1.1% |
| Hawaiian / Pacific | 0 | 0.0% |
| Hispanic or Latino | 593 | 27.8% |
| Native / Alaskan | 0 | 0.0% |
| White / Caucasian | 1,983 | 92.9% |
| Two or more Races | 61 | 2.9% |
| Some other Race | 19 | 0.9% |
| Total | 2,135 | 100.0% |
Ancestry in Shinnecock Hills
The most populous ancestries reported in Shinnecock Hills are Irish (423 | 19.8%), Italian (377 | 17.7%), Central American (327 | 15.3%), Guatemalan (314 | 14.7%), and German (250 | 11.7%), together accounting for 79.2% of all Shinnecock Hills residents.
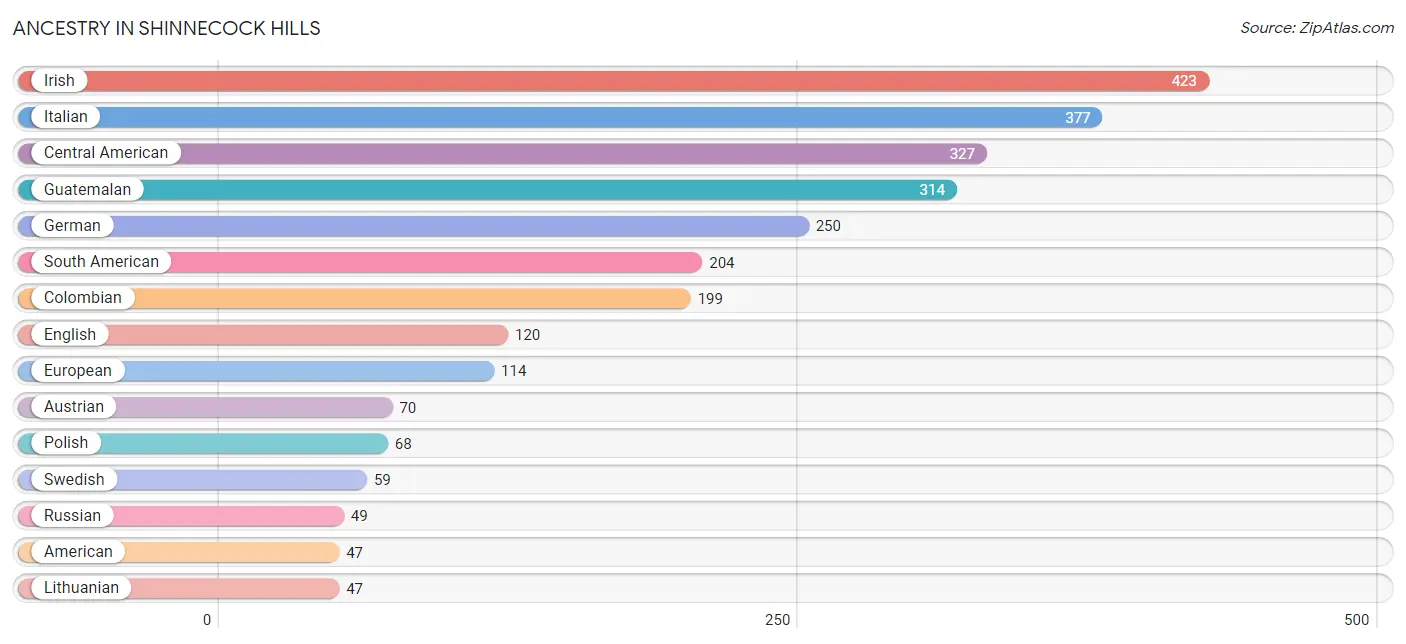
| Ancestry | # Population | % Population |
| American | 47 | 2.2% |
| Arab | 38 | 1.8% |
| Armenian | 28 | 1.3% |
| Australian | 31 | 1.5% |
| Austrian | 70 | 3.3% |
| British | 17 | 0.8% |
| Central American | 327 | 15.3% |
| Colombian | 199 | 9.3% |
| Costa Rican | 13 | 0.6% |
| Croatian | 11 | 0.5% |
| Dominican | 14 | 0.7% |
| Dutch | 35 | 1.6% |
| Ecuadorian | 5 | 0.2% |
| Egyptian | 17 | 0.8% |
| English | 120 | 5.6% |
| European | 114 | 5.3% |
| French | 22 | 1.0% |
| German | 250 | 11.7% |
| Greek | 38 | 1.8% |
| Guatemalan | 314 | 14.7% |
| Indian (Asian) | 30 | 1.4% |
| Iranian | 7 | 0.3% |
| Irish | 423 | 19.8% |
| Italian | 377 | 17.7% |
| Korean | 5 | 0.2% |
| Lebanese | 15 | 0.7% |
| Lithuanian | 47 | 2.2% |
| Mexican | 42 | 2.0% |
| Norwegian | 46 | 2.1% |
| Polish | 68 | 3.2% |
| Romanian | 23 | 1.1% |
| Russian | 49 | 2.3% |
| Scandinavian | 14 | 0.7% |
| Scotch-Irish | 18 | 0.8% |
| Scottish | 14 | 0.7% |
| South American | 204 | 9.6% |
| Swedish | 59 | 2.8% |
| Syrian | 21 | 1.0% |
| Thai | 20 | 0.9% | View All 39 Rows |
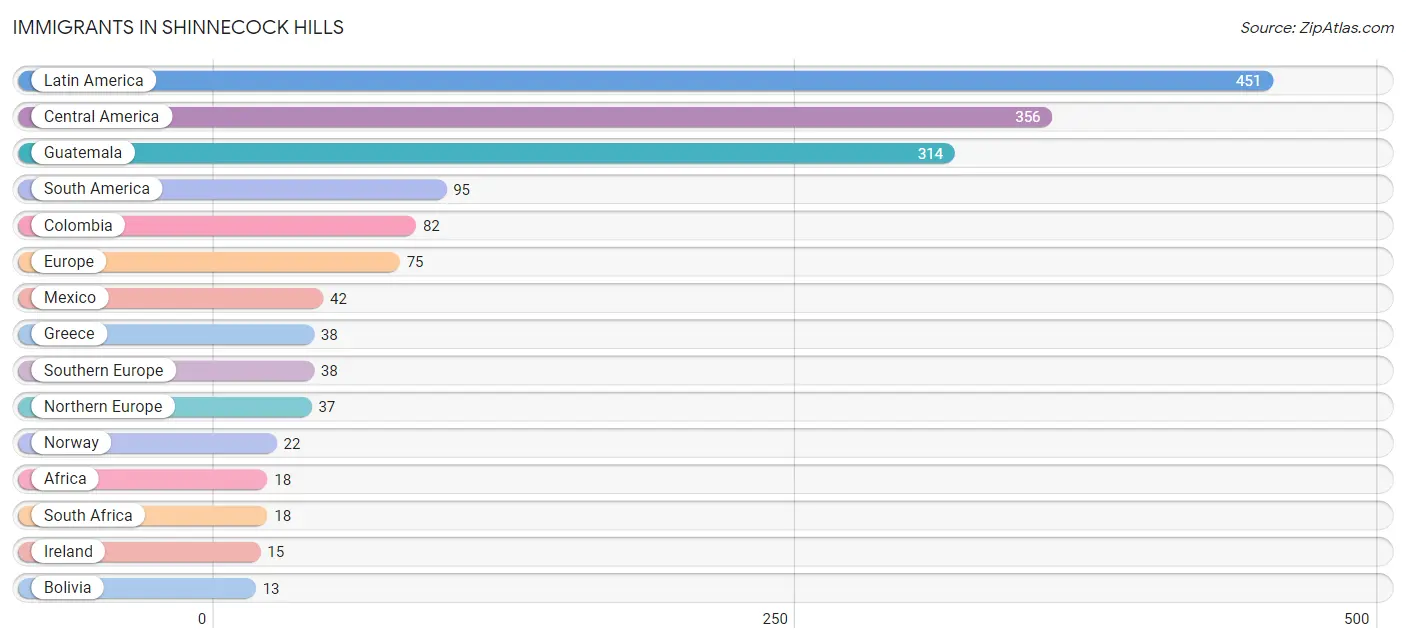
Immigrants in Shinnecock Hills
The most numerous immigrant groups reported in Shinnecock Hills came from Latin America (451 | 21.1%), Central America (356 | 16.7%), Guatemala (314 | 14.7%), South America (95 | 4.4%), and Colombia (82 | 3.8%), together accounting for 60.8% of all Shinnecock Hills residents.
| Immigration Origin | # Population | % Population |
| Africa | 18 | 0.8% |
| Asia | 7 | 0.3% |
| Bangladesh | 7 | 0.3% |
| Bolivia | 13 | 0.6% |
| Central America | 356 | 16.7% |
| Colombia | 82 | 3.8% |
| Europe | 75 | 3.5% |
| Greece | 38 | 1.8% |
| Guatemala | 314 | 14.7% |
| Ireland | 15 | 0.7% |
| Latin America | 451 | 21.1% |
| Mexico | 42 | 2.0% |
| Northern Europe | 37 | 1.7% |
| Norway | 22 | 1.0% |
| South Africa | 18 | 0.8% |
| South America | 95 | 4.4% |
| South Central Asia | 7 | 0.3% |
| Southern Europe | 38 | 1.8% | View All 18 Rows |
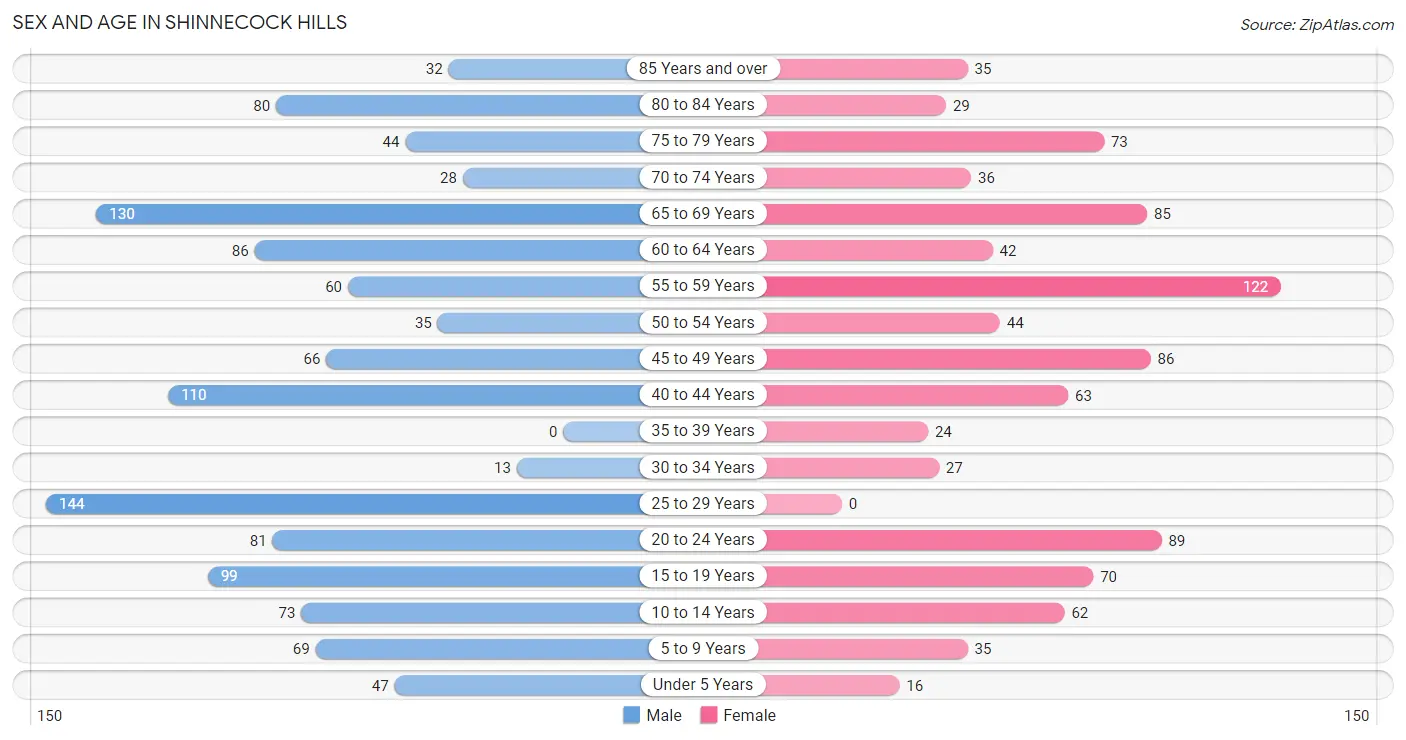
Sex and Age in Shinnecock Hills
Sex and Age in Shinnecock Hills
The most populous age groups in Shinnecock Hills are 25 to 29 Years (144 | 12.0%) for men and 55 to 59 Years (122 | 13.0%) for women.
| Age Bracket | Male | Female |
| Under 5 Years | 47 (3.9%) | 16 (1.7%) |
| 5 to 9 Years | 69 (5.8%) | 35 (3.7%) |
| 10 to 14 Years | 73 (6.1%) | 62 (6.6%) |
| 15 to 19 Years | 99 (8.3%) | 70 (7.5%) |
| 20 to 24 Years | 81 (6.8%) | 89 (9.5%) |
| 25 to 29 Years | 144 (12.0%) | 0 (0.0%) |
| 30 to 34 Years | 13 (1.1%) | 27 (2.9%) |
| 35 to 39 Years | 0 (0.0%) | 24 (2.6%) |
| 40 to 44 Years | 110 (9.2%) | 63 (6.7%) |
| 45 to 49 Years | 66 (5.5%) | 86 (9.2%) |
| 50 to 54 Years | 35 (2.9%) | 44 (4.7%) |
| 55 to 59 Years | 60 (5.0%) | 122 (13.0%) |
| 60 to 64 Years | 86 (7.2%) | 42 (4.5%) |
| 65 to 69 Years | 130 (10.9%) | 85 (9.1%) |
| 70 to 74 Years | 28 (2.3%) | 36 (3.8%) |
| 75 to 79 Years | 44 (3.7%) | 73 (7.8%) |
| 80 to 84 Years | 80 (6.7%) | 29 (3.1%) |
| 85 Years and over | 32 (2.7%) | 35 (3.7%) |
| Total | 1,197 (100.0%) | 938 (100.0%) |
Families and Households in Shinnecock Hills
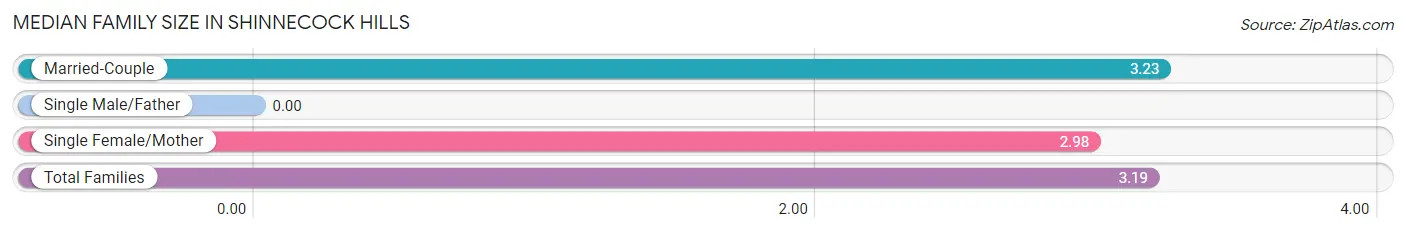
Median Family Size in Shinnecock Hills
| Family Type | # Families | Family Size |
| Married-Couple | 452 (83.9%) | 3.23 |
| Single Male/Father | 0 (0.0%) | - |
| Single Female/Mother | 87 (16.1%) | 2.98 |
| Total Families | 539 (100.0%) | 3.19 |
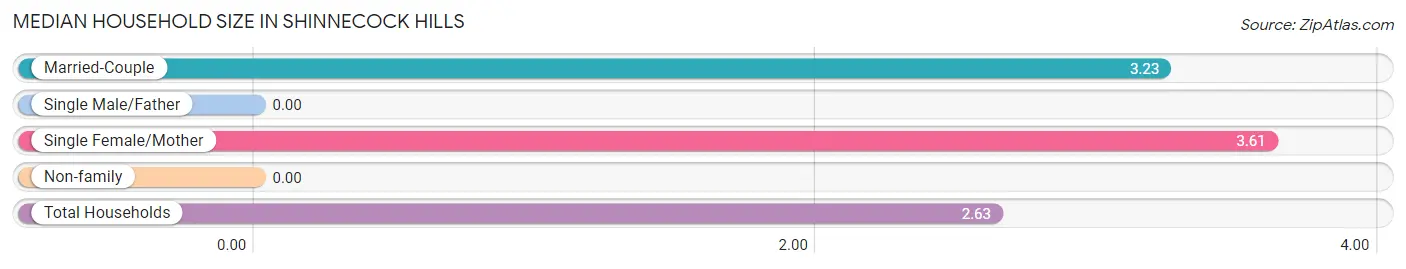
Median Household Size in Shinnecock Hills
| Household Type | # Households | Household Size |
| Married-Couple | 452 (59.6%) | 3.23 |
| Single Male/Father | 0 (0.0%) | - |
| Single Female/Mother | 87 (11.5%) | 3.61 |
| Non-family | 219 (28.9%) | - |
| Total Households | 758 (100.0%) | 2.63 |
Household Size by Marriage Status in Shinnecock Hills
Out of a total of 758 households in Shinnecock Hills, 539 (71.1%) are family households, while 219 (28.9%) are nonfamily households. The most numerous type of family households are 2-person households, comprising 281, and the most common type of nonfamily households are 1-person households, comprising 219.
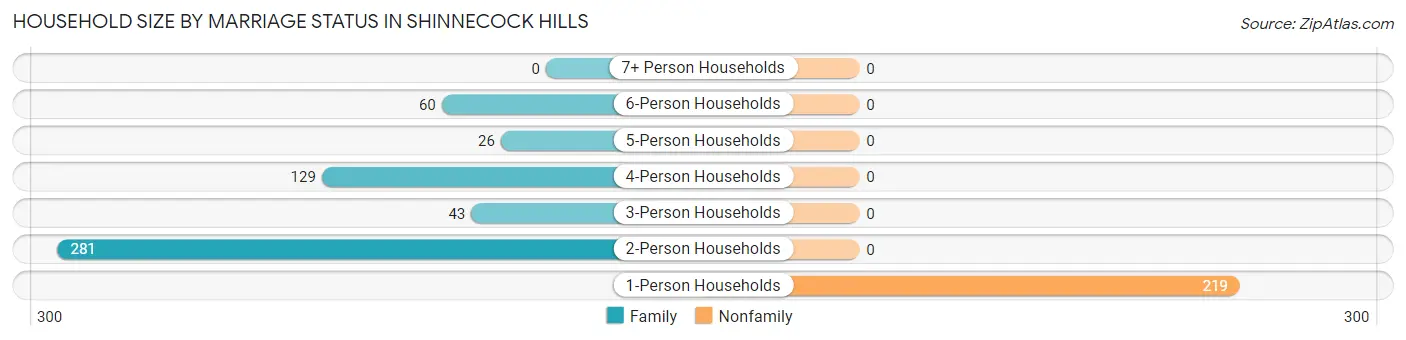
| Household Size | Family Households | Nonfamily Households |
| 1-Person Households | - | 219 (28.9%) |
| 2-Person Households | 281 (37.1%) | 0 (0.0%) |
| 3-Person Households | 43 (5.7%) | 0 (0.0%) |
| 4-Person Households | 129 (17.0%) | 0 (0.0%) |
| 5-Person Households | 26 (3.4%) | 0 (0.0%) |
| 6-Person Households | 60 (7.9%) | 0 (0.0%) |
| 7+ Person Households | 0 (0.0%) | 0 (0.0%) |
| Total | 539 (71.1%) | 219 (28.9%) |
Female Fertility in Shinnecock Hills
Fertility by Age in Shinnecock Hills
| Age Bracket | Women with Births | Births / 1,000 Women |
| 15 to 19 years | 0 (0.0%) | 0.0 |
| 20 to 34 years | 0 (0.0%) | 0.0 |
| 35 to 50 years | 0 (0.0%) | 0.0 |
| Total | 0 (0.0%) | 0.0 |
Fertility by Age by Marriage Status in Shinnecock Hills
| Age Bracket | Married | Unmarried |
| 15 to 19 years | 0 (0.0%) | 0 (0.0%) |
| 20 to 34 years | 0 (0.0%) | 0 (0.0%) |
| 35 to 50 years | 0 (0.0%) | 0 (0.0%) |
| Total | 0 (0.0%) | 0 (0.0%) |
Fertility by Education in Shinnecock Hills
| Educational Attainment | Women with Births | Births / 1,000 Women |
| Less than High School | 0 (0.0%) | 0.0 |
| High School Diploma | 0 (0.0%) | 0.0 |
| College or Associate's Degree | 0 (0.0%) | 0.0 |
| Bachelor's Degree | 0 (0.0%) | 0.0 |
| Graduate Degree | 0 (0.0%) | 0.0 |
| Total | 0 (0.0%) | 0.0 |
Fertility by Education by Marriage Status in Shinnecock Hills
| Educational Attainment | Married | Unmarried |
| Less than High School | 0 (0.0%) | 0 (0.0%) |
| High School Diploma | 0 (0.0%) | 0 (0.0%) |
| College or Associate's Degree | 0 (0.0%) | 0 (0.0%) |
| Bachelor's Degree | 0 (0.0%) | 0 (0.0%) |
| Graduate Degree | 0 (0.0%) | 0 (0.0%) |
| Total | 0 (0.0%) | 0 (0.0%) |
Employment Characteristics in Shinnecock Hills
Employment by Class of Employer in Shinnecock Hills
Among the 858 employed individuals in Shinnecock Hills, private company employees (628 | 73.2%), local government employees (68 | 7.9%), and self-employed (incorporated) (67 | 7.8%) make up the most common classes of employment.
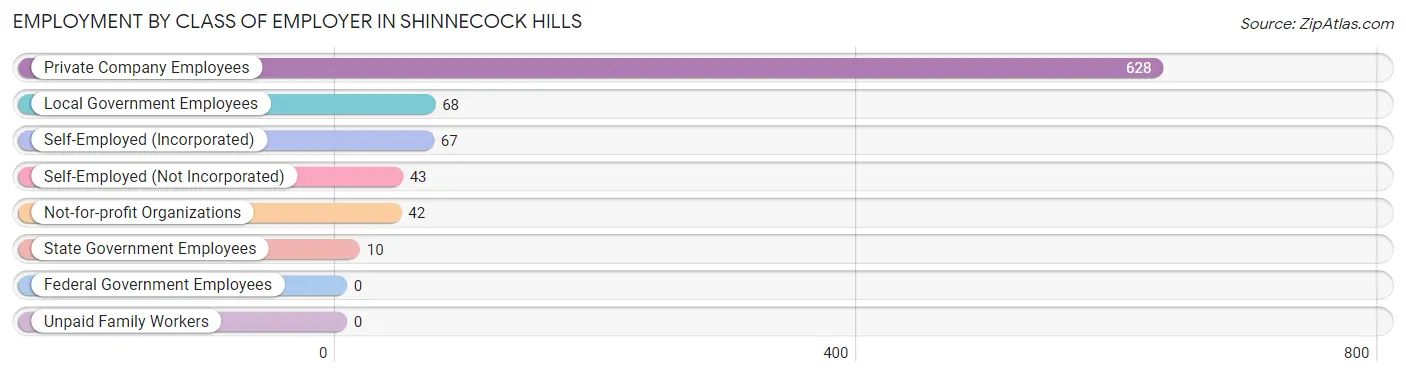
| Employer Class | # Employees | % Employees |
| Private Company Employees | 628 | 73.2% |
| Self-Employed (Incorporated) | 67 | 7.8% |
| Self-Employed (Not Incorporated) | 43 | 5.0% |
| Not-for-profit Organizations | 42 | 4.9% |
| Local Government Employees | 68 | 7.9% |
| State Government Employees | 10 | 1.2% |
| Federal Government Employees | 0 | 0.0% |
| Unpaid Family Workers | 0 | 0.0% |
| Total | 858 | 100.0% |
Employment Status by Age in Shinnecock Hills
According to the labor force statistics for Shinnecock Hills, out of the total population over 16 years of age (1,833), 51.7% or 948 individuals are in the labor force, with 6.8% or 64 of them unemployed. The age group with the highest labor force participation rate is 30 to 34 years, with 100.0% or 40 individuals in the labor force. Within the labor force, the 16 to 19 years age range has the highest percentage of unemployed individuals, with 33.3% or 6 of them being unemployed.
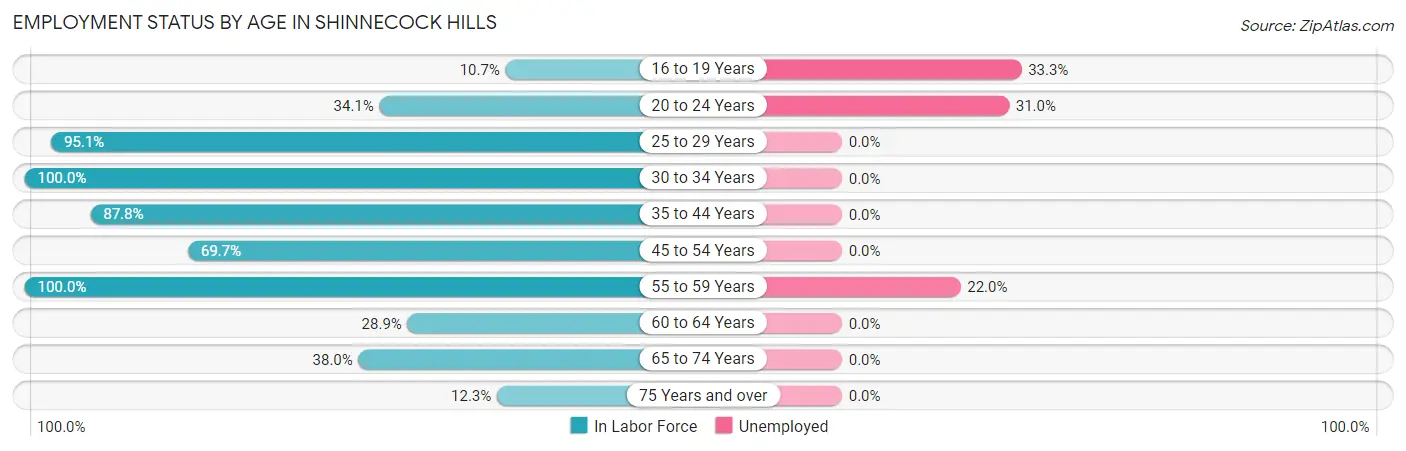
| Age Bracket | In Labor Force | Unemployed |
| 16 to 19 Years | 18 (10.7%) | 6 (33.3%) |
| 20 to 24 Years | 58 (34.1%) | 18 (31.0%) |
| 25 to 29 Years | 137 (95.1%) | 0 (0.0%) |
| 30 to 34 Years | 40 (100.0%) | 0 (0.0%) |
| 35 to 44 Years | 173 (87.8%) | 0 (0.0%) |
| 45 to 54 Years | 161 (69.7%) | 0 (0.0%) |
| 55 to 59 Years | 182 (100.0%) | 40 (22.0%) |
| 60 to 64 Years | 37 (28.9%) | 0 (0.0%) |
| 65 to 74 Years | 106 (38.0%) | 0 (0.0%) |
| 75 Years and over | 36 (12.3%) | 0 (0.0%) |
| Total | 948 (51.7%) | 64 (6.8%) |
Employment Status by Educational Attainment in Shinnecock Hills
According to labor force statistics for Shinnecock Hills, 79.2% of individuals (730) out of the total population between 25 and 64 years of age (922) are in the labor force, with 5.5% or 40 of them being unemployed. The group with the highest labor force participation rate are those with the educational attainment of college / associate degree, with 94.3% or 115 individuals in the labor force. Within the labor force, individuals with college / associate degree education have the highest percentage of unemployment, with 34.8% or 40 of them being unemployed.
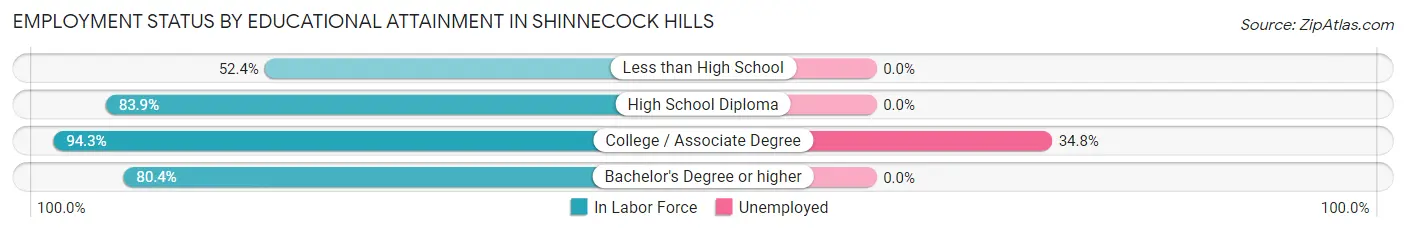
| Educational Attainment | In Labor Force | Unemployed |
| Less than High School | 66 (52.4%) | 0 (0.0%) |
| High School Diploma | 167 (83.9%) | 0 (0.0%) |
| College / Associate Degree | 115 (94.3%) | 42 (34.8%) |
| Bachelor's Degree or higher | 382 (80.4%) | 0 (0.0%) |
| Total | 730 (79.2%) | 51 (5.5%) |
Employment Occupations by Sex in Shinnecock Hills
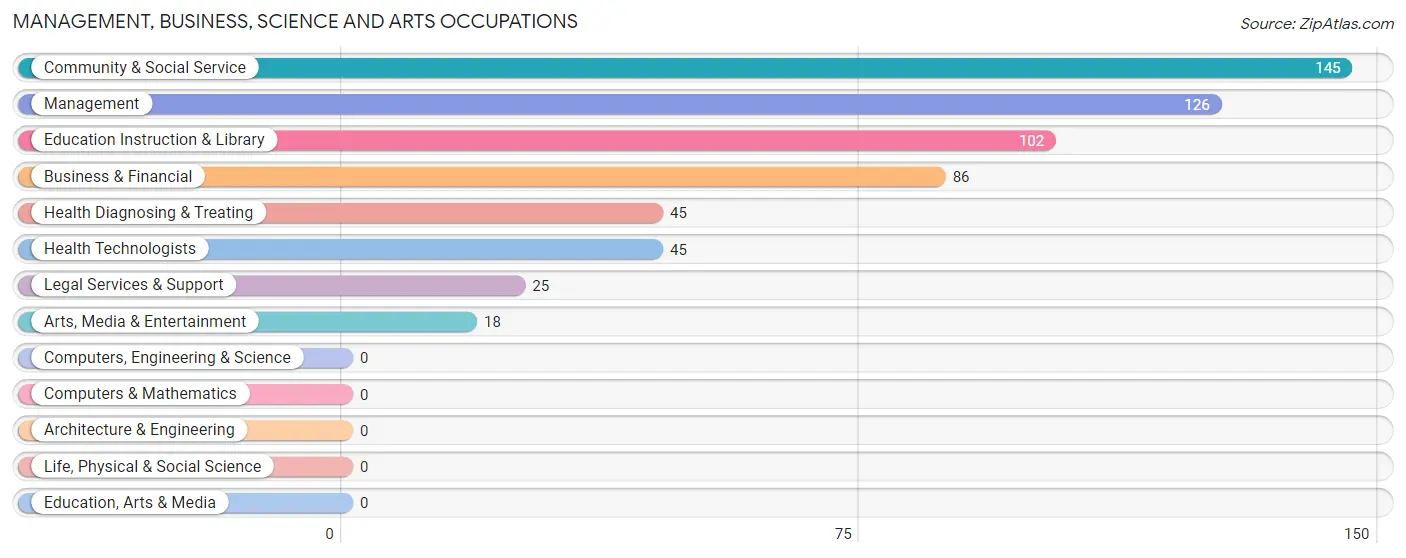
Management, Business, Science and Arts Occupations
The most common Management, Business, Science and Arts occupations in Shinnecock Hills are Community & Social Service (145 | 16.4%), Management (126 | 14.2%), Education Instruction & Library (102 | 11.5%), Business & Financial (86 | 9.7%), and Health Diagnosing & Treating (45 | 5.1%).
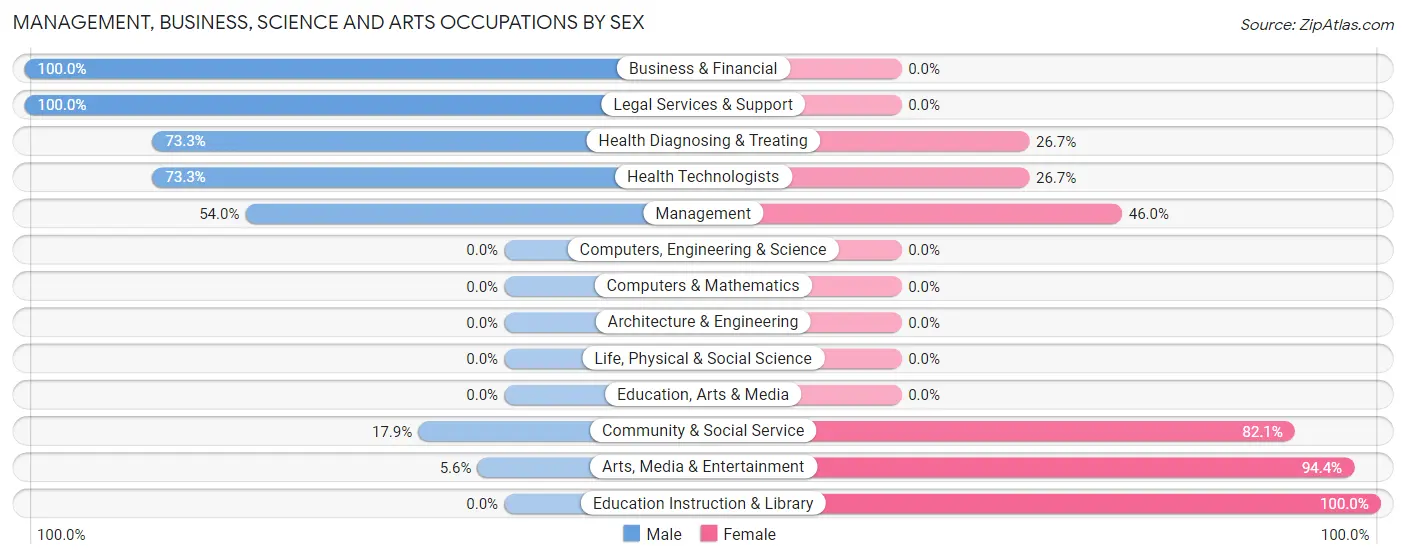
Management, Business, Science and Arts Occupations by Sex
Within the Management, Business, Science and Arts occupations in Shinnecock Hills, the most male-oriented occupations are Business & Financial (100.0%), Legal Services & Support (100.0%), and Health Diagnosing & Treating (73.3%), while the most female-oriented occupations are Education Instruction & Library (100.0%), Arts, Media & Entertainment (94.4%), and Community & Social Service (82.1%).
| Occupation | Male | Female |
| Management | 68 (54.0%) | 58 (46.0%) |
| Business & Financial | 86 (100.0%) | 0 (0.0%) |
| Computers, Engineering & Science | 0 (0.0%) | 0 (0.0%) |
| Computers & Mathematics | 0 (0.0%) | 0 (0.0%) |
| Architecture & Engineering | 0 (0.0%) | 0 (0.0%) |
| Life, Physical & Social Science | 0 (0.0%) | 0 (0.0%) |
| Community & Social Service | 26 (17.9%) | 119 (82.1%) |
| Education, Arts & Media | 0 (0.0%) | 0 (0.0%) |
| Legal Services & Support | 25 (100.0%) | 0 (0.0%) |
| Education Instruction & Library | 0 (0.0%) | 102 (100.0%) |
| Arts, Media & Entertainment | 1 (5.6%) | 17 (94.4%) |
| Health Diagnosing & Treating | 33 (73.3%) | 12 (26.7%) |
| Health Technologists | 33 (73.3%) | 12 (26.7%) |
| Total (Category) | 213 (53.0%) | 189 (47.0%) |
| Total (Overall) | 570 (64.5%) | 314 (35.5%) |
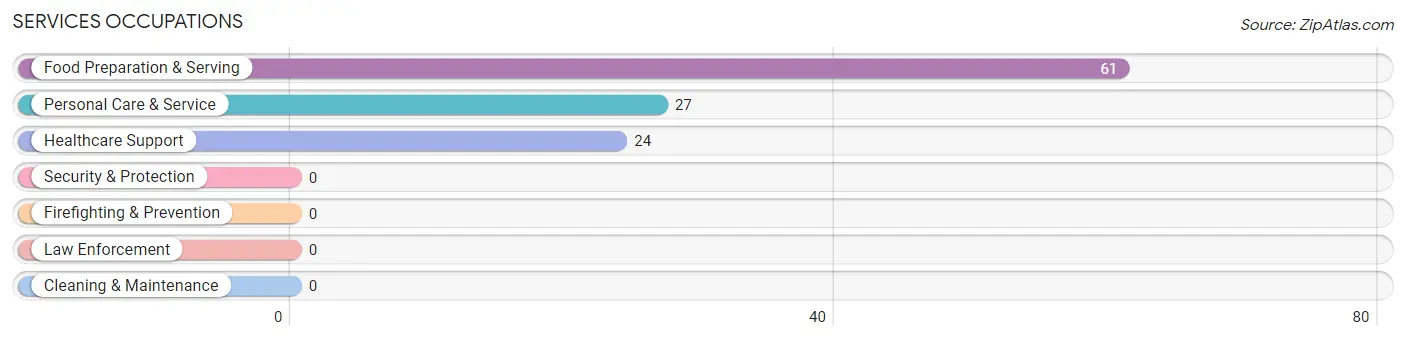
Services Occupations
The most common Services occupations in Shinnecock Hills are Food Preparation & Serving (61 | 6.9%), Personal Care & Service (27 | 3.0%), and Healthcare Support (24 | 2.7%).
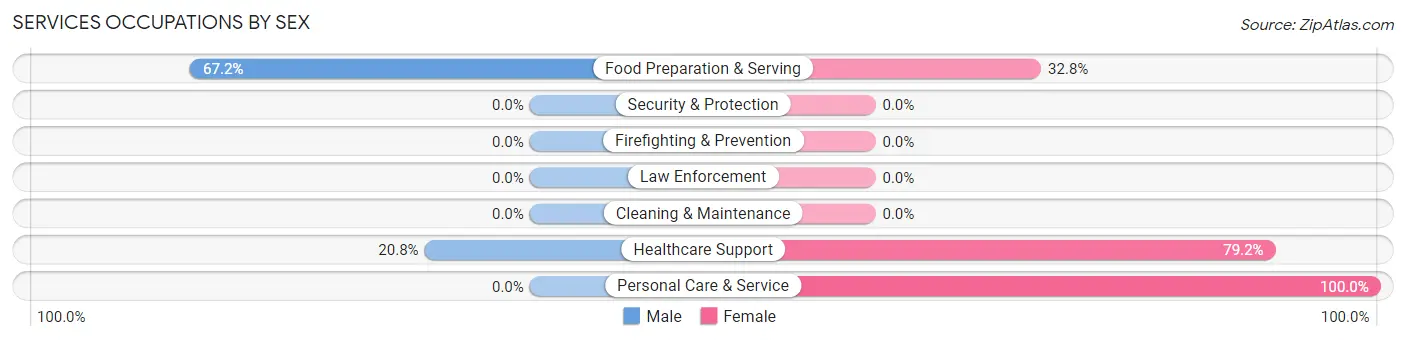
Services Occupations by Sex
Within the Services occupations in Shinnecock Hills, the most male-oriented occupations are Food Preparation & Serving (67.2%), and Healthcare Support (20.8%), while the most female-oriented occupations are Personal Care & Service (100.0%), Healthcare Support (79.2%), and Food Preparation & Serving (32.8%).
| Occupation | Male | Female |
| Healthcare Support | 5 (20.8%) | 19 (79.2%) |
| Security & Protection | 0 (0.0%) | 0 (0.0%) |
| Firefighting & Prevention | 0 (0.0%) | 0 (0.0%) |
| Law Enforcement | 0 (0.0%) | 0 (0.0%) |
| Food Preparation & Serving | 41 (67.2%) | 20 (32.8%) |
| Cleaning & Maintenance | 0 (0.0%) | 0 (0.0%) |
| Personal Care & Service | 0 (0.0%) | 27 (100.0%) |
| Total (Category) | 46 (41.1%) | 66 (58.9%) |
| Total (Overall) | 570 (64.5%) | 314 (35.5%) |
Sales and Office Occupations
The most common Sales and Office occupations in Shinnecock Hills are , and Sales & Related (72 | 8.1%).
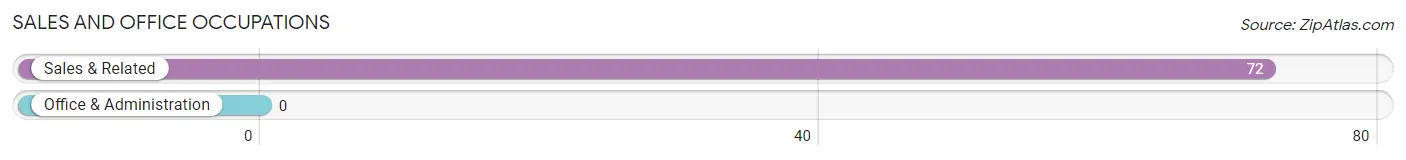
Sales and Office Occupations by Sex
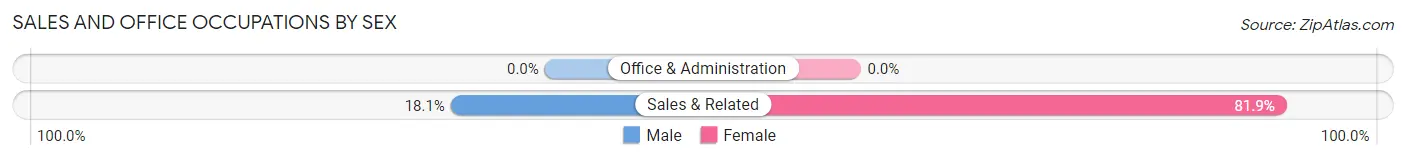
| Occupation | Male | Female |
| Sales & Related | 13 (18.1%) | 59 (81.9%) |
| Office & Administration | 0 (0.0%) | 0 (0.0%) |
| Total (Category) | 13 (18.1%) | 59 (81.9%) |
| Total (Overall) | 570 (64.5%) | 314 (35.5%) |
Natural Resources, Construction and Maintenance Occupations
The most common Natural Resources, Construction and Maintenance occupations in Shinnecock Hills are Construction & Extraction (188 | 21.3%), and Installation, Maintenance & Repair (86 | 9.7%).
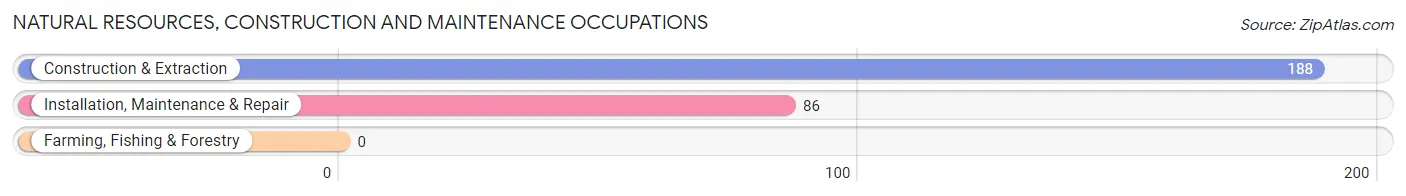
Natural Resources, Construction and Maintenance Occupations by Sex
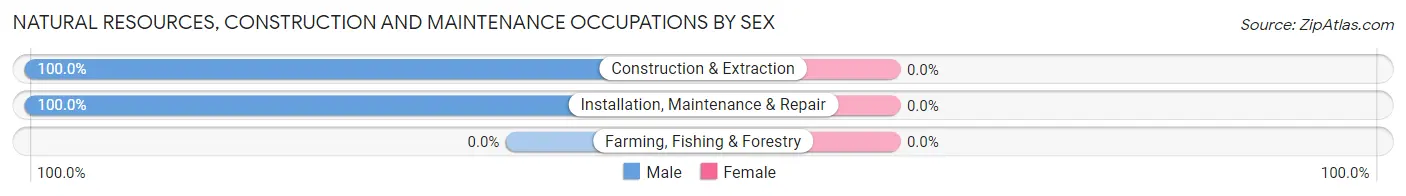
| Occupation | Male | Female |
| Farming, Fishing & Forestry | 0 (0.0%) | 0 (0.0%) |
| Construction & Extraction | 188 (100.0%) | 0 (0.0%) |
| Installation, Maintenance & Repair | 86 (100.0%) | 0 (0.0%) |
| Total (Category) | 274 (100.0%) | 0 (0.0%) |
| Total (Overall) | 570 (64.5%) | 314 (35.5%) |
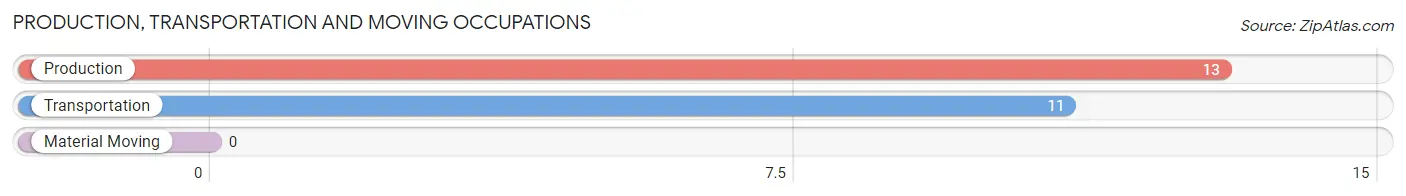
Production, Transportation and Moving Occupations
The most common Production, Transportation and Moving occupations in Shinnecock Hills are Production (13 | 1.5%), and Transportation (11 | 1.2%).
Production, Transportation and Moving Occupations by Sex
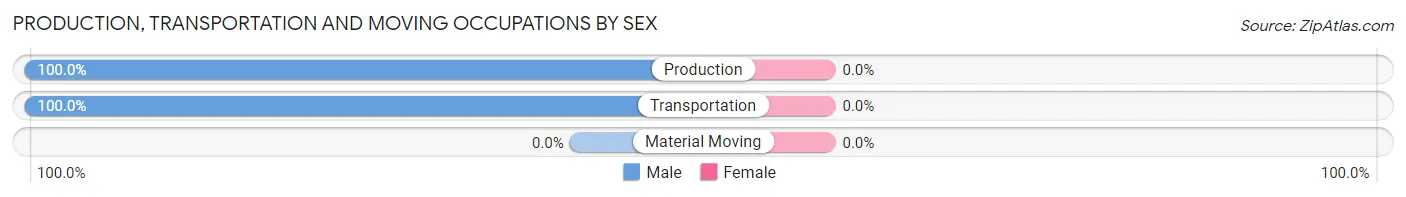
| Occupation | Male | Female |
| Production | 13 (100.0%) | 0 (0.0%) |
| Transportation | 11 (100.0%) | 0 (0.0%) |
| Material Moving | 0 (0.0%) | 0 (0.0%) |
| Total (Category) | 24 (100.0%) | 0 (0.0%) |
| Total (Overall) | 570 (64.5%) | 314 (35.5%) |
Employment Industries by Sex in Shinnecock Hills
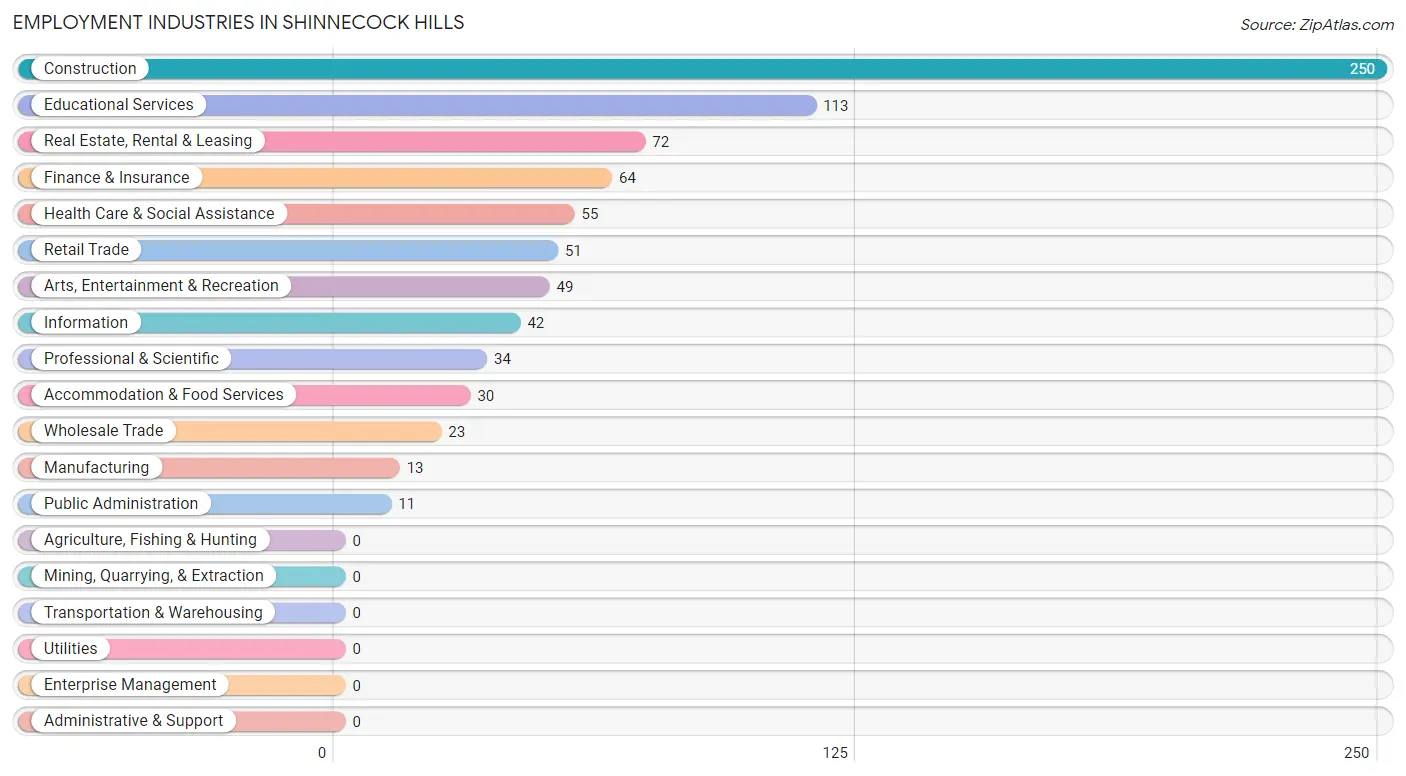
Employment Industries in Shinnecock Hills
The major employment industries in Shinnecock Hills include Construction (250 | 28.3%), Educational Services (113 | 12.8%), Real Estate, Rental & Leasing (72 | 8.1%), Finance & Insurance (64 | 7.2%), and Health Care & Social Assistance (55 | 6.2%).
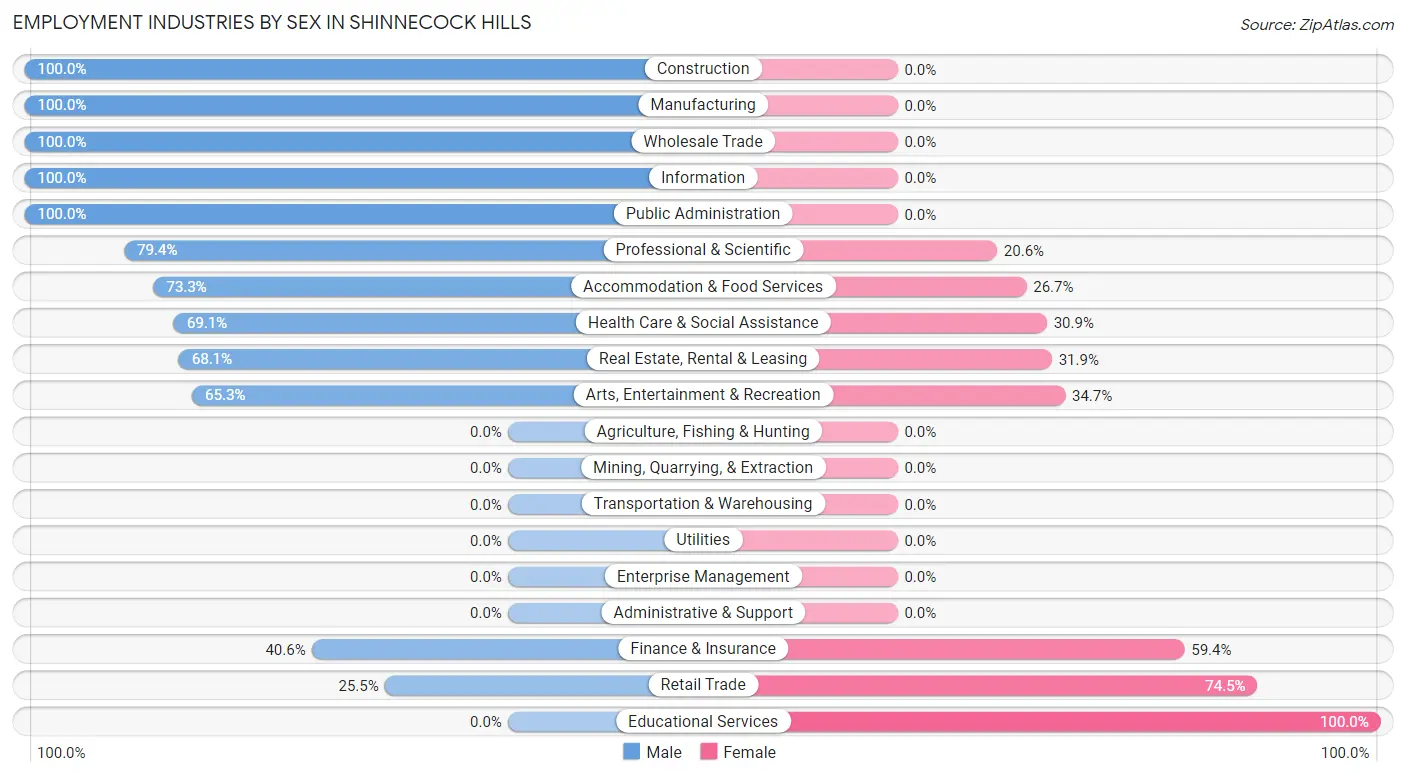
Employment Industries by Sex in Shinnecock Hills
The Shinnecock Hills industries that see more men than women are Construction (100.0%), Manufacturing (100.0%), and Wholesale Trade (100.0%), whereas the industries that tend to have a higher number of women are Educational Services (100.0%), Retail Trade (74.5%), and Finance & Insurance (59.4%).
| Industry | Male | Female |
| Agriculture, Fishing & Hunting | 0 (0.0%) | 0 (0.0%) |
| Mining, Quarrying, & Extraction | 0 (0.0%) | 0 (0.0%) |
| Construction | 250 (100.0%) | 0 (0.0%) |
| Manufacturing | 13 (100.0%) | 0 (0.0%) |
| Wholesale Trade | 23 (100.0%) | 0 (0.0%) |
| Retail Trade | 13 (25.5%) | 38 (74.5%) |
| Transportation & Warehousing | 0 (0.0%) | 0 (0.0%) |
| Utilities | 0 (0.0%) | 0 (0.0%) |
| Information | 42 (100.0%) | 0 (0.0%) |
| Finance & Insurance | 26 (40.6%) | 38 (59.4%) |
| Real Estate, Rental & Leasing | 49 (68.1%) | 23 (31.9%) |
| Professional & Scientific | 27 (79.4%) | 7 (20.6%) |
| Enterprise Management | 0 (0.0%) | 0 (0.0%) |
| Administrative & Support | 0 (0.0%) | 0 (0.0%) |
| Educational Services | 0 (0.0%) | 113 (100.0%) |
| Health Care & Social Assistance | 38 (69.1%) | 17 (30.9%) |
| Arts, Entertainment & Recreation | 32 (65.3%) | 17 (34.7%) |
| Accommodation & Food Services | 22 (73.3%) | 8 (26.7%) |
| Public Administration | 11 (100.0%) | 0 (0.0%) |
| Total | 570 (64.5%) | 314 (35.5%) |
Education in Shinnecock Hills
School Enrollment in Shinnecock Hills
The most common levels of schooling among the 530 students in Shinnecock Hills are college / undergraduate (180 | 34.0%), elementary school (139 | 26.2%), and middle school (100 | 18.9%).
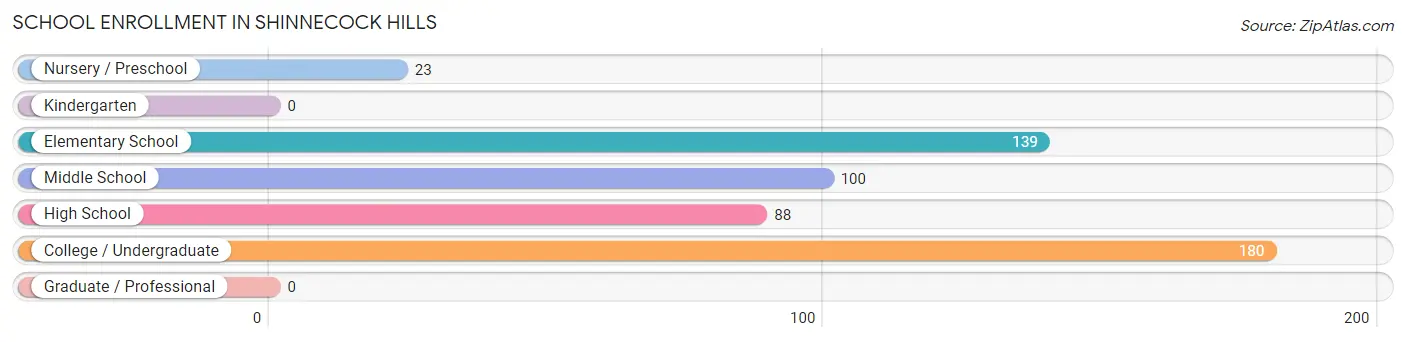
| School Level | # Students | % Students |
| Nursery / Preschool | 23 | 4.3% |
| Kindergarten | 0 | 0.0% |
| Elementary School | 139 | 26.2% |
| Middle School | 100 | 18.9% |
| High School | 88 | 16.6% |
| College / Undergraduate | 180 | 34.0% |
| Graduate / Professional | 0 | 0.0% |
| Total | 530 | 100.0% |
School Enrollment by Age by Funding Source in Shinnecock Hills
Out of a total of 530 students who are enrolled in schools in Shinnecock Hills, 79 (14.9%) attend a private institution, while the remaining 451 (85.1%) are enrolled in public schools. The age group of 3 to 4 year olds has the highest likelihood of being enrolled in private schools, with 23 (100.0% in the age bracket) enrolled. Conversely, the age group of 10 to 14 year olds has the lowest likelihood of being enrolled in a private school, with 135 (100.0% in the age bracket) attending a public institution.
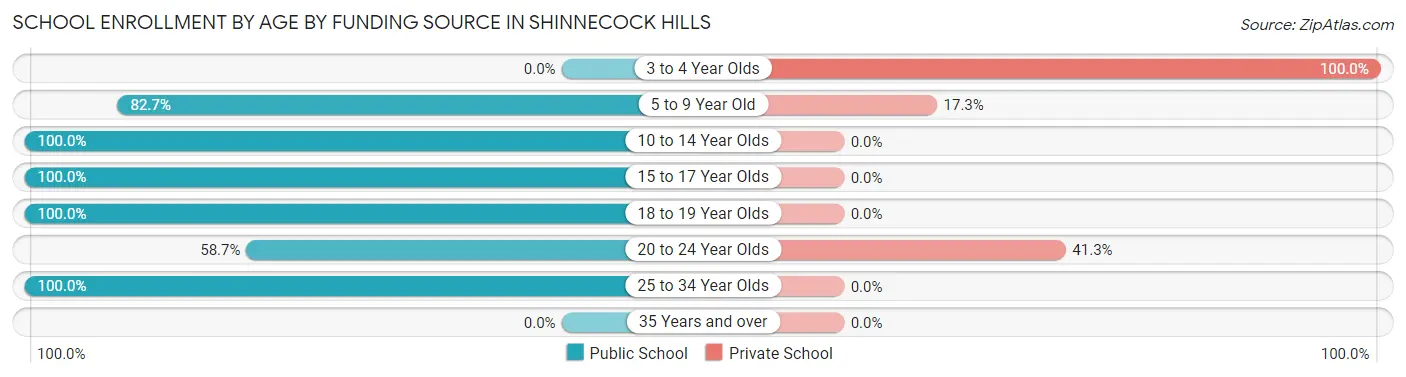
| Age Bracket | Public School | Private School |
| 3 to 4 Year Olds | 0 (0.0%) | 23 (100.0%) |
| 5 to 9 Year Old | 86 (82.7%) | 18 (17.3%) |
| 10 to 14 Year Olds | 135 (100.0%) | 0 (0.0%) |
| 15 to 17 Year Olds | 88 (100.0%) | 0 (0.0%) |
| 18 to 19 Year Olds | 81 (100.0%) | 0 (0.0%) |
| 20 to 24 Year Olds | 54 (58.7%) | 38 (41.3%) |
| 25 to 34 Year Olds | 7 (100.0%) | 0 (0.0%) |
| 35 Years and over | 0 (0.0%) | 0 (0.0%) |
| Total | 451 (85.1%) | 79 (14.9%) |
Educational Attainment by Field of Study in Shinnecock Hills
Business (205 | 21.8%), science & technology (152 | 16.2%), literature & languages (129 | 13.7%), social sciences (86 | 9.1%), and bio, nature & agricultural (70 | 7.4%) are the most common fields of study among 941 individuals in Shinnecock Hills who have obtained a bachelor's degree or higher.
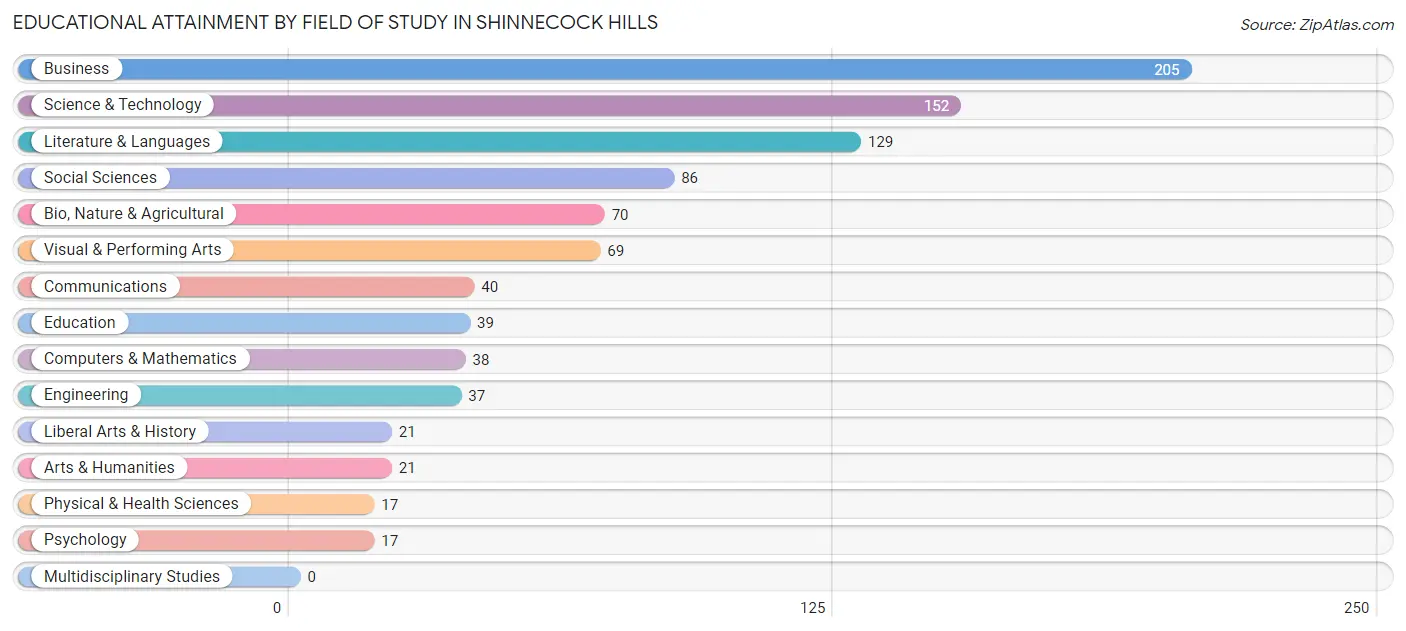
| Field of Study | # Graduates | % Graduates |
| Computers & Mathematics | 38 | 4.0% |
| Bio, Nature & Agricultural | 70 | 7.4% |
| Physical & Health Sciences | 17 | 1.8% |
| Psychology | 17 | 1.8% |
| Social Sciences | 86 | 9.1% |
| Engineering | 37 | 3.9% |
| Multidisciplinary Studies | 0 | 0.0% |
| Science & Technology | 152 | 16.2% |
| Business | 205 | 21.8% |
| Education | 39 | 4.1% |
| Literature & Languages | 129 | 13.7% |
| Liberal Arts & History | 21 | 2.2% |
| Visual & Performing Arts | 69 | 7.3% |
| Communications | 40 | 4.3% |
| Arts & Humanities | 21 | 2.2% |
| Total | 941 | 100.0% |
Transportation & Commute in Shinnecock Hills
Vehicle Availability by Sex in Shinnecock Hills
The most prevalent vehicle ownership categories in Shinnecock Hills are males with 3 vehicles (306, accounting for 54.3%) and females with 3 vehicles (30, making up 114.2%).
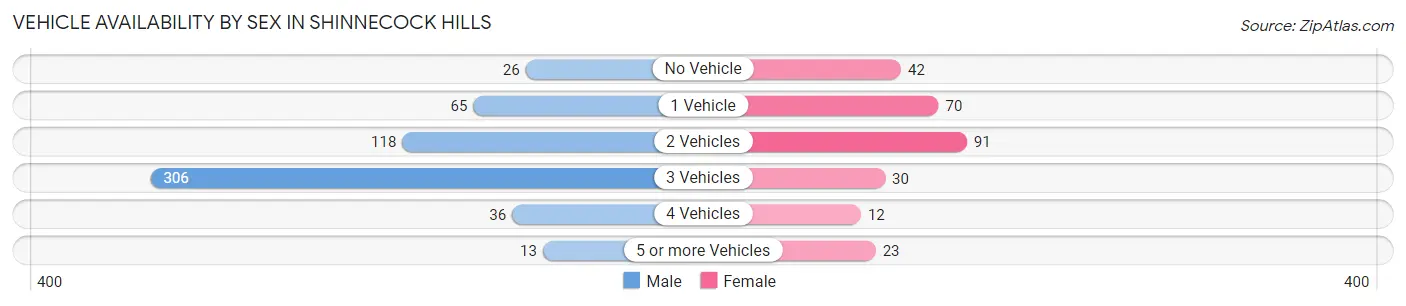
| Vehicles Available | Male | Female |
| No Vehicle | 26 (4.6%) | 42 (15.7%) |
| 1 Vehicle | 65 (11.5%) | 70 (26.1%) |
| 2 Vehicles | 118 (20.9%) | 91 (34.0%) |
| 3 Vehicles | 306 (54.3%) | 30 (11.2%) |
| 4 Vehicles | 36 (6.4%) | 12 (4.5%) |
| 5 or more Vehicles | 13 (2.3%) | 23 (8.6%) |
| Total | 564 (100.0%) | 268 (100.0%) |
Commute Time in Shinnecock Hills
The most frequently occuring commute durations in Shinnecock Hills are 15 to 19 minutes (200 commuters, 25.7%), 30 to 34 minutes (110 commuters, 14.2%), and 10 to 14 minutes (104 commuters, 13.4%).
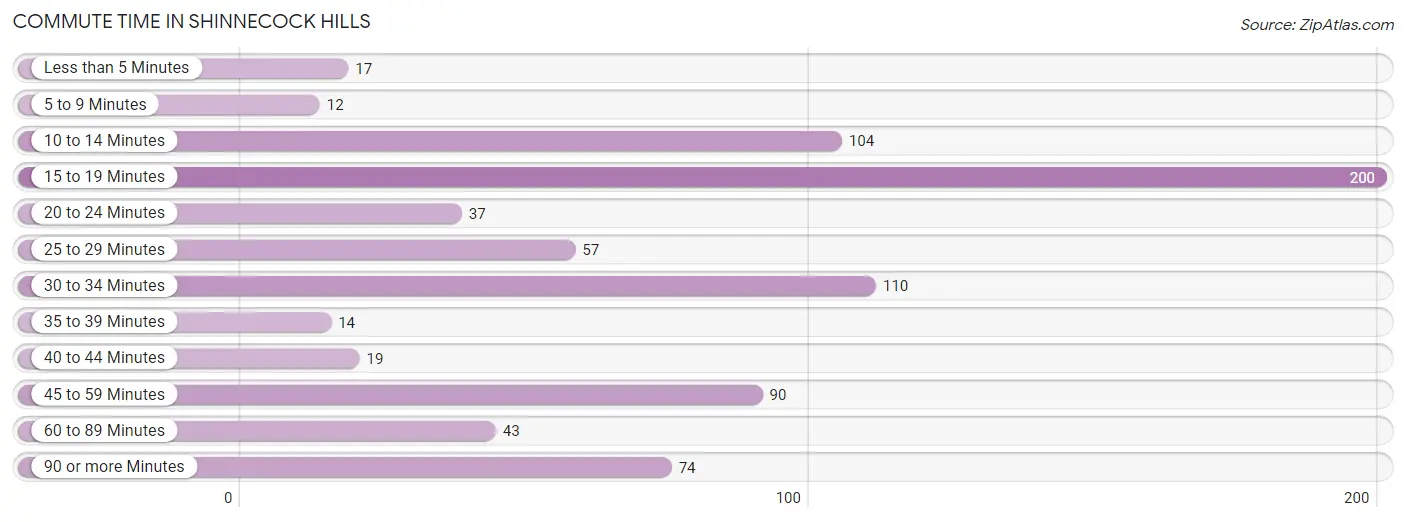
| Commute Time | # Commuters | % Commuters |
| Less than 5 Minutes | 17 | 2.2% |
| 5 to 9 Minutes | 12 | 1.5% |
| 10 to 14 Minutes | 104 | 13.4% |
| 15 to 19 Minutes | 200 | 25.7% |
| 20 to 24 Minutes | 37 | 4.8% |
| 25 to 29 Minutes | 57 | 7.3% |
| 30 to 34 Minutes | 110 | 14.2% |
| 35 to 39 Minutes | 14 | 1.8% |
| 40 to 44 Minutes | 19 | 2.5% |
| 45 to 59 Minutes | 90 | 11.6% |
| 60 to 89 Minutes | 43 | 5.5% |
| 90 or more Minutes | 74 | 9.5% |
Commute Time by Sex in Shinnecock Hills
The most common commute times in Shinnecock Hills are 15 to 19 minutes (157 commuters, 29.1%) for males and 30 to 34 minutes (50 commuters, 21.0%) for females.
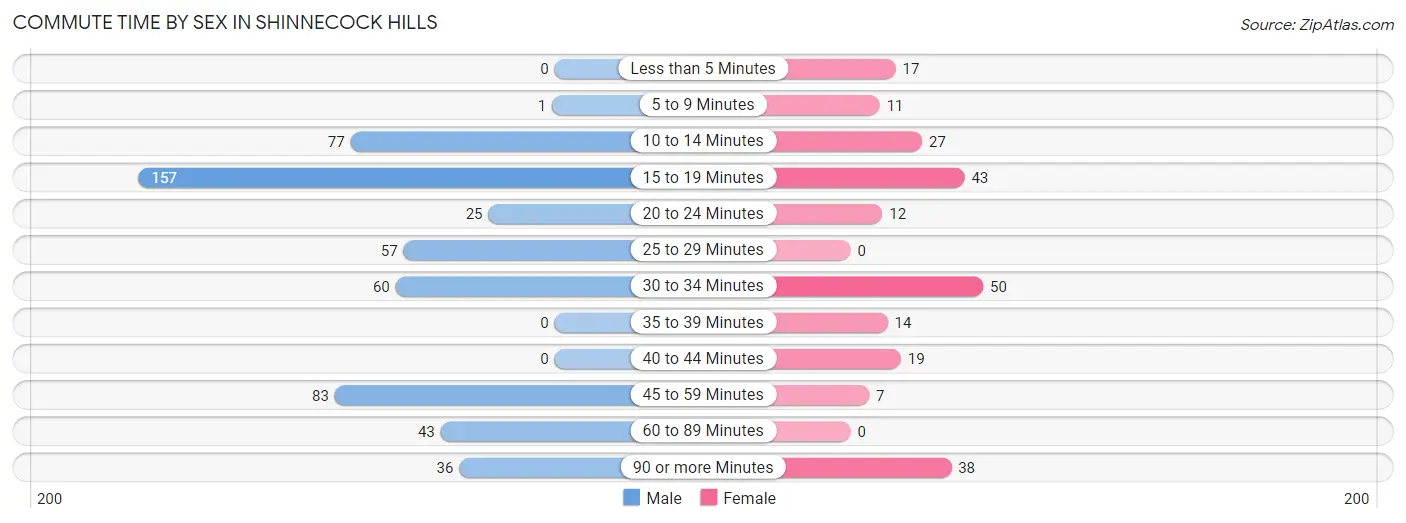
| Commute Time | Male | Female |
| Less than 5 Minutes | 0 (0.0%) | 17 (7.1%) |
| 5 to 9 Minutes | 1 (0.2%) | 11 (4.6%) |
| 10 to 14 Minutes | 77 (14.3%) | 27 (11.3%) |
| 15 to 19 Minutes | 157 (29.1%) | 43 (18.1%) |
| 20 to 24 Minutes | 25 (4.6%) | 12 (5.0%) |
| 25 to 29 Minutes | 57 (10.6%) | 0 (0.0%) |
| 30 to 34 Minutes | 60 (11.1%) | 50 (21.0%) |
| 35 to 39 Minutes | 0 (0.0%) | 14 (5.9%) |
| 40 to 44 Minutes | 0 (0.0%) | 19 (8.0%) |
| 45 to 59 Minutes | 83 (15.4%) | 7 (2.9%) |
| 60 to 89 Minutes | 43 (8.0%) | 0 (0.0%) |
| 90 or more Minutes | 36 (6.7%) | 38 (16.0%) |
Time of Departure to Work by Sex in Shinnecock Hills
The most frequent times of departure to work in Shinnecock Hills are 8:00 AM to 8:29 AM (203, 37.7%) for males and 8:00 AM to 8:29 AM (70, 29.4%) for females.
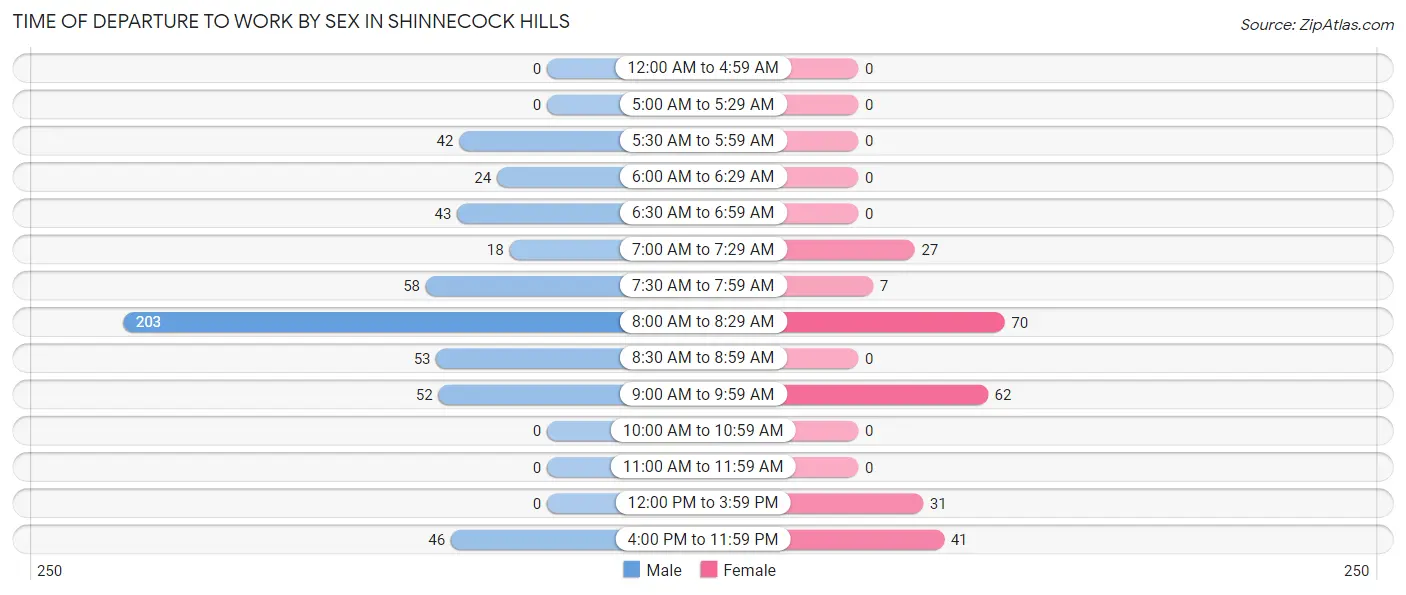
| Time of Departure | Male | Female |
| 12:00 AM to 4:59 AM | 0 (0.0%) | 0 (0.0%) |
| 5:00 AM to 5:29 AM | 0 (0.0%) | 0 (0.0%) |
| 5:30 AM to 5:59 AM | 42 (7.8%) | 0 (0.0%) |
| 6:00 AM to 6:29 AM | 24 (4.4%) | 0 (0.0%) |
| 6:30 AM to 6:59 AM | 43 (8.0%) | 0 (0.0%) |
| 7:00 AM to 7:29 AM | 18 (3.3%) | 27 (11.3%) |
| 7:30 AM to 7:59 AM | 58 (10.8%) | 7 (2.9%) |
| 8:00 AM to 8:29 AM | 203 (37.7%) | 70 (29.4%) |
| 8:30 AM to 8:59 AM | 53 (9.8%) | 0 (0.0%) |
| 9:00 AM to 9:59 AM | 52 (9.7%) | 62 (26.1%) |
| 10:00 AM to 10:59 AM | 0 (0.0%) | 0 (0.0%) |
| 11:00 AM to 11:59 AM | 0 (0.0%) | 0 (0.0%) |
| 12:00 PM to 3:59 PM | 0 (0.0%) | 31 (13.0%) |
| 4:00 PM to 11:59 PM | 46 (8.5%) | 41 (17.2%) |
| Total | 539 (100.0%) | 238 (100.0%) |
Housing Occupancy in Shinnecock Hills
Occupancy by Ownership in Shinnecock Hills
Of the total 758 dwellings in Shinnecock Hills, owner-occupied units account for 638 (84.2%), while renter-occupied units make up 120 (15.8%).
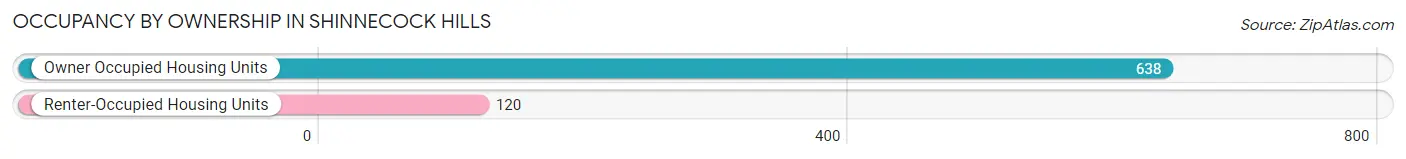
| Occupancy | # Housing Units | % Housing Units |
| Owner Occupied Housing Units | 638 | 84.2% |
| Renter-Occupied Housing Units | 120 | 15.8% |
| Total Occupied Housing Units | 758 | 100.0% |
Occupancy by Household Size in Shinnecock Hills
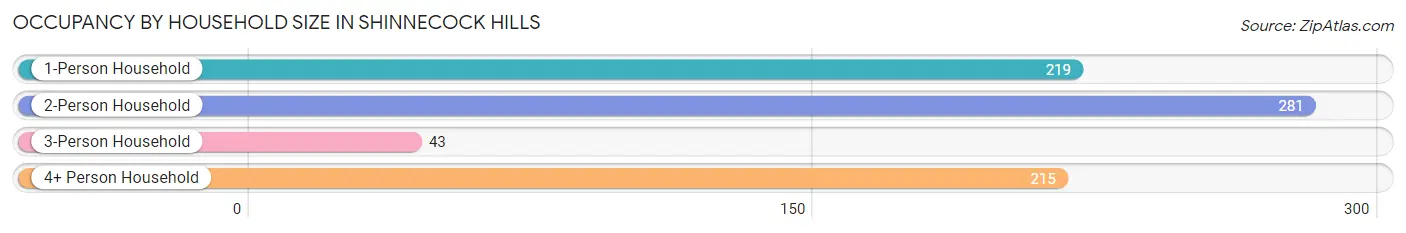
| Household Size | # Housing Units | % Housing Units |
| 1-Person Household | 219 | 28.9% |
| 2-Person Household | 281 | 37.1% |
| 3-Person Household | 43 | 5.7% |
| 4+ Person Household | 215 | 28.4% |
| Total Housing Units | 758 | 100.0% |
Occupancy by Ownership by Household Size in Shinnecock Hills
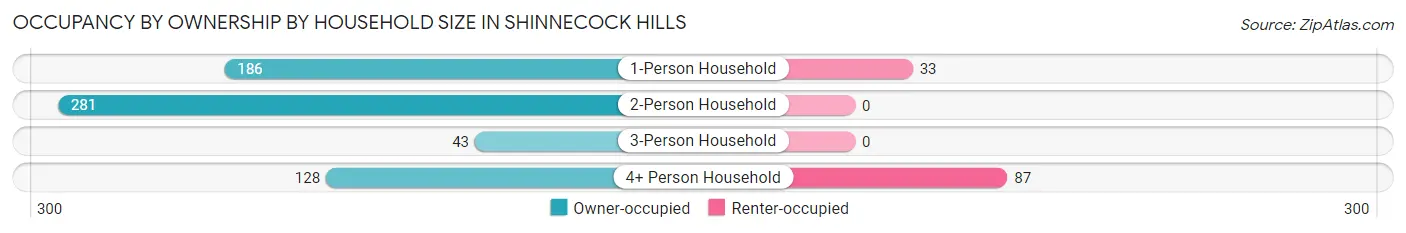
| Household Size | Owner-occupied | Renter-occupied |
| 1-Person Household | 186 (84.9%) | 33 (15.1%) |
| 2-Person Household | 281 (100.0%) | 0 (0.0%) |
| 3-Person Household | 43 (100.0%) | 0 (0.0%) |
| 4+ Person Household | 128 (59.5%) | 87 (40.5%) |
| Total Housing Units | 638 (84.2%) | 120 (15.8%) |
Occupancy by Educational Attainment in Shinnecock Hills
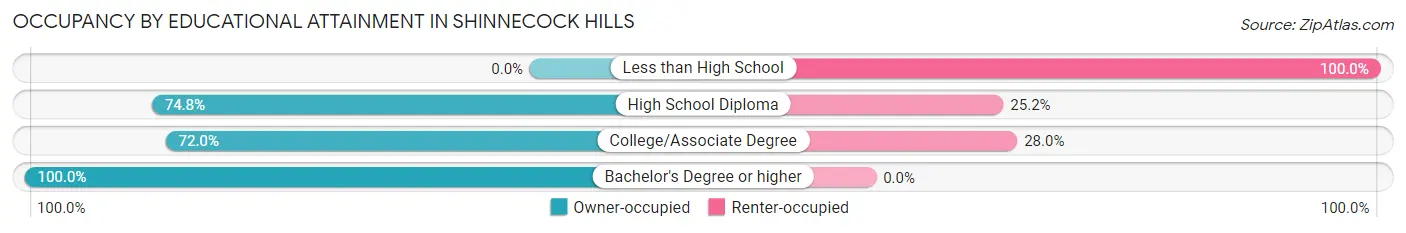
| Household Size | Owner-occupied | Renter-occupied |
| Less than High School | 0 (0.0%) | 60 (100.0%) |
| High School Diploma | 80 (74.8%) | 27 (25.2%) |
| College/Associate Degree | 85 (72.0%) | 33 (28.0%) |
| Bachelor's Degree or higher | 473 (100.0%) | 0 (0.0%) |
Occupancy by Age of Householder in Shinnecock Hills
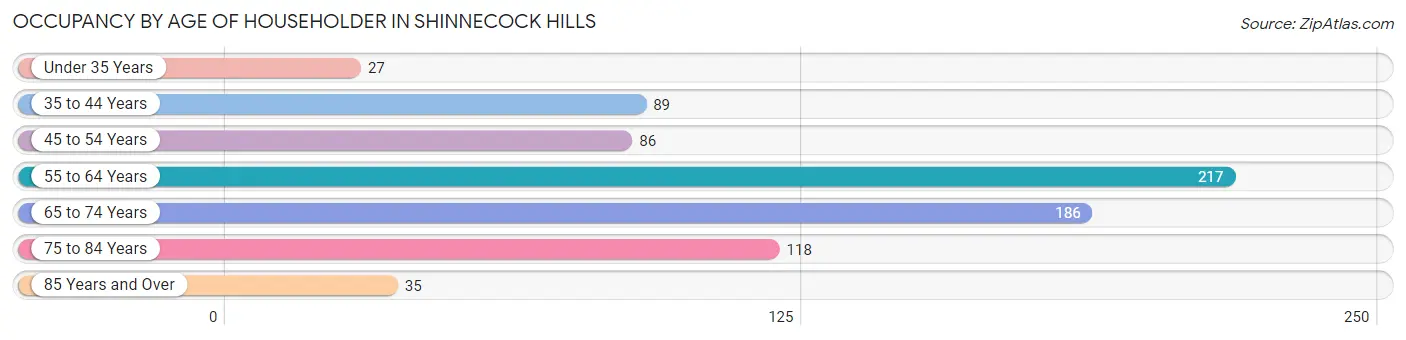
| Age Bracket | # Households | % Households |
| Under 35 Years | 27 | 3.6% |
| 35 to 44 Years | 89 | 11.7% |
| 45 to 54 Years | 86 | 11.4% |
| 55 to 64 Years | 217 | 28.6% |
| 65 to 74 Years | 186 | 24.5% |
| 75 to 84 Years | 118 | 15.6% |
| 85 Years and Over | 35 | 4.6% |
| Total | 758 | 100.0% |
Housing Finances in Shinnecock Hills
Median Income by Occupancy in Shinnecock Hills
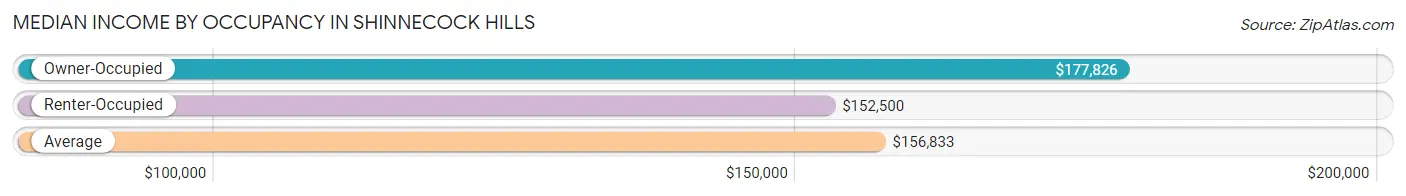
| Occupancy Type | # Households | Median Income |
| Owner-Occupied | 638 (84.2%) | $177,826 |
| Renter-Occupied | 120 (15.8%) | $152,500 |
| Average | 758 (100.0%) | $156,833 |
Occupancy by Householder Income Bracket in Shinnecock Hills
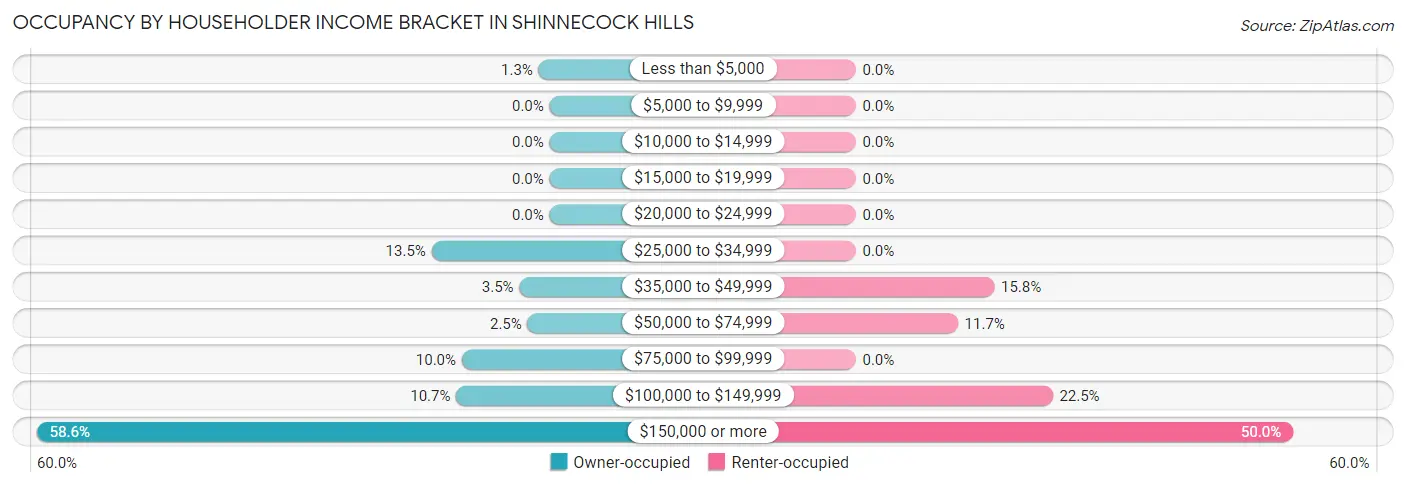
| Income Bracket | Owner-occupied | Renter-occupied |
| Less than $5,000 | 8 (1.3%) | 0 (0.0%) |
| $5,000 to $9,999 | 0 (0.0%) | 0 (0.0%) |
| $10,000 to $14,999 | 0 (0.0%) | 0 (0.0%) |
| $15,000 to $19,999 | 0 (0.0%) | 0 (0.0%) |
| $20,000 to $24,999 | 0 (0.0%) | 0 (0.0%) |
| $25,000 to $34,999 | 86 (13.5%) | 0 (0.0%) |
| $35,000 to $49,999 | 22 (3.5%) | 19 (15.8%) |
| $50,000 to $74,999 | 16 (2.5%) | 14 (11.7%) |
| $75,000 to $99,999 | 64 (10.0%) | 0 (0.0%) |
| $100,000 to $149,999 | 68 (10.7%) | 27 (22.5%) |
| $150,000 or more | 374 (58.6%) | 60 (50.0%) |
| Total | 638 (100.0%) | 120 (100.0%) |
Monthly Housing Cost Tiers in Shinnecock Hills
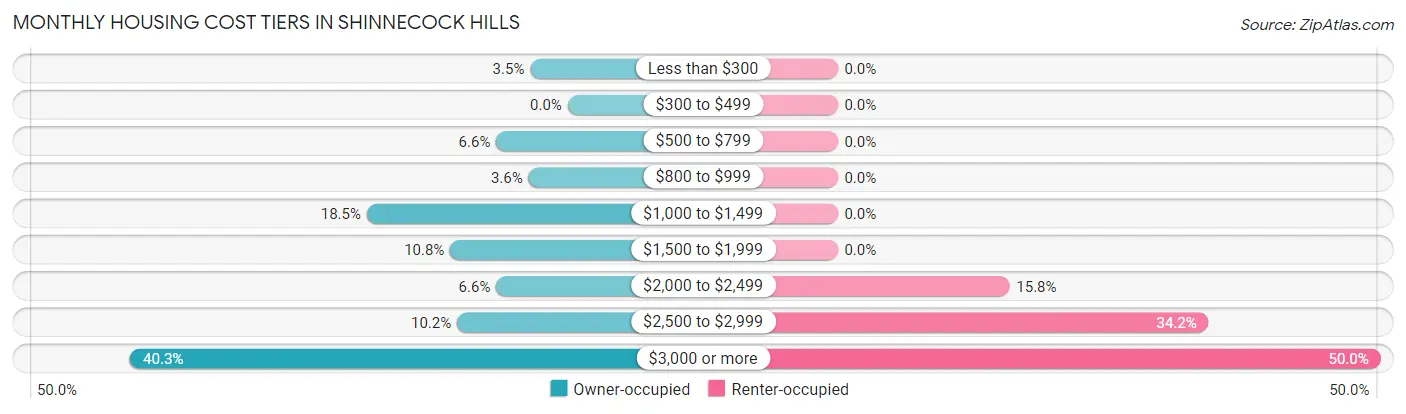
| Monthly Cost | Owner-occupied | Renter-occupied |
| Less than $300 | 22 (3.5%) | 0 (0.0%) |
| $300 to $499 | 0 (0.0%) | 0 (0.0%) |
| $500 to $799 | 42 (6.6%) | 0 (0.0%) |
| $800 to $999 | 23 (3.6%) | 0 (0.0%) |
| $1,000 to $1,499 | 118 (18.5%) | 0 (0.0%) |
| $1,500 to $1,999 | 69 (10.8%) | 0 (0.0%) |
| $2,000 to $2,499 | 42 (6.6%) | 19 (15.8%) |
| $2,500 to $2,999 | 65 (10.2%) | 41 (34.2%) |
| $3,000 or more | 257 (40.3%) | 60 (50.0%) |
| Total | 638 (100.0%) | 120 (100.0%) |
Physical Housing Characteristics in Shinnecock Hills
Housing Structures in Shinnecock Hills
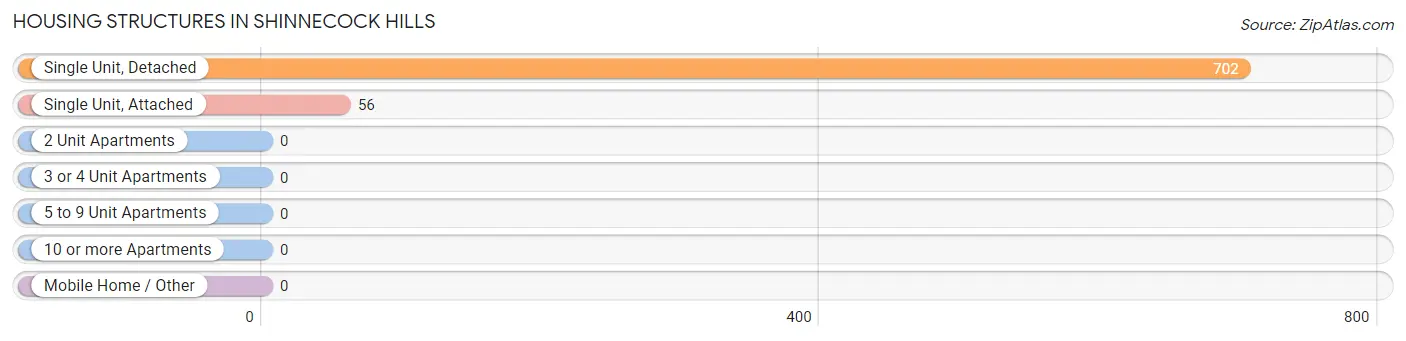
| Structure Type | # Housing Units | % Housing Units |
| Single Unit, Detached | 702 | 92.6% |
| Single Unit, Attached | 56 | 7.4% |
| 2 Unit Apartments | 0 | 0.0% |
| 3 or 4 Unit Apartments | 0 | 0.0% |
| 5 to 9 Unit Apartments | 0 | 0.0% |
| 10 or more Apartments | 0 | 0.0% |
| Mobile Home / Other | 0 | 0.0% |
| Total | 758 | 100.0% |
Housing Structures by Occupancy in Shinnecock Hills
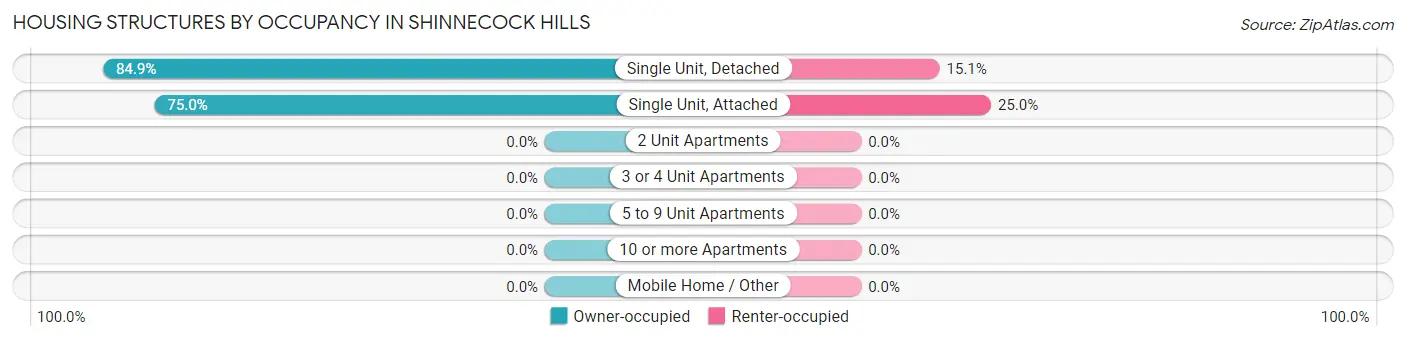
| Structure Type | Owner-occupied | Renter-occupied |
| Single Unit, Detached | 596 (84.9%) | 106 (15.1%) |
| Single Unit, Attached | 42 (75.0%) | 14 (25.0%) |
| 2 Unit Apartments | 0 (0.0%) | 0 (0.0%) |
| 3 or 4 Unit Apartments | 0 (0.0%) | 0 (0.0%) |
| 5 to 9 Unit Apartments | 0 (0.0%) | 0 (0.0%) |
| 10 or more Apartments | 0 (0.0%) | 0 (0.0%) |
| Mobile Home / Other | 0 (0.0%) | 0 (0.0%) |
| Total | 638 (84.2%) | 120 (15.8%) |
Housing Structures by Number of Rooms in Shinnecock Hills
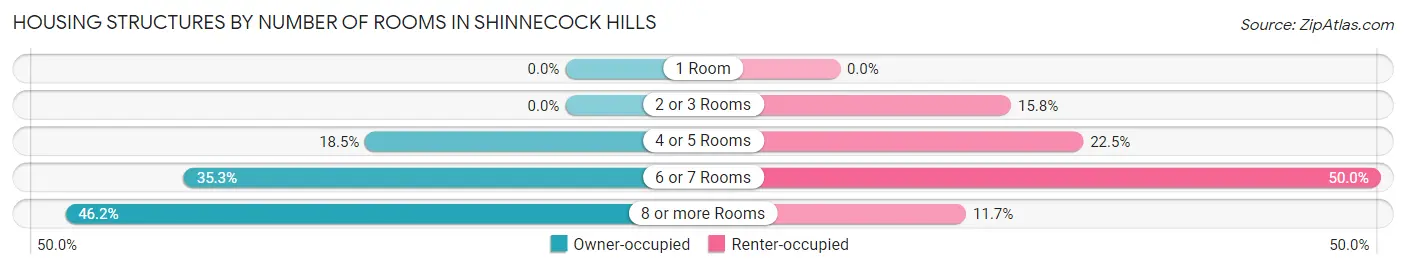
| Number of Rooms | Owner-occupied | Renter-occupied |
| 1 Room | 0 (0.0%) | 0 (0.0%) |
| 2 or 3 Rooms | 0 (0.0%) | 19 (15.8%) |
| 4 or 5 Rooms | 118 (18.5%) | 27 (22.5%) |
| 6 or 7 Rooms | 225 (35.3%) | 60 (50.0%) |
| 8 or more Rooms | 295 (46.2%) | 14 (11.7%) |
| Total | 638 (100.0%) | 120 (100.0%) |
Housing Structure by Heating Type in Shinnecock Hills
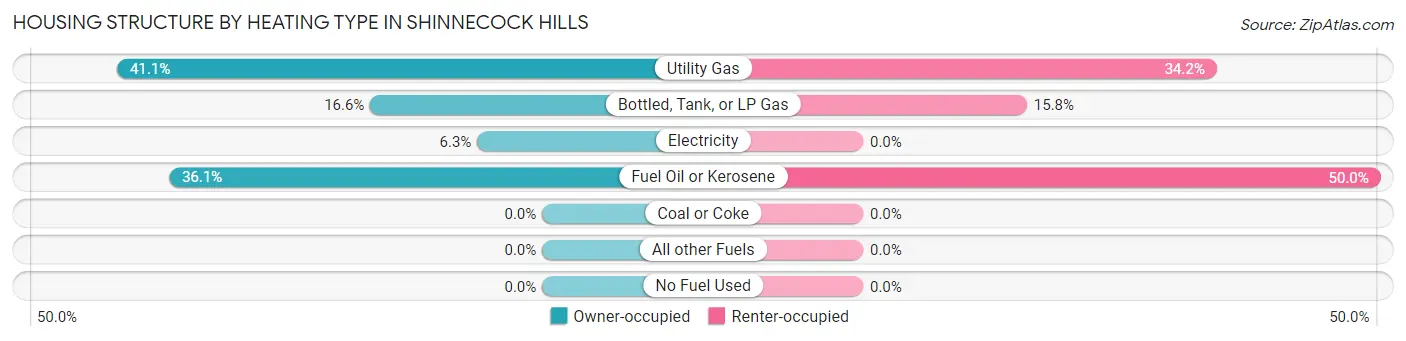
| Heating Type | Owner-occupied | Renter-occupied |
| Utility Gas | 262 (41.1%) | 41 (34.2%) |
| Bottled, Tank, or LP Gas | 106 (16.6%) | 19 (15.8%) |
| Electricity | 40 (6.3%) | 0 (0.0%) |
| Fuel Oil or Kerosene | 230 (36.0%) | 60 (50.0%) |
| Coal or Coke | 0 (0.0%) | 0 (0.0%) |
| All other Fuels | 0 (0.0%) | 0 (0.0%) |
| No Fuel Used | 0 (0.0%) | 0 (0.0%) |
| Total | 638 (100.0%) | 120 (100.0%) |
Household Vehicle Usage in Shinnecock Hills
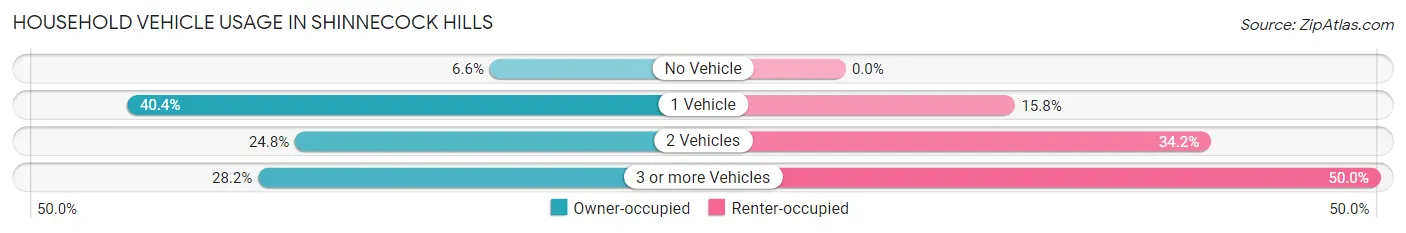
| Vehicles per Household | Owner-occupied | Renter-occupied |
| No Vehicle | 42 (6.6%) | 0 (0.0%) |
| 1 Vehicle | 258 (40.4%) | 19 (15.8%) |
| 2 Vehicles | 158 (24.8%) | 41 (34.2%) |
| 3 or more Vehicles | 180 (28.2%) | 60 (50.0%) |
| Total | 638 (100.0%) | 120 (100.0%) |
Real Estate & Mortgages in Shinnecock Hills
Real Estate and Mortgage Overview in Shinnecock Hills
| Characteristic | Without Mortgage | With Mortgage |
| Housing Units | 390 | 248 |
| Median Property Value | $1,648,800 | $1,416,700 |
| Median Household Income | $120,714 | $199 |
| Monthly Housing Costs | $1,501 | $177 |
| Real Estate Taxes | $9,824 | $0 |
Property Value by Mortgage Status in Shinnecock Hills
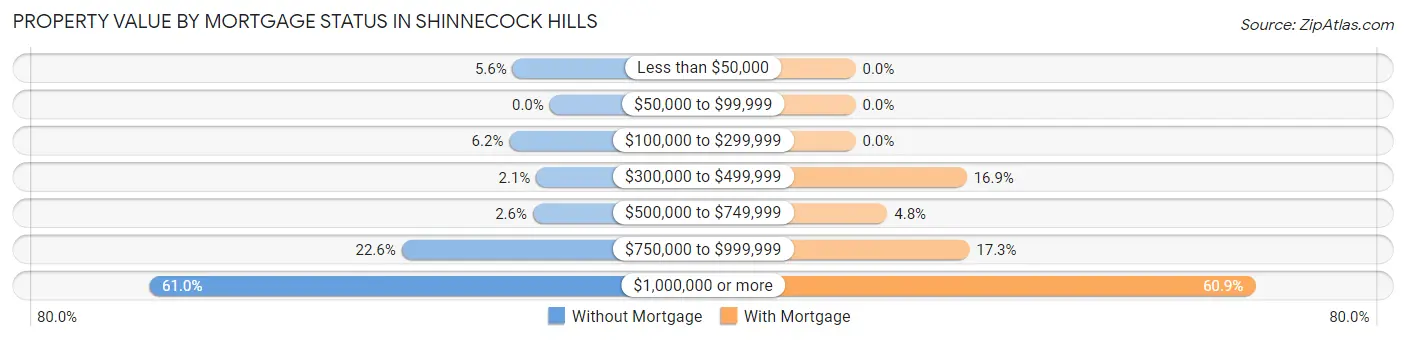
| Property Value | Without Mortgage | With Mortgage |
| Less than $50,000 | 22 (5.6%) | 0 (0.0%) |
| $50,000 to $99,999 | 0 (0.0%) | 0 (0.0%) |
| $100,000 to $299,999 | 24 (6.1%) | 0 (0.0%) |
| $300,000 to $499,999 | 8 (2.1%) | 42 (16.9%) |
| $500,000 to $749,999 | 10 (2.6%) | 12 (4.8%) |
| $750,000 to $999,999 | 88 (22.6%) | 43 (17.3%) |
| $1,000,000 or more | 238 (61.0%) | 151 (60.9%) |
| Total | 390 (100.0%) | 248 (100.0%) |
Household Income by Mortgage Status in Shinnecock Hills
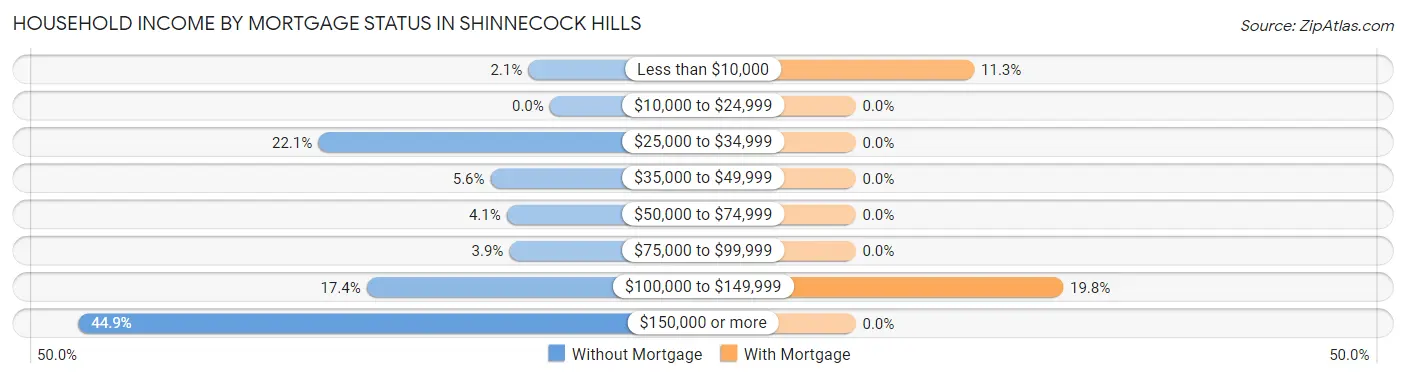
| Household Income | Without Mortgage | With Mortgage |
| Less than $10,000 | 8 (2.1%) | 28 (11.3%) |
| $10,000 to $24,999 | 0 (0.0%) | 0 (0.0%) |
| $25,000 to $34,999 | 86 (22.1%) | 0 (0.0%) |
| $35,000 to $49,999 | 22 (5.6%) | 0 (0.0%) |
| $50,000 to $74,999 | 16 (4.1%) | 0 (0.0%) |
| $75,000 to $99,999 | 15 (3.8%) | 0 (0.0%) |
| $100,000 to $149,999 | 68 (17.4%) | 49 (19.8%) |
| $150,000 or more | 175 (44.9%) | 0 (0.0%) |
| Total | 390 (100.0%) | 248 (100.0%) |
Property Value to Household Income Ratio in Shinnecock Hills
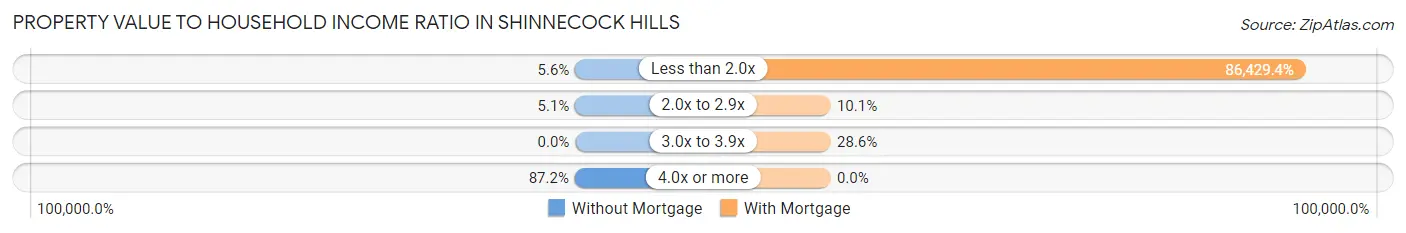
| Value-to-Income Ratio | Without Mortgage | With Mortgage |
| Less than 2.0x | 22 (5.6%) | 214,345 (86,429.4%) |
| 2.0x to 2.9x | 20 (5.1%) | 25 (10.1%) |
| 3.0x to 3.9x | 0 (0.0%) | 71 (28.6%) |
| 4.0x or more | 340 (87.2%) | 0 (0.0%) |
| Total | 390 (100.0%) | 248 (100.0%) |
Real Estate Taxes by Mortgage Status in Shinnecock Hills
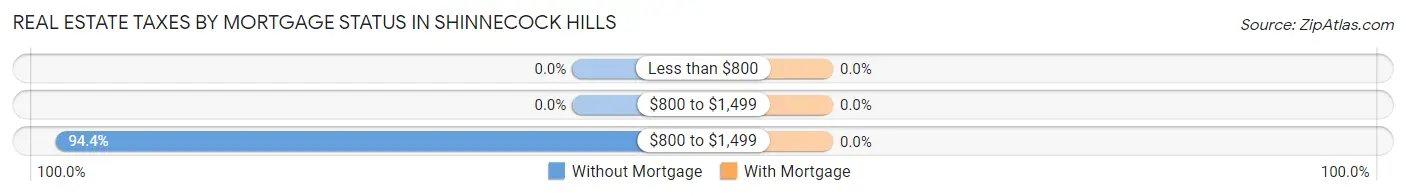
| Property Taxes | Without Mortgage | With Mortgage |
| Less than $800 | 0 (0.0%) | 0 (0.0%) |
| $800 to $1,499 | 0 (0.0%) | 0 (0.0%) |
| $800 to $1,499 | 368 (94.4%) | 0 (0.0%) |
| Total | 390 (100.0%) | 248 (100.0%) |
Health & Disability in Shinnecock Hills
Health Insurance Coverage by Age in Shinnecock Hills
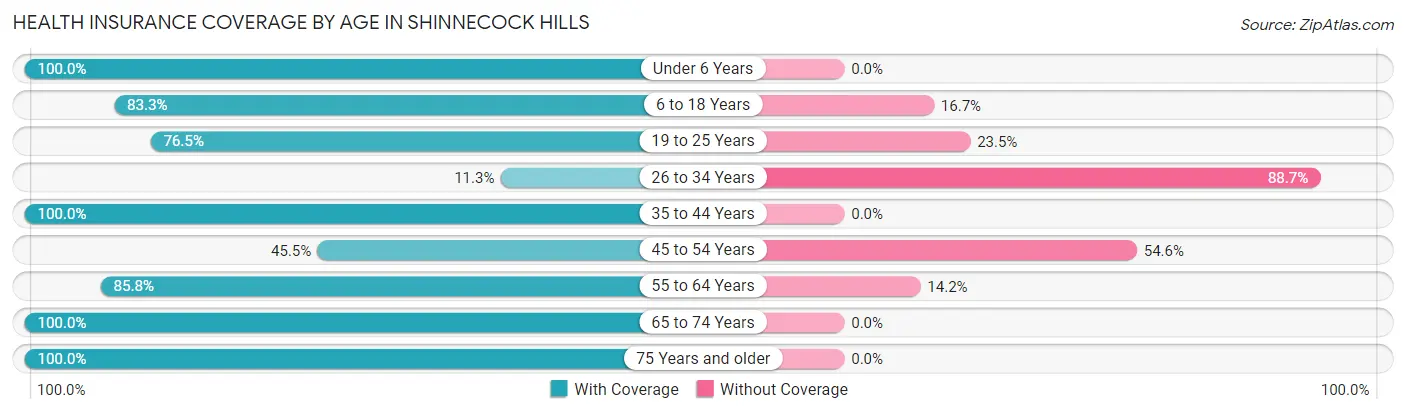
| Age Bracket | With Coverage | Without Coverage |
| Under 6 Years | 63 (100.0%) | 0 (0.0%) |
| 6 to 18 Years | 319 (83.3%) | 64 (16.7%) |
| 19 to 25 Years | 202 (76.5%) | 62 (23.5%) |
| 26 to 34 Years | 13 (11.3%) | 102 (88.7%) |
| 35 to 44 Years | 197 (100.0%) | 0 (0.0%) |
| 45 to 54 Years | 105 (45.5%) | 126 (54.5%) |
| 55 to 64 Years | 266 (85.8%) | 44 (14.2%) |
| 65 to 74 Years | 279 (100.0%) | 0 (0.0%) |
| 75 Years and older | 293 (100.0%) | 0 (0.0%) |
| Total | 1,737 (81.4%) | 398 (18.6%) |
Health Insurance Coverage by Citizenship Status in Shinnecock Hills
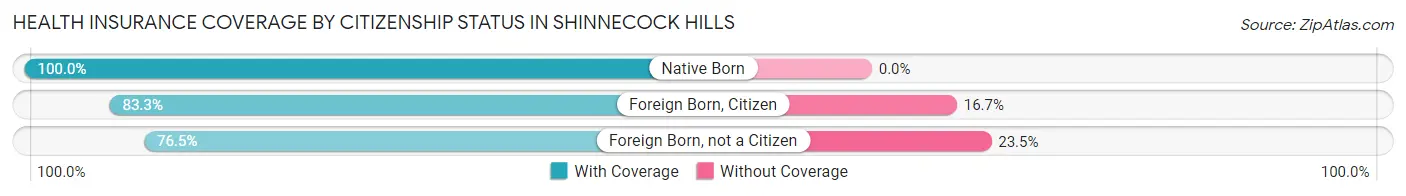
| Citizenship Status | With Coverage | Without Coverage |
| Native Born | 63 (100.0%) | 0 (0.0%) |
| Foreign Born, Citizen | 319 (83.3%) | 64 (16.7%) |
| Foreign Born, not a Citizen | 202 (76.5%) | 62 (23.5%) |
Health Insurance Coverage by Household Income in Shinnecock Hills
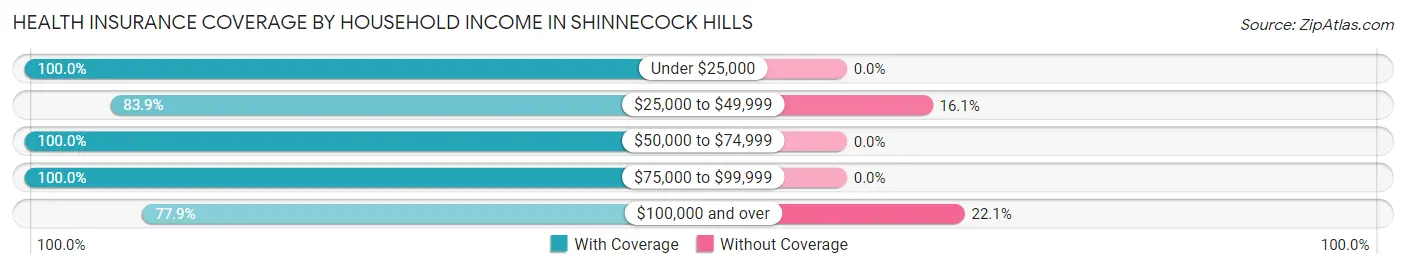
| Household Income | With Coverage | Without Coverage |
| Under $25,000 | 8 (100.0%) | 0 (0.0%) |
| $25,000 to $49,999 | 115 (83.9%) | 22 (16.1%) |
| $50,000 to $74,999 | 30 (100.0%) | 0 (0.0%) |
| $75,000 to $99,999 | 117 (100.0%) | 0 (0.0%) |
| $100,000 and over | 1,325 (77.9%) | 375 (22.1%) |
Public vs Private Health Insurance Coverage by Age in Shinnecock Hills
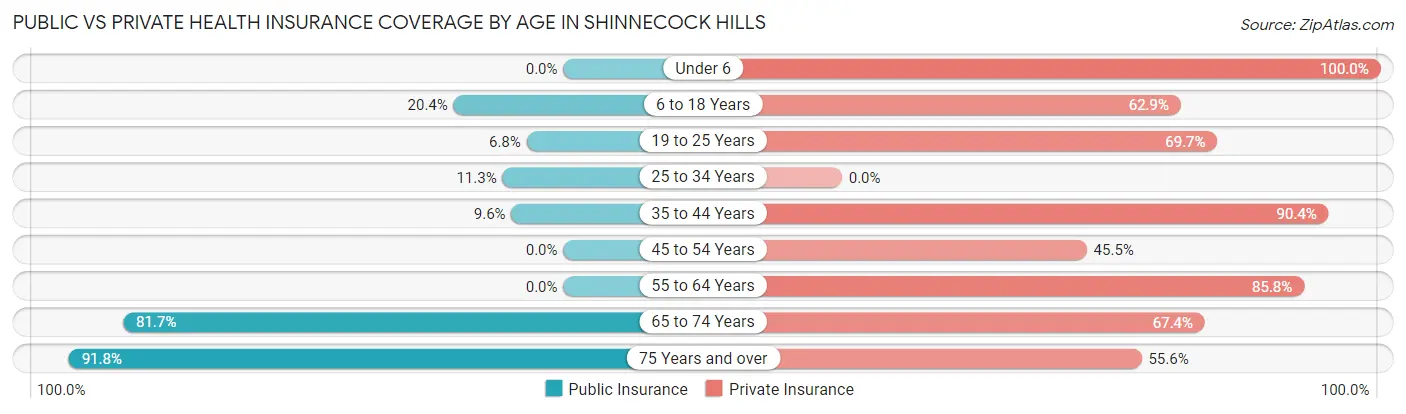
| Age Bracket | Public Insurance | Private Insurance |
| Under 6 | 0 (0.0%) | 63 (100.0%) |
| 6 to 18 Years | 78 (20.4%) | 241 (62.9%) |
| 19 to 25 Years | 18 (6.8%) | 184 (69.7%) |
| 25 to 34 Years | 13 (11.3%) | 0 (0.0%) |
| 35 to 44 Years | 19 (9.6%) | 178 (90.4%) |
| 45 to 54 Years | 0 (0.0%) | 105 (45.5%) |
| 55 to 64 Years | 0 (0.0%) | 266 (85.8%) |
| 65 to 74 Years | 228 (81.7%) | 188 (67.4%) |
| 75 Years and over | 269 (91.8%) | 163 (55.6%) |
| Total | 625 (29.3%) | 1,388 (65.0%) |
Disability Status by Sex by Age in Shinnecock Hills
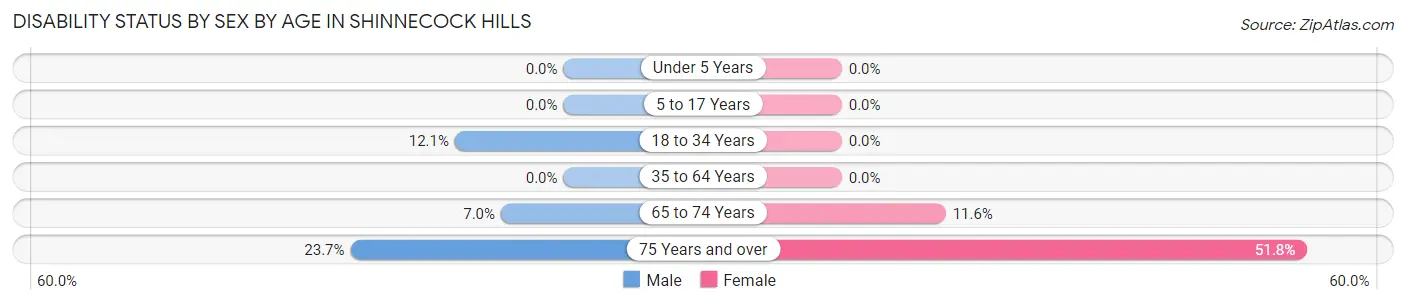
| Age Bracket | Male | Female |
| Under 5 Years | 0 (0.0%) | 0 (0.0%) |
| 5 to 17 Years | 0 (0.0%) | 0 (0.0%) |
| 18 to 34 Years | 33 (12.1%) | 0 (0.0%) |
| 35 to 64 Years | 0 (0.0%) | 0 (0.0%) |
| 65 to 74 Years | 11 (7.0%) | 14 (11.6%) |
| 75 Years and over | 37 (23.7%) | 71 (51.8%) |
Disability Class by Sex by Age in Shinnecock Hills
Disability Class: Hearing Difficulty
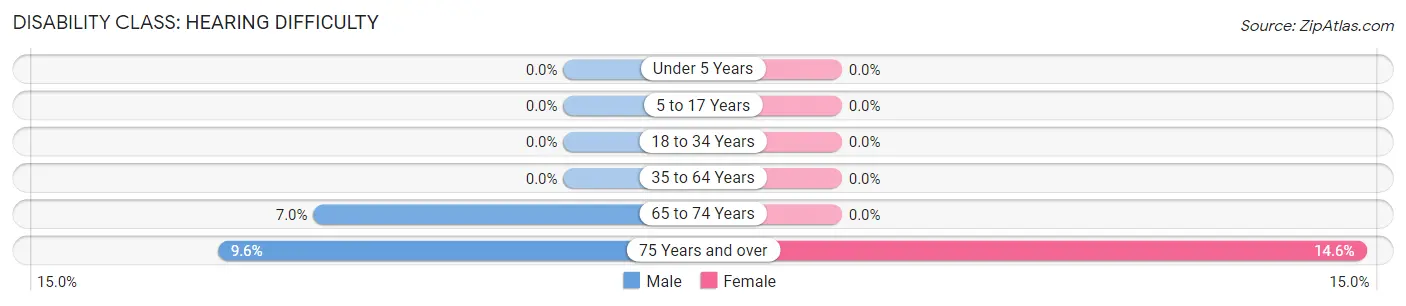
| Age Bracket | Male | Female |
| Under 5 Years | 0 (0.0%) | 0 (0.0%) |
| 5 to 17 Years | 0 (0.0%) | 0 (0.0%) |
| 18 to 34 Years | 0 (0.0%) | 0 (0.0%) |
| 35 to 64 Years | 0 (0.0%) | 0 (0.0%) |
| 65 to 74 Years | 11 (7.0%) | 0 (0.0%) |
| 75 Years and over | 15 (9.6%) | 20 (14.6%) |
Disability Class: Vision Difficulty
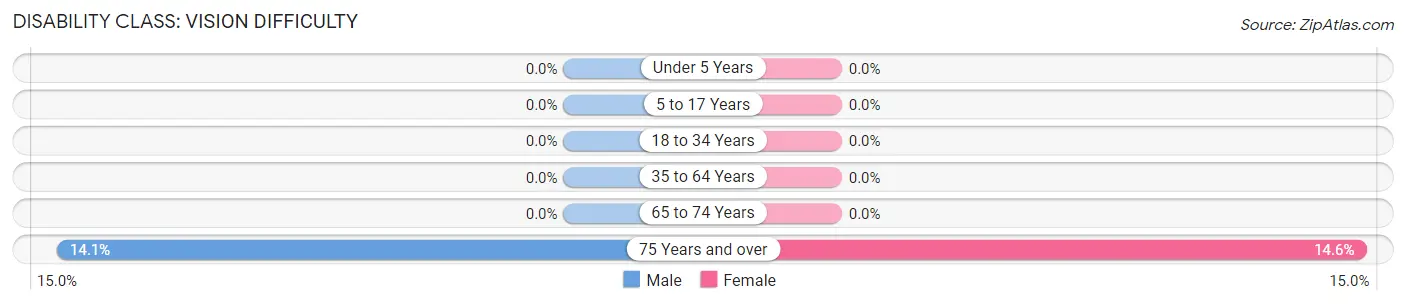
| Age Bracket | Male | Female |
| Under 5 Years | 0 (0.0%) | 0 (0.0%) |
| 5 to 17 Years | 0 (0.0%) | 0 (0.0%) |
| 18 to 34 Years | 0 (0.0%) | 0 (0.0%) |
| 35 to 64 Years | 0 (0.0%) | 0 (0.0%) |
| 65 to 74 Years | 0 (0.0%) | 0 (0.0%) |
| 75 Years and over | 22 (14.1%) | 20 (14.6%) |
Disability Class: Cognitive Difficulty
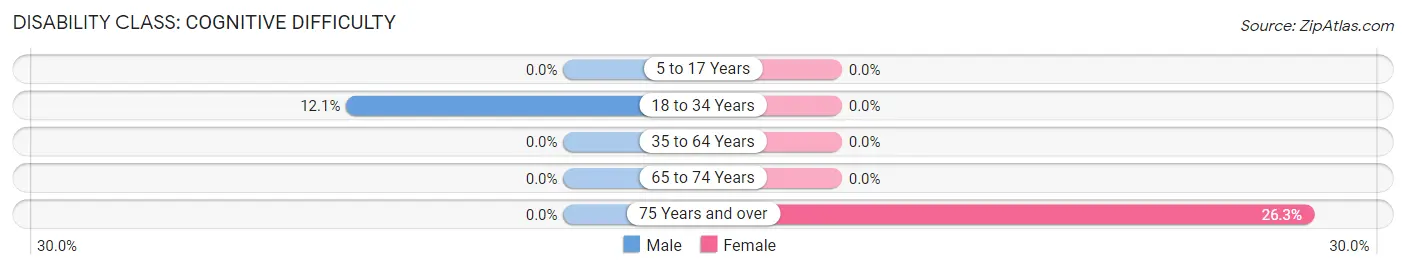
| Age Bracket | Male | Female |
| 5 to 17 Years | 0 (0.0%) | 0 (0.0%) |
| 18 to 34 Years | 33 (12.1%) | 0 (0.0%) |
| 35 to 64 Years | 0 (0.0%) | 0 (0.0%) |
| 65 to 74 Years | 0 (0.0%) | 0 (0.0%) |
| 75 Years and over | 0 (0.0%) | 36 (26.3%) |
Disability Class: Ambulatory Difficulty
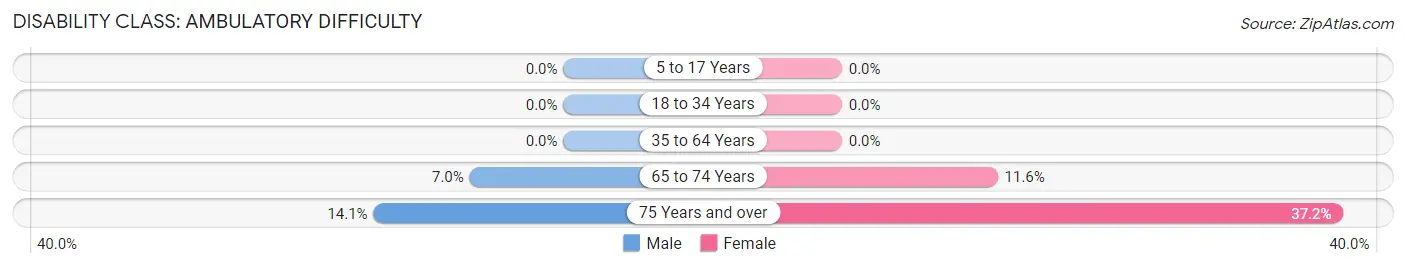
| Age Bracket | Male | Female |
| 5 to 17 Years | 0 (0.0%) | 0 (0.0%) |
| 18 to 34 Years | 0 (0.0%) | 0 (0.0%) |
| 35 to 64 Years | 0 (0.0%) | 0 (0.0%) |
| 65 to 74 Years | 11 (7.0%) | 14 (11.6%) |
| 75 Years and over | 22 (14.1%) | 51 (37.2%) |
Disability Class: Self-Care Difficulty
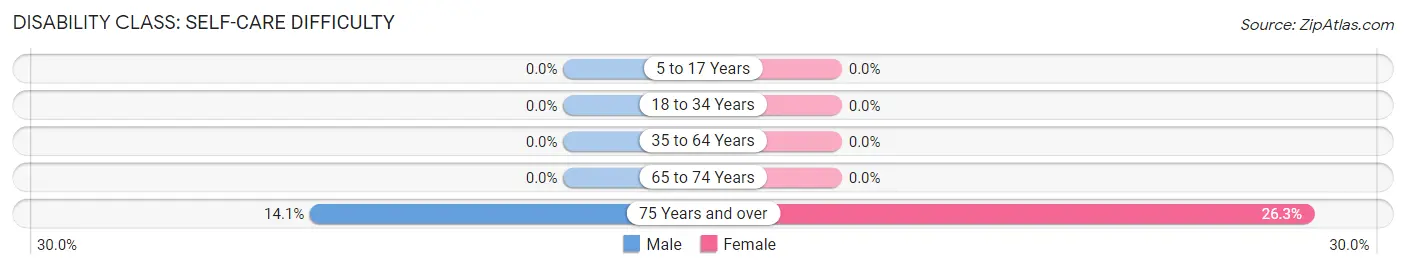
| Age Bracket | Male | Female |
| 5 to 17 Years | 0 (0.0%) | 0 (0.0%) |
| 18 to 34 Years | 0 (0.0%) | 0 (0.0%) |
| 35 to 64 Years | 0 (0.0%) | 0 (0.0%) |
| 65 to 74 Years | 0 (0.0%) | 0 (0.0%) |
| 75 Years and over | 22 (14.1%) | 36 (26.3%) |
Technology Access in Shinnecock Hills
Computing Device Access in Shinnecock Hills
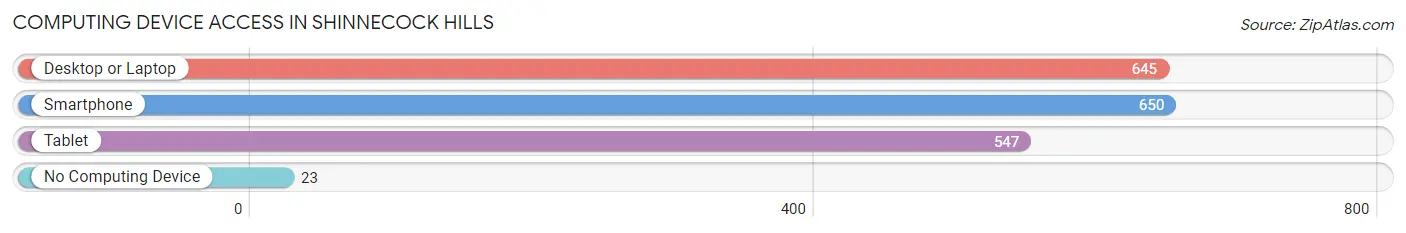
| Device Type | # Households | % Households |
| Desktop or Laptop | 645 | 85.1% |
| Smartphone | 650 | 85.8% |
| Tablet | 547 | 72.2% |
| No Computing Device | 23 | 3.0% |
| Total | 758 | 100.0% |
Internet Access in Shinnecock Hills
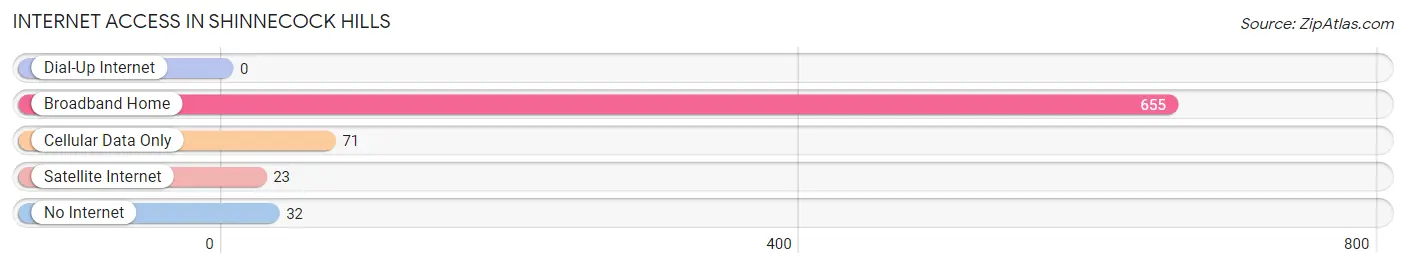
| Internet Type | # Households | % Households |
| Dial-Up Internet | 0 | 0.0% |
| Broadband Home | 655 | 86.4% |
| Cellular Data Only | 71 | 9.4% |
| Satellite Internet | 23 | 3.0% |
| No Internet | 32 | 4.2% |
| Total | 758 | 100.0% |
Shinnecock Hills Summary
Shinecock Hills is a hamlet located in the Town of Southampton in Suffolk County, New York. It is located on the South Fork of Long Island, approximately 90 miles east of New York City. The hamlet is home to the Shinnecock Indian Nation, a federally recognized tribe of Native Americans. The Shinnecock Hills area has a rich history, diverse geography, and a vibrant economy.
History
The Shinnecock Indian Nation is one of the oldest Native American tribes in the United States. The tribe has lived in the area for thousands of years, and their ancestors were among the first to greet the first European settlers in the 1600s. The Shinnecock were a powerful tribe, and their influence extended throughout the region. They were known for their skill in fishing, hunting, and trading.
The Shinnecock Hills area was first settled by Europeans in the late 1600s. The area was used for farming and fishing, and the Shinnecock were able to maintain their traditional way of life. In the 1800s, the area began to develop as a resort destination, and many wealthy New Yorkers built summer homes in the area.
In the late 1800s, the Shinnecock Indian Nation was forced to sell much of their land to the state of New York. This land was then used to build the Shinnecock Hills Golf Club, which opened in 1891. The golf club is now one of the oldest and most prestigious golf courses in the United States.
Geography
The Shinnecock Hills area is located on the South Fork of Long Island, approximately 90 miles east of New York City. The area is bordered by the Atlantic Ocean to the south, the Shinnecock Bay to the west, and the Peconic Bay to the east. The area is characterized by rolling hills, sandy beaches, and lush forests.
The area is home to several state parks, including the Shinnecock Hills State Park and the Montauk Point State Park. The area is also home to several nature preserves, including the Shinnecock Hills Nature Preserve and the Mashomack Preserve.
Economy
The Shinnecock Hills area is home to a vibrant economy. The area is home to several businesses, including restaurants, hotels, and retail stores. The area is also home to several golf courses, including the Shinnecock Hills Golf Club.
The area is also home to several wineries, including the Wölffer Estate Vineyard and the Channing Daughters Winery. The area is also home to several art galleries, including the Parrish Art Museum and the Southampton Arts Center.
Demographics
The Shinnecock Hills area is home to a diverse population. According to the 2010 census, the population of the area was 2,845. The population is primarily white (83.3%), followed by African American (7.2%), Native American (3.2%), Asian (2.7%), and Hispanic (2.6%).
The median household income in the area is $68,958, and the median home value is $717,000. The area is home to several colleges and universities, including Stony Brook University and Southampton College.
Conclusion
Shinnecock Hills is a hamlet located in the Town of Southampton in Suffolk County, New York. It is home to the Shinnecock Indian Nation, a federally recognized tribe of Native Americans. The area has a rich history, diverse geography, and a vibrant economy. The area is home to several businesses, including restaurants, hotels, and retail stores. The area is also home to several golf courses, wineries, and art galleries. The population of the area is primarily white, followed by African American, Native American, Asian, and Hispanic. The median household income in the area is $68,958, and the median home value is $717,000.
Common Questions
What is Per Capita Income in Shinnecock Hills?
Per Capita income in Shinnecock Hills is $74,785.
What is the Median Family Income in Shinnecock Hills?
Median Family Income in Shinnecock Hills is $177,663.
What is the Median Household income in Shinnecock Hills?
Median Household Income in Shinnecock Hills is $156,833.
What is Income or Wage Gap in Shinnecock Hills?
Income or Wage Gap in Shinnecock Hills is 14.2%.
Women in Shinnecock Hills earn 85.8 cents for every dollar earned by a man.
What is Inequality or Gini Index in Shinnecock Hills?
Inequality or Gini Index in Shinnecock Hills is 0.44.
What is the Total Population of Shinnecock Hills?
Total Population of Shinnecock Hills is 2,135.
What is the Total Male Population of Shinnecock Hills?
Total Male Population of Shinnecock Hills is 1,197.
What is the Total Female Population of Shinnecock Hills?
Total Female Population of Shinnecock Hills is 938.
What is the Ratio of Males per 100 Females in Shinnecock Hills?
There are 127.61 Males per 100 Females in Shinnecock Hills.
What is the Ratio of Females per 100 Males in Shinnecock Hills?
There are 78.36 Females per 100 Males in Shinnecock Hills.
What is the Median Population Age in Shinnecock Hills?
Median Population Age in Shinnecock Hills is 48.4 Years.
What is the Average Family Size in Shinnecock Hills
Average Family Size in Shinnecock Hills is 3.2 People.
What is the Average Household Size in Shinnecock Hills
Average Household Size in Shinnecock Hills is 2.6 People.
How Large is the Labor Force in Shinnecock Hills?
There are 948 People in the Labor Forcein in Shinnecock Hills.
What is the Percentage of People in the Labor Force in Shinnecock Hills?
51.7% of People are in the Labor Force in Shinnecock Hills.
What is the Unemployment Rate in Shinnecock Hills?
Unemployment Rate in Shinnecock Hills is 6.8%.