Huntington Bay, NY Map & Demographics
Huntington Bay Map
Huntington Bay Overview
$167,757
PER CAPITA INCOME
$250,001
AVG FAMILY INCOME
$250,001
AVG HOUSEHOLD INCOME
0.52
INEQUALITY / GINI INDEX
1,776
TOTAL POPULATION
878
MALE POPULATION
898
FEMALE POPULATION
97.77
MALES / 100 FEMALES
102.28
FEMALES / 100 MALES
57.5
MEDIAN AGE
2.8
AVG FAMILY SIZE
2.5
AVG HOUSEHOLD SIZE
814
LABOR FORCE [ PEOPLE ]
54.0%
PERCENT IN LABOR FORCE
5.8%
UNEMPLOYMENT RATE
Income in Huntington Bay
Income Overview in Huntington Bay
Per Capita Income in Huntington Bay is $167,757, while median incomes of families and households are $250,001 and $250,001 respectively.
| Characteristic | Number | Measure |
| Per Capita Income | 1,776 | $167,757 |
| Median Family Income | 559 | $250,001 |
| Mean Family Income | 559 | $476,373 |
| Median Household Income | 713 | $250,001 |
| Mean Household Income | 713 | $414,276 |
| Income Deficit | 559 | $0 |
| Wage / Income Gap (%) | 1,776 | 0.00% |
| Wage / Income Gap ($) | 1,776 | 100.00¢ per $1 |
| Gini / Inequality Index | 1,776 | 0.52 |
Earnings by Sex in Huntington Bay
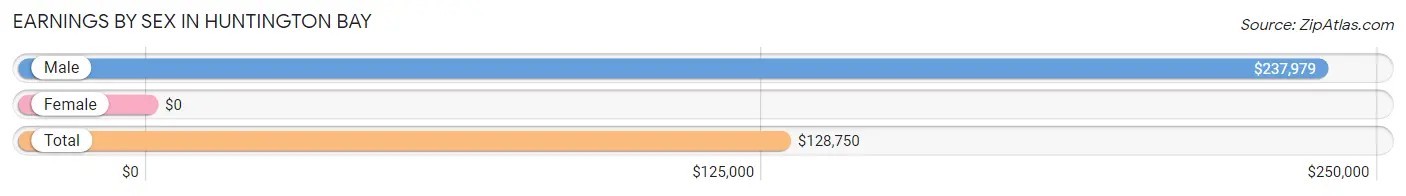
| Sex | Number | Average Earnings |
| Male | 589 (59.1%) | $237,979 |
| Female | 407 (40.9%) | $0 |
| Total | 996 (100.0%) | $128,750 |
Earnings by Sex by Income Bracket in Huntington Bay
The most common earnings brackets in Huntington Bay are $100,000+ for men (447 | 75.9%) and $100,000+ for women (104 | 25.6%).
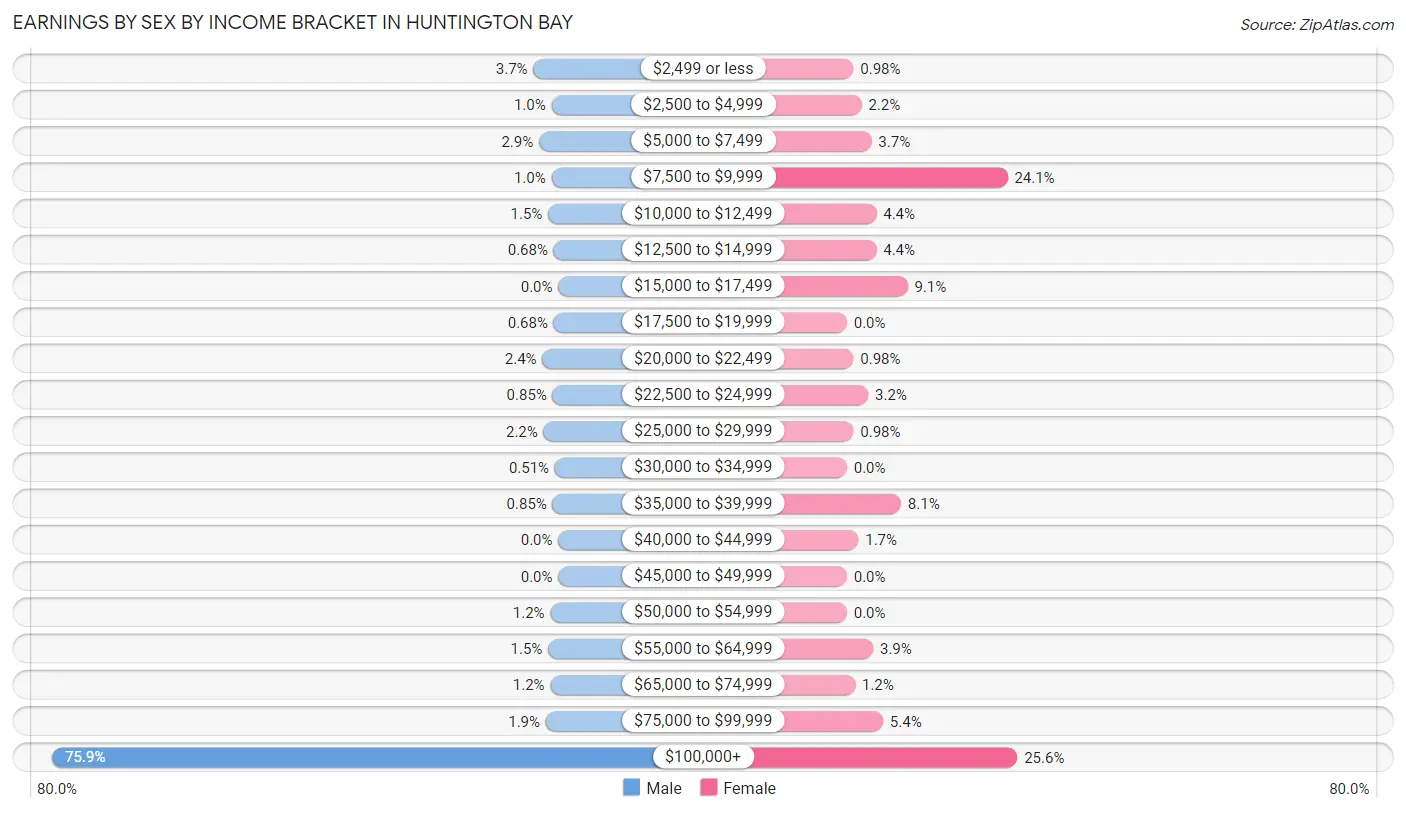
| Income | Male | Female |
| $2,499 or less | 22 (3.7%) | 4 (1.0%) |
| $2,500 to $4,999 | 6 (1.0%) | 9 (2.2%) |
| $5,000 to $7,499 | 17 (2.9%) | 15 (3.7%) |
| $7,500 to $9,999 | 6 (1.0%) | 98 (24.1%) |
| $10,000 to $12,499 | 9 (1.5%) | 18 (4.4%) |
| $12,500 to $14,999 | 4 (0.7%) | 18 (4.4%) |
| $15,000 to $17,499 | 0 (0.0%) | 37 (9.1%) |
| $17,500 to $19,999 | 4 (0.7%) | 0 (0.0%) |
| $20,000 to $22,499 | 14 (2.4%) | 4 (1.0%) |
| $22,500 to $24,999 | 5 (0.9%) | 13 (3.2%) |
| $25,000 to $29,999 | 13 (2.2%) | 4 (1.0%) |
| $30,000 to $34,999 | 3 (0.5%) | 0 (0.0%) |
| $35,000 to $39,999 | 5 (0.9%) | 33 (8.1%) |
| $40,000 to $44,999 | 0 (0.0%) | 7 (1.7%) |
| $45,000 to $49,999 | 0 (0.0%) | 0 (0.0%) |
| $50,000 to $54,999 | 7 (1.2%) | 0 (0.0%) |
| $55,000 to $64,999 | 9 (1.5%) | 16 (3.9%) |
| $65,000 to $74,999 | 7 (1.2%) | 5 (1.2%) |
| $75,000 to $99,999 | 11 (1.9%) | 22 (5.4%) |
| $100,000+ | 447 (75.9%) | 104 (25.6%) |
| Total | 589 (100.0%) | 407 (100.0%) |
Earnings by Sex by Educational Attainment in Huntington Bay
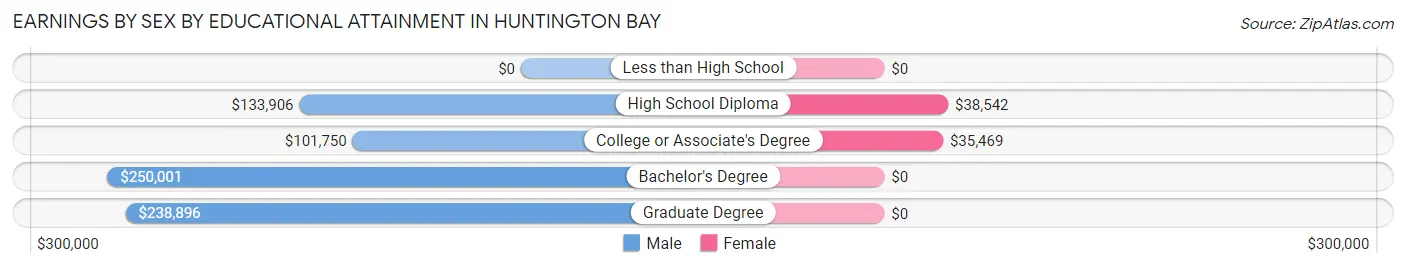
| Educational Attainment | Male Income | Female Income |
| Less than High School | - | - |
| High School Diploma | $133,906 | $38,542 |
| College or Associate's Degree | $101,750 | $35,469 |
| Bachelor's Degree | $250,001 | $0 |
| Graduate Degree | $238,896 | $0 |
| Total | $238,458 | $0 |
Family Income in Huntington Bay
Family Income Brackets in Huntington Bay
According to the Huntington Bay family income data, there are 406 families falling into the $200,000+ income range, which is the most common income bracket and makes up 72.6% of all families.
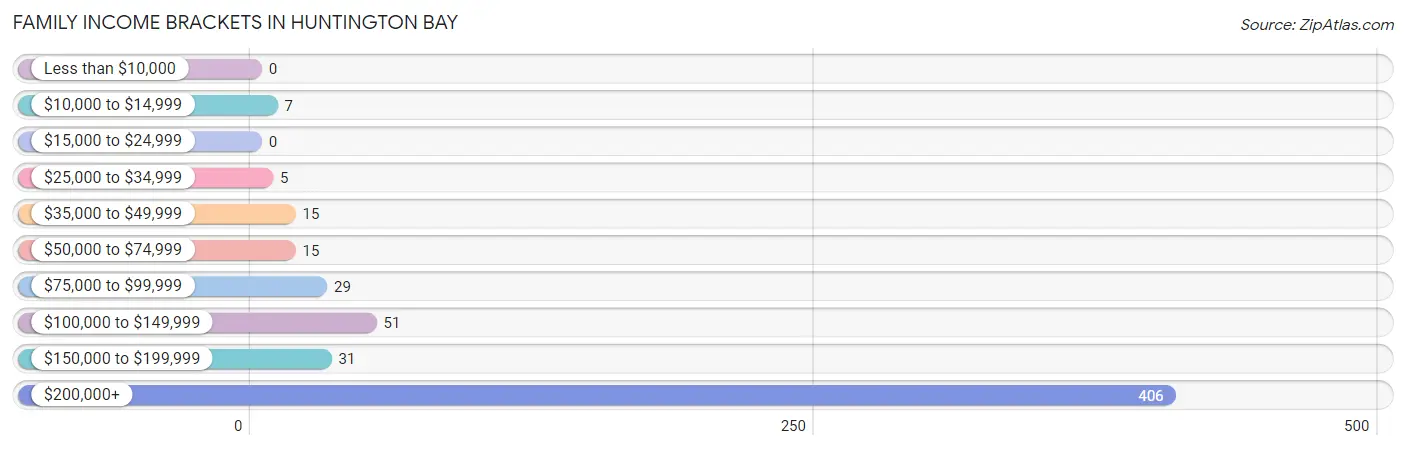
| Income Bracket | # Families | % Families |
| Less than $10,000 | 0 | 0.0% |
| $10,000 to $14,999 | 7 | 1.3% |
| $15,000 to $24,999 | 0 | 0.0% |
| $25,000 to $34,999 | 5 | 0.9% |
| $35,000 to $49,999 | 15 | 2.7% |
| $50,000 to $74,999 | 15 | 2.7% |
| $75,000 to $99,999 | 29 | 5.2% |
| $100,000 to $149,999 | 51 | 9.1% |
| $150,000 to $199,999 | 31 | 5.5% |
| $200,000+ | 406 | 72.6% |
Family Income by Famaliy Size in Huntington Bay
2-person families (369 | 66.0%) account for the highest median family income in Huntington Bay with $250,001 per family, while 2-person families (369 | 66.0%) have the highest median income of $125,000 per family member.
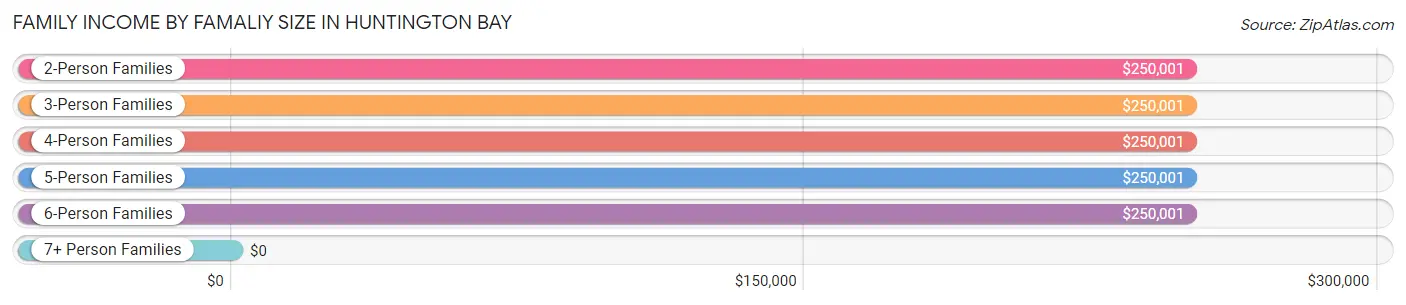
| Income Bracket | # Families | Median Income |
| 2-Person Families | 369 (66.0%) | $250,001 |
| 3-Person Families | 86 (15.4%) | $250,001 |
| 4-Person Families | 37 (6.6%) | $250,001 |
| 5-Person Families | 44 (7.9%) | $250,001 |
| 6-Person Families | 23 (4.1%) | $250,001 |
| 7+ Person Families | 0 (0.0%) | $0 |
| Total | 559 (100.0%) | $250,001 |
Family Income by Number of Earners in Huntington Bay
The median family income in Huntington Bay is $250,001, with families comprising 2 earners (274) having the highest median family income of $250,001, while families with no earners (77) have the lowest median family income of $127,813, accounting for 49.0% and 13.8% of families, respectively.
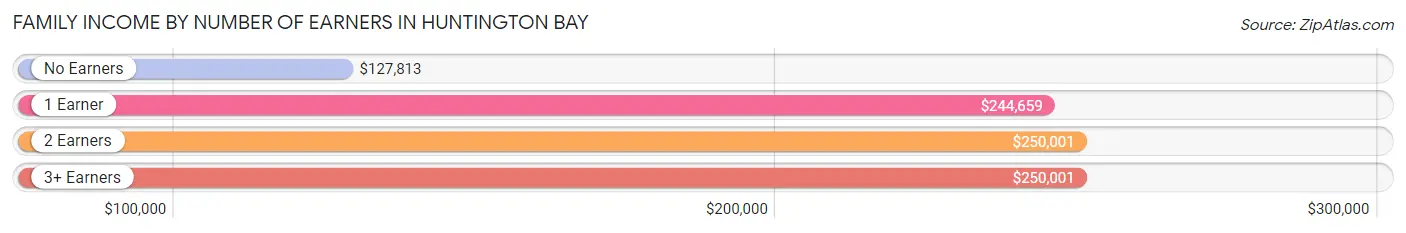
| Number of Earners | # Families | Median Income |
| No Earners | 77 (13.8%) | $127,813 |
| 1 Earner | 163 (29.2%) | $244,659 |
| 2 Earners | 274 (49.0%) | $250,001 |
| 3+ Earners | 45 (8.1%) | $250,001 |
| Total | 559 (100.0%) | $250,001 |
Household Income in Huntington Bay
Household Income Brackets in Huntington Bay
With 452 households falling in the category, the $200,000+ income range is the most frequent in Huntington Bay, accounting for 63.4% of all households. In contrast, only 3 households (0.4%) fall into the $15,000 to $24,999 income bracket, making it the least populous group.
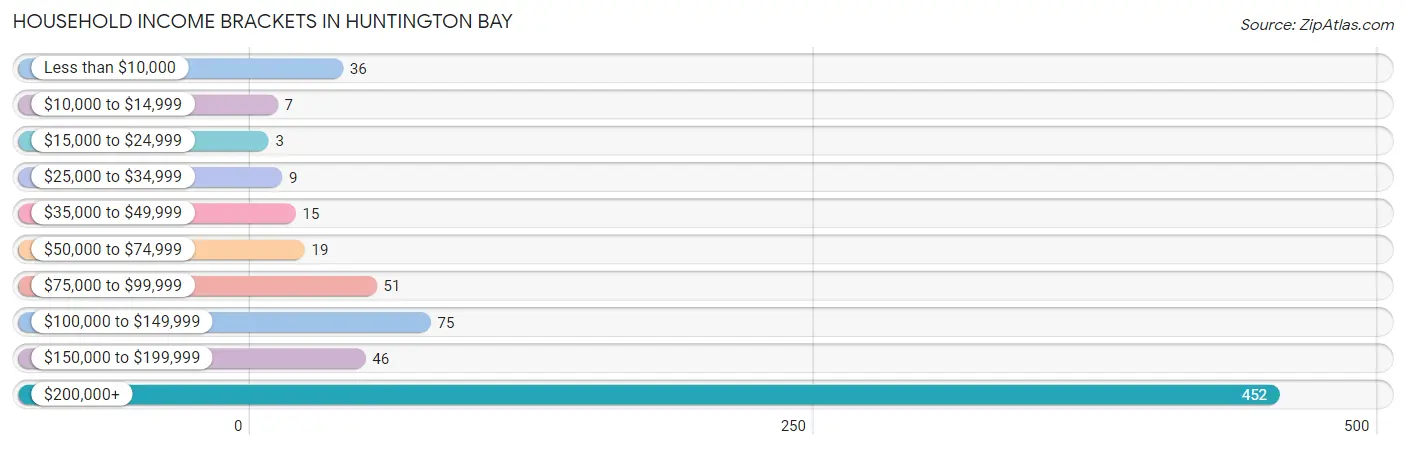
| Income Bracket | # Households | % Households |
| Less than $10,000 | 36 | 5.0% |
| $10,000 to $14,999 | 7 | 1.0% |
| $15,000 to $24,999 | 3 | 0.4% |
| $25,000 to $34,999 | 9 | 1.3% |
| $35,000 to $49,999 | 15 | 2.1% |
| $50,000 to $74,999 | 19 | 2.7% |
| $75,000 to $99,999 | 51 | 7.2% |
| $100,000 to $149,999 | 75 | 10.5% |
| $150,000 to $199,999 | 46 | 6.5% |
| $200,000+ | 452 | 63.4% |
Household Income by Householder Age in Huntington Bay
The median household income in Huntington Bay is $250,001, with the highest median household income of $250,001 found in the 25 to 44 years age bracket for the primary householder. A total of 53 households (7.4%) fall into this category.
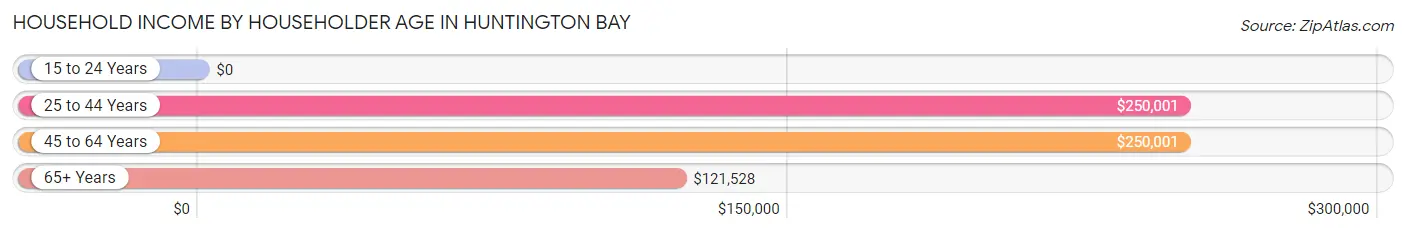
| Income Bracket | # Households | Median Income |
| 15 to 24 Years | 0 (0.0%) | $0 |
| 25 to 44 Years | 53 (7.4%) | $250,001 |
| 45 to 64 Years | 399 (56.0%) | $250,001 |
| 65+ Years | 261 (36.6%) | $121,528 |
| Total | 713 (100.0%) | $250,001 |
Poverty in Huntington Bay
Income Below Poverty by Sex and Age in Huntington Bay
With 0.8% poverty level for males and 7.1% for females among the residents of Huntington Bay, 65 to 74 year old males and 65 to 74 year old females are the most vulnerable to poverty, with 7 males (5.5%) and 45 females (31.5%) in their respective age groups living below the poverty level.
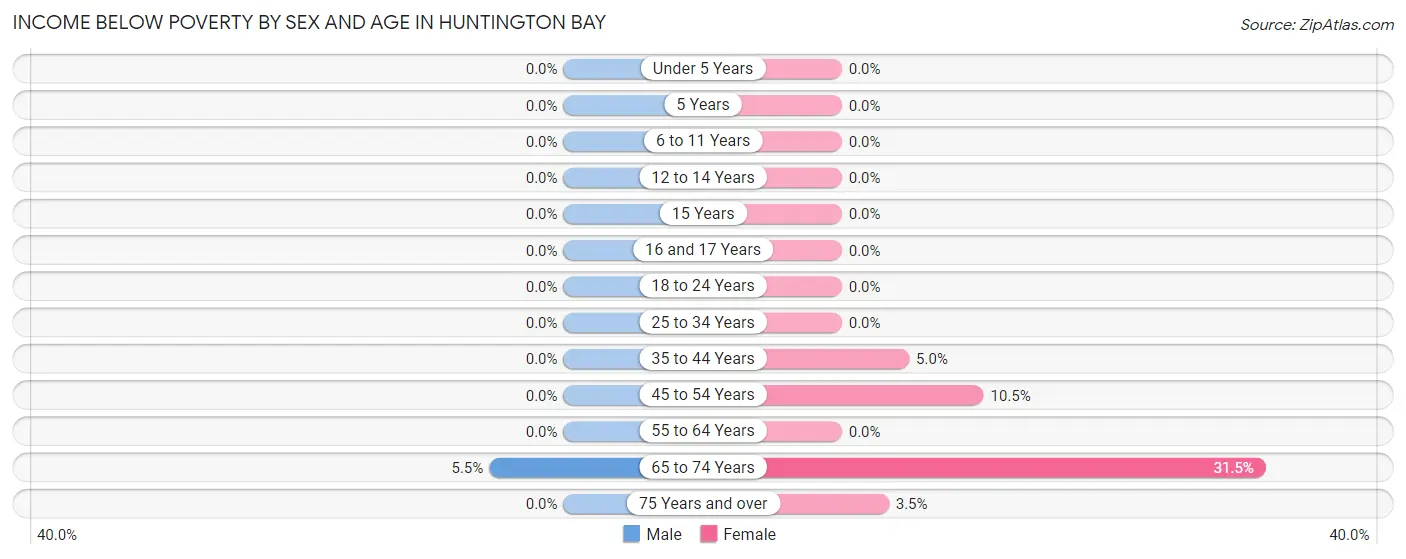
| Age Bracket | Male | Female |
| Under 5 Years | 0 (0.0%) | 0 (0.0%) |
| 5 Years | 0 (0.0%) | 0 (0.0%) |
| 6 to 11 Years | 0 (0.0%) | 0 (0.0%) |
| 12 to 14 Years | 0 (0.0%) | 0 (0.0%) |
| 15 Years | 0 (0.0%) | 0 (0.0%) |
| 16 and 17 Years | 0 (0.0%) | 0 (0.0%) |
| 18 to 24 Years | 0 (0.0%) | 0 (0.0%) |
| 25 to 34 Years | 0 (0.0%) | 0 (0.0%) |
| 35 to 44 Years | 0 (0.0%) | 4 (5.0%) |
| 45 to 54 Years | 0 (0.0%) | 12 (10.5%) |
| 55 to 64 Years | 0 (0.0%) | 0 (0.0%) |
| 65 to 74 Years | 7 (5.5%) | 45 (31.5%) |
| 75 Years and over | 0 (0.0%) | 3 (3.5%) |
| Total | 7 (0.8%) | 64 (7.1%) |
Income Above Poverty by Sex and Age in Huntington Bay
According to the poverty statistics in Huntington Bay, males aged under 5 years and females aged under 5 years are the age groups that are most secure financially, with 100.0% of males and 100.0% of females in these age groups living above the poverty line.
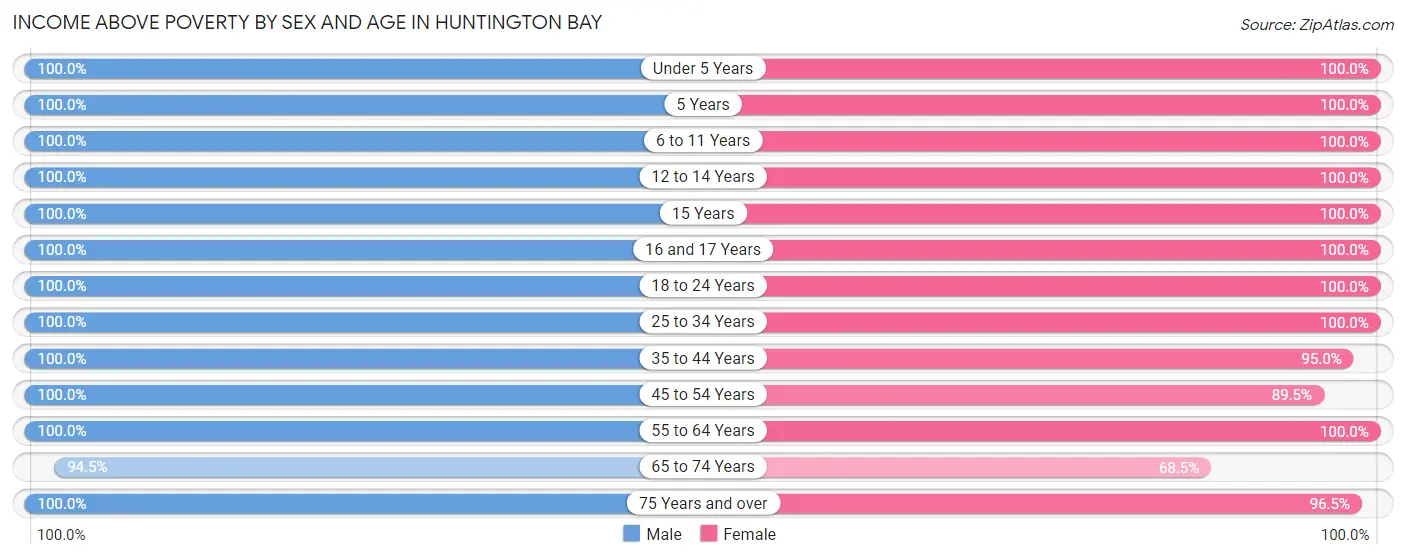
| Age Bracket | Male | Female |
| Under 5 Years | 24 (100.0%) | 43 (100.0%) |
| 5 Years | 9 (100.0%) | 18 (100.0%) |
| 6 to 11 Years | 60 (100.0%) | 47 (100.0%) |
| 12 to 14 Years | 20 (100.0%) | 20 (100.0%) |
| 15 Years | 24 (100.0%) | 4 (100.0%) |
| 16 and 17 Years | 24 (100.0%) | 15 (100.0%) |
| 18 to 24 Years | 31 (100.0%) | 38 (100.0%) |
| 25 to 34 Years | 25 (100.0%) | 42 (100.0%) |
| 35 to 44 Years | 74 (100.0%) | 76 (95.0%) |
| 45 to 54 Years | 106 (100.0%) | 102 (89.5%) |
| 55 to 64 Years | 265 (100.0%) | 248 (100.0%) |
| 65 to 74 Years | 120 (94.5%) | 98 (68.5%) |
| 75 Years and over | 89 (100.0%) | 83 (96.5%) |
| Total | 871 (99.2%) | 834 (92.9%) |
Income Below Poverty Among Married-Couple Families in Huntington Bay
The poverty statistics for married-couple families in Huntington Bay show that 1.3% or 7 of the total 538 families live below the poverty line. Families with no children have the highest poverty rate of 1.8%, comprising of 7 families. On the other hand, families with 1 or 2 children have the lowest poverty rate of 0.0%, which includes 0 families.
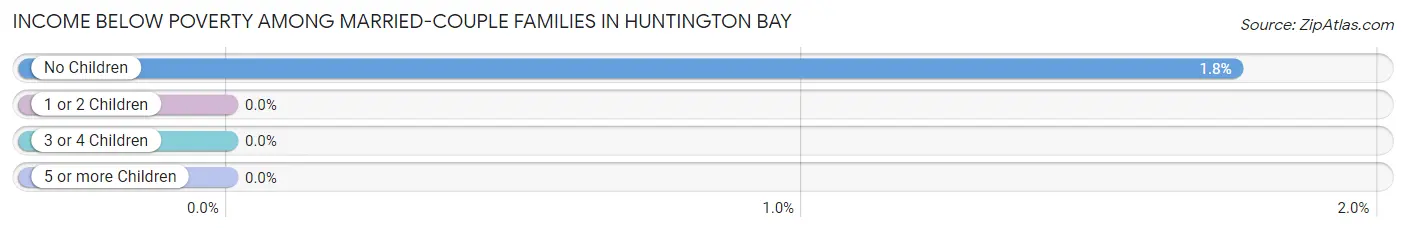
| Children | Above Poverty | Below Poverty |
| No Children | 393 (98.3%) | 7 (1.8%) |
| 1 or 2 Children | 91 (100.0%) | 0 (0.0%) |
| 3 or 4 Children | 47 (100.0%) | 0 (0.0%) |
| 5 or more Children | 0 (0.0%) | 0 (0.0%) |
| Total | 531 (98.7%) | 7 (1.3%) |
Income Below Poverty Among Single-Parent Households in Huntington Bay
| Children | Single Father | Single Mother |
| No Children | 0 (0.0%) | 0 (0.0%) |
| 1 or 2 Children | 0 (0.0%) | 0 (0.0%) |
| 3 or 4 Children | 0 (0.0%) | 0 (0.0%) |
| 5 or more Children | 0 (0.0%) | 0 (0.0%) |
| Total | 0 (0.0%) | 0 (0.0%) |
Income Below Poverty Among Married-Couple vs Single-Parent Households in Huntington Bay
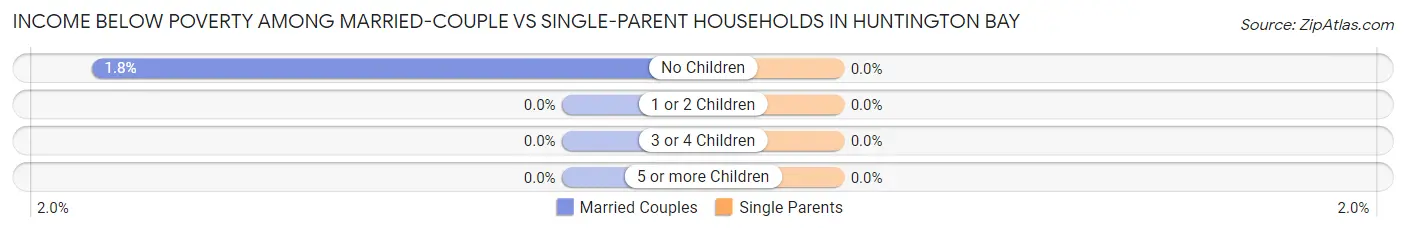
| Children | Married-Couple Families | Single-Parent Households |
| No Children | 7 (1.8%) | 0 (0.0%) |
| 1 or 2 Children | 0 (0.0%) | 0 (0.0%) |
| 3 or 4 Children | 0 (0.0%) | 0 (0.0%) |
| 5 or more Children | 0 (0.0%) | 0 (0.0%) |
| Total | 7 (1.3%) | 0 (0.0%) |
Race in Huntington Bay
The most populous races in Huntington Bay are White / Caucasian (1,665 | 93.8%), Two or more Races (68 | 3.8%), and Hispanic or Latino (51 | 2.9%).
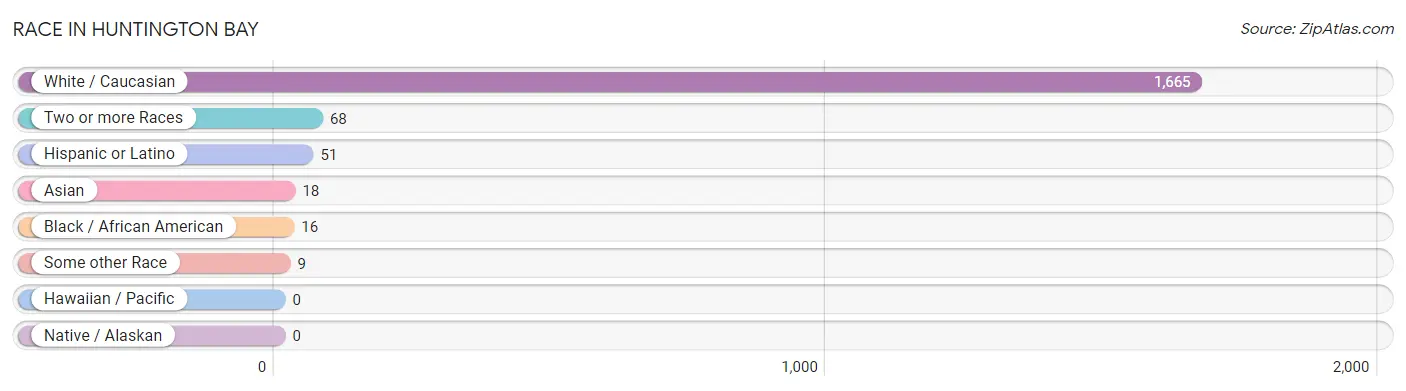
| Race | # Population | % Population |
| Asian | 18 | 1.0% |
| Black / African American | 16 | 0.9% |
| Hawaiian / Pacific | 0 | 0.0% |
| Hispanic or Latino | 51 | 2.9% |
| Native / Alaskan | 0 | 0.0% |
| White / Caucasian | 1,665 | 93.8% |
| Two or more Races | 68 | 3.8% |
| Some other Race | 9 | 0.5% |
| Total | 1,776 | 100.0% |
Ancestry in Huntington Bay
The most populous ancestries reported in Huntington Bay are Italian (414 | 23.3%), Irish (409 | 23.0%), English (267 | 15.0%), German (222 | 12.5%), and Czech (138 | 7.8%), together accounting for 81.6% of all Huntington Bay residents.
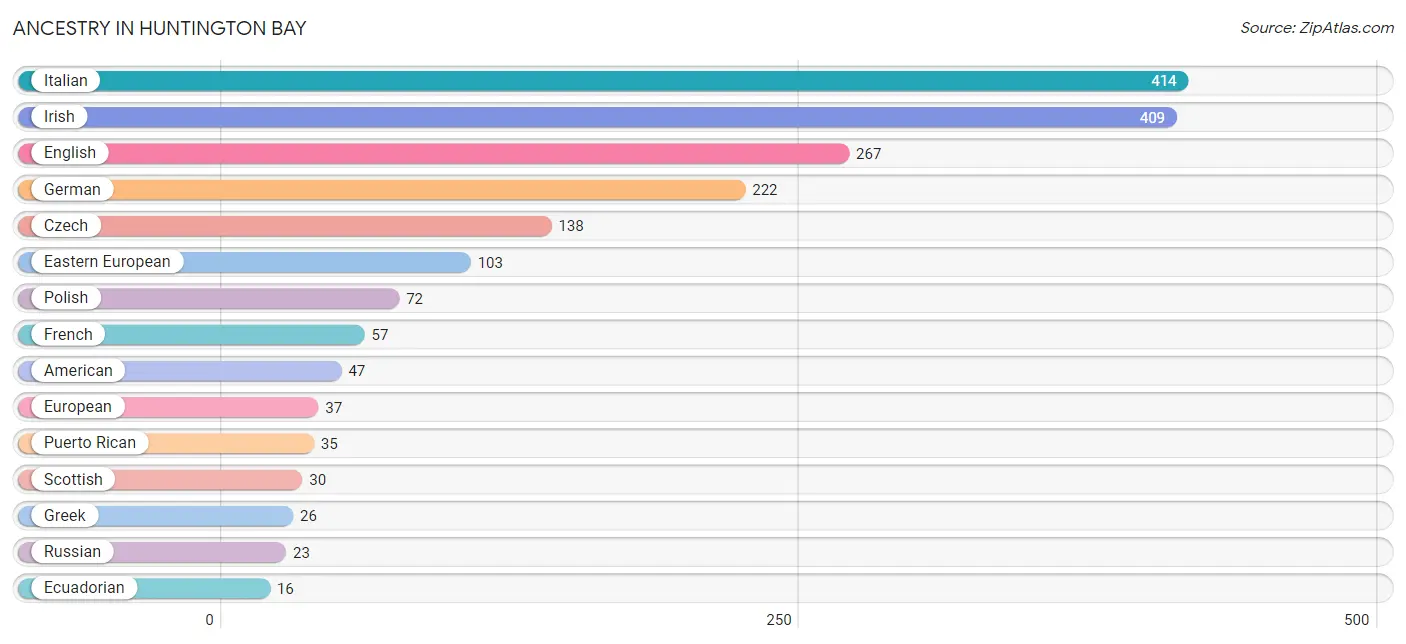
| Ancestry | # Population | % Population |
| American | 47 | 2.6% |
| Arab | 8 | 0.4% |
| Austrian | 14 | 0.8% |
| Brazilian | 8 | 0.4% |
| British | 9 | 0.5% |
| Canadian | 11 | 0.6% |
| Cypriot | 9 | 0.5% |
| Czech | 138 | 7.8% |
| Danish | 7 | 0.4% |
| Eastern European | 103 | 5.8% |
| Ecuadorian | 16 | 0.9% |
| English | 267 | 15.0% |
| European | 37 | 2.1% |
| French | 57 | 3.2% |
| French Canadian | 9 | 0.5% |
| German | 222 | 12.5% |
| Greek | 26 | 1.5% |
| Guyanese | 5 | 0.3% |
| Hungarian | 5 | 0.3% |
| Indian (Asian) | 15 | 0.8% |
| Irish | 409 | 23.0% |
| Italian | 414 | 23.3% |
| Korean | 6 | 0.3% |
| Lebanese | 8 | 0.4% |
| Norwegian | 13 | 0.7% |
| Polish | 72 | 4.1% |
| Portuguese | 4 | 0.2% |
| Puerto Rican | 35 | 2.0% |
| Romanian | 3 | 0.2% |
| Russian | 23 | 1.3% |
| Scottish | 30 | 1.7% |
| Slovak | 11 | 0.6% |
| South American | 16 | 0.9% |
| Swiss | 3 | 0.2% |
| Turkish | 4 | 0.2% |
| Ukrainian | 12 | 0.7% |
| Welsh | 11 | 0.6% | View All 37 Rows |
Immigrants in Huntington Bay
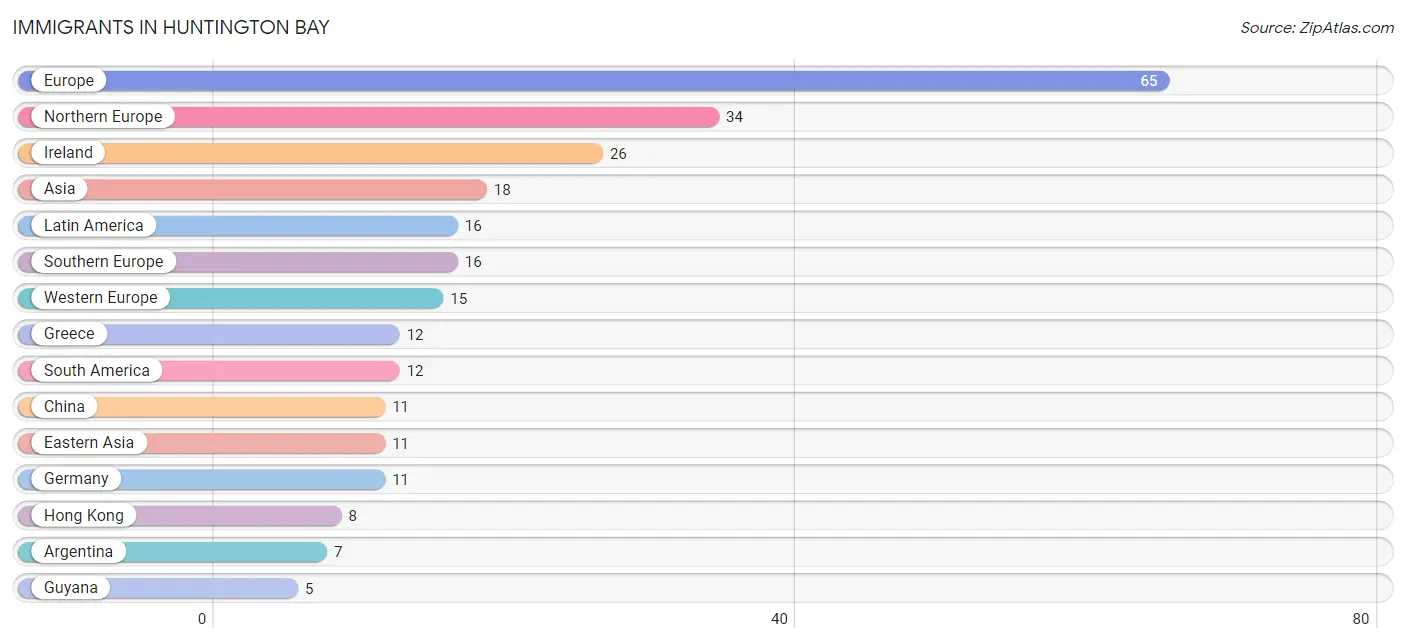
The most numerous immigrant groups reported in Huntington Bay came from Europe (65 | 3.7%), Northern Europe (34 | 1.9%), Ireland (26 | 1.5%), Asia (18 | 1.0%), and Latin America (16 | 0.9%), together accounting for 8.9% of all Huntington Bay residents.
| Immigration Origin | # Population | % Population |
| Argentina | 7 | 0.4% |
| Asia | 18 | 1.0% |
| Canada | 3 | 0.2% |
| Caribbean | 4 | 0.2% |
| China | 11 | 0.6% |
| Eastern Asia | 11 | 0.6% |
| Europe | 65 | 3.7% |
| Germany | 11 | 0.6% |
| Greece | 12 | 0.7% |
| Guyana | 5 | 0.3% |
| Hong Kong | 8 | 0.4% |
| India | 4 | 0.2% |
| Ireland | 26 | 1.5% |
| Jamaica | 4 | 0.2% |
| Latin America | 16 | 0.9% |
| Northern Europe | 34 | 1.9% |
| Norway | 4 | 0.2% |
| Philippines | 3 | 0.2% |
| Portugal | 4 | 0.2% |
| South America | 12 | 0.7% |
| South Central Asia | 4 | 0.2% |
| South Eastern Asia | 3 | 0.2% |
| Southern Europe | 16 | 0.9% |
| Switzerland | 4 | 0.2% |
| Western Europe | 15 | 0.8% | View All 25 Rows |
Sex and Age in Huntington Bay
Sex and Age in Huntington Bay
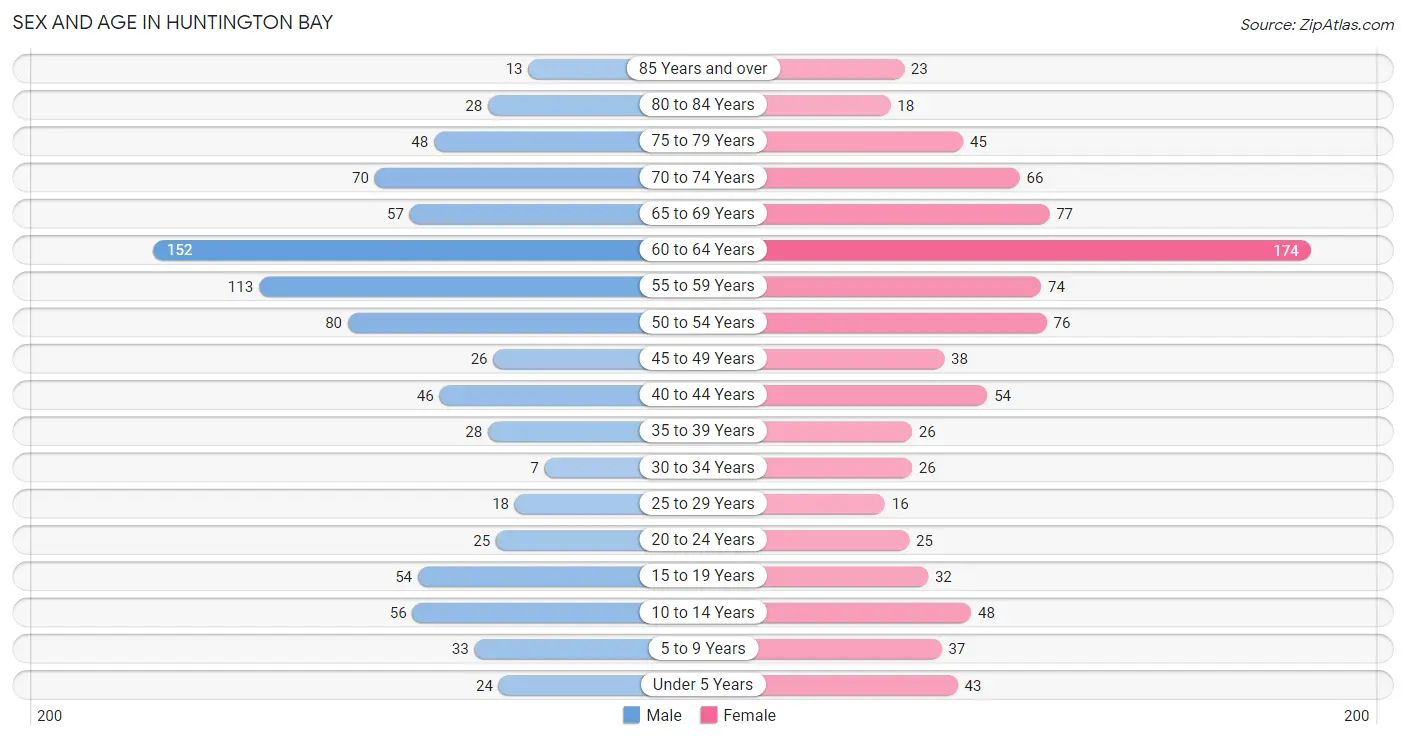
The most populous age groups in Huntington Bay are 60 to 64 Years (152 | 17.3%) for men and 60 to 64 Years (174 | 19.4%) for women.
| Age Bracket | Male | Female |
| Under 5 Years | 24 (2.7%) | 43 (4.8%) |
| 5 to 9 Years | 33 (3.8%) | 37 (4.1%) |
| 10 to 14 Years | 56 (6.4%) | 48 (5.3%) |
| 15 to 19 Years | 54 (6.1%) | 32 (3.6%) |
| 20 to 24 Years | 25 (2.9%) | 25 (2.8%) |
| 25 to 29 Years | 18 (2.1%) | 16 (1.8%) |
| 30 to 34 Years | 7 (0.8%) | 26 (2.9%) |
| 35 to 39 Years | 28 (3.2%) | 26 (2.9%) |
| 40 to 44 Years | 46 (5.2%) | 54 (6.0%) |
| 45 to 49 Years | 26 (3.0%) | 38 (4.2%) |
| 50 to 54 Years | 80 (9.1%) | 76 (8.5%) |
| 55 to 59 Years | 113 (12.9%) | 74 (8.2%) |
| 60 to 64 Years | 152 (17.3%) | 174 (19.4%) |
| 65 to 69 Years | 57 (6.5%) | 77 (8.6%) |
| 70 to 74 Years | 70 (8.0%) | 66 (7.3%) |
| 75 to 79 Years | 48 (5.5%) | 45 (5.0%) |
| 80 to 84 Years | 28 (3.2%) | 18 (2.0%) |
| 85 Years and over | 13 (1.5%) | 23 (2.6%) |
| Total | 878 (100.0%) | 898 (100.0%) |
Families and Households in Huntington Bay
Median Family Size in Huntington Bay
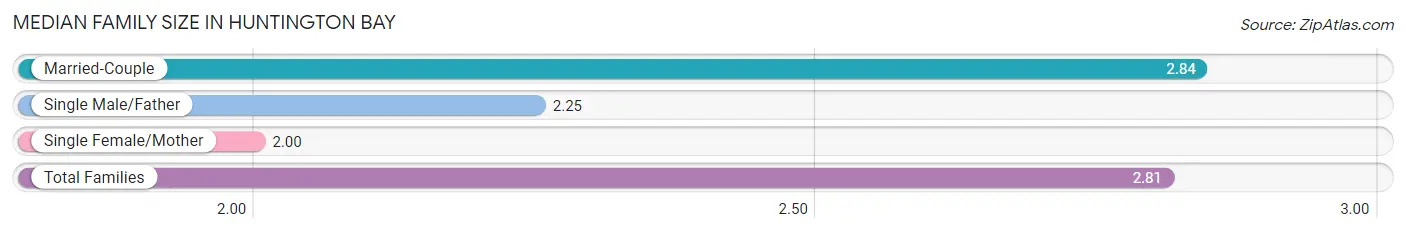
The median family size in Huntington Bay is 2.81 persons per family, with married-couple families (538 | 96.2%) accounting for the largest median family size of 2.84 persons per family. On the other hand, single female/mother families (17 | 3.0%) represent the smallest median family size with 2.00 persons per family.
| Family Type | # Families | Family Size |
| Married-Couple | 538 (96.2%) | 2.84 |
| Single Male/Father | 4 (0.7%) | 2.25 |
| Single Female/Mother | 17 (3.0%) | 2.00 |
| Total Families | 559 (100.0%) | 2.81 |
Median Household Size in Huntington Bay
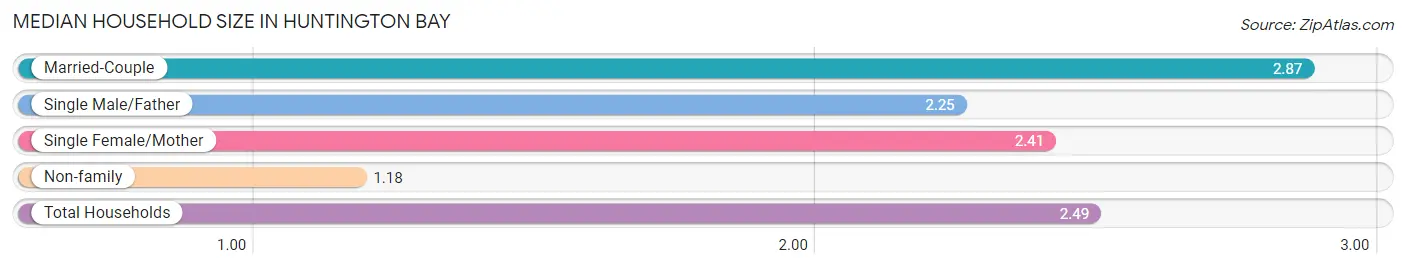
The median household size in Huntington Bay is 2.49 persons per household, with married-couple households (538 | 75.5%) accounting for the largest median household size of 2.87 persons per household. non-family households (154 | 21.6%) represent the smallest median household size with 1.18 persons per household.
| Household Type | # Households | Household Size |
| Married-Couple | 538 (75.5%) | 2.87 |
| Single Male/Father | 4 (0.6%) | 2.25 |
| Single Female/Mother | 17 (2.4%) | 2.41 |
| Non-family | 154 (21.6%) | 1.18 |
| Total Households | 713 (100.0%) | 2.49 |
Household Size by Marriage Status in Huntington Bay
Out of a total of 713 households in Huntington Bay, 559 (78.4%) are family households, while 154 (21.6%) are nonfamily households. The most numerous type of family households are 2-person households, comprising 358, and the most common type of nonfamily households are 1-person households, comprising 126.
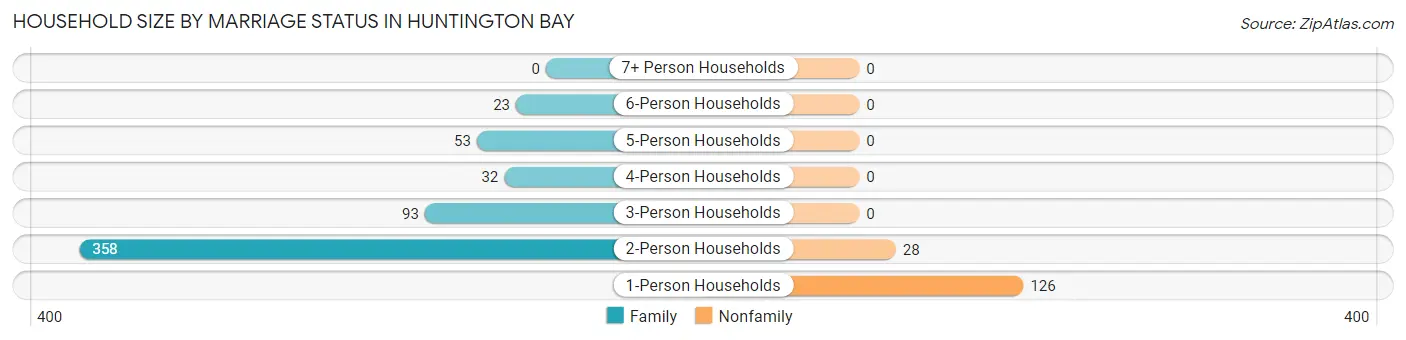
| Household Size | Family Households | Nonfamily Households |
| 1-Person Households | - | 126 (17.7%) |
| 2-Person Households | 358 (50.2%) | 28 (3.9%) |
| 3-Person Households | 93 (13.0%) | 0 (0.0%) |
| 4-Person Households | 32 (4.5%) | 0 (0.0%) |
| 5-Person Households | 53 (7.4%) | 0 (0.0%) |
| 6-Person Households | 23 (3.2%) | 0 (0.0%) |
| 7+ Person Households | 0 (0.0%) | 0 (0.0%) |
| Total | 559 (78.4%) | 154 (21.6%) |
Female Fertility in Huntington Bay
Fertility by Age in Huntington Bay
Average fertility rate in Huntington Bay is 65.0 births per 1,000 women. Women in the age bracket of 20 to 34 years have the highest fertility rate with 119.0 births per 1,000 women. Women in the age bracket of 20 to 34 years acount for 53.3% of all women with births.
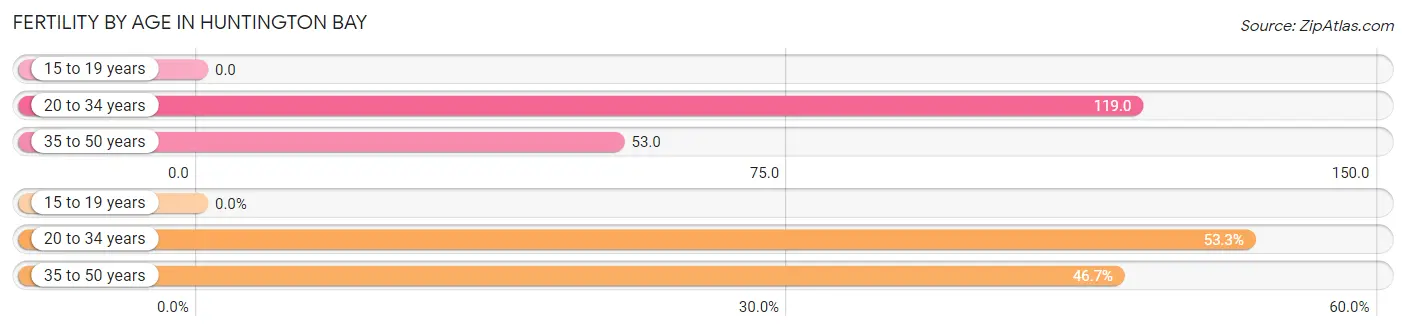
| Age Bracket | Women with Births | Births / 1,000 Women |
| 15 to 19 years | 0 (0.0%) | 0.0 |
| 20 to 34 years | 8 (53.3%) | 119.0 |
| 35 to 50 years | 7 (46.7%) | 53.0 |
| Total | 15 (100.0%) | 65.0 |
Fertility by Age by Marriage Status in Huntington Bay
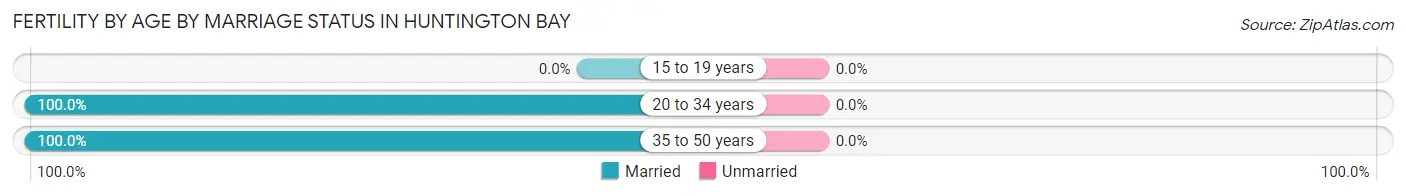
| Age Bracket | Married | Unmarried |
| 15 to 19 years | 0 (0.0%) | 0 (0.0%) |
| 20 to 34 years | 8 (100.0%) | 0 (0.0%) |
| 35 to 50 years | 7 (100.0%) | 0 (0.0%) |
| Total | 15 (100.0%) | 0 (0.0%) |
Fertility by Education in Huntington Bay
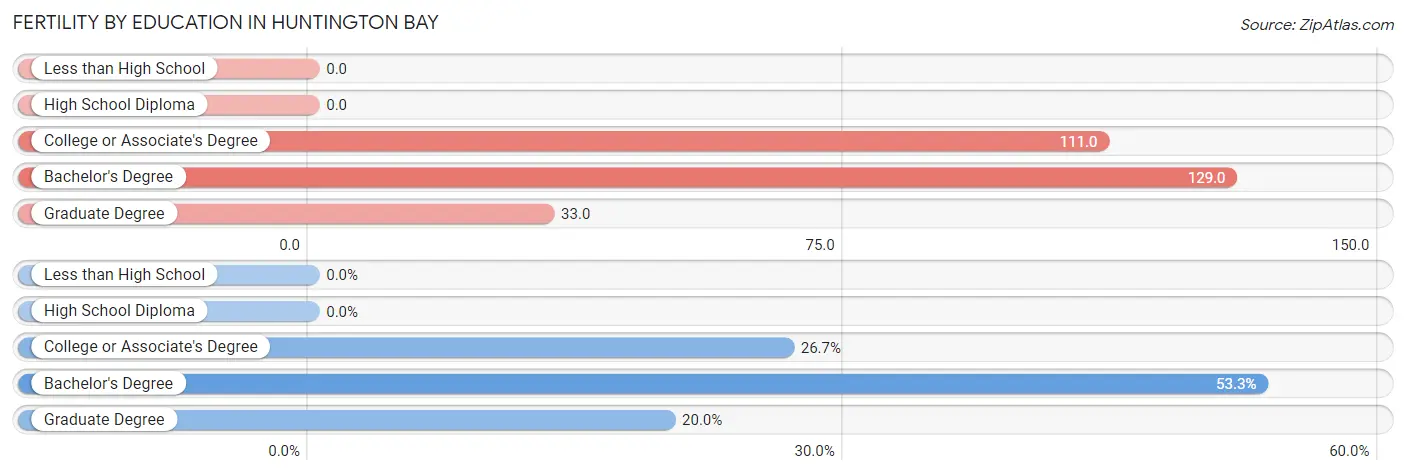
| Educational Attainment | Women with Births | Births / 1,000 Women |
| Less than High School | 0 (0.0%) | 0.0 |
| High School Diploma | 0 (0.0%) | 0.0 |
| College or Associate's Degree | 4 (26.7%) | 111.0 |
| Bachelor's Degree | 8 (53.3%) | 129.0 |
| Graduate Degree | 3 (20.0%) | 33.0 |
| Total | 15 (100.0%) | 65.0 |
Fertility by Education by Marriage Status in Huntington Bay
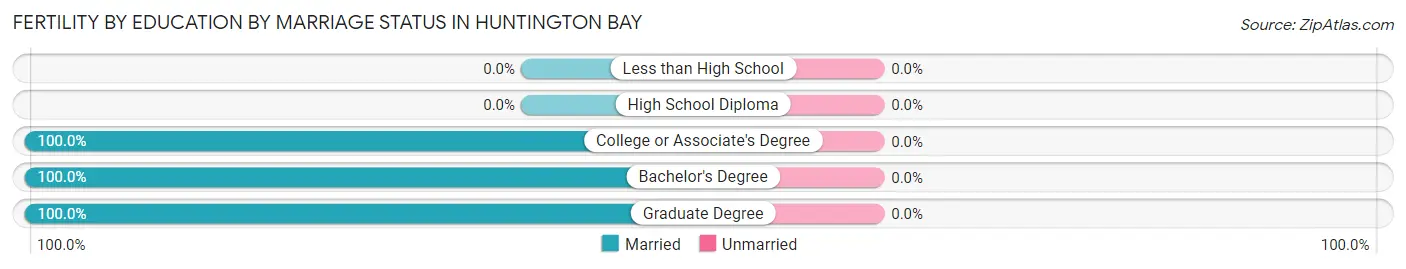
| Educational Attainment | Married | Unmarried |
| Less than High School | 0 (0.0%) | 0 (0.0%) |
| High School Diploma | 0 (0.0%) | 0 (0.0%) |
| College or Associate's Degree | 4 (100.0%) | 0 (0.0%) |
| Bachelor's Degree | 8 (100.0%) | 0 (0.0%) |
| Graduate Degree | 3 (100.0%) | 0 (0.0%) |
| Total | 15 (100.0%) | 0 (0.0%) |
Employment Characteristics in Huntington Bay
Employment by Class of Employer in Huntington Bay
Among the 767 employed individuals in Huntington Bay, private company employees (450 | 58.7%), self-employed (incorporated) (140 | 18.2%), and not-for-profit organizations (86 | 11.2%) make up the most common classes of employment.
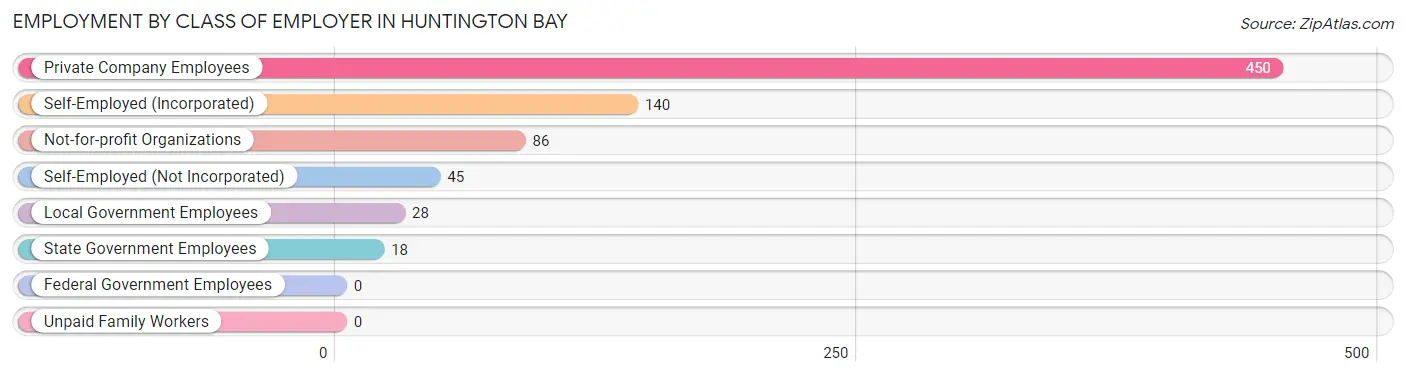
| Employer Class | # Employees | % Employees |
| Private Company Employees | 450 | 58.7% |
| Self-Employed (Incorporated) | 140 | 18.2% |
| Self-Employed (Not Incorporated) | 45 | 5.9% |
| Not-for-profit Organizations | 86 | 11.2% |
| Local Government Employees | 28 | 3.6% |
| State Government Employees | 18 | 2.4% |
| Federal Government Employees | 0 | 0.0% |
| Unpaid Family Workers | 0 | 0.0% |
| Total | 767 | 100.0% |
Employment Status by Age in Huntington Bay
According to the labor force statistics for Huntington Bay, out of the total population over 16 years of age (1,507), 54.0% or 814 individuals are in the labor force, with 5.8% or 47 of them unemployed. The age group with the highest labor force participation rate is 30 to 34 years, with 75.8% or 25 individuals in the labor force. Within the labor force, the 25 to 29 years age range has the highest percentage of unemployed individuals, with 30.4% or 7 of them being unemployed.
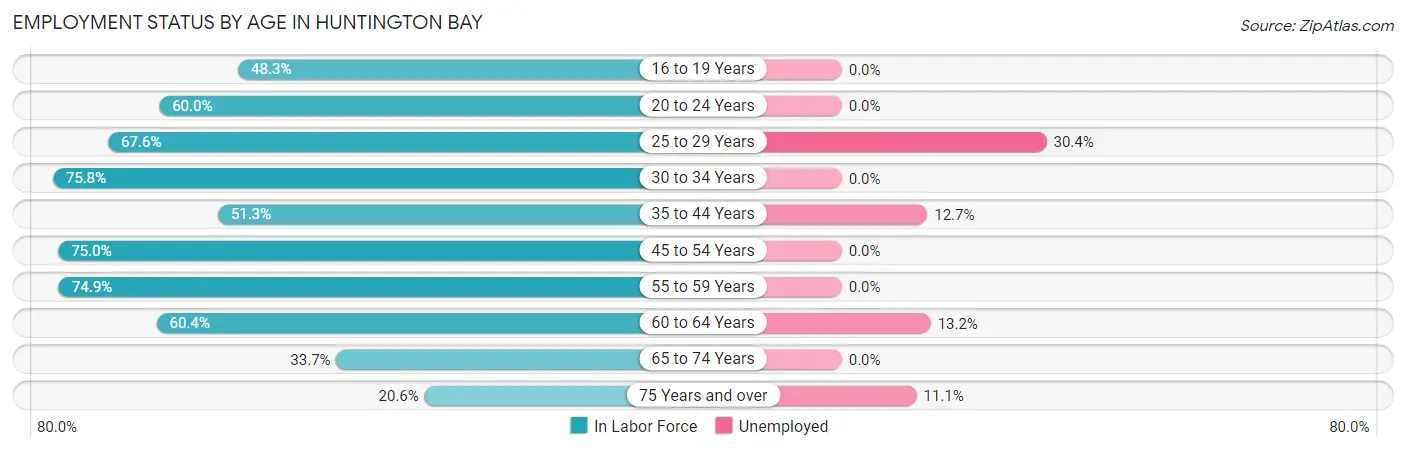
| Age Bracket | In Labor Force | Unemployed |
| 16 to 19 Years | 28 (48.3%) | 0 (0.0%) |
| 20 to 24 Years | 30 (60.0%) | 0 (0.0%) |
| 25 to 29 Years | 23 (67.6%) | 7 (30.4%) |
| 30 to 34 Years | 25 (75.8%) | 0 (0.0%) |
| 35 to 44 Years | 79 (51.3%) | 10 (12.7%) |
| 45 to 54 Years | 165 (75.0%) | 0 (0.0%) |
| 55 to 59 Years | 140 (74.9%) | 0 (0.0%) |
| 60 to 64 Years | 197 (60.4%) | 26 (13.2%) |
| 65 to 74 Years | 91 (33.7%) | 0 (0.0%) |
| 75 Years and over | 36 (20.6%) | 4 (11.1%) |
| Total | 814 (54.0%) | 47 (5.8%) |
Employment Status by Educational Attainment in Huntington Bay
According to labor force statistics for Huntington Bay, 65.9% of individuals (629) out of the total population between 25 and 64 years of age (954) are in the labor force, with 6.8% or 43 of them being unemployed. The group with the highest labor force participation rate are those with the educational attainment of high school diploma, with 72.7% or 40 individuals in the labor force. Within the labor force, individuals with college / associate degree education have the highest percentage of unemployment, with 29.6% or 16 of them being unemployed.
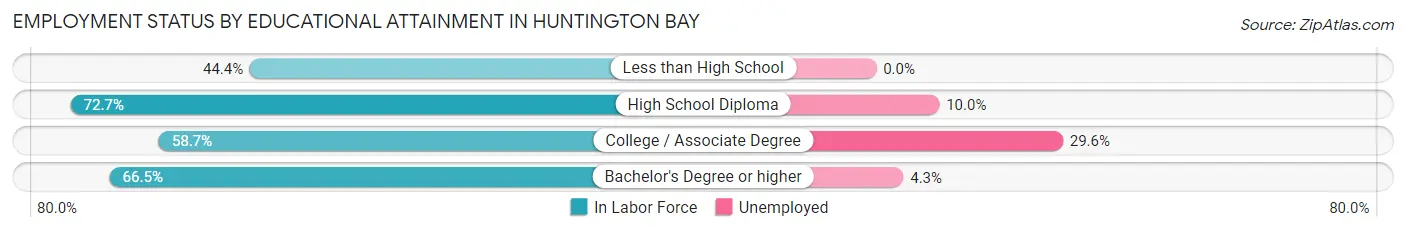
| Educational Attainment | In Labor Force | Unemployed |
| Less than High School | 4 (44.4%) | 0 (0.0%) |
| High School Diploma | 40 (72.7%) | 6 (10.0%) |
| College / Associate Degree | 54 (58.7%) | 27 (29.6%) |
| Bachelor's Degree or higher | 531 (66.5%) | 34 (4.3%) |
| Total | 629 (65.9%) | 65 (6.8%) |
Employment Occupations by Sex in Huntington Bay
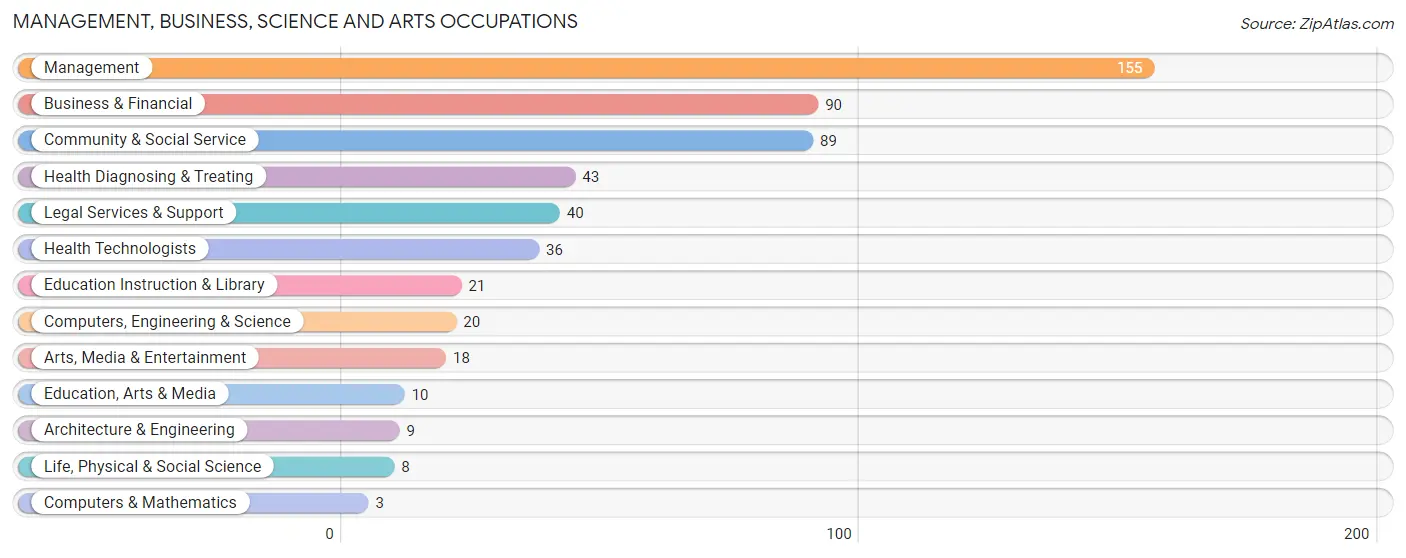
Management, Business, Science and Arts Occupations
The most common Management, Business, Science and Arts occupations in Huntington Bay are Management (155 | 20.2%), Business & Financial (90 | 11.7%), Community & Social Service (89 | 11.6%), Health Diagnosing & Treating (43 | 5.6%), and Legal Services & Support (40 | 5.2%).
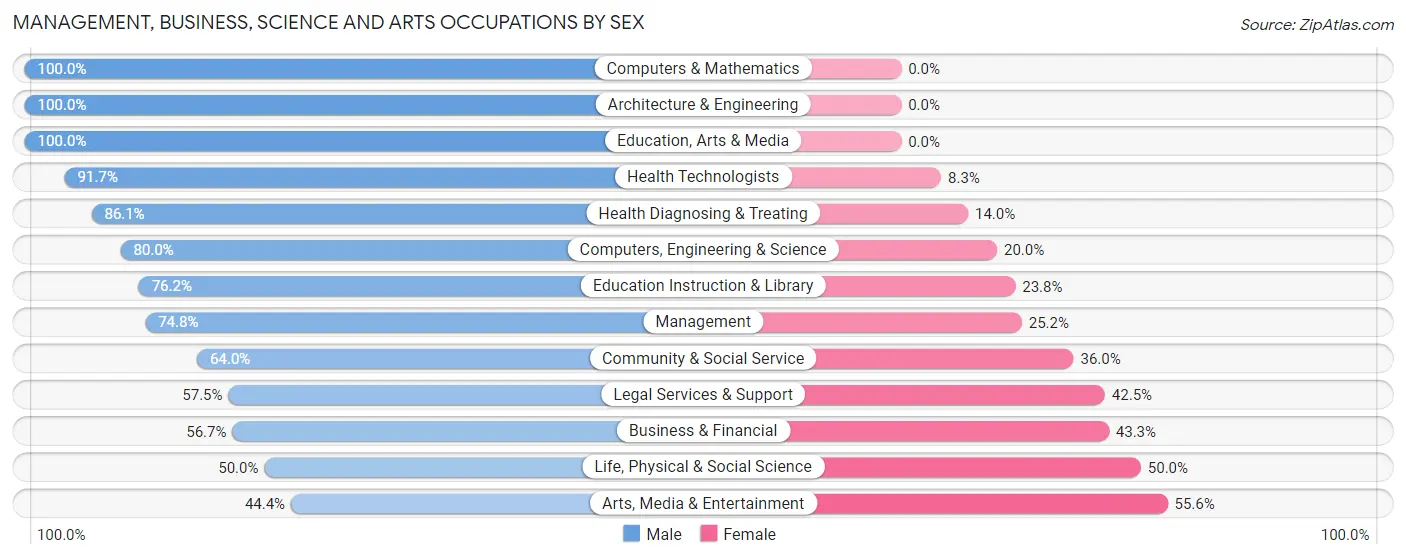
Management, Business, Science and Arts Occupations by Sex
Within the Management, Business, Science and Arts occupations in Huntington Bay, the most male-oriented occupations are Computers & Mathematics (100.0%), Architecture & Engineering (100.0%), and Education, Arts & Media (100.0%), while the most female-oriented occupations are Arts, Media & Entertainment (55.6%), Life, Physical & Social Science (50.0%), and Business & Financial (43.3%).
| Occupation | Male | Female |
| Management | 116 (74.8%) | 39 (25.2%) |
| Business & Financial | 51 (56.7%) | 39 (43.3%) |
| Computers, Engineering & Science | 16 (80.0%) | 4 (20.0%) |
| Computers & Mathematics | 3 (100.0%) | 0 (0.0%) |
| Architecture & Engineering | 9 (100.0%) | 0 (0.0%) |
| Life, Physical & Social Science | 4 (50.0%) | 4 (50.0%) |
| Community & Social Service | 57 (64.0%) | 32 (36.0%) |
| Education, Arts & Media | 10 (100.0%) | 0 (0.0%) |
| Legal Services & Support | 23 (57.5%) | 17 (42.5%) |
| Education Instruction & Library | 16 (76.2%) | 5 (23.8%) |
| Arts, Media & Entertainment | 8 (44.4%) | 10 (55.6%) |
| Health Diagnosing & Treating | 37 (86.1%) | 6 (14.0%) |
| Health Technologists | 33 (91.7%) | 3 (8.3%) |
| Total (Category) | 277 (69.8%) | 120 (30.2%) |
| Total (Overall) | 524 (68.3%) | 243 (31.7%) |
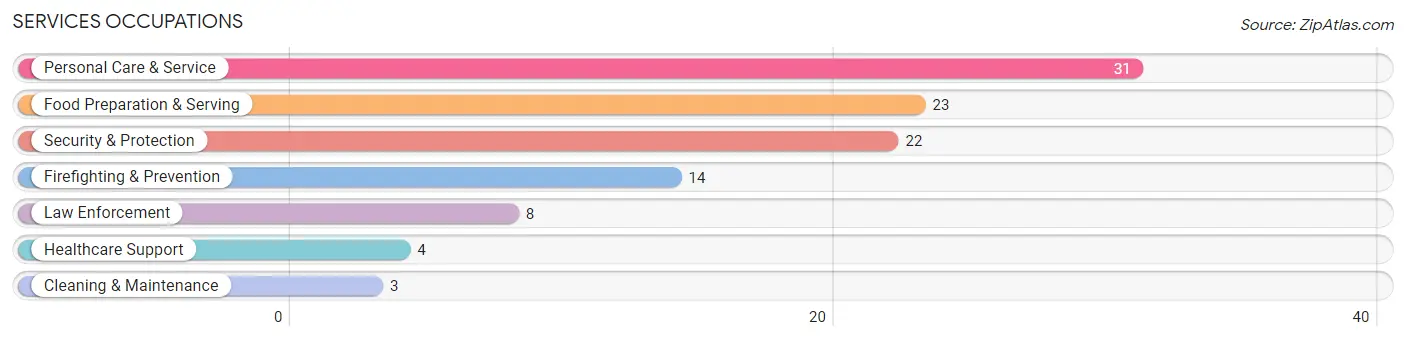
Services Occupations
The most common Services occupations in Huntington Bay are Personal Care & Service (31 | 4.0%), Food Preparation & Serving (23 | 3.0%), Security & Protection (22 | 2.9%), Firefighting & Prevention (14 | 1.8%), and Law Enforcement (8 | 1.0%).
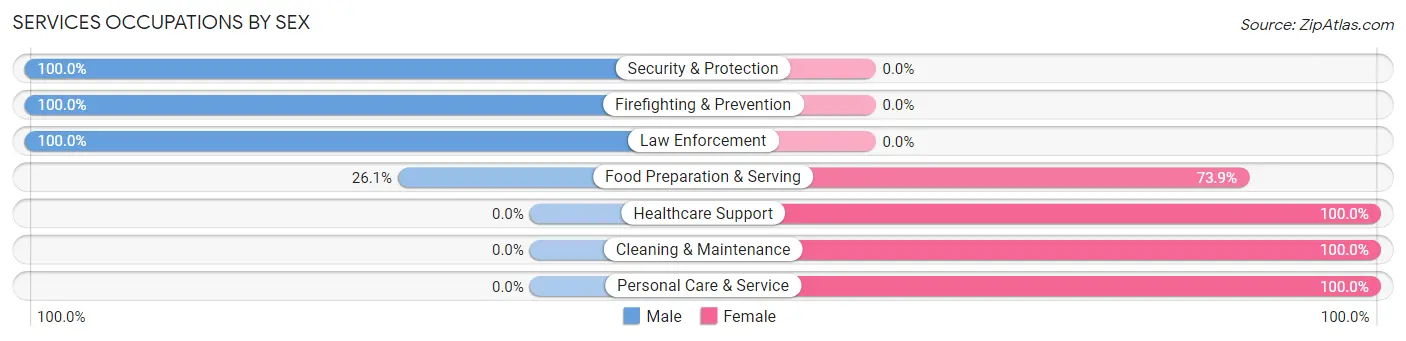
Services Occupations by Sex
Within the Services occupations in Huntington Bay, the most male-oriented occupations are Security & Protection (100.0%), Firefighting & Prevention (100.0%), and Law Enforcement (100.0%), while the most female-oriented occupations are Healthcare Support (100.0%), Cleaning & Maintenance (100.0%), and Personal Care & Service (100.0%).
| Occupation | Male | Female |
| Healthcare Support | 0 (0.0%) | 4 (100.0%) |
| Security & Protection | 22 (100.0%) | 0 (0.0%) |
| Firefighting & Prevention | 14 (100.0%) | 0 (0.0%) |
| Law Enforcement | 8 (100.0%) | 0 (0.0%) |
| Food Preparation & Serving | 6 (26.1%) | 17 (73.9%) |
| Cleaning & Maintenance | 0 (0.0%) | 3 (100.0%) |
| Personal Care & Service | 0 (0.0%) | 31 (100.0%) |
| Total (Category) | 28 (33.7%) | 55 (66.3%) |
| Total (Overall) | 524 (68.3%) | 243 (31.7%) |
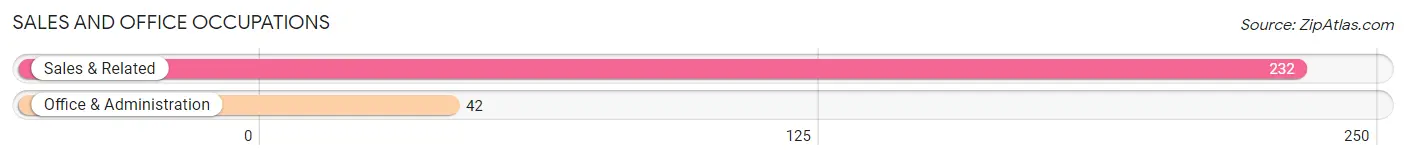
Sales and Office Occupations
The most common Sales and Office occupations in Huntington Bay are Sales & Related (232 | 30.2%), and Office & Administration (42 | 5.5%).
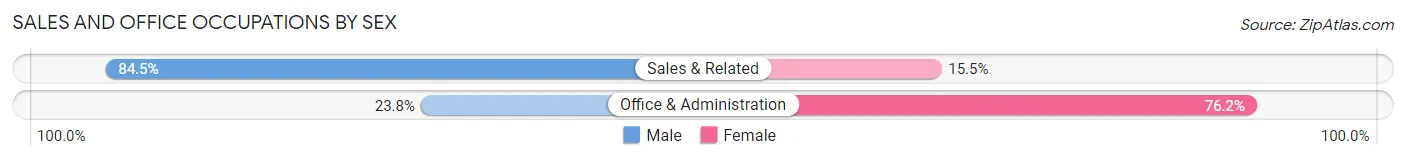
Sales and Office Occupations by Sex
| Occupation | Male | Female |
| Sales & Related | 196 (84.5%) | 36 (15.5%) |
| Office & Administration | 10 (23.8%) | 32 (76.2%) |
| Total (Category) | 206 (75.2%) | 68 (24.8%) |
| Total (Overall) | 524 (68.3%) | 243 (31.7%) |
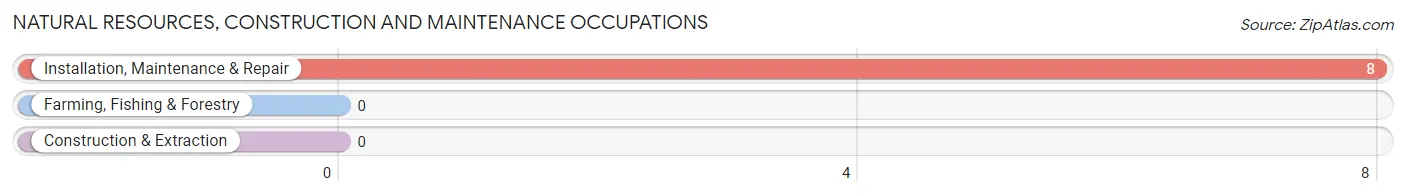
Natural Resources, Construction and Maintenance Occupations
The most common Natural Resources, Construction and Maintenance occupations in Huntington Bay are , and Installation, Maintenance & Repair (8 | 1.0%).
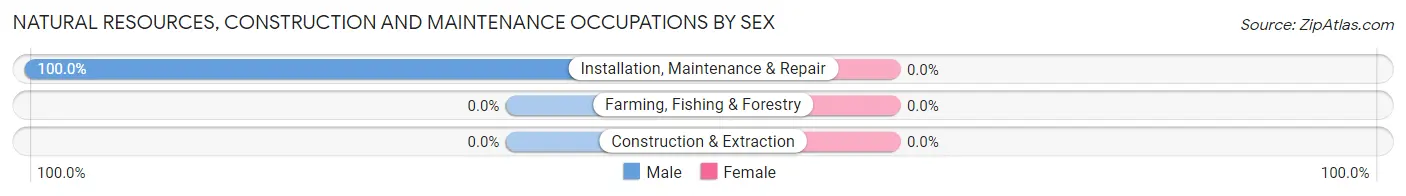
Natural Resources, Construction and Maintenance Occupations by Sex
| Occupation | Male | Female |
| Farming, Fishing & Forestry | 0 (0.0%) | 0 (0.0%) |
| Construction & Extraction | 0 (0.0%) | 0 (0.0%) |
| Installation, Maintenance & Repair | 8 (100.0%) | 0 (0.0%) |
| Total (Category) | 8 (100.0%) | 0 (0.0%) |
| Total (Overall) | 524 (68.3%) | 243 (31.7%) |
Production, Transportation and Moving Occupations
The most common Production, Transportation and Moving occupations in Huntington Bay are , and Transportation (5 | 0.6%).
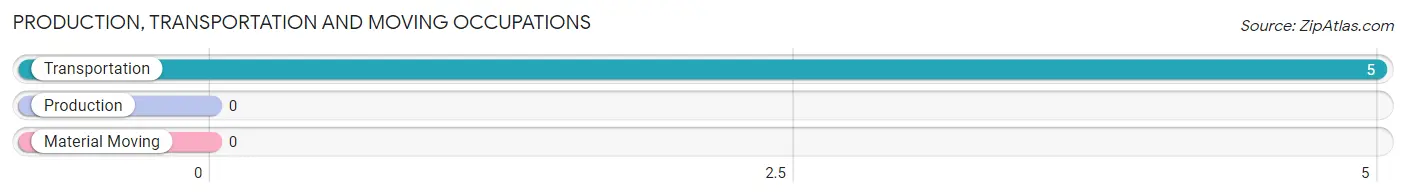
Production, Transportation and Moving Occupations by Sex
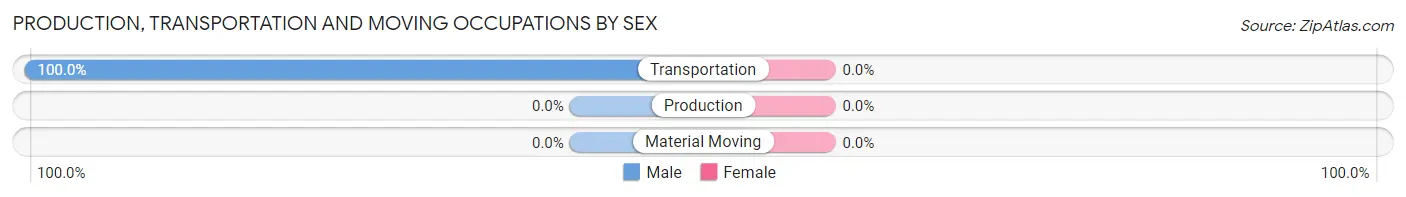
| Occupation | Male | Female |
| Production | 0 (0.0%) | 0 (0.0%) |
| Transportation | 5 (100.0%) | 0 (0.0%) |
| Material Moving | 0 (0.0%) | 0 (0.0%) |
| Total (Category) | 5 (100.0%) | 0 (0.0%) |
| Total (Overall) | 524 (68.3%) | 243 (31.7%) |
Employment Industries by Sex in Huntington Bay
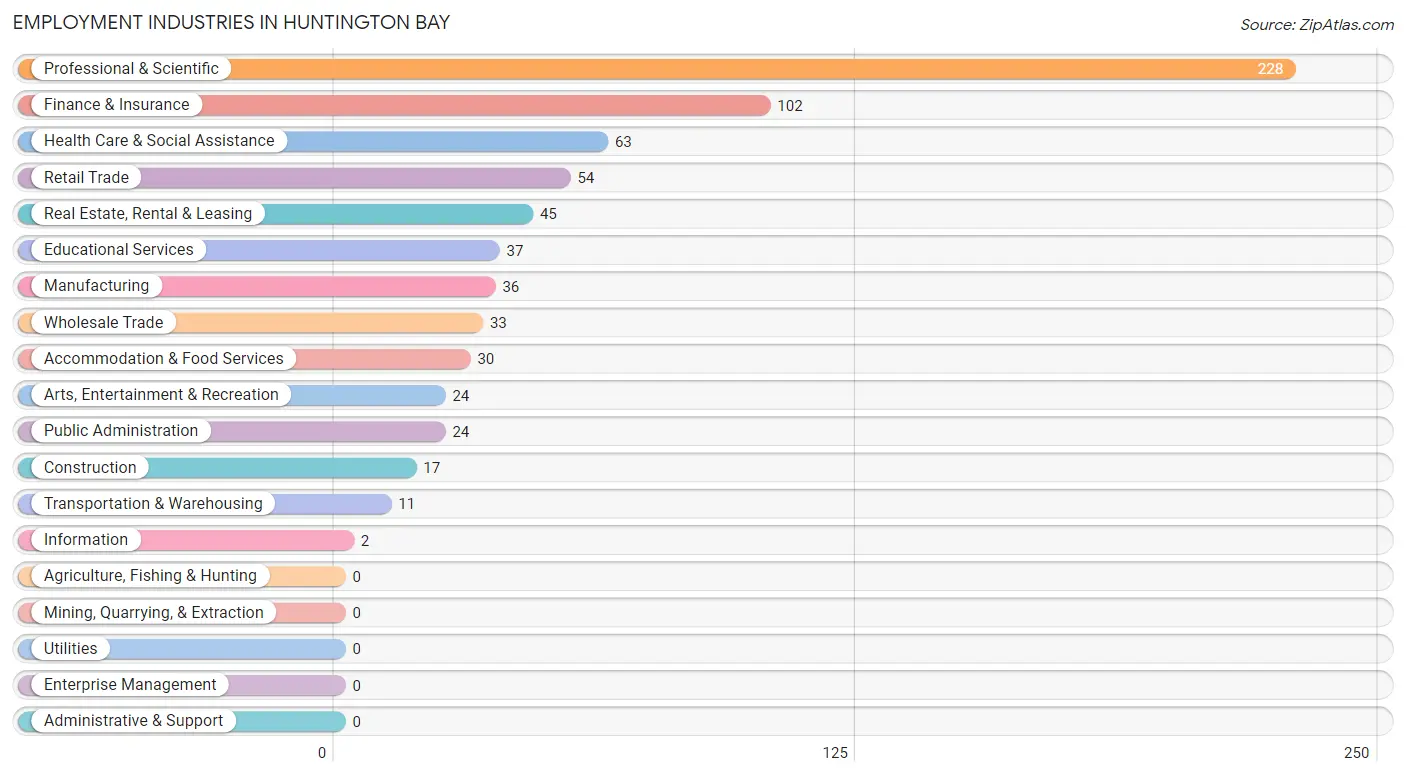
Employment Industries in Huntington Bay
The major employment industries in Huntington Bay include Professional & Scientific (228 | 29.7%), Finance & Insurance (102 | 13.3%), Health Care & Social Assistance (63 | 8.2%), Retail Trade (54 | 7.0%), and Real Estate, Rental & Leasing (45 | 5.9%).
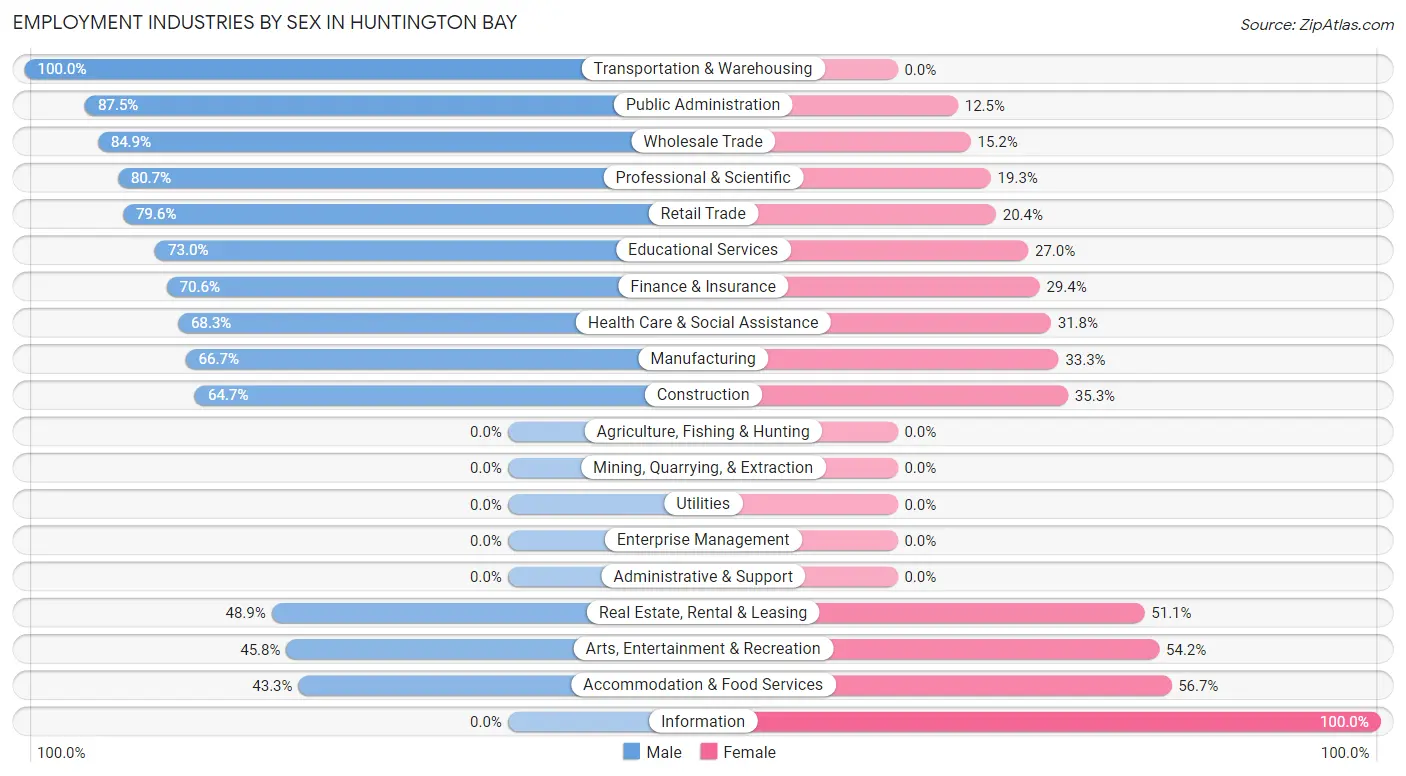
Employment Industries by Sex in Huntington Bay
The Huntington Bay industries that see more men than women are Transportation & Warehousing (100.0%), Public Administration (87.5%), and Wholesale Trade (84.9%), whereas the industries that tend to have a higher number of women are Information (100.0%), Accommodation & Food Services (56.7%), and Arts, Entertainment & Recreation (54.2%).
| Industry | Male | Female |
| Agriculture, Fishing & Hunting | 0 (0.0%) | 0 (0.0%) |
| Mining, Quarrying, & Extraction | 0 (0.0%) | 0 (0.0%) |
| Construction | 11 (64.7%) | 6 (35.3%) |
| Manufacturing | 24 (66.7%) | 12 (33.3%) |
| Wholesale Trade | 28 (84.9%) | 5 (15.1%) |
| Retail Trade | 43 (79.6%) | 11 (20.4%) |
| Transportation & Warehousing | 11 (100.0%) | 0 (0.0%) |
| Utilities | 0 (0.0%) | 0 (0.0%) |
| Information | 0 (0.0%) | 2 (100.0%) |
| Finance & Insurance | 72 (70.6%) | 30 (29.4%) |
| Real Estate, Rental & Leasing | 22 (48.9%) | 23 (51.1%) |
| Professional & Scientific | 184 (80.7%) | 44 (19.3%) |
| Enterprise Management | 0 (0.0%) | 0 (0.0%) |
| Administrative & Support | 0 (0.0%) | 0 (0.0%) |
| Educational Services | 27 (73.0%) | 10 (27.0%) |
| Health Care & Social Assistance | 43 (68.2%) | 20 (31.8%) |
| Arts, Entertainment & Recreation | 11 (45.8%) | 13 (54.2%) |
| Accommodation & Food Services | 13 (43.3%) | 17 (56.7%) |
| Public Administration | 21 (87.5%) | 3 (12.5%) |
| Total | 524 (68.3%) | 243 (31.7%) |
Education in Huntington Bay
School Enrollment in Huntington Bay
The most common levels of schooling among the 313 students in Huntington Bay are high school (87 | 27.8%), middle school (80 | 25.6%), and elementary school (43 | 13.7%).
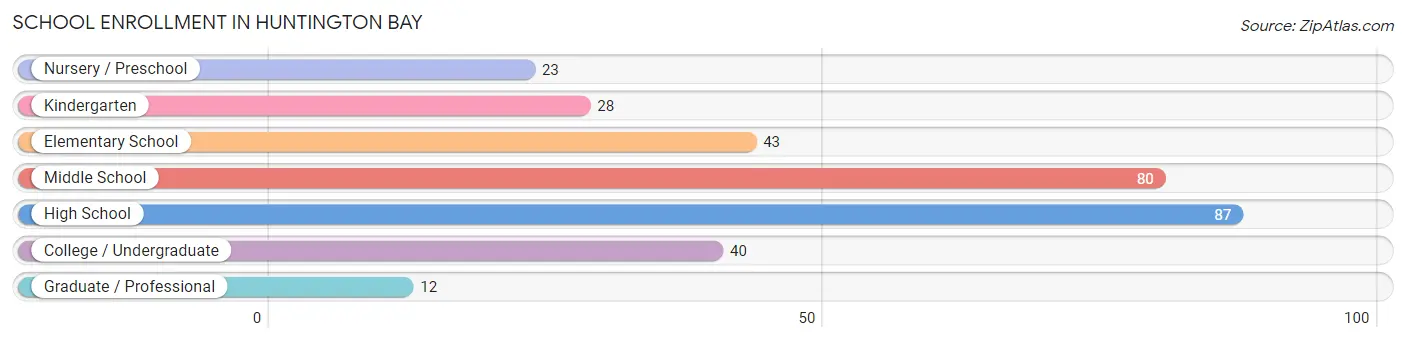
| School Level | # Students | % Students |
| Nursery / Preschool | 23 | 7.3% |
| Kindergarten | 28 | 8.9% |
| Elementary School | 43 | 13.7% |
| Middle School | 80 | 25.6% |
| High School | 87 | 27.8% |
| College / Undergraduate | 40 | 12.8% |
| Graduate / Professional | 12 | 3.8% |
| Total | 313 | 100.0% |
School Enrollment by Age by Funding Source in Huntington Bay
Out of a total of 313 students who are enrolled in schools in Huntington Bay, 90 (28.8%) attend a private institution, while the remaining 223 (71.2%) are enrolled in public schools. The age group of 3 to 4 year olds has the highest likelihood of being enrolled in private schools, with 18 (90.0% in the age bracket) enrolled. Conversely, the age group of 5 to 9 year old has the lowest likelihood of being enrolled in a private school, with 62 (88.6% in the age bracket) attending a public institution.
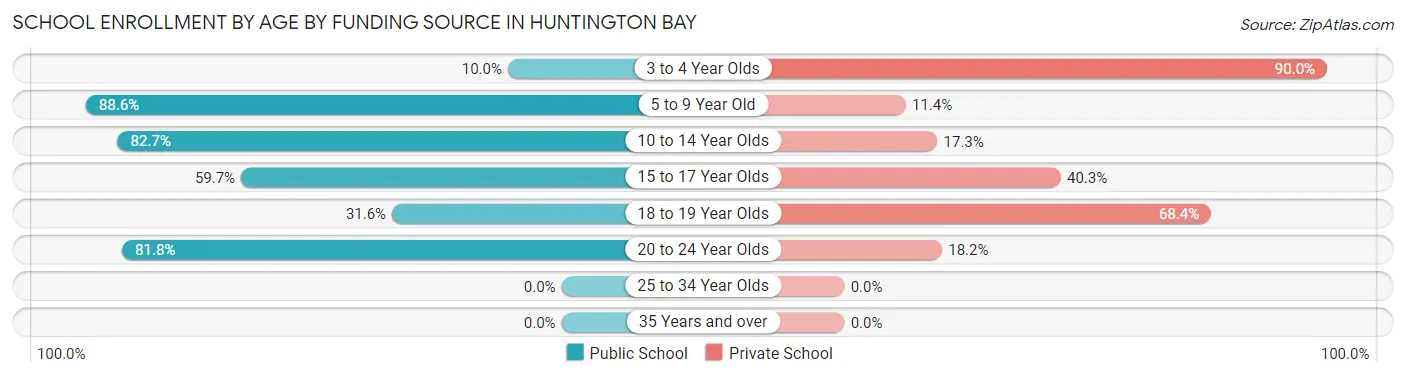
| Age Bracket | Public School | Private School |
| 3 to 4 Year Olds | 2 (10.0%) | 18 (90.0%) |
| 5 to 9 Year Old | 62 (88.6%) | 8 (11.4%) |
| 10 to 14 Year Olds | 86 (82.7%) | 18 (17.3%) |
| 15 to 17 Year Olds | 40 (59.7%) | 27 (40.3%) |
| 18 to 19 Year Olds | 6 (31.6%) | 13 (68.4%) |
| 20 to 24 Year Olds | 27 (81.8%) | 6 (18.2%) |
| 25 to 34 Year Olds | 0 (0.0%) | 0 (0.0%) |
| 35 Years and over | 0 (0.0%) | 0 (0.0%) |
| Total | 223 (71.2%) | 90 (28.8%) |
Educational Attainment by Field of Study in Huntington Bay
Social sciences (365 | 29.4%), business (230 | 18.5%), science & technology (102 | 8.2%), education (87 | 7.0%), and bio, nature & agricultural (77 | 6.2%) are the most common fields of study among 1,243 individuals in Huntington Bay who have obtained a bachelor's degree or higher.
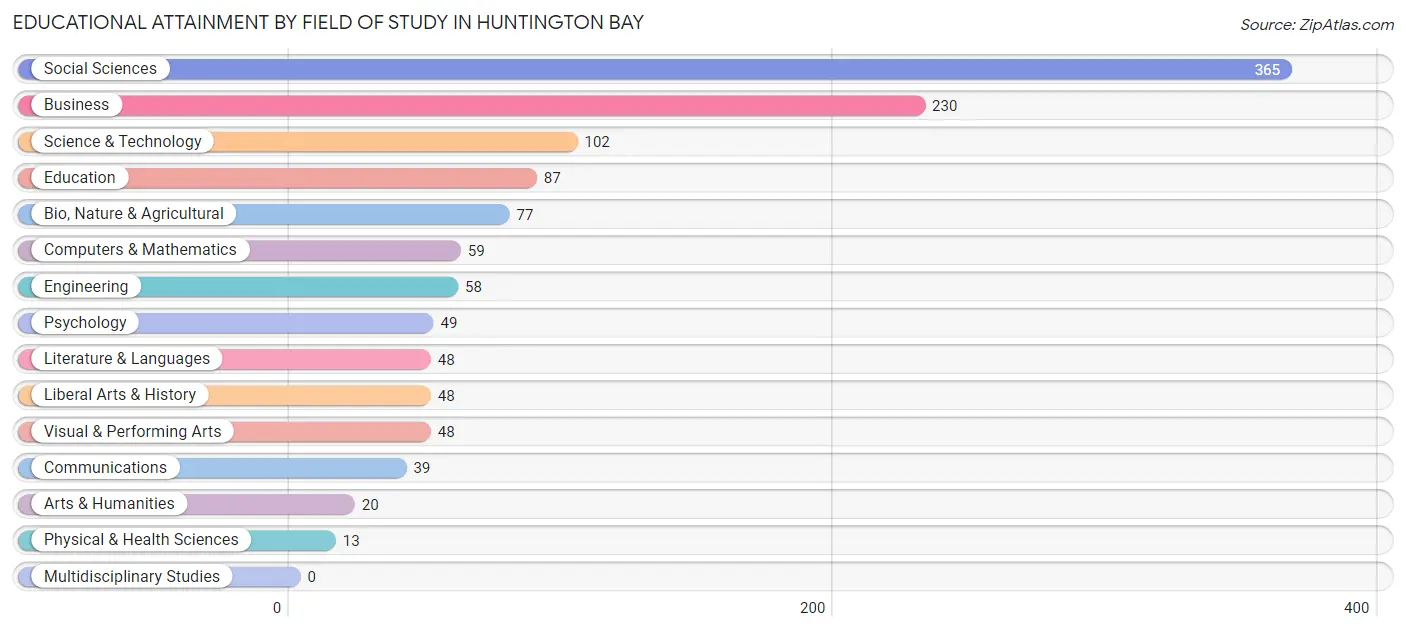
| Field of Study | # Graduates | % Graduates |
| Computers & Mathematics | 59 | 4.8% |
| Bio, Nature & Agricultural | 77 | 6.2% |
| Physical & Health Sciences | 13 | 1.1% |
| Psychology | 49 | 3.9% |
| Social Sciences | 365 | 29.4% |
| Engineering | 58 | 4.7% |
| Multidisciplinary Studies | 0 | 0.0% |
| Science & Technology | 102 | 8.2% |
| Business | 230 | 18.5% |
| Education | 87 | 7.0% |
| Literature & Languages | 48 | 3.9% |
| Liberal Arts & History | 48 | 3.9% |
| Visual & Performing Arts | 48 | 3.9% |
| Communications | 39 | 3.1% |
| Arts & Humanities | 20 | 1.6% |
| Total | 1,243 | 100.0% |
Transportation & Commute in Huntington Bay
Vehicle Availability by Sex in Huntington Bay
The most prevalent vehicle ownership categories in Huntington Bay are males with 2 vehicles (326, accounting for 62.2%) and females with 2 vehicles (88, making up 134.2%).
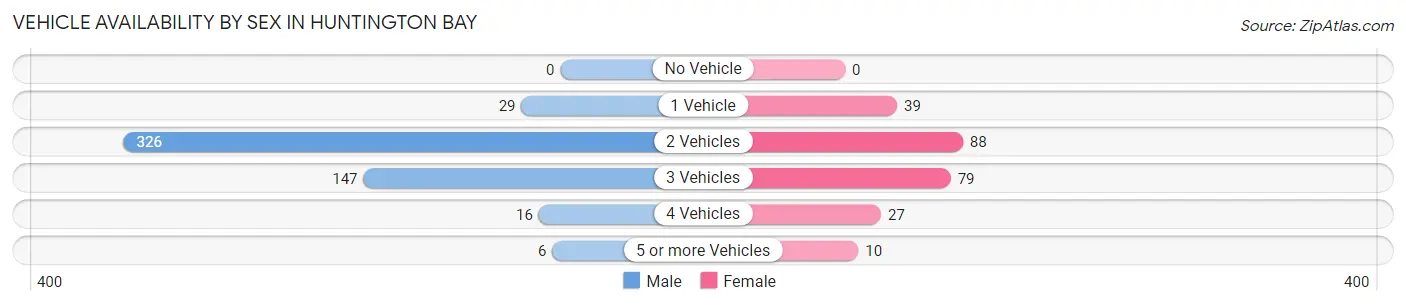
| Vehicles Available | Male | Female |
| No Vehicle | 0 (0.0%) | 0 (0.0%) |
| 1 Vehicle | 29 (5.5%) | 39 (16.1%) |
| 2 Vehicles | 326 (62.2%) | 88 (36.2%) |
| 3 Vehicles | 147 (28.1%) | 79 (32.5%) |
| 4 Vehicles | 16 (3.0%) | 27 (11.1%) |
| 5 or more Vehicles | 6 (1.1%) | 10 (4.1%) |
| Total | 524 (100.0%) | 243 (100.0%) |
Commute Time in Huntington Bay
The most frequently occuring commute durations in Huntington Bay are 60 to 89 minutes (87 commuters, 16.5%), 5 to 9 minutes (73 commuters, 13.8%), and 30 to 34 minutes (62 commuters, 11.7%).
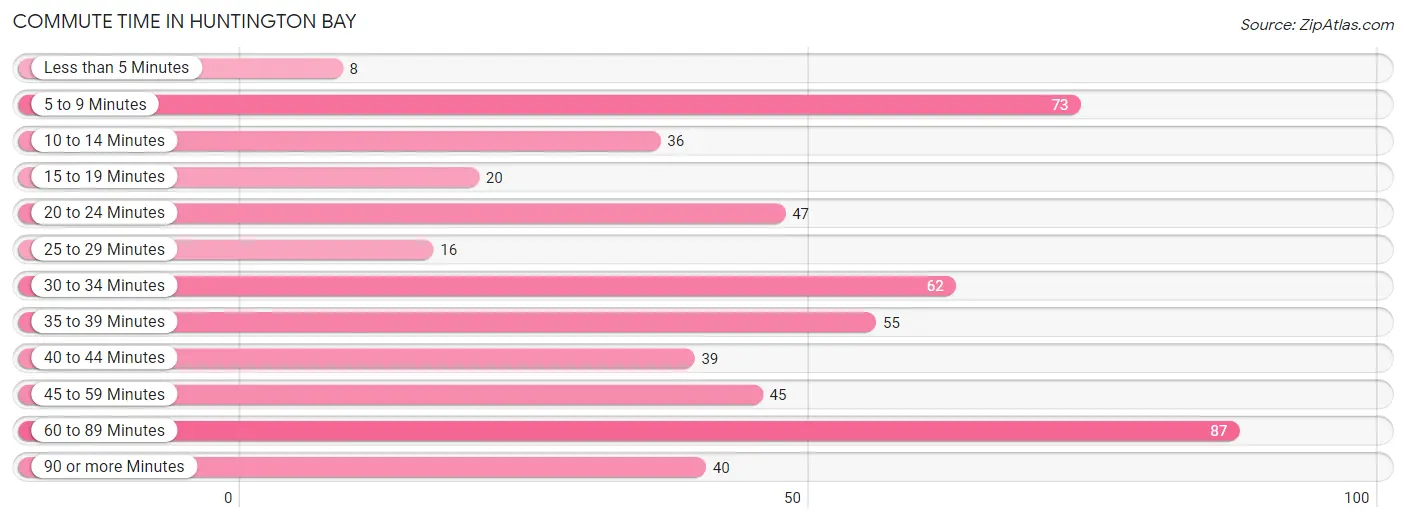
| Commute Time | # Commuters | % Commuters |
| Less than 5 Minutes | 8 | 1.5% |
| 5 to 9 Minutes | 73 | 13.8% |
| 10 to 14 Minutes | 36 | 6.8% |
| 15 to 19 Minutes | 20 | 3.8% |
| 20 to 24 Minutes | 47 | 8.9% |
| 25 to 29 Minutes | 16 | 3.0% |
| 30 to 34 Minutes | 62 | 11.7% |
| 35 to 39 Minutes | 55 | 10.4% |
| 40 to 44 Minutes | 39 | 7.4% |
| 45 to 59 Minutes | 45 | 8.5% |
| 60 to 89 Minutes | 87 | 16.5% |
| 90 or more Minutes | 40 | 7.6% |
Commute Time by Sex in Huntington Bay
The most common commute times in Huntington Bay are 60 to 89 minutes (74 commuters, 20.1%) for males and 5 to 9 minutes (34 commuters, 21.4%) for females.
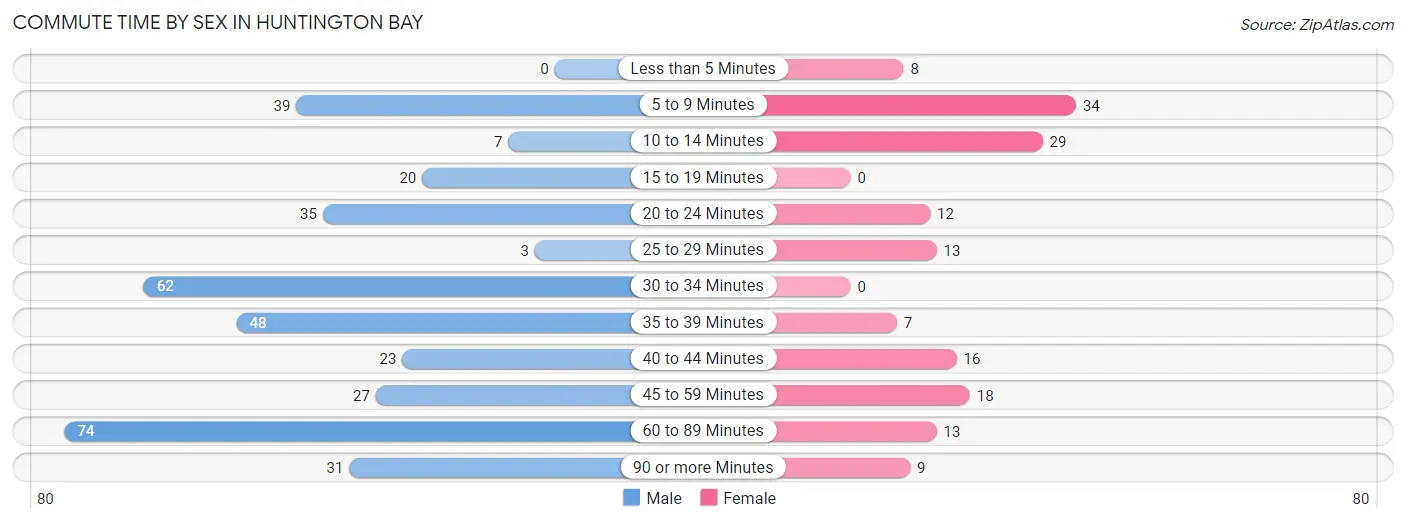
| Commute Time | Male | Female |
| Less than 5 Minutes | 0 (0.0%) | 8 (5.0%) |
| 5 to 9 Minutes | 39 (10.6%) | 34 (21.4%) |
| 10 to 14 Minutes | 7 (1.9%) | 29 (18.2%) |
| 15 to 19 Minutes | 20 (5.4%) | 0 (0.0%) |
| 20 to 24 Minutes | 35 (9.5%) | 12 (7.5%) |
| 25 to 29 Minutes | 3 (0.8%) | 13 (8.2%) |
| 30 to 34 Minutes | 62 (16.8%) | 0 (0.0%) |
| 35 to 39 Minutes | 48 (13.0%) | 7 (4.4%) |
| 40 to 44 Minutes | 23 (6.2%) | 16 (10.1%) |
| 45 to 59 Minutes | 27 (7.3%) | 18 (11.3%) |
| 60 to 89 Minutes | 74 (20.1%) | 13 (8.2%) |
| 90 or more Minutes | 31 (8.4%) | 9 (5.7%) |
Time of Departure to Work by Sex in Huntington Bay
The most frequent times of departure to work in Huntington Bay are 7:00 AM to 7:29 AM (102, 27.6%) for males and 8:00 AM to 8:29 AM (46, 28.9%) for females.
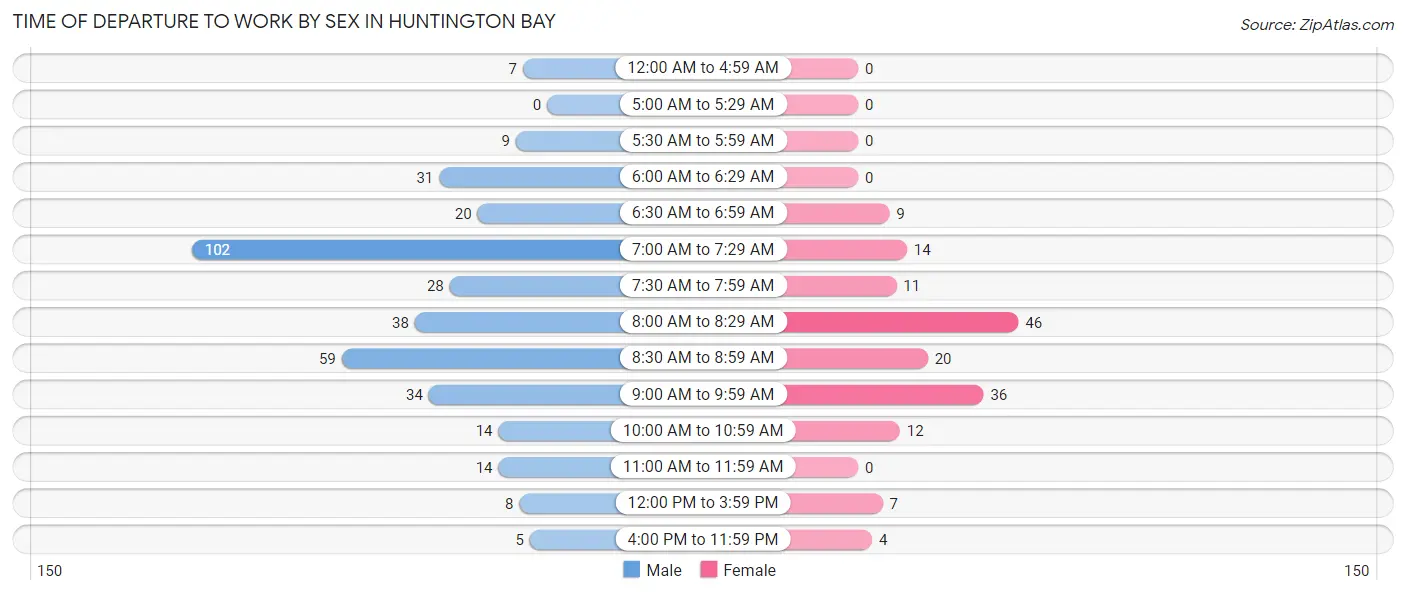
| Time of Departure | Male | Female |
| 12:00 AM to 4:59 AM | 7 (1.9%) | 0 (0.0%) |
| 5:00 AM to 5:29 AM | 0 (0.0%) | 0 (0.0%) |
| 5:30 AM to 5:59 AM | 9 (2.4%) | 0 (0.0%) |
| 6:00 AM to 6:29 AM | 31 (8.4%) | 0 (0.0%) |
| 6:30 AM to 6:59 AM | 20 (5.4%) | 9 (5.7%) |
| 7:00 AM to 7:29 AM | 102 (27.6%) | 14 (8.8%) |
| 7:30 AM to 7:59 AM | 28 (7.6%) | 11 (6.9%) |
| 8:00 AM to 8:29 AM | 38 (10.3%) | 46 (28.9%) |
| 8:30 AM to 8:59 AM | 59 (16.0%) | 20 (12.6%) |
| 9:00 AM to 9:59 AM | 34 (9.2%) | 36 (22.6%) |
| 10:00 AM to 10:59 AM | 14 (3.8%) | 12 (7.5%) |
| 11:00 AM to 11:59 AM | 14 (3.8%) | 0 (0.0%) |
| 12:00 PM to 3:59 PM | 8 (2.2%) | 7 (4.4%) |
| 4:00 PM to 11:59 PM | 5 (1.4%) | 4 (2.5%) |
| Total | 369 (100.0%) | 159 (100.0%) |
Housing Occupancy in Huntington Bay
Occupancy by Ownership in Huntington Bay
Of the total 713 dwellings in Huntington Bay, owner-occupied units account for 705 (98.9%), while renter-occupied units make up 8 (1.1%).
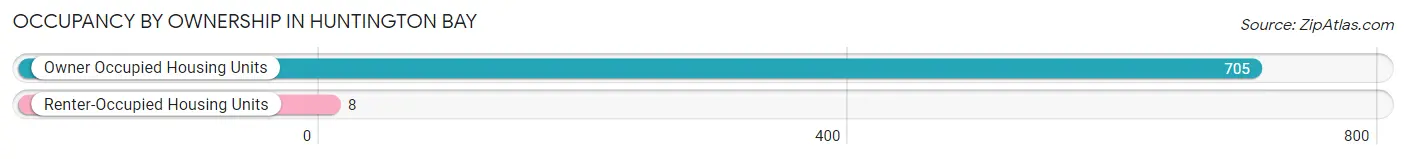
| Occupancy | # Housing Units | % Housing Units |
| Owner Occupied Housing Units | 705 | 98.9% |
| Renter-Occupied Housing Units | 8 | 1.1% |
| Total Occupied Housing Units | 713 | 100.0% |
Occupancy by Household Size in Huntington Bay
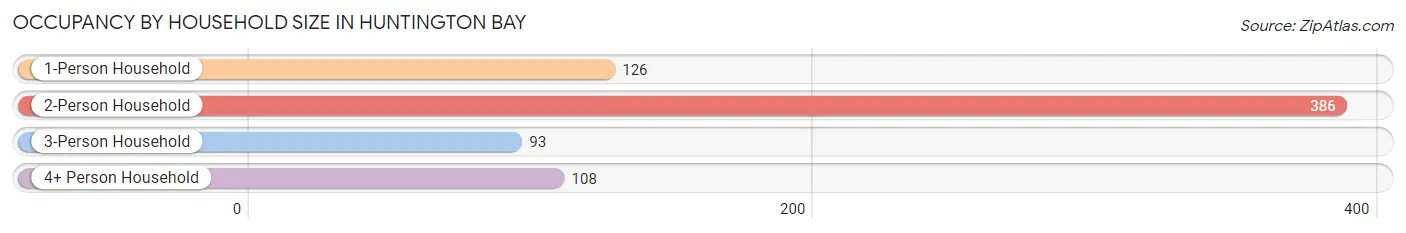
| Household Size | # Housing Units | % Housing Units |
| 1-Person Household | 126 | 17.7% |
| 2-Person Household | 386 | 54.1% |
| 3-Person Household | 93 | 13.0% |
| 4+ Person Household | 108 | 15.1% |
| Total Housing Units | 713 | 100.0% |
Occupancy by Ownership by Household Size in Huntington Bay
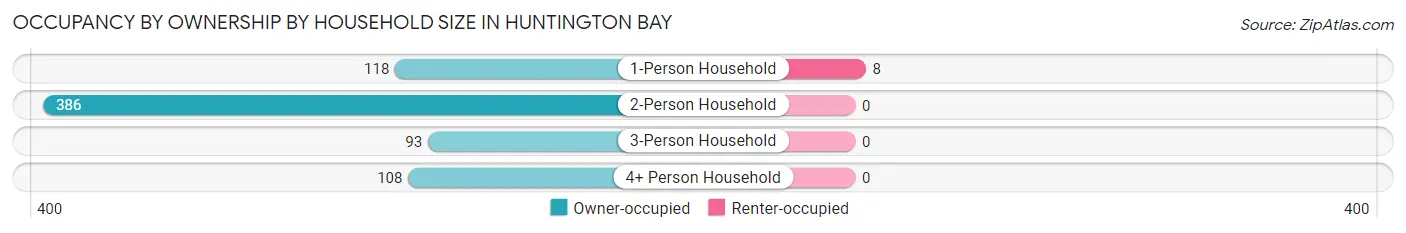
| Household Size | Owner-occupied | Renter-occupied |
| 1-Person Household | 118 (93.6%) | 8 (6.4%) |
| 2-Person Household | 386 (100.0%) | 0 (0.0%) |
| 3-Person Household | 93 (100.0%) | 0 (0.0%) |
| 4+ Person Household | 108 (100.0%) | 0 (0.0%) |
| Total Housing Units | 705 (98.9%) | 8 (1.1%) |
Occupancy by Educational Attainment in Huntington Bay
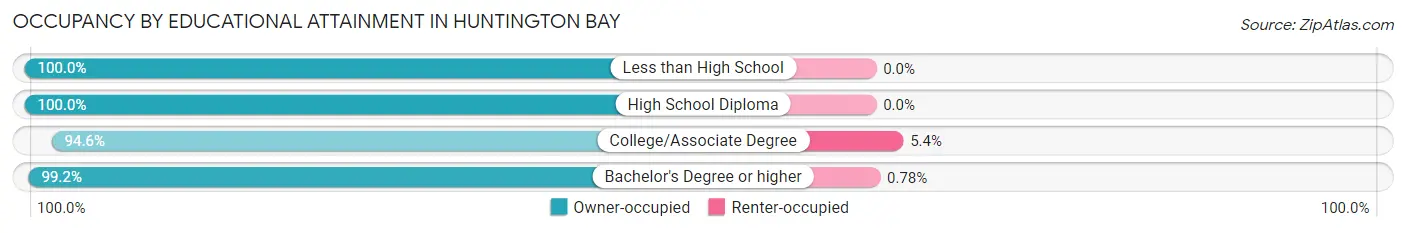
| Household Size | Owner-occupied | Renter-occupied |
| Less than High School | 4 (100.0%) | 0 (0.0%) |
| High School Diploma | 15 (100.0%) | 0 (0.0%) |
| College/Associate Degree | 53 (94.6%) | 3 (5.4%) |
| Bachelor's Degree or higher | 633 (99.2%) | 5 (0.8%) |
Occupancy by Age of Householder in Huntington Bay
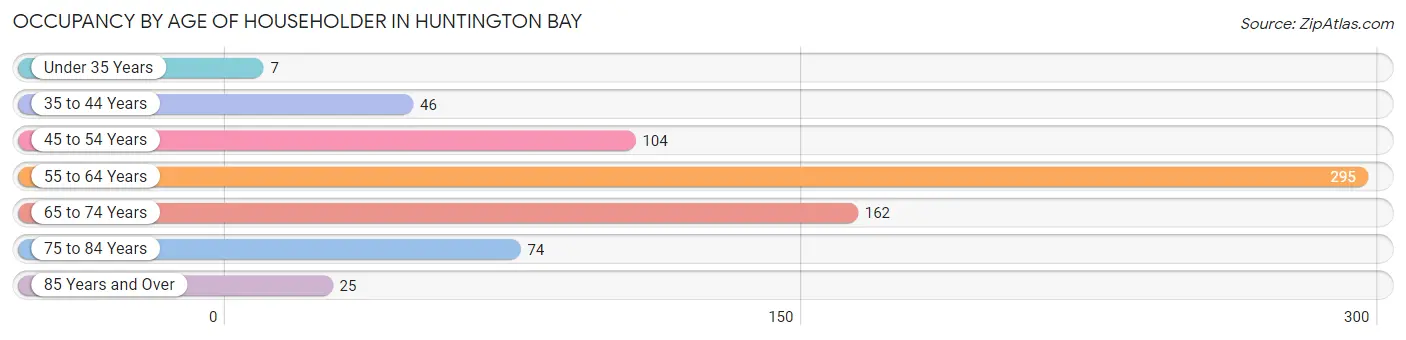
| Age Bracket | # Households | % Households |
| Under 35 Years | 7 | 1.0% |
| 35 to 44 Years | 46 | 6.5% |
| 45 to 54 Years | 104 | 14.6% |
| 55 to 64 Years | 295 | 41.4% |
| 65 to 74 Years | 162 | 22.7% |
| 75 to 84 Years | 74 | 10.4% |
| 85 Years and Over | 25 | 3.5% |
| Total | 713 | 100.0% |
Housing Finances in Huntington Bay
Median Income by Occupancy in Huntington Bay
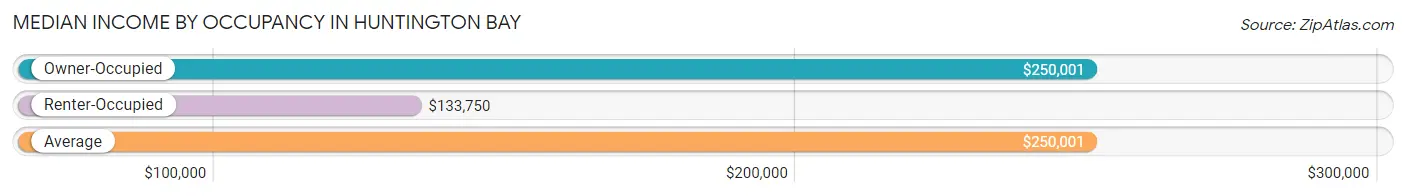
| Occupancy Type | # Households | Median Income |
| Owner-Occupied | 705 (98.9%) | $250,001 |
| Renter-Occupied | 8 (1.1%) | $133,750 |
| Average | 713 (100.0%) | $250,001 |
Occupancy by Householder Income Bracket in Huntington Bay
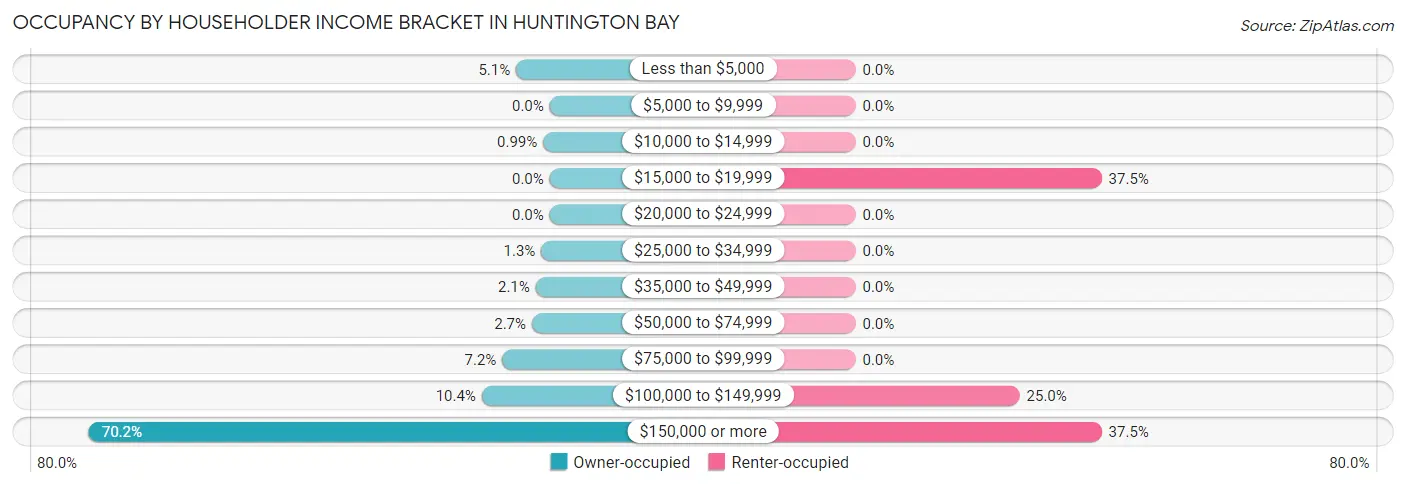
| Income Bracket | Owner-occupied | Renter-occupied |
| Less than $5,000 | 36 (5.1%) | 0 (0.0%) |
| $5,000 to $9,999 | 0 (0.0%) | 0 (0.0%) |
| $10,000 to $14,999 | 7 (1.0%) | 0 (0.0%) |
| $15,000 to $19,999 | 0 (0.0%) | 3 (37.5%) |
| $20,000 to $24,999 | 0 (0.0%) | 0 (0.0%) |
| $25,000 to $34,999 | 9 (1.3%) | 0 (0.0%) |
| $35,000 to $49,999 | 15 (2.1%) | 0 (0.0%) |
| $50,000 to $74,999 | 19 (2.7%) | 0 (0.0%) |
| $75,000 to $99,999 | 51 (7.2%) | 0 (0.0%) |
| $100,000 to $149,999 | 73 (10.3%) | 2 (25.0%) |
| $150,000 or more | 495 (70.2%) | 3 (37.5%) |
| Total | 705 (100.0%) | 8 (100.0%) |
Monthly Housing Cost Tiers in Huntington Bay
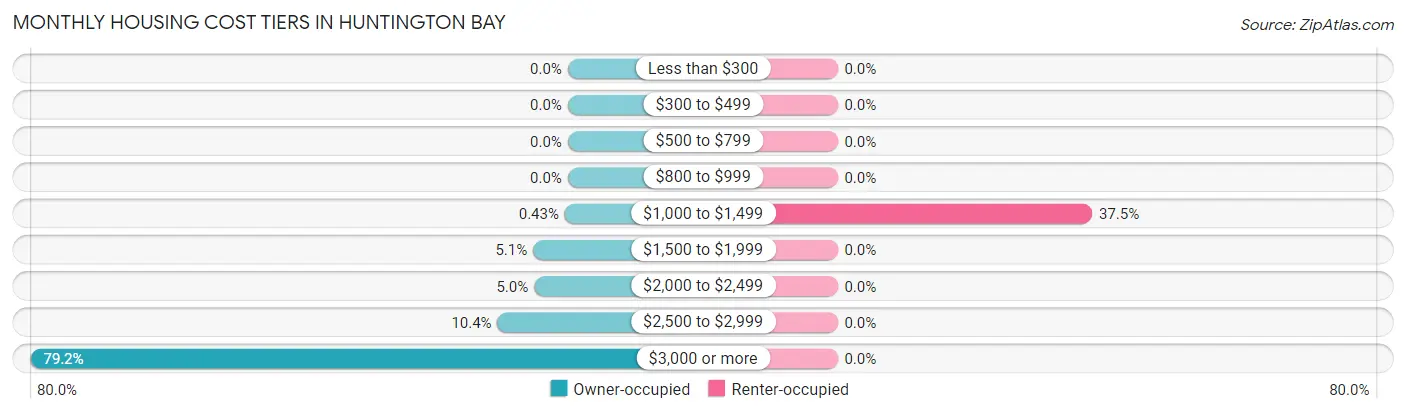
| Monthly Cost | Owner-occupied | Renter-occupied |
| Less than $300 | 0 (0.0%) | 0 (0.0%) |
| $300 to $499 | 0 (0.0%) | 0 (0.0%) |
| $500 to $799 | 0 (0.0%) | 0 (0.0%) |
| $800 to $999 | 0 (0.0%) | 0 (0.0%) |
| $1,000 to $1,499 | 3 (0.4%) | 3 (37.5%) |
| $1,500 to $1,999 | 36 (5.1%) | 0 (0.0%) |
| $2,000 to $2,499 | 35 (5.0%) | 0 (0.0%) |
| $2,500 to $2,999 | 73 (10.3%) | 0 (0.0%) |
| $3,000 or more | 558 (79.1%) | 0 (0.0%) |
| Total | 705 (100.0%) | 8 (100.0%) |
Physical Housing Characteristics in Huntington Bay
Housing Structures in Huntington Bay
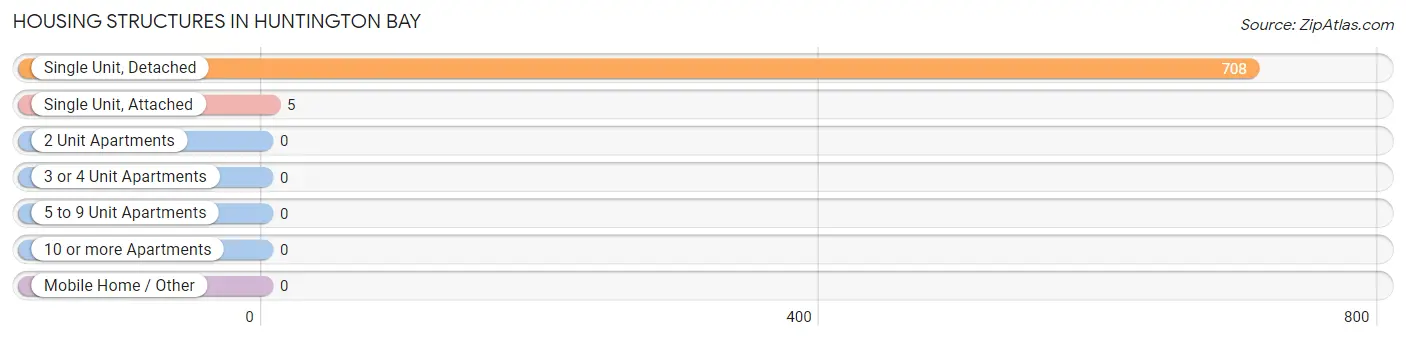
| Structure Type | # Housing Units | % Housing Units |
| Single Unit, Detached | 708 | 99.3% |
| Single Unit, Attached | 5 | 0.7% |
| 2 Unit Apartments | 0 | 0.0% |
| 3 or 4 Unit Apartments | 0 | 0.0% |
| 5 to 9 Unit Apartments | 0 | 0.0% |
| 10 or more Apartments | 0 | 0.0% |
| Mobile Home / Other | 0 | 0.0% |
| Total | 713 | 100.0% |
Housing Structures by Occupancy in Huntington Bay
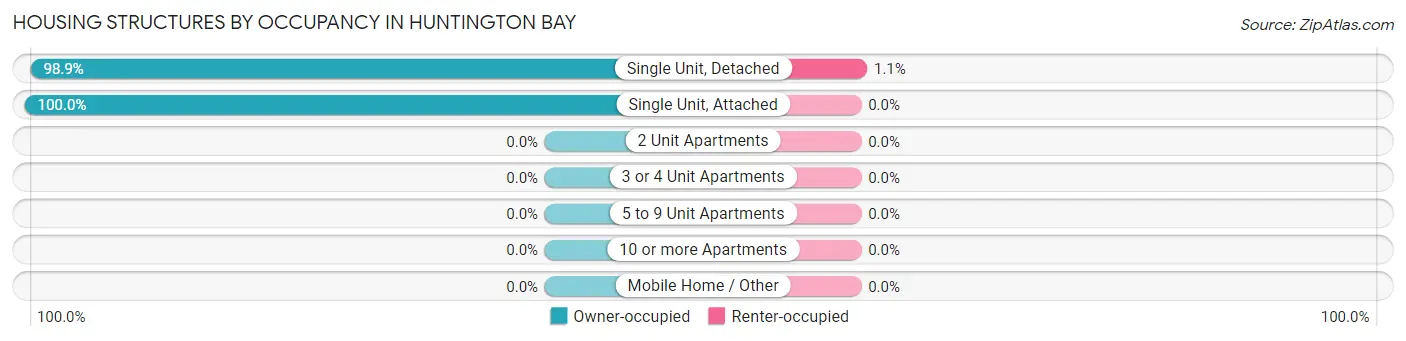
| Structure Type | Owner-occupied | Renter-occupied |
| Single Unit, Detached | 700 (98.9%) | 8 (1.1%) |
| Single Unit, Attached | 5 (100.0%) | 0 (0.0%) |
| 2 Unit Apartments | 0 (0.0%) | 0 (0.0%) |
| 3 or 4 Unit Apartments | 0 (0.0%) | 0 (0.0%) |
| 5 to 9 Unit Apartments | 0 (0.0%) | 0 (0.0%) |
| 10 or more Apartments | 0 (0.0%) | 0 (0.0%) |
| Mobile Home / Other | 0 (0.0%) | 0 (0.0%) |
| Total | 705 (98.9%) | 8 (1.1%) |
Housing Structures by Number of Rooms in Huntington Bay
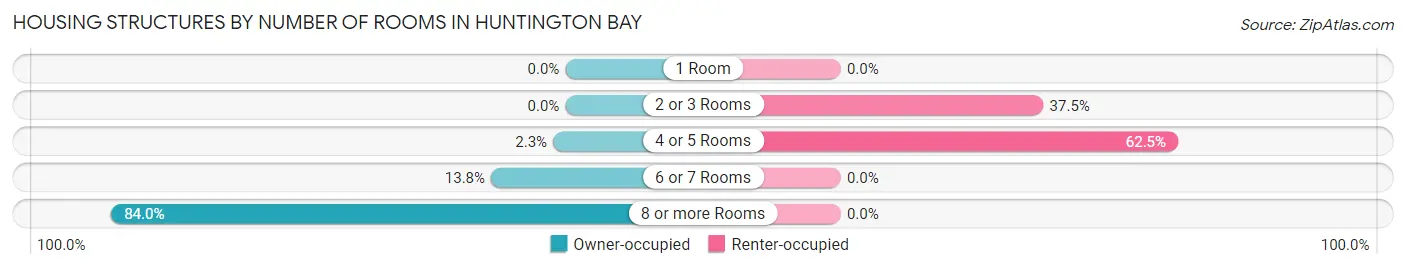
| Number of Rooms | Owner-occupied | Renter-occupied |
| 1 Room | 0 (0.0%) | 0 (0.0%) |
| 2 or 3 Rooms | 0 (0.0%) | 3 (37.5%) |
| 4 or 5 Rooms | 16 (2.3%) | 5 (62.5%) |
| 6 or 7 Rooms | 97 (13.8%) | 0 (0.0%) |
| 8 or more Rooms | 592 (84.0%) | 0 (0.0%) |
| Total | 705 (100.0%) | 8 (100.0%) |
Housing Structure by Heating Type in Huntington Bay
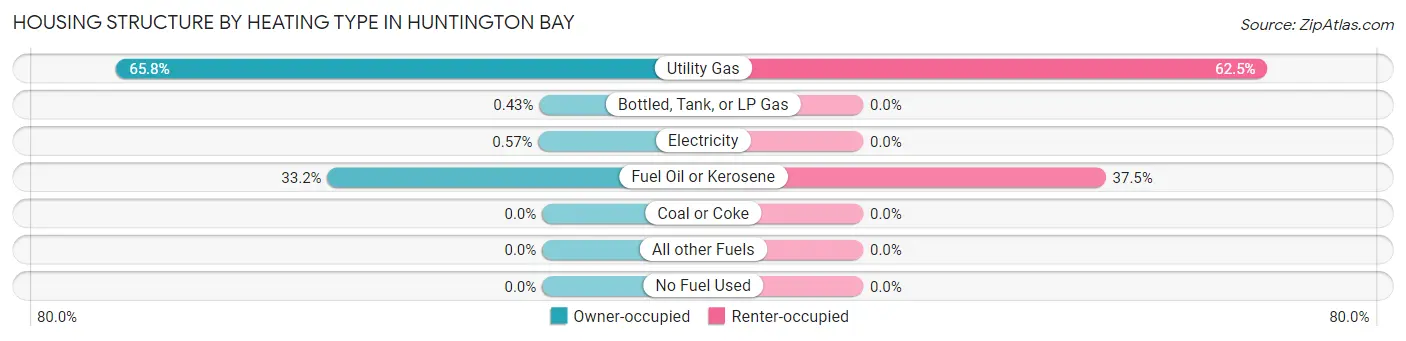
| Heating Type | Owner-occupied | Renter-occupied |
| Utility Gas | 464 (65.8%) | 5 (62.5%) |
| Bottled, Tank, or LP Gas | 3 (0.4%) | 0 (0.0%) |
| Electricity | 4 (0.6%) | 0 (0.0%) |
| Fuel Oil or Kerosene | 234 (33.2%) | 3 (37.5%) |
| Coal or Coke | 0 (0.0%) | 0 (0.0%) |
| All other Fuels | 0 (0.0%) | 0 (0.0%) |
| No Fuel Used | 0 (0.0%) | 0 (0.0%) |
| Total | 705 (100.0%) | 8 (100.0%) |
Household Vehicle Usage in Huntington Bay
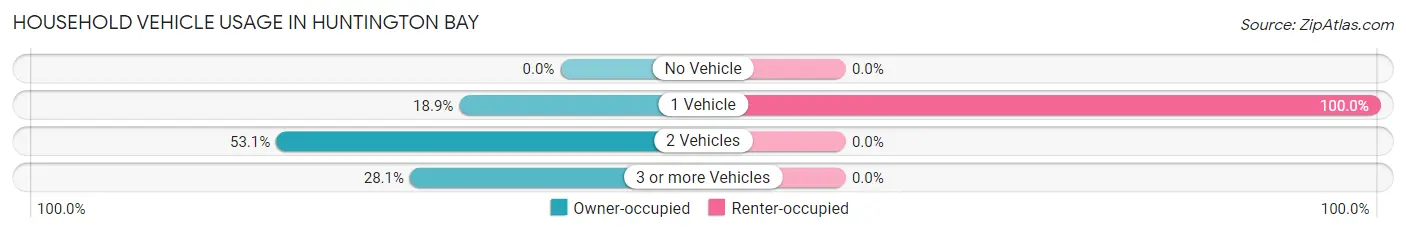
| Vehicles per Household | Owner-occupied | Renter-occupied |
| No Vehicle | 0 (0.0%) | 0 (0.0%) |
| 1 Vehicle | 133 (18.9%) | 8 (100.0%) |
| 2 Vehicles | 374 (53.0%) | 0 (0.0%) |
| 3 or more Vehicles | 198 (28.1%) | 0 (0.0%) |
| Total | 705 (100.0%) | 8 (100.0%) |
Real Estate & Mortgages in Huntington Bay
Real Estate and Mortgage Overview in Huntington Bay
| Characteristic | Without Mortgage | With Mortgage |
| Housing Units | 255 | 450 |
| Median Property Value | $1,242,800 | $1,523,800 |
| Median Household Income | $140,250 | $375 |
| Monthly Housing Costs | $1,501 | $406 |
| Real Estate Taxes | $10,001 | $0 |
Property Value by Mortgage Status in Huntington Bay
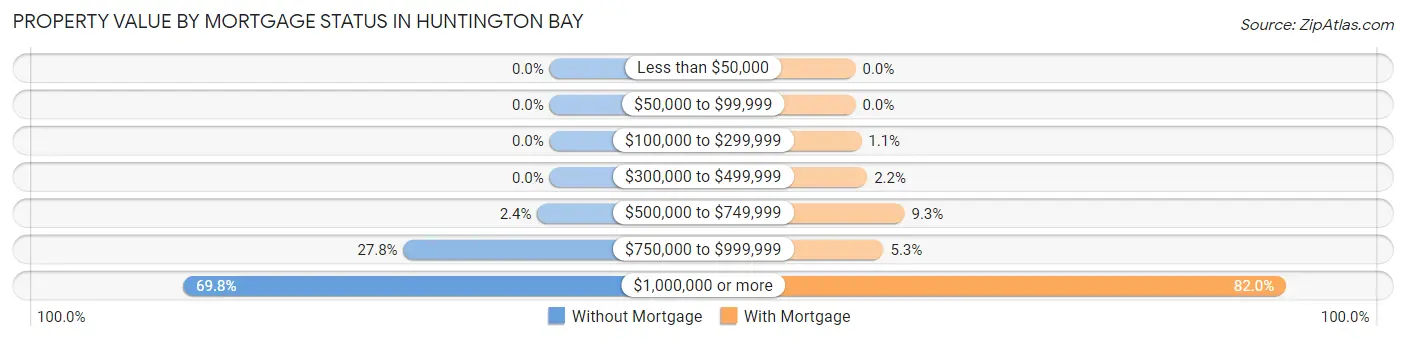
| Property Value | Without Mortgage | With Mortgage |
| Less than $50,000 | 0 (0.0%) | 0 (0.0%) |
| $50,000 to $99,999 | 0 (0.0%) | 0 (0.0%) |
| $100,000 to $299,999 | 0 (0.0%) | 5 (1.1%) |
| $300,000 to $499,999 | 0 (0.0%) | 10 (2.2%) |
| $500,000 to $749,999 | 6 (2.4%) | 42 (9.3%) |
| $750,000 to $999,999 | 71 (27.8%) | 24 (5.3%) |
| $1,000,000 or more | 178 (69.8%) | 369 (82.0%) |
| Total | 255 (100.0%) | 450 (100.0%) |
Household Income by Mortgage Status in Huntington Bay
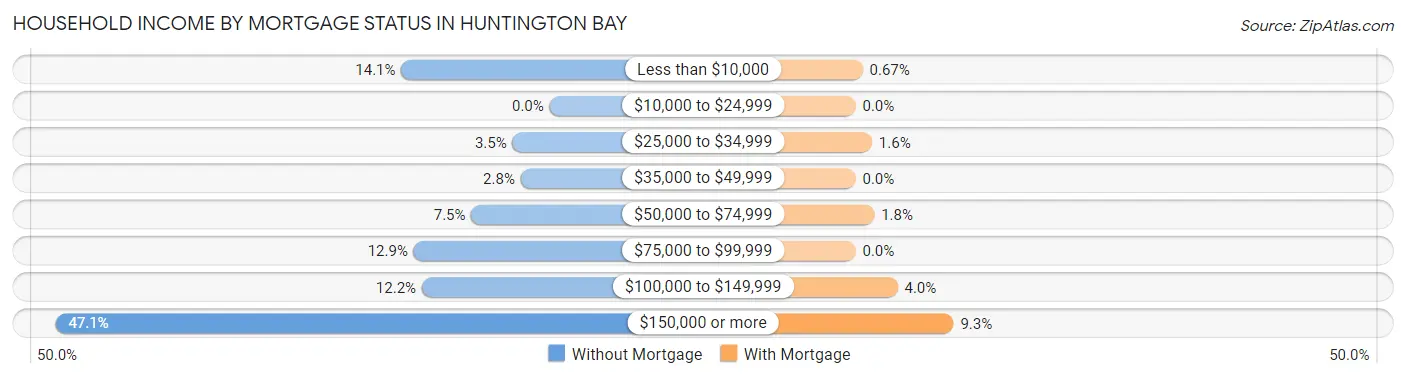
| Household Income | Without Mortgage | With Mortgage |
| Less than $10,000 | 36 (14.1%) | 3 (0.7%) |
| $10,000 to $24,999 | 0 (0.0%) | 0 (0.0%) |
| $25,000 to $34,999 | 9 (3.5%) | 7 (1.6%) |
| $35,000 to $49,999 | 7 (2.8%) | 0 (0.0%) |
| $50,000 to $74,999 | 19 (7.4%) | 8 (1.8%) |
| $75,000 to $99,999 | 33 (12.9%) | 0 (0.0%) |
| $100,000 to $149,999 | 31 (12.2%) | 18 (4.0%) |
| $150,000 or more | 120 (47.1%) | 42 (9.3%) |
| Total | 255 (100.0%) | 450 (100.0%) |
Property Value to Household Income Ratio in Huntington Bay
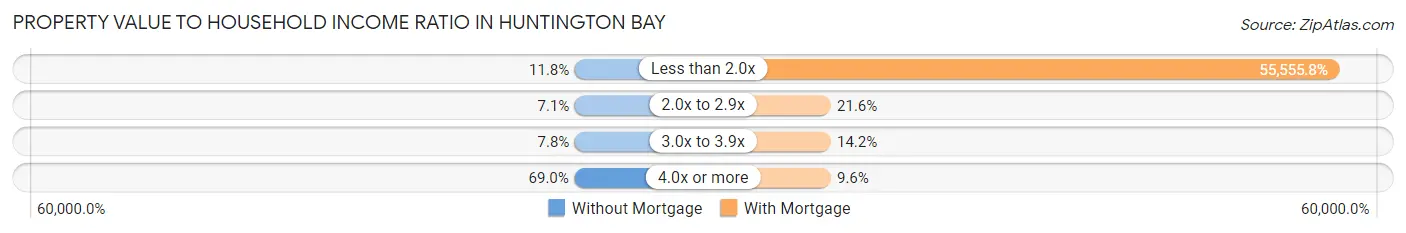
| Value-to-Income Ratio | Without Mortgage | With Mortgage |
| Less than 2.0x | 30 (11.8%) | 250,001 (55,555.8%) |
| 2.0x to 2.9x | 18 (7.1%) | 97 (21.6%) |
| 3.0x to 3.9x | 20 (7.8%) | 64 (14.2%) |
| 4.0x or more | 176 (69.0%) | 43 (9.6%) |
| Total | 255 (100.0%) | 450 (100.0%) |
Real Estate Taxes by Mortgage Status in Huntington Bay
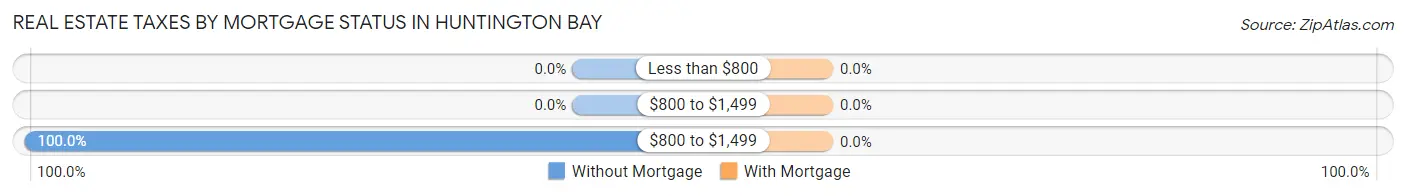
| Property Taxes | Without Mortgage | With Mortgage |
| Less than $800 | 0 (0.0%) | 0 (0.0%) |
| $800 to $1,499 | 0 (0.0%) | 0 (0.0%) |
| $800 to $1,499 | 255 (100.0%) | 0 (0.0%) |
| Total | 255 (100.0%) | 450 (100.0%) |
Health & Disability in Huntington Bay
Health Insurance Coverage by Age in Huntington Bay
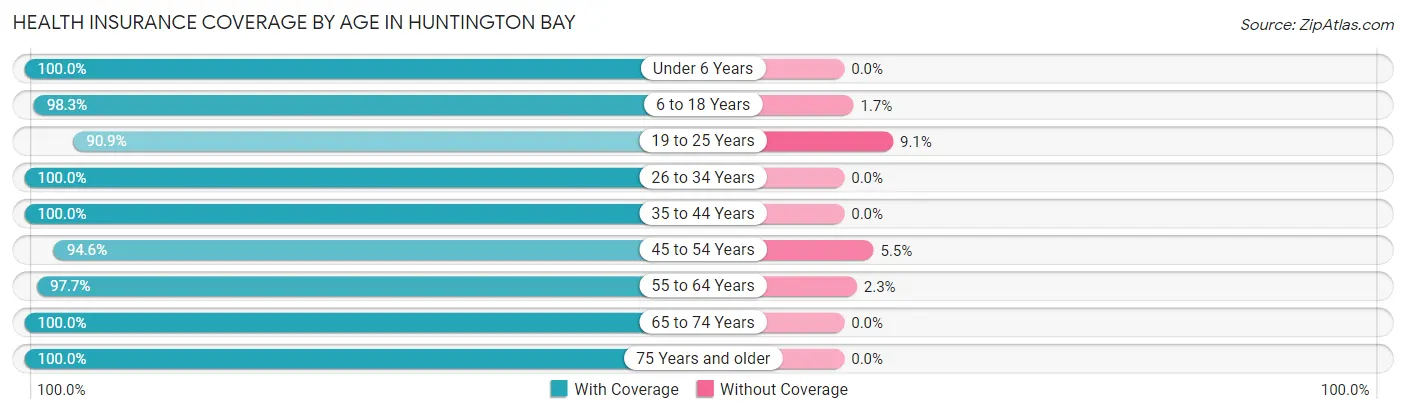
| Age Bracket | With Coverage | Without Coverage |
| Under 6 Years | 94 (100.0%) | 0 (0.0%) |
| 6 to 18 Years | 229 (98.3%) | 4 (1.7%) |
| 19 to 25 Years | 50 (90.9%) | 5 (9.1%) |
| 26 to 34 Years | 62 (100.0%) | 0 (0.0%) |
| 35 to 44 Years | 154 (100.0%) | 0 (0.0%) |
| 45 to 54 Years | 208 (94.6%) | 12 (5.4%) |
| 55 to 64 Years | 501 (97.7%) | 12 (2.3%) |
| 65 to 74 Years | 270 (100.0%) | 0 (0.0%) |
| 75 Years and older | 175 (100.0%) | 0 (0.0%) |
| Total | 1,743 (98.1%) | 33 (1.9%) |
Health Insurance Coverage by Citizenship Status in Huntington Bay
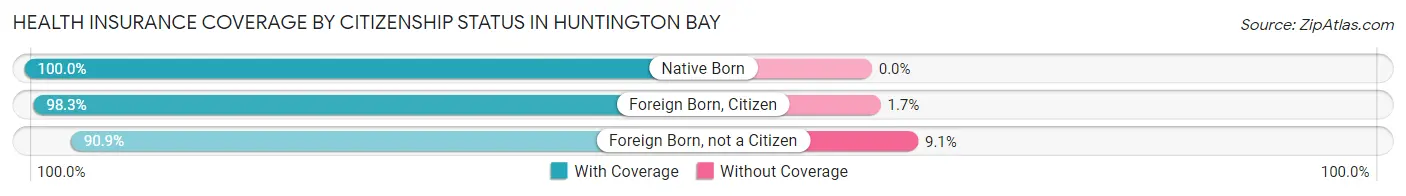
| Citizenship Status | With Coverage | Without Coverage |
| Native Born | 94 (100.0%) | 0 (0.0%) |
| Foreign Born, Citizen | 229 (98.3%) | 4 (1.7%) |
| Foreign Born, not a Citizen | 50 (90.9%) | 5 (9.1%) |
Health Insurance Coverage by Household Income in Huntington Bay
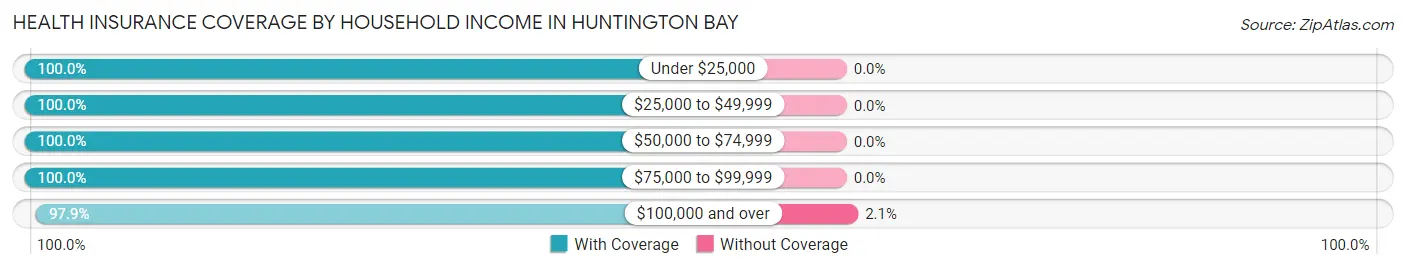
| Household Income | With Coverage | Without Coverage |
| Under $25,000 | 57 (100.0%) | 0 (0.0%) |
| $25,000 to $49,999 | 56 (100.0%) | 0 (0.0%) |
| $50,000 to $74,999 | 36 (100.0%) | 0 (0.0%) |
| $75,000 to $99,999 | 88 (100.0%) | 0 (0.0%) |
| $100,000 and over | 1,506 (97.9%) | 33 (2.1%) |
Public vs Private Health Insurance Coverage by Age in Huntington Bay
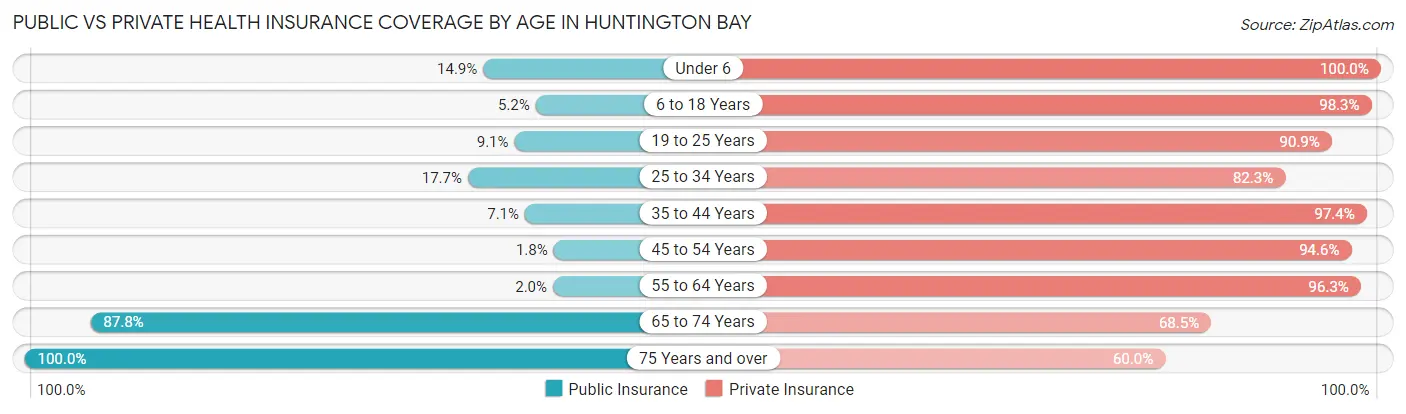
| Age Bracket | Public Insurance | Private Insurance |
| Under 6 | 14 (14.9%) | 94 (100.0%) |
| 6 to 18 Years | 12 (5.1%) | 229 (98.3%) |
| 19 to 25 Years | 5 (9.1%) | 50 (90.9%) |
| 25 to 34 Years | 11 (17.7%) | 51 (82.3%) |
| 35 to 44 Years | 11 (7.1%) | 150 (97.4%) |
| 45 to 54 Years | 4 (1.8%) | 208 (94.6%) |
| 55 to 64 Years | 10 (1.9%) | 494 (96.3%) |
| 65 to 74 Years | 237 (87.8%) | 185 (68.5%) |
| 75 Years and over | 175 (100.0%) | 105 (60.0%) |
| Total | 479 (27.0%) | 1,566 (88.2%) |
Disability Status by Sex by Age in Huntington Bay
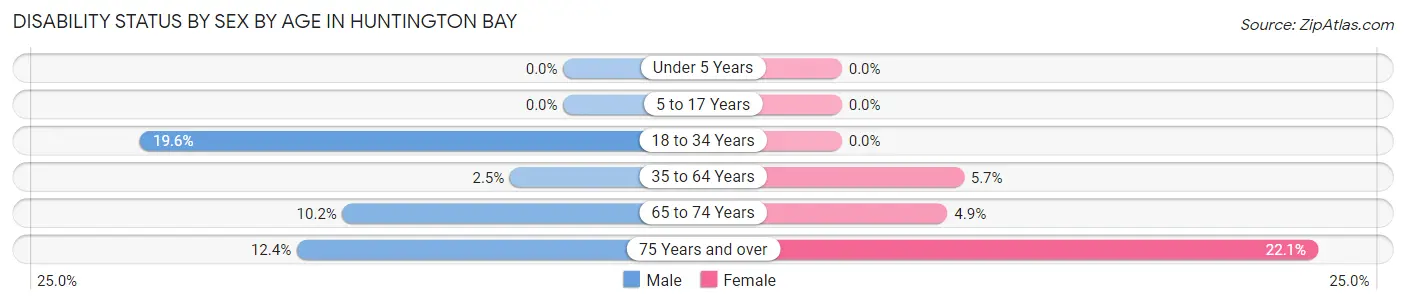
| Age Bracket | Male | Female |
| Under 5 Years | 0 (0.0%) | 0 (0.0%) |
| 5 to 17 Years | 0 (0.0%) | 0 (0.0%) |
| 18 to 34 Years | 11 (19.6%) | 0 (0.0%) |
| 35 to 64 Years | 11 (2.5%) | 25 (5.7%) |
| 65 to 74 Years | 13 (10.2%) | 7 (4.9%) |
| 75 Years and over | 11 (12.4%) | 19 (22.1%) |
Disability Class by Sex by Age in Huntington Bay
Disability Class: Hearing Difficulty
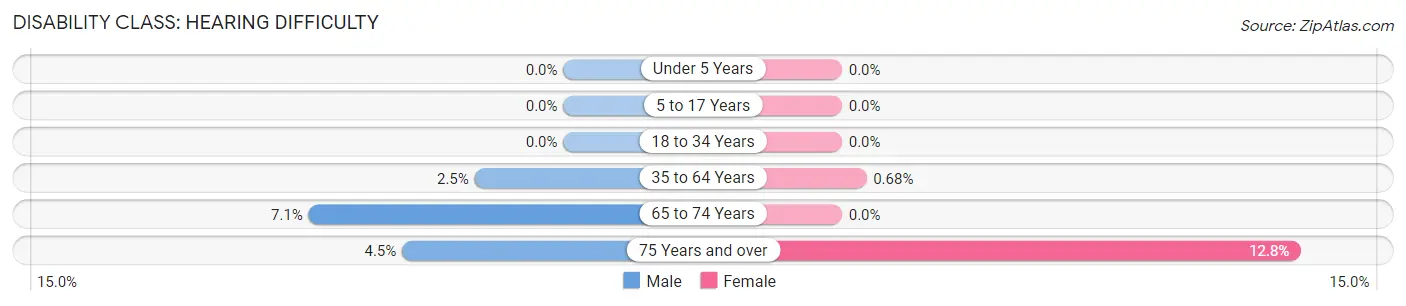
| Age Bracket | Male | Female |
| Under 5 Years | 0 (0.0%) | 0 (0.0%) |
| 5 to 17 Years | 0 (0.0%) | 0 (0.0%) |
| 18 to 34 Years | 0 (0.0%) | 0 (0.0%) |
| 35 to 64 Years | 11 (2.5%) | 3 (0.7%) |
| 65 to 74 Years | 9 (7.1%) | 0 (0.0%) |
| 75 Years and over | 4 (4.5%) | 11 (12.8%) |
Disability Class: Vision Difficulty
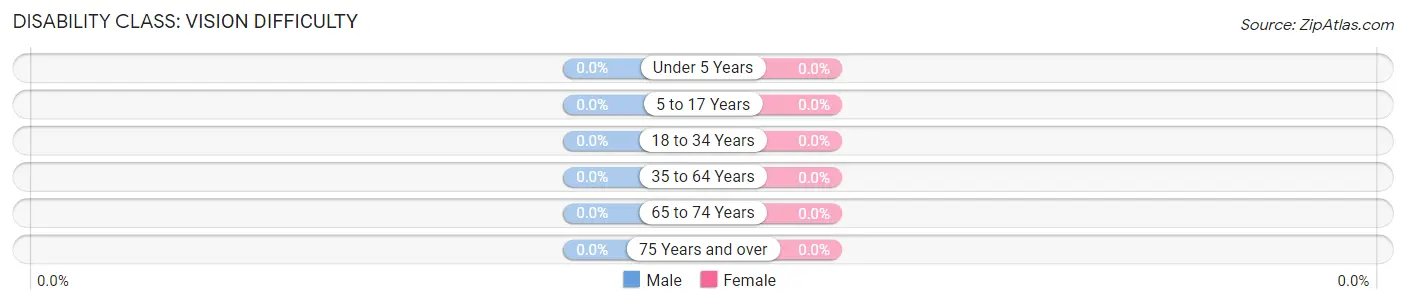
| Age Bracket | Male | Female |
| Under 5 Years | 0 (0.0%) | 0 (0.0%) |
| 5 to 17 Years | 0 (0.0%) | 0 (0.0%) |
| 18 to 34 Years | 0 (0.0%) | 0 (0.0%) |
| 35 to 64 Years | 0 (0.0%) | 0 (0.0%) |
| 65 to 74 Years | 0 (0.0%) | 0 (0.0%) |
| 75 Years and over | 0 (0.0%) | 0 (0.0%) |
Disability Class: Cognitive Difficulty
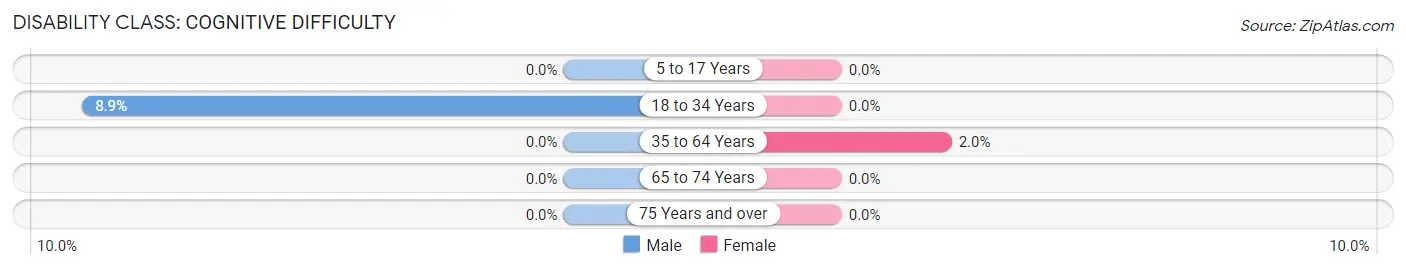
| Age Bracket | Male | Female |
| 5 to 17 Years | 0 (0.0%) | 0 (0.0%) |
| 18 to 34 Years | 5 (8.9%) | 0 (0.0%) |
| 35 to 64 Years | 0 (0.0%) | 9 (2.0%) |
| 65 to 74 Years | 0 (0.0%) | 0 (0.0%) |
| 75 Years and over | 0 (0.0%) | 0 (0.0%) |
Disability Class: Ambulatory Difficulty
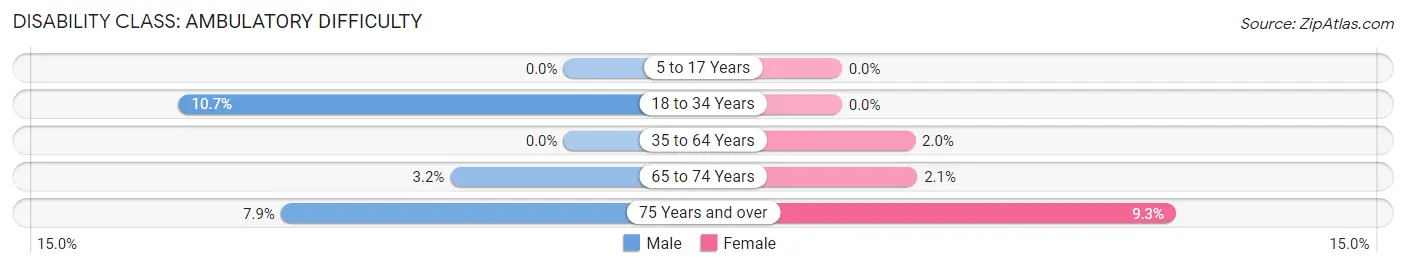
| Age Bracket | Male | Female |
| 5 to 17 Years | 0 (0.0%) | 0 (0.0%) |
| 18 to 34 Years | 6 (10.7%) | 0 (0.0%) |
| 35 to 64 Years | 0 (0.0%) | 9 (2.0%) |
| 65 to 74 Years | 4 (3.2%) | 3 (2.1%) |
| 75 Years and over | 7 (7.9%) | 8 (9.3%) |
Disability Class: Self-Care Difficulty
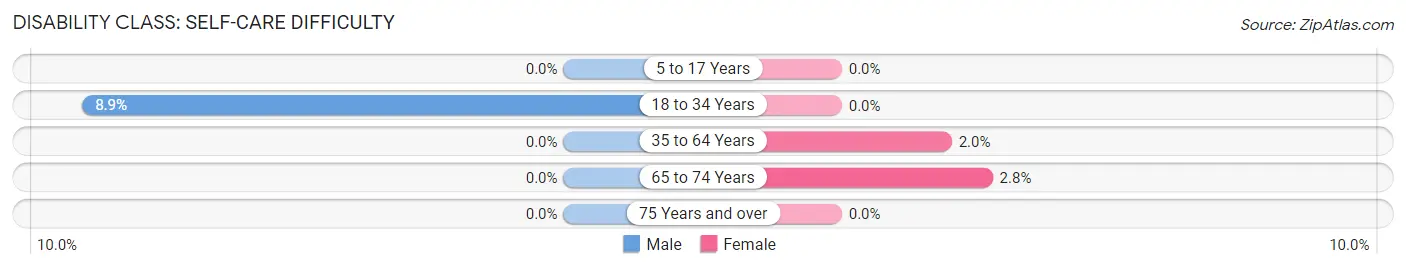
| Age Bracket | Male | Female |
| 5 to 17 Years | 0 (0.0%) | 0 (0.0%) |
| 18 to 34 Years | 5 (8.9%) | 0 (0.0%) |
| 35 to 64 Years | 0 (0.0%) | 9 (2.0%) |
| 65 to 74 Years | 0 (0.0%) | 4 (2.8%) |
| 75 Years and over | 0 (0.0%) | 0 (0.0%) |
Technology Access in Huntington Bay
Computing Device Access in Huntington Bay
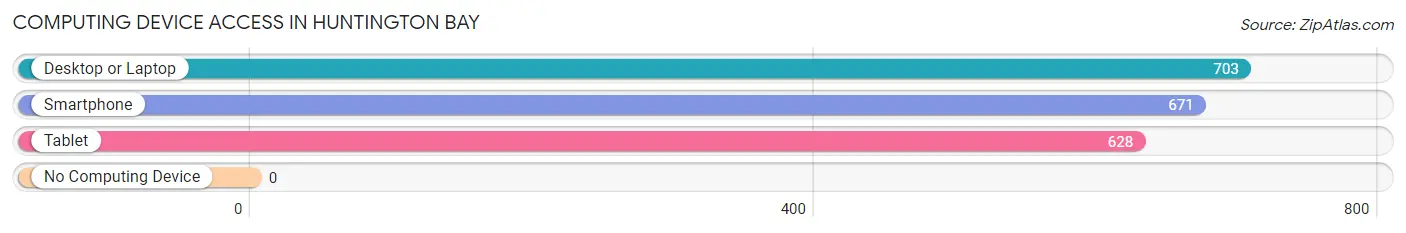
| Device Type | # Households | % Households |
| Desktop or Laptop | 703 | 98.6% |
| Smartphone | 671 | 94.1% |
| Tablet | 628 | 88.1% |
| No Computing Device | 0 | 0.0% |
| Total | 713 | 100.0% |
Internet Access in Huntington Bay
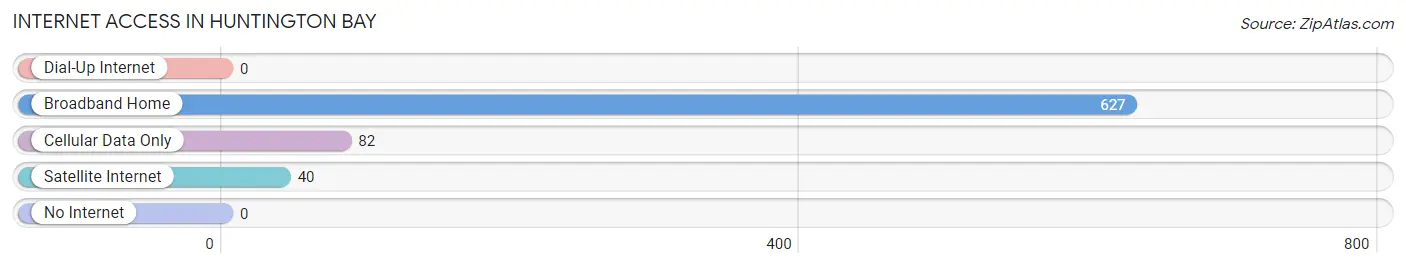
| Internet Type | # Households | % Households |
| Dial-Up Internet | 0 | 0.0% |
| Broadband Home | 627 | 87.9% |
| Cellular Data Only | 82 | 11.5% |
| Satellite Internet | 40 | 5.6% |
| No Internet | 0 | 0.0% |
| Total | 713 | 100.0% |
Huntington Bay Summary
Huntington Bay, NY is a small village located in Suffolk County, New York. It is situated on the north shore of Long Island, approximately 25 miles east of New York City. The village is part of the Town of Huntington and is bordered by the towns of Oyster Bay and North Hempstead. The village has a population of approximately 2,000 people and covers an area of 1.2 square miles.
History
The area that is now Huntington Bay was originally inhabited by the Matinecock Native American tribe. The first European settlers arrived in the area in the 1650s and the village was officially established in 1653. The village was named after the English statesman and philosopher, Lord Huntington.
In the late 19th century, the village became a popular summer resort destination for wealthy New Yorkers. The village was home to several large estates, including the estate of William K. Vanderbilt. The village was incorporated in 1910 and has remained relatively unchanged since then.
Geography
Huntington Bay is located on the north shore of Long Island, approximately 25 miles east of New York City. The village is bordered by the towns of Oyster Bay and North Hempstead. The village is situated on a peninsula that juts out into the Long Island Sound. The village is surrounded by water on three sides and is home to several small islands, including Lloyd Neck and Centre Island.
The village has a total area of 1.2 square miles, all of which is land. The village is located in a temperate climate zone and experiences mild winters and warm summers. The average annual temperature is around 50 degrees Fahrenheit.
Economy
The economy of Huntington Bay is largely based on tourism and real estate. The village is home to several large estates and is a popular summer resort destination for wealthy New Yorkers. The village is also home to several marinas and yacht clubs, which attract visitors from all over the world.
The village is also home to several small businesses, including restaurants, shops, and galleries. The village is also home to several small manufacturing companies, which produce a variety of products, including furniture and clothing.
Demographics
As of the 2010 census, the population of Huntington Bay was 2,000 people. The racial makeup of the village was 94.2% White, 2.2% African American, 0.7% Asian, 0.3% Native American, and 2.6% from other races. The median household income was $90,000 and the median family income was $100,000.
The village is home to several religious institutions, including churches, synagogues, and mosques. The village is also home to several private schools, including the Huntington Bay Academy and the Huntington Bay Preparatory School.
Conclusion
Huntington Bay, NY is a small village located in Suffolk County, New York. It is situated on the north shore of Long Island, approximately 25 miles east of New York City. The village has a population of approximately 2,000 people and covers an area of 1.2 square miles. The economy of the village is largely based on tourism and real estate. The village is home to several large estates and is a popular summer resort destination for wealthy New Yorkers. The village is also home to several small businesses, including restaurants, shops, and galleries. The racial makeup of the village is 94.2% White, 2.2% African American, 0.7% Asian, 0.3% Native American, and 2.6% from other races. The median household income was $90,000 and the median family income was $100,000.
Common Questions
What is Per Capita Income in Huntington Bay?
Per Capita income in Huntington Bay is $167,757.
What is the Median Family Income in Huntington Bay?
Median Family Income in Huntington Bay is $250,001.
What is the Median Household income in Huntington Bay?
Median Household Income in Huntington Bay is $250,001.
What is Inequality or Gini Index in Huntington Bay?
Inequality or Gini Index in Huntington Bay is 0.52.
What is the Total Population of Huntington Bay?
Total Population of Huntington Bay is 1,776.
What is the Total Male Population of Huntington Bay?
Total Male Population of Huntington Bay is 878.
What is the Total Female Population of Huntington Bay?
Total Female Population of Huntington Bay is 898.
What is the Ratio of Males per 100 Females in Huntington Bay?
There are 97.77 Males per 100 Females in Huntington Bay.
What is the Ratio of Females per 100 Males in Huntington Bay?
There are 102.28 Females per 100 Males in Huntington Bay.
What is the Median Population Age in Huntington Bay?
Median Population Age in Huntington Bay is 57.5 Years.
What is the Average Family Size in Huntington Bay
Average Family Size in Huntington Bay is 2.8 People.
What is the Average Household Size in Huntington Bay
Average Household Size in Huntington Bay is 2.5 People.
How Large is the Labor Force in Huntington Bay?
There are 814 People in the Labor Forcein in Huntington Bay.
What is the Percentage of People in the Labor Force in Huntington Bay?
54.0% of People are in the Labor Force in Huntington Bay.
What is the Unemployment Rate in Huntington Bay?
Unemployment Rate in Huntington Bay is 5.8%.