Oyster Bay Cove, NY Map & Demographics
Oyster Bay Cove Map
Oyster Bay Cove Overview
$145,710
PER CAPITA INCOME
$250,001
AVG FAMILY INCOME
$250,001
AVG HOUSEHOLD INCOME
55.3%
WAGE / INCOME GAP [ % ]
44.7¢/ $1
WAGE / INCOME GAP [ $ ]
0.51
INEQUALITY / GINI INDEX
1,942
TOTAL POPULATION
994
MALE POPULATION
948
FEMALE POPULATION
104.85
MALES / 100 FEMALES
95.37
FEMALES / 100 MALES
48.7
MEDIAN AGE
3.3
AVG FAMILY SIZE
3.0
AVG HOUSEHOLD SIZE
984
LABOR FORCE [ PEOPLE ]
62.1%
PERCENT IN LABOR FORCE
7.8%
UNEMPLOYMENT RATE
Income in Oyster Bay Cove
Income Overview in Oyster Bay Cove
Per Capita Income in Oyster Bay Cove is $145,710, while median incomes of families and households are $250,001 and $250,001 respectively.
| Characteristic | Number | Measure |
| Per Capita Income | 1,942 | $145,710 |
| Median Family Income | 544 | $250,001 |
| Mean Family Income | 544 | $486,015 |
| Median Household Income | 641 | $250,001 |
| Mean Household Income | 641 | $436,764 |
| Income Deficit | 544 | $0 |
| Wage / Income Gap (%) | 1,942 | 55.34% |
| Wage / Income Gap ($) | 1,942 | 44.66¢ per $1 |
| Gini / Inequality Index | 1,942 | 0.51 |
Earnings by Sex in Oyster Bay Cove
Average Earnings in Oyster Bay Cove are $106,417, $139,955 for men and $62,500 for women, a difference of 55.3%.
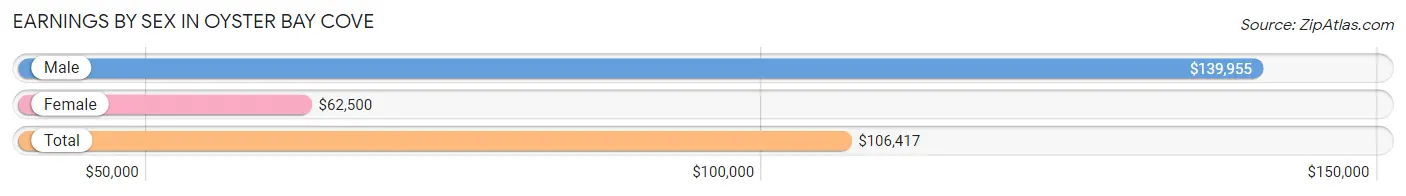
| Sex | Number | Average Earnings |
| Male | 575 (57.1%) | $139,955 |
| Female | 432 (42.9%) | $62,500 |
| Total | 1,007 (100.0%) | $106,417 |
Earnings by Sex by Income Bracket in Oyster Bay Cove
The most common earnings brackets in Oyster Bay Cove are $100,000+ for men (377 | 65.6%) and $100,000+ for women (157 | 36.3%).
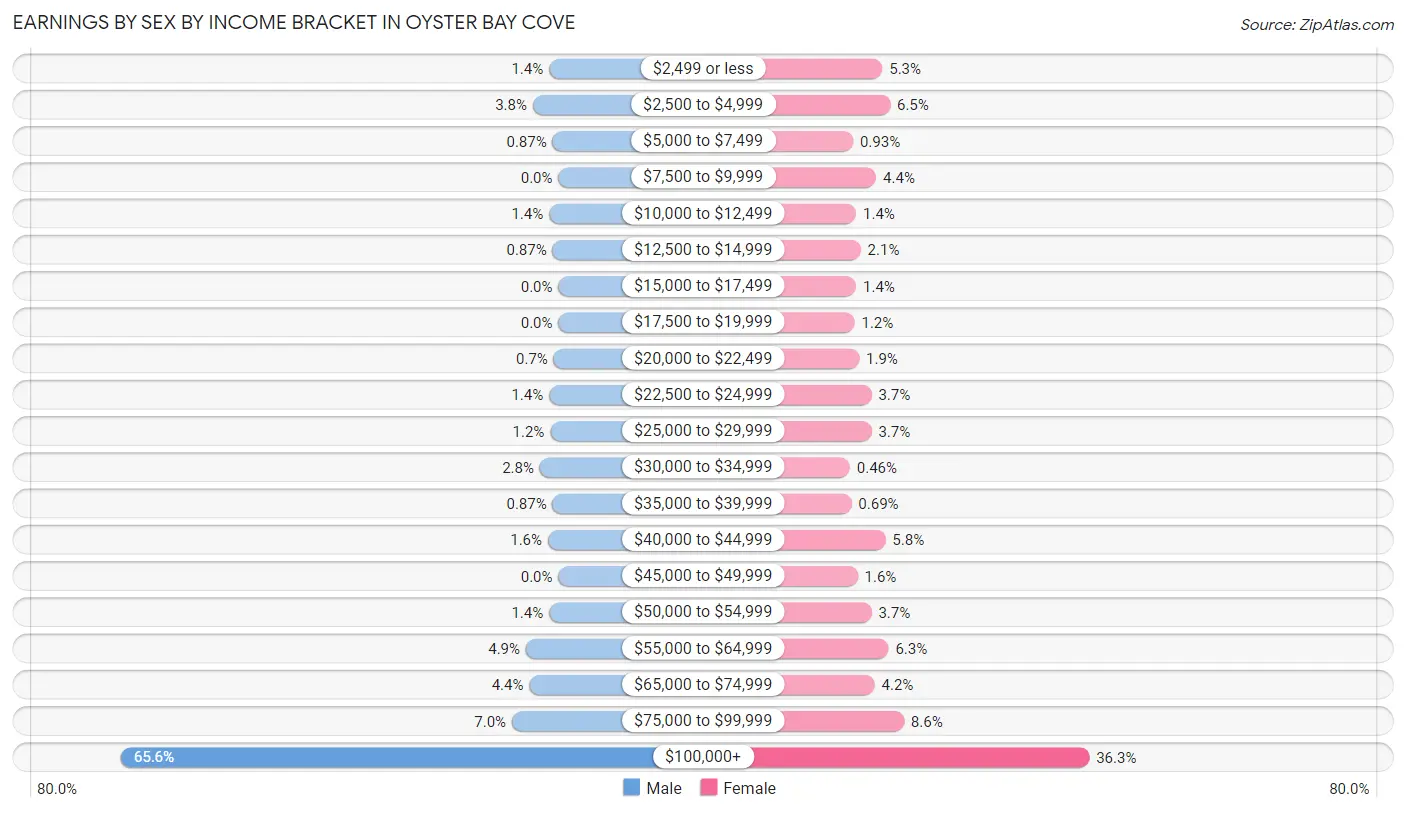
| Income | Male | Female |
| $2,499 or less | 8 (1.4%) | 23 (5.3%) |
| $2,500 to $4,999 | 22 (3.8%) | 28 (6.5%) |
| $5,000 to $7,499 | 5 (0.9%) | 4 (0.9%) |
| $7,500 to $9,999 | 0 (0.0%) | 19 (4.4%) |
| $10,000 to $12,499 | 8 (1.4%) | 6 (1.4%) |
| $12,500 to $14,999 | 5 (0.9%) | 9 (2.1%) |
| $15,000 to $17,499 | 0 (0.0%) | 6 (1.4%) |
| $17,500 to $19,999 | 0 (0.0%) | 5 (1.2%) |
| $20,000 to $22,499 | 4 (0.7%) | 8 (1.8%) |
| $22,500 to $24,999 | 8 (1.4%) | 16 (3.7%) |
| $25,000 to $29,999 | 7 (1.2%) | 16 (3.7%) |
| $30,000 to $34,999 | 16 (2.8%) | 2 (0.5%) |
| $35,000 to $39,999 | 5 (0.9%) | 3 (0.7%) |
| $40,000 to $44,999 | 9 (1.6%) | 25 (5.8%) |
| $45,000 to $49,999 | 0 (0.0%) | 7 (1.6%) |
| $50,000 to $54,999 | 8 (1.4%) | 16 (3.7%) |
| $55,000 to $64,999 | 28 (4.9%) | 27 (6.2%) |
| $65,000 to $74,999 | 25 (4.3%) | 18 (4.2%) |
| $75,000 to $99,999 | 40 (7.0%) | 37 (8.6%) |
| $100,000+ | 377 (65.6%) | 157 (36.3%) |
| Total | 575 (100.0%) | 432 (100.0%) |
Earnings by Sex by Educational Attainment in Oyster Bay Cove
Average earnings in Oyster Bay Cove are $146,563 for men and $74,028 for women, a difference of 49.5%. Men with an educational attainment of graduate degree enjoy the highest average annual earnings of $250,001, while those with high school diploma education earn the least with $69,688. Women with an educational attainment of graduate degree earn the most with the average annual earnings of $82,813, while those with college or associate's degree education have the smallest earnings of $27,750.
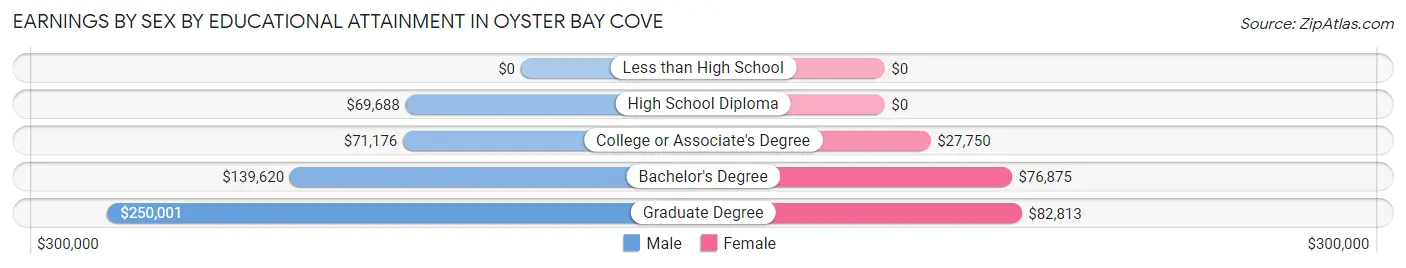
| Educational Attainment | Male Income | Female Income |
| Less than High School | - | - |
| High School Diploma | $69,688 | $0 |
| College or Associate's Degree | $71,176 | $27,750 |
| Bachelor's Degree | $139,620 | $76,875 |
| Graduate Degree | $250,001 | $82,813 |
| Total | $146,563 | $74,028 |
Family Income in Oyster Bay Cove
Family Income Brackets in Oyster Bay Cove
According to the Oyster Bay Cove family income data, there are 361 families falling into the $200,000+ income range, which is the most common income bracket and makes up 66.4% of all families.
| Income Bracket | # Families | % Families |
| Less than $10,000 | 13 | 2.4% |
| $10,000 to $14,999 | 1 | 0.2% |
| $15,000 to $24,999 | 0 | 0.0% |
| $25,000 to $34,999 | 7 | 1.3% |
| $35,000 to $49,999 | 5 | 0.9% |
| $50,000 to $74,999 | 8 | 1.5% |
| $75,000 to $99,999 | 22 | 4.0% |
| $100,000 to $149,999 | 59 | 10.8% |
| $150,000 to $199,999 | 68 | 12.5% |
| $200,000+ | 361 | 66.4% |
Family Income by Famaliy Size in Oyster Bay Cove
2-person families (237 | 43.6%) account for the highest median family income in Oyster Bay Cove with $250,001 per family, while 2-person families (237 | 43.6%) have the highest median income of $125,000 per family member.
| Income Bracket | # Families | Median Income |
| 2-Person Families | 237 (43.6%) | $250,001 |
| 3-Person Families | 100 (18.4%) | $209,808 |
| 4-Person Families | 134 (24.6%) | $250,001 |
| 5-Person Families | 45 (8.3%) | $250,001 |
| 6-Person Families | 10 (1.8%) | $0 |
| 7+ Person Families | 18 (3.3%) | $0 |
| Total | 544 (100.0%) | $250,001 |
Family Income by Number of Earners in Oyster Bay Cove
The median family income in Oyster Bay Cove is $250,001, with families comprising no earners (55) having the highest median family income of $250,001, while families with no earners (55) have the lowest median family income of $250,001, accounting for 10.1% and 10.1% of families, respectively.
| Number of Earners | # Families | Median Income |
| No Earners | 55 (10.1%) | $250,001 |
| 1 Earner | 174 (32.0%) | $250,001 |
| 2 Earners | 234 (43.0%) | $250,001 |
| 3+ Earners | 81 (14.9%) | $250,001 |
| Total | 544 (100.0%) | $250,001 |
Household Income in Oyster Bay Cove
Household Income Brackets in Oyster Bay Cove
With 388 households falling in the category, the $200,000+ income range is the most frequent in Oyster Bay Cove, accounting for 60.5% of all households.
| Income Bracket | # Households | % Households |
| Less than $10,000 | 21 | 3.3% |
| $10,000 to $14,999 | 1 | 0.2% |
| $15,000 to $24,999 | 5 | 0.8% |
| $25,000 to $34,999 | 11 | 1.7% |
| $35,000 to $49,999 | 0 | 0.0% |
| $50,000 to $74,999 | 55 | 8.6% |
| $75,000 to $99,999 | 25 | 3.9% |
| $100,000 to $149,999 | 64 | 10.0% |
| $150,000 to $199,999 | 71 | 11.1% |
| $200,000+ | 388 | 60.5% |
Household Income by Householder Age in Oyster Bay Cove
The median household income in Oyster Bay Cove is $250,001, with the highest median household income of $250,001 found in the 25 to 44 years age bracket for the primary householder. A total of 99 households (15.4%) fall into this category.
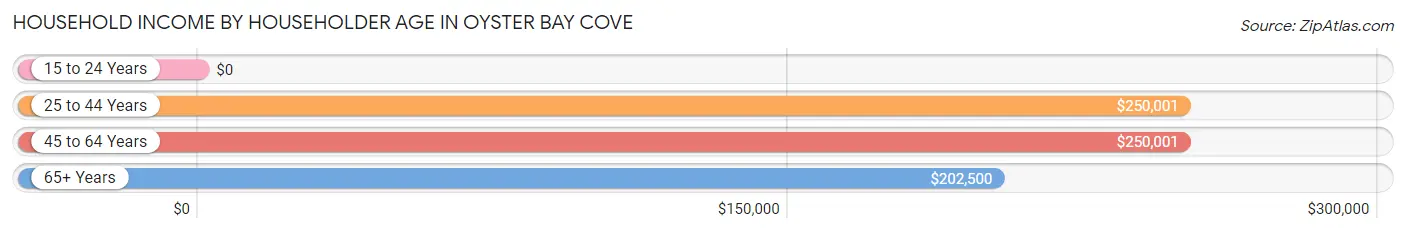
| Income Bracket | # Households | Median Income |
| 15 to 24 Years | 0 (0.0%) | $0 |
| 25 to 44 Years | 99 (15.4%) | $250,001 |
| 45 to 64 Years | 340 (53.0%) | $250,001 |
| 65+ Years | 202 (31.5%) | $202,500 |
| Total | 641 (100.0%) | $250,001 |
Poverty in Oyster Bay Cove
Income Below Poverty by Sex and Age in Oyster Bay Cove
With 9.5% poverty level for males and 4.3% for females among the residents of Oyster Bay Cove, 45 to 54 year old males and 25 to 34 year old females are the most vulnerable to poverty, with 66 males (34.4%) and 12 females (17.6%) in their respective age groups living below the poverty level.
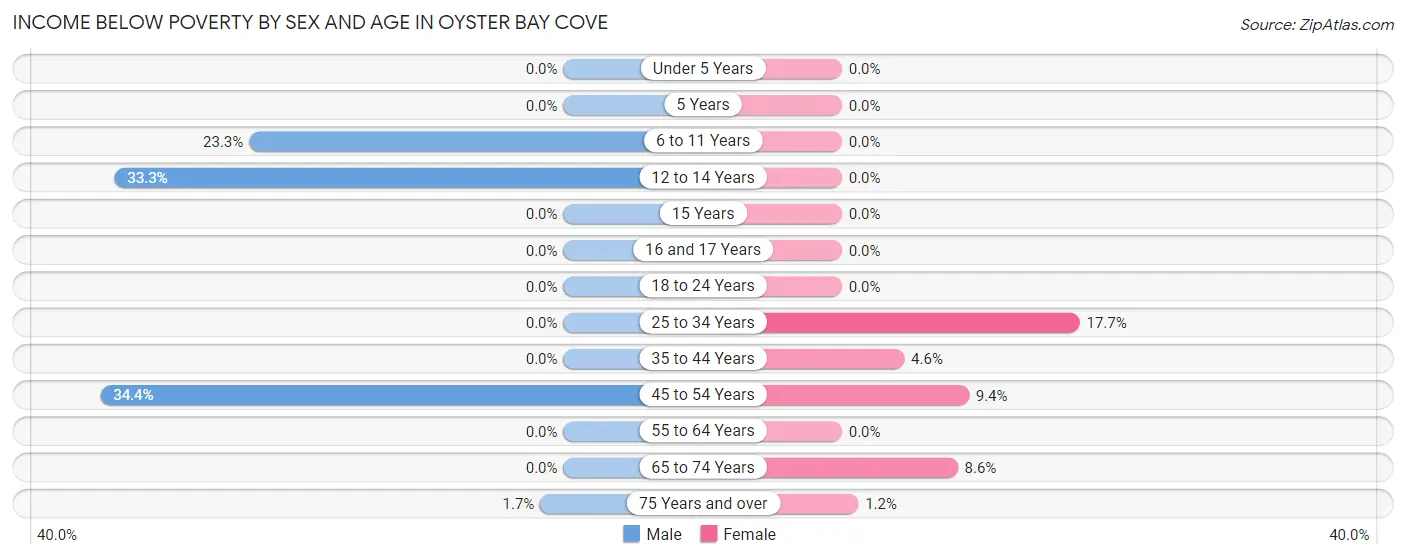
| Age Bracket | Male | Female |
| Under 5 Years | 0 (0.0%) | 0 (0.0%) |
| 5 Years | 0 (0.0%) | 0 (0.0%) |
| 6 to 11 Years | 14 (23.3%) | 0 (0.0%) |
| 12 to 14 Years | 13 (33.3%) | 0 (0.0%) |
| 15 Years | 0 (0.0%) | 0 (0.0%) |
| 16 and 17 Years | 0 (0.0%) | 0 (0.0%) |
| 18 to 24 Years | 0 (0.0%) | 0 (0.0%) |
| 25 to 34 Years | 0 (0.0%) | 12 (17.6%) |
| 35 to 44 Years | 0 (0.0%) | 5 (4.6%) |
| 45 to 54 Years | 66 (34.4%) | 15 (9.4%) |
| 55 to 64 Years | 0 (0.0%) | 0 (0.0%) |
| 65 to 74 Years | 0 (0.0%) | 8 (8.6%) |
| 75 Years and over | 1 (1.7%) | 1 (1.2%) |
| Total | 94 (9.5%) | 41 (4.3%) |
Income Above Poverty by Sex and Age in Oyster Bay Cove
According to the poverty statistics in Oyster Bay Cove, males aged under 5 years and females aged under 5 years are the age groups that are most secure financially, with 100.0% of males and 100.0% of females in these age groups living above the poverty line.
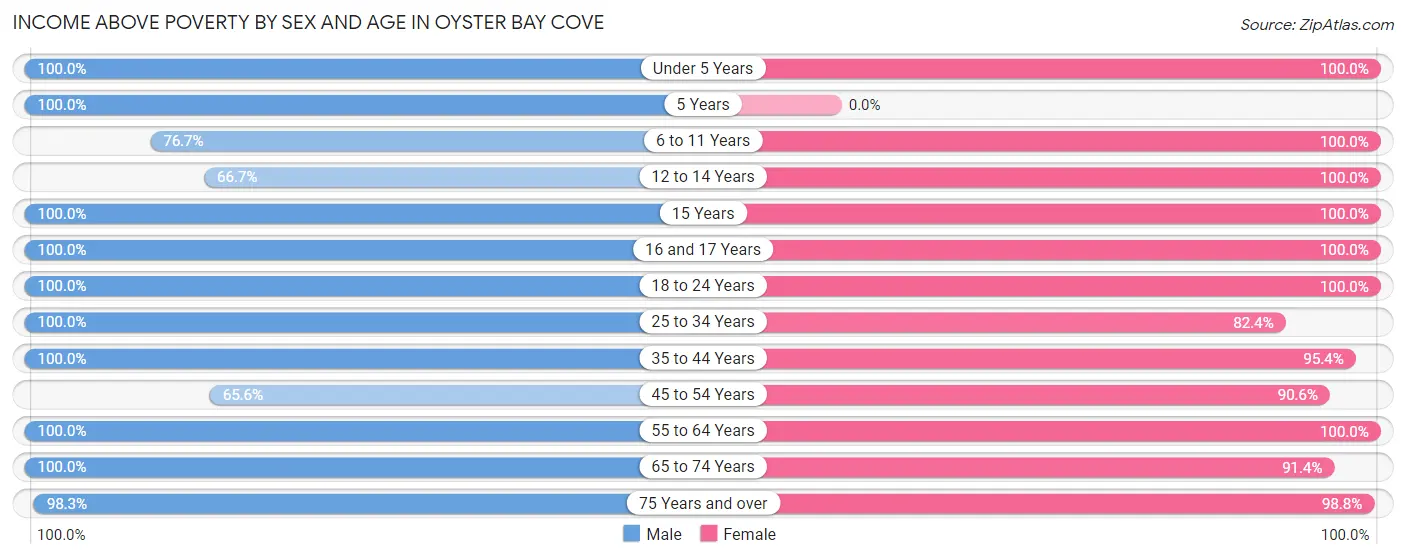
| Age Bracket | Male | Female |
| Under 5 Years | 78 (100.0%) | 37 (100.0%) |
| 5 Years | 9 (100.0%) | 0 (0.0%) |
| 6 to 11 Years | 46 (76.7%) | 72 (100.0%) |
| 12 to 14 Years | 26 (66.7%) | 41 (100.0%) |
| 15 Years | 4 (100.0%) | 17 (100.0%) |
| 16 and 17 Years | 23 (100.0%) | 36 (100.0%) |
| 18 to 24 Years | 73 (100.0%) | 63 (100.0%) |
| 25 to 34 Years | 50 (100.0%) | 56 (82.4%) |
| 35 to 44 Years | 123 (100.0%) | 103 (95.4%) |
| 45 to 54 Years | 126 (65.6%) | 144 (90.6%) |
| 55 to 64 Years | 188 (100.0%) | 172 (100.0%) |
| 65 to 74 Years | 97 (100.0%) | 85 (91.4%) |
| 75 Years and over | 57 (98.3%) | 81 (98.8%) |
| Total | 900 (90.5%) | 907 (95.7%) |
Income Below Poverty Among Married-Couple Families in Oyster Bay Cove
The poverty statistics for married-couple families in Oyster Bay Cove show that 2.9% or 14 of the total 481 families live below the poverty line. Families with 1 or 2 children have the highest poverty rate of 8.7%, comprising of 13 families. On the other hand, families with 3 or 4 children have the lowest poverty rate of 0.0%, which includes 0 families.
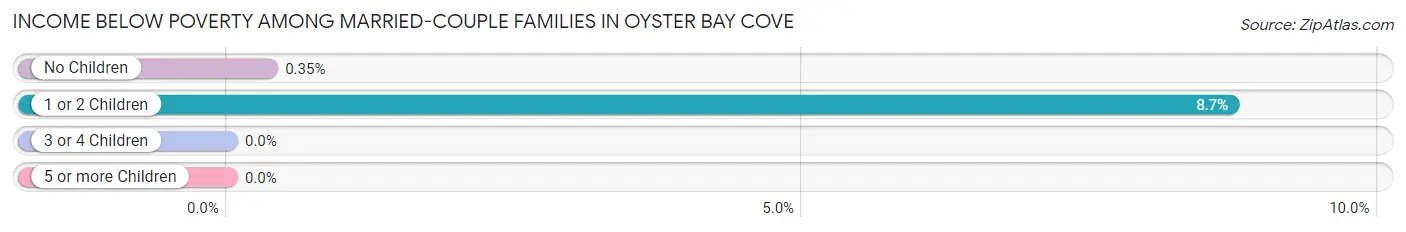
| Children | Above Poverty | Below Poverty |
| No Children | 287 (99.7%) | 1 (0.4%) |
| 1 or 2 Children | 136 (91.3%) | 13 (8.7%) |
| 3 or 4 Children | 29 (100.0%) | 0 (0.0%) |
| 5 or more Children | 15 (100.0%) | 0 (0.0%) |
| Total | 467 (97.1%) | 14 (2.9%) |
Income Below Poverty Among Single-Parent Households in Oyster Bay Cove
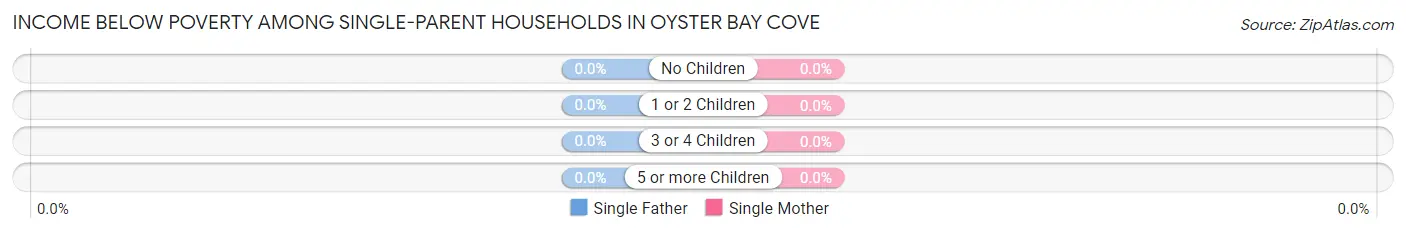
| Children | Single Father | Single Mother |
| No Children | 0 (0.0%) | 0 (0.0%) |
| 1 or 2 Children | 0 (0.0%) | 0 (0.0%) |
| 3 or 4 Children | 0 (0.0%) | 0 (0.0%) |
| 5 or more Children | 0 (0.0%) | 0 (0.0%) |
| Total | 0 (0.0%) | 0 (0.0%) |
Income Below Poverty Among Married-Couple vs Single-Parent Households in Oyster Bay Cove
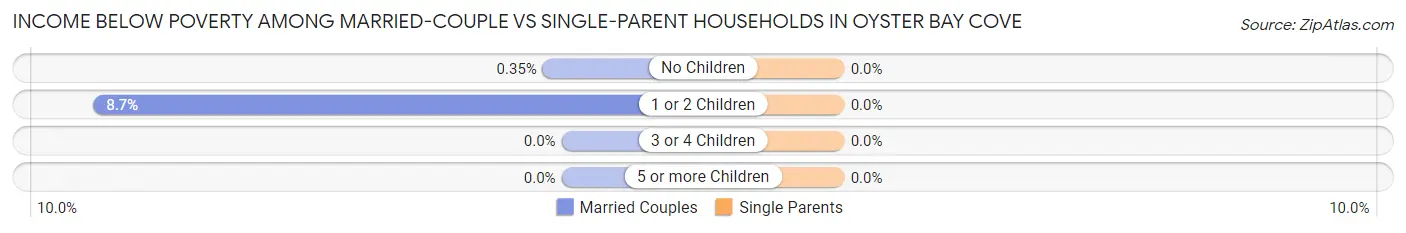
| Children | Married-Couple Families | Single-Parent Households |
| No Children | 1 (0.4%) | 0 (0.0%) |
| 1 or 2 Children | 13 (8.7%) | 0 (0.0%) |
| 3 or 4 Children | 0 (0.0%) | 0 (0.0%) |
| 5 or more Children | 0 (0.0%) | 0 (0.0%) |
| Total | 14 (2.9%) | 0 (0.0%) |
Race in Oyster Bay Cove
The most populous races in Oyster Bay Cove are White / Caucasian (1,412 | 72.7%), Asian (263 | 13.5%), and Hispanic or Latino (226 | 11.6%).
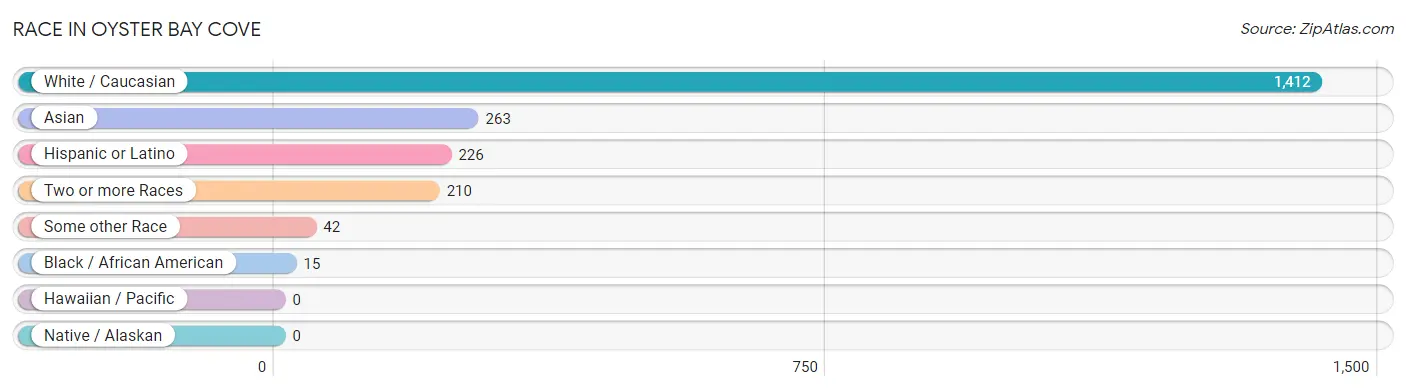
| Race | # Population | % Population |
| Asian | 263 | 13.5% |
| Black / African American | 15 | 0.8% |
| Hawaiian / Pacific | 0 | 0.0% |
| Hispanic or Latino | 226 | 11.6% |
| Native / Alaskan | 0 | 0.0% |
| White / Caucasian | 1,412 | 72.7% |
| Two or more Races | 210 | 10.8% |
| Some other Race | 42 | 2.2% |
| Total | 1,942 | 100.0% |
Ancestry in Oyster Bay Cove
The most populous ancestries reported in Oyster Bay Cove are Italian (346 | 17.8%), Irish (278 | 14.3%), German (197 | 10.1%), Thai (167 | 8.6%), and American (120 | 6.2%), together accounting for 57.1% of all Oyster Bay Cove residents.
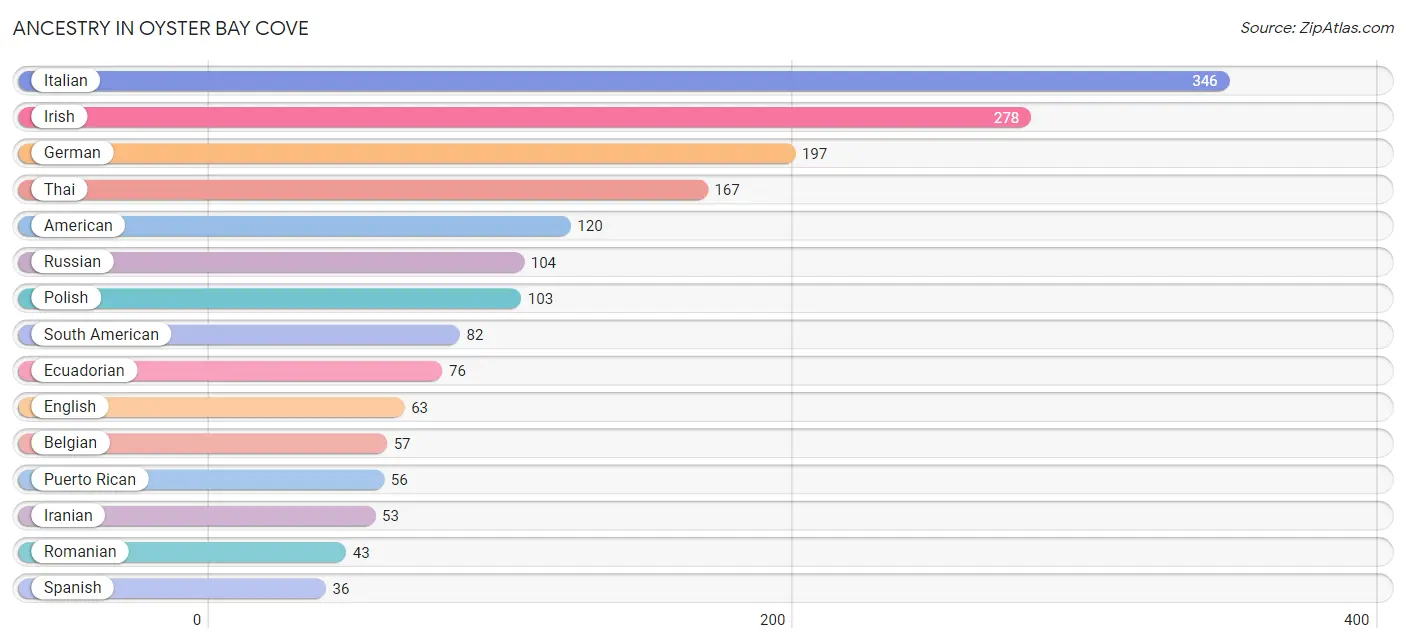
| Ancestry | # Population | % Population |
| American | 120 | 6.2% |
| Arab | 14 | 0.7% |
| Armenian | 7 | 0.4% |
| Austrian | 30 | 1.5% |
| Belgian | 57 | 2.9% |
| Brazilian | 3 | 0.2% |
| British | 4 | 0.2% |
| Canadian | 4 | 0.2% |
| Central American | 6 | 0.3% |
| Croatian | 3 | 0.2% |
| Cuban | 17 | 0.9% |
| Eastern European | 26 | 1.3% |
| Ecuadorian | 76 | 3.9% |
| Egyptian | 8 | 0.4% |
| English | 63 | 3.2% |
| European | 33 | 1.7% |
| French | 35 | 1.8% |
| French Canadian | 2 | 0.1% |
| German | 197 | 10.1% |
| Greek | 5 | 0.3% |
| Guatemalan | 6 | 0.3% |
| Hungarian | 22 | 1.1% |
| Indian (Asian) | 15 | 0.8% |
| Iranian | 53 | 2.7% |
| Irish | 278 | 14.3% |
| Israeli | 14 | 0.7% |
| Italian | 346 | 17.8% |
| Jamaican | 15 | 0.8% |
| Korean | 19 | 1.0% |
| Mexican | 19 | 1.0% |
| Northern European | 22 | 1.1% |
| Peruvian | 6 | 0.3% |
| Polish | 103 | 5.3% |
| Portuguese | 4 | 0.2% |
| Puerto Rican | 56 | 2.9% |
| Romanian | 43 | 2.2% |
| Russian | 104 | 5.4% |
| Scottish | 19 | 1.0% |
| South American | 82 | 4.2% |
| Spaniard | 10 | 0.5% |
| Spanish | 36 | 1.8% |
| Swedish | 29 | 1.5% |
| Syrian | 6 | 0.3% |
| Thai | 167 | 8.6% |
| Turkish | 13 | 0.7% |
| Ukrainian | 21 | 1.1% |
| Welsh | 16 | 0.8% | View All 47 Rows |
Immigrants in Oyster Bay Cove
The most numerous immigrant groups reported in Oyster Bay Cove came from Asia (179 | 9.2%), South Central Asia (145 | 7.5%), Europe (71 | 3.7%), Pakistan (69 | 3.5%), and India (62 | 3.2%), together accounting for 27.1% of all Oyster Bay Cove residents.
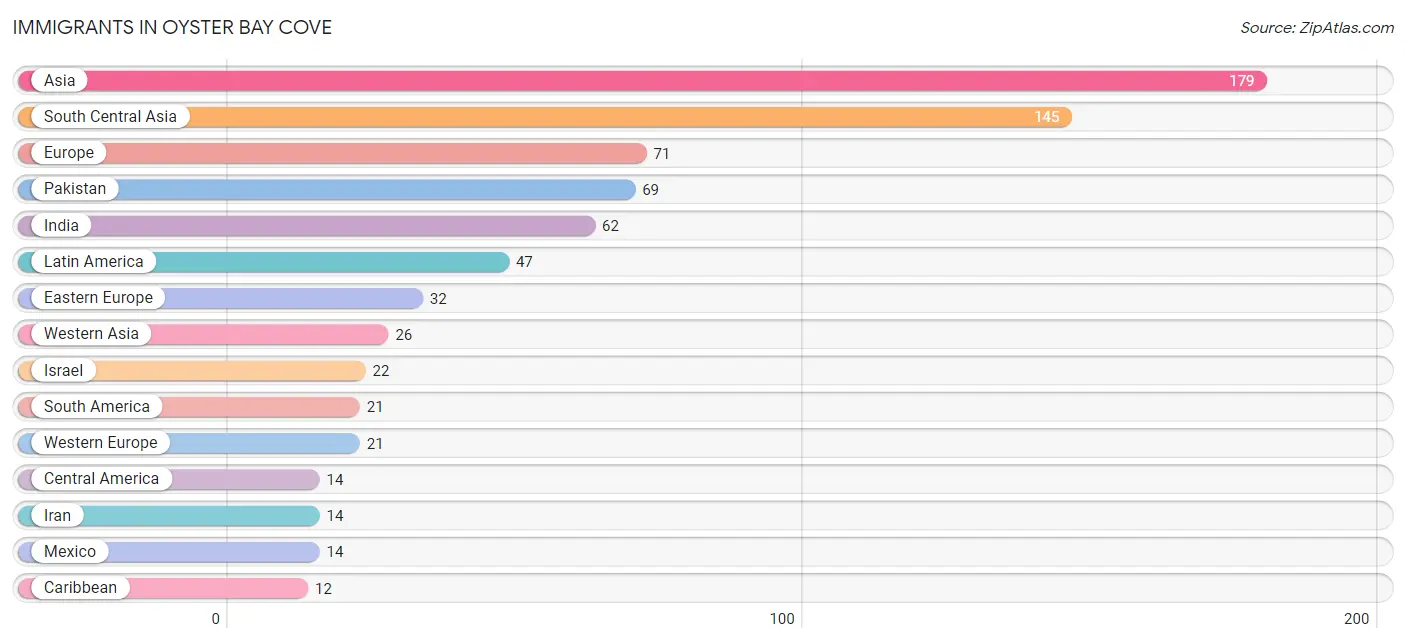
| Immigration Origin | # Population | % Population |
| Africa | 4 | 0.2% |
| Asia | 179 | 9.2% |
| Austria | 5 | 0.3% |
| Belarus | 10 | 0.5% |
| Brazil | 3 | 0.2% |
| Canada | 6 | 0.3% |
| Caribbean | 12 | 0.6% |
| Central America | 14 | 0.7% |
| China | 3 | 0.2% |
| Eastern Asia | 3 | 0.2% |
| Eastern Europe | 32 | 1.7% |
| Egypt | 4 | 0.2% |
| Europe | 71 | 3.7% |
| France | 9 | 0.5% |
| Germany | 7 | 0.4% |
| Greece | 4 | 0.2% |
| Guyana | 12 | 0.6% |
| Hungary | 5 | 0.3% |
| India | 62 | 3.2% |
| Iran | 14 | 0.7% |
| Israel | 22 | 1.1% |
| Italy | 6 | 0.3% |
| Jamaica | 12 | 0.6% |
| Kuwait | 4 | 0.2% |
| Latin America | 47 | 2.4% |
| Mexico | 14 | 0.7% |
| Northern Africa | 4 | 0.2% |
| Northern Europe | 8 | 0.4% |
| Pakistan | 69 | 3.5% |
| Peru | 6 | 0.3% |
| Philippines | 5 | 0.3% |
| Romania | 12 | 0.6% |
| Scotland | 4 | 0.2% |
| South America | 21 | 1.1% |
| South Central Asia | 145 | 7.5% |
| South Eastern Asia | 5 | 0.3% |
| Southern Europe | 10 | 0.5% |
| Sweden | 4 | 0.2% |
| Ukraine | 2 | 0.1% |
| Western Asia | 26 | 1.3% |
| Western Europe | 21 | 1.1% | View All 41 Rows |
Sex and Age in Oyster Bay Cove
Sex and Age in Oyster Bay Cove
The most populous age groups in Oyster Bay Cove are 50 to 54 Years (163 | 16.4%) for men and 55 to 59 Years (97 | 10.2%) for women.
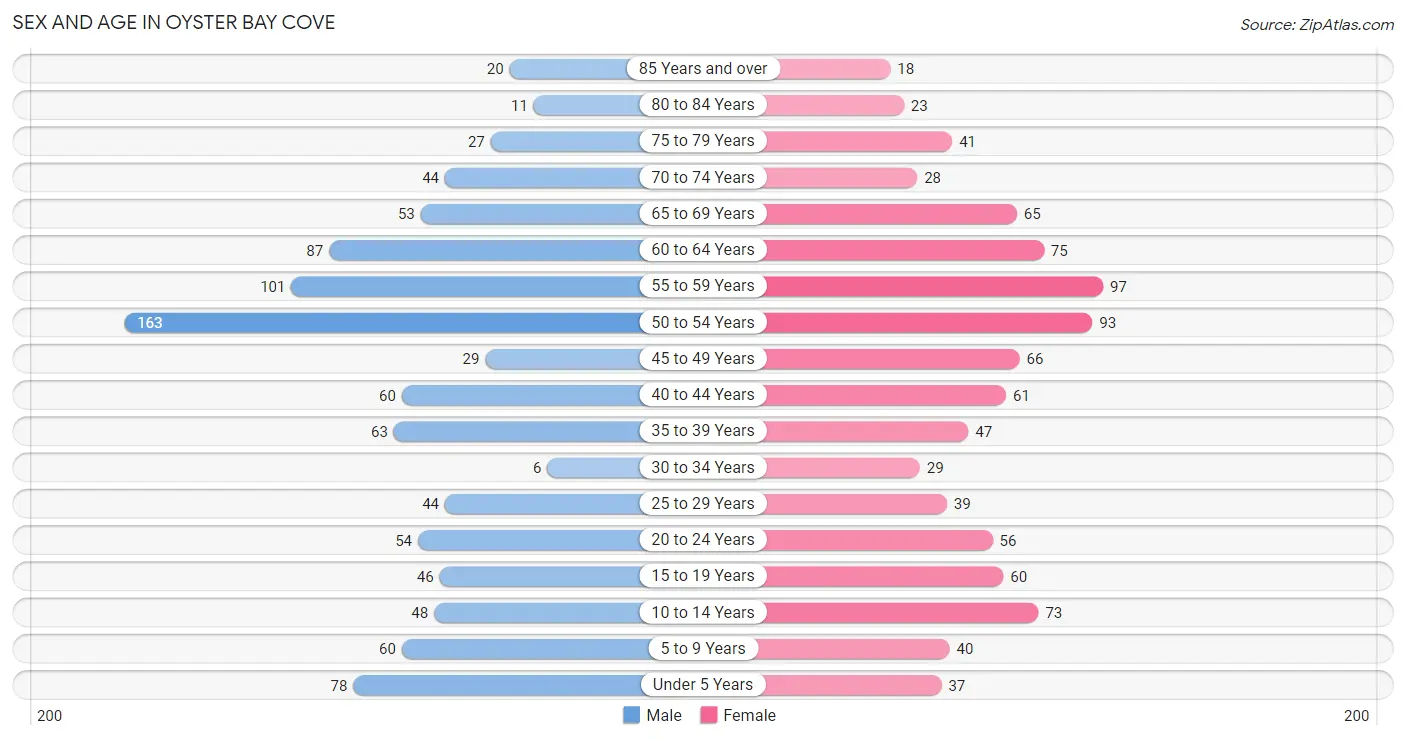
| Age Bracket | Male | Female |
| Under 5 Years | 78 (7.9%) | 37 (3.9%) |
| 5 to 9 Years | 60 (6.0%) | 40 (4.2%) |
| 10 to 14 Years | 48 (4.8%) | 73 (7.7%) |
| 15 to 19 Years | 46 (4.6%) | 60 (6.3%) |
| 20 to 24 Years | 54 (5.4%) | 56 (5.9%) |
| 25 to 29 Years | 44 (4.4%) | 39 (4.1%) |
| 30 to 34 Years | 6 (0.6%) | 29 (3.1%) |
| 35 to 39 Years | 63 (6.3%) | 47 (5.0%) |
| 40 to 44 Years | 60 (6.0%) | 61 (6.4%) |
| 45 to 49 Years | 29 (2.9%) | 66 (7.0%) |
| 50 to 54 Years | 163 (16.4%) | 93 (9.8%) |
| 55 to 59 Years | 101 (10.2%) | 97 (10.2%) |
| 60 to 64 Years | 87 (8.7%) | 75 (7.9%) |
| 65 to 69 Years | 53 (5.3%) | 65 (6.9%) |
| 70 to 74 Years | 44 (4.4%) | 28 (2.9%) |
| 75 to 79 Years | 27 (2.7%) | 41 (4.3%) |
| 80 to 84 Years | 11 (1.1%) | 23 (2.4%) |
| 85 Years and over | 20 (2.0%) | 18 (1.9%) |
| Total | 994 (100.0%) | 948 (100.0%) |
Families and Households in Oyster Bay Cove
Median Family Size in Oyster Bay Cove
The median family size in Oyster Bay Cove is 3.31 persons per family, with married-couple families (481 | 88.4%) accounting for the largest median family size of 3.46 persons per family. On the other hand, single female/mother families (33 | 6.1%) represent the smallest median family size with 2.06 persons per family.
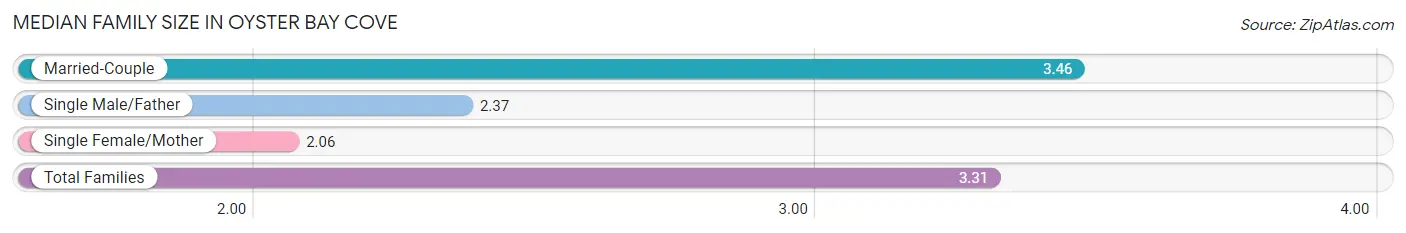
| Family Type | # Families | Family Size |
| Married-Couple | 481 (88.4%) | 3.46 |
| Single Male/Father | 30 (5.5%) | 2.37 |
| Single Female/Mother | 33 (6.1%) | 2.06 |
| Total Families | 544 (100.0%) | 3.31 |
Median Household Size in Oyster Bay Cove
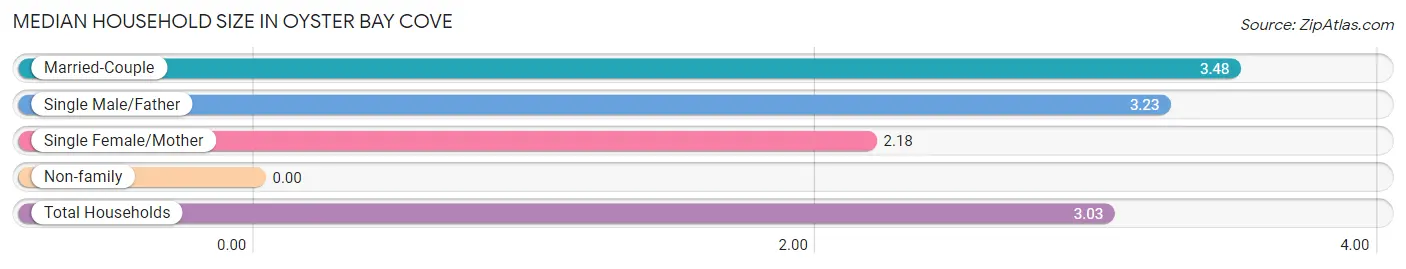
| Household Type | # Households | Household Size |
| Married-Couple | 481 (75.0%) | 3.48 |
| Single Male/Father | 30 (4.7%) | 3.23 |
| Single Female/Mother | 33 (5.1%) | 2.18 |
| Non-family | 97 (15.1%) | - |
| Total Households | 641 (100.0%) | 3.03 |
Household Size by Marriage Status in Oyster Bay Cove
Out of a total of 641 households in Oyster Bay Cove, 544 (84.9%) are family households, while 97 (15.1%) are nonfamily households. The most numerous type of family households are 2-person households, comprising 220, and the most common type of nonfamily households are 1-person households, comprising 97.
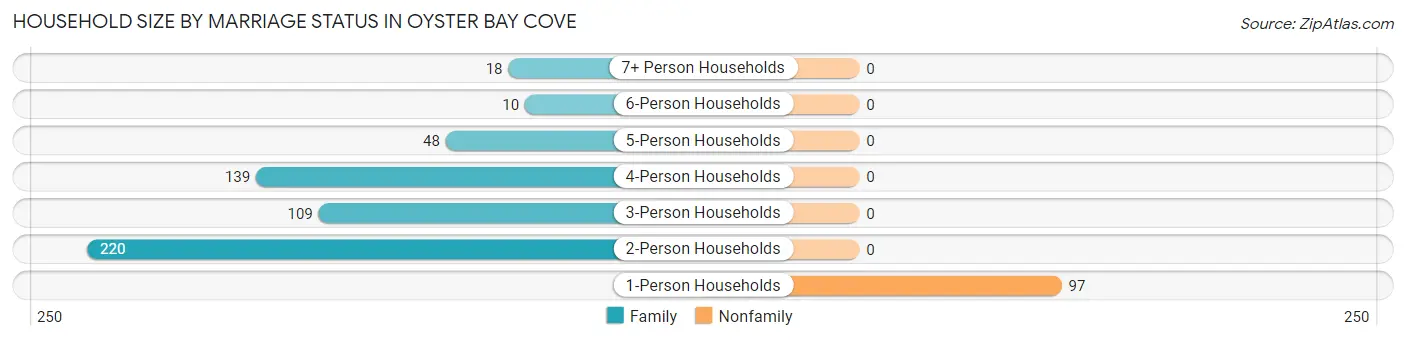
| Household Size | Family Households | Nonfamily Households |
| 1-Person Households | - | 97 (15.1%) |
| 2-Person Households | 220 (34.3%) | 0 (0.0%) |
| 3-Person Households | 109 (17.0%) | 0 (0.0%) |
| 4-Person Households | 139 (21.7%) | 0 (0.0%) |
| 5-Person Households | 48 (7.5%) | 0 (0.0%) |
| 6-Person Households | 10 (1.6%) | 0 (0.0%) |
| 7+ Person Households | 18 (2.8%) | 0 (0.0%) |
| Total | 544 (84.9%) | 97 (15.1%) |
Female Fertility in Oyster Bay Cove
Fertility by Age in Oyster Bay Cove
Average fertility rate in Oyster Bay Cove is 14.0 births per 1,000 women. Women in the age bracket of 35 to 50 years have the highest fertility rate with 27.0 births per 1,000 women. Women in the age bracket of 35 to 50 years acount for 100.0% of all women with births.
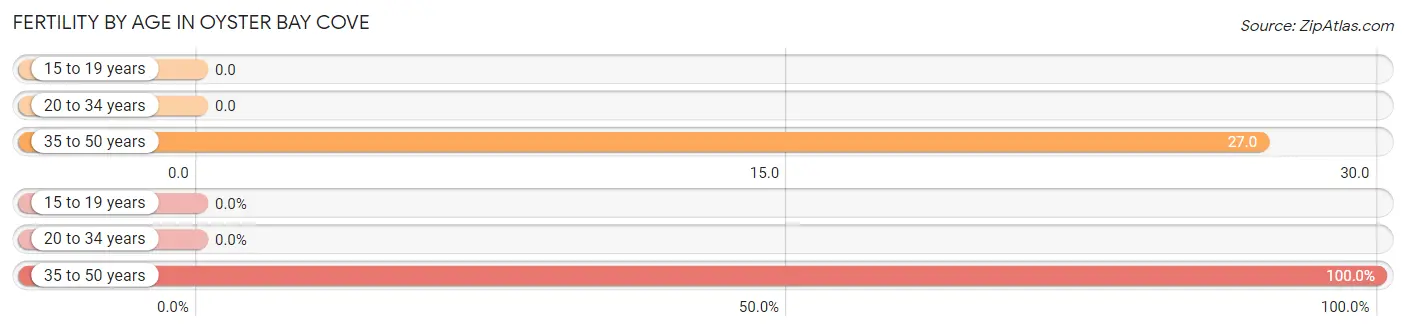
| Age Bracket | Women with Births | Births / 1,000 Women |
| 15 to 19 years | 0 (0.0%) | 0.0 |
| 20 to 34 years | 0 (0.0%) | 0.0 |
| 35 to 50 years | 5 (100.0%) | 27.0 |
| Total | 5 (100.0%) | 14.0 |
Fertility by Age by Marriage Status in Oyster Bay Cove
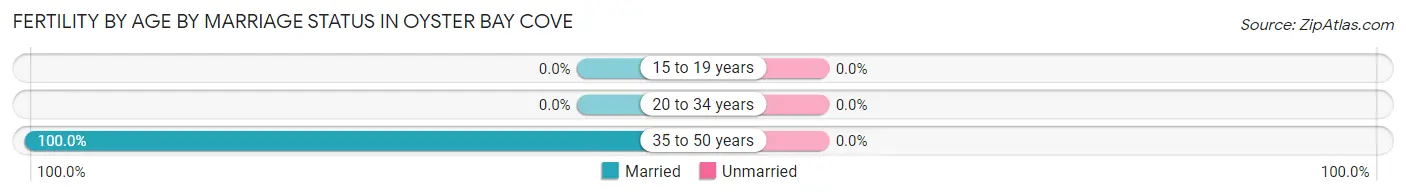
| Age Bracket | Married | Unmarried |
| 15 to 19 years | 0 (0.0%) | 0 (0.0%) |
| 20 to 34 years | 0 (0.0%) | 0 (0.0%) |
| 35 to 50 years | 5 (100.0%) | 0 (0.0%) |
| Total | 5 (100.0%) | 0 (0.0%) |
Fertility by Education in Oyster Bay Cove
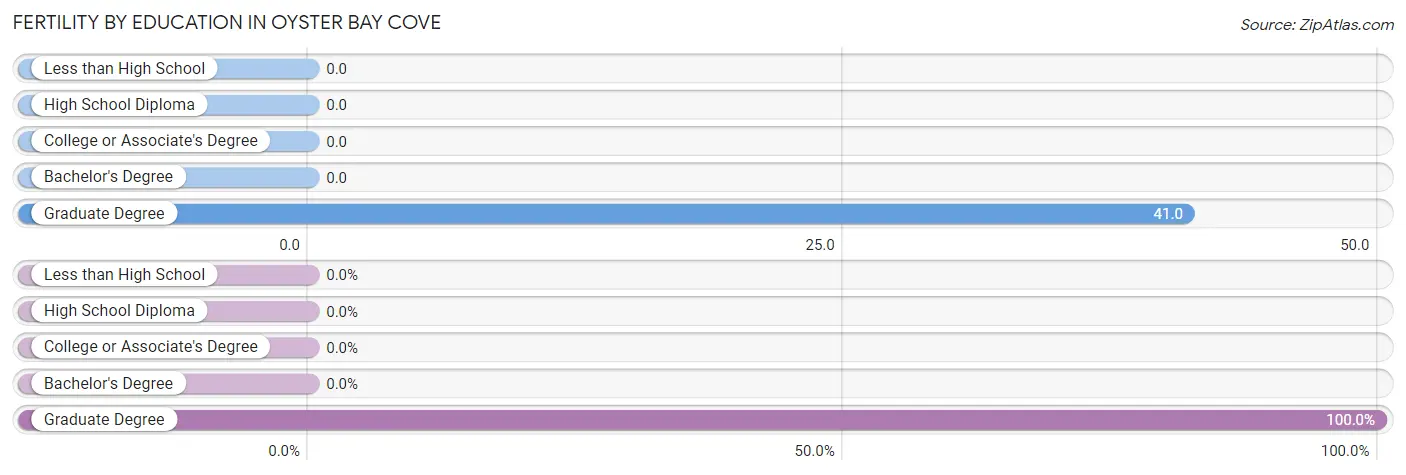
| Educational Attainment | Women with Births | Births / 1,000 Women |
| Less than High School | 0 (0.0%) | 0.0 |
| High School Diploma | 0 (0.0%) | 0.0 |
| College or Associate's Degree | 0 (0.0%) | 0.0 |
| Bachelor's Degree | 0 (0.0%) | 0.0 |
| Graduate Degree | 5 (100.0%) | 41.0 |
| Total | 5 (100.0%) | 14.0 |
Fertility by Education by Marriage Status in Oyster Bay Cove
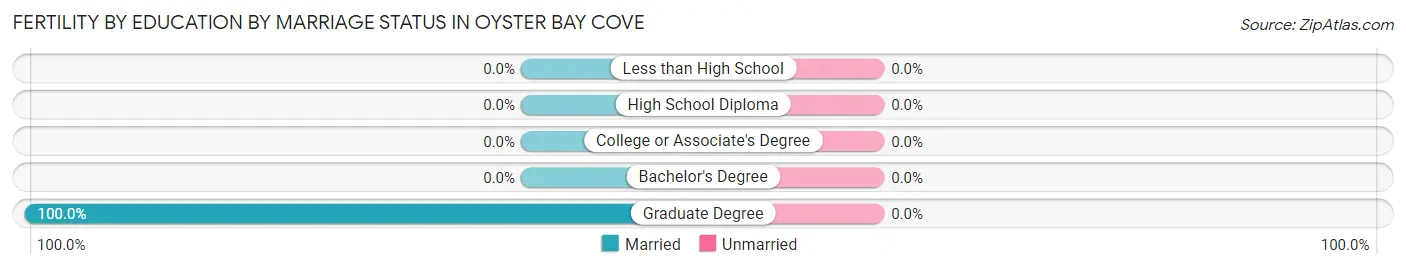
| Educational Attainment | Married | Unmarried |
| Less than High School | 0 (0.0%) | 0 (0.0%) |
| High School Diploma | 0 (0.0%) | 0 (0.0%) |
| College or Associate's Degree | 0 (0.0%) | 0 (0.0%) |
| Bachelor's Degree | 0 (0.0%) | 0 (0.0%) |
| Graduate Degree | 5 (100.0%) | 0 (0.0%) |
| Total | 5 (100.0%) | 0 (0.0%) |
Employment Characteristics in Oyster Bay Cove
Employment by Class of Employer in Oyster Bay Cove
Among the 898 employed individuals in Oyster Bay Cove, private company employees (525 | 58.5%), self-employed (incorporated) (159 | 17.7%), and self-employed (not incorporated) (73 | 8.1%) make up the most common classes of employment.
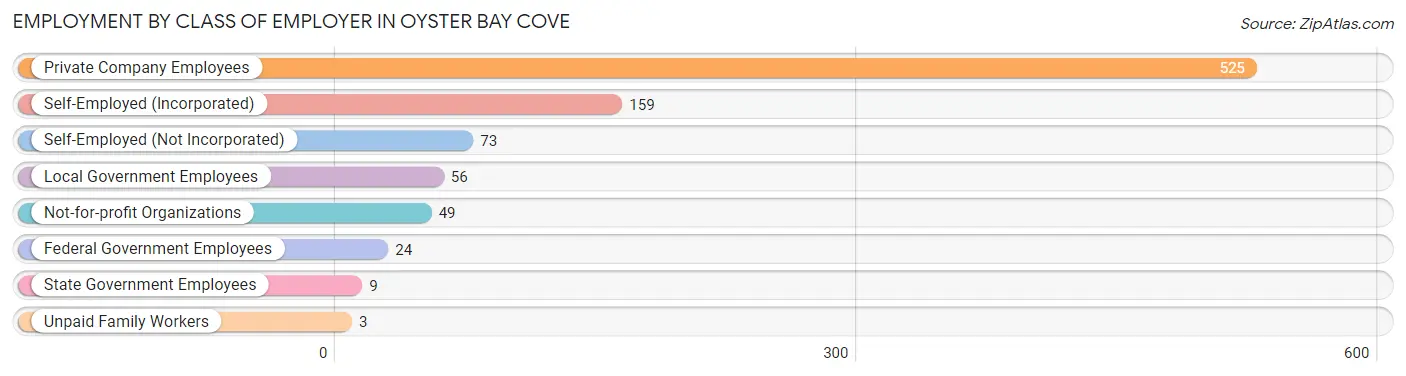
| Employer Class | # Employees | % Employees |
| Private Company Employees | 525 | 58.5% |
| Self-Employed (Incorporated) | 159 | 17.7% |
| Self-Employed (Not Incorporated) | 73 | 8.1% |
| Not-for-profit Organizations | 49 | 5.5% |
| Local Government Employees | 56 | 6.2% |
| State Government Employees | 9 | 1.0% |
| Federal Government Employees | 24 | 2.7% |
| Unpaid Family Workers | 3 | 0.3% |
| Total | 898 | 100.0% |
Employment Status by Age in Oyster Bay Cove
According to the labor force statistics for Oyster Bay Cove, out of the total population over 16 years of age (1,585), 62.1% or 984 individuals are in the labor force, with 7.8% or 77 of them unemployed. The age group with the highest labor force participation rate is 60 to 64 years, with 81.5% or 132 individuals in the labor force. Within the labor force, the 20 to 24 years age range has the highest percentage of unemployed individuals, with 27.3% or 21 of them being unemployed.
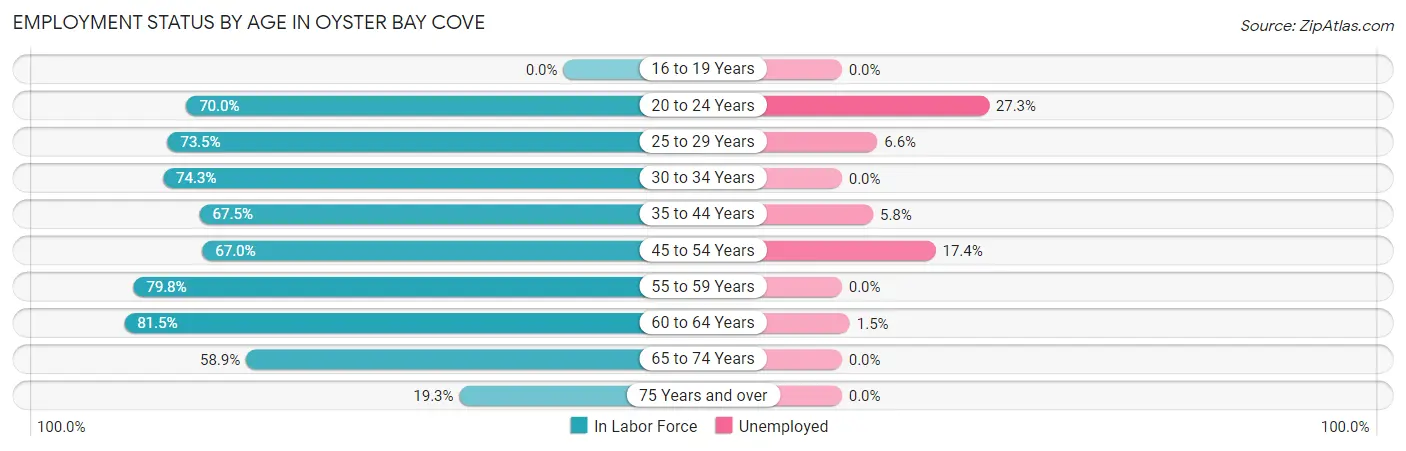
| Age Bracket | In Labor Force | Unemployed |
| 16 to 19 Years | 0 (0.0%) | 0 (0.0%) |
| 20 to 24 Years | 77 (70.0%) | 21 (27.3%) |
| 25 to 29 Years | 61 (73.5%) | 4 (6.6%) |
| 30 to 34 Years | 26 (74.3%) | 0 (0.0%) |
| 35 to 44 Years | 156 (67.5%) | 9 (5.8%) |
| 45 to 54 Years | 235 (67.0%) | 41 (17.4%) |
| 55 to 59 Years | 158 (79.8%) | 0 (0.0%) |
| 60 to 64 Years | 132 (81.5%) | 2 (1.5%) |
| 65 to 74 Years | 112 (58.9%) | 0 (0.0%) |
| 75 Years and over | 27 (19.3%) | 0 (0.0%) |
| Total | 984 (62.1%) | 77 (7.8%) |
Employment Status by Educational Attainment in Oyster Bay Cove
According to labor force statistics for Oyster Bay Cove, 72.5% of individuals (768) out of the total population between 25 and 64 years of age (1,060) are in the labor force, with 7.3% or 56 of them being unemployed. The group with the highest labor force participation rate are those with the educational attainment of bachelor's degree or higher, with 77.1% or 638 individuals in the labor force. Within the labor force, individuals with bachelor's degree or higher education have the highest percentage of unemployment, with 8.5% or 54 of them being unemployed.
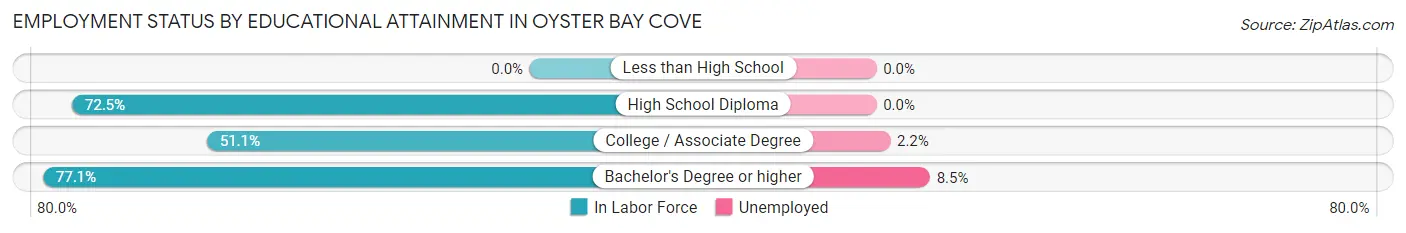
| Educational Attainment | In Labor Force | Unemployed |
| Less than High School | 0 (0.0%) | 0 (0.0%) |
| High School Diploma | 37 (72.5%) | 0 (0.0%) |
| College / Associate Degree | 93 (51.1%) | 4 (2.2%) |
| Bachelor's Degree or higher | 638 (77.1%) | 70 (8.5%) |
| Total | 768 (72.5%) | 77 (7.3%) |
Employment Occupations by Sex in Oyster Bay Cove
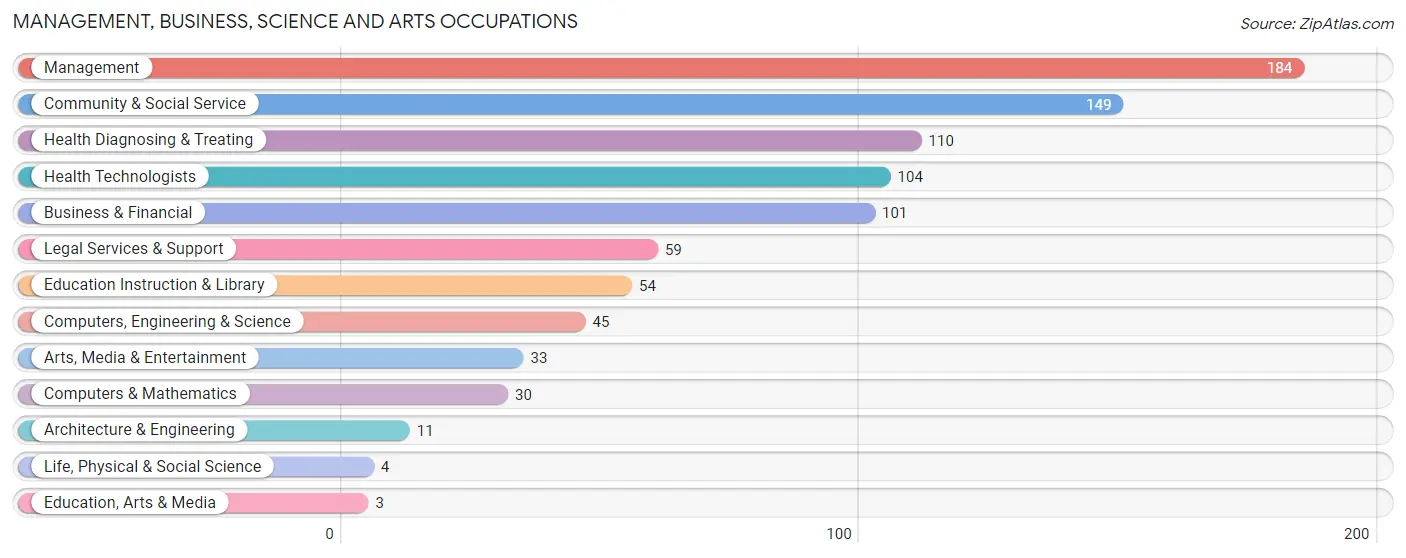
Management, Business, Science and Arts Occupations
The most common Management, Business, Science and Arts occupations in Oyster Bay Cove are Management (184 | 20.3%), Community & Social Service (149 | 16.4%), Health Diagnosing & Treating (110 | 12.1%), Health Technologists (104 | 11.5%), and Business & Financial (101 | 11.1%).
Management, Business, Science and Arts Occupations by Sex
Within the Management, Business, Science and Arts occupations in Oyster Bay Cove, the most male-oriented occupations are Life, Physical & Social Science (100.0%), Computers, Engineering & Science (84.4%), and Computers & Mathematics (83.3%), while the most female-oriented occupations are Education, Arts & Media (100.0%), Education Instruction & Library (88.9%), and Arts, Media & Entertainment (72.7%).
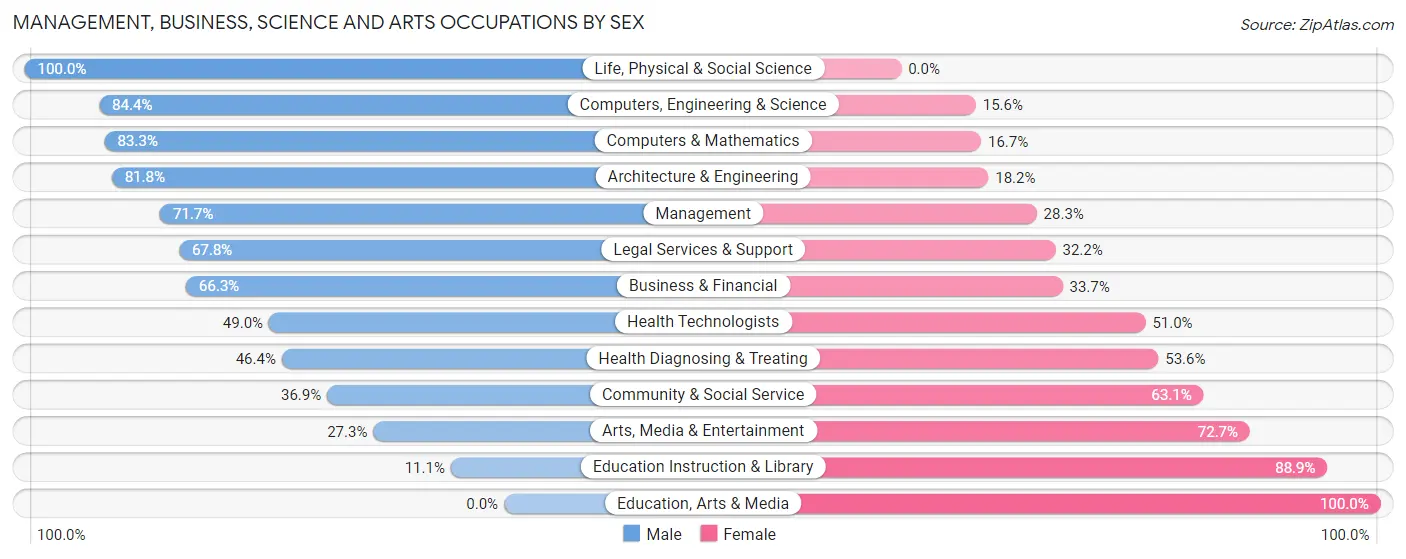
| Occupation | Male | Female |
| Management | 132 (71.7%) | 52 (28.3%) |
| Business & Financial | 67 (66.3%) | 34 (33.7%) |
| Computers, Engineering & Science | 38 (84.4%) | 7 (15.6%) |
| Computers & Mathematics | 25 (83.3%) | 5 (16.7%) |
| Architecture & Engineering | 9 (81.8%) | 2 (18.2%) |
| Life, Physical & Social Science | 4 (100.0%) | 0 (0.0%) |
| Community & Social Service | 55 (36.9%) | 94 (63.1%) |
| Education, Arts & Media | 0 (0.0%) | 3 (100.0%) |
| Legal Services & Support | 40 (67.8%) | 19 (32.2%) |
| Education Instruction & Library | 6 (11.1%) | 48 (88.9%) |
| Arts, Media & Entertainment | 9 (27.3%) | 24 (72.7%) |
| Health Diagnosing & Treating | 51 (46.4%) | 59 (53.6%) |
| Health Technologists | 51 (49.0%) | 53 (51.0%) |
| Total (Category) | 343 (58.2%) | 246 (41.8%) |
| Total (Overall) | 537 (59.2%) | 370 (40.8%) |
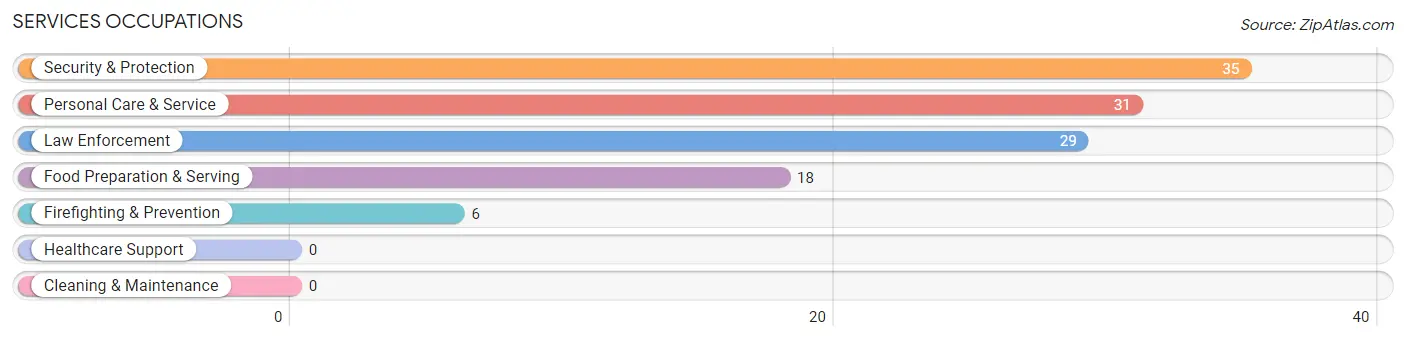
Services Occupations
The most common Services occupations in Oyster Bay Cove are Security & Protection (35 | 3.9%), Personal Care & Service (31 | 3.4%), Law Enforcement (29 | 3.2%), Food Preparation & Serving (18 | 2.0%), and Firefighting & Prevention (6 | 0.7%).
Services Occupations by Sex
Within the Services occupations in Oyster Bay Cove, the most male-oriented occupations are Firefighting & Prevention (100.0%), Security & Protection (94.3%), and Law Enforcement (93.1%), while the most female-oriented occupations are Personal Care & Service (83.9%), Food Preparation & Serving (50.0%), and Law Enforcement (6.9%).
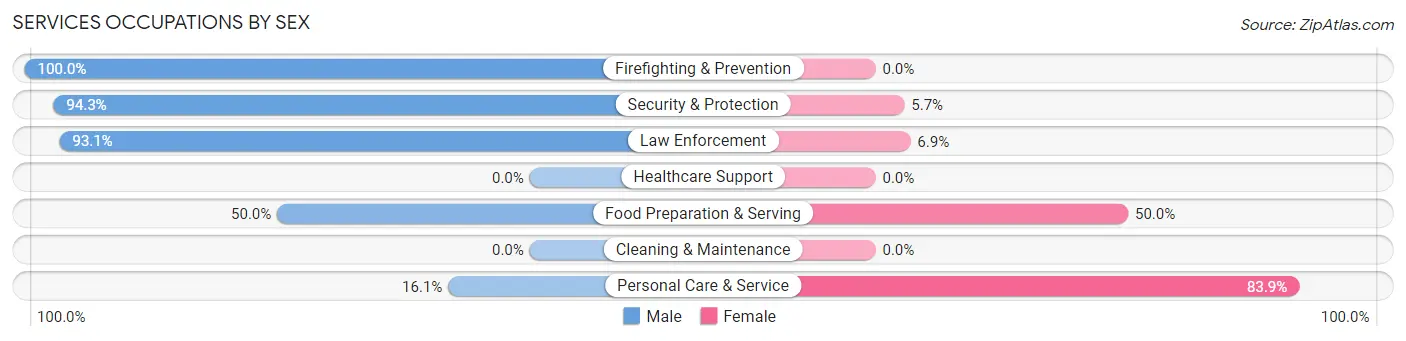
| Occupation | Male | Female |
| Healthcare Support | 0 (0.0%) | 0 (0.0%) |
| Security & Protection | 33 (94.3%) | 2 (5.7%) |
| Firefighting & Prevention | 6 (100.0%) | 0 (0.0%) |
| Law Enforcement | 27 (93.1%) | 2 (6.9%) |
| Food Preparation & Serving | 9 (50.0%) | 9 (50.0%) |
| Cleaning & Maintenance | 0 (0.0%) | 0 (0.0%) |
| Personal Care & Service | 5 (16.1%) | 26 (83.9%) |
| Total (Category) | 47 (55.9%) | 37 (44.1%) |
| Total (Overall) | 537 (59.2%) | 370 (40.8%) |
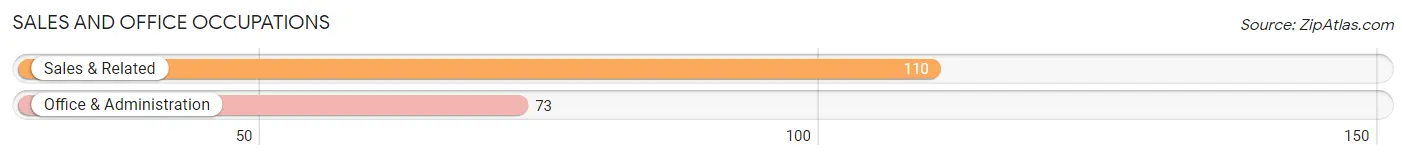
Sales and Office Occupations
The most common Sales and Office occupations in Oyster Bay Cove are Sales & Related (110 | 12.1%), and Office & Administration (73 | 8.1%).
Sales and Office Occupations by Sex
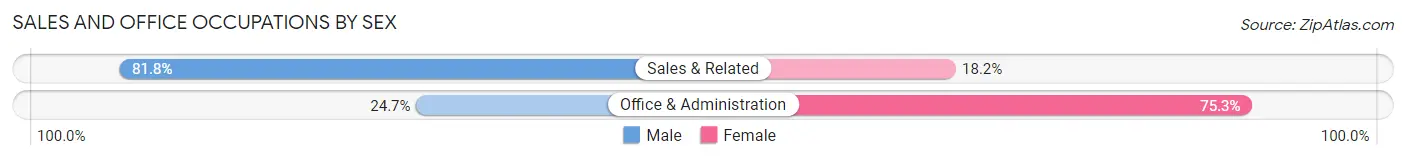
| Occupation | Male | Female |
| Sales & Related | 90 (81.8%) | 20 (18.2%) |
| Office & Administration | 18 (24.7%) | 55 (75.3%) |
| Total (Category) | 108 (59.0%) | 75 (41.0%) |
| Total (Overall) | 537 (59.2%) | 370 (40.8%) |
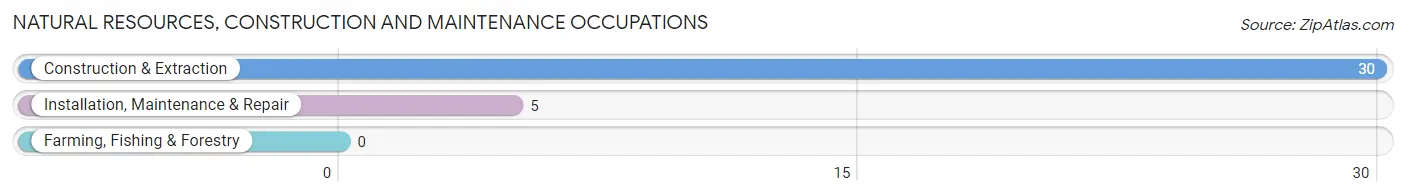
Natural Resources, Construction and Maintenance Occupations
The most common Natural Resources, Construction and Maintenance occupations in Oyster Bay Cove are Construction & Extraction (30 | 3.3%), and Installation, Maintenance & Repair (5 | 0.5%).
Natural Resources, Construction and Maintenance Occupations by Sex
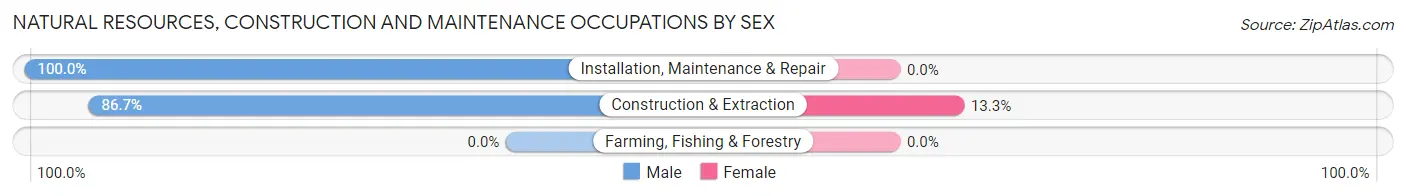
| Occupation | Male | Female |
| Farming, Fishing & Forestry | 0 (0.0%) | 0 (0.0%) |
| Construction & Extraction | 26 (86.7%) | 4 (13.3%) |
| Installation, Maintenance & Repair | 5 (100.0%) | 0 (0.0%) |
| Total (Category) | 31 (88.6%) | 4 (11.4%) |
| Total (Overall) | 537 (59.2%) | 370 (40.8%) |
Production, Transportation and Moving Occupations
The most common Production, Transportation and Moving occupations in Oyster Bay Cove are Transportation (8 | 0.9%), and Material Moving (8 | 0.9%).
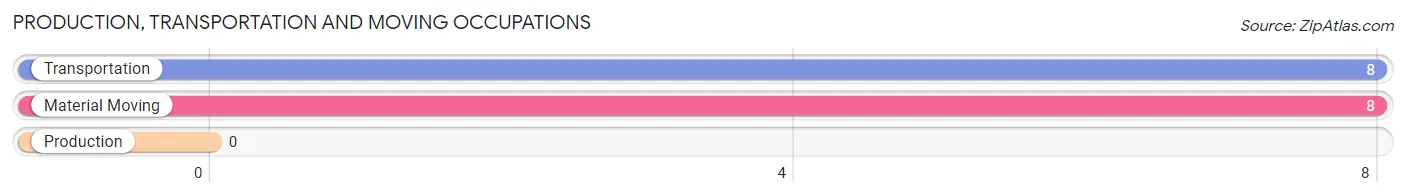
Production, Transportation and Moving Occupations by Sex
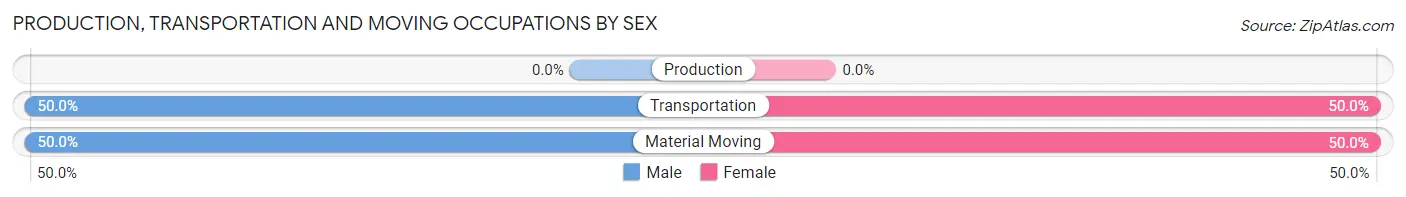
| Occupation | Male | Female |
| Production | 0 (0.0%) | 0 (0.0%) |
| Transportation | 4 (50.0%) | 4 (50.0%) |
| Material Moving | 4 (50.0%) | 4 (50.0%) |
| Total (Category) | 8 (50.0%) | 8 (50.0%) |
| Total (Overall) | 537 (59.2%) | 370 (40.8%) |
Employment Industries by Sex in Oyster Bay Cove
Employment Industries in Oyster Bay Cove
The major employment industries in Oyster Bay Cove include Finance & Insurance (167 | 18.4%), Professional & Scientific (158 | 17.4%), Health Care & Social Assistance (157 | 17.3%), Educational Services (72 | 7.9%), and Real Estate, Rental & Leasing (54 | 5.9%).
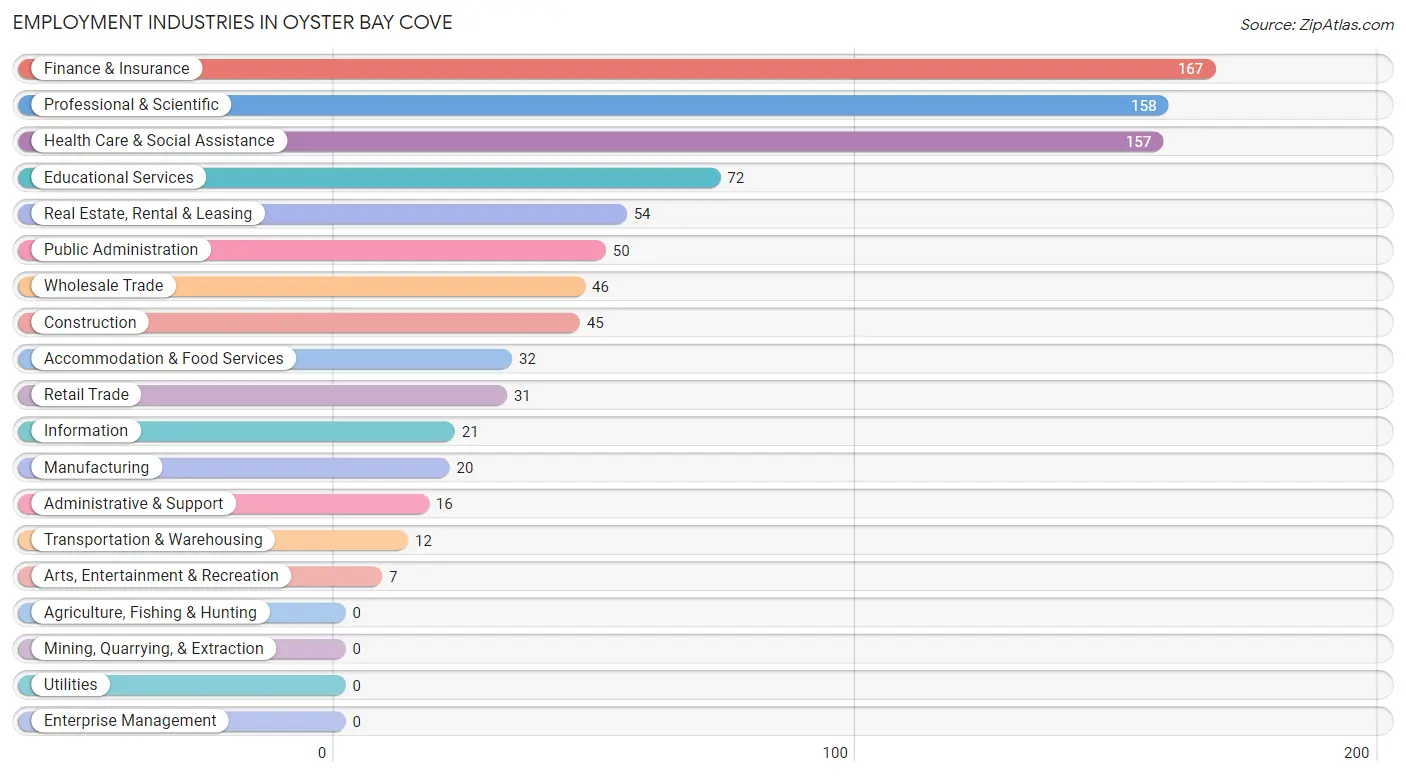
Employment Industries by Sex in Oyster Bay Cove
The Oyster Bay Cove industries that see more men than women are Finance & Insurance (92.8%), Construction (86.7%), and Accommodation & Food Services (71.9%), whereas the industries that tend to have a higher number of women are Educational Services (77.8%), Retail Trade (74.2%), and Health Care & Social Assistance (64.3%).
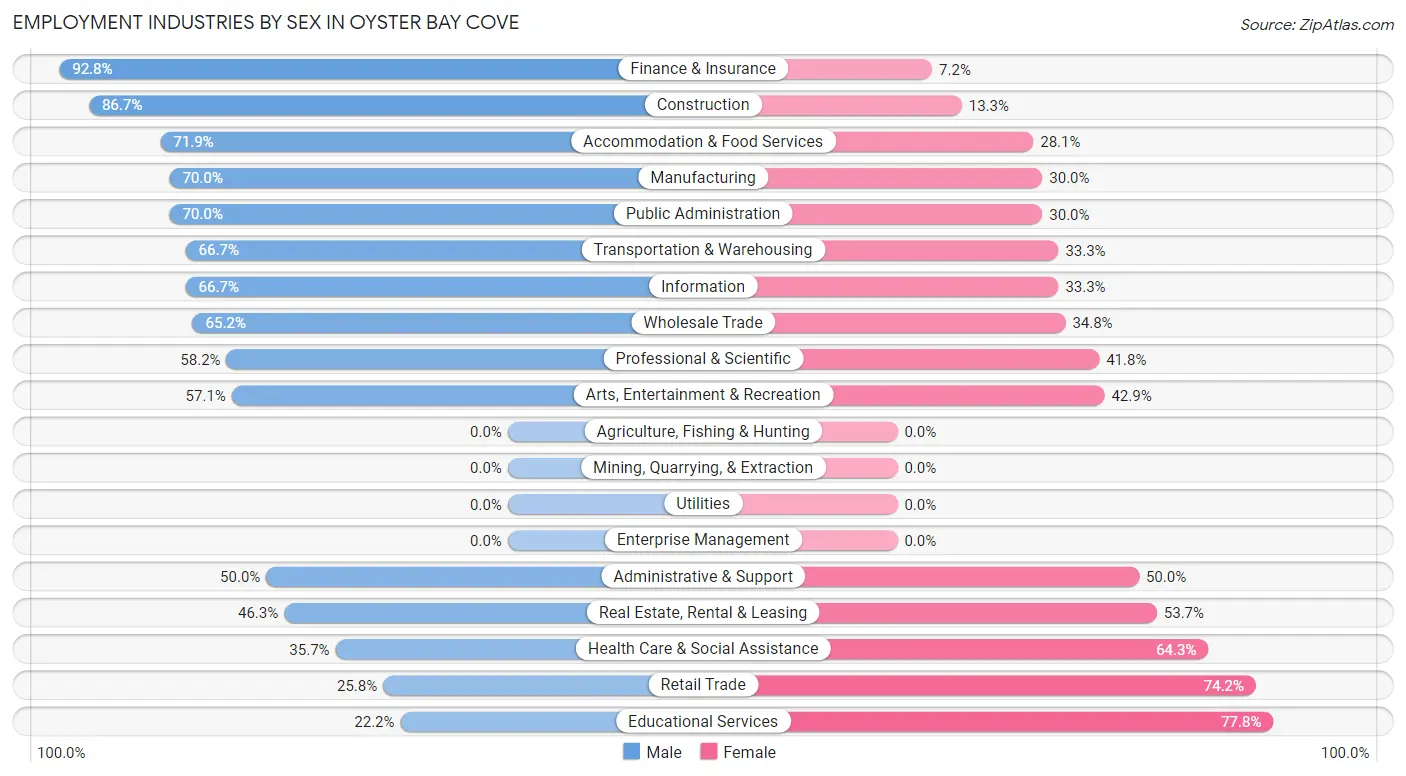
| Industry | Male | Female |
| Agriculture, Fishing & Hunting | 0 (0.0%) | 0 (0.0%) |
| Mining, Quarrying, & Extraction | 0 (0.0%) | 0 (0.0%) |
| Construction | 39 (86.7%) | 6 (13.3%) |
| Manufacturing | 14 (70.0%) | 6 (30.0%) |
| Wholesale Trade | 30 (65.2%) | 16 (34.8%) |
| Retail Trade | 8 (25.8%) | 23 (74.2%) |
| Transportation & Warehousing | 8 (66.7%) | 4 (33.3%) |
| Utilities | 0 (0.0%) | 0 (0.0%) |
| Information | 14 (66.7%) | 7 (33.3%) |
| Finance & Insurance | 155 (92.8%) | 12 (7.2%) |
| Real Estate, Rental & Leasing | 25 (46.3%) | 29 (53.7%) |
| Professional & Scientific | 92 (58.2%) | 66 (41.8%) |
| Enterprise Management | 0 (0.0%) | 0 (0.0%) |
| Administrative & Support | 8 (50.0%) | 8 (50.0%) |
| Educational Services | 16 (22.2%) | 56 (77.8%) |
| Health Care & Social Assistance | 56 (35.7%) | 101 (64.3%) |
| Arts, Entertainment & Recreation | 4 (57.1%) | 3 (42.9%) |
| Accommodation & Food Services | 23 (71.9%) | 9 (28.1%) |
| Public Administration | 35 (70.0%) | 15 (30.0%) |
| Total | 537 (59.2%) | 370 (40.8%) |
Education in Oyster Bay Cove
School Enrollment in Oyster Bay Cove
The most common levels of schooling among the 472 students in Oyster Bay Cove are high school (124 | 26.3%), middle school (93 | 19.7%), and elementary school (91 | 19.3%).
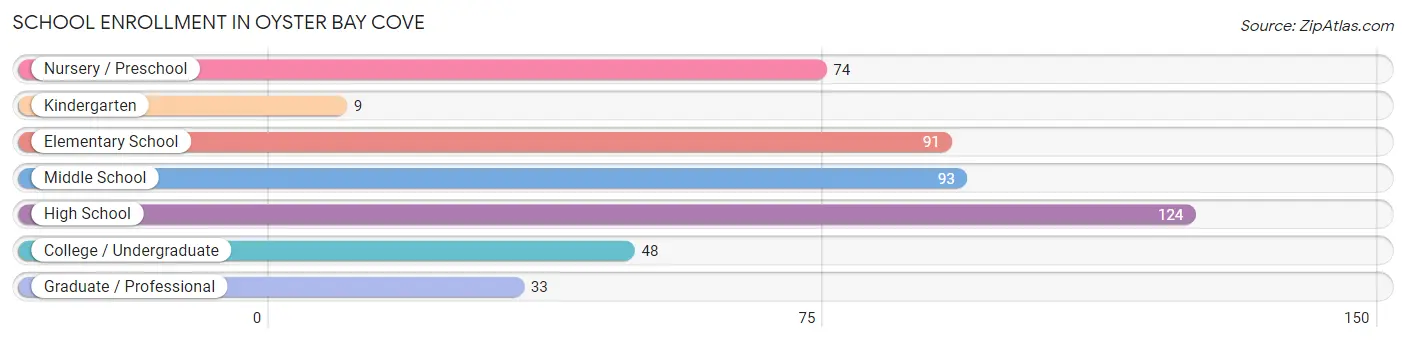
| School Level | # Students | % Students |
| Nursery / Preschool | 74 | 15.7% |
| Kindergarten | 9 | 1.9% |
| Elementary School | 91 | 19.3% |
| Middle School | 93 | 19.7% |
| High School | 124 | 26.3% |
| College / Undergraduate | 48 | 10.2% |
| Graduate / Professional | 33 | 7.0% |
| Total | 472 | 100.0% |
School Enrollment by Age by Funding Source in Oyster Bay Cove
Out of a total of 472 students who are enrolled in schools in Oyster Bay Cove, 151 (32.0%) attend a private institution, while the remaining 321 (68.0%) are enrolled in public schools. The age group of 25 to 34 year olds has the highest likelihood of being enrolled in private schools, with 11 (78.6% in the age bracket) enrolled. Conversely, the age group of 5 to 9 year old has the lowest likelihood of being enrolled in a private school, with 94 (94.0% in the age bracket) attending a public institution.
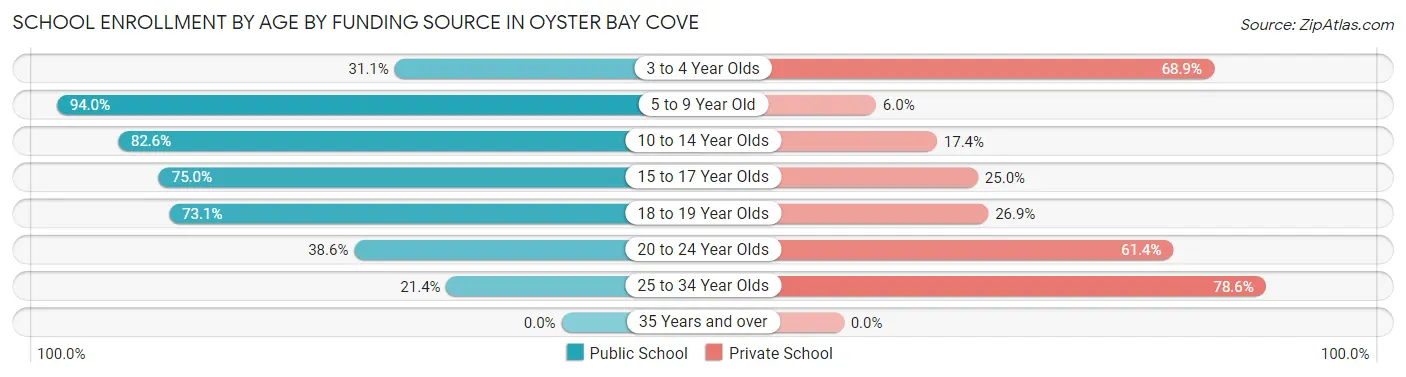
| Age Bracket | Public School | Private School |
| 3 to 4 Year Olds | 23 (31.1%) | 51 (68.9%) |
| 5 to 9 Year Old | 94 (94.0%) | 6 (6.0%) |
| 10 to 14 Year Olds | 100 (82.6%) | 21 (17.4%) |
| 15 to 17 Year Olds | 60 (75.0%) | 20 (25.0%) |
| 18 to 19 Year Olds | 19 (73.1%) | 7 (26.9%) |
| 20 to 24 Year Olds | 22 (38.6%) | 35 (61.4%) |
| 25 to 34 Year Olds | 3 (21.4%) | 11 (78.6%) |
| 35 Years and over | 0 (0.0%) | 0 (0.0%) |
| Total | 321 (68.0%) | 151 (32.0%) |
Educational Attainment by Field of Study in Oyster Bay Cove
Business (315 | 27.1%), social sciences (184 | 15.9%), science & technology (85 | 7.3%), education (84 | 7.2%), and psychology (80 | 6.9%) are the most common fields of study among 1,161 individuals in Oyster Bay Cove who have obtained a bachelor's degree or higher.
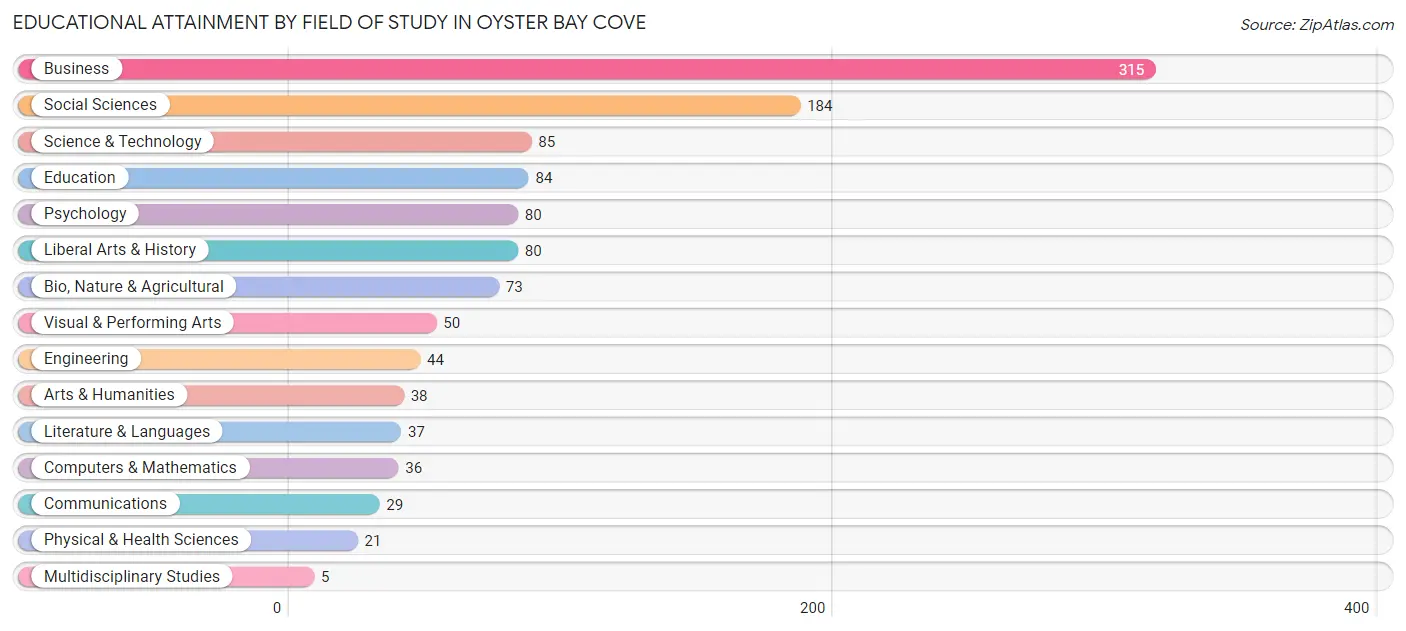
| Field of Study | # Graduates | % Graduates |
| Computers & Mathematics | 36 | 3.1% |
| Bio, Nature & Agricultural | 73 | 6.3% |
| Physical & Health Sciences | 21 | 1.8% |
| Psychology | 80 | 6.9% |
| Social Sciences | 184 | 15.9% |
| Engineering | 44 | 3.8% |
| Multidisciplinary Studies | 5 | 0.4% |
| Science & Technology | 85 | 7.3% |
| Business | 315 | 27.1% |
| Education | 84 | 7.2% |
| Literature & Languages | 37 | 3.2% |
| Liberal Arts & History | 80 | 6.9% |
| Visual & Performing Arts | 50 | 4.3% |
| Communications | 29 | 2.5% |
| Arts & Humanities | 38 | 3.3% |
| Total | 1,161 | 100.0% |
Transportation & Commute in Oyster Bay Cove
Vehicle Availability by Sex in Oyster Bay Cove
The most prevalent vehicle ownership categories in Oyster Bay Cove are males with 2 vehicles (231, accounting for 43.0%) and females with 2 vehicles (118, making up 64.0%).
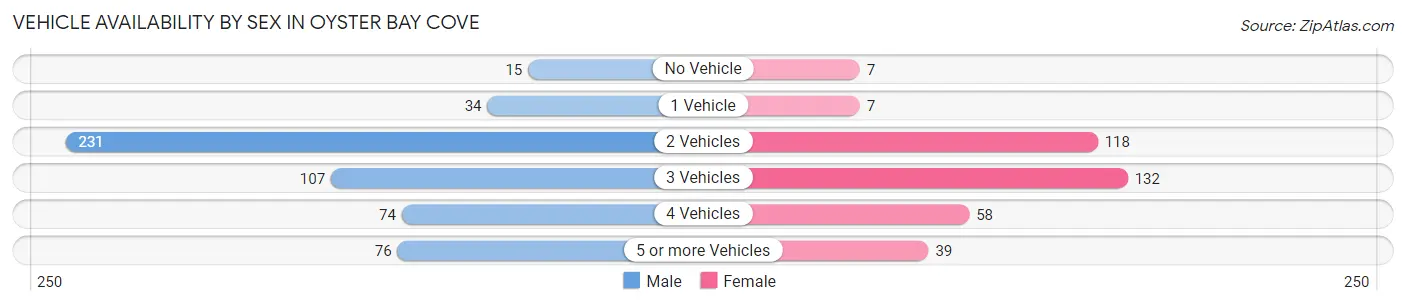
| Vehicles Available | Male | Female |
| No Vehicle | 15 (2.8%) | 7 (1.9%) |
| 1 Vehicle | 34 (6.3%) | 7 (1.9%) |
| 2 Vehicles | 231 (43.0%) | 118 (32.7%) |
| 3 Vehicles | 107 (19.9%) | 132 (36.6%) |
| 4 Vehicles | 74 (13.8%) | 58 (16.1%) |
| 5 or more Vehicles | 76 (14.1%) | 39 (10.8%) |
| Total | 537 (100.0%) | 361 (100.0%) |
Commute Time in Oyster Bay Cove
The most frequently occuring commute durations in Oyster Bay Cove are 45 to 59 minutes (118 commuters, 16.9%), 60 to 89 minutes (111 commuters, 15.9%), and 90 or more minutes (93 commuters, 13.3%).
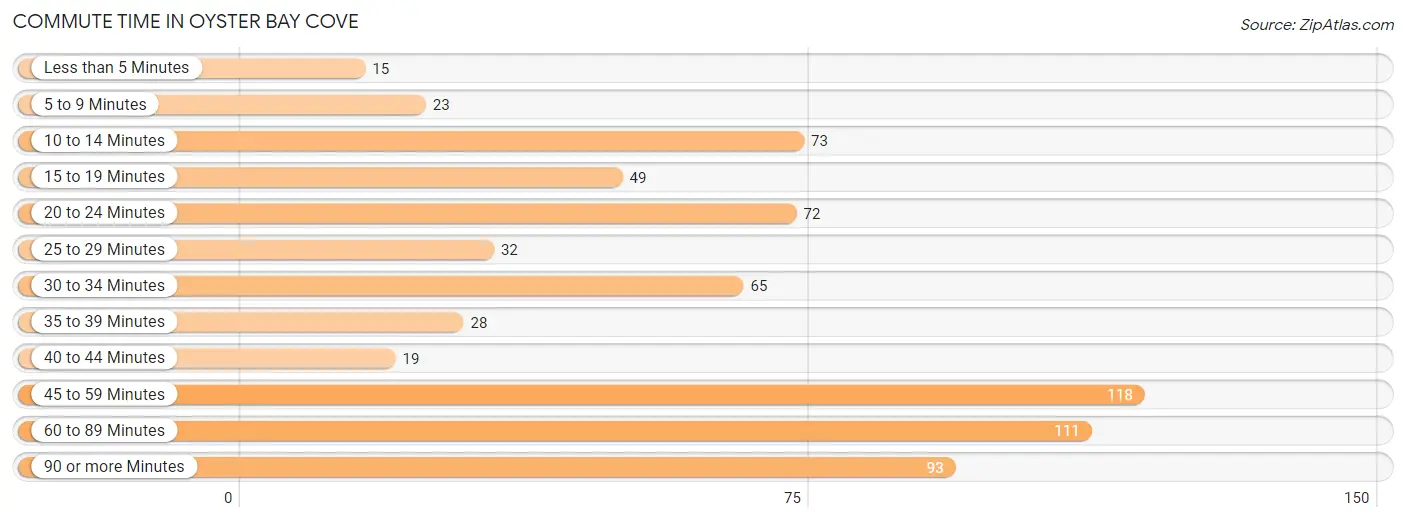
| Commute Time | # Commuters | % Commuters |
| Less than 5 Minutes | 15 | 2.1% |
| 5 to 9 Minutes | 23 | 3.3% |
| 10 to 14 Minutes | 73 | 10.5% |
| 15 to 19 Minutes | 49 | 7.0% |
| 20 to 24 Minutes | 72 | 10.3% |
| 25 to 29 Minutes | 32 | 4.6% |
| 30 to 34 Minutes | 65 | 9.3% |
| 35 to 39 Minutes | 28 | 4.0% |
| 40 to 44 Minutes | 19 | 2.7% |
| 45 to 59 Minutes | 118 | 16.9% |
| 60 to 89 Minutes | 111 | 15.9% |
| 90 or more Minutes | 93 | 13.3% |
Commute Time by Sex in Oyster Bay Cove
The most common commute times in Oyster Bay Cove are 60 to 89 minutes (76 commuters, 18.2%) for males and 45 to 59 minutes (58 commuters, 20.6%) for females.
| Commute Time | Male | Female |
| Less than 5 Minutes | 12 (2.9%) | 3 (1.1%) |
| 5 to 9 Minutes | 13 (3.1%) | 10 (3.6%) |
| 10 to 14 Minutes | 28 (6.7%) | 45 (16.0%) |
| 15 to 19 Minutes | 22 (5.3%) | 27 (9.6%) |
| 20 to 24 Minutes | 48 (11.5%) | 24 (8.5%) |
| 25 to 29 Minutes | 27 (6.5%) | 5 (1.8%) |
| 30 to 34 Minutes | 30 (7.2%) | 35 (12.5%) |
| 35 to 39 Minutes | 25 (6.0%) | 3 (1.1%) |
| 40 to 44 Minutes | 10 (2.4%) | 9 (3.2%) |
| 45 to 59 Minutes | 60 (14.4%) | 58 (20.6%) |
| 60 to 89 Minutes | 76 (18.2%) | 35 (12.5%) |
| 90 or more Minutes | 66 (15.8%) | 27 (9.6%) |
Time of Departure to Work by Sex in Oyster Bay Cove
The most frequent times of departure to work in Oyster Bay Cove are 7:00 AM to 7:29 AM (88, 21.1%) for males and 8:00 AM to 8:29 AM (51, 18.1%) for females.
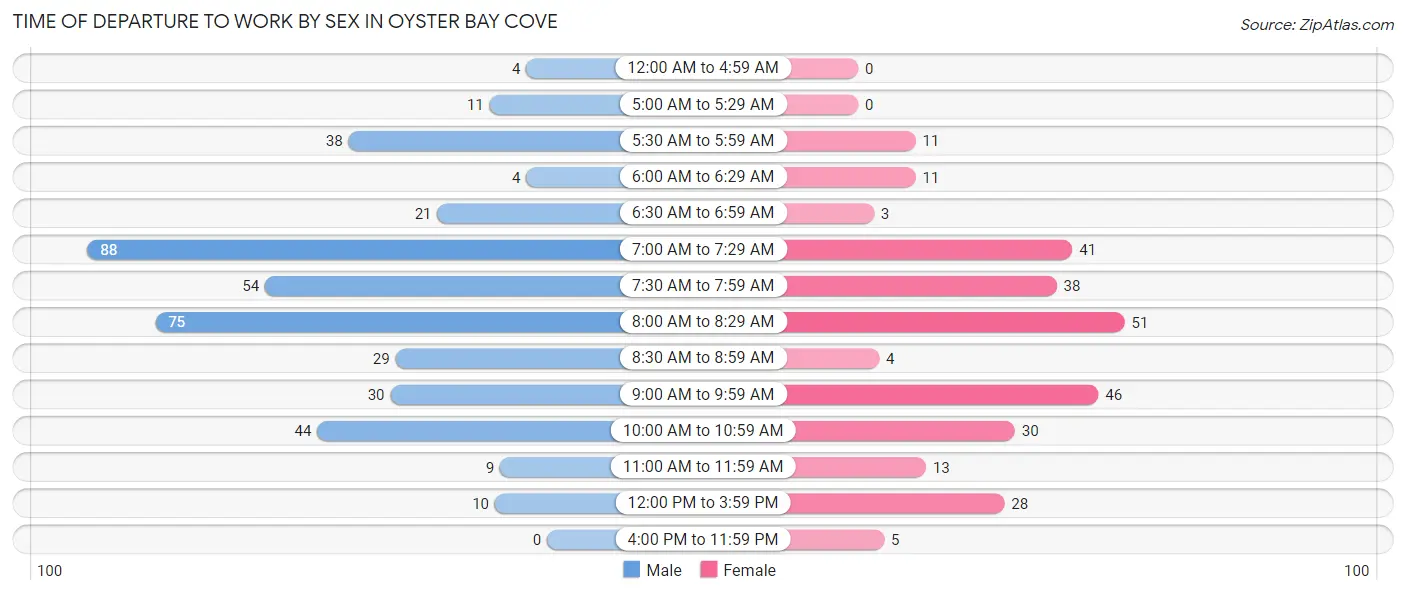
| Time of Departure | Male | Female |
| 12:00 AM to 4:59 AM | 4 (1.0%) | 0 (0.0%) |
| 5:00 AM to 5:29 AM | 11 (2.6%) | 0 (0.0%) |
| 5:30 AM to 5:59 AM | 38 (9.1%) | 11 (3.9%) |
| 6:00 AM to 6:29 AM | 4 (1.0%) | 11 (3.9%) |
| 6:30 AM to 6:59 AM | 21 (5.0%) | 3 (1.1%) |
| 7:00 AM to 7:29 AM | 88 (21.1%) | 41 (14.6%) |
| 7:30 AM to 7:59 AM | 54 (13.0%) | 38 (13.5%) |
| 8:00 AM to 8:29 AM | 75 (18.0%) | 51 (18.1%) |
| 8:30 AM to 8:59 AM | 29 (7.0%) | 4 (1.4%) |
| 9:00 AM to 9:59 AM | 30 (7.2%) | 46 (16.4%) |
| 10:00 AM to 10:59 AM | 44 (10.5%) | 30 (10.7%) |
| 11:00 AM to 11:59 AM | 9 (2.2%) | 13 (4.6%) |
| 12:00 PM to 3:59 PM | 10 (2.4%) | 28 (10.0%) |
| 4:00 PM to 11:59 PM | 0 (0.0%) | 5 (1.8%) |
| Total | 417 (100.0%) | 281 (100.0%) |
Housing Occupancy in Oyster Bay Cove
Occupancy by Ownership in Oyster Bay Cove
Of the total 641 dwellings in Oyster Bay Cove, owner-occupied units account for 586 (91.4%), while renter-occupied units make up 55 (8.6%).
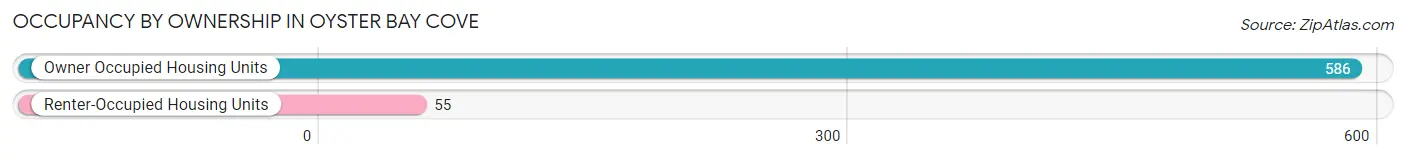
| Occupancy | # Housing Units | % Housing Units |
| Owner Occupied Housing Units | 586 | 91.4% |
| Renter-Occupied Housing Units | 55 | 8.6% |
| Total Occupied Housing Units | 641 | 100.0% |
Occupancy by Household Size in Oyster Bay Cove
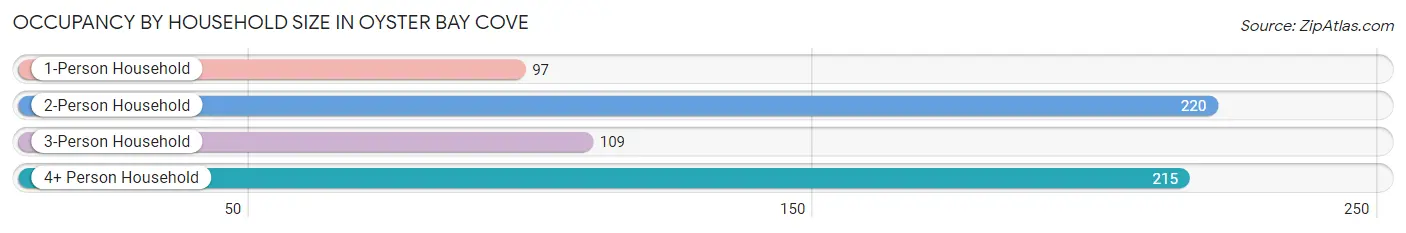
| Household Size | # Housing Units | % Housing Units |
| 1-Person Household | 97 | 15.1% |
| 2-Person Household | 220 | 34.3% |
| 3-Person Household | 109 | 17.0% |
| 4+ Person Household | 215 | 33.5% |
| Total Housing Units | 641 | 100.0% |
Occupancy by Ownership by Household Size in Oyster Bay Cove
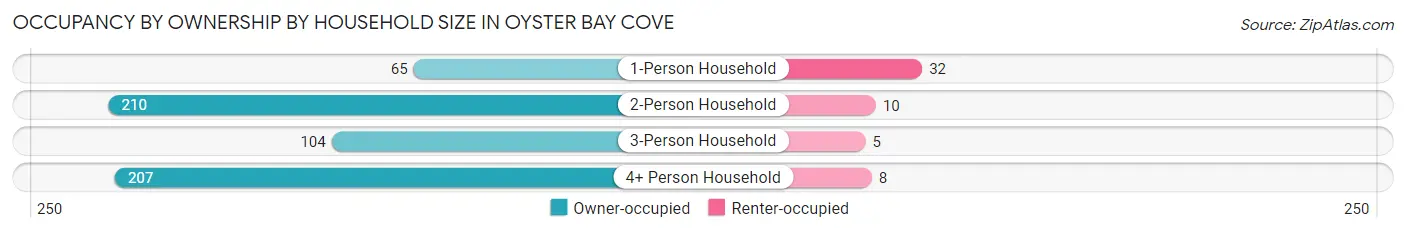
| Household Size | Owner-occupied | Renter-occupied |
| 1-Person Household | 65 (67.0%) | 32 (33.0%) |
| 2-Person Household | 210 (95.5%) | 10 (4.5%) |
| 3-Person Household | 104 (95.4%) | 5 (4.6%) |
| 4+ Person Household | 207 (96.3%) | 8 (3.7%) |
| Total Housing Units | 586 (91.4%) | 55 (8.6%) |
Occupancy by Educational Attainment in Oyster Bay Cove
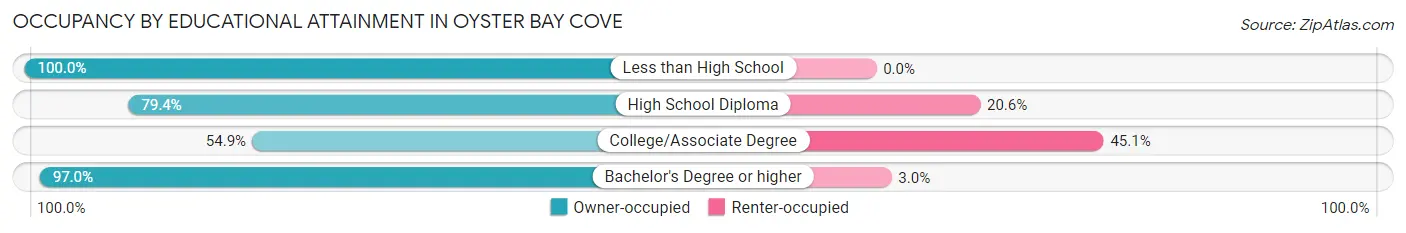
| Household Size | Owner-occupied | Renter-occupied |
| Less than High School | 7 (100.0%) | 0 (0.0%) |
| High School Diploma | 27 (79.4%) | 7 (20.6%) |
| College/Associate Degree | 39 (54.9%) | 32 (45.1%) |
| Bachelor's Degree or higher | 513 (97.0%) | 16 (3.0%) |
Occupancy by Age of Householder in Oyster Bay Cove
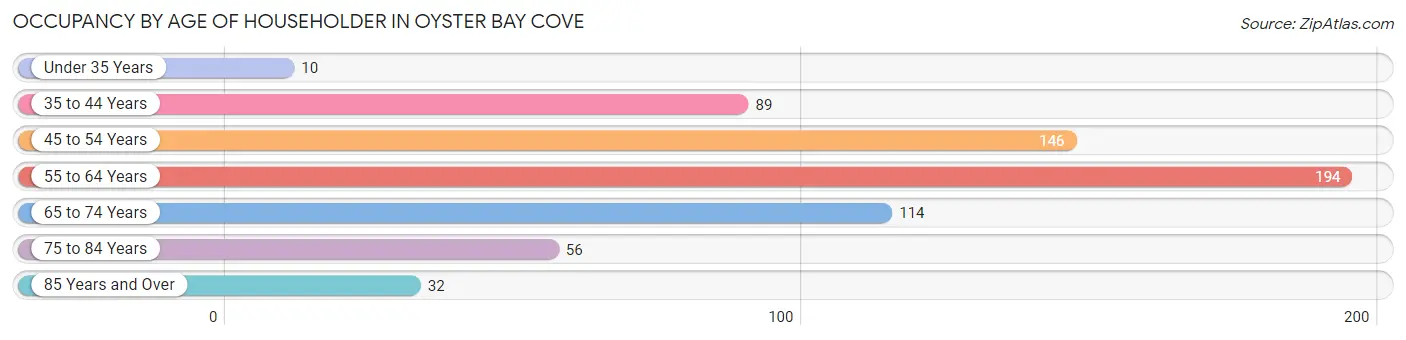
| Age Bracket | # Households | % Households |
| Under 35 Years | 10 | 1.6% |
| 35 to 44 Years | 89 | 13.9% |
| 45 to 54 Years | 146 | 22.8% |
| 55 to 64 Years | 194 | 30.3% |
| 65 to 74 Years | 114 | 17.8% |
| 75 to 84 Years | 56 | 8.7% |
| 85 Years and Over | 32 | 5.0% |
| Total | 641 | 100.0% |
Housing Finances in Oyster Bay Cove
Median Income by Occupancy in Oyster Bay Cove
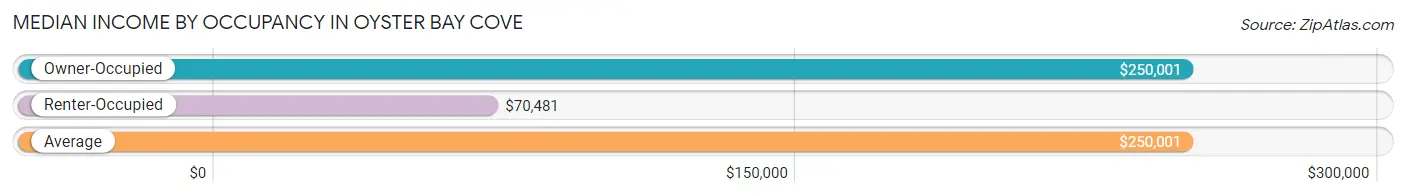
| Occupancy Type | # Households | Median Income |
| Owner-Occupied | 586 (91.4%) | $250,001 |
| Renter-Occupied | 55 (8.6%) | $70,481 |
| Average | 641 (100.0%) | $250,001 |
Occupancy by Householder Income Bracket in Oyster Bay Cove
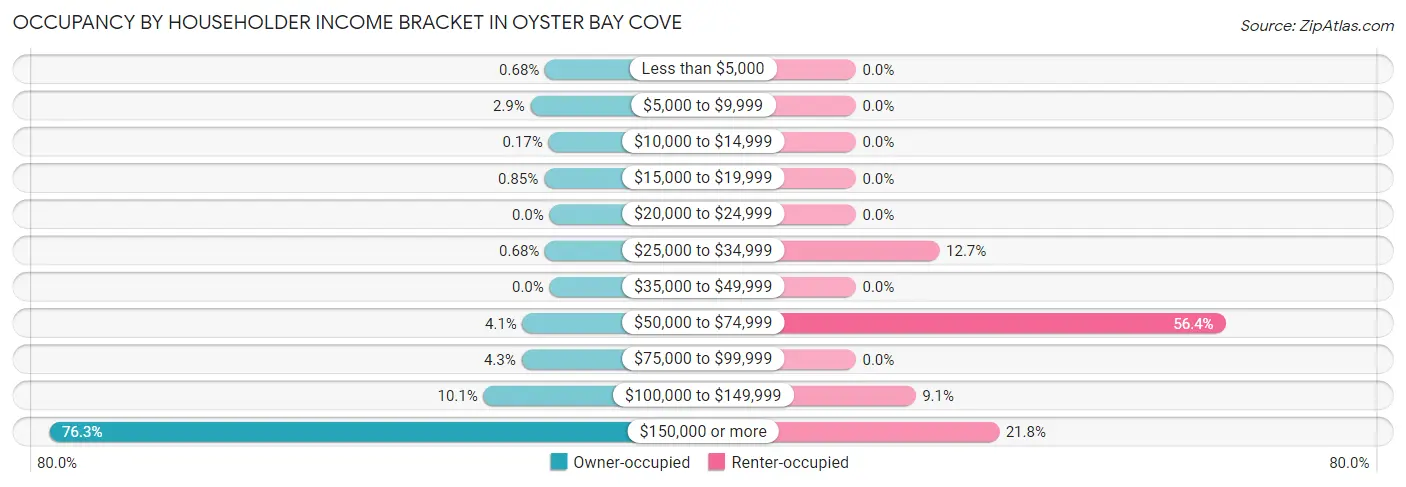
| Income Bracket | Owner-occupied | Renter-occupied |
| Less than $5,000 | 4 (0.7%) | 0 (0.0%) |
| $5,000 to $9,999 | 17 (2.9%) | 0 (0.0%) |
| $10,000 to $14,999 | 1 (0.2%) | 0 (0.0%) |
| $15,000 to $19,999 | 5 (0.9%) | 0 (0.0%) |
| $20,000 to $24,999 | 0 (0.0%) | 0 (0.0%) |
| $25,000 to $34,999 | 4 (0.7%) | 7 (12.7%) |
| $35,000 to $49,999 | 0 (0.0%) | 0 (0.0%) |
| $50,000 to $74,999 | 24 (4.1%) | 31 (56.4%) |
| $75,000 to $99,999 | 25 (4.3%) | 0 (0.0%) |
| $100,000 to $149,999 | 59 (10.1%) | 5 (9.1%) |
| $150,000 or more | 447 (76.3%) | 12 (21.8%) |
| Total | 586 (100.0%) | 55 (100.0%) |
Monthly Housing Cost Tiers in Oyster Bay Cove
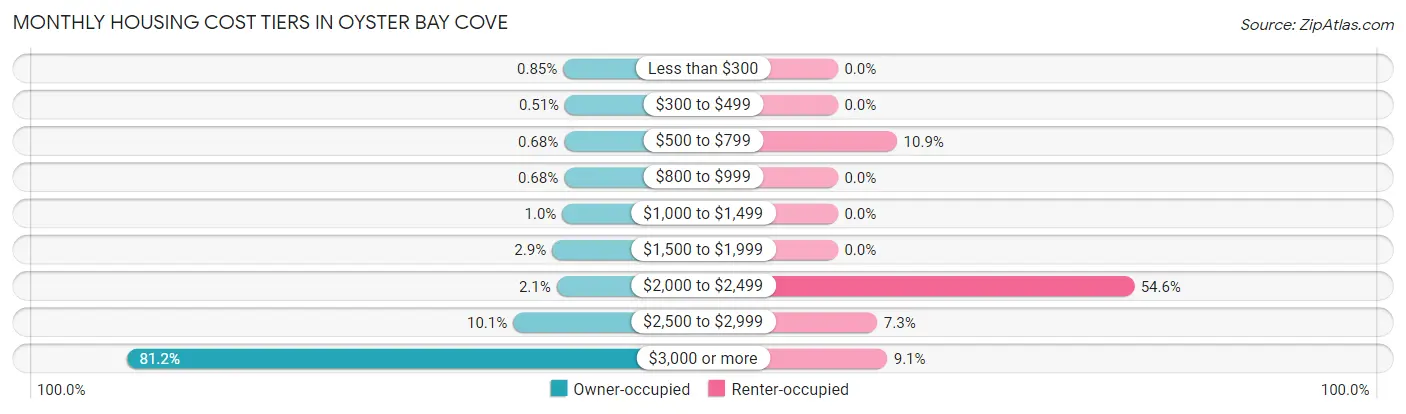
| Monthly Cost | Owner-occupied | Renter-occupied |
| Less than $300 | 5 (0.9%) | 0 (0.0%) |
| $300 to $499 | 3 (0.5%) | 0 (0.0%) |
| $500 to $799 | 4 (0.7%) | 6 (10.9%) |
| $800 to $999 | 4 (0.7%) | 0 (0.0%) |
| $1,000 to $1,499 | 6 (1.0%) | 0 (0.0%) |
| $1,500 to $1,999 | 17 (2.9%) | 0 (0.0%) |
| $2,000 to $2,499 | 12 (2.1%) | 30 (54.5%) |
| $2,500 to $2,999 | 59 (10.1%) | 4 (7.3%) |
| $3,000 or more | 476 (81.2%) | 5 (9.1%) |
| Total | 586 (100.0%) | 55 (100.0%) |
Physical Housing Characteristics in Oyster Bay Cove
Housing Structures in Oyster Bay Cove
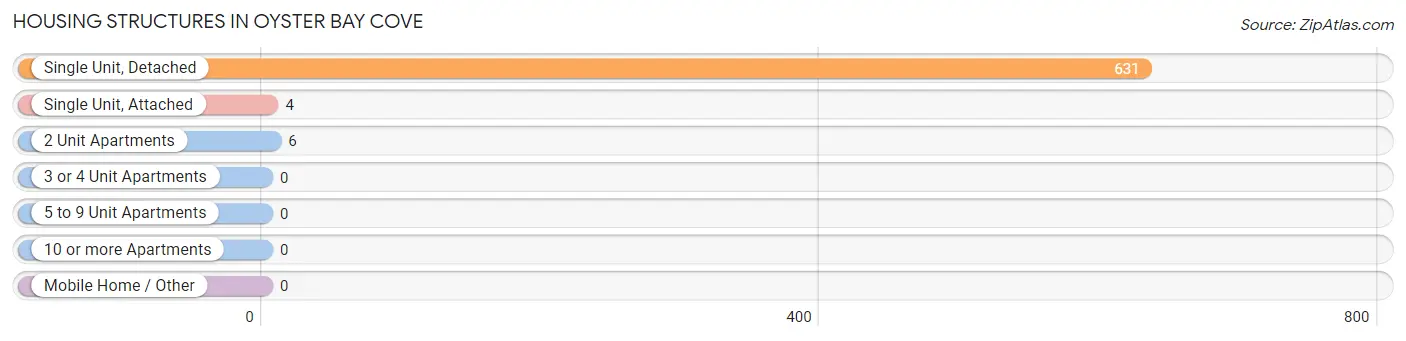
| Structure Type | # Housing Units | % Housing Units |
| Single Unit, Detached | 631 | 98.4% |
| Single Unit, Attached | 4 | 0.6% |
| 2 Unit Apartments | 6 | 0.9% |
| 3 or 4 Unit Apartments | 0 | 0.0% |
| 5 to 9 Unit Apartments | 0 | 0.0% |
| 10 or more Apartments | 0 | 0.0% |
| Mobile Home / Other | 0 | 0.0% |
| Total | 641 | 100.0% |
Housing Structures by Occupancy in Oyster Bay Cove
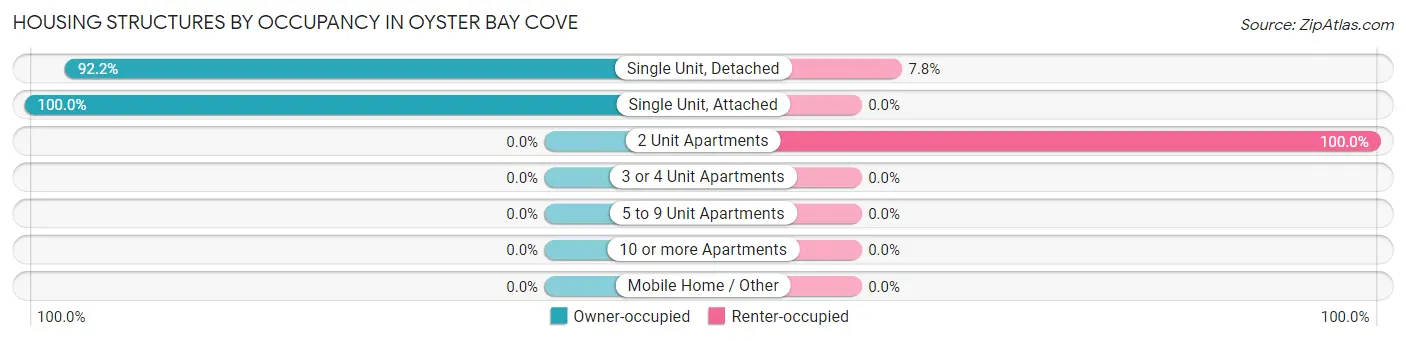
| Structure Type | Owner-occupied | Renter-occupied |
| Single Unit, Detached | 582 (92.2%) | 49 (7.8%) |
| Single Unit, Attached | 4 (100.0%) | 0 (0.0%) |
| 2 Unit Apartments | 0 (0.0%) | 6 (100.0%) |
| 3 or 4 Unit Apartments | 0 (0.0%) | 0 (0.0%) |
| 5 to 9 Unit Apartments | 0 (0.0%) | 0 (0.0%) |
| 10 or more Apartments | 0 (0.0%) | 0 (0.0%) |
| Mobile Home / Other | 0 (0.0%) | 0 (0.0%) |
| Total | 586 (91.4%) | 55 (8.6%) |
Housing Structures by Number of Rooms in Oyster Bay Cove
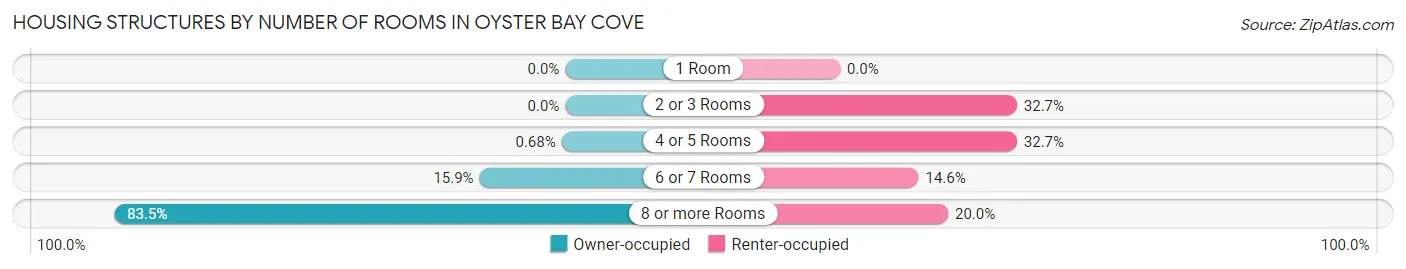
| Number of Rooms | Owner-occupied | Renter-occupied |
| 1 Room | 0 (0.0%) | 0 (0.0%) |
| 2 or 3 Rooms | 0 (0.0%) | 18 (32.7%) |
| 4 or 5 Rooms | 4 (0.7%) | 18 (32.7%) |
| 6 or 7 Rooms | 93 (15.9%) | 8 (14.5%) |
| 8 or more Rooms | 489 (83.5%) | 11 (20.0%) |
| Total | 586 (100.0%) | 55 (100.0%) |
Housing Structure by Heating Type in Oyster Bay Cove
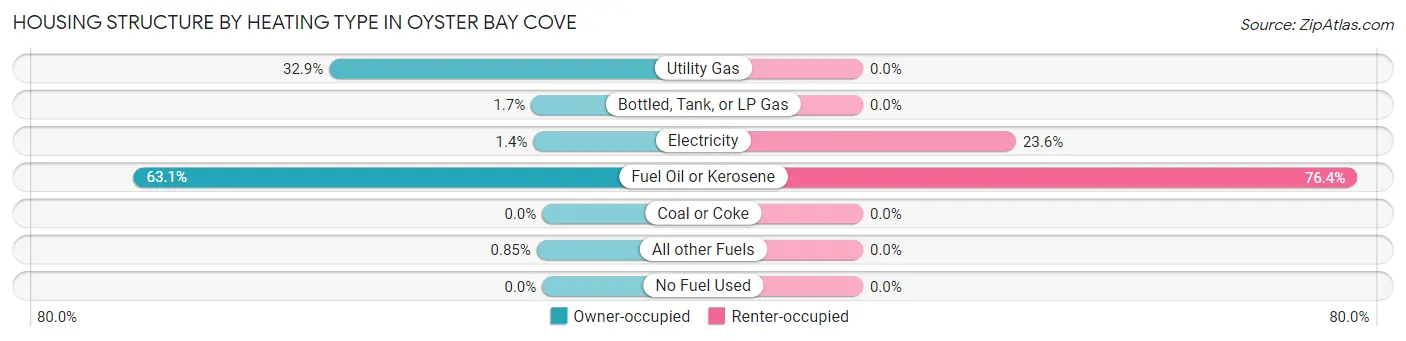
| Heating Type | Owner-occupied | Renter-occupied |
| Utility Gas | 193 (32.9%) | 0 (0.0%) |
| Bottled, Tank, or LP Gas | 10 (1.7%) | 0 (0.0%) |
| Electricity | 8 (1.4%) | 13 (23.6%) |
| Fuel Oil or Kerosene | 370 (63.1%) | 42 (76.4%) |
| Coal or Coke | 0 (0.0%) | 0 (0.0%) |
| All other Fuels | 5 (0.9%) | 0 (0.0%) |
| No Fuel Used | 0 (0.0%) | 0 (0.0%) |
| Total | 586 (100.0%) | 55 (100.0%) |
Household Vehicle Usage in Oyster Bay Cove
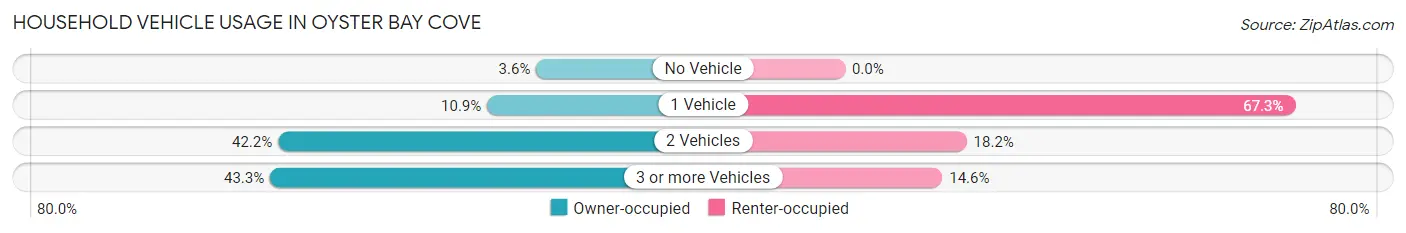
| Vehicles per Household | Owner-occupied | Renter-occupied |
| No Vehicle | 21 (3.6%) | 0 (0.0%) |
| 1 Vehicle | 64 (10.9%) | 37 (67.3%) |
| 2 Vehicles | 247 (42.1%) | 10 (18.2%) |
| 3 or more Vehicles | 254 (43.3%) | 8 (14.5%) |
| Total | 586 (100.0%) | 55 (100.0%) |
Real Estate & Mortgages in Oyster Bay Cove
Real Estate and Mortgage Overview in Oyster Bay Cove
| Characteristic | Without Mortgage | With Mortgage |
| Housing Units | 266 | 320 |
| Median Property Value | $1,604,200 | $1,547,200 |
| Median Household Income | $242,500 | $254 |
| Monthly Housing Costs | $1,501 | $297 |
| Real Estate Taxes | $10,001 | $0 |
Property Value by Mortgage Status in Oyster Bay Cove
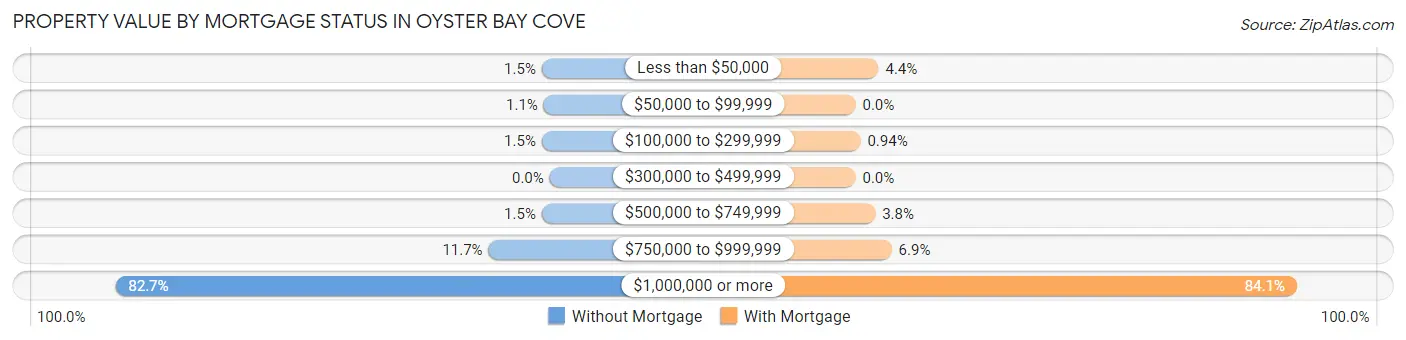
| Property Value | Without Mortgage | With Mortgage |
| Less than $50,000 | 4 (1.5%) | 14 (4.4%) |
| $50,000 to $99,999 | 3 (1.1%) | 0 (0.0%) |
| $100,000 to $299,999 | 4 (1.5%) | 3 (0.9%) |
| $300,000 to $499,999 | 0 (0.0%) | 0 (0.0%) |
| $500,000 to $749,999 | 4 (1.5%) | 12 (3.7%) |
| $750,000 to $999,999 | 31 (11.7%) | 22 (6.9%) |
| $1,000,000 or more | 220 (82.7%) | 269 (84.1%) |
| Total | 266 (100.0%) | 320 (100.0%) |
Household Income by Mortgage Status in Oyster Bay Cove
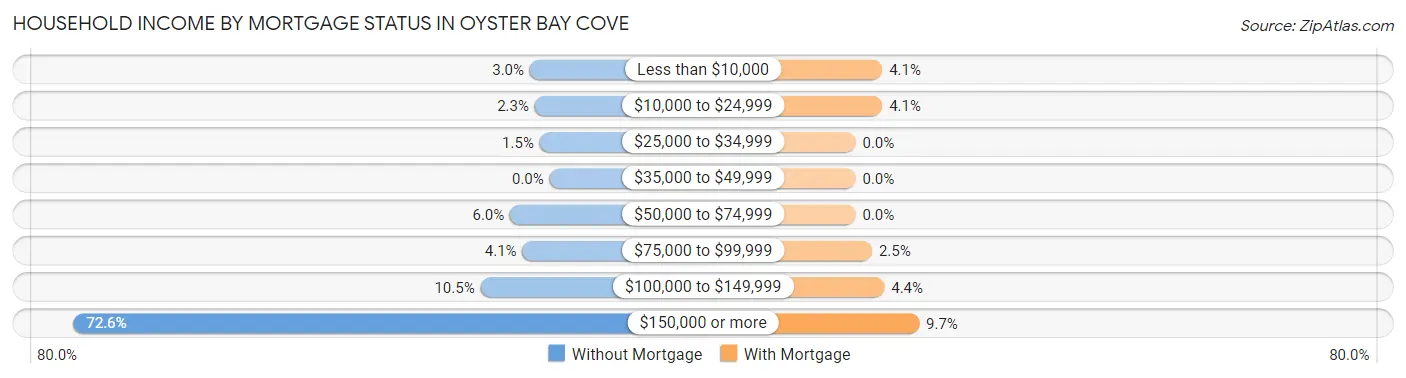
| Household Income | Without Mortgage | With Mortgage |
| Less than $10,000 | 8 (3.0%) | 13 (4.1%) |
| $10,000 to $24,999 | 6 (2.3%) | 13 (4.1%) |
| $25,000 to $34,999 | 4 (1.5%) | 0 (0.0%) |
| $35,000 to $49,999 | 0 (0.0%) | 0 (0.0%) |
| $50,000 to $74,999 | 16 (6.0%) | 0 (0.0%) |
| $75,000 to $99,999 | 11 (4.1%) | 8 (2.5%) |
| $100,000 to $149,999 | 28 (10.5%) | 14 (4.4%) |
| $150,000 or more | 193 (72.6%) | 31 (9.7%) |
| Total | 266 (100.0%) | 320 (100.0%) |
Property Value to Household Income Ratio in Oyster Bay Cove
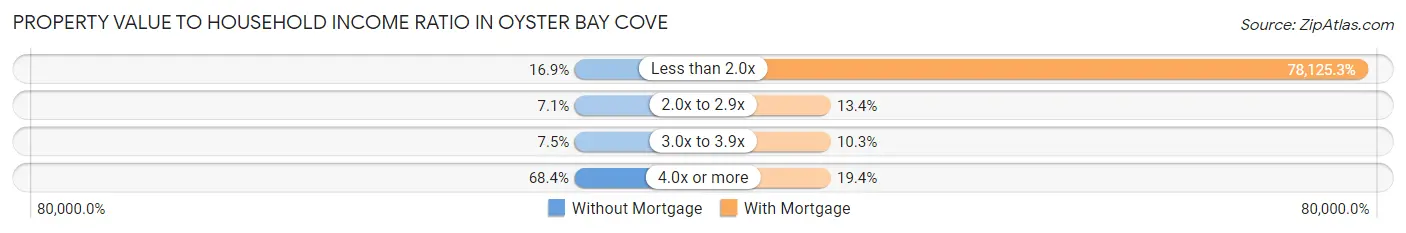
| Value-to-Income Ratio | Without Mortgage | With Mortgage |
| Less than 2.0x | 45 (16.9%) | 250,001 (78,125.3%) |
| 2.0x to 2.9x | 19 (7.1%) | 43 (13.4%) |
| 3.0x to 3.9x | 20 (7.5%) | 33 (10.3%) |
| 4.0x or more | 182 (68.4%) | 62 (19.4%) |
| Total | 266 (100.0%) | 320 (100.0%) |
Real Estate Taxes by Mortgage Status in Oyster Bay Cove
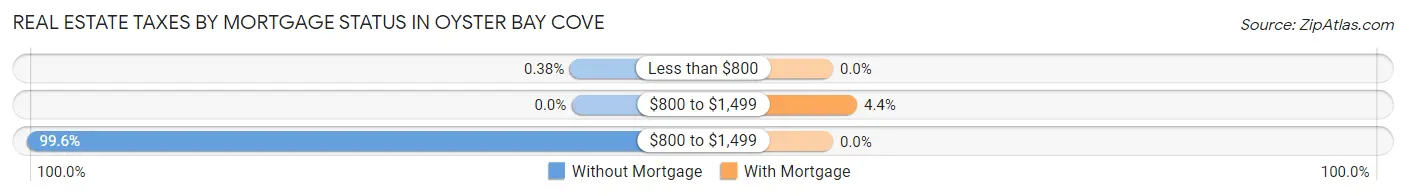
| Property Taxes | Without Mortgage | With Mortgage |
| Less than $800 | 1 (0.4%) | 0 (0.0%) |
| $800 to $1,499 | 0 (0.0%) | 14 (4.4%) |
| $800 to $1,499 | 265 (99.6%) | 0 (0.0%) |
| Total | 266 (100.0%) | 320 (100.0%) |
Health & Disability in Oyster Bay Cove
Health Insurance Coverage by Age in Oyster Bay Cove
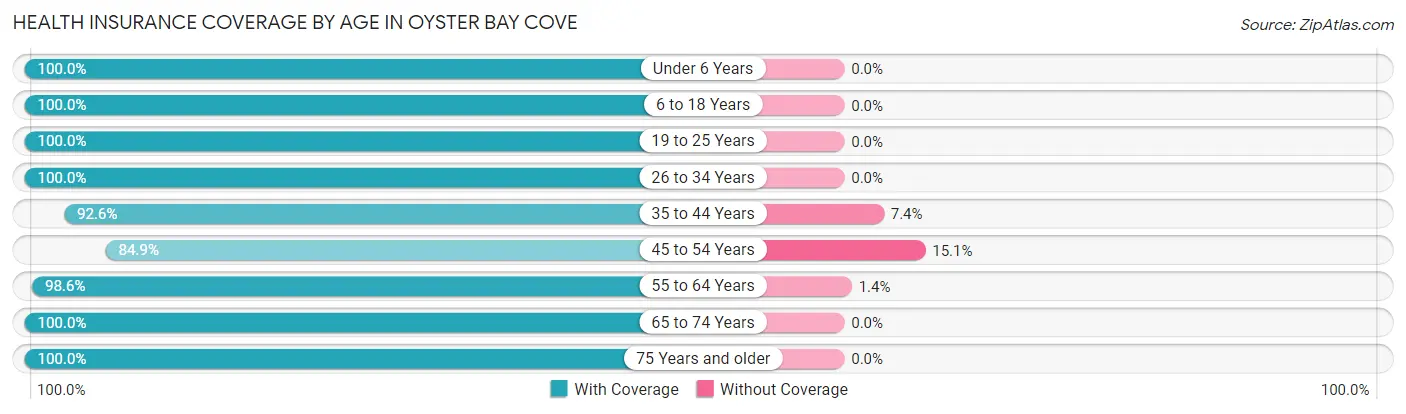
| Age Bracket | With Coverage | Without Coverage |
| Under 6 Years | 124 (100.0%) | 0 (0.0%) |
| 6 to 18 Years | 314 (100.0%) | 0 (0.0%) |
| 19 to 25 Years | 133 (100.0%) | 0 (0.0%) |
| 26 to 34 Years | 99 (100.0%) | 0 (0.0%) |
| 35 to 44 Years | 214 (92.6%) | 17 (7.4%) |
| 45 to 54 Years | 298 (84.9%) | 53 (15.1%) |
| 55 to 64 Years | 355 (98.6%) | 5 (1.4%) |
| 65 to 74 Years | 190 (100.0%) | 0 (0.0%) |
| 75 Years and older | 140 (100.0%) | 0 (0.0%) |
| Total | 1,867 (96.1%) | 75 (3.9%) |
Health Insurance Coverage by Citizenship Status in Oyster Bay Cove
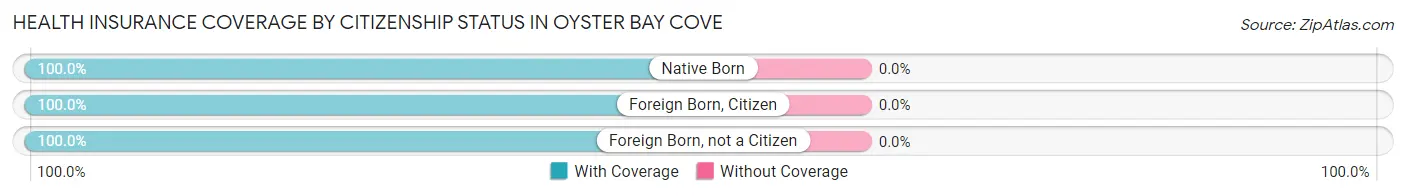
| Citizenship Status | With Coverage | Without Coverage |
| Native Born | 124 (100.0%) | 0 (0.0%) |
| Foreign Born, Citizen | 314 (100.0%) | 0 (0.0%) |
| Foreign Born, not a Citizen | 133 (100.0%) | 0 (0.0%) |
Health Insurance Coverage by Household Income in Oyster Bay Cove
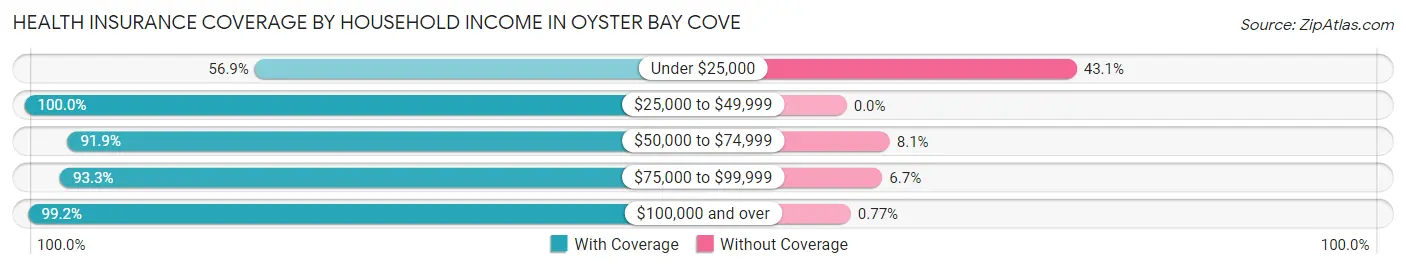
| Household Income | With Coverage | Without Coverage |
| Under $25,000 | 70 (56.9%) | 53 (43.1%) |
| $25,000 to $49,999 | 14 (100.0%) | 0 (0.0%) |
| $50,000 to $74,999 | 57 (91.9%) | 5 (8.1%) |
| $75,000 to $99,999 | 56 (93.3%) | 4 (6.7%) |
| $100,000 and over | 1,670 (99.2%) | 13 (0.8%) |
Public vs Private Health Insurance Coverage by Age in Oyster Bay Cove
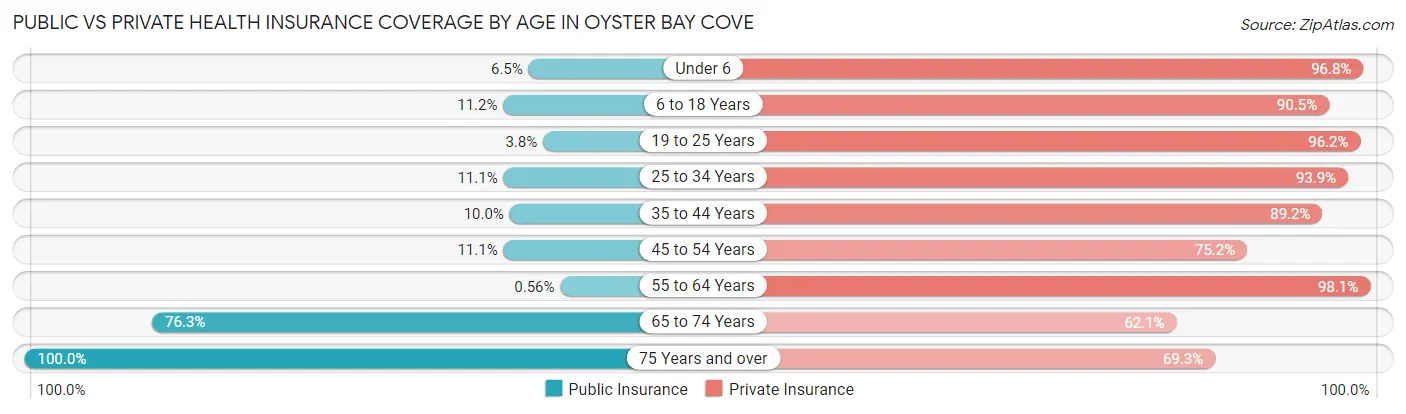
| Age Bracket | Public Insurance | Private Insurance |
| Under 6 | 8 (6.5%) | 120 (96.8%) |
| 6 to 18 Years | 35 (11.2%) | 284 (90.4%) |
| 19 to 25 Years | 5 (3.8%) | 128 (96.2%) |
| 25 to 34 Years | 11 (11.1%) | 93 (93.9%) |
| 35 to 44 Years | 23 (10.0%) | 206 (89.2%) |
| 45 to 54 Years | 39 (11.1%) | 264 (75.2%) |
| 55 to 64 Years | 2 (0.6%) | 353 (98.1%) |
| 65 to 74 Years | 145 (76.3%) | 118 (62.1%) |
| 75 Years and over | 140 (100.0%) | 97 (69.3%) |
| Total | 408 (21.0%) | 1,663 (85.6%) |
Disability Status by Sex by Age in Oyster Bay Cove
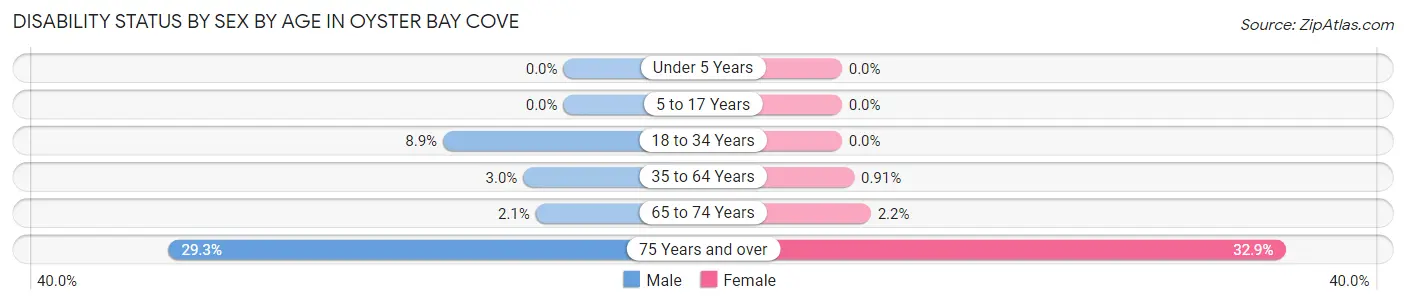
| Age Bracket | Male | Female |
| Under 5 Years | 0 (0.0%) | 0 (0.0%) |
| 5 to 17 Years | 0 (0.0%) | 0 (0.0%) |
| 18 to 34 Years | 11 (8.9%) | 0 (0.0%) |
| 35 to 64 Years | 15 (3.0%) | 4 (0.9%) |
| 65 to 74 Years | 2 (2.1%) | 2 (2.1%) |
| 75 Years and over | 17 (29.3%) | 27 (32.9%) |
Disability Class by Sex by Age in Oyster Bay Cove
Disability Class: Hearing Difficulty
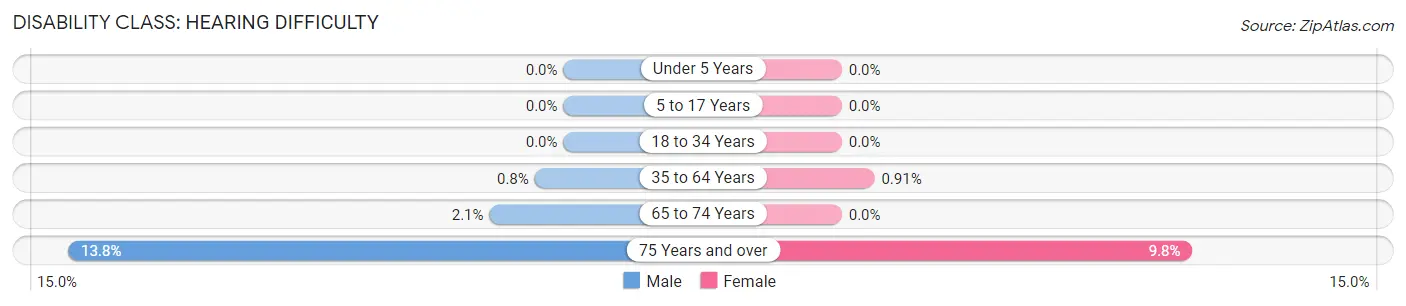
| Age Bracket | Male | Female |
| Under 5 Years | 0 (0.0%) | 0 (0.0%) |
| 5 to 17 Years | 0 (0.0%) | 0 (0.0%) |
| 18 to 34 Years | 0 (0.0%) | 0 (0.0%) |
| 35 to 64 Years | 4 (0.8%) | 4 (0.9%) |
| 65 to 74 Years | 2 (2.1%) | 0 (0.0%) |
| 75 Years and over | 8 (13.8%) | 8 (9.8%) |
Disability Class: Vision Difficulty
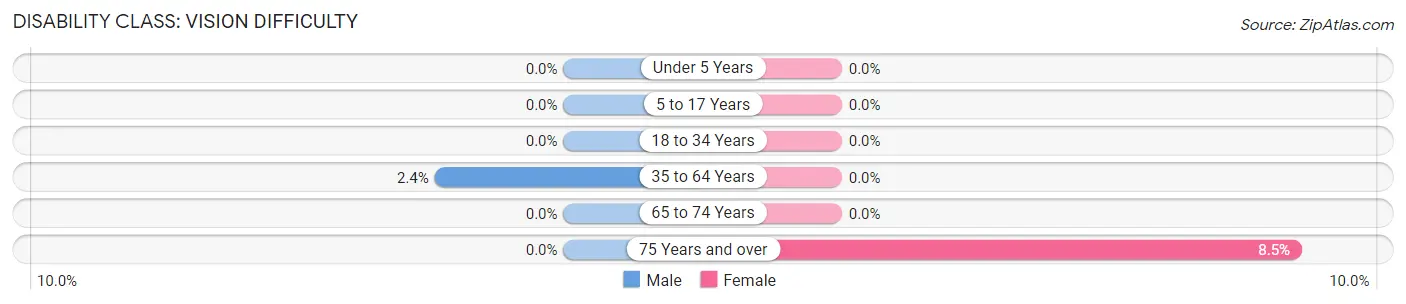
| Age Bracket | Male | Female |
| Under 5 Years | 0 (0.0%) | 0 (0.0%) |
| 5 to 17 Years | 0 (0.0%) | 0 (0.0%) |
| 18 to 34 Years | 0 (0.0%) | 0 (0.0%) |
| 35 to 64 Years | 12 (2.4%) | 0 (0.0%) |
| 65 to 74 Years | 0 (0.0%) | 0 (0.0%) |
| 75 Years and over | 0 (0.0%) | 7 (8.5%) |
Disability Class: Cognitive Difficulty
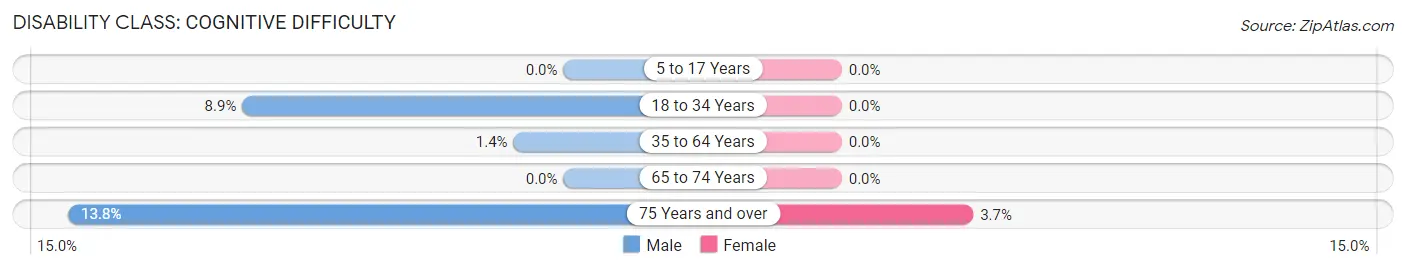
| Age Bracket | Male | Female |
| 5 to 17 Years | 0 (0.0%) | 0 (0.0%) |
| 18 to 34 Years | 11 (8.9%) | 0 (0.0%) |
| 35 to 64 Years | 7 (1.4%) | 0 (0.0%) |
| 65 to 74 Years | 0 (0.0%) | 0 (0.0%) |
| 75 Years and over | 8 (13.8%) | 3 (3.7%) |
Disability Class: Ambulatory Difficulty
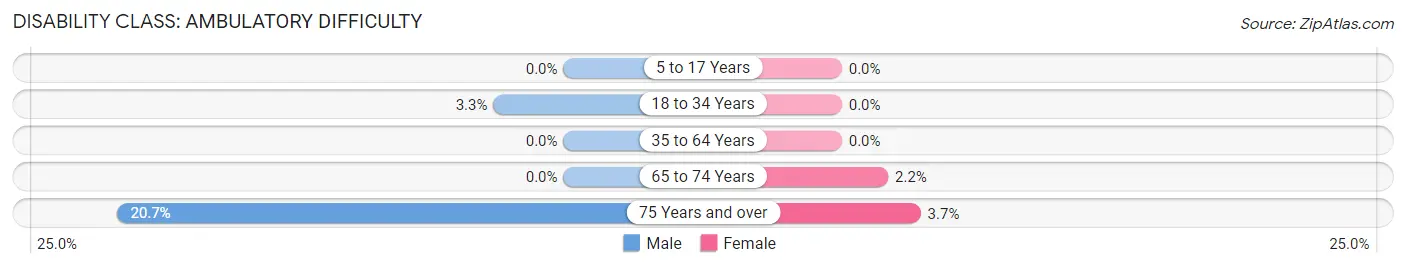
| Age Bracket | Male | Female |
| 5 to 17 Years | 0 (0.0%) | 0 (0.0%) |
| 18 to 34 Years | 4 (3.3%) | 0 (0.0%) |
| 35 to 64 Years | 0 (0.0%) | 0 (0.0%) |
| 65 to 74 Years | 0 (0.0%) | 2 (2.1%) |
| 75 Years and over | 12 (20.7%) | 3 (3.7%) |
Disability Class: Self-Care Difficulty
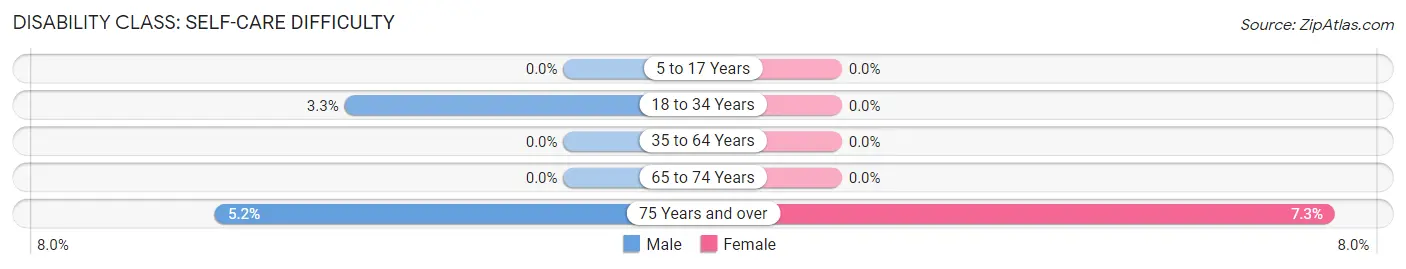
| Age Bracket | Male | Female |
| 5 to 17 Years | 0 (0.0%) | 0 (0.0%) |
| 18 to 34 Years | 4 (3.3%) | 0 (0.0%) |
| 35 to 64 Years | 0 (0.0%) | 0 (0.0%) |
| 65 to 74 Years | 0 (0.0%) | 0 (0.0%) |
| 75 Years and over | 3 (5.2%) | 6 (7.3%) |
Technology Access in Oyster Bay Cove
Computing Device Access in Oyster Bay Cove
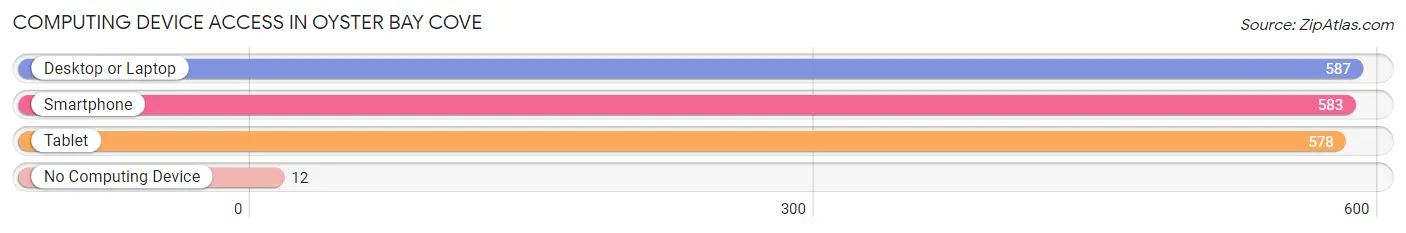
| Device Type | # Households | % Households |
| Desktop or Laptop | 587 | 91.6% |
| Smartphone | 583 | 90.9% |
| Tablet | 578 | 90.2% |
| No Computing Device | 12 | 1.9% |
| Total | 641 | 100.0% |
Internet Access in Oyster Bay Cove
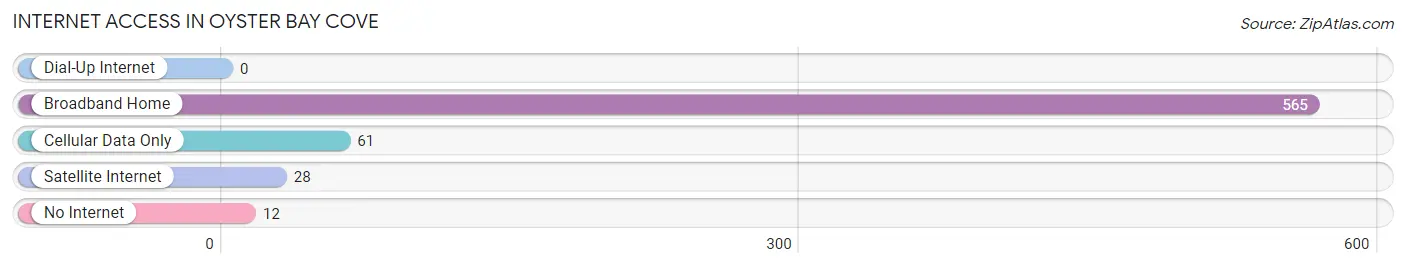
| Internet Type | # Households | % Households |
| Dial-Up Internet | 0 | 0.0% |
| Broadband Home | 565 | 88.1% |
| Cellular Data Only | 61 | 9.5% |
| Satellite Internet | 28 | 4.4% |
| No Internet | 12 | 1.9% |
| Total | 641 | 100.0% |
Oyster Bay Cove Summary
Oyster Bay Cove is a village located in Nassau County, New York, United States. The village is located within the Town of Oyster Bay, and is part of the Greater New York City metropolitan area. As of the 2010 census, the village had a population of 2,197.
Geography
Oyster Bay Cove is located at 40°51'17" North, 73°33'45" West (40.854722, -73.562500). The village is located on the north shore of Long Island, approximately 25 miles east of Manhattan. It is bordered by the villages of Mill Neck to the west, Upper Brookville to the north, and Oyster Bay to the south.
The village is situated on a peninsula, with Oyster Bay to the south and Cold Spring Harbor to the north. The peninsula is surrounded by several small coves, including Oyster Bay Cove, which gives the village its name. The village is located on a hill, with the highest point being approximately 150 feet above sea level.
History
The area that is now Oyster Bay Cove was originally inhabited by the Matinecock Native American tribe. The first European settlers arrived in the area in the 1650s, and the village was officially incorporated in 1931.
The village was originally a farming community, with many of the original settlers being of Dutch and English descent. The village was also home to a number of oyster beds, which gave the village its name.
In the late 19th century, the village began to experience a period of growth and development. The village was connected to the Long Island Rail Road in 1881, and the Oyster Bay Cove Post Office was established in 1883.
In the early 20th century, the village began to experience a period of suburbanization. Many of the farms in the area were sold off and replaced with residential developments. The village also experienced a period of economic growth, with many new businesses opening in the area.
Economy
Oyster Bay Cove is primarily a residential community, with most of the village's residents commuting to nearby cities for work. The village is home to a number of small businesses, including restaurants, retail stores, and professional services.
The village is also home to a number of corporate headquarters, including the headquarters of the Estee Lauder Companies. The village is also home to a number of financial services companies, including Morgan Stanley and UBS.
Demographics
As of the 2010 census, the village had a population of 2,197. The racial makeup of the village was 94.2% White, 1.2% African American, 0.2% Native American, 2.2% Asian, 0.1% Pacific Islander, 0.7% from other races, and 1.6% from two or more races. Hispanic or Latino of any race were 4.2% of the population.
The median household income in the village was $150,000, and the median family income was $170,000. The per capita income for the village was $75,000. About 1.2% of families and 2.2% of the population were below the poverty line, including 1.2% of those under age 18 and 0.7% of those age 65 or over.
Conclusion
Oyster Bay Cove is a small village located on the north shore of Long Island, approximately 25 miles east of Manhattan. The village is primarily a residential community, with most of the village's residents commuting to nearby cities for work. The village is home to a number of small businesses, including restaurants, retail stores, and professional services. The village also has a number of corporate headquarters, including the headquarters of the Estee Lauder Companies. As of the 2010 census, the village had a population of 2,197, with a median household income of $150,000.
Common Questions
What is Per Capita Income in Oyster Bay Cove?
Per Capita income in Oyster Bay Cove is $145,710.
What is the Median Family Income in Oyster Bay Cove?
Median Family Income in Oyster Bay Cove is $250,001.
What is the Median Household income in Oyster Bay Cove?
Median Household Income in Oyster Bay Cove is $250,001.
What is Income or Wage Gap in Oyster Bay Cove?
Income or Wage Gap in Oyster Bay Cove is 55.3%.
Women in Oyster Bay Cove earn 44.7 cents for every dollar earned by a man.
What is Inequality or Gini Index in Oyster Bay Cove?
Inequality or Gini Index in Oyster Bay Cove is 0.51.
What is the Total Population of Oyster Bay Cove?
Total Population of Oyster Bay Cove is 1,942.
What is the Total Male Population of Oyster Bay Cove?
Total Male Population of Oyster Bay Cove is 994.
What is the Total Female Population of Oyster Bay Cove?
Total Female Population of Oyster Bay Cove is 948.
What is the Ratio of Males per 100 Females in Oyster Bay Cove?
There are 104.85 Males per 100 Females in Oyster Bay Cove.
What is the Ratio of Females per 100 Males in Oyster Bay Cove?
There are 95.37 Females per 100 Males in Oyster Bay Cove.
What is the Median Population Age in Oyster Bay Cove?
Median Population Age in Oyster Bay Cove is 48.7 Years.
What is the Average Family Size in Oyster Bay Cove
Average Family Size in Oyster Bay Cove is 3.3 People.
What is the Average Household Size in Oyster Bay Cove
Average Household Size in Oyster Bay Cove is 3.0 People.
How Large is the Labor Force in Oyster Bay Cove?
There are 984 People in the Labor Forcein in Oyster Bay Cove.
What is the Percentage of People in the Labor Force in Oyster Bay Cove?
62.1% of People are in the Labor Force in Oyster Bay Cove.
What is the Unemployment Rate in Oyster Bay Cove?
Unemployment Rate in Oyster Bay Cove is 7.8%.