Breesport, NY Map & Demographics
Breesport Map
Breesport Overview
$28,142
PER CAPITA INCOME
$65,398
AVG FAMILY INCOME
$64,665
AVG HOUSEHOLD INCOME
60.1%
WAGE / INCOME GAP [ % ]
39.9¢/ $1
WAGE / INCOME GAP [ $ ]
0.29
INEQUALITY / GINI INDEX
864
TOTAL POPULATION
455
MALE POPULATION
409
FEMALE POPULATION
111.25
MALES / 100 FEMALES
89.89
FEMALES / 100 MALES
57.1
MEDIAN AGE
3.0
AVG FAMILY SIZE
2.9
AVG HOUSEHOLD SIZE
292
LABOR FORCE [ PEOPLE ]
40.0%
PERCENT IN LABOR FORCE
Breesport Zip Codes
Breesport Area Codes
Income in Breesport
Income Overview in Breesport
Per Capita Income in Breesport is $28,142, while median incomes of families and households are $65,398 and $64,665 respectively.
| Characteristic | Number | Measure |
| Per Capita Income | 864 | $28,142 |
| Median Family Income | 283 | $65,398 |
| Mean Family Income | 283 | $81,460 |
| Median Household Income | 301 | $64,665 |
| Mean Household Income | 301 | $78,965 |
| Income Deficit | 283 | $0 |
| Wage / Income Gap (%) | 864 | 60.07% |
| Wage / Income Gap ($) | 864 | 39.93¢ per $1 |
| Gini / Inequality Index | 864 | 0.29 |
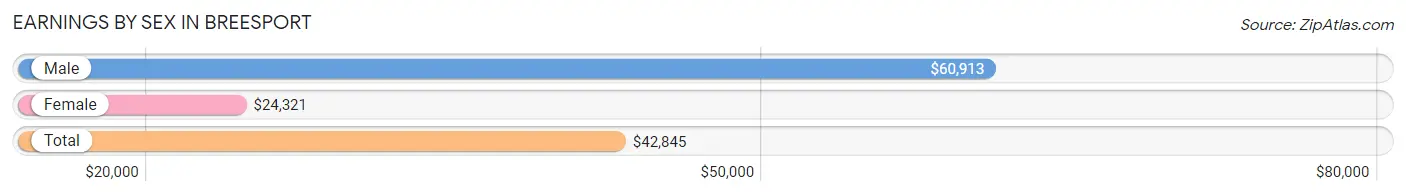
Earnings by Sex in Breesport
Average Earnings in Breesport are $42,845, $60,913 for men and $24,321 for women, a difference of 60.1%.
| Sex | Number | Average Earnings |
| Male | 151 (49.0%) | $60,913 |
| Female | 157 (51.0%) | $24,321 |
| Total | 308 (100.0%) | $42,845 |
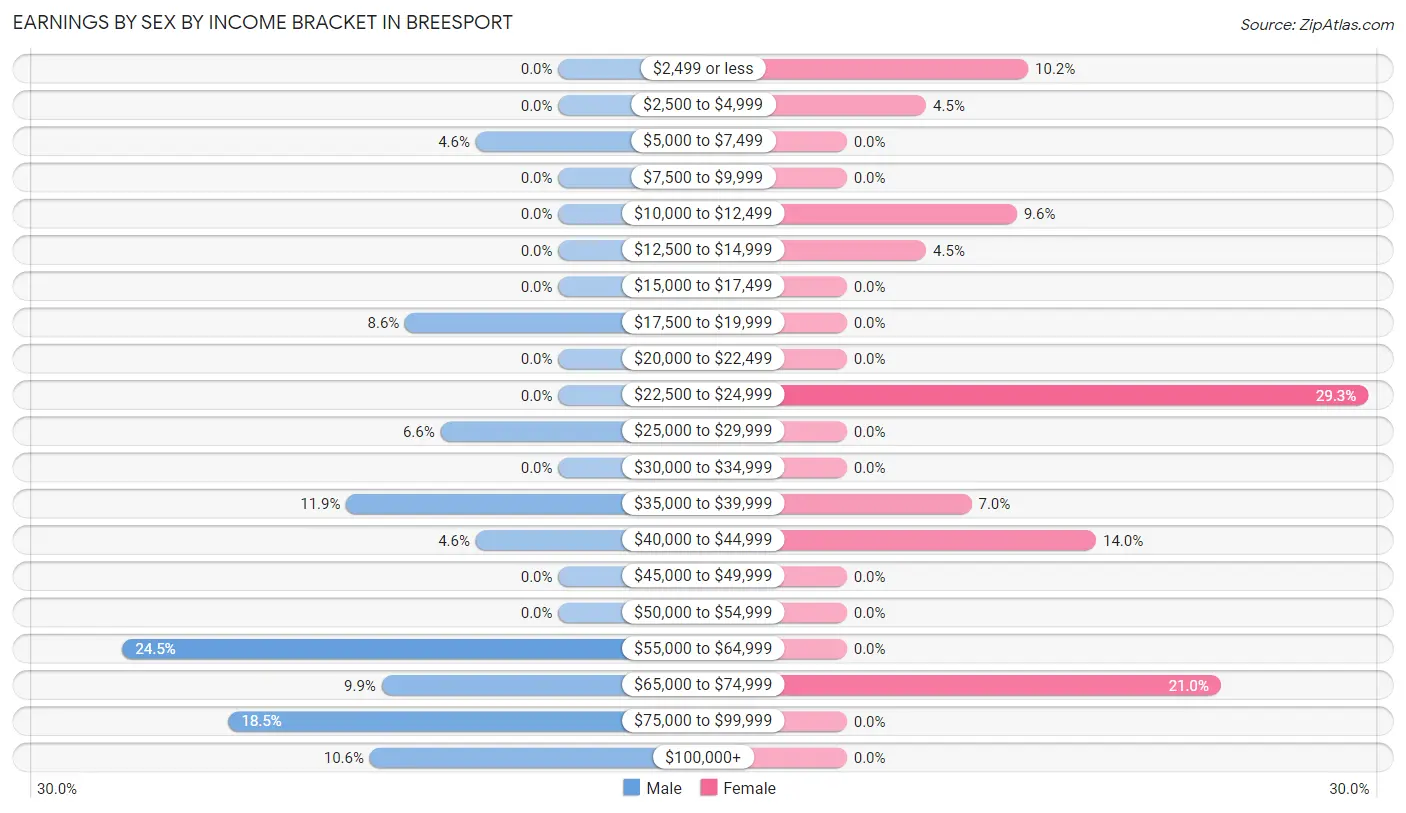
Earnings by Sex by Income Bracket in Breesport
The most common earnings brackets in Breesport are $55,000 to $64,999 for men (37 | 24.5%) and $22,500 to $24,999 for women (46 | 29.3%).
| Income | Male | Female |
| $2,499 or less | 0 (0.0%) | 16 (10.2%) |
| $2,500 to $4,999 | 0 (0.0%) | 7 (4.5%) |
| $5,000 to $7,499 | 7 (4.6%) | 0 (0.0%) |
| $7,500 to $9,999 | 0 (0.0%) | 0 (0.0%) |
| $10,000 to $12,499 | 0 (0.0%) | 15 (9.6%) |
| $12,500 to $14,999 | 0 (0.0%) | 7 (4.5%) |
| $15,000 to $17,499 | 0 (0.0%) | 0 (0.0%) |
| $17,500 to $19,999 | 13 (8.6%) | 0 (0.0%) |
| $20,000 to $22,499 | 0 (0.0%) | 0 (0.0%) |
| $22,500 to $24,999 | 0 (0.0%) | 46 (29.3%) |
| $25,000 to $29,999 | 10 (6.6%) | 0 (0.0%) |
| $30,000 to $34,999 | 0 (0.0%) | 0 (0.0%) |
| $35,000 to $39,999 | 18 (11.9%) | 11 (7.0%) |
| $40,000 to $44,999 | 7 (4.6%) | 22 (14.0%) |
| $45,000 to $49,999 | 0 (0.0%) | 0 (0.0%) |
| $50,000 to $54,999 | 0 (0.0%) | 0 (0.0%) |
| $55,000 to $64,999 | 37 (24.5%) | 0 (0.0%) |
| $65,000 to $74,999 | 15 (9.9%) | 33 (21.0%) |
| $75,000 to $99,999 | 28 (18.5%) | 0 (0.0%) |
| $100,000+ | 16 (10.6%) | 0 (0.0%) |
| Total | 151 (100.0%) | 157 (100.0%) |
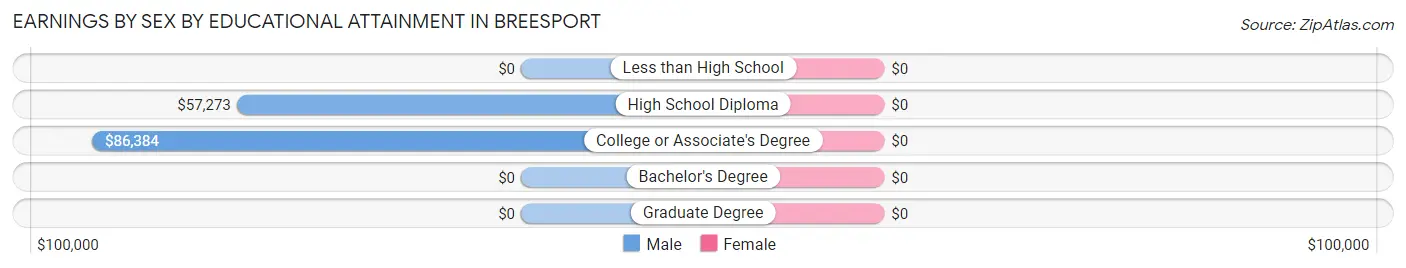
Earnings by Sex by Educational Attainment in Breesport
| Educational Attainment | Male Income | Female Income |
| Less than High School | - | - |
| High School Diploma | $57,273 | $0 |
| College or Associate's Degree | $86,384 | $0 |
| Bachelor's Degree | - | - |
| Graduate Degree | - | - |
| Total | $60,913 | $24,321 |
Family Income in Breesport
Family Income Brackets in Breesport
According to the Breesport family income data, there are 82 families falling into the $50,000 to $74,999 income range, which is the most common income bracket and makes up 29.0% of all families.
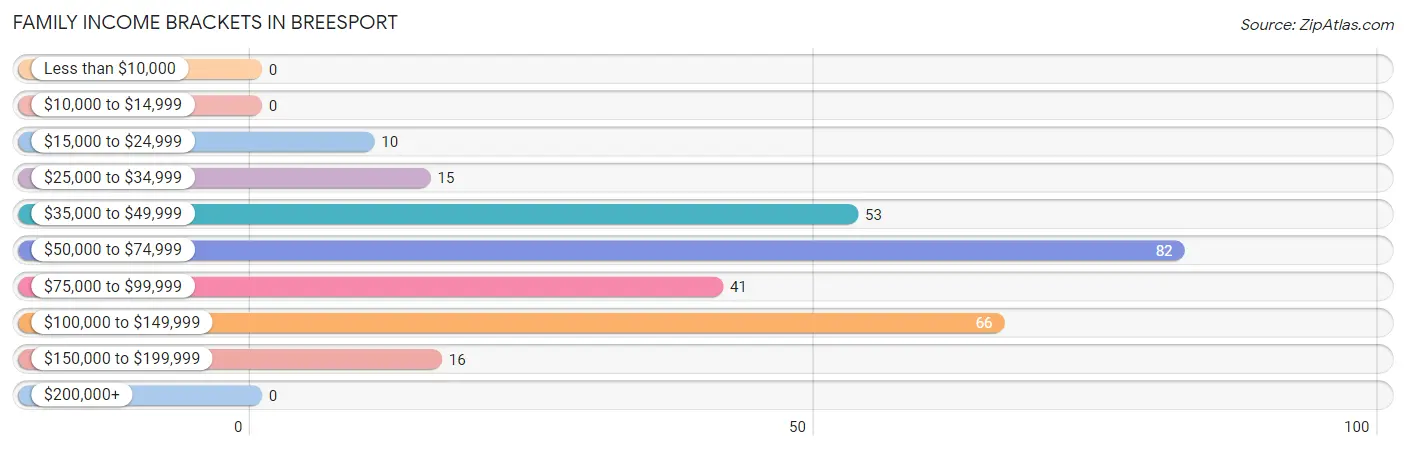
| Income Bracket | # Families | % Families |
| Less than $10,000 | 0 | 0.0% |
| $10,000 to $14,999 | 0 | 0.0% |
| $15,000 to $24,999 | 10 | 3.5% |
| $25,000 to $34,999 | 15 | 5.3% |
| $35,000 to $49,999 | 53 | 18.7% |
| $50,000 to $74,999 | 82 | 29.0% |
| $75,000 to $99,999 | 41 | 14.5% |
| $100,000 to $149,999 | 66 | 23.3% |
| $150,000 to $199,999 | 16 | 5.7% |
| $200,000+ | 0 | 0.0% |
Family Income by Famaliy Size in Breesport
2-person families (134 | 47.3%) account for the highest median family income in Breesport with $65,114 per family, while 2-person families (134 | 47.3%) have the highest median income of $32,557 per family member.
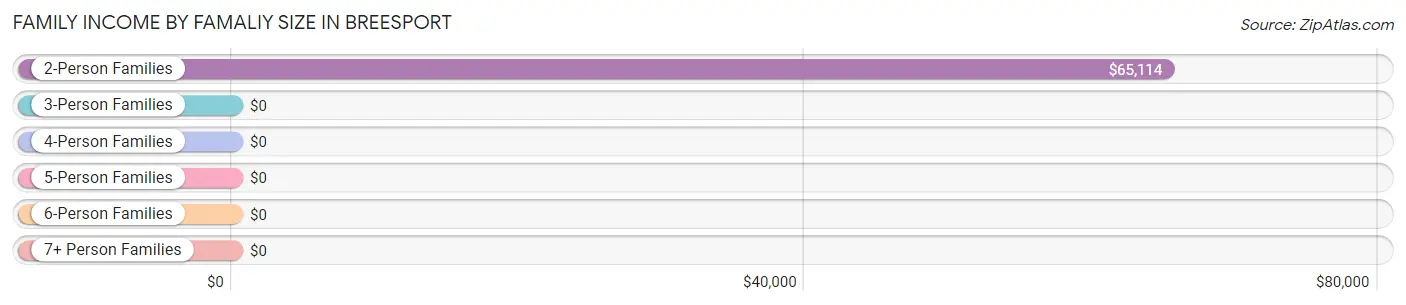
| Income Bracket | # Families | Median Income |
| 2-Person Families | 134 (47.3%) | $65,114 |
| 3-Person Families | 41 (14.5%) | $0 |
| 4-Person Families | 82 (29.0%) | $0 |
| 5-Person Families | 26 (9.2%) | $0 |
| 6-Person Families | 0 (0.0%) | $0 |
| 7+ Person Families | 0 (0.0%) | $0 |
| Total | 283 (100.0%) | $65,398 |
Family Income by Number of Earners in Breesport
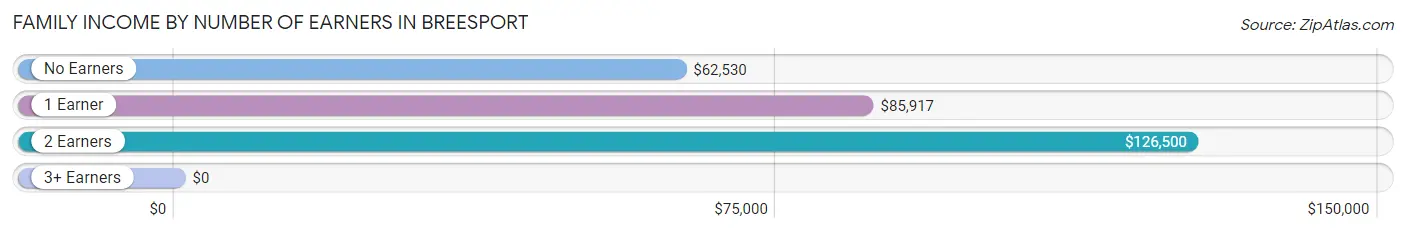
| Number of Earners | # Families | Median Income |
| No Earners | 125 (44.2%) | $62,530 |
| 1 Earner | 51 (18.0%) | $85,917 |
| 2 Earners | 100 (35.3%) | $126,500 |
| 3+ Earners | 7 (2.5%) | $0 |
| Total | 283 (100.0%) | $65,398 |
Household Income in Breesport
Household Income Brackets in Breesport
With 82 households falling in the category, the $50,000 to $74,999 income range is the most frequent in Breesport, accounting for 27.2% of all households.
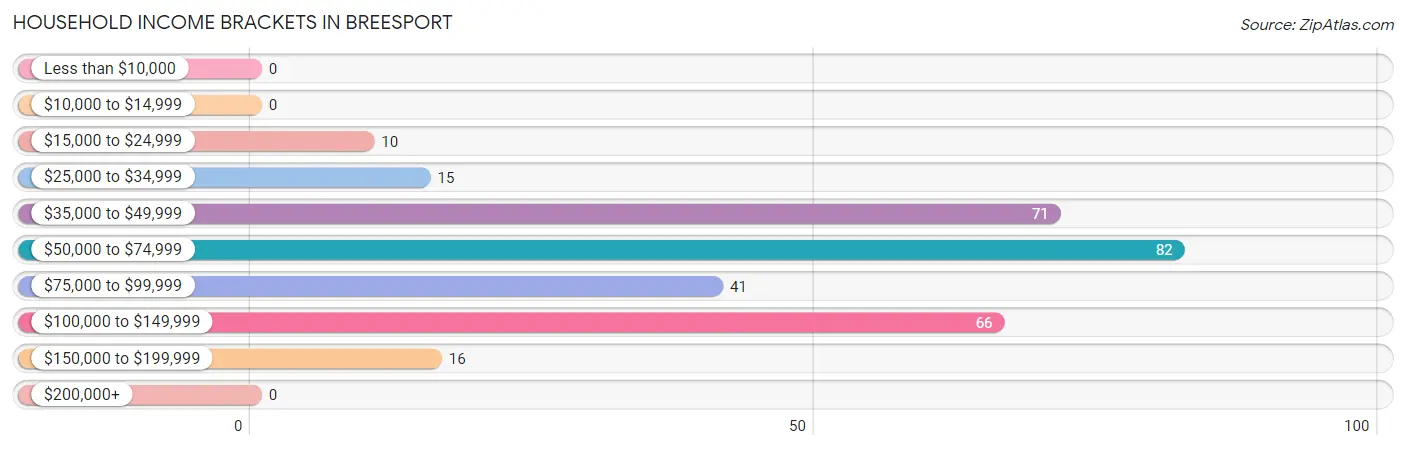
| Income Bracket | # Households | % Households |
| Less than $10,000 | 0 | 0.0% |
| $10,000 to $14,999 | 0 | 0.0% |
| $15,000 to $24,999 | 10 | 3.3% |
| $25,000 to $34,999 | 15 | 5.0% |
| $35,000 to $49,999 | 71 | 23.6% |
| $50,000 to $74,999 | 82 | 27.2% |
| $75,000 to $99,999 | 41 | 13.6% |
| $100,000 to $149,999 | 66 | 21.9% |
| $150,000 to $199,999 | 16 | 5.3% |
| $200,000+ | 0 | 0.0% |
Household Income by Householder Age in Breesport
The median household income in Breesport is $64,665, with the highest median household income of $85,640 found in the 45 to 64 years age bracket for the primary householder. A total of 111 households (36.9%) fall into this category.
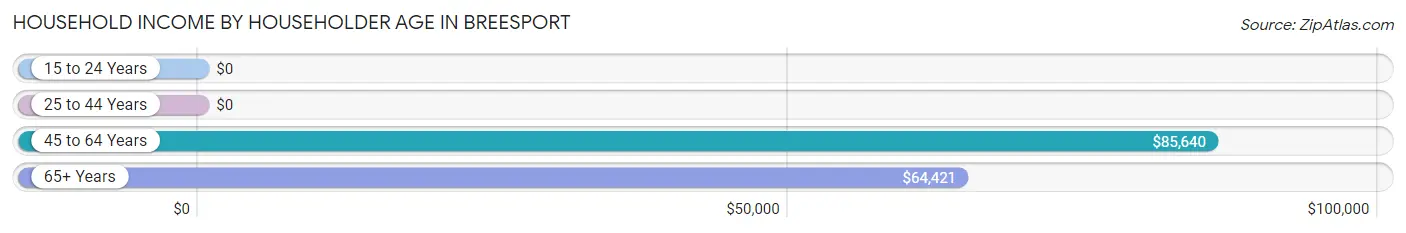
| Income Bracket | # Households | Median Income |
| 15 to 24 Years | 0 (0.0%) | $0 |
| 25 to 44 Years | 81 (26.9%) | $0 |
| 45 to 64 Years | 111 (36.9%) | $85,640 |
| 65+ Years | 109 (36.2%) | $64,421 |
| Total | 301 (100.0%) | $64,665 |
Poverty in Breesport
Income Below Poverty by Sex and Age in Breesport
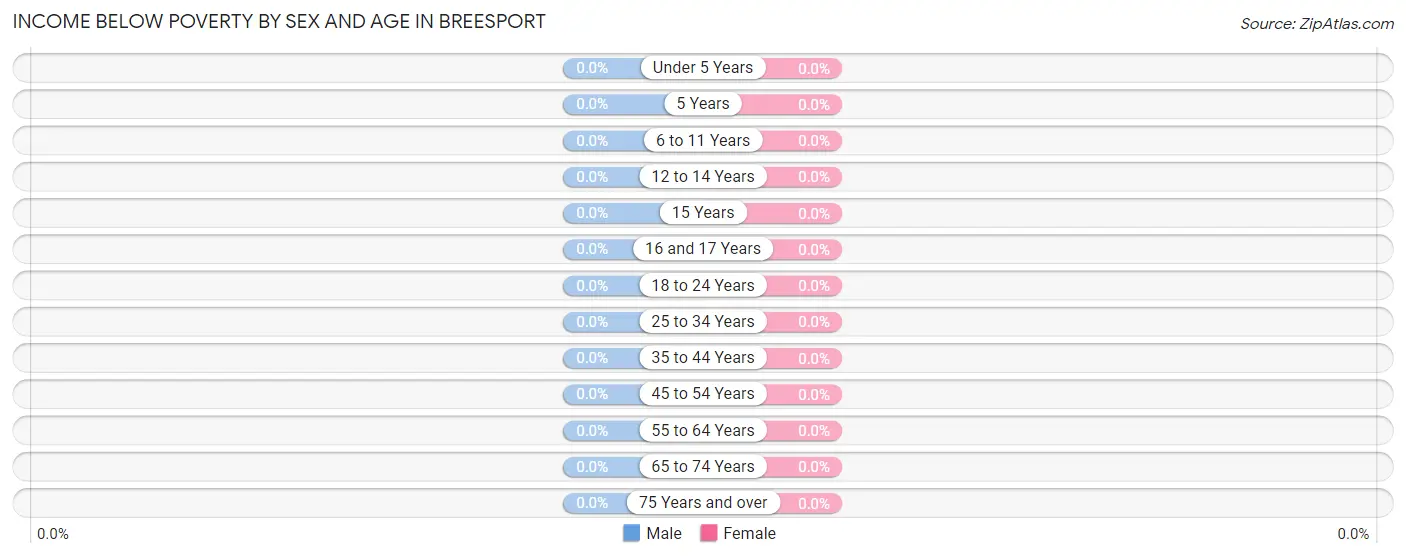
| Age Bracket | Male | Female |
| Under 5 Years | 0 (0.0%) | 0 (0.0%) |
| 5 Years | 0 (0.0%) | 0 (0.0%) |
| 6 to 11 Years | 0 (0.0%) | 0 (0.0%) |
| 12 to 14 Years | 0 (0.0%) | 0 (0.0%) |
| 15 Years | 0 (0.0%) | 0 (0.0%) |
| 16 and 17 Years | 0 (0.0%) | 0 (0.0%) |
| 18 to 24 Years | 0 (0.0%) | 0 (0.0%) |
| 25 to 34 Years | 0 (0.0%) | 0 (0.0%) |
| 35 to 44 Years | 0 (0.0%) | 0 (0.0%) |
| 45 to 54 Years | 0 (0.0%) | 0 (0.0%) |
| 55 to 64 Years | 0 (0.0%) | 0 (0.0%) |
| 65 to 74 Years | 0 (0.0%) | 0 (0.0%) |
| 75 Years and over | 0 (0.0%) | 0 (0.0%) |
| Total | 0 (0.0%) | 0 (0.0%) |
Income Above Poverty by Sex and Age in Breesport
According to the poverty statistics in Breesport, males aged under 5 years and females aged 5 years are the age groups that are most secure financially, with 100.0% of males and 100.0% of females in these age groups living above the poverty line.
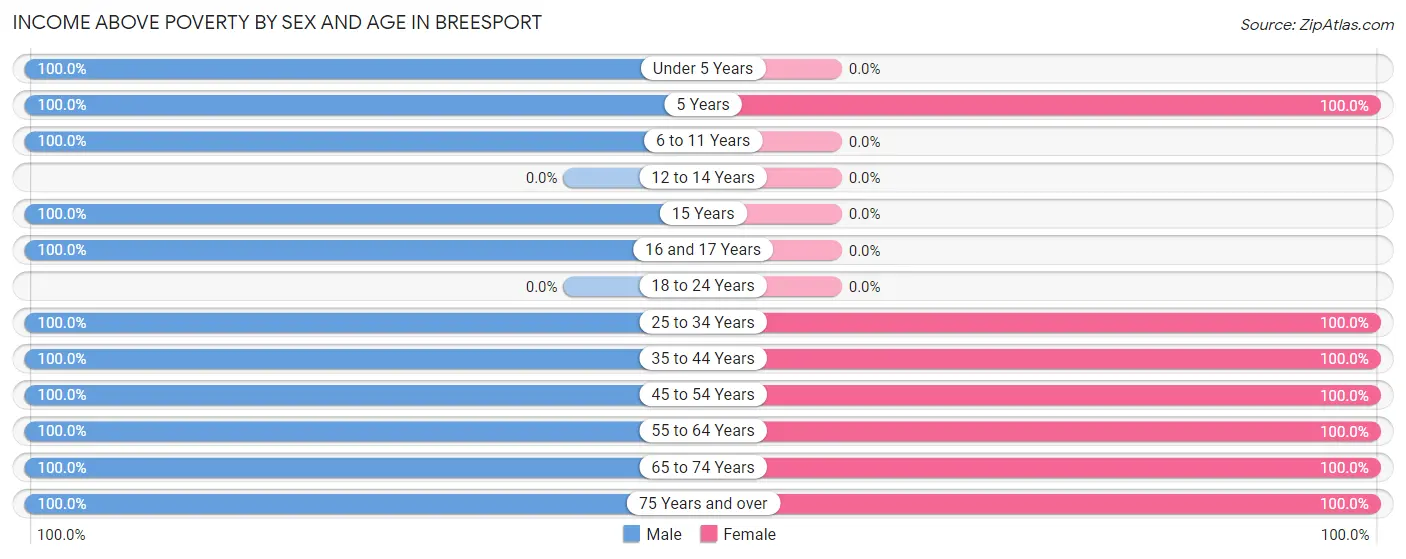
| Age Bracket | Male | Female |
| Under 5 Years | 23 (100.0%) | 0 (0.0%) |
| 5 Years | 14 (100.0%) | 26 (100.0%) |
| 6 to 11 Years | 63 (100.0%) | 0 (0.0%) |
| 12 to 14 Years | 0 (0.0%) | 0 (0.0%) |
| 15 Years | 8 (100.0%) | 0 (0.0%) |
| 16 and 17 Years | 13 (100.0%) | 0 (0.0%) |
| 18 to 24 Years | 0 (0.0%) | 0 (0.0%) |
| 25 to 34 Years | 16 (100.0%) | 19 (100.0%) |
| 35 to 44 Years | 41 (100.0%) | 83 (100.0%) |
| 45 to 54 Years | 31 (100.0%) | 56 (100.0%) |
| 55 to 64 Years | 81 (100.0%) | 97 (100.0%) |
| 65 to 74 Years | 124 (100.0%) | 88 (100.0%) |
| 75 Years and over | 41 (100.0%) | 40 (100.0%) |
| Total | 455 (100.0%) | 409 (100.0%) |
Income Below Poverty Among Married-Couple Families in Breesport
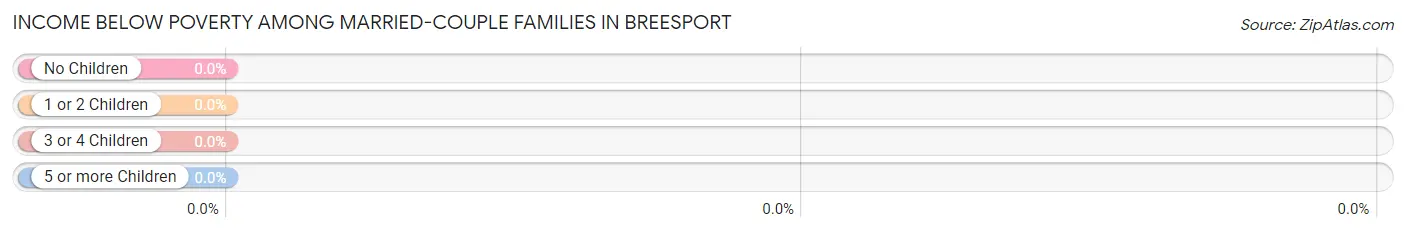
| Children | Above Poverty | Below Poverty |
| No Children | 184 (100.0%) | 0 (0.0%) |
| 1 or 2 Children | 85 (100.0%) | 0 (0.0%) |
| 3 or 4 Children | 0 (0.0%) | 0 (0.0%) |
| 5 or more Children | 0 (0.0%) | 0 (0.0%) |
| Total | 269 (100.0%) | 0 (0.0%) |
Income Below Poverty Among Single-Parent Households in Breesport
| Children | Single Father | Single Mother |
| No Children | 0 (0.0%) | 0 (0.0%) |
| 1 or 2 Children | 0 (0.0%) | 0 (0.0%) |
| 3 or 4 Children | 0 (0.0%) | 0 (0.0%) |
| 5 or more Children | 0 (0.0%) | 0 (0.0%) |
| Total | 0 (0.0%) | 0 (0.0%) |
Income Below Poverty Among Married-Couple vs Single-Parent Households in Breesport
| Children | Married-Couple Families | Single-Parent Households |
| No Children | 0 (0.0%) | 0 (0.0%) |
| 1 or 2 Children | 0 (0.0%) | 0 (0.0%) |
| 3 or 4 Children | 0 (0.0%) | 0 (0.0%) |
| 5 or more Children | 0 (0.0%) | 0 (0.0%) |
| Total | 0 (0.0%) | 0 (0.0%) |
Race in Breesport
The most populous races in Breesport are White / Caucasian (836 | 96.8%), and Asian (28 | 3.2%).
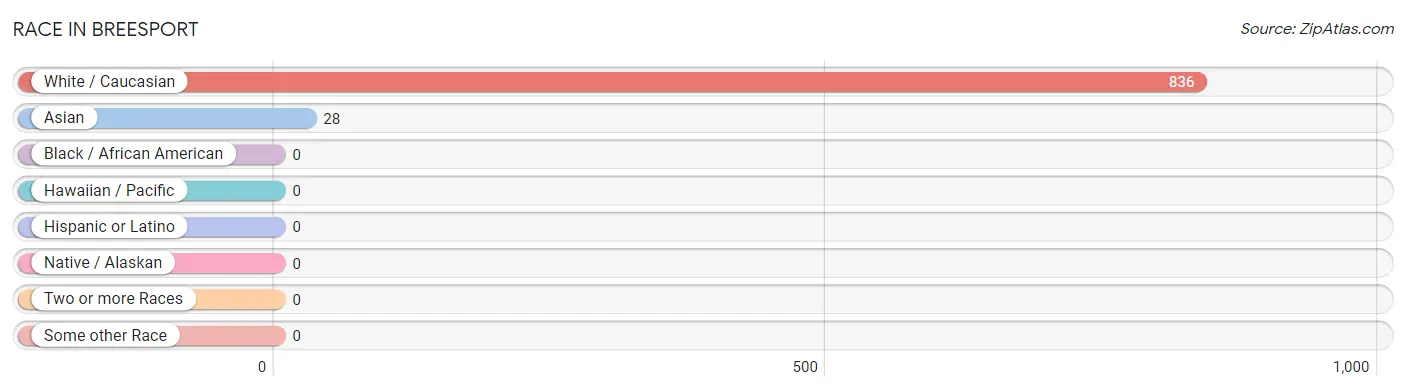
| Race | # Population | % Population |
| Asian | 28 | 3.2% |
| Black / African American | 0 | 0.0% |
| Hawaiian / Pacific | 0 | 0.0% |
| Hispanic or Latino | 0 | 0.0% |
| Native / Alaskan | 0 | 0.0% |
| White / Caucasian | 836 | 96.8% |
| Two or more Races | 0 | 0.0% |
| Some other Race | 0 | 0.0% |
| Total | 864 | 100.0% |
Ancestry in Breesport
The most populous ancestries reported in Breesport are Italian (251 | 29.0%), English (192 | 22.2%), German (131 | 15.2%), Irish (114 | 13.2%), and American (63 | 7.3%), together accounting for 86.9% of all Breesport residents.
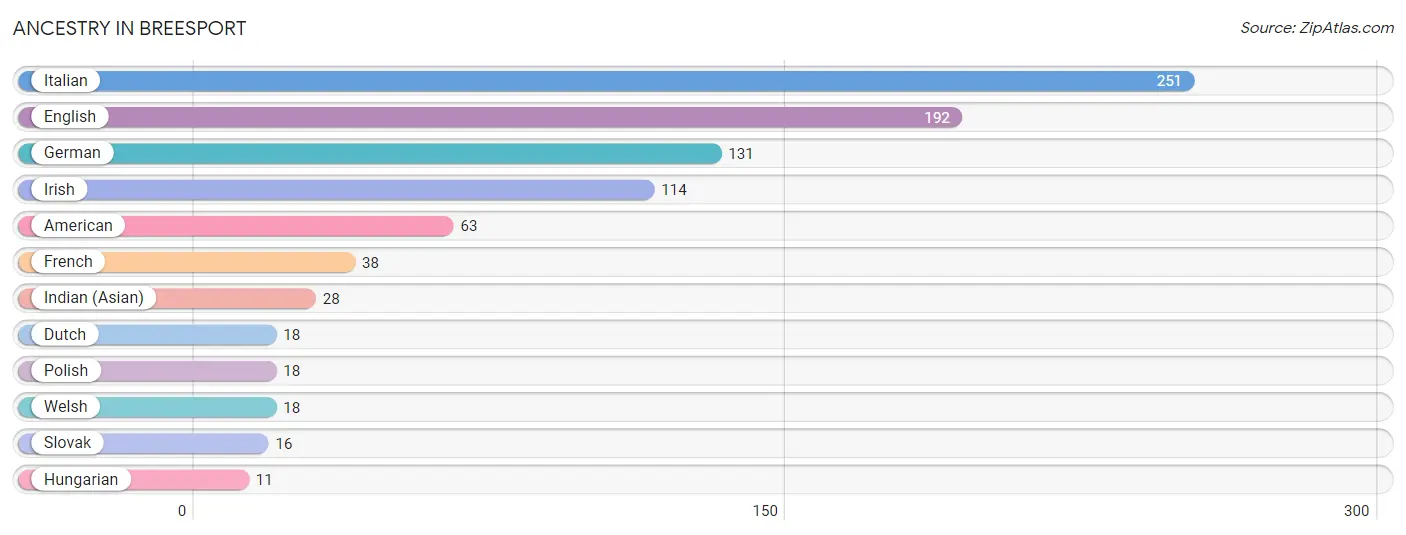
| Ancestry | # Population | % Population |
| American | 63 | 7.3% |
| Dutch | 18 | 2.1% |
| English | 192 | 22.2% |
| French | 38 | 4.4% |
| German | 131 | 15.2% |
| Hungarian | 11 | 1.3% |
| Indian (Asian) | 28 | 3.2% |
| Irish | 114 | 13.2% |
| Italian | 251 | 29.0% |
| Polish | 18 | 2.1% |
| Slovak | 16 | 1.8% |
| Welsh | 18 | 2.1% | View All 12 Rows |
Immigrants in Breesport
The most numerous immigrant groups reported in Breesport came from Caribbean (28 | 3.2%), Latin America (28 | 3.2%), and Trinidad and Tobago (28 | 3.2%), together accounting for 9.7% of all Breesport residents.
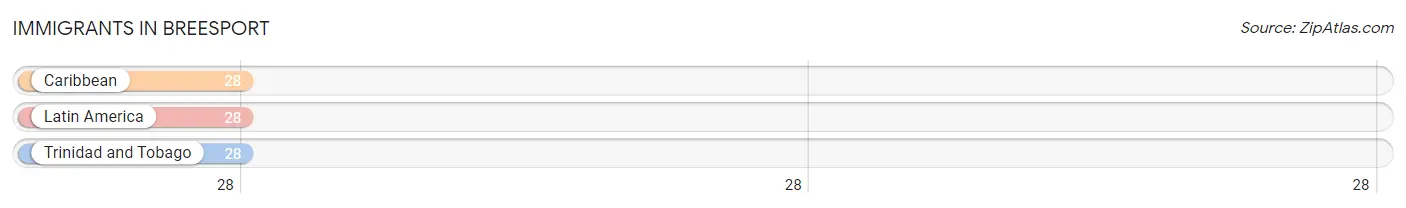
| Immigration Origin | # Population | % Population |
| Caribbean | 28 | 3.2% |
| Latin America | 28 | 3.2% |
| Trinidad and Tobago | 28 | 3.2% | View All 3 Rows |
Sex and Age in Breesport
Sex and Age in Breesport
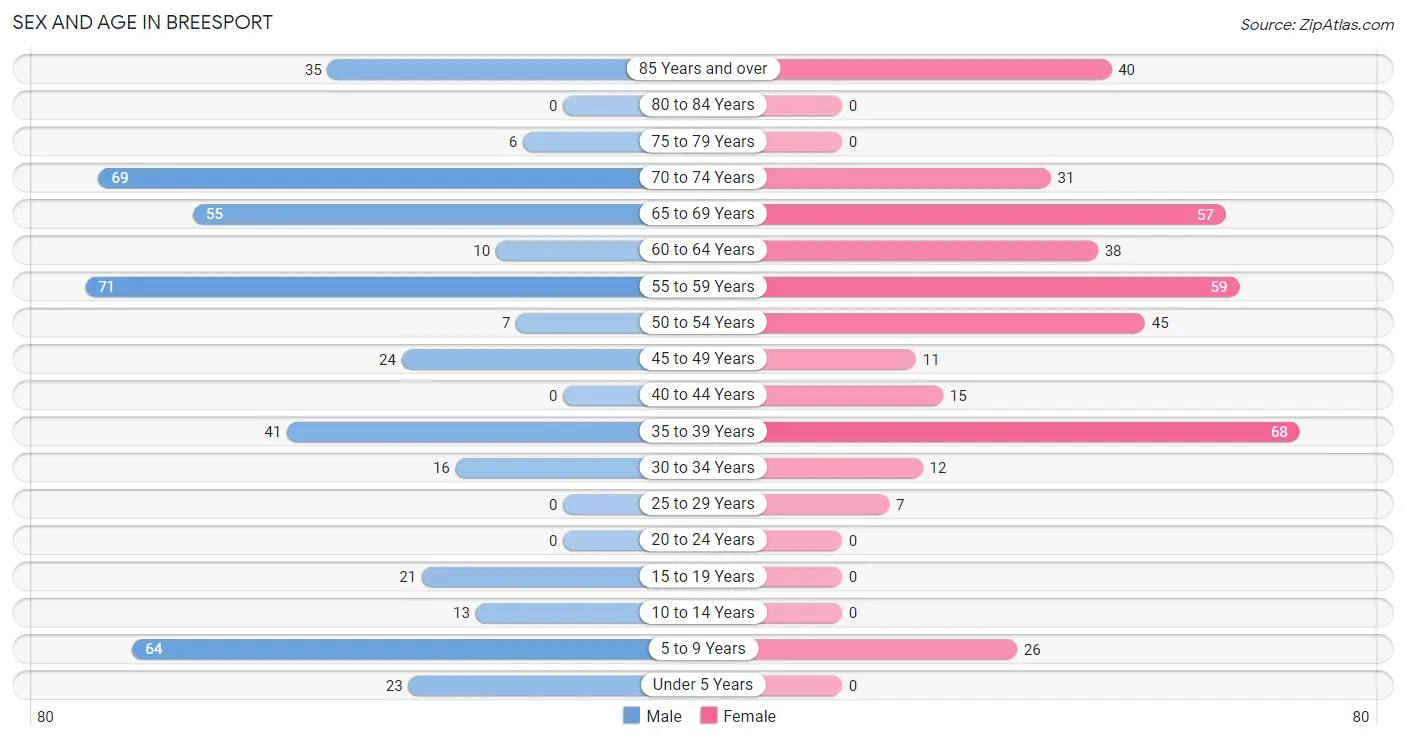
The most populous age groups in Breesport are 55 to 59 Years (71 | 15.6%) for men and 35 to 39 Years (68 | 16.6%) for women.
| Age Bracket | Male | Female |
| Under 5 Years | 23 (5.1%) | 0 (0.0%) |
| 5 to 9 Years | 64 (14.1%) | 26 (6.4%) |
| 10 to 14 Years | 13 (2.9%) | 0 (0.0%) |
| 15 to 19 Years | 21 (4.6%) | 0 (0.0%) |
| 20 to 24 Years | 0 (0.0%) | 0 (0.0%) |
| 25 to 29 Years | 0 (0.0%) | 7 (1.7%) |
| 30 to 34 Years | 16 (3.5%) | 12 (2.9%) |
| 35 to 39 Years | 41 (9.0%) | 68 (16.6%) |
| 40 to 44 Years | 0 (0.0%) | 15 (3.7%) |
| 45 to 49 Years | 24 (5.3%) | 11 (2.7%) |
| 50 to 54 Years | 7 (1.5%) | 45 (11.0%) |
| 55 to 59 Years | 71 (15.6%) | 59 (14.4%) |
| 60 to 64 Years | 10 (2.2%) | 38 (9.3%) |
| 65 to 69 Years | 55 (12.1%) | 57 (13.9%) |
| 70 to 74 Years | 69 (15.2%) | 31 (7.6%) |
| 75 to 79 Years | 6 (1.3%) | 0 (0.0%) |
| 80 to 84 Years | 0 (0.0%) | 0 (0.0%) |
| 85 Years and over | 35 (7.7%) | 40 (9.8%) |
| Total | 455 (100.0%) | 409 (100.0%) |
Families and Households in Breesport
Median Family Size in Breesport
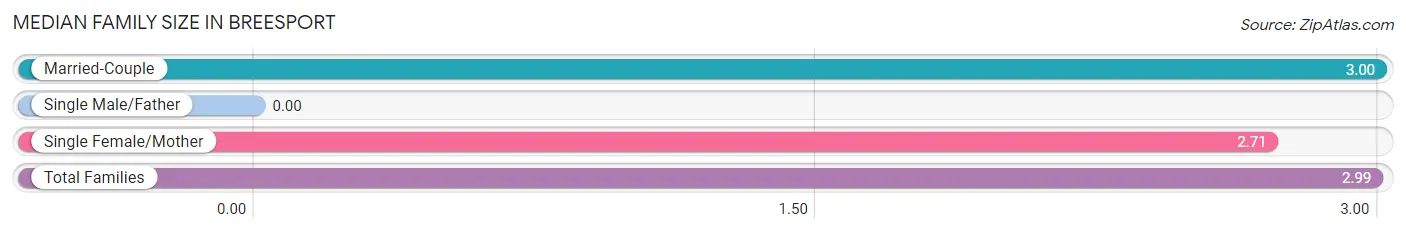
| Family Type | # Families | Family Size |
| Married-Couple | 269 (95.1%) | 3.00 |
| Single Male/Father | 0 (0.0%) | - |
| Single Female/Mother | 14 (5.0%) | 2.71 |
| Total Families | 283 (100.0%) | 2.99 |
Median Household Size in Breesport
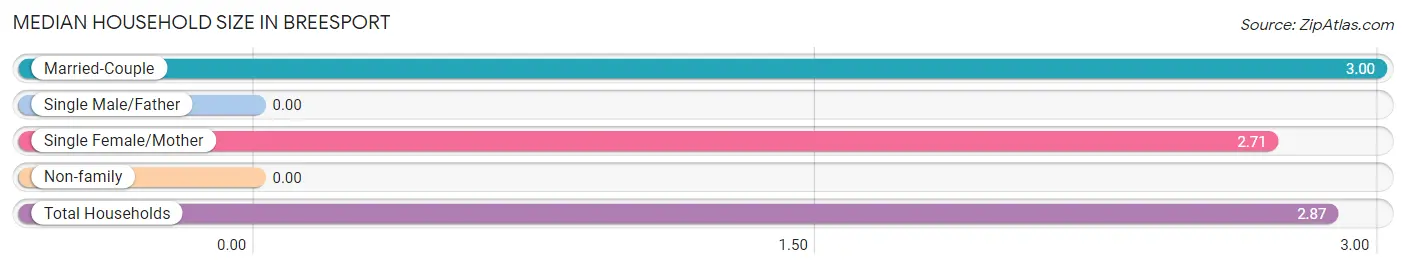
| Household Type | # Households | Household Size |
| Married-Couple | 269 (89.4%) | 3.00 |
| Single Male/Father | 0 (0.0%) | - |
| Single Female/Mother | 14 (4.6%) | 2.71 |
| Non-family | 18 (6.0%) | - |
| Total Households | 301 (100.0%) | 2.87 |
Household Size by Marriage Status in Breesport
Out of a total of 301 households in Breesport, 283 (94.0%) are family households, while 18 (6.0%) are nonfamily households. The most numerous type of family households are 2-person households, comprising 134, and the most common type of nonfamily households are 1-person households, comprising 18.
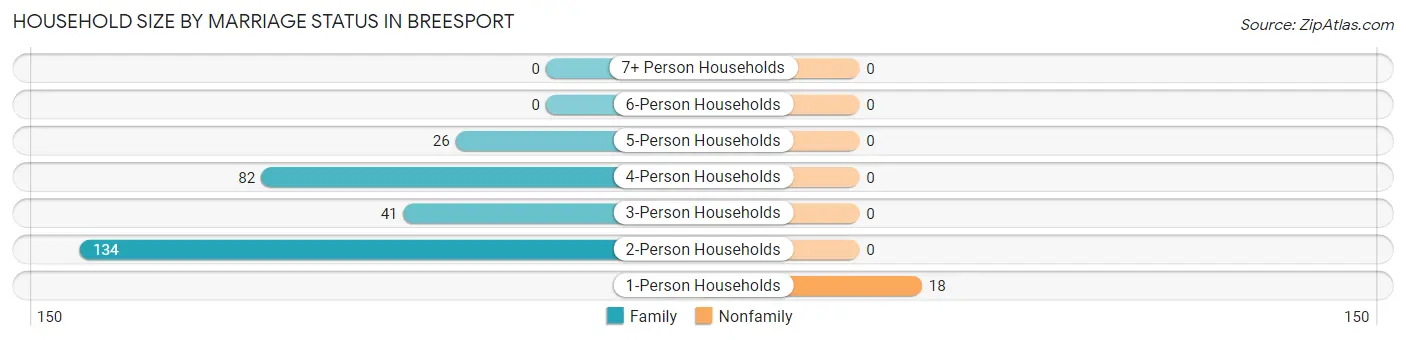
| Household Size | Family Households | Nonfamily Households |
| 1-Person Households | - | 18 (6.0%) |
| 2-Person Households | 134 (44.5%) | 0 (0.0%) |
| 3-Person Households | 41 (13.6%) | 0 (0.0%) |
| 4-Person Households | 82 (27.2%) | 0 (0.0%) |
| 5-Person Households | 26 (8.6%) | 0 (0.0%) |
| 6-Person Households | 0 (0.0%) | 0 (0.0%) |
| 7+ Person Households | 0 (0.0%) | 0 (0.0%) |
| Total | 283 (94.0%) | 18 (6.0%) |
Female Fertility in Breesport
Fertility by Age in Breesport
| Age Bracket | Women with Births | Births / 1,000 Women |
| 15 to 19 years | 0 (0.0%) | 0.0 |
| 20 to 34 years | 0 (0.0%) | 0.0 |
| 35 to 50 years | 0 (0.0%) | 0.0 |
| Total | 0 (0.0%) | 0.0 |
Fertility by Age by Marriage Status in Breesport
| Age Bracket | Married | Unmarried |
| 15 to 19 years | 0 (0.0%) | 0 (0.0%) |
| 20 to 34 years | 0 (0.0%) | 0 (0.0%) |
| 35 to 50 years | 0 (0.0%) | 0 (0.0%) |
| Total | 0 (0.0%) | 0 (0.0%) |
Fertility by Education in Breesport
| Educational Attainment | Women with Births | Births / 1,000 Women |
| Less than High School | 0 (0.0%) | 0.0 |
| High School Diploma | 0 (0.0%) | 0.0 |
| College or Associate's Degree | 0 (0.0%) | 0.0 |
| Bachelor's Degree | 0 (0.0%) | 0.0 |
| Graduate Degree | 0 (0.0%) | 0.0 |
| Total | 0 (0.0%) | 0.0 |
Fertility by Education by Marriage Status in Breesport
| Educational Attainment | Married | Unmarried |
| Less than High School | 0 (0.0%) | 0 (0.0%) |
| High School Diploma | 0 (0.0%) | 0 (0.0%) |
| College or Associate's Degree | 0 (0.0%) | 0 (0.0%) |
| Bachelor's Degree | 0 (0.0%) | 0 (0.0%) |
| Graduate Degree | 0 (0.0%) | 0 (0.0%) |
| Total | 0 (0.0%) | 0 (0.0%) |
Employment Characteristics in Breesport
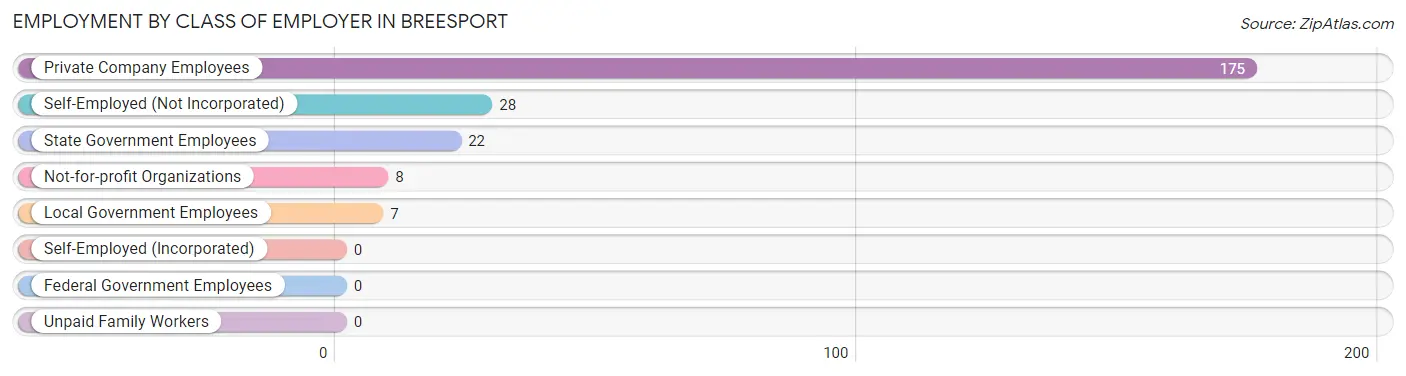
Employment by Class of Employer in Breesport
Among the 240 employed individuals in Breesport, private company employees (175 | 72.9%), self-employed (not incorporated) (28 | 11.7%), and state government employees (22 | 9.2%) make up the most common classes of employment.
| Employer Class | # Employees | % Employees |
| Private Company Employees | 175 | 72.9% |
| Self-Employed (Incorporated) | 0 | 0.0% |
| Self-Employed (Not Incorporated) | 28 | 11.7% |
| Not-for-profit Organizations | 8 | 3.3% |
| Local Government Employees | 7 | 2.9% |
| State Government Employees | 22 | 9.2% |
| Federal Government Employees | 0 | 0.0% |
| Unpaid Family Workers | 0 | 0.0% |
| Total | 240 | 100.0% |
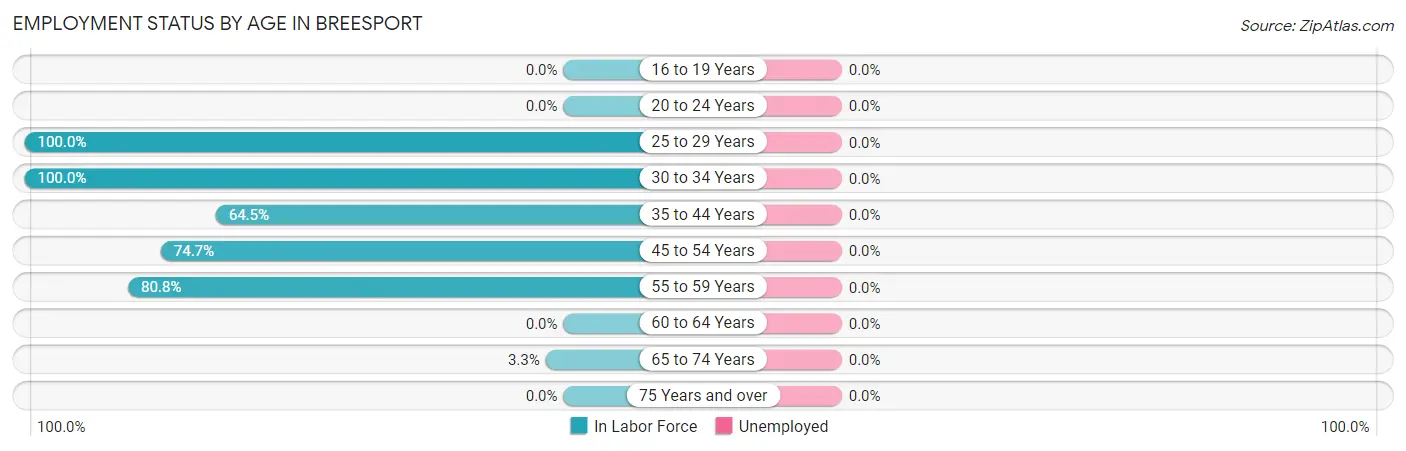
Employment Status by Age in Breesport
| Age Bracket | In Labor Force | Unemployed |
| 16 to 19 Years | 0 (0.0%) | 0 (0.0%) |
| 20 to 24 Years | 0 (0.0%) | 0 (0.0%) |
| 25 to 29 Years | 7 (100.0%) | 0 (0.0%) |
| 30 to 34 Years | 28 (100.0%) | 0 (0.0%) |
| 35 to 44 Years | 80 (64.5%) | 0 (0.0%) |
| 45 to 54 Years | 65 (74.7%) | 0 (0.0%) |
| 55 to 59 Years | 105 (80.8%) | 0 (0.0%) |
| 60 to 64 Years | 0 (0.0%) | 0 (0.0%) |
| 65 to 74 Years | 7 (3.3%) | 0 (0.0%) |
| 75 Years and over | 0 (0.0%) | 0 (0.0%) |
| Total | 292 (40.0%) | 0 (0.0%) |
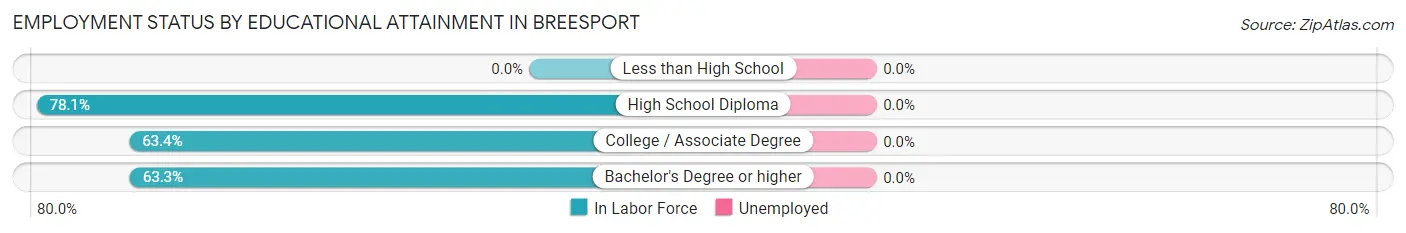
Employment Status by Educational Attainment in Breesport
| Educational Attainment | In Labor Force | Unemployed |
| Less than High School | 0 (0.0%) | 0 (0.0%) |
| High School Diploma | 114 (78.1%) | 0 (0.0%) |
| College / Associate Degree | 109 (63.4%) | 0 (0.0%) |
| Bachelor's Degree or higher | 62 (63.3%) | 0 (0.0%) |
| Total | 285 (67.2%) | 0 (0.0%) |
Employment Occupations by Sex in Breesport
Management, Business, Science and Arts Occupations
The most common Management, Business, Science and Arts occupations in Breesport are Community & Social Service (52 | 17.8%), Education, Arts & Media (34 | 11.6%), Management (28 | 9.6%), Health Diagnosing & Treating (26 | 8.9%), and Education Instruction & Library (18 | 6.2%).
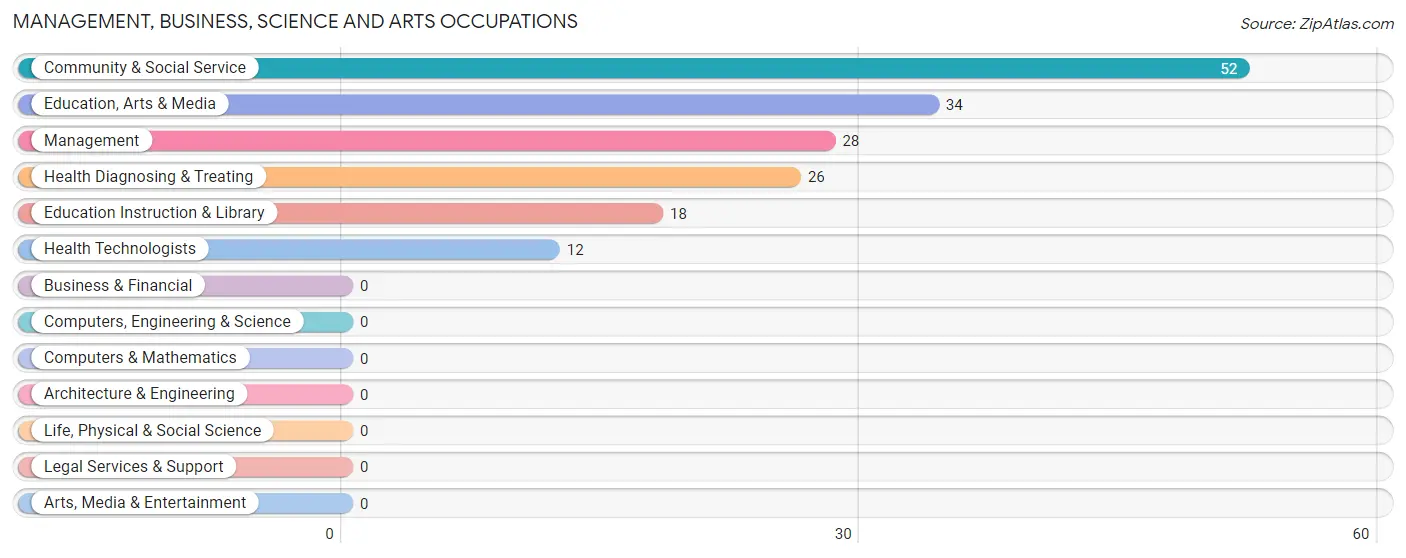
Management, Business, Science and Arts Occupations by Sex
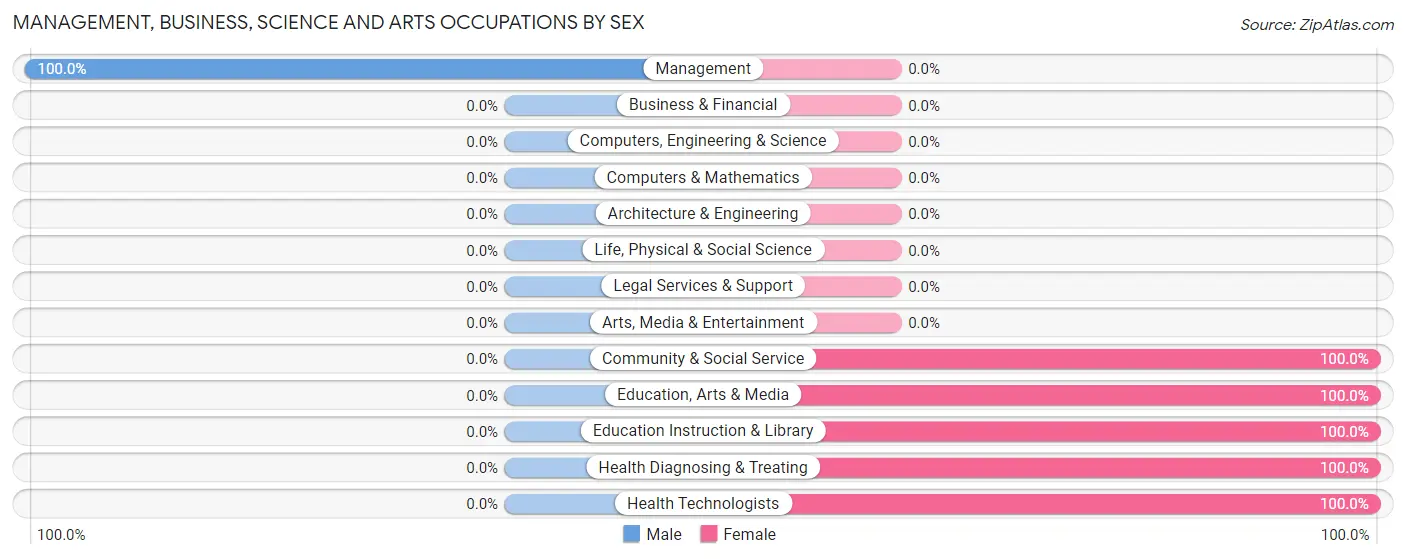
| Occupation | Male | Female |
| Management | 28 (100.0%) | 0 (0.0%) |
| Business & Financial | 0 (0.0%) | 0 (0.0%) |
| Computers, Engineering & Science | 0 (0.0%) | 0 (0.0%) |
| Computers & Mathematics | 0 (0.0%) | 0 (0.0%) |
| Architecture & Engineering | 0 (0.0%) | 0 (0.0%) |
| Life, Physical & Social Science | 0 (0.0%) | 0 (0.0%) |
| Community & Social Service | 0 (0.0%) | 52 (100.0%) |
| Education, Arts & Media | 0 (0.0%) | 34 (100.0%) |
| Legal Services & Support | 0 (0.0%) | 0 (0.0%) |
| Education Instruction & Library | 0 (0.0%) | 18 (100.0%) |
| Arts, Media & Entertainment | 0 (0.0%) | 0 (0.0%) |
| Health Diagnosing & Treating | 0 (0.0%) | 26 (100.0%) |
| Health Technologists | 0 (0.0%) | 12 (100.0%) |
| Total (Category) | 28 (26.4%) | 78 (73.6%) |
| Total (Overall) | 151 (51.7%) | 141 (48.3%) |
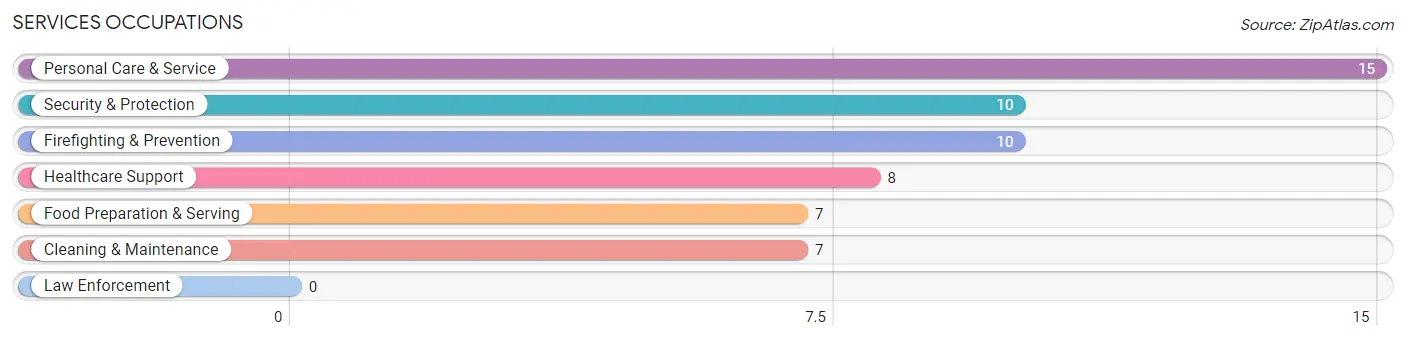
Services Occupations
The most common Services occupations in Breesport are Personal Care & Service (15 | 5.1%), Security & Protection (10 | 3.4%), Firefighting & Prevention (10 | 3.4%), Healthcare Support (8 | 2.7%), and Food Preparation & Serving (7 | 2.4%).
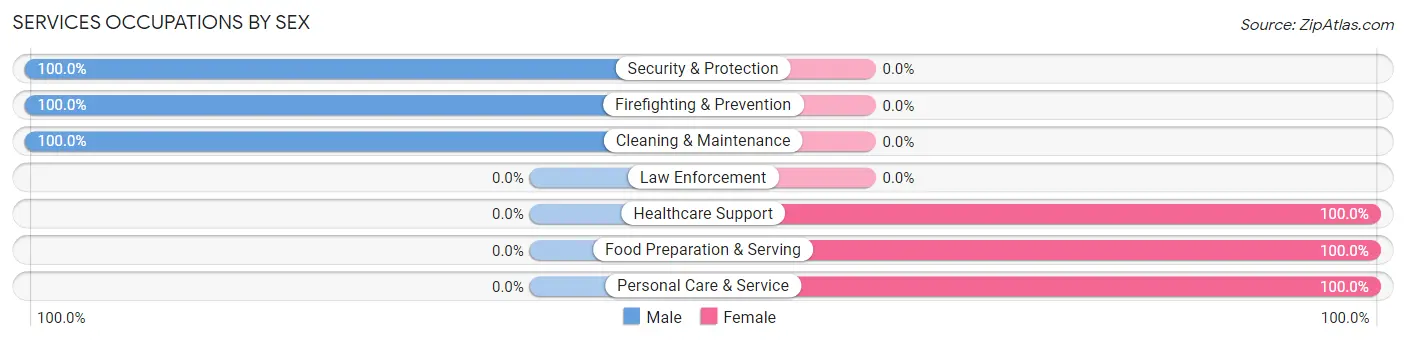
Services Occupations by Sex
Within the Services occupations in Breesport, the most male-oriented occupations are Security & Protection (100.0%), Firefighting & Prevention (100.0%), and Cleaning & Maintenance (100.0%), while the most female-oriented occupations are Healthcare Support (100.0%), Food Preparation & Serving (100.0%), and Personal Care & Service (100.0%).
| Occupation | Male | Female |
| Healthcare Support | 0 (0.0%) | 8 (100.0%) |
| Security & Protection | 10 (100.0%) | 0 (0.0%) |
| Firefighting & Prevention | 10 (100.0%) | 0 (0.0%) |
| Law Enforcement | 0 (0.0%) | 0 (0.0%) |
| Food Preparation & Serving | 0 (0.0%) | 7 (100.0%) |
| Cleaning & Maintenance | 7 (100.0%) | 0 (0.0%) |
| Personal Care & Service | 0 (0.0%) | 15 (100.0%) |
| Total (Category) | 17 (36.2%) | 30 (63.8%) |
| Total (Overall) | 151 (51.7%) | 141 (48.3%) |
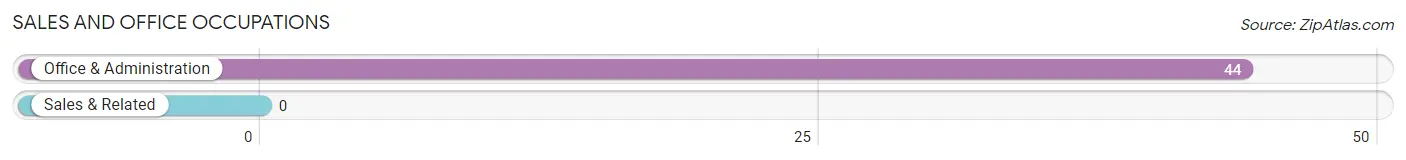
Sales and Office Occupations
The most common Sales and Office occupations in Breesport are , and Office & Administration (44 | 15.1%).
Sales and Office Occupations by Sex
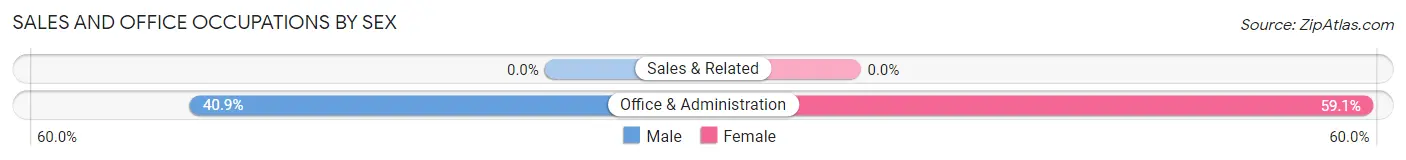
| Occupation | Male | Female |
| Sales & Related | 0 (0.0%) | 0 (0.0%) |
| Office & Administration | 18 (40.9%) | 26 (59.1%) |
| Total (Category) | 18 (40.9%) | 26 (59.1%) |
| Total (Overall) | 151 (51.7%) | 141 (48.3%) |
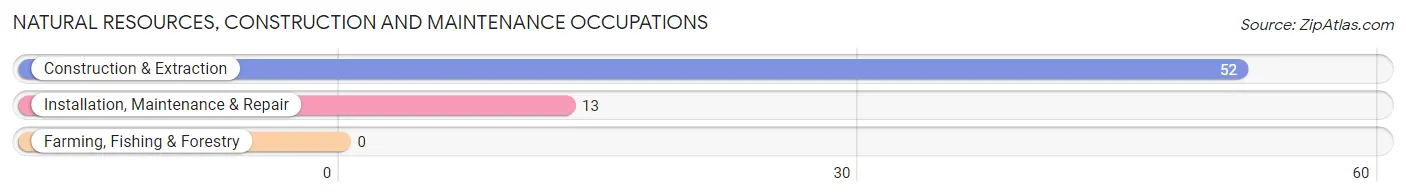
Natural Resources, Construction and Maintenance Occupations
The most common Natural Resources, Construction and Maintenance occupations in Breesport are Construction & Extraction (52 | 17.8%), and Installation, Maintenance & Repair (13 | 4.4%).
Natural Resources, Construction and Maintenance Occupations by Sex
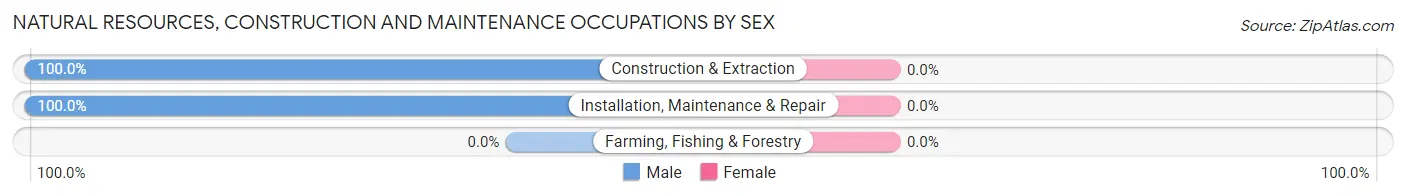
| Occupation | Male | Female |
| Farming, Fishing & Forestry | 0 (0.0%) | 0 (0.0%) |
| Construction & Extraction | 52 (100.0%) | 0 (0.0%) |
| Installation, Maintenance & Repair | 13 (100.0%) | 0 (0.0%) |
| Total (Category) | 65 (100.0%) | 0 (0.0%) |
| Total (Overall) | 151 (51.7%) | 141 (48.3%) |
Production, Transportation and Moving Occupations
The most common Production, Transportation and Moving occupations in Breesport are Production (16 | 5.5%), and Material Moving (14 | 4.8%).
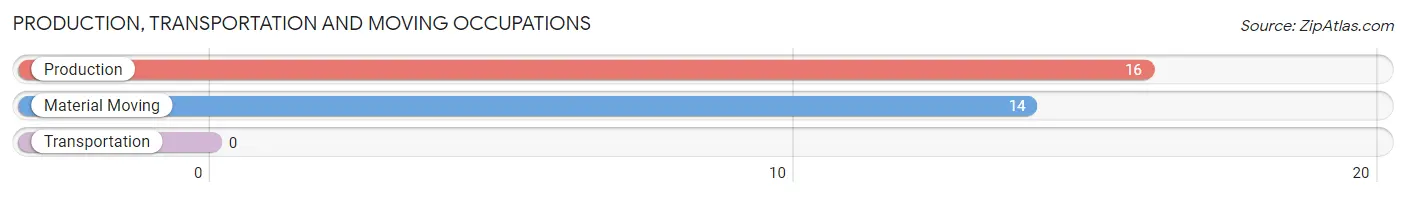
Production, Transportation and Moving Occupations by Sex
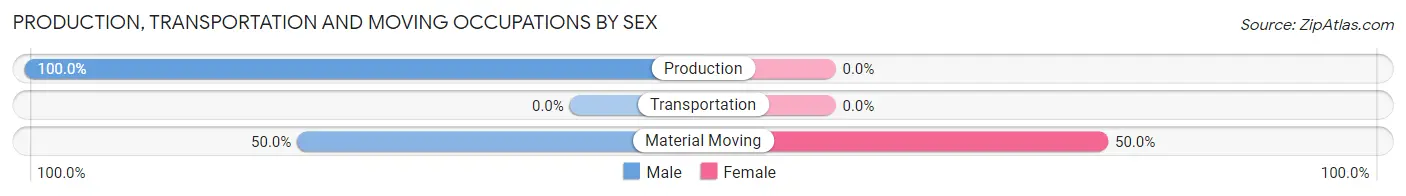
| Occupation | Male | Female |
| Production | 16 (100.0%) | 0 (0.0%) |
| Transportation | 0 (0.0%) | 0 (0.0%) |
| Material Moving | 7 (50.0%) | 7 (50.0%) |
| Total (Category) | 23 (76.7%) | 7 (23.3%) |
| Total (Overall) | 151 (51.7%) | 141 (48.3%) |
Employment Industries by Sex in Breesport
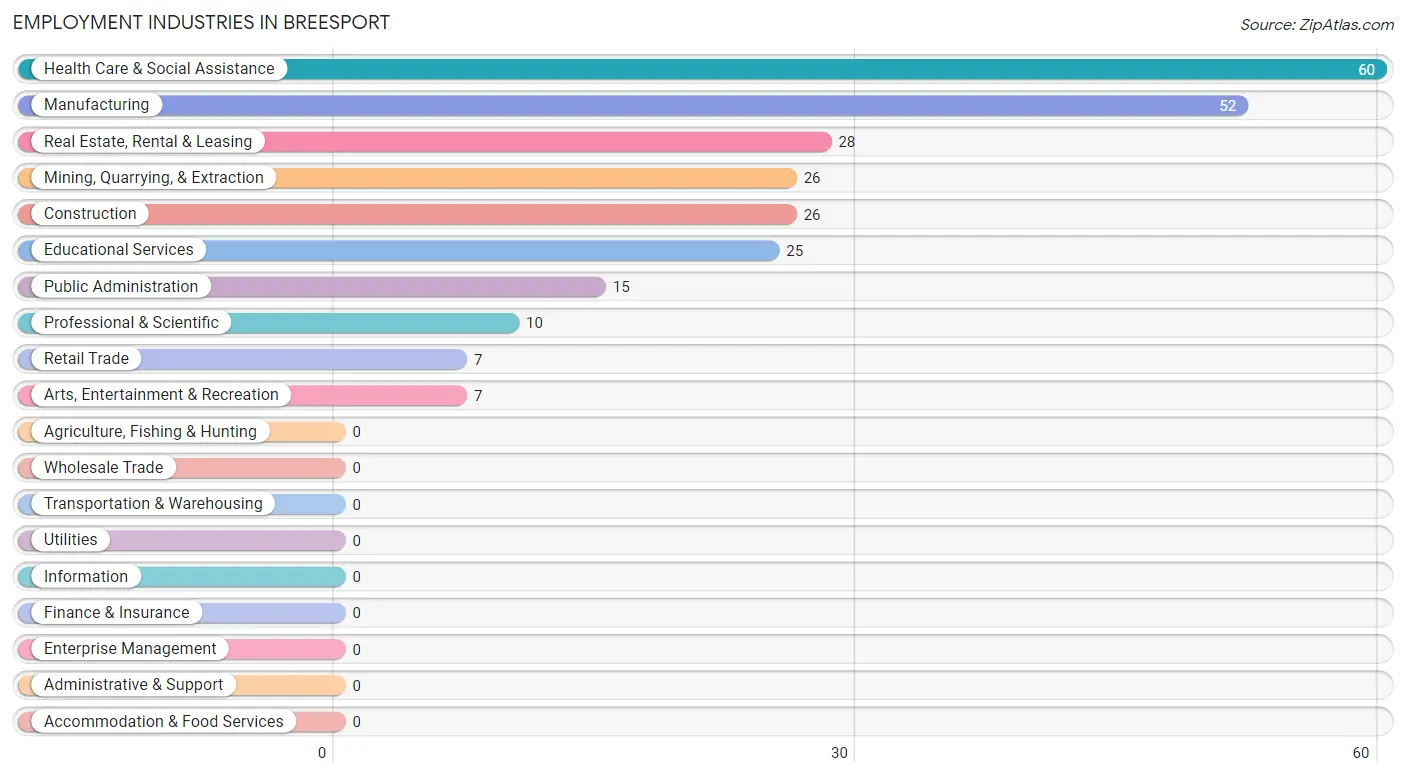
Employment Industries in Breesport
The major employment industries in Breesport include Health Care & Social Assistance (60 | 20.5%), Manufacturing (52 | 17.8%), Real Estate, Rental & Leasing (28 | 9.6%), Mining, Quarrying, & Extraction (26 | 8.9%), and Construction (26 | 8.9%).
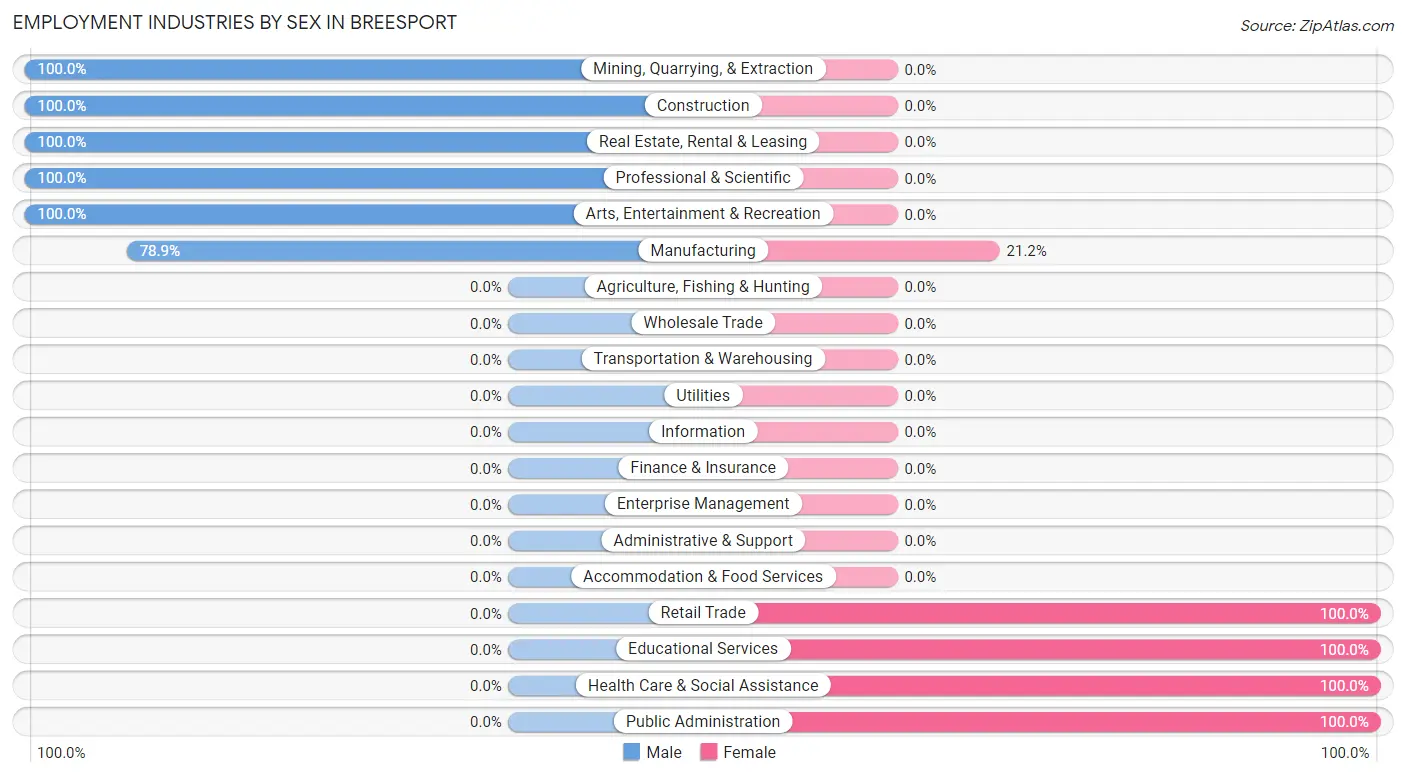
Employment Industries by Sex in Breesport
The Breesport industries that see more men than women are Mining, Quarrying, & Extraction (100.0%), Construction (100.0%), and Real Estate, Rental & Leasing (100.0%), whereas the industries that tend to have a higher number of women are Retail Trade (100.0%), Educational Services (100.0%), and Health Care & Social Assistance (100.0%).
| Industry | Male | Female |
| Agriculture, Fishing & Hunting | 0 (0.0%) | 0 (0.0%) |
| Mining, Quarrying, & Extraction | 26 (100.0%) | 0 (0.0%) |
| Construction | 26 (100.0%) | 0 (0.0%) |
| Manufacturing | 41 (78.8%) | 11 (21.1%) |
| Wholesale Trade | 0 (0.0%) | 0 (0.0%) |
| Retail Trade | 0 (0.0%) | 7 (100.0%) |
| Transportation & Warehousing | 0 (0.0%) | 0 (0.0%) |
| Utilities | 0 (0.0%) | 0 (0.0%) |
| Information | 0 (0.0%) | 0 (0.0%) |
| Finance & Insurance | 0 (0.0%) | 0 (0.0%) |
| Real Estate, Rental & Leasing | 28 (100.0%) | 0 (0.0%) |
| Professional & Scientific | 10 (100.0%) | 0 (0.0%) |
| Enterprise Management | 0 (0.0%) | 0 (0.0%) |
| Administrative & Support | 0 (0.0%) | 0 (0.0%) |
| Educational Services | 0 (0.0%) | 25 (100.0%) |
| Health Care & Social Assistance | 0 (0.0%) | 60 (100.0%) |
| Arts, Entertainment & Recreation | 7 (100.0%) | 0 (0.0%) |
| Accommodation & Food Services | 0 (0.0%) | 0 (0.0%) |
| Public Administration | 0 (0.0%) | 15 (100.0%) |
| Total | 151 (51.7%) | 141 (48.3%) |
Education in Breesport
School Enrollment in Breesport
The most common levels of schooling among the 159 students in Breesport are elementary school (50 | 31.5%), nursery / preschool (37 | 23.3%), and kindergarten (26 | 16.4%).
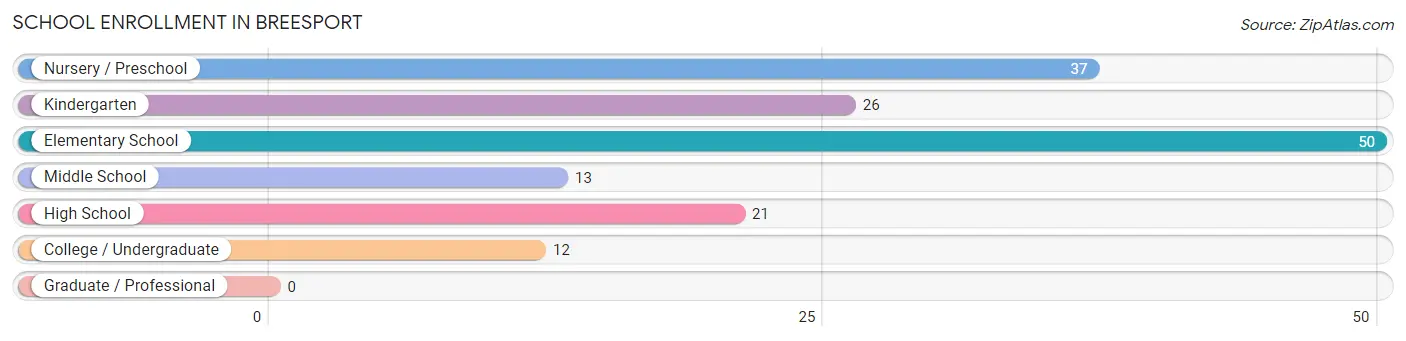
| School Level | # Students | % Students |
| Nursery / Preschool | 37 | 23.3% |
| Kindergarten | 26 | 16.4% |
| Elementary School | 50 | 31.5% |
| Middle School | 13 | 8.2% |
| High School | 21 | 13.2% |
| College / Undergraduate | 12 | 7.5% |
| Graduate / Professional | 0 | 0.0% |
| Total | 159 | 100.0% |
School Enrollment by Age by Funding Source in Breesport
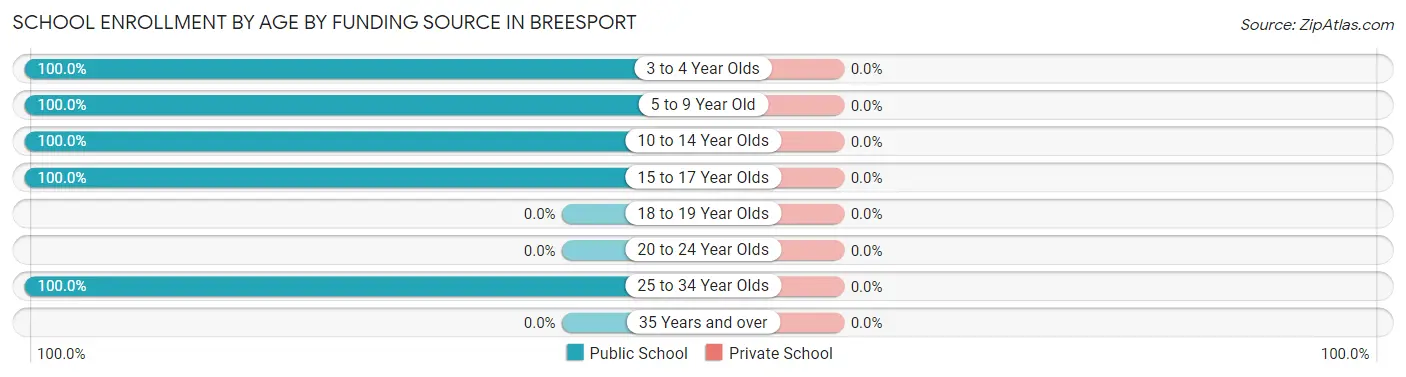
| Age Bracket | Public School | Private School |
| 3 to 4 Year Olds | 23 (100.0%) | 0 (0.0%) |
| 5 to 9 Year Old | 90 (100.0%) | 0 (0.0%) |
| 10 to 14 Year Olds | 13 (100.0%) | 0 (0.0%) |
| 15 to 17 Year Olds | 21 (100.0%) | 0 (0.0%) |
| 18 to 19 Year Olds | 0 (0.0%) | 0 (0.0%) |
| 20 to 24 Year Olds | 0 (0.0%) | 0 (0.0%) |
| 25 to 34 Year Olds | 12 (100.0%) | 0 (0.0%) |
| 35 Years and over | 0 (0.0%) | 0 (0.0%) |
| Total | 159 (100.0%) | 0 (0.0%) |
Educational Attainment by Field of Study in Breesport
Education (50 | 35.7%), arts & humanities (44 | 31.4%), visual & performing arts (36 | 25.7%), and business (10 | 7.1%) are the most common fields of study among 140 individuals in Breesport who have obtained a bachelor's degree or higher.
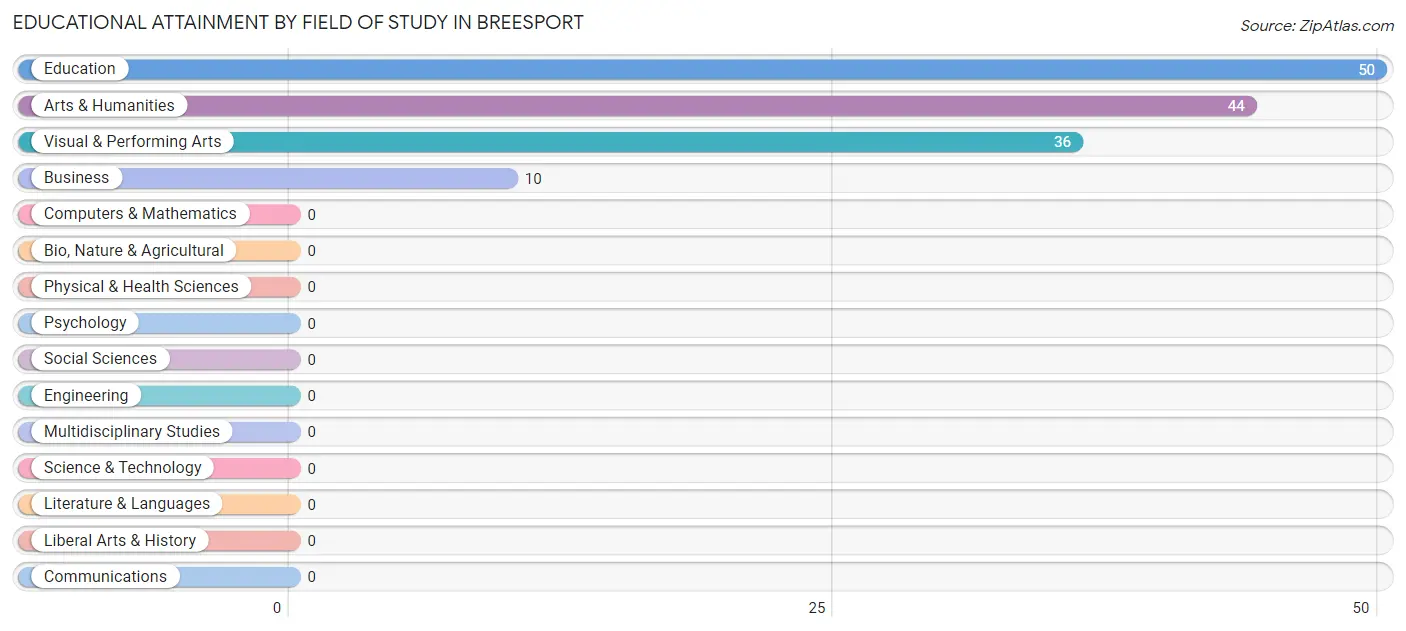
| Field of Study | # Graduates | % Graduates |
| Computers & Mathematics | 0 | 0.0% |
| Bio, Nature & Agricultural | 0 | 0.0% |
| Physical & Health Sciences | 0 | 0.0% |
| Psychology | 0 | 0.0% |
| Social Sciences | 0 | 0.0% |
| Engineering | 0 | 0.0% |
| Multidisciplinary Studies | 0 | 0.0% |
| Science & Technology | 0 | 0.0% |
| Business | 10 | 7.1% |
| Education | 50 | 35.7% |
| Literature & Languages | 0 | 0.0% |
| Liberal Arts & History | 0 | 0.0% |
| Visual & Performing Arts | 36 | 25.7% |
| Communications | 0 | 0.0% |
| Arts & Humanities | 44 | 31.4% |
| Total | 140 | 100.0% |
Transportation & Commute in Breesport
Vehicle Availability by Sex in Breesport
The most prevalent vehicle ownership categories in Breesport are males with 3 vehicles (63, accounting for 41.7%) and females with 3 vehicles (37, making up 70.8%).
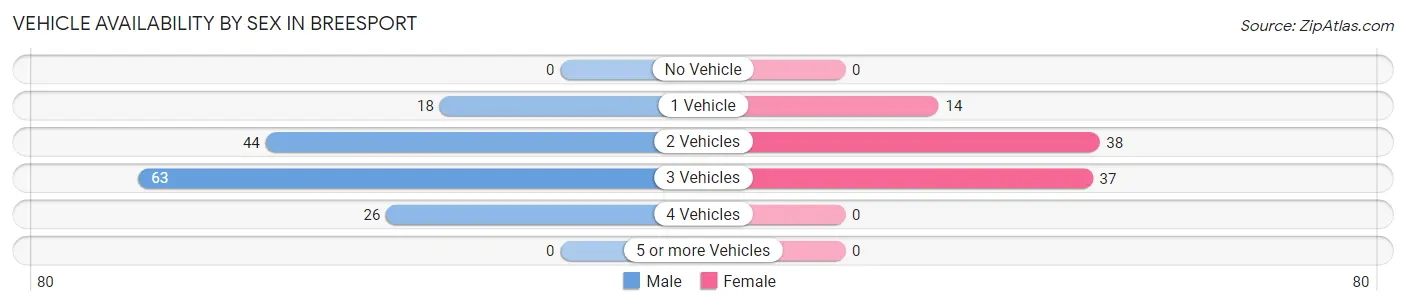
| Vehicles Available | Male | Female |
| No Vehicle | 0 (0.0%) | 0 (0.0%) |
| 1 Vehicle | 18 (11.9%) | 14 (15.7%) |
| 2 Vehicles | 44 (29.1%) | 38 (42.7%) |
| 3 Vehicles | 63 (41.7%) | 37 (41.6%) |
| 4 Vehicles | 26 (17.2%) | 0 (0.0%) |
| 5 or more Vehicles | 0 (0.0%) | 0 (0.0%) |
| Total | 151 (100.0%) | 89 (100.0%) |
Commute Time in Breesport
The most frequently occuring commute durations in Breesport are 20 to 24 minutes (62 commuters, 27.1%), 15 to 19 minutes (37 commuters, 16.2%), and 10 to 14 minutes (35 commuters, 15.3%).
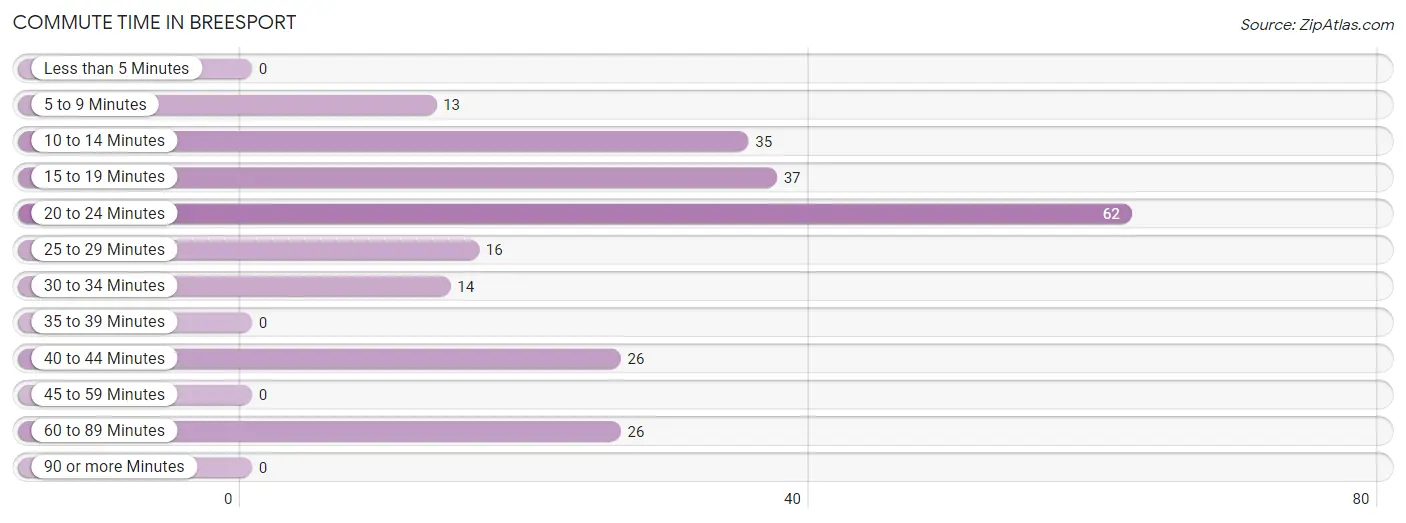
| Commute Time | # Commuters | % Commuters |
| Less than 5 Minutes | 0 | 0.0% |
| 5 to 9 Minutes | 13 | 5.7% |
| 10 to 14 Minutes | 35 | 15.3% |
| 15 to 19 Minutes | 37 | 16.2% |
| 20 to 24 Minutes | 62 | 27.1% |
| 25 to 29 Minutes | 16 | 7.0% |
| 30 to 34 Minutes | 14 | 6.1% |
| 35 to 39 Minutes | 0 | 0.0% |
| 40 to 44 Minutes | 26 | 11.4% |
| 45 to 59 Minutes | 0 | 0.0% |
| 60 to 89 Minutes | 26 | 11.4% |
| 90 or more Minutes | 0 | 0.0% |
Commute Time by Sex in Breesport
The most common commute times in Breesport are 10 to 14 minutes (28 commuters, 18.5%) for males and 20 to 24 minutes (45 commuters, 57.7%) for females.
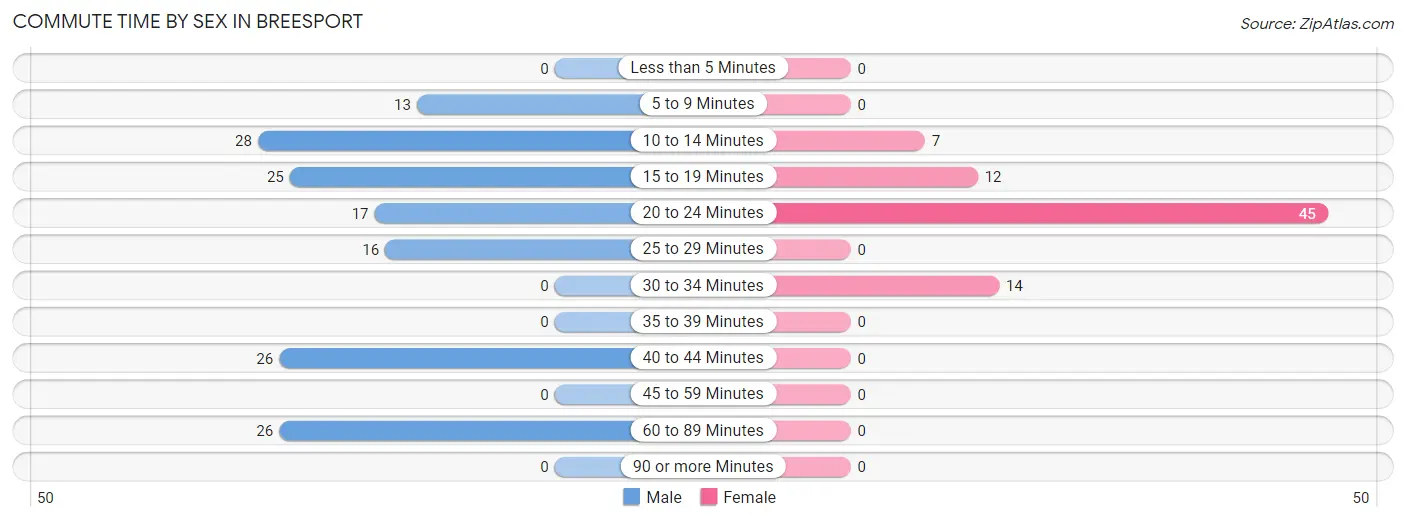
| Commute Time | Male | Female |
| Less than 5 Minutes | 0 (0.0%) | 0 (0.0%) |
| 5 to 9 Minutes | 13 (8.6%) | 0 (0.0%) |
| 10 to 14 Minutes | 28 (18.5%) | 7 (9.0%) |
| 15 to 19 Minutes | 25 (16.6%) | 12 (15.4%) |
| 20 to 24 Minutes | 17 (11.3%) | 45 (57.7%) |
| 25 to 29 Minutes | 16 (10.6%) | 0 (0.0%) |
| 30 to 34 Minutes | 0 (0.0%) | 14 (17.9%) |
| 35 to 39 Minutes | 0 (0.0%) | 0 (0.0%) |
| 40 to 44 Minutes | 26 (17.2%) | 0 (0.0%) |
| 45 to 59 Minutes | 0 (0.0%) | 0 (0.0%) |
| 60 to 89 Minutes | 26 (17.2%) | 0 (0.0%) |
| 90 or more Minutes | 0 (0.0%) | 0 (0.0%) |
Time of Departure to Work by Sex in Breesport
The most frequent times of departure to work in Breesport are 8:00 AM to 8:29 AM (46, 30.5%) for males and 7:30 AM to 7:59 AM (22, 28.2%) for females.
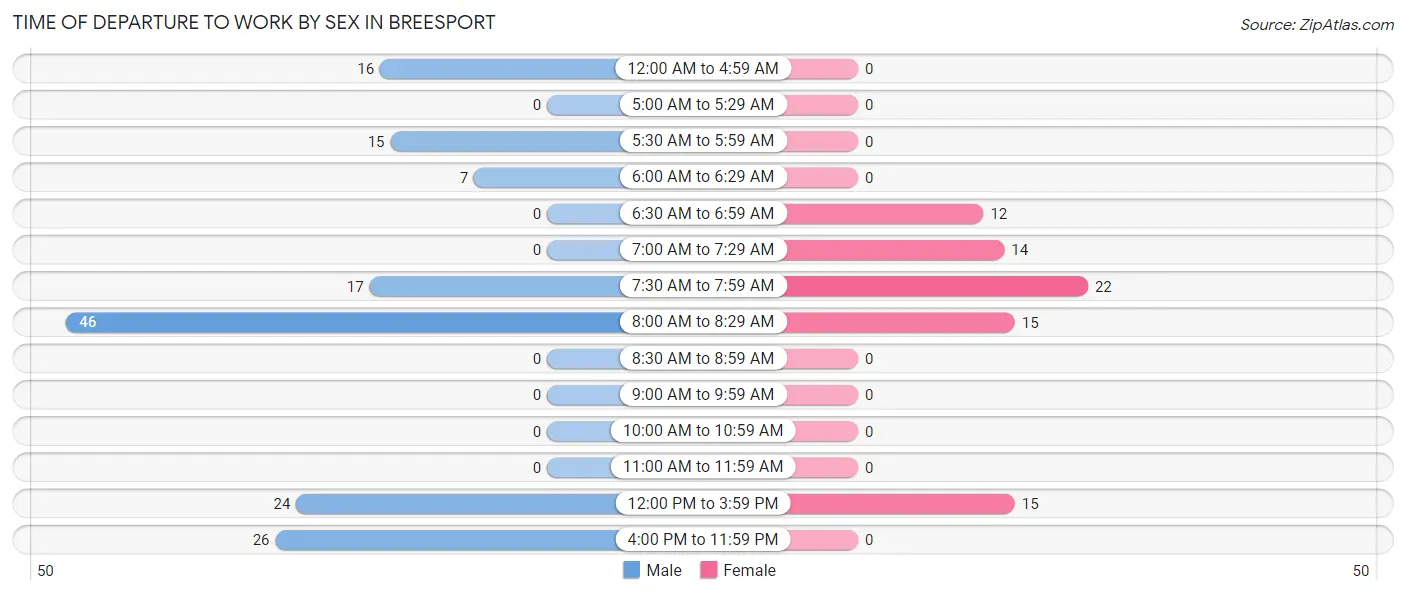
| Time of Departure | Male | Female |
| 12:00 AM to 4:59 AM | 16 (10.6%) | 0 (0.0%) |
| 5:00 AM to 5:29 AM | 0 (0.0%) | 0 (0.0%) |
| 5:30 AM to 5:59 AM | 15 (9.9%) | 0 (0.0%) |
| 6:00 AM to 6:29 AM | 7 (4.6%) | 0 (0.0%) |
| 6:30 AM to 6:59 AM | 0 (0.0%) | 12 (15.4%) |
| 7:00 AM to 7:29 AM | 0 (0.0%) | 14 (17.9%) |
| 7:30 AM to 7:59 AM | 17 (11.3%) | 22 (28.2%) |
| 8:00 AM to 8:29 AM | 46 (30.5%) | 15 (19.2%) |
| 8:30 AM to 8:59 AM | 0 (0.0%) | 0 (0.0%) |
| 9:00 AM to 9:59 AM | 0 (0.0%) | 0 (0.0%) |
| 10:00 AM to 10:59 AM | 0 (0.0%) | 0 (0.0%) |
| 11:00 AM to 11:59 AM | 0 (0.0%) | 0 (0.0%) |
| 12:00 PM to 3:59 PM | 24 (15.9%) | 15 (19.2%) |
| 4:00 PM to 11:59 PM | 26 (17.2%) | 0 (0.0%) |
| Total | 151 (100.0%) | 78 (100.0%) |
Housing Occupancy in Breesport
Occupancy by Ownership in Breesport
Of the total 301 dwellings in Breesport, owner-occupied units account for 301 (100.0%), while renter-occupied units make up 0 (0.0%).
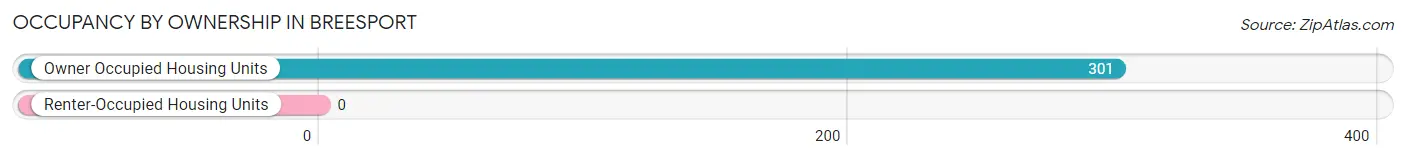
| Occupancy | # Housing Units | % Housing Units |
| Owner Occupied Housing Units | 301 | 100.0% |
| Renter-Occupied Housing Units | 0 | 0.0% |
| Total Occupied Housing Units | 301 | 100.0% |
Occupancy by Household Size in Breesport
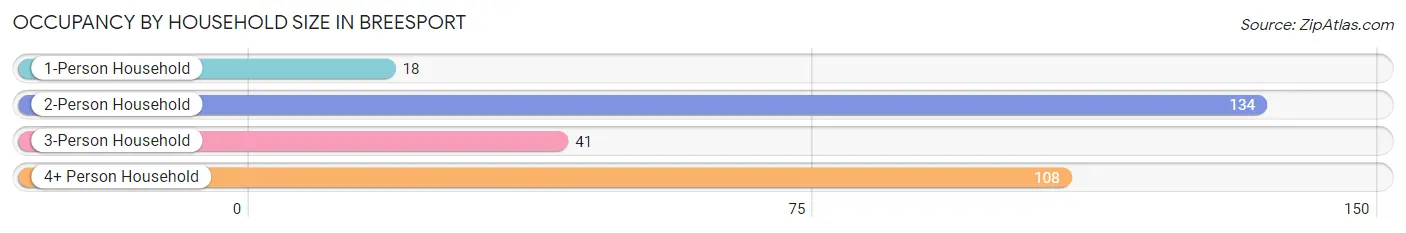
| Household Size | # Housing Units | % Housing Units |
| 1-Person Household | 18 | 6.0% |
| 2-Person Household | 134 | 44.5% |
| 3-Person Household | 41 | 13.6% |
| 4+ Person Household | 108 | 35.9% |
| Total Housing Units | 301 | 100.0% |
Occupancy by Ownership by Household Size in Breesport
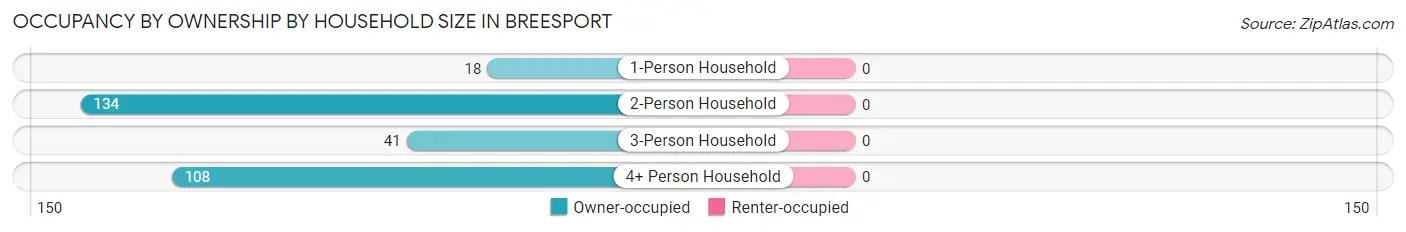
| Household Size | Owner-occupied | Renter-occupied |
| 1-Person Household | 18 (100.0%) | 0 (0.0%) |
| 2-Person Household | 134 (100.0%) | 0 (0.0%) |
| 3-Person Household | 41 (100.0%) | 0 (0.0%) |
| 4+ Person Household | 108 (100.0%) | 0 (0.0%) |
| Total Housing Units | 301 (100.0%) | 0 (0.0%) |
Occupancy by Educational Attainment in Breesport
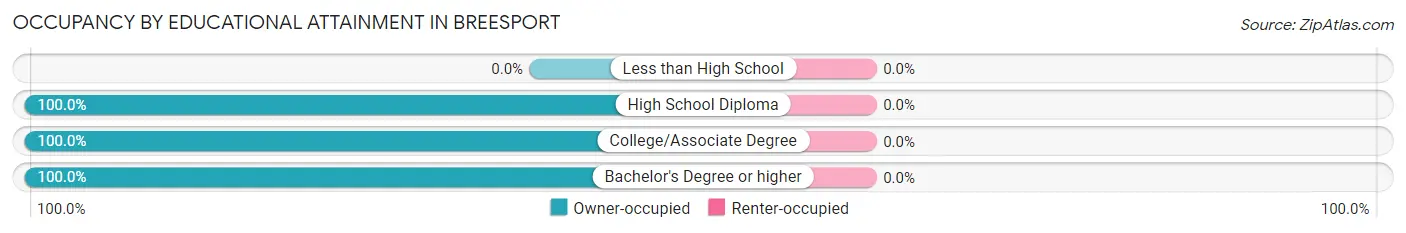
| Household Size | Owner-occupied | Renter-occupied |
| Less than High School | 0 (0.0%) | 0 (0.0%) |
| High School Diploma | 105 (100.0%) | 0 (0.0%) |
| College/Associate Degree | 152 (100.0%) | 0 (0.0%) |
| Bachelor's Degree or higher | 44 (100.0%) | 0 (0.0%) |
Occupancy by Age of Householder in Breesport
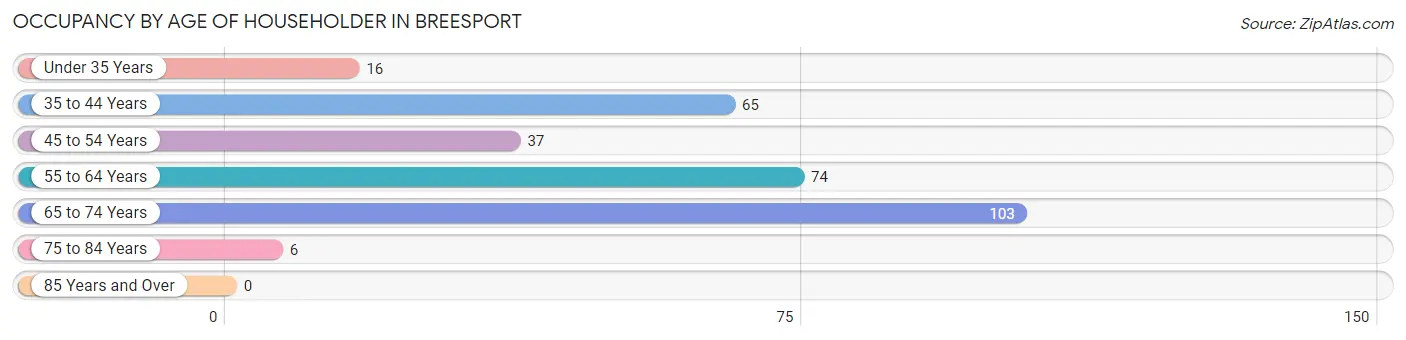
| Age Bracket | # Households | % Households |
| Under 35 Years | 16 | 5.3% |
| 35 to 44 Years | 65 | 21.6% |
| 45 to 54 Years | 37 | 12.3% |
| 55 to 64 Years | 74 | 24.6% |
| 65 to 74 Years | 103 | 34.2% |
| 75 to 84 Years | 6 | 2.0% |
| 85 Years and Over | 0 | 0.0% |
| Total | 301 | 100.0% |
Housing Finances in Breesport
Median Income by Occupancy in Breesport
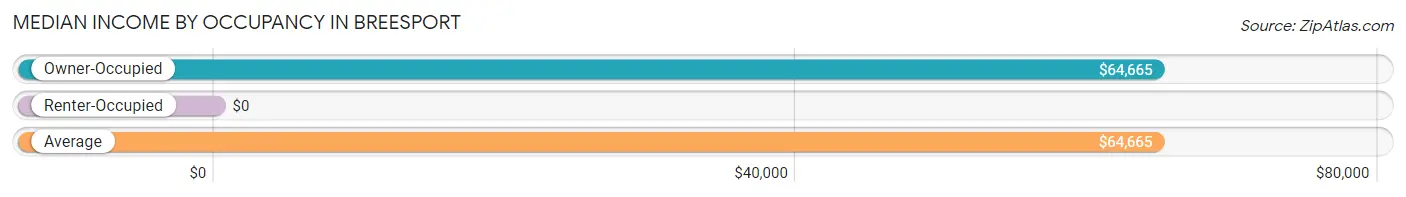
| Occupancy Type | # Households | Median Income |
| Owner-Occupied | 301 (100.0%) | $64,665 |
| Renter-Occupied | 0 (0.0%) | $0 |
| Average | 301 (100.0%) | $64,665 |
Occupancy by Householder Income Bracket in Breesport
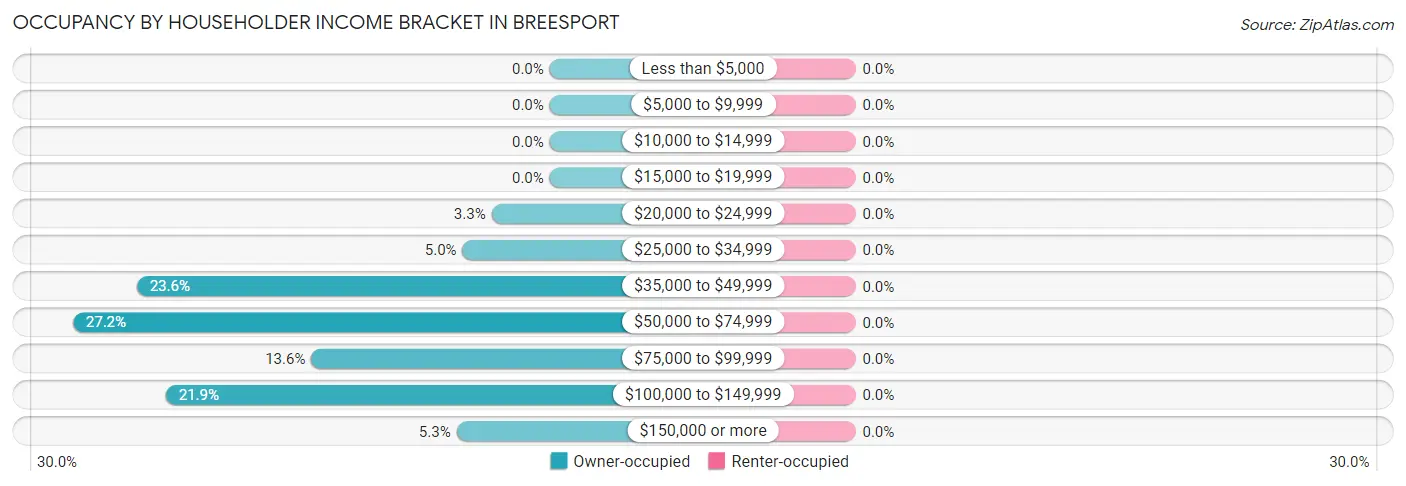
| Income Bracket | Owner-occupied | Renter-occupied |
| Less than $5,000 | 0 (0.0%) | 0 (0.0%) |
| $5,000 to $9,999 | 0 (0.0%) | 0 (0.0%) |
| $10,000 to $14,999 | 0 (0.0%) | 0 (0.0%) |
| $15,000 to $19,999 | 0 (0.0%) | 0 (0.0%) |
| $20,000 to $24,999 | 10 (3.3%) | 0 (0.0%) |
| $25,000 to $34,999 | 15 (5.0%) | 0 (0.0%) |
| $35,000 to $49,999 | 71 (23.6%) | 0 (0.0%) |
| $50,000 to $74,999 | 82 (27.2%) | 0 (0.0%) |
| $75,000 to $99,999 | 41 (13.6%) | 0 (0.0%) |
| $100,000 to $149,999 | 66 (21.9%) | 0 (0.0%) |
| $150,000 or more | 16 (5.3%) | 0 (0.0%) |
| Total | 301 (100.0%) | 0 (0.0%) |
Monthly Housing Cost Tiers in Breesport
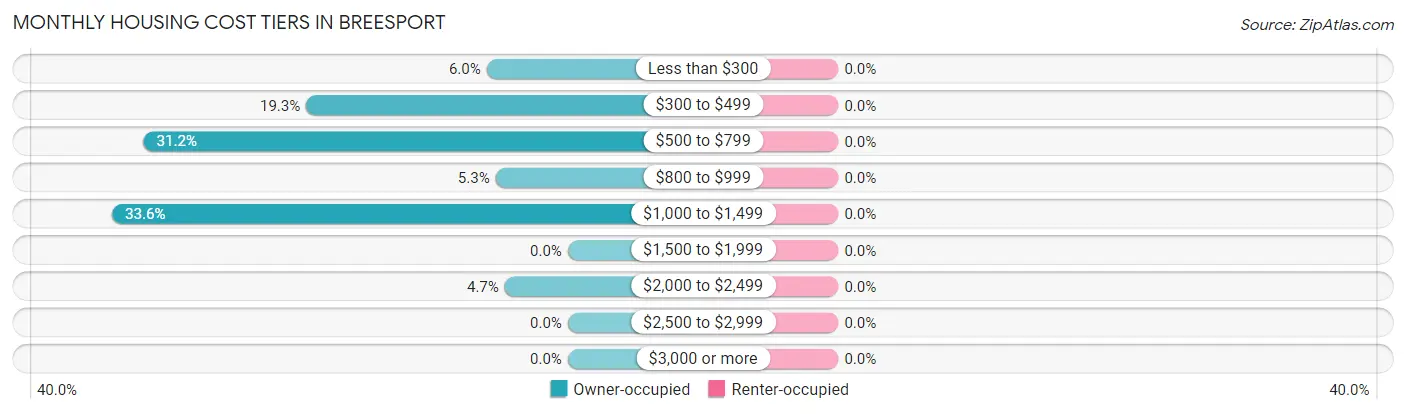
| Monthly Cost | Owner-occupied | Renter-occupied |
| Less than $300 | 18 (6.0%) | 0 (0.0%) |
| $300 to $499 | 58 (19.3%) | 0 (0.0%) |
| $500 to $799 | 94 (31.2%) | 0 (0.0%) |
| $800 to $999 | 16 (5.3%) | 0 (0.0%) |
| $1,000 to $1,499 | 101 (33.6%) | 0 (0.0%) |
| $1,500 to $1,999 | 0 (0.0%) | 0 (0.0%) |
| $2,000 to $2,499 | 14 (4.6%) | 0 (0.0%) |
| $2,500 to $2,999 | 0 (0.0%) | 0 (0.0%) |
| $3,000 or more | 0 (0.0%) | 0 (0.0%) |
| Total | 301 (100.0%) | 0 (0.0%) |
Physical Housing Characteristics in Breesport
Housing Structures in Breesport
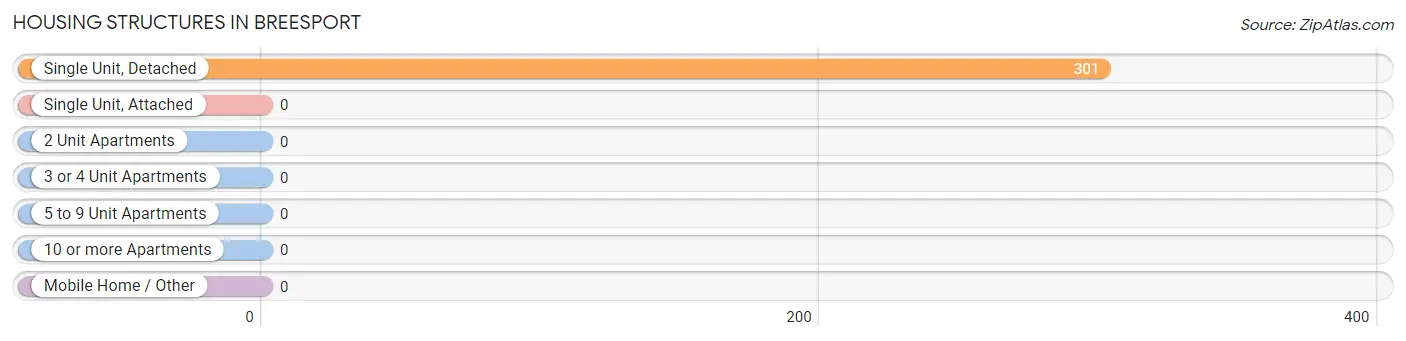
| Structure Type | # Housing Units | % Housing Units |
| Single Unit, Detached | 301 | 100.0% |
| Single Unit, Attached | 0 | 0.0% |
| 2 Unit Apartments | 0 | 0.0% |
| 3 or 4 Unit Apartments | 0 | 0.0% |
| 5 to 9 Unit Apartments | 0 | 0.0% |
| 10 or more Apartments | 0 | 0.0% |
| Mobile Home / Other | 0 | 0.0% |
| Total | 301 | 100.0% |
Housing Structures by Occupancy in Breesport
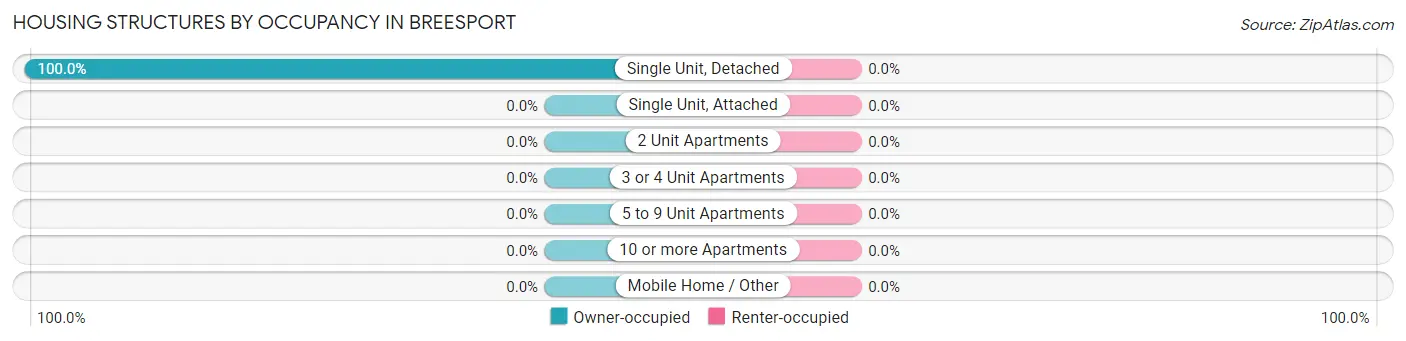
| Structure Type | Owner-occupied | Renter-occupied |
| Single Unit, Detached | 301 (100.0%) | 0 (0.0%) |
| Single Unit, Attached | 0 (0.0%) | 0 (0.0%) |
| 2 Unit Apartments | 0 (0.0%) | 0 (0.0%) |
| 3 or 4 Unit Apartments | 0 (0.0%) | 0 (0.0%) |
| 5 to 9 Unit Apartments | 0 (0.0%) | 0 (0.0%) |
| 10 or more Apartments | 0 (0.0%) | 0 (0.0%) |
| Mobile Home / Other | 0 (0.0%) | 0 (0.0%) |
| Total | 301 (100.0%) | 0 (0.0%) |
Housing Structures by Number of Rooms in Breesport
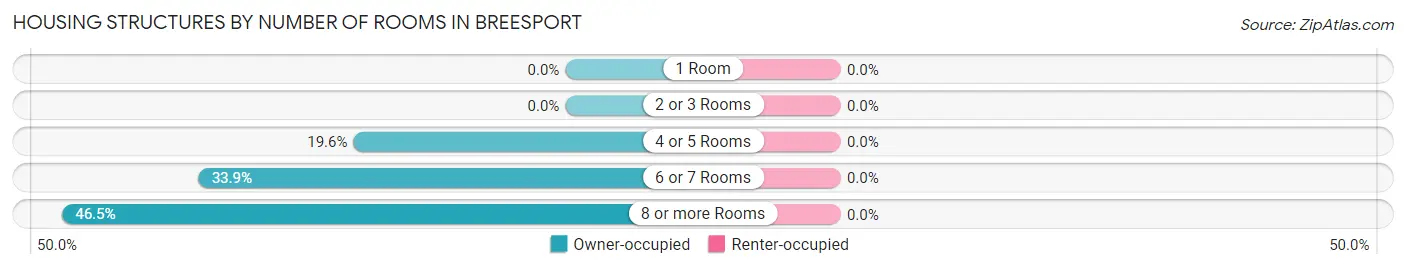
| Number of Rooms | Owner-occupied | Renter-occupied |
| 1 Room | 0 (0.0%) | 0 (0.0%) |
| 2 or 3 Rooms | 0 (0.0%) | 0 (0.0%) |
| 4 or 5 Rooms | 59 (19.6%) | 0 (0.0%) |
| 6 or 7 Rooms | 102 (33.9%) | 0 (0.0%) |
| 8 or more Rooms | 140 (46.5%) | 0 (0.0%) |
| Total | 301 (100.0%) | 0 (0.0%) |
Housing Structure by Heating Type in Breesport
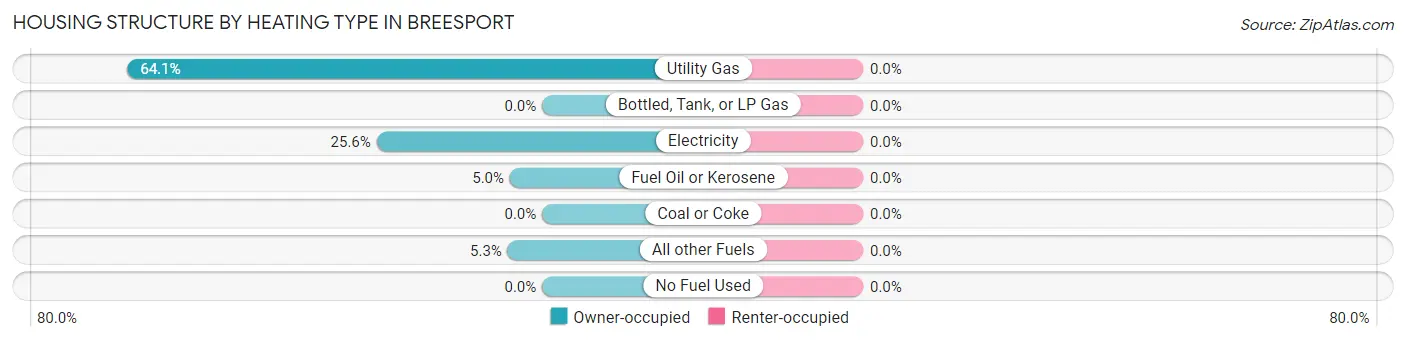
| Heating Type | Owner-occupied | Renter-occupied |
| Utility Gas | 193 (64.1%) | 0 (0.0%) |
| Bottled, Tank, or LP Gas | 0 (0.0%) | 0 (0.0%) |
| Electricity | 77 (25.6%) | 0 (0.0%) |
| Fuel Oil or Kerosene | 15 (5.0%) | 0 (0.0%) |
| Coal or Coke | 0 (0.0%) | 0 (0.0%) |
| All other Fuels | 16 (5.3%) | 0 (0.0%) |
| No Fuel Used | 0 (0.0%) | 0 (0.0%) |
| Total | 301 (100.0%) | 0 (0.0%) |
Household Vehicle Usage in Breesport
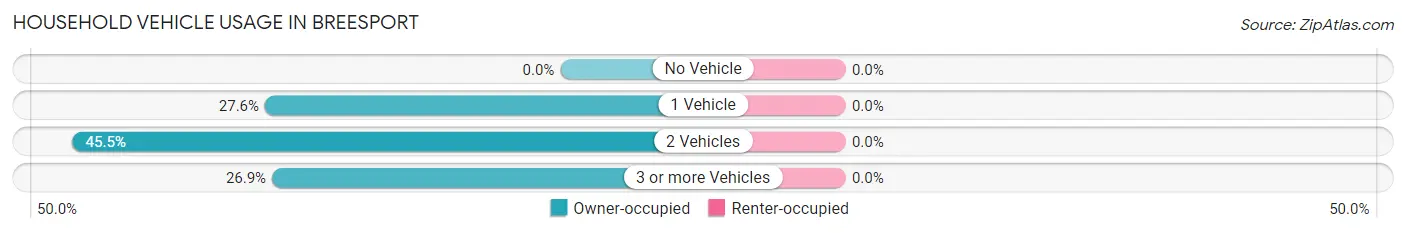
| Vehicles per Household | Owner-occupied | Renter-occupied |
| No Vehicle | 0 (0.0%) | 0 (0.0%) |
| 1 Vehicle | 83 (27.6%) | 0 (0.0%) |
| 2 Vehicles | 137 (45.5%) | 0 (0.0%) |
| 3 or more Vehicles | 81 (26.9%) | 0 (0.0%) |
| Total | 301 (100.0%) | 0 (0.0%) |
Real Estate & Mortgages in Breesport
Real Estate and Mortgage Overview in Breesport
| Characteristic | Without Mortgage | With Mortgage |
| Housing Units | 171 | 130 |
| Median Property Value | $103,900 | $124,000 |
| Median Household Income | $63,872 | $16 |
| Monthly Housing Costs | $518 | $0 |
| Real Estate Taxes | $2,698 | $0 |
Property Value by Mortgage Status in Breesport
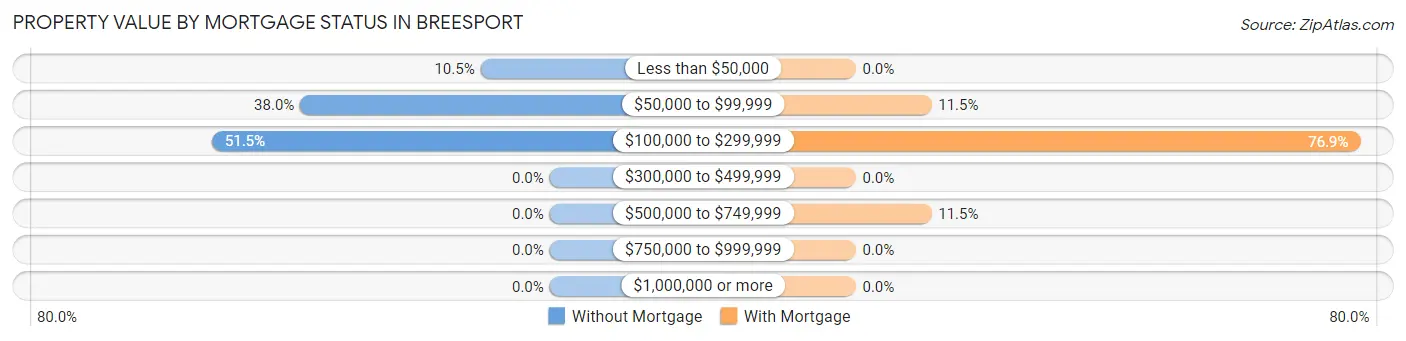
| Property Value | Without Mortgage | With Mortgage |
| Less than $50,000 | 18 (10.5%) | 0 (0.0%) |
| $50,000 to $99,999 | 65 (38.0%) | 15 (11.5%) |
| $100,000 to $299,999 | 88 (51.5%) | 100 (76.9%) |
| $300,000 to $499,999 | 0 (0.0%) | 0 (0.0%) |
| $500,000 to $749,999 | 0 (0.0%) | 15 (11.5%) |
| $750,000 to $999,999 | 0 (0.0%) | 0 (0.0%) |
| $1,000,000 or more | 0 (0.0%) | 0 (0.0%) |
| Total | 171 (100.0%) | 130 (100.0%) |
Household Income by Mortgage Status in Breesport
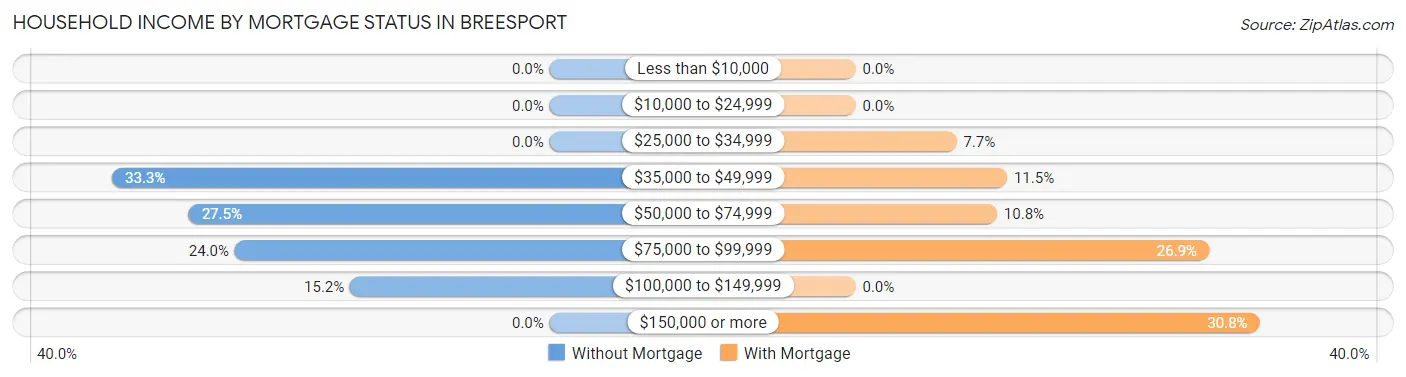
| Household Income | Without Mortgage | With Mortgage |
| Less than $10,000 | 0 (0.0%) | 0 (0.0%) |
| $10,000 to $24,999 | 0 (0.0%) | 0 (0.0%) |
| $25,000 to $34,999 | 0 (0.0%) | 10 (7.7%) |
| $35,000 to $49,999 | 57 (33.3%) | 15 (11.5%) |
| $50,000 to $74,999 | 47 (27.5%) | 14 (10.8%) |
| $75,000 to $99,999 | 41 (24.0%) | 35 (26.9%) |
| $100,000 to $149,999 | 26 (15.2%) | 0 (0.0%) |
| $150,000 or more | 0 (0.0%) | 40 (30.8%) |
| Total | 171 (100.0%) | 130 (100.0%) |
Property Value to Household Income Ratio in Breesport
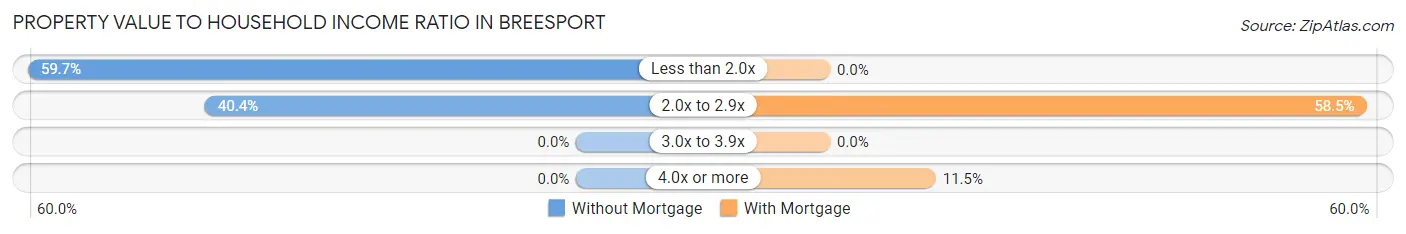
| Value-to-Income Ratio | Without Mortgage | With Mortgage |
| Less than 2.0x | 102 (59.7%) | 0 (0.0%) |
| 2.0x to 2.9x | 69 (40.4%) | 76 (58.5%) |
| 3.0x to 3.9x | 0 (0.0%) | 0 (0.0%) |
| 4.0x or more | 0 (0.0%) | 15 (11.5%) |
| Total | 171 (100.0%) | 130 (100.0%) |
Real Estate Taxes by Mortgage Status in Breesport
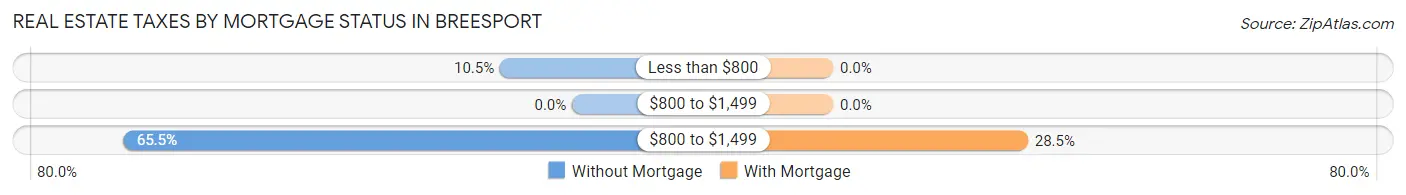
| Property Taxes | Without Mortgage | With Mortgage |
| Less than $800 | 18 (10.5%) | 0 (0.0%) |
| $800 to $1,499 | 0 (0.0%) | 0 (0.0%) |
| $800 to $1,499 | 112 (65.5%) | 37 (28.5%) |
| Total | 171 (100.0%) | 130 (100.0%) |
Health & Disability in Breesport
Health Insurance Coverage by Age in Breesport
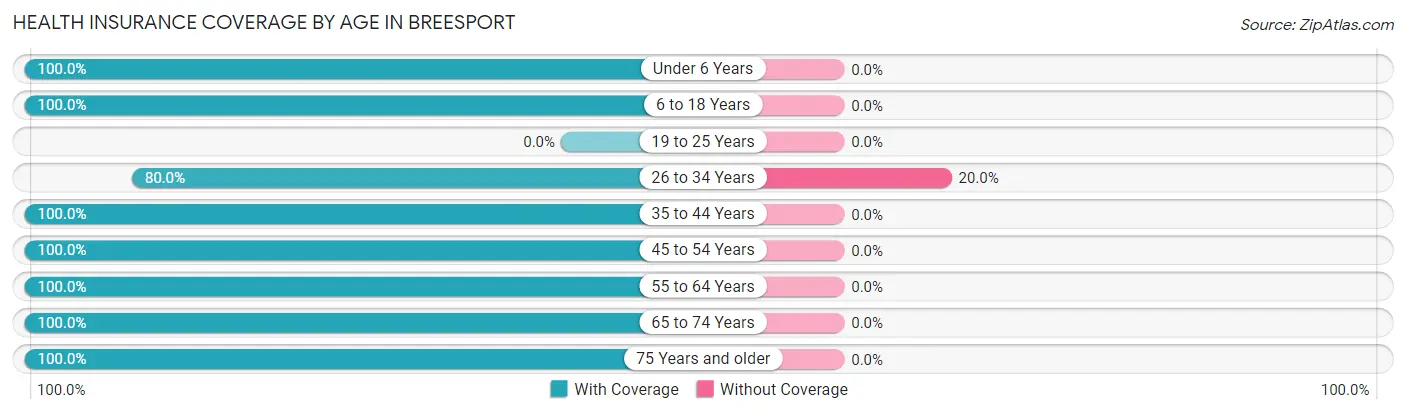
| Age Bracket | With Coverage | Without Coverage |
| Under 6 Years | 63 (100.0%) | 0 (0.0%) |
| 6 to 18 Years | 84 (100.0%) | 0 (0.0%) |
| 19 to 25 Years | 0 (0.0%) | 0 (0.0%) |
| 26 to 34 Years | 28 (80.0%) | 7 (20.0%) |
| 35 to 44 Years | 124 (100.0%) | 0 (0.0%) |
| 45 to 54 Years | 87 (100.0%) | 0 (0.0%) |
| 55 to 64 Years | 178 (100.0%) | 0 (0.0%) |
| 65 to 74 Years | 212 (100.0%) | 0 (0.0%) |
| 75 Years and older | 81 (100.0%) | 0 (0.0%) |
| Total | 857 (99.2%) | 7 (0.8%) |
Health Insurance Coverage by Citizenship Status in Breesport
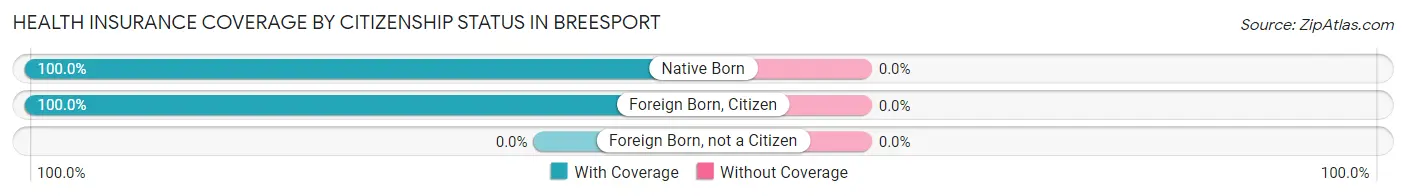
| Citizenship Status | With Coverage | Without Coverage |
| Native Born | 63 (100.0%) | 0 (0.0%) |
| Foreign Born, Citizen | 84 (100.0%) | 0 (0.0%) |
| Foreign Born, not a Citizen | 0 (0.0%) | 0 (0.0%) |
Health Insurance Coverage by Household Income in Breesport
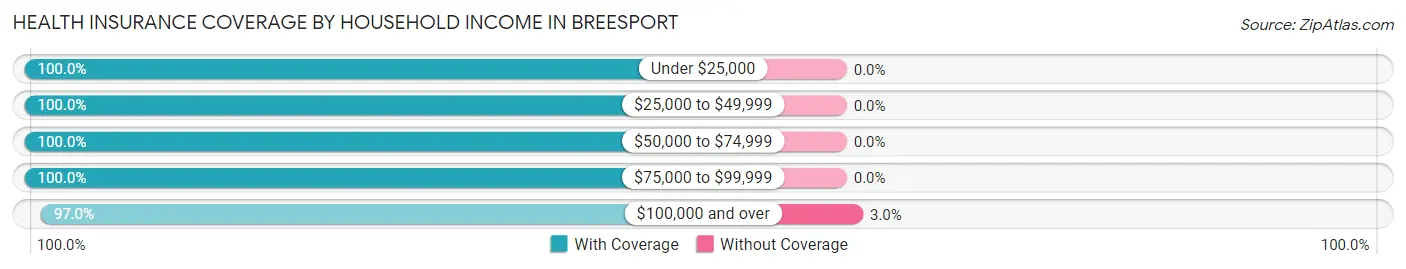
| Household Income | With Coverage | Without Coverage |
| Under $25,000 | 28 (100.0%) | 0 (0.0%) |
| $25,000 to $49,999 | 172 (100.0%) | 0 (0.0%) |
| $50,000 to $74,999 | 246 (100.0%) | 0 (0.0%) |
| $75,000 to $99,999 | 188 (100.0%) | 0 (0.0%) |
| $100,000 and over | 223 (97.0%) | 7 (3.0%) |
Public vs Private Health Insurance Coverage by Age in Breesport
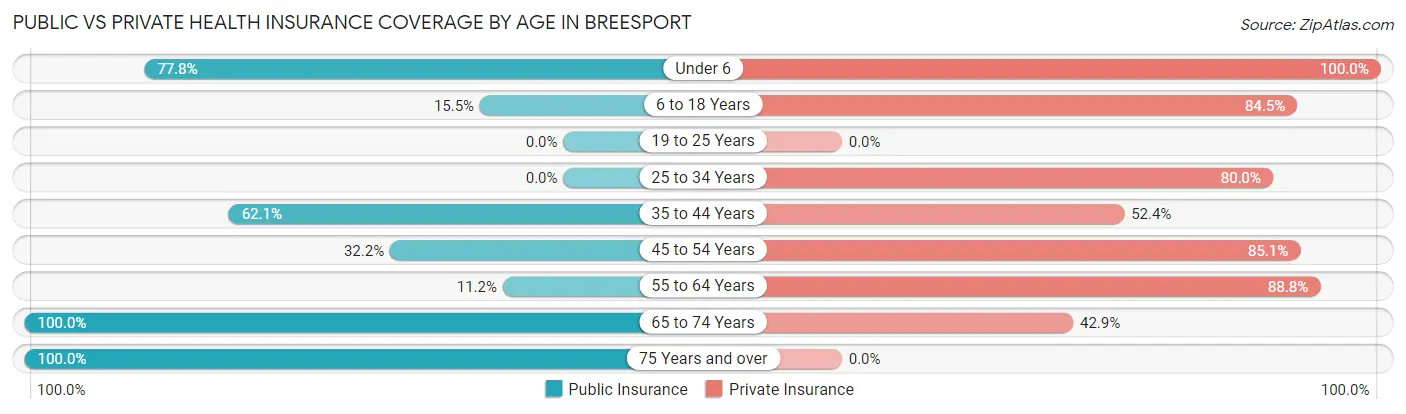
| Age Bracket | Public Insurance | Private Insurance |
| Under 6 | 49 (77.8%) | 63 (100.0%) |
| 6 to 18 Years | 13 (15.5%) | 71 (84.5%) |
| 19 to 25 Years | 0 (0.0%) | 0 (0.0%) |
| 25 to 34 Years | 0 (0.0%) | 28 (80.0%) |
| 35 to 44 Years | 77 (62.1%) | 65 (52.4%) |
| 45 to 54 Years | 28 (32.2%) | 74 (85.1%) |
| 55 to 64 Years | 20 (11.2%) | 158 (88.8%) |
| 65 to 74 Years | 212 (100.0%) | 91 (42.9%) |
| 75 Years and over | 81 (100.0%) | 0 (0.0%) |
| Total | 480 (55.6%) | 550 (63.7%) |
Disability Status by Sex by Age in Breesport
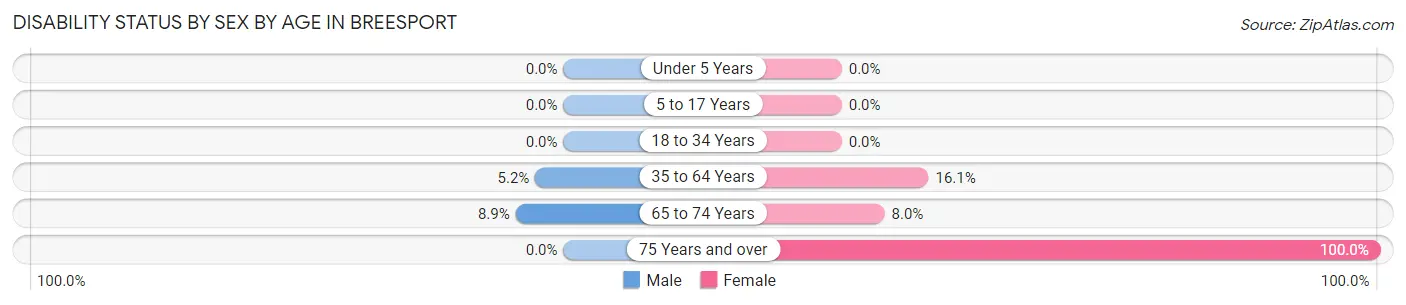
| Age Bracket | Male | Female |
| Under 5 Years | 0 (0.0%) | 0 (0.0%) |
| 5 to 17 Years | 0 (0.0%) | 0 (0.0%) |
| 18 to 34 Years | 0 (0.0%) | 0 (0.0%) |
| 35 to 64 Years | 8 (5.2%) | 38 (16.1%) |
| 65 to 74 Years | 11 (8.9%) | 7 (8.0%) |
| 75 Years and over | 0 (0.0%) | 40 (100.0%) |
Disability Class by Sex by Age in Breesport
Disability Class: Hearing Difficulty
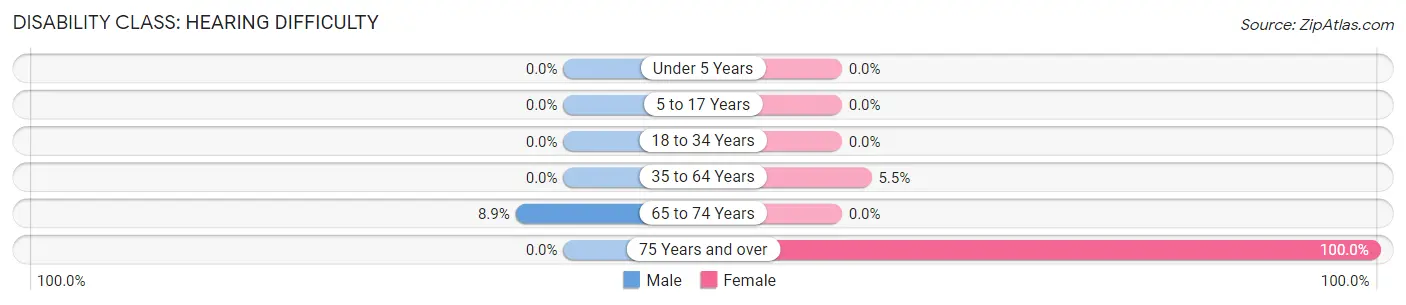
| Age Bracket | Male | Female |
| Under 5 Years | 0 (0.0%) | 0 (0.0%) |
| 5 to 17 Years | 0 (0.0%) | 0 (0.0%) |
| 18 to 34 Years | 0 (0.0%) | 0 (0.0%) |
| 35 to 64 Years | 0 (0.0%) | 13 (5.5%) |
| 65 to 74 Years | 11 (8.9%) | 0 (0.0%) |
| 75 Years and over | 0 (0.0%) | 40 (100.0%) |
Disability Class: Vision Difficulty
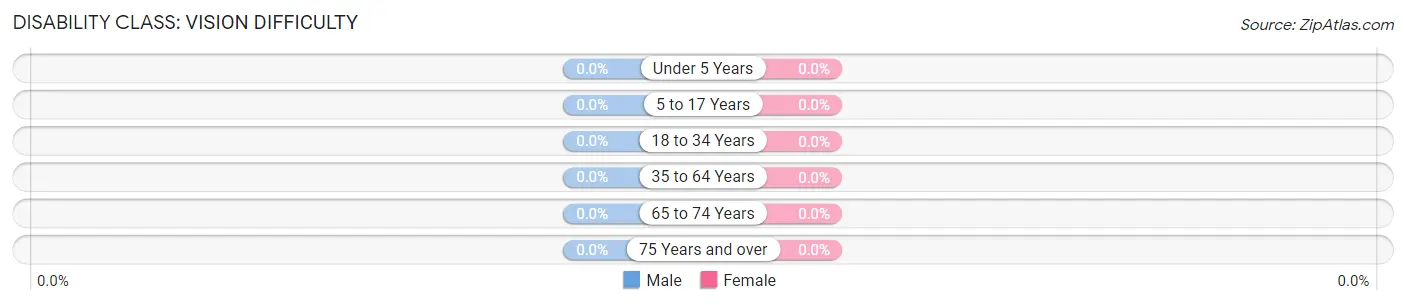
| Age Bracket | Male | Female |
| Under 5 Years | 0 (0.0%) | 0 (0.0%) |
| 5 to 17 Years | 0 (0.0%) | 0 (0.0%) |
| 18 to 34 Years | 0 (0.0%) | 0 (0.0%) |
| 35 to 64 Years | 0 (0.0%) | 0 (0.0%) |
| 65 to 74 Years | 0 (0.0%) | 0 (0.0%) |
| 75 Years and over | 0 (0.0%) | 0 (0.0%) |
Disability Class: Cognitive Difficulty
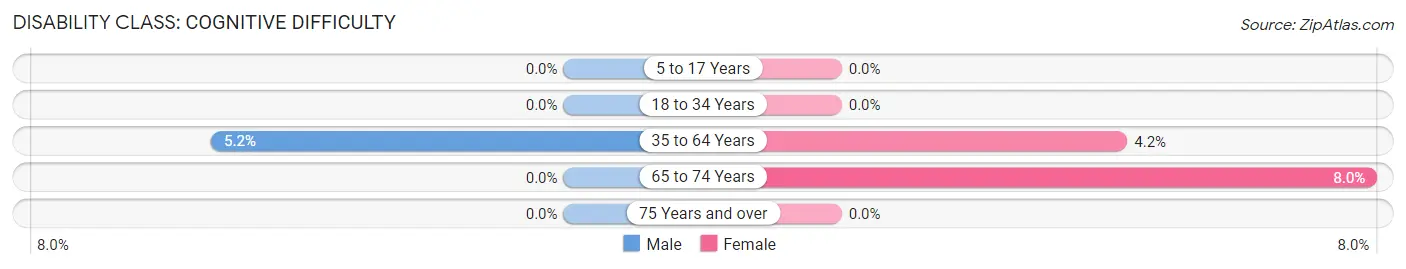
| Age Bracket | Male | Female |
| 5 to 17 Years | 0 (0.0%) | 0 (0.0%) |
| 18 to 34 Years | 0 (0.0%) | 0 (0.0%) |
| 35 to 64 Years | 8 (5.2%) | 10 (4.2%) |
| 65 to 74 Years | 0 (0.0%) | 7 (8.0%) |
| 75 Years and over | 0 (0.0%) | 0 (0.0%) |
Disability Class: Ambulatory Difficulty
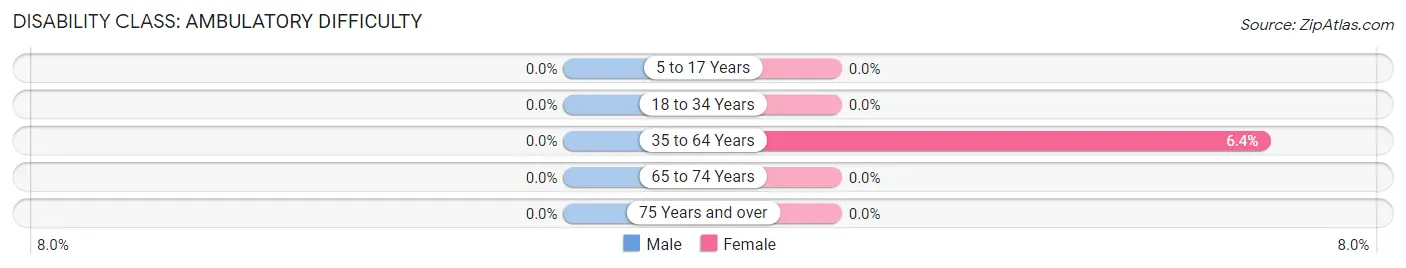
| Age Bracket | Male | Female |
| 5 to 17 Years | 0 (0.0%) | 0 (0.0%) |
| 18 to 34 Years | 0 (0.0%) | 0 (0.0%) |
| 35 to 64 Years | 0 (0.0%) | 15 (6.4%) |
| 65 to 74 Years | 0 (0.0%) | 0 (0.0%) |
| 75 Years and over | 0 (0.0%) | 0 (0.0%) |
Disability Class: Self-Care Difficulty
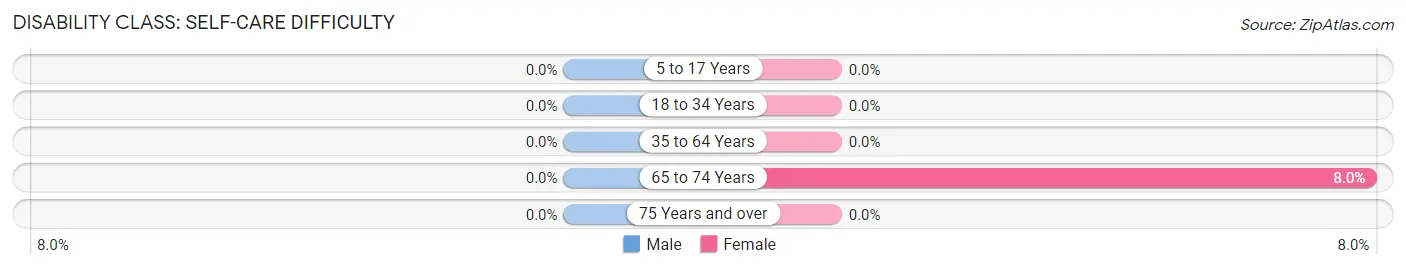
| Age Bracket | Male | Female |
| 5 to 17 Years | 0 (0.0%) | 0 (0.0%) |
| 18 to 34 Years | 0 (0.0%) | 0 (0.0%) |
| 35 to 64 Years | 0 (0.0%) | 0 (0.0%) |
| 65 to 74 Years | 0 (0.0%) | 7 (8.0%) |
| 75 Years and over | 0 (0.0%) | 0 (0.0%) |
Technology Access in Breesport
Computing Device Access in Breesport
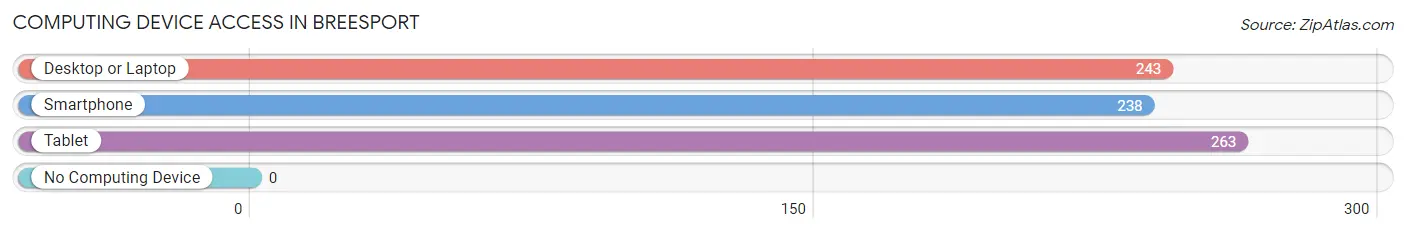
| Device Type | # Households | % Households |
| Desktop or Laptop | 243 | 80.7% |
| Smartphone | 238 | 79.1% |
| Tablet | 263 | 87.4% |
| No Computing Device | 0 | 0.0% |
| Total | 301 | 100.0% |
Internet Access in Breesport
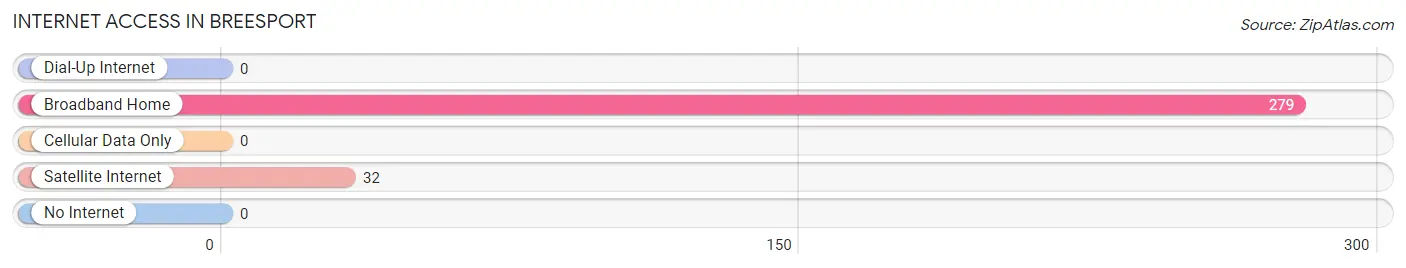
| Internet Type | # Households | % Households |
| Dial-Up Internet | 0 | 0.0% |
| Broadband Home | 279 | 92.7% |
| Cellular Data Only | 0 | 0.0% |
| Satellite Internet | 32 | 10.6% |
| No Internet | 0 | 0.0% |
| Total | 301 | 100.0% |
Breesport Summary
Breesport is a small hamlet located in the Town of Chemung in Chemung County, New York. It is situated on the banks of the Chemung River, approximately five miles south of the City of Elmira. The hamlet is home to a population of approximately 1,000 people and is a popular destination for outdoor recreation, including fishing, boating, and camping.
History
The area that is now known as Breesport was first settled in the late 1700s by a group of German immigrants. The hamlet was originally known as “Breesport” after the family of John Brees, who was one of the first settlers in the area. The hamlet was officially incorporated in 1845 and has remained a small, rural community ever since.
Geography
Breesport is located in the Town of Chemung in Chemung County, New York. It is situated on the banks of the Chemung River, approximately five miles south of the City of Elmira. The hamlet is surrounded by rolling hills and farmland, and is home to a variety of wildlife, including deer, foxes, and wild turkeys. The area is also known for its abundance of natural springs, which provide a source of fresh water for the hamlet.
Economy
Breesport is a small, rural community with a limited economy. The hamlet is home to a few small businesses, including a general store, a gas station, and a few restaurants. The hamlet is also home to a number of farms, which provide employment for many of the residents. The hamlet is also a popular destination for outdoor recreation, and many visitors come to the area to enjoy fishing, boating, and camping.
Demographics
As of the 2010 census, the population of Breesport was 1,000 people. The racial makeup of the hamlet was 97.2% White, 0.7% African American, 0.3% Native American, 0.3% Asian, and 1.5% from other races. The median household income was $37,500, and the median age was 43 years. The majority of the population (90%) was born in the United States, and the majority of the population (90%) spoke English as their primary language.
Conclusion
Breesport is a small hamlet located in the Town of Chemung in Chemung County, New York. It is situated on the banks of the Chemung River, approximately five miles south of the City of Elmira. The hamlet is home to a population of approximately 1,000 people and is a popular destination for outdoor recreation, including fishing, boating, and camping. The hamlet is home to a few small businesses, and many of the residents are employed in the local farming industry. The hamlet is also a popular destination for outdoor recreation, and many visitors come to the area to enjoy fishing, boating, and camping. The population of Breesport is predominantly White, with a median household income of $37,500 and a median age of 43 years.
Common Questions
What is Per Capita Income in Breesport?
Per Capita income in Breesport is $28,142.
What is the Median Family Income in Breesport?
Median Family Income in Breesport is $65,398.
What is the Median Household income in Breesport?
Median Household Income in Breesport is $64,665.
What is Income or Wage Gap in Breesport?
Income or Wage Gap in Breesport is 60.1%.
Women in Breesport earn 39.9 cents for every dollar earned by a man.
What is Inequality or Gini Index in Breesport?
Inequality or Gini Index in Breesport is 0.29.
What is the Total Population of Breesport?
Total Population of Breesport is 864.
What is the Total Male Population of Breesport?
Total Male Population of Breesport is 455.
What is the Total Female Population of Breesport?
Total Female Population of Breesport is 409.
What is the Ratio of Males per 100 Females in Breesport?
There are 111.25 Males per 100 Females in Breesport.
What is the Ratio of Females per 100 Males in Breesport?
There are 89.89 Females per 100 Males in Breesport.
What is the Median Population Age in Breesport?
Median Population Age in Breesport is 57.1 Years.
What is the Average Family Size in Breesport
Average Family Size in Breesport is 3.0 People.
What is the Average Household Size in Breesport
Average Household Size in Breesport is 2.9 People.
How Large is the Labor Force in Breesport?
There are 292 People in the Labor Forcein in Breesport.
What is the Percentage of People in the Labor Force in Breesport?
40.0% of People are in the Labor Force in Breesport.