Bedford Hills, NY Map & Demographics
Bedford Hills Map
Bedford Hills Overview
$46,040
PER CAPITA INCOME
$101,350
AVG FAMILY INCOME
$84,555
AVG HOUSEHOLD INCOME
0.49
INEQUALITY / GINI INDEX
2,304
TOTAL POPULATION
1,058
MALE POPULATION
1,246
FEMALE POPULATION
84.91
MALES / 100 FEMALES
117.77
FEMALES / 100 MALES
51.2
MEDIAN AGE
3.0
AVG FAMILY SIZE
2.4
AVG HOUSEHOLD SIZE
1,217
LABOR FORCE [ PEOPLE ]
61.3%
PERCENT IN LABOR FORCE
6.7%
UNEMPLOYMENT RATE
Bedford Hills Zip Codes
Bedford Hills Area Codes
Income in Bedford Hills
Income Overview in Bedford Hills
Per Capita Income in Bedford Hills is $46,040, while median incomes of families and households are $101,350 and $84,555 respectively.
| Characteristic | Number | Measure |
| Per Capita Income | 2,304 | $46,040 |
| Median Family Income | 595 | $101,350 |
| Mean Family Income | 595 | $139,939 |
| Median Household Income | 962 | $84,555 |
| Mean Household Income | 962 | $113,319 |
| Income Deficit | 595 | $0 |
| Wage / Income Gap (%) | 2,304 | 0.00% |
| Wage / Income Gap ($) | 2,304 | 100.00¢ per $1 |
| Gini / Inequality Index | 2,304 | 0.49 |
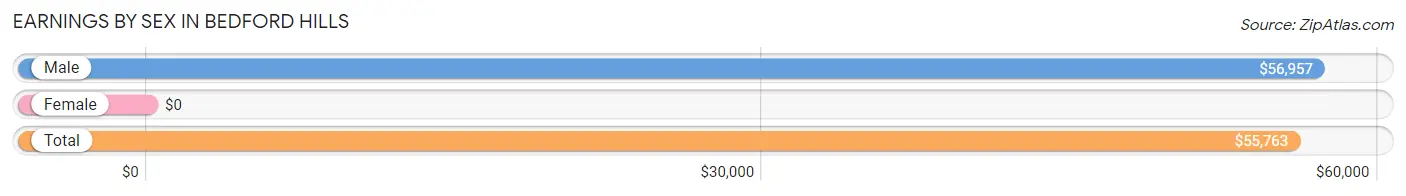
Earnings by Sex in Bedford Hills
| Sex | Number | Average Earnings |
| Male | 516 (42.0%) | $56,957 |
| Female | 712 (58.0%) | $0 |
| Total | 1,228 (100.0%) | $55,763 |
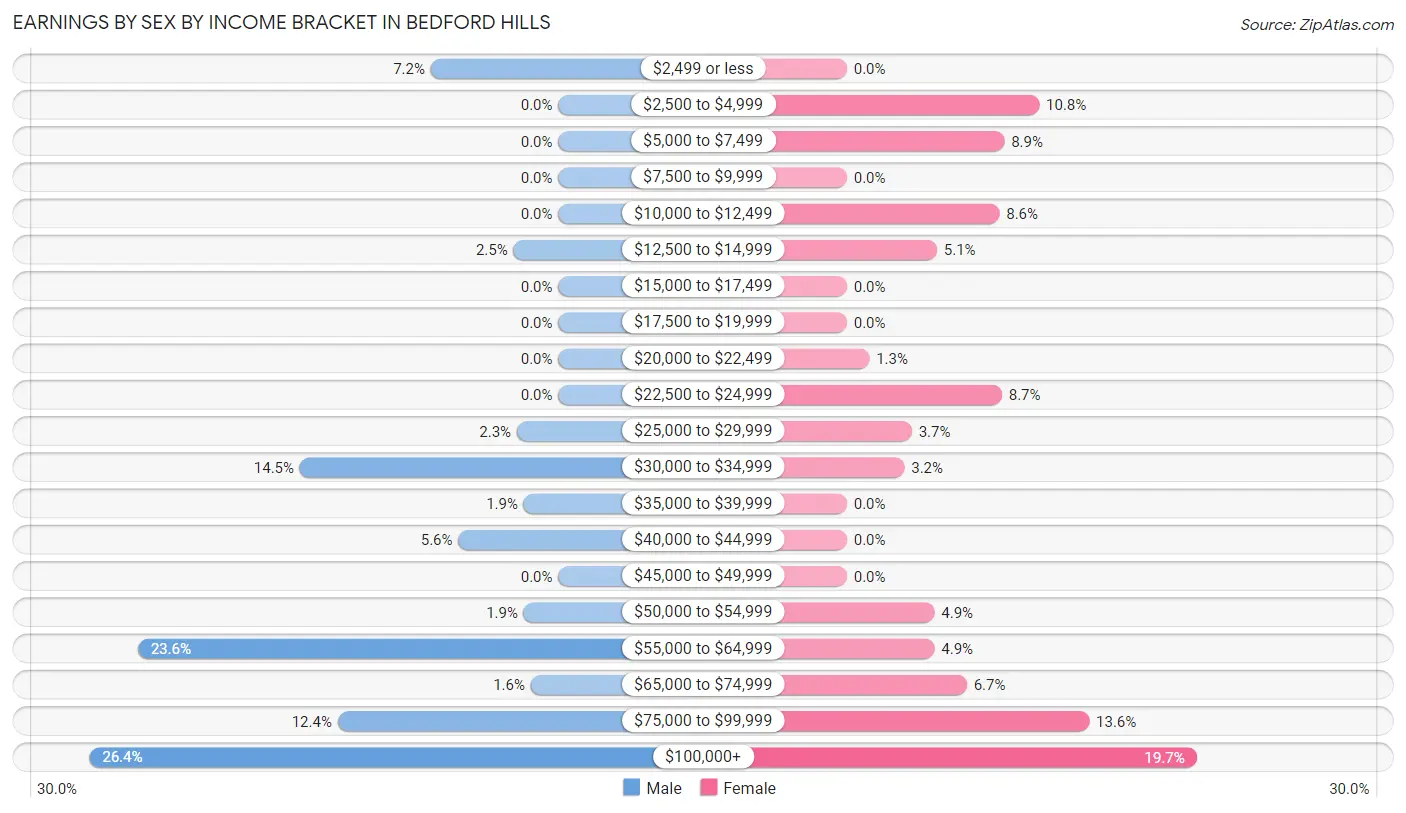
Earnings by Sex by Income Bracket in Bedford Hills
The most common earnings brackets in Bedford Hills are $100,000+ for men (136 | 26.4%) and $100,000+ for women (140 | 19.7%).
| Income | Male | Female |
| $2,499 or less | 37 (7.2%) | 0 (0.0%) |
| $2,500 to $4,999 | 0 (0.0%) | 77 (10.8%) |
| $5,000 to $7,499 | 0 (0.0%) | 63 (8.8%) |
| $7,500 to $9,999 | 0 (0.0%) | 0 (0.0%) |
| $10,000 to $12,499 | 0 (0.0%) | 61 (8.6%) |
| $12,500 to $14,999 | 13 (2.5%) | 36 (5.1%) |
| $15,000 to $17,499 | 0 (0.0%) | 0 (0.0%) |
| $17,500 to $19,999 | 0 (0.0%) | 0 (0.0%) |
| $20,000 to $22,499 | 0 (0.0%) | 9 (1.3%) |
| $22,500 to $24,999 | 0 (0.0%) | 62 (8.7%) |
| $25,000 to $29,999 | 12 (2.3%) | 26 (3.6%) |
| $30,000 to $34,999 | 75 (14.5%) | 23 (3.2%) |
| $35,000 to $39,999 | 10 (1.9%) | 0 (0.0%) |
| $40,000 to $44,999 | 29 (5.6%) | 0 (0.0%) |
| $45,000 to $49,999 | 0 (0.0%) | 0 (0.0%) |
| $50,000 to $54,999 | 10 (1.9%) | 35 (4.9%) |
| $55,000 to $64,999 | 122 (23.6%) | 35 (4.9%) |
| $65,000 to $74,999 | 8 (1.5%) | 48 (6.7%) |
| $75,000 to $99,999 | 64 (12.4%) | 97 (13.6%) |
| $100,000+ | 136 (26.4%) | 140 (19.7%) |
| Total | 516 (100.0%) | 712 (100.0%) |
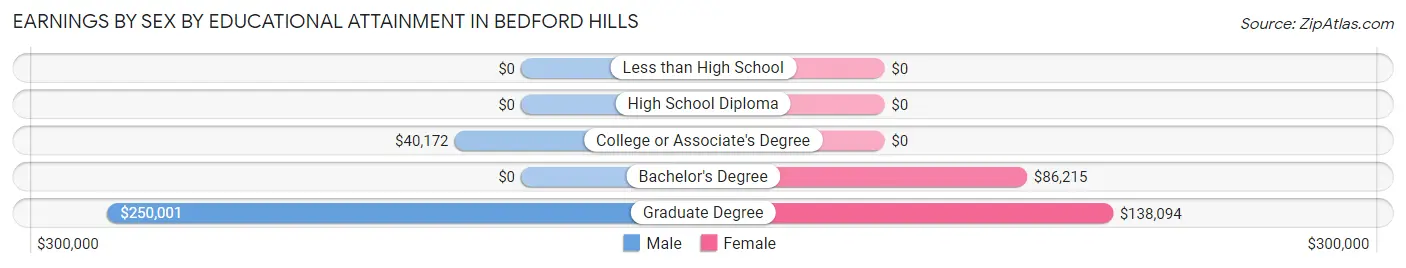
Earnings by Sex by Educational Attainment in Bedford Hills
| Educational Attainment | Male Income | Female Income |
| Less than High School | - | - |
| High School Diploma | - | - |
| College or Associate's Degree | $40,172 | $0 |
| Bachelor's Degree | - | - |
| Graduate Degree | $250,001 | $138,094 |
| Total | $57,120 | $0 |
Family Income in Bedford Hills
Family Income Brackets in Bedford Hills
According to the Bedford Hills family income data, there are 159 families falling into the $75,000 to $99,999 income range, which is the most common income bracket and makes up 26.7% of all families.
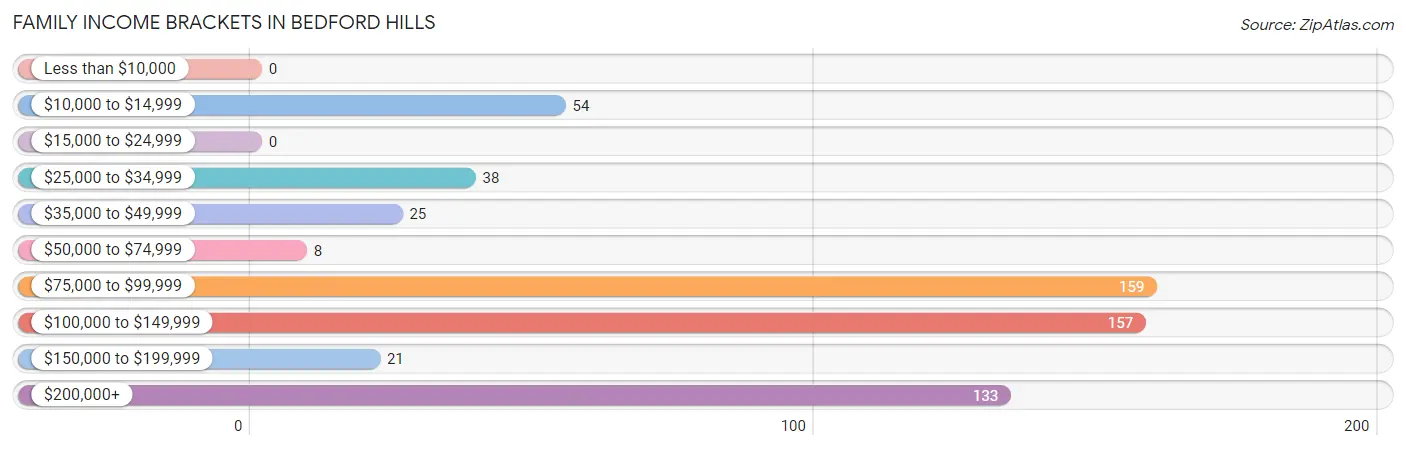
| Income Bracket | # Families | % Families |
| Less than $10,000 | 0 | 0.0% |
| $10,000 to $14,999 | 54 | 9.1% |
| $15,000 to $24,999 | 0 | 0.0% |
| $25,000 to $34,999 | 38 | 6.4% |
| $35,000 to $49,999 | 25 | 4.2% |
| $50,000 to $74,999 | 8 | 1.3% |
| $75,000 to $99,999 | 159 | 26.7% |
| $100,000 to $149,999 | 157 | 26.4% |
| $150,000 to $199,999 | 21 | 3.5% |
| $200,000+ | 133 | 22.4% |
Family Income by Famaliy Size in Bedford Hills
3-person families (98 | 16.5%) account for the highest median family income in Bedford Hills with $186,250 per family, while 3-person families (98 | 16.5%) have the highest median income of $62,083 per family member.
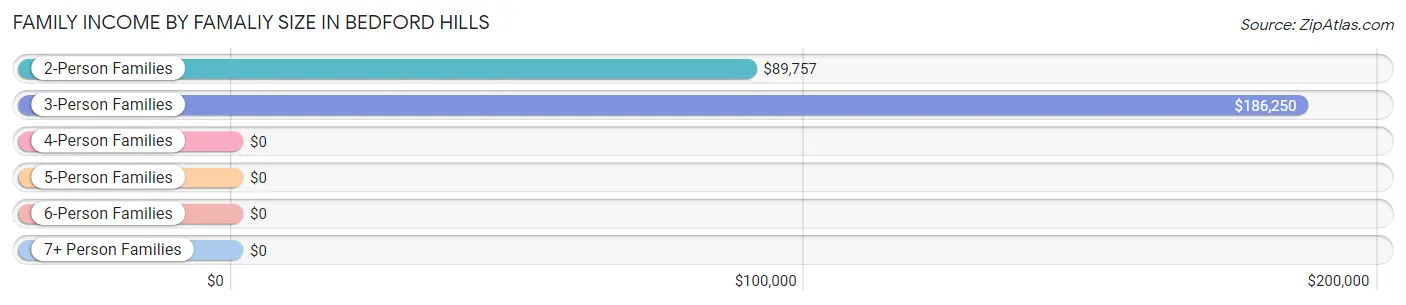
| Income Bracket | # Families | Median Income |
| 2-Person Families | 315 (52.9%) | $89,757 |
| 3-Person Families | 98 (16.5%) | $186,250 |
| 4-Person Families | 146 (24.5%) | $0 |
| 5-Person Families | 0 (0.0%) | $0 |
| 6-Person Families | 0 (0.0%) | $0 |
| 7+ Person Families | 36 (6.0%) | $0 |
| Total | 595 (100.0%) | $101,350 |
Family Income by Number of Earners in Bedford Hills
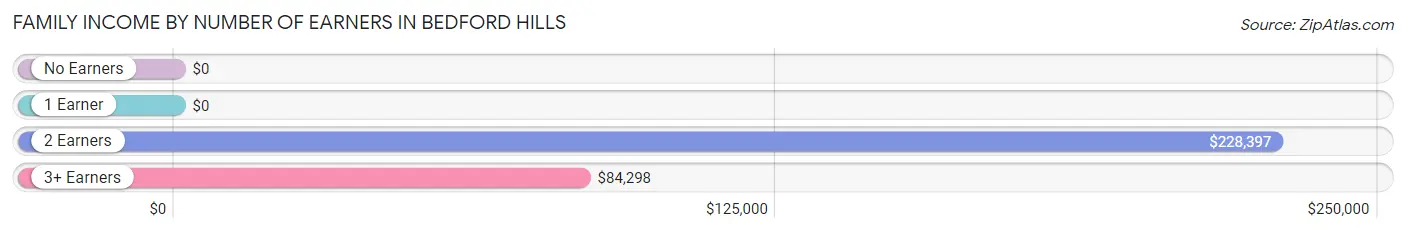
| Number of Earners | # Families | Median Income |
| No Earners | 60 (10.1%) | $0 |
| 1 Earner | 221 (37.1%) | $0 |
| 2 Earners | 209 (35.1%) | $228,397 |
| 3+ Earners | 105 (17.6%) | $84,298 |
| Total | 595 (100.0%) | $101,350 |
Household Income in Bedford Hills
Household Income Brackets in Bedford Hills
With 202 households falling in the category, the $100,000 to $149,999 income range is the most frequent in Bedford Hills, accounting for 21.0% of all households. In contrast, only 17 households (1.8%) fall into the $15,000 to $24,999 income bracket, making it the least populous group.
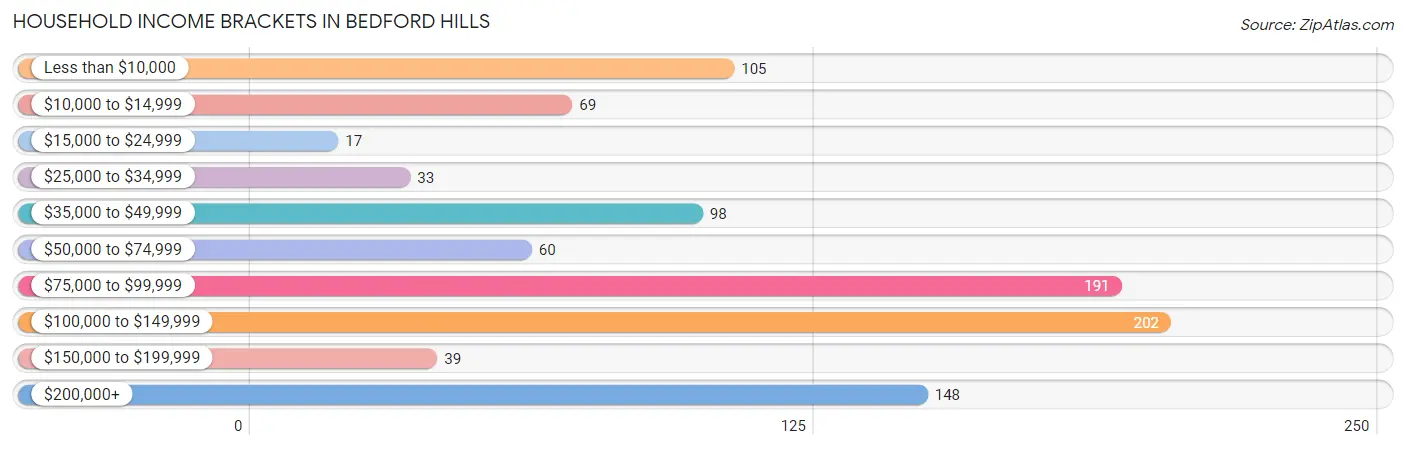
| Income Bracket | # Households | % Households |
| Less than $10,000 | 105 | 10.9% |
| $10,000 to $14,999 | 69 | 7.2% |
| $15,000 to $24,999 | 17 | 1.8% |
| $25,000 to $34,999 | 33 | 3.4% |
| $35,000 to $49,999 | 98 | 10.2% |
| $50,000 to $74,999 | 60 | 6.2% |
| $75,000 to $99,999 | 191 | 19.9% |
| $100,000 to $149,999 | 202 | 21.0% |
| $150,000 to $199,999 | 39 | 4.1% |
| $200,000+ | 148 | 15.4% |
Household Income by Householder Age in Bedford Hills
The median household income in Bedford Hills is $84,555, with the highest median household income of $128,929 found in the 25 to 44 years age bracket for the primary householder. A total of 222 households (23.1%) fall into this category. Meanwhile, the 15 to 24 years age bracket for the primary householder has the lowest median household income of $0, with 33 households (3.4%) in this group.
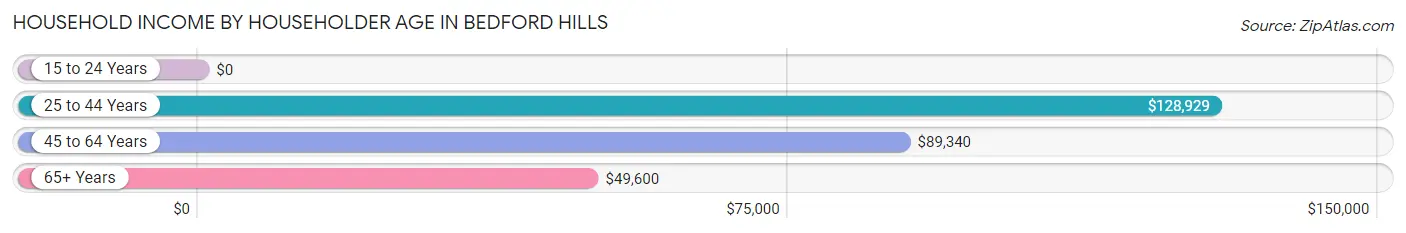
| Income Bracket | # Households | Median Income |
| 15 to 24 Years | 33 (3.4%) | $0 |
| 25 to 44 Years | 222 (23.1%) | $128,929 |
| 45 to 64 Years | 377 (39.2%) | $89,340 |
| 65+ Years | 330 (34.3%) | $49,600 |
| Total | 962 (100.0%) | $84,555 |
Poverty in Bedford Hills
Income Below Poverty by Sex and Age in Bedford Hills
With 6.6% poverty level for males and 18.4% for females among the residents of Bedford Hills, under 5 year old males and 25 to 34 year old females are the most vulnerable to poverty, with 57 males (54.8%) and 46 females (44.2%) in their respective age groups living below the poverty level.
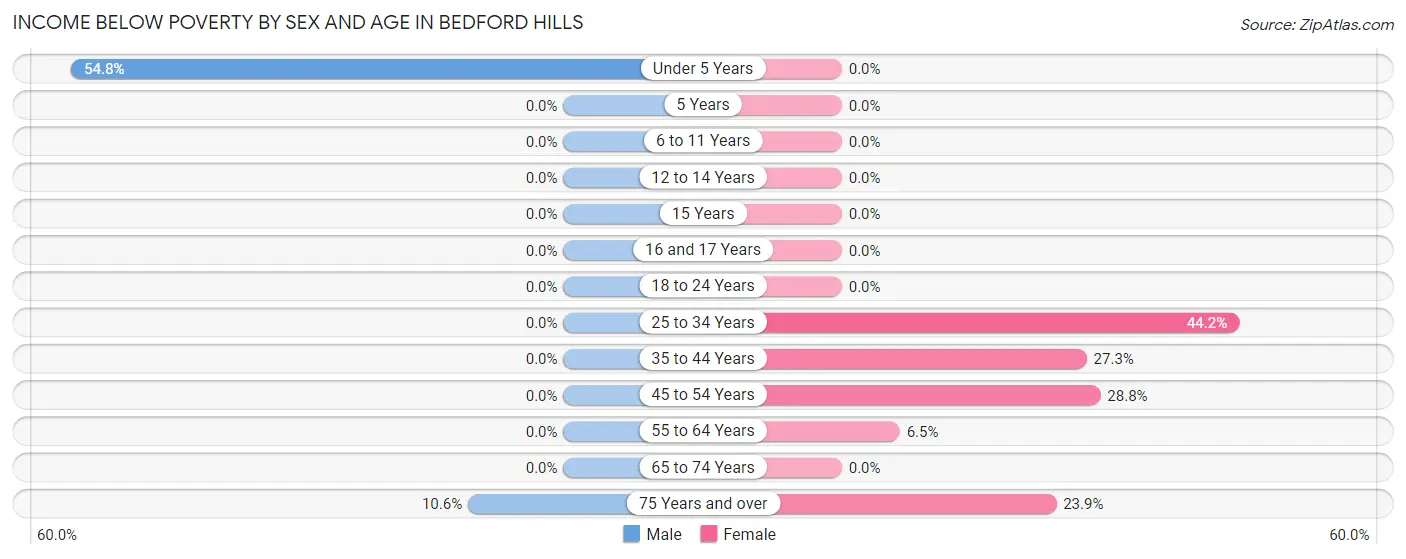
| Age Bracket | Male | Female |
| Under 5 Years | 57 (54.8%) | 0 (0.0%) |
| 5 Years | 0 (0.0%) | 0 (0.0%) |
| 6 to 11 Years | 0 (0.0%) | 0 (0.0%) |
| 12 to 14 Years | 0 (0.0%) | 0 (0.0%) |
| 15 Years | 0 (0.0%) | 0 (0.0%) |
| 16 and 17 Years | 0 (0.0%) | 0 (0.0%) |
| 18 to 24 Years | 0 (0.0%) | 0 (0.0%) |
| 25 to 34 Years | 0 (0.0%) | 46 (44.2%) |
| 35 to 44 Years | 0 (0.0%) | 39 (27.3%) |
| 45 to 54 Years | 0 (0.0%) | 72 (28.8%) |
| 55 to 64 Years | 0 (0.0%) | 8 (6.5%) |
| 65 to 74 Years | 0 (0.0%) | 0 (0.0%) |
| 75 Years and over | 12 (10.6%) | 64 (23.9%) |
| Total | 69 (6.6%) | 229 (18.4%) |
Income Above Poverty by Sex and Age in Bedford Hills
According to the poverty statistics in Bedford Hills, males aged 6 to 11 years and females aged 6 to 11 years are the age groups that are most secure financially, with 100.0% of males and 100.0% of females in these age groups living above the poverty line.
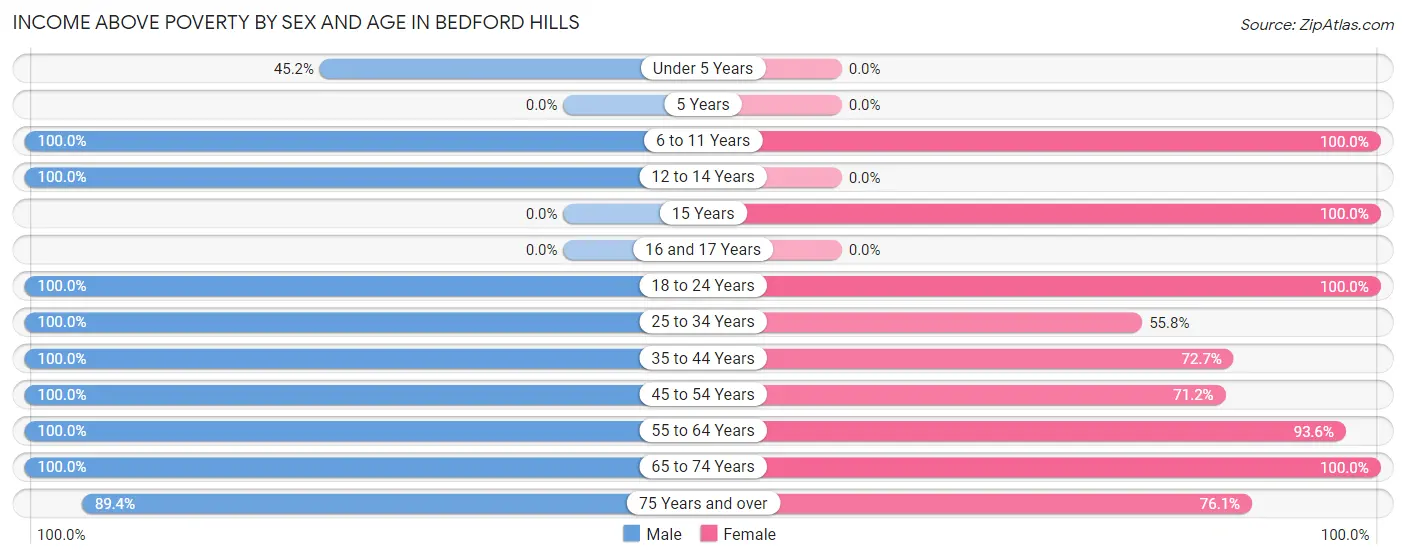
| Age Bracket | Male | Female |
| Under 5 Years | 47 (45.2%) | 0 (0.0%) |
| 5 Years | 0 (0.0%) | 0 (0.0%) |
| 6 to 11 Years | 99 (100.0%) | 63 (100.0%) |
| 12 to 14 Years | 24 (100.0%) | 0 (0.0%) |
| 15 Years | 0 (0.0%) | 28 (100.0%) |
| 16 and 17 Years | 0 (0.0%) | 0 (0.0%) |
| 18 to 24 Years | 90 (100.0%) | 129 (100.0%) |
| 25 to 34 Years | 112 (100.0%) | 58 (55.8%) |
| 35 to 44 Years | 121 (100.0%) | 104 (72.7%) |
| 45 to 54 Years | 111 (100.0%) | 178 (71.2%) |
| 55 to 64 Years | 106 (100.0%) | 116 (93.5%) |
| 65 to 74 Years | 168 (100.0%) | 137 (100.0%) |
| 75 Years and over | 101 (89.4%) | 204 (76.1%) |
| Total | 979 (93.4%) | 1,017 (81.6%) |
Income Below Poverty Among Married-Couple Families in Bedford Hills
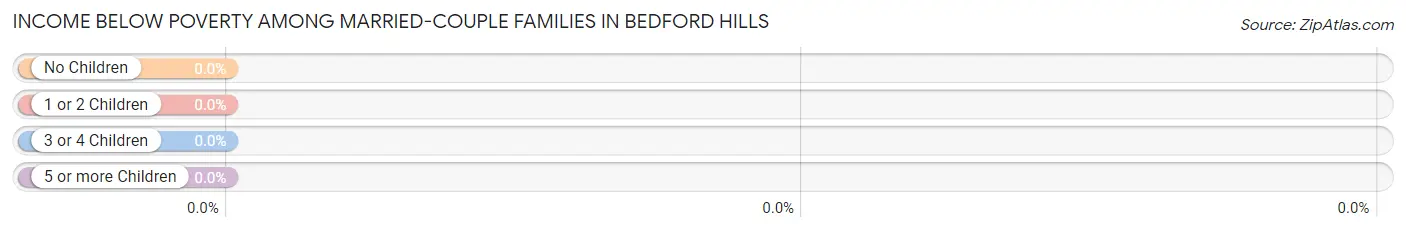
| Children | Above Poverty | Below Poverty |
| No Children | 230 (100.0%) | 0 (0.0%) |
| 1 or 2 Children | 175 (100.0%) | 0 (0.0%) |
| 3 or 4 Children | 0 (0.0%) | 0 (0.0%) |
| 5 or more Children | 0 (0.0%) | 0 (0.0%) |
| Total | 405 (100.0%) | 0 (0.0%) |
Income Below Poverty Among Single-Parent Households in Bedford Hills
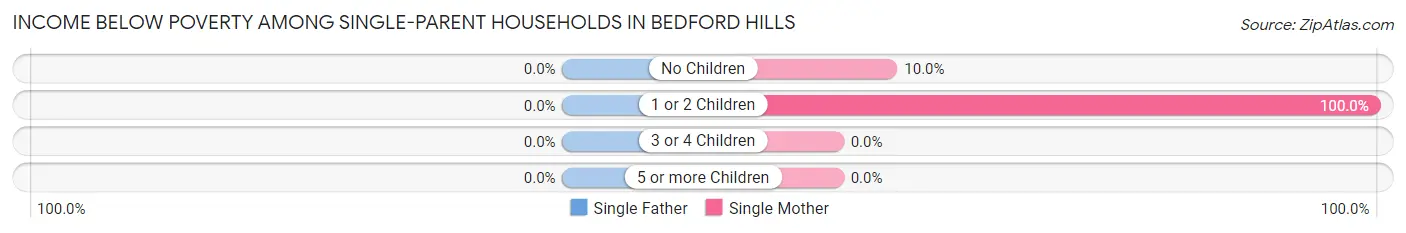
| Children | Single Father | Single Mother |
| No Children | 0 (0.0%) | 8 (10.0%) |
| 1 or 2 Children | 0 (0.0%) | 46 (100.0%) |
| 3 or 4 Children | 0 (0.0%) | 0 (0.0%) |
| 5 or more Children | 0 (0.0%) | 0 (0.0%) |
| Total | 0 (0.0%) | 54 (42.9%) |
Income Below Poverty Among Married-Couple vs Single-Parent Households in Bedford Hills
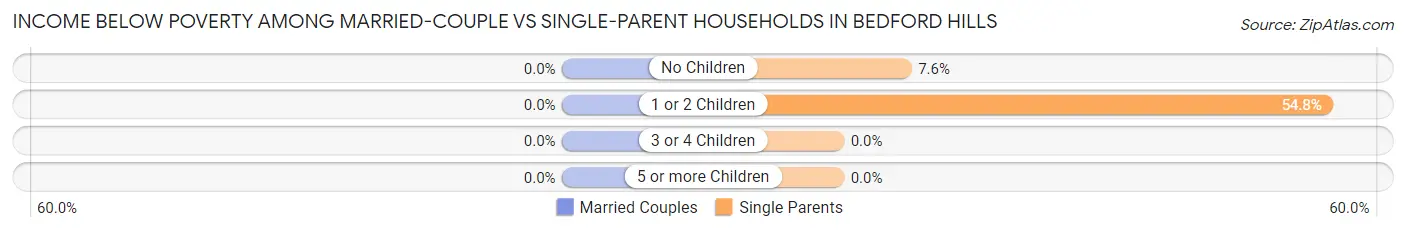
| Children | Married-Couple Families | Single-Parent Households |
| No Children | 0 (0.0%) | 8 (7.5%) |
| 1 or 2 Children | 0 (0.0%) | 46 (54.8%) |
| 3 or 4 Children | 0 (0.0%) | 0 (0.0%) |
| 5 or more Children | 0 (0.0%) | 0 (0.0%) |
| Total | 0 (0.0%) | 54 (28.4%) |
Race in Bedford Hills
The most populous races in Bedford Hills are White / Caucasian (1,232 | 53.5%), Hispanic or Latino (743 | 32.3%), and Some other Race (425 | 18.4%).
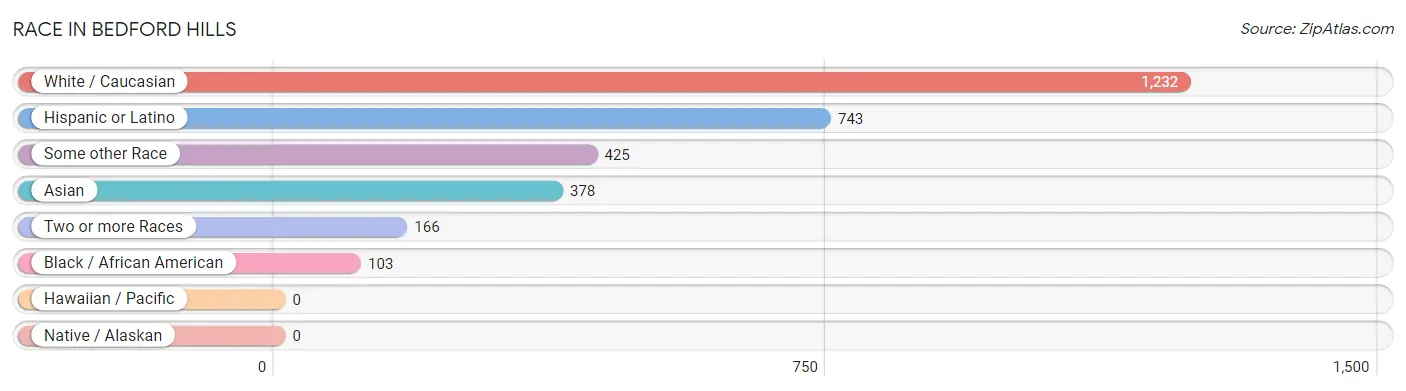
| Race | # Population | % Population |
| Asian | 378 | 16.4% |
| Black / African American | 103 | 4.5% |
| Hawaiian / Pacific | 0 | 0.0% |
| Hispanic or Latino | 743 | 32.3% |
| Native / Alaskan | 0 | 0.0% |
| White / Caucasian | 1,232 | 53.5% |
| Two or more Races | 166 | 7.2% |
| Some other Race | 425 | 18.4% |
| Total | 2,304 | 100.0% |
Ancestry in Bedford Hills
The most populous ancestries reported in Bedford Hills are Italian (390 | 16.9%), Korean (363 | 15.8%), Central American (336 | 14.6%), Irish (237 | 10.3%), and Salvadoran (213 | 9.2%), together accounting for 66.8% of all Bedford Hills residents.
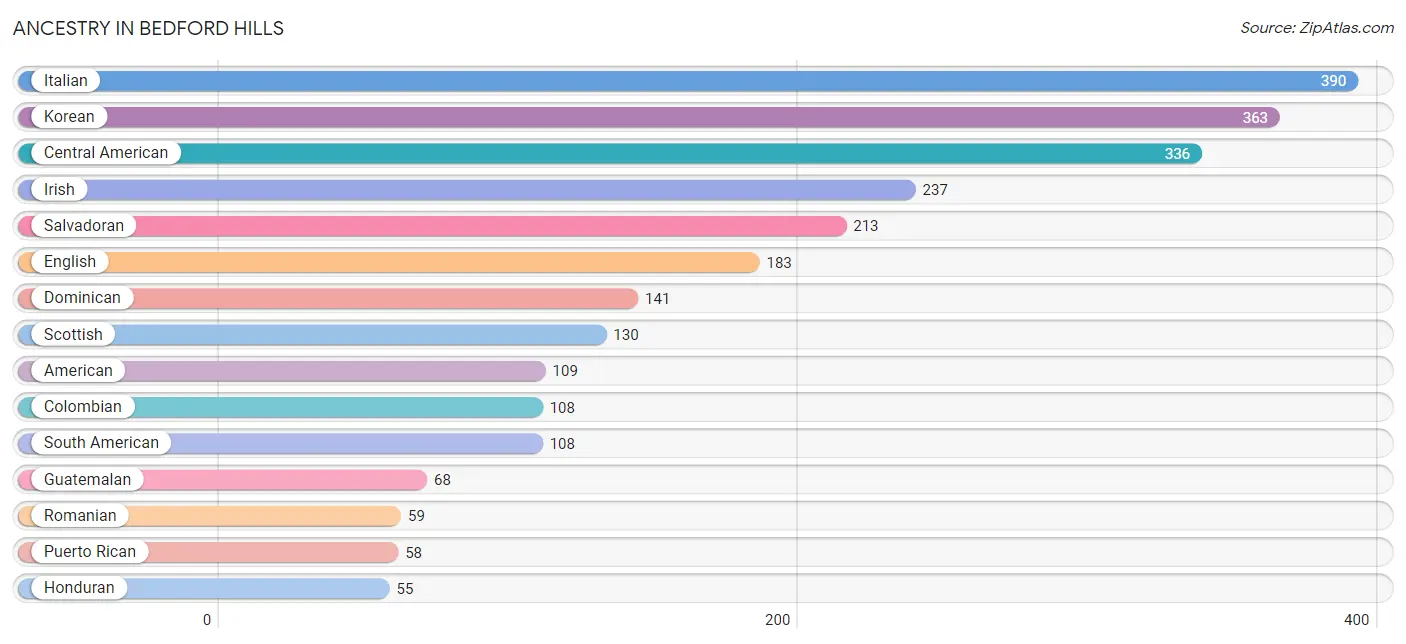
| Ancestry | # Population | % Population |
| American | 109 | 4.7% |
| Bhutanese | 46 | 2.0% |
| Canadian | 12 | 0.5% |
| Central American | 336 | 14.6% |
| Colombian | 108 | 4.7% |
| Cuban | 12 | 0.5% |
| Dominican | 141 | 6.1% |
| English | 183 | 7.9% |
| European | 30 | 1.3% |
| French | 14 | 0.6% |
| German | 25 | 1.1% |
| Greek | 27 | 1.2% |
| Guatemalan | 68 | 2.9% |
| Honduran | 55 | 2.4% |
| Hungarian | 16 | 0.7% |
| Indian (Asian) | 18 | 0.8% |
| Irish | 237 | 10.3% |
| Italian | 390 | 16.9% |
| Korean | 363 | 15.8% |
| Norwegian | 29 | 1.3% |
| Pakistani | 6 | 0.3% |
| Polish | 39 | 1.7% |
| Portuguese | 24 | 1.0% |
| Puerto Rican | 58 | 2.5% |
| Romanian | 59 | 2.6% |
| Russian | 28 | 1.2% |
| Salvadoran | 213 | 9.2% |
| Scotch-Irish | 41 | 1.8% |
| Scottish | 130 | 5.6% |
| South American | 108 | 4.7% |
| Spaniard | 11 | 0.5% |
| Spanish | 11 | 0.5% |
| Ukrainian | 47 | 2.0% |
| Welsh | 12 | 0.5% | View All 34 Rows |
Immigrants in Bedford Hills
The most numerous immigrant groups reported in Bedford Hills came from Latin America (400 | 17.4%), Asia (353 | 15.3%), South Eastern Asia (353 | 15.3%), Philippines (347 | 15.1%), and Central America (196 | 8.5%), together accounting for 71.6% of all Bedford Hills residents.
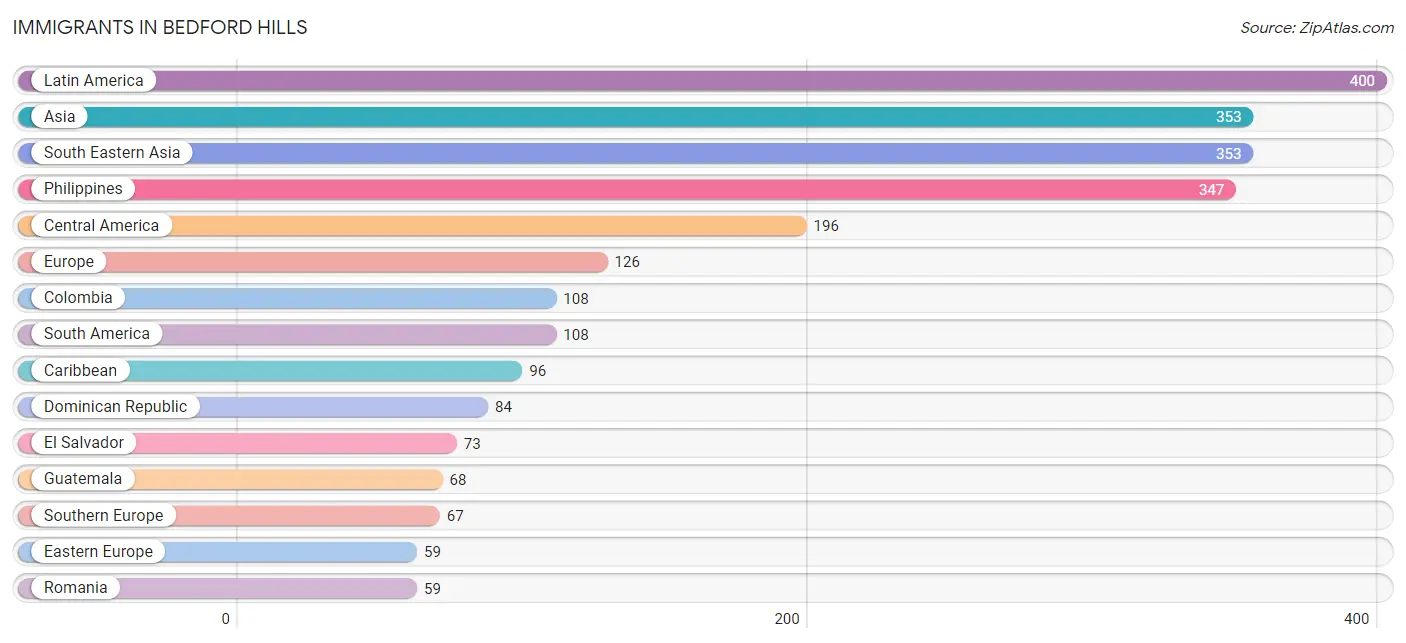
| Immigration Origin | # Population | % Population |
| Asia | 353 | 15.3% |
| Caribbean | 96 | 4.2% |
| Central America | 196 | 8.5% |
| Colombia | 108 | 4.7% |
| Cuba | 12 | 0.5% |
| Dominican Republic | 84 | 3.6% |
| Eastern Europe | 59 | 2.6% |
| El Salvador | 73 | 3.2% |
| Europe | 126 | 5.5% |
| Guatemala | 68 | 2.9% |
| Honduras | 55 | 2.4% |
| Italy | 45 | 1.9% |
| Latin America | 400 | 17.4% |
| Philippines | 347 | 15.1% |
| Romania | 59 | 2.6% |
| South America | 108 | 4.7% |
| South Eastern Asia | 353 | 15.3% |
| Southern Europe | 67 | 2.9% |
| Spain | 22 | 0.9% |
| Thailand | 6 | 0.3% | View All 20 Rows |
Sex and Age in Bedford Hills
Sex and Age in Bedford Hills
The most populous age groups in Bedford Hills are 70 to 74 Years (108 | 10.2%) for men and 50 to 54 Years (204 | 16.4%) for women.
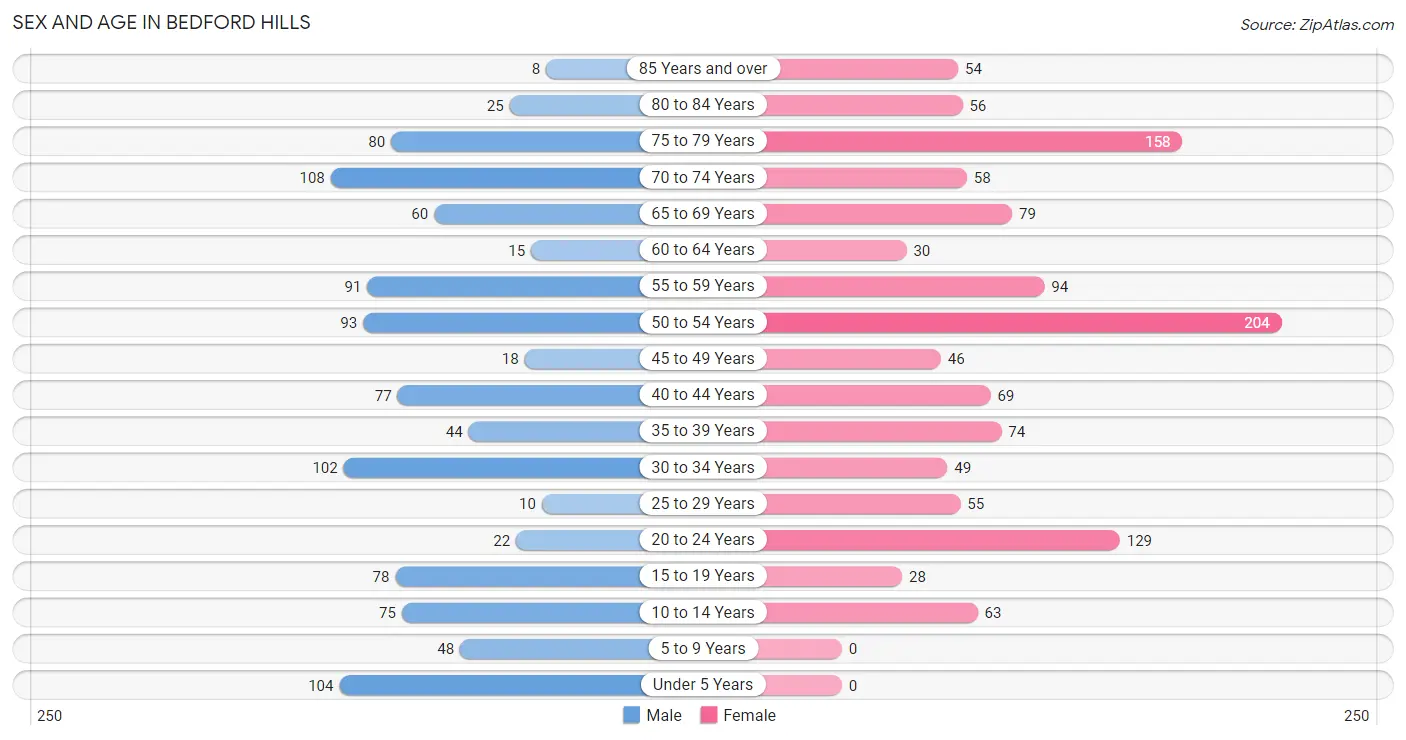
| Age Bracket | Male | Female |
| Under 5 Years | 104 (9.8%) | 0 (0.0%) |
| 5 to 9 Years | 48 (4.5%) | 0 (0.0%) |
| 10 to 14 Years | 75 (7.1%) | 63 (5.1%) |
| 15 to 19 Years | 78 (7.4%) | 28 (2.2%) |
| 20 to 24 Years | 22 (2.1%) | 129 (10.3%) |
| 25 to 29 Years | 10 (0.9%) | 55 (4.4%) |
| 30 to 34 Years | 102 (9.6%) | 49 (3.9%) |
| 35 to 39 Years | 44 (4.2%) | 74 (5.9%) |
| 40 to 44 Years | 77 (7.3%) | 69 (5.5%) |
| 45 to 49 Years | 18 (1.7%) | 46 (3.7%) |
| 50 to 54 Years | 93 (8.8%) | 204 (16.4%) |
| 55 to 59 Years | 91 (8.6%) | 94 (7.5%) |
| 60 to 64 Years | 15 (1.4%) | 30 (2.4%) |
| 65 to 69 Years | 60 (5.7%) | 79 (6.3%) |
| 70 to 74 Years | 108 (10.2%) | 58 (4.6%) |
| 75 to 79 Years | 80 (7.6%) | 158 (12.7%) |
| 80 to 84 Years | 25 (2.4%) | 56 (4.5%) |
| 85 Years and over | 8 (0.8%) | 54 (4.3%) |
| Total | 1,058 (100.0%) | 1,246 (100.0%) |
Families and Households in Bedford Hills
Median Family Size in Bedford Hills
The median family size in Bedford Hills is 3.03 persons per family, with married-couple families (405 | 68.1%) accounting for the largest median family size of 3.42 persons per family. On the other hand, single male/father families (64 | 10.8%) represent the smallest median family size with 1.98 persons per family.
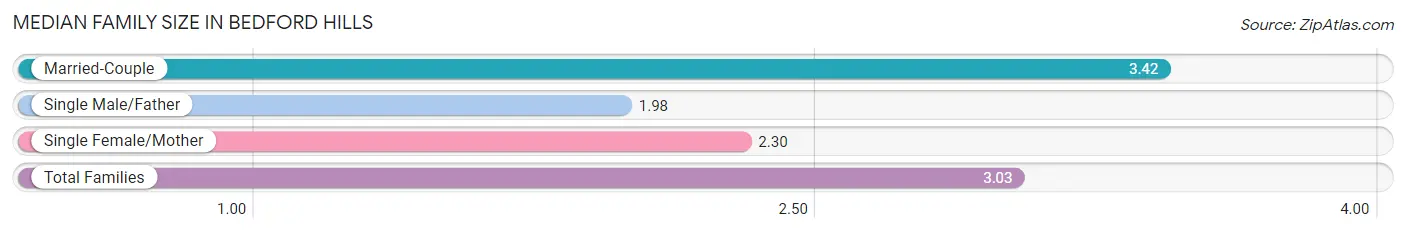
| Family Type | # Families | Family Size |
| Married-Couple | 405 (68.1%) | 3.42 |
| Single Male/Father | 64 (10.8%) | 1.98 |
| Single Female/Mother | 126 (21.2%) | 2.30 |
| Total Families | 595 (100.0%) | 3.03 |
Median Household Size in Bedford Hills
The median household size in Bedford Hills is 2.38 persons per household, with married-couple households (405 | 42.1%) accounting for the largest median household size of 3.43 persons per household. non-family households (367 | 38.2%) represent the smallest median household size with 1.25 persons per household.
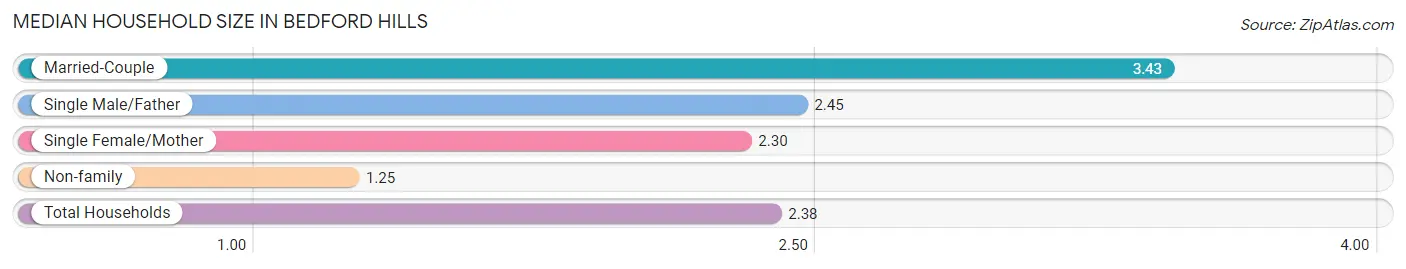
| Household Type | # Households | Household Size |
| Married-Couple | 405 (42.1%) | 3.43 |
| Single Male/Father | 64 (6.7%) | 2.45 |
| Single Female/Mother | 126 (13.1%) | 2.30 |
| Non-family | 367 (38.2%) | 1.25 |
| Total Households | 962 (100.0%) | 2.38 |
Household Size by Marriage Status in Bedford Hills
Out of a total of 962 households in Bedford Hills, 595 (61.9%) are family households, while 367 (38.2%) are nonfamily households. The most numerous type of family households are 2-person households, comprising 277, and the most common type of nonfamily households are 1-person households, comprising 282.
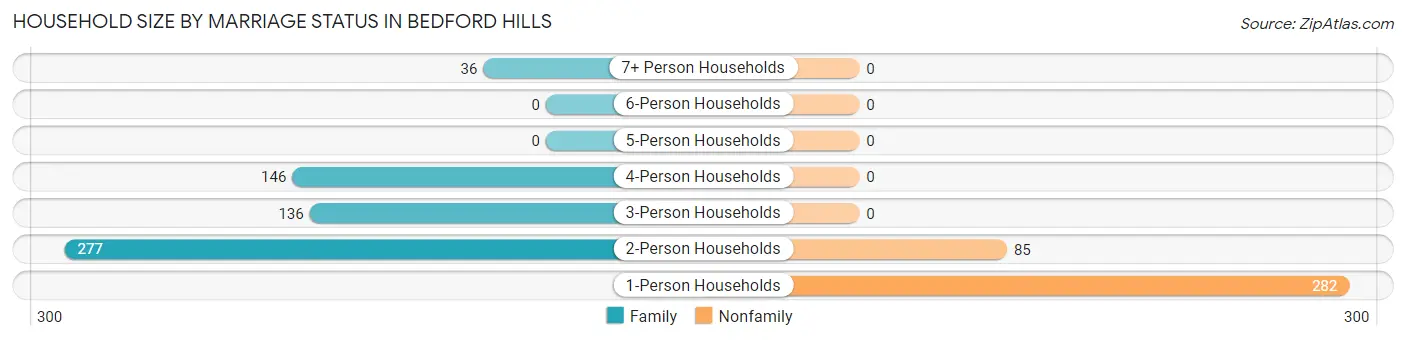
| Household Size | Family Households | Nonfamily Households |
| 1-Person Households | - | 282 (29.3%) |
| 2-Person Households | 277 (28.8%) | 85 (8.8%) |
| 3-Person Households | 136 (14.1%) | 0 (0.0%) |
| 4-Person Households | 146 (15.2%) | 0 (0.0%) |
| 5-Person Households | 0 (0.0%) | 0 (0.0%) |
| 6-Person Households | 0 (0.0%) | 0 (0.0%) |
| 7+ Person Households | 36 (3.7%) | 0 (0.0%) |
| Total | 595 (61.9%) | 367 (38.2%) |
Female Fertility in Bedford Hills
Fertility by Age in Bedford Hills
Average fertility rate in Bedford Hills is 45.0 births per 1,000 women. Women in the age bracket of 35 to 50 years have the highest fertility rate with 57.0 births per 1,000 women. Women in the age bracket of 35 to 50 years acount for 60.9% of all women with births.
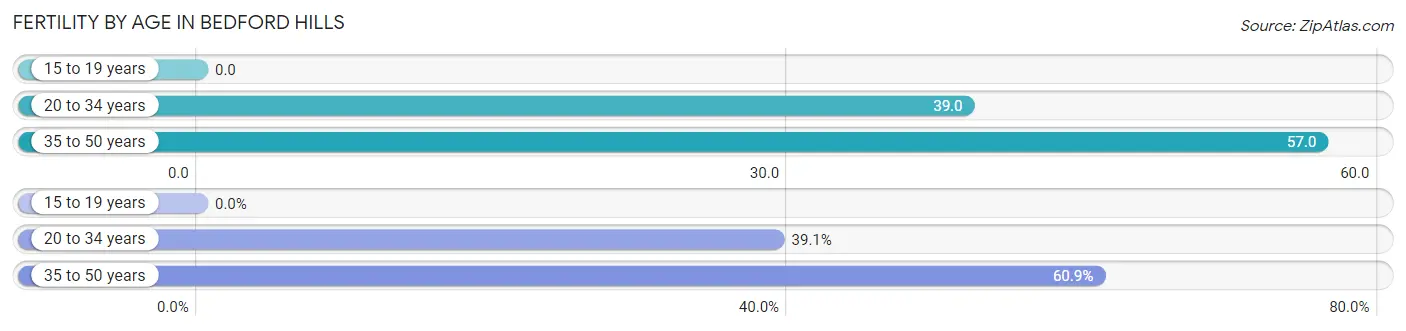
| Age Bracket | Women with Births | Births / 1,000 Women |
| 15 to 19 years | 0 (0.0%) | 0.0 |
| 20 to 34 years | 9 (39.1%) | 39.0 |
| 35 to 50 years | 14 (60.9%) | 57.0 |
| Total | 23 (100.0%) | 45.0 |
Fertility by Age by Marriage Status in Bedford Hills
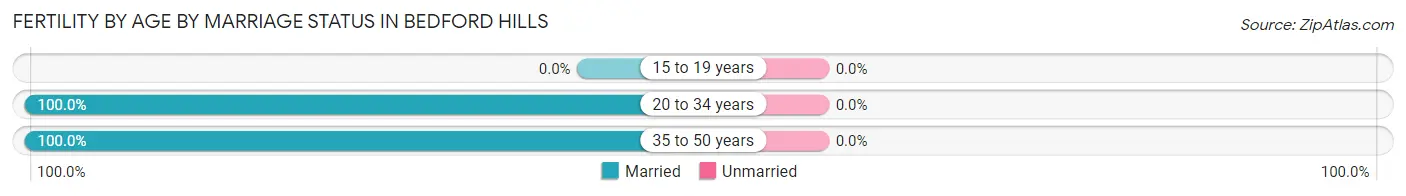
| Age Bracket | Married | Unmarried |
| 15 to 19 years | 0 (0.0%) | 0 (0.0%) |
| 20 to 34 years | 9 (100.0%) | 0 (0.0%) |
| 35 to 50 years | 14 (100.0%) | 0 (0.0%) |
| Total | 23 (100.0%) | 0 (0.0%) |
Fertility by Education in Bedford Hills
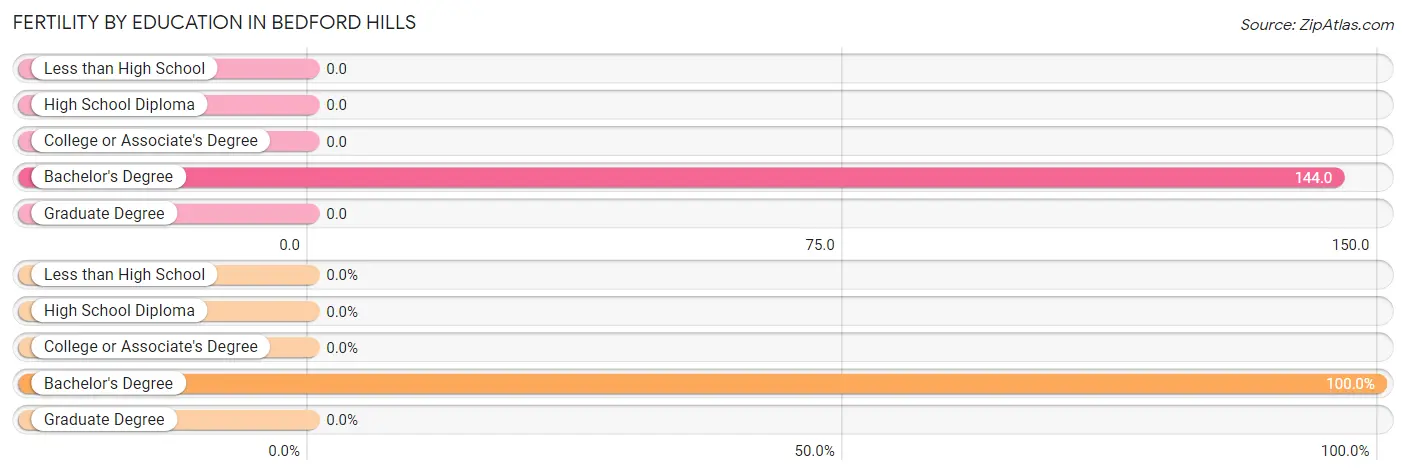
| Educational Attainment | Women with Births | Births / 1,000 Women |
| Less than High School | 0 (0.0%) | 0.0 |
| High School Diploma | 0 (0.0%) | 0.0 |
| College or Associate's Degree | 0 (0.0%) | 0.0 |
| Bachelor's Degree | 23 (100.0%) | 144.0 |
| Graduate Degree | 0 (0.0%) | 0.0 |
| Total | 23 (100.0%) | 45.0 |
Fertility by Education by Marriage Status in Bedford Hills
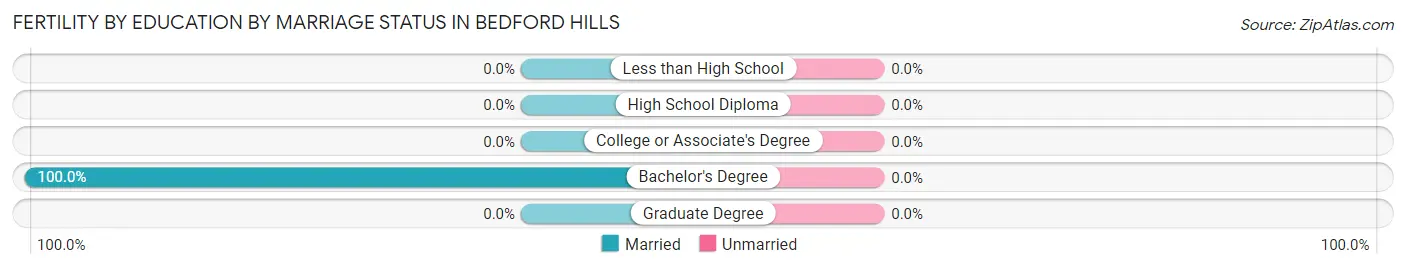
| Educational Attainment | Married | Unmarried |
| Less than High School | 0 (0.0%) | 0 (0.0%) |
| High School Diploma | 0 (0.0%) | 0 (0.0%) |
| College or Associate's Degree | 0 (0.0%) | 0 (0.0%) |
| Bachelor's Degree | 23 (100.0%) | 0 (0.0%) |
| Graduate Degree | 0 (0.0%) | 0 (0.0%) |
| Total | 23 (100.0%) | 0 (0.0%) |
Employment Characteristics in Bedford Hills
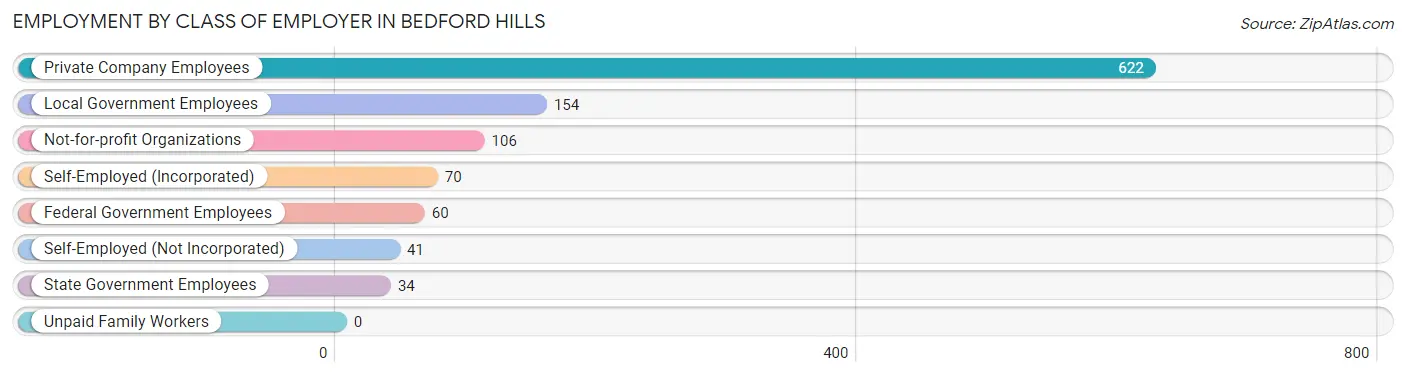
Employment by Class of Employer in Bedford Hills
Among the 1,087 employed individuals in Bedford Hills, private company employees (622 | 57.2%), local government employees (154 | 14.2%), and not-for-profit organizations (106 | 9.8%) make up the most common classes of employment.
| Employer Class | # Employees | % Employees |
| Private Company Employees | 622 | 57.2% |
| Self-Employed (Incorporated) | 70 | 6.4% |
| Self-Employed (Not Incorporated) | 41 | 3.8% |
| Not-for-profit Organizations | 106 | 9.8% |
| Local Government Employees | 154 | 14.2% |
| State Government Employees | 34 | 3.1% |
| Federal Government Employees | 60 | 5.5% |
| Unpaid Family Workers | 0 | 0.0% |
| Total | 1,087 | 100.0% |
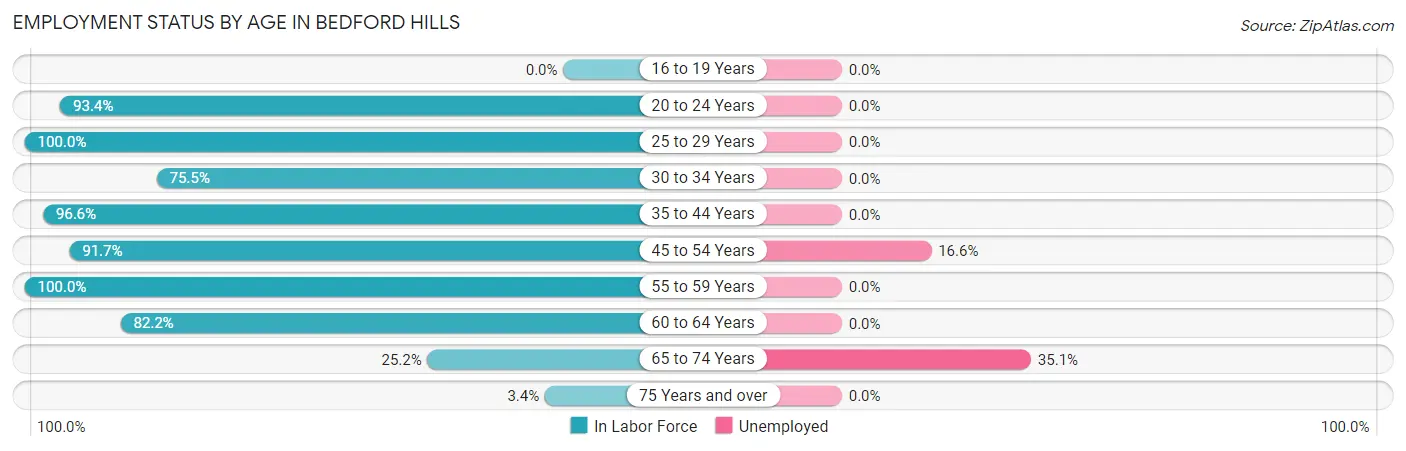
Employment Status by Age in Bedford Hills
According to the labor force statistics for Bedford Hills, out of the total population over 16 years of age (1,986), 61.3% or 1,217 individuals are in the labor force, with 6.7% or 82 of them unemployed. The age group with the highest labor force participation rate is 25 to 29 years, with 100.0% or 65 individuals in the labor force. Within the labor force, the 65 to 74 years age range has the highest percentage of unemployed individuals, with 35.1% or 27 of them being unemployed.
| Age Bracket | In Labor Force | Unemployed |
| 16 to 19 Years | 0 (0.0%) | 0 (0.0%) |
| 20 to 24 Years | 141 (93.4%) | 0 (0.0%) |
| 25 to 29 Years | 65 (100.0%) | 0 (0.0%) |
| 30 to 34 Years | 114 (75.5%) | 0 (0.0%) |
| 35 to 44 Years | 255 (96.6%) | 0 (0.0%) |
| 45 to 54 Years | 331 (91.7%) | 55 (16.6%) |
| 55 to 59 Years | 185 (100.0%) | 0 (0.0%) |
| 60 to 64 Years | 37 (82.2%) | 0 (0.0%) |
| 65 to 74 Years | 77 (25.2%) | 27 (35.1%) |
| 75 Years and over | 13 (3.4%) | 0 (0.0%) |
| Total | 1,217 (61.3%) | 82 (6.7%) |
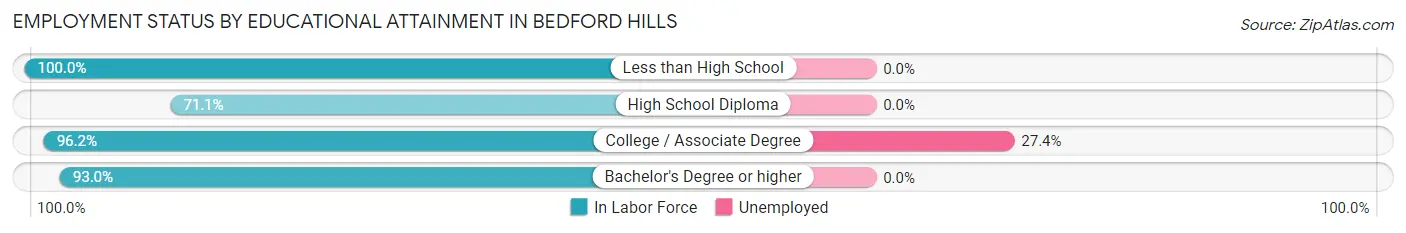
Employment Status by Educational Attainment in Bedford Hills
According to labor force statistics for Bedford Hills, 92.2% of individuals (987) out of the total population between 25 and 64 years of age (1,071) are in the labor force, with 5.6% or 55 of them being unemployed. The group with the highest labor force participation rate are those with the educational attainment of less than high school, with 100.0% or 196 individuals in the labor force. Within the labor force, individuals with college / associate degree education have the highest percentage of unemployment, with 27.4% or 55 of them being unemployed.
| Educational Attainment | In Labor Force | Unemployed |
| Less than High School | 196 (100.0%) | 0 (0.0%) |
| High School Diploma | 96 (71.1%) | 0 (0.0%) |
| College / Associate Degree | 201 (96.2%) | 57 (27.4%) |
| Bachelor's Degree or higher | 494 (93.0%) | 0 (0.0%) |
| Total | 987 (92.2%) | 60 (5.6%) |
Employment Occupations by Sex in Bedford Hills
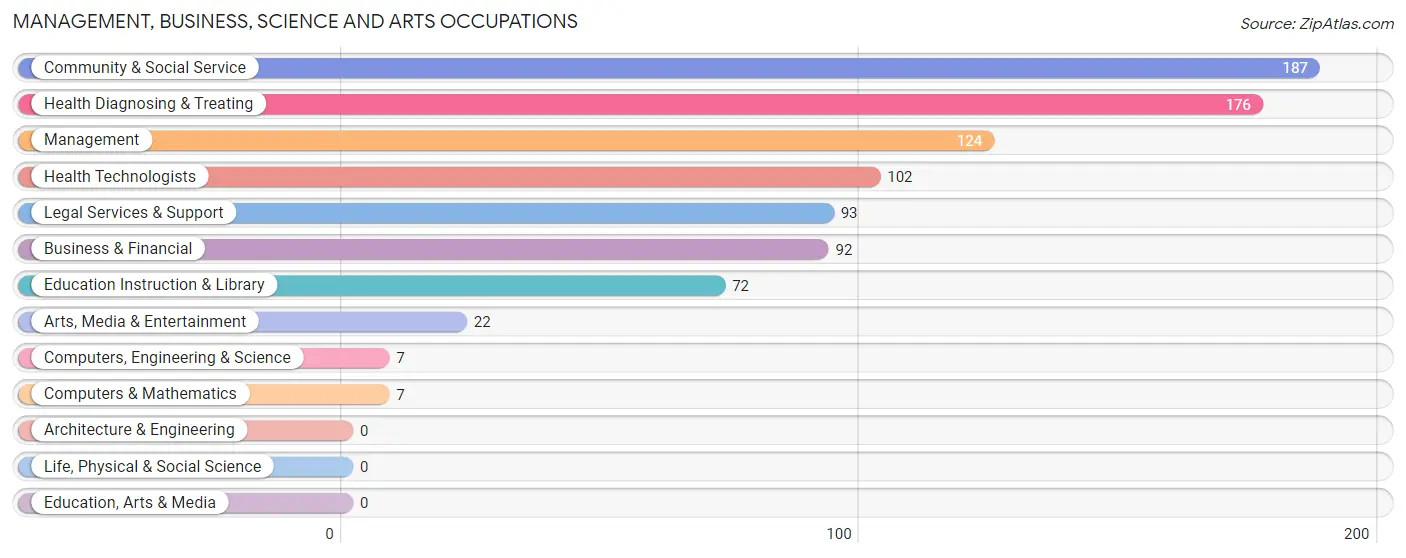
Management, Business, Science and Arts Occupations
The most common Management, Business, Science and Arts occupations in Bedford Hills are Community & Social Service (187 | 16.5%), Health Diagnosing & Treating (176 | 15.5%), Management (124 | 10.9%), Health Technologists (102 | 9.0%), and Legal Services & Support (93 | 8.2%).
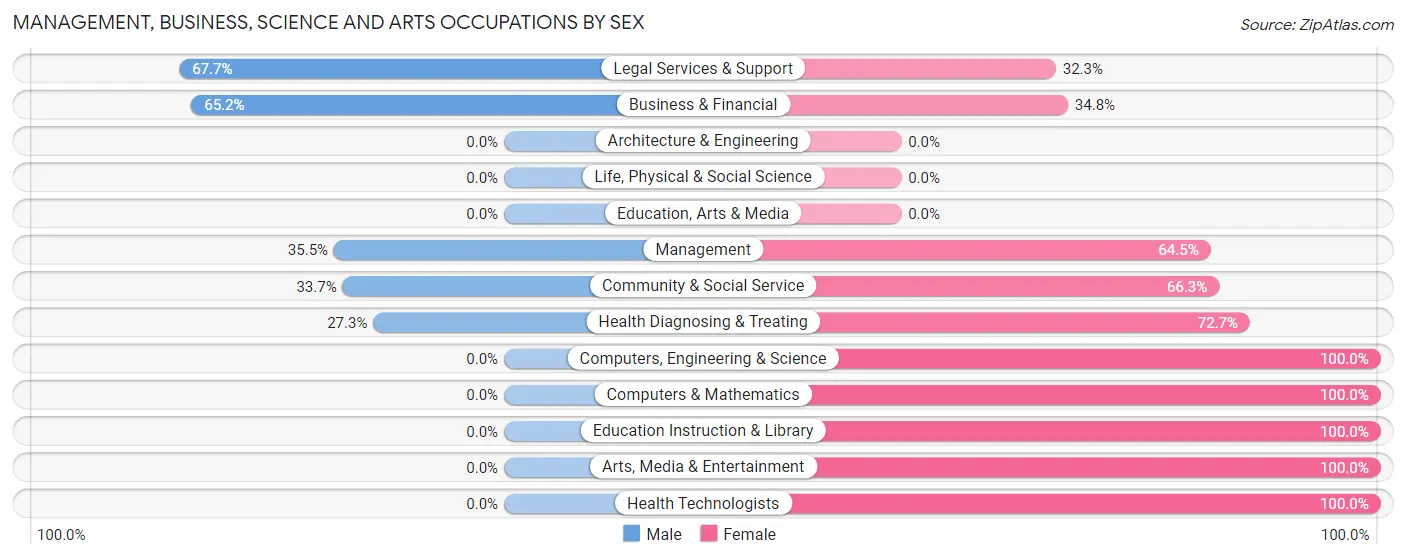
Management, Business, Science and Arts Occupations by Sex
Within the Management, Business, Science and Arts occupations in Bedford Hills, the most male-oriented occupations are Legal Services & Support (67.7%), Business & Financial (65.2%), and Management (35.5%), while the most female-oriented occupations are Computers, Engineering & Science (100.0%), Computers & Mathematics (100.0%), and Education Instruction & Library (100.0%).
| Occupation | Male | Female |
| Management | 44 (35.5%) | 80 (64.5%) |
| Business & Financial | 60 (65.2%) | 32 (34.8%) |
| Computers, Engineering & Science | 0 (0.0%) | 7 (100.0%) |
| Computers & Mathematics | 0 (0.0%) | 7 (100.0%) |
| Architecture & Engineering | 0 (0.0%) | 0 (0.0%) |
| Life, Physical & Social Science | 0 (0.0%) | 0 (0.0%) |
| Community & Social Service | 63 (33.7%) | 124 (66.3%) |
| Education, Arts & Media | 0 (0.0%) | 0 (0.0%) |
| Legal Services & Support | 63 (67.7%) | 30 (32.3%) |
| Education Instruction & Library | 0 (0.0%) | 72 (100.0%) |
| Arts, Media & Entertainment | 0 (0.0%) | 22 (100.0%) |
| Health Diagnosing & Treating | 48 (27.3%) | 128 (72.7%) |
| Health Technologists | 0 (0.0%) | 102 (100.0%) |
| Total (Category) | 215 (36.7%) | 371 (63.3%) |
| Total (Overall) | 479 (42.2%) | 657 (57.8%) |
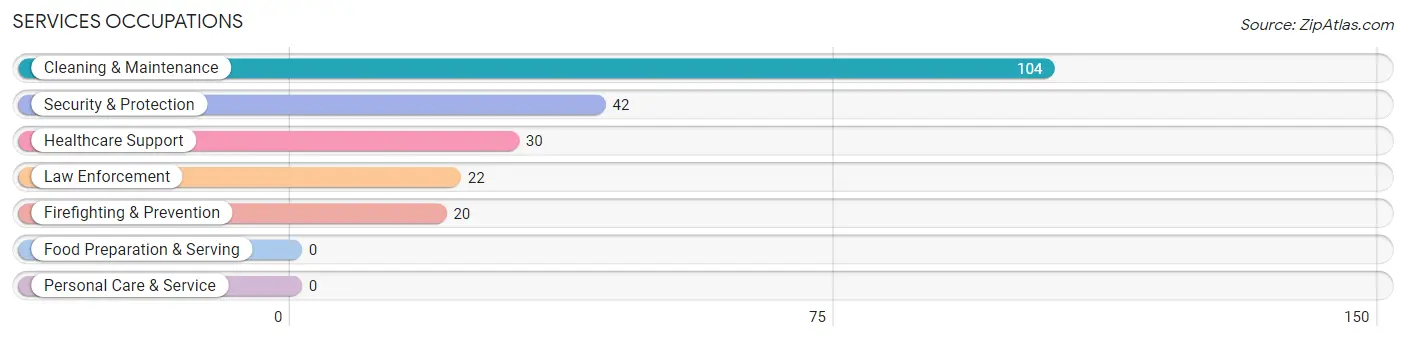
Services Occupations
The most common Services occupations in Bedford Hills are Cleaning & Maintenance (104 | 9.1%), Security & Protection (42 | 3.7%), Healthcare Support (30 | 2.6%), Law Enforcement (22 | 1.9%), and Firefighting & Prevention (20 | 1.8%).
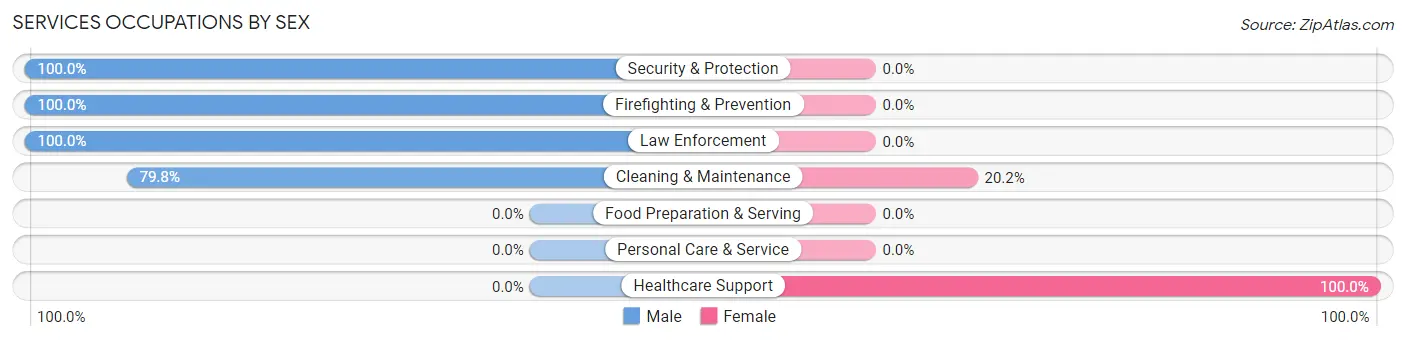
Services Occupations by Sex
Within the Services occupations in Bedford Hills, the most male-oriented occupations are Security & Protection (100.0%), Firefighting & Prevention (100.0%), and Law Enforcement (100.0%), while the most female-oriented occupations are Healthcare Support (100.0%), and Cleaning & Maintenance (20.2%).
| Occupation | Male | Female |
| Healthcare Support | 0 (0.0%) | 30 (100.0%) |
| Security & Protection | 42 (100.0%) | 0 (0.0%) |
| Firefighting & Prevention | 20 (100.0%) | 0 (0.0%) |
| Law Enforcement | 22 (100.0%) | 0 (0.0%) |
| Food Preparation & Serving | 0 (0.0%) | 0 (0.0%) |
| Cleaning & Maintenance | 83 (79.8%) | 21 (20.2%) |
| Personal Care & Service | 0 (0.0%) | 0 (0.0%) |
| Total (Category) | 125 (71.0%) | 51 (29.0%) |
| Total (Overall) | 479 (42.2%) | 657 (57.8%) |
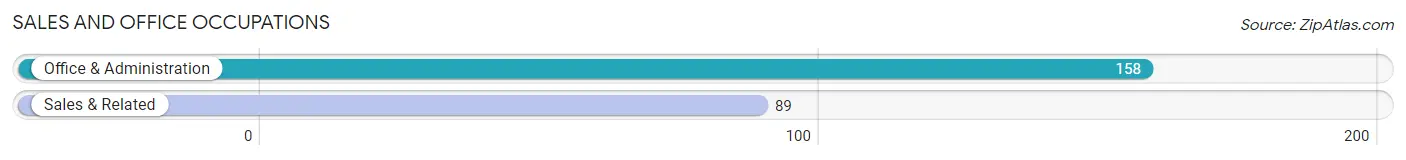
Sales and Office Occupations
The most common Sales and Office occupations in Bedford Hills are Office & Administration (158 | 13.9%), and Sales & Related (89 | 7.8%).
Sales and Office Occupations by Sex
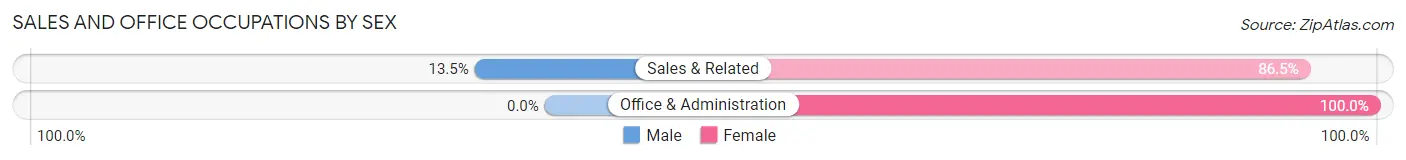
| Occupation | Male | Female |
| Sales & Related | 12 (13.5%) | 77 (86.5%) |
| Office & Administration | 0 (0.0%) | 158 (100.0%) |
| Total (Category) | 12 (4.9%) | 235 (95.1%) |
| Total (Overall) | 479 (42.2%) | 657 (57.8%) |
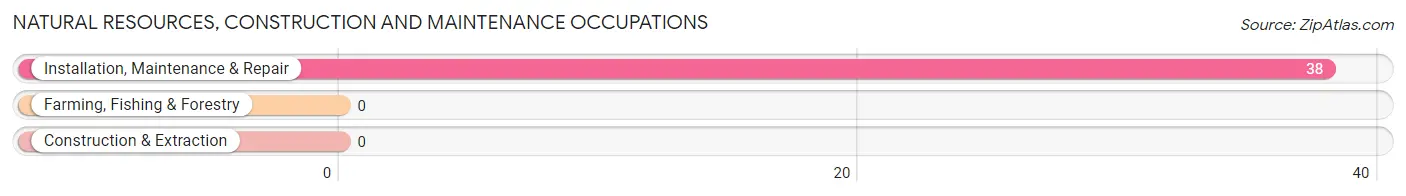
Natural Resources, Construction and Maintenance Occupations
The most common Natural Resources, Construction and Maintenance occupations in Bedford Hills are , and Installation, Maintenance & Repair (38 | 3.4%).
Natural Resources, Construction and Maintenance Occupations by Sex
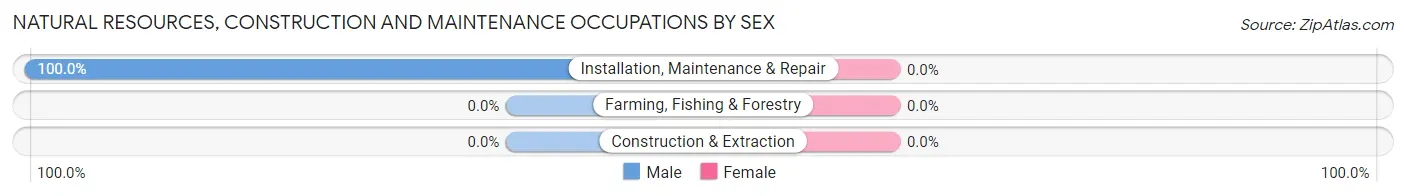
| Occupation | Male | Female |
| Farming, Fishing & Forestry | 0 (0.0%) | 0 (0.0%) |
| Construction & Extraction | 0 (0.0%) | 0 (0.0%) |
| Installation, Maintenance & Repair | 38 (100.0%) | 0 (0.0%) |
| Total (Category) | 38 (100.0%) | 0 (0.0%) |
| Total (Overall) | 479 (42.2%) | 657 (57.8%) |
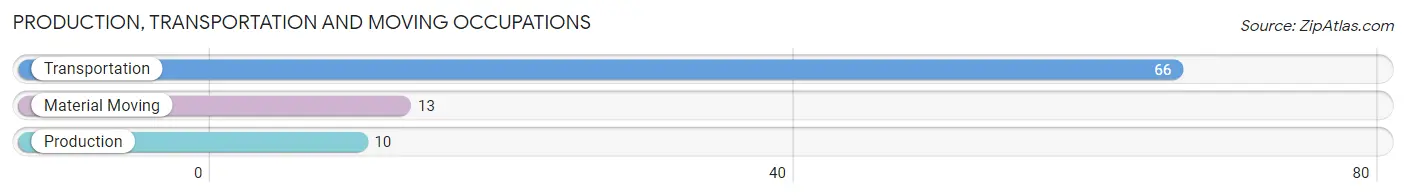
Production, Transportation and Moving Occupations
The most common Production, Transportation and Moving occupations in Bedford Hills are Transportation (66 | 5.8%), Material Moving (13 | 1.1%), and Production (10 | 0.9%).
Production, Transportation and Moving Occupations by Sex
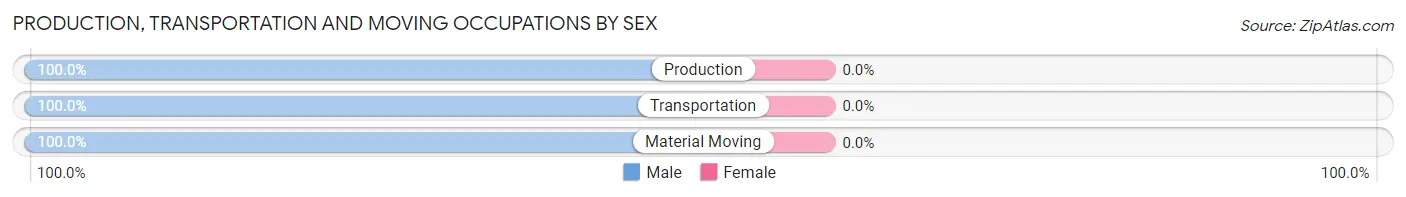
| Occupation | Male | Female |
| Production | 10 (100.0%) | 0 (0.0%) |
| Transportation | 66 (100.0%) | 0 (0.0%) |
| Material Moving | 13 (100.0%) | 0 (0.0%) |
| Total (Category) | 89 (100.0%) | 0 (0.0%) |
| Total (Overall) | 479 (42.2%) | 657 (57.8%) |
Employment Industries by Sex in Bedford Hills
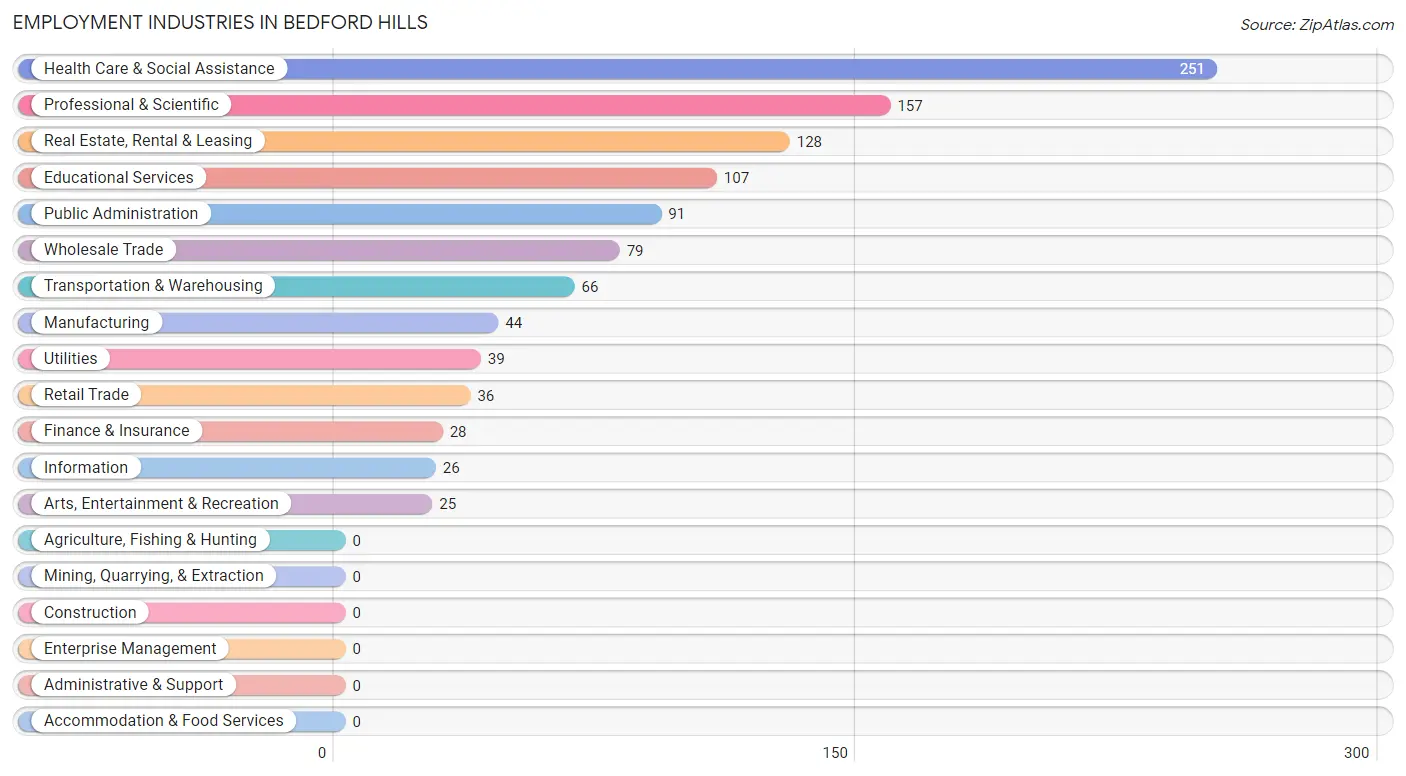
Employment Industries in Bedford Hills
The major employment industries in Bedford Hills include Health Care & Social Assistance (251 | 22.1%), Professional & Scientific (157 | 13.8%), Real Estate, Rental & Leasing (128 | 11.3%), Educational Services (107 | 9.4%), and Public Administration (91 | 8.0%).
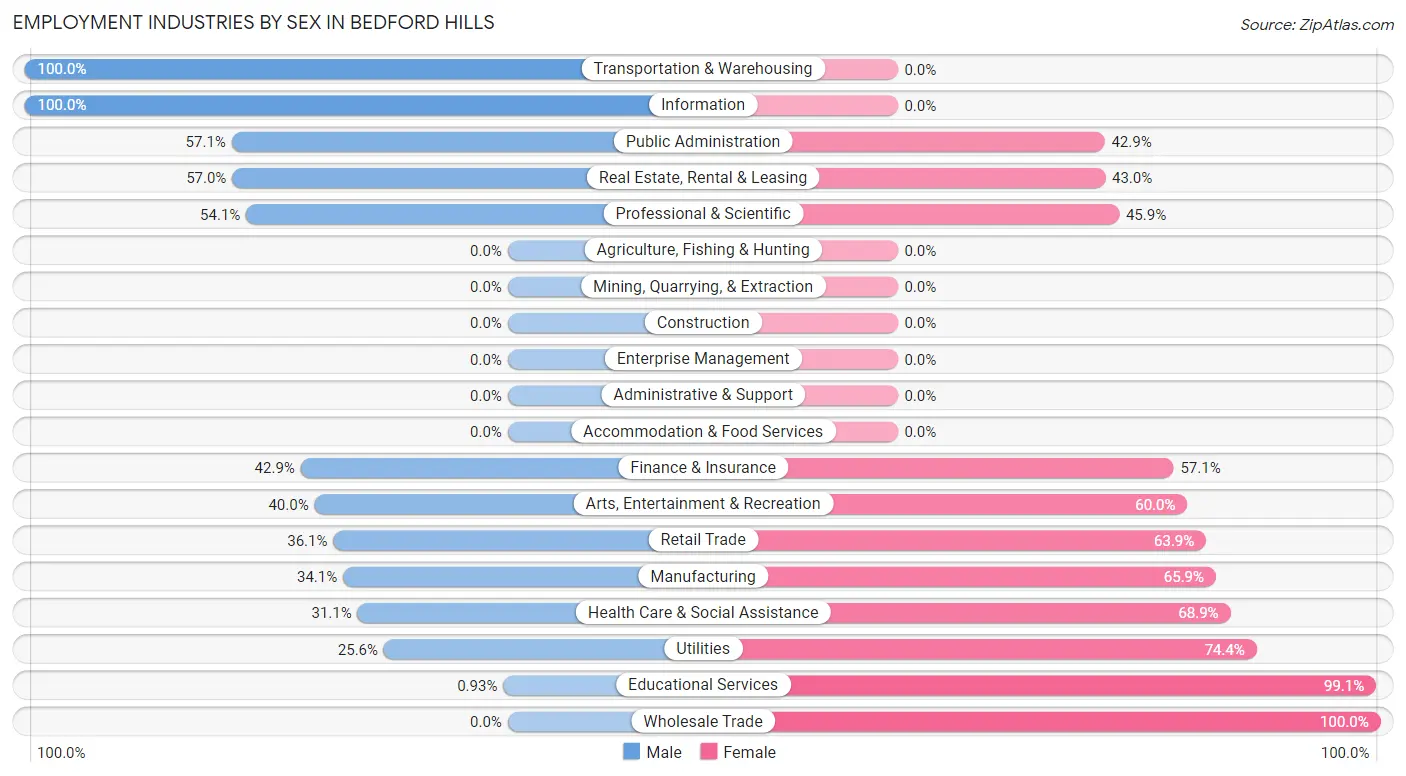
Employment Industries by Sex in Bedford Hills
The Bedford Hills industries that see more men than women are Transportation & Warehousing (100.0%), Information (100.0%), and Public Administration (57.1%), whereas the industries that tend to have a higher number of women are Wholesale Trade (100.0%), Educational Services (99.1%), and Utilities (74.4%).
| Industry | Male | Female |
| Agriculture, Fishing & Hunting | 0 (0.0%) | 0 (0.0%) |
| Mining, Quarrying, & Extraction | 0 (0.0%) | 0 (0.0%) |
| Construction | 0 (0.0%) | 0 (0.0%) |
| Manufacturing | 15 (34.1%) | 29 (65.9%) |
| Wholesale Trade | 0 (0.0%) | 79 (100.0%) |
| Retail Trade | 13 (36.1%) | 23 (63.9%) |
| Transportation & Warehousing | 66 (100.0%) | 0 (0.0%) |
| Utilities | 10 (25.6%) | 29 (74.4%) |
| Information | 26 (100.0%) | 0 (0.0%) |
| Finance & Insurance | 12 (42.9%) | 16 (57.1%) |
| Real Estate, Rental & Leasing | 73 (57.0%) | 55 (43.0%) |
| Professional & Scientific | 85 (54.1%) | 72 (45.9%) |
| Enterprise Management | 0 (0.0%) | 0 (0.0%) |
| Administrative & Support | 0 (0.0%) | 0 (0.0%) |
| Educational Services | 1 (0.9%) | 106 (99.1%) |
| Health Care & Social Assistance | 78 (31.1%) | 173 (68.9%) |
| Arts, Entertainment & Recreation | 10 (40.0%) | 15 (60.0%) |
| Accommodation & Food Services | 0 (0.0%) | 0 (0.0%) |
| Public Administration | 52 (57.1%) | 39 (42.9%) |
| Total | 479 (42.2%) | 657 (57.8%) |
Education in Bedford Hills
School Enrollment in Bedford Hills
The most common levels of schooling among the 333 students in Bedford Hills are elementary school (115 | 34.5%), college / undergraduate (111 | 33.3%), and high school (52 | 15.6%).
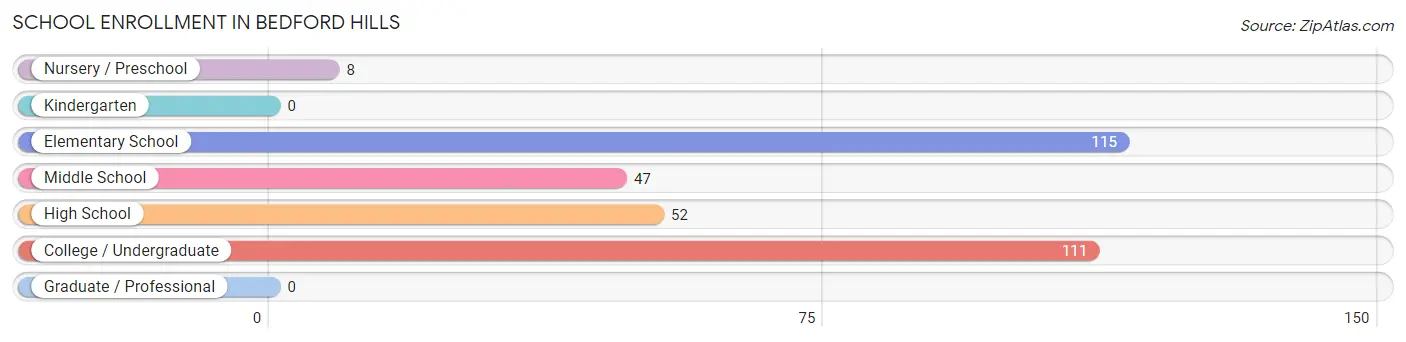
| School Level | # Students | % Students |
| Nursery / Preschool | 8 | 2.4% |
| Kindergarten | 0 | 0.0% |
| Elementary School | 115 | 34.5% |
| Middle School | 47 | 14.1% |
| High School | 52 | 15.6% |
| College / Undergraduate | 111 | 33.3% |
| Graduate / Professional | 0 | 0.0% |
| Total | 333 | 100.0% |
School Enrollment by Age by Funding Source in Bedford Hills
Out of a total of 333 students who are enrolled in schools in Bedford Hills, 113 (33.9%) attend a private institution, while the remaining 220 (66.1%) are enrolled in public schools. The age group of 3 to 4 year olds has the highest likelihood of being enrolled in private schools, with 8 (100.0% in the age bracket) enrolled. Conversely, the age group of 15 to 17 year olds has the lowest likelihood of being enrolled in a private school, with 28 (100.0% in the age bracket) attending a public institution.
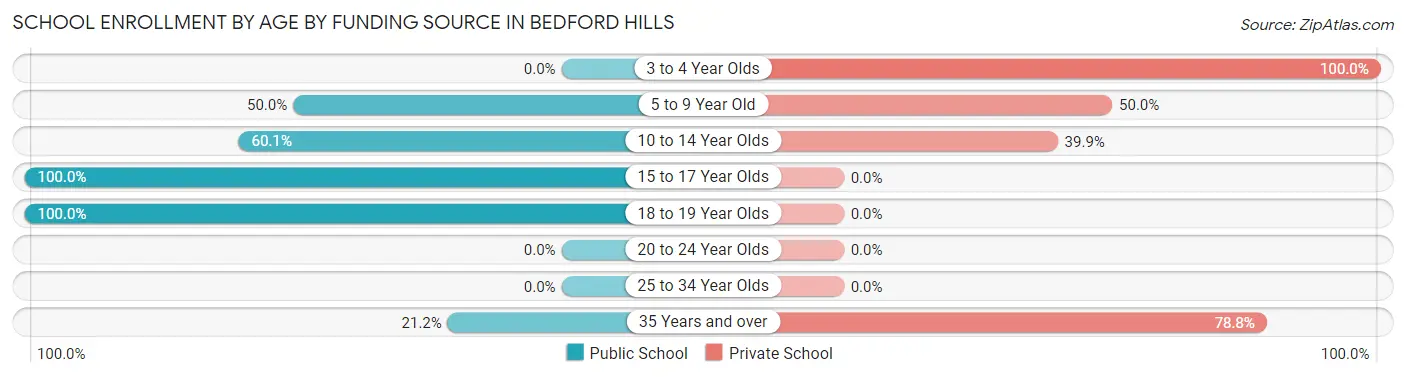
| Age Bracket | Public School | Private School |
| 3 to 4 Year Olds | 0 (0.0%) | 8 (100.0%) |
| 5 to 9 Year Old | 24 (50.0%) | 24 (50.0%) |
| 10 to 14 Year Olds | 83 (60.1%) | 55 (39.9%) |
| 15 to 17 Year Olds | 28 (100.0%) | 0 (0.0%) |
| 18 to 19 Year Olds | 78 (100.0%) | 0 (0.0%) |
| 20 to 24 Year Olds | 0 (0.0%) | 0 (0.0%) |
| 25 to 34 Year Olds | 0 (0.0%) | 0 (0.0%) |
| 35 Years and over | 7 (21.2%) | 26 (78.8%) |
| Total | 220 (66.1%) | 113 (33.9%) |
Educational Attainment by Field of Study in Bedford Hills
Science & technology (137 | 21.4%), social sciences (109 | 17.0%), business (98 | 15.3%), psychology (54 | 8.4%), and literature & languages (42 | 6.6%) are the most common fields of study among 640 individuals in Bedford Hills who have obtained a bachelor's degree or higher.
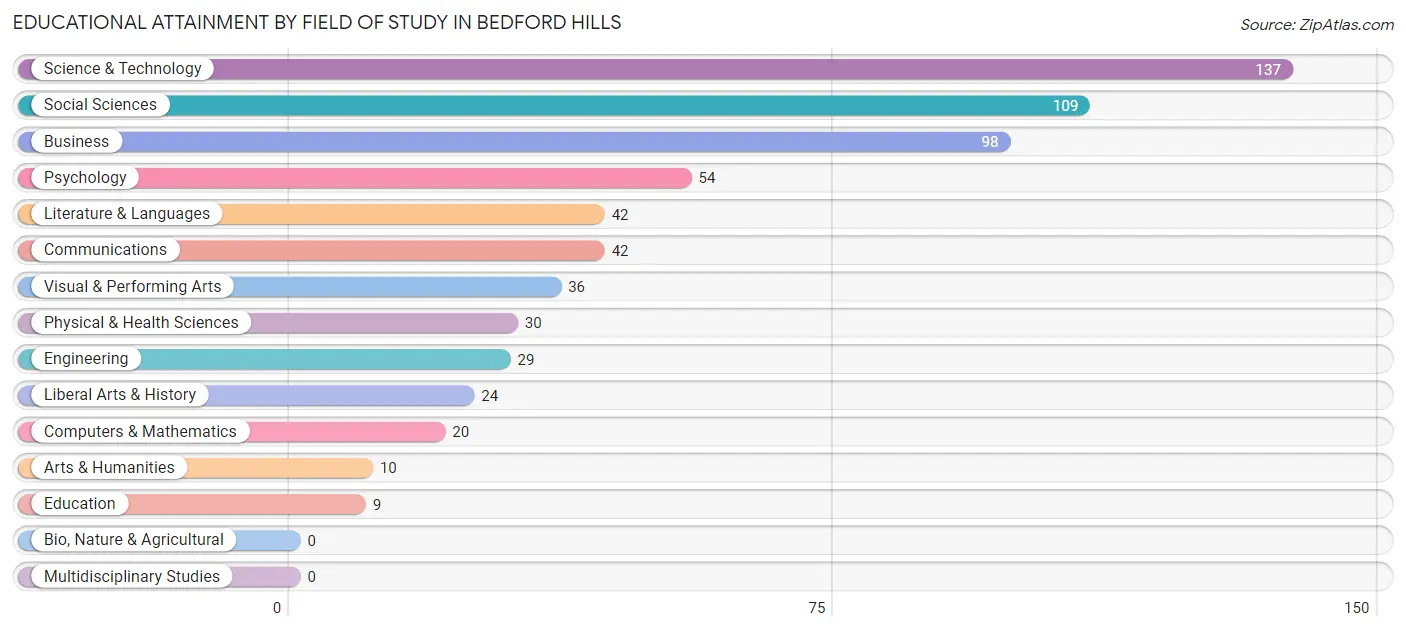
| Field of Study | # Graduates | % Graduates |
| Computers & Mathematics | 20 | 3.1% |
| Bio, Nature & Agricultural | 0 | 0.0% |
| Physical & Health Sciences | 30 | 4.7% |
| Psychology | 54 | 8.4% |
| Social Sciences | 109 | 17.0% |
| Engineering | 29 | 4.5% |
| Multidisciplinary Studies | 0 | 0.0% |
| Science & Technology | 137 | 21.4% |
| Business | 98 | 15.3% |
| Education | 9 | 1.4% |
| Literature & Languages | 42 | 6.6% |
| Liberal Arts & History | 24 | 3.7% |
| Visual & Performing Arts | 36 | 5.6% |
| Communications | 42 | 6.6% |
| Arts & Humanities | 10 | 1.6% |
| Total | 640 | 100.0% |
Transportation & Commute in Bedford Hills
Vehicle Availability by Sex in Bedford Hills
The most prevalent vehicle ownership categories in Bedford Hills are males with 2 vehicles (194, accounting for 40.5%) and females with 2 vehicles (220, making up 31.9%).
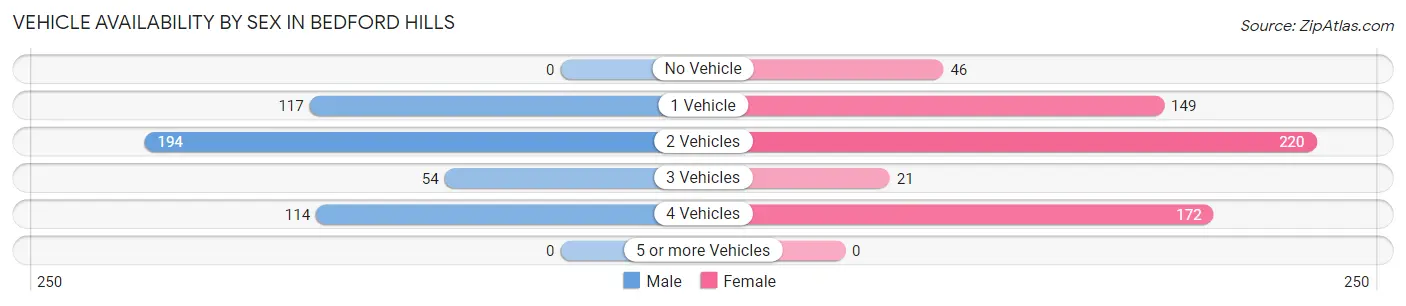
| Vehicles Available | Male | Female |
| No Vehicle | 0 (0.0%) | 46 (7.6%) |
| 1 Vehicle | 117 (24.4%) | 149 (24.5%) |
| 2 Vehicles | 194 (40.5%) | 220 (36.2%) |
| 3 Vehicles | 54 (11.3%) | 21 (3.5%) |
| 4 Vehicles | 114 (23.8%) | 172 (28.3%) |
| 5 or more Vehicles | 0 (0.0%) | 0 (0.0%) |
| Total | 479 (100.0%) | 608 (100.0%) |
Commute Time in Bedford Hills
The most frequently occuring commute durations in Bedford Hills are 10 to 14 minutes (254 commuters, 28.1%), 15 to 19 minutes (196 commuters, 21.7%), and 5 to 9 minutes (144 commuters, 15.9%).
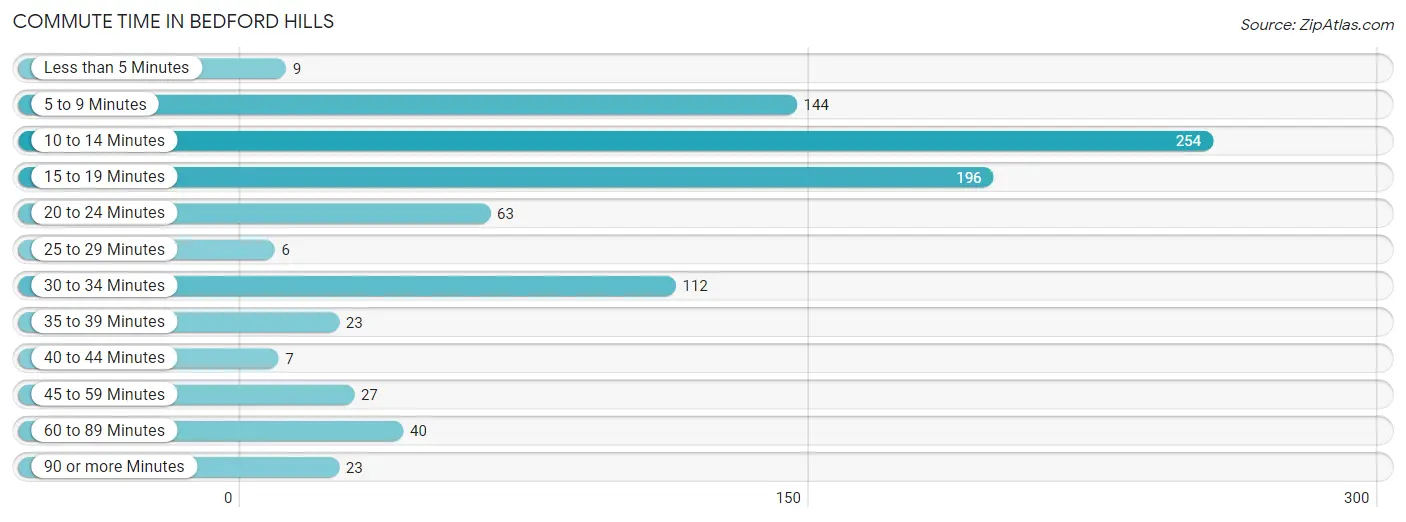
| Commute Time | # Commuters | % Commuters |
| Less than 5 Minutes | 9 | 1.0% |
| 5 to 9 Minutes | 144 | 15.9% |
| 10 to 14 Minutes | 254 | 28.1% |
| 15 to 19 Minutes | 196 | 21.7% |
| 20 to 24 Minutes | 63 | 7.0% |
| 25 to 29 Minutes | 6 | 0.7% |
| 30 to 34 Minutes | 112 | 12.4% |
| 35 to 39 Minutes | 23 | 2.5% |
| 40 to 44 Minutes | 7 | 0.8% |
| 45 to 59 Minutes | 27 | 3.0% |
| 60 to 89 Minutes | 40 | 4.4% |
| 90 or more Minutes | 23 | 2.5% |
Commute Time by Sex in Bedford Hills
The most common commute times in Bedford Hills are 10 to 14 minutes (150 commuters, 39.7%) for males and 5 to 9 minutes (131 commuters, 24.9%) for females.
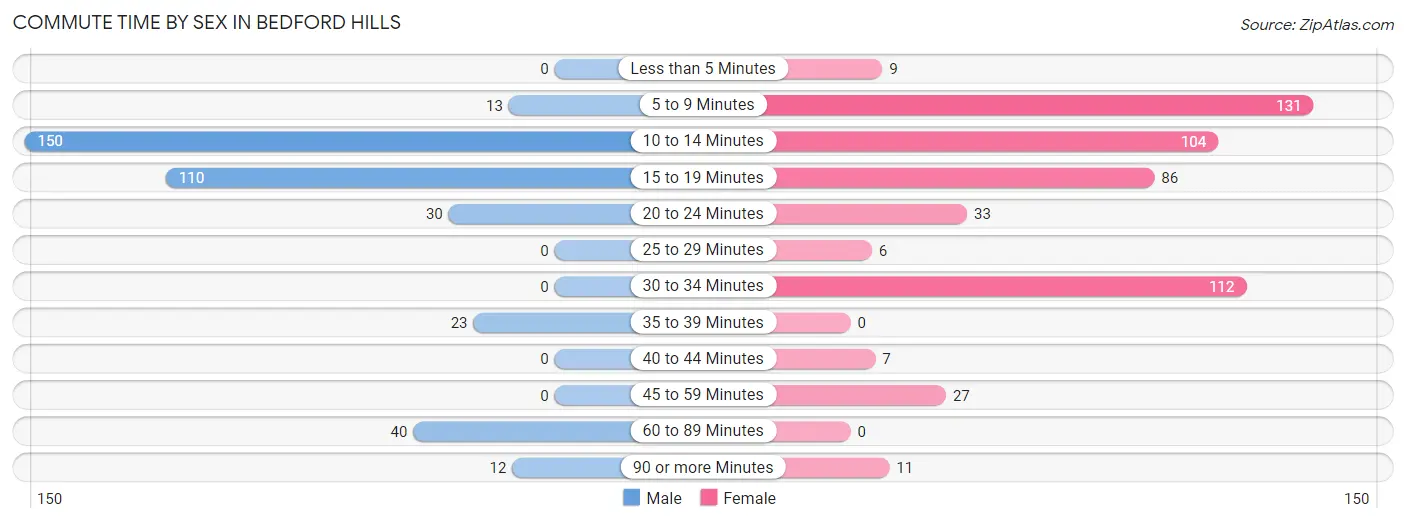
| Commute Time | Male | Female |
| Less than 5 Minutes | 0 (0.0%) | 9 (1.7%) |
| 5 to 9 Minutes | 13 (3.4%) | 131 (24.9%) |
| 10 to 14 Minutes | 150 (39.7%) | 104 (19.8%) |
| 15 to 19 Minutes | 110 (29.1%) | 86 (16.4%) |
| 20 to 24 Minutes | 30 (7.9%) | 33 (6.3%) |
| 25 to 29 Minutes | 0 (0.0%) | 6 (1.1%) |
| 30 to 34 Minutes | 0 (0.0%) | 112 (21.3%) |
| 35 to 39 Minutes | 23 (6.1%) | 0 (0.0%) |
| 40 to 44 Minutes | 0 (0.0%) | 7 (1.3%) |
| 45 to 59 Minutes | 0 (0.0%) | 27 (5.1%) |
| 60 to 89 Minutes | 40 (10.6%) | 0 (0.0%) |
| 90 or more Minutes | 12 (3.2%) | 11 (2.1%) |
Time of Departure to Work by Sex in Bedford Hills
The most frequent times of departure to work in Bedford Hills are 7:30 AM to 7:59 AM (105, 27.8%) for males and 8:30 AM to 8:59 AM (270, 51.3%) for females.
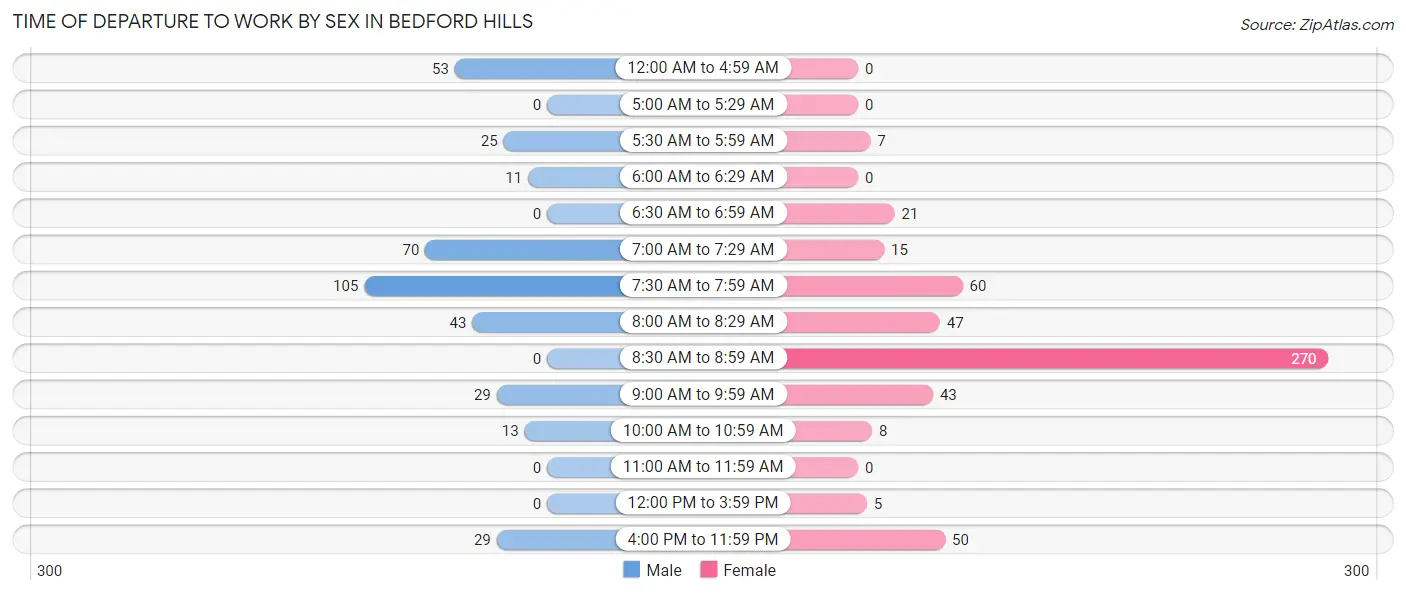
| Time of Departure | Male | Female |
| 12:00 AM to 4:59 AM | 53 (14.0%) | 0 (0.0%) |
| 5:00 AM to 5:29 AM | 0 (0.0%) | 0 (0.0%) |
| 5:30 AM to 5:59 AM | 25 (6.6%) | 7 (1.3%) |
| 6:00 AM to 6:29 AM | 11 (2.9%) | 0 (0.0%) |
| 6:30 AM to 6:59 AM | 0 (0.0%) | 21 (4.0%) |
| 7:00 AM to 7:29 AM | 70 (18.5%) | 15 (2.9%) |
| 7:30 AM to 7:59 AM | 105 (27.8%) | 60 (11.4%) |
| 8:00 AM to 8:29 AM | 43 (11.4%) | 47 (8.9%) |
| 8:30 AM to 8:59 AM | 0 (0.0%) | 270 (51.3%) |
| 9:00 AM to 9:59 AM | 29 (7.7%) | 43 (8.2%) |
| 10:00 AM to 10:59 AM | 13 (3.4%) | 8 (1.5%) |
| 11:00 AM to 11:59 AM | 0 (0.0%) | 0 (0.0%) |
| 12:00 PM to 3:59 PM | 0 (0.0%) | 5 (0.9%) |
| 4:00 PM to 11:59 PM | 29 (7.7%) | 50 (9.5%) |
| Total | 378 (100.0%) | 526 (100.0%) |
Housing Occupancy in Bedford Hills
Occupancy by Ownership in Bedford Hills
Of the total 962 dwellings in Bedford Hills, owner-occupied units account for 478 (49.7%), while renter-occupied units make up 484 (50.3%).
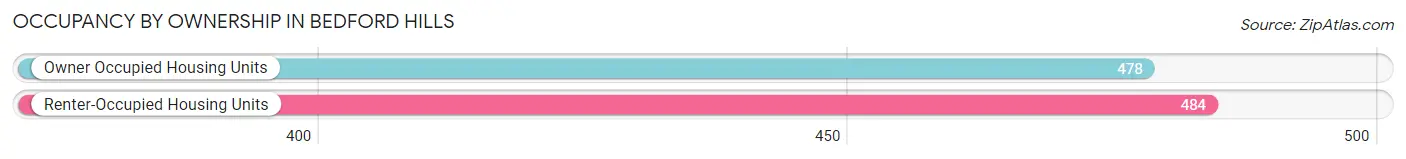
| Occupancy | # Housing Units | % Housing Units |
| Owner Occupied Housing Units | 478 | 49.7% |
| Renter-Occupied Housing Units | 484 | 50.3% |
| Total Occupied Housing Units | 962 | 100.0% |
Occupancy by Household Size in Bedford Hills
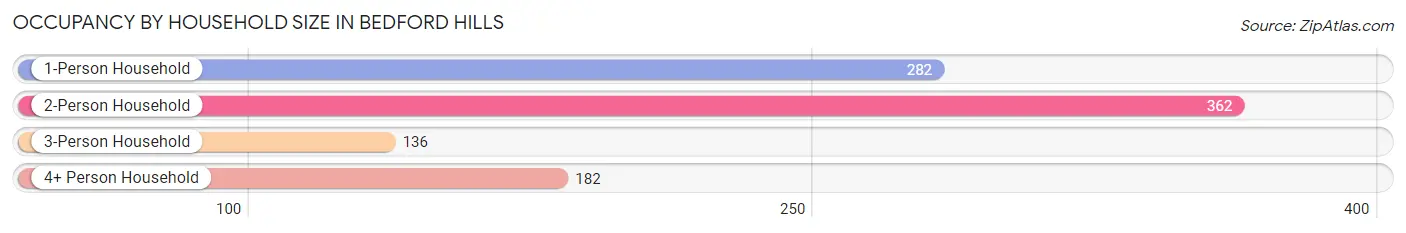
| Household Size | # Housing Units | % Housing Units |
| 1-Person Household | 282 | 29.3% |
| 2-Person Household | 362 | 37.6% |
| 3-Person Household | 136 | 14.1% |
| 4+ Person Household | 182 | 18.9% |
| Total Housing Units | 962 | 100.0% |
Occupancy by Ownership by Household Size in Bedford Hills
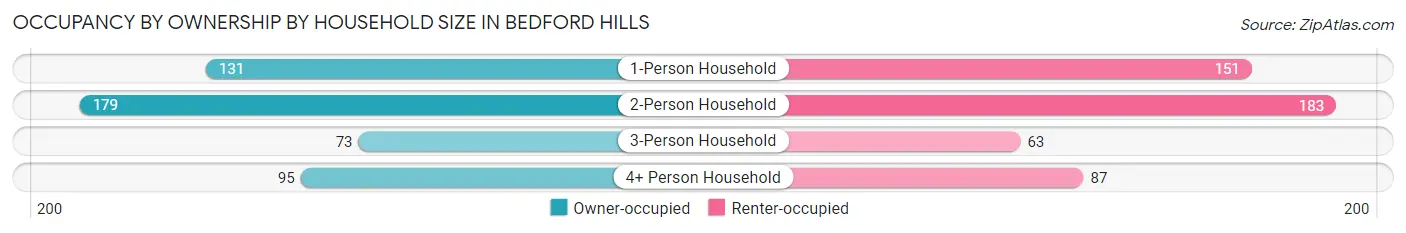
| Household Size | Owner-occupied | Renter-occupied |
| 1-Person Household | 131 (46.5%) | 151 (53.5%) |
| 2-Person Household | 179 (49.4%) | 183 (50.5%) |
| 3-Person Household | 73 (53.7%) | 63 (46.3%) |
| 4+ Person Household | 95 (52.2%) | 87 (47.8%) |
| Total Housing Units | 478 (49.7%) | 484 (50.3%) |
Occupancy by Educational Attainment in Bedford Hills
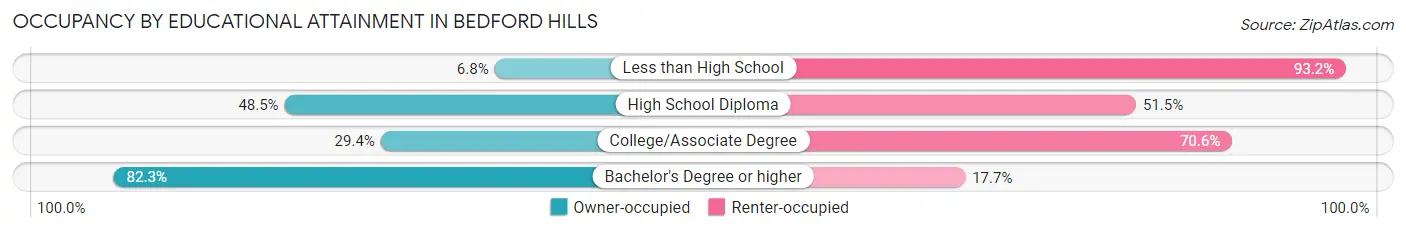
| Household Size | Owner-occupied | Renter-occupied |
| Less than High School | 13 (6.8%) | 177 (93.2%) |
| High School Diploma | 64 (48.5%) | 68 (51.5%) |
| College/Associate Degree | 70 (29.4%) | 168 (70.6%) |
| Bachelor's Degree or higher | 331 (82.3%) | 71 (17.7%) |
Occupancy by Age of Householder in Bedford Hills
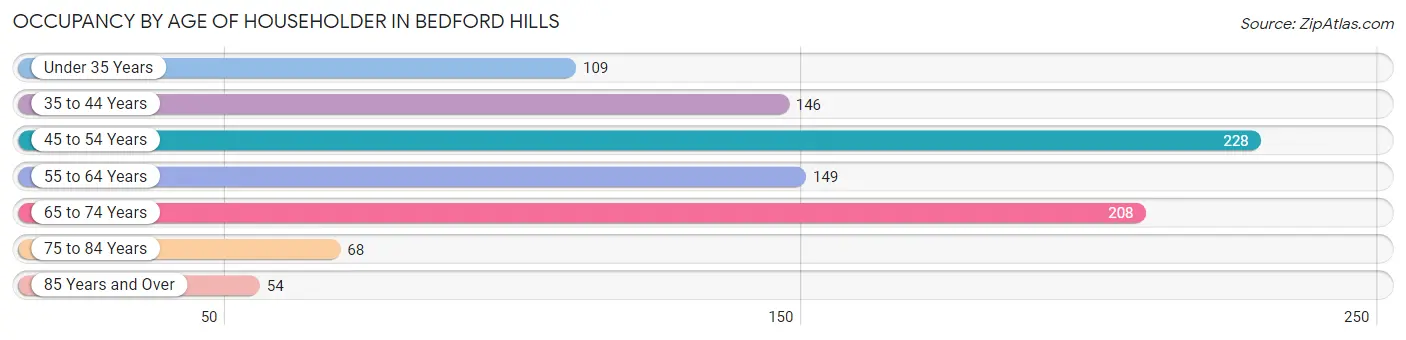
| Age Bracket | # Households | % Households |
| Under 35 Years | 109 | 11.3% |
| 35 to 44 Years | 146 | 15.2% |
| 45 to 54 Years | 228 | 23.7% |
| 55 to 64 Years | 149 | 15.5% |
| 65 to 74 Years | 208 | 21.6% |
| 75 to 84 Years | 68 | 7.1% |
| 85 Years and Over | 54 | 5.6% |
| Total | 962 | 100.0% |
Housing Finances in Bedford Hills
Median Income by Occupancy in Bedford Hills
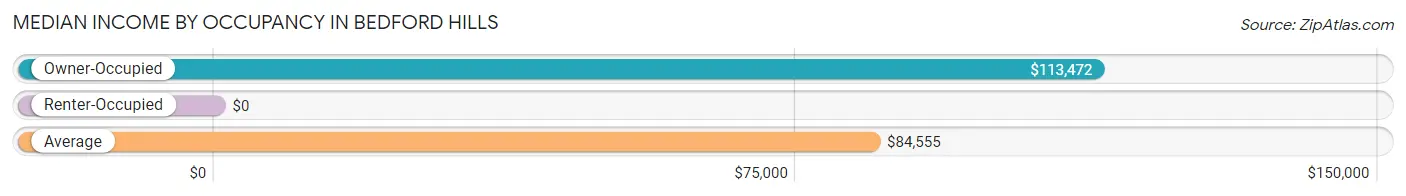
| Occupancy Type | # Households | Median Income |
| Owner-Occupied | 478 (49.7%) | $113,472 |
| Renter-Occupied | 484 (50.3%) | $0 |
| Average | 962 (100.0%) | $84,555 |
Occupancy by Householder Income Bracket in Bedford Hills
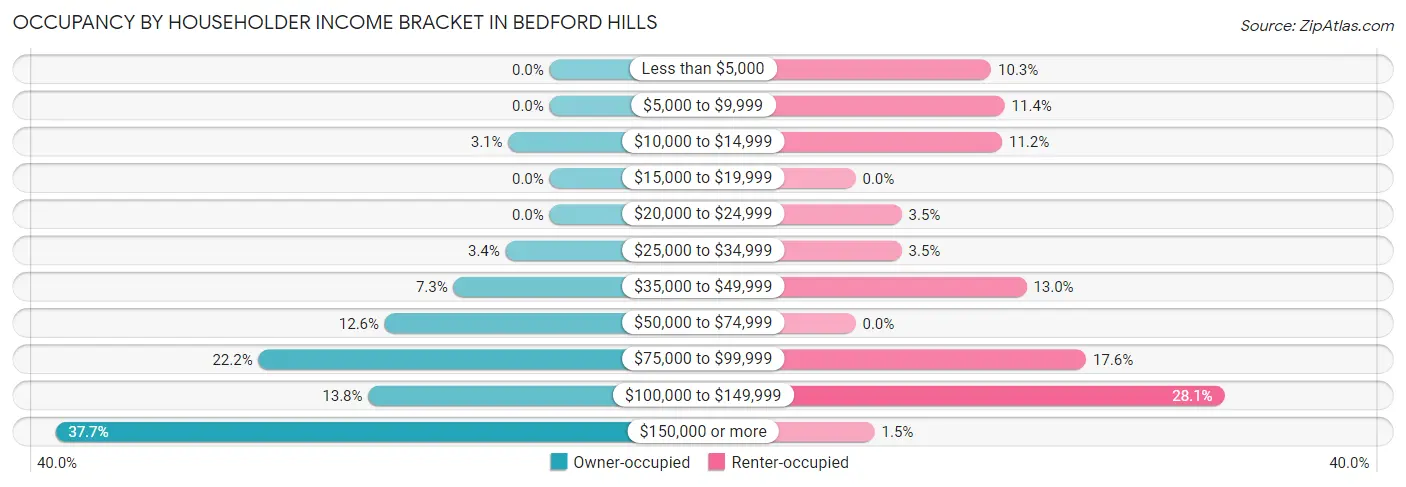
| Income Bracket | Owner-occupied | Renter-occupied |
| Less than $5,000 | 0 (0.0%) | 50 (10.3%) |
| $5,000 to $9,999 | 0 (0.0%) | 55 (11.4%) |
| $10,000 to $14,999 | 15 (3.1%) | 54 (11.2%) |
| $15,000 to $19,999 | 0 (0.0%) | 0 (0.0%) |
| $20,000 to $24,999 | 0 (0.0%) | 17 (3.5%) |
| $25,000 to $34,999 | 16 (3.4%) | 17 (3.5%) |
| $35,000 to $49,999 | 35 (7.3%) | 63 (13.0%) |
| $50,000 to $74,999 | 60 (12.6%) | 0 (0.0%) |
| $75,000 to $99,999 | 106 (22.2%) | 85 (17.6%) |
| $100,000 to $149,999 | 66 (13.8%) | 136 (28.1%) |
| $150,000 or more | 180 (37.7%) | 7 (1.5%) |
| Total | 478 (100.0%) | 484 (100.0%) |
Monthly Housing Cost Tiers in Bedford Hills
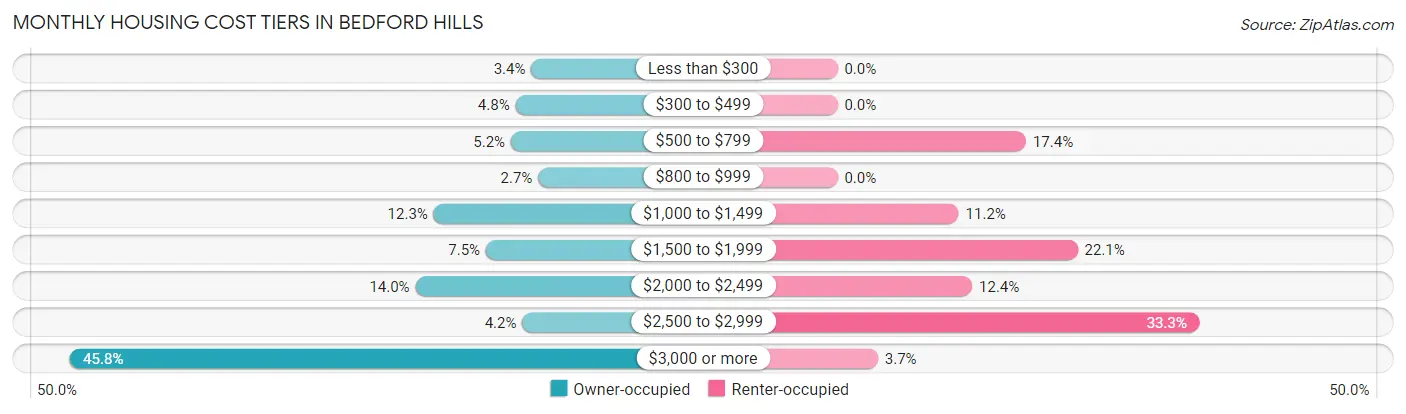
| Monthly Cost | Owner-occupied | Renter-occupied |
| Less than $300 | 16 (3.4%) | 0 (0.0%) |
| $300 to $499 | 23 (4.8%) | 0 (0.0%) |
| $500 to $799 | 25 (5.2%) | 84 (17.4%) |
| $800 to $999 | 13 (2.7%) | 0 (0.0%) |
| $1,000 to $1,499 | 59 (12.3%) | 54 (11.2%) |
| $1,500 to $1,999 | 36 (7.5%) | 107 (22.1%) |
| $2,000 to $2,499 | 67 (14.0%) | 60 (12.4%) |
| $2,500 to $2,999 | 20 (4.2%) | 161 (33.3%) |
| $3,000 or more | 219 (45.8%) | 18 (3.7%) |
| Total | 478 (100.0%) | 484 (100.0%) |
Physical Housing Characteristics in Bedford Hills
Housing Structures in Bedford Hills
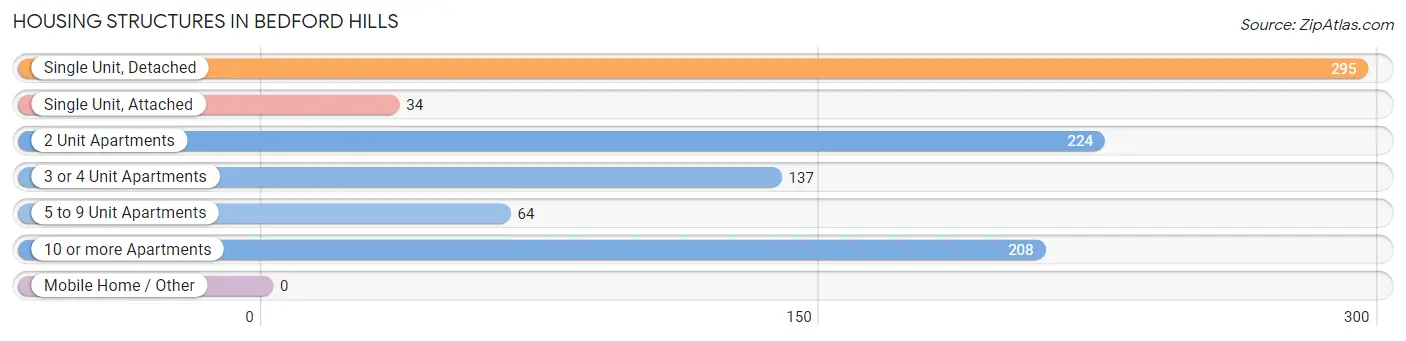
| Structure Type | # Housing Units | % Housing Units |
| Single Unit, Detached | 295 | 30.7% |
| Single Unit, Attached | 34 | 3.5% |
| 2 Unit Apartments | 224 | 23.3% |
| 3 or 4 Unit Apartments | 137 | 14.2% |
| 5 to 9 Unit Apartments | 64 | 6.7% |
| 10 or more Apartments | 208 | 21.6% |
| Mobile Home / Other | 0 | 0.0% |
| Total | 962 | 100.0% |
Housing Structures by Occupancy in Bedford Hills
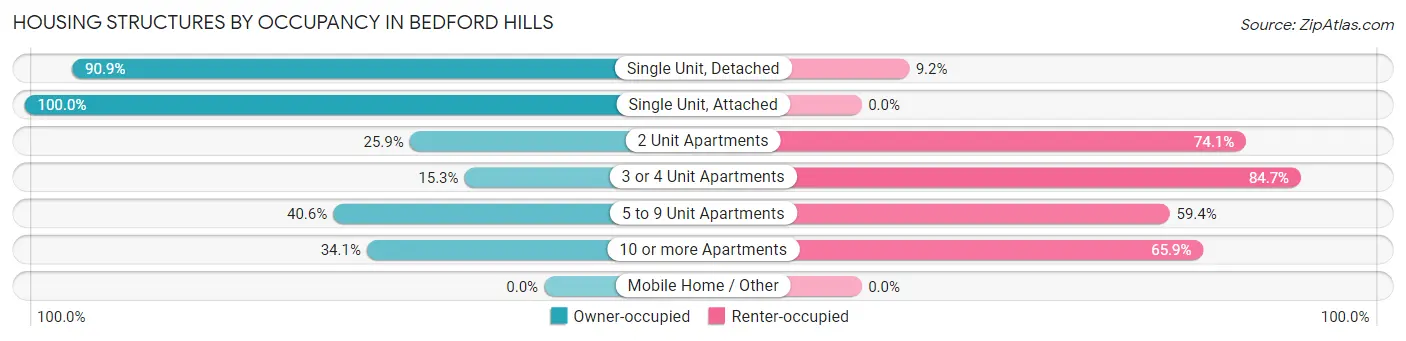
| Structure Type | Owner-occupied | Renter-occupied |
| Single Unit, Detached | 268 (90.8%) | 27 (9.1%) |
| Single Unit, Attached | 34 (100.0%) | 0 (0.0%) |
| 2 Unit Apartments | 58 (25.9%) | 166 (74.1%) |
| 3 or 4 Unit Apartments | 21 (15.3%) | 116 (84.7%) |
| 5 to 9 Unit Apartments | 26 (40.6%) | 38 (59.4%) |
| 10 or more Apartments | 71 (34.1%) | 137 (65.9%) |
| Mobile Home / Other | 0 (0.0%) | 0 (0.0%) |
| Total | 478 (49.7%) | 484 (50.3%) |
Housing Structures by Number of Rooms in Bedford Hills
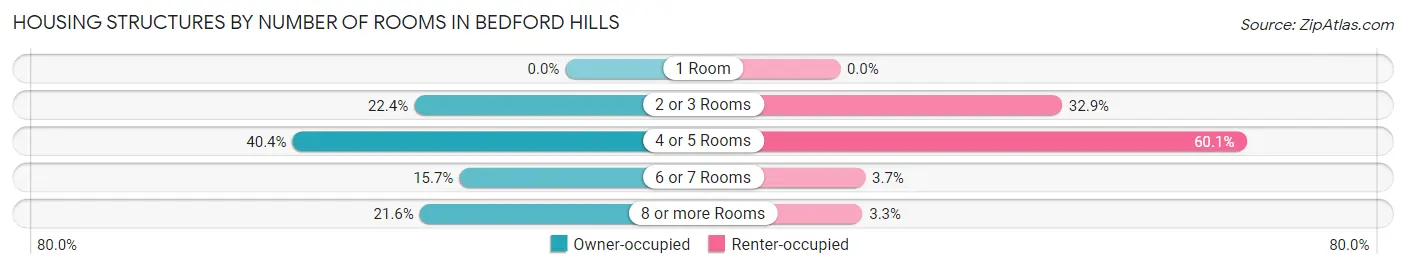
| Number of Rooms | Owner-occupied | Renter-occupied |
| 1 Room | 0 (0.0%) | 0 (0.0%) |
| 2 or 3 Rooms | 107 (22.4%) | 159 (32.9%) |
| 4 or 5 Rooms | 193 (40.4%) | 291 (60.1%) |
| 6 or 7 Rooms | 75 (15.7%) | 18 (3.7%) |
| 8 or more Rooms | 103 (21.5%) | 16 (3.3%) |
| Total | 478 (100.0%) | 484 (100.0%) |
Housing Structure by Heating Type in Bedford Hills
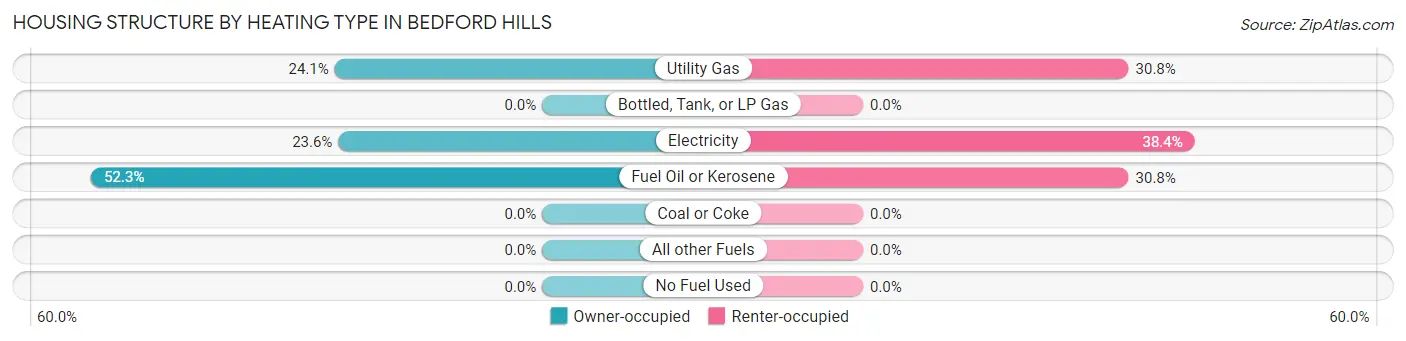
| Heating Type | Owner-occupied | Renter-occupied |
| Utility Gas | 115 (24.1%) | 149 (30.8%) |
| Bottled, Tank, or LP Gas | 0 (0.0%) | 0 (0.0%) |
| Electricity | 113 (23.6%) | 186 (38.4%) |
| Fuel Oil or Kerosene | 250 (52.3%) | 149 (30.8%) |
| Coal or Coke | 0 (0.0%) | 0 (0.0%) |
| All other Fuels | 0 (0.0%) | 0 (0.0%) |
| No Fuel Used | 0 (0.0%) | 0 (0.0%) |
| Total | 478 (100.0%) | 484 (100.0%) |
Household Vehicle Usage in Bedford Hills
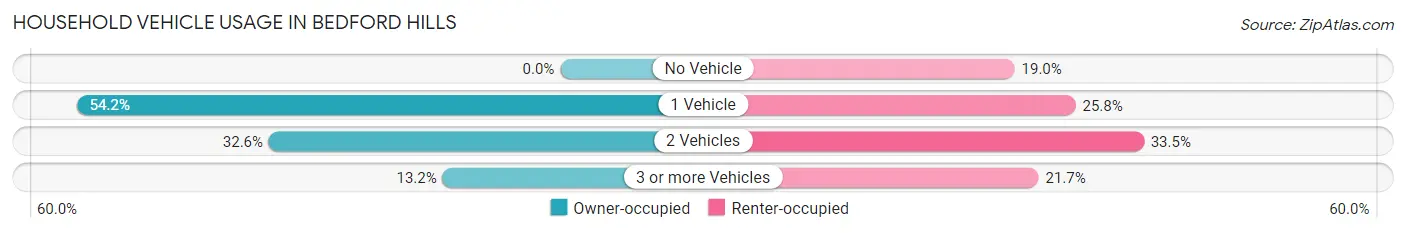
| Vehicles per Household | Owner-occupied | Renter-occupied |
| No Vehicle | 0 (0.0%) | 92 (19.0%) |
| 1 Vehicle | 259 (54.2%) | 125 (25.8%) |
| 2 Vehicles | 156 (32.6%) | 162 (33.5%) |
| 3 or more Vehicles | 63 (13.2%) | 105 (21.7%) |
| Total | 478 (100.0%) | 484 (100.0%) |
Real Estate & Mortgages in Bedford Hills
Real Estate and Mortgage Overview in Bedford Hills
| Characteristic | Without Mortgage | With Mortgage |
| Housing Units | 123 | 355 |
| Median Property Value | $431,500 | $482,700 |
| Median Household Income | $59,323 | $180 |
| Monthly Housing Costs | $1,031 | $213 |
| Real Estate Taxes | $8,992 | $0 |
Property Value by Mortgage Status in Bedford Hills
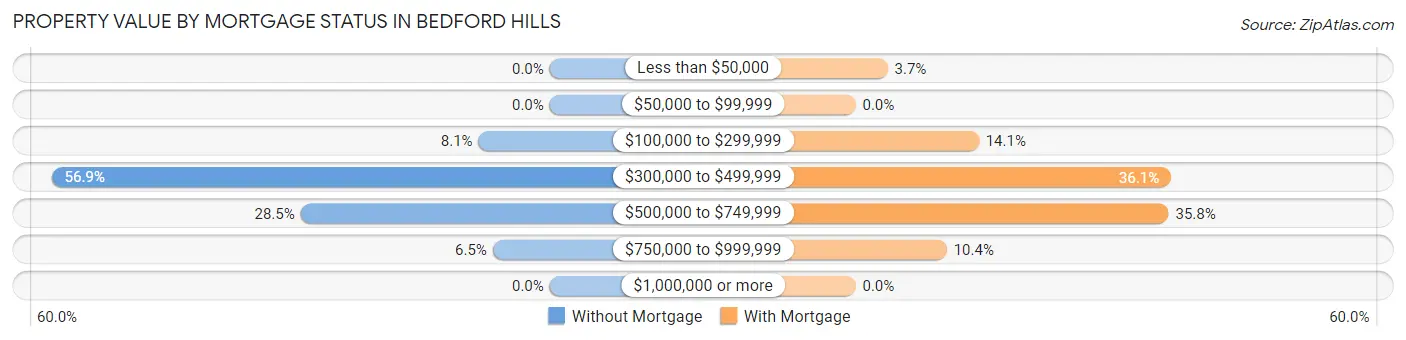
| Property Value | Without Mortgage | With Mortgage |
| Less than $50,000 | 0 (0.0%) | 13 (3.7%) |
| $50,000 to $99,999 | 0 (0.0%) | 0 (0.0%) |
| $100,000 to $299,999 | 10 (8.1%) | 50 (14.1%) |
| $300,000 to $499,999 | 70 (56.9%) | 128 (36.1%) |
| $500,000 to $749,999 | 35 (28.5%) | 127 (35.8%) |
| $750,000 to $999,999 | 8 (6.5%) | 37 (10.4%) |
| $1,000,000 or more | 0 (0.0%) | 0 (0.0%) |
| Total | 123 (100.0%) | 355 (100.0%) |
Household Income by Mortgage Status in Bedford Hills
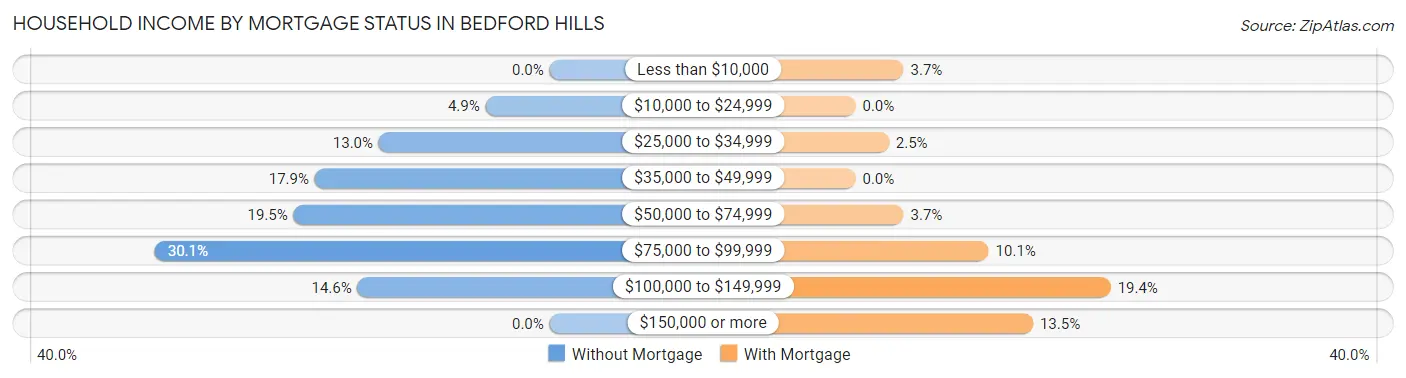
| Household Income | Without Mortgage | With Mortgage |
| Less than $10,000 | 0 (0.0%) | 13 (3.7%) |
| $10,000 to $24,999 | 6 (4.9%) | 0 (0.0%) |
| $25,000 to $34,999 | 16 (13.0%) | 9 (2.5%) |
| $35,000 to $49,999 | 22 (17.9%) | 0 (0.0%) |
| $50,000 to $74,999 | 24 (19.5%) | 13 (3.7%) |
| $75,000 to $99,999 | 37 (30.1%) | 36 (10.1%) |
| $100,000 to $149,999 | 18 (14.6%) | 69 (19.4%) |
| $150,000 or more | 0 (0.0%) | 48 (13.5%) |
| Total | 123 (100.0%) | 355 (100.0%) |
Property Value to Household Income Ratio in Bedford Hills
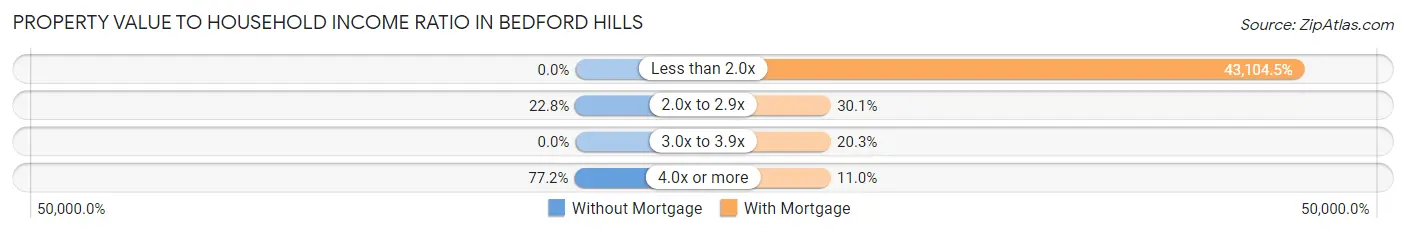
| Value-to-Income Ratio | Without Mortgage | With Mortgage |
| Less than 2.0x | 0 (0.0%) | 153,021 (43,104.5%) |
| 2.0x to 2.9x | 28 (22.8%) | 107 (30.1%) |
| 3.0x to 3.9x | 0 (0.0%) | 72 (20.3%) |
| 4.0x or more | 95 (77.2%) | 39 (11.0%) |
| Total | 123 (100.0%) | 355 (100.0%) |
Real Estate Taxes by Mortgage Status in Bedford Hills
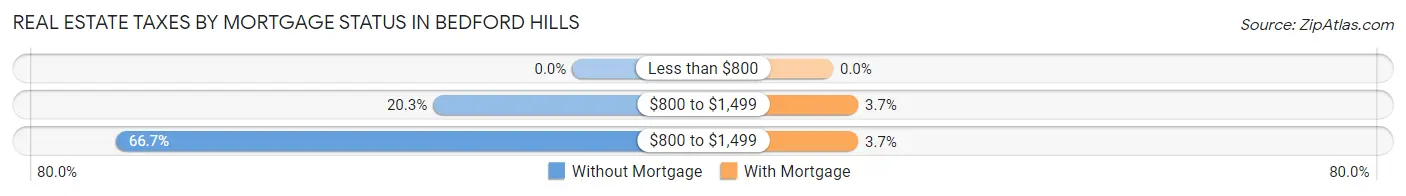
| Property Taxes | Without Mortgage | With Mortgage |
| Less than $800 | 0 (0.0%) | 0 (0.0%) |
| $800 to $1,499 | 25 (20.3%) | 13 (3.7%) |
| $800 to $1,499 | 82 (66.7%) | 13 (3.7%) |
| Total | 123 (100.0%) | 355 (100.0%) |
Health & Disability in Bedford Hills
Health Insurance Coverage by Age in Bedford Hills
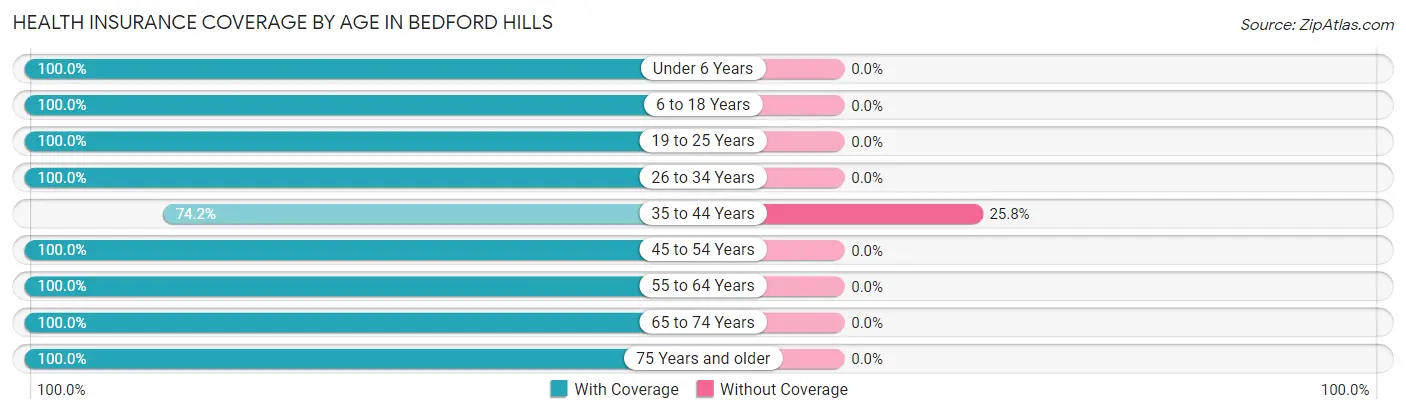
| Age Bracket | With Coverage | Without Coverage |
| Under 6 Years | 104 (100.0%) | 0 (0.0%) |
| 6 to 18 Years | 214 (100.0%) | 0 (0.0%) |
| 19 to 25 Years | 219 (100.0%) | 0 (0.0%) |
| 26 to 34 Years | 216 (100.0%) | 0 (0.0%) |
| 35 to 44 Years | 196 (74.2%) | 68 (25.8%) |
| 45 to 54 Years | 361 (100.0%) | 0 (0.0%) |
| 55 to 64 Years | 230 (100.0%) | 0 (0.0%) |
| 65 to 74 Years | 305 (100.0%) | 0 (0.0%) |
| 75 Years and older | 381 (100.0%) | 0 (0.0%) |
| Total | 2,226 (97.0%) | 68 (3.0%) |
Health Insurance Coverage by Citizenship Status in Bedford Hills
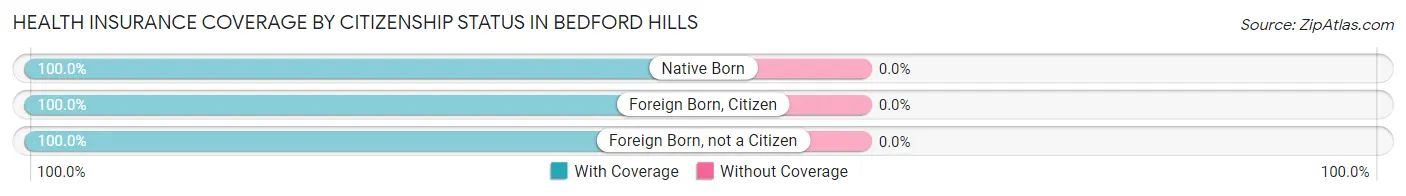
| Citizenship Status | With Coverage | Without Coverage |
| Native Born | 104 (100.0%) | 0 (0.0%) |
| Foreign Born, Citizen | 214 (100.0%) | 0 (0.0%) |
| Foreign Born, not a Citizen | 219 (100.0%) | 0 (0.0%) |
Health Insurance Coverage by Household Income in Bedford Hills
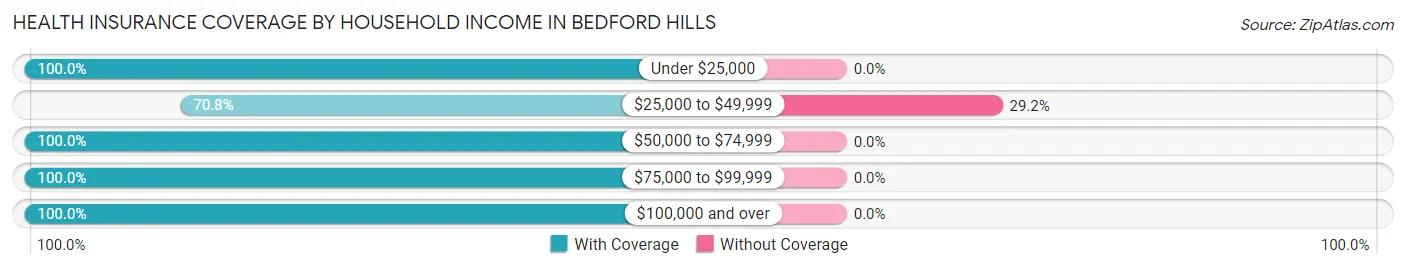
| Household Income | With Coverage | Without Coverage |
| Under $25,000 | 257 (100.0%) | 0 (0.0%) |
| $25,000 to $49,999 | 165 (70.8%) | 68 (29.2%) |
| $50,000 to $74,999 | 85 (100.0%) | 0 (0.0%) |
| $75,000 to $99,999 | 529 (100.0%) | 0 (0.0%) |
| $100,000 and over | 1,190 (100.0%) | 0 (0.0%) |
Public vs Private Health Insurance Coverage by Age in Bedford Hills
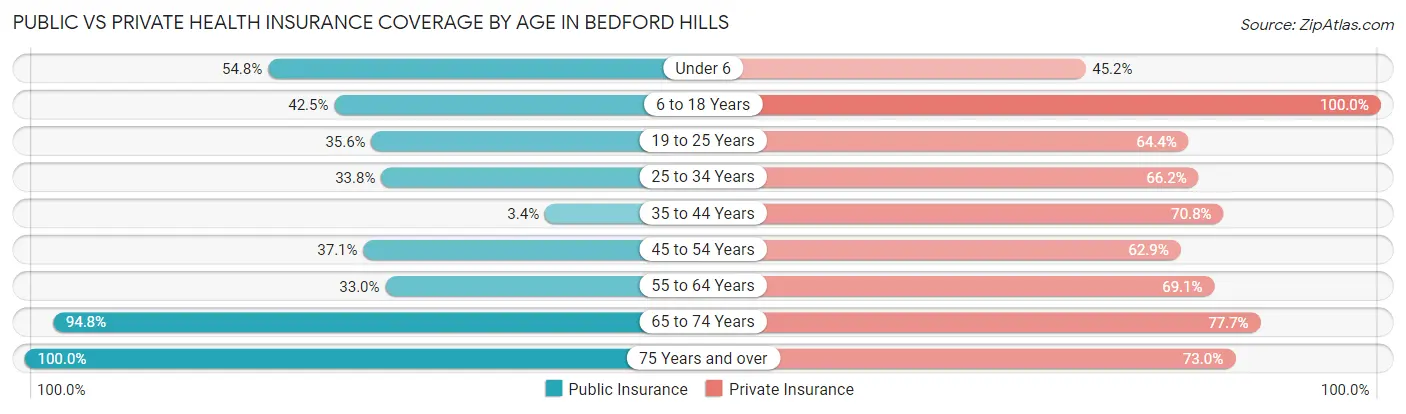
| Age Bracket | Public Insurance | Private Insurance |
| Under 6 | 57 (54.8%) | 47 (45.2%) |
| 6 to 18 Years | 91 (42.5%) | 214 (100.0%) |
| 19 to 25 Years | 78 (35.6%) | 141 (64.4%) |
| 25 to 34 Years | 73 (33.8%) | 143 (66.2%) |
| 35 to 44 Years | 9 (3.4%) | 187 (70.8%) |
| 45 to 54 Years | 134 (37.1%) | 227 (62.9%) |
| 55 to 64 Years | 76 (33.0%) | 159 (69.1%) |
| 65 to 74 Years | 289 (94.8%) | 237 (77.7%) |
| 75 Years and over | 381 (100.0%) | 278 (73.0%) |
| Total | 1,188 (51.8%) | 1,633 (71.2%) |
Disability Status by Sex by Age in Bedford Hills
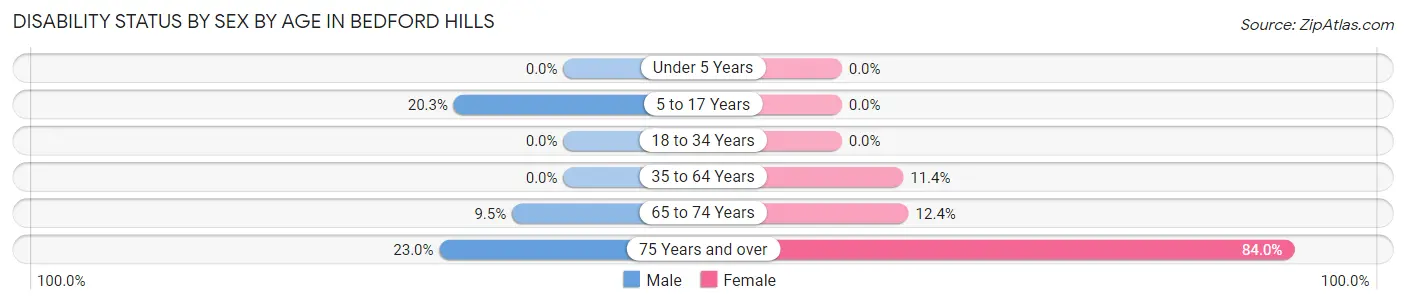
| Age Bracket | Male | Female |
| Under 5 Years | 0 (0.0%) | 0 (0.0%) |
| 5 to 17 Years | 25 (20.3%) | 0 (0.0%) |
| 18 to 34 Years | 0 (0.0%) | 0 (0.0%) |
| 35 to 64 Years | 0 (0.0%) | 59 (11.4%) |
| 65 to 74 Years | 16 (9.5%) | 17 (12.4%) |
| 75 Years and over | 26 (23.0%) | 225 (84.0%) |
Disability Class by Sex by Age in Bedford Hills
Disability Class: Hearing Difficulty
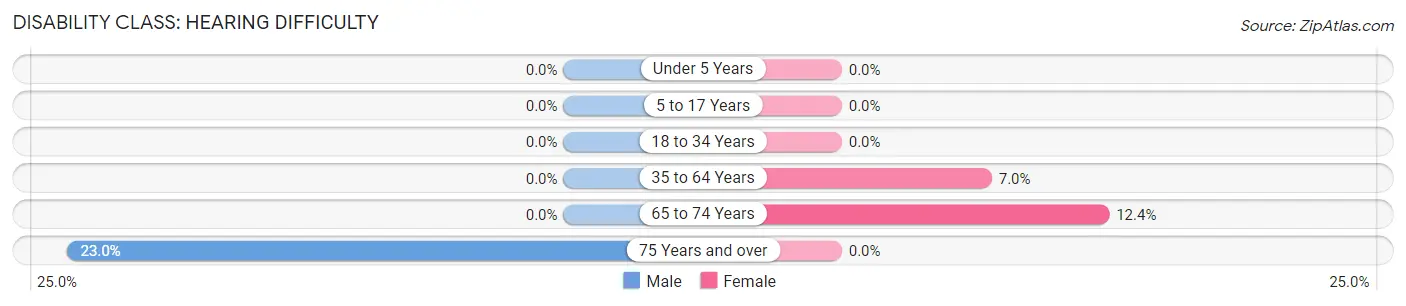
| Age Bracket | Male | Female |
| Under 5 Years | 0 (0.0%) | 0 (0.0%) |
| 5 to 17 Years | 0 (0.0%) | 0 (0.0%) |
| 18 to 34 Years | 0 (0.0%) | 0 (0.0%) |
| 35 to 64 Years | 0 (0.0%) | 36 (7.0%) |
| 65 to 74 Years | 0 (0.0%) | 17 (12.4%) |
| 75 Years and over | 26 (23.0%) | 0 (0.0%) |
Disability Class: Vision Difficulty
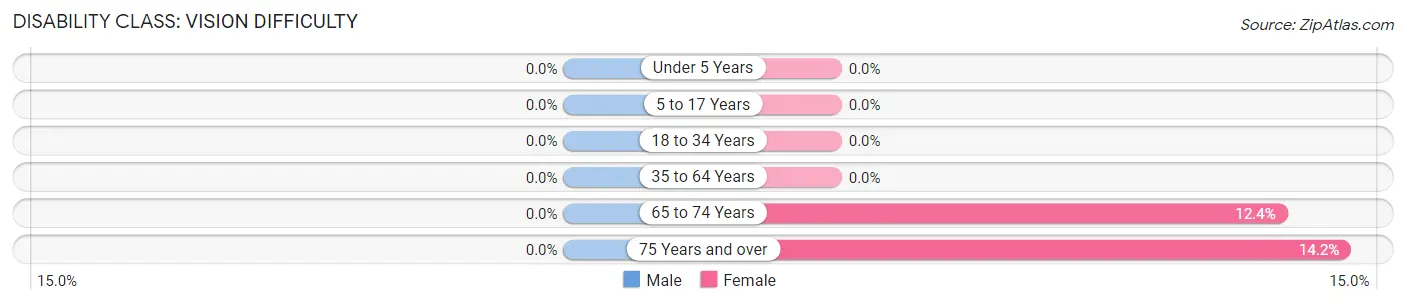
| Age Bracket | Male | Female |
| Under 5 Years | 0 (0.0%) | 0 (0.0%) |
| 5 to 17 Years | 0 (0.0%) | 0 (0.0%) |
| 18 to 34 Years | 0 (0.0%) | 0 (0.0%) |
| 35 to 64 Years | 0 (0.0%) | 0 (0.0%) |
| 65 to 74 Years | 0 (0.0%) | 17 (12.4%) |
| 75 Years and over | 0 (0.0%) | 38 (14.2%) |
Disability Class: Cognitive Difficulty
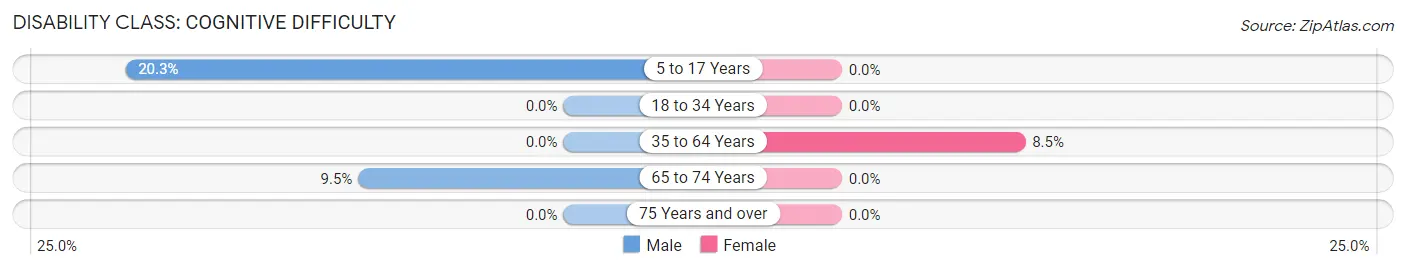
| Age Bracket | Male | Female |
| 5 to 17 Years | 25 (20.3%) | 0 (0.0%) |
| 18 to 34 Years | 0 (0.0%) | 0 (0.0%) |
| 35 to 64 Years | 0 (0.0%) | 44 (8.5%) |
| 65 to 74 Years | 16 (9.5%) | 0 (0.0%) |
| 75 Years and over | 0 (0.0%) | 0 (0.0%) |
Disability Class: Ambulatory Difficulty
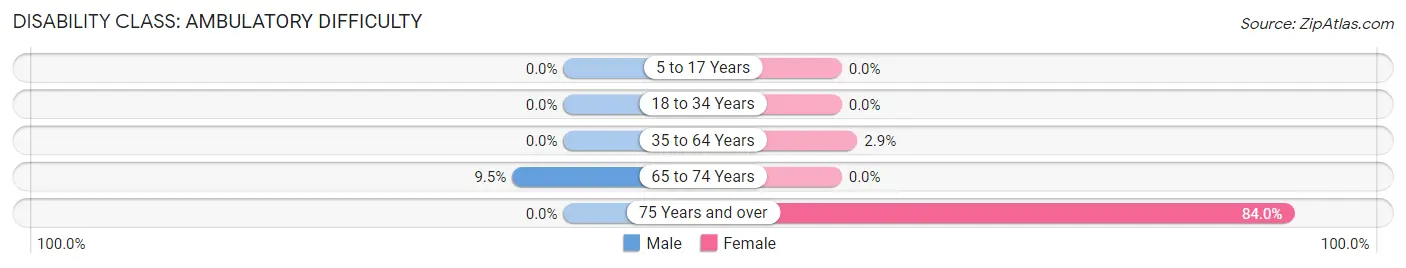
| Age Bracket | Male | Female |
| 5 to 17 Years | 0 (0.0%) | 0 (0.0%) |
| 18 to 34 Years | 0 (0.0%) | 0 (0.0%) |
| 35 to 64 Years | 0 (0.0%) | 15 (2.9%) |
| 65 to 74 Years | 16 (9.5%) | 0 (0.0%) |
| 75 Years and over | 0 (0.0%) | 225 (84.0%) |
Disability Class: Self-Care Difficulty
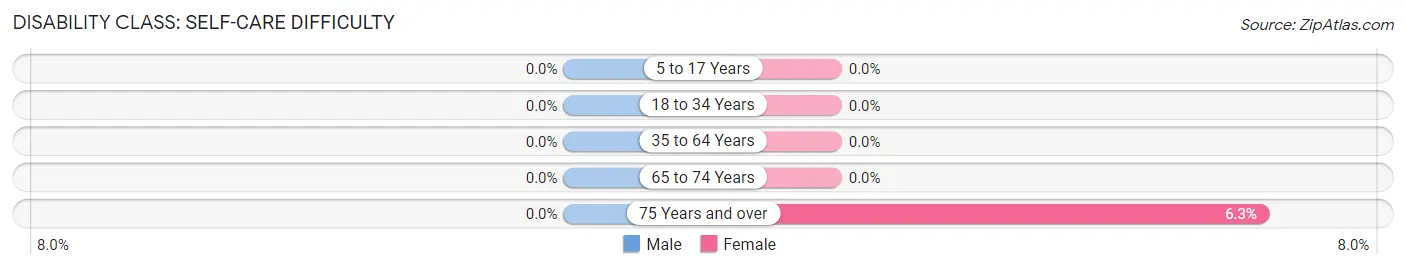
| Age Bracket | Male | Female |
| 5 to 17 Years | 0 (0.0%) | 0 (0.0%) |
| 18 to 34 Years | 0 (0.0%) | 0 (0.0%) |
| 35 to 64 Years | 0 (0.0%) | 0 (0.0%) |
| 65 to 74 Years | 0 (0.0%) | 0 (0.0%) |
| 75 Years and over | 0 (0.0%) | 17 (6.3%) |
Technology Access in Bedford Hills
Computing Device Access in Bedford Hills
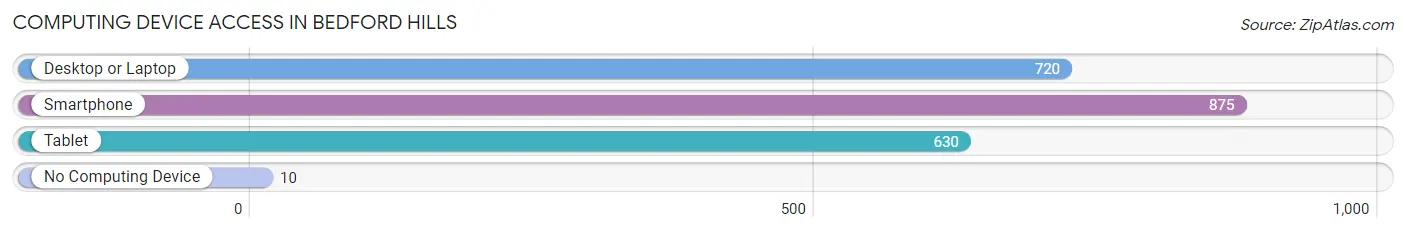
| Device Type | # Households | % Households |
| Desktop or Laptop | 720 | 74.8% |
| Smartphone | 875 | 91.0% |
| Tablet | 630 | 65.5% |
| No Computing Device | 10 | 1.0% |
| Total | 962 | 100.0% |
Internet Access in Bedford Hills
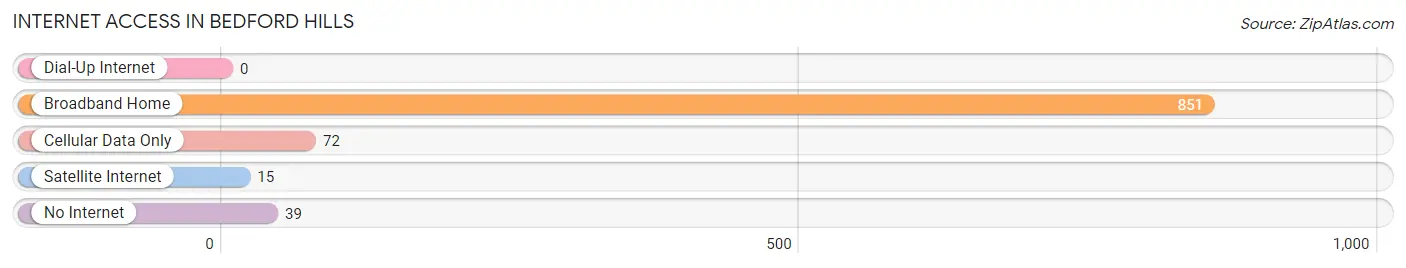
| Internet Type | # Households | % Households |
| Dial-Up Internet | 0 | 0.0% |
| Broadband Home | 851 | 88.5% |
| Cellular Data Only | 72 | 7.5% |
| Satellite Internet | 15 | 1.6% |
| No Internet | 39 | 4.1% |
| Total | 962 | 100.0% |
Bedford Hills Summary
Bedford Hills is a hamlet located in the town of Bedford, in Westchester County, New York. It is located about 40 miles north of New York City and is part of the New York metropolitan area. The hamlet has a population of about 3,000 people and is known for its rural charm and proximity to the city.
Geography
Bedford Hills is located in the town of Bedford, in Westchester County, New York. It is located about 40 miles north of New York City and is part of the New York metropolitan area. The hamlet is situated in the northern part of the town, near the border with the town of Pound Ridge. The hamlet is bordered to the north by the hamlet of Bedford, to the east by the hamlet of Katonah, to the south by the hamlet of Mount Kisco, and to the west by the town of Pound Ridge. The hamlet is located in the Croton River watershed and is surrounded by hills and forests.
History
The area that is now Bedford Hills was originally inhabited by the Wappinger Native American tribe. The first European settlers arrived in the area in the late 17th century. The hamlet was originally known as Bedford Corners and was part of the town of Bedford. In 1845, the hamlet was renamed Bedford Hills. The hamlet was primarily an agricultural community until the late 19th century, when it began to develop into a residential community. The hamlet was served by the New York and Harlem Railroad, which provided access to New York City. The hamlet continued to grow in the early 20th century, and in the 1950s, the hamlet was incorporated into the town of Bedford.
Economy
The economy of Bedford Hills is primarily based on services and retail. The hamlet is home to several small businesses, including restaurants, shops, and professional services. The hamlet is also home to several corporate offices, including those of IBM, PepsiCo, and Verizon. The hamlet is also home to the Bedford Hills Correctional Facility, which is a medium-security prison for women.
Demographics
As of the 2010 census, the population of Bedford Hills was 3,001. The racial makeup of the hamlet was 87.3% White, 5.2% African American, 0.3% Native American, 3.2% Asian, 0.1% Pacific Islander, and 3.9% from other races. The median household income was $90,945, and the median family income was $106,945. The per capita income was $41,945.
Conclusion
Bedford Hills is a hamlet located in the town of Bedford, in Westchester County, New York. It is located about 40 miles north of New York City and is part of the New York metropolitan area. The hamlet has a population of about 3,000 people and is known for its rural charm and proximity to the city. The economy of Bedford Hills is primarily based on services and retail, and the hamlet is home to several small businesses, corporate offices, and the Bedford Hills Correctional Facility. The population of Bedford Hills is predominantly White, with a median household income of $90,945 and a median family income of $106,945.
Common Questions
What is Per Capita Income in Bedford Hills?
Per Capita income in Bedford Hills is $46,040.
What is the Median Family Income in Bedford Hills?
Median Family Income in Bedford Hills is $101,350.
What is the Median Household income in Bedford Hills?
Median Household Income in Bedford Hills is $84,555.
What is Inequality or Gini Index in Bedford Hills?
Inequality or Gini Index in Bedford Hills is 0.49.
What is the Total Population of Bedford Hills?
Total Population of Bedford Hills is 2,304.
What is the Total Male Population of Bedford Hills?
Total Male Population of Bedford Hills is 1,058.
What is the Total Female Population of Bedford Hills?
Total Female Population of Bedford Hills is 1,246.
What is the Ratio of Males per 100 Females in Bedford Hills?
There are 84.91 Males per 100 Females in Bedford Hills.
What is the Ratio of Females per 100 Males in Bedford Hills?
There are 117.77 Females per 100 Males in Bedford Hills.
What is the Median Population Age in Bedford Hills?
Median Population Age in Bedford Hills is 51.2 Years.
What is the Average Family Size in Bedford Hills
Average Family Size in Bedford Hills is 3.0 People.
What is the Average Household Size in Bedford Hills
Average Household Size in Bedford Hills is 2.4 People.
How Large is the Labor Force in Bedford Hills?
There are 1,217 People in the Labor Forcein in Bedford Hills.
What is the Percentage of People in the Labor Force in Bedford Hills?
61.3% of People are in the Labor Force in Bedford Hills.
What is the Unemployment Rate in Bedford Hills?
Unemployment Rate in Bedford Hills is 6.7%.