Plandome, NY Map & Demographics
Plandome Map
Plandome Overview
$169,729
PER CAPITA INCOME
$250,001
AVG FAMILY INCOME
$250,001
AVG HOUSEHOLD INCOME
72.2%
WAGE / INCOME GAP [ % ]
27.8¢/ $1
WAGE / INCOME GAP [ $ ]
0.48
INEQUALITY / GINI INDEX
1,365
TOTAL POPULATION
608
MALE POPULATION
757
FEMALE POPULATION
80.32
MALES / 100 FEMALES
124.51
FEMALES / 100 MALES
44.3
MEDIAN AGE
3.5
AVG FAMILY SIZE
3.2
AVG HOUSEHOLD SIZE
579
LABOR FORCE [ PEOPLE ]
59.2%
PERCENT IN LABOR FORCE
2.4%
UNEMPLOYMENT RATE
Plandome Area Codes
Income in Plandome
Income Overview in Plandome
Per Capita Income in Plandome is $169,729, while median incomes of families and households are $250,001 and $250,001 respectively.
| Characteristic | Number | Measure |
| Per Capita Income | 1,365 | $169,729 |
| Median Family Income | 375 | $250,001 |
| Mean Family Income | 375 | $579,879 |
| Median Household Income | 424 | $250,001 |
| Mean Household Income | 424 | $524,991 |
| Income Deficit | 375 | $0 |
| Wage / Income Gap (%) | 1,365 | 72.24% |
| Wage / Income Gap ($) | 1,365 | 27.76¢ per $1 |
| Gini / Inequality Index | 1,365 | 0.48 |
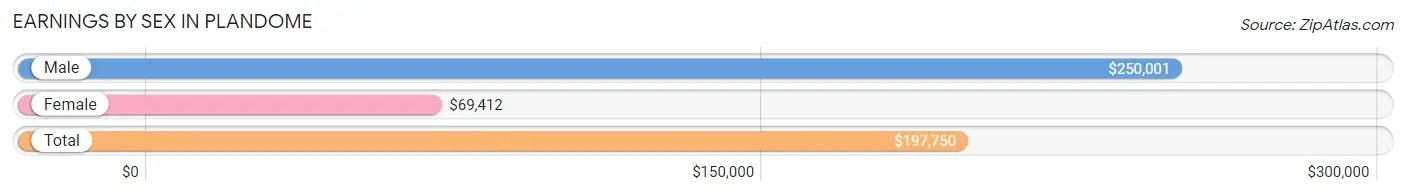
Earnings by Sex in Plandome
Average Earnings in Plandome are $197,750, $250,001 for men and $69,412 for women, a difference of 72.2%.
| Sex | Number | Average Earnings |
| Male | 355 (56.8%) | $250,001 |
| Female | 270 (43.2%) | $69,412 |
| Total | 625 (100.0%) | $197,750 |
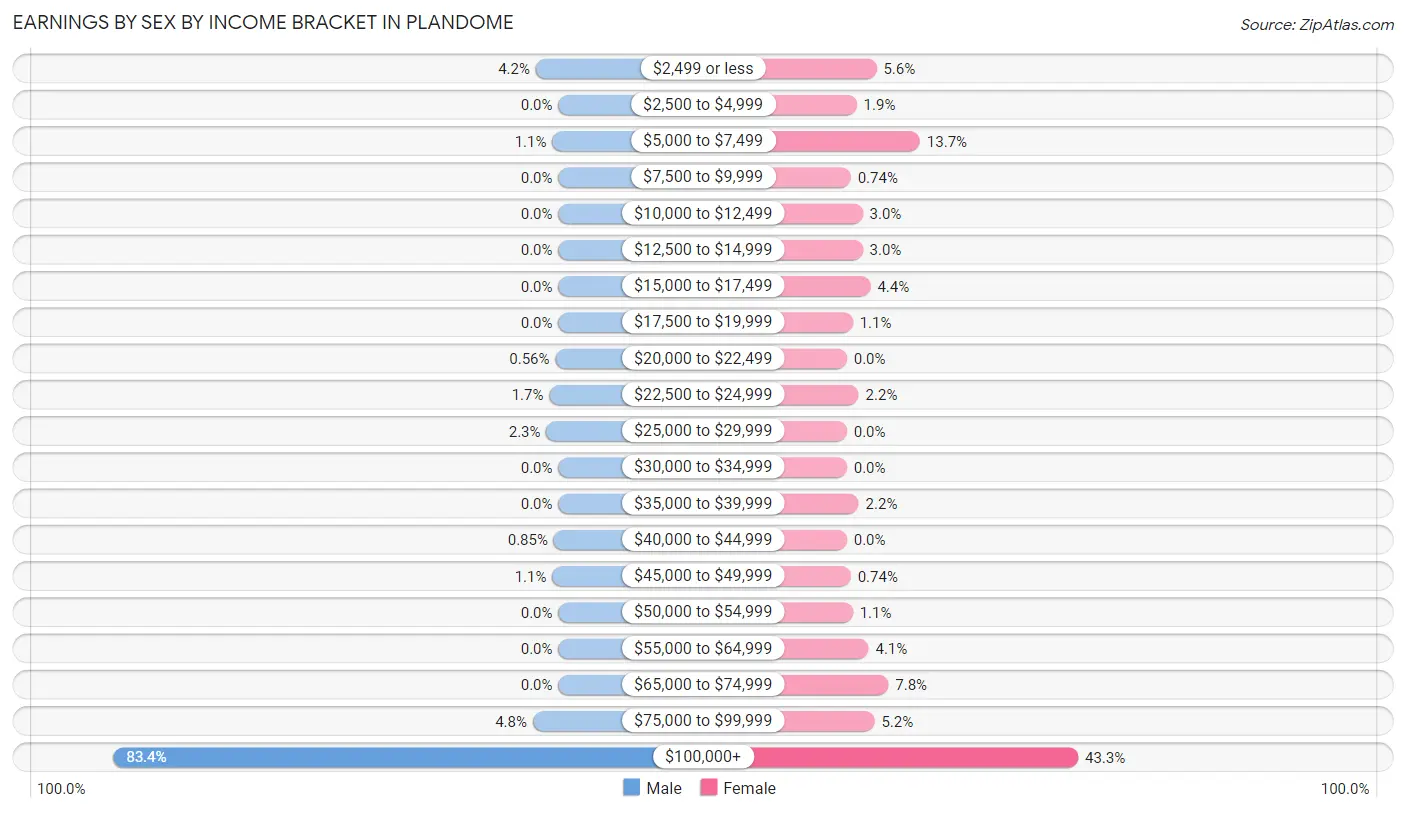
Earnings by Sex by Income Bracket in Plandome
The most common earnings brackets in Plandome are $100,000+ for men (296 | 83.4%) and $100,000+ for women (117 | 43.3%).
| Income | Male | Female |
| $2,499 or less | 15 (4.2%) | 15 (5.6%) |
| $2,500 to $4,999 | 0 (0.0%) | 5 (1.8%) |
| $5,000 to $7,499 | 4 (1.1%) | 37 (13.7%) |
| $7,500 to $9,999 | 0 (0.0%) | 2 (0.7%) |
| $10,000 to $12,499 | 0 (0.0%) | 8 (3.0%) |
| $12,500 to $14,999 | 0 (0.0%) | 8 (3.0%) |
| $15,000 to $17,499 | 0 (0.0%) | 12 (4.4%) |
| $17,500 to $19,999 | 0 (0.0%) | 3 (1.1%) |
| $20,000 to $22,499 | 2 (0.6%) | 0 (0.0%) |
| $22,500 to $24,999 | 6 (1.7%) | 6 (2.2%) |
| $25,000 to $29,999 | 8 (2.2%) | 0 (0.0%) |
| $30,000 to $34,999 | 0 (0.0%) | 0 (0.0%) |
| $35,000 to $39,999 | 0 (0.0%) | 6 (2.2%) |
| $40,000 to $44,999 | 3 (0.9%) | 0 (0.0%) |
| $45,000 to $49,999 | 4 (1.1%) | 2 (0.7%) |
| $50,000 to $54,999 | 0 (0.0%) | 3 (1.1%) |
| $55,000 to $64,999 | 0 (0.0%) | 11 (4.1%) |
| $65,000 to $74,999 | 0 (0.0%) | 21 (7.8%) |
| $75,000 to $99,999 | 17 (4.8%) | 14 (5.2%) |
| $100,000+ | 296 (83.4%) | 117 (43.3%) |
| Total | 355 (100.0%) | 270 (100.0%) |
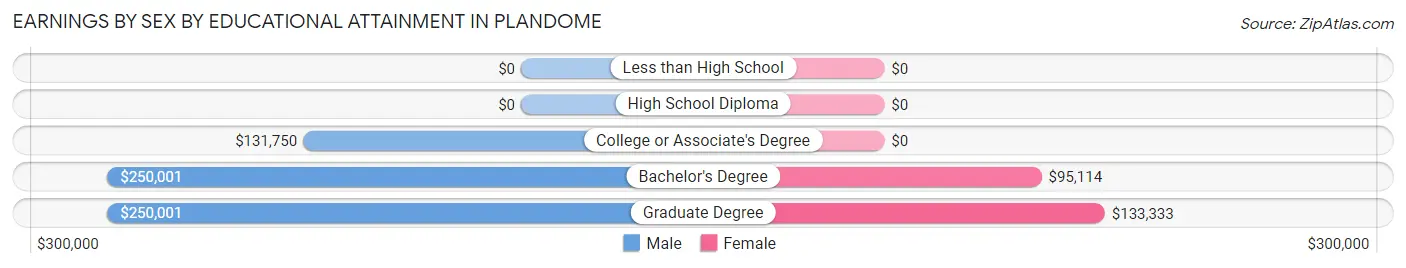
Earnings by Sex by Educational Attainment in Plandome
Average earnings in Plandome are $250,001 for men and $101,750 for women, a difference of 59.3%. Men with an educational attainment of bachelor's degree enjoy the highest average annual earnings of $250,001, while those with college or associate's degree education earn the least with $131,750. Women with an educational attainment of graduate degree earn the most with the average annual earnings of $133,333, while those with bachelor's degree education have the smallest earnings of $95,114.
| Educational Attainment | Male Income | Female Income |
| Less than High School | - | - |
| High School Diploma | - | - |
| College or Associate's Degree | $131,750 | $0 |
| Bachelor's Degree | $250,001 | $95,114 |
| Graduate Degree | $250,001 | $133,333 |
| Total | $250,001 | $101,750 |
Family Income in Plandome
Family Income Brackets in Plandome
According to the Plandome family income data, there are 293 families falling into the $200,000+ income range, which is the most common income bracket and makes up 78.1% of all families.
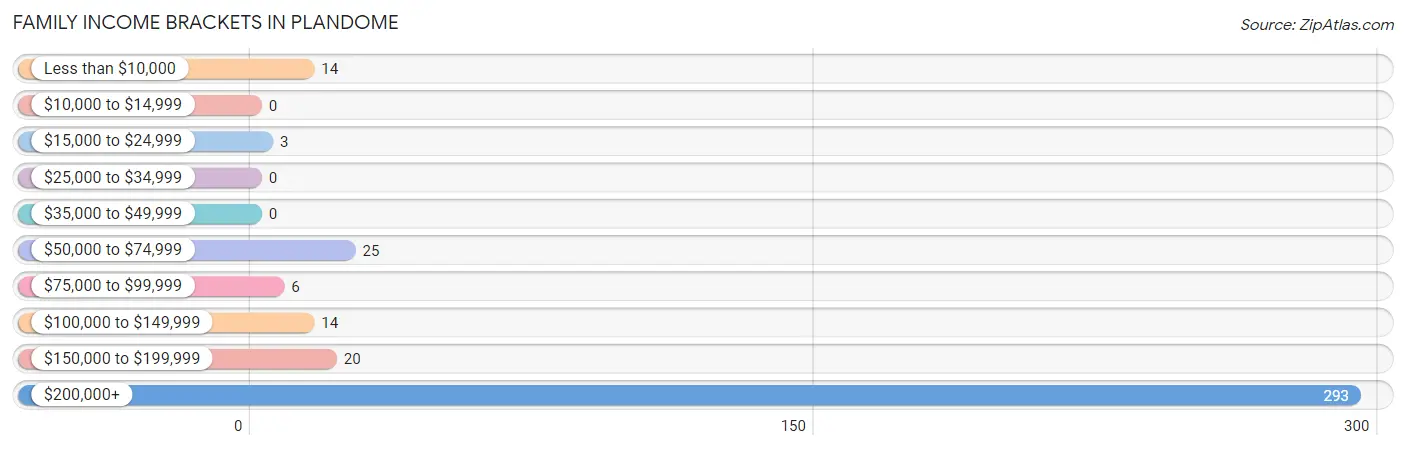
| Income Bracket | # Families | % Families |
| Less than $10,000 | 14 | 3.7% |
| $10,000 to $14,999 | 0 | 0.0% |
| $15,000 to $24,999 | 3 | 0.8% |
| $25,000 to $34,999 | 0 | 0.0% |
| $35,000 to $49,999 | 0 | 0.0% |
| $50,000 to $74,999 | 25 | 6.7% |
| $75,000 to $99,999 | 6 | 1.6% |
| $100,000 to $149,999 | 14 | 3.7% |
| $150,000 to $199,999 | 20 | 5.3% |
| $200,000+ | 293 | 78.1% |
Family Income by Famaliy Size in Plandome
2-person families (162 | 43.2%) account for the highest median family income in Plandome with $250,001 per family, while 2-person families (162 | 43.2%) have the highest median income of $125,000 per family member.
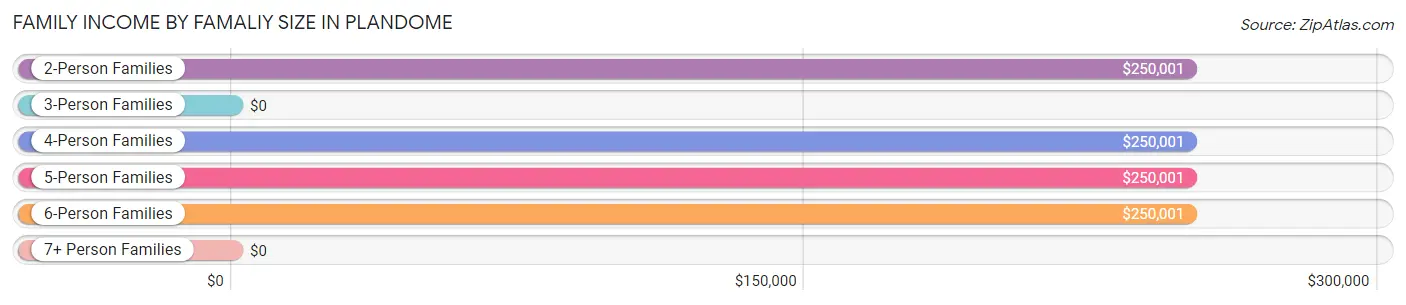
| Income Bracket | # Families | Median Income |
| 2-Person Families | 162 (43.2%) | $250,001 |
| 3-Person Families | 41 (10.9%) | $0 |
| 4-Person Families | 101 (26.9%) | $250,001 |
| 5-Person Families | 53 (14.1%) | $250,001 |
| 6-Person Families | 18 (4.8%) | $250,001 |
| 7+ Person Families | 0 (0.0%) | $0 |
| Total | 375 (100.0%) | $250,001 |
Family Income by Number of Earners in Plandome
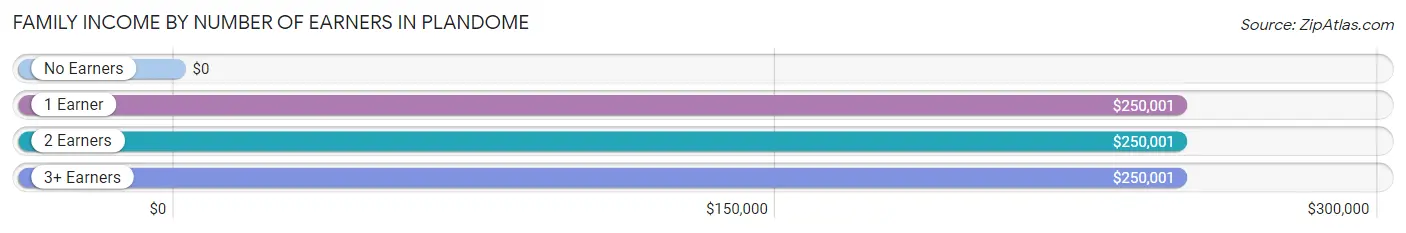
| Number of Earners | # Families | Median Income |
| No Earners | 37 (9.9%) | $0 |
| 1 Earner | 168 (44.8%) | $250,001 |
| 2 Earners | 129 (34.4%) | $250,001 |
| 3+ Earners | 41 (10.9%) | $250,001 |
| Total | 375 (100.0%) | $250,001 |
Household Income in Plandome
Household Income Brackets in Plandome
With 297 households falling in the category, the $200,000+ income range is the most frequent in Plandome, accounting for 70.1% of all households.
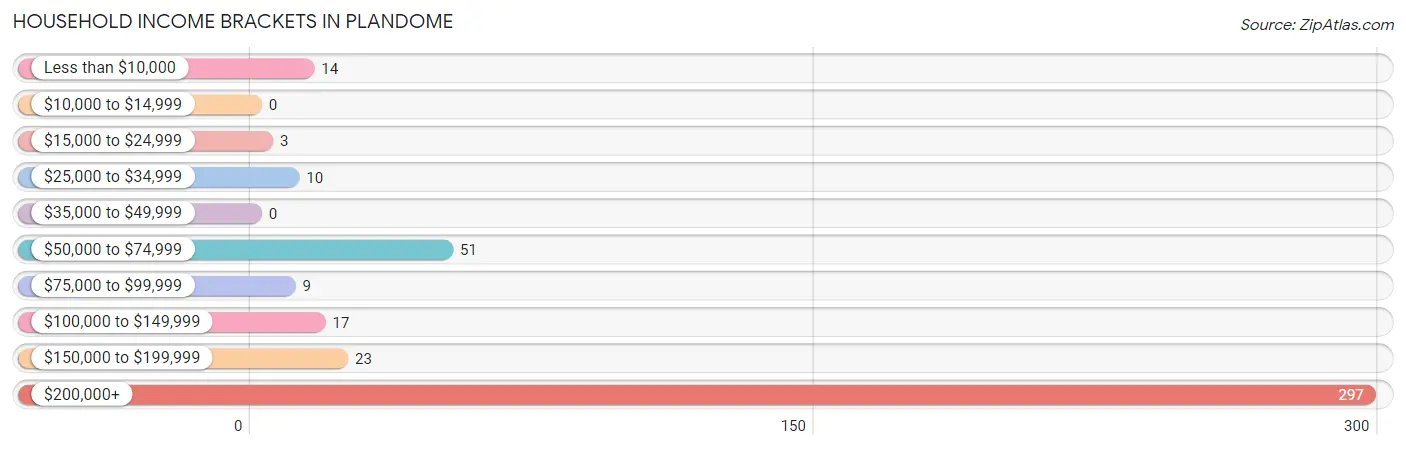
| Income Bracket | # Households | % Households |
| Less than $10,000 | 14 | 3.3% |
| $10,000 to $14,999 | 0 | 0.0% |
| $15,000 to $24,999 | 3 | 0.7% |
| $25,000 to $34,999 | 10 | 2.4% |
| $35,000 to $49,999 | 0 | 0.0% |
| $50,000 to $74,999 | 51 | 12.0% |
| $75,000 to $99,999 | 9 | 2.1% |
| $100,000 to $149,999 | 17 | 4.0% |
| $150,000 to $199,999 | 23 | 5.4% |
| $200,000+ | 297 | 70.0% |
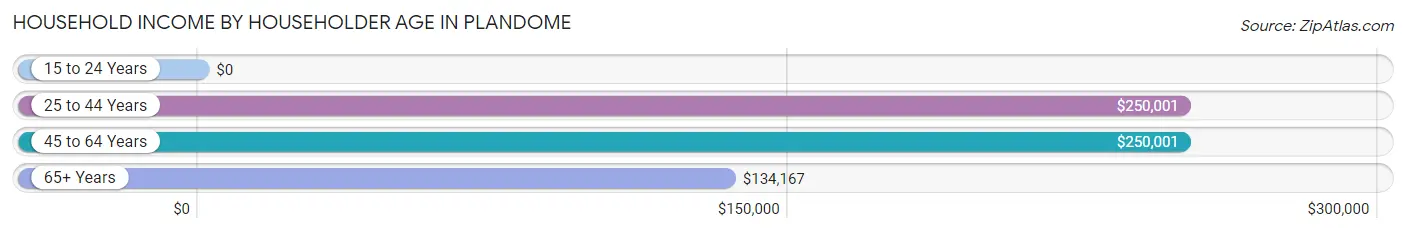
Household Income by Householder Age in Plandome
The median household income in Plandome is $250,001, with the highest median household income of $250,001 found in the 25 to 44 years age bracket for the primary householder. A total of 74 households (17.4%) fall into this category.
| Income Bracket | # Households | Median Income |
| 15 to 24 Years | 0 (0.0%) | $0 |
| 25 to 44 Years | 74 (17.4%) | $250,001 |
| 45 to 64 Years | 212 (50.0%) | $250,001 |
| 65+ Years | 138 (32.6%) | $134,167 |
| Total | 424 (100.0%) | $250,001 |
Poverty in Plandome
Income Below Poverty by Sex and Age in Plandome
With 3.6% poverty level for males and 4.2% for females among the residents of Plandome, 15 year old males and 6 to 11 year old females are the most vulnerable to poverty, with 13 males (100.0%) and 12 females (14.0%) in their respective age groups living below the poverty level.
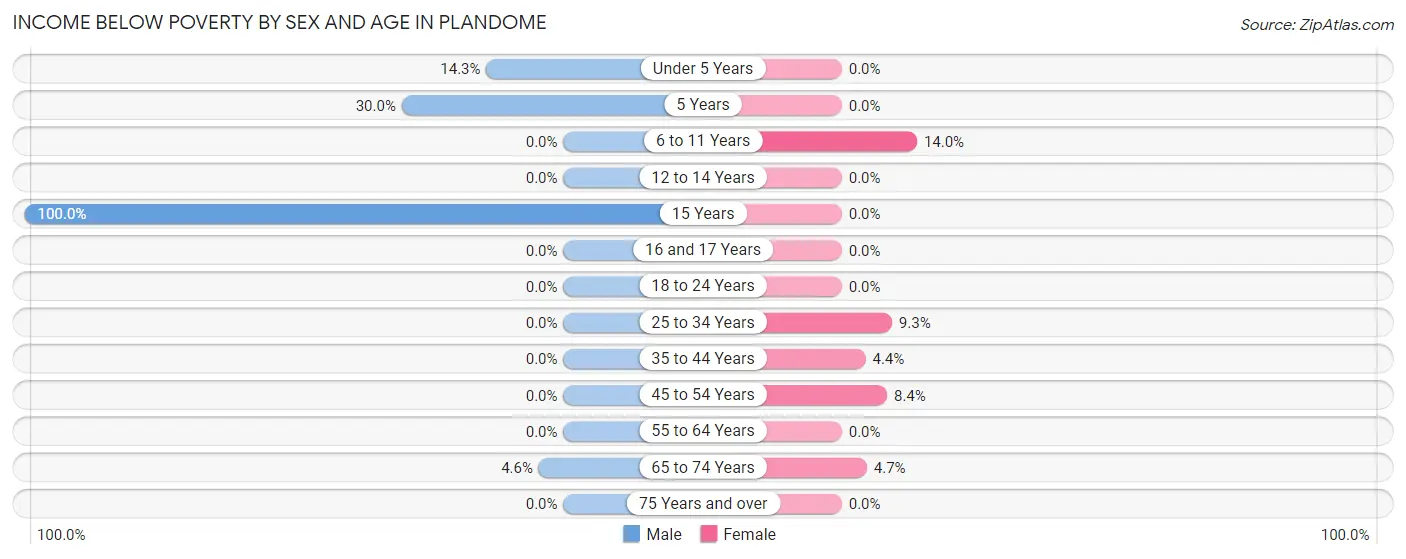
| Age Bracket | Male | Female |
| Under 5 Years | 3 (14.3%) | 0 (0.0%) |
| 5 Years | 3 (30.0%) | 0 (0.0%) |
| 6 to 11 Years | 0 (0.0%) | 12 (14.0%) |
| 12 to 14 Years | 0 (0.0%) | 0 (0.0%) |
| 15 Years | 13 (100.0%) | 0 (0.0%) |
| 16 and 17 Years | 0 (0.0%) | 0 (0.0%) |
| 18 to 24 Years | 0 (0.0%) | 0 (0.0%) |
| 25 to 34 Years | 0 (0.0%) | 4 (9.3%) |
| 35 to 44 Years | 0 (0.0%) | 3 (4.4%) |
| 45 to 54 Years | 0 (0.0%) | 11 (8.4%) |
| 55 to 64 Years | 0 (0.0%) | 0 (0.0%) |
| 65 to 74 Years | 3 (4.5%) | 2 (4.6%) |
| 75 Years and over | 0 (0.0%) | 0 (0.0%) |
| Total | 22 (3.6%) | 32 (4.2%) |
Income Above Poverty by Sex and Age in Plandome
According to the poverty statistics in Plandome, males aged 6 to 11 years and females aged under 5 years are the age groups that are most secure financially, with 100.0% of males and 100.0% of females in these age groups living above the poverty line.
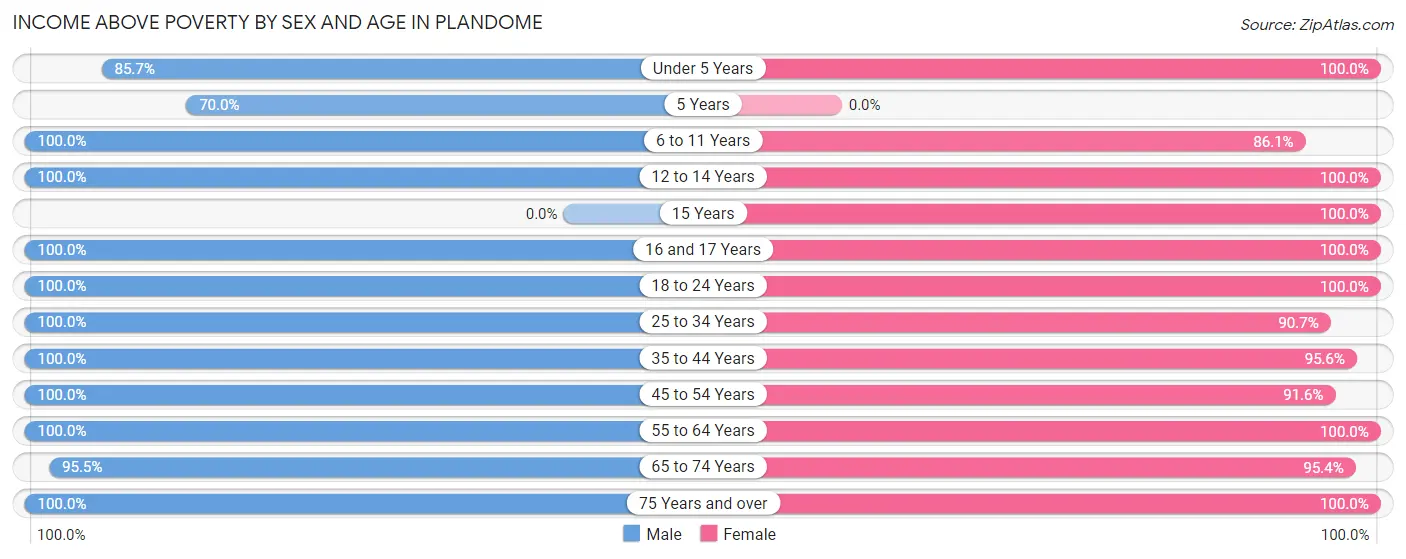
| Age Bracket | Male | Female |
| Under 5 Years | 18 (85.7%) | 36 (100.0%) |
| 5 Years | 7 (70.0%) | 0 (0.0%) |
| 6 to 11 Years | 45 (100.0%) | 74 (86.1%) |
| 12 to 14 Years | 78 (100.0%) | 55 (100.0%) |
| 15 Years | 0 (0.0%) | 43 (100.0%) |
| 16 and 17 Years | 33 (100.0%) | 19 (100.0%) |
| 18 to 24 Years | 15 (100.0%) | 45 (100.0%) |
| 25 to 34 Years | 17 (100.0%) | 39 (90.7%) |
| 35 to 44 Years | 76 (100.0%) | 65 (95.6%) |
| 45 to 54 Years | 119 (100.0%) | 120 (91.6%) |
| 55 to 64 Years | 81 (100.0%) | 102 (100.0%) |
| 65 to 74 Years | 63 (95.5%) | 41 (95.4%) |
| 75 Years and over | 32 (100.0%) | 86 (100.0%) |
| Total | 584 (96.4%) | 725 (95.8%) |
Income Below Poverty Among Married-Couple Families in Plandome
The poverty statistics for married-couple families in Plandome show that 0.8% or 3 of the total 356 families live below the poverty line. Families with no children have the highest poverty rate of 1.6%, comprising of 3 families. On the other hand, families with 1 or 2 children have the lowest poverty rate of 0.0%, which includes 0 families.
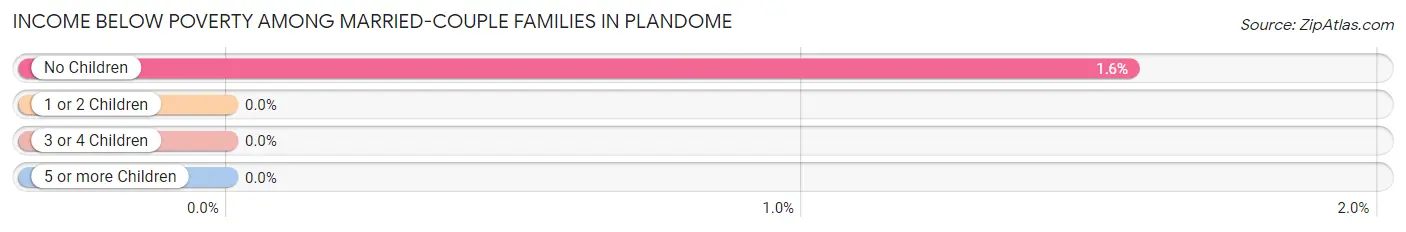
| Children | Above Poverty | Below Poverty |
| No Children | 188 (98.4%) | 3 (1.6%) |
| 1 or 2 Children | 100 (100.0%) | 0 (0.0%) |
| 3 or 4 Children | 65 (100.0%) | 0 (0.0%) |
| 5 or more Children | 0 (0.0%) | 0 (0.0%) |
| Total | 353 (99.2%) | 3 (0.8%) |
Income Below Poverty Among Single-Parent Households in Plandome
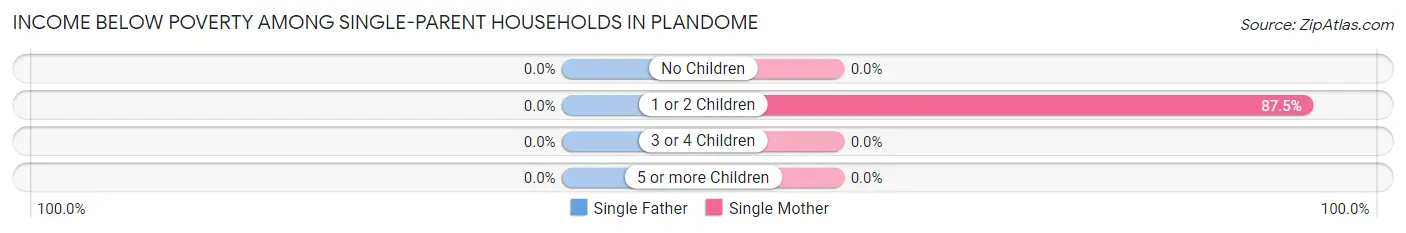
| Children | Single Father | Single Mother |
| No Children | 0 (0.0%) | 0 (0.0%) |
| 1 or 2 Children | 0 (0.0%) | 14 (87.5%) |
| 3 or 4 Children | 0 (0.0%) | 0 (0.0%) |
| 5 or more Children | 0 (0.0%) | 0 (0.0%) |
| Total | 0 (0.0%) | 14 (73.7%) |
Income Below Poverty Among Married-Couple vs Single-Parent Households in Plandome
The poverty data for Plandome shows that 3 of the married-couple family households (0.8%) and 14 of the single-parent households (73.7%) are living below the poverty level. Within the married-couple family households, those with no children have the highest poverty rate, with 3 households (1.6%) falling below the poverty line. Among the single-parent households, those with 1 or 2 children have the highest poverty rate, with 14 household (87.5%) living below poverty.
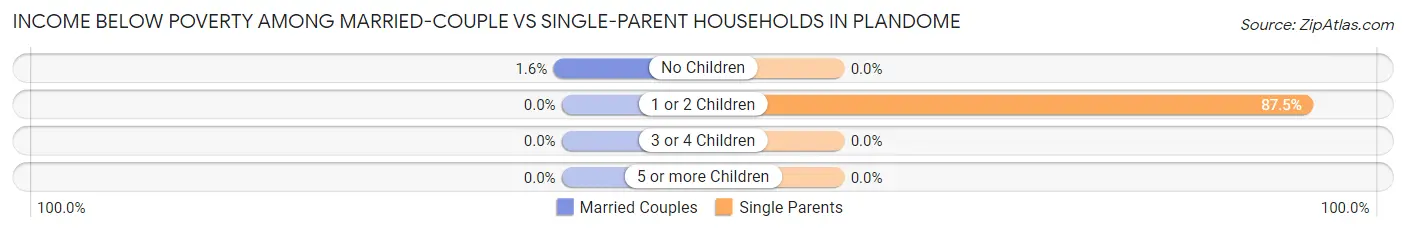
| Children | Married-Couple Families | Single-Parent Households |
| No Children | 3 (1.6%) | 0 (0.0%) |
| 1 or 2 Children | 0 (0.0%) | 14 (87.5%) |
| 3 or 4 Children | 0 (0.0%) | 0 (0.0%) |
| 5 or more Children | 0 (0.0%) | 0 (0.0%) |
| Total | 3 (0.8%) | 14 (73.7%) |
Race in Plandome
The most populous races in Plandome are White / Caucasian (1,197 | 87.7%), Asian (84 | 6.1%), and Two or more Races (81 | 5.9%).
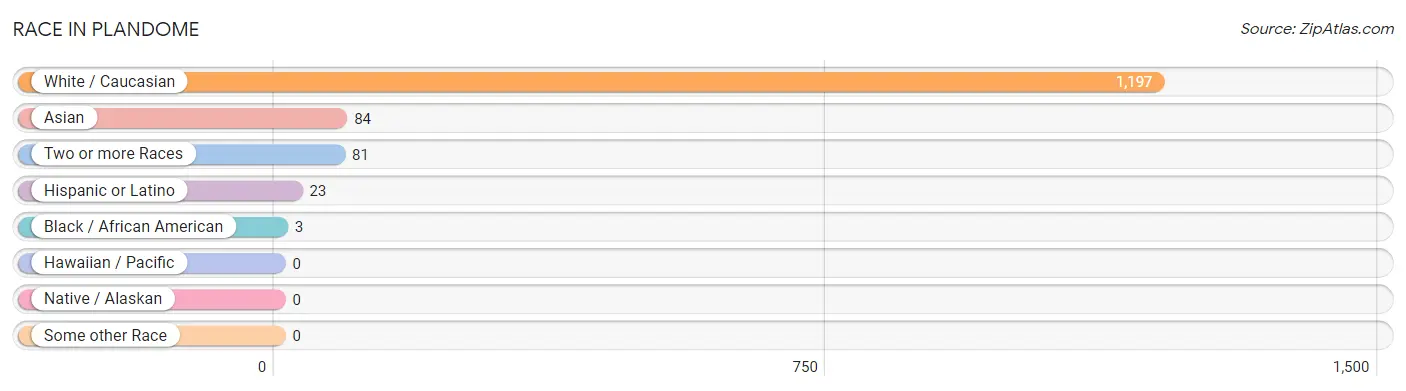
| Race | # Population | % Population |
| Asian | 84 | 6.1% |
| Black / African American | 3 | 0.2% |
| Hawaiian / Pacific | 0 | 0.0% |
| Hispanic or Latino | 23 | 1.7% |
| Native / Alaskan | 0 | 0.0% |
| White / Caucasian | 1,197 | 87.7% |
| Two or more Races | 81 | 5.9% |
| Some other Race | 0 | 0.0% |
| Total | 1,365 | 100.0% |
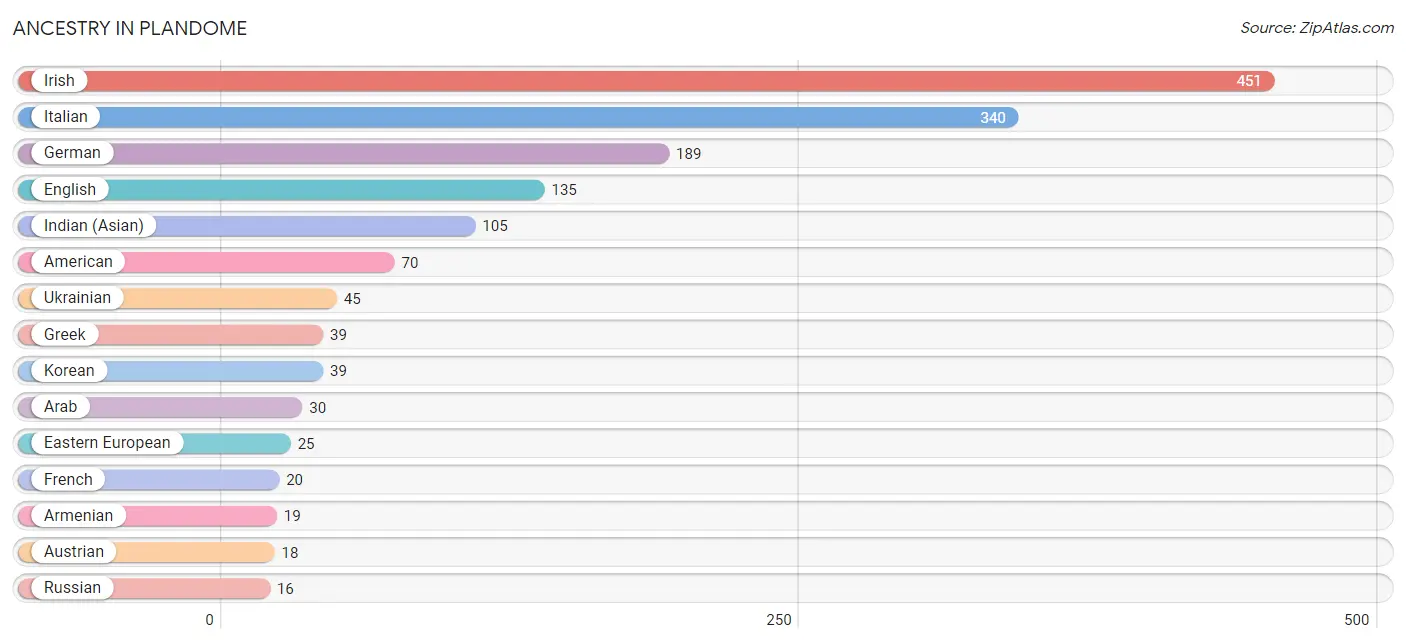
Ancestry in Plandome
The most populous ancestries reported in Plandome are Irish (451 | 33.0%), Italian (340 | 24.9%), German (189 | 13.9%), English (135 | 9.9%), and Indian (Asian) (105 | 7.7%), together accounting for 89.4% of all Plandome residents.
| Ancestry | # Population | % Population |
| American | 70 | 5.1% |
| Arab | 30 | 2.2% |
| Armenian | 19 | 1.4% |
| Austrian | 18 | 1.3% |
| British | 2 | 0.2% |
| Burmese | 8 | 0.6% |
| Colombian | 8 | 0.6% |
| Croatian | 2 | 0.2% |
| Dominican | 11 | 0.8% |
| Dutch | 2 | 0.2% |
| Eastern European | 25 | 1.8% |
| English | 135 | 9.9% |
| Ethiopian | 4 | 0.3% |
| European | 12 | 0.9% |
| French | 20 | 1.5% |
| German | 189 | 13.9% |
| Greek | 39 | 2.9% |
| Hungarian | 11 | 0.8% |
| Indian (Asian) | 105 | 7.7% |
| Irish | 451 | 33.0% |
| Italian | 340 | 24.9% |
| Jamaican | 3 | 0.2% |
| Jordanian | 14 | 1.0% |
| Korean | 39 | 2.9% |
| Norwegian | 4 | 0.3% |
| Polish | 8 | 0.6% |
| Russian | 16 | 1.2% |
| Scotch-Irish | 13 | 0.9% |
| Scottish | 16 | 1.2% |
| Slavic | 2 | 0.2% |
| South American | 8 | 0.6% |
| Spaniard | 4 | 0.3% |
| Subsaharan African | 4 | 0.3% |
| Thai | 9 | 0.7% |
| Ukrainian | 45 | 3.3% |
| Welsh | 4 | 0.3% | View All 36 Rows |
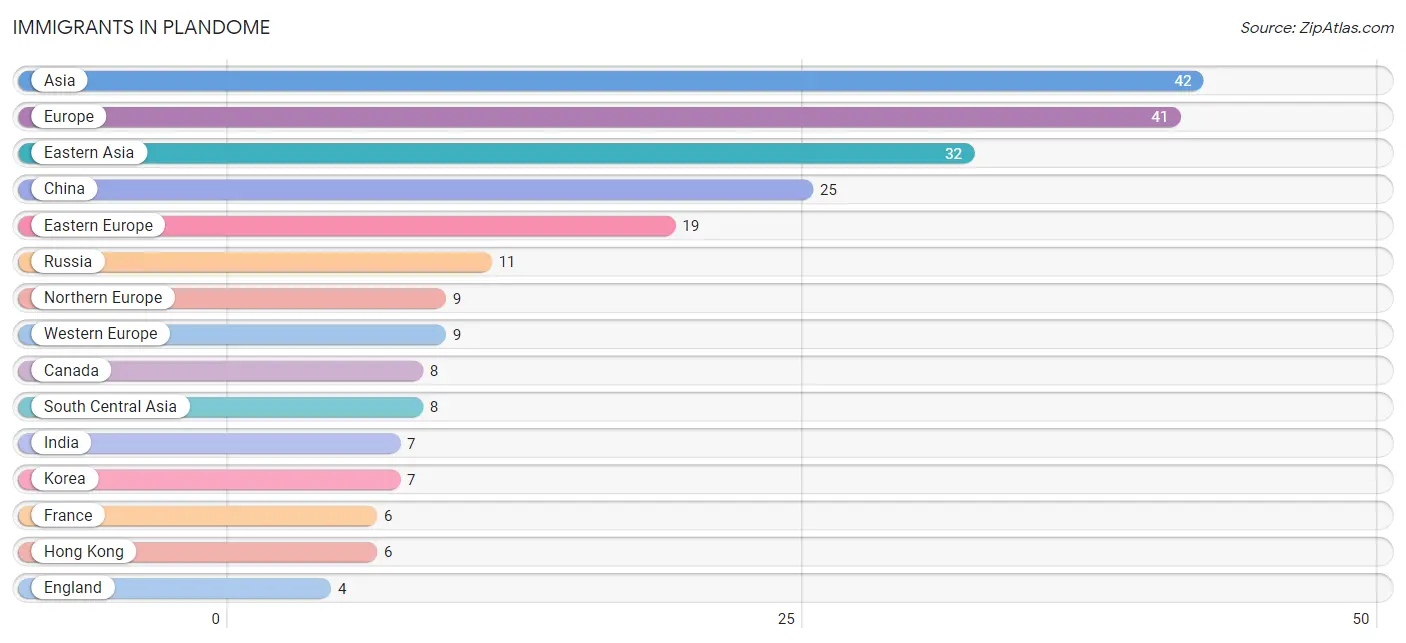
Immigrants in Plandome
The most numerous immigrant groups reported in Plandome came from Asia (42 | 3.1%), Europe (41 | 3.0%), Eastern Asia (32 | 2.3%), China (25 | 1.8%), and Eastern Europe (19 | 1.4%), together accounting for 11.6% of all Plandome residents.
| Immigration Origin | # Population | % Population |
| Asia | 42 | 3.1% |
| Australia | 3 | 0.2% |
| Canada | 8 | 0.6% |
| Caribbean | 3 | 0.2% |
| China | 25 | 1.8% |
| Eastern Asia | 32 | 2.3% |
| Eastern Europe | 19 | 1.4% |
| England | 4 | 0.3% |
| Europe | 41 | 3.0% |
| France | 6 | 0.4% |
| Germany | 3 | 0.2% |
| Hong Kong | 6 | 0.4% |
| Hungary | 4 | 0.3% |
| India | 7 | 0.5% |
| Ireland | 3 | 0.2% |
| Italy | 4 | 0.3% |
| Jamaica | 3 | 0.2% |
| Kazakhstan | 1 | 0.1% |
| Korea | 7 | 0.5% |
| Latin America | 3 | 0.2% |
| Northern Europe | 9 | 0.7% |
| Oceania | 3 | 0.2% |
| Poland | 4 | 0.3% |
| Russia | 11 | 0.8% |
| South Central Asia | 8 | 0.6% |
| Southern Europe | 4 | 0.3% |
| Taiwan | 3 | 0.2% |
| Turkey | 2 | 0.2% |
| Western Asia | 2 | 0.2% |
| Western Europe | 9 | 0.7% | View All 30 Rows |
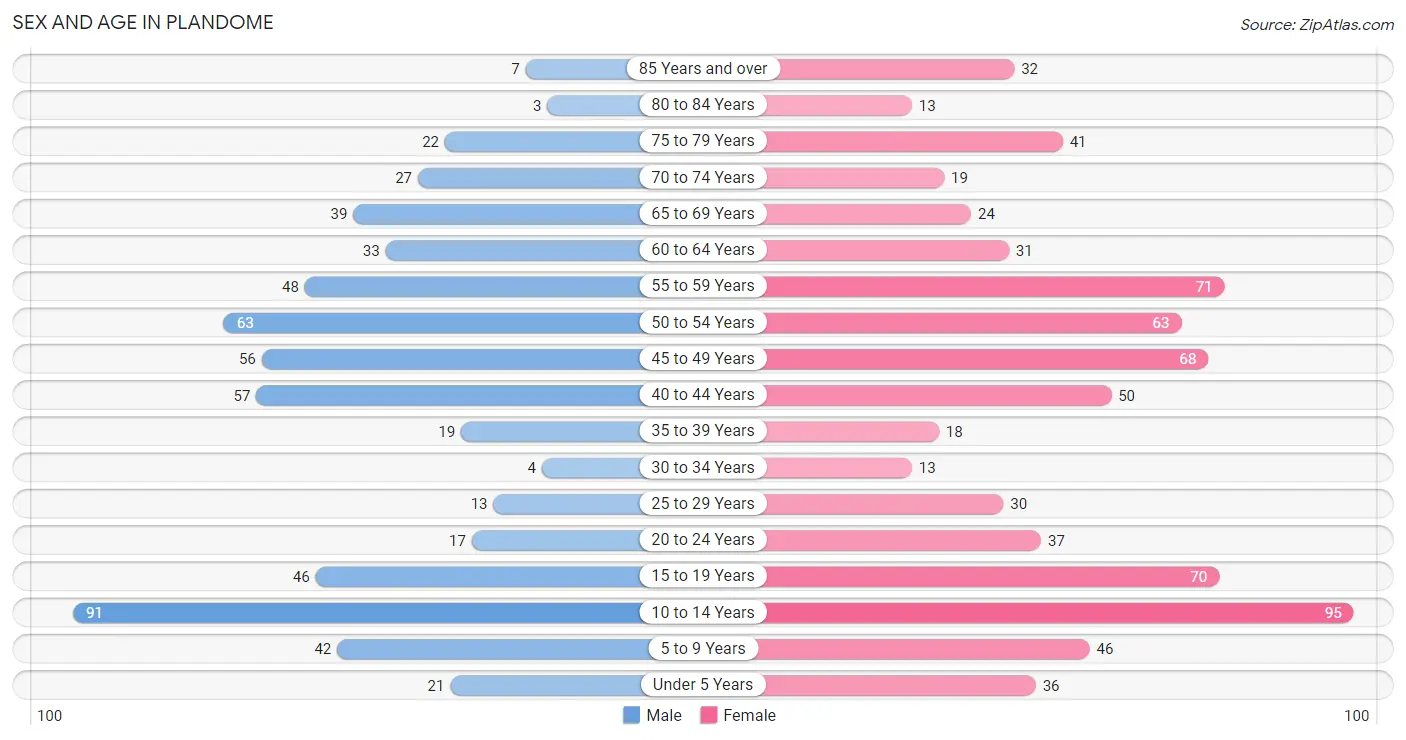
Sex and Age in Plandome
Sex and Age in Plandome
The most populous age groups in Plandome are 10 to 14 Years (91 | 15.0%) for men and 10 to 14 Years (95 | 12.6%) for women.
| Age Bracket | Male | Female |
| Under 5 Years | 21 (3.5%) | 36 (4.8%) |
| 5 to 9 Years | 42 (6.9%) | 46 (6.1%) |
| 10 to 14 Years | 91 (15.0%) | 95 (12.6%) |
| 15 to 19 Years | 46 (7.6%) | 70 (9.2%) |
| 20 to 24 Years | 17 (2.8%) | 37 (4.9%) |
| 25 to 29 Years | 13 (2.1%) | 30 (4.0%) |
| 30 to 34 Years | 4 (0.7%) | 13 (1.7%) |
| 35 to 39 Years | 19 (3.1%) | 18 (2.4%) |
| 40 to 44 Years | 57 (9.4%) | 50 (6.6%) |
| 45 to 49 Years | 56 (9.2%) | 68 (9.0%) |
| 50 to 54 Years | 63 (10.4%) | 63 (8.3%) |
| 55 to 59 Years | 48 (7.9%) | 71 (9.4%) |
| 60 to 64 Years | 33 (5.4%) | 31 (4.1%) |
| 65 to 69 Years | 39 (6.4%) | 24 (3.2%) |
| 70 to 74 Years | 27 (4.4%) | 19 (2.5%) |
| 75 to 79 Years | 22 (3.6%) | 41 (5.4%) |
| 80 to 84 Years | 3 (0.5%) | 13 (1.7%) |
| 85 Years and over | 7 (1.1%) | 32 (4.2%) |
| Total | 608 (100.0%) | 757 (100.0%) |
Families and Households in Plandome
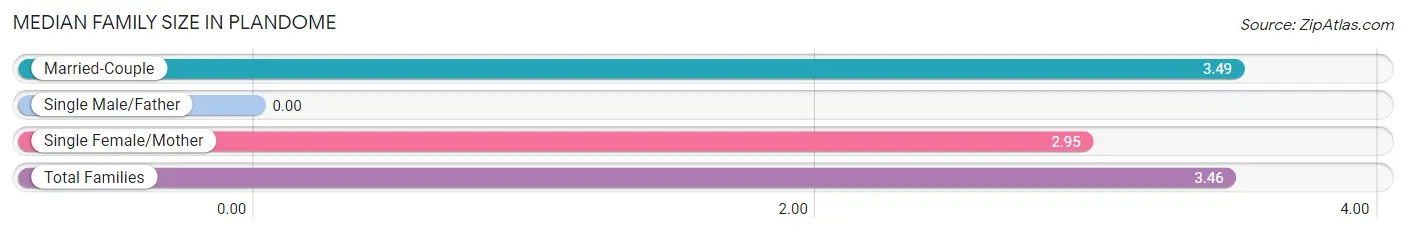
Median Family Size in Plandome
| Family Type | # Families | Family Size |
| Married-Couple | 356 (94.9%) | 3.49 |
| Single Male/Father | 0 (0.0%) | - |
| Single Female/Mother | 19 (5.1%) | 2.95 |
| Total Families | 375 (100.0%) | 3.46 |
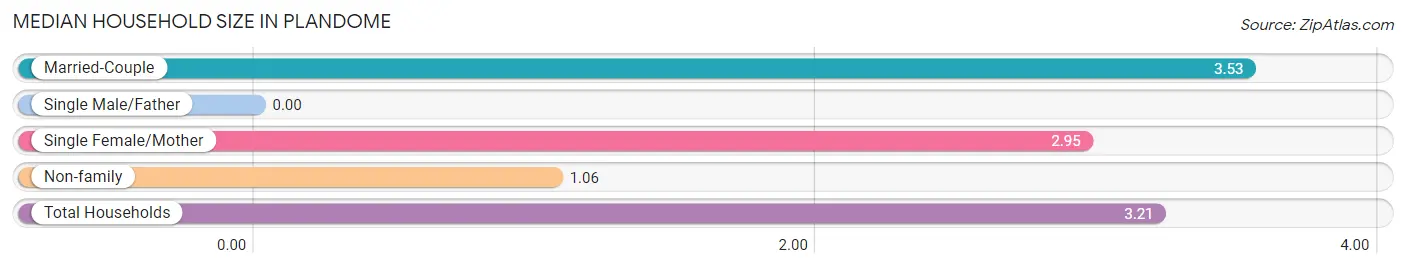
Median Household Size in Plandome
| Household Type | # Households | Household Size |
| Married-Couple | 356 (84.0%) | 3.53 |
| Single Male/Father | 0 (0.0%) | - |
| Single Female/Mother | 19 (4.5%) | 2.95 |
| Non-family | 49 (11.6%) | 1.06 |
| Total Households | 424 (100.0%) | 3.21 |
Household Size by Marriage Status in Plandome
Out of a total of 424 households in Plandome, 375 (88.4%) are family households, while 49 (11.6%) are nonfamily households. The most numerous type of family households are 2-person households, comprising 162, and the most common type of nonfamily households are 1-person households, comprising 47.
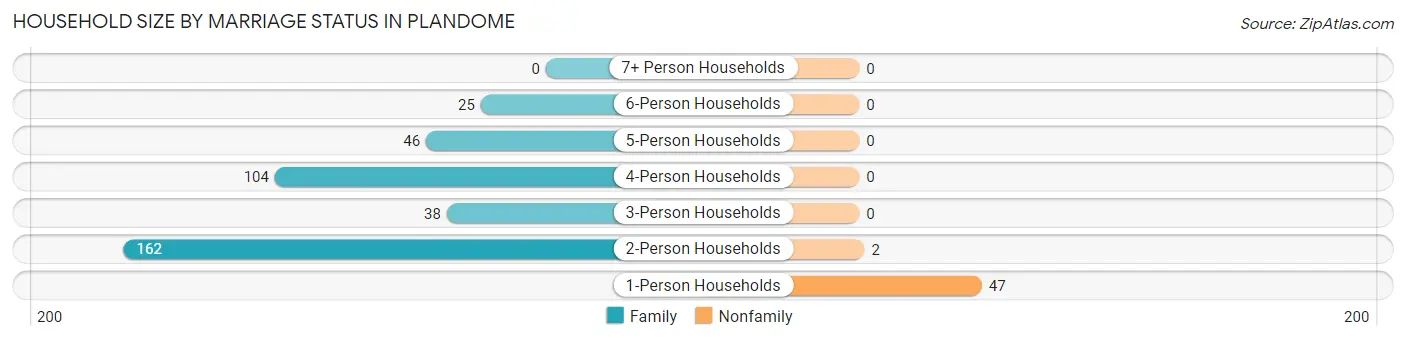
| Household Size | Family Households | Nonfamily Households |
| 1-Person Households | - | 47 (11.1%) |
| 2-Person Households | 162 (38.2%) | 2 (0.5%) |
| 3-Person Households | 38 (9.0%) | 0 (0.0%) |
| 4-Person Households | 104 (24.5%) | 0 (0.0%) |
| 5-Person Households | 46 (10.8%) | 0 (0.0%) |
| 6-Person Households | 25 (5.9%) | 0 (0.0%) |
| 7+ Person Households | 0 (0.0%) | 0 (0.0%) |
| Total | 375 (88.4%) | 49 (11.6%) |
Female Fertility in Plandome
Fertility by Age in Plandome
Average fertility rate in Plandome is 10.0 births per 1,000 women. Women in the age bracket of 35 to 50 years have the highest fertility rate with 21.0 births per 1,000 women. Women in the age bracket of 35 to 50 years acount for 100.0% of all women with births.
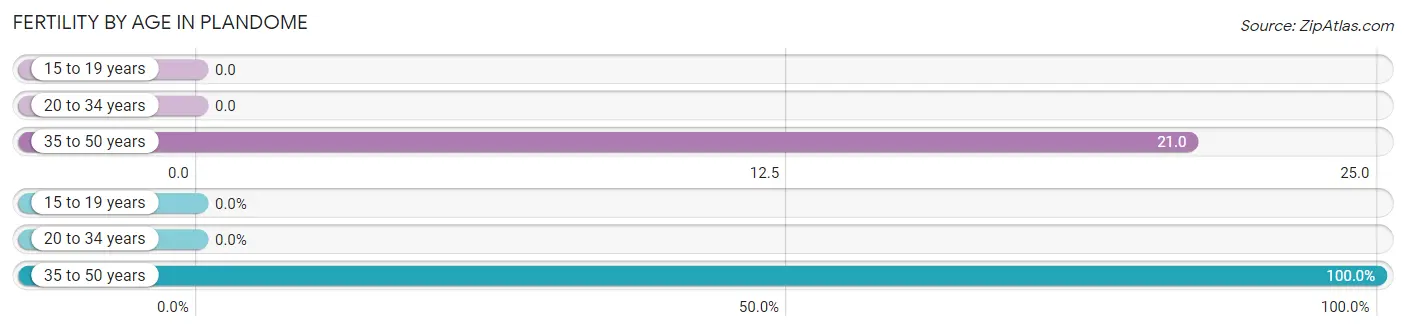
| Age Bracket | Women with Births | Births / 1,000 Women |
| 15 to 19 years | 0 (0.0%) | 0.0 |
| 20 to 34 years | 0 (0.0%) | 0.0 |
| 35 to 50 years | 3 (100.0%) | 21.0 |
| Total | 3 (100.0%) | 10.0 |
Fertility by Age by Marriage Status in Plandome
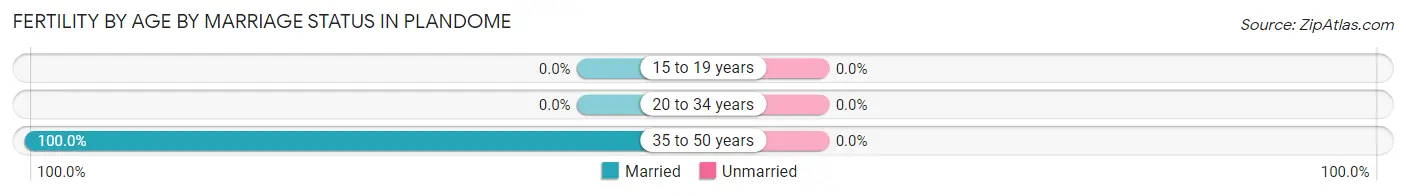
| Age Bracket | Married | Unmarried |
| 15 to 19 years | 0 (0.0%) | 0 (0.0%) |
| 20 to 34 years | 0 (0.0%) | 0 (0.0%) |
| 35 to 50 years | 3 (100.0%) | 0 (0.0%) |
| Total | 3 (100.0%) | 0 (0.0%) |
Fertility by Education in Plandome
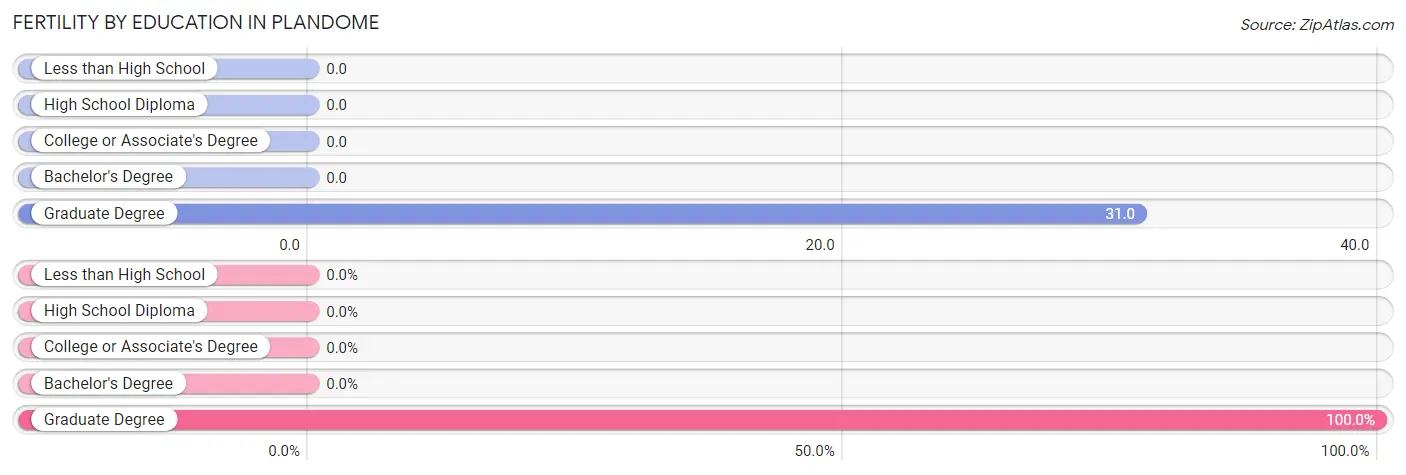
| Educational Attainment | Women with Births | Births / 1,000 Women |
| Less than High School | 0 (0.0%) | 0.0 |
| High School Diploma | 0 (0.0%) | 0.0 |
| College or Associate's Degree | 0 (0.0%) | 0.0 |
| Bachelor's Degree | 0 (0.0%) | 0.0 |
| Graduate Degree | 3 (100.0%) | 31.0 |
| Total | 3 (100.0%) | 10.0 |
Fertility by Education by Marriage Status in Plandome
| Educational Attainment | Married | Unmarried |
| Less than High School | 0 (0.0%) | 0 (0.0%) |
| High School Diploma | 0 (0.0%) | 0 (0.0%) |
| College or Associate's Degree | 0 (0.0%) | 0 (0.0%) |
| Bachelor's Degree | 0 (0.0%) | 0 (0.0%) |
| Graduate Degree | 3 (100.0%) | 0 (0.0%) |
| Total | 3 (100.0%) | 0 (0.0%) |
Employment Characteristics in Plandome
Employment by Class of Employer in Plandome
Among the 562 employed individuals in Plandome, private company employees (392 | 69.8%), self-employed (not incorporated) (64 | 11.4%), and self-employed (incorporated) (56 | 10.0%) make up the most common classes of employment.
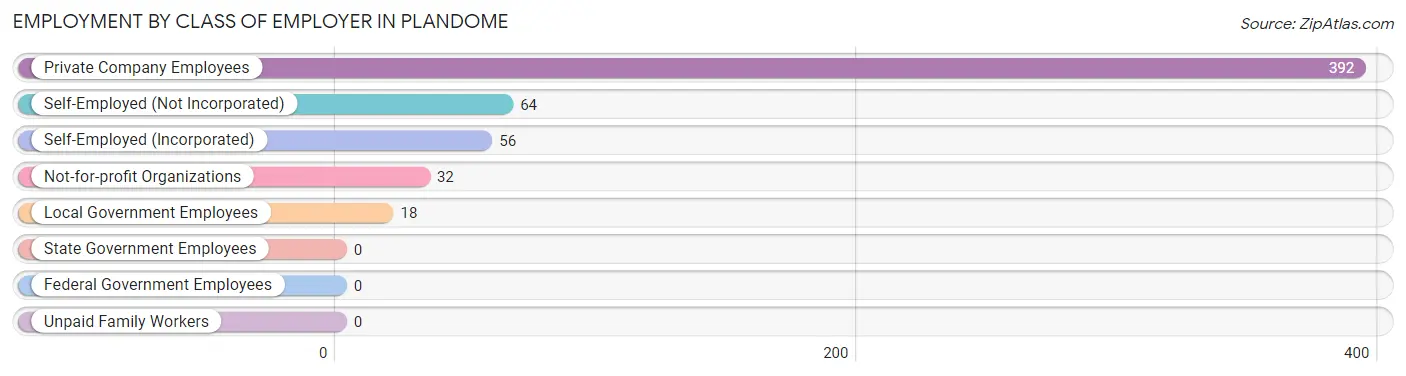
| Employer Class | # Employees | % Employees |
| Private Company Employees | 392 | 69.8% |
| Self-Employed (Incorporated) | 56 | 10.0% |
| Self-Employed (Not Incorporated) | 64 | 11.4% |
| Not-for-profit Organizations | 32 | 5.7% |
| Local Government Employees | 18 | 3.2% |
| State Government Employees | 0 | 0.0% |
| Federal Government Employees | 0 | 0.0% |
| Unpaid Family Workers | 0 | 0.0% |
| Total | 562 | 100.0% |
Employment Status by Age in Plandome
According to the labor force statistics for Plandome, out of the total population over 16 years of age (978), 59.2% or 579 individuals are in the labor force, with 2.4% or 14 of them unemployed. The age group with the highest labor force participation rate is 25 to 29 years, with 88.4% or 38 individuals in the labor force. Within the labor force, the 16 to 19 years age range has the highest percentage of unemployed individuals, with 100.0% or 4 of them being unemployed.
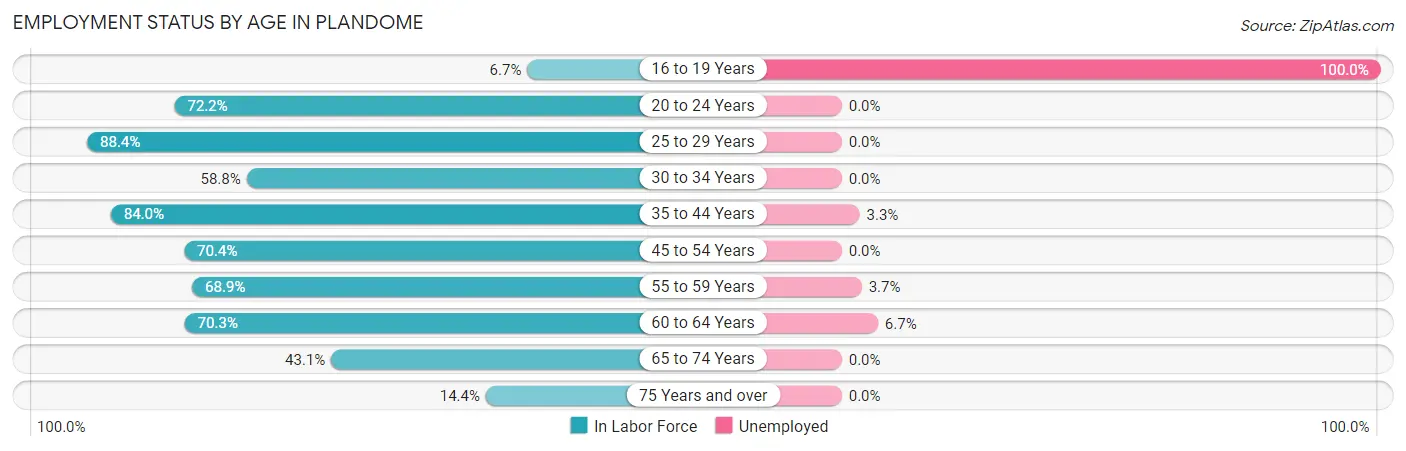
| Age Bracket | In Labor Force | Unemployed |
| 16 to 19 Years | 4 (6.7%) | 4 (100.0%) |
| 20 to 24 Years | 39 (72.2%) | 0 (0.0%) |
| 25 to 29 Years | 38 (88.4%) | 0 (0.0%) |
| 30 to 34 Years | 10 (58.8%) | 0 (0.0%) |
| 35 to 44 Years | 121 (84.0%) | 4 (3.3%) |
| 45 to 54 Years | 176 (70.4%) | 0 (0.0%) |
| 55 to 59 Years | 82 (68.9%) | 3 (3.7%) |
| 60 to 64 Years | 45 (70.3%) | 3 (6.7%) |
| 65 to 74 Years | 47 (43.1%) | 0 (0.0%) |
| 75 Years and over | 17 (14.4%) | 0 (0.0%) |
| Total | 579 (59.2%) | 14 (2.4%) |
Employment Status by Educational Attainment in Plandome
According to labor force statistics for Plandome, 74.1% of individuals (472) out of the total population between 25 and 64 years of age (637) are in the labor force, with 2.1% or 10 of them being unemployed. The group with the highest labor force participation rate are those with the educational attainment of high school diploma, with 77.8% or 14 individuals in the labor force. Within the labor force, individuals with bachelor's degree or higher education have the highest percentage of unemployment, with 2.3% or 10 of them being unemployed.
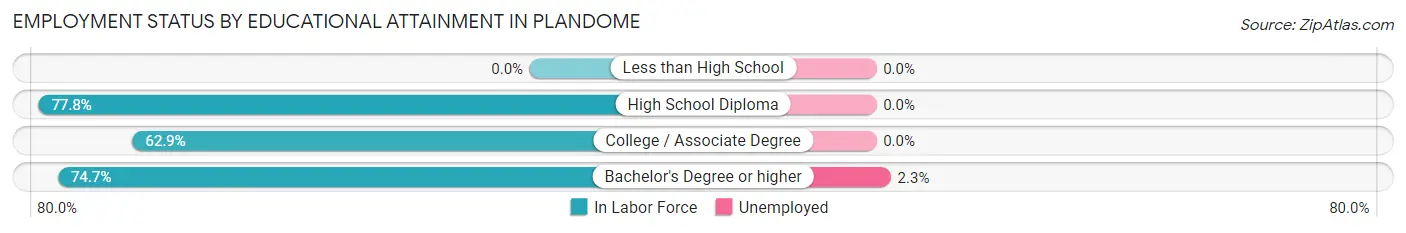
| Educational Attainment | In Labor Force | Unemployed |
| Less than High School | 0 (0.0%) | 0 (0.0%) |
| High School Diploma | 14 (77.8%) | 0 (0.0%) |
| College / Associate Degree | 22 (62.9%) | 0 (0.0%) |
| Bachelor's Degree or higher | 436 (74.7%) | 13 (2.3%) |
| Total | 472 (74.1%) | 13 (2.1%) |
Employment Occupations by Sex in Plandome
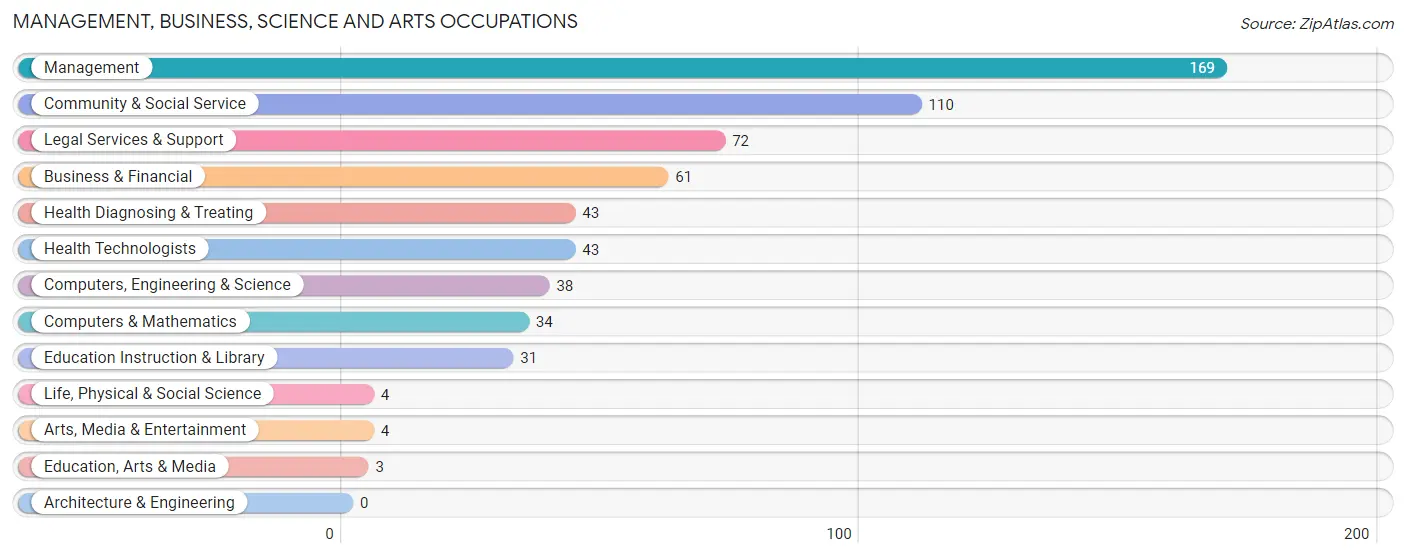
Management, Business, Science and Arts Occupations
The most common Management, Business, Science and Arts occupations in Plandome are Management (169 | 29.9%), Community & Social Service (110 | 19.5%), Legal Services & Support (72 | 12.7%), Business & Financial (61 | 10.8%), and Health Diagnosing & Treating (43 | 7.6%).
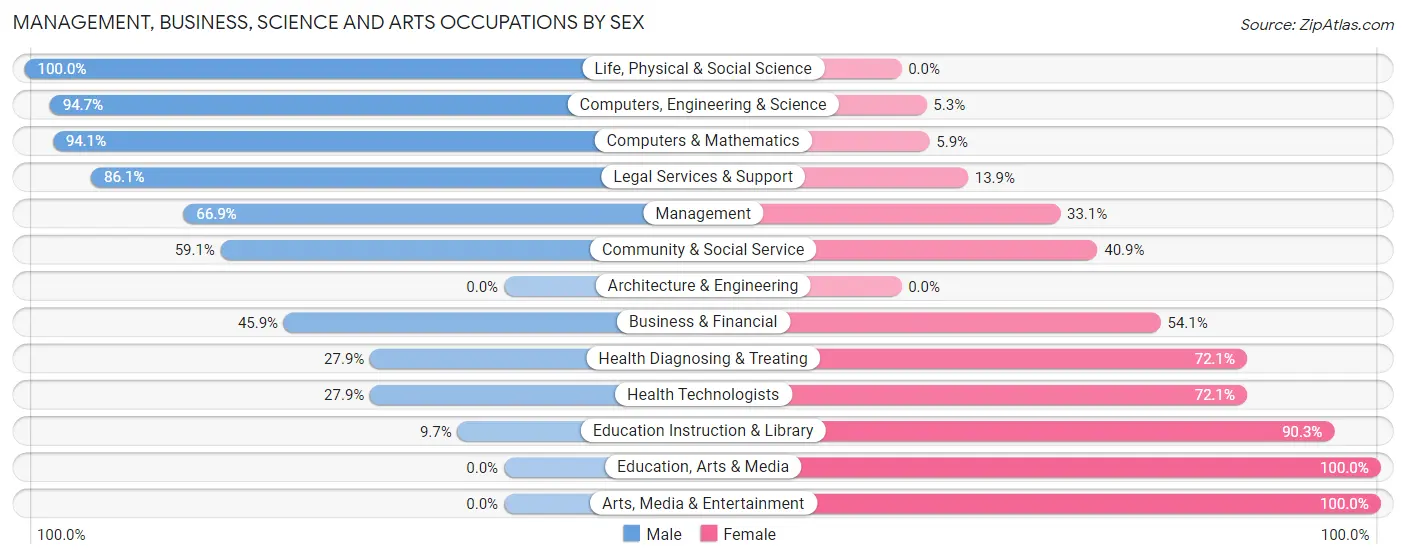
Management, Business, Science and Arts Occupations by Sex
Within the Management, Business, Science and Arts occupations in Plandome, the most male-oriented occupations are Life, Physical & Social Science (100.0%), Computers, Engineering & Science (94.7%), and Computers & Mathematics (94.1%), while the most female-oriented occupations are Education, Arts & Media (100.0%), Arts, Media & Entertainment (100.0%), and Education Instruction & Library (90.3%).
| Occupation | Male | Female |
| Management | 113 (66.9%) | 56 (33.1%) |
| Business & Financial | 28 (45.9%) | 33 (54.1%) |
| Computers, Engineering & Science | 36 (94.7%) | 2 (5.3%) |
| Computers & Mathematics | 32 (94.1%) | 2 (5.9%) |
| Architecture & Engineering | 0 (0.0%) | 0 (0.0%) |
| Life, Physical & Social Science | 4 (100.0%) | 0 (0.0%) |
| Community & Social Service | 65 (59.1%) | 45 (40.9%) |
| Education, Arts & Media | 0 (0.0%) | 3 (100.0%) |
| Legal Services & Support | 62 (86.1%) | 10 (13.9%) |
| Education Instruction & Library | 3 (9.7%) | 28 (90.3%) |
| Arts, Media & Entertainment | 0 (0.0%) | 4 (100.0%) |
| Health Diagnosing & Treating | 12 (27.9%) | 31 (72.1%) |
| Health Technologists | 12 (27.9%) | 31 (72.1%) |
| Total (Category) | 254 (60.3%) | 167 (39.7%) |
| Total (Overall) | 338 (59.8%) | 227 (40.2%) |
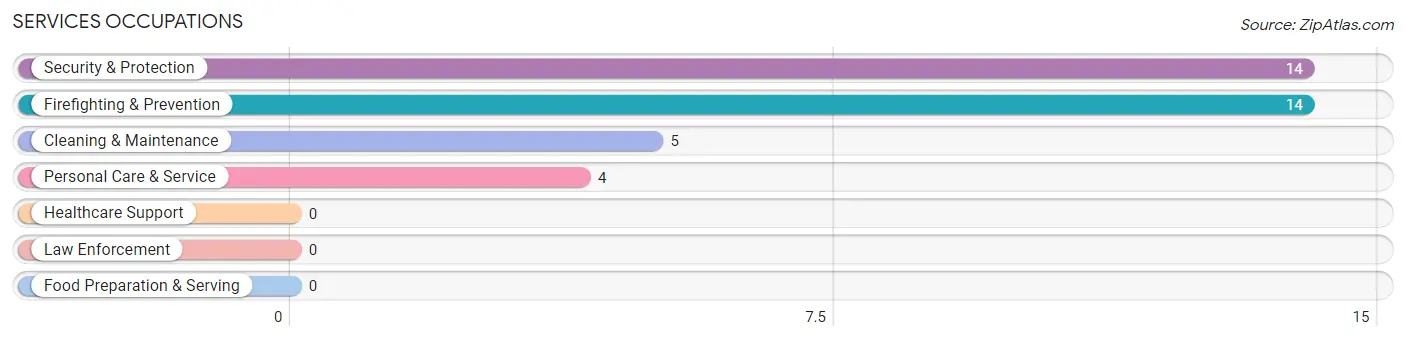
Services Occupations
The most common Services occupations in Plandome are Security & Protection (14 | 2.5%), Firefighting & Prevention (14 | 2.5%), Cleaning & Maintenance (5 | 0.9%), and Personal Care & Service (4 | 0.7%).
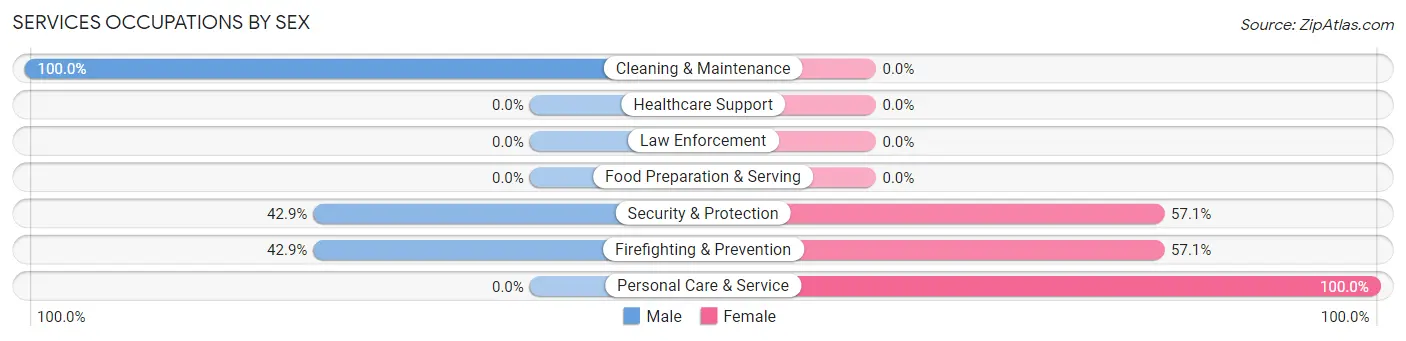
Services Occupations by Sex
Within the Services occupations in Plandome, the most male-oriented occupations are Cleaning & Maintenance (100.0%), Security & Protection (42.9%), and Firefighting & Prevention (42.9%), while the most female-oriented occupations are Personal Care & Service (100.0%), Security & Protection (57.1%), and Firefighting & Prevention (57.1%).
| Occupation | Male | Female |
| Healthcare Support | 0 (0.0%) | 0 (0.0%) |
| Security & Protection | 6 (42.9%) | 8 (57.1%) |
| Firefighting & Prevention | 6 (42.9%) | 8 (57.1%) |
| Law Enforcement | 0 (0.0%) | 0 (0.0%) |
| Food Preparation & Serving | 0 (0.0%) | 0 (0.0%) |
| Cleaning & Maintenance | 5 (100.0%) | 0 (0.0%) |
| Personal Care & Service | 0 (0.0%) | 4 (100.0%) |
| Total (Category) | 11 (47.8%) | 12 (52.2%) |
| Total (Overall) | 338 (59.8%) | 227 (40.2%) |
Sales and Office Occupations
The most common Sales and Office occupations in Plandome are Sales & Related (88 | 15.6%), and Office & Administration (32 | 5.7%).
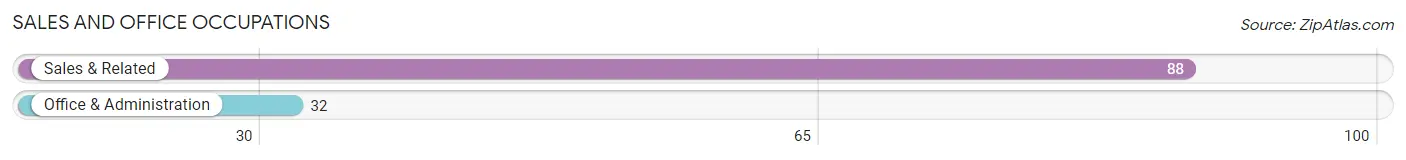
Sales and Office Occupations by Sex
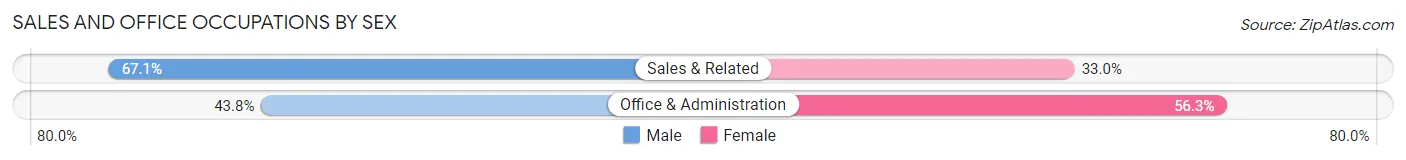
| Occupation | Male | Female |
| Sales & Related | 59 (67.0%) | 29 (33.0%) |
| Office & Administration | 14 (43.8%) | 18 (56.2%) |
| Total (Category) | 73 (60.8%) | 47 (39.2%) |
| Total (Overall) | 338 (59.8%) | 227 (40.2%) |
Natural Resources, Construction and Maintenance Occupations
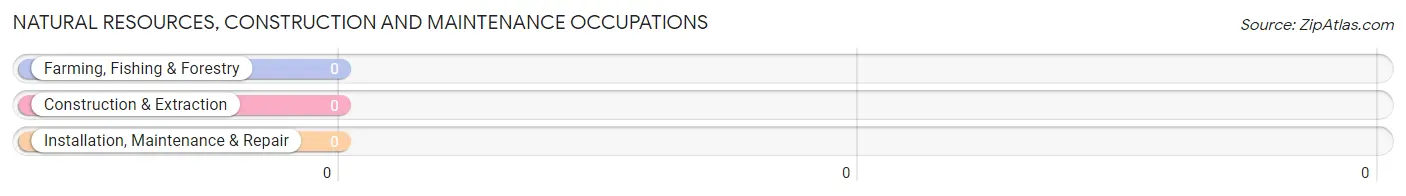
Natural Resources, Construction and Maintenance Occupations by Sex
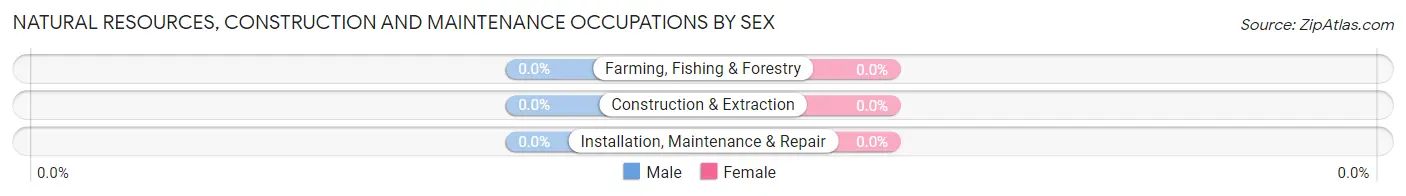
| Occupation | Male | Female |
| Farming, Fishing & Forestry | 0 (0.0%) | 0 (0.0%) |
| Construction & Extraction | 0 (0.0%) | 0 (0.0%) |
| Installation, Maintenance & Repair | 0 (0.0%) | 0 (0.0%) |
| Total (Category) | 0 (0.0%) | 0 (0.0%) |
| Total (Overall) | 338 (59.8%) | 227 (40.2%) |
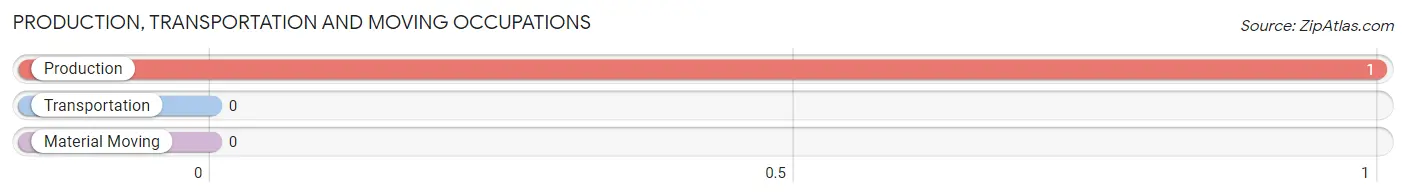
Production, Transportation and Moving Occupations
The most common Production, Transportation and Moving occupations in Plandome are , and Production (1 | 0.2%).
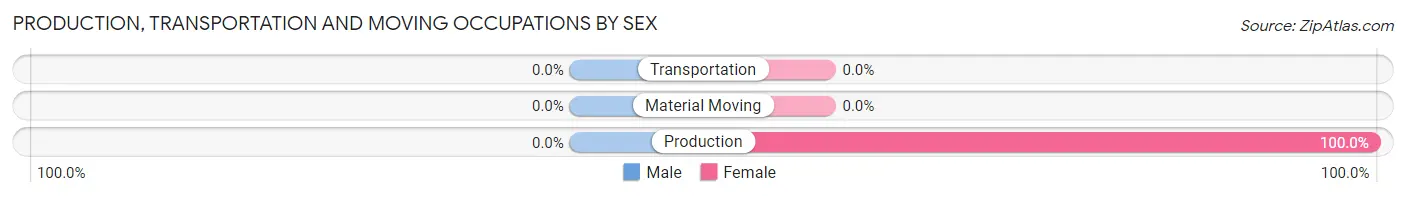
Production, Transportation and Moving Occupations by Sex
| Occupation | Male | Female |
| Production | 0 (0.0%) | 1 (100.0%) |
| Transportation | 0 (0.0%) | 0 (0.0%) |
| Material Moving | 0 (0.0%) | 0 (0.0%) |
| Total (Category) | 0 (0.0%) | 1 (100.0%) |
| Total (Overall) | 338 (59.8%) | 227 (40.2%) |
Employment Industries by Sex in Plandome
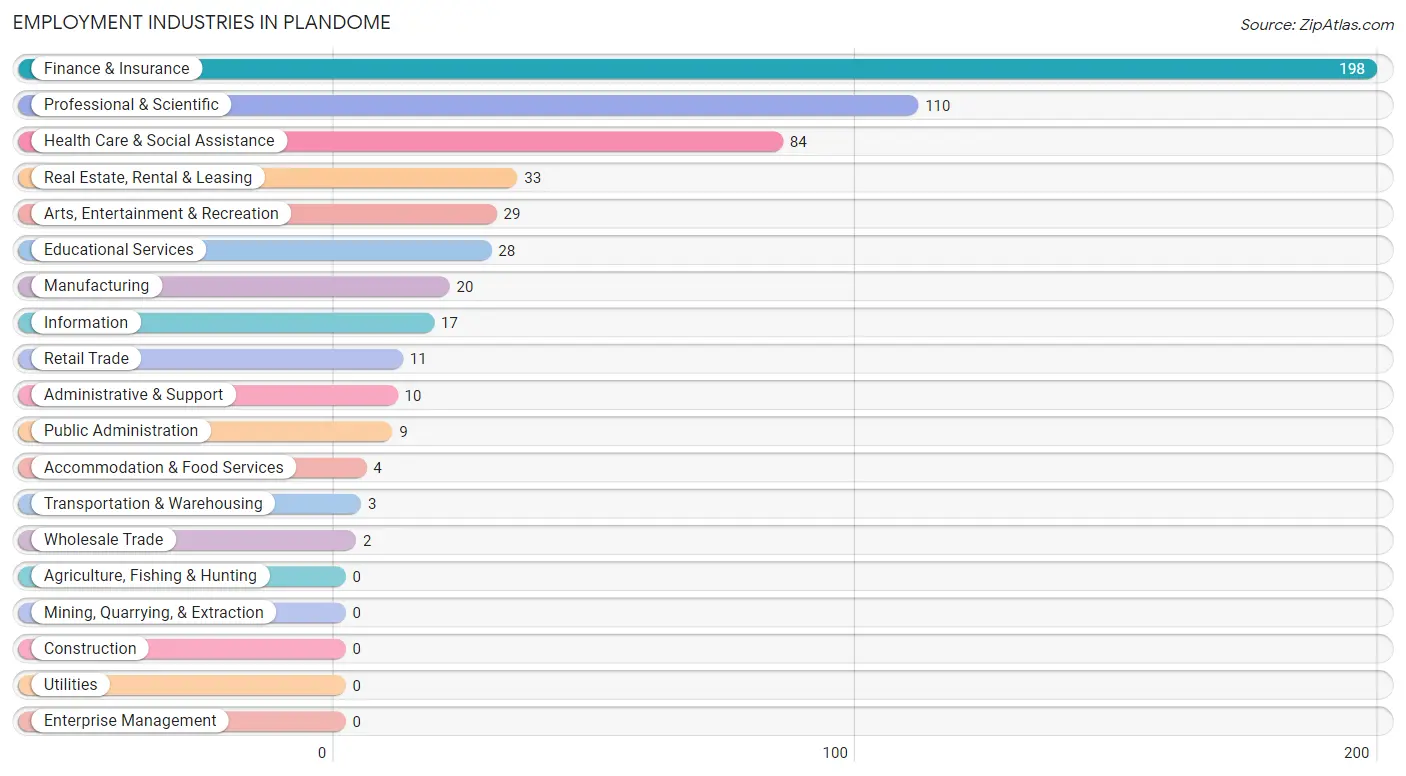
Employment Industries in Plandome
The major employment industries in Plandome include Finance & Insurance (198 | 35.0%), Professional & Scientific (110 | 19.5%), Health Care & Social Assistance (84 | 14.9%), Real Estate, Rental & Leasing (33 | 5.8%), and Arts, Entertainment & Recreation (29 | 5.1%).
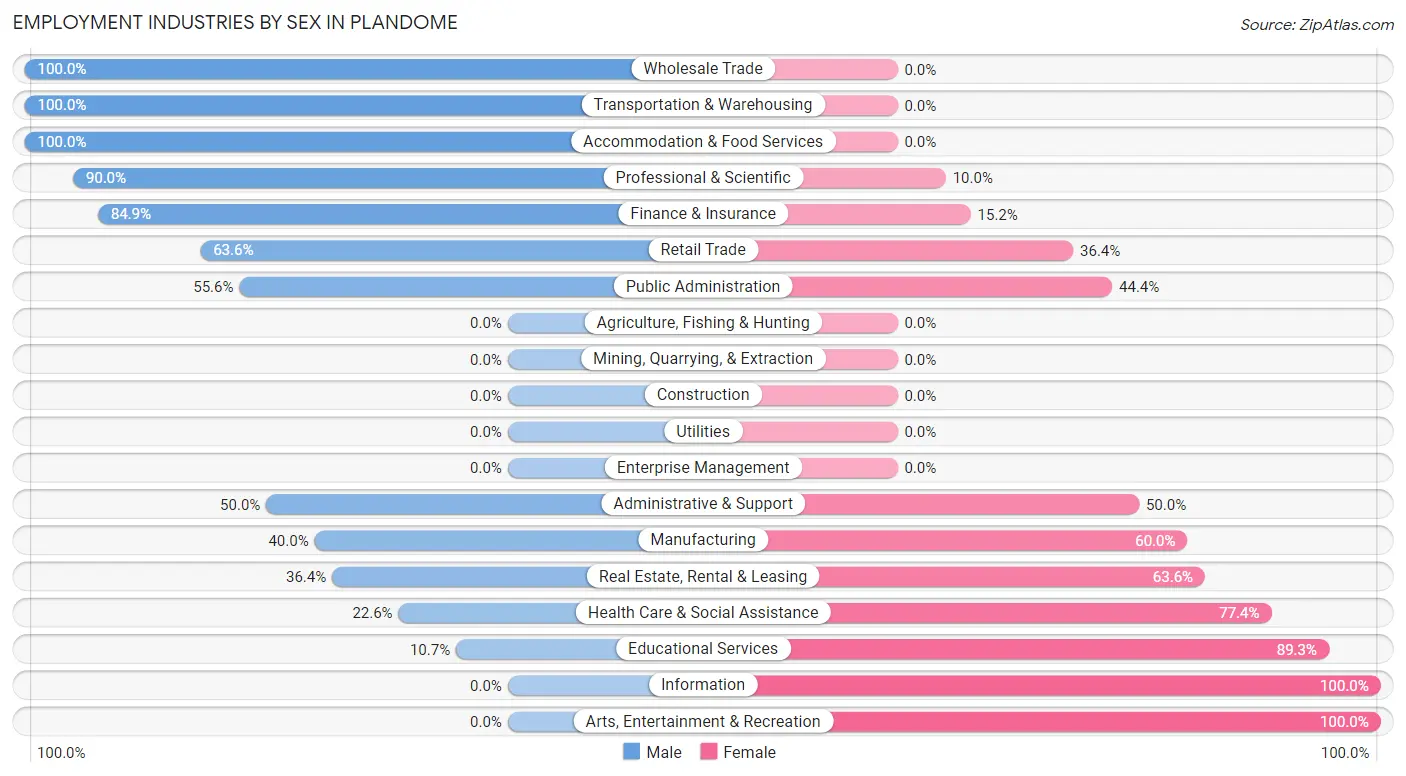
Employment Industries by Sex in Plandome
The Plandome industries that see more men than women are Wholesale Trade (100.0%), Transportation & Warehousing (100.0%), and Accommodation & Food Services (100.0%), whereas the industries that tend to have a higher number of women are Information (100.0%), Arts, Entertainment & Recreation (100.0%), and Educational Services (89.3%).
| Industry | Male | Female |
| Agriculture, Fishing & Hunting | 0 (0.0%) | 0 (0.0%) |
| Mining, Quarrying, & Extraction | 0 (0.0%) | 0 (0.0%) |
| Construction | 0 (0.0%) | 0 (0.0%) |
| Manufacturing | 8 (40.0%) | 12 (60.0%) |
| Wholesale Trade | 2 (100.0%) | 0 (0.0%) |
| Retail Trade | 7 (63.6%) | 4 (36.4%) |
| Transportation & Warehousing | 3 (100.0%) | 0 (0.0%) |
| Utilities | 0 (0.0%) | 0 (0.0%) |
| Information | 0 (0.0%) | 17 (100.0%) |
| Finance & Insurance | 168 (84.9%) | 30 (15.1%) |
| Real Estate, Rental & Leasing | 12 (36.4%) | 21 (63.6%) |
| Professional & Scientific | 99 (90.0%) | 11 (10.0%) |
| Enterprise Management | 0 (0.0%) | 0 (0.0%) |
| Administrative & Support | 5 (50.0%) | 5 (50.0%) |
| Educational Services | 3 (10.7%) | 25 (89.3%) |
| Health Care & Social Assistance | 19 (22.6%) | 65 (77.4%) |
| Arts, Entertainment & Recreation | 0 (0.0%) | 29 (100.0%) |
| Accommodation & Food Services | 4 (100.0%) | 0 (0.0%) |
| Public Administration | 5 (55.6%) | 4 (44.4%) |
| Total | 338 (59.8%) | 227 (40.2%) |
Education in Plandome
School Enrollment in Plandome
The most common levels of schooling among the 477 students in Plandome are middle school (149 | 31.2%), high school (130 | 27.3%), and elementary school (90 | 18.9%).
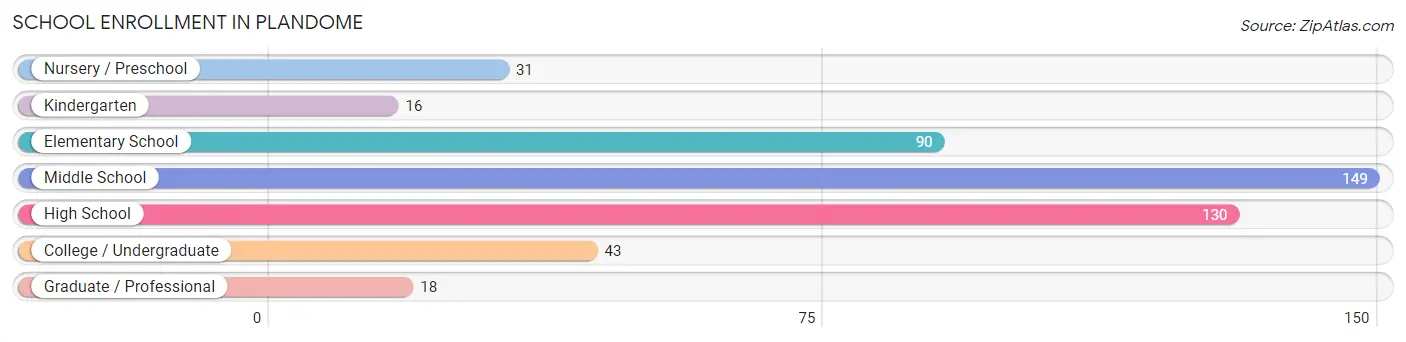
| School Level | # Students | % Students |
| Nursery / Preschool | 31 | 6.5% |
| Kindergarten | 16 | 3.4% |
| Elementary School | 90 | 18.9% |
| Middle School | 149 | 31.2% |
| High School | 130 | 27.3% |
| College / Undergraduate | 43 | 9.0% |
| Graduate / Professional | 18 | 3.8% |
| Total | 477 | 100.0% |
School Enrollment by Age by Funding Source in Plandome
Out of a total of 477 students who are enrolled in schools in Plandome, 115 (24.1%) attend a private institution, while the remaining 362 (75.9%) are enrolled in public schools. The age group of 3 to 4 year olds has the highest likelihood of being enrolled in private schools, with 23 (74.2% in the age bracket) enrolled. Conversely, the age group of 15 to 17 year olds has the lowest likelihood of being enrolled in a private school, with 97 (89.8% in the age bracket) attending a public institution.
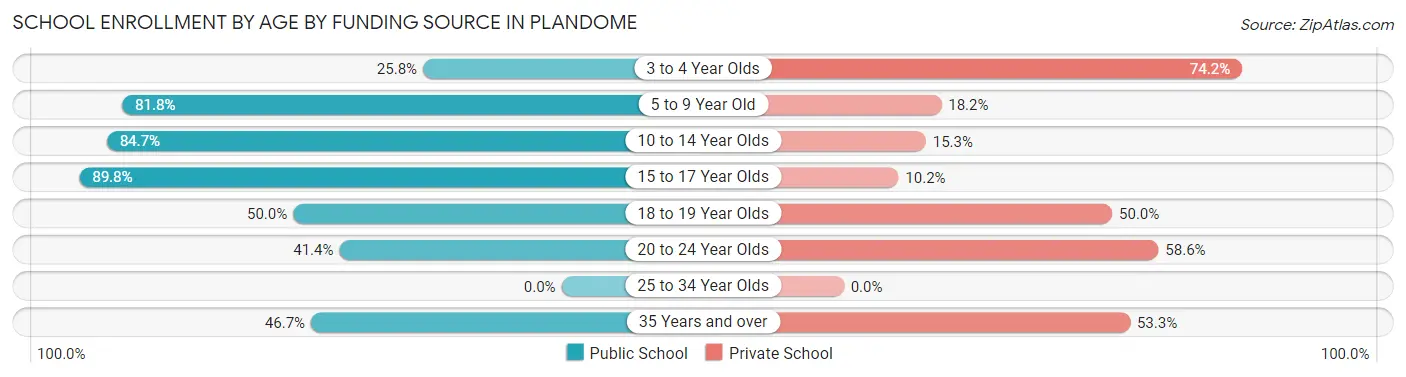
| Age Bracket | Public School | Private School |
| 3 to 4 Year Olds | 8 (25.8%) | 23 (74.2%) |
| 5 to 9 Year Old | 72 (81.8%) | 16 (18.2%) |
| 10 to 14 Year Olds | 155 (84.7%) | 28 (15.3%) |
| 15 to 17 Year Olds | 97 (89.8%) | 11 (10.2%) |
| 18 to 19 Year Olds | 4 (50.0%) | 4 (50.0%) |
| 20 to 24 Year Olds | 12 (41.4%) | 17 (58.6%) |
| 25 to 34 Year Olds | 0 (0.0%) | 0 (0.0%) |
| 35 Years and over | 14 (46.7%) | 16 (53.3%) |
| Total | 362 (75.9%) | 115 (24.1%) |
Educational Attainment by Field of Study in Plandome
Business (253 | 30.6%), social sciences (113 | 13.7%), liberal arts & history (107 | 12.9%), education (70 | 8.5%), and science & technology (62 | 7.5%) are the most common fields of study among 828 individuals in Plandome who have obtained a bachelor's degree or higher.
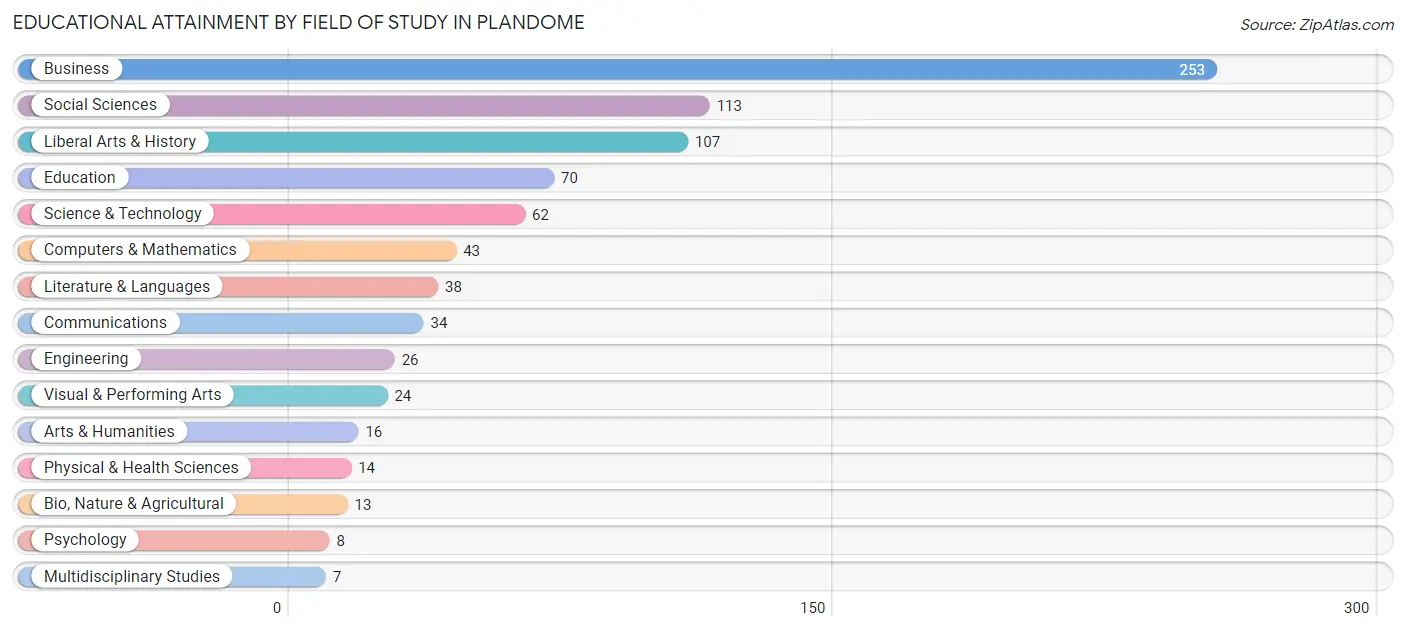
| Field of Study | # Graduates | % Graduates |
| Computers & Mathematics | 43 | 5.2% |
| Bio, Nature & Agricultural | 13 | 1.6% |
| Physical & Health Sciences | 14 | 1.7% |
| Psychology | 8 | 1.0% |
| Social Sciences | 113 | 13.7% |
| Engineering | 26 | 3.1% |
| Multidisciplinary Studies | 7 | 0.9% |
| Science & Technology | 62 | 7.5% |
| Business | 253 | 30.6% |
| Education | 70 | 8.5% |
| Literature & Languages | 38 | 4.6% |
| Liberal Arts & History | 107 | 12.9% |
| Visual & Performing Arts | 24 | 2.9% |
| Communications | 34 | 4.1% |
| Arts & Humanities | 16 | 1.9% |
| Total | 828 | 100.0% |
Transportation & Commute in Plandome
Vehicle Availability by Sex in Plandome
The most prevalent vehicle ownership categories in Plandome are males with 2 vehicles (182, accounting for 54.3%) and females with 2 vehicles (79, making up 80.2%).
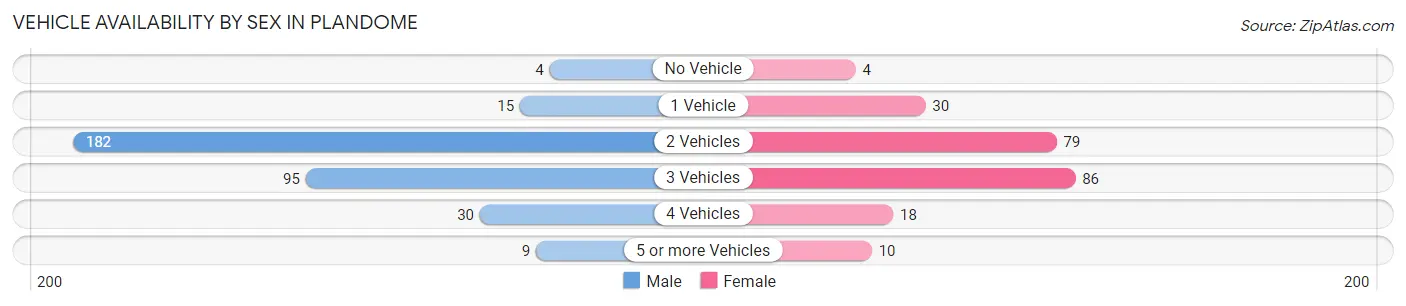
| Vehicles Available | Male | Female |
| No Vehicle | 4 (1.2%) | 4 (1.8%) |
| 1 Vehicle | 15 (4.5%) | 30 (13.2%) |
| 2 Vehicles | 182 (54.3%) | 79 (34.8%) |
| 3 Vehicles | 95 (28.4%) | 86 (37.9%) |
| 4 Vehicles | 30 (9.0%) | 18 (7.9%) |
| 5 or more Vehicles | 9 (2.7%) | 10 (4.4%) |
| Total | 335 (100.0%) | 227 (100.0%) |
Commute Time in Plandome
The most frequently occuring commute durations in Plandome are 60 to 89 minutes (159 commuters, 39.6%), 45 to 59 minutes (71 commuters, 17.7%), and 20 to 24 minutes (28 commuters, 7.0%).
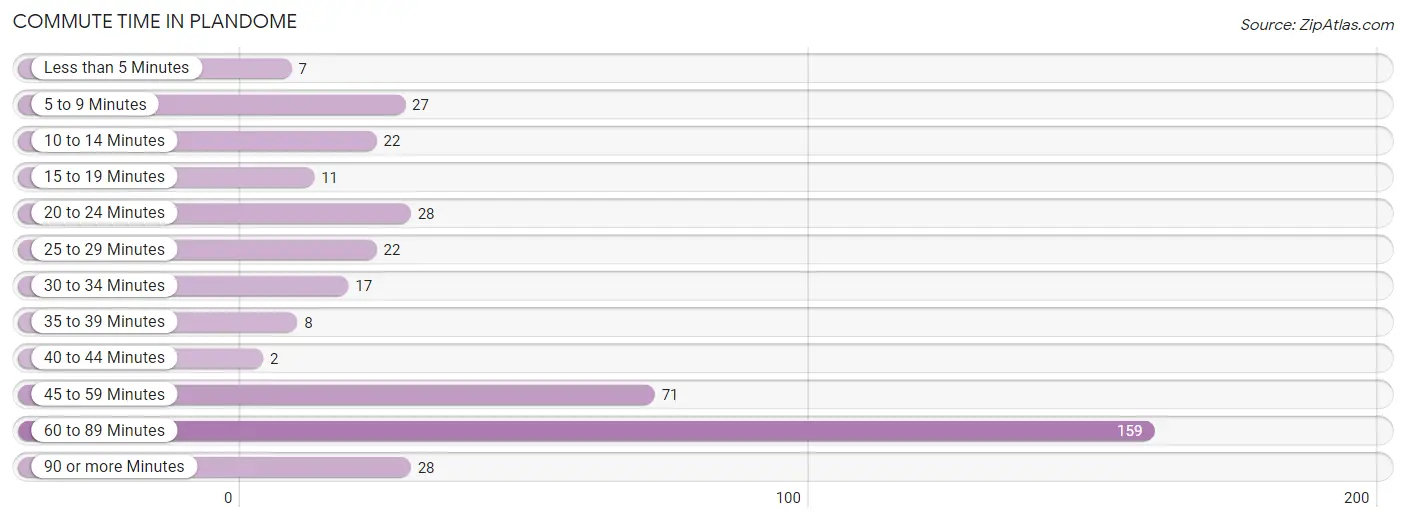
| Commute Time | # Commuters | % Commuters |
| Less than 5 Minutes | 7 | 1.7% |
| 5 to 9 Minutes | 27 | 6.7% |
| 10 to 14 Minutes | 22 | 5.5% |
| 15 to 19 Minutes | 11 | 2.7% |
| 20 to 24 Minutes | 28 | 7.0% |
| 25 to 29 Minutes | 22 | 5.5% |
| 30 to 34 Minutes | 17 | 4.2% |
| 35 to 39 Minutes | 8 | 2.0% |
| 40 to 44 Minutes | 2 | 0.5% |
| 45 to 59 Minutes | 71 | 17.7% |
| 60 to 89 Minutes | 159 | 39.6% |
| 90 or more Minutes | 28 | 7.0% |
Commute Time by Sex in Plandome
The most common commute times in Plandome are 60 to 89 minutes (122 commuters, 48.8%) for males and 60 to 89 minutes (37 commuters, 24.3%) for females.
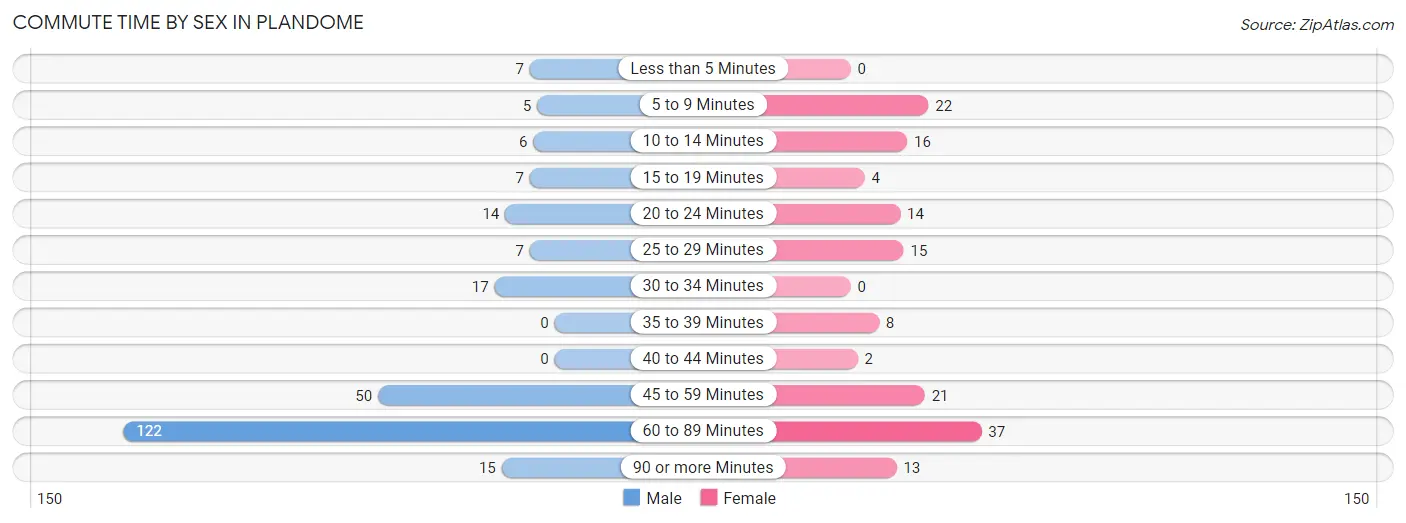
| Commute Time | Male | Female |
| Less than 5 Minutes | 7 (2.8%) | 0 (0.0%) |
| 5 to 9 Minutes | 5 (2.0%) | 22 (14.5%) |
| 10 to 14 Minutes | 6 (2.4%) | 16 (10.5%) |
| 15 to 19 Minutes | 7 (2.8%) | 4 (2.6%) |
| 20 to 24 Minutes | 14 (5.6%) | 14 (9.2%) |
| 25 to 29 Minutes | 7 (2.8%) | 15 (9.9%) |
| 30 to 34 Minutes | 17 (6.8%) | 0 (0.0%) |
| 35 to 39 Minutes | 0 (0.0%) | 8 (5.3%) |
| 40 to 44 Minutes | 0 (0.0%) | 2 (1.3%) |
| 45 to 59 Minutes | 50 (20.0%) | 21 (13.8%) |
| 60 to 89 Minutes | 122 (48.8%) | 37 (24.3%) |
| 90 or more Minutes | 15 (6.0%) | 13 (8.6%) |
Time of Departure to Work by Sex in Plandome
The most frequent times of departure to work in Plandome are 7:30 AM to 7:59 AM (58, 23.2%) for males and 7:00 AM to 7:29 AM (30, 19.7%) for females.
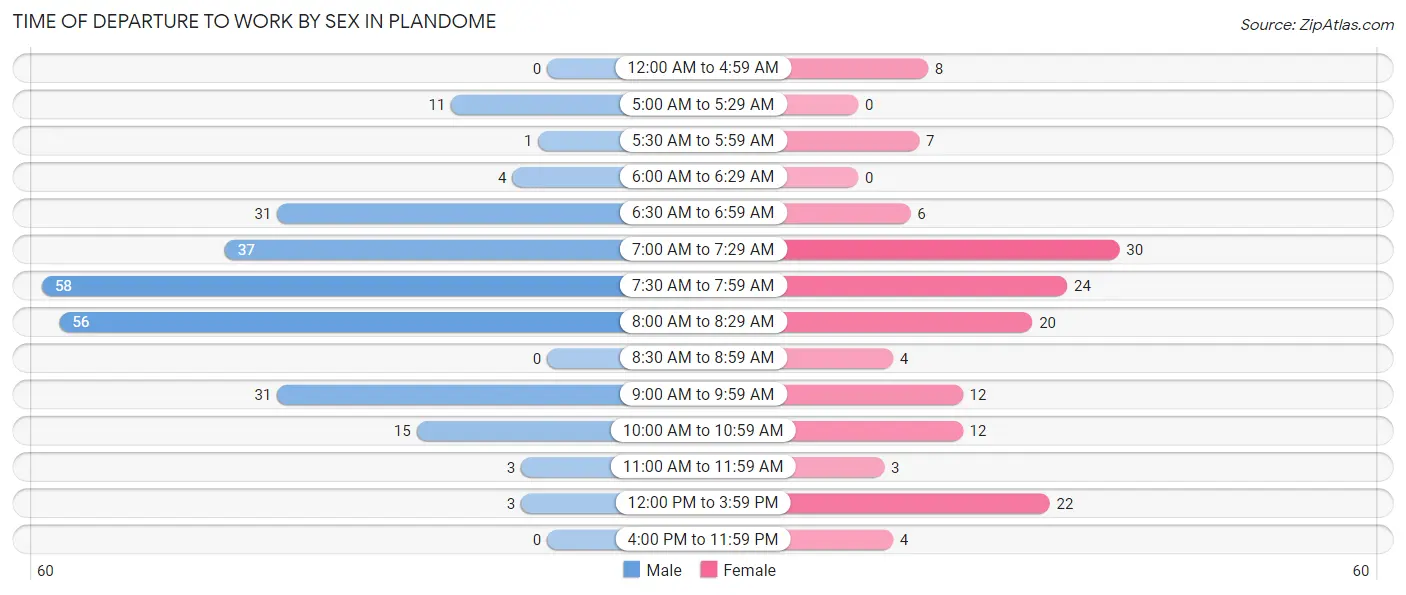
| Time of Departure | Male | Female |
| 12:00 AM to 4:59 AM | 0 (0.0%) | 8 (5.3%) |
| 5:00 AM to 5:29 AM | 11 (4.4%) | 0 (0.0%) |
| 5:30 AM to 5:59 AM | 1 (0.4%) | 7 (4.6%) |
| 6:00 AM to 6:29 AM | 4 (1.6%) | 0 (0.0%) |
| 6:30 AM to 6:59 AM | 31 (12.4%) | 6 (4.0%) |
| 7:00 AM to 7:29 AM | 37 (14.8%) | 30 (19.7%) |
| 7:30 AM to 7:59 AM | 58 (23.2%) | 24 (15.8%) |
| 8:00 AM to 8:29 AM | 56 (22.4%) | 20 (13.2%) |
| 8:30 AM to 8:59 AM | 0 (0.0%) | 4 (2.6%) |
| 9:00 AM to 9:59 AM | 31 (12.4%) | 12 (7.9%) |
| 10:00 AM to 10:59 AM | 15 (6.0%) | 12 (7.9%) |
| 11:00 AM to 11:59 AM | 3 (1.2%) | 3 (2.0%) |
| 12:00 PM to 3:59 PM | 3 (1.2%) | 22 (14.5%) |
| 4:00 PM to 11:59 PM | 0 (0.0%) | 4 (2.6%) |
| Total | 250 (100.0%) | 152 (100.0%) |
Housing Occupancy in Plandome
Occupancy by Ownership in Plandome
Of the total 424 dwellings in Plandome, owner-occupied units account for 412 (97.2%), while renter-occupied units make up 12 (2.8%).
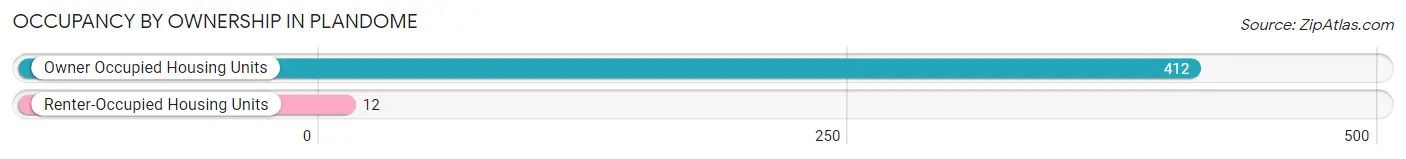
| Occupancy | # Housing Units | % Housing Units |
| Owner Occupied Housing Units | 412 | 97.2% |
| Renter-Occupied Housing Units | 12 | 2.8% |
| Total Occupied Housing Units | 424 | 100.0% |
Occupancy by Household Size in Plandome
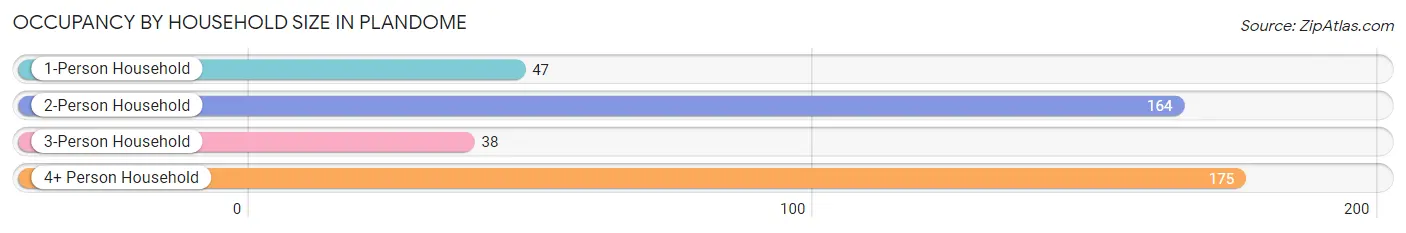
| Household Size | # Housing Units | % Housing Units |
| 1-Person Household | 47 | 11.1% |
| 2-Person Household | 164 | 38.7% |
| 3-Person Household | 38 | 9.0% |
| 4+ Person Household | 175 | 41.3% |
| Total Housing Units | 424 | 100.0% |
Occupancy by Ownership by Household Size in Plandome
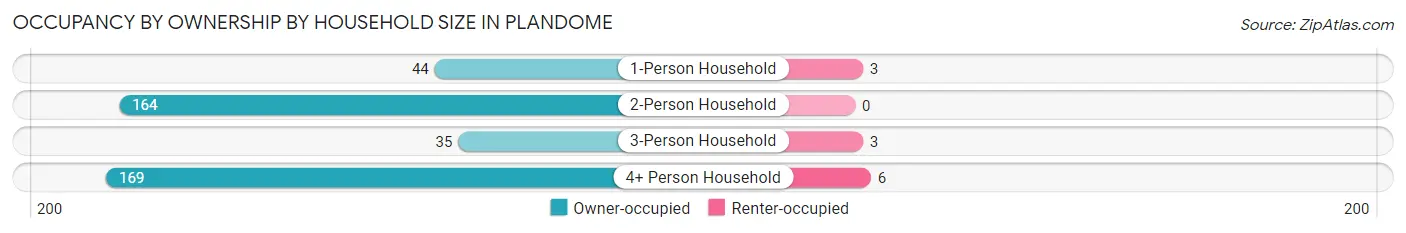
| Household Size | Owner-occupied | Renter-occupied |
| 1-Person Household | 44 (93.6%) | 3 (6.4%) |
| 2-Person Household | 164 (100.0%) | 0 (0.0%) |
| 3-Person Household | 35 (92.1%) | 3 (7.9%) |
| 4+ Person Household | 169 (96.6%) | 6 (3.4%) |
| Total Housing Units | 412 (97.2%) | 12 (2.8%) |
Occupancy by Educational Attainment in Plandome
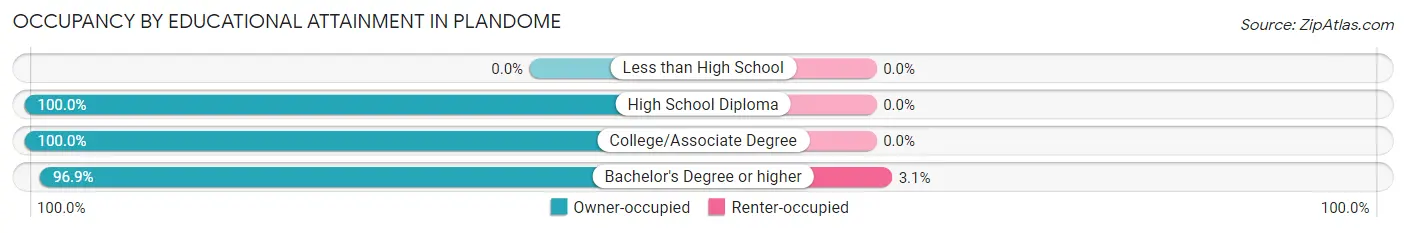
| Household Size | Owner-occupied | Renter-occupied |
| Less than High School | 0 (0.0%) | 0 (0.0%) |
| High School Diploma | 17 (100.0%) | 0 (0.0%) |
| College/Associate Degree | 19 (100.0%) | 0 (0.0%) |
| Bachelor's Degree or higher | 376 (96.9%) | 12 (3.1%) |
Occupancy by Age of Householder in Plandome
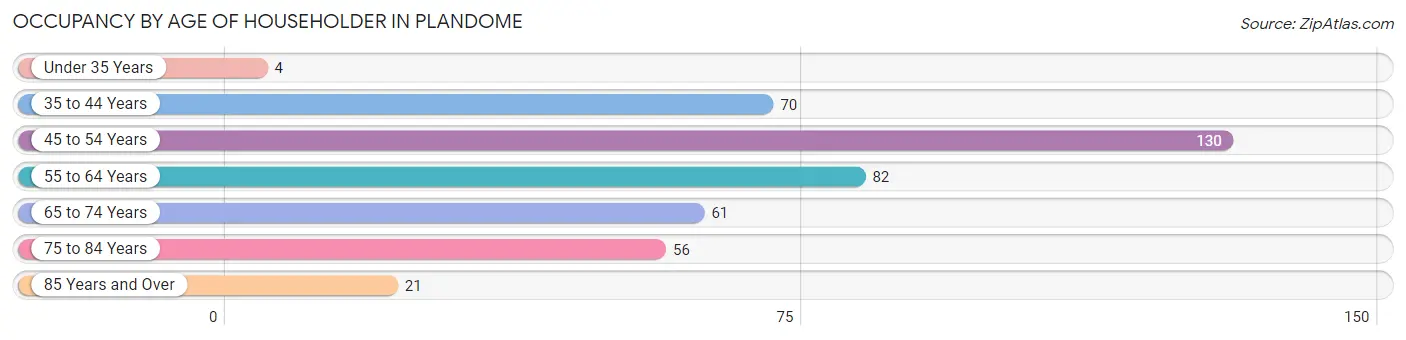
| Age Bracket | # Households | % Households |
| Under 35 Years | 4 | 0.9% |
| 35 to 44 Years | 70 | 16.5% |
| 45 to 54 Years | 130 | 30.7% |
| 55 to 64 Years | 82 | 19.3% |
| 65 to 74 Years | 61 | 14.4% |
| 75 to 84 Years | 56 | 13.2% |
| 85 Years and Over | 21 | 5.0% |
| Total | 424 | 100.0% |
Housing Finances in Plandome
Median Income by Occupancy in Plandome
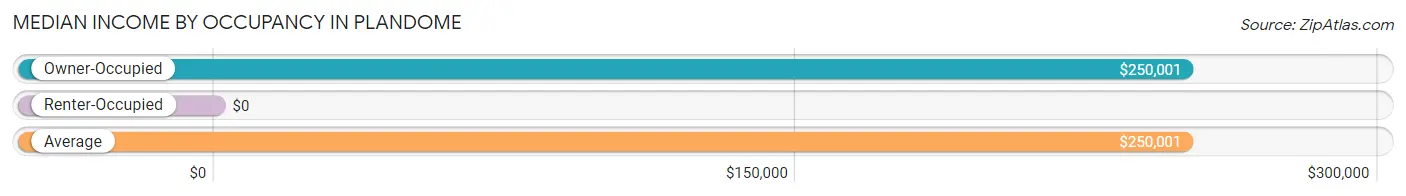
| Occupancy Type | # Households | Median Income |
| Owner-Occupied | 412 (97.2%) | $250,001 |
| Renter-Occupied | 12 (2.8%) | $0 |
| Average | 424 (100.0%) | $250,001 |
Occupancy by Householder Income Bracket in Plandome
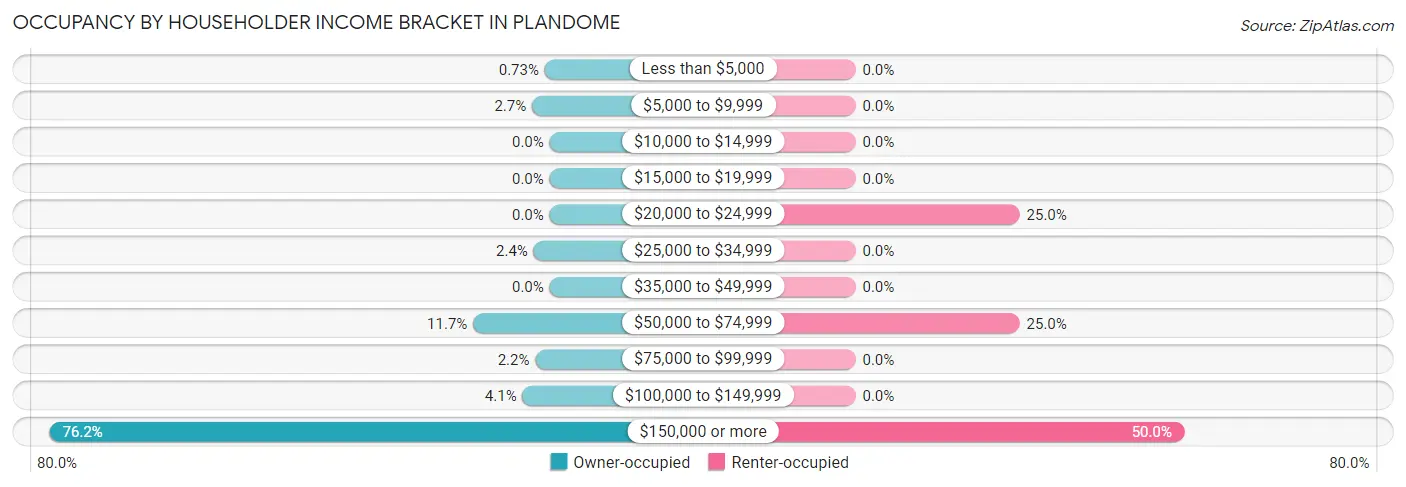
| Income Bracket | Owner-occupied | Renter-occupied |
| Less than $5,000 | 3 (0.7%) | 0 (0.0%) |
| $5,000 to $9,999 | 11 (2.7%) | 0 (0.0%) |
| $10,000 to $14,999 | 0 (0.0%) | 0 (0.0%) |
| $15,000 to $19,999 | 0 (0.0%) | 0 (0.0%) |
| $20,000 to $24,999 | 0 (0.0%) | 3 (25.0%) |
| $25,000 to $34,999 | 10 (2.4%) | 0 (0.0%) |
| $35,000 to $49,999 | 0 (0.0%) | 0 (0.0%) |
| $50,000 to $74,999 | 48 (11.7%) | 3 (25.0%) |
| $75,000 to $99,999 | 9 (2.2%) | 0 (0.0%) |
| $100,000 to $149,999 | 17 (4.1%) | 0 (0.0%) |
| $150,000 or more | 314 (76.2%) | 6 (50.0%) |
| Total | 412 (100.0%) | 12 (100.0%) |
Monthly Housing Cost Tiers in Plandome
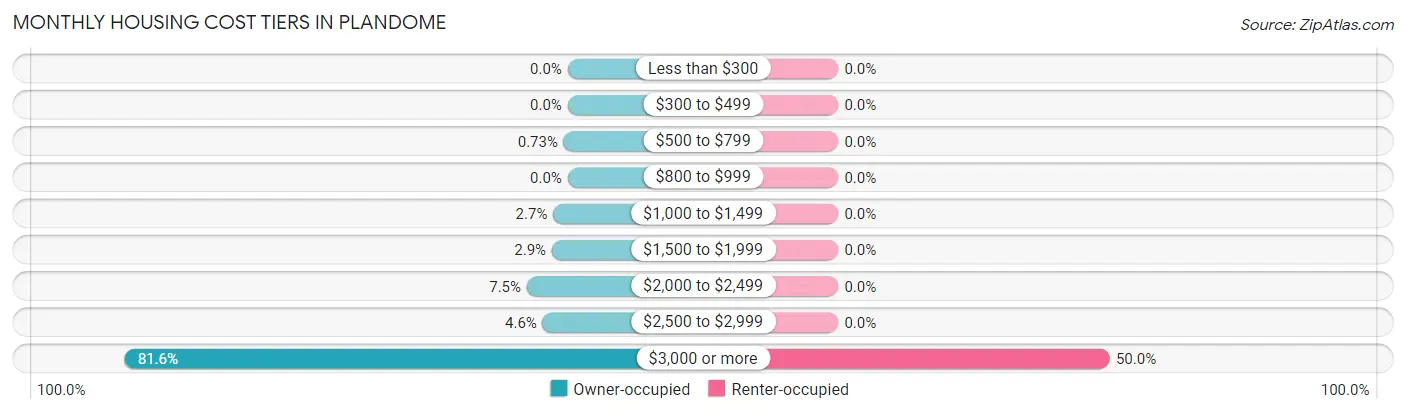
| Monthly Cost | Owner-occupied | Renter-occupied |
| Less than $300 | 0 (0.0%) | 0 (0.0%) |
| $300 to $499 | 0 (0.0%) | 0 (0.0%) |
| $500 to $799 | 3 (0.7%) | 0 (0.0%) |
| $800 to $999 | 0 (0.0%) | 0 (0.0%) |
| $1,000 to $1,499 | 11 (2.7%) | 0 (0.0%) |
| $1,500 to $1,999 | 12 (2.9%) | 0 (0.0%) |
| $2,000 to $2,499 | 31 (7.5%) | 0 (0.0%) |
| $2,500 to $2,999 | 19 (4.6%) | 0 (0.0%) |
| $3,000 or more | 336 (81.6%) | 6 (50.0%) |
| Total | 412 (100.0%) | 12 (100.0%) |
Physical Housing Characteristics in Plandome
Housing Structures in Plandome
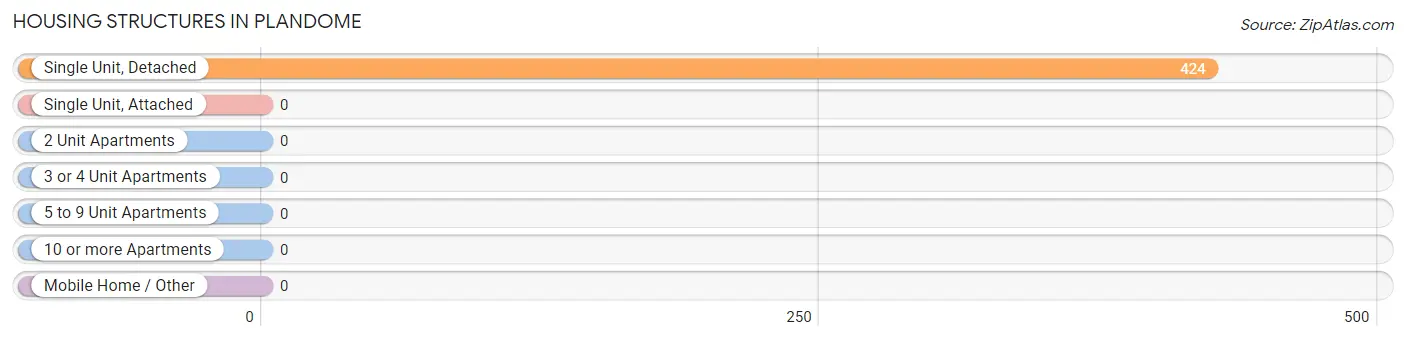
| Structure Type | # Housing Units | % Housing Units |
| Single Unit, Detached | 424 | 100.0% |
| Single Unit, Attached | 0 | 0.0% |
| 2 Unit Apartments | 0 | 0.0% |
| 3 or 4 Unit Apartments | 0 | 0.0% |
| 5 to 9 Unit Apartments | 0 | 0.0% |
| 10 or more Apartments | 0 | 0.0% |
| Mobile Home / Other | 0 | 0.0% |
| Total | 424 | 100.0% |
Housing Structures by Occupancy in Plandome
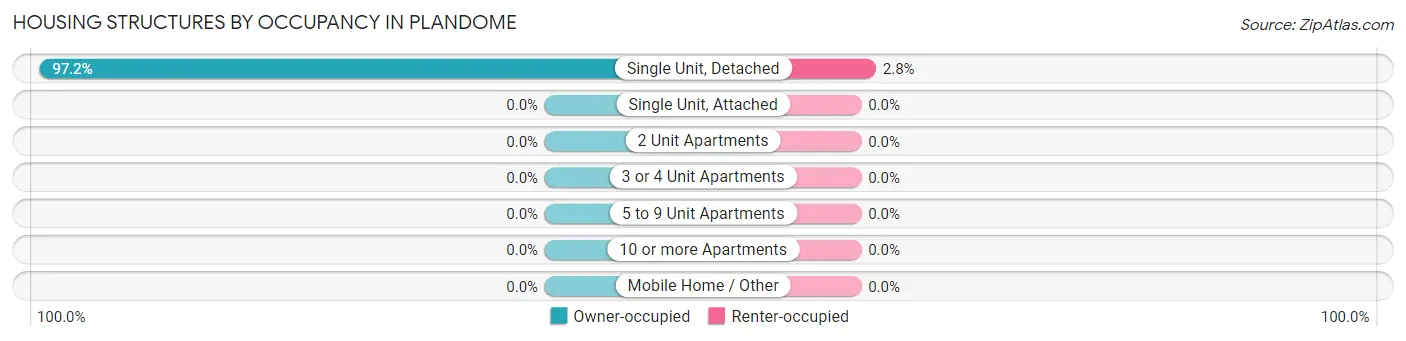
| Structure Type | Owner-occupied | Renter-occupied |
| Single Unit, Detached | 412 (97.2%) | 12 (2.8%) |
| Single Unit, Attached | 0 (0.0%) | 0 (0.0%) |
| 2 Unit Apartments | 0 (0.0%) | 0 (0.0%) |
| 3 or 4 Unit Apartments | 0 (0.0%) | 0 (0.0%) |
| 5 to 9 Unit Apartments | 0 (0.0%) | 0 (0.0%) |
| 10 or more Apartments | 0 (0.0%) | 0 (0.0%) |
| Mobile Home / Other | 0 (0.0%) | 0 (0.0%) |
| Total | 412 (97.2%) | 12 (2.8%) |
Housing Structures by Number of Rooms in Plandome
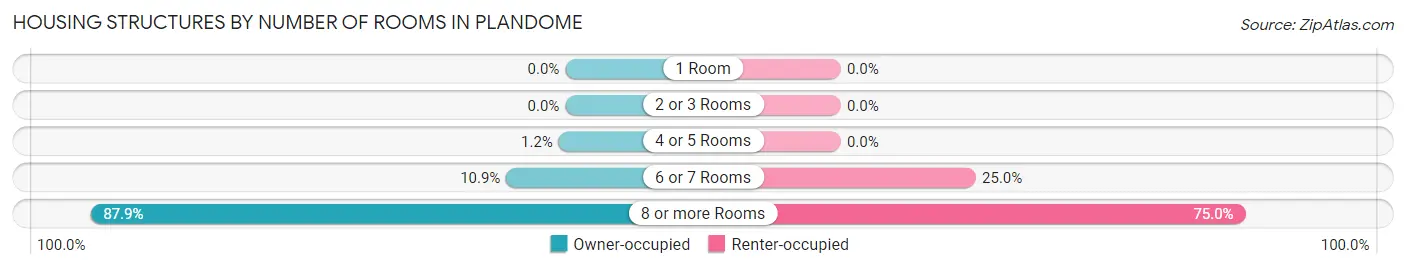
| Number of Rooms | Owner-occupied | Renter-occupied |
| 1 Room | 0 (0.0%) | 0 (0.0%) |
| 2 or 3 Rooms | 0 (0.0%) | 0 (0.0%) |
| 4 or 5 Rooms | 5 (1.2%) | 0 (0.0%) |
| 6 or 7 Rooms | 45 (10.9%) | 3 (25.0%) |
| 8 or more Rooms | 362 (87.9%) | 9 (75.0%) |
| Total | 412 (100.0%) | 12 (100.0%) |
Housing Structure by Heating Type in Plandome
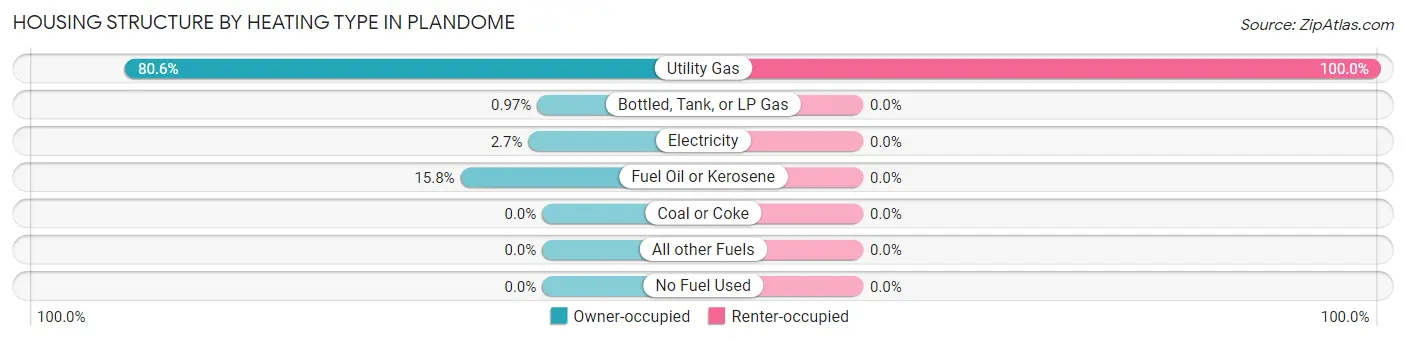
| Heating Type | Owner-occupied | Renter-occupied |
| Utility Gas | 332 (80.6%) | 12 (100.0%) |
| Bottled, Tank, or LP Gas | 4 (1.0%) | 0 (0.0%) |
| Electricity | 11 (2.7%) | 0 (0.0%) |
| Fuel Oil or Kerosene | 65 (15.8%) | 0 (0.0%) |
| Coal or Coke | 0 (0.0%) | 0 (0.0%) |
| All other Fuels | 0 (0.0%) | 0 (0.0%) |
| No Fuel Used | 0 (0.0%) | 0 (0.0%) |
| Total | 412 (100.0%) | 12 (100.0%) |
Household Vehicle Usage in Plandome
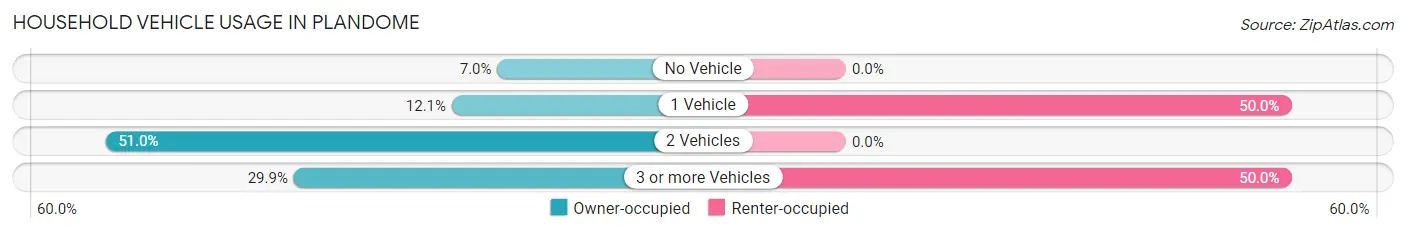
| Vehicles per Household | Owner-occupied | Renter-occupied |
| No Vehicle | 29 (7.0%) | 0 (0.0%) |
| 1 Vehicle | 50 (12.1%) | 6 (50.0%) |
| 2 Vehicles | 210 (51.0%) | 0 (0.0%) |
| 3 or more Vehicles | 123 (29.8%) | 6 (50.0%) |
| Total | 412 (100.0%) | 12 (100.0%) |
Real Estate & Mortgages in Plandome
Real Estate and Mortgage Overview in Plandome
| Characteristic | Without Mortgage | With Mortgage |
| Housing Units | 176 | 236 |
| Median Property Value | $2,000,001 | $2,000,001 |
| Median Household Income | $250,001 | $194 |
| Monthly Housing Costs | $1,501 | $230 |
| Real Estate Taxes | $10,001 | $0 |
Property Value by Mortgage Status in Plandome
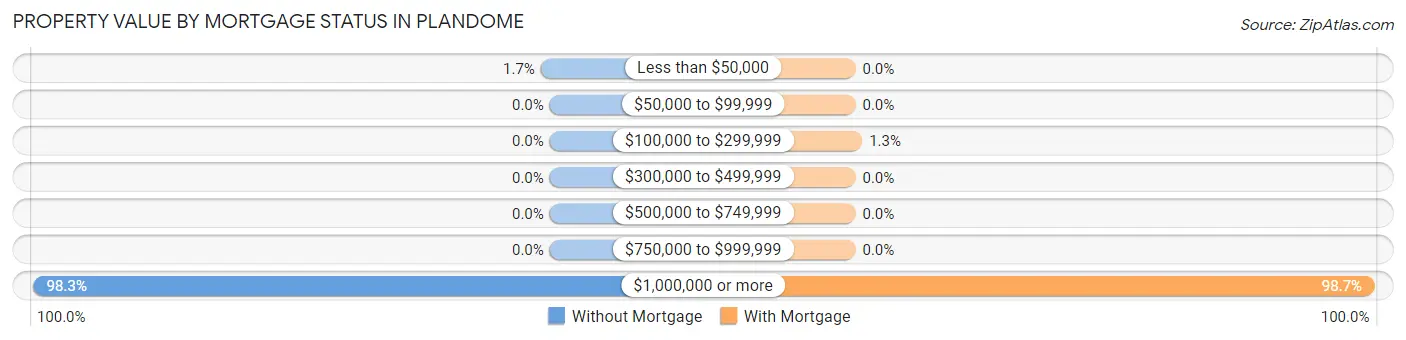
| Property Value | Without Mortgage | With Mortgage |
| Less than $50,000 | 3 (1.7%) | 0 (0.0%) |
| $50,000 to $99,999 | 0 (0.0%) | 0 (0.0%) |
| $100,000 to $299,999 | 0 (0.0%) | 3 (1.3%) |
| $300,000 to $499,999 | 0 (0.0%) | 0 (0.0%) |
| $500,000 to $749,999 | 0 (0.0%) | 0 (0.0%) |
| $750,000 to $999,999 | 0 (0.0%) | 0 (0.0%) |
| $1,000,000 or more | 173 (98.3%) | 233 (98.7%) |
| Total | 176 (100.0%) | 236 (100.0%) |
Household Income by Mortgage Status in Plandome
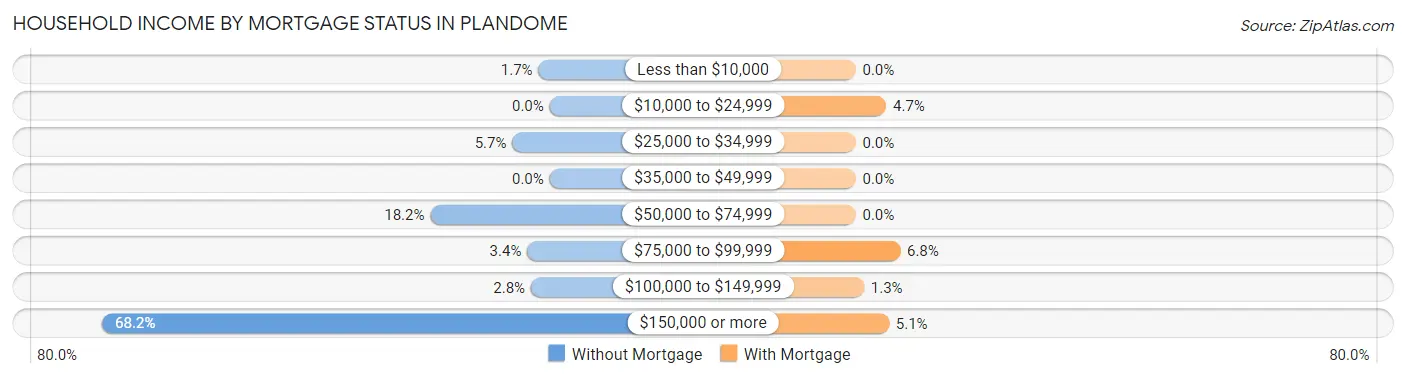
| Household Income | Without Mortgage | With Mortgage |
| Less than $10,000 | 3 (1.7%) | 0 (0.0%) |
| $10,000 to $24,999 | 0 (0.0%) | 11 (4.7%) |
| $25,000 to $34,999 | 10 (5.7%) | 0 (0.0%) |
| $35,000 to $49,999 | 0 (0.0%) | 0 (0.0%) |
| $50,000 to $74,999 | 32 (18.2%) | 0 (0.0%) |
| $75,000 to $99,999 | 6 (3.4%) | 16 (6.8%) |
| $100,000 to $149,999 | 5 (2.8%) | 3 (1.3%) |
| $150,000 or more | 120 (68.2%) | 12 (5.1%) |
| Total | 176 (100.0%) | 236 (100.0%) |
Property Value to Household Income Ratio in Plandome
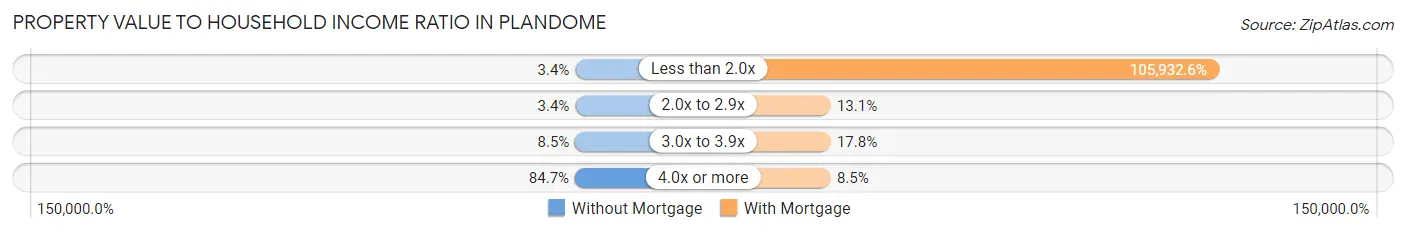
| Value-to-Income Ratio | Without Mortgage | With Mortgage |
| Less than 2.0x | 6 (3.4%) | 250,001 (105,932.6%) |
| 2.0x to 2.9x | 6 (3.4%) | 31 (13.1%) |
| 3.0x to 3.9x | 15 (8.5%) | 42 (17.8%) |
| 4.0x or more | 149 (84.7%) | 20 (8.5%) |
| Total | 176 (100.0%) | 236 (100.0%) |
Real Estate Taxes by Mortgage Status in Plandome
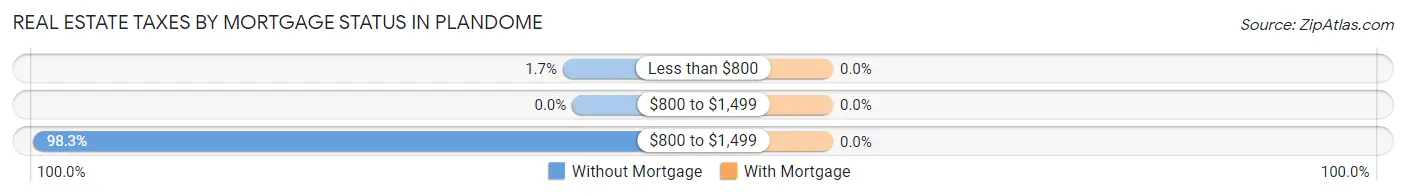
| Property Taxes | Without Mortgage | With Mortgage |
| Less than $800 | 3 (1.7%) | 0 (0.0%) |
| $800 to $1,499 | 0 (0.0%) | 0 (0.0%) |
| $800 to $1,499 | 173 (98.3%) | 0 (0.0%) |
| Total | 176 (100.0%) | 236 (100.0%) |
Health & Disability in Plandome
Health Insurance Coverage by Age in Plandome
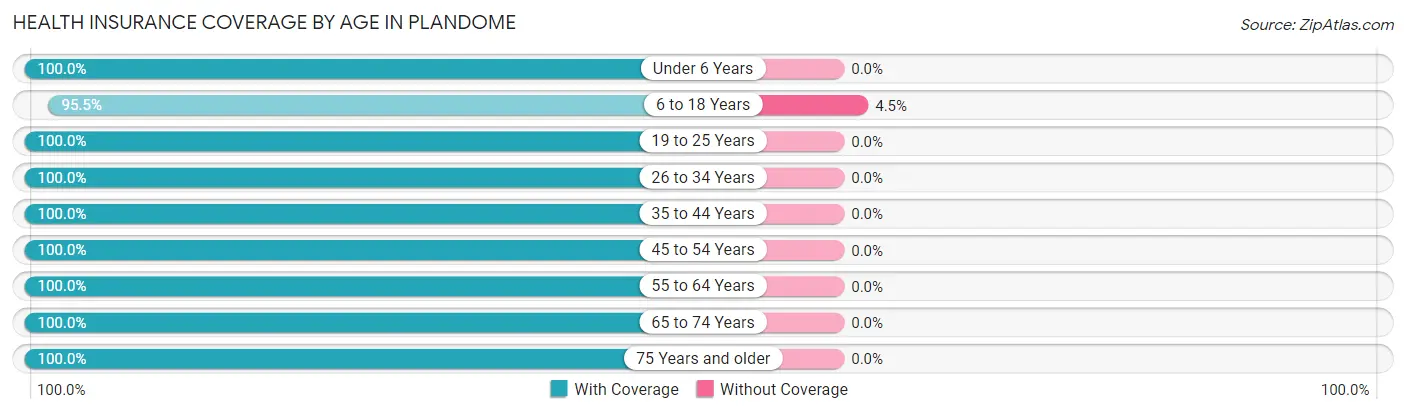
| Age Bracket | With Coverage | Without Coverage |
| Under 6 Years | 67 (100.0%) | 0 (0.0%) |
| 6 to 18 Years | 363 (95.5%) | 17 (4.5%) |
| 19 to 25 Years | 57 (100.0%) | 0 (0.0%) |
| 26 to 34 Years | 55 (100.0%) | 0 (0.0%) |
| 35 to 44 Years | 144 (100.0%) | 0 (0.0%) |
| 45 to 54 Years | 250 (100.0%) | 0 (0.0%) |
| 55 to 64 Years | 183 (100.0%) | 0 (0.0%) |
| 65 to 74 Years | 109 (100.0%) | 0 (0.0%) |
| 75 Years and older | 118 (100.0%) | 0 (0.0%) |
| Total | 1,346 (98.8%) | 17 (1.3%) |
Health Insurance Coverage by Citizenship Status in Plandome
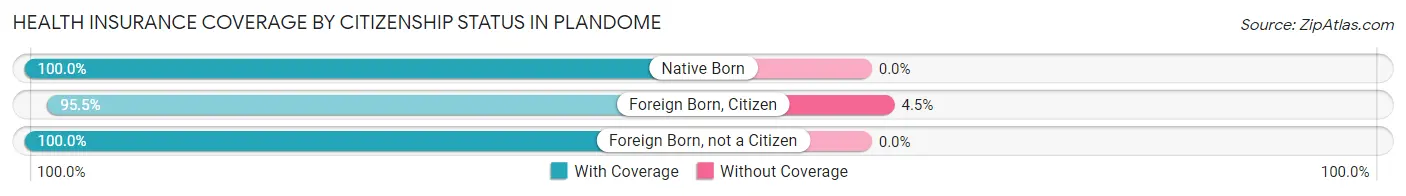
| Citizenship Status | With Coverage | Without Coverage |
| Native Born | 67 (100.0%) | 0 (0.0%) |
| Foreign Born, Citizen | 363 (95.5%) | 17 (4.5%) |
| Foreign Born, not a Citizen | 57 (100.0%) | 0 (0.0%) |
Health Insurance Coverage by Household Income in Plandome
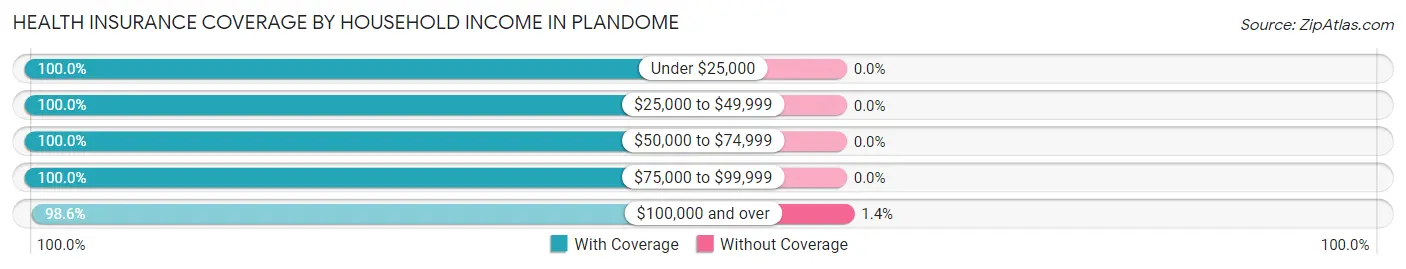
| Household Income | With Coverage | Without Coverage |
| Under $25,000 | 50 (100.0%) | 0 (0.0%) |
| $25,000 to $49,999 | 10 (100.0%) | 0 (0.0%) |
| $50,000 to $74,999 | 89 (100.0%) | 0 (0.0%) |
| $75,000 to $99,999 | 17 (100.0%) | 0 (0.0%) |
| $100,000 and over | 1,180 (98.6%) | 17 (1.4%) |
Public vs Private Health Insurance Coverage by Age in Plandome
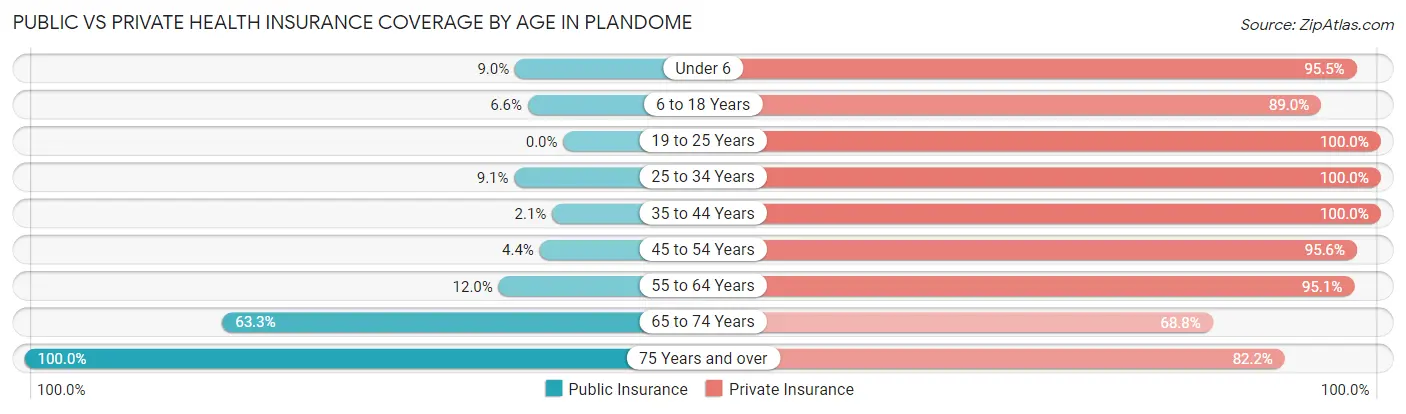
| Age Bracket | Public Insurance | Private Insurance |
| Under 6 | 6 (9.0%) | 64 (95.5%) |
| 6 to 18 Years | 25 (6.6%) | 338 (88.9%) |
| 19 to 25 Years | 0 (0.0%) | 57 (100.0%) |
| 25 to 34 Years | 5 (9.1%) | 55 (100.0%) |
| 35 to 44 Years | 3 (2.1%) | 144 (100.0%) |
| 45 to 54 Years | 11 (4.4%) | 239 (95.6%) |
| 55 to 64 Years | 22 (12.0%) | 174 (95.1%) |
| 65 to 74 Years | 69 (63.3%) | 75 (68.8%) |
| 75 Years and over | 118 (100.0%) | 97 (82.2%) |
| Total | 259 (19.0%) | 1,243 (91.2%) |
Disability Status by Sex by Age in Plandome
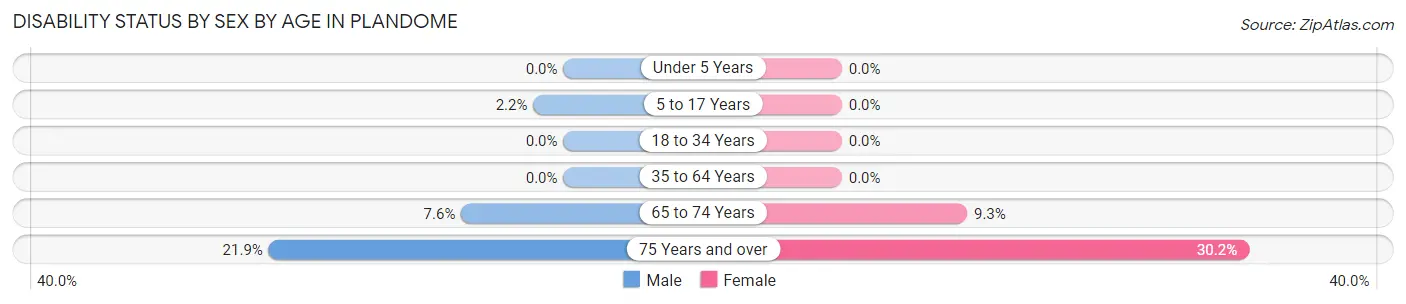
| Age Bracket | Male | Female |
| Under 5 Years | 0 (0.0%) | 0 (0.0%) |
| 5 to 17 Years | 4 (2.2%) | 0 (0.0%) |
| 18 to 34 Years | 0 (0.0%) | 0 (0.0%) |
| 35 to 64 Years | 0 (0.0%) | 0 (0.0%) |
| 65 to 74 Years | 5 (7.6%) | 4 (9.3%) |
| 75 Years and over | 7 (21.9%) | 26 (30.2%) |
Disability Class by Sex by Age in Plandome
Disability Class: Hearing Difficulty
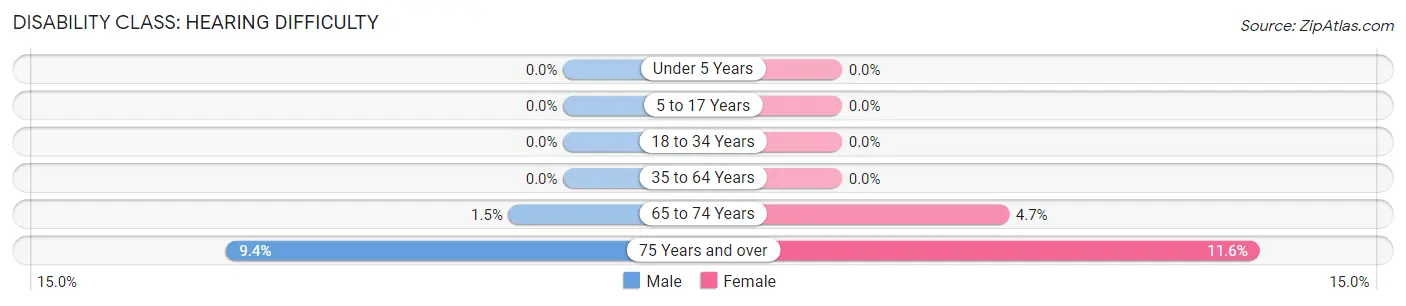
| Age Bracket | Male | Female |
| Under 5 Years | 0 (0.0%) | 0 (0.0%) |
| 5 to 17 Years | 0 (0.0%) | 0 (0.0%) |
| 18 to 34 Years | 0 (0.0%) | 0 (0.0%) |
| 35 to 64 Years | 0 (0.0%) | 0 (0.0%) |
| 65 to 74 Years | 1 (1.5%) | 2 (4.6%) |
| 75 Years and over | 3 (9.4%) | 10 (11.6%) |
Disability Class: Vision Difficulty
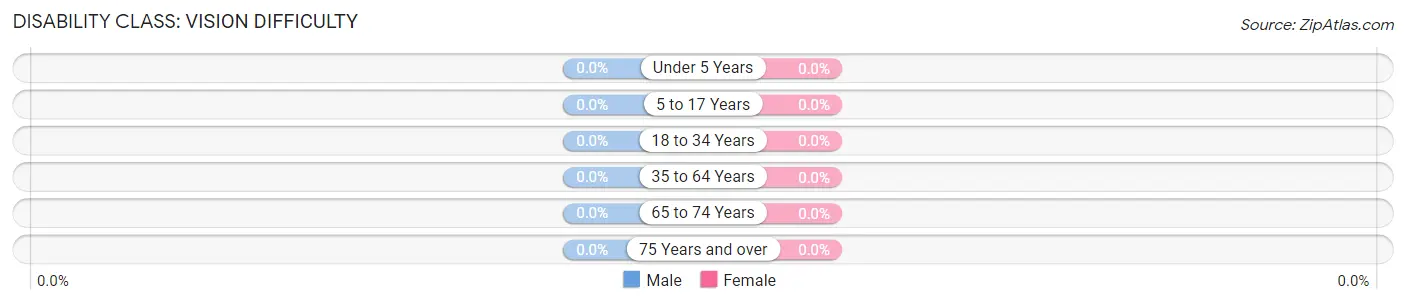
| Age Bracket | Male | Female |
| Under 5 Years | 0 (0.0%) | 0 (0.0%) |
| 5 to 17 Years | 0 (0.0%) | 0 (0.0%) |
| 18 to 34 Years | 0 (0.0%) | 0 (0.0%) |
| 35 to 64 Years | 0 (0.0%) | 0 (0.0%) |
| 65 to 74 Years | 0 (0.0%) | 0 (0.0%) |
| 75 Years and over | 0 (0.0%) | 0 (0.0%) |
Disability Class: Cognitive Difficulty
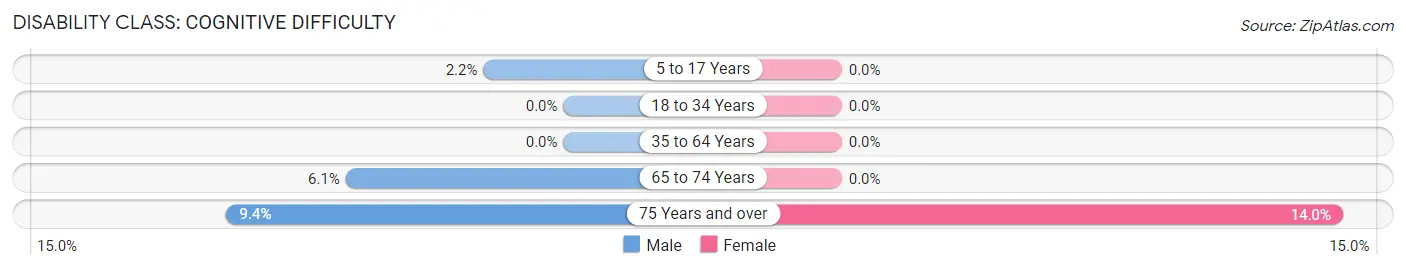
| Age Bracket | Male | Female |
| 5 to 17 Years | 4 (2.2%) | 0 (0.0%) |
| 18 to 34 Years | 0 (0.0%) | 0 (0.0%) |
| 35 to 64 Years | 0 (0.0%) | 0 (0.0%) |
| 65 to 74 Years | 4 (6.1%) | 0 (0.0%) |
| 75 Years and over | 3 (9.4%) | 12 (14.0%) |
Disability Class: Ambulatory Difficulty
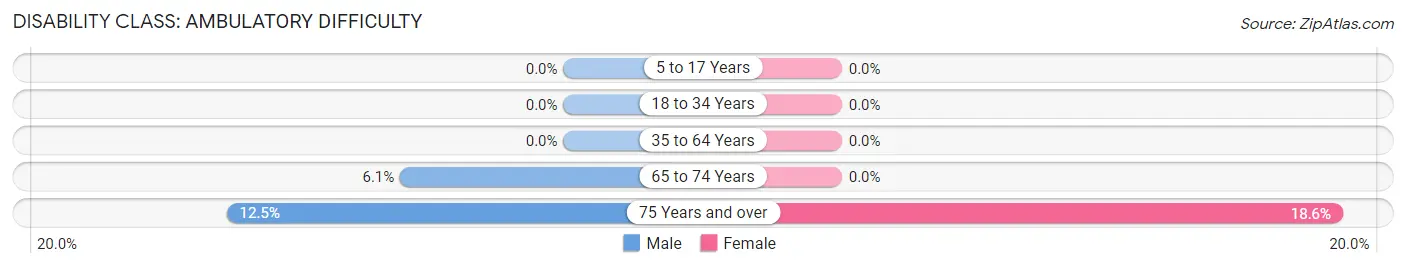
| Age Bracket | Male | Female |
| 5 to 17 Years | 0 (0.0%) | 0 (0.0%) |
| 18 to 34 Years | 0 (0.0%) | 0 (0.0%) |
| 35 to 64 Years | 0 (0.0%) | 0 (0.0%) |
| 65 to 74 Years | 4 (6.1%) | 0 (0.0%) |
| 75 Years and over | 4 (12.5%) | 16 (18.6%) |
Disability Class: Self-Care Difficulty
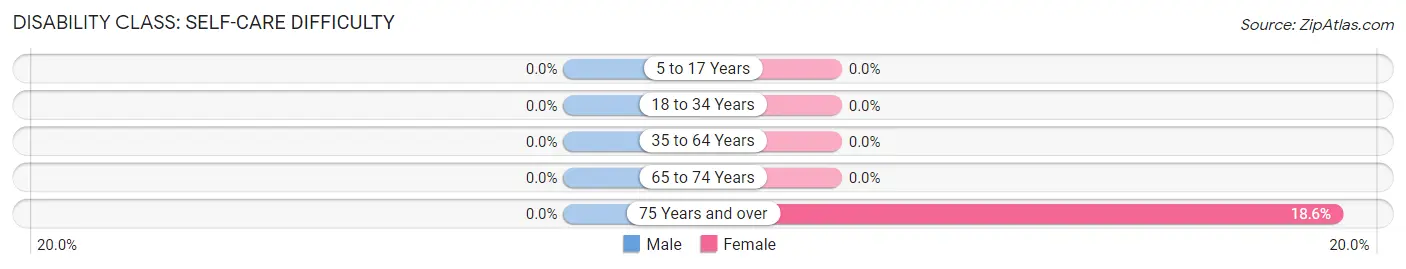
| Age Bracket | Male | Female |
| 5 to 17 Years | 0 (0.0%) | 0 (0.0%) |
| 18 to 34 Years | 0 (0.0%) | 0 (0.0%) |
| 35 to 64 Years | 0 (0.0%) | 0 (0.0%) |
| 65 to 74 Years | 0 (0.0%) | 0 (0.0%) |
| 75 Years and over | 0 (0.0%) | 16 (18.6%) |
Technology Access in Plandome
Computing Device Access in Plandome
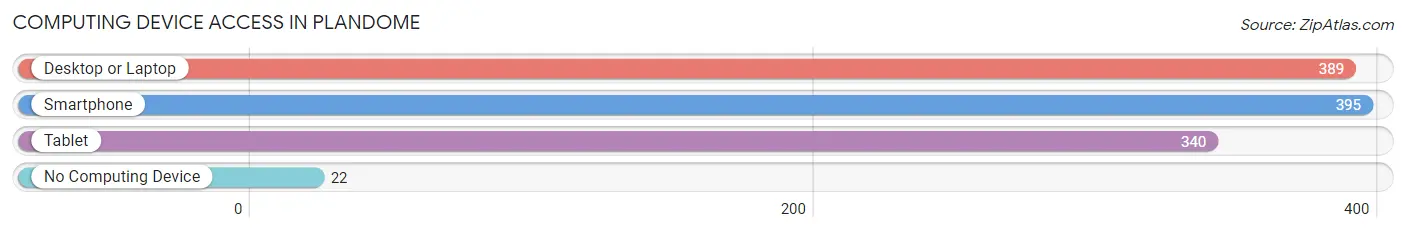
| Device Type | # Households | % Households |
| Desktop or Laptop | 389 | 91.7% |
| Smartphone | 395 | 93.2% |
| Tablet | 340 | 80.2% |
| No Computing Device | 22 | 5.2% |
| Total | 424 | 100.0% |
Internet Access in Plandome
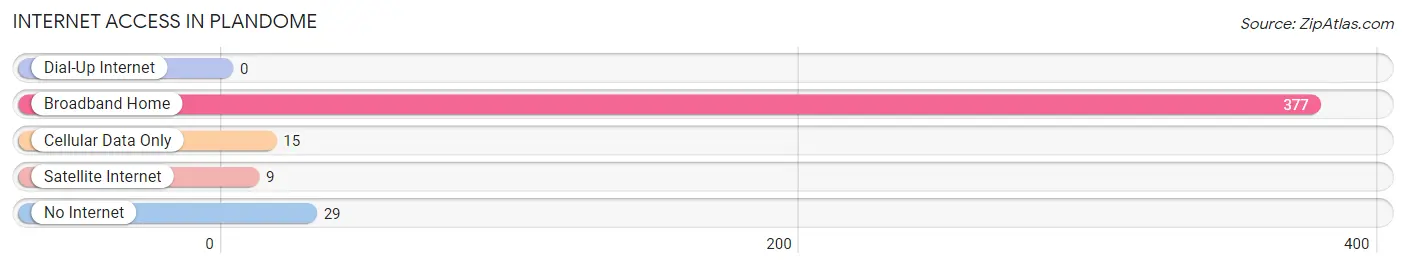
| Internet Type | # Households | % Households |
| Dial-Up Internet | 0 | 0.0% |
| Broadband Home | 377 | 88.9% |
| Cellular Data Only | 15 | 3.5% |
| Satellite Internet | 9 | 2.1% |
| No Internet | 29 | 6.8% |
| Total | 424 | 100.0% |
Plandome Summary
Plandome is a village located in Nassau County, New York, United States. It is situated on the North Shore of Long Island, approximately 18 miles east of Manhattan. The village is part of the Town of North Hempstead and is bordered by the villages of Manhasset, Munsey Park, and Flower Hill. As of the 2010 census, the population of Plandome was 1,567.
Geography
Plandome is located at 40°48'17" North, 73°41'17" West (40.804722, -73.688056). According to the United States Census Bureau, the village has a total area of 0.3 square miles (0.8 km2), all of it land.
Demographics
As of the census of 2000, there were 1,567 people, 545 households, and 441 families residing in the village. The population density was 5,541.3 people per square mile (2,139.2/km2). There were 554 housing units at an average density of 1,945.2 per square mile (743.2/km2). The racial makeup of the village was 94.45% White, 0.51% African American, 0.19% Native American, 3.45% Asian, 0.06% Pacific Islander, 0.51% from other races, and 0.83% from two or more races. Hispanic or Latino of any race were 2.90% of the population.
Economy
Plandome is a primarily residential community, with no major commercial or industrial businesses. The village is home to a variety of small businesses, including restaurants, retail stores, and professional services. The village is also home to the Plandome Country Club, which offers golf, tennis, and swimming.
Education
Plandome is served by the Manhasset School District. The district includes three elementary schools, one middle school, and one high school. The village is also home to the Plandome Heights School, a private school for grades K-8.
Transportation
Plandome is served by the Long Island Rail Road, with the Plandome station located in the village. The village is also served by the Nassau Inter-County Express (NICE) bus system, with routes connecting the village to Manhasset, Port Washington, and other nearby communities.
Culture
Plandome is home to a variety of cultural and recreational activities. The village is home to the Plandome Country Club, which offers golf, tennis, and swimming. The village also hosts a variety of annual events, including the Plandome Summer Festival and the Plandome Fall Festival. The village is also home to the Plandome Art Gallery, which features works by local artists.
Common Questions
What is Per Capita Income in Plandome?
Per Capita income in Plandome is $169,729.
What is the Median Family Income in Plandome?
Median Family Income in Plandome is $250,001.
What is the Median Household income in Plandome?
Median Household Income in Plandome is $250,001.
What is Income or Wage Gap in Plandome?
Income or Wage Gap in Plandome is 72.2%.
Women in Plandome earn 27.8 cents for every dollar earned by a man.
What is Inequality or Gini Index in Plandome?
Inequality or Gini Index in Plandome is 0.48.
What is the Total Population of Plandome?
Total Population of Plandome is 1,365.
What is the Total Male Population of Plandome?
Total Male Population of Plandome is 608.
What is the Total Female Population of Plandome?
Total Female Population of Plandome is 757.
What is the Ratio of Males per 100 Females in Plandome?
There are 80.32 Males per 100 Females in Plandome.
What is the Ratio of Females per 100 Males in Plandome?
There are 124.51 Females per 100 Males in Plandome.
What is the Median Population Age in Plandome?
Median Population Age in Plandome is 44.3 Years.
What is the Average Family Size in Plandome
Average Family Size in Plandome is 3.5 People.
What is the Average Household Size in Plandome
Average Household Size in Plandome is 3.2 People.
How Large is the Labor Force in Plandome?
There are 579 People in the Labor Forcein in Plandome.
What is the Percentage of People in the Labor Force in Plandome?
59.2% of People are in the Labor Force in Plandome.
What is the Unemployment Rate in Plandome?
Unemployment Rate in Plandome is 2.4%.