Northport, NY Map & Demographics
Northport Map
Northport Overview
$79,808
PER CAPITA INCOME
$166,613
AVG FAMILY INCOME
$137,487
AVG HOUSEHOLD INCOME
24.8%
WAGE / INCOME GAP [ % ]
75.2¢/ $1
WAGE / INCOME GAP [ $ ]
0.49
INEQUALITY / GINI INDEX
7,337
TOTAL POPULATION
3,382
MALE POPULATION
3,955
FEMALE POPULATION
85.51
MALES / 100 FEMALES
116.94
FEMALES / 100 MALES
51.2
MEDIAN AGE
2.9
AVG FAMILY SIZE
2.4
AVG HOUSEHOLD SIZE
4,133
LABOR FORCE [ PEOPLE ]
66.1%
PERCENT IN LABOR FORCE
0.5%
UNEMPLOYMENT RATE
Northport Zip Codes
Northport Area Codes
Income in Northport
Income Overview in Northport
Per Capita Income in Northport is $79,808, while median incomes of families and households are $166,613 and $137,487 respectively.
| Characteristic | Number | Measure |
| Per Capita Income | 7,337 | $79,808 |
| Median Family Income | 2,050 | $166,613 |
| Mean Family Income | 2,050 | $228,330 |
| Median Household Income | 2,999 | $137,487 |
| Mean Household Income | 2,999 | $188,255 |
| Income Deficit | 2,050 | $0 |
| Wage / Income Gap (%) | 7,337 | 24.77% |
| Wage / Income Gap ($) | 7,337 | 75.23¢ per $1 |
| Gini / Inequality Index | 7,337 | 0.49 |
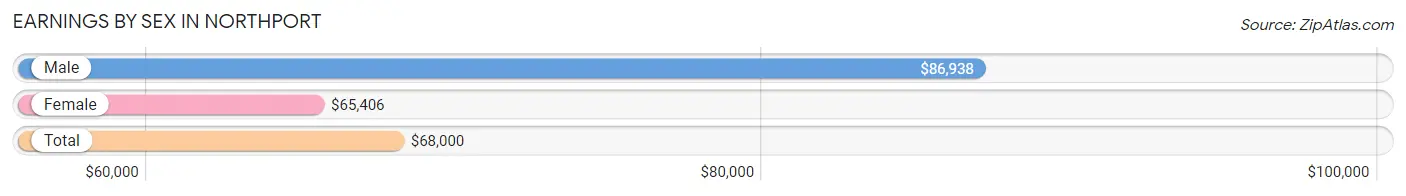
Earnings by Sex in Northport
Average Earnings in Northport are $68,000, $86,938 for men and $65,406 for women, a difference of 24.8%.
| Sex | Number | Average Earnings |
| Male | 1,999 (46.4%) | $86,938 |
| Female | 2,313 (53.6%) | $65,406 |
| Total | 4,312 (100.0%) | $68,000 |
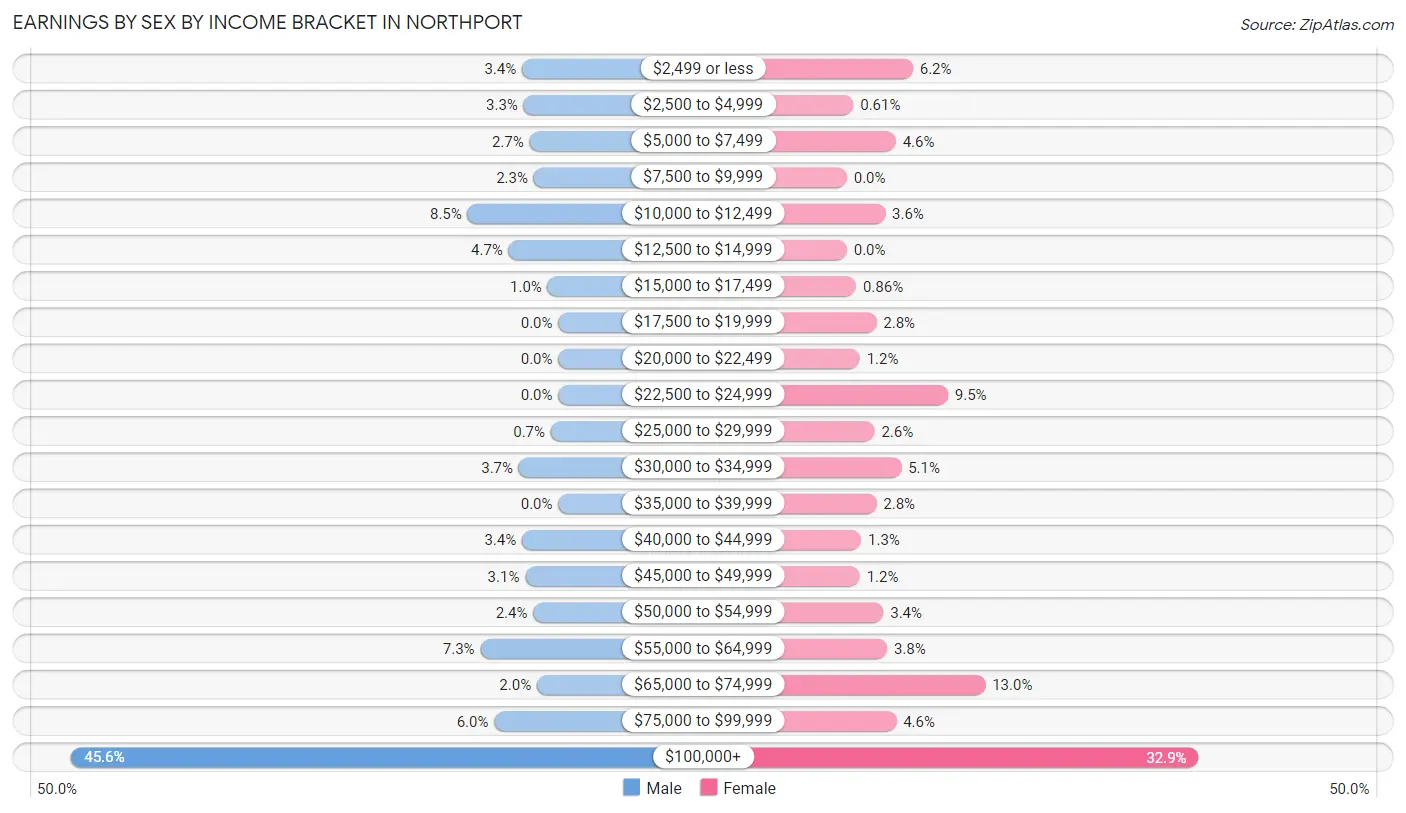
Earnings by Sex by Income Bracket in Northport
The most common earnings brackets in Northport are $100,000+ for men (912 | 45.6%) and $100,000+ for women (762 | 32.9%).
| Income | Male | Female |
| $2,499 or less | 68 (3.4%) | 143 (6.2%) |
| $2,500 to $4,999 | 65 (3.3%) | 14 (0.6%) |
| $5,000 to $7,499 | 54 (2.7%) | 106 (4.6%) |
| $7,500 to $9,999 | 46 (2.3%) | 0 (0.0%) |
| $10,000 to $12,499 | 170 (8.5%) | 83 (3.6%) |
| $12,500 to $14,999 | 93 (4.6%) | 0 (0.0%) |
| $15,000 to $17,499 | 20 (1.0%) | 20 (0.9%) |
| $17,500 to $19,999 | 0 (0.0%) | 64 (2.8%) |
| $20,000 to $22,499 | 0 (0.0%) | 28 (1.2%) |
| $22,500 to $24,999 | 0 (0.0%) | 219 (9.5%) |
| $25,000 to $29,999 | 14 (0.7%) | 60 (2.6%) |
| $30,000 to $34,999 | 74 (3.7%) | 118 (5.1%) |
| $35,000 to $39,999 | 0 (0.0%) | 64 (2.8%) |
| $40,000 to $44,999 | 68 (3.4%) | 31 (1.3%) |
| $45,000 to $49,999 | 62 (3.1%) | 28 (1.2%) |
| $50,000 to $54,999 | 47 (2.4%) | 79 (3.4%) |
| $55,000 to $64,999 | 146 (7.3%) | 87 (3.8%) |
| $65,000 to $74,999 | 40 (2.0%) | 300 (13.0%) |
| $75,000 to $99,999 | 120 (6.0%) | 107 (4.6%) |
| $100,000+ | 912 (45.6%) | 762 (32.9%) |
| Total | 1,999 (100.0%) | 2,313 (100.0%) |
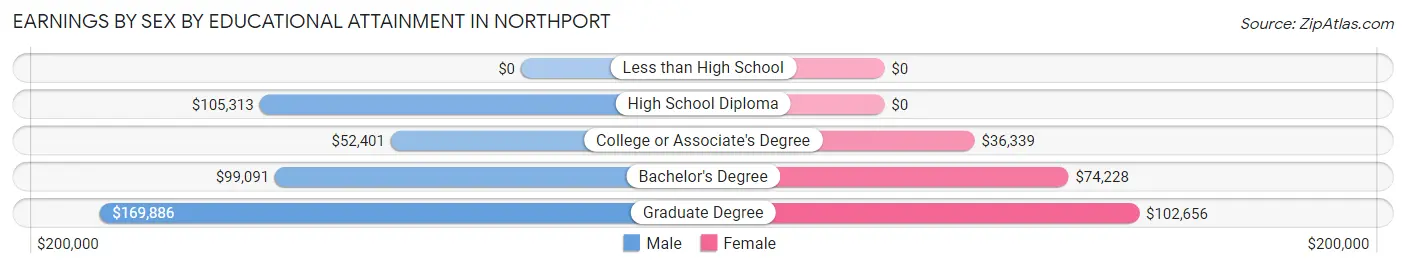
Earnings by Sex by Educational Attainment in Northport
Average earnings in Northport are $100,000 for men and $73,306 for women, a difference of 26.7%. Men with an educational attainment of graduate degree enjoy the highest average annual earnings of $169,886, while those with college or associate's degree education earn the least with $52,401. Women with an educational attainment of graduate degree earn the most with the average annual earnings of $102,656, while those with college or associate's degree education have the smallest earnings of $36,339.
| Educational Attainment | Male Income | Female Income |
| Less than High School | - | - |
| High School Diploma | $105,313 | $0 |
| College or Associate's Degree | $52,401 | $36,339 |
| Bachelor's Degree | $99,091 | $74,228 |
| Graduate Degree | $169,886 | $102,656 |
| Total | $100,000 | $73,306 |
Family Income in Northport
Family Income Brackets in Northport
According to the Northport family income data, there are 789 families falling into the $200,000+ income range, which is the most common income bracket and makes up 38.5% of all families.
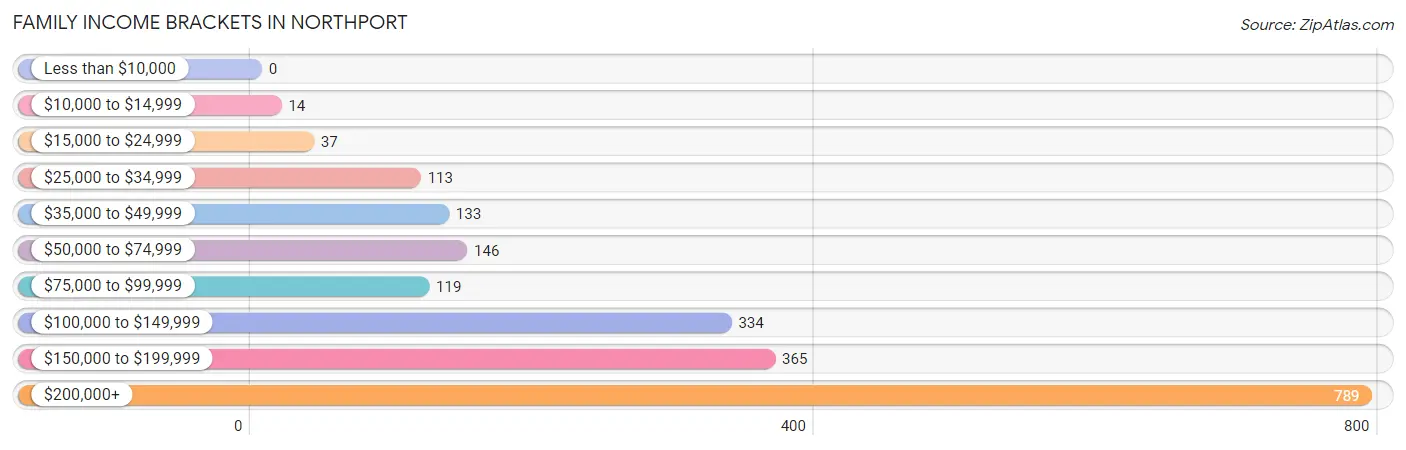
| Income Bracket | # Families | % Families |
| Less than $10,000 | 0 | 0.0% |
| $10,000 to $14,999 | 14 | 0.7% |
| $15,000 to $24,999 | 37 | 1.8% |
| $25,000 to $34,999 | 113 | 5.5% |
| $35,000 to $49,999 | 133 | 6.5% |
| $50,000 to $74,999 | 146 | 7.1% |
| $75,000 to $99,999 | 119 | 5.8% |
| $100,000 to $149,999 | 334 | 16.3% |
| $150,000 to $199,999 | 365 | 17.8% |
| $200,000+ | 789 | 38.5% |
Family Income by Famaliy Size in Northport
4-person families (458 | 22.3%) account for the highest median family income in Northport with $250,001 per family, while 2-person families (1,155 | 56.3%) have the highest median income of $68,262 per family member.
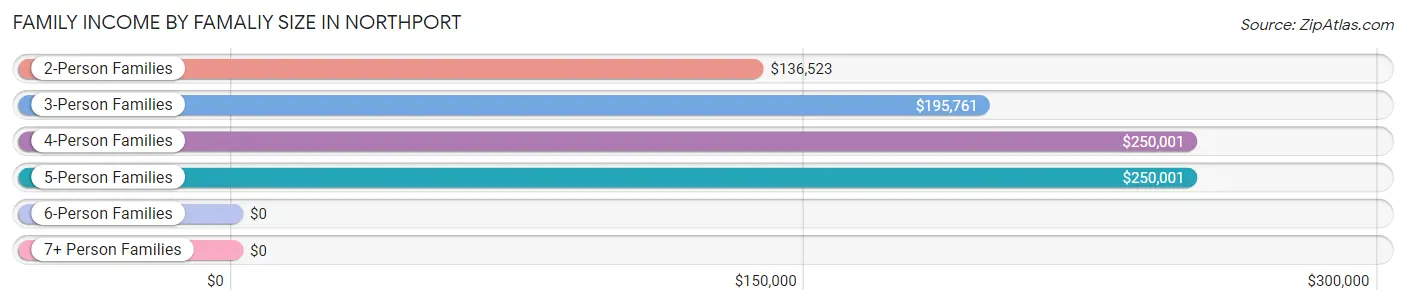
| Income Bracket | # Families | Median Income |
| 2-Person Families | 1,155 (56.3%) | $136,523 |
| 3-Person Families | 302 (14.7%) | $195,761 |
| 4-Person Families | 458 (22.3%) | $250,001 |
| 5-Person Families | 110 (5.4%) | $250,001 |
| 6-Person Families | 25 (1.2%) | $0 |
| 7+ Person Families | 0 (0.0%) | $0 |
| Total | 2,050 (100.0%) | $166,613 |
Family Income by Number of Earners in Northport
The median family income in Northport is $166,613, with families comprising 3+ earners (187) having the highest median family income of $249,229, while families with no earners (219) have the lowest median family income of $132,426, accounting for 9.1% and 10.7% of families, respectively.
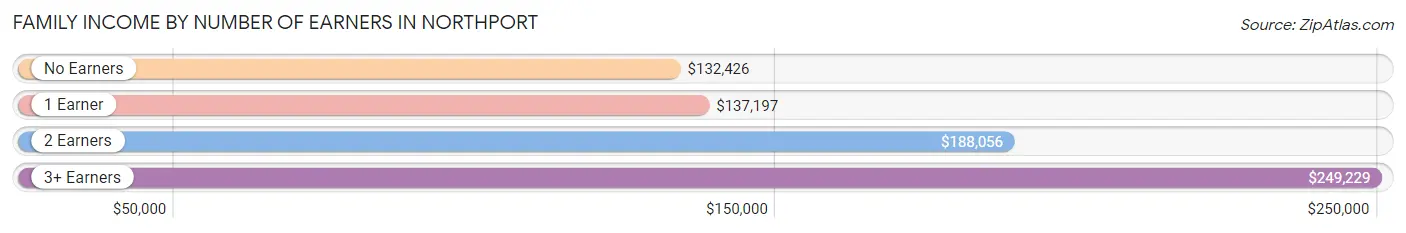
| Number of Earners | # Families | Median Income |
| No Earners | 219 (10.7%) | $132,426 |
| 1 Earner | 652 (31.8%) | $137,197 |
| 2 Earners | 992 (48.4%) | $188,056 |
| 3+ Earners | 187 (9.1%) | $249,229 |
| Total | 2,050 (100.0%) | $166,613 |
Household Income in Northport
Household Income Brackets in Northport
With 819 households falling in the category, the $200,000+ income range is the most frequent in Northport, accounting for 27.3% of all households. In contrast, only 66 households (2.2%) fall into the $10,000 to $14,999 income bracket, making it the least populous group.
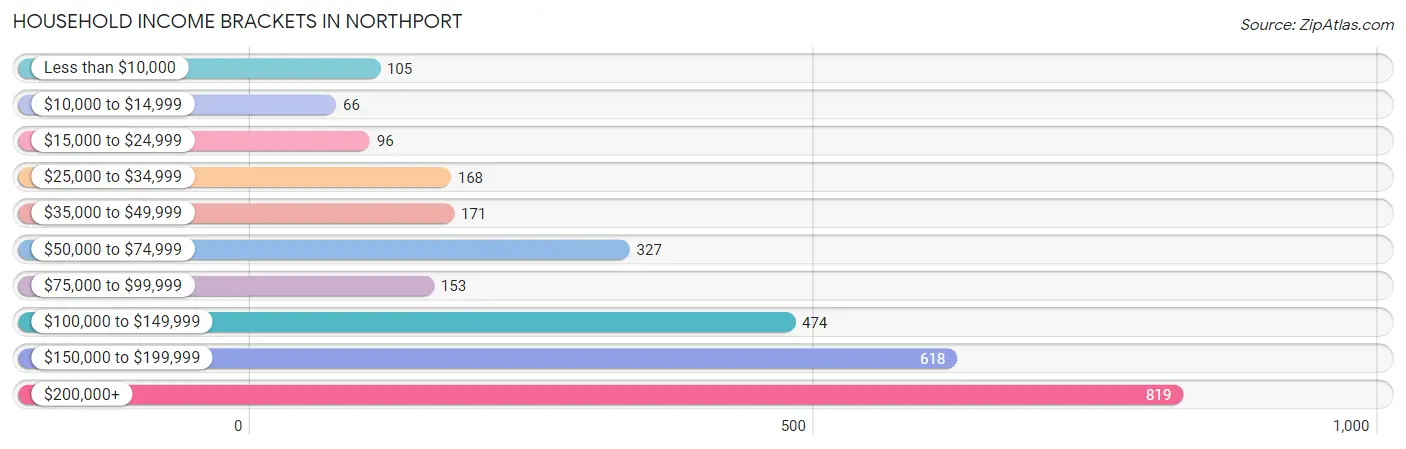
| Income Bracket | # Households | % Households |
| Less than $10,000 | 105 | 3.5% |
| $10,000 to $14,999 | 66 | 2.2% |
| $15,000 to $24,999 | 96 | 3.2% |
| $25,000 to $34,999 | 168 | 5.6% |
| $35,000 to $49,999 | 171 | 5.7% |
| $50,000 to $74,999 | 327 | 10.9% |
| $75,000 to $99,999 | 153 | 5.1% |
| $100,000 to $149,999 | 474 | 15.8% |
| $150,000 to $199,999 | 618 | 20.6% |
| $200,000+ | 819 | 27.3% |
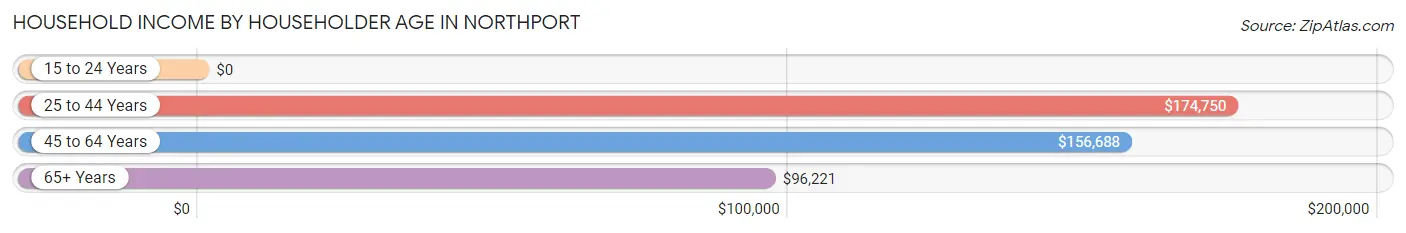
Household Income by Householder Age in Northport
The median household income in Northport is $137,487, with the highest median household income of $174,750 found in the 25 to 44 years age bracket for the primary householder. A total of 430 households (14.3%) fall into this category.
| Income Bracket | # Households | Median Income |
| 15 to 24 Years | 0 (0.0%) | $0 |
| 25 to 44 Years | 430 (14.3%) | $174,750 |
| 45 to 64 Years | 1,363 (45.5%) | $156,688 |
| 65+ Years | 1,206 (40.2%) | $96,221 |
| Total | 2,999 (100.0%) | $137,487 |
Poverty in Northport
Income Below Poverty by Sex and Age in Northport
With 6.5% poverty level for males and 14.0% for females among the residents of Northport, 12 to 14 year old males and 16 and 17 year old females are the most vulnerable to poverty, with 105 males (40.1%) and 111 females (89.5%) in their respective age groups living below the poverty level.
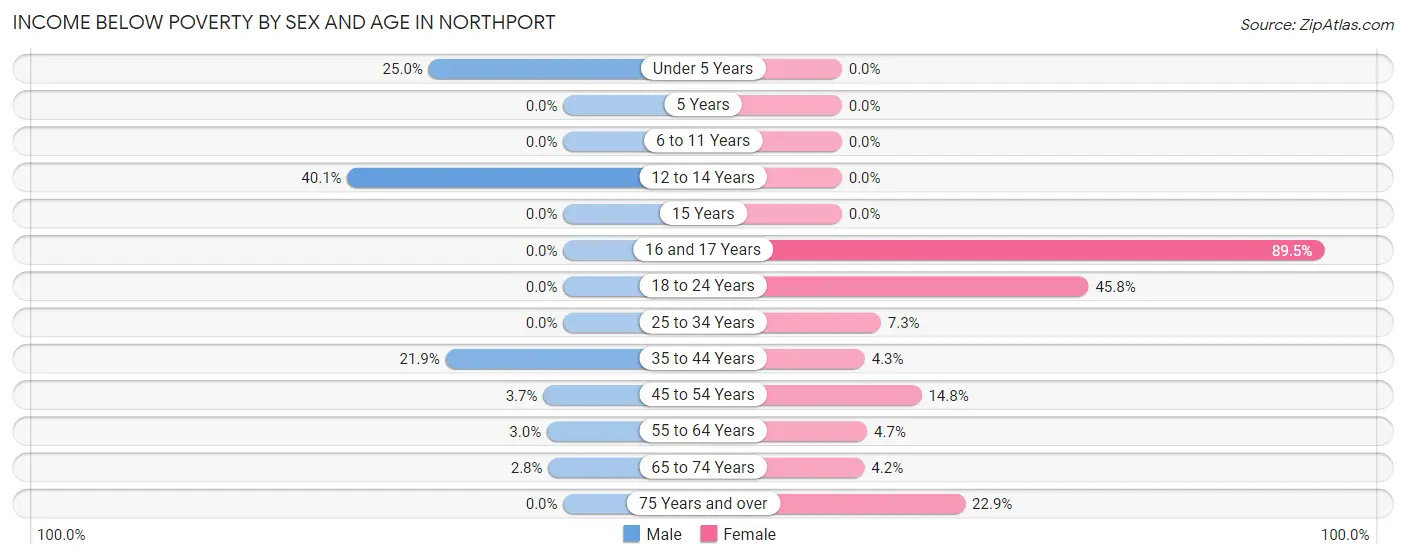
| Age Bracket | Male | Female |
| Under 5 Years | 17 (25.0%) | 0 (0.0%) |
| 5 Years | 0 (0.0%) | 0 (0.0%) |
| 6 to 11 Years | 0 (0.0%) | 0 (0.0%) |
| 12 to 14 Years | 105 (40.1%) | 0 (0.0%) |
| 15 Years | 0 (0.0%) | 0 (0.0%) |
| 16 and 17 Years | 0 (0.0%) | 111 (89.5%) |
| 18 to 24 Years | 0 (0.0%) | 136 (45.8%) |
| 25 to 34 Years | 0 (0.0%) | 19 (7.2%) |
| 35 to 44 Years | 40 (21.9%) | 16 (4.3%) |
| 45 to 54 Years | 24 (3.7%) | 101 (14.8%) |
| 55 to 64 Years | 16 (3.0%) | 32 (4.7%) |
| 65 to 74 Years | 16 (2.8%) | 23 (4.2%) |
| 75 Years and over | 0 (0.0%) | 117 (22.9%) |
| Total | 218 (6.5%) | 555 (14.0%) |
Income Above Poverty by Sex and Age in Northport
According to the poverty statistics in Northport, males aged 5 years and females aged under 5 years are the age groups that are most secure financially, with 100.0% of males and 100.0% of females in these age groups living above the poverty line.
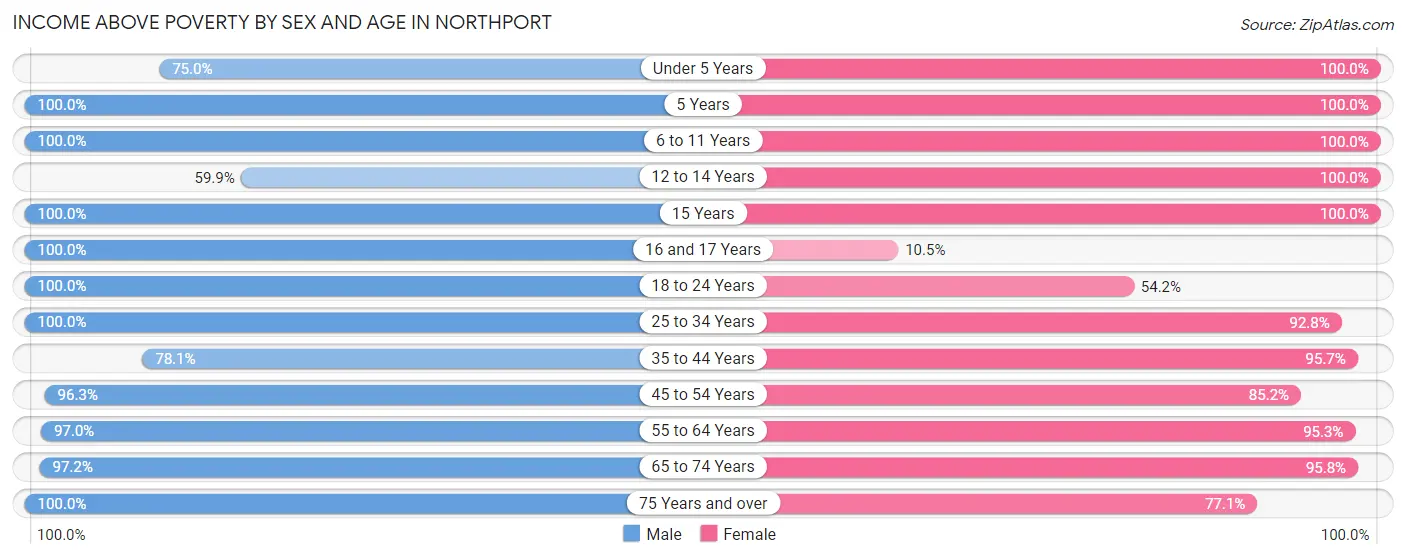
| Age Bracket | Male | Female |
| Under 5 Years | 51 (75.0%) | 100 (100.0%) |
| 5 Years | 33 (100.0%) | 15 (100.0%) |
| 6 to 11 Years | 225 (100.0%) | 194 (100.0%) |
| 12 to 14 Years | 157 (59.9%) | 122 (100.0%) |
| 15 Years | 21 (100.0%) | 45 (100.0%) |
| 16 and 17 Years | 117 (100.0%) | 13 (10.5%) |
| 18 to 24 Years | 143 (100.0%) | 161 (54.2%) |
| 25 to 34 Years | 339 (100.0%) | 243 (92.7%) |
| 35 to 44 Years | 143 (78.1%) | 360 (95.7%) |
| 45 to 54 Years | 622 (96.3%) | 582 (85.2%) |
| 55 to 64 Years | 510 (97.0%) | 647 (95.3%) |
| 65 to 74 Years | 560 (97.2%) | 524 (95.8%) |
| 75 Years and over | 243 (100.0%) | 394 (77.1%) |
| Total | 3,164 (93.5%) | 3,400 (86.0%) |
Income Below Poverty Among Married-Couple Families in Northport
The poverty statistics for married-couple families in Northport show that 1.1% or 17 of the total 1,545 families live below the poverty line. Families with 1 or 2 children have the highest poverty rate of 3.6%, comprising of 17 families. On the other hand, families with no children have the lowest poverty rate of 0.0%, which includes 0 families.
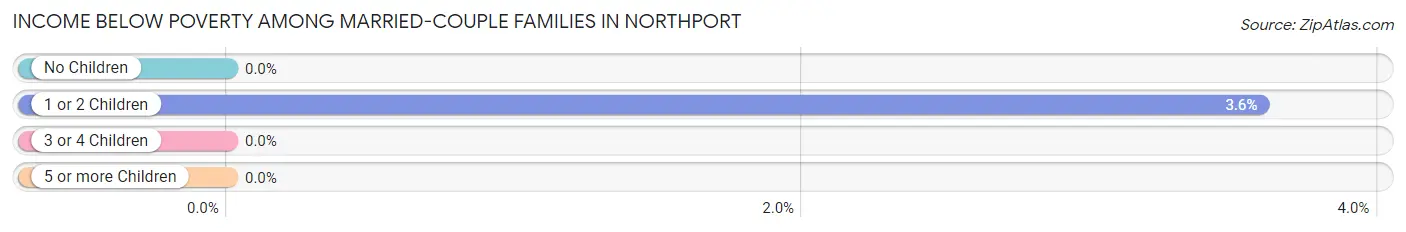
| Children | Above Poverty | Below Poverty |
| No Children | 1,006 (100.0%) | 0 (0.0%) |
| 1 or 2 Children | 457 (96.4%) | 17 (3.6%) |
| 3 or 4 Children | 65 (100.0%) | 0 (0.0%) |
| 5 or more Children | 0 (0.0%) | 0 (0.0%) |
| Total | 1,528 (98.9%) | 17 (1.1%) |
Income Below Poverty Among Single-Parent Households in Northport
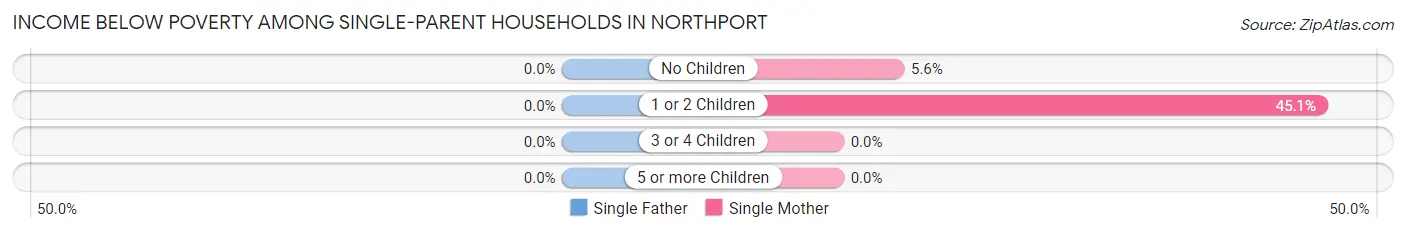
| Children | Single Father | Single Mother |
| No Children | 0 (0.0%) | 14 (5.6%) |
| 1 or 2 Children | 0 (0.0%) | 101 (45.1%) |
| 3 or 4 Children | 0 (0.0%) | 0 (0.0%) |
| 5 or more Children | 0 (0.0%) | 0 (0.0%) |
| Total | 0 (0.0%) | 115 (24.3%) |
Income Below Poverty Among Married-Couple vs Single-Parent Households in Northport
The poverty data for Northport shows that 17 of the married-couple family households (1.1%) and 115 of the single-parent households (22.8%) are living below the poverty level. Within the married-couple family households, those with 1 or 2 children have the highest poverty rate, with 17 households (3.6%) falling below the poverty line. Among the single-parent households, those with 1 or 2 children have the highest poverty rate, with 101 household (45.1%) living below poverty.
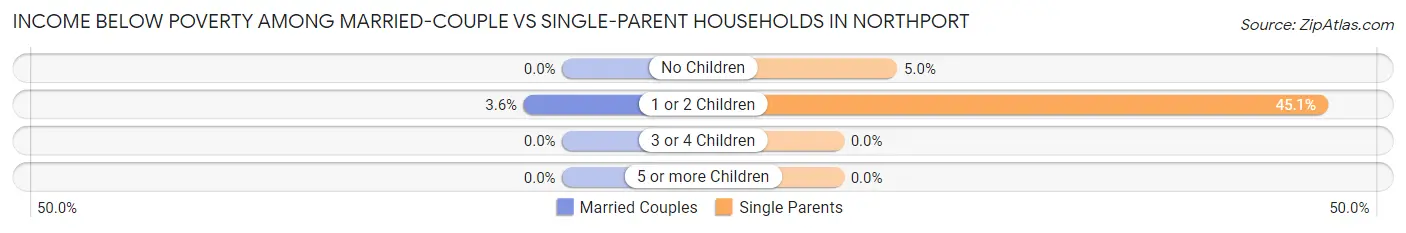
| Children | Married-Couple Families | Single-Parent Households |
| No Children | 0 (0.0%) | 14 (5.0%) |
| 1 or 2 Children | 17 (3.6%) | 101 (45.1%) |
| 3 or 4 Children | 0 (0.0%) | 0 (0.0%) |
| 5 or more Children | 0 (0.0%) | 0 (0.0%) |
| Total | 17 (1.1%) | 115 (22.8%) |
Race in Northport
The most populous races in Northport are White / Caucasian (6,864 | 93.5%), Hispanic or Latino (417 | 5.7%), and Two or more Races (363 | 5.0%).
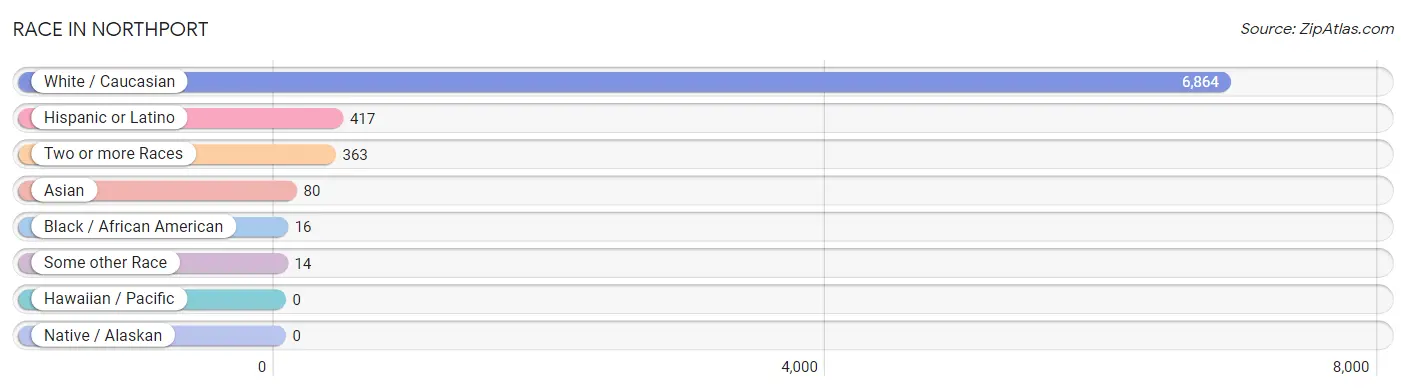
| Race | # Population | % Population |
| Asian | 80 | 1.1% |
| Black / African American | 16 | 0.2% |
| Hawaiian / Pacific | 0 | 0.0% |
| Hispanic or Latino | 417 | 5.7% |
| Native / Alaskan | 0 | 0.0% |
| White / Caucasian | 6,864 | 93.5% |
| Two or more Races | 363 | 5.0% |
| Some other Race | 14 | 0.2% |
| Total | 7,337 | 100.0% |
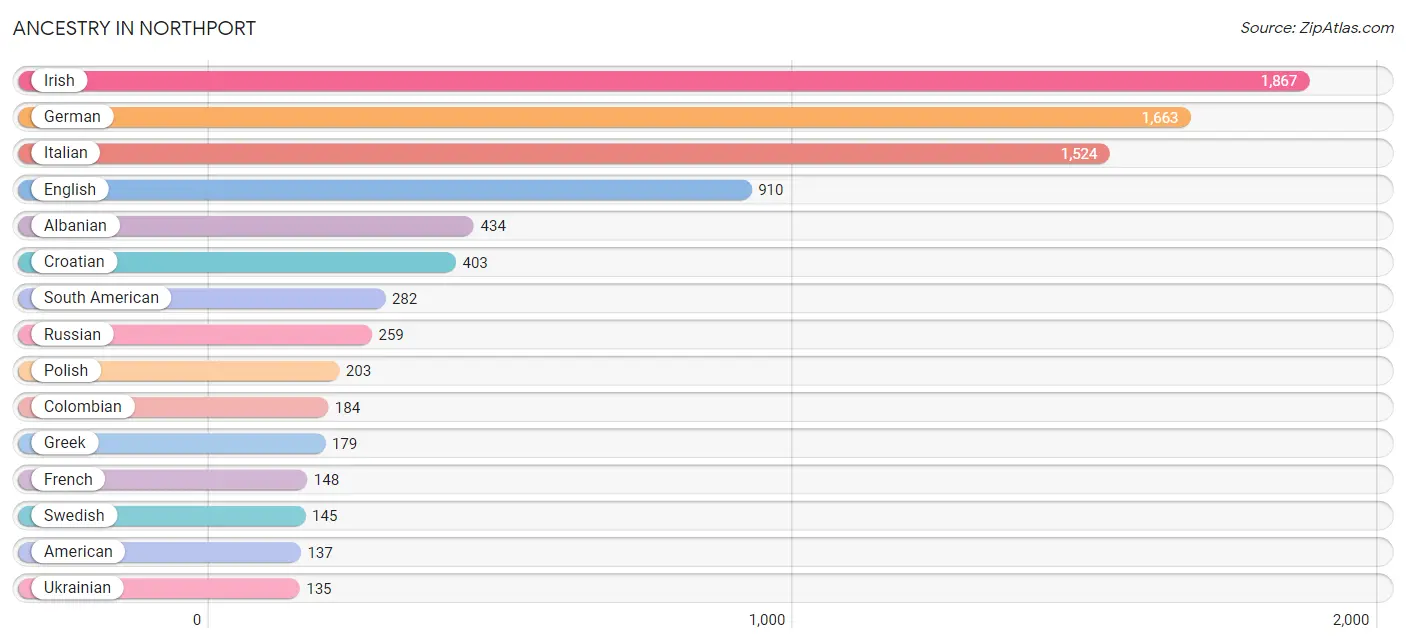
Ancestry in Northport
The most populous ancestries reported in Northport are Irish (1,867 | 25.5%), German (1,663 | 22.7%), Italian (1,524 | 20.8%), English (910 | 12.4%), and Albanian (434 | 5.9%), together accounting for 87.2% of all Northport residents.
| Ancestry | # Population | % Population |
| Albanian | 434 | 5.9% |
| American | 137 | 1.9% |
| Australian | 19 | 0.3% |
| Austrian | 22 | 0.3% |
| British | 39 | 0.5% |
| Burmese | 46 | 0.6% |
| Central American | 14 | 0.2% |
| Central American Indian | 14 | 0.2% |
| Colombian | 184 | 2.5% |
| Croatian | 403 | 5.5% |
| Cuban | 12 | 0.2% |
| Czech | 11 | 0.2% |
| Czechoslovakian | 9 | 0.1% |
| Danish | 24 | 0.3% |
| Dominican | 68 | 0.9% |
| Eastern European | 71 | 1.0% |
| Ecuadorian | 49 | 0.7% |
| English | 910 | 12.4% |
| European | 72 | 1.0% |
| Finnish | 10 | 0.1% |
| French | 148 | 2.0% |
| German | 1,663 | 22.7% |
| Greek | 179 | 2.4% |
| Guatemalan | 14 | 0.2% |
| Hungarian | 108 | 1.5% |
| Iranian | 22 | 0.3% |
| Irish | 1,867 | 25.5% |
| Israeli | 22 | 0.3% |
| Italian | 1,524 | 20.8% |
| Laotian | 48 | 0.6% |
| Lithuanian | 123 | 1.7% |
| Native Hawaiian | 14 | 0.2% |
| Northern European | 28 | 0.4% |
| Norwegian | 110 | 1.5% |
| Peruvian | 49 | 0.7% |
| Polish | 203 | 2.8% |
| Portuguese | 55 | 0.7% |
| Puerto Rican | 41 | 0.6% |
| Romanian | 19 | 0.3% |
| Russian | 259 | 3.5% |
| Scandinavian | 17 | 0.2% |
| Scotch-Irish | 39 | 0.5% |
| Scottish | 65 | 0.9% |
| South American | 282 | 3.8% |
| South American Indian | 49 | 0.7% |
| Swedish | 145 | 2.0% |
| Swiss | 69 | 0.9% |
| Ukrainian | 135 | 1.8% | View All 48 Rows |
Immigrants in Northport
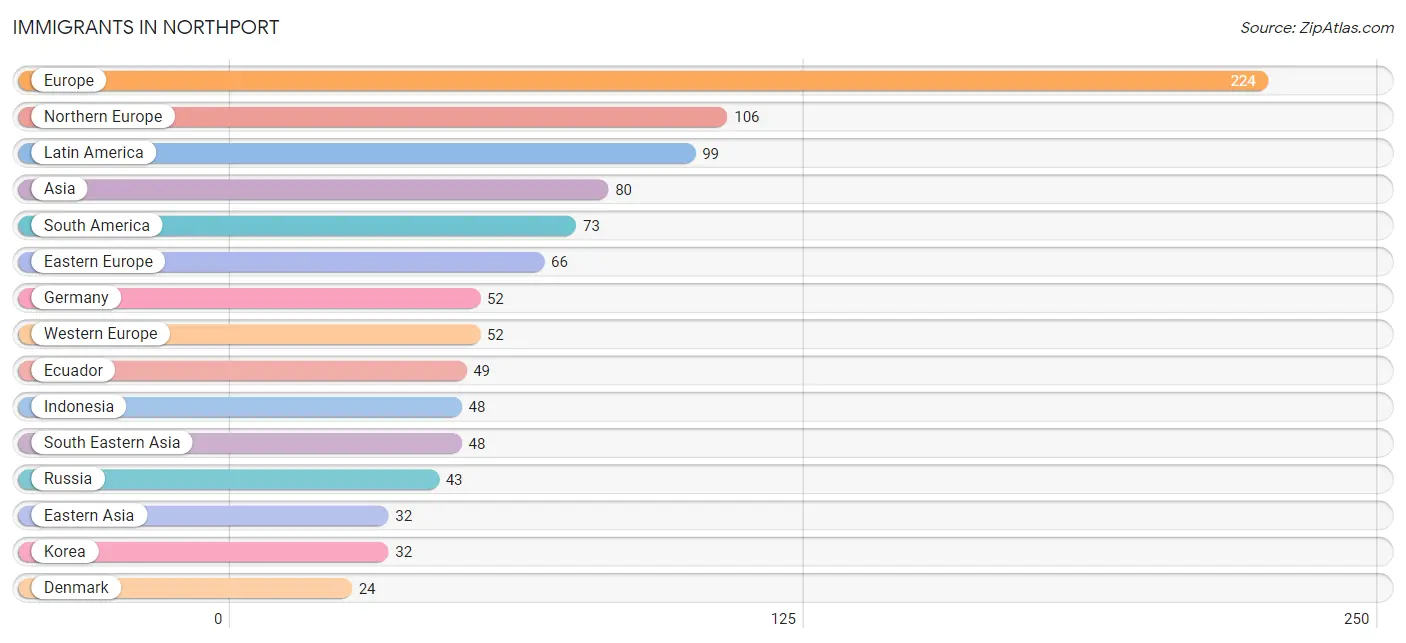
The most numerous immigrant groups reported in Northport came from Europe (224 | 3.0%), Northern Europe (106 | 1.4%), Latin America (99 | 1.3%), Asia (80 | 1.1%), and South America (73 | 1.0%), together accounting for 7.9% of all Northport residents.
| Immigration Origin | # Population | % Population |
| Asia | 80 | 1.1% |
| Australia | 19 | 0.3% |
| Canada | 21 | 0.3% |
| Caribbean | 12 | 0.2% |
| Central America | 14 | 0.2% |
| Croatia | 23 | 0.3% |
| Cuba | 12 | 0.2% |
| Denmark | 24 | 0.3% |
| Eastern Asia | 32 | 0.4% |
| Eastern Europe | 66 | 0.9% |
| Ecuador | 49 | 0.7% |
| England | 22 | 0.3% |
| Europe | 224 | 3.0% |
| Germany | 52 | 0.7% |
| Guatemala | 14 | 0.2% |
| Indonesia | 48 | 0.6% |
| Korea | 32 | 0.4% |
| Latin America | 99 | 1.3% |
| Northern Europe | 106 | 1.4% |
| Oceania | 19 | 0.3% |
| Peru | 24 | 0.3% |
| Russia | 43 | 0.6% |
| South America | 73 | 1.0% |
| South Eastern Asia | 48 | 0.6% |
| Western Europe | 52 | 0.7% | View All 25 Rows |
Sex and Age in Northport
Sex and Age in Northport
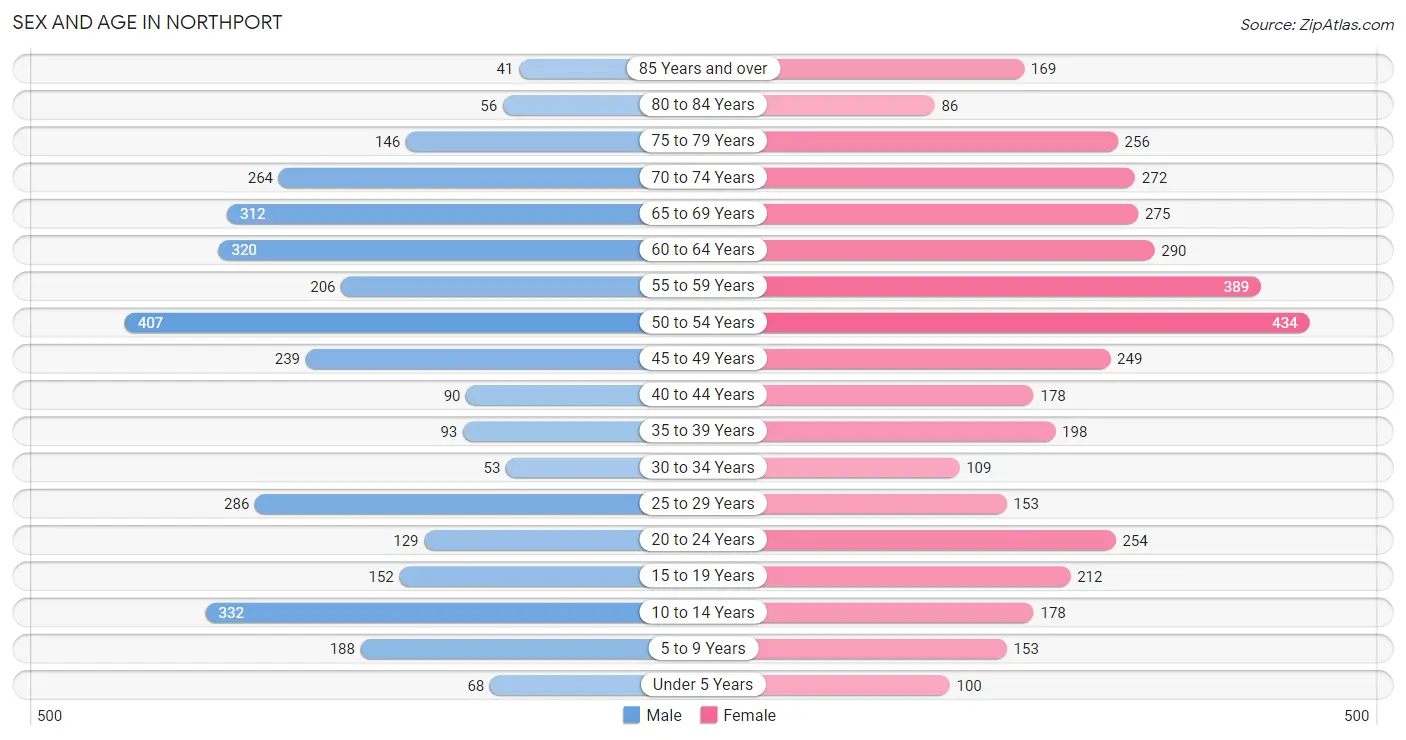
The most populous age groups in Northport are 50 to 54 Years (407 | 12.0%) for men and 50 to 54 Years (434 | 11.0%) for women.
| Age Bracket | Male | Female |
| Under 5 Years | 68 (2.0%) | 100 (2.5%) |
| 5 to 9 Years | 188 (5.6%) | 153 (3.9%) |
| 10 to 14 Years | 332 (9.8%) | 178 (4.5%) |
| 15 to 19 Years | 152 (4.5%) | 212 (5.4%) |
| 20 to 24 Years | 129 (3.8%) | 254 (6.4%) |
| 25 to 29 Years | 286 (8.5%) | 153 (3.9%) |
| 30 to 34 Years | 53 (1.6%) | 109 (2.8%) |
| 35 to 39 Years | 93 (2.8%) | 198 (5.0%) |
| 40 to 44 Years | 90 (2.7%) | 178 (4.5%) |
| 45 to 49 Years | 239 (7.1%) | 249 (6.3%) |
| 50 to 54 Years | 407 (12.0%) | 434 (11.0%) |
| 55 to 59 Years | 206 (6.1%) | 389 (9.8%) |
| 60 to 64 Years | 320 (9.5%) | 290 (7.3%) |
| 65 to 69 Years | 312 (9.2%) | 275 (7.0%) |
| 70 to 74 Years | 264 (7.8%) | 272 (6.9%) |
| 75 to 79 Years | 146 (4.3%) | 256 (6.5%) |
| 80 to 84 Years | 56 (1.7%) | 86 (2.2%) |
| 85 Years and over | 41 (1.2%) | 169 (4.3%) |
| Total | 3,382 (100.0%) | 3,955 (100.0%) |
Families and Households in Northport
Median Family Size in Northport
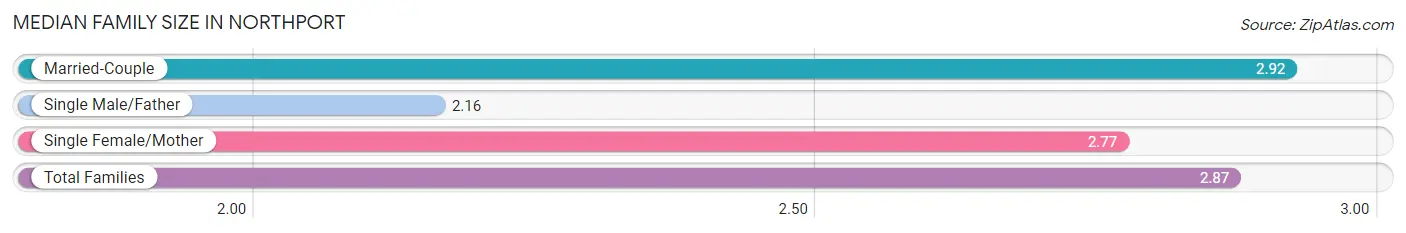
The median family size in Northport is 2.87 persons per family, with married-couple families (1,545 | 75.4%) accounting for the largest median family size of 2.92 persons per family. On the other hand, single male/father families (32 | 1.6%) represent the smallest median family size with 2.16 persons per family.
| Family Type | # Families | Family Size |
| Married-Couple | 1,545 (75.4%) | 2.92 |
| Single Male/Father | 32 (1.6%) | 2.16 |
| Single Female/Mother | 473 (23.1%) | 2.77 |
| Total Families | 2,050 (100.0%) | 2.87 |
Median Household Size in Northport
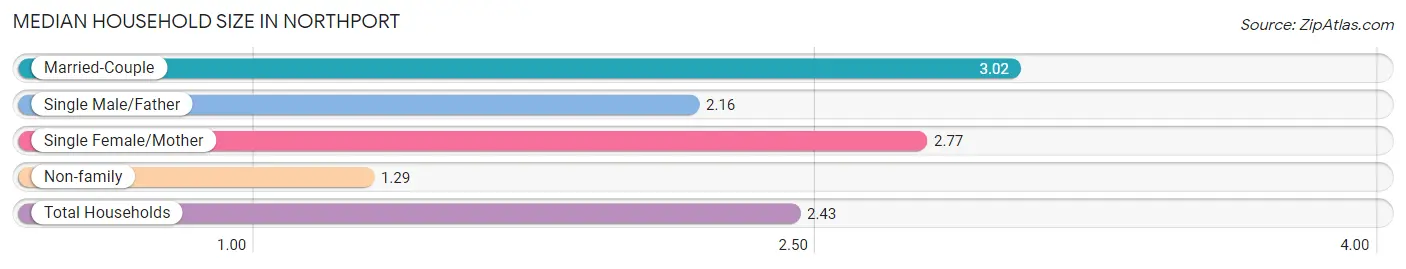
The median household size in Northport is 2.43 persons per household, with married-couple households (1,545 | 51.5%) accounting for the largest median household size of 3.02 persons per household. non-family households (949 | 31.6%) represent the smallest median household size with 1.29 persons per household.
| Household Type | # Households | Household Size |
| Married-Couple | 1,545 (51.5%) | 3.02 |
| Single Male/Father | 32 (1.1%) | 2.16 |
| Single Female/Mother | 473 (15.8%) | 2.77 |
| Non-family | 949 (31.6%) | 1.29 |
| Total Households | 2,999 (100.0%) | 2.43 |
Household Size by Marriage Status in Northport
Out of a total of 2,999 households in Northport, 2,050 (68.4%) are family households, while 949 (31.6%) are nonfamily households. The most numerous type of family households are 2-person households, comprising 1,111, and the most common type of nonfamily households are 1-person households, comprising 769.
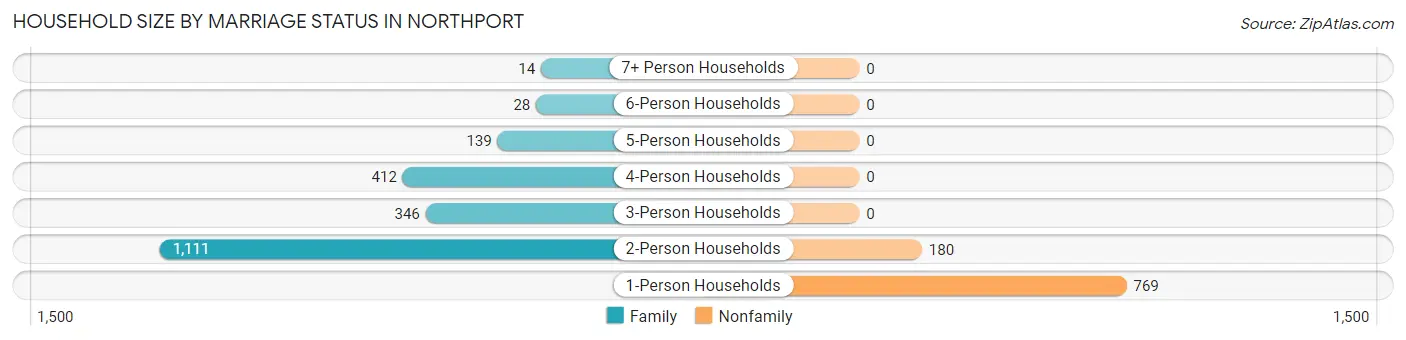
| Household Size | Family Households | Nonfamily Households |
| 1-Person Households | - | 769 (25.6%) |
| 2-Person Households | 1,111 (37.0%) | 180 (6.0%) |
| 3-Person Households | 346 (11.5%) | 0 (0.0%) |
| 4-Person Households | 412 (13.7%) | 0 (0.0%) |
| 5-Person Households | 139 (4.6%) | 0 (0.0%) |
| 6-Person Households | 28 (0.9%) | 0 (0.0%) |
| 7+ Person Households | 14 (0.5%) | 0 (0.0%) |
| Total | 2,050 (68.4%) | 949 (31.6%) |
Female Fertility in Northport
Fertility by Age in Northport
| Age Bracket | Women with Births | Births / 1,000 Women |
| 15 to 19 years | 0 (0.0%) | 0.0 |
| 20 to 34 years | 0 (0.0%) | 0.0 |
| 35 to 50 years | 0 (0.0%) | 0.0 |
| Total | 0 (0.0%) | 0.0 |
Fertility by Age by Marriage Status in Northport
| Age Bracket | Married | Unmarried |
| 15 to 19 years | 0 (0.0%) | 0 (0.0%) |
| 20 to 34 years | 0 (0.0%) | 0 (0.0%) |
| 35 to 50 years | 0 (0.0%) | 0 (0.0%) |
| Total | 0 (0.0%) | 0 (0.0%) |
Fertility by Education in Northport
| Educational Attainment | Women with Births | Births / 1,000 Women |
| Less than High School | 0 (0.0%) | 0.0 |
| High School Diploma | 0 (0.0%) | 0.0 |
| College or Associate's Degree | 0 (0.0%) | 0.0 |
| Bachelor's Degree | 0 (0.0%) | 0.0 |
| Graduate Degree | 0 (0.0%) | 0.0 |
| Total | 0 (0.0%) | 0.0 |
Fertility by Education by Marriage Status in Northport
| Educational Attainment | Married | Unmarried |
| Less than High School | 0 (0.0%) | 0 (0.0%) |
| High School Diploma | 0 (0.0%) | 0 (0.0%) |
| College or Associate's Degree | 0 (0.0%) | 0 (0.0%) |
| Bachelor's Degree | 0 (0.0%) | 0 (0.0%) |
| Graduate Degree | 0 (0.0%) | 0 (0.0%) |
| Total | 0 (0.0%) | 0 (0.0%) |
Employment Characteristics in Northport
Employment by Class of Employer in Northport
Among the 4,051 employed individuals in Northport, private company employees (2,401 | 59.3%), not-for-profit organizations (513 | 12.7%), and local government employees (436 | 10.8%) make up the most common classes of employment.
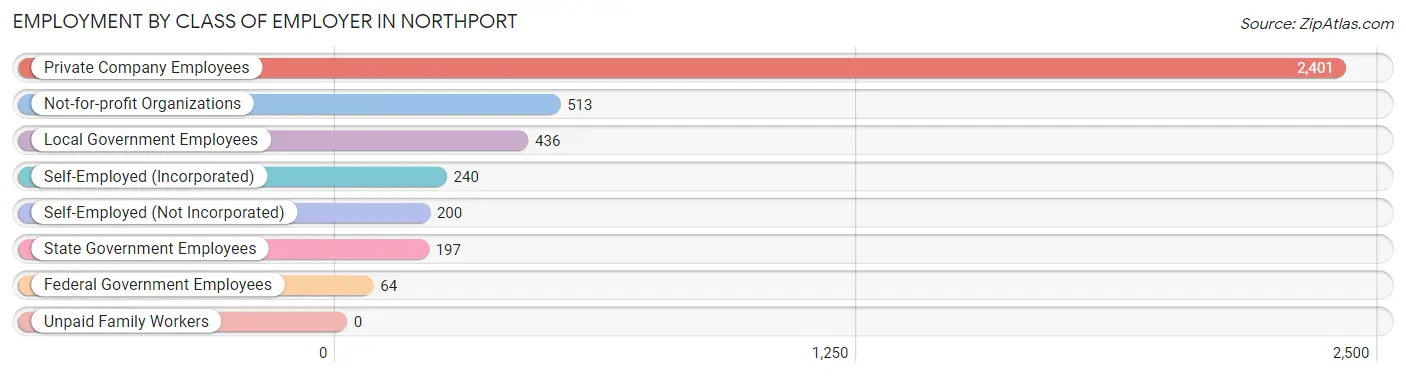
| Employer Class | # Employees | % Employees |
| Private Company Employees | 2,401 | 59.3% |
| Self-Employed (Incorporated) | 240 | 5.9% |
| Self-Employed (Not Incorporated) | 200 | 4.9% |
| Not-for-profit Organizations | 513 | 12.7% |
| Local Government Employees | 436 | 10.8% |
| State Government Employees | 197 | 4.9% |
| Federal Government Employees | 64 | 1.6% |
| Unpaid Family Workers | 0 | 0.0% |
| Total | 4,051 | 100.0% |
Employment Status by Age in Northport
According to the labor force statistics for Northport, out of the total population over 16 years of age (6,252), 66.1% or 4,133 individuals are in the labor force, with 0.5% or 21 of them unemployed. The age group with the highest labor force participation rate is 30 to 34 years, with 100.0% or 162 individuals in the labor force. Within the labor force, the 65 to 74 years age range has the highest percentage of unemployed individuals, with 3.4% or 21 of them being unemployed.
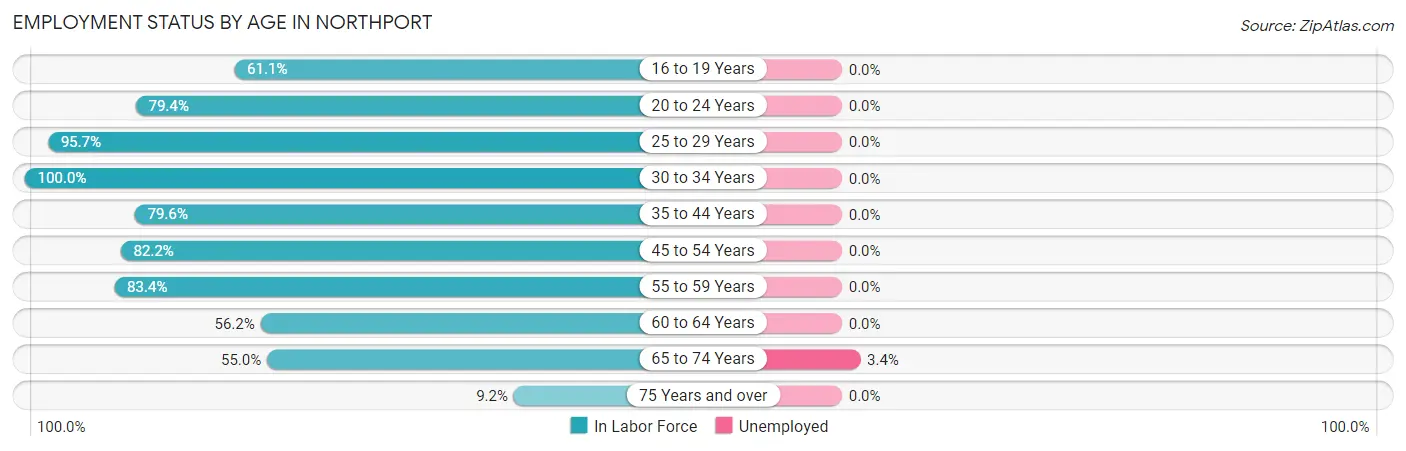
| Age Bracket | In Labor Force | Unemployed |
| 16 to 19 Years | 182 (61.1%) | 0 (0.0%) |
| 20 to 24 Years | 304 (79.4%) | 0 (0.0%) |
| 25 to 29 Years | 420 (95.7%) | 0 (0.0%) |
| 30 to 34 Years | 162 (100.0%) | 0 (0.0%) |
| 35 to 44 Years | 445 (79.6%) | 0 (0.0%) |
| 45 to 54 Years | 1,092 (82.2%) | 0 (0.0%) |
| 55 to 59 Years | 496 (83.4%) | 0 (0.0%) |
| 60 to 64 Years | 343 (56.2%) | 0 (0.0%) |
| 65 to 74 Years | 618 (55.0%) | 21 (3.4%) |
| 75 Years and over | 69 (9.2%) | 0 (0.0%) |
| Total | 4,133 (66.1%) | 21 (0.5%) |
Employment Status by Educational Attainment in Northport
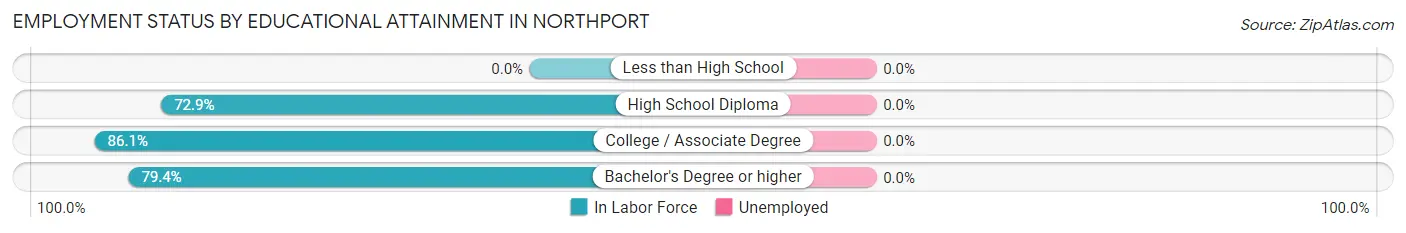
| Educational Attainment | In Labor Force | Unemployed |
| Less than High School | 0 (0.0%) | 0 (0.0%) |
| High School Diploma | 167 (72.9%) | 0 (0.0%) |
| College / Associate Degree | 760 (86.1%) | 0 (0.0%) |
| Bachelor's Degree or higher | 2,031 (79.4%) | 0 (0.0%) |
| Total | 2,959 (80.1%) | 0 (0.0%) |
Employment Occupations by Sex in Northport
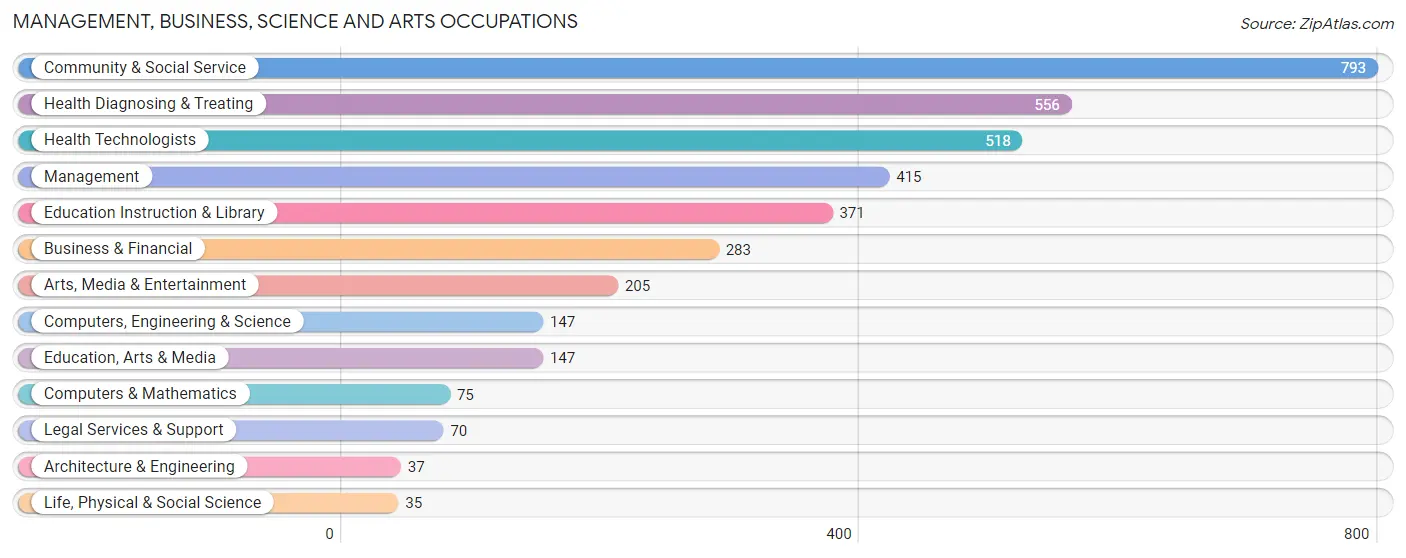
Management, Business, Science and Arts Occupations
The most common Management, Business, Science and Arts occupations in Northport are Community & Social Service (793 | 19.3%), Health Diagnosing & Treating (556 | 13.5%), Health Technologists (518 | 12.6%), Management (415 | 10.1%), and Education Instruction & Library (371 | 9.0%).
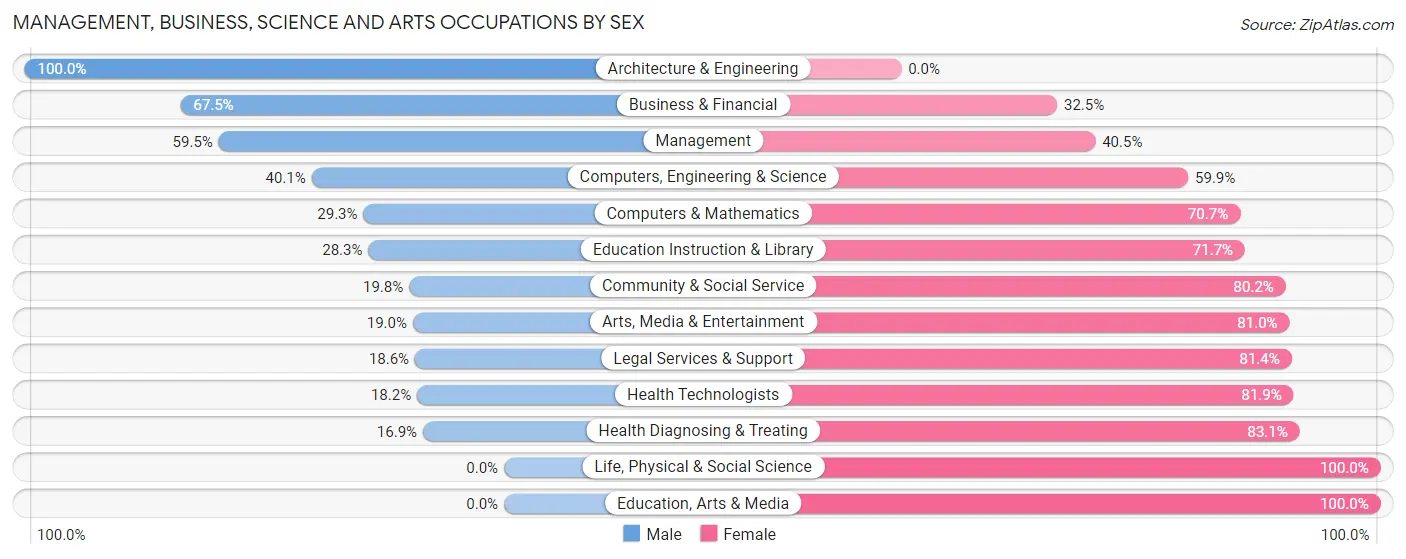
Management, Business, Science and Arts Occupations by Sex
Within the Management, Business, Science and Arts occupations in Northport, the most male-oriented occupations are Architecture & Engineering (100.0%), Business & Financial (67.5%), and Management (59.5%), while the most female-oriented occupations are Life, Physical & Social Science (100.0%), Education, Arts & Media (100.0%), and Health Diagnosing & Treating (83.1%).
| Occupation | Male | Female |
| Management | 247 (59.5%) | 168 (40.5%) |
| Business & Financial | 191 (67.5%) | 92 (32.5%) |
| Computers, Engineering & Science | 59 (40.1%) | 88 (59.9%) |
| Computers & Mathematics | 22 (29.3%) | 53 (70.7%) |
| Architecture & Engineering | 37 (100.0%) | 0 (0.0%) |
| Life, Physical & Social Science | 0 (0.0%) | 35 (100.0%) |
| Community & Social Service | 157 (19.8%) | 636 (80.2%) |
| Education, Arts & Media | 0 (0.0%) | 147 (100.0%) |
| Legal Services & Support | 13 (18.6%) | 57 (81.4%) |
| Education Instruction & Library | 105 (28.3%) | 266 (71.7%) |
| Arts, Media & Entertainment | 39 (19.0%) | 166 (81.0%) |
| Health Diagnosing & Treating | 94 (16.9%) | 462 (83.1%) |
| Health Technologists | 94 (18.1%) | 424 (81.9%) |
| Total (Category) | 748 (34.1%) | 1,446 (65.9%) |
| Total (Overall) | 1,930 (47.0%) | 2,180 (53.0%) |
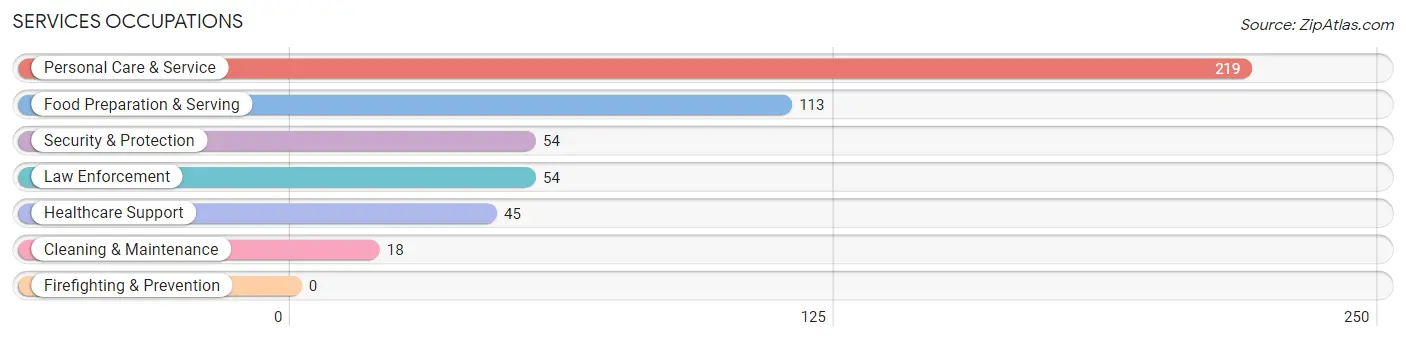
Services Occupations
The most common Services occupations in Northport are Personal Care & Service (219 | 5.3%), Food Preparation & Serving (113 | 2.8%), Security & Protection (54 | 1.3%), Law Enforcement (54 | 1.3%), and Healthcare Support (45 | 1.1%).
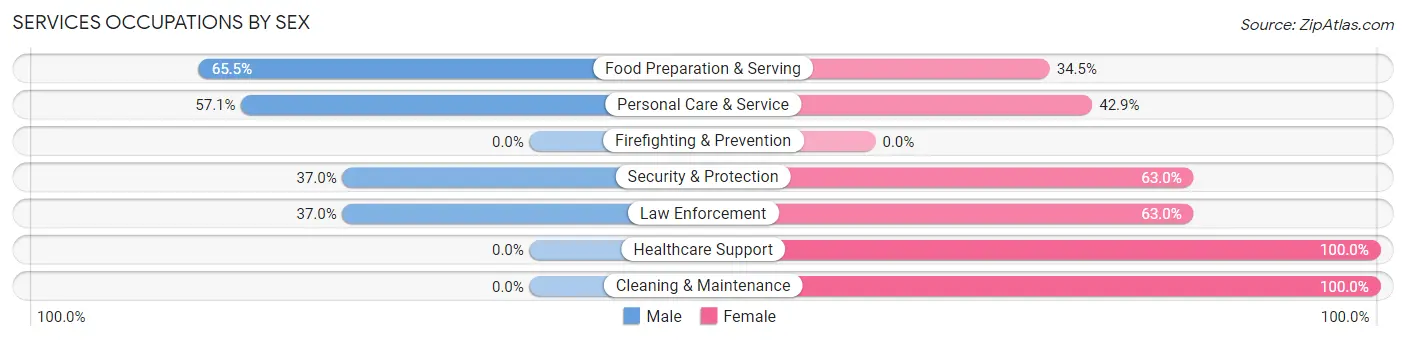
Services Occupations by Sex
Within the Services occupations in Northport, the most male-oriented occupations are Food Preparation & Serving (65.5%), Personal Care & Service (57.1%), and Security & Protection (37.0%), while the most female-oriented occupations are Healthcare Support (100.0%), Cleaning & Maintenance (100.0%), and Security & Protection (63.0%).
| Occupation | Male | Female |
| Healthcare Support | 0 (0.0%) | 45 (100.0%) |
| Security & Protection | 20 (37.0%) | 34 (63.0%) |
| Firefighting & Prevention | 0 (0.0%) | 0 (0.0%) |
| Law Enforcement | 20 (37.0%) | 34 (63.0%) |
| Food Preparation & Serving | 74 (65.5%) | 39 (34.5%) |
| Cleaning & Maintenance | 0 (0.0%) | 18 (100.0%) |
| Personal Care & Service | 125 (57.1%) | 94 (42.9%) |
| Total (Category) | 219 (48.8%) | 230 (51.2%) |
| Total (Overall) | 1,930 (47.0%) | 2,180 (53.0%) |
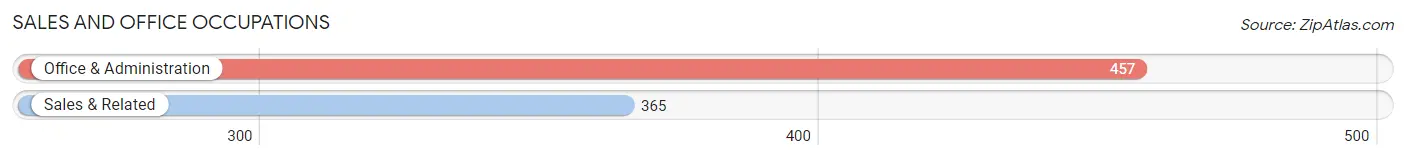
Sales and Office Occupations
The most common Sales and Office occupations in Northport are Office & Administration (457 | 11.1%), and Sales & Related (365 | 8.9%).
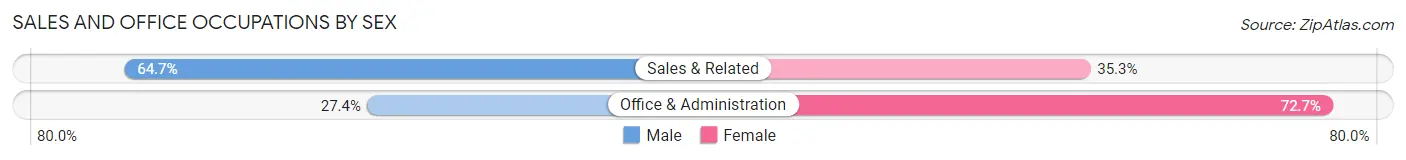
Sales and Office Occupations by Sex
| Occupation | Male | Female |
| Sales & Related | 236 (64.7%) | 129 (35.3%) |
| Office & Administration | 125 (27.4%) | 332 (72.7%) |
| Total (Category) | 361 (43.9%) | 461 (56.1%) |
| Total (Overall) | 1,930 (47.0%) | 2,180 (53.0%) |
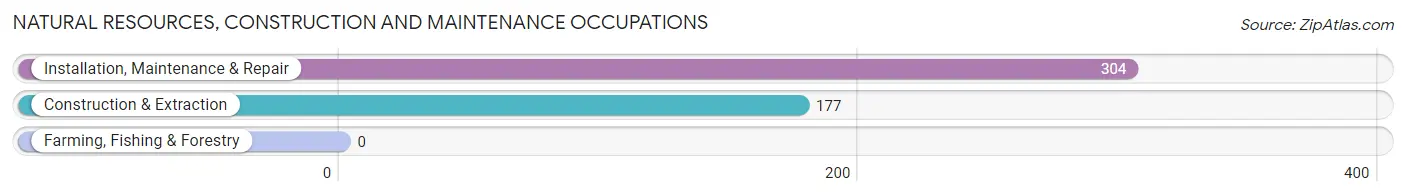
Natural Resources, Construction and Maintenance Occupations
The most common Natural Resources, Construction and Maintenance occupations in Northport are Installation, Maintenance & Repair (304 | 7.4%), and Construction & Extraction (177 | 4.3%).
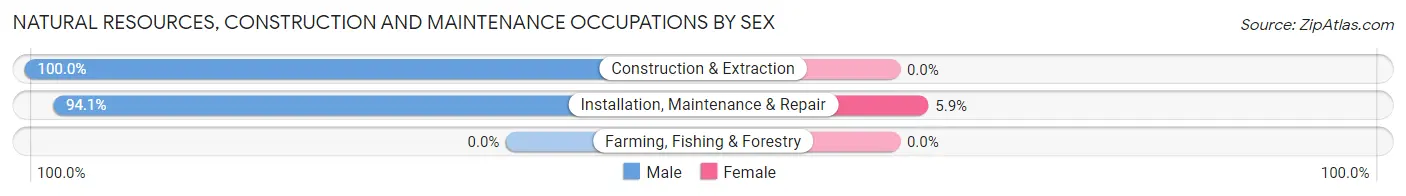
Natural Resources, Construction and Maintenance Occupations by Sex
| Occupation | Male | Female |
| Farming, Fishing & Forestry | 0 (0.0%) | 0 (0.0%) |
| Construction & Extraction | 177 (100.0%) | 0 (0.0%) |
| Installation, Maintenance & Repair | 286 (94.1%) | 18 (5.9%) |
| Total (Category) | 463 (96.3%) | 18 (3.7%) |
| Total (Overall) | 1,930 (47.0%) | 2,180 (53.0%) |
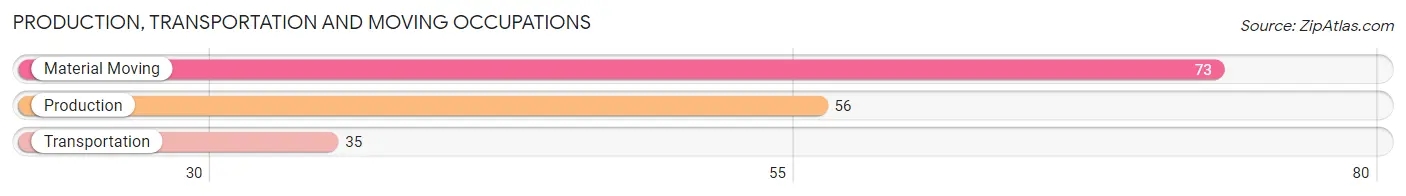
Production, Transportation and Moving Occupations
The most common Production, Transportation and Moving occupations in Northport are Material Moving (73 | 1.8%), Production (56 | 1.4%), and Transportation (35 | 0.9%).
Production, Transportation and Moving Occupations by Sex
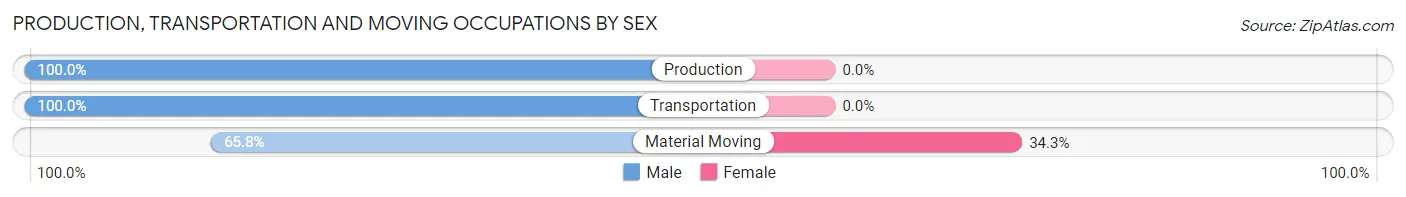
| Occupation | Male | Female |
| Production | 56 (100.0%) | 0 (0.0%) |
| Transportation | 35 (100.0%) | 0 (0.0%) |
| Material Moving | 48 (65.7%) | 25 (34.3%) |
| Total (Category) | 139 (84.8%) | 25 (15.2%) |
| Total (Overall) | 1,930 (47.0%) | 2,180 (53.0%) |
Employment Industries by Sex in Northport
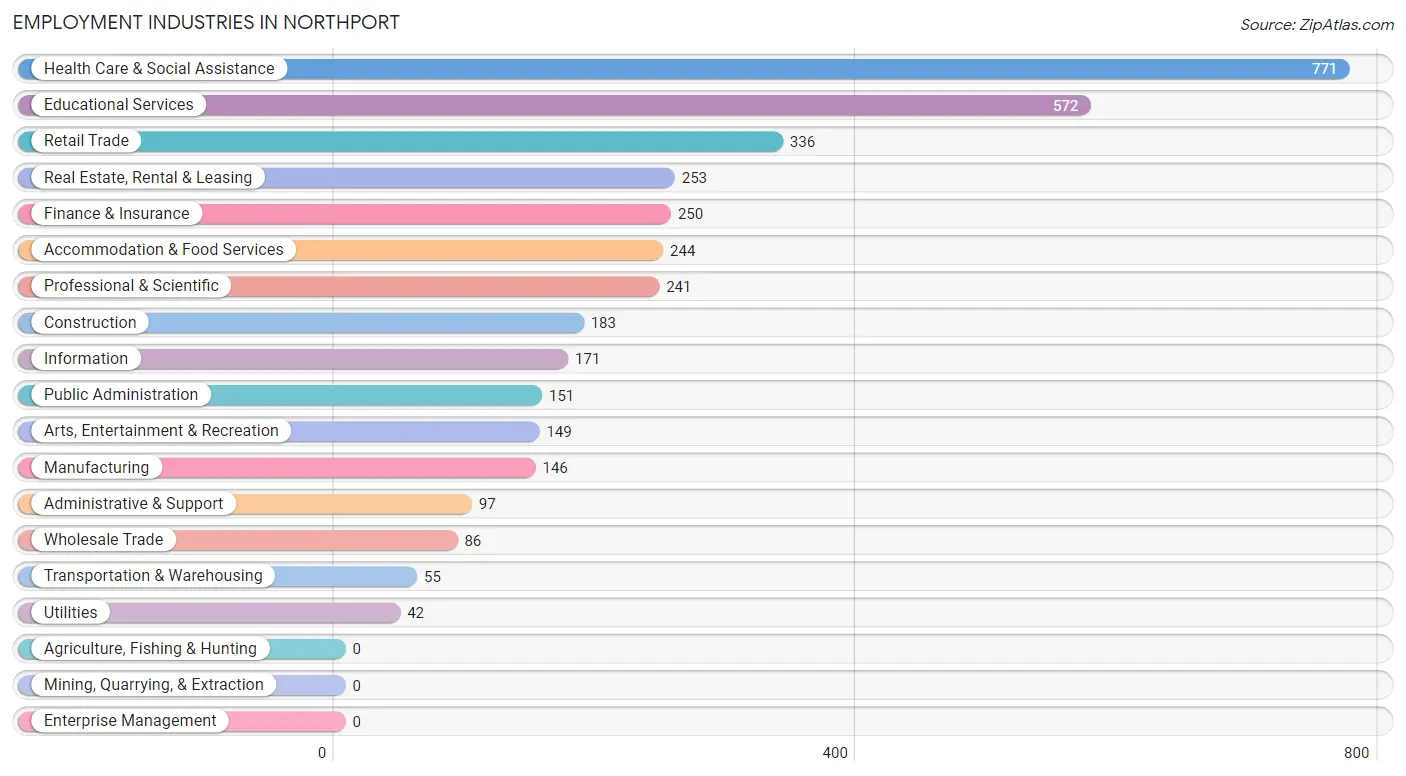
Employment Industries in Northport
The major employment industries in Northport include Health Care & Social Assistance (771 | 18.8%), Educational Services (572 | 13.9%), Retail Trade (336 | 8.2%), Real Estate, Rental & Leasing (253 | 6.2%), and Finance & Insurance (250 | 6.1%).
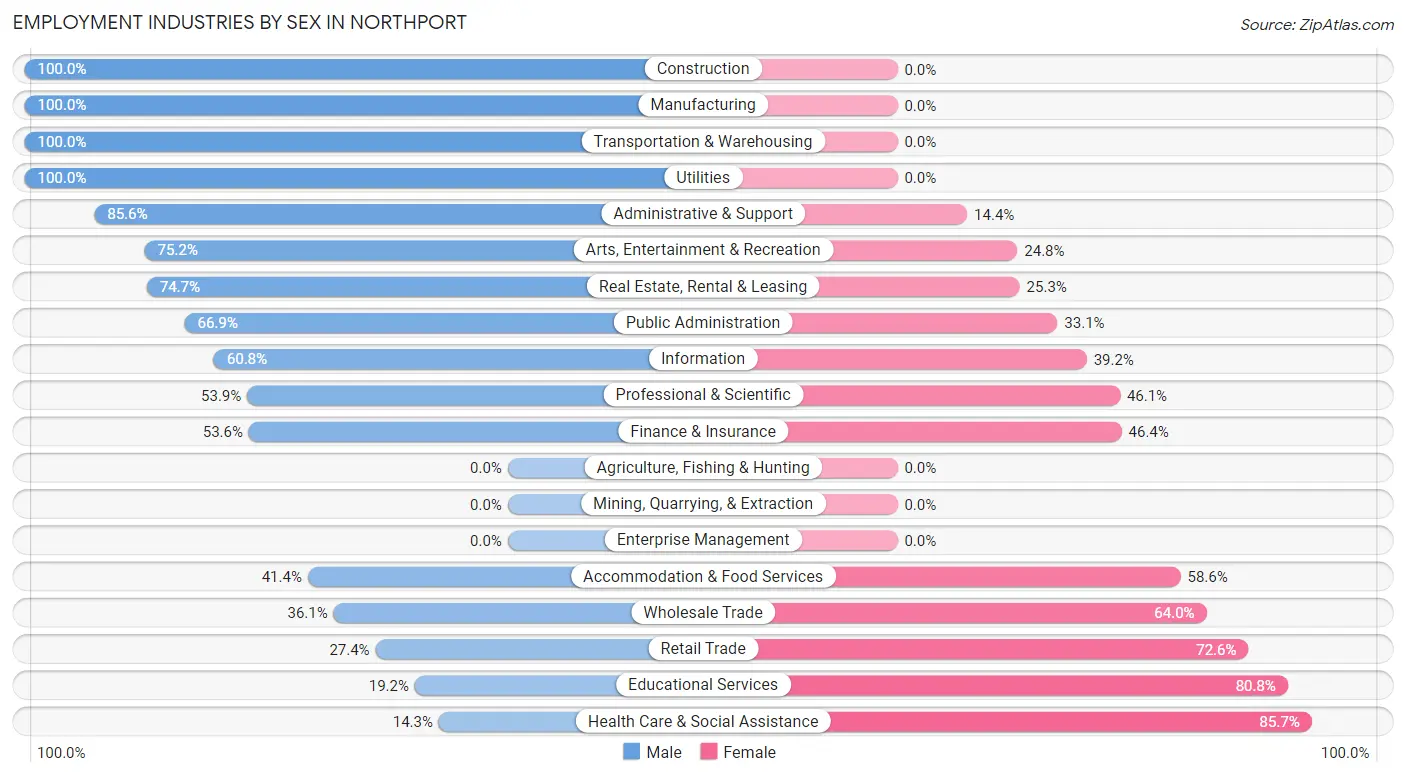
Employment Industries by Sex in Northport
The Northport industries that see more men than women are Construction (100.0%), Manufacturing (100.0%), and Transportation & Warehousing (100.0%), whereas the industries that tend to have a higher number of women are Health Care & Social Assistance (85.7%), Educational Services (80.8%), and Retail Trade (72.6%).
| Industry | Male | Female |
| Agriculture, Fishing & Hunting | 0 (0.0%) | 0 (0.0%) |
| Mining, Quarrying, & Extraction | 0 (0.0%) | 0 (0.0%) |
| Construction | 183 (100.0%) | 0 (0.0%) |
| Manufacturing | 146 (100.0%) | 0 (0.0%) |
| Wholesale Trade | 31 (36.0%) | 55 (63.9%) |
| Retail Trade | 92 (27.4%) | 244 (72.6%) |
| Transportation & Warehousing | 55 (100.0%) | 0 (0.0%) |
| Utilities | 42 (100.0%) | 0 (0.0%) |
| Information | 104 (60.8%) | 67 (39.2%) |
| Finance & Insurance | 134 (53.6%) | 116 (46.4%) |
| Real Estate, Rental & Leasing | 189 (74.7%) | 64 (25.3%) |
| Professional & Scientific | 130 (53.9%) | 111 (46.1%) |
| Enterprise Management | 0 (0.0%) | 0 (0.0%) |
| Administrative & Support | 83 (85.6%) | 14 (14.4%) |
| Educational Services | 110 (19.2%) | 462 (80.8%) |
| Health Care & Social Assistance | 110 (14.3%) | 661 (85.7%) |
| Arts, Entertainment & Recreation | 112 (75.2%) | 37 (24.8%) |
| Accommodation & Food Services | 101 (41.4%) | 143 (58.6%) |
| Public Administration | 101 (66.9%) | 50 (33.1%) |
| Total | 1,930 (47.0%) | 2,180 (53.0%) |
Education in Northport
School Enrollment in Northport
The most common levels of schooling among the 1,516 students in Northport are middle school (446 | 29.4%), high school (360 | 23.7%), and elementary school (268 | 17.7%).
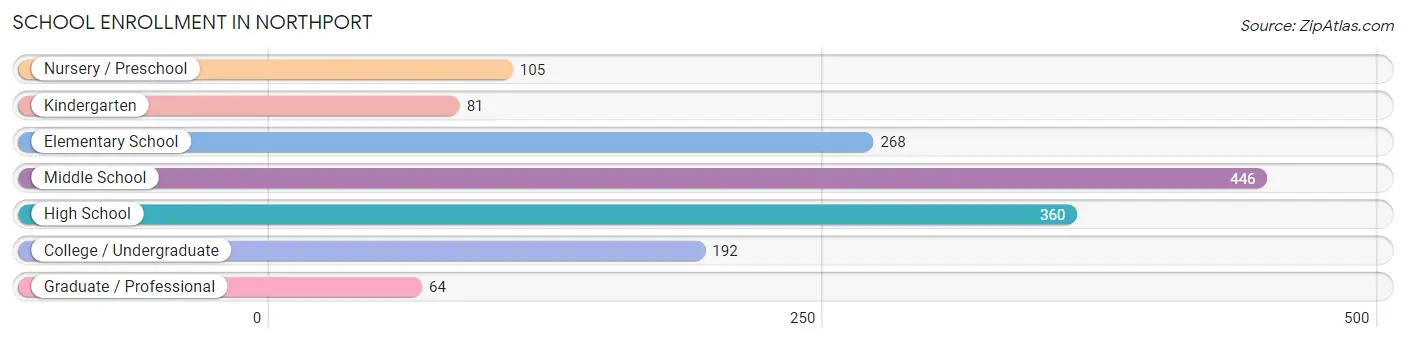
| School Level | # Students | % Students |
| Nursery / Preschool | 105 | 6.9% |
| Kindergarten | 81 | 5.3% |
| Elementary School | 268 | 17.7% |
| Middle School | 446 | 29.4% |
| High School | 360 | 23.7% |
| College / Undergraduate | 192 | 12.7% |
| Graduate / Professional | 64 | 4.2% |
| Total | 1,516 | 100.0% |
School Enrollment by Age by Funding Source in Northport
Out of a total of 1,516 students who are enrolled in schools in Northport, 193 (12.7%) attend a private institution, while the remaining 1,323 (87.3%) are enrolled in public schools. The age group of 3 to 4 year olds has the highest likelihood of being enrolled in private schools, with 61 (84.7% in the age bracket) enrolled. Conversely, the age group of 10 to 14 year olds has the lowest likelihood of being enrolled in a private school, with 510 (100.0% in the age bracket) attending a public institution.
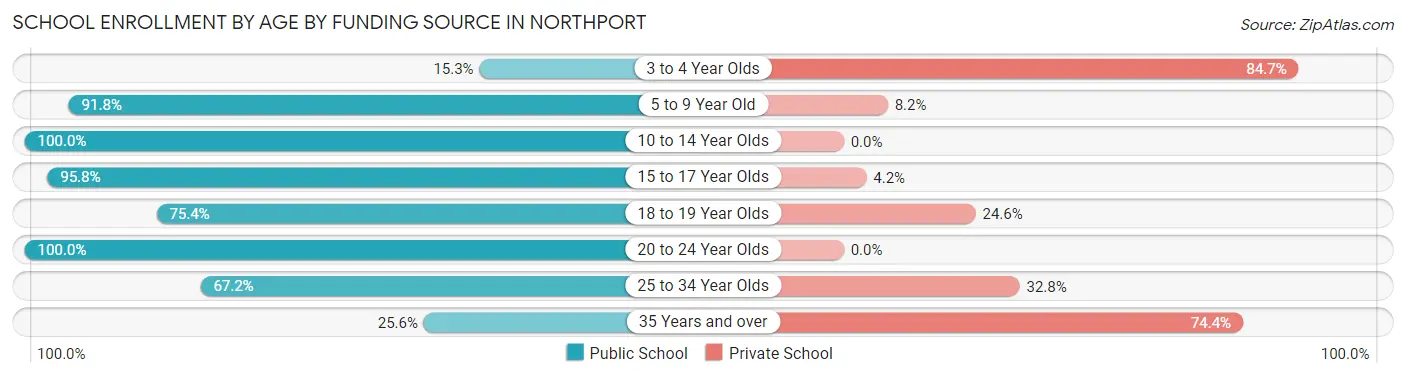
| Age Bracket | Public School | Private School |
| 3 to 4 Year Olds | 11 (15.3%) | 61 (84.7%) |
| 5 to 9 Year Old | 313 (91.8%) | 28 (8.2%) |
| 10 to 14 Year Olds | 510 (100.0%) | 0 (0.0%) |
| 15 to 17 Year Olds | 294 (95.8%) | 13 (4.2%) |
| 18 to 19 Year Olds | 43 (75.4%) | 14 (24.6%) |
| 20 to 24 Year Olds | 93 (100.0%) | 0 (0.0%) |
| 25 to 34 Year Olds | 39 (67.2%) | 19 (32.8%) |
| 35 Years and over | 20 (25.6%) | 58 (74.4%) |
| Total | 1,323 (87.3%) | 193 (12.7%) |
Educational Attainment by Field of Study in Northport
Business (655 | 16.8%), education (540 | 13.8%), science & technology (420 | 10.7%), social sciences (365 | 9.3%), and literature & languages (327 | 8.4%) are the most common fields of study among 3,907 individuals in Northport who have obtained a bachelor's degree or higher.
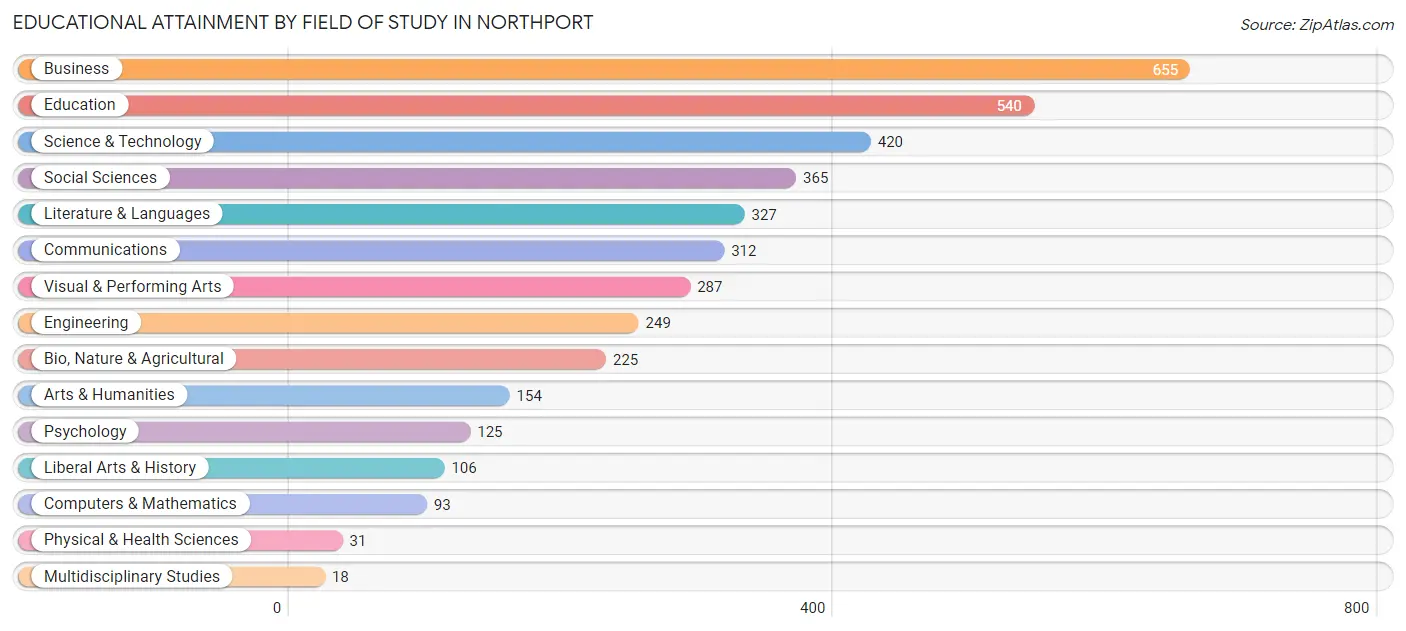
| Field of Study | # Graduates | % Graduates |
| Computers & Mathematics | 93 | 2.4% |
| Bio, Nature & Agricultural | 225 | 5.8% |
| Physical & Health Sciences | 31 | 0.8% |
| Psychology | 125 | 3.2% |
| Social Sciences | 365 | 9.3% |
| Engineering | 249 | 6.4% |
| Multidisciplinary Studies | 18 | 0.5% |
| Science & Technology | 420 | 10.7% |
| Business | 655 | 16.8% |
| Education | 540 | 13.8% |
| Literature & Languages | 327 | 8.4% |
| Liberal Arts & History | 106 | 2.7% |
| Visual & Performing Arts | 287 | 7.3% |
| Communications | 312 | 8.0% |
| Arts & Humanities | 154 | 3.9% |
| Total | 3,907 | 100.0% |
Transportation & Commute in Northport
Vehicle Availability by Sex in Northport
The most prevalent vehicle ownership categories in Northport are males with 2 vehicles (981, accounting for 52.0%) and females with 2 vehicles (1,120, making up 45.3%).
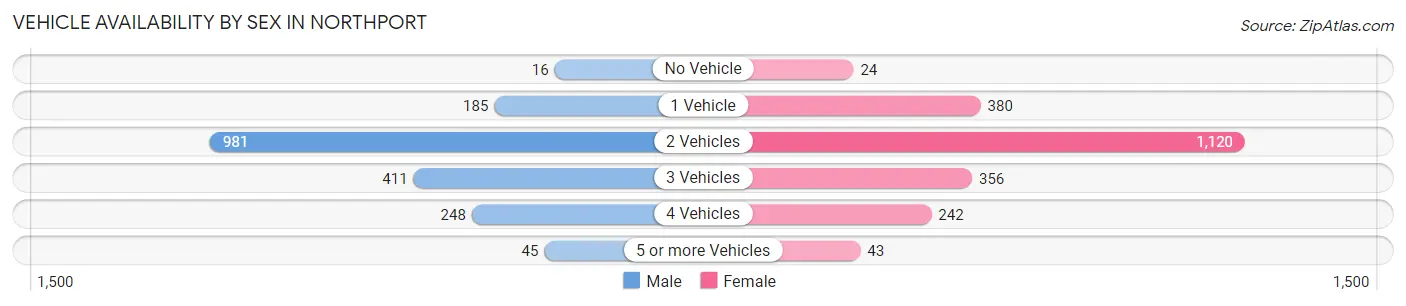
| Vehicles Available | Male | Female |
| No Vehicle | 16 (0.9%) | 24 (1.1%) |
| 1 Vehicle | 185 (9.8%) | 380 (17.5%) |
| 2 Vehicles | 981 (52.0%) | 1,120 (51.7%) |
| 3 Vehicles | 411 (21.8%) | 356 (16.4%) |
| 4 Vehicles | 248 (13.2%) | 242 (11.2%) |
| 5 or more Vehicles | 45 (2.4%) | 43 (2.0%) |
| Total | 1,886 (100.0%) | 2,165 (100.0%) |
Commute Time in Northport
The most frequently occuring commute durations in Northport are 5 to 9 minutes (577 commuters, 16.4%), 10 to 14 minutes (461 commuters, 13.1%), and 20 to 24 minutes (453 commuters, 12.9%).
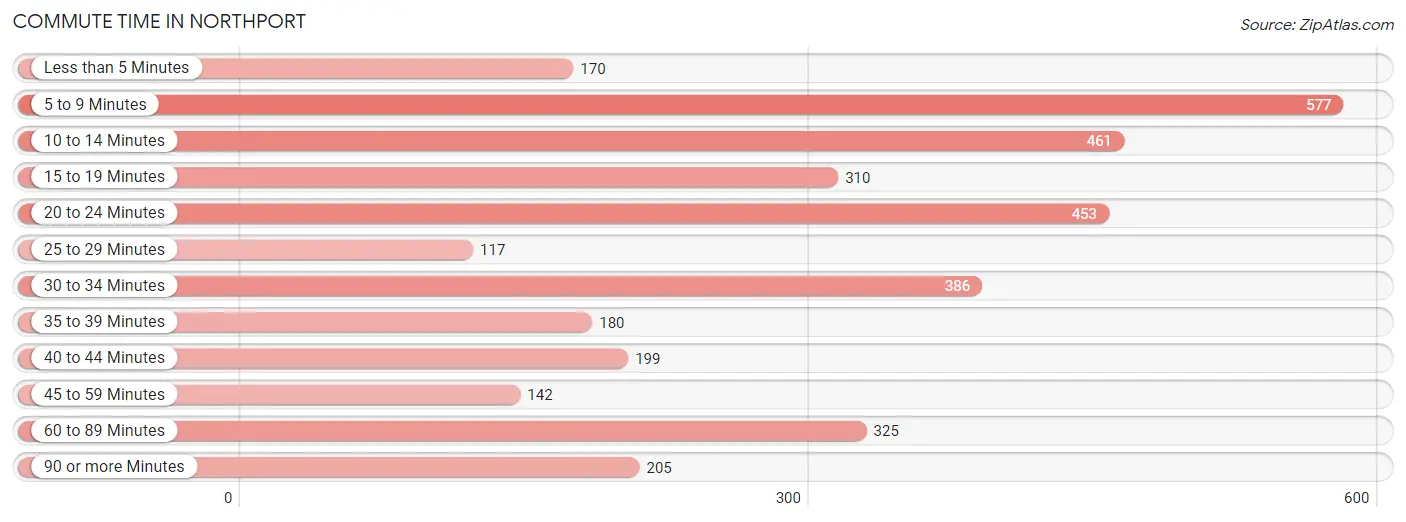
| Commute Time | # Commuters | % Commuters |
| Less than 5 Minutes | 170 | 4.8% |
| 5 to 9 Minutes | 577 | 16.4% |
| 10 to 14 Minutes | 461 | 13.1% |
| 15 to 19 Minutes | 310 | 8.8% |
| 20 to 24 Minutes | 453 | 12.9% |
| 25 to 29 Minutes | 117 | 3.3% |
| 30 to 34 Minutes | 386 | 11.0% |
| 35 to 39 Minutes | 180 | 5.1% |
| 40 to 44 Minutes | 199 | 5.7% |
| 45 to 59 Minutes | 142 | 4.0% |
| 60 to 89 Minutes | 325 | 9.2% |
| 90 or more Minutes | 205 | 5.8% |
Commute Time by Sex in Northport
The most common commute times in Northport are 5 to 9 minutes (330 commuters, 20.7%) for males and 10 to 14 minutes (451 commuters, 23.4%) for females.
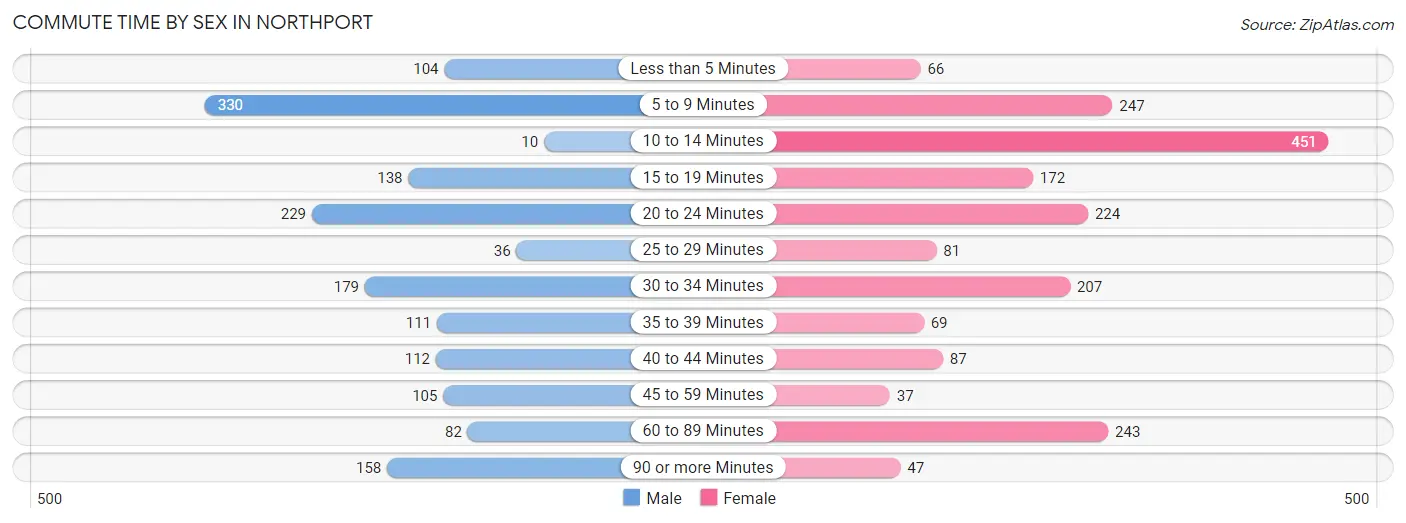
| Commute Time | Male | Female |
| Less than 5 Minutes | 104 (6.5%) | 66 (3.4%) |
| 5 to 9 Minutes | 330 (20.7%) | 247 (12.8%) |
| 10 to 14 Minutes | 10 (0.6%) | 451 (23.4%) |
| 15 to 19 Minutes | 138 (8.7%) | 172 (8.9%) |
| 20 to 24 Minutes | 229 (14.4%) | 224 (11.6%) |
| 25 to 29 Minutes | 36 (2.3%) | 81 (4.2%) |
| 30 to 34 Minutes | 179 (11.2%) | 207 (10.7%) |
| 35 to 39 Minutes | 111 (7.0%) | 69 (3.6%) |
| 40 to 44 Minutes | 112 (7.0%) | 87 (4.5%) |
| 45 to 59 Minutes | 105 (6.6%) | 37 (1.9%) |
| 60 to 89 Minutes | 82 (5.1%) | 243 (12.6%) |
| 90 or more Minutes | 158 (9.9%) | 47 (2.4%) |
Time of Departure to Work by Sex in Northport
The most frequent times of departure to work in Northport are 8:30 AM to 8:59 AM (282, 17.7%) for males and 8:00 AM to 8:29 AM (539, 27.9%) for females.
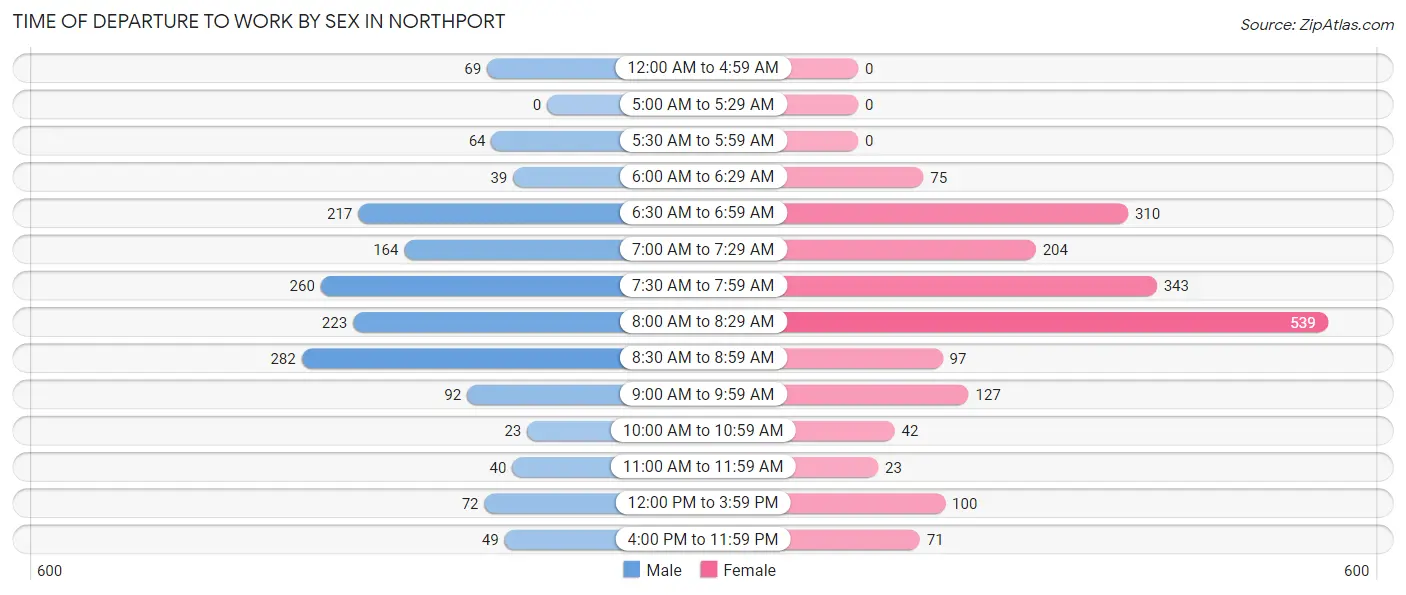
| Time of Departure | Male | Female |
| 12:00 AM to 4:59 AM | 69 (4.3%) | 0 (0.0%) |
| 5:00 AM to 5:29 AM | 0 (0.0%) | 0 (0.0%) |
| 5:30 AM to 5:59 AM | 64 (4.0%) | 0 (0.0%) |
| 6:00 AM to 6:29 AM | 39 (2.5%) | 75 (3.9%) |
| 6:30 AM to 6:59 AM | 217 (13.6%) | 310 (16.1%) |
| 7:00 AM to 7:29 AM | 164 (10.3%) | 204 (10.6%) |
| 7:30 AM to 7:59 AM | 260 (16.3%) | 343 (17.8%) |
| 8:00 AM to 8:29 AM | 223 (14.0%) | 539 (27.9%) |
| 8:30 AM to 8:59 AM | 282 (17.7%) | 97 (5.0%) |
| 9:00 AM to 9:59 AM | 92 (5.8%) | 127 (6.6%) |
| 10:00 AM to 10:59 AM | 23 (1.4%) | 42 (2.2%) |
| 11:00 AM to 11:59 AM | 40 (2.5%) | 23 (1.2%) |
| 12:00 PM to 3:59 PM | 72 (4.5%) | 100 (5.2%) |
| 4:00 PM to 11:59 PM | 49 (3.1%) | 71 (3.7%) |
| Total | 1,594 (100.0%) | 1,931 (100.0%) |
Housing Occupancy in Northport
Occupancy by Ownership in Northport
Of the total 2,999 dwellings in Northport, owner-occupied units account for 2,452 (81.8%), while renter-occupied units make up 547 (18.2%).
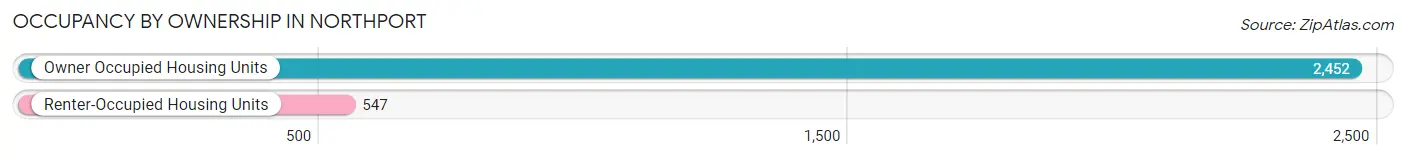
| Occupancy | # Housing Units | % Housing Units |
| Owner Occupied Housing Units | 2,452 | 81.8% |
| Renter-Occupied Housing Units | 547 | 18.2% |
| Total Occupied Housing Units | 2,999 | 100.0% |
Occupancy by Household Size in Northport
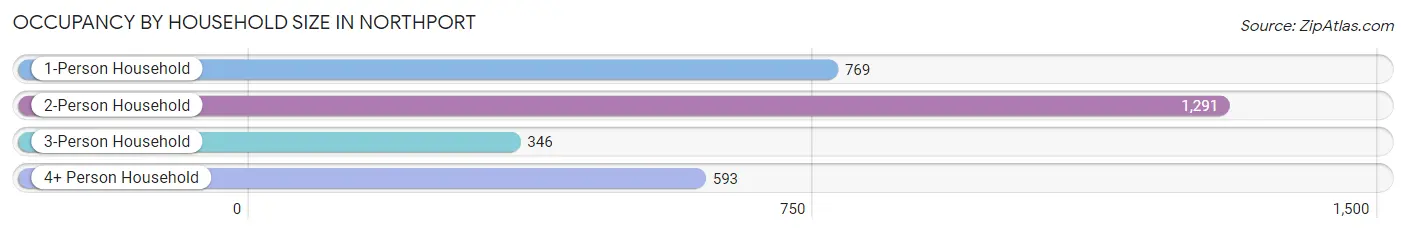
| Household Size | # Housing Units | % Housing Units |
| 1-Person Household | 769 | 25.6% |
| 2-Person Household | 1,291 | 43.0% |
| 3-Person Household | 346 | 11.5% |
| 4+ Person Household | 593 | 19.8% |
| Total Housing Units | 2,999 | 100.0% |
Occupancy by Ownership by Household Size in Northport
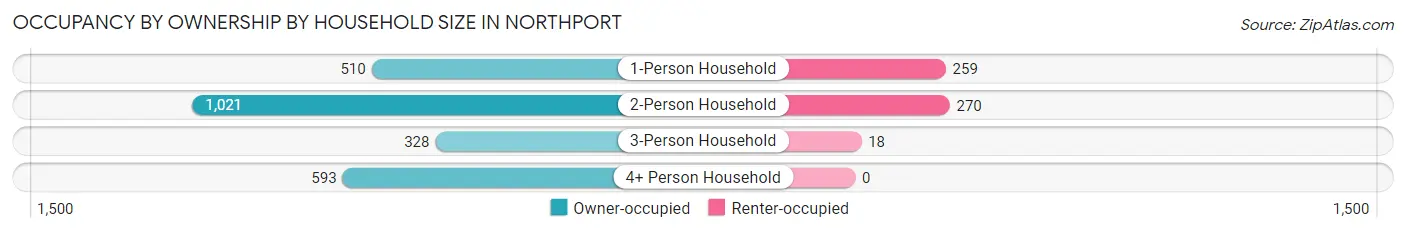
| Household Size | Owner-occupied | Renter-occupied |
| 1-Person Household | 510 (66.3%) | 259 (33.7%) |
| 2-Person Household | 1,021 (79.1%) | 270 (20.9%) |
| 3-Person Household | 328 (94.8%) | 18 (5.2%) |
| 4+ Person Household | 593 (100.0%) | 0 (0.0%) |
| Total Housing Units | 2,452 (81.8%) | 547 (18.2%) |
Occupancy by Educational Attainment in Northport
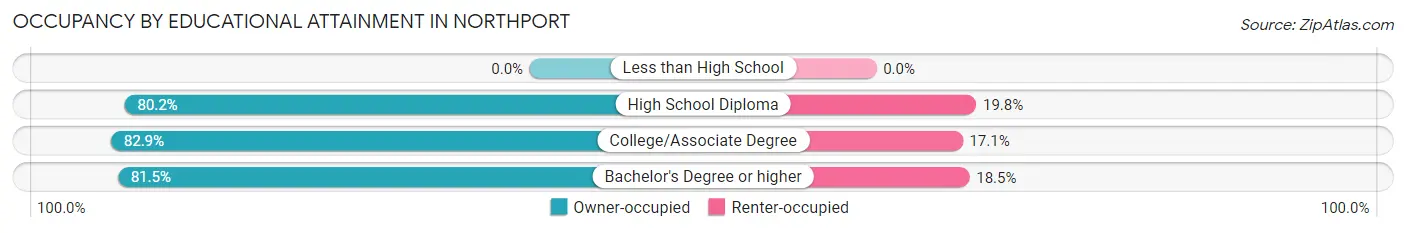
| Household Size | Owner-occupied | Renter-occupied |
| Less than High School | 0 (0.0%) | 0 (0.0%) |
| High School Diploma | 158 (80.2%) | 39 (19.8%) |
| College/Associate Degree | 562 (82.9%) | 116 (17.1%) |
| Bachelor's Degree or higher | 1,732 (81.5%) | 392 (18.5%) |
Occupancy by Age of Householder in Northport
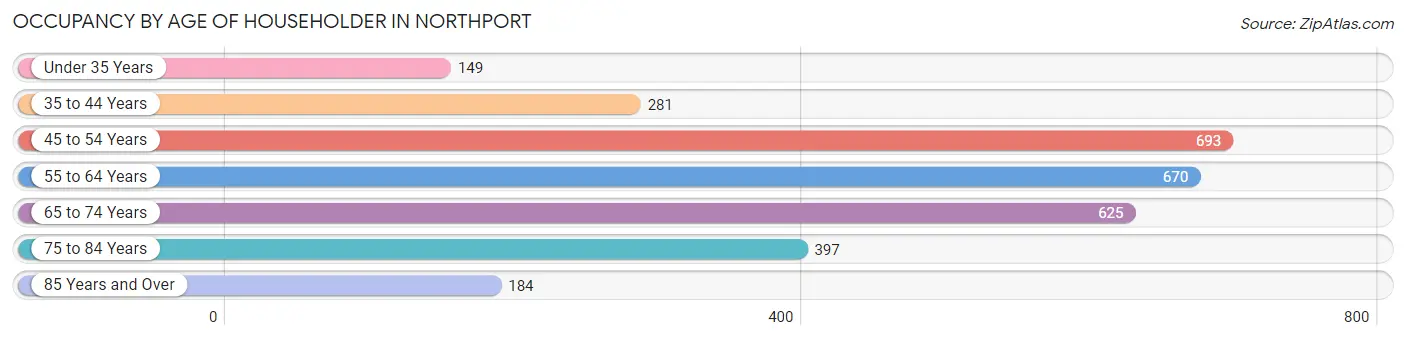
| Age Bracket | # Households | % Households |
| Under 35 Years | 149 | 5.0% |
| 35 to 44 Years | 281 | 9.4% |
| 45 to 54 Years | 693 | 23.1% |
| 55 to 64 Years | 670 | 22.3% |
| 65 to 74 Years | 625 | 20.8% |
| 75 to 84 Years | 397 | 13.2% |
| 85 Years and Over | 184 | 6.1% |
| Total | 2,999 | 100.0% |
Housing Finances in Northport
Median Income by Occupancy in Northport
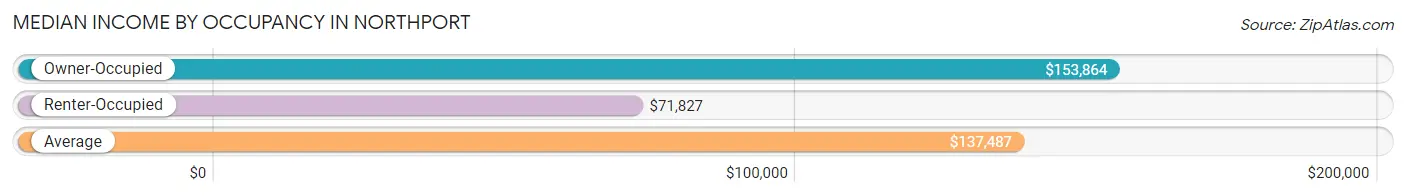
| Occupancy Type | # Households | Median Income |
| Owner-Occupied | 2,452 (81.8%) | $153,864 |
| Renter-Occupied | 547 (18.2%) | $71,827 |
| Average | 2,999 (100.0%) | $137,487 |
Occupancy by Householder Income Bracket in Northport
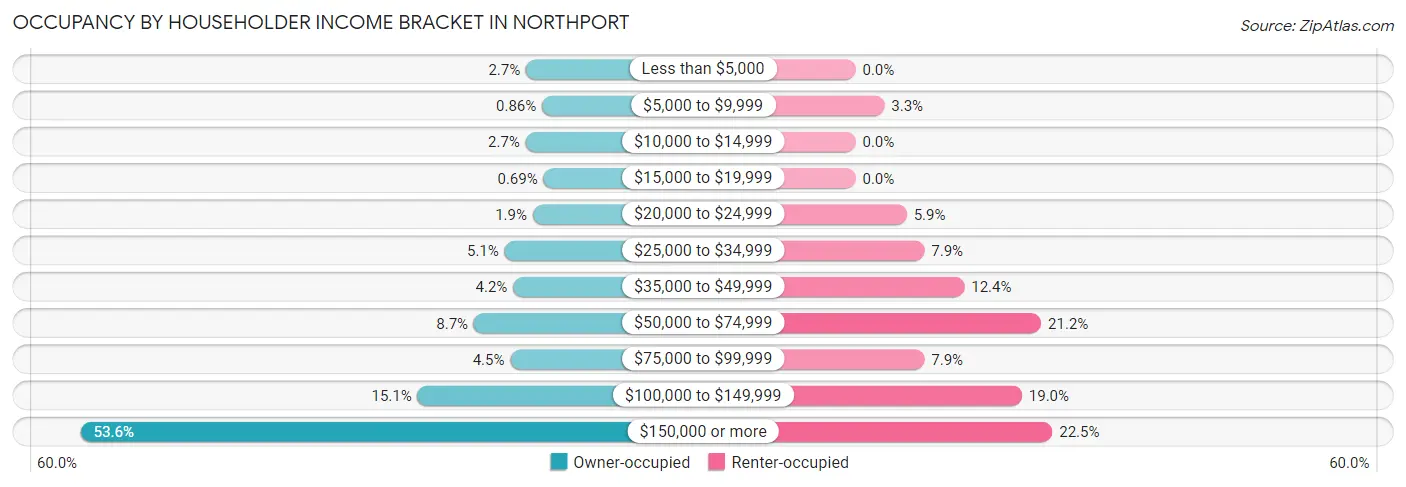
| Income Bracket | Owner-occupied | Renter-occupied |
| Less than $5,000 | 66 (2.7%) | 0 (0.0%) |
| $5,000 to $9,999 | 21 (0.9%) | 18 (3.3%) |
| $10,000 to $14,999 | 67 (2.7%) | 0 (0.0%) |
| $15,000 to $19,999 | 17 (0.7%) | 0 (0.0%) |
| $20,000 to $24,999 | 47 (1.9%) | 32 (5.9%) |
| $25,000 to $34,999 | 126 (5.1%) | 43 (7.9%) |
| $35,000 to $49,999 | 102 (4.2%) | 68 (12.4%) |
| $50,000 to $74,999 | 212 (8.6%) | 116 (21.2%) |
| $75,000 to $99,999 | 110 (4.5%) | 43 (7.9%) |
| $100,000 to $149,999 | 370 (15.1%) | 104 (19.0%) |
| $150,000 or more | 1,314 (53.6%) | 123 (22.5%) |
| Total | 2,452 (100.0%) | 547 (100.0%) |
Monthly Housing Cost Tiers in Northport
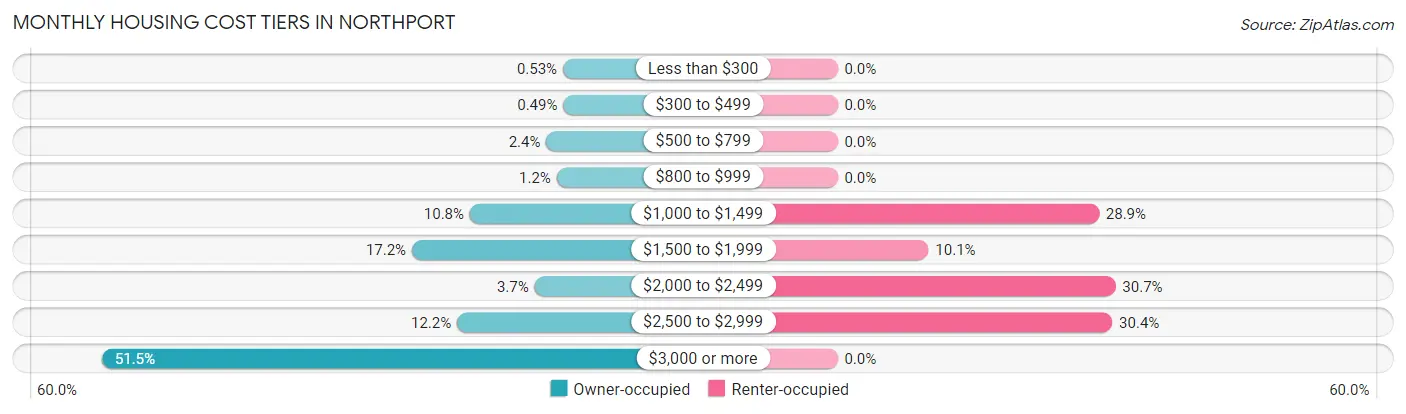
| Monthly Cost | Owner-occupied | Renter-occupied |
| Less than $300 | 13 (0.5%) | 0 (0.0%) |
| $300 to $499 | 12 (0.5%) | 0 (0.0%) |
| $500 to $799 | 58 (2.4%) | 0 (0.0%) |
| $800 to $999 | 30 (1.2%) | 0 (0.0%) |
| $1,000 to $1,499 | 265 (10.8%) | 158 (28.9%) |
| $1,500 to $1,999 | 422 (17.2%) | 55 (10.1%) |
| $2,000 to $2,499 | 90 (3.7%) | 168 (30.7%) |
| $2,500 to $2,999 | 300 (12.2%) | 166 (30.3%) |
| $3,000 or more | 1,262 (51.5%) | 0 (0.0%) |
| Total | 2,452 (100.0%) | 547 (100.0%) |
Physical Housing Characteristics in Northport
Housing Structures in Northport
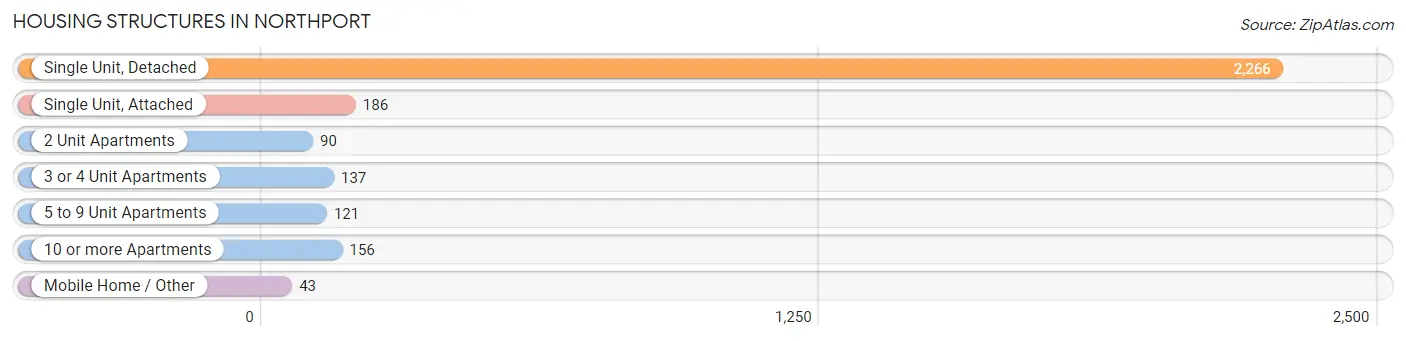
| Structure Type | # Housing Units | % Housing Units |
| Single Unit, Detached | 2,266 | 75.6% |
| Single Unit, Attached | 186 | 6.2% |
| 2 Unit Apartments | 90 | 3.0% |
| 3 or 4 Unit Apartments | 137 | 4.6% |
| 5 to 9 Unit Apartments | 121 | 4.0% |
| 10 or more Apartments | 156 | 5.2% |
| Mobile Home / Other | 43 | 1.4% |
| Total | 2,999 | 100.0% |
Housing Structures by Occupancy in Northport
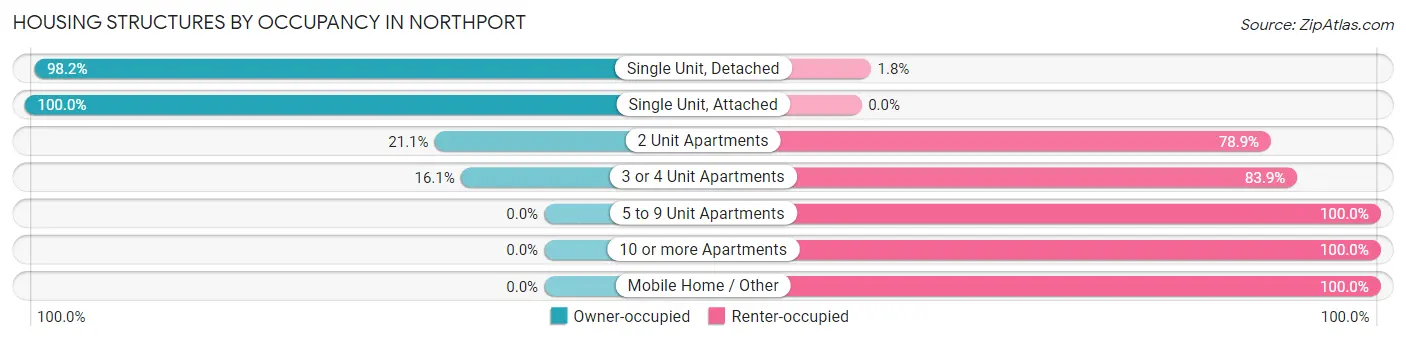
| Structure Type | Owner-occupied | Renter-occupied |
| Single Unit, Detached | 2,225 (98.2%) | 41 (1.8%) |
| Single Unit, Attached | 186 (100.0%) | 0 (0.0%) |
| 2 Unit Apartments | 19 (21.1%) | 71 (78.9%) |
| 3 or 4 Unit Apartments | 22 (16.1%) | 115 (83.9%) |
| 5 to 9 Unit Apartments | 0 (0.0%) | 121 (100.0%) |
| 10 or more Apartments | 0 (0.0%) | 156 (100.0%) |
| Mobile Home / Other | 0 (0.0%) | 43 (100.0%) |
| Total | 2,452 (81.8%) | 547 (18.2%) |
Housing Structures by Number of Rooms in Northport
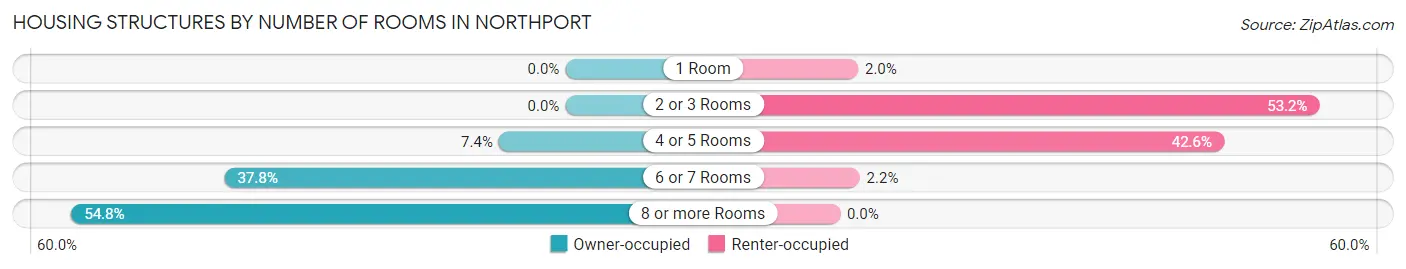
| Number of Rooms | Owner-occupied | Renter-occupied |
| 1 Room | 0 (0.0%) | 11 (2.0%) |
| 2 or 3 Rooms | 0 (0.0%) | 291 (53.2%) |
| 4 or 5 Rooms | 181 (7.4%) | 233 (42.6%) |
| 6 or 7 Rooms | 927 (37.8%) | 12 (2.2%) |
| 8 or more Rooms | 1,344 (54.8%) | 0 (0.0%) |
| Total | 2,452 (100.0%) | 547 (100.0%) |
Housing Structure by Heating Type in Northport
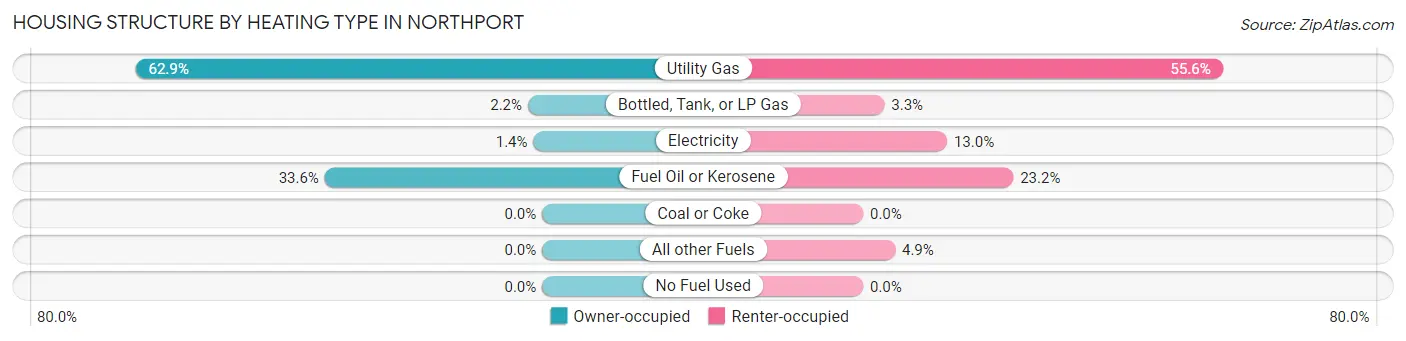
| Heating Type | Owner-occupied | Renter-occupied |
| Utility Gas | 1,541 (62.8%) | 304 (55.6%) |
| Bottled, Tank, or LP Gas | 54 (2.2%) | 18 (3.3%) |
| Electricity | 33 (1.3%) | 71 (13.0%) |
| Fuel Oil or Kerosene | 824 (33.6%) | 127 (23.2%) |
| Coal or Coke | 0 (0.0%) | 0 (0.0%) |
| All other Fuels | 0 (0.0%) | 27 (4.9%) |
| No Fuel Used | 0 (0.0%) | 0 (0.0%) |
| Total | 2,452 (100.0%) | 547 (100.0%) |
Household Vehicle Usage in Northport
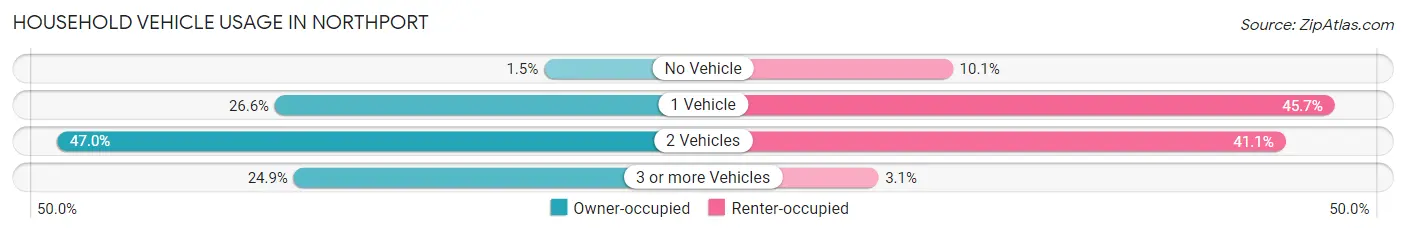
| Vehicles per Household | Owner-occupied | Renter-occupied |
| No Vehicle | 37 (1.5%) | 55 (10.1%) |
| 1 Vehicle | 653 (26.6%) | 250 (45.7%) |
| 2 Vehicles | 1,152 (47.0%) | 225 (41.1%) |
| 3 or more Vehicles | 610 (24.9%) | 17 (3.1%) |
| Total | 2,452 (100.0%) | 547 (100.0%) |
Real Estate & Mortgages in Northport
Real Estate and Mortgage Overview in Northport
| Characteristic | Without Mortgage | With Mortgage |
| Housing Units | 862 | 1,590 |
| Median Property Value | $694,600 | $710,000 |
| Median Household Income | $103,088 | $1,049 |
| Monthly Housing Costs | $1,501 | $1,205 |
| Real Estate Taxes | $10,001 | $0 |
Property Value by Mortgage Status in Northport
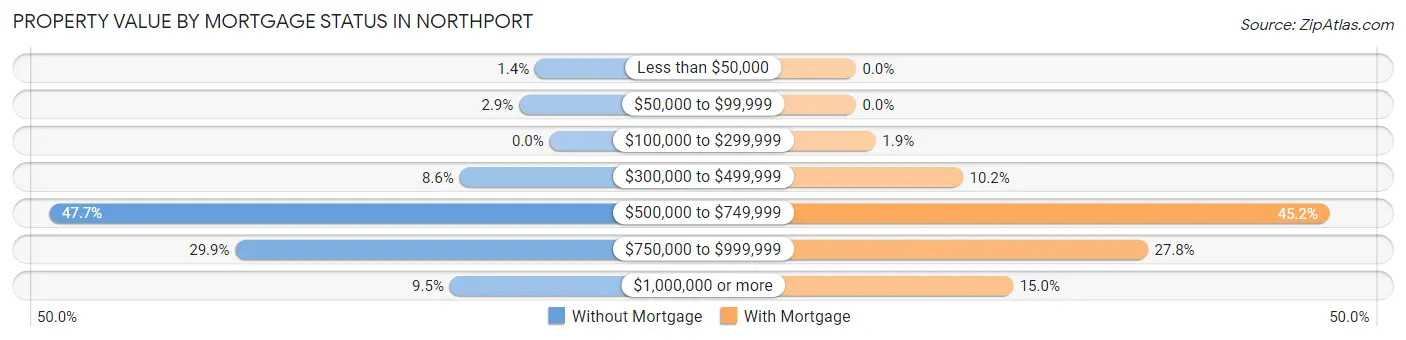
| Property Value | Without Mortgage | With Mortgage |
| Less than $50,000 | 12 (1.4%) | 0 (0.0%) |
| $50,000 to $99,999 | 25 (2.9%) | 0 (0.0%) |
| $100,000 to $299,999 | 0 (0.0%) | 30 (1.9%) |
| $300,000 to $499,999 | 74 (8.6%) | 162 (10.2%) |
| $500,000 to $749,999 | 411 (47.7%) | 718 (45.2%) |
| $750,000 to $999,999 | 258 (29.9%) | 442 (27.8%) |
| $1,000,000 or more | 82 (9.5%) | 238 (15.0%) |
| Total | 862 (100.0%) | 1,590 (100.0%) |
Household Income by Mortgage Status in Northport
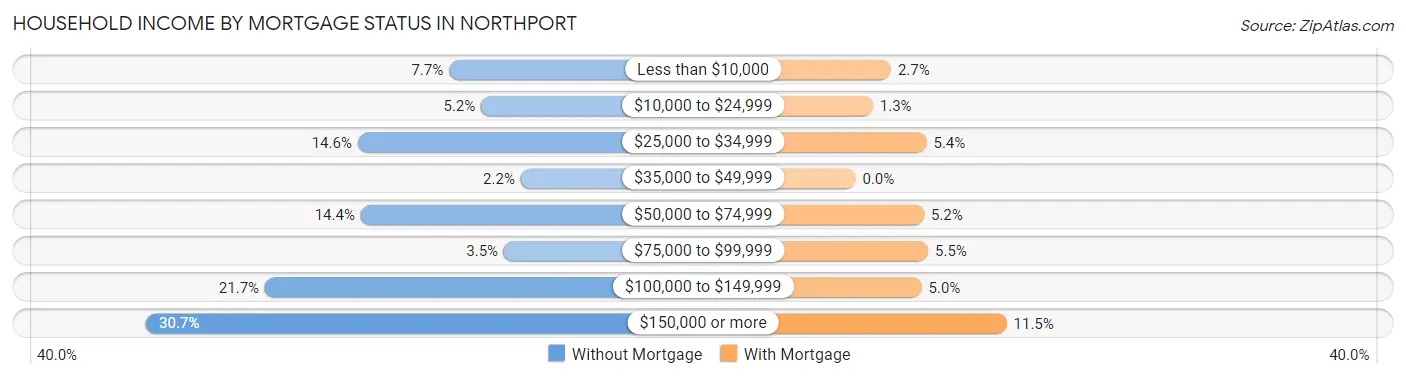
| Household Income | Without Mortgage | With Mortgage |
| Less than $10,000 | 66 (7.7%) | 43 (2.7%) |
| $10,000 to $24,999 | 45 (5.2%) | 21 (1.3%) |
| $25,000 to $34,999 | 126 (14.6%) | 86 (5.4%) |
| $35,000 to $49,999 | 19 (2.2%) | 0 (0.0%) |
| $50,000 to $74,999 | 124 (14.4%) | 83 (5.2%) |
| $75,000 to $99,999 | 30 (3.5%) | 88 (5.5%) |
| $100,000 to $149,999 | 187 (21.7%) | 80 (5.0%) |
| $150,000 or more | 265 (30.7%) | 183 (11.5%) |
| Total | 862 (100.0%) | 1,590 (100.0%) |
Property Value to Household Income Ratio in Northport
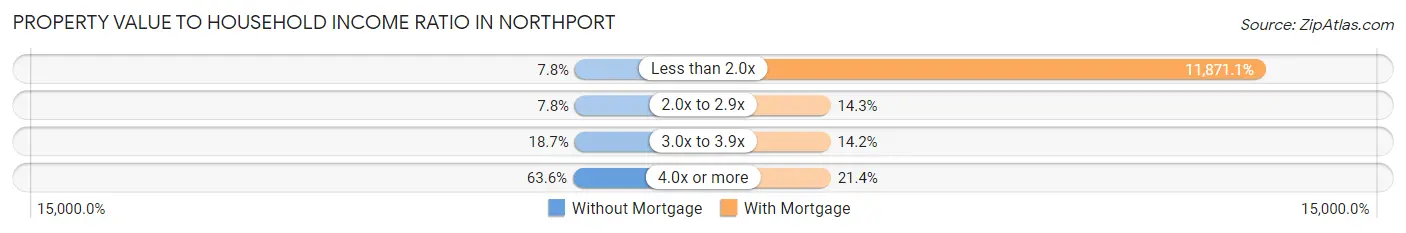
| Value-to-Income Ratio | Without Mortgage | With Mortgage |
| Less than 2.0x | 67 (7.8%) | 188,750 (11,871.1%) |
| 2.0x to 2.9x | 67 (7.8%) | 227 (14.3%) |
| 3.0x to 3.9x | 161 (18.7%) | 226 (14.2%) |
| 4.0x or more | 548 (63.6%) | 340 (21.4%) |
| Total | 862 (100.0%) | 1,590 (100.0%) |
Real Estate Taxes by Mortgage Status in Northport
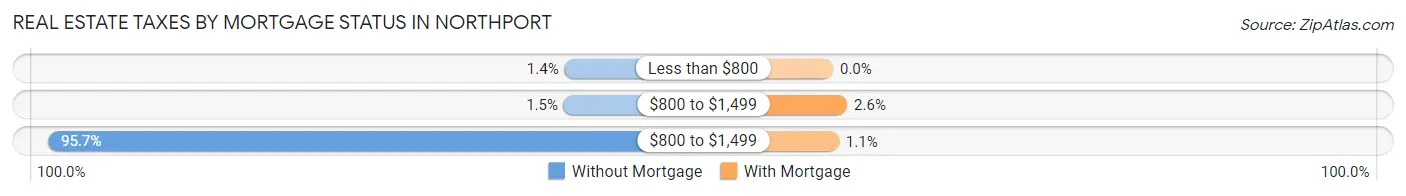
| Property Taxes | Without Mortgage | With Mortgage |
| Less than $800 | 12 (1.4%) | 0 (0.0%) |
| $800 to $1,499 | 13 (1.5%) | 41 (2.6%) |
| $800 to $1,499 | 825 (95.7%) | 17 (1.1%) |
| Total | 862 (100.0%) | 1,590 (100.0%) |
Health & Disability in Northport
Health Insurance Coverage by Age in Northport
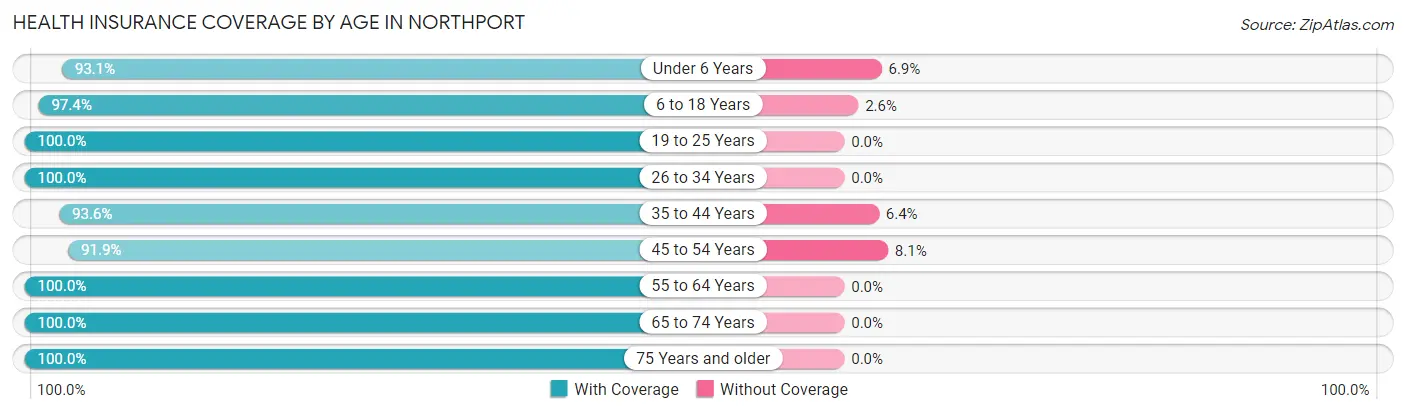
| Age Bracket | With Coverage | Without Coverage |
| Under 6 Years | 201 (93.1%) | 15 (6.9%) |
| 6 to 18 Years | 1,123 (97.4%) | 30 (2.6%) |
| 19 to 25 Years | 740 (100.0%) | 0 (0.0%) |
| 26 to 34 Years | 258 (100.0%) | 0 (0.0%) |
| 35 to 44 Years | 523 (93.6%) | 36 (6.4%) |
| 45 to 54 Years | 1,221 (91.9%) | 108 (8.1%) |
| 55 to 64 Years | 1,205 (100.0%) | 0 (0.0%) |
| 65 to 74 Years | 1,123 (100.0%) | 0 (0.0%) |
| 75 Years and older | 754 (100.0%) | 0 (0.0%) |
| Total | 7,148 (97.4%) | 189 (2.6%) |
Health Insurance Coverage by Citizenship Status in Northport
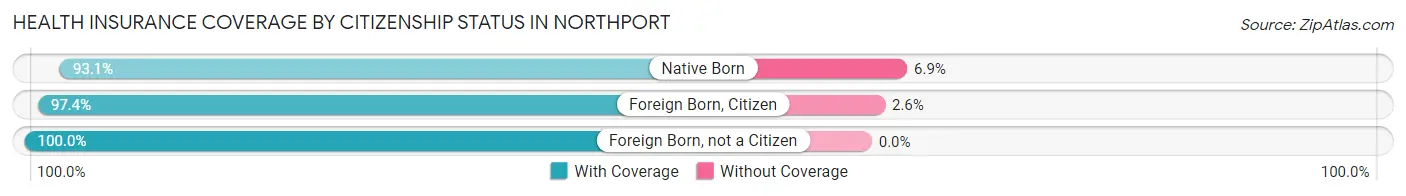
| Citizenship Status | With Coverage | Without Coverage |
| Native Born | 201 (93.1%) | 15 (6.9%) |
| Foreign Born, Citizen | 1,123 (97.4%) | 30 (2.6%) |
| Foreign Born, not a Citizen | 740 (100.0%) | 0 (0.0%) |
Health Insurance Coverage by Household Income in Northport
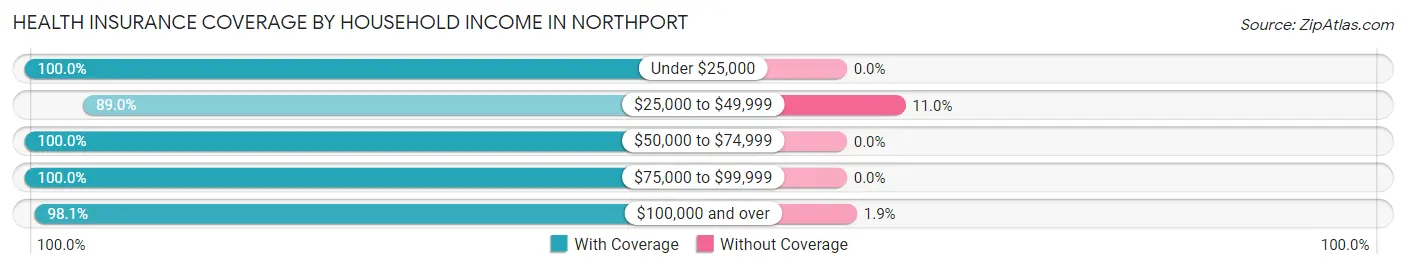
| Household Income | With Coverage | Without Coverage |
| Under $25,000 | 343 (100.0%) | 0 (0.0%) |
| $25,000 to $49,999 | 715 (89.0%) | 88 (11.0%) |
| $50,000 to $74,999 | 497 (100.0%) | 0 (0.0%) |
| $75,000 to $99,999 | 273 (100.0%) | 0 (0.0%) |
| $100,000 and over | 5,257 (98.1%) | 101 (1.9%) |
Public vs Private Health Insurance Coverage by Age in Northport
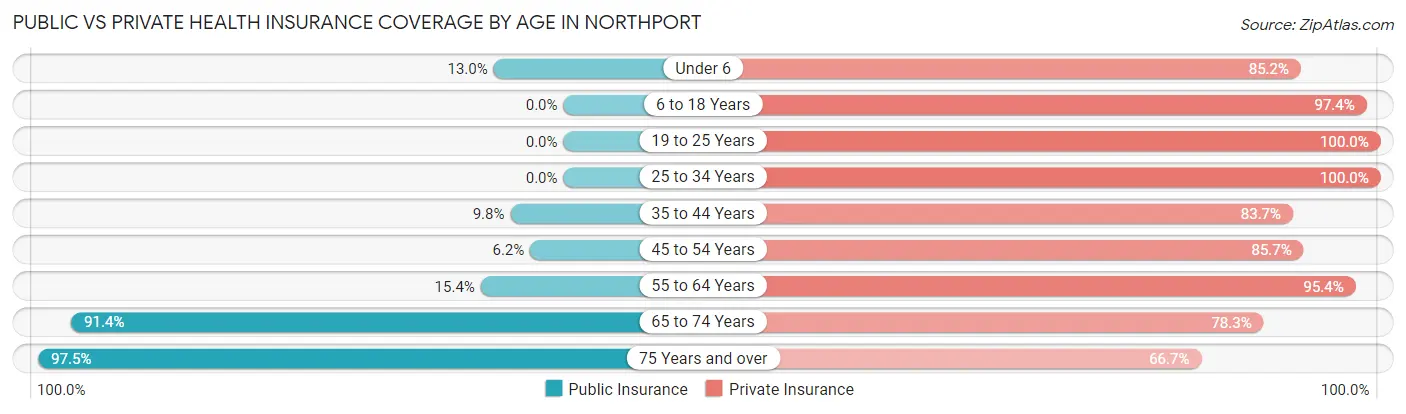
| Age Bracket | Public Insurance | Private Insurance |
| Under 6 | 28 (13.0%) | 184 (85.2%) |
| 6 to 18 Years | 0 (0.0%) | 1,123 (97.4%) |
| 19 to 25 Years | 0 (0.0%) | 740 (100.0%) |
| 25 to 34 Years | 0 (0.0%) | 258 (100.0%) |
| 35 to 44 Years | 55 (9.8%) | 468 (83.7%) |
| 45 to 54 Years | 82 (6.2%) | 1,139 (85.7%) |
| 55 to 64 Years | 185 (15.3%) | 1,149 (95.4%) |
| 65 to 74 Years | 1,026 (91.4%) | 879 (78.3%) |
| 75 Years and over | 735 (97.5%) | 503 (66.7%) |
| Total | 2,111 (28.8%) | 6,443 (87.8%) |
Disability Status by Sex by Age in Northport
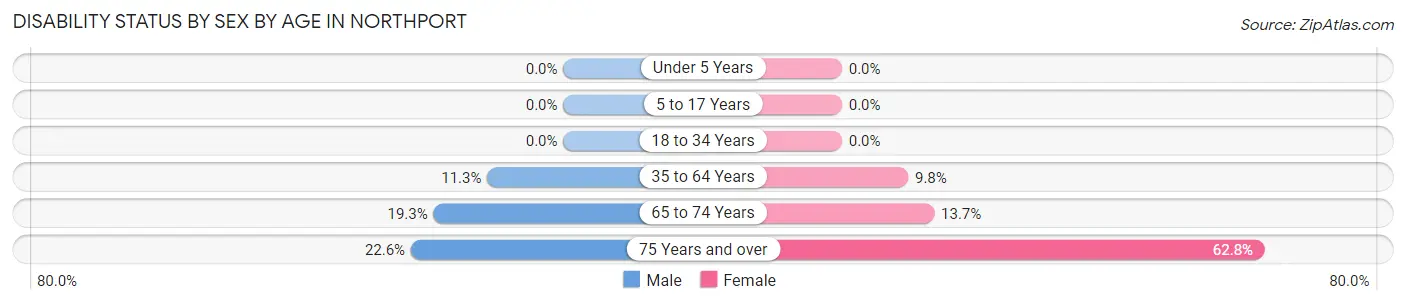
| Age Bracket | Male | Female |
| Under 5 Years | 0 (0.0%) | 0 (0.0%) |
| 5 to 17 Years | 0 (0.0%) | 0 (0.0%) |
| 18 to 34 Years | 0 (0.0%) | 0 (0.0%) |
| 35 to 64 Years | 153 (11.3%) | 171 (9.8%) |
| 65 to 74 Years | 111 (19.3%) | 75 (13.7%) |
| 75 Years and over | 55 (22.6%) | 321 (62.8%) |
Disability Class by Sex by Age in Northport
Disability Class: Hearing Difficulty
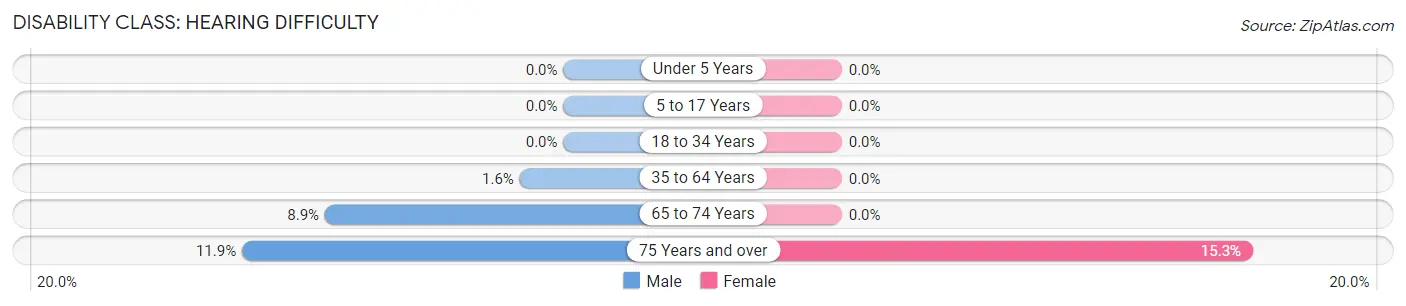
| Age Bracket | Male | Female |
| Under 5 Years | 0 (0.0%) | 0 (0.0%) |
| 5 to 17 Years | 0 (0.0%) | 0 (0.0%) |
| 18 to 34 Years | 0 (0.0%) | 0 (0.0%) |
| 35 to 64 Years | 22 (1.6%) | 0 (0.0%) |
| 65 to 74 Years | 51 (8.8%) | 0 (0.0%) |
| 75 Years and over | 29 (11.9%) | 78 (15.3%) |
Disability Class: Vision Difficulty
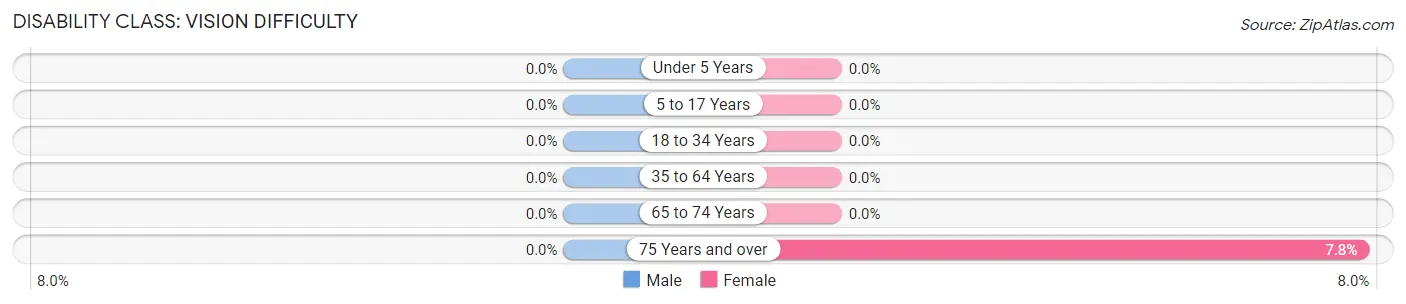
| Age Bracket | Male | Female |
| Under 5 Years | 0 (0.0%) | 0 (0.0%) |
| 5 to 17 Years | 0 (0.0%) | 0 (0.0%) |
| 18 to 34 Years | 0 (0.0%) | 0 (0.0%) |
| 35 to 64 Years | 0 (0.0%) | 0 (0.0%) |
| 65 to 74 Years | 0 (0.0%) | 0 (0.0%) |
| 75 Years and over | 0 (0.0%) | 40 (7.8%) |
Disability Class: Cognitive Difficulty
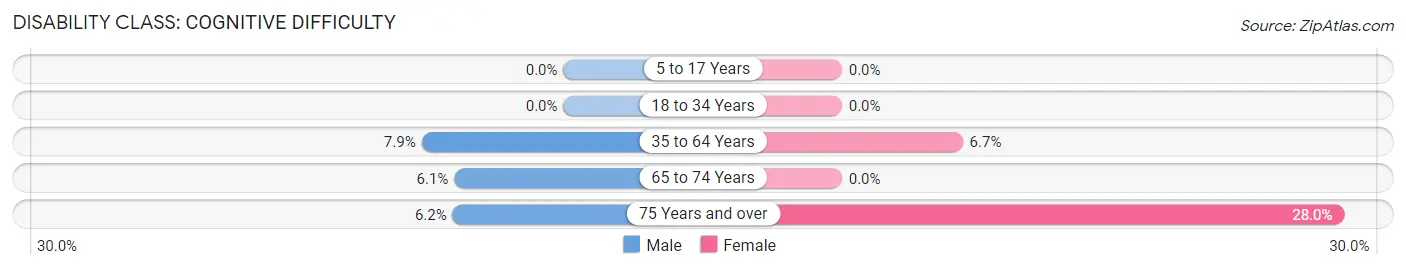
| Age Bracket | Male | Female |
| 5 to 17 Years | 0 (0.0%) | 0 (0.0%) |
| 18 to 34 Years | 0 (0.0%) | 0 (0.0%) |
| 35 to 64 Years | 107 (7.9%) | 117 (6.7%) |
| 65 to 74 Years | 35 (6.1%) | 0 (0.0%) |
| 75 Years and over | 15 (6.2%) | 143 (28.0%) |
Disability Class: Ambulatory Difficulty
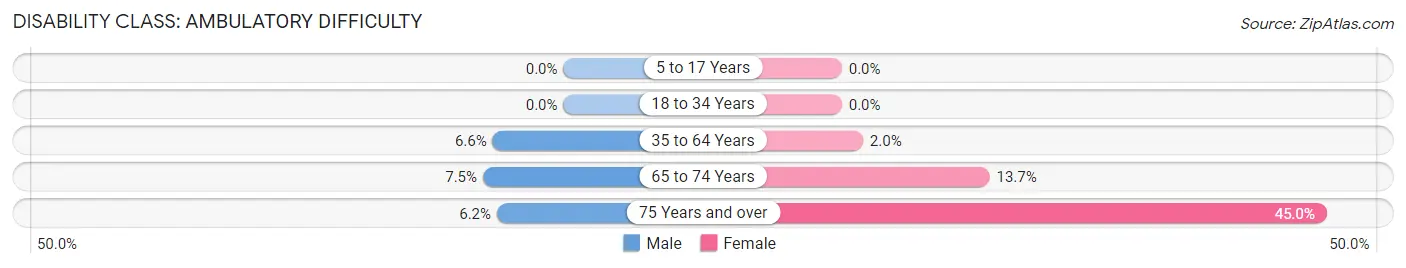
| Age Bracket | Male | Female |
| 5 to 17 Years | 0 (0.0%) | 0 (0.0%) |
| 18 to 34 Years | 0 (0.0%) | 0 (0.0%) |
| 35 to 64 Years | 89 (6.6%) | 34 (2.0%) |
| 65 to 74 Years | 43 (7.5%) | 75 (13.7%) |
| 75 Years and over | 15 (6.2%) | 230 (45.0%) |
Disability Class: Self-Care Difficulty
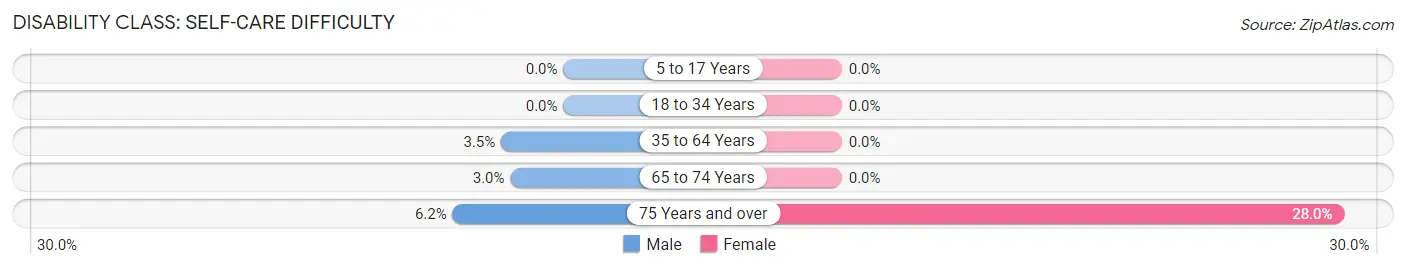
| Age Bracket | Male | Female |
| 5 to 17 Years | 0 (0.0%) | 0 (0.0%) |
| 18 to 34 Years | 0 (0.0%) | 0 (0.0%) |
| 35 to 64 Years | 47 (3.5%) | 0 (0.0%) |
| 65 to 74 Years | 17 (2.9%) | 0 (0.0%) |
| 75 Years and over | 15 (6.2%) | 143 (28.0%) |
Technology Access in Northport
Computing Device Access in Northport
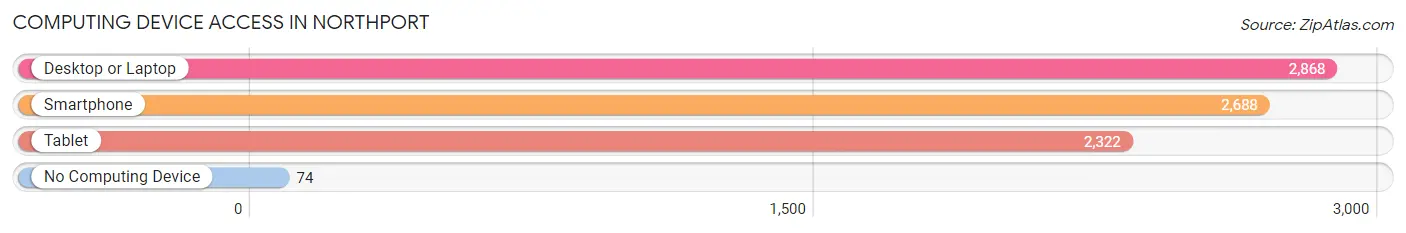
| Device Type | # Households | % Households |
| Desktop or Laptop | 2,868 | 95.6% |
| Smartphone | 2,688 | 89.6% |
| Tablet | 2,322 | 77.4% |
| No Computing Device | 74 | 2.5% |
| Total | 2,999 | 100.0% |
Internet Access in Northport
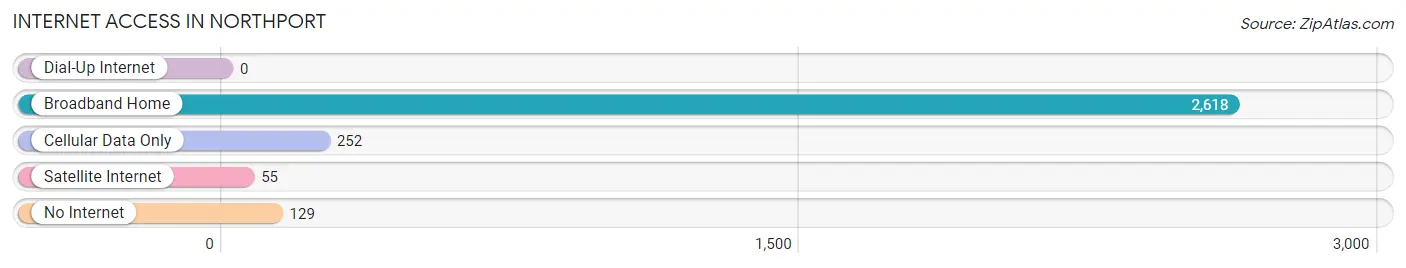
| Internet Type | # Households | % Households |
| Dial-Up Internet | 0 | 0.0% |
| Broadband Home | 2,618 | 87.3% |
| Cellular Data Only | 252 | 8.4% |
| Satellite Internet | 55 | 1.8% |
| No Internet | 129 | 4.3% |
| Total | 2,999 | 100.0% |
Northport Summary
Northport is a village located in Suffolk County, New York, United States. The village is located on the north shore of Long Island, approximately 7 miles east of Huntington, and is part of the Town of Huntington. As of the 2010 census, the village had a population of 7,401.
History
The area that is now Northport was originally inhabited by the Matinecock Native American tribe. The first European settlers arrived in the area in the late 1600s, and the village was officially founded in 1837. The village was originally known as Great Cow Harbour, but was renamed Northport in 1837.
The village was a popular summer destination for wealthy New Yorkers in the late 19th and early 20th centuries. The village was home to several large estates, including the estate of William K. Vanderbilt, which is now the site of the Vanderbilt Museum.
Geography
Northport is located at 40°54'N 73°20'W (40.9000, -73.3333). According to the United States Census Bureau, the village has a total area of 2.2 square miles, all of which is land.
The village is located on the north shore of Long Island, approximately 7 miles east of Huntington. It is bordered by the villages of East Northport to the west and Asharoken to the east.
Economy
Northport's economy is largely based on tourism and retail. The village is home to several restaurants, bars, and shops, as well as a marina and a public beach. The village is also home to several corporate offices, including the headquarters of the Northport-East Northport School District.
Demographics
As of the 2010 census, there were 7,401 people, 2,845 households, and 1,945 families residing in the village. The population density was 3,346.2 people per square mile. The racial makeup of the village was 92.2% White, 2.3% African American, 0.2% Native American, 2.2% Asian, 0.1% Pacific Islander, 1.3% from other races, and 1.7% from two or more races. Hispanic or Latino of any race were 5.3% of the population.
The median income for a household in the village was $87,917, and the median income for a family was $103,917. The per capita income for the village was $41,917. About 3.2% of families and 4.7% of the population were below the poverty line, including 5.3% of those under age 18 and 4.2% of those age 65 or over.
Common Questions
What is Per Capita Income in Northport?
Per Capita income in Northport is $79,808.
What is the Median Family Income in Northport?
Median Family Income in Northport is $166,613.
What is the Median Household income in Northport?
Median Household Income in Northport is $137,487.
What is Income or Wage Gap in Northport?
Income or Wage Gap in Northport is 24.8%.
Women in Northport earn 75.2 cents for every dollar earned by a man.
What is Inequality or Gini Index in Northport?
Inequality or Gini Index in Northport is 0.49.
What is the Total Population of Northport?
Total Population of Northport is 7,337.
What is the Total Male Population of Northport?
Total Male Population of Northport is 3,382.
What is the Total Female Population of Northport?
Total Female Population of Northport is 3,955.
What is the Ratio of Males per 100 Females in Northport?
There are 85.51 Males per 100 Females in Northport.
What is the Ratio of Females per 100 Males in Northport?
There are 116.94 Females per 100 Males in Northport.
What is the Median Population Age in Northport?
Median Population Age in Northport is 51.2 Years.
What is the Average Family Size in Northport
Average Family Size in Northport is 2.9 People.
What is the Average Household Size in Northport
Average Household Size in Northport is 2.4 People.
How Large is the Labor Force in Northport?
There are 4,133 People in the Labor Forcein in Northport.
What is the Percentage of People in the Labor Force in Northport?
66.1% of People are in the Labor Force in Northport.
What is the Unemployment Rate in Northport?
Unemployment Rate in Northport is 0.5%.