Verplanck, NY Map & Demographics
Verplanck Map
Verplanck Overview
$43,331
PER CAPITA INCOME
$93,147
AVG FAMILY INCOME
$70,833
AVG HOUSEHOLD INCOME
8.1%
WAGE / INCOME GAP [ % ]
91.9¢/ $1
WAGE / INCOME GAP [ $ ]
0.40
INEQUALITY / GINI INDEX
796
TOTAL POPULATION
501
MALE POPULATION
295
FEMALE POPULATION
169.83
MALES / 100 FEMALES
58.88
FEMALES / 100 MALES
42.9
MEDIAN AGE
3.1
AVG FAMILY SIZE
2.2
AVG HOUSEHOLD SIZE
481
LABOR FORCE [ PEOPLE ]
67.0%
PERCENT IN LABOR FORCE
13.3%
UNEMPLOYMENT RATE
Verplanck Zip Codes
Verplanck Area Codes
Income in Verplanck
Income Overview in Verplanck
Per Capita Income in Verplanck is $43,331, while median incomes of families and households are $93,147 and $70,833 respectively.
| Characteristic | Number | Measure |
| Per Capita Income | 796 | $43,331 |
| Median Family Income | 167 | $93,147 |
| Mean Family Income | 167 | $123,847 |
| Median Household Income | 364 | $70,833 |
| Mean Household Income | 364 | $90,608 |
| Income Deficit | 167 | $0 |
| Wage / Income Gap (%) | 796 | 8.14% |
| Wage / Income Gap ($) | 796 | 91.86¢ per $1 |
| Gini / Inequality Index | 796 | 0.40 |
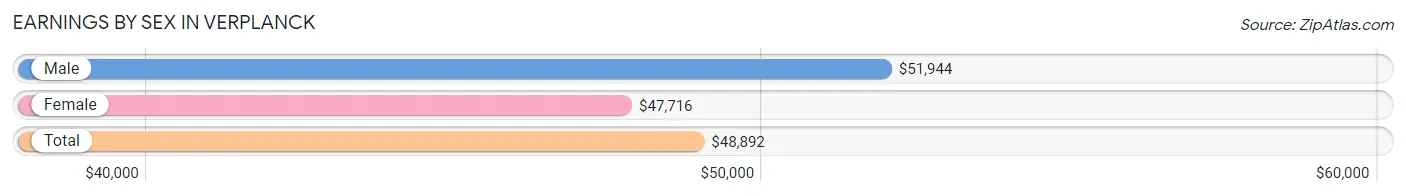
Earnings by Sex in Verplanck
Average Earnings in Verplanck are $48,892, $51,944 for men and $47,716 for women, a difference of 8.1%.
| Sex | Number | Average Earnings |
| Male | 350 (71.9%) | $51,944 |
| Female | 137 (28.1%) | $47,716 |
| Total | 487 (100.0%) | $48,892 |
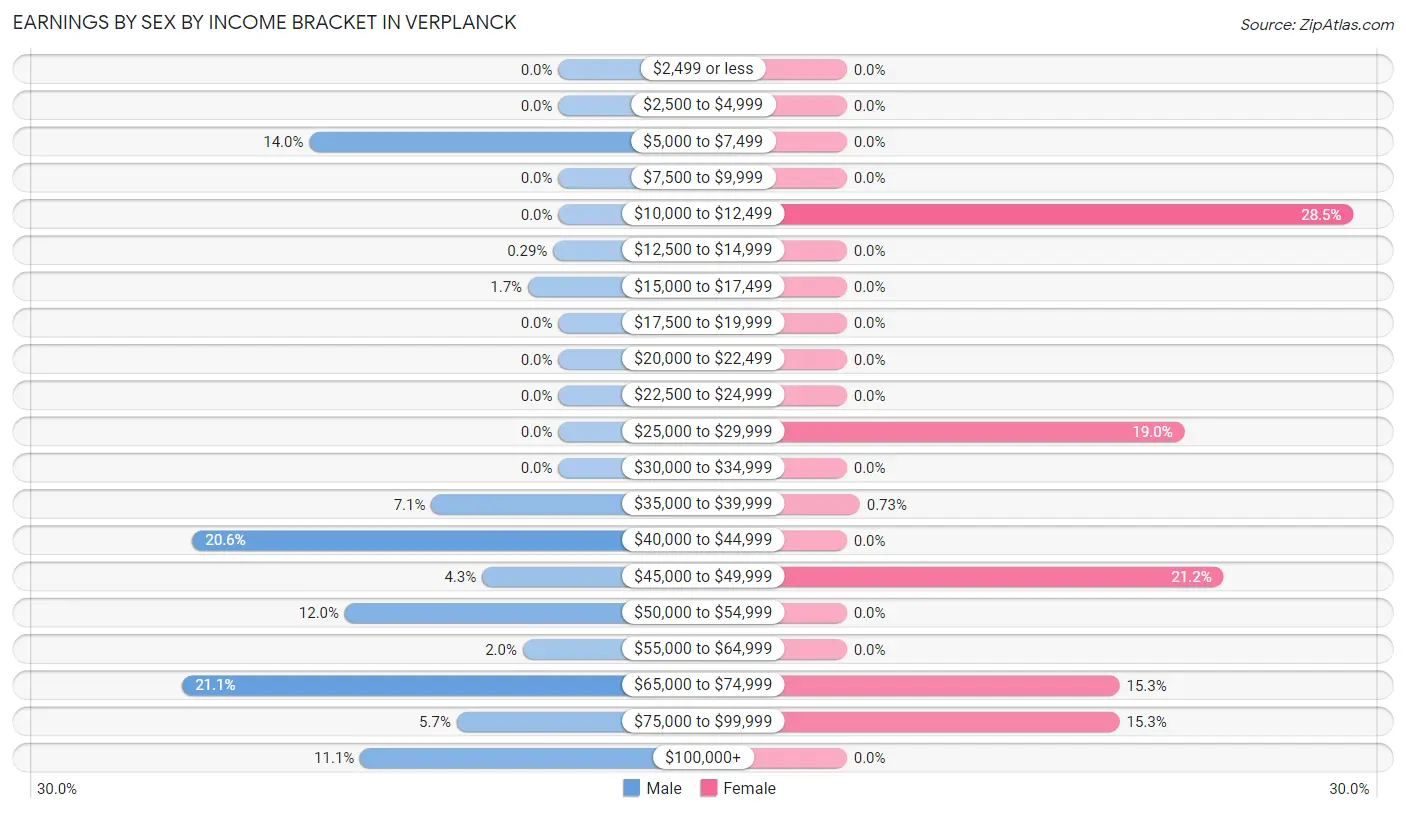
Earnings by Sex by Income Bracket in Verplanck
The most common earnings brackets in Verplanck are $65,000 to $74,999 for men (74 | 21.1%) and $10,000 to $12,499 for women (39 | 28.5%).
| Income | Male | Female |
| $2,499 or less | 0 (0.0%) | 0 (0.0%) |
| $2,500 to $4,999 | 0 (0.0%) | 0 (0.0%) |
| $5,000 to $7,499 | 49 (14.0%) | 0 (0.0%) |
| $7,500 to $9,999 | 0 (0.0%) | 0 (0.0%) |
| $10,000 to $12,499 | 0 (0.0%) | 39 (28.5%) |
| $12,500 to $14,999 | 1 (0.3%) | 0 (0.0%) |
| $15,000 to $17,499 | 6 (1.7%) | 0 (0.0%) |
| $17,500 to $19,999 | 0 (0.0%) | 0 (0.0%) |
| $20,000 to $22,499 | 0 (0.0%) | 0 (0.0%) |
| $22,500 to $24,999 | 0 (0.0%) | 0 (0.0%) |
| $25,000 to $29,999 | 0 (0.0%) | 26 (19.0%) |
| $30,000 to $34,999 | 0 (0.0%) | 0 (0.0%) |
| $35,000 to $39,999 | 25 (7.1%) | 1 (0.7%) |
| $40,000 to $44,999 | 72 (20.6%) | 0 (0.0%) |
| $45,000 to $49,999 | 15 (4.3%) | 29 (21.2%) |
| $50,000 to $54,999 | 42 (12.0%) | 0 (0.0%) |
| $55,000 to $64,999 | 7 (2.0%) | 0 (0.0%) |
| $65,000 to $74,999 | 74 (21.1%) | 21 (15.3%) |
| $75,000 to $99,999 | 20 (5.7%) | 21 (15.3%) |
| $100,000+ | 39 (11.1%) | 0 (0.0%) |
| Total | 350 (100.0%) | 137 (100.0%) |
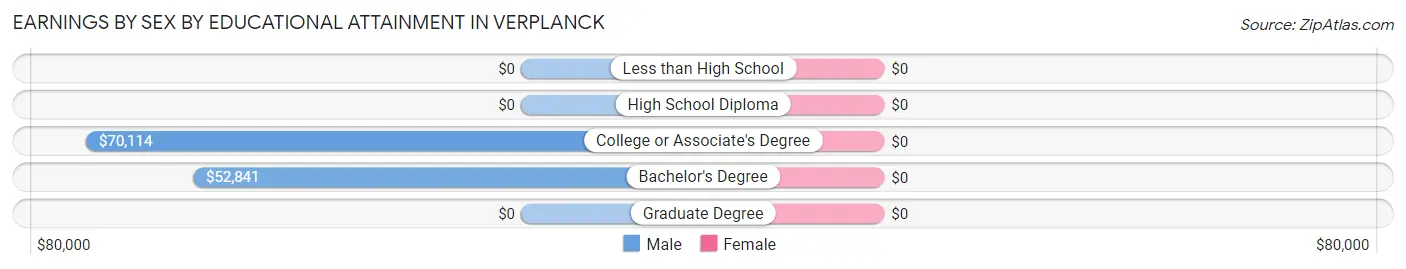
Earnings by Sex by Educational Attainment in Verplanck
| Educational Attainment | Male Income | Female Income |
| Less than High School | - | - |
| High School Diploma | - | - |
| College or Associate's Degree | $70,114 | $0 |
| Bachelor's Degree | $52,841 | $0 |
| Graduate Degree | - | - |
| Total | $54,205 | $47,716 |
Family Income in Verplanck
Family Income Brackets in Verplanck
According to the Verplanck family income data, there are 44 families falling into the $35,000 to $49,999 income range, which is the most common income bracket and makes up 26.4% of all families.
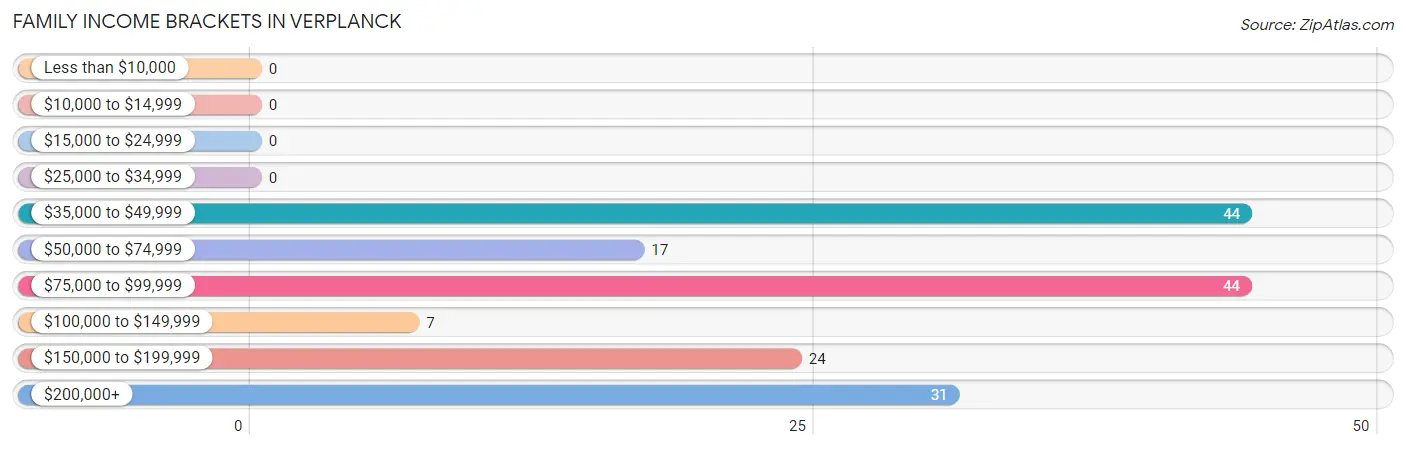
| Income Bracket | # Families | % Families |
| Less than $10,000 | 0 | 0.0% |
| $10,000 to $14,999 | 0 | 0.0% |
| $15,000 to $24,999 | 0 | 0.0% |
| $25,000 to $34,999 | 0 | 0.0% |
| $35,000 to $49,999 | 44 | 26.3% |
| $50,000 to $74,999 | 17 | 10.2% |
| $75,000 to $99,999 | 44 | 26.3% |
| $100,000 to $149,999 | 7 | 4.2% |
| $150,000 to $199,999 | 24 | 14.4% |
| $200,000+ | 31 | 18.6% |
Family Income by Famaliy Size in Verplanck
3-person families (33 | 19.8%) account for the highest median family income in Verplanck with $172,841 per family, while 3-person families (33 | 19.8%) have the highest median income of $57,614 per family member.
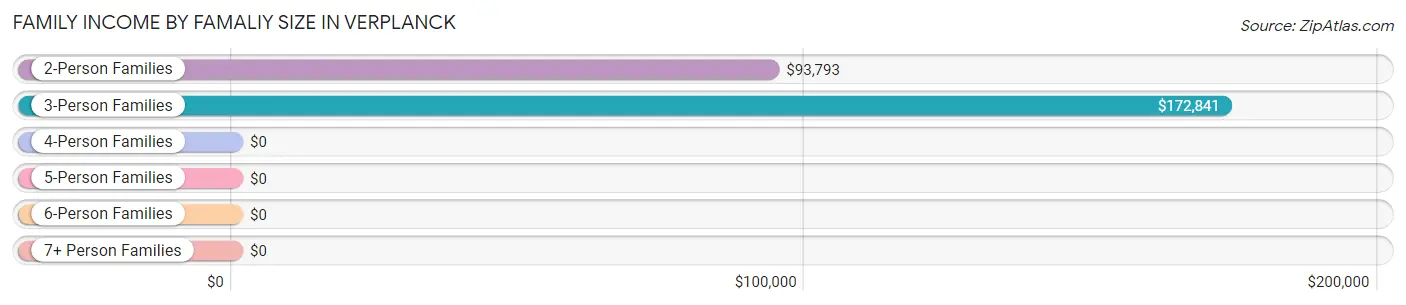
| Income Bracket | # Families | Median Income |
| 2-Person Families | 96 (57.5%) | $93,793 |
| 3-Person Families | 33 (19.8%) | $172,841 |
| 4-Person Families | 28 (16.8%) | $0 |
| 5-Person Families | 10 (6.0%) | $0 |
| 6-Person Families | 0 (0.0%) | $0 |
| 7+ Person Families | 0 (0.0%) | $0 |
| Total | 167 (100.0%) | $93,147 |
Family Income by Number of Earners in Verplanck
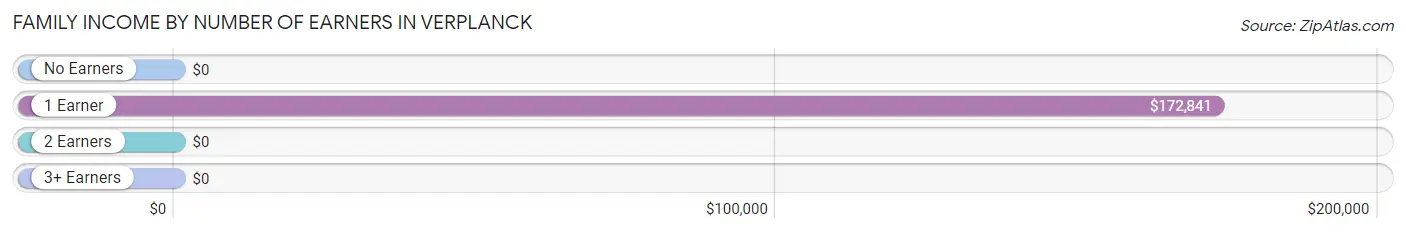
| Number of Earners | # Families | Median Income |
| No Earners | 27 (16.2%) | $0 |
| 1 Earner | 33 (19.8%) | $172,841 |
| 2 Earners | 97 (58.1%) | $0 |
| 3+ Earners | 10 (6.0%) | $0 |
| Total | 167 (100.0%) | $93,147 |
Household Income in Verplanck
Household Income Brackets in Verplanck
With 106 households falling in the category, the $50,000 to $74,999 income range is the most frequent in Verplanck, accounting for 29.1% of all households.
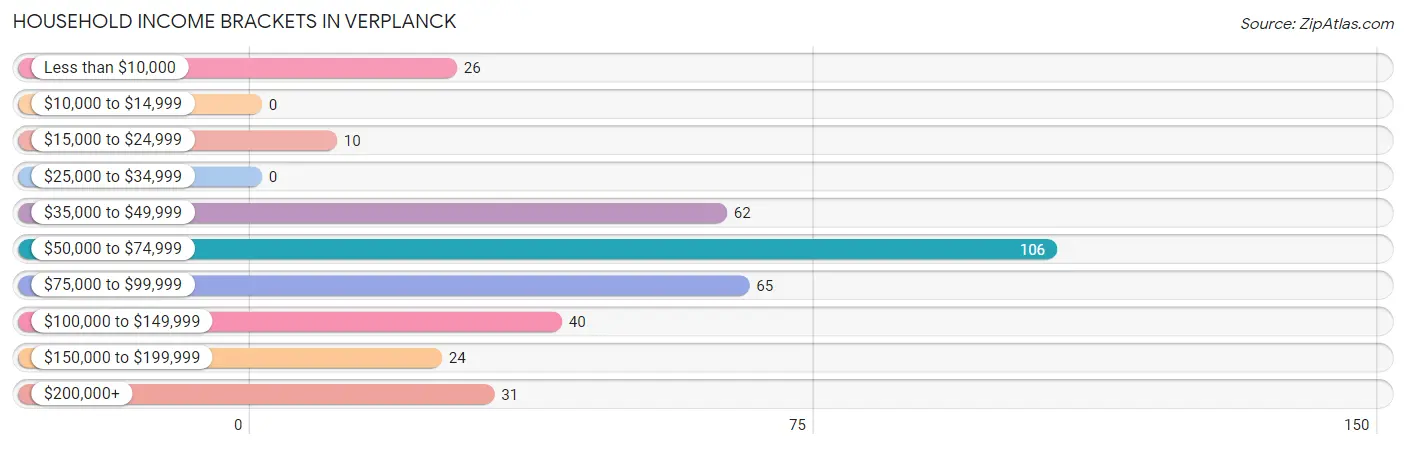
| Income Bracket | # Households | % Households |
| Less than $10,000 | 26 | 7.1% |
| $10,000 to $14,999 | 0 | 0.0% |
| $15,000 to $24,999 | 10 | 2.7% |
| $25,000 to $34,999 | 0 | 0.0% |
| $35,000 to $49,999 | 62 | 17.0% |
| $50,000 to $74,999 | 106 | 29.1% |
| $75,000 to $99,999 | 65 | 17.9% |
| $100,000 to $149,999 | 40 | 11.0% |
| $150,000 to $199,999 | 24 | 6.6% |
| $200,000+ | 31 | 8.5% |
Household Income by Householder Age in Verplanck
The median household income in Verplanck is $70,833, with the highest median household income of $92,845 found in the 25 to 44 years age bracket for the primary householder. A total of 130 households (35.7%) fall into this category.
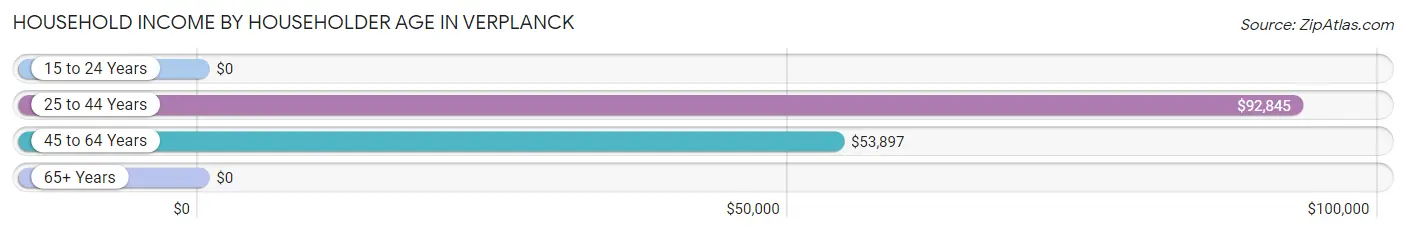
| Income Bracket | # Households | Median Income |
| 15 to 24 Years | 0 (0.0%) | $0 |
| 25 to 44 Years | 130 (35.7%) | $92,845 |
| 45 to 64 Years | 114 (31.3%) | $53,897 |
| 65+ Years | 120 (33.0%) | $0 |
| Total | 364 (100.0%) | $70,833 |
Poverty in Verplanck
Income Below Poverty by Sex and Age in Verplanck
With 5.2% poverty level for males and 8.8% for females among the residents of Verplanck, 65 to 74 year old males and 45 to 54 year old females are the most vulnerable to poverty, with 26 males (23.0%) and 24 females (53.3%) in their respective age groups living below the poverty level.
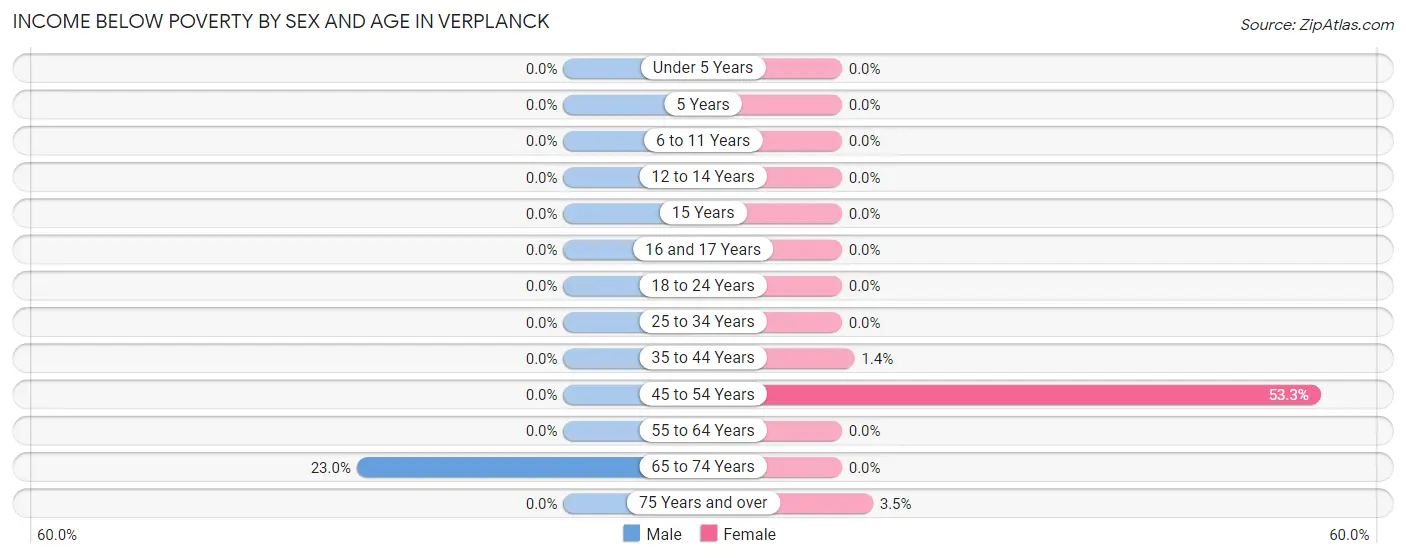
| Age Bracket | Male | Female |
| Under 5 Years | 0 (0.0%) | 0 (0.0%) |
| 5 Years | 0 (0.0%) | 0 (0.0%) |
| 6 to 11 Years | 0 (0.0%) | 0 (0.0%) |
| 12 to 14 Years | 0 (0.0%) | 0 (0.0%) |
| 15 Years | 0 (0.0%) | 0 (0.0%) |
| 16 and 17 Years | 0 (0.0%) | 0 (0.0%) |
| 18 to 24 Years | 0 (0.0%) | 0 (0.0%) |
| 25 to 34 Years | 0 (0.0%) | 0 (0.0%) |
| 35 to 44 Years | 0 (0.0%) | 1 (1.4%) |
| 45 to 54 Years | 0 (0.0%) | 24 (53.3%) |
| 55 to 64 Years | 0 (0.0%) | 0 (0.0%) |
| 65 to 74 Years | 26 (23.0%) | 0 (0.0%) |
| 75 Years and over | 0 (0.0%) | 1 (3.5%) |
| Total | 26 (5.2%) | 26 (8.8%) |
Income Above Poverty by Sex and Age in Verplanck
According to the poverty statistics in Verplanck, males aged under 5 years and females aged 6 to 11 years are the age groups that are most secure financially, with 100.0% of males and 100.0% of females in these age groups living above the poverty line.
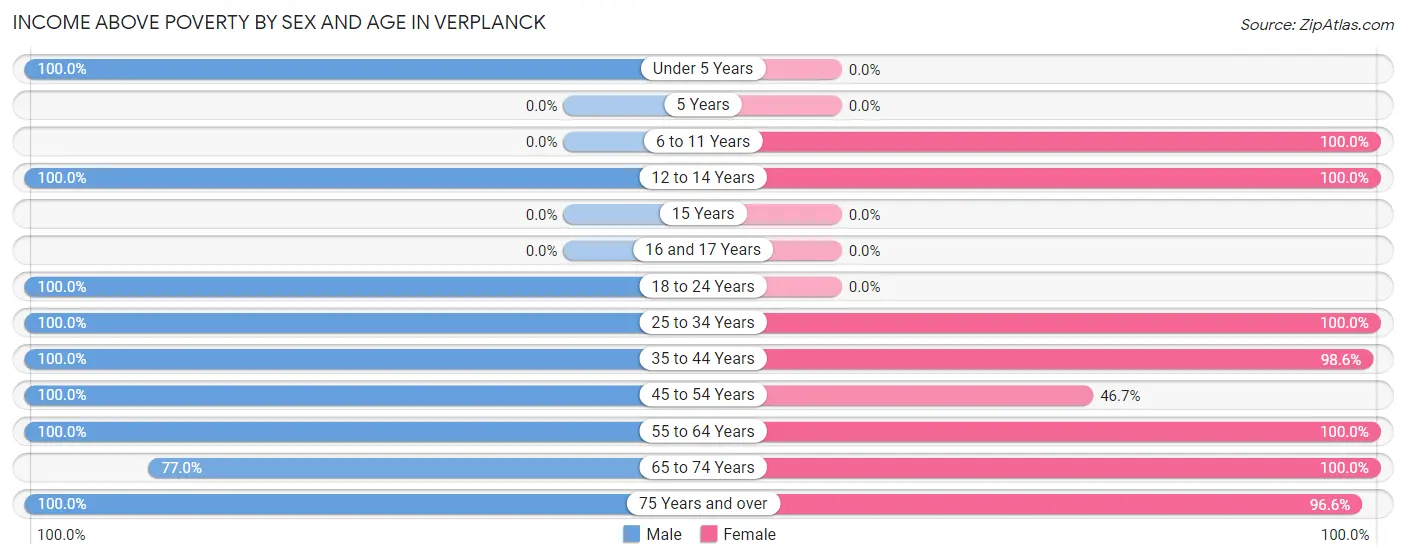
| Age Bracket | Male | Female |
| Under 5 Years | 14 (100.0%) | 0 (0.0%) |
| 5 Years | 0 (0.0%) | 0 (0.0%) |
| 6 to 11 Years | 0 (0.0%) | 34 (100.0%) |
| 12 to 14 Years | 20 (100.0%) | 10 (100.0%) |
| 15 Years | 0 (0.0%) | 0 (0.0%) |
| 16 and 17 Years | 0 (0.0%) | 0 (0.0%) |
| 18 to 24 Years | 79 (100.0%) | 0 (0.0%) |
| 25 to 34 Years | 79 (100.0%) | 22 (100.0%) |
| 35 to 44 Years | 77 (100.0%) | 70 (98.6%) |
| 45 to 54 Years | 69 (100.0%) | 21 (46.7%) |
| 55 to 64 Years | 49 (100.0%) | 51 (100.0%) |
| 65 to 74 Years | 87 (77.0%) | 33 (100.0%) |
| 75 Years and over | 1 (100.0%) | 28 (96.6%) |
| Total | 475 (94.8%) | 269 (91.2%) |
Income Below Poverty Among Married-Couple Families in Verplanck
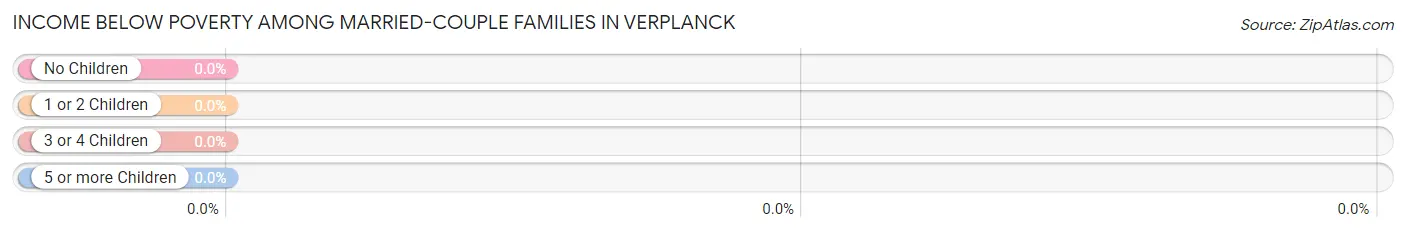
| Children | Above Poverty | Below Poverty |
| No Children | 99 (100.0%) | 0 (0.0%) |
| 1 or 2 Children | 43 (100.0%) | 0 (0.0%) |
| 3 or 4 Children | 0 (0.0%) | 0 (0.0%) |
| 5 or more Children | 0 (0.0%) | 0 (0.0%) |
| Total | 142 (100.0%) | 0 (0.0%) |
Income Below Poverty Among Single-Parent Households in Verplanck
| Children | Single Father | Single Mother |
| No Children | 0 (0.0%) | 0 (0.0%) |
| 1 or 2 Children | 0 (0.0%) | 0 (0.0%) |
| 3 or 4 Children | 0 (0.0%) | 0 (0.0%) |
| 5 or more Children | 0 (0.0%) | 0 (0.0%) |
| Total | 0 (0.0%) | 0 (0.0%) |
Income Below Poverty Among Married-Couple vs Single-Parent Households in Verplanck
| Children | Married-Couple Families | Single-Parent Households |
| No Children | 0 (0.0%) | 0 (0.0%) |
| 1 or 2 Children | 0 (0.0%) | 0 (0.0%) |
| 3 or 4 Children | 0 (0.0%) | 0 (0.0%) |
| 5 or more Children | 0 (0.0%) | 0 (0.0%) |
| Total | 0 (0.0%) | 0 (0.0%) |
Race in Verplanck
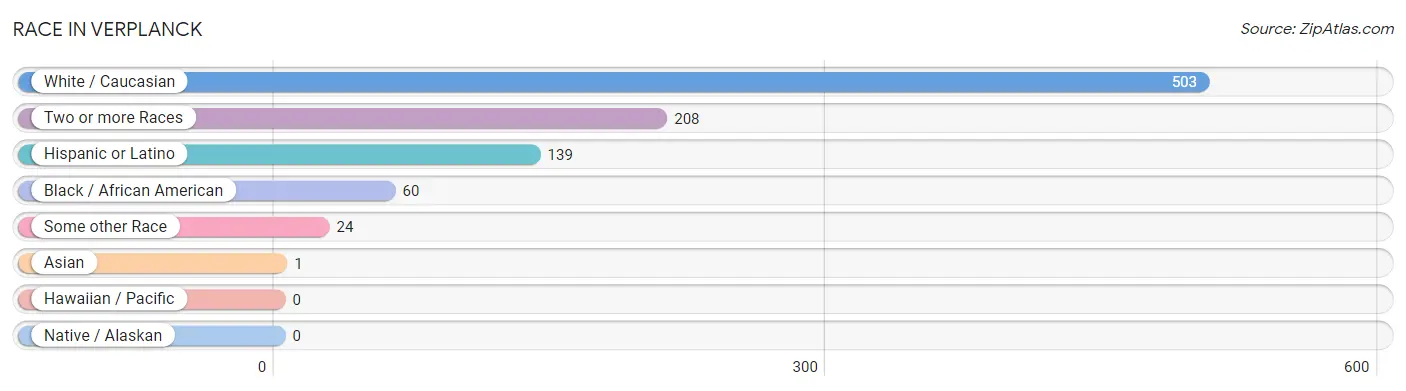
The most populous races in Verplanck are White / Caucasian (503 | 63.2%), Two or more Races (208 | 26.1%), and Hispanic or Latino (139 | 17.5%).
| Race | # Population | % Population |
| Asian | 1 | 0.1% |
| Black / African American | 60 | 7.5% |
| Hawaiian / Pacific | 0 | 0.0% |
| Hispanic or Latino | 139 | 17.5% |
| Native / Alaskan | 0 | 0.0% |
| White / Caucasian | 503 | 63.2% |
| Two or more Races | 208 | 26.1% |
| Some other Race | 24 | 3.0% |
| Total | 796 | 100.0% |
Ancestry in Verplanck
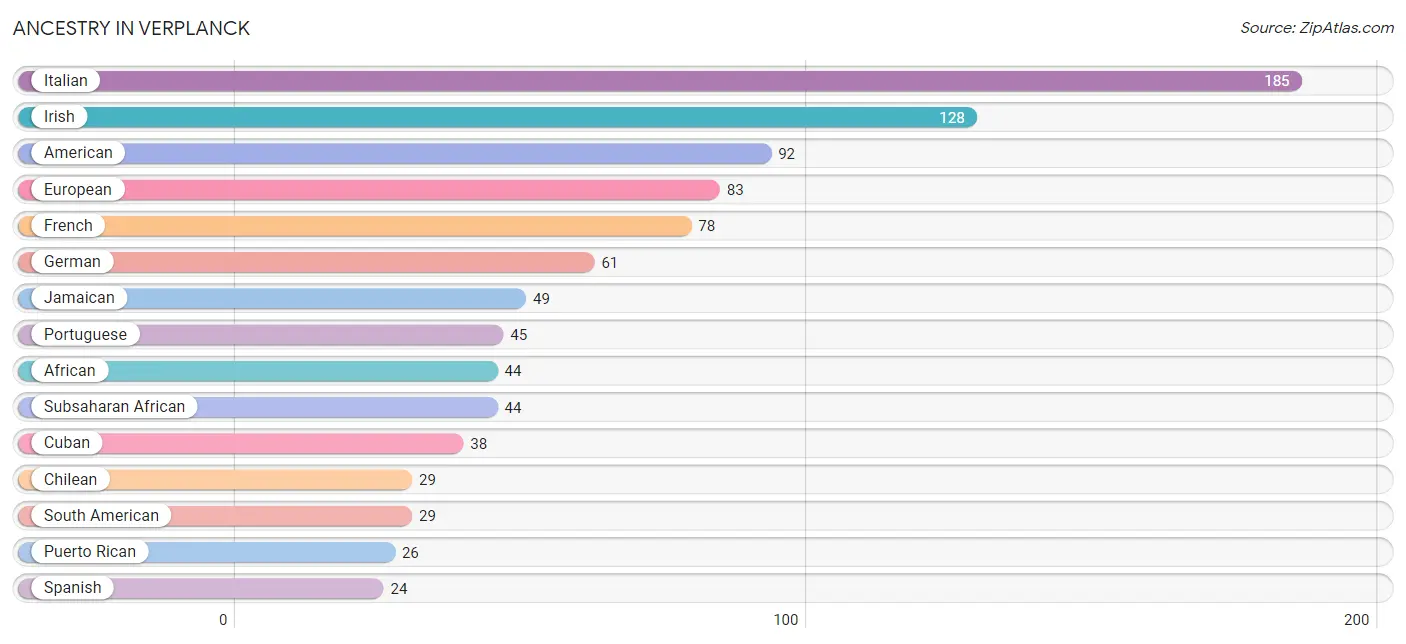
The most populous ancestries reported in Verplanck are Italian (185 | 23.2%), Irish (128 | 16.1%), American (92 | 11.6%), European (83 | 10.4%), and French (78 | 9.8%), together accounting for 71.1% of all Verplanck residents.
| Ancestry | # Population | % Population |
| African | 44 | 5.5% |
| American | 92 | 11.6% |
| Arab | 1 | 0.1% |
| British | 1 | 0.1% |
| Chilean | 29 | 3.6% |
| Cuban | 38 | 4.8% |
| Czech | 14 | 1.8% |
| Dominican | 21 | 2.6% |
| Dutch | 8 | 1.0% |
| English | 7 | 0.9% |
| European | 83 | 10.4% |
| French | 78 | 9.8% |
| German | 61 | 7.7% |
| Haitian | 1 | 0.1% |
| Indian (Asian) | 1 | 0.1% |
| Irish | 128 | 16.1% |
| Italian | 185 | 23.2% |
| Jamaican | 49 | 6.2% |
| Lebanese | 1 | 0.1% |
| Mexican | 1 | 0.1% |
| Polish | 10 | 1.3% |
| Portuguese | 45 | 5.7% |
| Puerto Rican | 26 | 3.3% |
| South American | 29 | 3.6% |
| Spanish | 24 | 3.0% |
| Subsaharan African | 44 | 5.5% | View All 26 Rows |
Immigrants in Verplanck
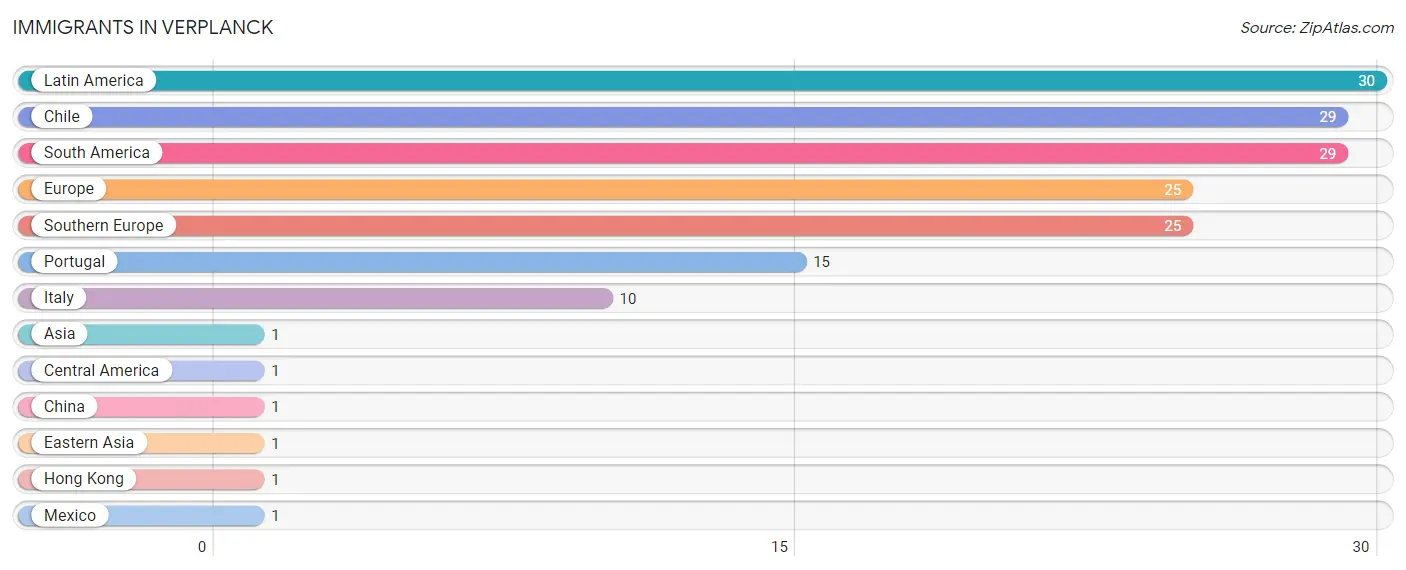
The most numerous immigrant groups reported in Verplanck came from Latin America (30 | 3.8%), Chile (29 | 3.6%), South America (29 | 3.6%), Europe (25 | 3.1%), and Southern Europe (25 | 3.1%), together accounting for 17.3% of all Verplanck residents.
| Immigration Origin | # Population | % Population |
| Asia | 1 | 0.1% |
| Central America | 1 | 0.1% |
| Chile | 29 | 3.6% |
| China | 1 | 0.1% |
| Eastern Asia | 1 | 0.1% |
| Europe | 25 | 3.1% |
| Hong Kong | 1 | 0.1% |
| Italy | 10 | 1.3% |
| Latin America | 30 | 3.8% |
| Mexico | 1 | 0.1% |
| Portugal | 15 | 1.9% |
| South America | 29 | 3.6% |
| Southern Europe | 25 | 3.1% | View All 13 Rows |
Sex and Age in Verplanck
Sex and Age in Verplanck
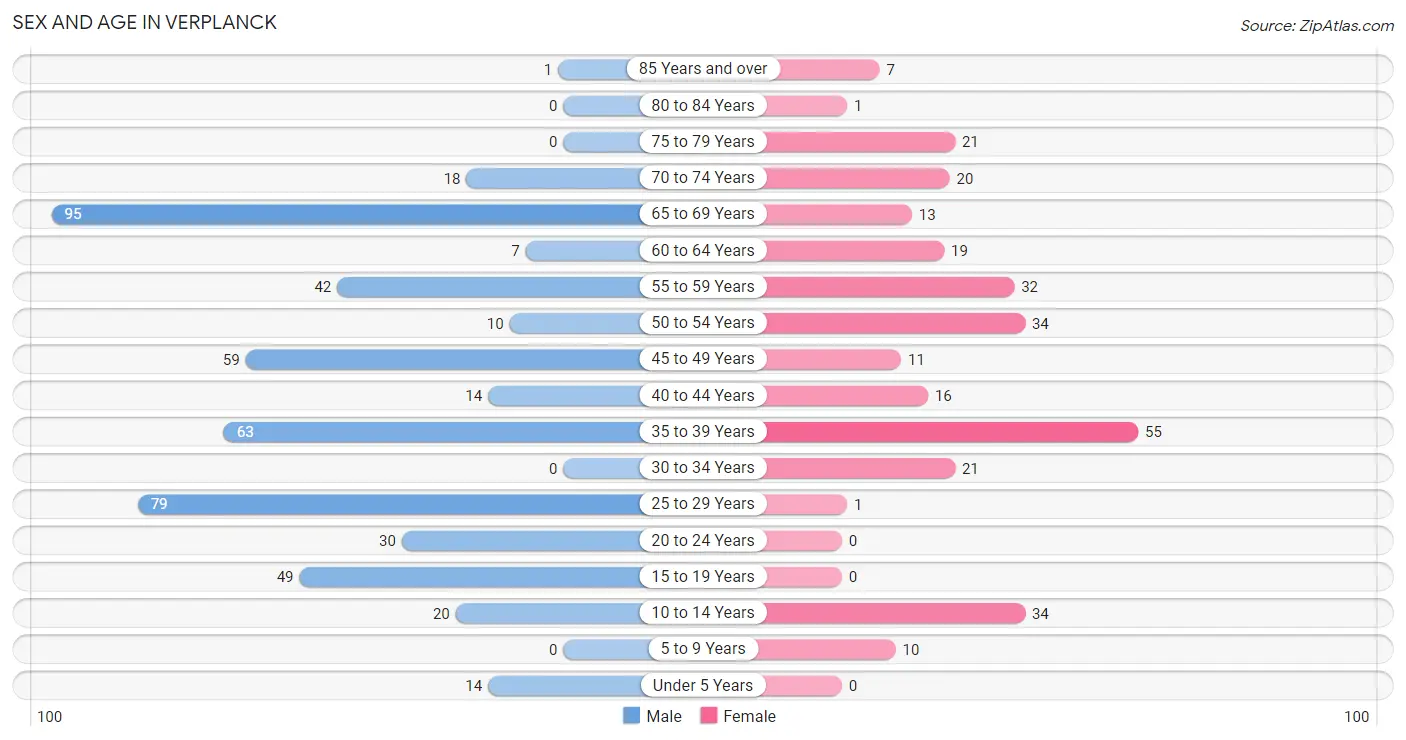
The most populous age groups in Verplanck are 65 to 69 Years (95 | 19.0%) for men and 35 to 39 Years (55 | 18.6%) for women.
| Age Bracket | Male | Female |
| Under 5 Years | 14 (2.8%) | 0 (0.0%) |
| 5 to 9 Years | 0 (0.0%) | 10 (3.4%) |
| 10 to 14 Years | 20 (4.0%) | 34 (11.5%) |
| 15 to 19 Years | 49 (9.8%) | 0 (0.0%) |
| 20 to 24 Years | 30 (6.0%) | 0 (0.0%) |
| 25 to 29 Years | 79 (15.8%) | 1 (0.3%) |
| 30 to 34 Years | 0 (0.0%) | 21 (7.1%) |
| 35 to 39 Years | 63 (12.6%) | 55 (18.6%) |
| 40 to 44 Years | 14 (2.8%) | 16 (5.4%) |
| 45 to 49 Years | 59 (11.8%) | 11 (3.7%) |
| 50 to 54 Years | 10 (2.0%) | 34 (11.5%) |
| 55 to 59 Years | 42 (8.4%) | 32 (10.8%) |
| 60 to 64 Years | 7 (1.4%) | 19 (6.4%) |
| 65 to 69 Years | 95 (19.0%) | 13 (4.4%) |
| 70 to 74 Years | 18 (3.6%) | 20 (6.8%) |
| 75 to 79 Years | 0 (0.0%) | 21 (7.1%) |
| 80 to 84 Years | 0 (0.0%) | 1 (0.3%) |
| 85 Years and over | 1 (0.2%) | 7 (2.4%) |
| Total | 501 (100.0%) | 295 (100.0%) |
Families and Households in Verplanck
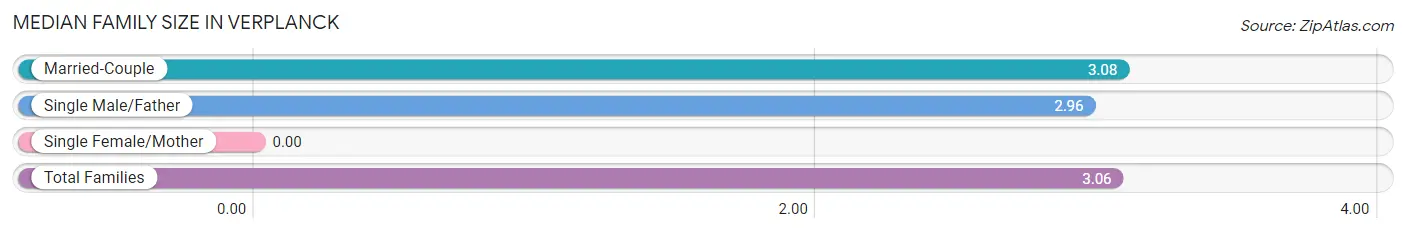
Median Family Size in Verplanck
| Family Type | # Families | Family Size |
| Married-Couple | 142 (85.0%) | 3.08 |
| Single Male/Father | 25 (15.0%) | 2.96 |
| Single Female/Mother | 0 (0.0%) | - |
| Total Families | 167 (100.0%) | 3.06 |
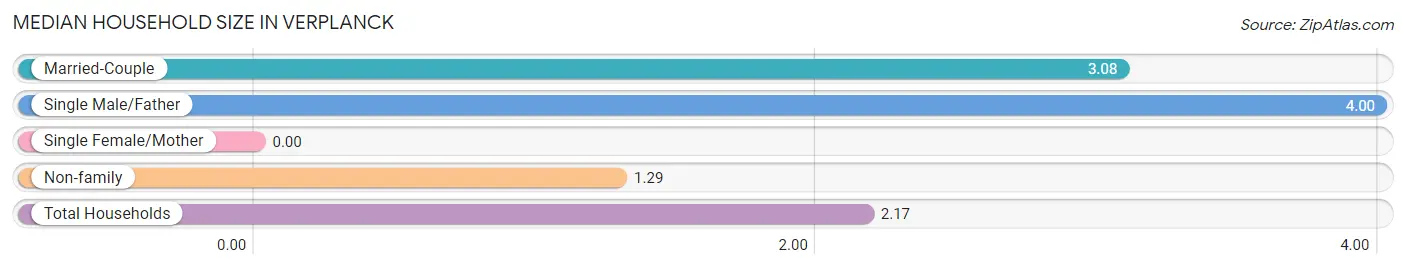
Median Household Size in Verplanck
| Household Type | # Households | Household Size |
| Married-Couple | 142 (39.0%) | 3.08 |
| Single Male/Father | 25 (6.9%) | 4.00 |
| Single Female/Mother | 0 (0.0%) | - |
| Non-family | 197 (54.1%) | 1.29 |
| Total Households | 364 (100.0%) | 2.17 |
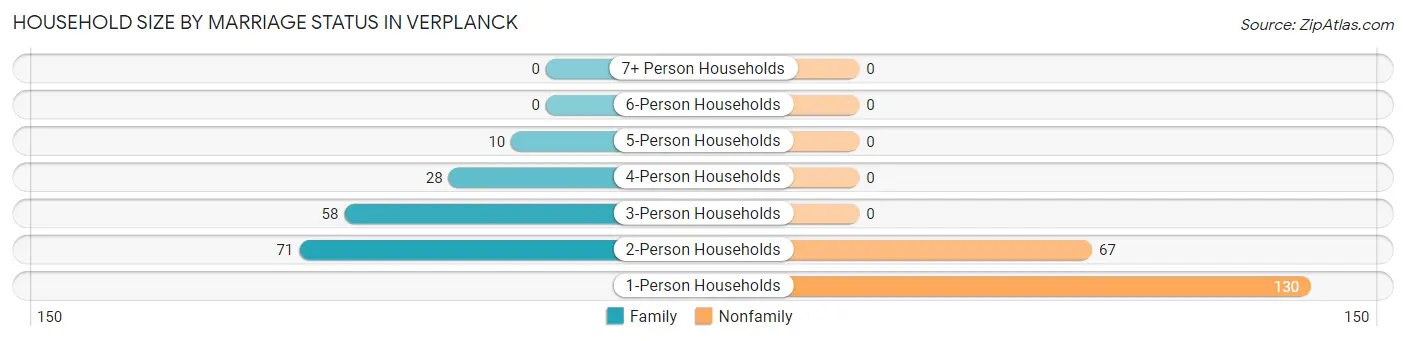
Household Size by Marriage Status in Verplanck
Out of a total of 364 households in Verplanck, 167 (45.9%) are family households, while 197 (54.1%) are nonfamily households. The most numerous type of family households are 2-person households, comprising 71, and the most common type of nonfamily households are 1-person households, comprising 130.
| Household Size | Family Households | Nonfamily Households |
| 1-Person Households | - | 130 (35.7%) |
| 2-Person Households | 71 (19.5%) | 67 (18.4%) |
| 3-Person Households | 58 (15.9%) | 0 (0.0%) |
| 4-Person Households | 28 (7.7%) | 0 (0.0%) |
| 5-Person Households | 10 (2.8%) | 0 (0.0%) |
| 6-Person Households | 0 (0.0%) | 0 (0.0%) |
| 7+ Person Households | 0 (0.0%) | 0 (0.0%) |
| Total | 167 (45.9%) | 197 (54.1%) |
Female Fertility in Verplanck
Fertility by Age in Verplanck
| Age Bracket | Women with Births | Births / 1,000 Women |
| 15 to 19 years | 0 (0.0%) | 0.0 |
| 20 to 34 years | 0 (0.0%) | 0.0 |
| 35 to 50 years | 0 (0.0%) | 0.0 |
| Total | 0 (0.0%) | 0.0 |
Fertility by Age by Marriage Status in Verplanck
| Age Bracket | Married | Unmarried |
| 15 to 19 years | 0 (0.0%) | 0 (0.0%) |
| 20 to 34 years | 0 (0.0%) | 0 (0.0%) |
| 35 to 50 years | 0 (0.0%) | 0 (0.0%) |
| Total | 0 (0.0%) | 0 (0.0%) |
Fertility by Education in Verplanck
| Educational Attainment | Women with Births | Births / 1,000 Women |
| Less than High School | 0 (0.0%) | 0.0 |
| High School Diploma | 0 (0.0%) | 0.0 |
| College or Associate's Degree | 0 (0.0%) | 0.0 |
| Bachelor's Degree | 0 (0.0%) | 0.0 |
| Graduate Degree | 0 (0.0%) | 0.0 |
| Total | 0 (0.0%) | 0.0 |
Fertility by Education by Marriage Status in Verplanck
| Educational Attainment | Married | Unmarried |
| Less than High School | 0 (0.0%) | 0 (0.0%) |
| High School Diploma | 0 (0.0%) | 0 (0.0%) |
| College or Associate's Degree | 0 (0.0%) | 0 (0.0%) |
| Bachelor's Degree | 0 (0.0%) | 0 (0.0%) |
| Graduate Degree | 0 (0.0%) | 0 (0.0%) |
| Total | 0 (0.0%) | 0 (0.0%) |
Employment Characteristics in Verplanck
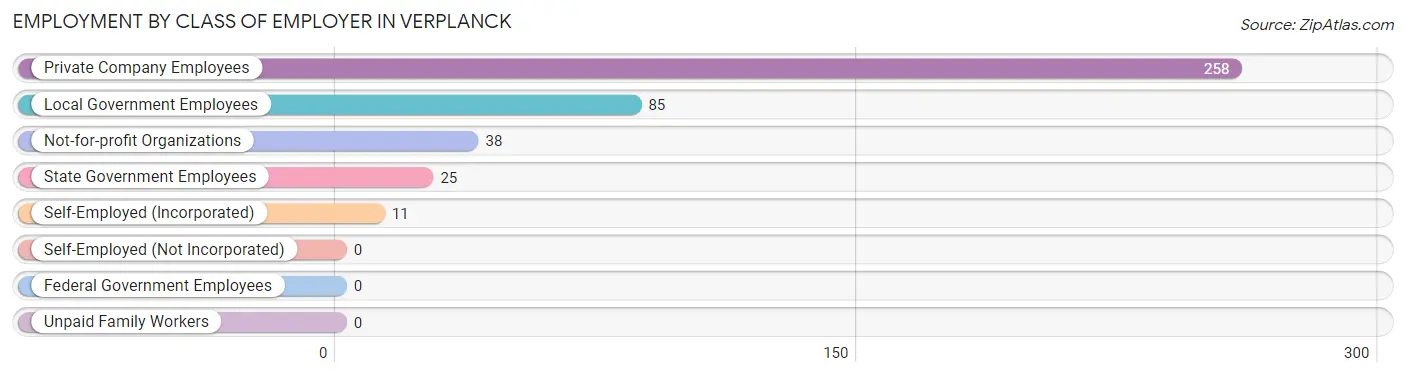
Employment by Class of Employer in Verplanck
Among the 417 employed individuals in Verplanck, private company employees (258 | 61.9%), local government employees (85 | 20.4%), and not-for-profit organizations (38 | 9.1%) make up the most common classes of employment.
| Employer Class | # Employees | % Employees |
| Private Company Employees | 258 | 61.9% |
| Self-Employed (Incorporated) | 11 | 2.6% |
| Self-Employed (Not Incorporated) | 0 | 0.0% |
| Not-for-profit Organizations | 38 | 9.1% |
| Local Government Employees | 85 | 20.4% |
| State Government Employees | 25 | 6.0% |
| Federal Government Employees | 0 | 0.0% |
| Unpaid Family Workers | 0 | 0.0% |
| Total | 417 | 100.0% |
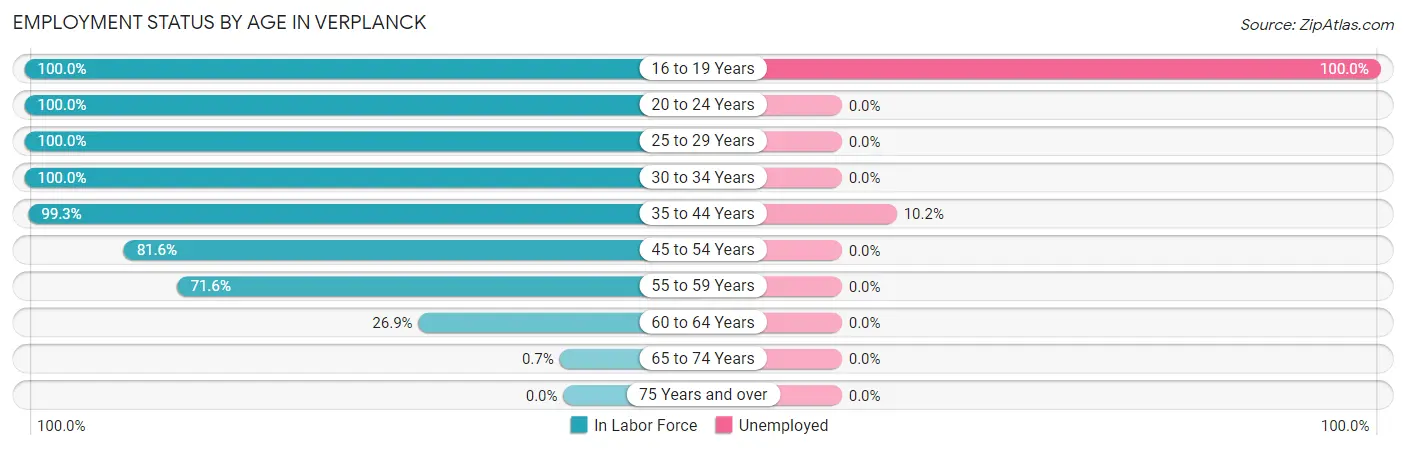
Employment Status by Age in Verplanck
According to the labor force statistics for Verplanck, out of the total population over 16 years of age (718), 67.0% or 481 individuals are in the labor force, with 13.3% or 64 of them unemployed. The age group with the highest labor force participation rate is 16 to 19 years, with 100.0% or 49 individuals in the labor force. Within the labor force, the 16 to 19 years age range has the highest percentage of unemployed individuals, with 100.0% or 49 of them being unemployed.
| Age Bracket | In Labor Force | Unemployed |
| 16 to 19 Years | 49 (100.0%) | 49 (100.0%) |
| 20 to 24 Years | 30 (100.0%) | 0 (0.0%) |
| 25 to 29 Years | 80 (100.0%) | 0 (0.0%) |
| 30 to 34 Years | 21 (100.0%) | 0 (0.0%) |
| 35 to 44 Years | 147 (99.3%) | 15 (10.2%) |
| 45 to 54 Years | 93 (81.6%) | 0 (0.0%) |
| 55 to 59 Years | 53 (71.6%) | 0 (0.0%) |
| 60 to 64 Years | 7 (26.9%) | 0 (0.0%) |
| 65 to 74 Years | 1 (0.7%) | 0 (0.0%) |
| 75 Years and over | 0 (0.0%) | 0 (0.0%) |
| Total | 481 (67.0%) | 64 (13.3%) |
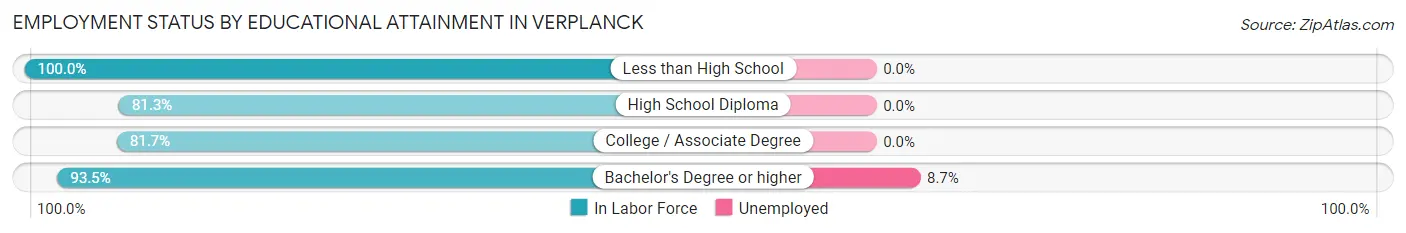
Employment Status by Educational Attainment in Verplanck
According to labor force statistics for Verplanck, 86.6% of individuals (401) out of the total population between 25 and 64 years of age (463) are in the labor force, with 3.7% or 15 of them being unemployed. The group with the highest labor force participation rate are those with the educational attainment of less than high school, with 100.0% or 10 individuals in the labor force. Within the labor force, individuals with bachelor's degree or higher education have the highest percentage of unemployment, with 8.7% or 15 of them being unemployed.
| Educational Attainment | In Labor Force | Unemployed |
| Less than High School | 10 (100.0%) | 0 (0.0%) |
| High School Diploma | 130 (81.3%) | 0 (0.0%) |
| College / Associate Degree | 89 (81.7%) | 0 (0.0%) |
| Bachelor's Degree or higher | 172 (93.5%) | 16 (8.7%) |
| Total | 401 (86.6%) | 17 (3.7%) |
Employment Occupations by Sex in Verplanck
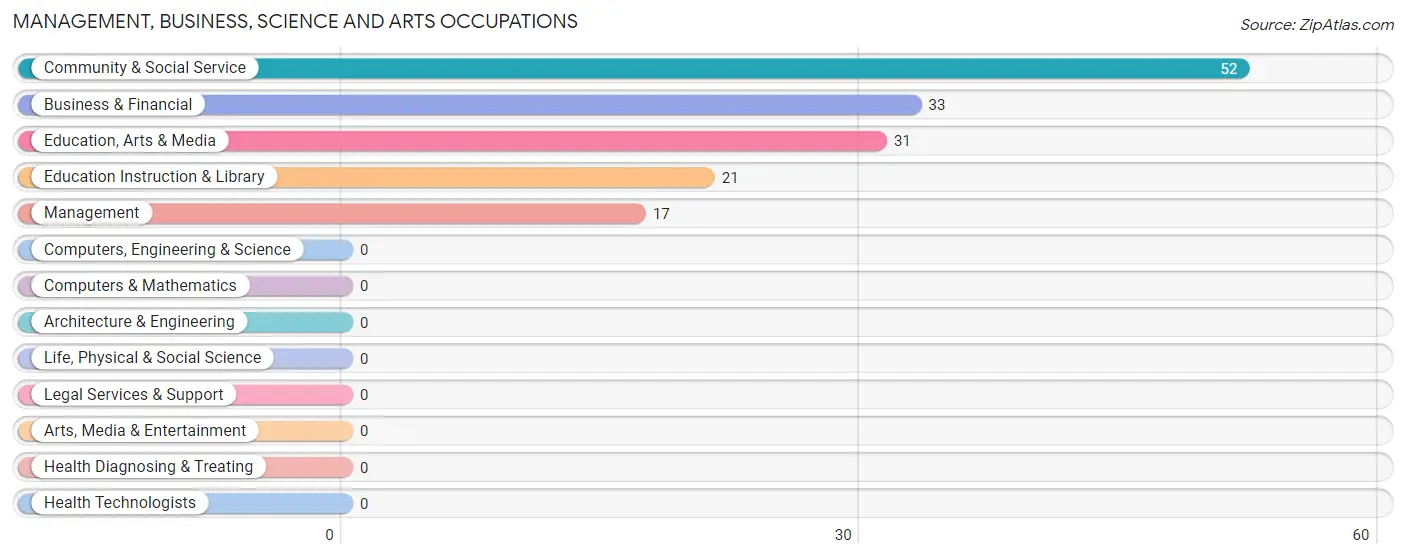
Management, Business, Science and Arts Occupations
The most common Management, Business, Science and Arts occupations in Verplanck are Community & Social Service (52 | 12.5%), Business & Financial (33 | 7.9%), Education, Arts & Media (31 | 7.4%), Education Instruction & Library (21 | 5.0%), and Management (17 | 4.1%).
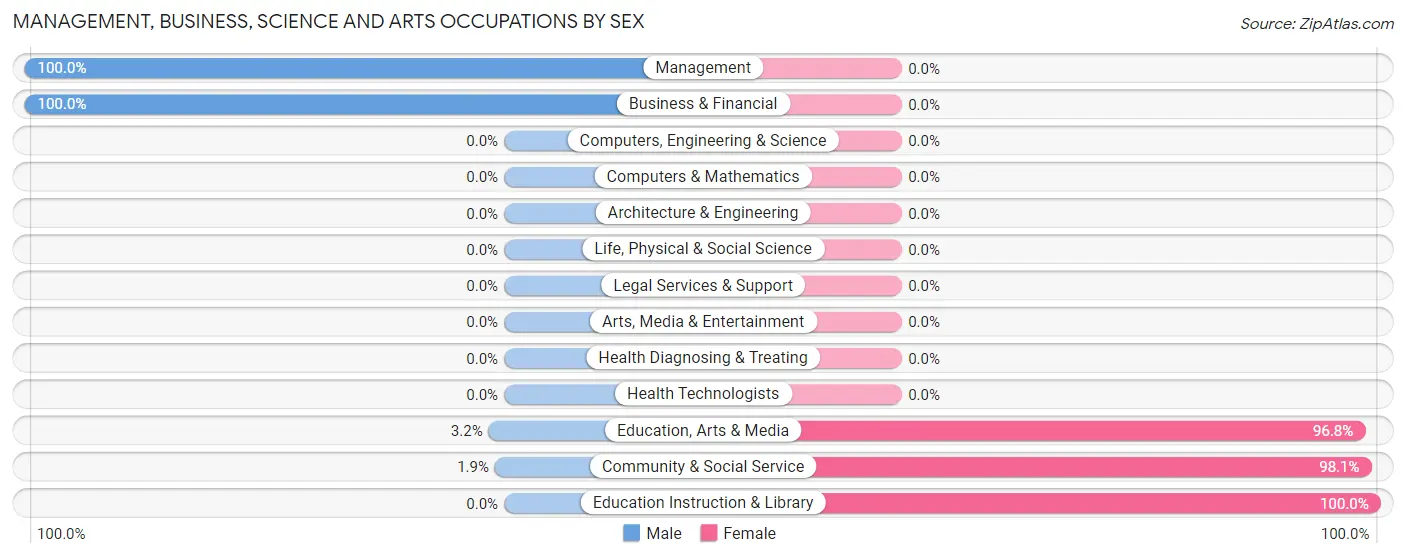
Management, Business, Science and Arts Occupations by Sex
Within the Management, Business, Science and Arts occupations in Verplanck, the most male-oriented occupations are Management (100.0%), Business & Financial (100.0%), and Education, Arts & Media (3.2%), while the most female-oriented occupations are Education Instruction & Library (100.0%), Community & Social Service (98.1%), and Education, Arts & Media (96.8%).
| Occupation | Male | Female |
| Management | 17 (100.0%) | 0 (0.0%) |
| Business & Financial | 33 (100.0%) | 0 (0.0%) |
| Computers, Engineering & Science | 0 (0.0%) | 0 (0.0%) |
| Computers & Mathematics | 0 (0.0%) | 0 (0.0%) |
| Architecture & Engineering | 0 (0.0%) | 0 (0.0%) |
| Life, Physical & Social Science | 0 (0.0%) | 0 (0.0%) |
| Community & Social Service | 1 (1.9%) | 51 (98.1%) |
| Education, Arts & Media | 1 (3.2%) | 30 (96.8%) |
| Legal Services & Support | 0 (0.0%) | 0 (0.0%) |
| Education Instruction & Library | 0 (0.0%) | 21 (100.0%) |
| Arts, Media & Entertainment | 0 (0.0%) | 0 (0.0%) |
| Health Diagnosing & Treating | 0 (0.0%) | 0 (0.0%) |
| Health Technologists | 0 (0.0%) | 0 (0.0%) |
| Total (Category) | 51 (50.0%) | 51 (50.0%) |
| Total (Overall) | 295 (70.7%) | 122 (29.3%) |
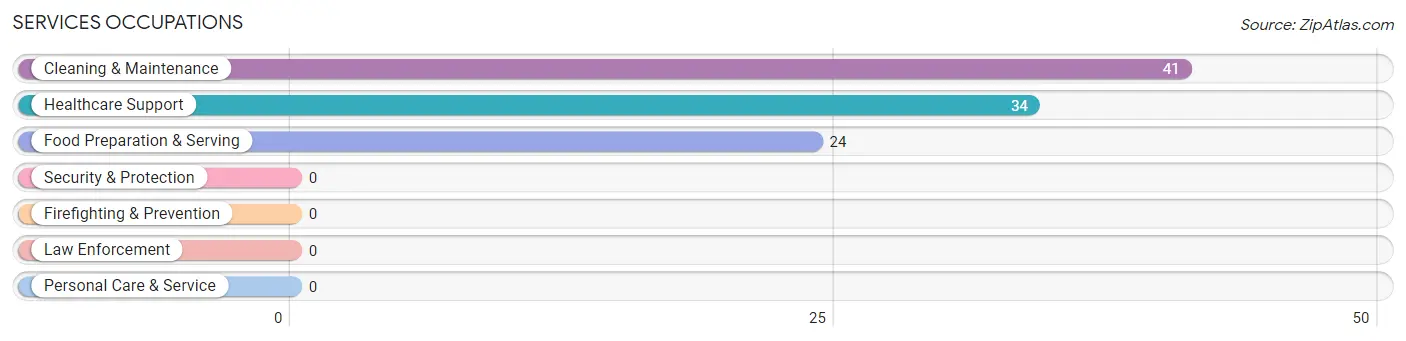
Services Occupations
The most common Services occupations in Verplanck are Cleaning & Maintenance (41 | 9.8%), Healthcare Support (34 | 8.2%), and Food Preparation & Serving (24 | 5.8%).
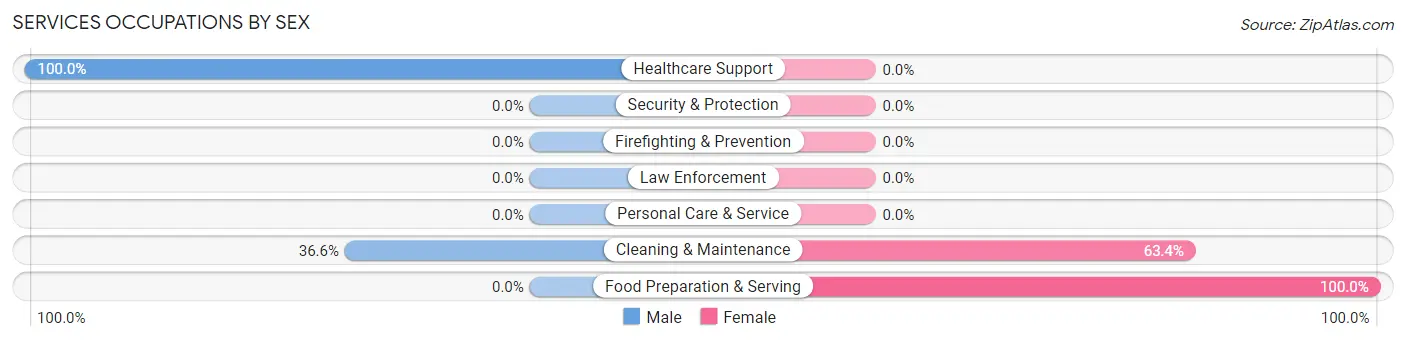
Services Occupations by Sex
Within the Services occupations in Verplanck, the most male-oriented occupations are Healthcare Support (100.0%), and Cleaning & Maintenance (36.6%), while the most female-oriented occupations are Food Preparation & Serving (100.0%), and Cleaning & Maintenance (63.4%).
| Occupation | Male | Female |
| Healthcare Support | 34 (100.0%) | 0 (0.0%) |
| Security & Protection | 0 (0.0%) | 0 (0.0%) |
| Firefighting & Prevention | 0 (0.0%) | 0 (0.0%) |
| Law Enforcement | 0 (0.0%) | 0 (0.0%) |
| Food Preparation & Serving | 0 (0.0%) | 24 (100.0%) |
| Cleaning & Maintenance | 15 (36.6%) | 26 (63.4%) |
| Personal Care & Service | 0 (0.0%) | 0 (0.0%) |
| Total (Category) | 49 (49.5%) | 50 (50.5%) |
| Total (Overall) | 295 (70.7%) | 122 (29.3%) |
Sales and Office Occupations
The most common Sales and Office occupations in Verplanck are Sales & Related (79 | 18.9%), and Office & Administration (21 | 5.0%).
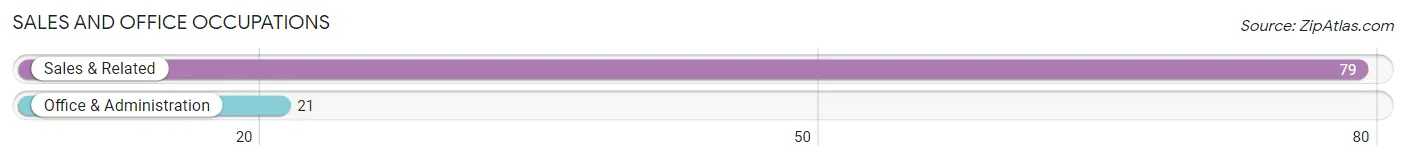
Sales and Office Occupations by Sex

| Occupation | Male | Female |
| Sales & Related | 79 (100.0%) | 0 (0.0%) |
| Office & Administration | 0 (0.0%) | 21 (100.0%) |
| Total (Category) | 79 (79.0%) | 21 (21.0%) |
| Total (Overall) | 295 (70.7%) | 122 (29.3%) |
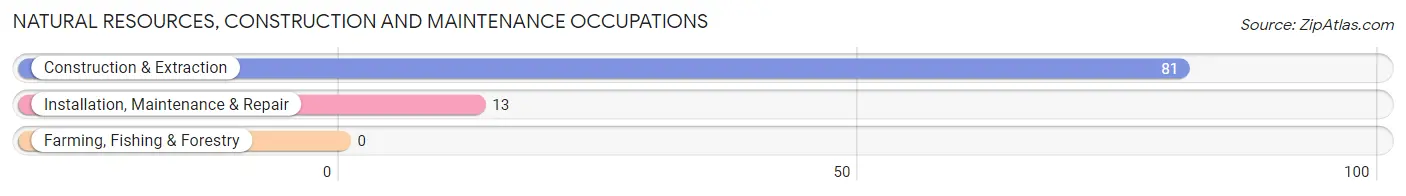
Natural Resources, Construction and Maintenance Occupations
The most common Natural Resources, Construction and Maintenance occupations in Verplanck are Construction & Extraction (81 | 19.4%), and Installation, Maintenance & Repair (13 | 3.1%).
Natural Resources, Construction and Maintenance Occupations by Sex
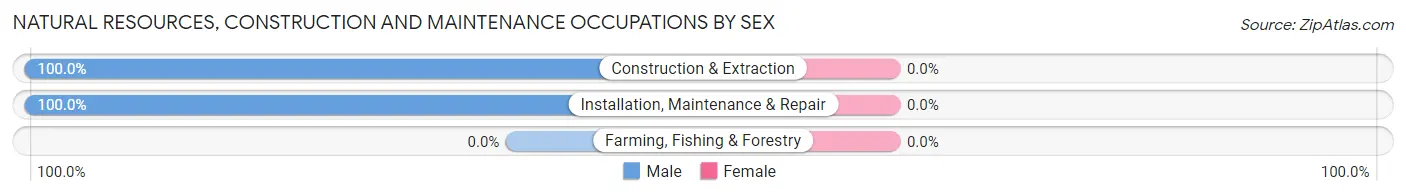
| Occupation | Male | Female |
| Farming, Fishing & Forestry | 0 (0.0%) | 0 (0.0%) |
| Construction & Extraction | 81 (100.0%) | 0 (0.0%) |
| Installation, Maintenance & Repair | 13 (100.0%) | 0 (0.0%) |
| Total (Category) | 94 (100.0%) | 0 (0.0%) |
| Total (Overall) | 295 (70.7%) | 122 (29.3%) |
Production, Transportation and Moving Occupations
The most common Production, Transportation and Moving occupations in Verplanck are Production (15 | 3.6%), and Transportation (7 | 1.7%).
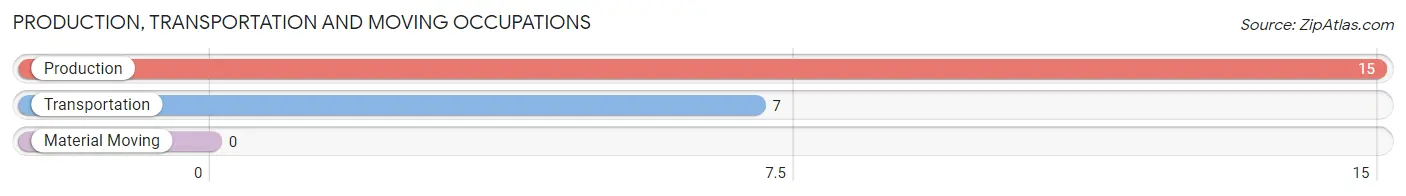
Production, Transportation and Moving Occupations by Sex
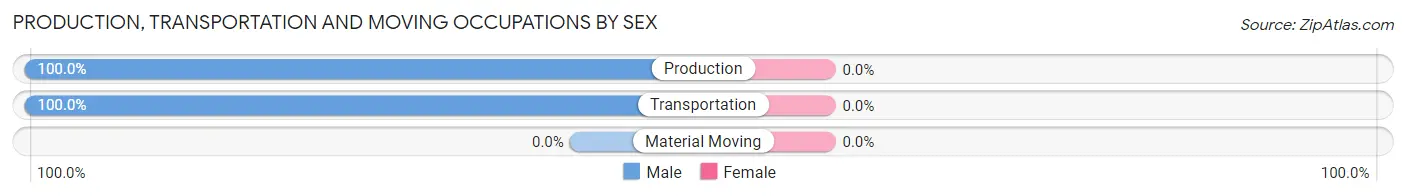
| Occupation | Male | Female |
| Production | 15 (100.0%) | 0 (0.0%) |
| Transportation | 7 (100.0%) | 0 (0.0%) |
| Material Moving | 0 (0.0%) | 0 (0.0%) |
| Total (Category) | 22 (100.0%) | 0 (0.0%) |
| Total (Overall) | 295 (70.7%) | 122 (29.3%) |
Employment Industries by Sex in Verplanck
Employment Industries in Verplanck
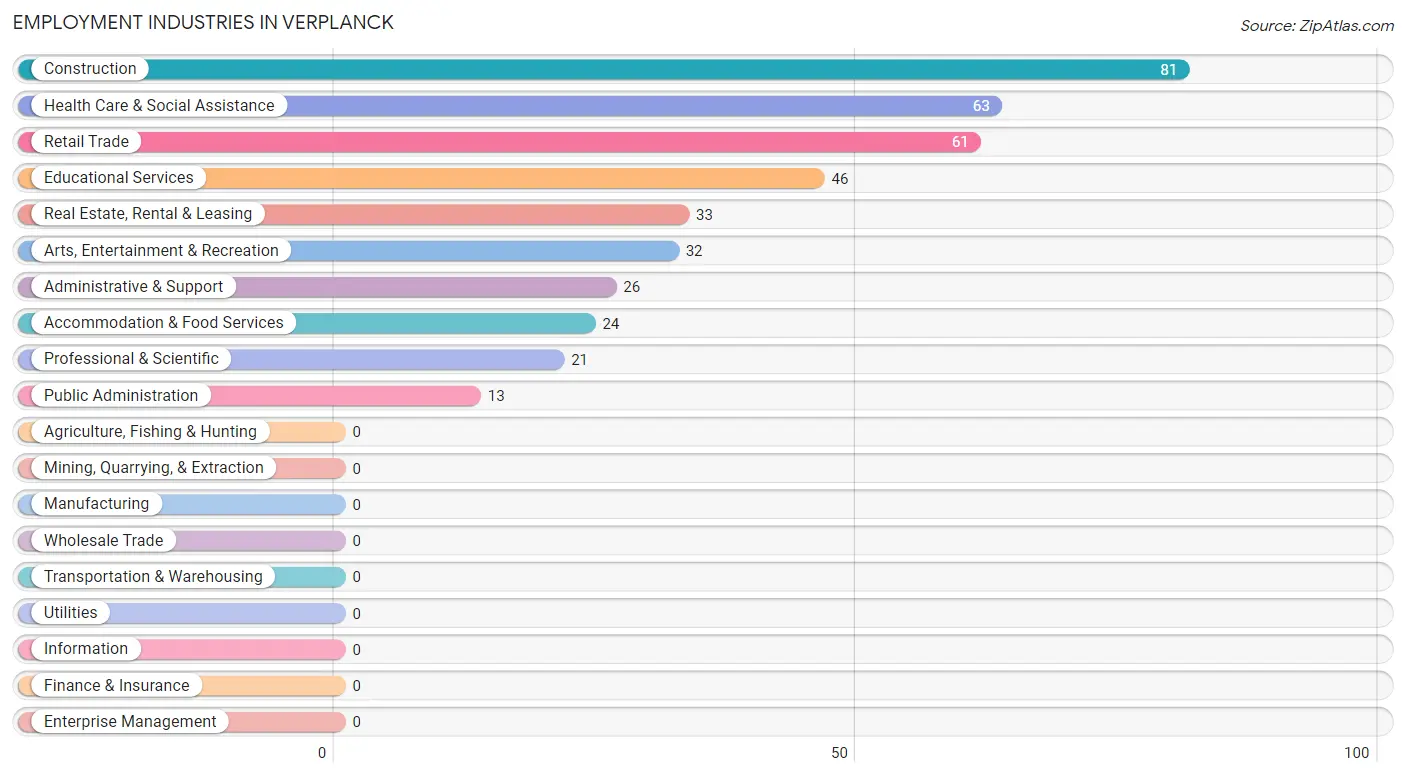
The major employment industries in Verplanck include Construction (81 | 19.4%), Health Care & Social Assistance (63 | 15.1%), Retail Trade (61 | 14.6%), Educational Services (46 | 11.0%), and Real Estate, Rental & Leasing (33 | 7.9%).
Employment Industries by Sex in Verplanck
The Verplanck industries that see more men than women are Construction (100.0%), Retail Trade (100.0%), and Real Estate, Rental & Leasing (100.0%), whereas the industries that tend to have a higher number of women are Professional & Scientific (100.0%), Administrative & Support (100.0%), and Accommodation & Food Services (100.0%).
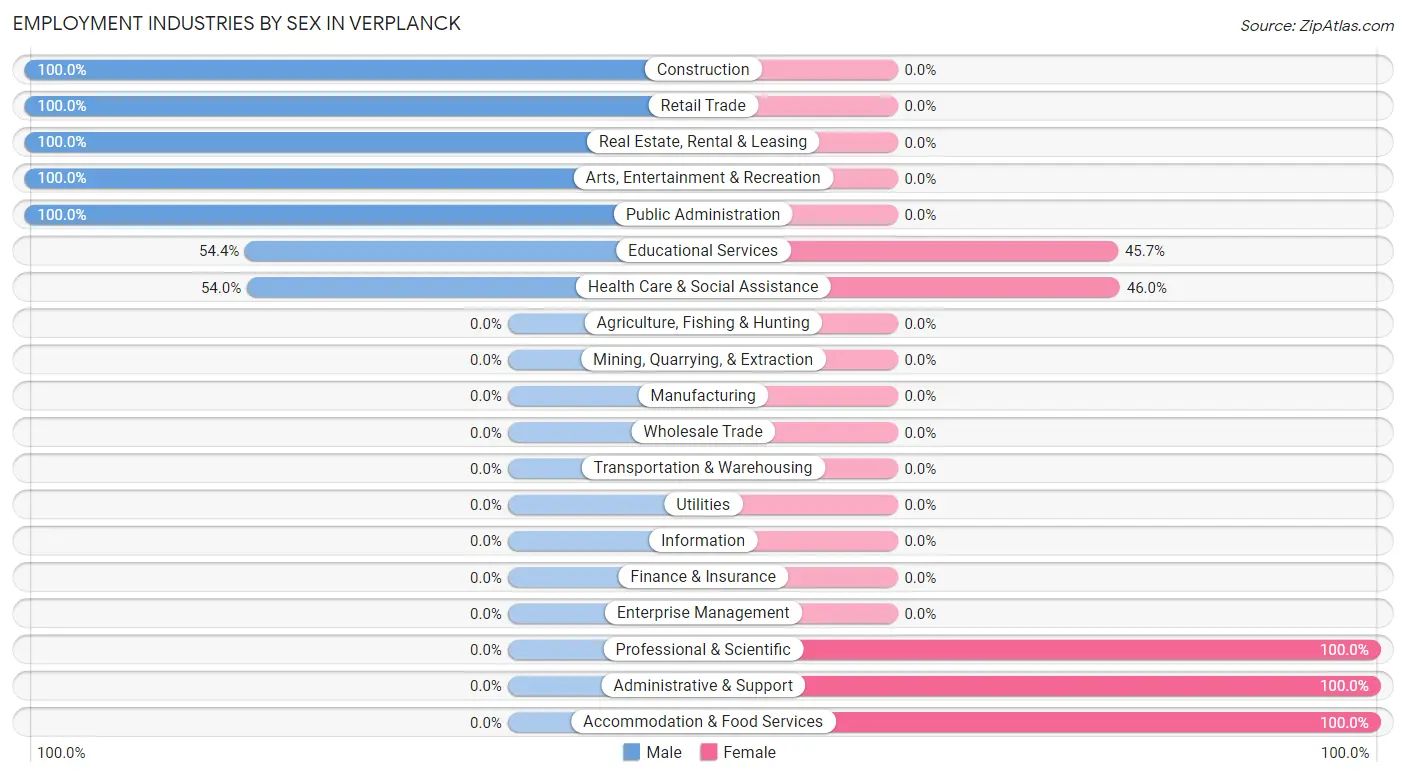
| Industry | Male | Female |
| Agriculture, Fishing & Hunting | 0 (0.0%) | 0 (0.0%) |
| Mining, Quarrying, & Extraction | 0 (0.0%) | 0 (0.0%) |
| Construction | 81 (100.0%) | 0 (0.0%) |
| Manufacturing | 0 (0.0%) | 0 (0.0%) |
| Wholesale Trade | 0 (0.0%) | 0 (0.0%) |
| Retail Trade | 61 (100.0%) | 0 (0.0%) |
| Transportation & Warehousing | 0 (0.0%) | 0 (0.0%) |
| Utilities | 0 (0.0%) | 0 (0.0%) |
| Information | 0 (0.0%) | 0 (0.0%) |
| Finance & Insurance | 0 (0.0%) | 0 (0.0%) |
| Real Estate, Rental & Leasing | 33 (100.0%) | 0 (0.0%) |
| Professional & Scientific | 0 (0.0%) | 21 (100.0%) |
| Enterprise Management | 0 (0.0%) | 0 (0.0%) |
| Administrative & Support | 0 (0.0%) | 26 (100.0%) |
| Educational Services | 25 (54.3%) | 21 (45.7%) |
| Health Care & Social Assistance | 34 (54.0%) | 29 (46.0%) |
| Arts, Entertainment & Recreation | 32 (100.0%) | 0 (0.0%) |
| Accommodation & Food Services | 0 (0.0%) | 24 (100.0%) |
| Public Administration | 13 (100.0%) | 0 (0.0%) |
| Total | 295 (70.7%) | 122 (29.3%) |
Education in Verplanck
School Enrollment in Verplanck
The most common levels of schooling among the 85 students in Verplanck are middle school (54 | 63.5%), graduate / professional (21 | 24.7%), and elementary school (10 | 11.8%).
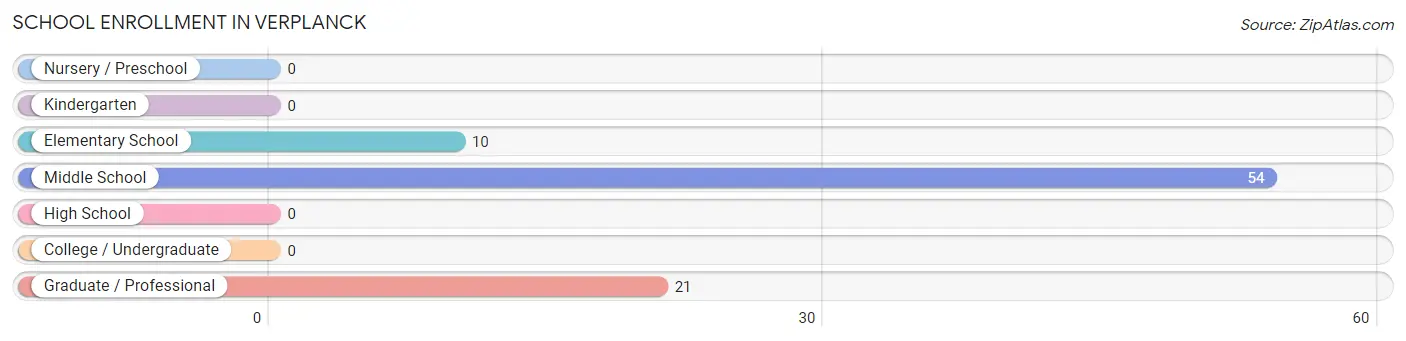
| School Level | # Students | % Students |
| Nursery / Preschool | 0 | 0.0% |
| Kindergarten | 0 | 0.0% |
| Elementary School | 10 | 11.8% |
| Middle School | 54 | 63.5% |
| High School | 0 | 0.0% |
| College / Undergraduate | 0 | 0.0% |
| Graduate / Professional | 21 | 24.7% |
| Total | 85 | 100.0% |
School Enrollment by Age by Funding Source in Verplanck
Out of a total of 85 students who are enrolled in schools in Verplanck, 20 (23.5%) attend a private institution, while the remaining 65 (76.5%) are enrolled in public schools. The age group of 5 to 9 year old has the highest likelihood of being enrolled in private schools, with 10 (100.0% in the age bracket) enrolled. Conversely, the age group of 25 to 34 year olds has the lowest likelihood of being enrolled in a private school, with 21 (100.0% in the age bracket) attending a public institution.
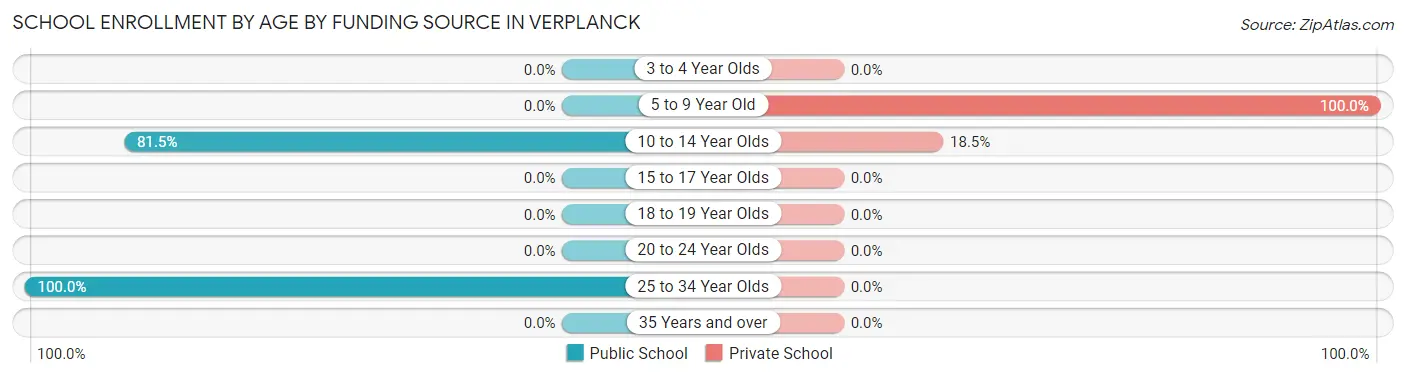
| Age Bracket | Public School | Private School |
| 3 to 4 Year Olds | 0 (0.0%) | 0 (0.0%) |
| 5 to 9 Year Old | 0 (0.0%) | 10 (100.0%) |
| 10 to 14 Year Olds | 44 (81.5%) | 10 (18.5%) |
| 15 to 17 Year Olds | 0 (0.0%) | 0 (0.0%) |
| 18 to 19 Year Olds | 0 (0.0%) | 0 (0.0%) |
| 20 to 24 Year Olds | 0 (0.0%) | 0 (0.0%) |
| 25 to 34 Year Olds | 21 (100.0%) | 0 (0.0%) |
| 35 Years and over | 0 (0.0%) | 0 (0.0%) |
| Total | 65 (76.5%) | 20 (23.5%) |
Educational Attainment by Field of Study in Verplanck
Engineering (47 | 22.5%), social sciences (37 | 17.7%), business (34 | 16.3%), liberal arts & history (23 | 11.0%), and visual & performing arts (22 | 10.5%) are the most common fields of study among 209 individuals in Verplanck who have obtained a bachelor's degree or higher.
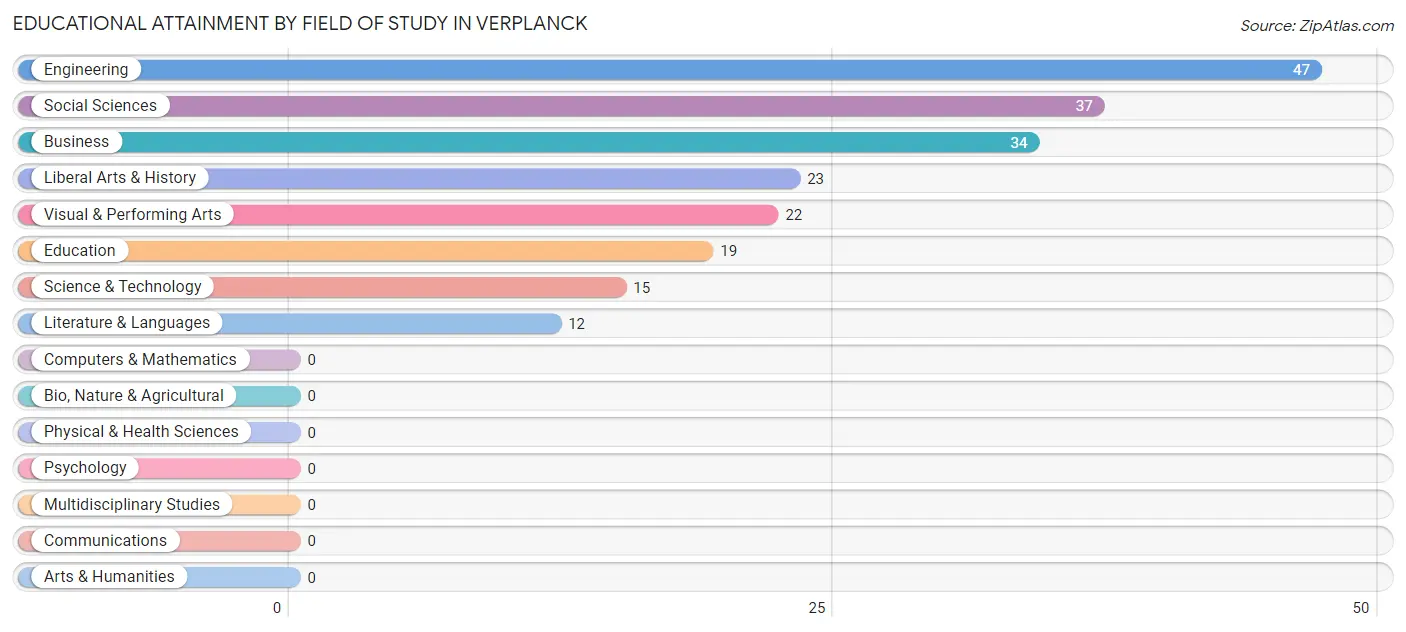
| Field of Study | # Graduates | % Graduates |
| Computers & Mathematics | 0 | 0.0% |
| Bio, Nature & Agricultural | 0 | 0.0% |
| Physical & Health Sciences | 0 | 0.0% |
| Psychology | 0 | 0.0% |
| Social Sciences | 37 | 17.7% |
| Engineering | 47 | 22.5% |
| Multidisciplinary Studies | 0 | 0.0% |
| Science & Technology | 15 | 7.2% |
| Business | 34 | 16.3% |
| Education | 19 | 9.1% |
| Literature & Languages | 12 | 5.7% |
| Liberal Arts & History | 23 | 11.0% |
| Visual & Performing Arts | 22 | 10.5% |
| Communications | 0 | 0.0% |
| Arts & Humanities | 0 | 0.0% |
| Total | 209 | 100.0% |
Transportation & Commute in Verplanck
Vehicle Availability by Sex in Verplanck
The most prevalent vehicle ownership categories in Verplanck are males with 2 vehicles (175, accounting for 59.5%) and females with 2 vehicles (76, making up 144.6%).
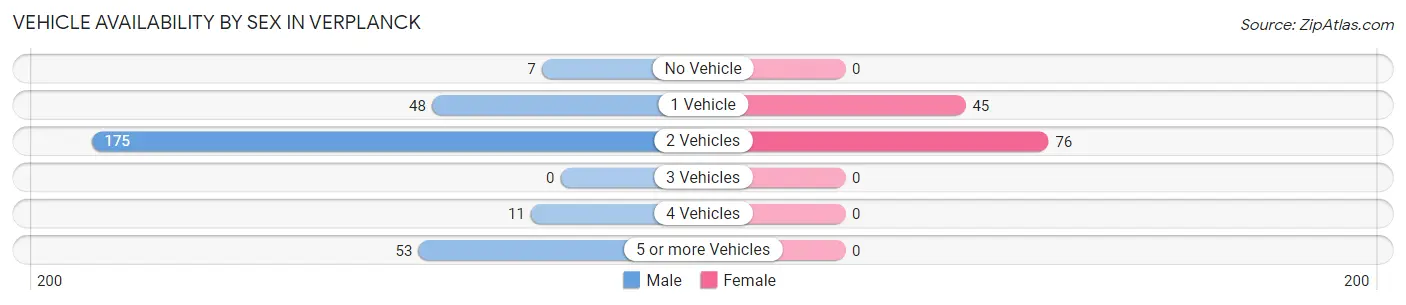
| Vehicles Available | Male | Female |
| No Vehicle | 7 (2.4%) | 0 (0.0%) |
| 1 Vehicle | 48 (16.3%) | 45 (37.2%) |
| 2 Vehicles | 175 (59.5%) | 76 (62.8%) |
| 3 Vehicles | 0 (0.0%) | 0 (0.0%) |
| 4 Vehicles | 11 (3.7%) | 0 (0.0%) |
| 5 or more Vehicles | 53 (18.0%) | 0 (0.0%) |
| Total | 294 (100.0%) | 121 (100.0%) |
Commute Time in Verplanck
The most frequently occuring commute durations in Verplanck are 30 to 34 minutes (70 commuters, 17.9%), 60 to 89 minutes (61 commuters, 15.6%), and 15 to 19 minutes (59 commuters, 15.0%).
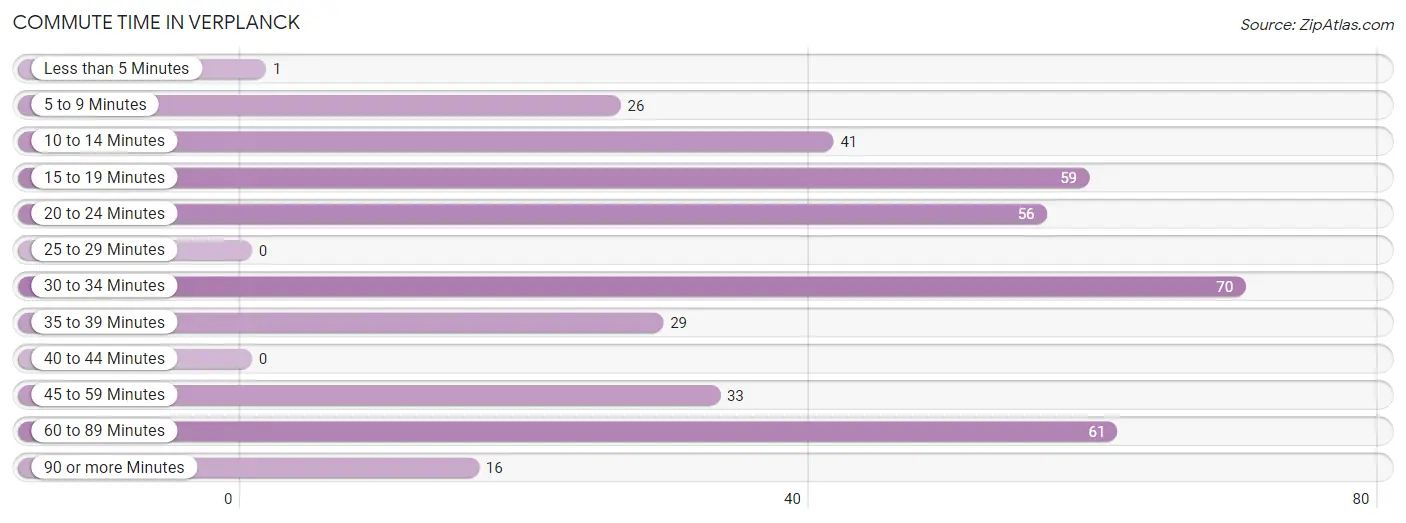
| Commute Time | # Commuters | % Commuters |
| Less than 5 Minutes | 1 | 0.3% |
| 5 to 9 Minutes | 26 | 6.6% |
| 10 to 14 Minutes | 41 | 10.5% |
| 15 to 19 Minutes | 59 | 15.0% |
| 20 to 24 Minutes | 56 | 14.3% |
| 25 to 29 Minutes | 0 | 0.0% |
| 30 to 34 Minutes | 70 | 17.9% |
| 35 to 39 Minutes | 29 | 7.4% |
| 40 to 44 Minutes | 0 | 0.0% |
| 45 to 59 Minutes | 33 | 8.4% |
| 60 to 89 Minutes | 61 | 15.6% |
| 90 or more Minutes | 16 | 4.1% |
Commute Time by Sex in Verplanck
The most common commute times in Verplanck are 30 to 34 minutes (70 commuters, 23.8%) for males and 35 to 39 minutes (29 commuters, 29.6%) for females.
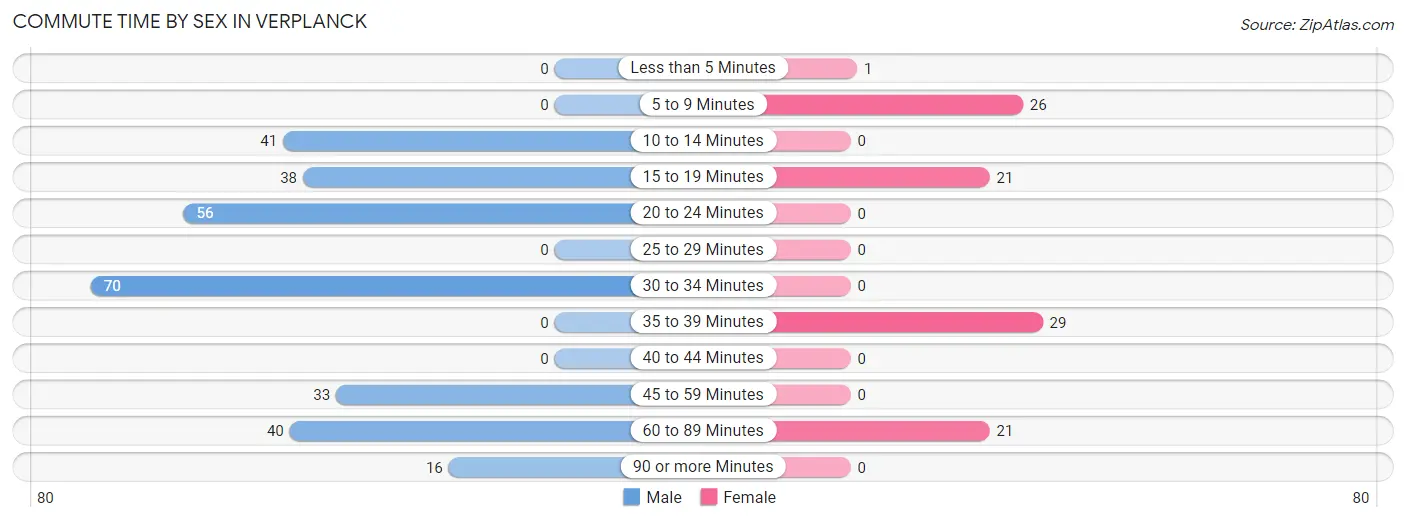
| Commute Time | Male | Female |
| Less than 5 Minutes | 0 (0.0%) | 1 (1.0%) |
| 5 to 9 Minutes | 0 (0.0%) | 26 (26.5%) |
| 10 to 14 Minutes | 41 (14.0%) | 0 (0.0%) |
| 15 to 19 Minutes | 38 (12.9%) | 21 (21.4%) |
| 20 to 24 Minutes | 56 (19.1%) | 0 (0.0%) |
| 25 to 29 Minutes | 0 (0.0%) | 0 (0.0%) |
| 30 to 34 Minutes | 70 (23.8%) | 0 (0.0%) |
| 35 to 39 Minutes | 0 (0.0%) | 29 (29.6%) |
| 40 to 44 Minutes | 0 (0.0%) | 0 (0.0%) |
| 45 to 59 Minutes | 33 (11.2%) | 0 (0.0%) |
| 60 to 89 Minutes | 40 (13.6%) | 21 (21.4%) |
| 90 or more Minutes | 16 (5.4%) | 0 (0.0%) |
Time of Departure to Work by Sex in Verplanck
The most frequent times of departure to work in Verplanck are 6:00 AM to 6:29 AM (89, 30.3%) for males and 8:30 AM to 8:59 AM (76, 77.5%) for females.
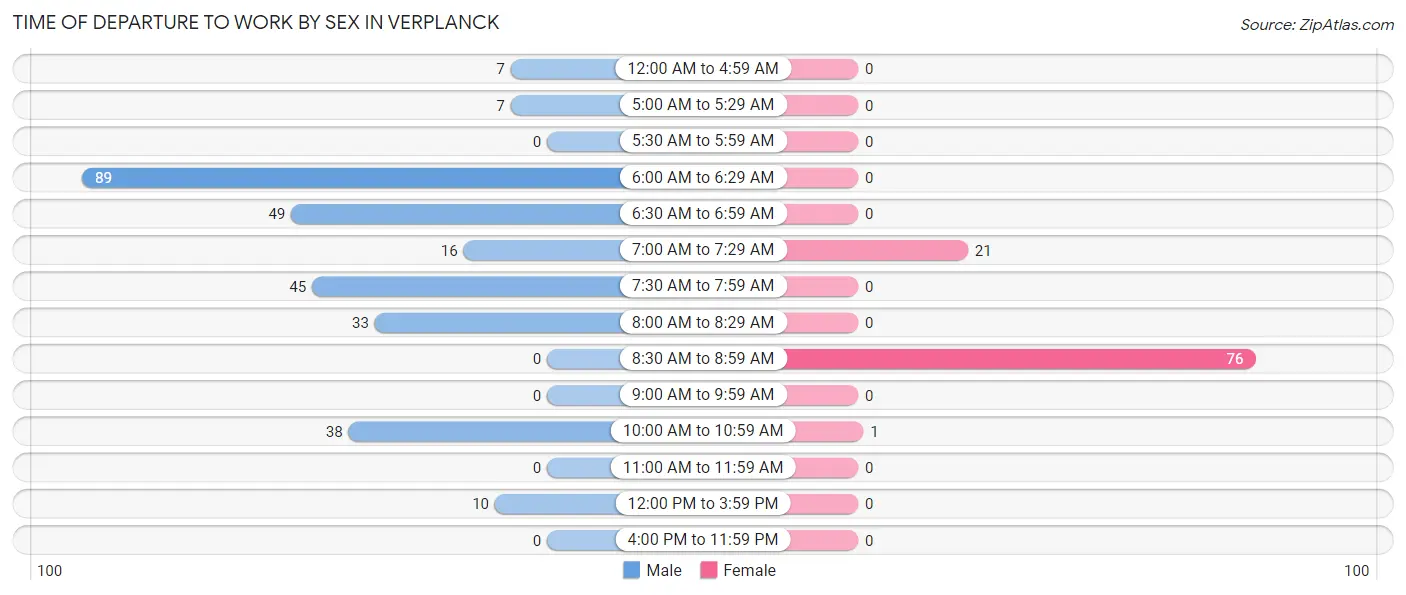
| Time of Departure | Male | Female |
| 12:00 AM to 4:59 AM | 7 (2.4%) | 0 (0.0%) |
| 5:00 AM to 5:29 AM | 7 (2.4%) | 0 (0.0%) |
| 5:30 AM to 5:59 AM | 0 (0.0%) | 0 (0.0%) |
| 6:00 AM to 6:29 AM | 89 (30.3%) | 0 (0.0%) |
| 6:30 AM to 6:59 AM | 49 (16.7%) | 0 (0.0%) |
| 7:00 AM to 7:29 AM | 16 (5.4%) | 21 (21.4%) |
| 7:30 AM to 7:59 AM | 45 (15.3%) | 0 (0.0%) |
| 8:00 AM to 8:29 AM | 33 (11.2%) | 0 (0.0%) |
| 8:30 AM to 8:59 AM | 0 (0.0%) | 76 (77.5%) |
| 9:00 AM to 9:59 AM | 0 (0.0%) | 0 (0.0%) |
| 10:00 AM to 10:59 AM | 38 (12.9%) | 1 (1.0%) |
| 11:00 AM to 11:59 AM | 0 (0.0%) | 0 (0.0%) |
| 12:00 PM to 3:59 PM | 10 (3.4%) | 0 (0.0%) |
| 4:00 PM to 11:59 PM | 0 (0.0%) | 0 (0.0%) |
| Total | 294 (100.0%) | 98 (100.0%) |
Housing Occupancy in Verplanck
Occupancy by Ownership in Verplanck
Of the total 364 dwellings in Verplanck, owner-occupied units account for 187 (51.4%), while renter-occupied units make up 177 (48.6%).
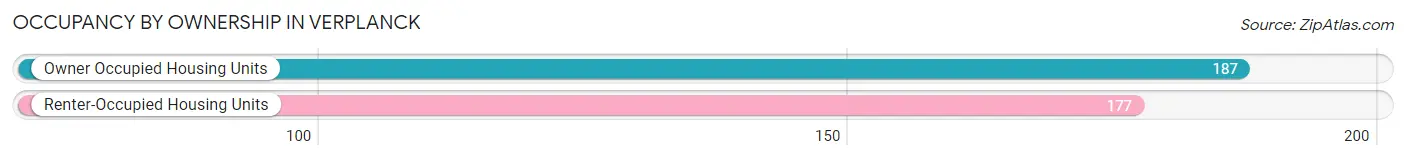
| Occupancy | # Housing Units | % Housing Units |
| Owner Occupied Housing Units | 187 | 51.4% |
| Renter-Occupied Housing Units | 177 | 48.6% |
| Total Occupied Housing Units | 364 | 100.0% |
Occupancy by Household Size in Verplanck
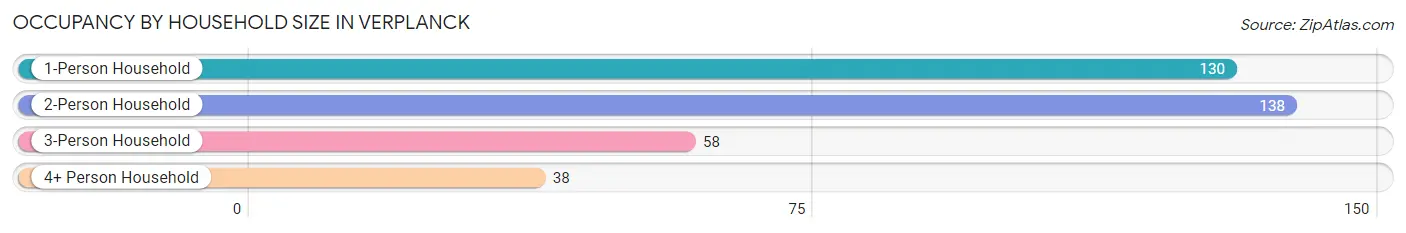
| Household Size | # Housing Units | % Housing Units |
| 1-Person Household | 130 | 35.7% |
| 2-Person Household | 138 | 37.9% |
| 3-Person Household | 58 | 15.9% |
| 4+ Person Household | 38 | 10.4% |
| Total Housing Units | 364 | 100.0% |
Occupancy by Ownership by Household Size in Verplanck
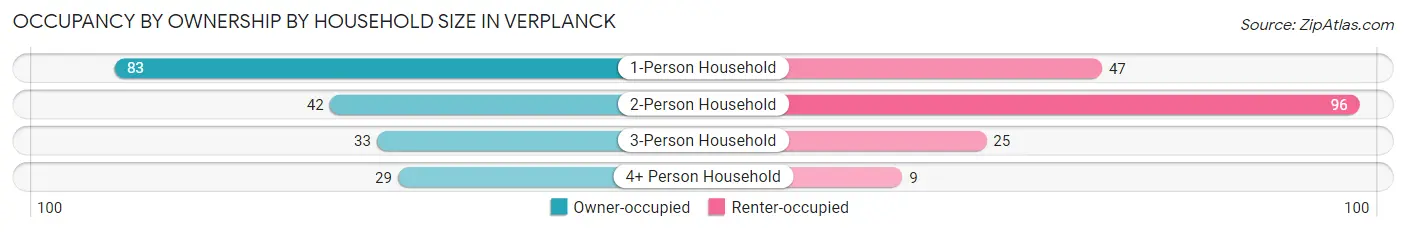
| Household Size | Owner-occupied | Renter-occupied |
| 1-Person Household | 83 (63.8%) | 47 (36.1%) |
| 2-Person Household | 42 (30.4%) | 96 (69.6%) |
| 3-Person Household | 33 (56.9%) | 25 (43.1%) |
| 4+ Person Household | 29 (76.3%) | 9 (23.7%) |
| Total Housing Units | 187 (51.4%) | 177 (48.6%) |
Occupancy by Educational Attainment in Verplanck
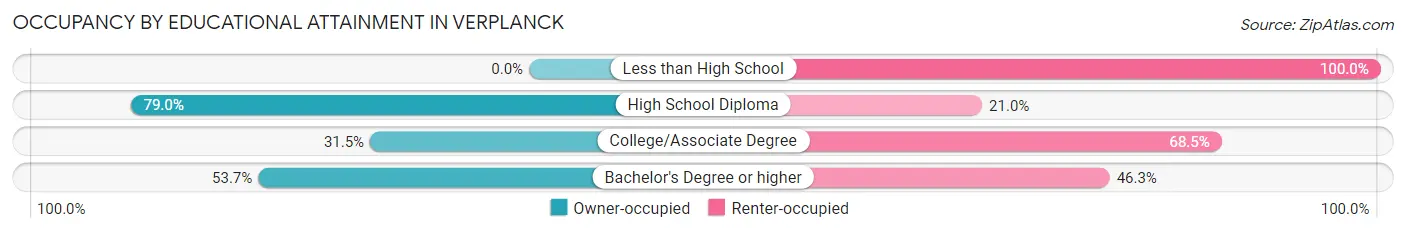
| Household Size | Owner-occupied | Renter-occupied |
| Less than High School | 0 (0.0%) | 26 (100.0%) |
| High School Diploma | 94 (79.0%) | 25 (21.0%) |
| College/Associate Degree | 35 (31.5%) | 76 (68.5%) |
| Bachelor's Degree or higher | 58 (53.7%) | 50 (46.3%) |
Occupancy by Age of Householder in Verplanck
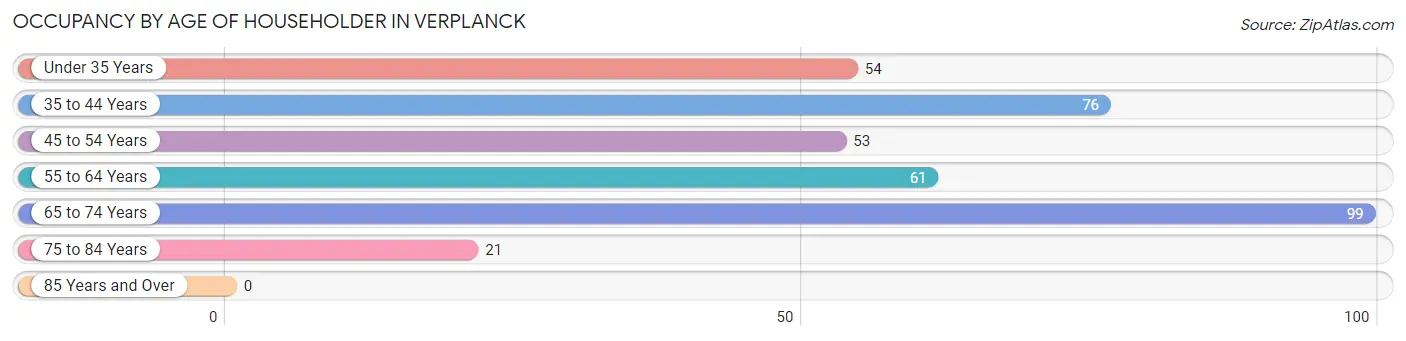
| Age Bracket | # Households | % Households |
| Under 35 Years | 54 | 14.8% |
| 35 to 44 Years | 76 | 20.9% |
| 45 to 54 Years | 53 | 14.6% |
| 55 to 64 Years | 61 | 16.8% |
| 65 to 74 Years | 99 | 27.2% |
| 75 to 84 Years | 21 | 5.8% |
| 85 Years and Over | 0 | 0.0% |
| Total | 364 | 100.0% |
Housing Finances in Verplanck
Median Income by Occupancy in Verplanck
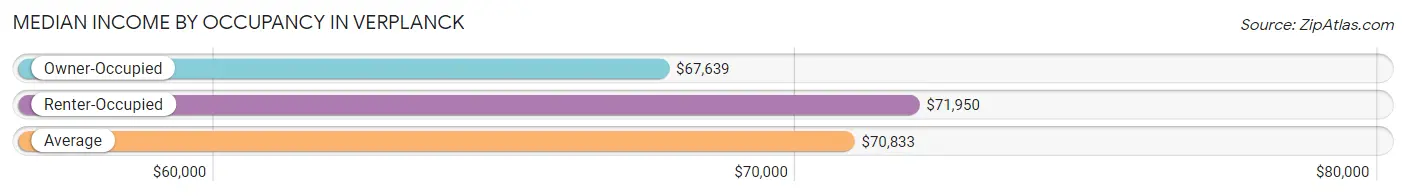
| Occupancy Type | # Households | Median Income |
| Owner-Occupied | 187 (51.4%) | $67,639 |
| Renter-Occupied | 177 (48.6%) | $71,950 |
| Average | 364 (100.0%) | $70,833 |
Occupancy by Householder Income Bracket in Verplanck
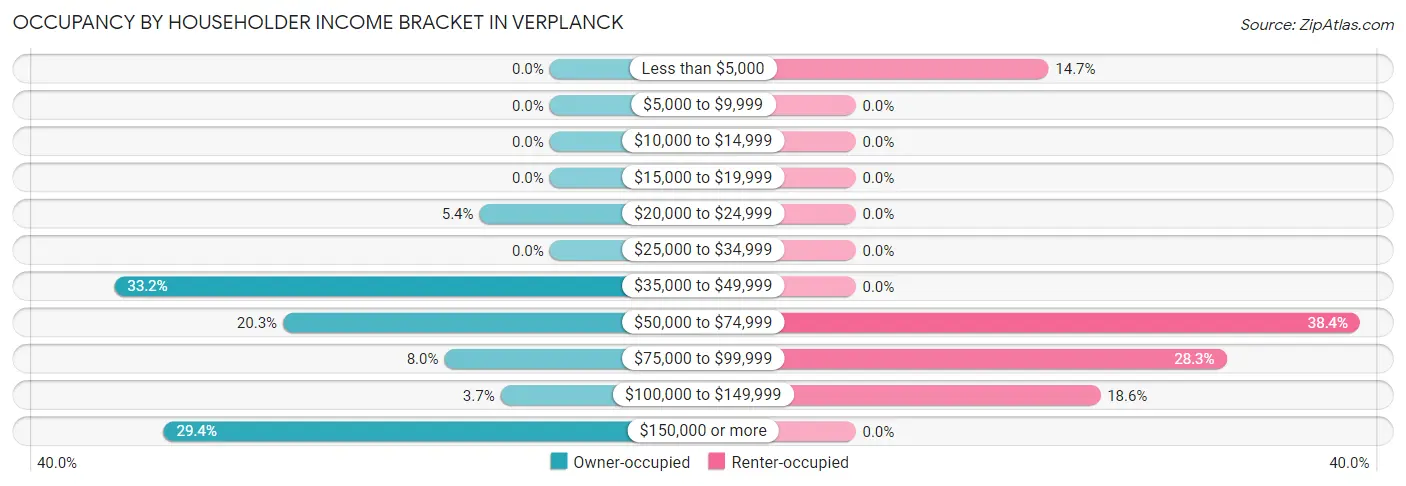
| Income Bracket | Owner-occupied | Renter-occupied |
| Less than $5,000 | 0 (0.0%) | 26 (14.7%) |
| $5,000 to $9,999 | 0 (0.0%) | 0 (0.0%) |
| $10,000 to $14,999 | 0 (0.0%) | 0 (0.0%) |
| $15,000 to $19,999 | 0 (0.0%) | 0 (0.0%) |
| $20,000 to $24,999 | 10 (5.3%) | 0 (0.0%) |
| $25,000 to $34,999 | 0 (0.0%) | 0 (0.0%) |
| $35,000 to $49,999 | 62 (33.2%) | 0 (0.0%) |
| $50,000 to $74,999 | 38 (20.3%) | 68 (38.4%) |
| $75,000 to $99,999 | 15 (8.0%) | 50 (28.2%) |
| $100,000 to $149,999 | 7 (3.7%) | 33 (18.6%) |
| $150,000 or more | 55 (29.4%) | 0 (0.0%) |
| Total | 187 (100.0%) | 177 (100.0%) |
Monthly Housing Cost Tiers in Verplanck
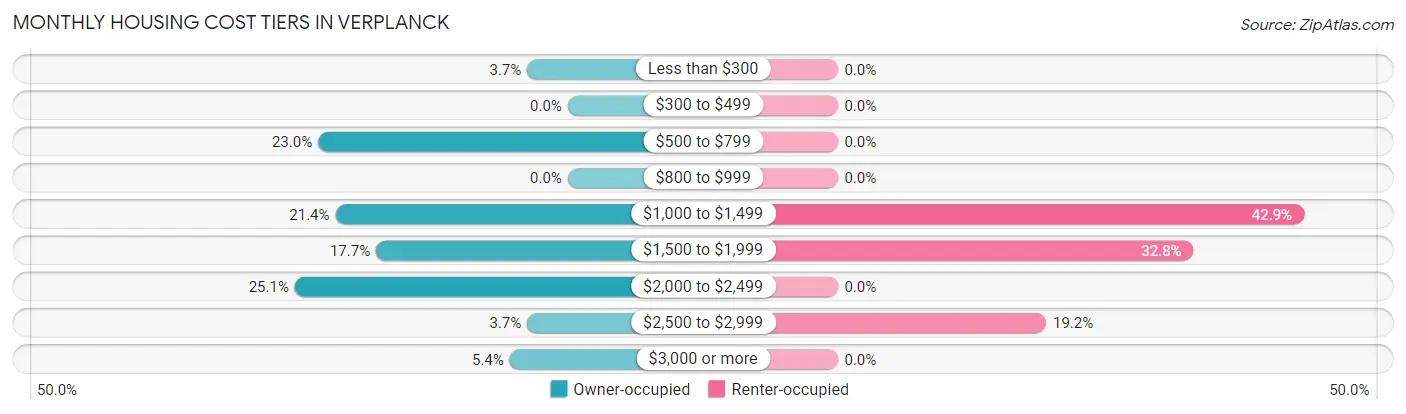
| Monthly Cost | Owner-occupied | Renter-occupied |
| Less than $300 | 7 (3.7%) | 0 (0.0%) |
| $300 to $499 | 0 (0.0%) | 0 (0.0%) |
| $500 to $799 | 43 (23.0%) | 0 (0.0%) |
| $800 to $999 | 0 (0.0%) | 0 (0.0%) |
| $1,000 to $1,499 | 40 (21.4%) | 76 (42.9%) |
| $1,500 to $1,999 | 33 (17.6%) | 58 (32.8%) |
| $2,000 to $2,499 | 47 (25.1%) | 0 (0.0%) |
| $2,500 to $2,999 | 7 (3.7%) | 34 (19.2%) |
| $3,000 or more | 10 (5.3%) | 0 (0.0%) |
| Total | 187 (100.0%) | 177 (100.0%) |
Physical Housing Characteristics in Verplanck
Housing Structures in Verplanck
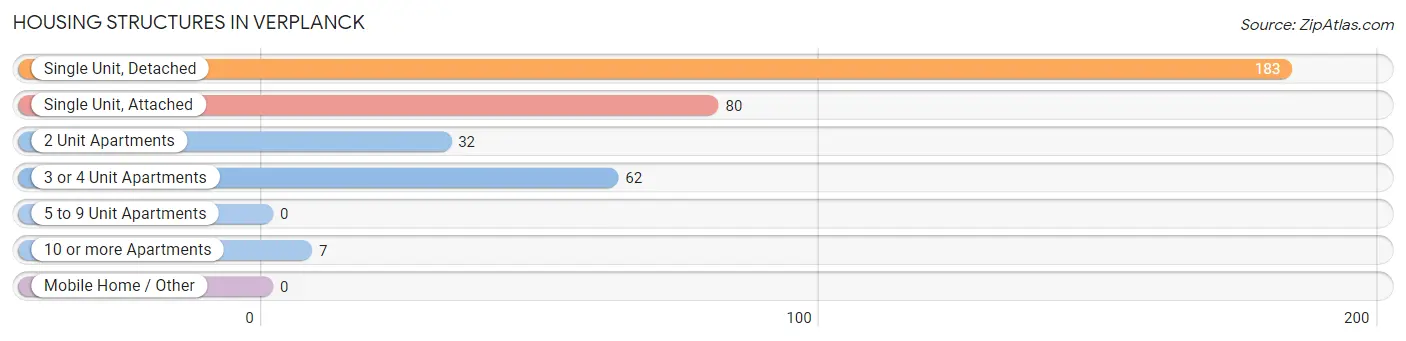
| Structure Type | # Housing Units | % Housing Units |
| Single Unit, Detached | 183 | 50.3% |
| Single Unit, Attached | 80 | 22.0% |
| 2 Unit Apartments | 32 | 8.8% |
| 3 or 4 Unit Apartments | 62 | 17.0% |
| 5 to 9 Unit Apartments | 0 | 0.0% |
| 10 or more Apartments | 7 | 1.9% |
| Mobile Home / Other | 0 | 0.0% |
| Total | 364 | 100.0% |
Housing Structures by Occupancy in Verplanck
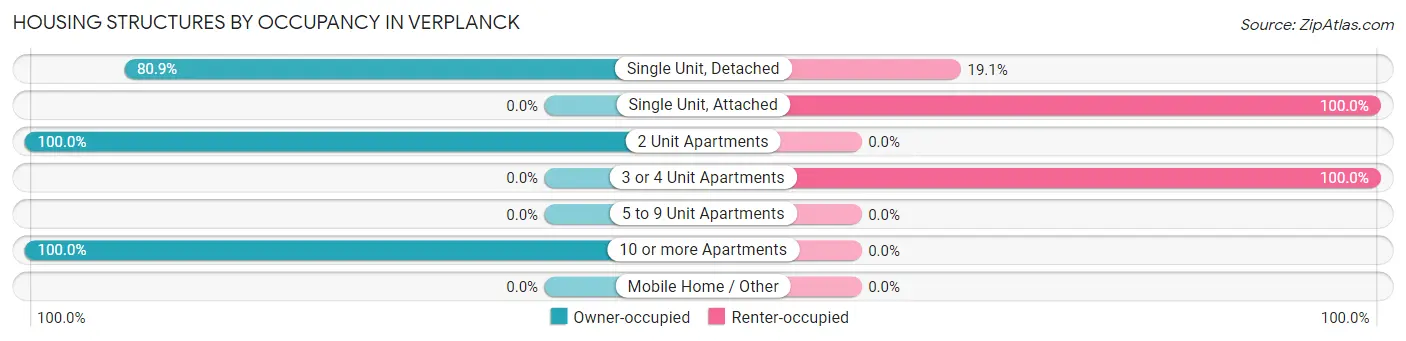
| Structure Type | Owner-occupied | Renter-occupied |
| Single Unit, Detached | 148 (80.9%) | 35 (19.1%) |
| Single Unit, Attached | 0 (0.0%) | 80 (100.0%) |
| 2 Unit Apartments | 32 (100.0%) | 0 (0.0%) |
| 3 or 4 Unit Apartments | 0 (0.0%) | 62 (100.0%) |
| 5 to 9 Unit Apartments | 0 (0.0%) | 0 (0.0%) |
| 10 or more Apartments | 7 (100.0%) | 0 (0.0%) |
| Mobile Home / Other | 0 (0.0%) | 0 (0.0%) |
| Total | 187 (51.4%) | 177 (48.6%) |
Housing Structures by Number of Rooms in Verplanck
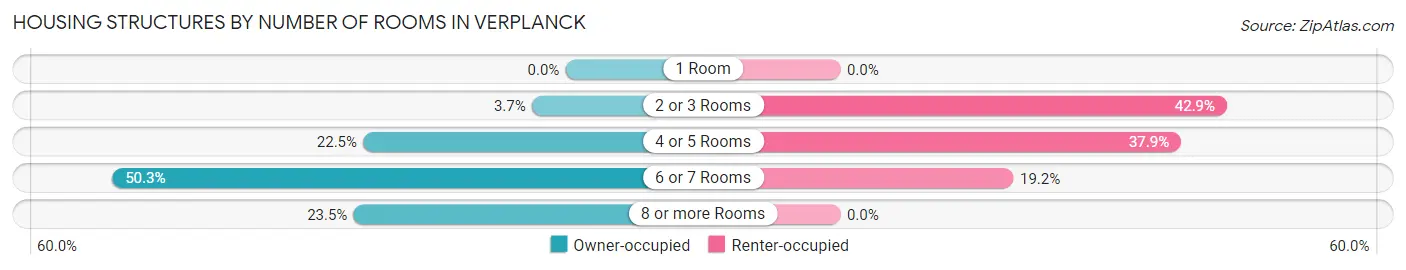
| Number of Rooms | Owner-occupied | Renter-occupied |
| 1 Room | 0 (0.0%) | 0 (0.0%) |
| 2 or 3 Rooms | 7 (3.7%) | 76 (42.9%) |
| 4 or 5 Rooms | 42 (22.5%) | 67 (37.9%) |
| 6 or 7 Rooms | 94 (50.3%) | 34 (19.2%) |
| 8 or more Rooms | 44 (23.5%) | 0 (0.0%) |
| Total | 187 (100.0%) | 177 (100.0%) |
Housing Structure by Heating Type in Verplanck
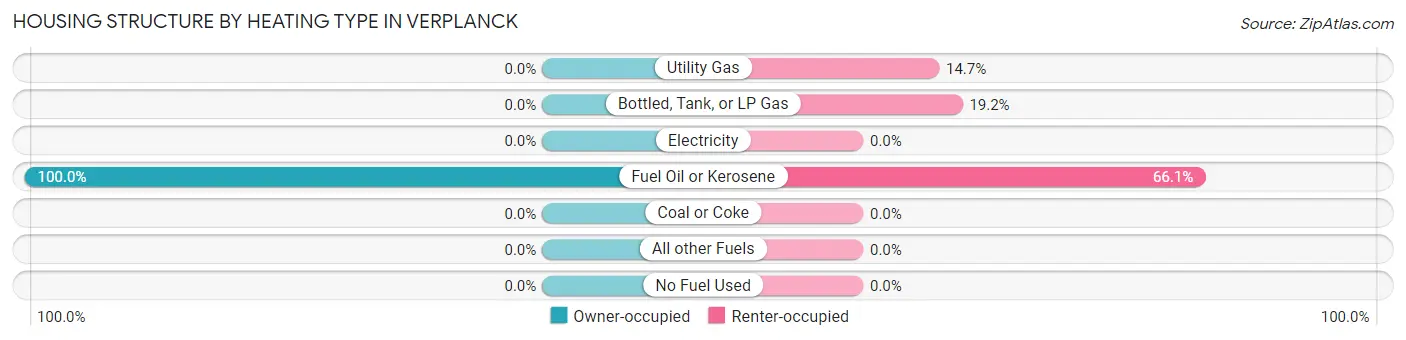
| Heating Type | Owner-occupied | Renter-occupied |
| Utility Gas | 0 (0.0%) | 26 (14.7%) |
| Bottled, Tank, or LP Gas | 0 (0.0%) | 34 (19.2%) |
| Electricity | 0 (0.0%) | 0 (0.0%) |
| Fuel Oil or Kerosene | 187 (100.0%) | 117 (66.1%) |
| Coal or Coke | 0 (0.0%) | 0 (0.0%) |
| All other Fuels | 0 (0.0%) | 0 (0.0%) |
| No Fuel Used | 0 (0.0%) | 0 (0.0%) |
| Total | 187 (100.0%) | 177 (100.0%) |
Household Vehicle Usage in Verplanck
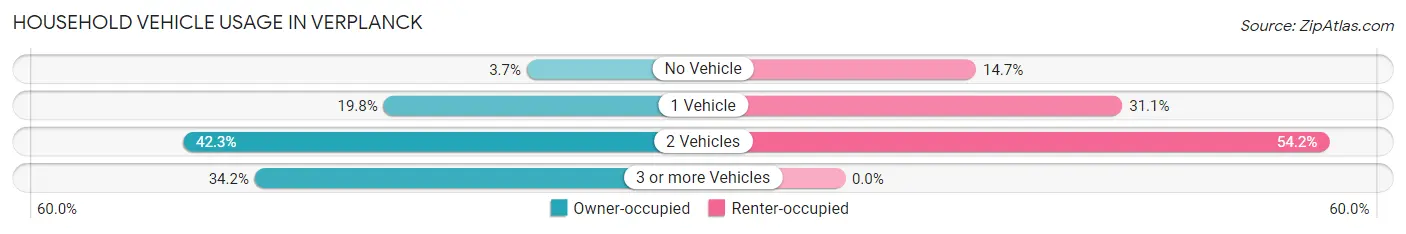
| Vehicles per Household | Owner-occupied | Renter-occupied |
| No Vehicle | 7 (3.7%) | 26 (14.7%) |
| 1 Vehicle | 37 (19.8%) | 55 (31.1%) |
| 2 Vehicles | 79 (42.2%) | 96 (54.2%) |
| 3 or more Vehicles | 64 (34.2%) | 0 (0.0%) |
| Total | 187 (100.0%) | 177 (100.0%) |
Real Estate & Mortgages in Verplanck
Real Estate and Mortgage Overview in Verplanck
| Characteristic | Without Mortgage | With Mortgage |
| Housing Units | 100 | 87 |
| Median Property Value | $350,000 | $455,700 |
| Median Household Income | $37,326 | $55 |
| Monthly Housing Costs | $900 | $10 |
| Real Estate Taxes | - | - |
Property Value by Mortgage Status in Verplanck
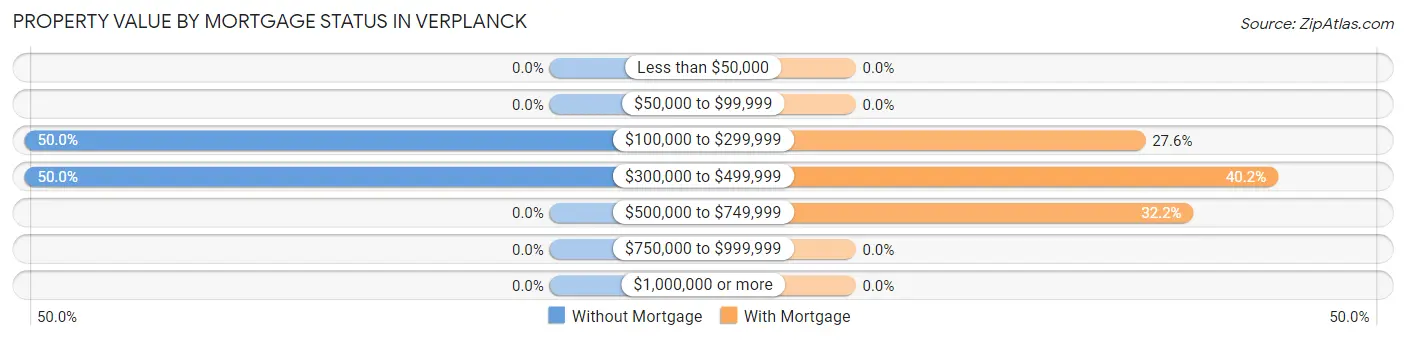
| Property Value | Without Mortgage | With Mortgage |
| Less than $50,000 | 0 (0.0%) | 0 (0.0%) |
| $50,000 to $99,999 | 0 (0.0%) | 0 (0.0%) |
| $100,000 to $299,999 | 50 (50.0%) | 24 (27.6%) |
| $300,000 to $499,999 | 50 (50.0%) | 35 (40.2%) |
| $500,000 to $749,999 | 0 (0.0%) | 28 (32.2%) |
| $750,000 to $999,999 | 0 (0.0%) | 0 (0.0%) |
| $1,000,000 or more | 0 (0.0%) | 0 (0.0%) |
| Total | 100 (100.0%) | 87 (100.0%) |
Household Income by Mortgage Status in Verplanck
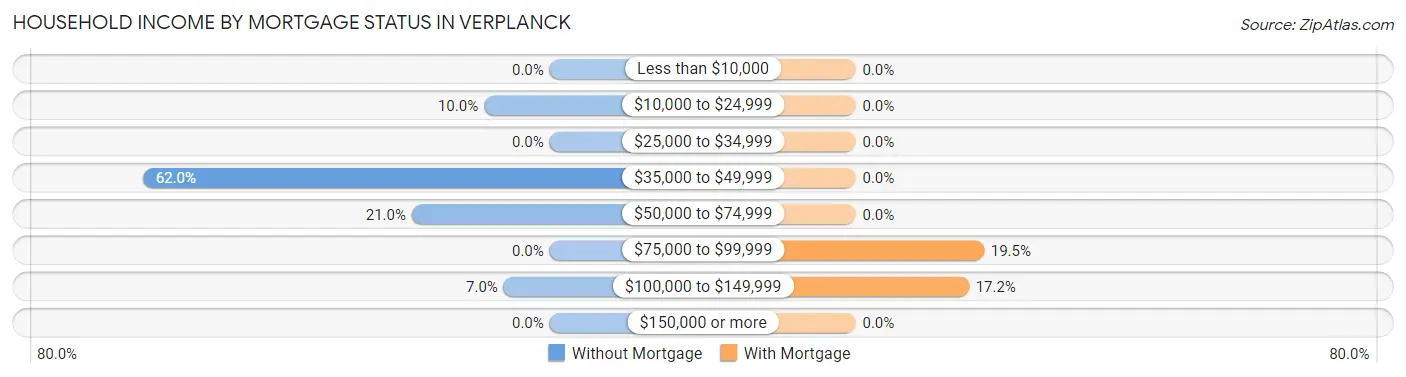
| Household Income | Without Mortgage | With Mortgage |
| Less than $10,000 | 0 (0.0%) | 0 (0.0%) |
| $10,000 to $24,999 | 10 (10.0%) | 0 (0.0%) |
| $25,000 to $34,999 | 0 (0.0%) | 0 (0.0%) |
| $35,000 to $49,999 | 62 (62.0%) | 0 (0.0%) |
| $50,000 to $74,999 | 21 (21.0%) | 0 (0.0%) |
| $75,000 to $99,999 | 0 (0.0%) | 17 (19.5%) |
| $100,000 to $149,999 | 7 (7.0%) | 15 (17.2%) |
| $150,000 or more | 0 (0.0%) | 0 (0.0%) |
| Total | 100 (100.0%) | 87 (100.0%) |
Property Value to Household Income Ratio in Verplanck
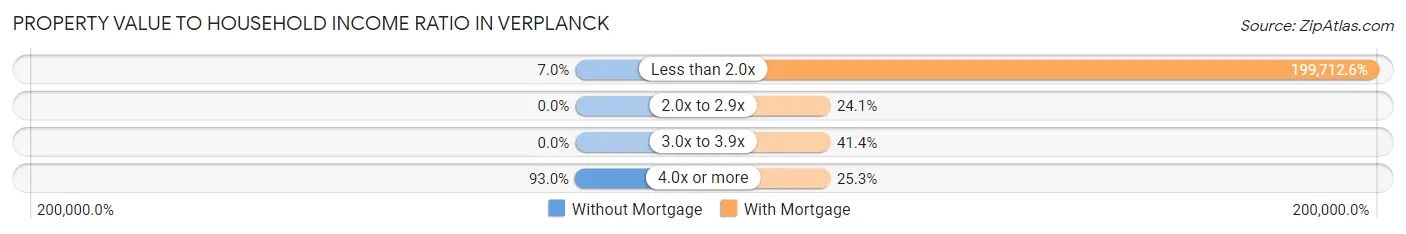
| Value-to-Income Ratio | Without Mortgage | With Mortgage |
| Less than 2.0x | 7 (7.0%) | 173,750 (199,712.6%) |
| 2.0x to 2.9x | 0 (0.0%) | 21 (24.1%) |
| 3.0x to 3.9x | 0 (0.0%) | 36 (41.4%) |
| 4.0x or more | 93 (93.0%) | 22 (25.3%) |
| Total | 100 (100.0%) | 87 (100.0%) |
Real Estate Taxes by Mortgage Status in Verplanck
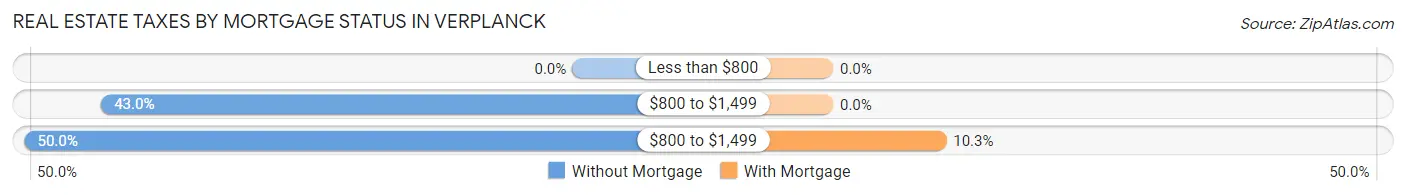
| Property Taxes | Without Mortgage | With Mortgage |
| Less than $800 | 0 (0.0%) | 0 (0.0%) |
| $800 to $1,499 | 43 (43.0%) | 0 (0.0%) |
| $800 to $1,499 | 50 (50.0%) | 9 (10.3%) |
| Total | 100 (100.0%) | 87 (100.0%) |
Health & Disability in Verplanck
Health Insurance Coverage by Age in Verplanck
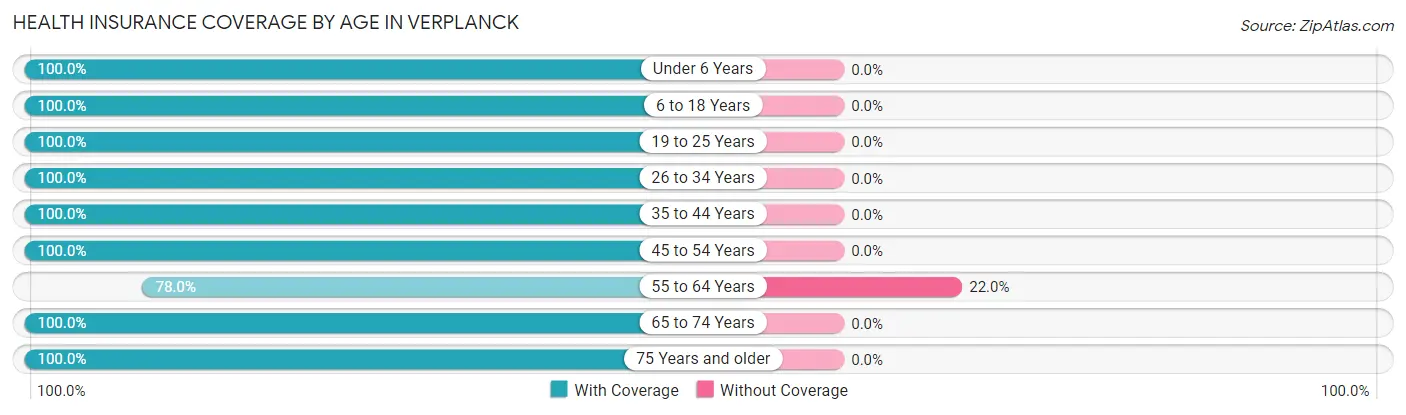
| Age Bracket | With Coverage | Without Coverage |
| Under 6 Years | 14 (100.0%) | 0 (0.0%) |
| 6 to 18 Years | 64 (100.0%) | 0 (0.0%) |
| 19 to 25 Years | 79 (100.0%) | 0 (0.0%) |
| 26 to 34 Years | 101 (100.0%) | 0 (0.0%) |
| 35 to 44 Years | 148 (100.0%) | 0 (0.0%) |
| 45 to 54 Years | 114 (100.0%) | 0 (0.0%) |
| 55 to 64 Years | 78 (78.0%) | 22 (22.0%) |
| 65 to 74 Years | 146 (100.0%) | 0 (0.0%) |
| 75 Years and older | 30 (100.0%) | 0 (0.0%) |
| Total | 774 (97.2%) | 22 (2.8%) |
Health Insurance Coverage by Citizenship Status in Verplanck
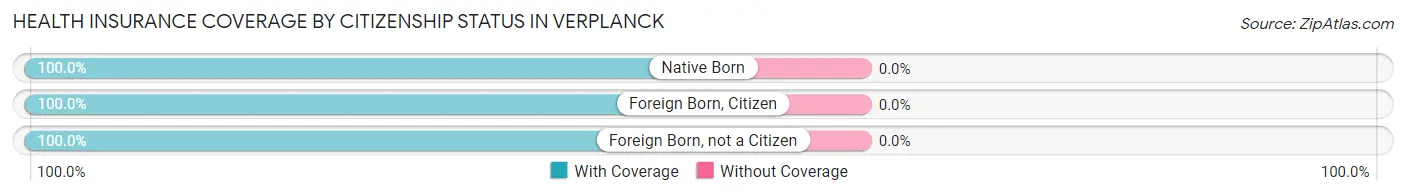
| Citizenship Status | With Coverage | Without Coverage |
| Native Born | 14 (100.0%) | 0 (0.0%) |
| Foreign Born, Citizen | 64 (100.0%) | 0 (0.0%) |
| Foreign Born, not a Citizen | 79 (100.0%) | 0 (0.0%) |
Health Insurance Coverage by Household Income in Verplanck
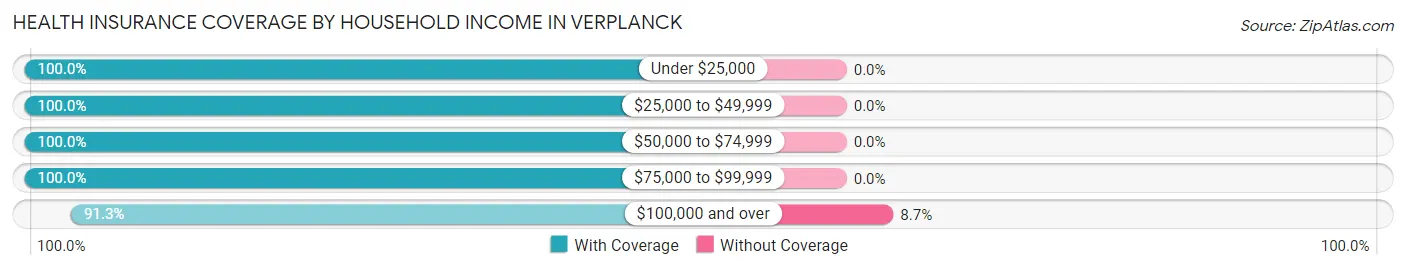
| Household Income | With Coverage | Without Coverage |
| Under $25,000 | 36 (100.0%) | 0 (0.0%) |
| $25,000 to $49,999 | 126 (100.0%) | 0 (0.0%) |
| $50,000 to $74,999 | 244 (100.0%) | 0 (0.0%) |
| $75,000 to $99,999 | 133 (100.0%) | 0 (0.0%) |
| $100,000 and over | 230 (91.3%) | 22 (8.7%) |
Public vs Private Health Insurance Coverage by Age in Verplanck
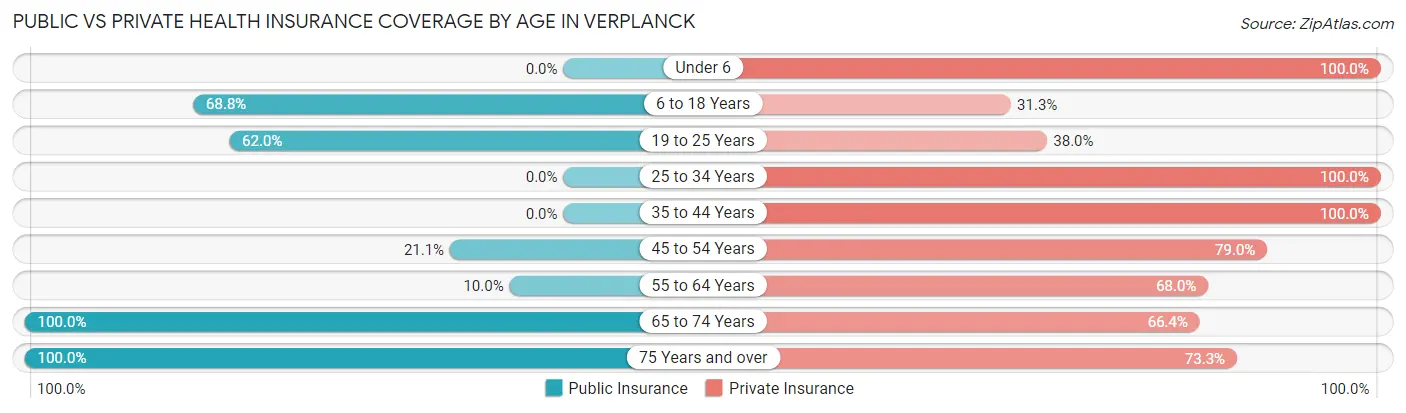
| Age Bracket | Public Insurance | Private Insurance |
| Under 6 | 0 (0.0%) | 14 (100.0%) |
| 6 to 18 Years | 44 (68.8%) | 20 (31.2%) |
| 19 to 25 Years | 49 (62.0%) | 30 (38.0%) |
| 25 to 34 Years | 0 (0.0%) | 101 (100.0%) |
| 35 to 44 Years | 0 (0.0%) | 148 (100.0%) |
| 45 to 54 Years | 24 (21.0%) | 90 (78.9%) |
| 55 to 64 Years | 10 (10.0%) | 68 (68.0%) |
| 65 to 74 Years | 146 (100.0%) | 97 (66.4%) |
| 75 Years and over | 30 (100.0%) | 22 (73.3%) |
| Total | 303 (38.1%) | 590 (74.1%) |
Disability Status by Sex by Age in Verplanck
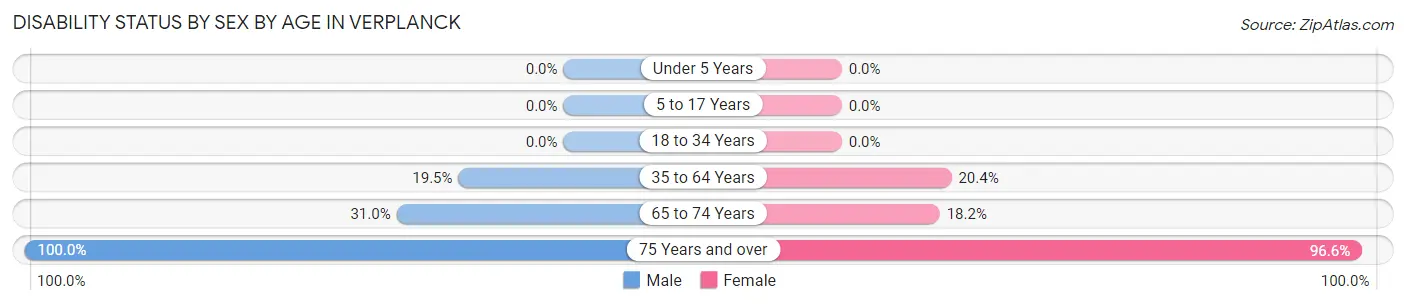
| Age Bracket | Male | Female |
| Under 5 Years | 0 (0.0%) | 0 (0.0%) |
| 5 to 17 Years | 0 (0.0%) | 0 (0.0%) |
| 18 to 34 Years | 0 (0.0%) | 0 (0.0%) |
| 35 to 64 Years | 38 (19.5%) | 34 (20.4%) |
| 65 to 74 Years | 35 (31.0%) | 6 (18.2%) |
| 75 Years and over | 1 (100.0%) | 28 (96.6%) |
Disability Class by Sex by Age in Verplanck
Disability Class: Hearing Difficulty
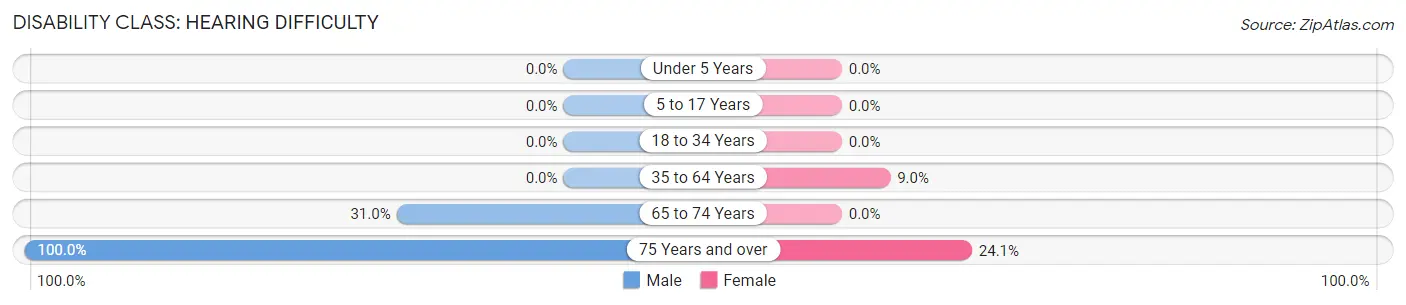
| Age Bracket | Male | Female |
| Under 5 Years | 0 (0.0%) | 0 (0.0%) |
| 5 to 17 Years | 0 (0.0%) | 0 (0.0%) |
| 18 to 34 Years | 0 (0.0%) | 0 (0.0%) |
| 35 to 64 Years | 0 (0.0%) | 15 (9.0%) |
| 65 to 74 Years | 35 (31.0%) | 0 (0.0%) |
| 75 Years and over | 1 (100.0%) | 7 (24.1%) |
Disability Class: Vision Difficulty
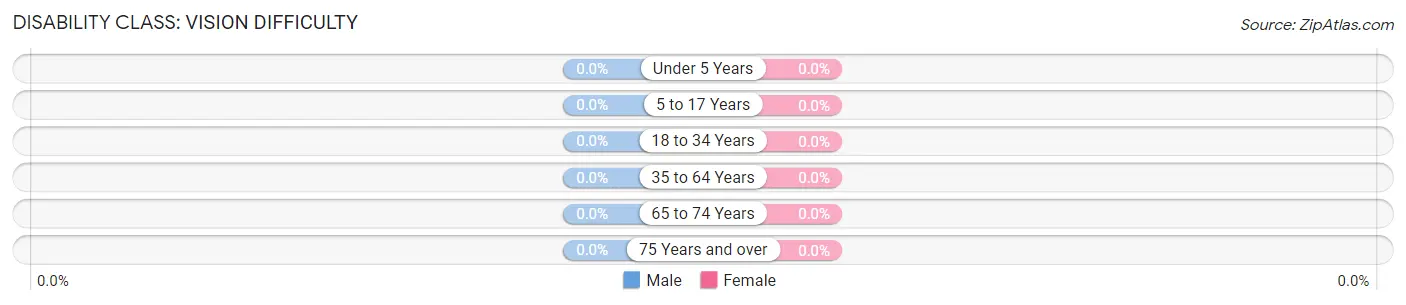
| Age Bracket | Male | Female |
| Under 5 Years | 0 (0.0%) | 0 (0.0%) |
| 5 to 17 Years | 0 (0.0%) | 0 (0.0%) |
| 18 to 34 Years | 0 (0.0%) | 0 (0.0%) |
| 35 to 64 Years | 0 (0.0%) | 0 (0.0%) |
| 65 to 74 Years | 0 (0.0%) | 0 (0.0%) |
| 75 Years and over | 0 (0.0%) | 0 (0.0%) |
Disability Class: Cognitive Difficulty
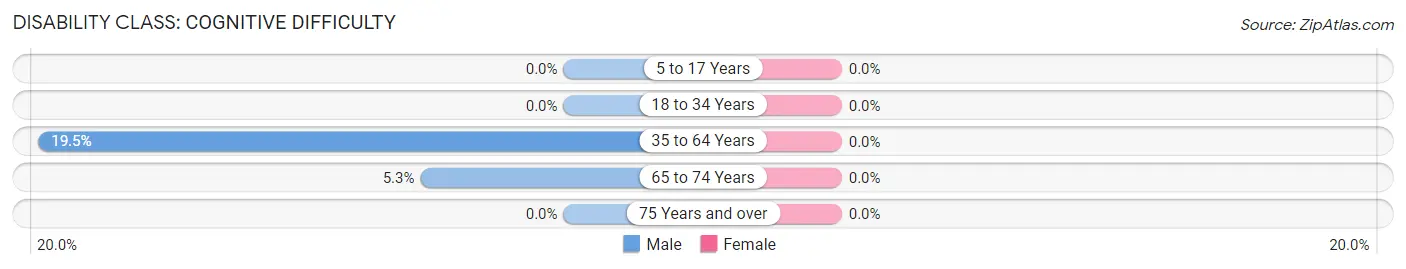
| Age Bracket | Male | Female |
| 5 to 17 Years | 0 (0.0%) | 0 (0.0%) |
| 18 to 34 Years | 0 (0.0%) | 0 (0.0%) |
| 35 to 64 Years | 38 (19.5%) | 0 (0.0%) |
| 65 to 74 Years | 6 (5.3%) | 0 (0.0%) |
| 75 Years and over | 0 (0.0%) | 0 (0.0%) |
Disability Class: Ambulatory Difficulty
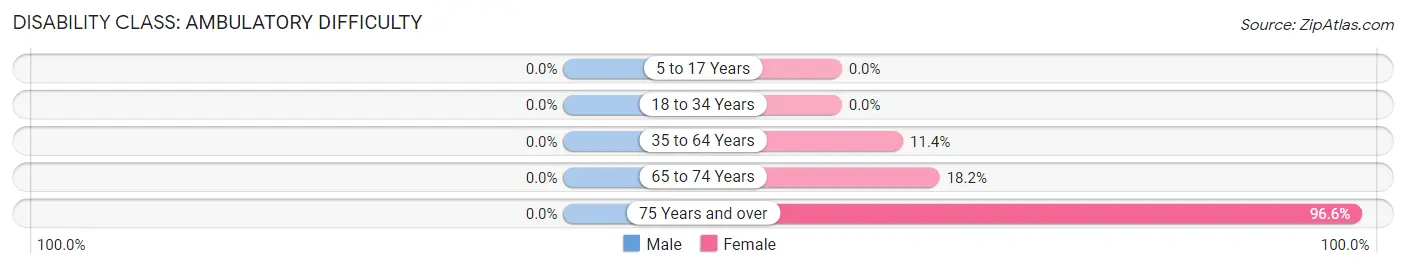
| Age Bracket | Male | Female |
| 5 to 17 Years | 0 (0.0%) | 0 (0.0%) |
| 18 to 34 Years | 0 (0.0%) | 0 (0.0%) |
| 35 to 64 Years | 0 (0.0%) | 19 (11.4%) |
| 65 to 74 Years | 0 (0.0%) | 6 (18.2%) |
| 75 Years and over | 0 (0.0%) | 28 (96.6%) |
Disability Class: Self-Care Difficulty
| Age Bracket | Male | Female |
| 5 to 17 Years | 0 (0.0%) | 0 (0.0%) |
| 18 to 34 Years | 0 (0.0%) | 0 (0.0%) |
| 35 to 64 Years | 0 (0.0%) | 0 (0.0%) |
| 65 to 74 Years | 0 (0.0%) | 0 (0.0%) |
| 75 Years and over | 0 (0.0%) | 0 (0.0%) |
Technology Access in Verplanck
Computing Device Access in Verplanck
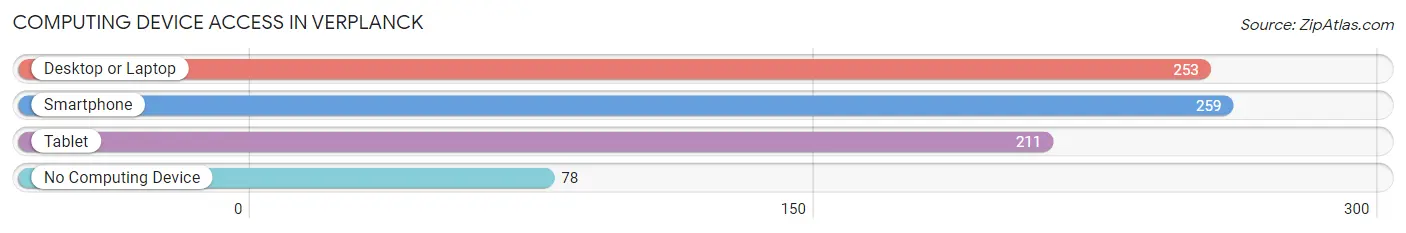
| Device Type | # Households | % Households |
| Desktop or Laptop | 253 | 69.5% |
| Smartphone | 259 | 71.2% |
| Tablet | 211 | 58.0% |
| No Computing Device | 78 | 21.4% |
| Total | 364 | 100.0% |
Internet Access in Verplanck
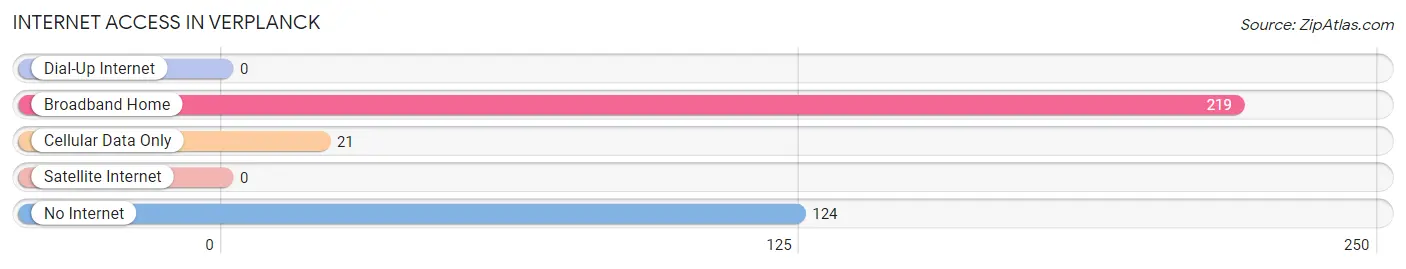
| Internet Type | # Households | % Households |
| Dial-Up Internet | 0 | 0.0% |
| Broadband Home | 219 | 60.2% |
| Cellular Data Only | 21 | 5.8% |
| Satellite Internet | 0 | 0.0% |
| No Internet | 124 | 34.1% |
| Total | 364 | 100.0% |
Verplanck Summary
Verplanck is a small hamlet located in the town of Cortlandt, in Westchester County, New York. It is situated on the east bank of the Hudson River, about 25 miles north of New York City. The hamlet is home to a population of approximately 1,000 people, and is part of the larger town of Cortlandt, which has a population of approximately 20,000.
History
Verplanck was first settled in the late 17th century by Dutch settlers, who named the area after the Verplanck family, who were prominent landowners in the area. The hamlet was originally part of the larger town of Cortlandt, which was established in 1788. In the 19th century, the hamlet grew in population and became an important port for the shipping of goods and materials. The Verplanck Point Lighthouse was built in 1855 to help guide ships into the harbor.
In the early 20th century, the hamlet began to decline in population as many of its residents moved away to larger cities. However, in the late 20th century, the hamlet began to experience a resurgence in population as people began to move back to the area.
Geography
Verplanck is located on the east bank of the Hudson River, about 25 miles north of New York City. The hamlet is situated on a peninsula, with the Hudson River to the west and the Croton River to the east. The hamlet is bordered by the towns of Cortlandt to the north, Peekskill to the south, and Croton-on-Hudson to the east.
The hamlet is home to a variety of natural features, including the Verplanck Point Lighthouse, which was built in 1855. The hamlet is also home to a variety of parks and recreational areas, including the Verplanck Nature Preserve, which is a popular spot for bird watching and hiking.
Economy
Verplanck is primarily a residential community, with most of its residents commuting to nearby cities for work. The hamlet is home to a variety of small businesses, including restaurants, shops, and services. The hamlet is also home to a number of marinas, which provide services to boaters and fishermen.
Demographics
As of the 2010 census, the population of Verplanck was 1,000. The racial makeup of the hamlet was 94.2% White, 1.7% African American, 0.2% Native American, 0.7% Asian, 0.1% Pacific Islander, and 2.2% from other races. The median household income was $68,750, and the median family income was $76,250. The per capita income was $30,945.
Verplanck is a small, close-knit community with a strong sense of community and pride. The hamlet is home to a variety of churches, schools, and other organizations, which help to foster a sense of community and provide a variety of services to its residents.
Common Questions
What is Per Capita Income in Verplanck?
Per Capita income in Verplanck is $43,331.
What is the Median Family Income in Verplanck?
Median Family Income in Verplanck is $93,147.
What is the Median Household income in Verplanck?
Median Household Income in Verplanck is $70,833.
What is Income or Wage Gap in Verplanck?
Income or Wage Gap in Verplanck is 8.1%.
Women in Verplanck earn 91.9 cents for every dollar earned by a man.
What is Inequality or Gini Index in Verplanck?
Inequality or Gini Index in Verplanck is 0.40.
What is the Total Population of Verplanck?
Total Population of Verplanck is 796.
What is the Total Male Population of Verplanck?
Total Male Population of Verplanck is 501.
What is the Total Female Population of Verplanck?
Total Female Population of Verplanck is 295.
What is the Ratio of Males per 100 Females in Verplanck?
There are 169.83 Males per 100 Females in Verplanck.
What is the Ratio of Females per 100 Males in Verplanck?
There are 58.88 Females per 100 Males in Verplanck.
What is the Median Population Age in Verplanck?
Median Population Age in Verplanck is 42.9 Years.
What is the Average Family Size in Verplanck
Average Family Size in Verplanck is 3.1 People.
What is the Average Household Size in Verplanck
Average Household Size in Verplanck is 2.2 People.
How Large is the Labor Force in Verplanck?
There are 481 People in the Labor Forcein in Verplanck.
What is the Percentage of People in the Labor Force in Verplanck?
67.0% of People are in the Labor Force in Verplanck.
What is the Unemployment Rate in Verplanck?
Unemployment Rate in Verplanck is 13.3%.