Pomona, NY Map & Demographics
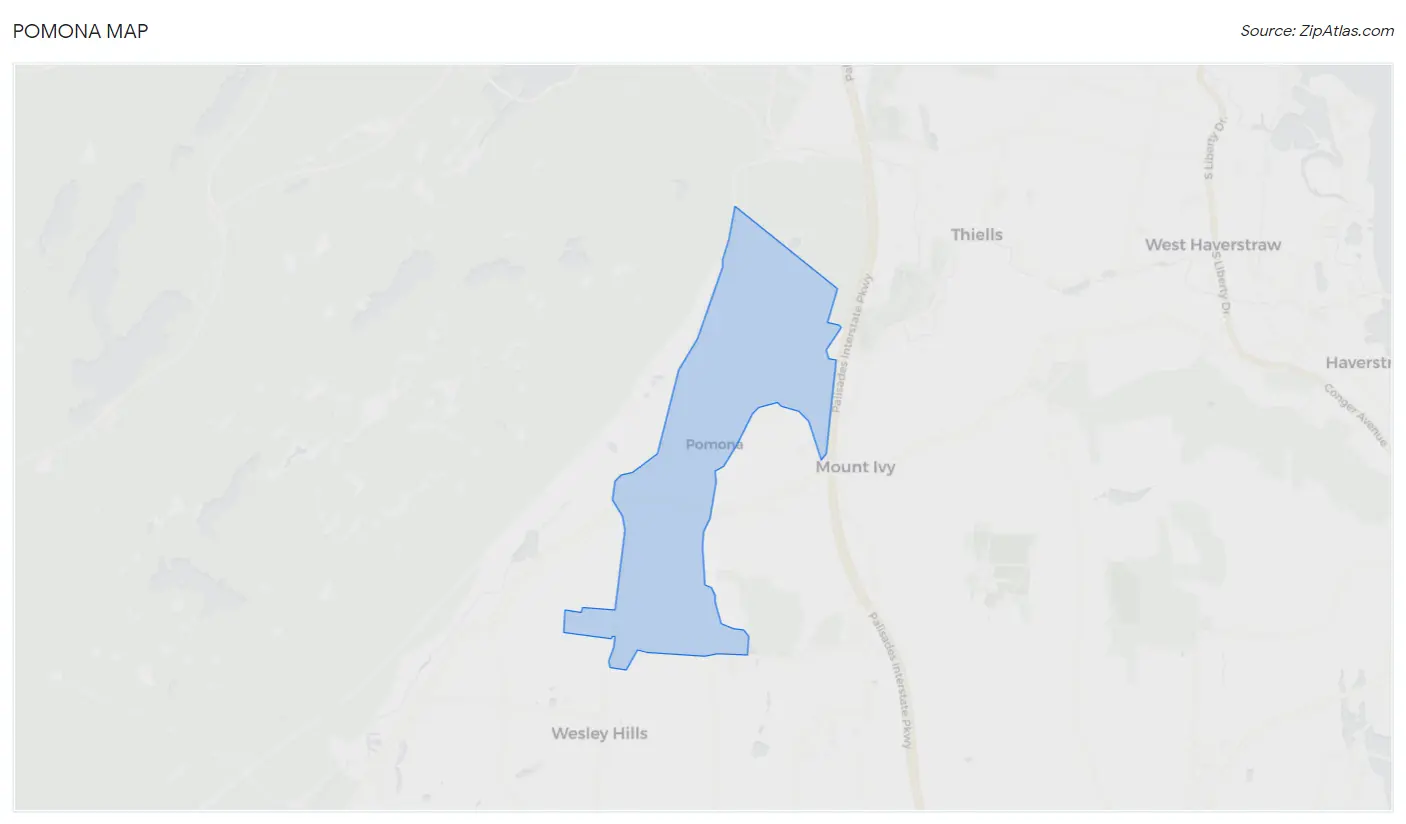
Pomona Map
Pomona Overview
$63,773
PER CAPITA INCOME
$179,667
AVG FAMILY INCOME
$167,740
AVG HOUSEHOLD INCOME
55.3%
WAGE / INCOME GAP [ % ]
44.7¢/ $1
WAGE / INCOME GAP [ $ ]
0.44
INEQUALITY / GINI INDEX
3,837
TOTAL POPULATION
2,008
MALE POPULATION
1,829
FEMALE POPULATION
109.79
MALES / 100 FEMALES
91.09
FEMALES / 100 MALES
32.1
MEDIAN AGE
4.1
AVG FAMILY SIZE
3.6
AVG HOUSEHOLD SIZE
1,829
LABOR FORCE [ PEOPLE ]
64.6%
PERCENT IN LABOR FORCE
8.6%
UNEMPLOYMENT RATE
Pomona Zip Codes
Pomona Area Codes
Income in Pomona
Income Overview in Pomona
Per Capita Income in Pomona is $63,773, while median incomes of families and households are $179,667 and $167,740 respectively.
| Characteristic | Number | Measure |
| Per Capita Income | 3,837 | $63,773 |
| Median Family Income | 864 | $179,667 |
| Mean Family Income | 864 | $250,783 |
| Median Household Income | 1,053 | $167,740 |
| Mean Household Income | 1,053 | $225,254 |
| Income Deficit | 864 | $0 |
| Wage / Income Gap (%) | 3,837 | 55.31% |
| Wage / Income Gap ($) | 3,837 | 44.69¢ per $1 |
| Gini / Inequality Index | 3,837 | 0.44 |
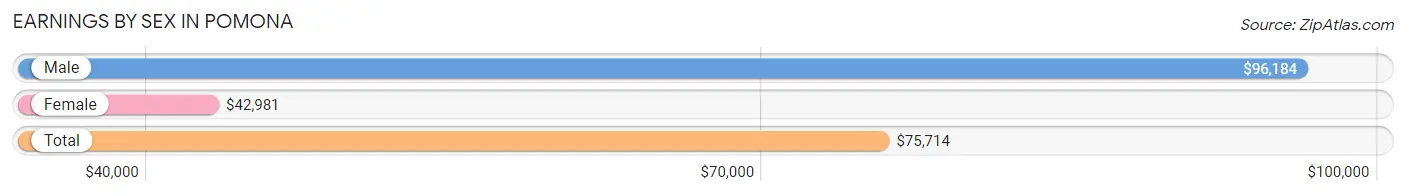
Earnings by Sex in Pomona
Average Earnings in Pomona are $75,714, $96,184 for men and $42,981 for women, a difference of 55.3%.
| Sex | Number | Average Earnings |
| Male | 1,058 (59.0%) | $96,184 |
| Female | 734 (41.0%) | $42,981 |
| Total | 1,792 (100.0%) | $75,714 |
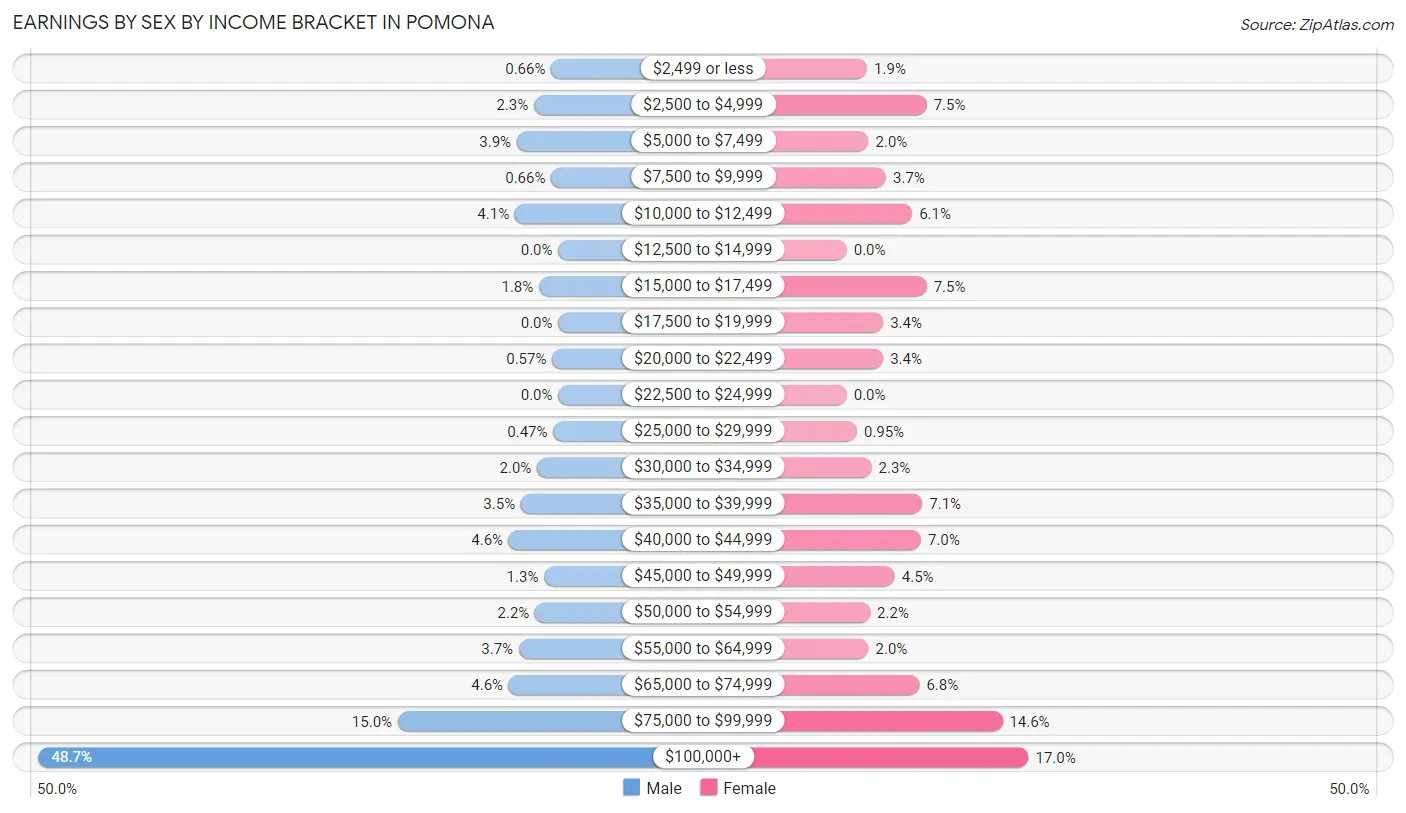
Earnings by Sex by Income Bracket in Pomona
The most common earnings brackets in Pomona are $100,000+ for men (515 | 48.7%) and $100,000+ for women (125 | 17.0%).
| Income | Male | Female |
| $2,499 or less | 7 (0.7%) | 14 (1.9%) |
| $2,500 to $4,999 | 24 (2.3%) | 55 (7.5%) |
| $5,000 to $7,499 | 41 (3.9%) | 15 (2.0%) |
| $7,500 to $9,999 | 7 (0.7%) | 27 (3.7%) |
| $10,000 to $12,499 | 43 (4.1%) | 45 (6.1%) |
| $12,500 to $14,999 | 0 (0.0%) | 0 (0.0%) |
| $15,000 to $17,499 | 19 (1.8%) | 55 (7.5%) |
| $17,500 to $19,999 | 0 (0.0%) | 25 (3.4%) |
| $20,000 to $22,499 | 6 (0.6%) | 25 (3.4%) |
| $22,500 to $24,999 | 0 (0.0%) | 0 (0.0%) |
| $25,000 to $29,999 | 5 (0.5%) | 7 (0.9%) |
| $30,000 to $34,999 | 21 (2.0%) | 17 (2.3%) |
| $35,000 to $39,999 | 37 (3.5%) | 52 (7.1%) |
| $40,000 to $44,999 | 49 (4.6%) | 51 (7.0%) |
| $45,000 to $49,999 | 14 (1.3%) | 33 (4.5%) |
| $50,000 to $54,999 | 23 (2.2%) | 16 (2.2%) |
| $55,000 to $64,999 | 39 (3.7%) | 15 (2.0%) |
| $65,000 to $74,999 | 49 (4.6%) | 50 (6.8%) |
| $75,000 to $99,999 | 159 (15.0%) | 107 (14.6%) |
| $100,000+ | 515 (48.7%) | 125 (17.0%) |
| Total | 1,058 (100.0%) | 734 (100.0%) |
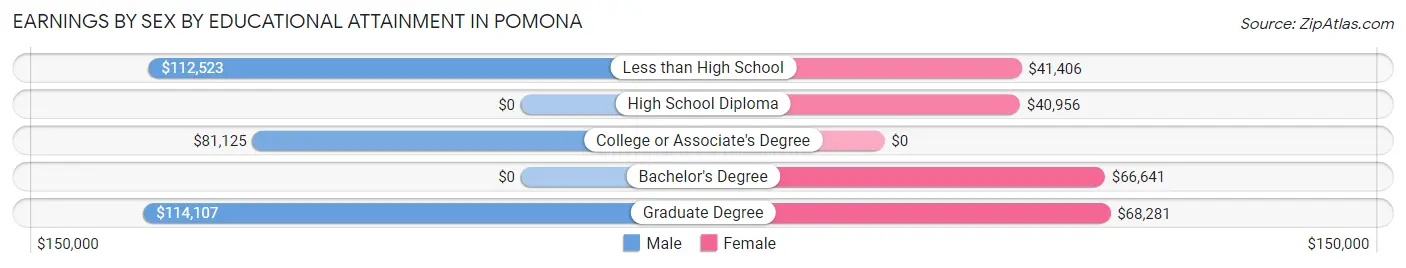
Earnings by Sex by Educational Attainment in Pomona
Average earnings in Pomona are $97,039 for men and $52,361 for women, a difference of 46.0%. Men with an educational attainment of graduate degree enjoy the highest average annual earnings of $114,107, while those with college or associate's degree education earn the least with $81,125. Women with an educational attainment of graduate degree earn the most with the average annual earnings of $68,281, while those with high school diploma education have the smallest earnings of $40,956.
| Educational Attainment | Male Income | Female Income |
| Less than High School | $112,523 | $41,406 |
| High School Diploma | - | - |
| College or Associate's Degree | $81,125 | $0 |
| Bachelor's Degree | - | - |
| Graduate Degree | $114,107 | $68,281 |
| Total | $97,039 | $52,361 |
Family Income in Pomona
Family Income Brackets in Pomona
According to the Pomona family income data, there are 399 families falling into the $200,000+ income range, which is the most common income bracket and makes up 46.2% of all families.
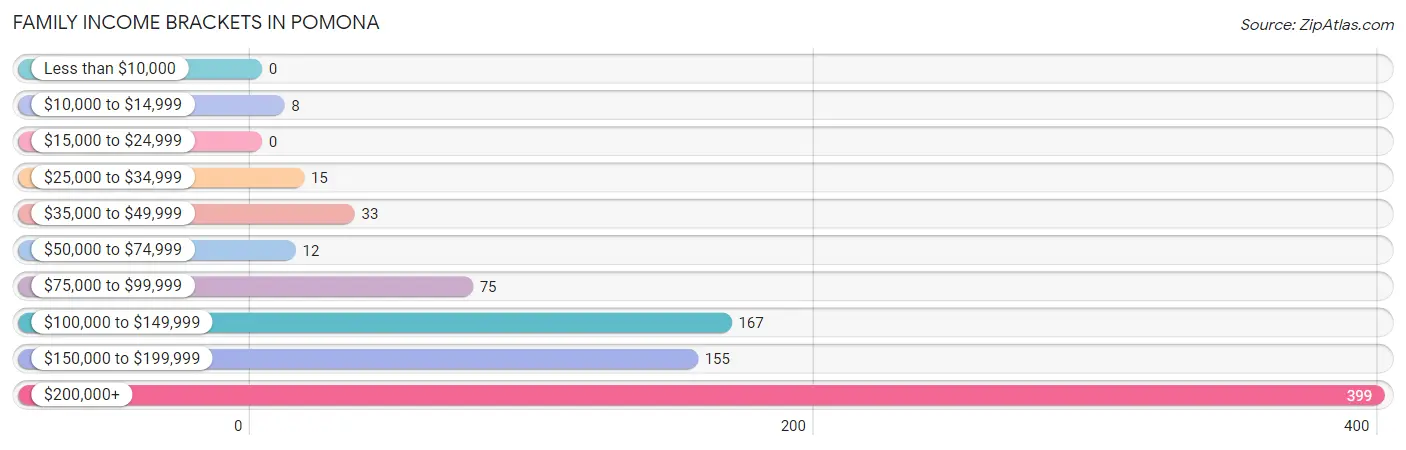
| Income Bracket | # Families | % Families |
| Less than $10,000 | 0 | 0.0% |
| $10,000 to $14,999 | 8 | 0.9% |
| $15,000 to $24,999 | 0 | 0.0% |
| $25,000 to $34,999 | 15 | 1.7% |
| $35,000 to $49,999 | 33 | 3.8% |
| $50,000 to $74,999 | 12 | 1.4% |
| $75,000 to $99,999 | 75 | 8.7% |
| $100,000 to $149,999 | 167 | 19.3% |
| $150,000 to $199,999 | 155 | 17.9% |
| $200,000+ | 399 | 46.2% |
Family Income by Famaliy Size in Pomona
5-person families (98 | 11.3%) account for the highest median family income in Pomona with $250,001 per family, while 2-person families (246 | 28.5%) have the highest median income of $81,094 per family member.
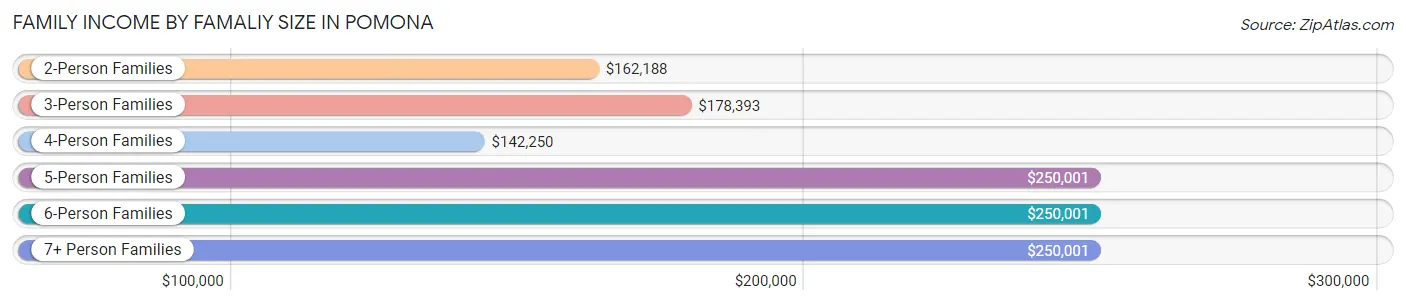
| Income Bracket | # Families | Median Income |
| 2-Person Families | 246 (28.5%) | $162,188 |
| 3-Person Families | 179 (20.7%) | $178,393 |
| 4-Person Families | 207 (24.0%) | $142,250 |
| 5-Person Families | 98 (11.3%) | $250,001 |
| 6-Person Families | 66 (7.6%) | $250,001 |
| 7+ Person Families | 68 (7.9%) | $250,001 |
| Total | 864 (100.0%) | $179,667 |
Family Income by Number of Earners in Pomona
The median family income in Pomona is $179,667, with families comprising 3+ earners (191) having the highest median family income of $250,001, while families with no earners (89) have the lowest median family income of $130,568, accounting for 22.1% and 10.3% of families, respectively.
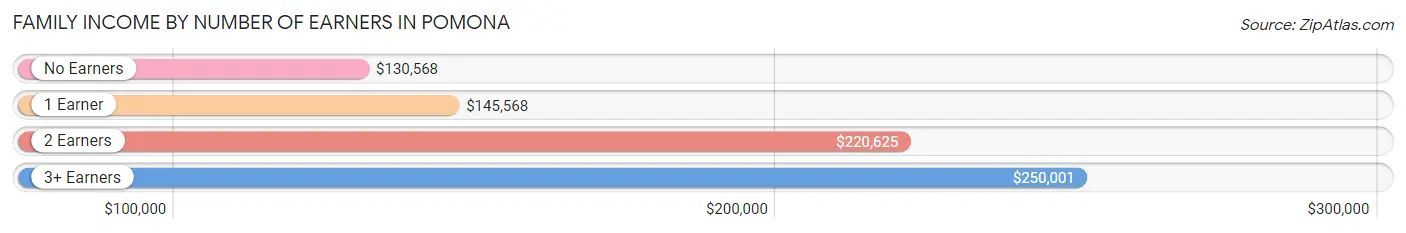
| Number of Earners | # Families | Median Income |
| No Earners | 89 (10.3%) | $130,568 |
| 1 Earner | 305 (35.3%) | $145,568 |
| 2 Earners | 279 (32.3%) | $220,625 |
| 3+ Earners | 191 (22.1%) | $250,001 |
| Total | 864 (100.0%) | $179,667 |
Household Income in Pomona
Household Income Brackets in Pomona
With 438 households falling in the category, the $200,000+ income range is the most frequent in Pomona, accounting for 41.6% of all households. In contrast, only 6 households (0.6%) fall into the $15,000 to $24,999 income bracket, making it the least populous group.
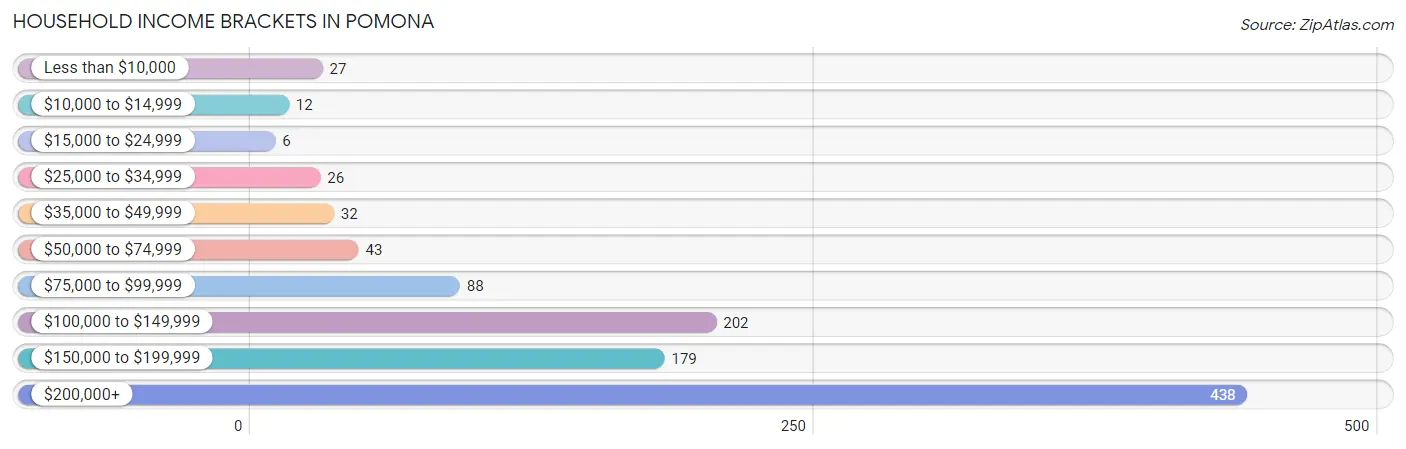
| Income Bracket | # Households | % Households |
| Less than $10,000 | 27 | 2.6% |
| $10,000 to $14,999 | 12 | 1.1% |
| $15,000 to $24,999 | 6 | 0.6% |
| $25,000 to $34,999 | 26 | 2.5% |
| $35,000 to $49,999 | 32 | 3.0% |
| $50,000 to $74,999 | 43 | 4.1% |
| $75,000 to $99,999 | 88 | 8.4% |
| $100,000 to $149,999 | 202 | 19.2% |
| $150,000 to $199,999 | 179 | 17.0% |
| $200,000+ | 438 | 41.6% |
Household Income by Householder Age in Pomona
The median household income in Pomona is $167,740, with the highest median household income of $185,750 found in the 45 to 64 years age bracket for the primary householder. A total of 441 households (41.9%) fall into this category.
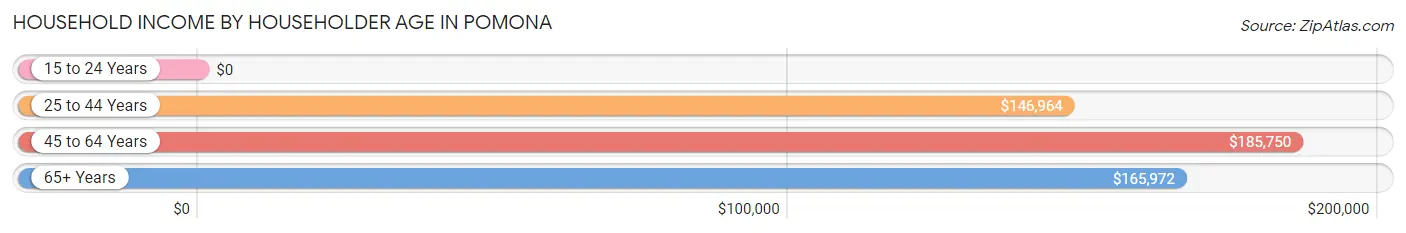
| Income Bracket | # Households | Median Income |
| 15 to 24 Years | 0 (0.0%) | $0 |
| 25 to 44 Years | 275 (26.1%) | $146,964 |
| 45 to 64 Years | 441 (41.9%) | $185,750 |
| 65+ Years | 337 (32.0%) | $165,972 |
| Total | 1,053 (100.0%) | $167,740 |
Poverty in Pomona
Income Below Poverty by Sex and Age in Pomona
With 1.9% poverty level for males and 2.6% for females among the residents of Pomona, 45 to 54 year old males and 55 to 64 year old females are the most vulnerable to poverty, with 11 males (5.7%) and 30 females (12.0%) in their respective age groups living below the poverty level.
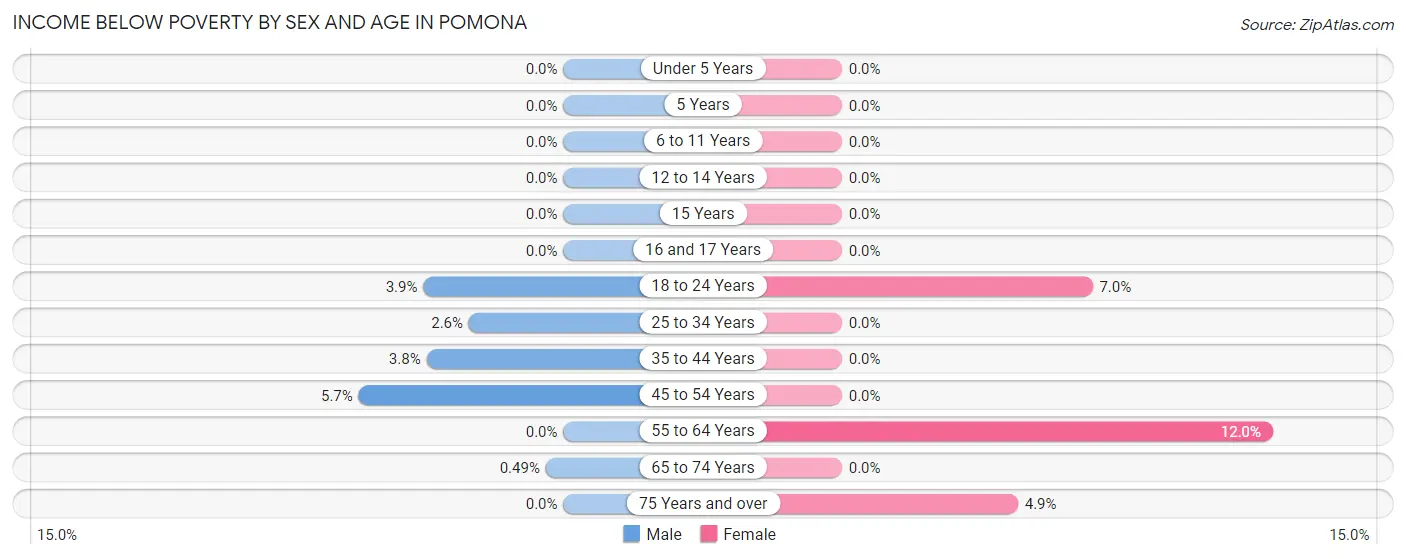
| Age Bracket | Male | Female |
| Under 5 Years | 0 (0.0%) | 0 (0.0%) |
| 5 Years | 0 (0.0%) | 0 (0.0%) |
| 6 to 11 Years | 0 (0.0%) | 0 (0.0%) |
| 12 to 14 Years | 0 (0.0%) | 0 (0.0%) |
| 15 Years | 0 (0.0%) | 0 (0.0%) |
| 16 and 17 Years | 0 (0.0%) | 0 (0.0%) |
| 18 to 24 Years | 11 (3.9%) | 12 (7.0%) |
| 25 to 34 Years | 7 (2.6%) | 0 (0.0%) |
| 35 to 44 Years | 8 (3.8%) | 0 (0.0%) |
| 45 to 54 Years | 11 (5.7%) | 0 (0.0%) |
| 55 to 64 Years | 0 (0.0%) | 30 (12.0%) |
| 65 to 74 Years | 1 (0.5%) | 0 (0.0%) |
| 75 Years and over | 0 (0.0%) | 5 (4.9%) |
| Total | 38 (1.9%) | 47 (2.6%) |
Income Above Poverty by Sex and Age in Pomona
According to the poverty statistics in Pomona, males aged under 5 years and females aged under 5 years are the age groups that are most secure financially, with 100.0% of males and 100.0% of females in these age groups living above the poverty line.
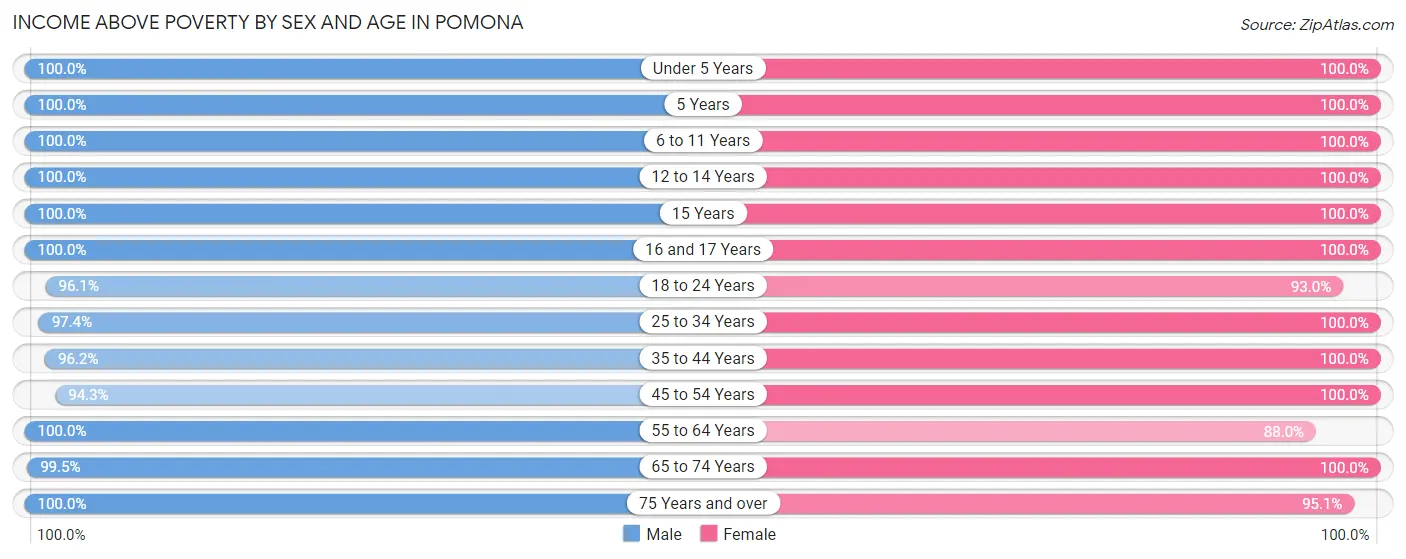
| Age Bracket | Male | Female |
| Under 5 Years | 173 (100.0%) | 153 (100.0%) |
| 5 Years | 9 (100.0%) | 19 (100.0%) |
| 6 to 11 Years | 251 (100.0%) | 241 (100.0%) |
| 12 to 14 Years | 53 (100.0%) | 64 (100.0%) |
| 15 Years | 22 (100.0%) | 21 (100.0%) |
| 16 and 17 Years | 25 (100.0%) | 19 (100.0%) |
| 18 to 24 Years | 271 (96.1%) | 160 (93.0%) |
| 25 to 34 Years | 259 (97.4%) | 301 (100.0%) |
| 35 to 44 Years | 202 (96.2%) | 166 (100.0%) |
| 45 to 54 Years | 182 (94.3%) | 125 (100.0%) |
| 55 to 64 Years | 173 (100.0%) | 220 (88.0%) |
| 65 to 74 Years | 203 (99.5%) | 189 (100.0%) |
| 75 Years and over | 147 (100.0%) | 97 (95.1%) |
| Total | 1,970 (98.1%) | 1,775 (97.4%) |
Income Below Poverty Among Married-Couple Families in Pomona
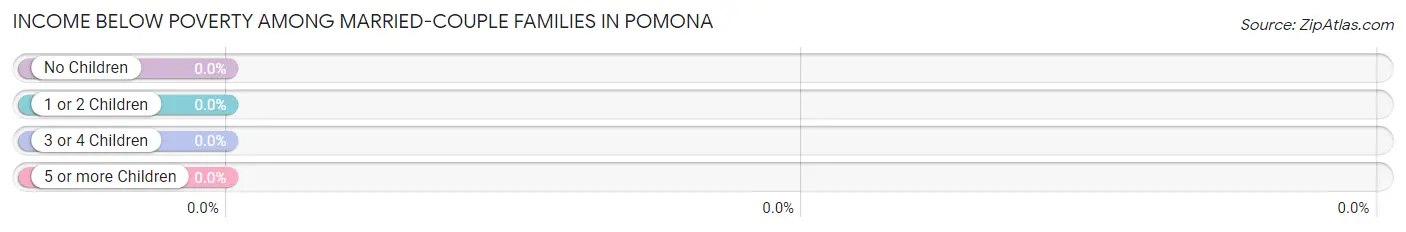
| Children | Above Poverty | Below Poverty |
| No Children | 448 (100.0%) | 0 (0.0%) |
| 1 or 2 Children | 237 (100.0%) | 0 (0.0%) |
| 3 or 4 Children | 110 (100.0%) | 0 (0.0%) |
| 5 or more Children | 14 (100.0%) | 0 (0.0%) |
| Total | 809 (100.0%) | 0 (0.0%) |
Income Below Poverty Among Single-Parent Households in Pomona
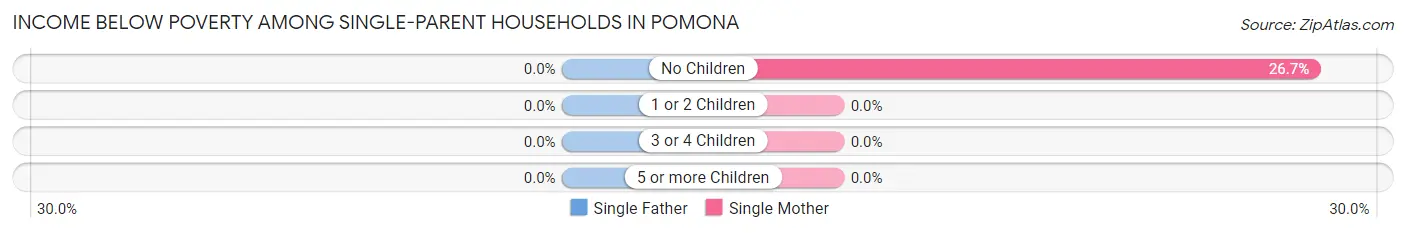
| Children | Single Father | Single Mother |
| No Children | 0 (0.0%) | 8 (26.7%) |
| 1 or 2 Children | 0 (0.0%) | 0 (0.0%) |
| 3 or 4 Children | 0 (0.0%) | 0 (0.0%) |
| 5 or more Children | 0 (0.0%) | 0 (0.0%) |
| Total | 0 (0.0%) | 8 (22.2%) |
Income Below Poverty Among Married-Couple vs Single-Parent Households in Pomona
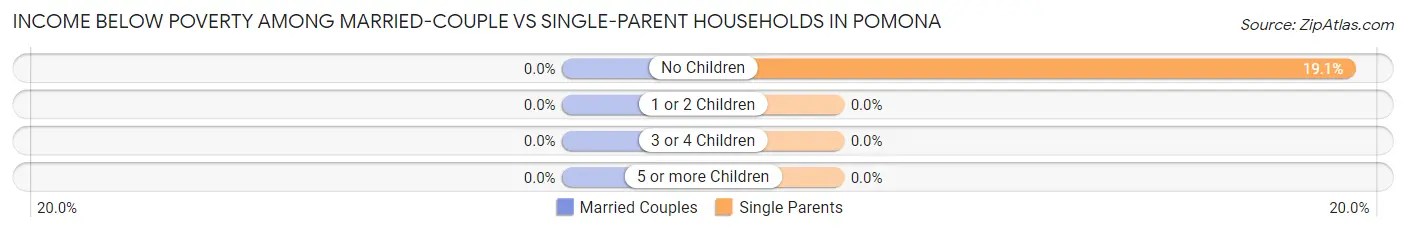
| Children | Married-Couple Families | Single-Parent Households |
| No Children | 0 (0.0%) | 8 (19.1%) |
| 1 or 2 Children | 0 (0.0%) | 0 (0.0%) |
| 3 or 4 Children | 0 (0.0%) | 0 (0.0%) |
| 5 or more Children | 0 (0.0%) | 0 (0.0%) |
| Total | 0 (0.0%) | 8 (14.5%) |
Race in Pomona
The most populous races in Pomona are White / Caucasian (2,390 | 62.3%), Asian (737 | 19.2%), and Black / African American (425 | 11.1%).
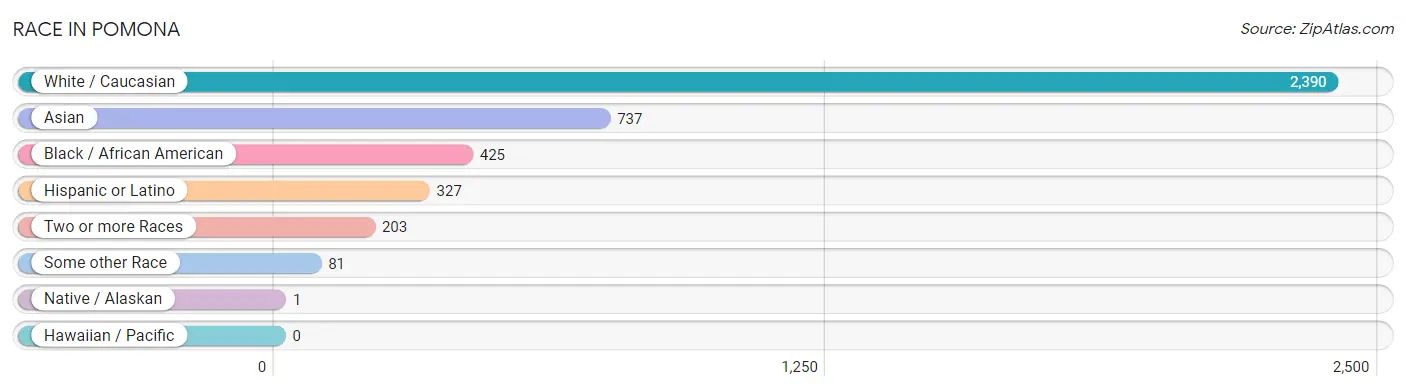
| Race | # Population | % Population |
| Asian | 737 | 19.2% |
| Black / African American | 425 | 11.1% |
| Hawaiian / Pacific | 0 | 0.0% |
| Hispanic or Latino | 327 | 8.5% |
| Native / Alaskan | 1 | 0.0% |
| White / Caucasian | 2,390 | 62.3% |
| Two or more Races | 203 | 5.3% |
| Some other Race | 81 | 2.1% |
| Total | 3,837 | 100.0% |
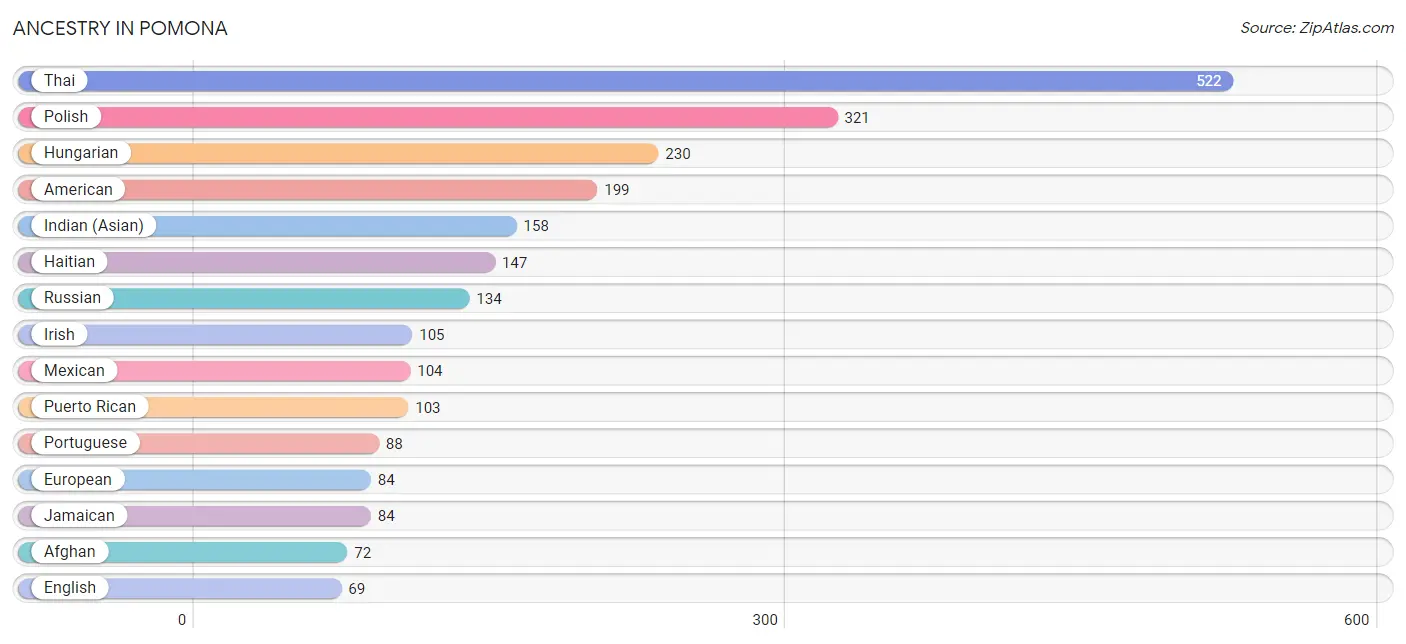
Ancestry in Pomona
The most populous ancestries reported in Pomona are Thai (522 | 13.6%), Polish (321 | 8.4%), Hungarian (230 | 6.0%), American (199 | 5.2%), and Indian (Asian) (158 | 4.1%), together accounting for 37.3% of all Pomona residents.
| Ancestry | # Population | % Population |
| Afghan | 72 | 1.9% |
| African | 17 | 0.4% |
| American | 199 | 5.2% |
| Armenian | 4 | 0.1% |
| Australian | 7 | 0.2% |
| Austrian | 40 | 1.0% |
| Blackfeet | 1 | 0.0% |
| British West Indian | 8 | 0.2% |
| Central American | 64 | 1.7% |
| Cherokee | 3 | 0.1% |
| Czech | 6 | 0.2% |
| Czechoslovakian | 4 | 0.1% |
| Dutch | 13 | 0.3% |
| Eastern European | 42 | 1.1% |
| English | 69 | 1.8% |
| European | 84 | 2.2% |
| French | 10 | 0.3% |
| German | 63 | 1.6% |
| Greek | 36 | 0.9% |
| Haitian | 147 | 3.8% |
| Hungarian | 230 | 6.0% |
| Indian (Asian) | 158 | 4.1% |
| Iranian | 34 | 0.9% |
| Irish | 105 | 2.7% |
| Iroquois | 1 | 0.0% |
| Israeli | 33 | 0.9% |
| Italian | 62 | 1.6% |
| Jamaican | 84 | 2.2% |
| Korean | 4 | 0.1% |
| Lithuanian | 11 | 0.3% |
| Mexican | 104 | 2.7% |
| Nigerian | 22 | 0.6% |
| Norwegian | 6 | 0.2% |
| Peruvian | 3 | 0.1% |
| Polish | 321 | 8.4% |
| Portuguese | 88 | 2.3% |
| Puerto Rican | 103 | 2.7% |
| Russian | 134 | 3.5% |
| Salvadoran | 64 | 1.7% |
| Scottish | 5 | 0.1% |
| South American | 8 | 0.2% |
| Spaniard | 20 | 0.5% |
| Subsaharan African | 39 | 1.0% |
| Swedish | 8 | 0.2% |
| Thai | 522 | 13.6% |
| Trinidadian and Tobagonian | 30 | 0.8% |
| Turkish | 11 | 0.3% |
| Ukrainian | 10 | 0.3% |
| Uruguayan | 5 | 0.1% |
| Vietnamese | 19 | 0.5% | View All 50 Rows |
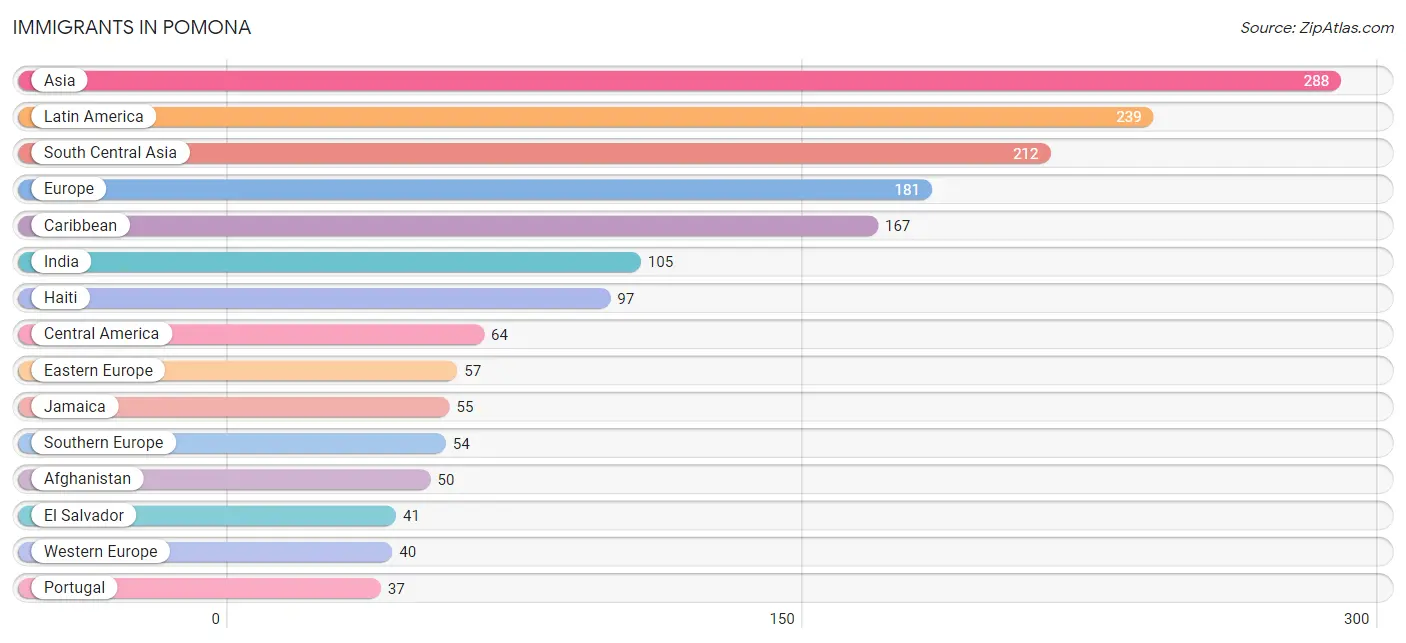
Immigrants in Pomona
The most numerous immigrant groups reported in Pomona came from Asia (288 | 7.5%), Latin America (239 | 6.2%), South Central Asia (212 | 5.5%), Europe (181 | 4.7%), and Caribbean (167 | 4.3%), together accounting for 28.3% of all Pomona residents.
| Immigration Origin | # Population | % Population |
| Afghanistan | 50 | 1.3% |
| Africa | 30 | 0.8% |
| Asia | 288 | 7.5% |
| Australia | 15 | 0.4% |
| Bangladesh | 19 | 0.5% |
| Belarus | 5 | 0.1% |
| Belgium | 7 | 0.2% |
| Canada | 5 | 0.1% |
| Caribbean | 167 | 4.3% |
| Central America | 64 | 1.7% |
| China | 33 | 0.9% |
| Eastern Asia | 33 | 0.9% |
| Eastern Europe | 57 | 1.5% |
| El Salvador | 41 | 1.1% |
| England | 3 | 0.1% |
| Europe | 181 | 4.7% |
| France | 22 | 0.6% |
| Germany | 11 | 0.3% |
| Greece | 17 | 0.4% |
| Haiti | 97 | 2.5% |
| India | 105 | 2.7% |
| Iran | 34 | 0.9% |
| Ireland | 11 | 0.3% |
| Israel | 23 | 0.6% |
| Jamaica | 55 | 1.4% |
| Kazakhstan | 4 | 0.1% |
| Latin America | 239 | 6.2% |
| Malaysia | 9 | 0.2% |
| Mexico | 23 | 0.6% |
| Nigeria | 10 | 0.3% |
| Northern Europe | 30 | 0.8% |
| Norway | 6 | 0.2% |
| Oceania | 15 | 0.4% |
| Peru | 3 | 0.1% |
| Poland | 10 | 0.3% |
| Portugal | 37 | 1.0% |
| Russia | 28 | 0.7% |
| South Africa | 20 | 0.5% |
| South America | 8 | 0.2% |
| South Central Asia | 212 | 5.5% |
| South Eastern Asia | 9 | 0.2% |
| Southern Europe | 54 | 1.4% |
| Trinidad and Tobago | 15 | 0.4% |
| Turkey | 11 | 0.3% |
| Ukraine | 10 | 0.3% |
| Uruguay | 5 | 0.1% |
| Western Africa | 10 | 0.3% |
| Western Asia | 34 | 0.9% |
| Western Europe | 40 | 1.0% | View All 49 Rows |
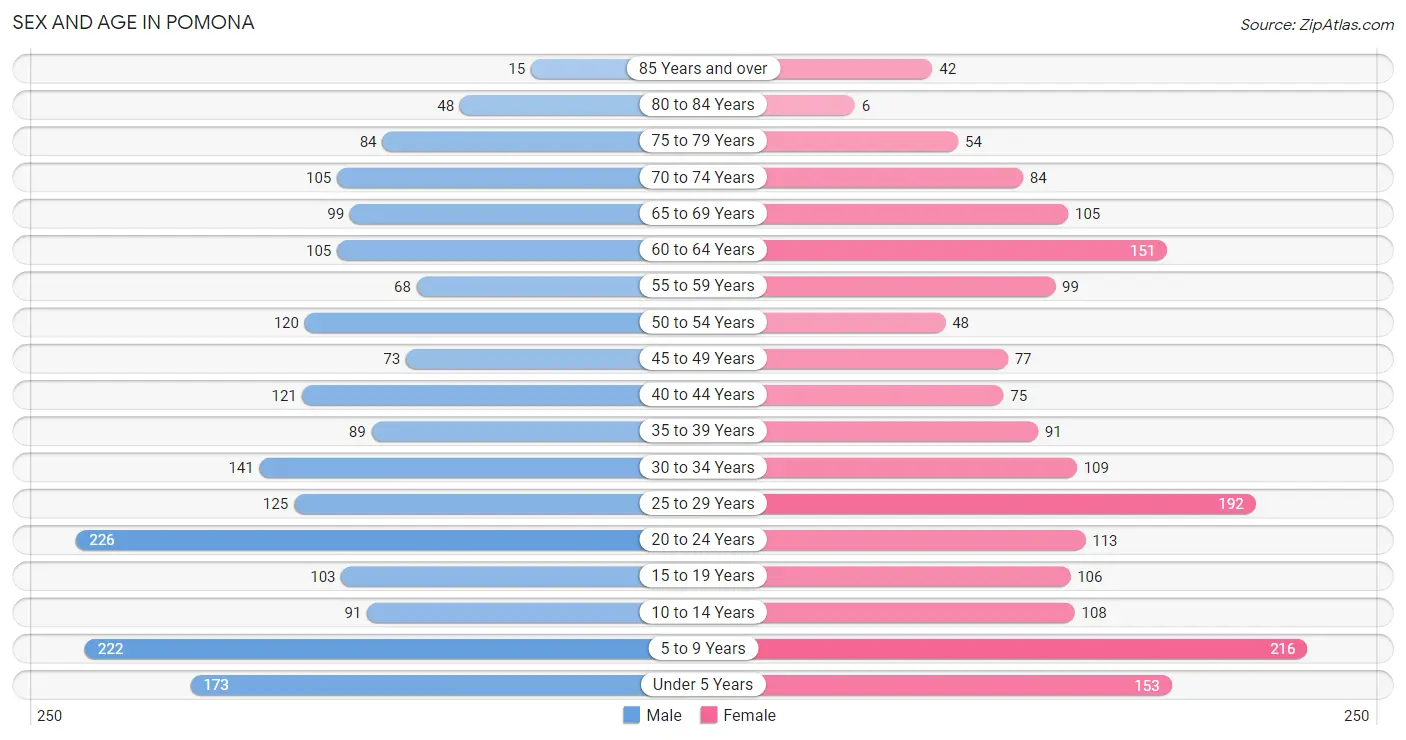
Sex and Age in Pomona
Sex and Age in Pomona
The most populous age groups in Pomona are 20 to 24 Years (226 | 11.3%) for men and 5 to 9 Years (216 | 11.8%) for women.
| Age Bracket | Male | Female |
| Under 5 Years | 173 (8.6%) | 153 (8.4%) |
| 5 to 9 Years | 222 (11.1%) | 216 (11.8%) |
| 10 to 14 Years | 91 (4.5%) | 108 (5.9%) |
| 15 to 19 Years | 103 (5.1%) | 106 (5.8%) |
| 20 to 24 Years | 226 (11.3%) | 113 (6.2%) |
| 25 to 29 Years | 125 (6.2%) | 192 (10.5%) |
| 30 to 34 Years | 141 (7.0%) | 109 (6.0%) |
| 35 to 39 Years | 89 (4.4%) | 91 (5.0%) |
| 40 to 44 Years | 121 (6.0%) | 75 (4.1%) |
| 45 to 49 Years | 73 (3.6%) | 77 (4.2%) |
| 50 to 54 Years | 120 (6.0%) | 48 (2.6%) |
| 55 to 59 Years | 68 (3.4%) | 99 (5.4%) |
| 60 to 64 Years | 105 (5.2%) | 151 (8.3%) |
| 65 to 69 Years | 99 (4.9%) | 105 (5.7%) |
| 70 to 74 Years | 105 (5.2%) | 84 (4.6%) |
| 75 to 79 Years | 84 (4.2%) | 54 (2.9%) |
| 80 to 84 Years | 48 (2.4%) | 6 (0.3%) |
| 85 Years and over | 15 (0.7%) | 42 (2.3%) |
| Total | 2,008 (100.0%) | 1,829 (100.0%) |
Families and Households in Pomona
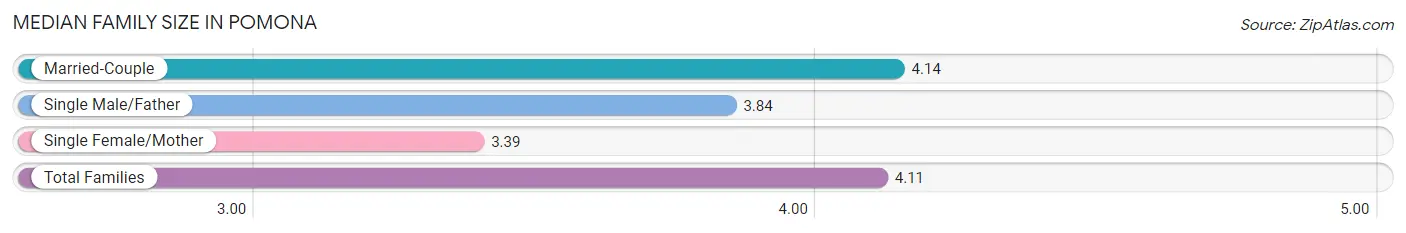
Median Family Size in Pomona
The median family size in Pomona is 4.11 persons per family, with married-couple families (809 | 93.6%) accounting for the largest median family size of 4.14 persons per family. On the other hand, single female/mother families (36 | 4.2%) represent the smallest median family size with 3.39 persons per family.
| Family Type | # Families | Family Size |
| Married-Couple | 809 (93.6%) | 4.14 |
| Single Male/Father | 19 (2.2%) | 3.84 |
| Single Female/Mother | 36 (4.2%) | 3.39 |
| Total Families | 864 (100.0%) | 4.11 |
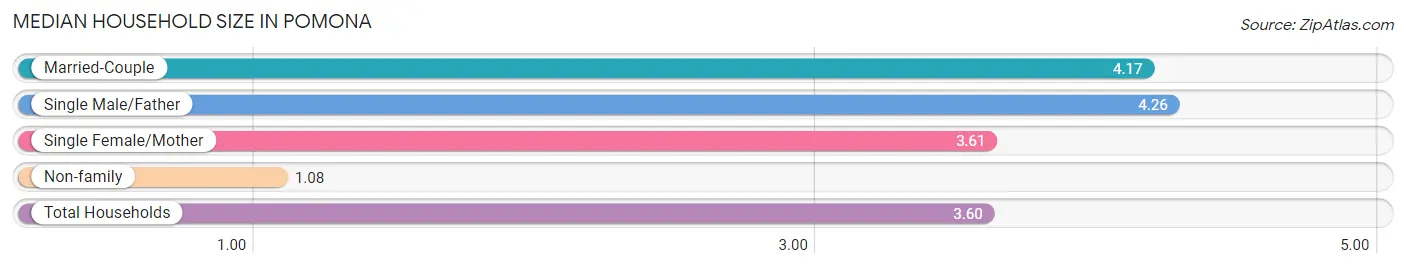
Median Household Size in Pomona
The median household size in Pomona is 3.60 persons per household, with single male/father households (19 | 1.8%) accounting for the largest median household size of 4.26 persons per household. non-family households (189 | 17.9%) represent the smallest median household size with 1.08 persons per household.
| Household Type | # Households | Household Size |
| Married-Couple | 809 (76.8%) | 4.17 |
| Single Male/Father | 19 (1.8%) | 4.26 |
| Single Female/Mother | 36 (3.4%) | 3.61 |
| Non-family | 189 (17.9%) | 1.08 |
| Total Households | 1,053 (100.0%) | 3.60 |
Household Size by Marriage Status in Pomona
Out of a total of 1,053 households in Pomona, 864 (82.1%) are family households, while 189 (17.9%) are nonfamily households. The most numerous type of family households are 2-person households, comprising 246, and the most common type of nonfamily households are 1-person households, comprising 174.
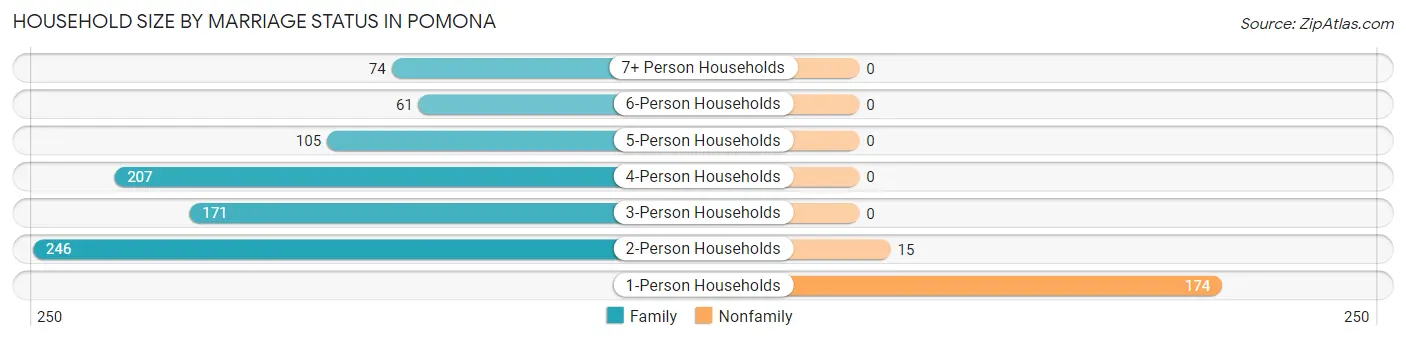
| Household Size | Family Households | Nonfamily Households |
| 1-Person Households | - | 174 (16.5%) |
| 2-Person Households | 246 (23.4%) | 15 (1.4%) |
| 3-Person Households | 171 (16.2%) | 0 (0.0%) |
| 4-Person Households | 207 (19.7%) | 0 (0.0%) |
| 5-Person Households | 105 (10.0%) | 0 (0.0%) |
| 6-Person Households | 61 (5.8%) | 0 (0.0%) |
| 7+ Person Households | 74 (7.0%) | 0 (0.0%) |
| Total | 864 (82.1%) | 189 (17.9%) |
Female Fertility in Pomona
Fertility by Age in Pomona
Average fertility rate in Pomona is 60.0 births per 1,000 women. Women in the age bracket of 20 to 34 years have the highest fertility rate with 70.0 births per 1,000 women. Women in the age bracket of 20 to 34 years acount for 63.0% of all women with births.
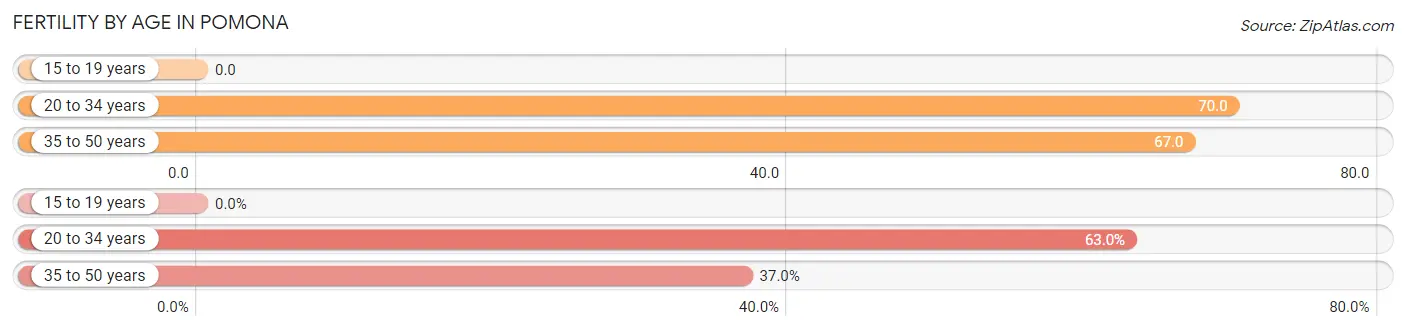
| Age Bracket | Women with Births | Births / 1,000 Women |
| 15 to 19 years | 0 (0.0%) | 0.0 |
| 20 to 34 years | 29 (63.0%) | 70.0 |
| 35 to 50 years | 17 (37.0%) | 67.0 |
| Total | 46 (100.0%) | 60.0 |
Fertility by Age by Marriage Status in Pomona
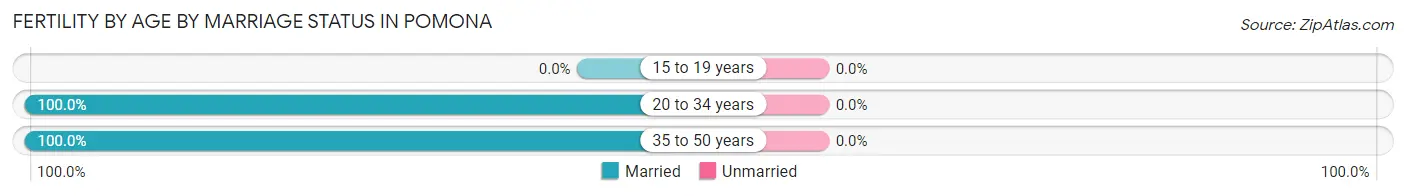
| Age Bracket | Married | Unmarried |
| 15 to 19 years | 0 (0.0%) | 0 (0.0%) |
| 20 to 34 years | 29 (100.0%) | 0 (0.0%) |
| 35 to 50 years | 17 (100.0%) | 0 (0.0%) |
| Total | 46 (100.0%) | 0 (0.0%) |
Fertility by Education in Pomona
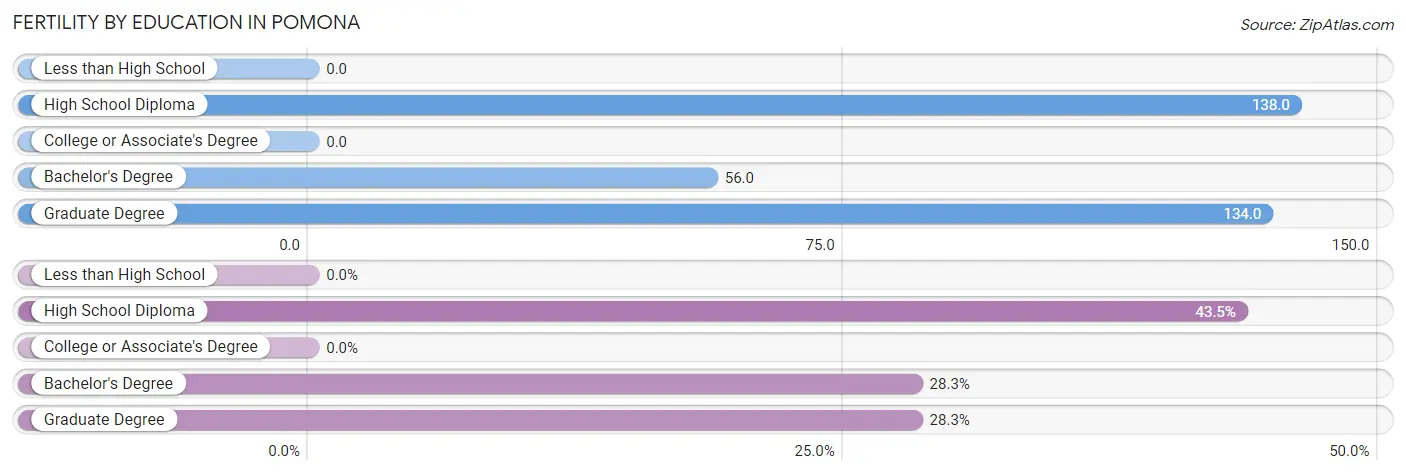
| Educational Attainment | Women with Births | Births / 1,000 Women |
| Less than High School | 0 (0.0%) | 0.0 |
| High School Diploma | 20 (43.5%) | 138.0 |
| College or Associate's Degree | 0 (0.0%) | 0.0 |
| Bachelor's Degree | 13 (28.3%) | 56.0 |
| Graduate Degree | 13 (28.3%) | 134.0 |
| Total | 46 (100.0%) | 60.0 |
Fertility by Education by Marriage Status in Pomona
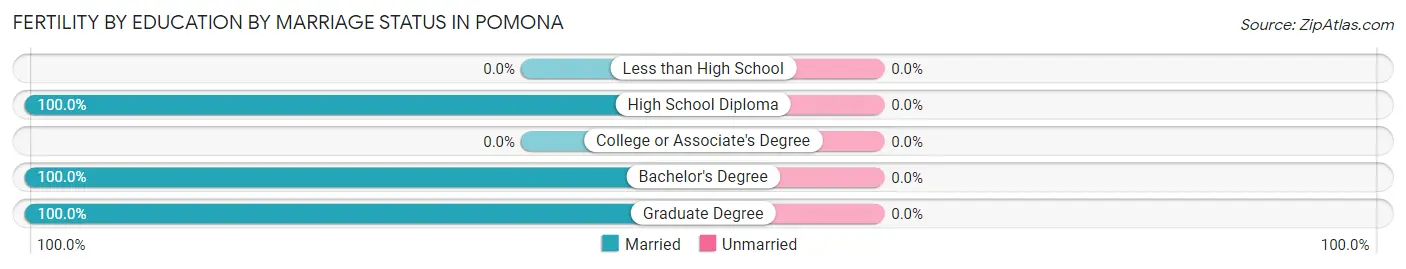
| Educational Attainment | Married | Unmarried |
| Less than High School | 0 (0.0%) | 0 (0.0%) |
| High School Diploma | 20 (100.0%) | 0 (0.0%) |
| College or Associate's Degree | 0 (0.0%) | 0 (0.0%) |
| Bachelor's Degree | 13 (100.0%) | 0 (0.0%) |
| Graduate Degree | 13 (100.0%) | 0 (0.0%) |
| Total | 46 (100.0%) | 0 (0.0%) |
Employment Characteristics in Pomona
Employment by Class of Employer in Pomona
Among the 1,660 employed individuals in Pomona, private company employees (1,044 | 62.9%), not-for-profit organizations (213 | 12.8%), and self-employed (incorporated) (136 | 8.2%) make up the most common classes of employment.
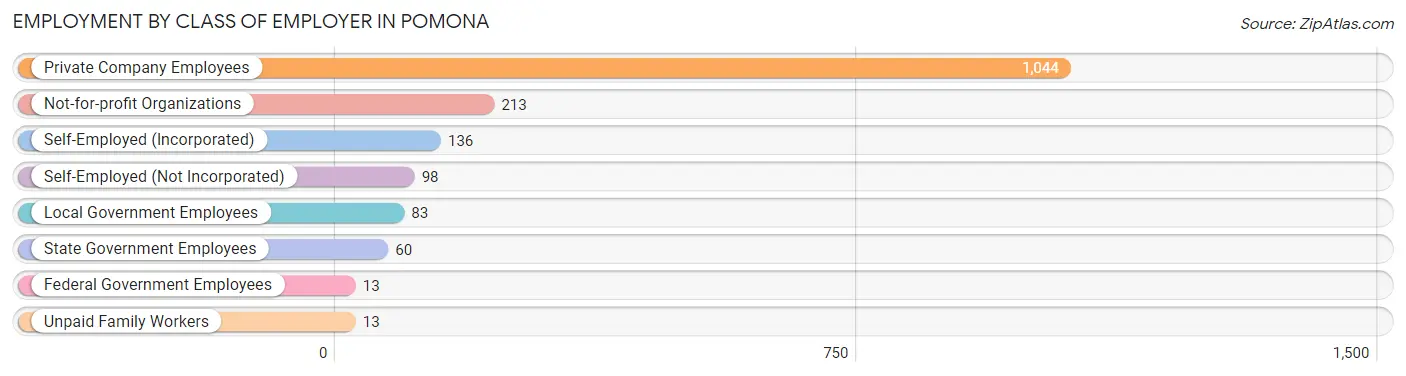
| Employer Class | # Employees | % Employees |
| Private Company Employees | 1,044 | 62.9% |
| Self-Employed (Incorporated) | 136 | 8.2% |
| Self-Employed (Not Incorporated) | 98 | 5.9% |
| Not-for-profit Organizations | 213 | 12.8% |
| Local Government Employees | 83 | 5.0% |
| State Government Employees | 60 | 3.6% |
| Federal Government Employees | 13 | 0.8% |
| Unpaid Family Workers | 13 | 0.8% |
| Total | 1,660 | 100.0% |
Employment Status by Age in Pomona
According to the labor force statistics for Pomona, out of the total population over 16 years of age (2,831), 64.6% or 1,829 individuals are in the labor force, with 8.6% or 157 of them unemployed. The age group with the highest labor force participation rate is 55 to 59 years, with 97.0% or 162 individuals in the labor force. Within the labor force, the 60 to 64 years age range has the highest percentage of unemployed individuals, with 20.9% or 41 of them being unemployed.
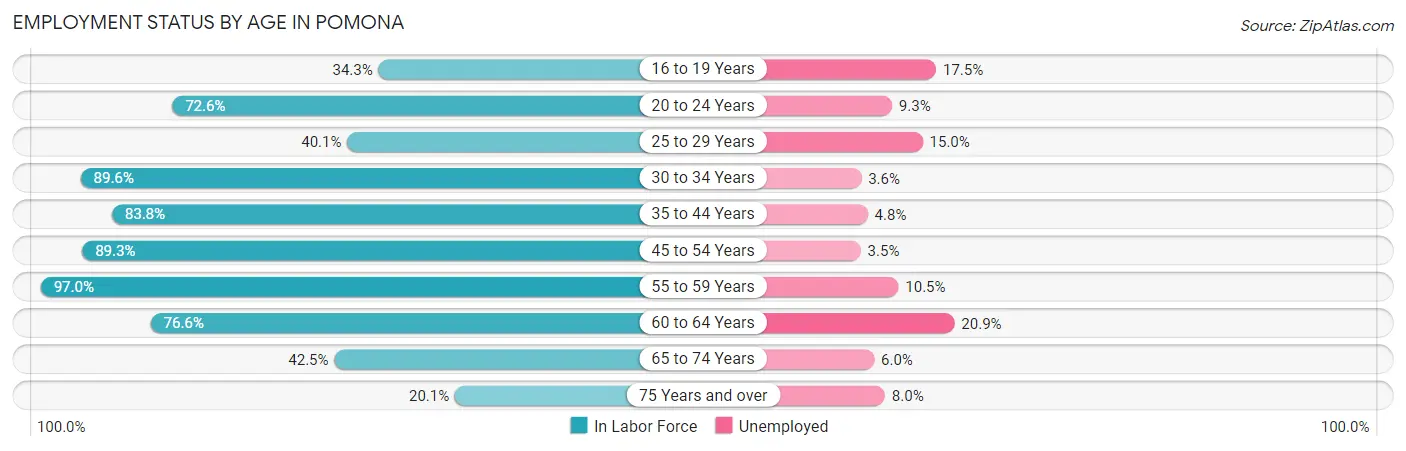
| Age Bracket | In Labor Force | Unemployed |
| 16 to 19 Years | 57 (34.3%) | 10 (17.5%) |
| 20 to 24 Years | 246 (72.6%) | 23 (9.3%) |
| 25 to 29 Years | 127 (40.1%) | 19 (15.0%) |
| 30 to 34 Years | 224 (89.6%) | 8 (3.6%) |
| 35 to 44 Years | 315 (83.8%) | 15 (4.8%) |
| 45 to 54 Years | 284 (89.3%) | 10 (3.5%) |
| 55 to 59 Years | 162 (97.0%) | 17 (10.5%) |
| 60 to 64 Years | 196 (76.6%) | 41 (20.9%) |
| 65 to 74 Years | 167 (42.5%) | 10 (6.0%) |
| 75 Years and over | 50 (20.1%) | 4 (8.0%) |
| Total | 1,829 (64.6%) | 157 (8.6%) |
Employment Status by Educational Attainment in Pomona
According to labor force statistics for Pomona, 77.7% of individuals (1,308) out of the total population between 25 and 64 years of age (1,684) are in the labor force, with 8.4% or 110 of them being unemployed. The group with the highest labor force participation rate are those with the educational attainment of high school diploma, with 87.0% or 168 individuals in the labor force. Within the labor force, individuals with college / associate degree education have the highest percentage of unemployment, with 17.0% or 36 of them being unemployed.
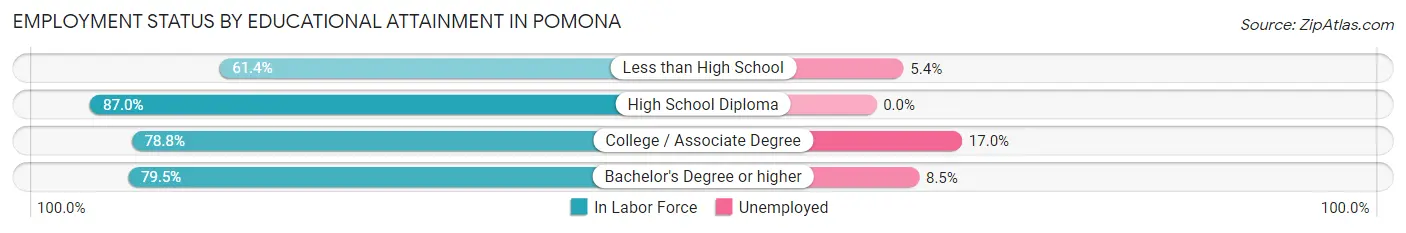
| Educational Attainment | In Labor Force | Unemployed |
| Less than High School | 148 (61.4%) | 13 (5.4%) |
| High School Diploma | 168 (87.0%) | 0 (0.0%) |
| College / Associate Degree | 212 (78.8%) | 46 (17.0%) |
| Bachelor's Degree or higher | 780 (79.5%) | 83 (8.5%) |
| Total | 1,308 (77.7%) | 141 (8.4%) |
Employment Occupations by Sex in Pomona
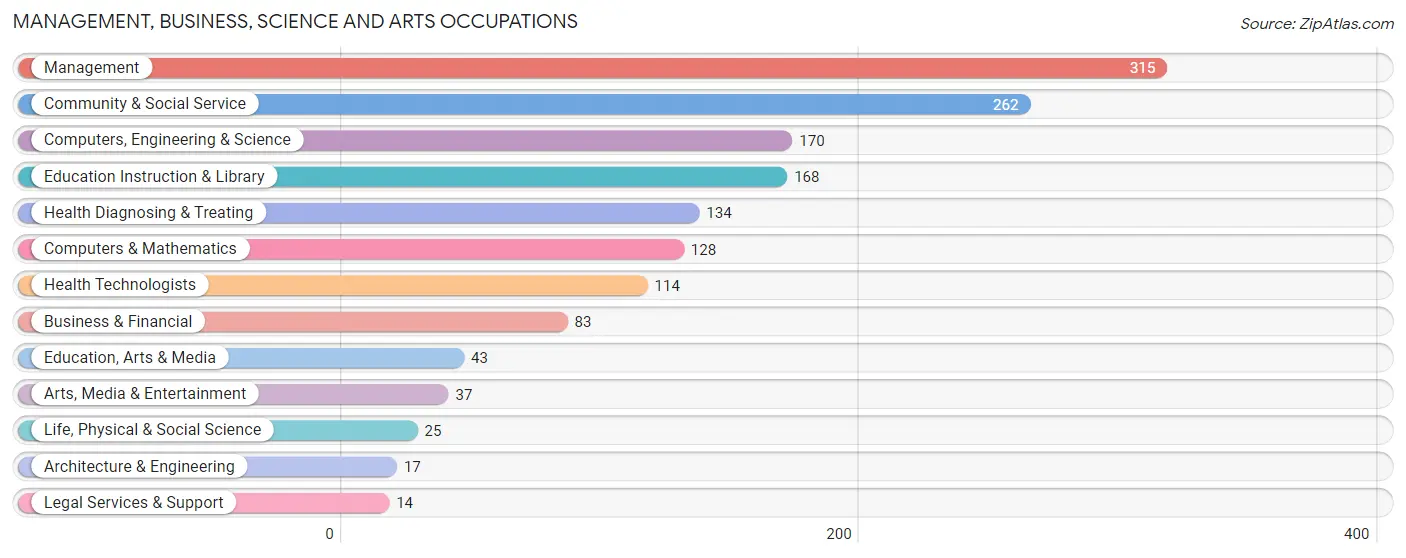
Management, Business, Science and Arts Occupations
The most common Management, Business, Science and Arts occupations in Pomona are Management (315 | 18.9%), Community & Social Service (262 | 15.7%), Computers, Engineering & Science (170 | 10.2%), Education Instruction & Library (168 | 10.1%), and Health Diagnosing & Treating (134 | 8.0%).
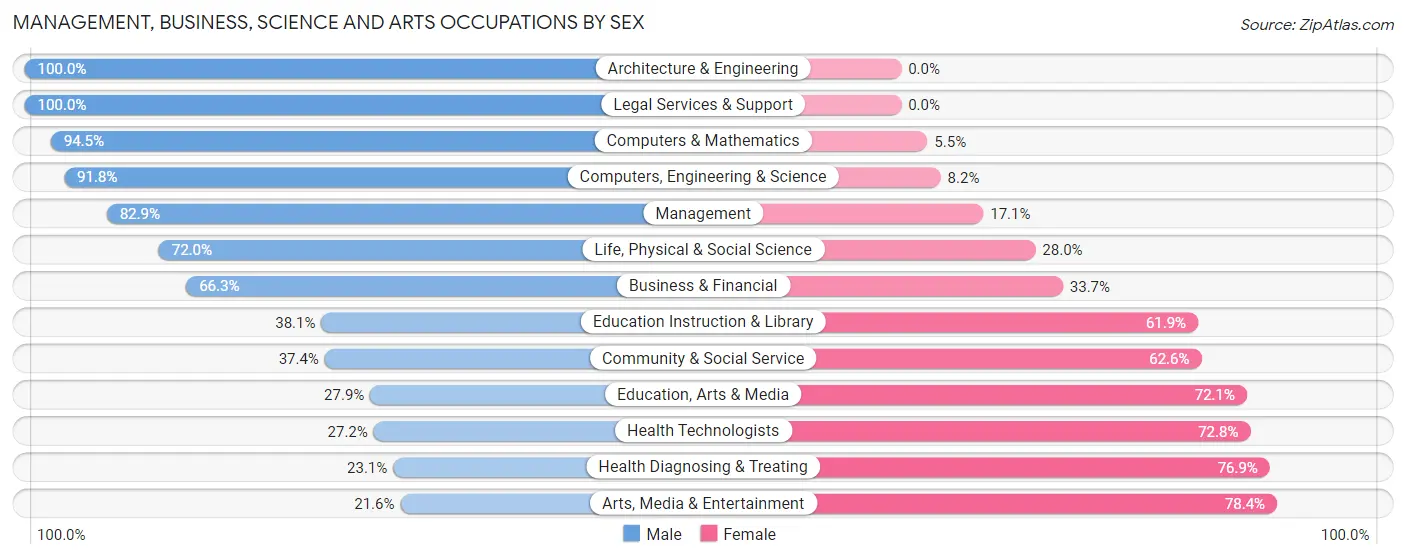
Management, Business, Science and Arts Occupations by Sex
Within the Management, Business, Science and Arts occupations in Pomona, the most male-oriented occupations are Architecture & Engineering (100.0%), Legal Services & Support (100.0%), and Computers & Mathematics (94.5%), while the most female-oriented occupations are Arts, Media & Entertainment (78.4%), Health Diagnosing & Treating (76.9%), and Health Technologists (72.8%).
| Occupation | Male | Female |
| Management | 261 (82.9%) | 54 (17.1%) |
| Business & Financial | 55 (66.3%) | 28 (33.7%) |
| Computers, Engineering & Science | 156 (91.8%) | 14 (8.2%) |
| Computers & Mathematics | 121 (94.5%) | 7 (5.5%) |
| Architecture & Engineering | 17 (100.0%) | 0 (0.0%) |
| Life, Physical & Social Science | 18 (72.0%) | 7 (28.0%) |
| Community & Social Service | 98 (37.4%) | 164 (62.6%) |
| Education, Arts & Media | 12 (27.9%) | 31 (72.1%) |
| Legal Services & Support | 14 (100.0%) | 0 (0.0%) |
| Education Instruction & Library | 64 (38.1%) | 104 (61.9%) |
| Arts, Media & Entertainment | 8 (21.6%) | 29 (78.4%) |
| Health Diagnosing & Treating | 31 (23.1%) | 103 (76.9%) |
| Health Technologists | 31 (27.2%) | 83 (72.8%) |
| Total (Category) | 601 (62.3%) | 363 (37.7%) |
| Total (Overall) | 1,020 (61.0%) | 651 (39.0%) |
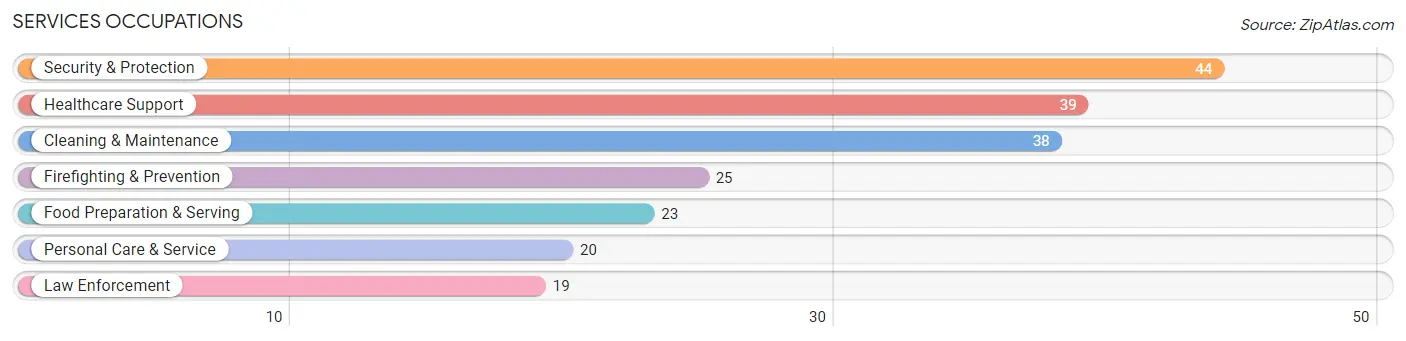
Services Occupations
The most common Services occupations in Pomona are Security & Protection (44 | 2.6%), Healthcare Support (39 | 2.3%), Cleaning & Maintenance (38 | 2.3%), Firefighting & Prevention (25 | 1.5%), and Food Preparation & Serving (23 | 1.4%).
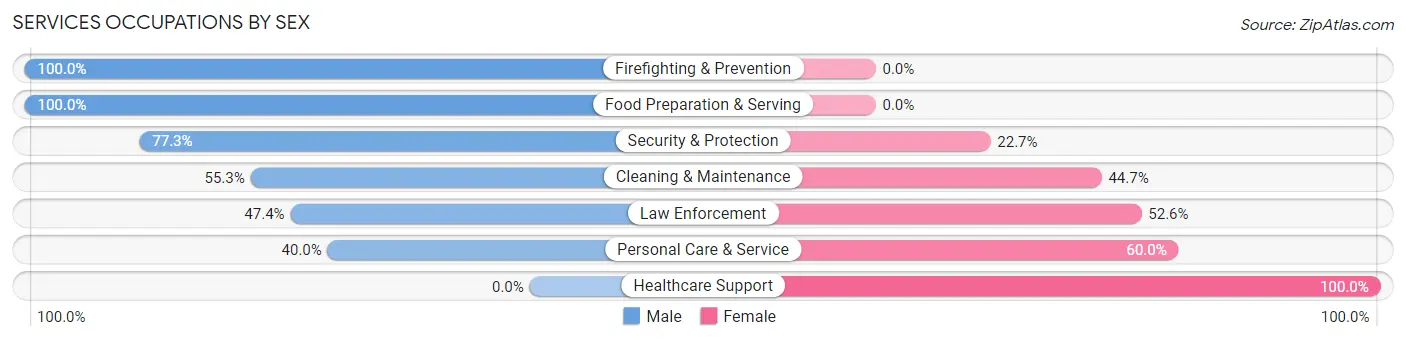
Services Occupations by Sex
Within the Services occupations in Pomona, the most male-oriented occupations are Firefighting & Prevention (100.0%), Food Preparation & Serving (100.0%), and Security & Protection (77.3%), while the most female-oriented occupations are Healthcare Support (100.0%), Personal Care & Service (60.0%), and Law Enforcement (52.6%).
| Occupation | Male | Female |
| Healthcare Support | 0 (0.0%) | 39 (100.0%) |
| Security & Protection | 34 (77.3%) | 10 (22.7%) |
| Firefighting & Prevention | 25 (100.0%) | 0 (0.0%) |
| Law Enforcement | 9 (47.4%) | 10 (52.6%) |
| Food Preparation & Serving | 23 (100.0%) | 0 (0.0%) |
| Cleaning & Maintenance | 21 (55.3%) | 17 (44.7%) |
| Personal Care & Service | 8 (40.0%) | 12 (60.0%) |
| Total (Category) | 86 (52.4%) | 78 (47.6%) |
| Total (Overall) | 1,020 (61.0%) | 651 (39.0%) |
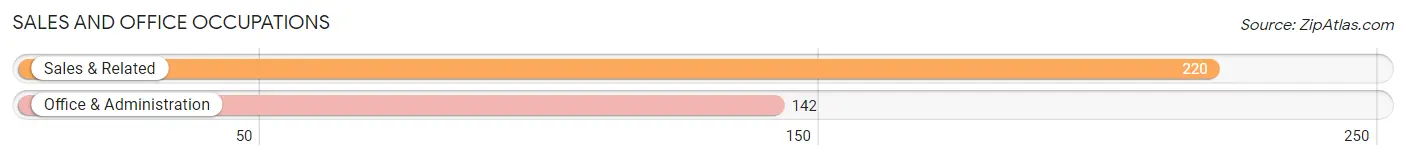
Sales and Office Occupations
The most common Sales and Office occupations in Pomona are Sales & Related (220 | 13.2%), and Office & Administration (142 | 8.5%).
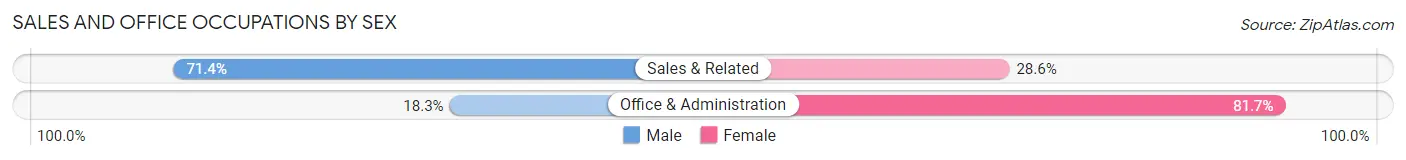
Sales and Office Occupations by Sex
| Occupation | Male | Female |
| Sales & Related | 157 (71.4%) | 63 (28.6%) |
| Office & Administration | 26 (18.3%) | 116 (81.7%) |
| Total (Category) | 183 (50.5%) | 179 (49.4%) |
| Total (Overall) | 1,020 (61.0%) | 651 (39.0%) |
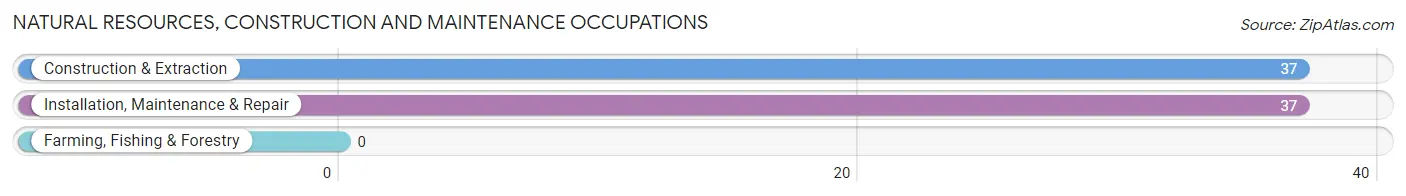
Natural Resources, Construction and Maintenance Occupations
The most common Natural Resources, Construction and Maintenance occupations in Pomona are Construction & Extraction (37 | 2.2%), and Installation, Maintenance & Repair (37 | 2.2%).
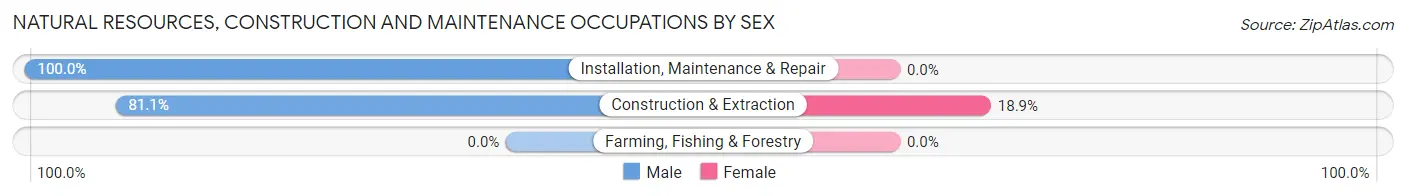
Natural Resources, Construction and Maintenance Occupations by Sex
| Occupation | Male | Female |
| Farming, Fishing & Forestry | 0 (0.0%) | 0 (0.0%) |
| Construction & Extraction | 30 (81.1%) | 7 (18.9%) |
| Installation, Maintenance & Repair | 37 (100.0%) | 0 (0.0%) |
| Total (Category) | 67 (90.5%) | 7 (9.5%) |
| Total (Overall) | 1,020 (61.0%) | 651 (39.0%) |
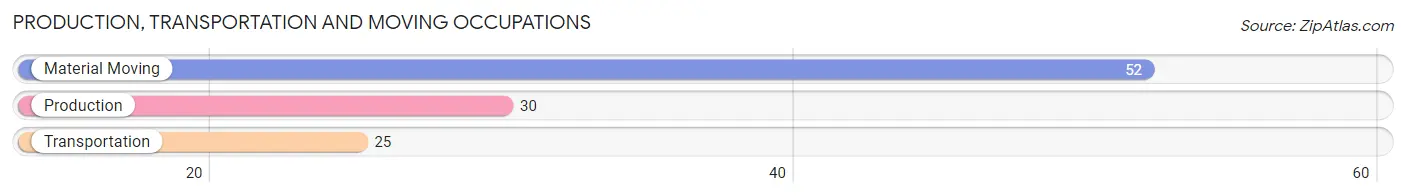
Production, Transportation and Moving Occupations
The most common Production, Transportation and Moving occupations in Pomona are Material Moving (52 | 3.1%), Production (30 | 1.8%), and Transportation (25 | 1.5%).
Production, Transportation and Moving Occupations by Sex
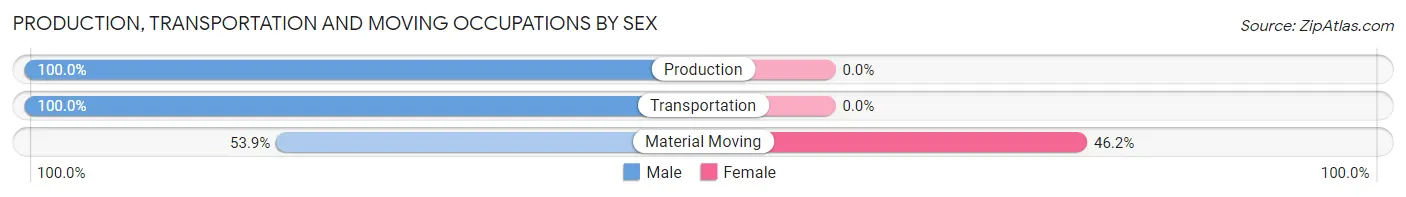
| Occupation | Male | Female |
| Production | 30 (100.0%) | 0 (0.0%) |
| Transportation | 25 (100.0%) | 0 (0.0%) |
| Material Moving | 28 (53.8%) | 24 (46.2%) |
| Total (Category) | 83 (77.6%) | 24 (22.4%) |
| Total (Overall) | 1,020 (61.0%) | 651 (39.0%) |
Employment Industries by Sex in Pomona
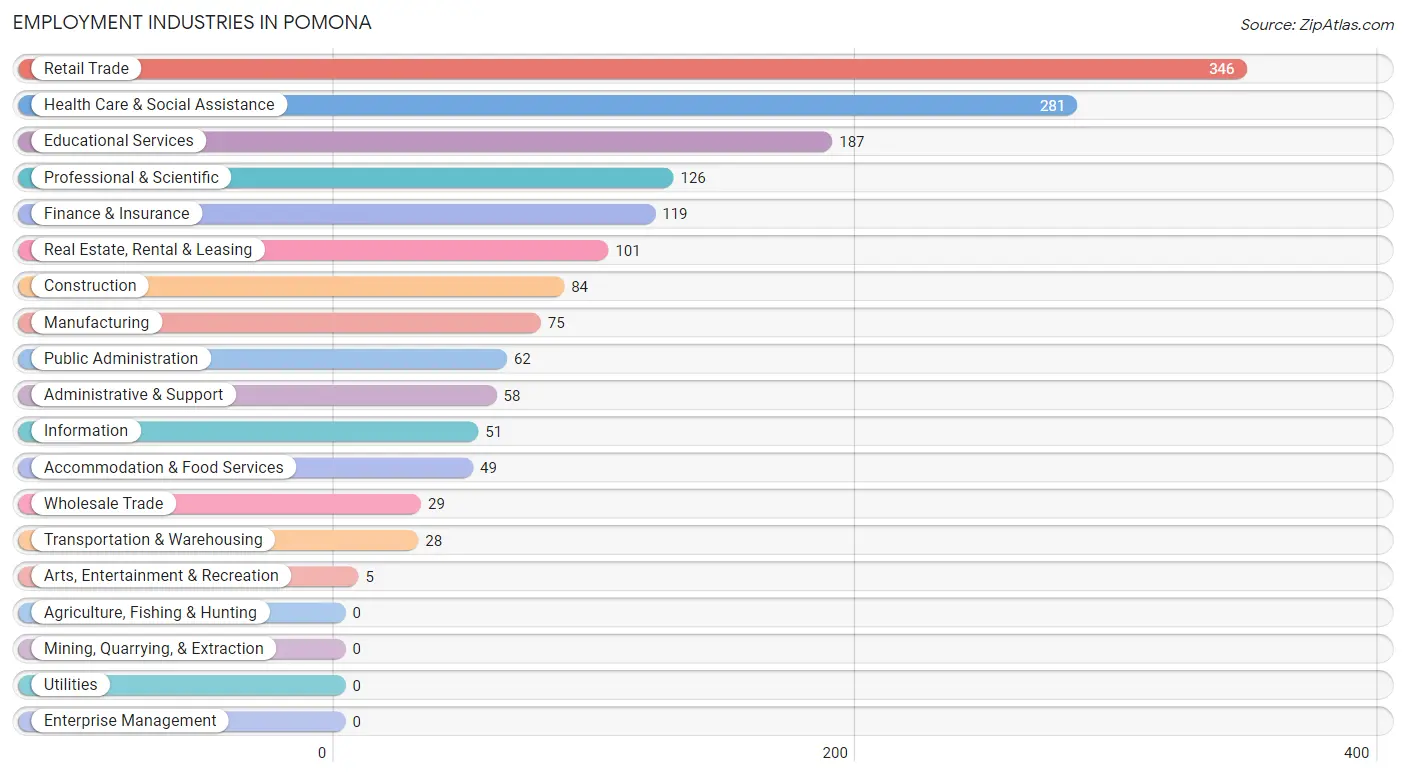
Employment Industries in Pomona
The major employment industries in Pomona include Retail Trade (346 | 20.7%), Health Care & Social Assistance (281 | 16.8%), Educational Services (187 | 11.2%), Professional & Scientific (126 | 7.5%), and Finance & Insurance (119 | 7.1%).
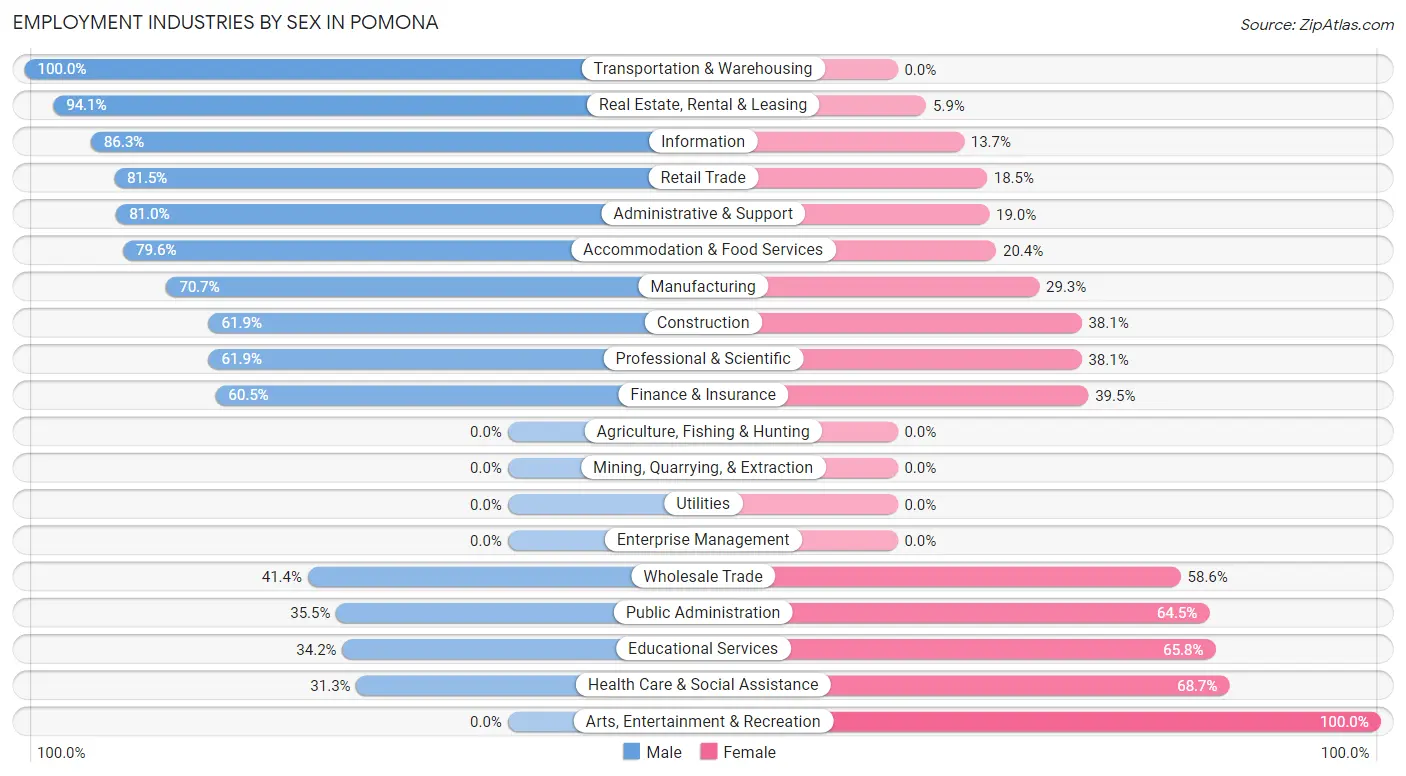
Employment Industries by Sex in Pomona
The Pomona industries that see more men than women are Transportation & Warehousing (100.0%), Real Estate, Rental & Leasing (94.1%), and Information (86.3%), whereas the industries that tend to have a higher number of women are Arts, Entertainment & Recreation (100.0%), Health Care & Social Assistance (68.7%), and Educational Services (65.8%).
| Industry | Male | Female |
| Agriculture, Fishing & Hunting | 0 (0.0%) | 0 (0.0%) |
| Mining, Quarrying, & Extraction | 0 (0.0%) | 0 (0.0%) |
| Construction | 52 (61.9%) | 32 (38.1%) |
| Manufacturing | 53 (70.7%) | 22 (29.3%) |
| Wholesale Trade | 12 (41.4%) | 17 (58.6%) |
| Retail Trade | 282 (81.5%) | 64 (18.5%) |
| Transportation & Warehousing | 28 (100.0%) | 0 (0.0%) |
| Utilities | 0 (0.0%) | 0 (0.0%) |
| Information | 44 (86.3%) | 7 (13.7%) |
| Finance & Insurance | 72 (60.5%) | 47 (39.5%) |
| Real Estate, Rental & Leasing | 95 (94.1%) | 6 (5.9%) |
| Professional & Scientific | 78 (61.9%) | 48 (38.1%) |
| Enterprise Management | 0 (0.0%) | 0 (0.0%) |
| Administrative & Support | 47 (81.0%) | 11 (19.0%) |
| Educational Services | 64 (34.2%) | 123 (65.8%) |
| Health Care & Social Assistance | 88 (31.3%) | 193 (68.7%) |
| Arts, Entertainment & Recreation | 0 (0.0%) | 5 (100.0%) |
| Accommodation & Food Services | 39 (79.6%) | 10 (20.4%) |
| Public Administration | 22 (35.5%) | 40 (64.5%) |
| Total | 1,020 (61.0%) | 651 (39.0%) |
Education in Pomona
School Enrollment in Pomona
The most common levels of schooling among the 1,103 students in Pomona are elementary school (373 | 33.8%), college / undergraduate (256 | 23.2%), and high school (159 | 14.4%).
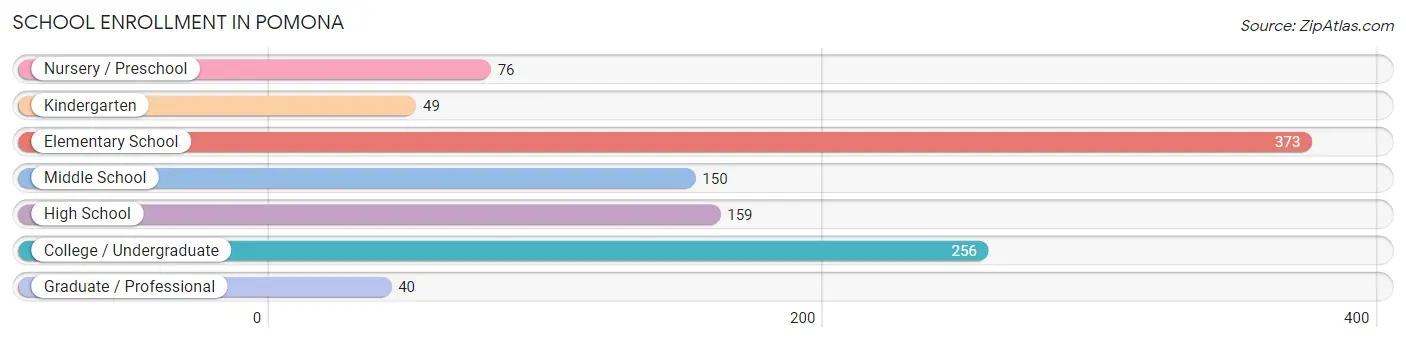
| School Level | # Students | % Students |
| Nursery / Preschool | 76 | 6.9% |
| Kindergarten | 49 | 4.4% |
| Elementary School | 373 | 33.8% |
| Middle School | 150 | 13.6% |
| High School | 159 | 14.4% |
| College / Undergraduate | 256 | 23.2% |
| Graduate / Professional | 40 | 3.6% |
| Total | 1,103 | 100.0% |
School Enrollment by Age by Funding Source in Pomona
Out of a total of 1,103 students who are enrolled in schools in Pomona, 538 (48.8%) attend a private institution, while the remaining 565 (51.2%) are enrolled in public schools. The age group of 3 to 4 year olds has the highest likelihood of being enrolled in private schools, with 68 (100.0% in the age bracket) enrolled. Conversely, the age group of 35 years and over has the lowest likelihood of being enrolled in a private school, with 46 (93.9% in the age bracket) attending a public institution.
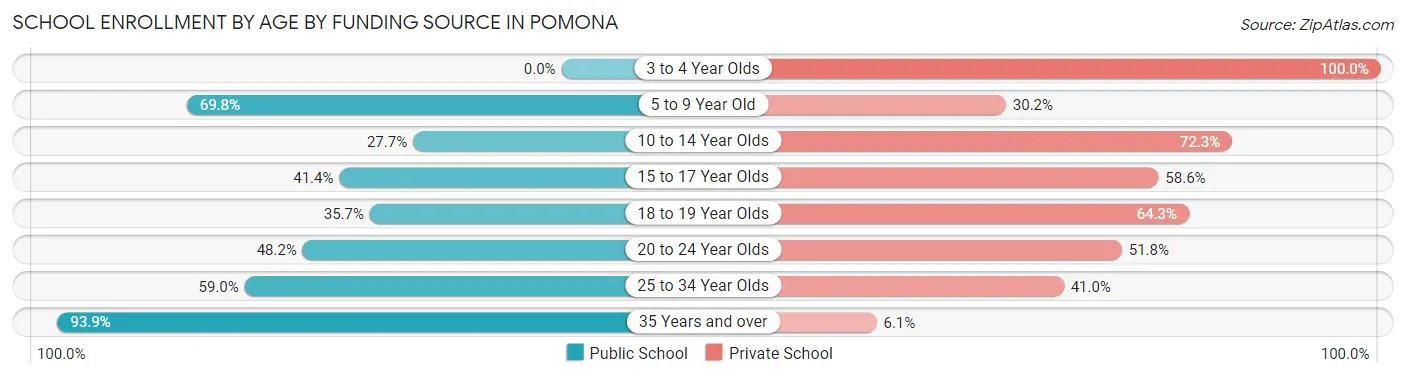
| Age Bracket | Public School | Private School |
| 3 to 4 Year Olds | 0 (0.0%) | 68 (100.0%) |
| 5 to 9 Year Old | 298 (69.8%) | 129 (30.2%) |
| 10 to 14 Year Olds | 52 (27.7%) | 136 (72.3%) |
| 15 to 17 Year Olds | 36 (41.4%) | 51 (58.6%) |
| 18 to 19 Year Olds | 30 (35.7%) | 54 (64.3%) |
| 20 to 24 Year Olds | 67 (48.2%) | 72 (51.8%) |
| 25 to 34 Year Olds | 36 (59.0%) | 25 (41.0%) |
| 35 Years and over | 46 (93.9%) | 3 (6.1%) |
| Total | 565 (51.2%) | 538 (48.8%) |
Educational Attainment by Field of Study in Pomona
Education (237 | 16.1%), business (224 | 15.2%), science & technology (166 | 11.3%), visual & performing arts (154 | 10.5%), and social sciences (113 | 7.7%) are the most common fields of study among 1,472 individuals in Pomona who have obtained a bachelor's degree or higher.
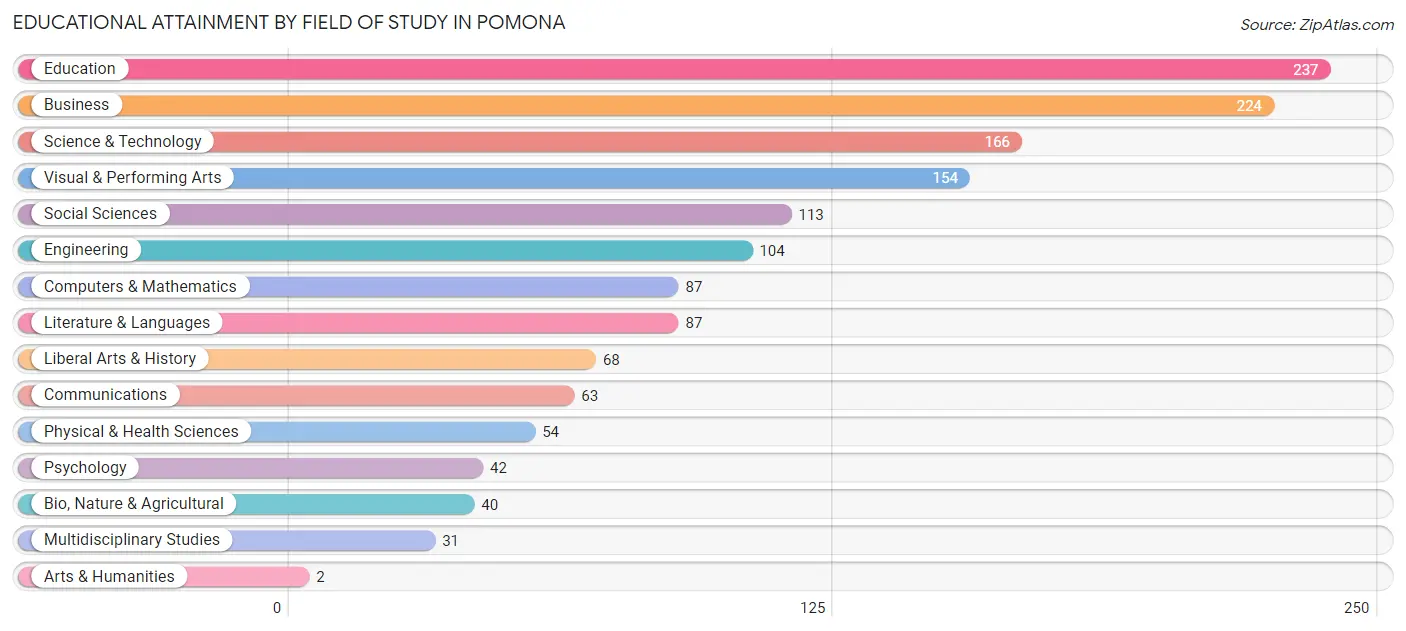
| Field of Study | # Graduates | % Graduates |
| Computers & Mathematics | 87 | 5.9% |
| Bio, Nature & Agricultural | 40 | 2.7% |
| Physical & Health Sciences | 54 | 3.7% |
| Psychology | 42 | 2.9% |
| Social Sciences | 113 | 7.7% |
| Engineering | 104 | 7.1% |
| Multidisciplinary Studies | 31 | 2.1% |
| Science & Technology | 166 | 11.3% |
| Business | 224 | 15.2% |
| Education | 237 | 16.1% |
| Literature & Languages | 87 | 5.9% |
| Liberal Arts & History | 68 | 4.6% |
| Visual & Performing Arts | 154 | 10.5% |
| Communications | 63 | 4.3% |
| Arts & Humanities | 2 | 0.1% |
| Total | 1,472 | 100.0% |
Transportation & Commute in Pomona
Vehicle Availability by Sex in Pomona
The most prevalent vehicle ownership categories in Pomona are males with 2 vehicles (444, accounting for 43.8%) and females with 2 vehicles (251, making up 69.4%).
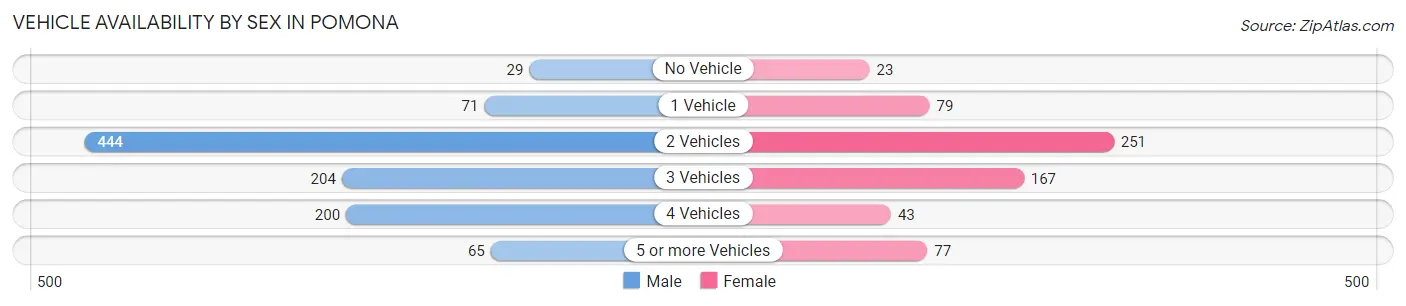
| Vehicles Available | Male | Female |
| No Vehicle | 29 (2.9%) | 23 (3.6%) |
| 1 Vehicle | 71 (7.0%) | 79 (12.3%) |
| 2 Vehicles | 444 (43.8%) | 251 (39.2%) |
| 3 Vehicles | 204 (20.1%) | 167 (26.1%) |
| 4 Vehicles | 200 (19.7%) | 43 (6.7%) |
| 5 or more Vehicles | 65 (6.4%) | 77 (12.0%) |
| Total | 1,013 (100.0%) | 640 (100.0%) |
Commute Time in Pomona
The most frequently occuring commute durations in Pomona are 60 to 89 minutes (305 commuters, 22.2%), 20 to 24 minutes (236 commuters, 17.2%), and 15 to 19 minutes (184 commuters, 13.4%).
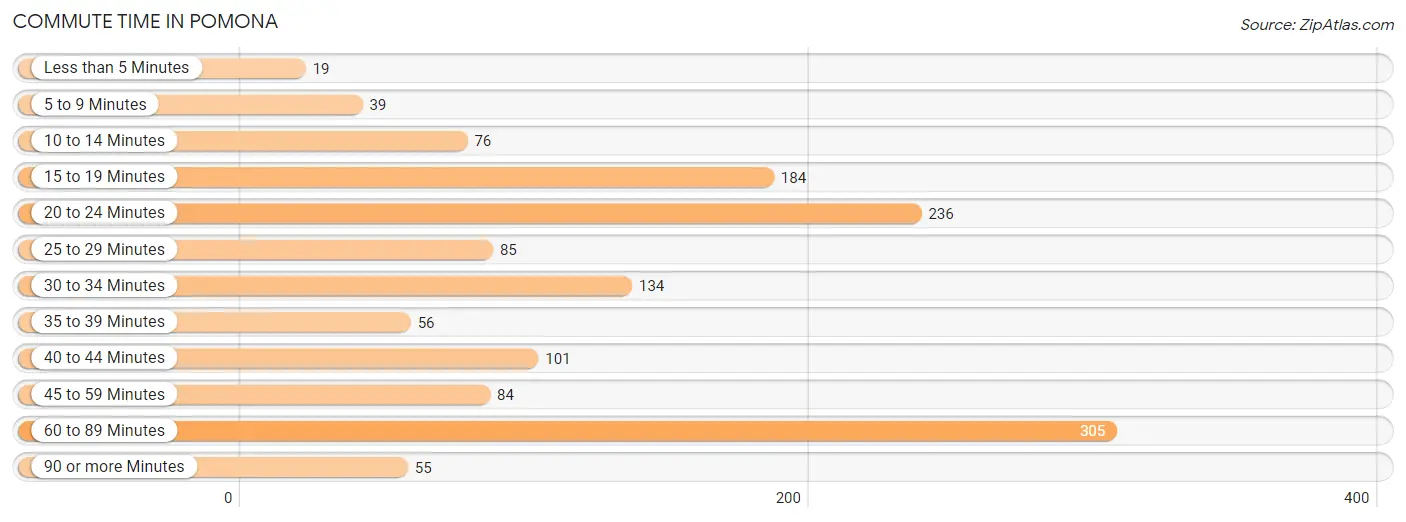
| Commute Time | # Commuters | % Commuters |
| Less than 5 Minutes | 19 | 1.4% |
| 5 to 9 Minutes | 39 | 2.8% |
| 10 to 14 Minutes | 76 | 5.5% |
| 15 to 19 Minutes | 184 | 13.4% |
| 20 to 24 Minutes | 236 | 17.2% |
| 25 to 29 Minutes | 85 | 6.2% |
| 30 to 34 Minutes | 134 | 9.8% |
| 35 to 39 Minutes | 56 | 4.1% |
| 40 to 44 Minutes | 101 | 7.3% |
| 45 to 59 Minutes | 84 | 6.1% |
| 60 to 89 Minutes | 305 | 22.2% |
| 90 or more Minutes | 55 | 4.0% |
Commute Time by Sex in Pomona
The most common commute times in Pomona are 60 to 89 minutes (281 commuters, 33.3%) for males and 20 to 24 minutes (112 commuters, 21.2%) for females.
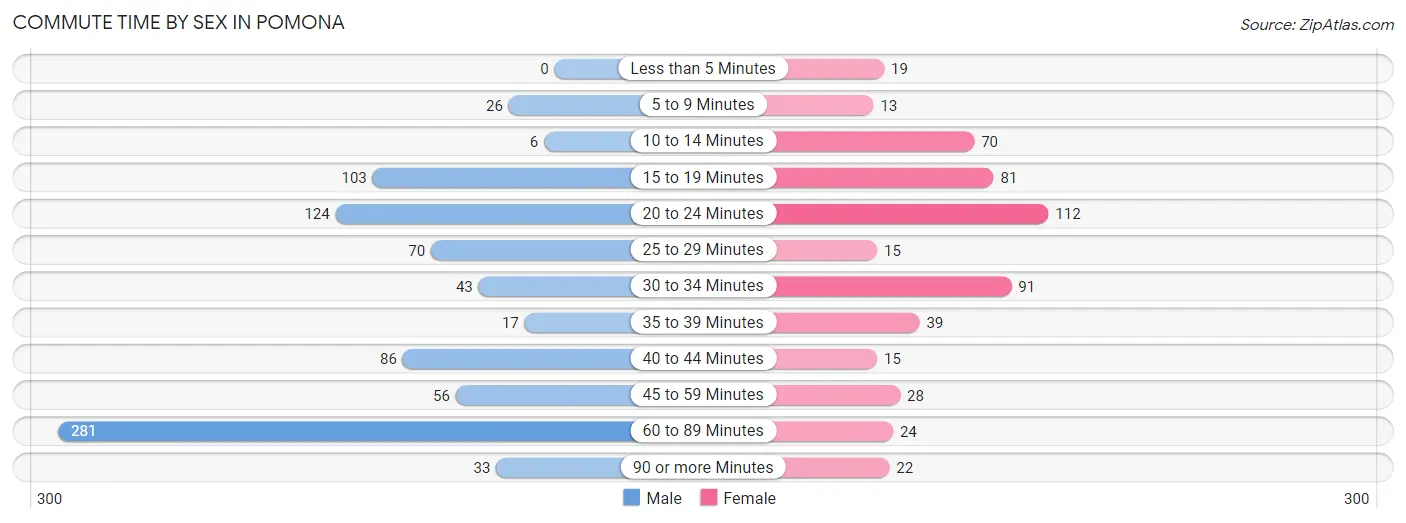
| Commute Time | Male | Female |
| Less than 5 Minutes | 0 (0.0%) | 19 (3.6%) |
| 5 to 9 Minutes | 26 (3.1%) | 13 (2.5%) |
| 10 to 14 Minutes | 6 (0.7%) | 70 (13.2%) |
| 15 to 19 Minutes | 103 (12.2%) | 81 (15.3%) |
| 20 to 24 Minutes | 124 (14.7%) | 112 (21.2%) |
| 25 to 29 Minutes | 70 (8.3%) | 15 (2.8%) |
| 30 to 34 Minutes | 43 (5.1%) | 91 (17.2%) |
| 35 to 39 Minutes | 17 (2.0%) | 39 (7.4%) |
| 40 to 44 Minutes | 86 (10.2%) | 15 (2.8%) |
| 45 to 59 Minutes | 56 (6.6%) | 28 (5.3%) |
| 60 to 89 Minutes | 281 (33.3%) | 24 (4.5%) |
| 90 or more Minutes | 33 (3.9%) | 22 (4.2%) |
Time of Departure to Work by Sex in Pomona
The most frequent times of departure to work in Pomona are 7:00 AM to 7:29 AM (215, 25.4%) for males and 8:30 AM to 8:59 AM (109, 20.6%) for females.
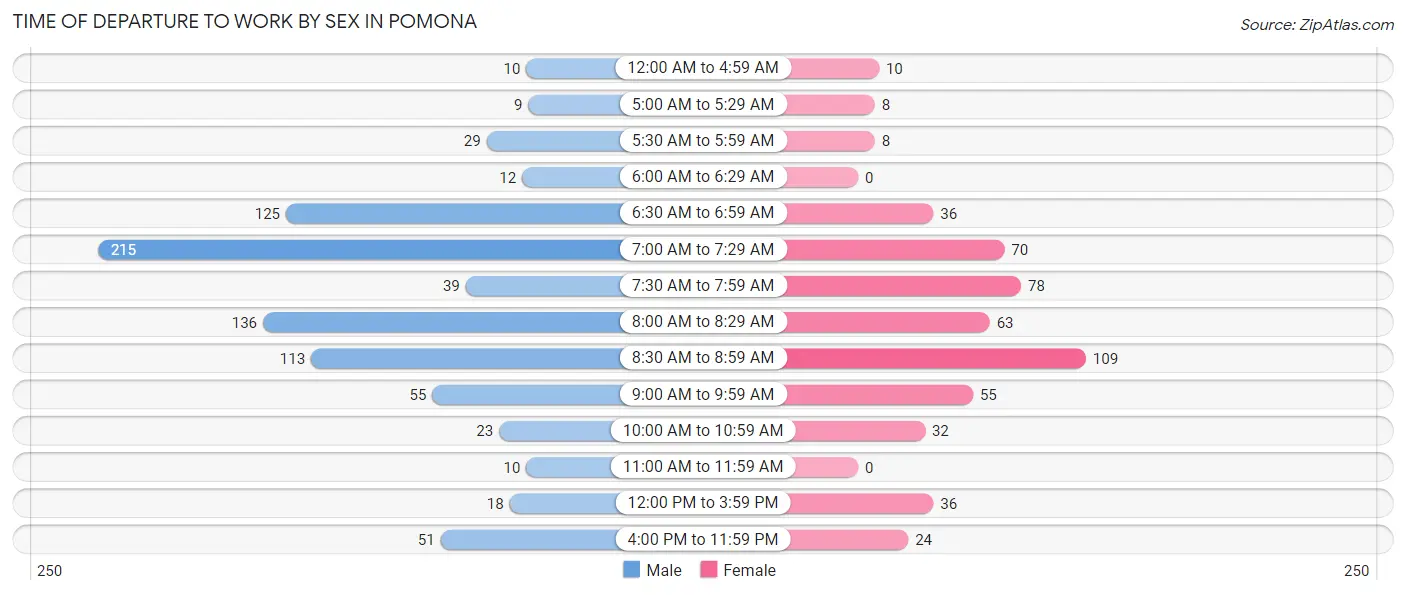
| Time of Departure | Male | Female |
| 12:00 AM to 4:59 AM | 10 (1.2%) | 10 (1.9%) |
| 5:00 AM to 5:29 AM | 9 (1.1%) | 8 (1.5%) |
| 5:30 AM to 5:59 AM | 29 (3.4%) | 8 (1.5%) |
| 6:00 AM to 6:29 AM | 12 (1.4%) | 0 (0.0%) |
| 6:30 AM to 6:59 AM | 125 (14.8%) | 36 (6.8%) |
| 7:00 AM to 7:29 AM | 215 (25.4%) | 70 (13.2%) |
| 7:30 AM to 7:59 AM | 39 (4.6%) | 78 (14.7%) |
| 8:00 AM to 8:29 AM | 136 (16.1%) | 63 (11.9%) |
| 8:30 AM to 8:59 AM | 113 (13.4%) | 109 (20.6%) |
| 9:00 AM to 9:59 AM | 55 (6.5%) | 55 (10.4%) |
| 10:00 AM to 10:59 AM | 23 (2.7%) | 32 (6.0%) |
| 11:00 AM to 11:59 AM | 10 (1.2%) | 0 (0.0%) |
| 12:00 PM to 3:59 PM | 18 (2.1%) | 36 (6.8%) |
| 4:00 PM to 11:59 PM | 51 (6.0%) | 24 (4.5%) |
| Total | 845 (100.0%) | 529 (100.0%) |
Housing Occupancy in Pomona
Occupancy by Ownership in Pomona
Of the total 1,053 dwellings in Pomona, owner-occupied units account for 971 (92.2%), while renter-occupied units make up 82 (7.8%).
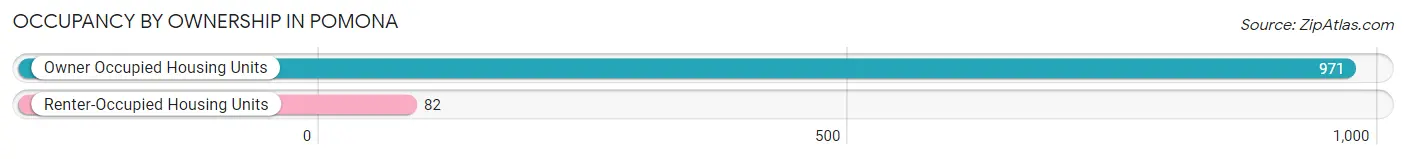
| Occupancy | # Housing Units | % Housing Units |
| Owner Occupied Housing Units | 971 | 92.2% |
| Renter-Occupied Housing Units | 82 | 7.8% |
| Total Occupied Housing Units | 1,053 | 100.0% |
Occupancy by Household Size in Pomona
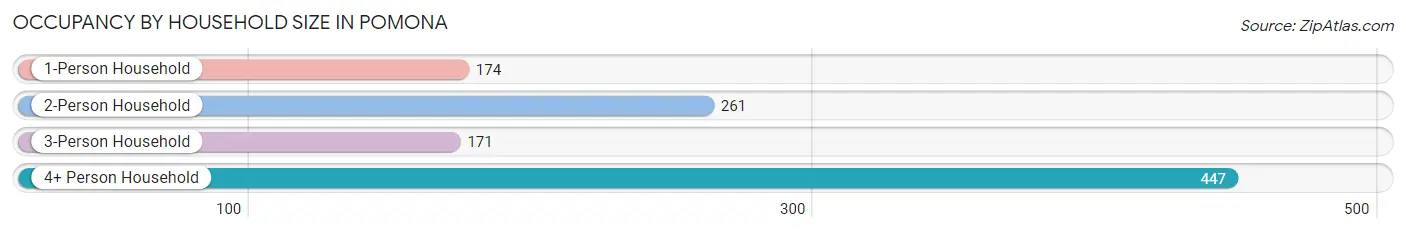
| Household Size | # Housing Units | % Housing Units |
| 1-Person Household | 174 | 16.5% |
| 2-Person Household | 261 | 24.8% |
| 3-Person Household | 171 | 16.2% |
| 4+ Person Household | 447 | 42.4% |
| Total Housing Units | 1,053 | 100.0% |
Occupancy by Ownership by Household Size in Pomona
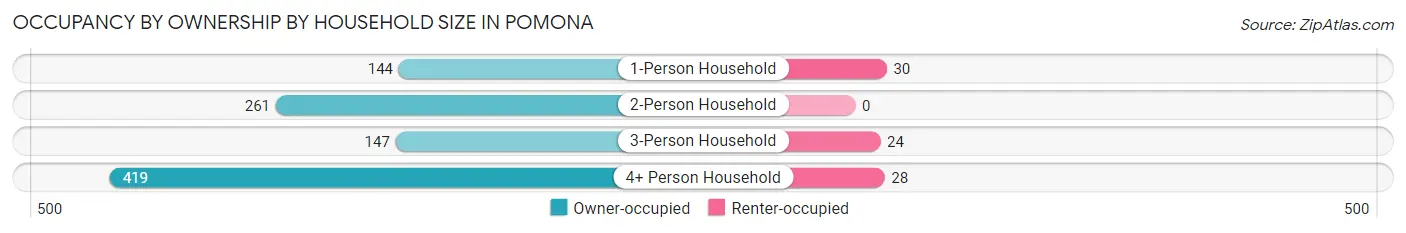
| Household Size | Owner-occupied | Renter-occupied |
| 1-Person Household | 144 (82.8%) | 30 (17.2%) |
| 2-Person Household | 261 (100.0%) | 0 (0.0%) |
| 3-Person Household | 147 (86.0%) | 24 (14.0%) |
| 4+ Person Household | 419 (93.7%) | 28 (6.3%) |
| Total Housing Units | 971 (92.2%) | 82 (7.8%) |
Occupancy by Educational Attainment in Pomona
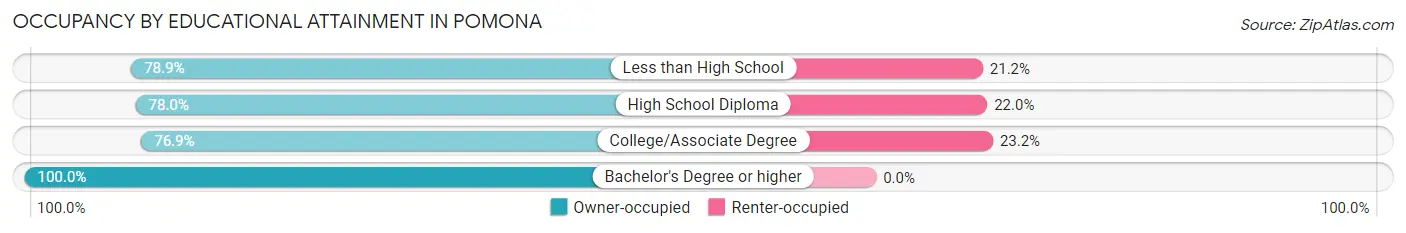
| Household Size | Owner-occupied | Renter-occupied |
| Less than High School | 123 (78.8%) | 33 (21.1%) |
| High School Diploma | 85 (78.0%) | 24 (22.0%) |
| College/Associate Degree | 83 (76.8%) | 25 (23.2%) |
| Bachelor's Degree or higher | 680 (100.0%) | 0 (0.0%) |
Occupancy by Age of Householder in Pomona
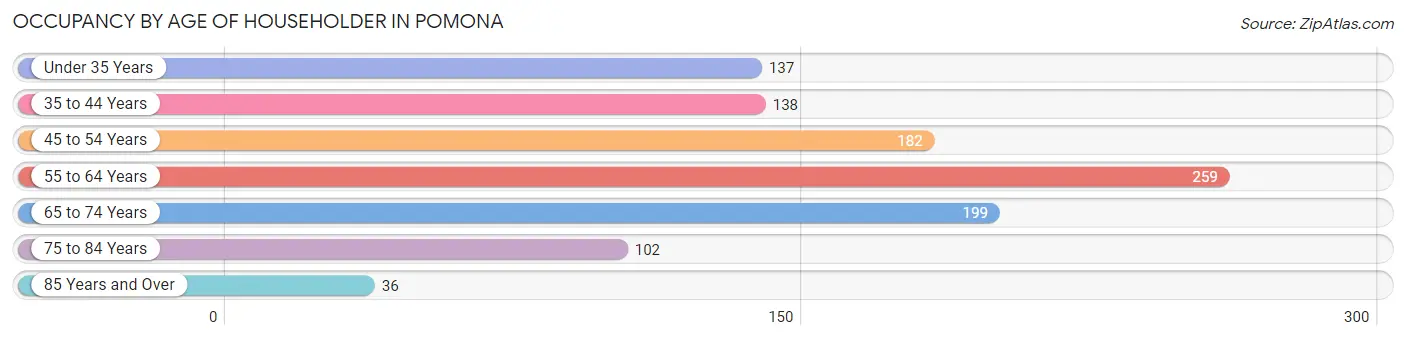
| Age Bracket | # Households | % Households |
| Under 35 Years | 137 | 13.0% |
| 35 to 44 Years | 138 | 13.1% |
| 45 to 54 Years | 182 | 17.3% |
| 55 to 64 Years | 259 | 24.6% |
| 65 to 74 Years | 199 | 18.9% |
| 75 to 84 Years | 102 | 9.7% |
| 85 Years and Over | 36 | 3.4% |
| Total | 1,053 | 100.0% |
Housing Finances in Pomona
Median Income by Occupancy in Pomona
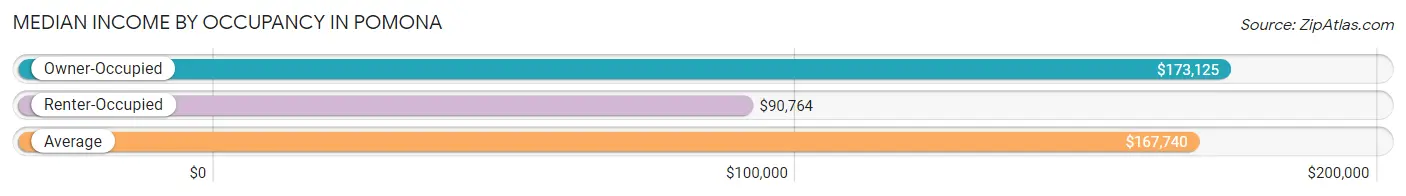
| Occupancy Type | # Households | Median Income |
| Owner-Occupied | 971 (92.2%) | $173,125 |
| Renter-Occupied | 82 (7.8%) | $90,764 |
| Average | 1,053 (100.0%) | $167,740 |
Occupancy by Householder Income Bracket in Pomona
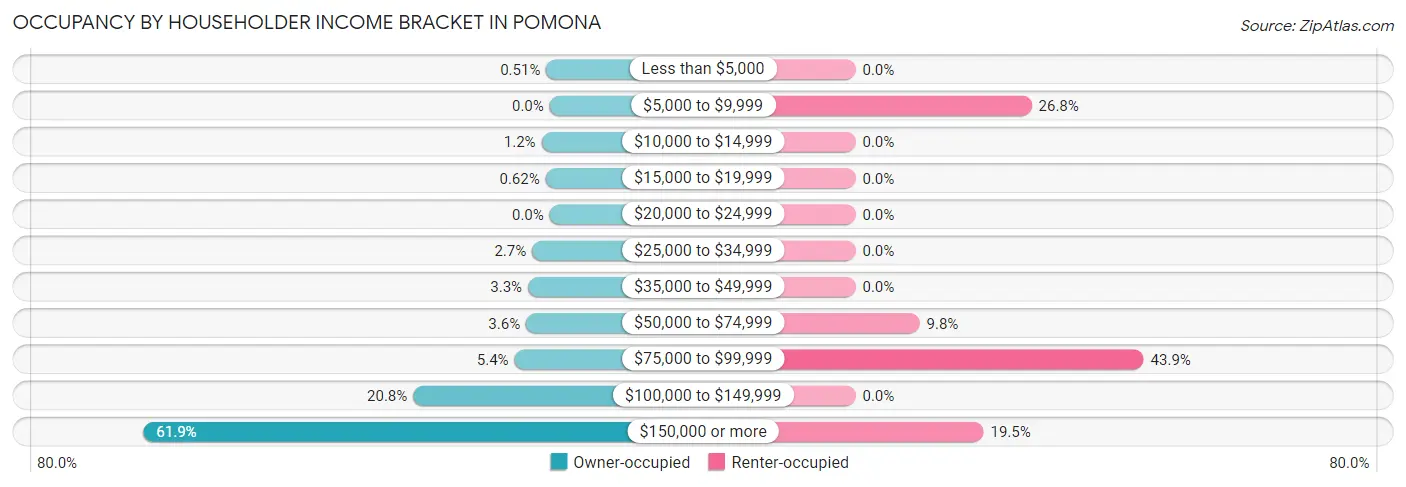
| Income Bracket | Owner-occupied | Renter-occupied |
| Less than $5,000 | 5 (0.5%) | 0 (0.0%) |
| $5,000 to $9,999 | 0 (0.0%) | 22 (26.8%) |
| $10,000 to $14,999 | 12 (1.2%) | 0 (0.0%) |
| $15,000 to $19,999 | 6 (0.6%) | 0 (0.0%) |
| $20,000 to $24,999 | 0 (0.0%) | 0 (0.0%) |
| $25,000 to $34,999 | 26 (2.7%) | 0 (0.0%) |
| $35,000 to $49,999 | 32 (3.3%) | 0 (0.0%) |
| $50,000 to $74,999 | 35 (3.6%) | 8 (9.8%) |
| $75,000 to $99,999 | 52 (5.4%) | 36 (43.9%) |
| $100,000 to $149,999 | 202 (20.8%) | 0 (0.0%) |
| $150,000 or more | 601 (61.9%) | 16 (19.5%) |
| Total | 971 (100.0%) | 82 (100.0%) |
Monthly Housing Cost Tiers in Pomona
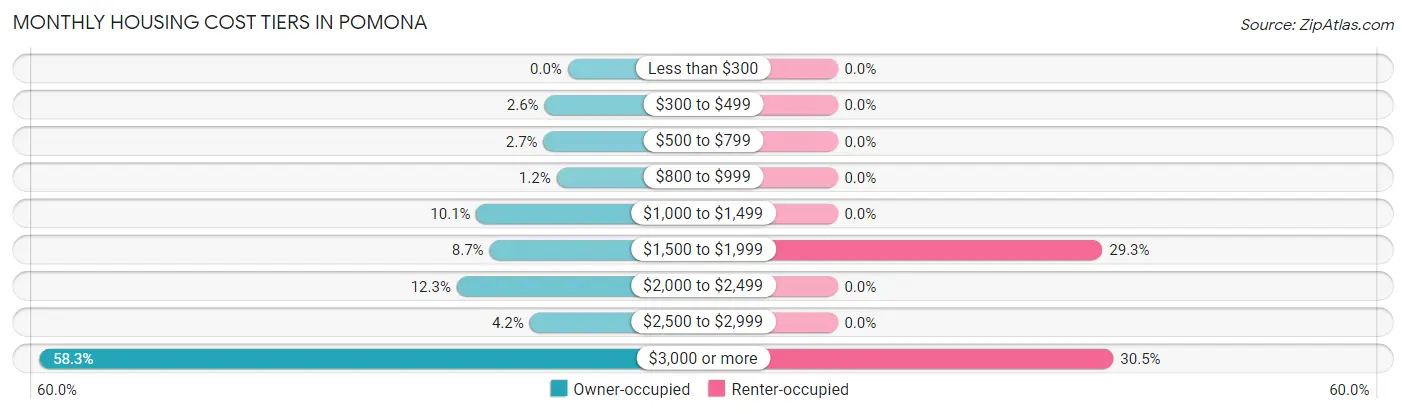
| Monthly Cost | Owner-occupied | Renter-occupied |
| Less than $300 | 0 (0.0%) | 0 (0.0%) |
| $300 to $499 | 25 (2.6%) | 0 (0.0%) |
| $500 to $799 | 26 (2.7%) | 0 (0.0%) |
| $800 to $999 | 12 (1.2%) | 0 (0.0%) |
| $1,000 to $1,499 | 98 (10.1%) | 0 (0.0%) |
| $1,500 to $1,999 | 84 (8.6%) | 24 (29.3%) |
| $2,000 to $2,499 | 119 (12.3%) | 0 (0.0%) |
| $2,500 to $2,999 | 41 (4.2%) | 0 (0.0%) |
| $3,000 or more | 566 (58.3%) | 25 (30.5%) |
| Total | 971 (100.0%) | 82 (100.0%) |
Physical Housing Characteristics in Pomona
Housing Structures in Pomona
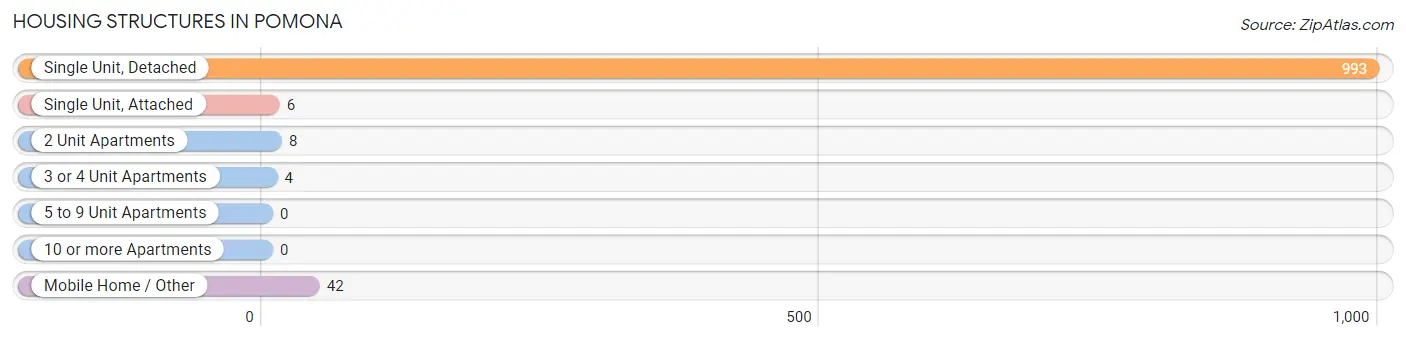
| Structure Type | # Housing Units | % Housing Units |
| Single Unit, Detached | 993 | 94.3% |
| Single Unit, Attached | 6 | 0.6% |
| 2 Unit Apartments | 8 | 0.8% |
| 3 or 4 Unit Apartments | 4 | 0.4% |
| 5 to 9 Unit Apartments | 0 | 0.0% |
| 10 or more Apartments | 0 | 0.0% |
| Mobile Home / Other | 42 | 4.0% |
| Total | 1,053 | 100.0% |
Housing Structures by Occupancy in Pomona
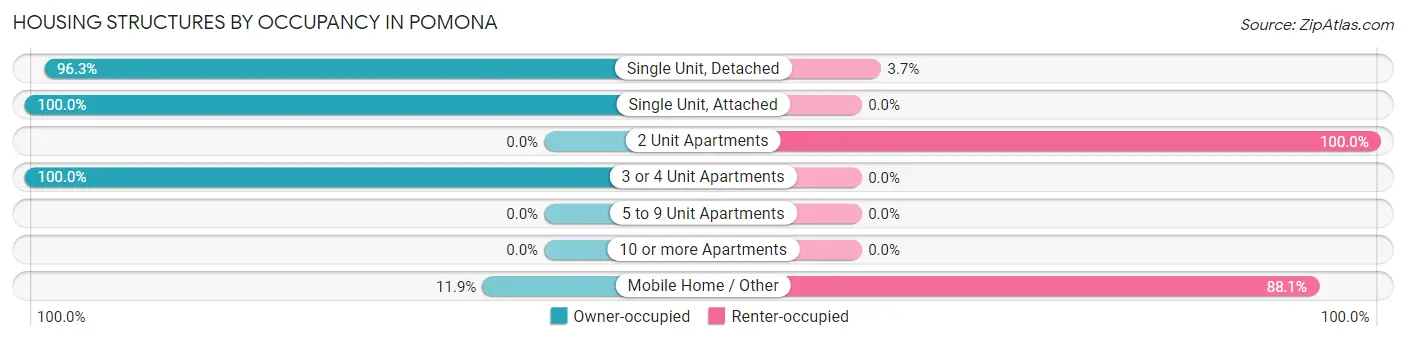
| Structure Type | Owner-occupied | Renter-occupied |
| Single Unit, Detached | 956 (96.3%) | 37 (3.7%) |
| Single Unit, Attached | 6 (100.0%) | 0 (0.0%) |
| 2 Unit Apartments | 0 (0.0%) | 8 (100.0%) |
| 3 or 4 Unit Apartments | 4 (100.0%) | 0 (0.0%) |
| 5 to 9 Unit Apartments | 0 (0.0%) | 0 (0.0%) |
| 10 or more Apartments | 0 (0.0%) | 0 (0.0%) |
| Mobile Home / Other | 5 (11.9%) | 37 (88.1%) |
| Total | 971 (92.2%) | 82 (7.8%) |
Housing Structures by Number of Rooms in Pomona
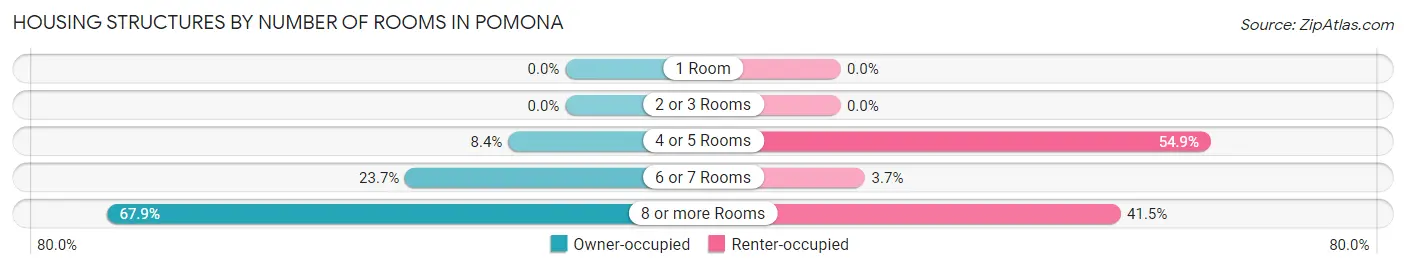
| Number of Rooms | Owner-occupied | Renter-occupied |
| 1 Room | 0 (0.0%) | 0 (0.0%) |
| 2 or 3 Rooms | 0 (0.0%) | 0 (0.0%) |
| 4 or 5 Rooms | 82 (8.4%) | 45 (54.9%) |
| 6 or 7 Rooms | 230 (23.7%) | 3 (3.7%) |
| 8 or more Rooms | 659 (67.9%) | 34 (41.5%) |
| Total | 971 (100.0%) | 82 (100.0%) |
Housing Structure by Heating Type in Pomona
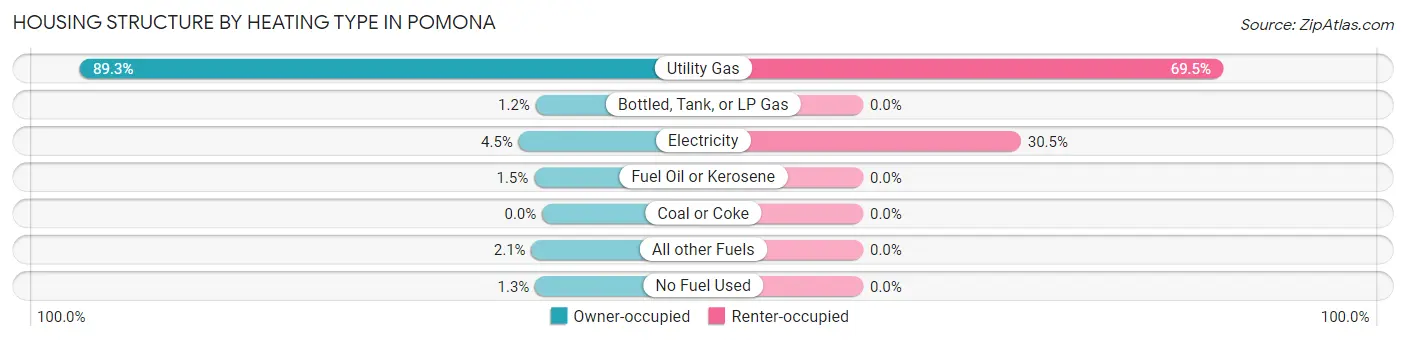
| Heating Type | Owner-occupied | Renter-occupied |
| Utility Gas | 867 (89.3%) | 57 (69.5%) |
| Bottled, Tank, or LP Gas | 12 (1.2%) | 0 (0.0%) |
| Electricity | 44 (4.5%) | 25 (30.5%) |
| Fuel Oil or Kerosene | 15 (1.5%) | 0 (0.0%) |
| Coal or Coke | 0 (0.0%) | 0 (0.0%) |
| All other Fuels | 20 (2.1%) | 0 (0.0%) |
| No Fuel Used | 13 (1.3%) | 0 (0.0%) |
| Total | 971 (100.0%) | 82 (100.0%) |
Household Vehicle Usage in Pomona
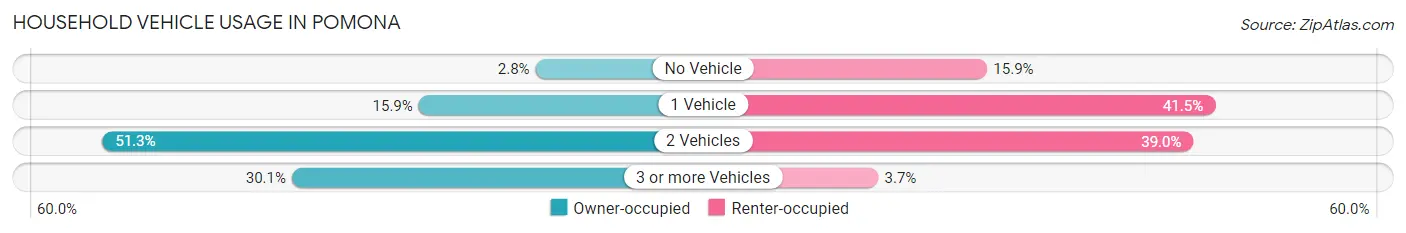
| Vehicles per Household | Owner-occupied | Renter-occupied |
| No Vehicle | 27 (2.8%) | 13 (15.9%) |
| 1 Vehicle | 154 (15.9%) | 34 (41.5%) |
| 2 Vehicles | 498 (51.3%) | 32 (39.0%) |
| 3 or more Vehicles | 292 (30.1%) | 3 (3.7%) |
| Total | 971 (100.0%) | 82 (100.0%) |
Real Estate & Mortgages in Pomona
Real Estate and Mortgage Overview in Pomona
| Characteristic | Without Mortgage | With Mortgage |
| Housing Units | 342 | 629 |
| Median Property Value | $648,900 | $676,300 |
| Median Household Income | $168,000 | $398 |
| Monthly Housing Costs | $1,501 | $566 |
| Real Estate Taxes | $10,001 | $0 |
Property Value by Mortgage Status in Pomona
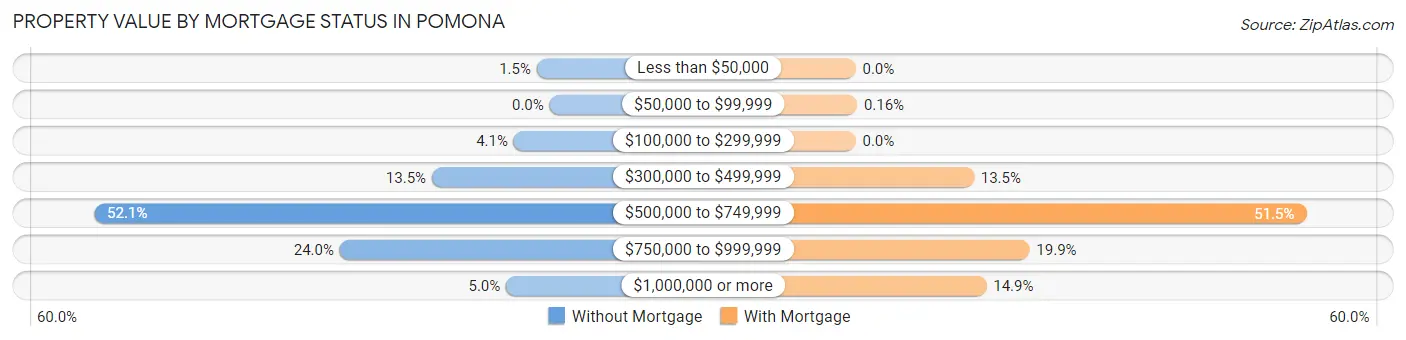
| Property Value | Without Mortgage | With Mortgage |
| Less than $50,000 | 5 (1.5%) | 0 (0.0%) |
| $50,000 to $99,999 | 0 (0.0%) | 1 (0.2%) |
| $100,000 to $299,999 | 14 (4.1%) | 0 (0.0%) |
| $300,000 to $499,999 | 46 (13.5%) | 85 (13.5%) |
| $500,000 to $749,999 | 178 (52.0%) | 324 (51.5%) |
| $750,000 to $999,999 | 82 (24.0%) | 125 (19.9%) |
| $1,000,000 or more | 17 (5.0%) | 94 (14.9%) |
| Total | 342 (100.0%) | 629 (100.0%) |
Household Income by Mortgage Status in Pomona
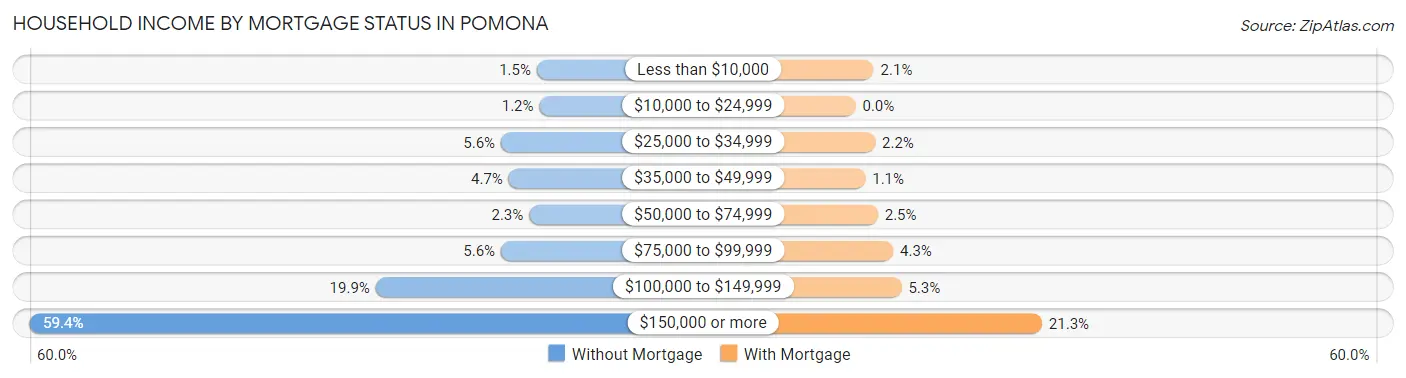
| Household Income | Without Mortgage | With Mortgage |
| Less than $10,000 | 5 (1.5%) | 13 (2.1%) |
| $10,000 to $24,999 | 4 (1.2%) | 0 (0.0%) |
| $25,000 to $34,999 | 19 (5.6%) | 14 (2.2%) |
| $35,000 to $49,999 | 16 (4.7%) | 7 (1.1%) |
| $50,000 to $74,999 | 8 (2.3%) | 16 (2.5%) |
| $75,000 to $99,999 | 19 (5.6%) | 27 (4.3%) |
| $100,000 to $149,999 | 68 (19.9%) | 33 (5.2%) |
| $150,000 or more | 203 (59.4%) | 134 (21.3%) |
| Total | 342 (100.0%) | 629 (100.0%) |
Property Value to Household Income Ratio in Pomona
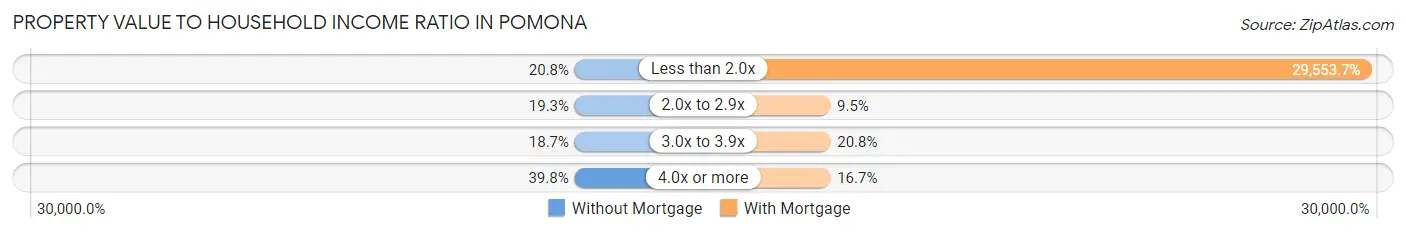
| Value-to-Income Ratio | Without Mortgage | With Mortgage |
| Less than 2.0x | 71 (20.8%) | 185,893 (29,553.7%) |
| 2.0x to 2.9x | 66 (19.3%) | 60 (9.5%) |
| 3.0x to 3.9x | 64 (18.7%) | 131 (20.8%) |
| 4.0x or more | 136 (39.8%) | 105 (16.7%) |
| Total | 342 (100.0%) | 629 (100.0%) |
Real Estate Taxes by Mortgage Status in Pomona
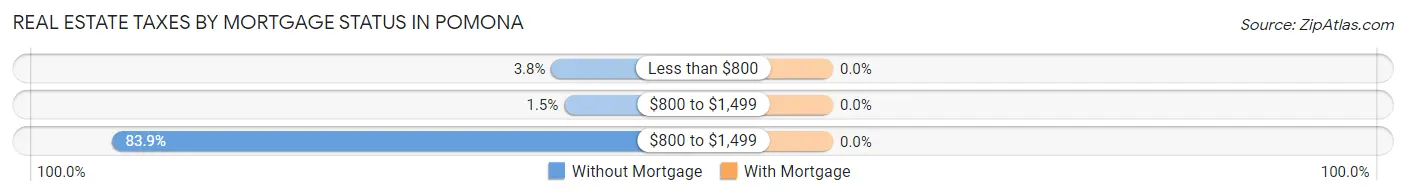
| Property Taxes | Without Mortgage | With Mortgage |
| Less than $800 | 13 (3.8%) | 0 (0.0%) |
| $800 to $1,499 | 5 (1.5%) | 0 (0.0%) |
| $800 to $1,499 | 287 (83.9%) | 0 (0.0%) |
| Total | 342 (100.0%) | 629 (100.0%) |
Health & Disability in Pomona
Health Insurance Coverage by Age in Pomona
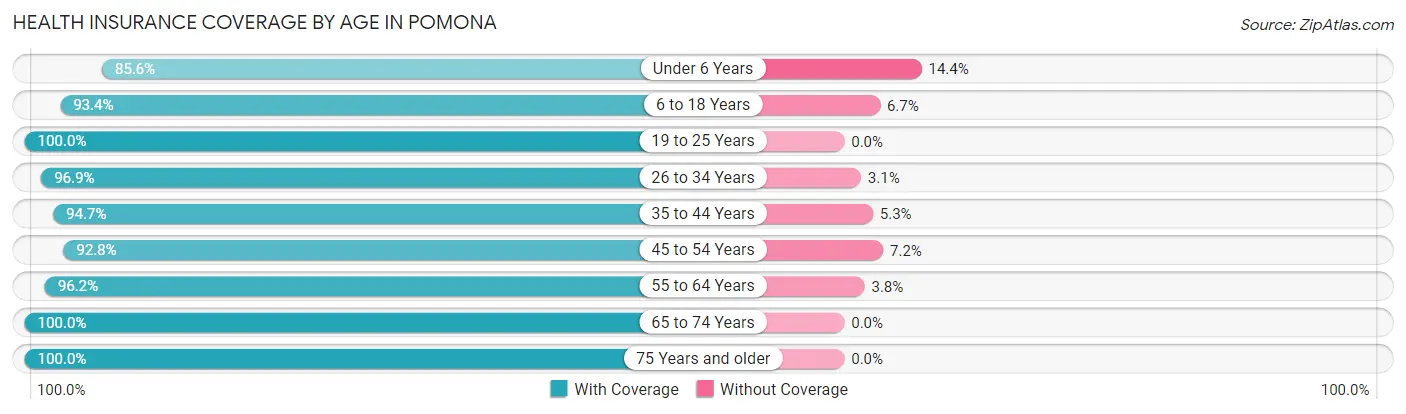
| Age Bracket | With Coverage | Without Coverage |
| Under 6 Years | 303 (85.6%) | 51 (14.4%) |
| 6 to 18 Years | 730 (93.3%) | 52 (6.7%) |
| 19 to 25 Years | 393 (100.0%) | 0 (0.0%) |
| 26 to 34 Years | 532 (96.9%) | 17 (3.1%) |
| 35 to 44 Years | 356 (94.7%) | 20 (5.3%) |
| 45 to 54 Years | 295 (92.8%) | 23 (7.2%) |
| 55 to 64 Years | 407 (96.2%) | 16 (3.8%) |
| 65 to 74 Years | 393 (100.0%) | 0 (0.0%) |
| 75 Years and older | 249 (100.0%) | 0 (0.0%) |
| Total | 3,658 (95.3%) | 179 (4.7%) |
Health Insurance Coverage by Citizenship Status in Pomona
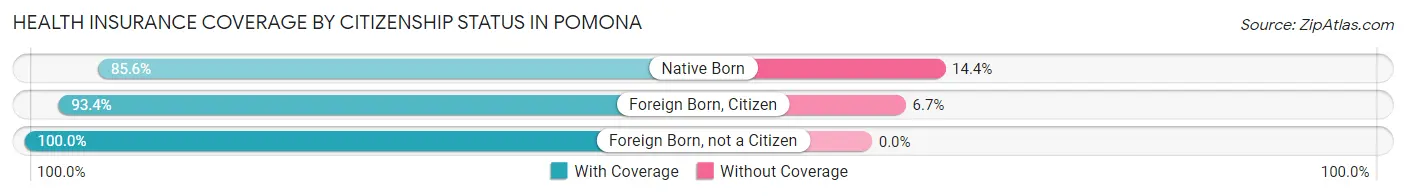
| Citizenship Status | With Coverage | Without Coverage |
| Native Born | 303 (85.6%) | 51 (14.4%) |
| Foreign Born, Citizen | 730 (93.3%) | 52 (6.7%) |
| Foreign Born, not a Citizen | 393 (100.0%) | 0 (0.0%) |
Health Insurance Coverage by Household Income in Pomona
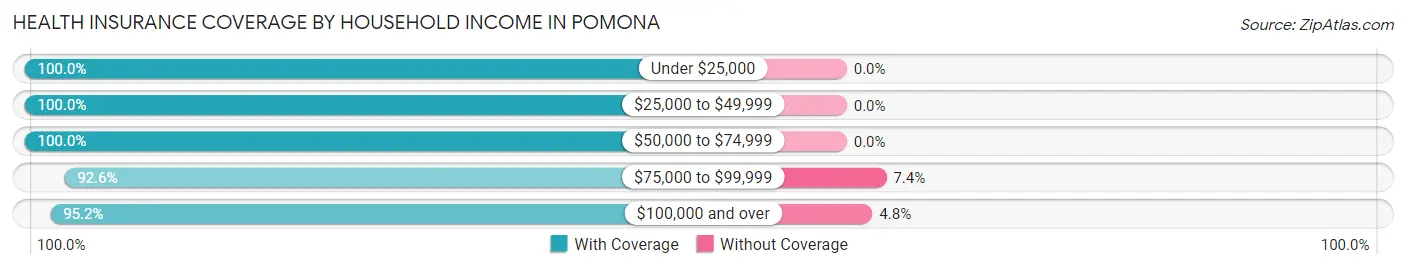
| Household Income | With Coverage | Without Coverage |
| Under $25,000 | 55 (100.0%) | 0 (0.0%) |
| $25,000 to $49,999 | 112 (100.0%) | 0 (0.0%) |
| $50,000 to $74,999 | 56 (100.0%) | 0 (0.0%) |
| $75,000 to $99,999 | 274 (92.6%) | 22 (7.4%) |
| $100,000 and over | 3,112 (95.2%) | 157 (4.8%) |
Public vs Private Health Insurance Coverage by Age in Pomona
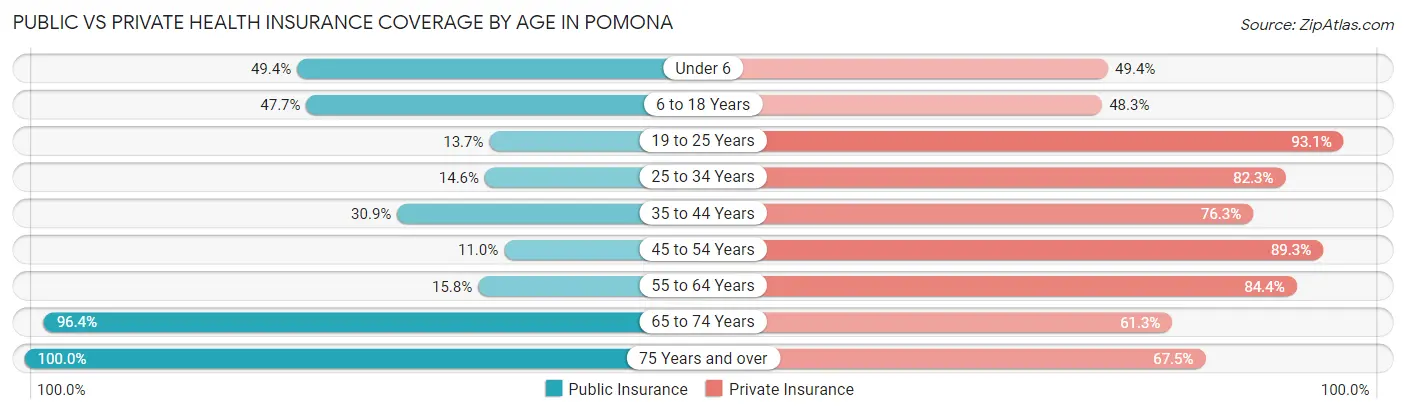
| Age Bracket | Public Insurance | Private Insurance |
| Under 6 | 175 (49.4%) | 175 (49.4%) |
| 6 to 18 Years | 373 (47.7%) | 378 (48.3%) |
| 19 to 25 Years | 54 (13.7%) | 366 (93.1%) |
| 25 to 34 Years | 80 (14.6%) | 452 (82.3%) |
| 35 to 44 Years | 116 (30.8%) | 287 (76.3%) |
| 45 to 54 Years | 35 (11.0%) | 284 (89.3%) |
| 55 to 64 Years | 67 (15.8%) | 357 (84.4%) |
| 65 to 74 Years | 379 (96.4%) | 241 (61.3%) |
| 75 Years and over | 249 (100.0%) | 168 (67.5%) |
| Total | 1,528 (39.8%) | 2,708 (70.6%) |
Disability Status by Sex by Age in Pomona
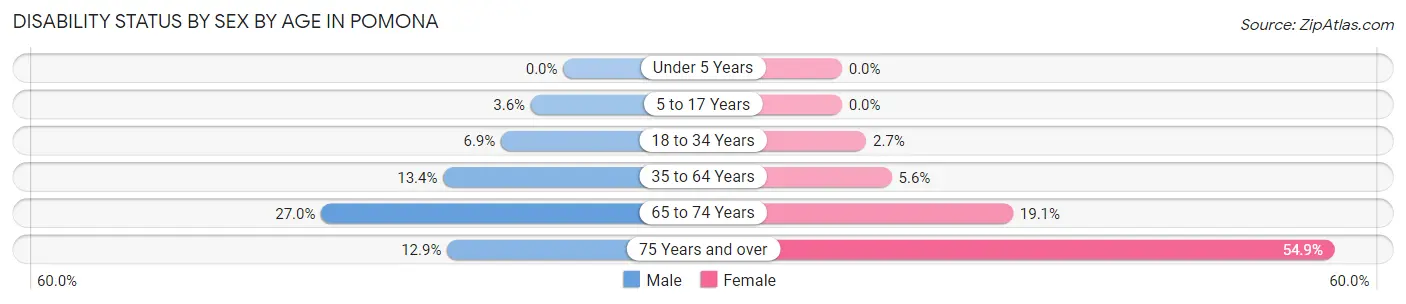
| Age Bracket | Male | Female |
| Under 5 Years | 0 (0.0%) | 0 (0.0%) |
| 5 to 17 Years | 13 (3.6%) | 0 (0.0%) |
| 18 to 34 Years | 38 (6.9%) | 13 (2.7%) |
| 35 to 64 Years | 77 (13.4%) | 30 (5.6%) |
| 65 to 74 Years | 55 (27.0%) | 36 (19.1%) |
| 75 Years and over | 19 (12.9%) | 56 (54.9%) |
Disability Class by Sex by Age in Pomona
Disability Class: Hearing Difficulty
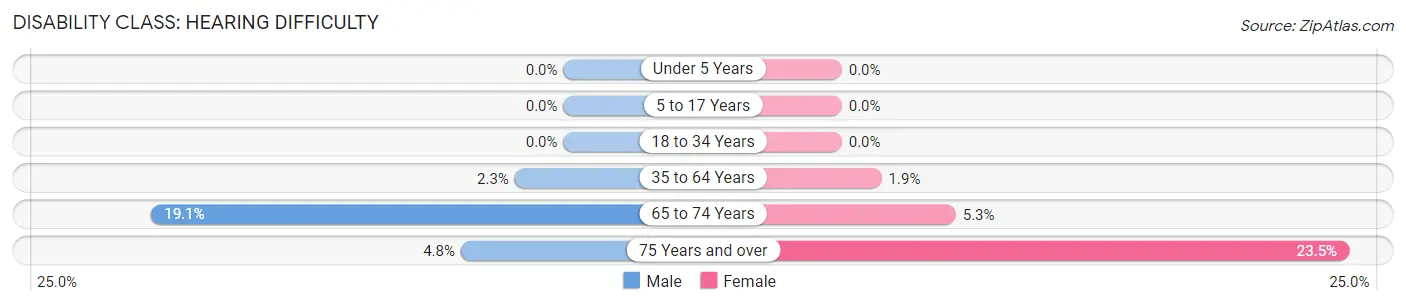
| Age Bracket | Male | Female |
| Under 5 Years | 0 (0.0%) | 0 (0.0%) |
| 5 to 17 Years | 0 (0.0%) | 0 (0.0%) |
| 18 to 34 Years | 0 (0.0%) | 0 (0.0%) |
| 35 to 64 Years | 13 (2.3%) | 10 (1.8%) |
| 65 to 74 Years | 39 (19.1%) | 10 (5.3%) |
| 75 Years and over | 7 (4.8%) | 24 (23.5%) |
Disability Class: Vision Difficulty
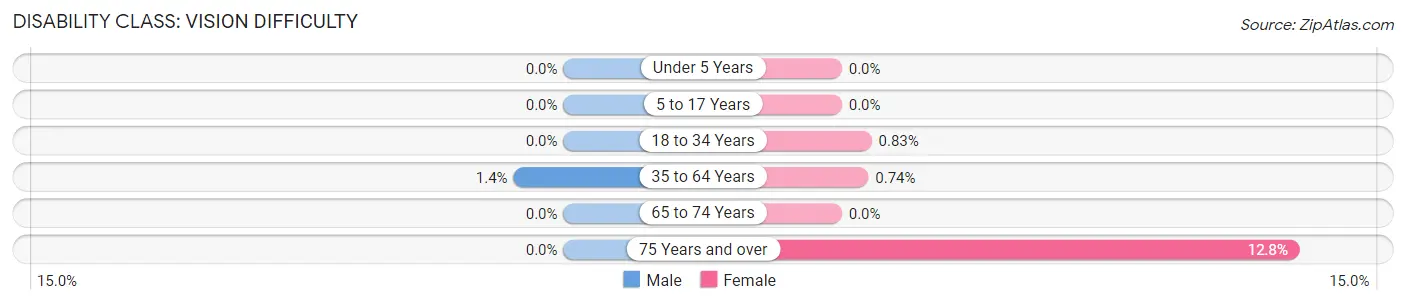
| Age Bracket | Male | Female |
| Under 5 Years | 0 (0.0%) | 0 (0.0%) |
| 5 to 17 Years | 0 (0.0%) | 0 (0.0%) |
| 18 to 34 Years | 0 (0.0%) | 4 (0.8%) |
| 35 to 64 Years | 8 (1.4%) | 4 (0.7%) |
| 65 to 74 Years | 0 (0.0%) | 0 (0.0%) |
| 75 Years and over | 0 (0.0%) | 13 (12.8%) |
Disability Class: Cognitive Difficulty
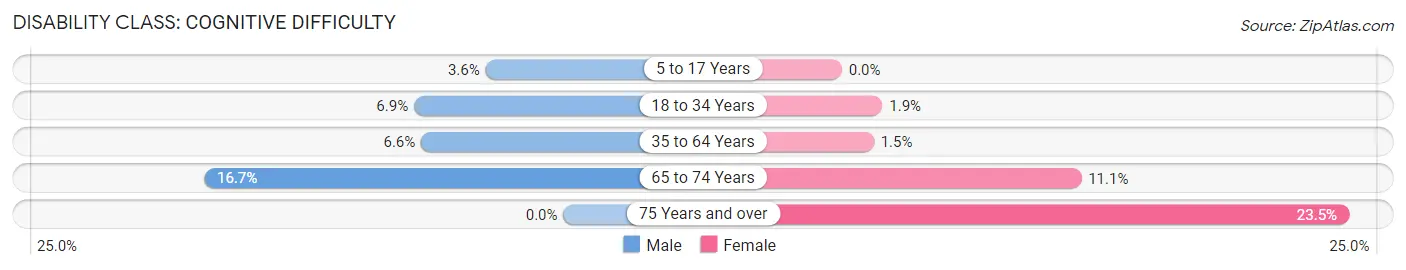
| Age Bracket | Male | Female |
| 5 to 17 Years | 13 (3.6%) | 0 (0.0%) |
| 18 to 34 Years | 38 (6.9%) | 9 (1.9%) |
| 35 to 64 Years | 38 (6.6%) | 8 (1.5%) |
| 65 to 74 Years | 34 (16.7%) | 21 (11.1%) |
| 75 Years and over | 0 (0.0%) | 24 (23.5%) |
Disability Class: Ambulatory Difficulty
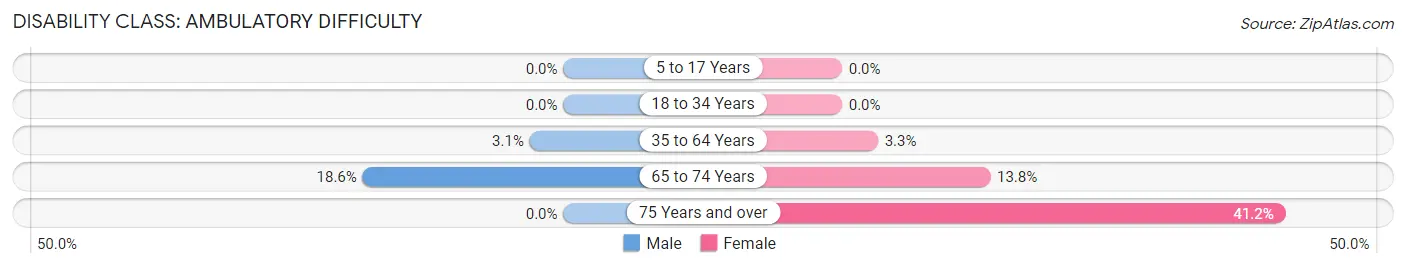
| Age Bracket | Male | Female |
| 5 to 17 Years | 0 (0.0%) | 0 (0.0%) |
| 18 to 34 Years | 0 (0.0%) | 0 (0.0%) |
| 35 to 64 Years | 18 (3.1%) | 18 (3.3%) |
| 65 to 74 Years | 38 (18.6%) | 26 (13.8%) |
| 75 Years and over | 0 (0.0%) | 42 (41.2%) |
Disability Class: Self-Care Difficulty
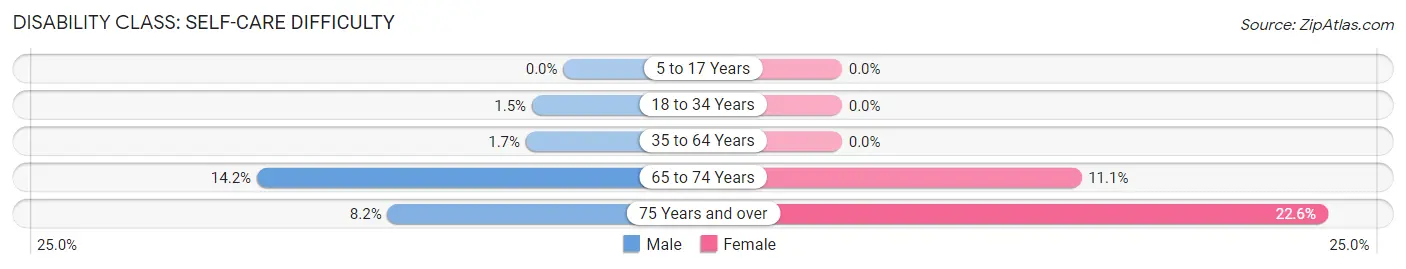
| Age Bracket | Male | Female |
| 5 to 17 Years | 0 (0.0%) | 0 (0.0%) |
| 18 to 34 Years | 8 (1.5%) | 0 (0.0%) |
| 35 to 64 Years | 10 (1.7%) | 0 (0.0%) |
| 65 to 74 Years | 29 (14.2%) | 21 (11.1%) |
| 75 Years and over | 12 (8.2%) | 23 (22.6%) |
Technology Access in Pomona
Computing Device Access in Pomona
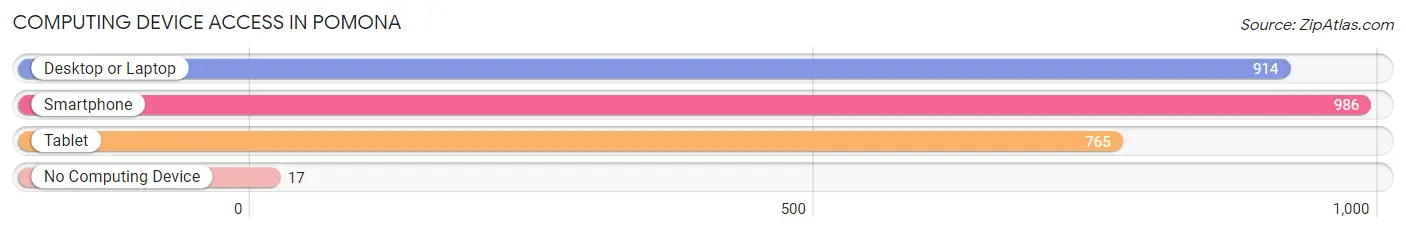
| Device Type | # Households | % Households |
| Desktop or Laptop | 914 | 86.8% |
| Smartphone | 986 | 93.6% |
| Tablet | 765 | 72.7% |
| No Computing Device | 17 | 1.6% |
| Total | 1,053 | 100.0% |
Internet Access in Pomona
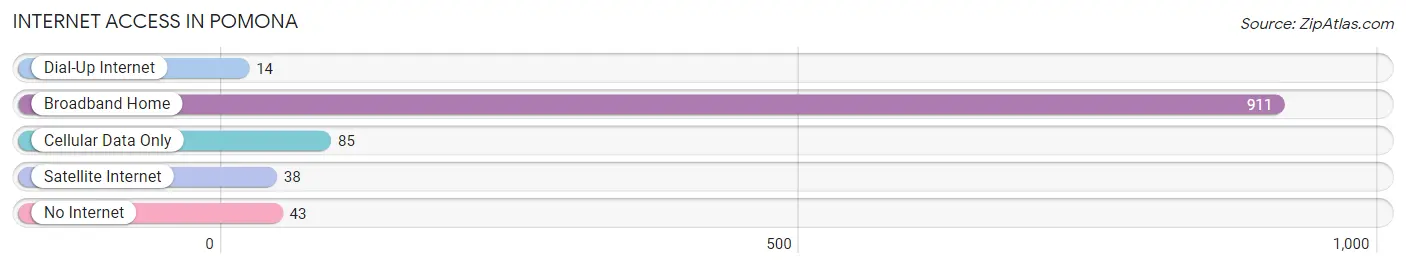
| Internet Type | # Households | % Households |
| Dial-Up Internet | 14 | 1.3% |
| Broadband Home | 911 | 86.5% |
| Cellular Data Only | 85 | 8.1% |
| Satellite Internet | 38 | 3.6% |
| No Internet | 43 | 4.1% |
| Total | 1,053 | 100.0% |
Pomona Summary
Pomona, New York is a hamlet located in the town of Ramapo in Rockland County, New York. It is located about 30 miles north of New York City and is part of the New York metropolitan area. The hamlet has a population of about 4,000 people and is home to a diverse population of people from different backgrounds.
History
Pomona was first settled in 1750 by Dutch settlers who named the area after the Roman goddess of fruit. The hamlet was originally part of the town of Haverstraw, but was later annexed to the town of Ramapo in 1791. The hamlet was an agricultural community for many years, with the main crops being apples, pears, and peaches. In the late 19th century, the hamlet began to develop into a residential community, with the construction of several homes and businesses.
Geography
Pomona is located in the town of Ramapo in Rockland County, New York. It is located about 30 miles north of New York City and is part of the New York metropolitan area. The hamlet is situated on the western side of the Ramapo Mountains and is bordered by the towns of Ramapo, Haverstraw, and Stony Point. The hamlet is located near the New York State Thruway and is accessible by car.
Economy
Pomona is a primarily residential community, with most of its residents commuting to nearby cities for work. The hamlet is home to several small businesses, including restaurants, retail stores, and professional services. The hamlet is also home to a number of corporate offices, including those of the pharmaceutical company Pfizer and the telecommunications company Verizon.
Demographics
As of the 2010 census, the population of Pomona was 4,000. The population is diverse, with the largest ethnic groups being White (63.3%), Hispanic or Latino (17.2%), and African American (14.2%). The median household income is $76,000, and the median home value is $400,000. The hamlet is served by the Ramapo Central School District.
Pomona is a small hamlet with a rich history and a diverse population. It is located in the town of Ramapo in Rockland County, New York and is part of the New York metropolitan area. The hamlet is primarily residential, with most of its residents commuting to nearby cities for work. The hamlet is home to several small businesses, corporate offices, and is served by the Ramapo Central School District. The population is diverse, with the largest ethnic groups being White, Hispanic or Latino, and African American. The median household income is $76,000, and the median home value is $400,000.
Common Questions
What is Per Capita Income in Pomona?
Per Capita income in Pomona is $63,773.
What is the Median Family Income in Pomona?
Median Family Income in Pomona is $179,667.
What is the Median Household income in Pomona?
Median Household Income in Pomona is $167,740.
What is Income or Wage Gap in Pomona?
Income or Wage Gap in Pomona is 55.3%.
Women in Pomona earn 44.7 cents for every dollar earned by a man.
What is Inequality or Gini Index in Pomona?
Inequality or Gini Index in Pomona is 0.44.
What is the Total Population of Pomona?
Total Population of Pomona is 3,837.
What is the Total Male Population of Pomona?
Total Male Population of Pomona is 2,008.
What is the Total Female Population of Pomona?
Total Female Population of Pomona is 1,829.
What is the Ratio of Males per 100 Females in Pomona?
There are 109.79 Males per 100 Females in Pomona.
What is the Ratio of Females per 100 Males in Pomona?
There are 91.09 Females per 100 Males in Pomona.
What is the Median Population Age in Pomona?
Median Population Age in Pomona is 32.1 Years.
What is the Average Family Size in Pomona
Average Family Size in Pomona is 4.1 People.
What is the Average Household Size in Pomona
Average Household Size in Pomona is 3.6 People.
How Large is the Labor Force in Pomona?
There are 1,829 People in the Labor Forcein in Pomona.
What is the Percentage of People in the Labor Force in Pomona?
64.6% of People are in the Labor Force in Pomona.
What is the Unemployment Rate in Pomona?
Unemployment Rate in Pomona is 8.6%.