North Hills, NY Map & Demographics
North Hills Map
North Hills Overview
$125,639
PER CAPITA INCOME
$214,600
AVG FAMILY INCOME
$182,401
AVG HOUSEHOLD INCOME
63.9%
WAGE / INCOME GAP [ % ]
36.1¢/ $1
WAGE / INCOME GAP [ $ ]
0.49
INEQUALITY / GINI INDEX
5,425
TOTAL POPULATION
2,395
MALE POPULATION
3,030
FEMALE POPULATION
79.04
MALES / 100 FEMALES
126.51
FEMALES / 100 MALES
55.8
MEDIAN AGE
2.7
AVG FAMILY SIZE
2.3
AVG HOUSEHOLD SIZE
2,520
LABOR FORCE [ PEOPLE ]
55.0%
PERCENT IN LABOR FORCE
1.9%
UNEMPLOYMENT RATE
North Hills Area Codes
Income in North Hills
Income Overview in North Hills
Per Capita Income in North Hills is $125,639, while median incomes of families and households are $214,600 and $182,401 respectively.
| Characteristic | Number | Measure |
| Per Capita Income | 5,425 | $125,639 |
| Median Family Income | 1,820 | $214,600 |
| Mean Family Income | 1,820 | $350,714 |
| Median Household Income | 2,319 | $182,401 |
| Mean Household Income | 2,319 | $299,513 |
| Income Deficit | 1,820 | $0 |
| Wage / Income Gap (%) | 5,425 | 63.92% |
| Wage / Income Gap ($) | 5,425 | 36.08¢ per $1 |
| Gini / Inequality Index | 5,425 | 0.49 |
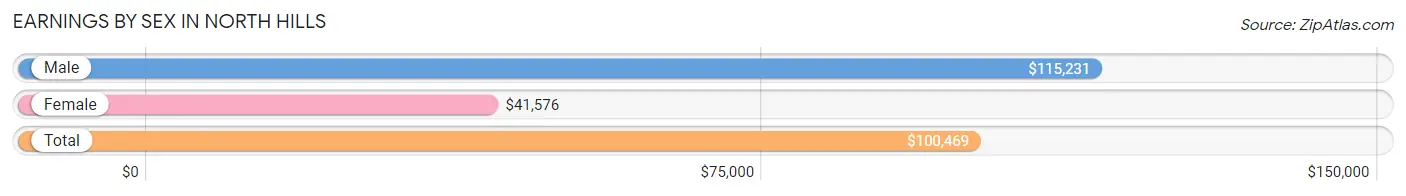
Earnings by Sex in North Hills
Average Earnings in North Hills are $100,469, $115,231 for men and $41,576 for women, a difference of 63.9%.
| Sex | Number | Average Earnings |
| Male | 1,596 (61.1%) | $115,231 |
| Female | 1,015 (38.9%) | $41,576 |
| Total | 2,611 (100.0%) | $100,469 |
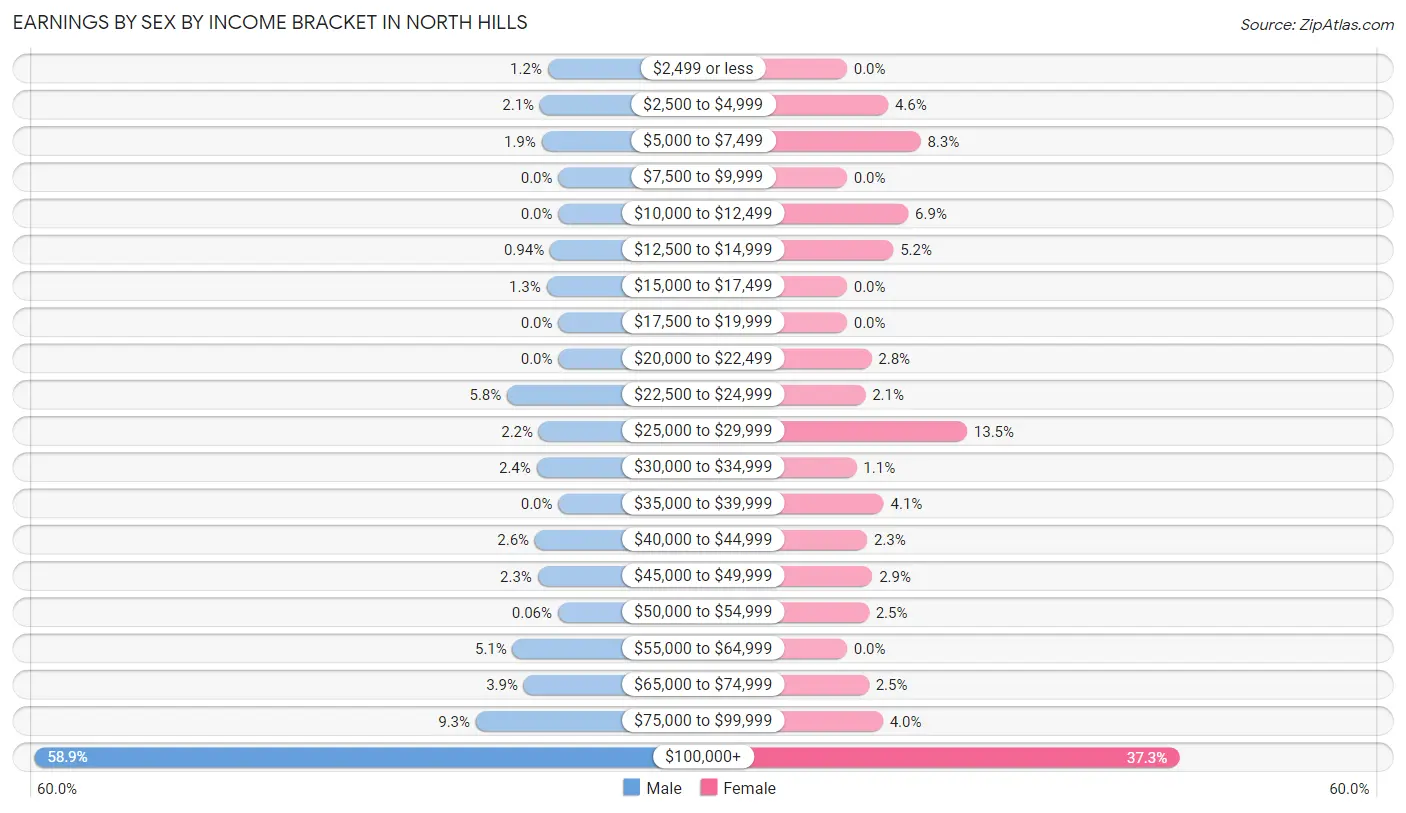
Earnings by Sex by Income Bracket in North Hills
The most common earnings brackets in North Hills are $100,000+ for men (940 | 58.9%) and $100,000+ for women (379 | 37.3%).
| Income | Male | Female |
| $2,499 or less | 19 (1.2%) | 0 (0.0%) |
| $2,500 to $4,999 | 33 (2.1%) | 47 (4.6%) |
| $5,000 to $7,499 | 30 (1.9%) | 84 (8.3%) |
| $7,500 to $9,999 | 0 (0.0%) | 0 (0.0%) |
| $10,000 to $12,499 | 0 (0.0%) | 70 (6.9%) |
| $12,500 to $14,999 | 15 (0.9%) | 53 (5.2%) |
| $15,000 to $17,499 | 21 (1.3%) | 0 (0.0%) |
| $17,500 to $19,999 | 0 (0.0%) | 0 (0.0%) |
| $20,000 to $22,499 | 0 (0.0%) | 28 (2.8%) |
| $22,500 to $24,999 | 92 (5.8%) | 21 (2.1%) |
| $25,000 to $29,999 | 35 (2.2%) | 137 (13.5%) |
| $30,000 to $34,999 | 39 (2.4%) | 11 (1.1%) |
| $35,000 to $39,999 | 0 (0.0%) | 42 (4.1%) |
| $40,000 to $44,999 | 42 (2.6%) | 23 (2.3%) |
| $45,000 to $49,999 | 37 (2.3%) | 29 (2.9%) |
| $50,000 to $54,999 | 1 (0.1%) | 25 (2.5%) |
| $55,000 to $64,999 | 82 (5.1%) | 0 (0.0%) |
| $65,000 to $74,999 | 62 (3.9%) | 25 (2.5%) |
| $75,000 to $99,999 | 148 (9.3%) | 41 (4.0%) |
| $100,000+ | 940 (58.9%) | 379 (37.3%) |
| Total | 1,596 (100.0%) | 1,015 (100.0%) |
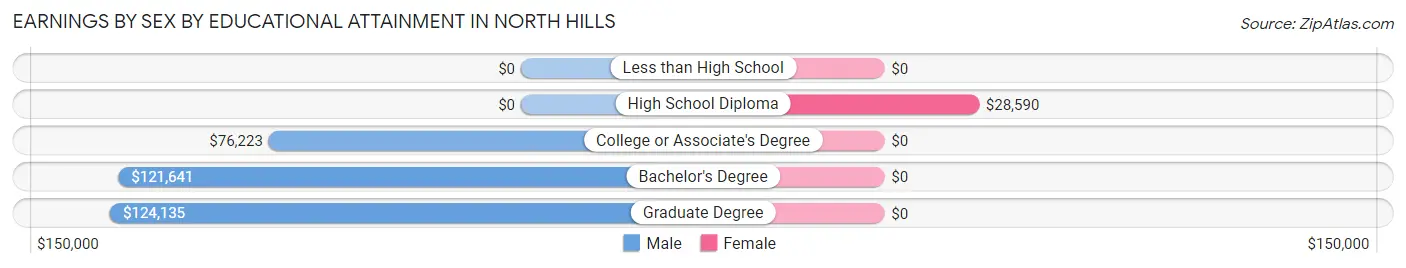
Earnings by Sex by Educational Attainment in North Hills
| Educational Attainment | Male Income | Female Income |
| Less than High School | - | - |
| High School Diploma | - | - |
| College or Associate's Degree | $76,223 | $0 |
| Bachelor's Degree | $121,641 | $0 |
| Graduate Degree | $124,135 | $0 |
| Total | $115,868 | $0 |
Family Income in North Hills
Family Income Brackets in North Hills
According to the North Hills family income data, there are 1,046 families falling into the $200,000+ income range, which is the most common income bracket and makes up 57.5% of all families.
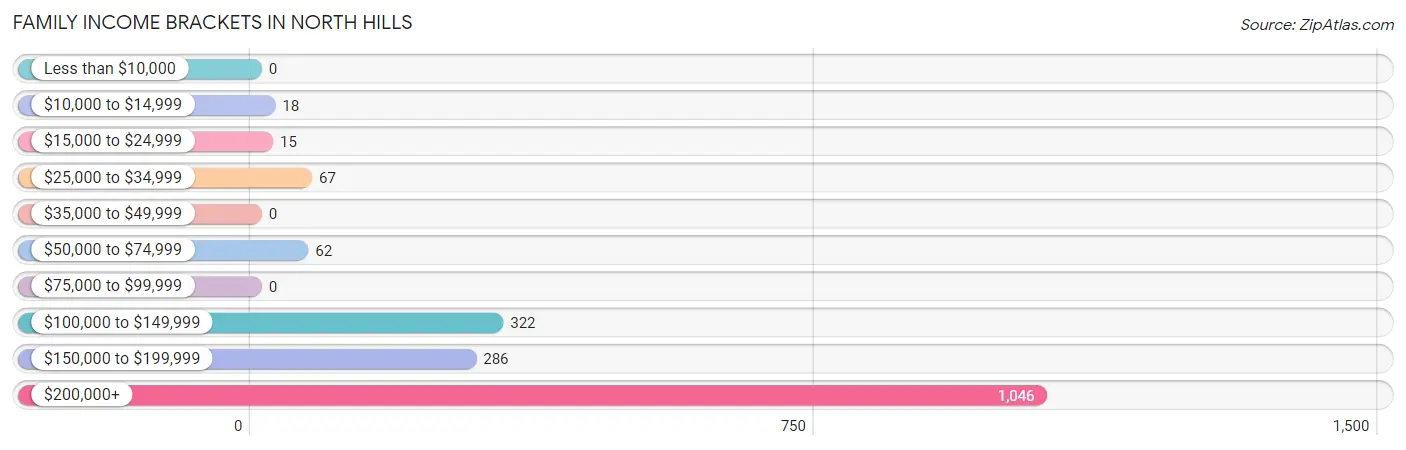
| Income Bracket | # Families | % Families |
| Less than $10,000 | 0 | 0.0% |
| $10,000 to $14,999 | 18 | 1.0% |
| $15,000 to $24,999 | 15 | 0.8% |
| $25,000 to $34,999 | 67 | 3.7% |
| $35,000 to $49,999 | 0 | 0.0% |
| $50,000 to $74,999 | 62 | 3.4% |
| $75,000 to $99,999 | 0 | 0.0% |
| $100,000 to $149,999 | 322 | 17.7% |
| $150,000 to $199,999 | 286 | 15.7% |
| $200,000+ | 1,046 | 57.5% |
Family Income by Famaliy Size in North Hills
3-person families (369 | 20.3%) account for the highest median family income in North Hills with $250,001 per family, while 2-person families (1,058 | 58.1%) have the highest median income of $107,300 per family member.
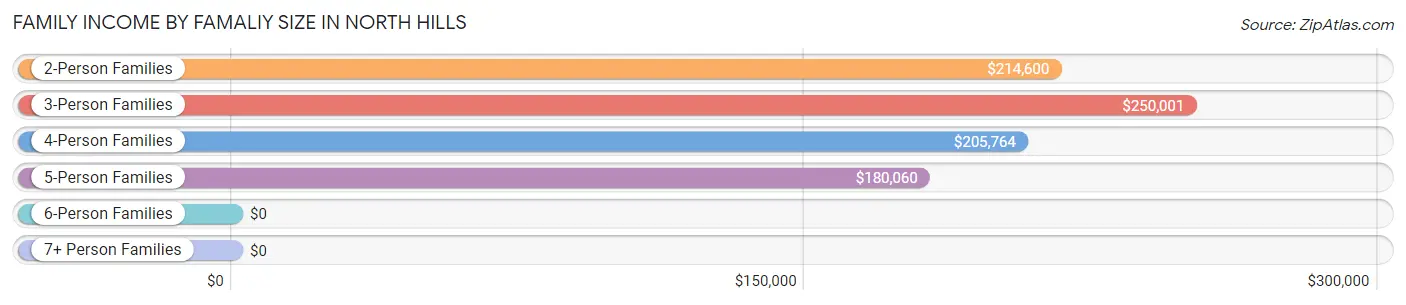
| Income Bracket | # Families | Median Income |
| 2-Person Families | 1,058 (58.1%) | $214,600 |
| 3-Person Families | 369 (20.3%) | $250,001 |
| 4-Person Families | 325 (17.9%) | $205,764 |
| 5-Person Families | 43 (2.4%) | $180,060 |
| 6-Person Families | 25 (1.4%) | $0 |
| 7+ Person Families | 0 (0.0%) | $0 |
| Total | 1,820 (100.0%) | $214,600 |
Family Income by Number of Earners in North Hills
The median family income in North Hills is $214,600, with families comprising 2 earners (705) having the highest median family income of $250,001, while families with 3+ earners (94) have the lowest median family income of $180,595, accounting for 38.7% and 5.2% of families, respectively.
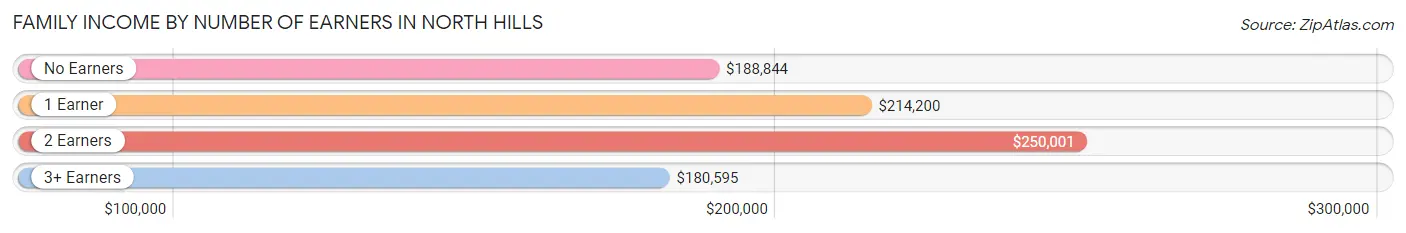
| Number of Earners | # Families | Median Income |
| No Earners | 341 (18.7%) | $188,844 |
| 1 Earner | 680 (37.4%) | $214,200 |
| 2 Earners | 705 (38.7%) | $250,001 |
| 3+ Earners | 94 (5.2%) | $180,595 |
| Total | 1,820 (100.0%) | $214,600 |
Household Income in North Hills
Household Income Brackets in North Hills
With 1,102 households falling in the category, the $200,000+ income range is the most frequent in North Hills, accounting for 47.5% of all households.
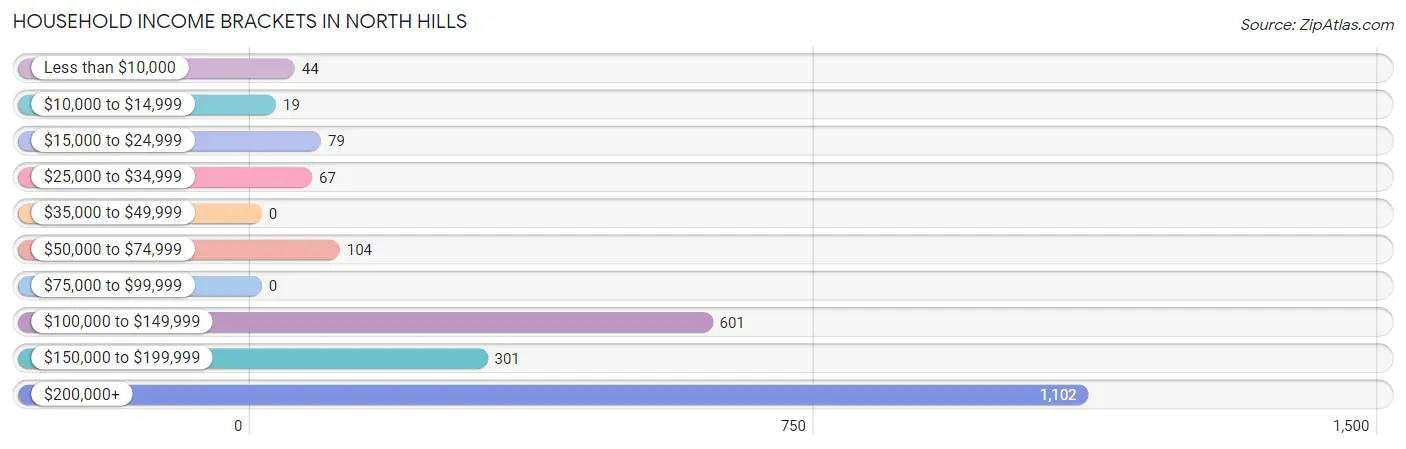
| Income Bracket | # Households | % Households |
| Less than $10,000 | 44 | 1.9% |
| $10,000 to $14,999 | 19 | 0.8% |
| $15,000 to $24,999 | 79 | 3.4% |
| $25,000 to $34,999 | 67 | 2.9% |
| $35,000 to $49,999 | 0 | 0.0% |
| $50,000 to $74,999 | 104 | 4.5% |
| $75,000 to $99,999 | 0 | 0.0% |
| $100,000 to $149,999 | 601 | 25.9% |
| $150,000 to $199,999 | 301 | 13.0% |
| $200,000+ | 1,102 | 47.5% |
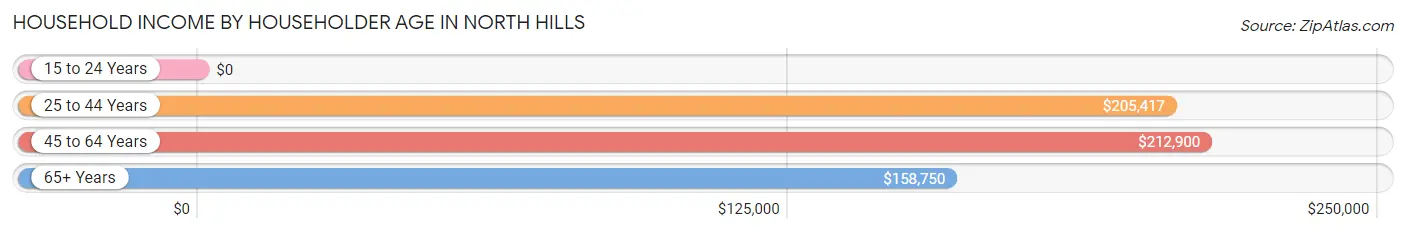
Household Income by Householder Age in North Hills
The median household income in North Hills is $182,401, with the highest median household income of $212,900 found in the 45 to 64 years age bracket for the primary householder. A total of 746 households (32.2%) fall into this category.
| Income Bracket | # Households | Median Income |
| 15 to 24 Years | 0 (0.0%) | $0 |
| 25 to 44 Years | 366 (15.8%) | $205,417 |
| 45 to 64 Years | 746 (32.2%) | $212,900 |
| 65+ Years | 1,207 (52.0%) | $158,750 |
| Total | 2,319 (100.0%) | $182,401 |
Poverty in North Hills
Income Below Poverty by Sex and Age in North Hills
With 2.5% poverty level for males and 3.9% for females among the residents of North Hills, 16 and 17 year old males and 75 year old and over females are the most vulnerable to poverty, with 18 males (100.0%) and 53 females (11.0%) in their respective age groups living below the poverty level.
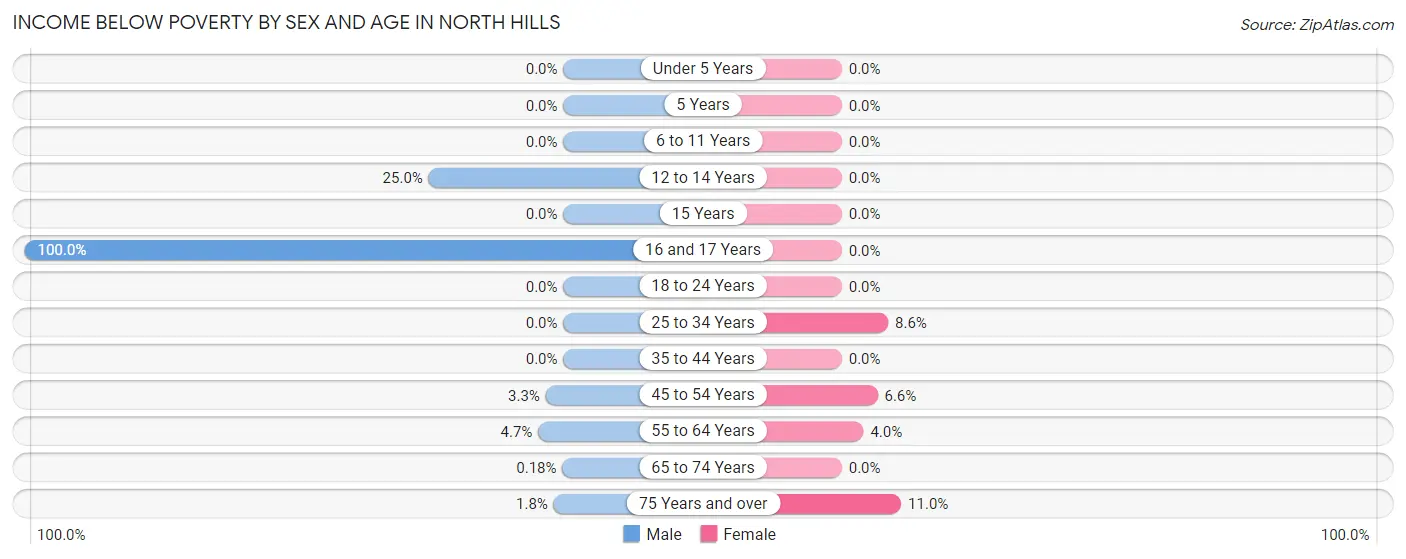
| Age Bracket | Male | Female |
| Under 5 Years | 0 (0.0%) | 0 (0.0%) |
| 5 Years | 0 (0.0%) | 0 (0.0%) |
| 6 to 11 Years | 0 (0.0%) | 0 (0.0%) |
| 12 to 14 Years | 7 (25.0%) | 0 (0.0%) |
| 15 Years | 0 (0.0%) | 0 (0.0%) |
| 16 and 17 Years | 18 (100.0%) | 0 (0.0%) |
| 18 to 24 Years | 0 (0.0%) | 0 (0.0%) |
| 25 to 34 Years | 0 (0.0%) | 35 (8.6%) |
| 35 to 44 Years | 0 (0.0%) | 0 (0.0%) |
| 45 to 54 Years | 8 (3.3%) | 11 (6.6%) |
| 55 to 64 Years | 19 (4.7%) | 19 (4.0%) |
| 65 to 74 Years | 1 (0.2%) | 0 (0.0%) |
| 75 Years and over | 7 (1.8%) | 53 (11.0%) |
| Total | 60 (2.5%) | 118 (3.9%) |
Income Above Poverty by Sex and Age in North Hills
According to the poverty statistics in North Hills, males aged under 5 years and females aged under 5 years are the age groups that are most secure financially, with 100.0% of males and 100.0% of females in these age groups living above the poverty line.
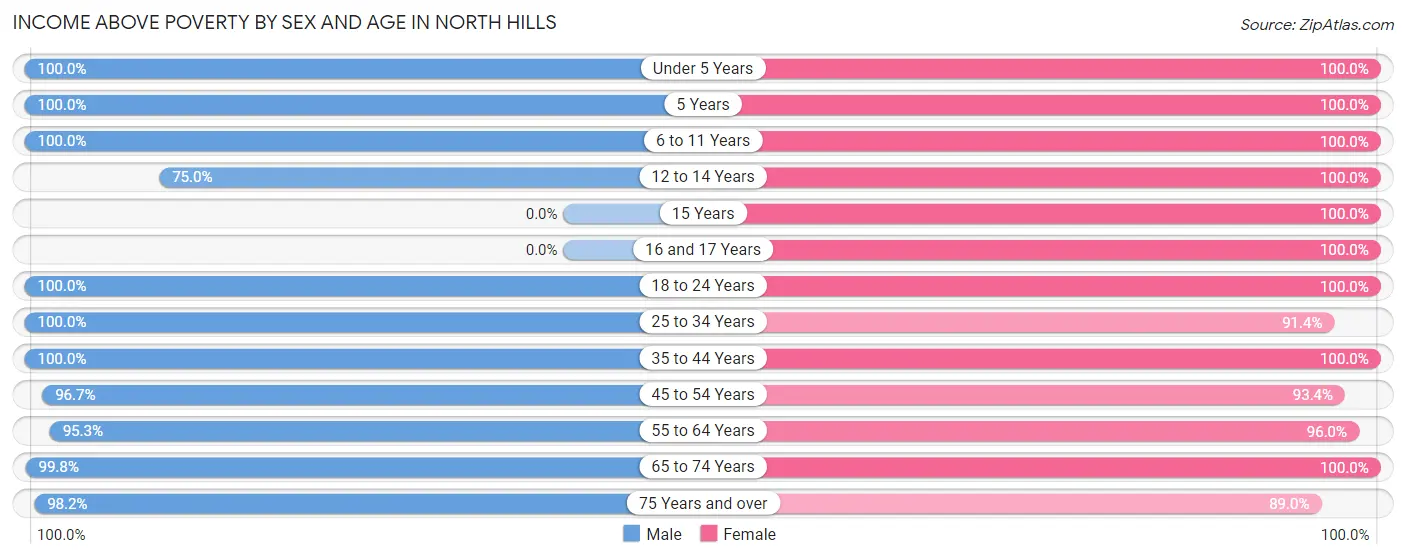
| Age Bracket | Male | Female |
| Under 5 Years | 86 (100.0%) | 216 (100.0%) |
| 5 Years | 13 (100.0%) | 48 (100.0%) |
| 6 to 11 Years | 129 (100.0%) | 174 (100.0%) |
| 12 to 14 Years | 21 (75.0%) | 134 (100.0%) |
| 15 Years | 0 (0.0%) | 15 (100.0%) |
| 16 and 17 Years | 0 (0.0%) | 21 (100.0%) |
| 18 to 24 Years | 97 (100.0%) | 75 (100.0%) |
| 25 to 34 Years | 191 (100.0%) | 372 (91.4%) |
| 35 to 44 Years | 248 (100.0%) | 287 (100.0%) |
| 45 to 54 Years | 236 (96.7%) | 155 (93.4%) |
| 55 to 64 Years | 388 (95.3%) | 452 (96.0%) |
| 65 to 74 Years | 541 (99.8%) | 535 (100.0%) |
| 75 Years and over | 385 (98.2%) | 428 (89.0%) |
| Total | 2,335 (97.5%) | 2,912 (96.1%) |
Income Below Poverty Among Married-Couple Families in North Hills
The poverty statistics for married-couple families in North Hills show that 1.5% or 26 of the total 1,722 families live below the poverty line. Families with 1 or 2 children have the highest poverty rate of 5.2%, comprising of 26 families. On the other hand, families with no children have the lowest poverty rate of 0.0%, which includes 0 families.
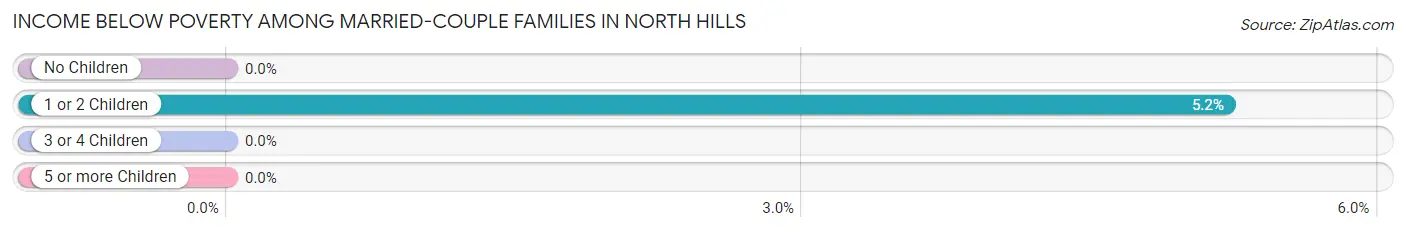
| Children | Above Poverty | Below Poverty |
| No Children | 1,184 (100.0%) | 0 (0.0%) |
| 1 or 2 Children | 473 (94.8%) | 26 (5.2%) |
| 3 or 4 Children | 39 (100.0%) | 0 (0.0%) |
| 5 or more Children | 0 (0.0%) | 0 (0.0%) |
| Total | 1,696 (98.5%) | 26 (1.5%) |
Income Below Poverty Among Single-Parent Households in North Hills
| Children | Single Father | Single Mother |
| No Children | 0 (0.0%) | 0 (0.0%) |
| 1 or 2 Children | 0 (0.0%) | 0 (0.0%) |
| 3 or 4 Children | 0 (0.0%) | 0 (0.0%) |
| 5 or more Children | 0 (0.0%) | 0 (0.0%) |
| Total | 0 (0.0%) | 0 (0.0%) |
Income Below Poverty Among Married-Couple vs Single-Parent Households in North Hills
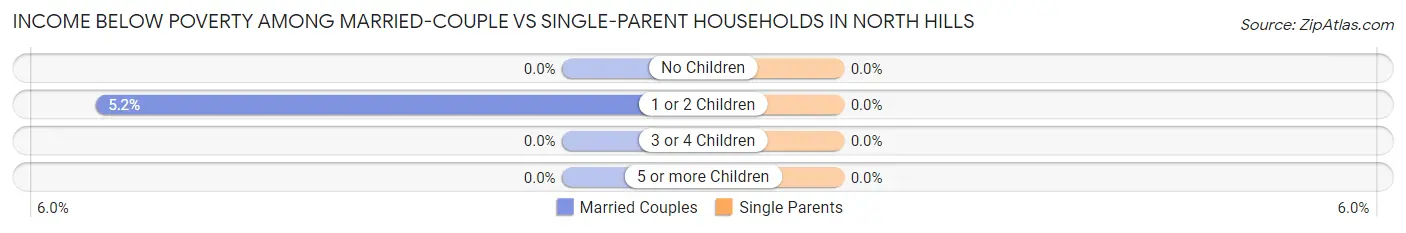
| Children | Married-Couple Families | Single-Parent Households |
| No Children | 0 (0.0%) | 0 (0.0%) |
| 1 or 2 Children | 26 (5.2%) | 0 (0.0%) |
| 3 or 4 Children | 0 (0.0%) | 0 (0.0%) |
| 5 or more Children | 0 (0.0%) | 0 (0.0%) |
| Total | 26 (1.5%) | 0 (0.0%) |
Race in North Hills
The most populous races in North Hills are White / Caucasian (3,683 | 67.9%), Asian (1,630 | 30.0%), and Hispanic or Latino (376 | 6.9%).
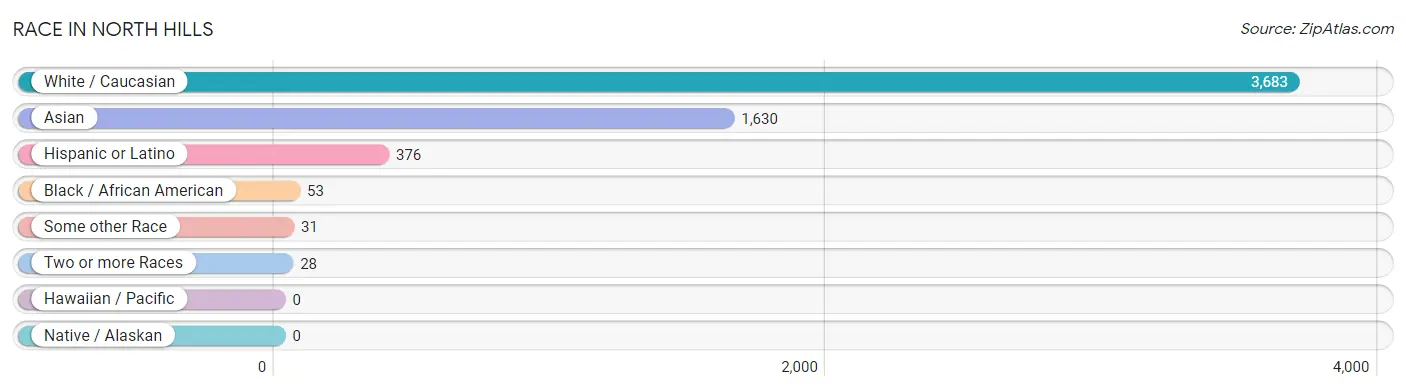
| Race | # Population | % Population |
| Asian | 1,630 | 30.0% |
| Black / African American | 53 | 1.0% |
| Hawaiian / Pacific | 0 | 0.0% |
| Hispanic or Latino | 376 | 6.9% |
| Native / Alaskan | 0 | 0.0% |
| White / Caucasian | 3,683 | 67.9% |
| Two or more Races | 28 | 0.5% |
| Some other Race | 31 | 0.6% |
| Total | 5,425 | 100.0% |
Ancestry in North Hills
The most populous ancestries reported in North Hills are Indian (Asian) (629 | 11.6%), Italian (511 | 9.4%), Burmese (458 | 8.4%), Thai (425 | 7.8%), and Russian (387 | 7.1%), together accounting for 44.4% of all North Hills residents.
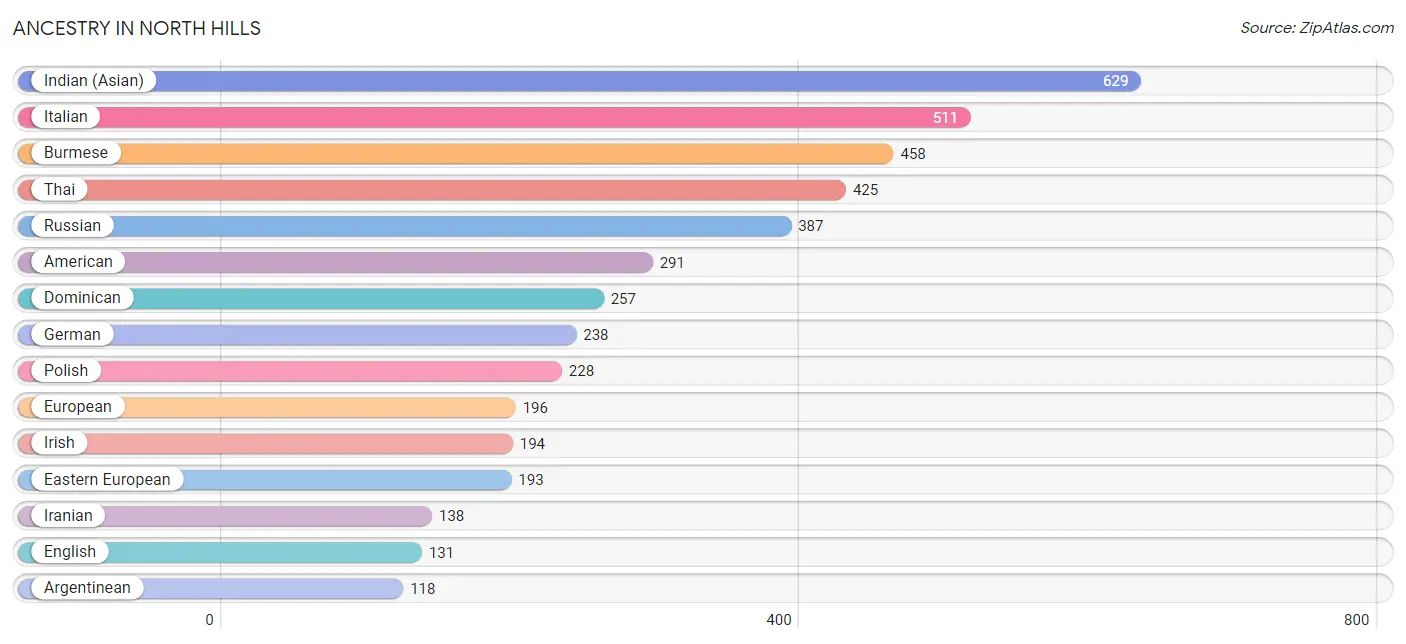
| Ancestry | # Population | % Population |
| American | 291 | 5.4% |
| Arab | 18 | 0.3% |
| Argentinean | 118 | 2.2% |
| Austrian | 37 | 0.7% |
| Bhutanese | 41 | 0.8% |
| Burmese | 458 | 8.4% |
| Dominican | 257 | 4.7% |
| Dutch | 18 | 0.3% |
| Eastern European | 193 | 3.6% |
| English | 131 | 2.4% |
| European | 196 | 3.6% |
| Filipino | 65 | 1.2% |
| German | 238 | 4.4% |
| Greek | 109 | 2.0% |
| Guyanese | 28 | 0.5% |
| Hungarian | 43 | 0.8% |
| Indian (Asian) | 629 | 11.6% |
| Iranian | 138 | 2.5% |
| Irish | 194 | 3.6% |
| Italian | 511 | 9.4% |
| Korean | 52 | 1.0% |
| Lithuanian | 17 | 0.3% |
| Norwegian | 23 | 0.4% |
| Polish | 228 | 4.2% |
| Romanian | 52 | 1.0% |
| Russian | 387 | 7.1% |
| South American | 118 | 2.2% |
| Swedish | 13 | 0.2% |
| Syrian | 18 | 0.3% |
| Thai | 425 | 7.8% |
| Turkish | 18 | 0.3% |
| West Indian | 1 | 0.0% | View All 32 Rows |
Immigrants in North Hills
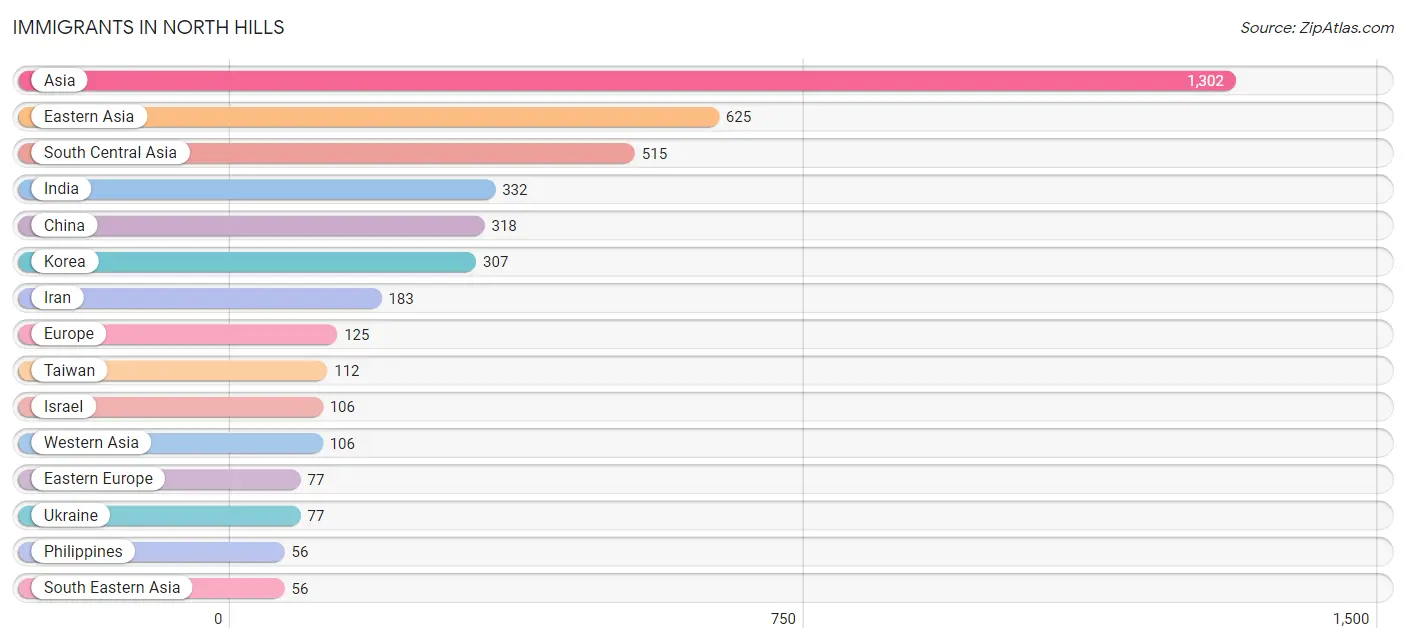
The most numerous immigrant groups reported in North Hills came from Asia (1,302 | 24.0%), Eastern Asia (625 | 11.5%), South Central Asia (515 | 9.5%), India (332 | 6.1%), and China (318 | 5.9%), together accounting for 57.0% of all North Hills residents.
| Immigration Origin | # Population | % Population |
| Asia | 1,302 | 24.0% |
| Caribbean | 1 | 0.0% |
| Central America | 1 | 0.0% |
| China | 318 | 5.9% |
| Colombia | 17 | 0.3% |
| Eastern Asia | 625 | 11.5% |
| Eastern Europe | 77 | 1.4% |
| El Salvador | 1 | 0.0% |
| Europe | 125 | 2.3% |
| Grenada | 1 | 0.0% |
| Guyana | 28 | 0.5% |
| India | 332 | 6.1% |
| Iran | 183 | 3.4% |
| Israel | 106 | 1.9% |
| Korea | 307 | 5.7% |
| Latin America | 47 | 0.9% |
| Northern Europe | 48 | 0.9% |
| Norway | 23 | 0.4% |
| Philippines | 56 | 1.0% |
| South America | 45 | 0.8% |
| South Central Asia | 515 | 9.5% |
| South Eastern Asia | 56 | 1.0% |
| Taiwan | 112 | 2.1% |
| Ukraine | 77 | 1.4% |
| Western Asia | 106 | 1.9% | View All 25 Rows |
Sex and Age in North Hills
Sex and Age in North Hills
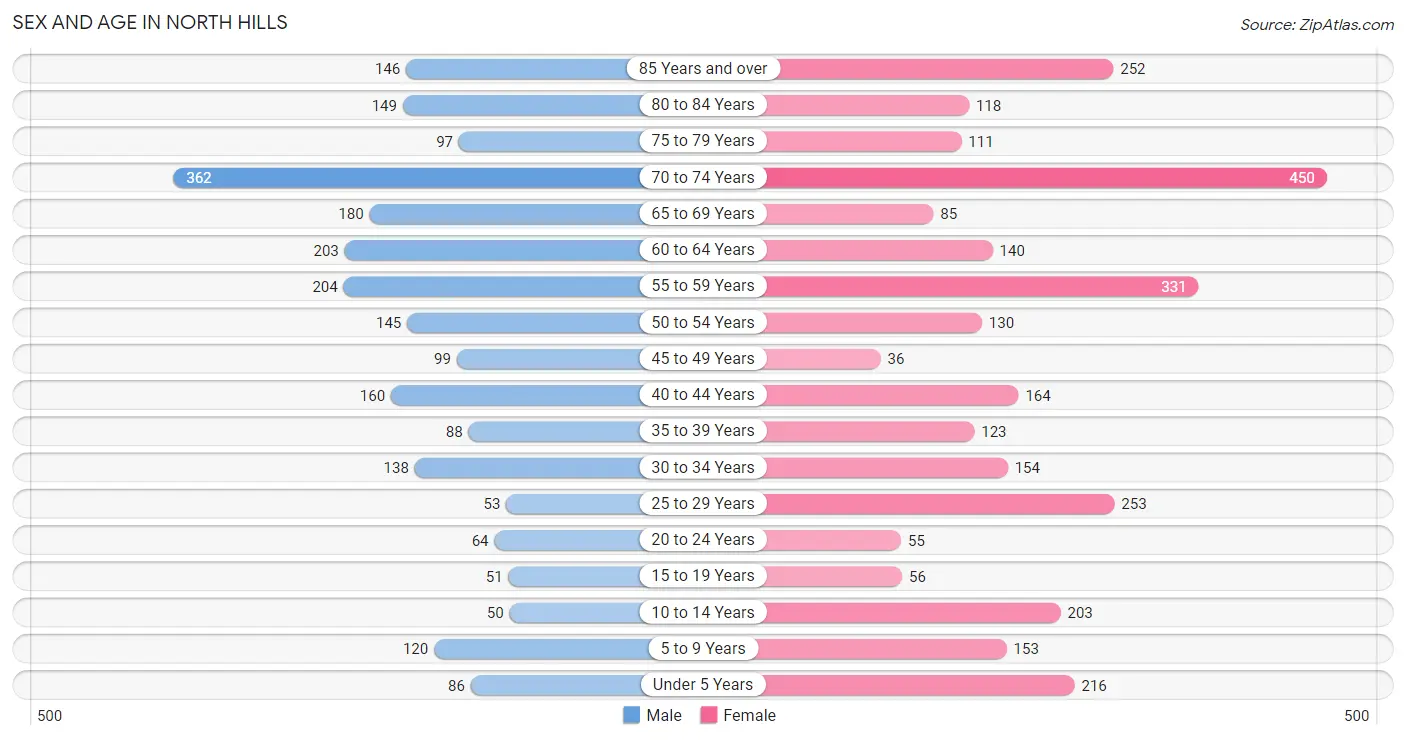
The most populous age groups in North Hills are 70 to 74 Years (362 | 15.1%) for men and 70 to 74 Years (450 | 14.8%) for women.
| Age Bracket | Male | Female |
| Under 5 Years | 86 (3.6%) | 216 (7.1%) |
| 5 to 9 Years | 120 (5.0%) | 153 (5.1%) |
| 10 to 14 Years | 50 (2.1%) | 203 (6.7%) |
| 15 to 19 Years | 51 (2.1%) | 56 (1.8%) |
| 20 to 24 Years | 64 (2.7%) | 55 (1.8%) |
| 25 to 29 Years | 53 (2.2%) | 253 (8.4%) |
| 30 to 34 Years | 138 (5.8%) | 154 (5.1%) |
| 35 to 39 Years | 88 (3.7%) | 123 (4.1%) |
| 40 to 44 Years | 160 (6.7%) | 164 (5.4%) |
| 45 to 49 Years | 99 (4.1%) | 36 (1.2%) |
| 50 to 54 Years | 145 (6.0%) | 130 (4.3%) |
| 55 to 59 Years | 204 (8.5%) | 331 (10.9%) |
| 60 to 64 Years | 203 (8.5%) | 140 (4.6%) |
| 65 to 69 Years | 180 (7.5%) | 85 (2.8%) |
| 70 to 74 Years | 362 (15.1%) | 450 (14.8%) |
| 75 to 79 Years | 97 (4.1%) | 111 (3.7%) |
| 80 to 84 Years | 149 (6.2%) | 118 (3.9%) |
| 85 Years and over | 146 (6.1%) | 252 (8.3%) |
| Total | 2,395 (100.0%) | 3,030 (100.0%) |
Families and Households in North Hills
Median Family Size in North Hills
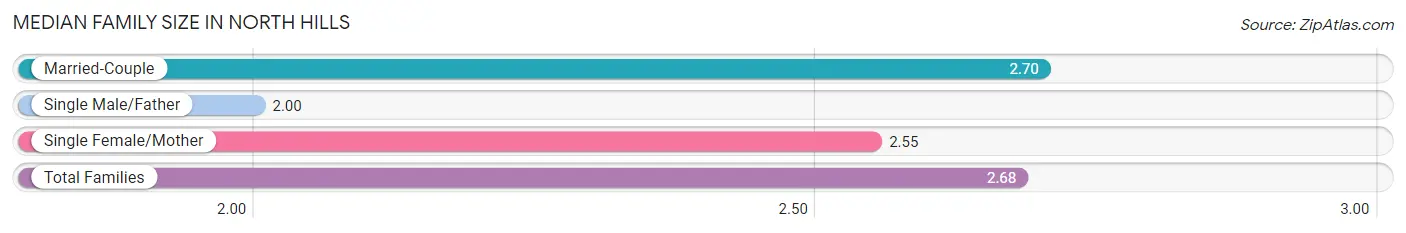
The median family size in North Hills is 2.68 persons per family, with married-couple families (1,722 | 94.6%) accounting for the largest median family size of 2.7 persons per family. On the other hand, single male/father families (18 | 1.0%) represent the smallest median family size with 2.00 persons per family.
| Family Type | # Families | Family Size |
| Married-Couple | 1,722 (94.6%) | 2.70 |
| Single Male/Father | 18 (1.0%) | 2.00 |
| Single Female/Mother | 80 (4.4%) | 2.55 |
| Total Families | 1,820 (100.0%) | 2.68 |
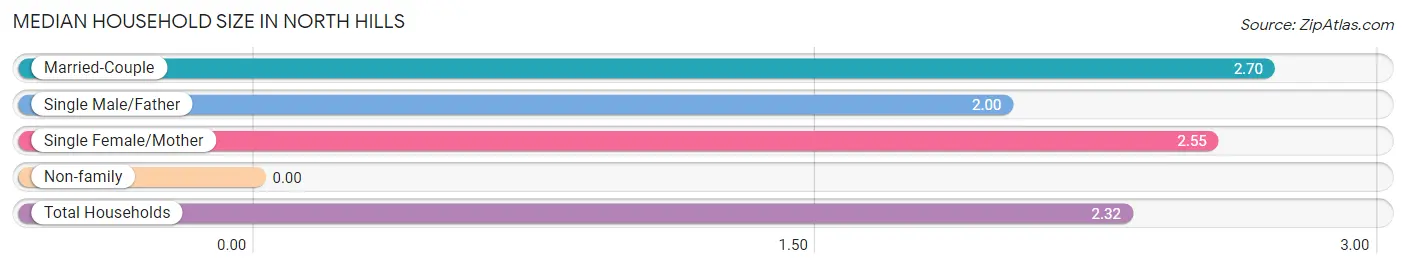
Median Household Size in North Hills
| Household Type | # Households | Household Size |
| Married-Couple | 1,722 (74.3%) | 2.70 |
| Single Male/Father | 18 (0.8%) | 2.00 |
| Single Female/Mother | 80 (3.5%) | 2.55 |
| Non-family | 499 (21.5%) | - |
| Total Households | 2,319 (100.0%) | 2.32 |
Household Size by Marriage Status in North Hills
Out of a total of 2,319 households in North Hills, 1,820 (78.5%) are family households, while 499 (21.5%) are nonfamily households. The most numerous type of family households are 2-person households, comprising 1,058, and the most common type of nonfamily households are 1-person households, comprising 499.
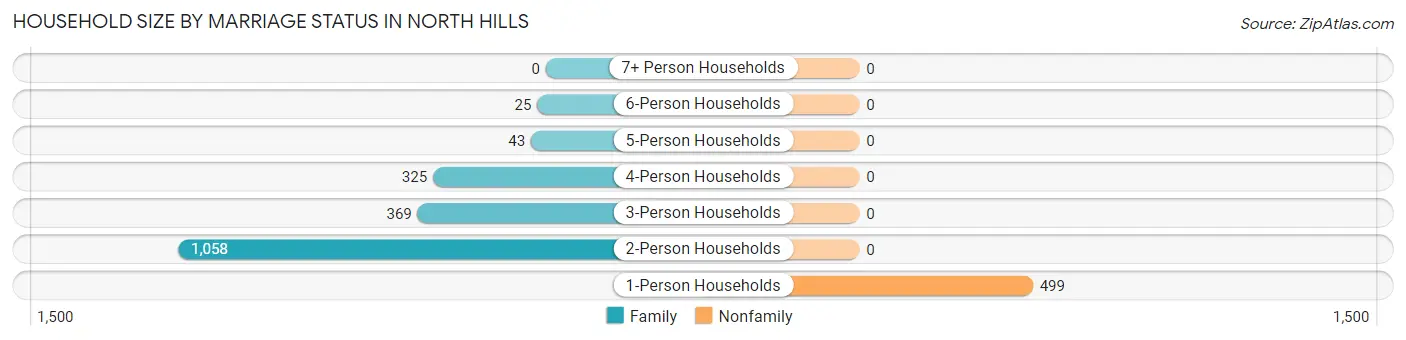
| Household Size | Family Households | Nonfamily Households |
| 1-Person Households | - | 499 (21.5%) |
| 2-Person Households | 1,058 (45.6%) | 0 (0.0%) |
| 3-Person Households | 369 (15.9%) | 0 (0.0%) |
| 4-Person Households | 325 (14.0%) | 0 (0.0%) |
| 5-Person Households | 43 (1.8%) | 0 (0.0%) |
| 6-Person Households | 25 (1.1%) | 0 (0.0%) |
| 7+ Person Households | 0 (0.0%) | 0 (0.0%) |
| Total | 1,820 (78.5%) | 499 (21.5%) |
Female Fertility in North Hills
Fertility by Age in North Hills
Average fertility rate in North Hills is 123.0 births per 1,000 women. Women in the age bracket of 35 to 50 years have the highest fertility rate with 183.0 births per 1,000 women. Women in the age bracket of 35 to 50 years acount for 59.1% of all women with births.
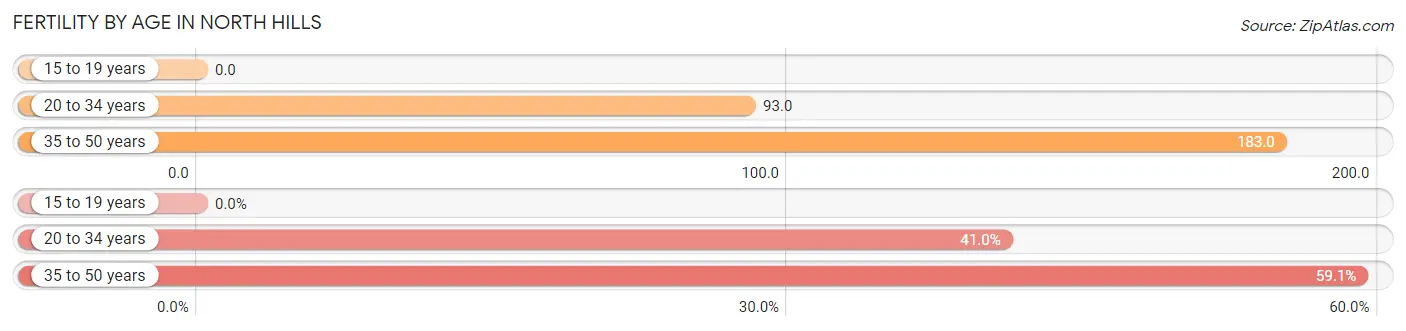
| Age Bracket | Women with Births | Births / 1,000 Women |
| 15 to 19 years | 0 (0.0%) | 0.0 |
| 20 to 34 years | 43 (40.9%) | 93.0 |
| 35 to 50 years | 62 (59.1%) | 183.0 |
| Total | 105 (100.0%) | 123.0 |
Fertility by Age by Marriage Status in North Hills
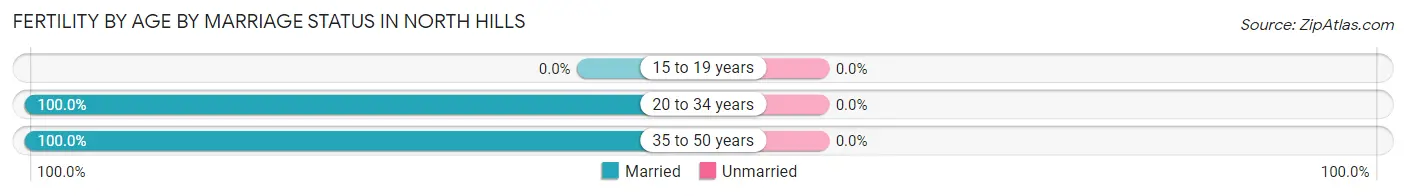
| Age Bracket | Married | Unmarried |
| 15 to 19 years | 0 (0.0%) | 0 (0.0%) |
| 20 to 34 years | 43 (100.0%) | 0 (0.0%) |
| 35 to 50 years | 62 (100.0%) | 0 (0.0%) |
| Total | 105 (100.0%) | 0 (0.0%) |
Fertility by Education in North Hills
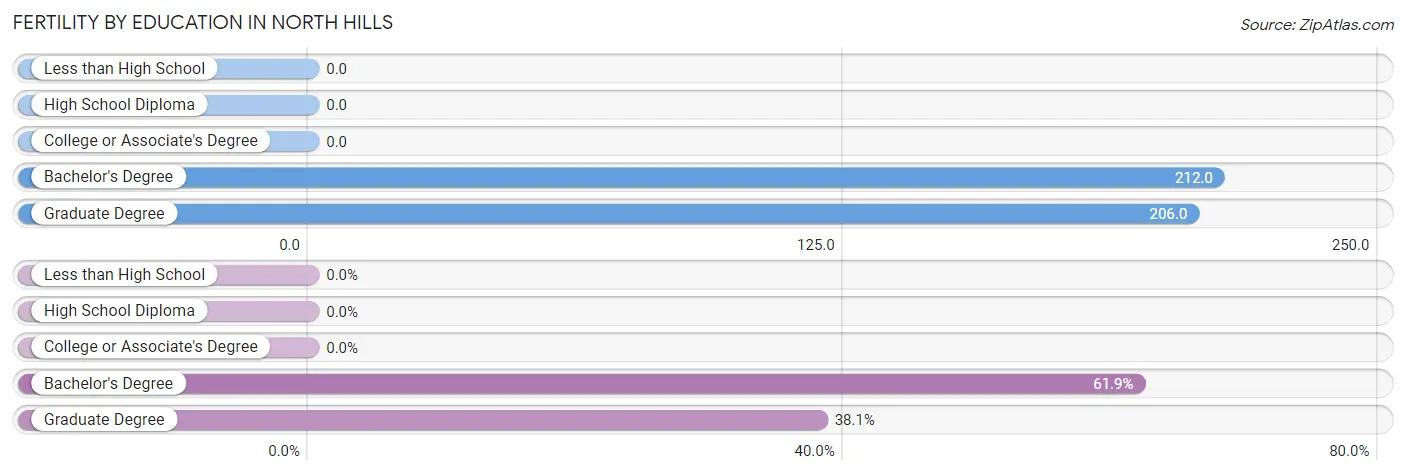
| Educational Attainment | Women with Births | Births / 1,000 Women |
| Less than High School | 0 (0.0%) | 0.0 |
| High School Diploma | 0 (0.0%) | 0.0 |
| College or Associate's Degree | 0 (0.0%) | 0.0 |
| Bachelor's Degree | 65 (61.9%) | 212.0 |
| Graduate Degree | 40 (38.1%) | 206.0 |
| Total | 105 (100.0%) | 123.0 |
Fertility by Education by Marriage Status in North Hills
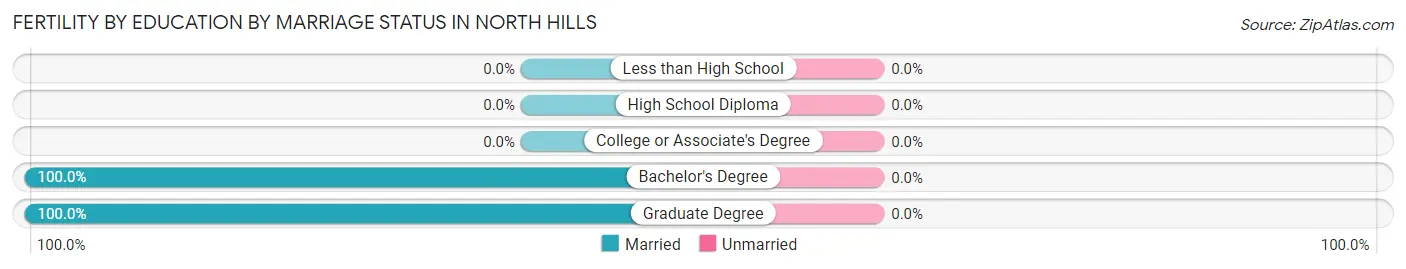
| Educational Attainment | Married | Unmarried |
| Less than High School | 0 (0.0%) | 0 (0.0%) |
| High School Diploma | 0 (0.0%) | 0 (0.0%) |
| College or Associate's Degree | 0 (0.0%) | 0 (0.0%) |
| Bachelor's Degree | 65 (100.0%) | 0 (0.0%) |
| Graduate Degree | 40 (100.0%) | 0 (0.0%) |
| Total | 105 (100.0%) | 0 (0.0%) |
Employment Characteristics in North Hills
Employment by Class of Employer in North Hills
Among the 2,243 employed individuals in North Hills, private company employees (1,336 | 59.6%), self-employed (incorporated) (334 | 14.9%), and self-employed (not incorporated) (198 | 8.8%) make up the most common classes of employment.
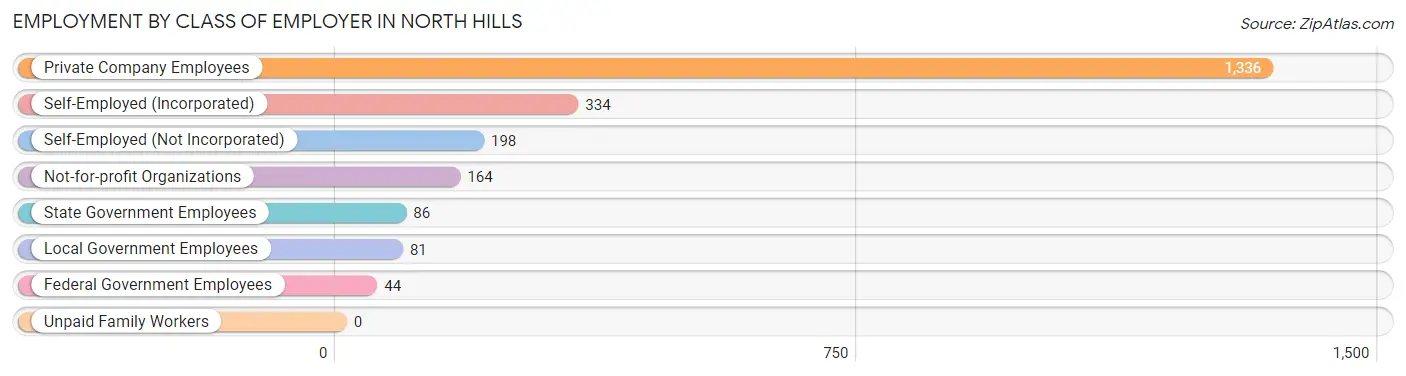
| Employer Class | # Employees | % Employees |
| Private Company Employees | 1,336 | 59.6% |
| Self-Employed (Incorporated) | 334 | 14.9% |
| Self-Employed (Not Incorporated) | 198 | 8.8% |
| Not-for-profit Organizations | 164 | 7.3% |
| Local Government Employees | 81 | 3.6% |
| State Government Employees | 86 | 3.8% |
| Federal Government Employees | 44 | 2.0% |
| Unpaid Family Workers | 0 | 0.0% |
| Total | 2,243 | 100.0% |
Employment Status by Age in North Hills
According to the labor force statistics for North Hills, out of the total population over 16 years of age (4,582), 55.0% or 2,520 individuals are in the labor force, with 1.9% or 48 of them unemployed. The age group with the highest labor force participation rate is 45 to 54 years, with 78.3% or 321 individuals in the labor force. Within the labor force, the 20 to 24 years age range has the highest percentage of unemployed individuals, with 59.7% or 46 of them being unemployed.
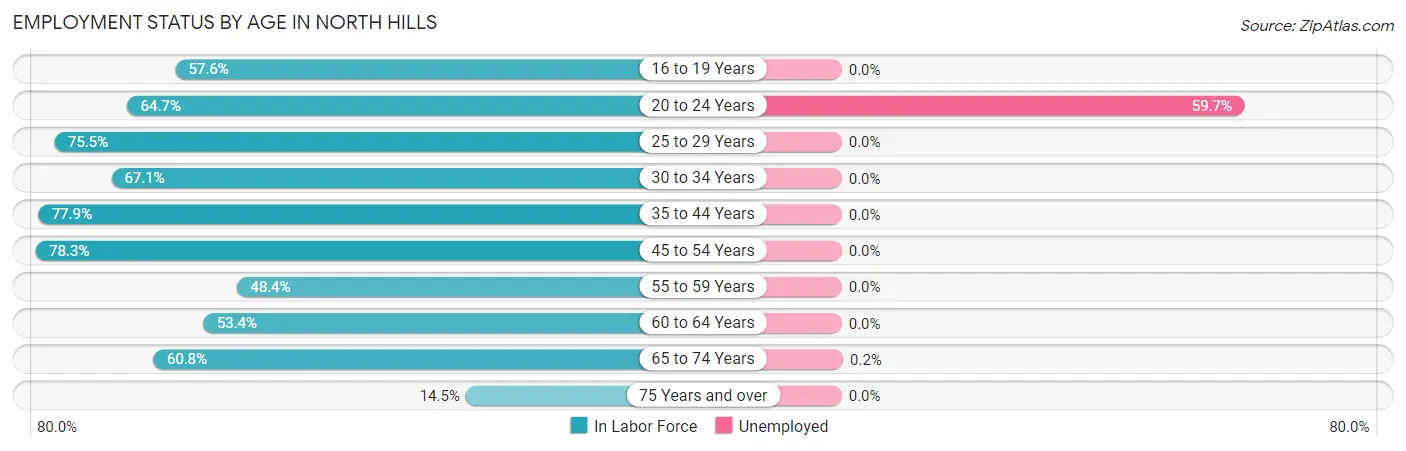
| Age Bracket | In Labor Force | Unemployed |
| 16 to 19 Years | 53 (57.6%) | 0 (0.0%) |
| 20 to 24 Years | 77 (64.7%) | 46 (59.7%) |
| 25 to 29 Years | 231 (75.5%) | 0 (0.0%) |
| 30 to 34 Years | 196 (67.1%) | 0 (0.0%) |
| 35 to 44 Years | 417 (77.9%) | 0 (0.0%) |
| 45 to 54 Years | 321 (78.3%) | 0 (0.0%) |
| 55 to 59 Years | 259 (48.4%) | 0 (0.0%) |
| 60 to 64 Years | 183 (53.4%) | 0 (0.0%) |
| 65 to 74 Years | 655 (60.8%) | 1 (0.2%) |
| 75 Years and over | 127 (14.5%) | 0 (0.0%) |
| Total | 2,520 (55.0%) | 48 (1.9%) |
Employment Status by Educational Attainment in North Hills
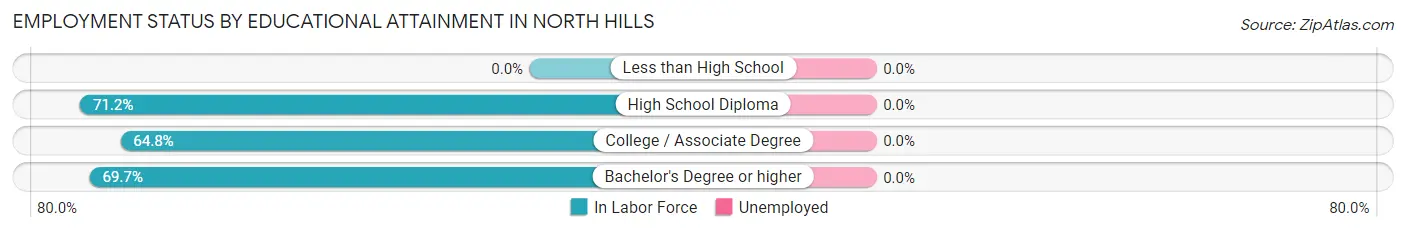
| Educational Attainment | In Labor Force | Unemployed |
| Less than High School | 0 (0.0%) | 0 (0.0%) |
| High School Diploma | 151 (71.2%) | 0 (0.0%) |
| College / Associate Degree | 142 (64.8%) | 0 (0.0%) |
| Bachelor's Degree or higher | 1,314 (69.7%) | 0 (0.0%) |
| Total | 1,608 (66.4%) | 0 (0.0%) |
Employment Occupations by Sex in North Hills
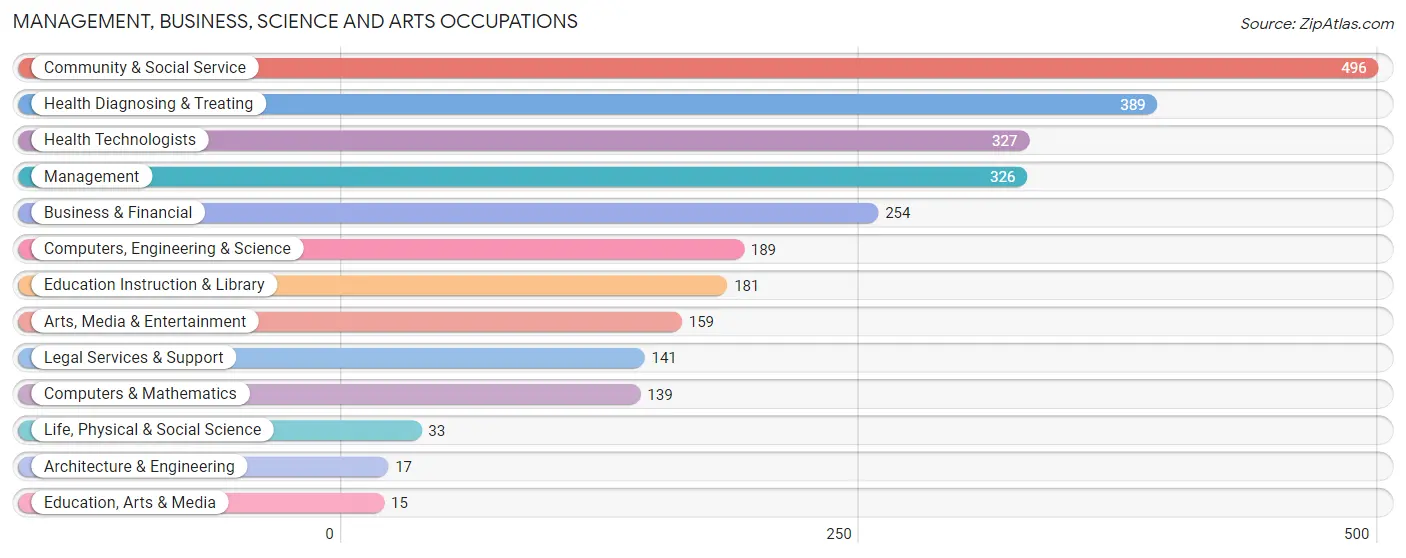
Management, Business, Science and Arts Occupations
The most common Management, Business, Science and Arts occupations in North Hills are Community & Social Service (496 | 20.1%), Health Diagnosing & Treating (389 | 15.7%), Health Technologists (327 | 13.2%), Management (326 | 13.2%), and Business & Financial (254 | 10.3%).
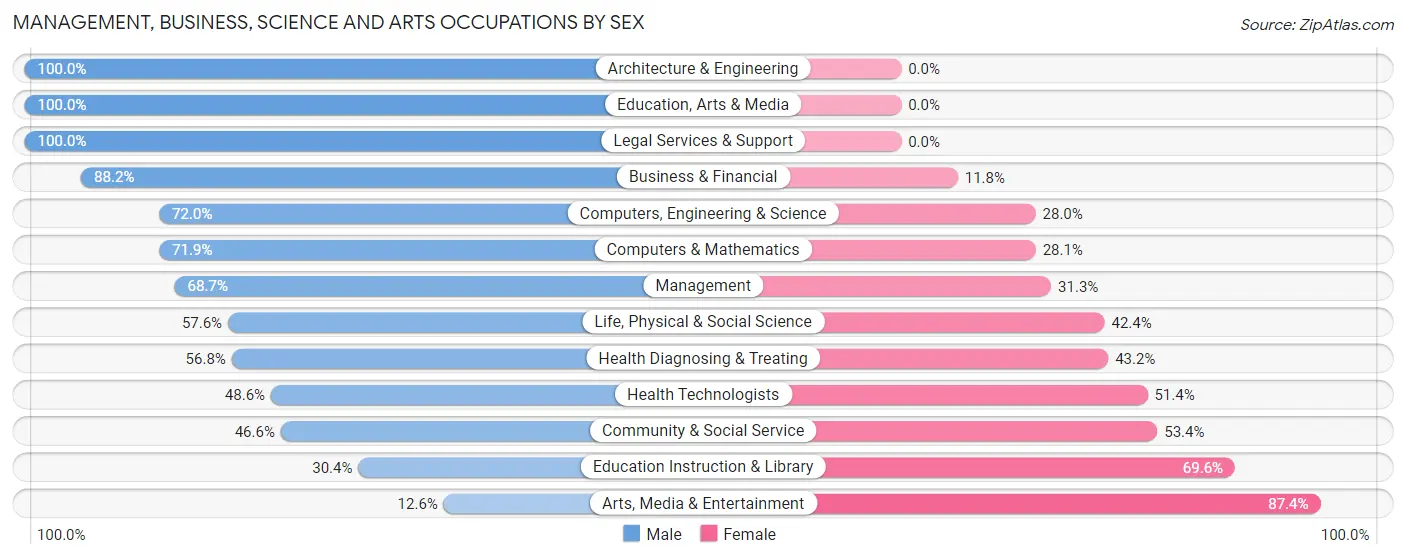
Management, Business, Science and Arts Occupations by Sex
Within the Management, Business, Science and Arts occupations in North Hills, the most male-oriented occupations are Architecture & Engineering (100.0%), Education, Arts & Media (100.0%), and Legal Services & Support (100.0%), while the most female-oriented occupations are Arts, Media & Entertainment (87.4%), Education Instruction & Library (69.6%), and Community & Social Service (53.4%).
| Occupation | Male | Female |
| Management | 224 (68.7%) | 102 (31.3%) |
| Business & Financial | 224 (88.2%) | 30 (11.8%) |
| Computers, Engineering & Science | 136 (72.0%) | 53 (28.0%) |
| Computers & Mathematics | 100 (71.9%) | 39 (28.1%) |
| Architecture & Engineering | 17 (100.0%) | 0 (0.0%) |
| Life, Physical & Social Science | 19 (57.6%) | 14 (42.4%) |
| Community & Social Service | 231 (46.6%) | 265 (53.4%) |
| Education, Arts & Media | 15 (100.0%) | 0 (0.0%) |
| Legal Services & Support | 141 (100.0%) | 0 (0.0%) |
| Education Instruction & Library | 55 (30.4%) | 126 (69.6%) |
| Arts, Media & Entertainment | 20 (12.6%) | 139 (87.4%) |
| Health Diagnosing & Treating | 221 (56.8%) | 168 (43.2%) |
| Health Technologists | 159 (48.6%) | 168 (51.4%) |
| Total (Category) | 1,036 (62.6%) | 618 (37.4%) |
| Total (Overall) | 1,541 (62.3%) | 931 (37.7%) |
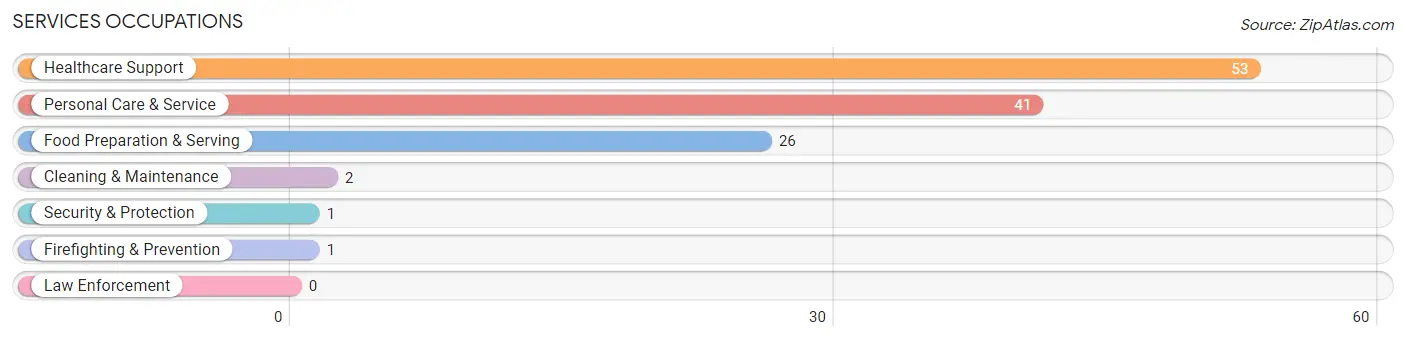
Services Occupations
The most common Services occupations in North Hills are Healthcare Support (53 | 2.1%), Personal Care & Service (41 | 1.7%), Food Preparation & Serving (26 | 1.1%), Cleaning & Maintenance (2 | 0.1%), and Security & Protection (1 | 0.0%).
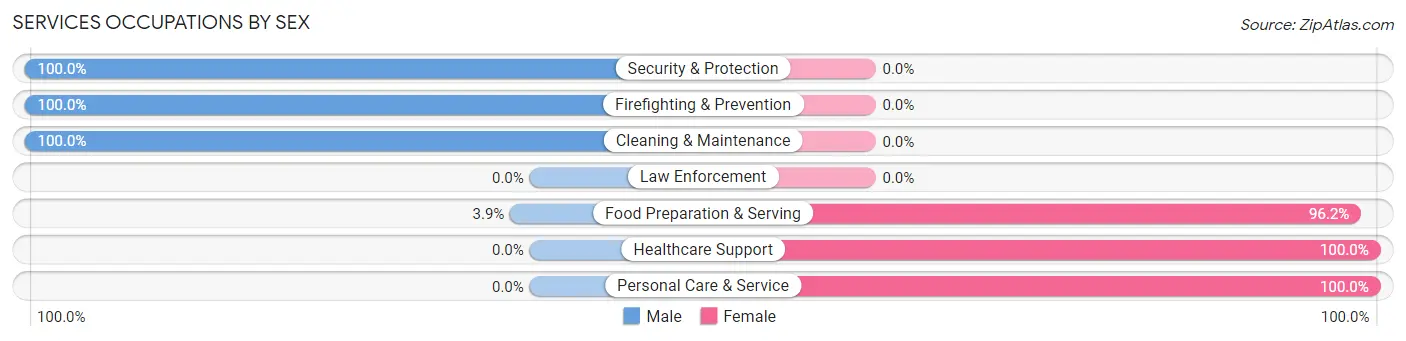
Services Occupations by Sex
Within the Services occupations in North Hills, the most male-oriented occupations are Security & Protection (100.0%), Firefighting & Prevention (100.0%), and Cleaning & Maintenance (100.0%), while the most female-oriented occupations are Healthcare Support (100.0%), Personal Care & Service (100.0%), and Food Preparation & Serving (96.2%).
| Occupation | Male | Female |
| Healthcare Support | 0 (0.0%) | 53 (100.0%) |
| Security & Protection | 1 (100.0%) | 0 (0.0%) |
| Firefighting & Prevention | 1 (100.0%) | 0 (0.0%) |
| Law Enforcement | 0 (0.0%) | 0 (0.0%) |
| Food Preparation & Serving | 1 (3.8%) | 25 (96.2%) |
| Cleaning & Maintenance | 2 (100.0%) | 0 (0.0%) |
| Personal Care & Service | 0 (0.0%) | 41 (100.0%) |
| Total (Category) | 4 (3.3%) | 119 (96.8%) |
| Total (Overall) | 1,541 (62.3%) | 931 (37.7%) |
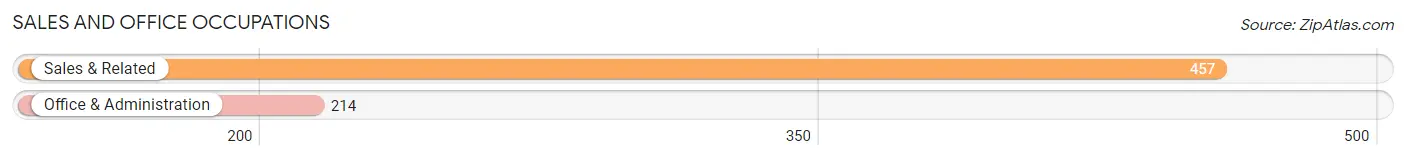
Sales and Office Occupations
The most common Sales and Office occupations in North Hills are Sales & Related (457 | 18.5%), and Office & Administration (214 | 8.7%).
Sales and Office Occupations by Sex
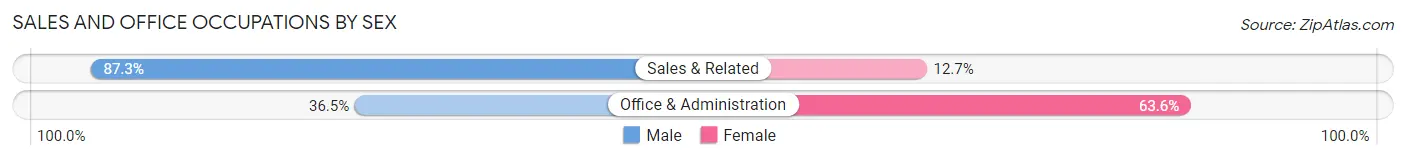
| Occupation | Male | Female |
| Sales & Related | 399 (87.3%) | 58 (12.7%) |
| Office & Administration | 78 (36.4%) | 136 (63.5%) |
| Total (Category) | 477 (71.1%) | 194 (28.9%) |
| Total (Overall) | 1,541 (62.3%) | 931 (37.7%) |
Natural Resources, Construction and Maintenance Occupations
Natural Resources, Construction and Maintenance Occupations by Sex
| Occupation | Male | Female |
| Farming, Fishing & Forestry | 0 (0.0%) | 0 (0.0%) |
| Construction & Extraction | 0 (0.0%) | 0 (0.0%) |
| Installation, Maintenance & Repair | 0 (0.0%) | 0 (0.0%) |
| Total (Category) | 0 (0.0%) | 0 (0.0%) |
| Total (Overall) | 1,541 (62.3%) | 931 (37.7%) |
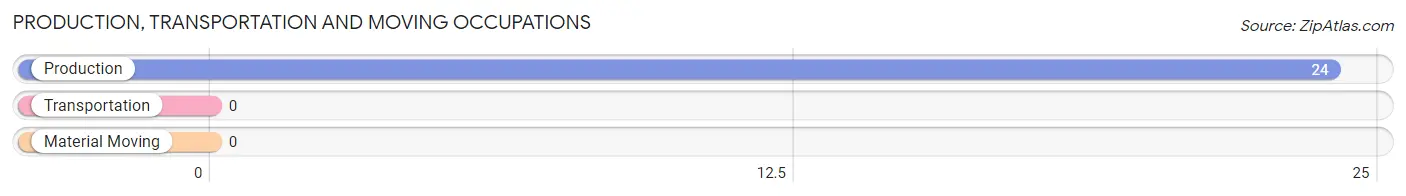
Production, Transportation and Moving Occupations
The most common Production, Transportation and Moving occupations in North Hills are , and Production (24 | 1.0%).
Production, Transportation and Moving Occupations by Sex
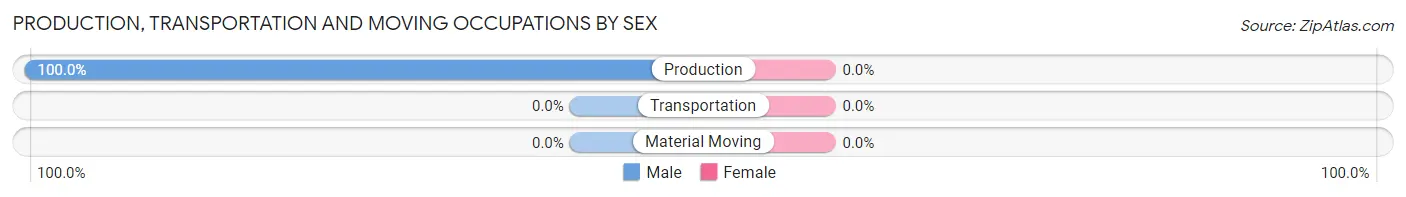
| Occupation | Male | Female |
| Production | 24 (100.0%) | 0 (0.0%) |
| Transportation | 0 (0.0%) | 0 (0.0%) |
| Material Moving | 0 (0.0%) | 0 (0.0%) |
| Total (Category) | 24 (100.0%) | 0 (0.0%) |
| Total (Overall) | 1,541 (62.3%) | 931 (37.7%) |
Employment Industries by Sex in North Hills
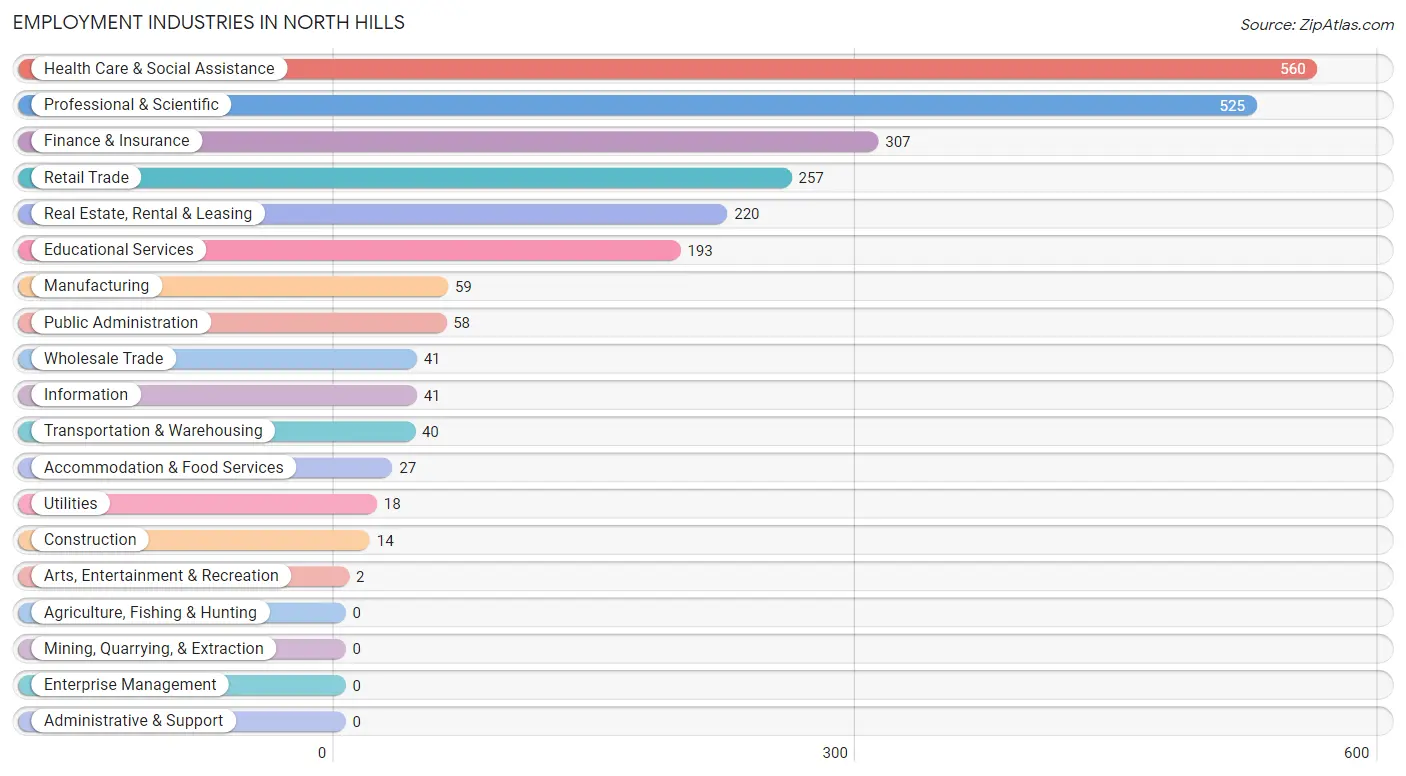
Employment Industries in North Hills
The major employment industries in North Hills include Health Care & Social Assistance (560 | 22.7%), Professional & Scientific (525 | 21.2%), Finance & Insurance (307 | 12.4%), Retail Trade (257 | 10.4%), and Real Estate, Rental & Leasing (220 | 8.9%).
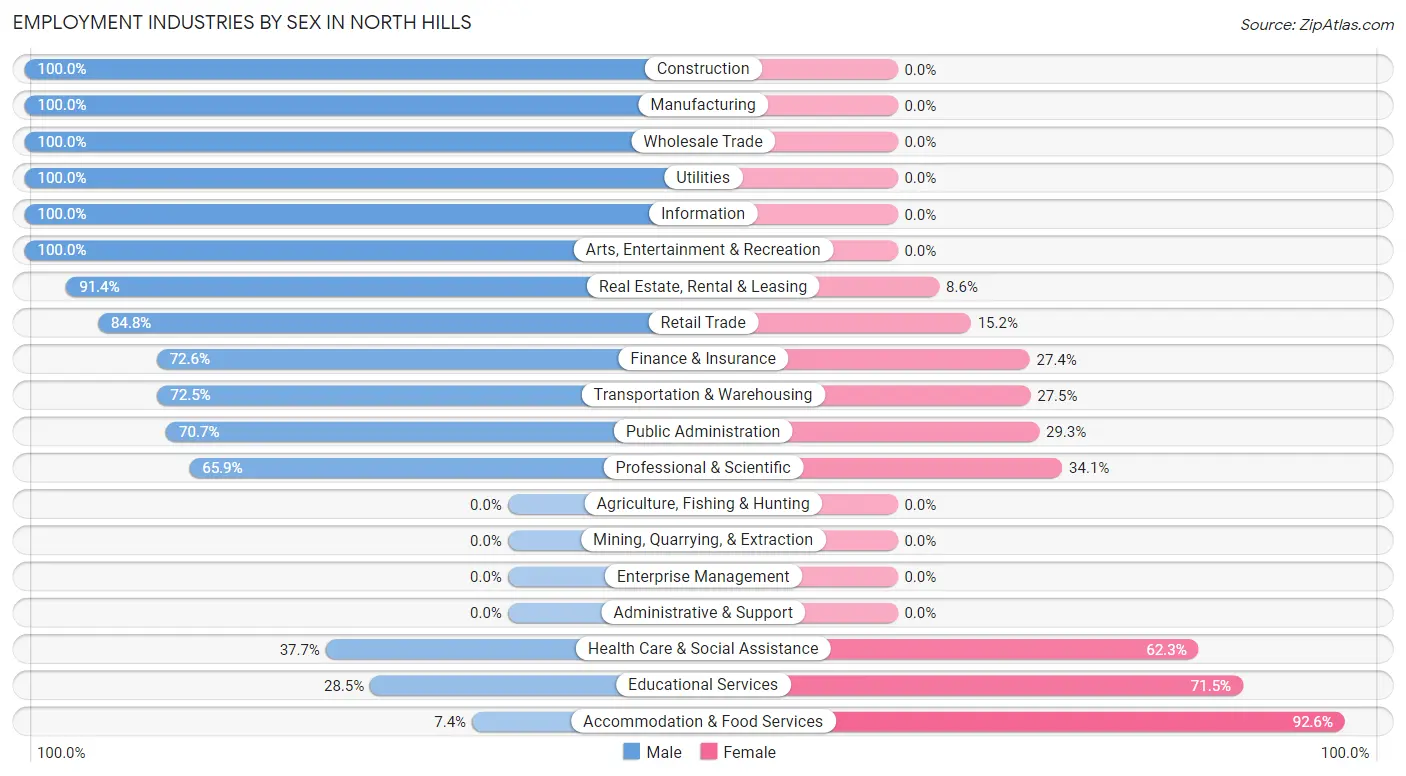
Employment Industries by Sex in North Hills
The North Hills industries that see more men than women are Construction (100.0%), Manufacturing (100.0%), and Wholesale Trade (100.0%), whereas the industries that tend to have a higher number of women are Accommodation & Food Services (92.6%), Educational Services (71.5%), and Health Care & Social Assistance (62.3%).
| Industry | Male | Female |
| Agriculture, Fishing & Hunting | 0 (0.0%) | 0 (0.0%) |
| Mining, Quarrying, & Extraction | 0 (0.0%) | 0 (0.0%) |
| Construction | 14 (100.0%) | 0 (0.0%) |
| Manufacturing | 59 (100.0%) | 0 (0.0%) |
| Wholesale Trade | 41 (100.0%) | 0 (0.0%) |
| Retail Trade | 218 (84.8%) | 39 (15.2%) |
| Transportation & Warehousing | 29 (72.5%) | 11 (27.5%) |
| Utilities | 18 (100.0%) | 0 (0.0%) |
| Information | 41 (100.0%) | 0 (0.0%) |
| Finance & Insurance | 223 (72.6%) | 84 (27.4%) |
| Real Estate, Rental & Leasing | 201 (91.4%) | 19 (8.6%) |
| Professional & Scientific | 346 (65.9%) | 179 (34.1%) |
| Enterprise Management | 0 (0.0%) | 0 (0.0%) |
| Administrative & Support | 0 (0.0%) | 0 (0.0%) |
| Educational Services | 55 (28.5%) | 138 (71.5%) |
| Health Care & Social Assistance | 211 (37.7%) | 349 (62.3%) |
| Arts, Entertainment & Recreation | 2 (100.0%) | 0 (0.0%) |
| Accommodation & Food Services | 2 (7.4%) | 25 (92.6%) |
| Public Administration | 41 (70.7%) | 17 (29.3%) |
| Total | 1,541 (62.3%) | 931 (37.7%) |
Education in North Hills
School Enrollment in North Hills
The most common levels of schooling among the 751 students in North Hills are middle school (197 | 26.2%), elementary school (175 | 23.3%), and college / undergraduate (147 | 19.6%).
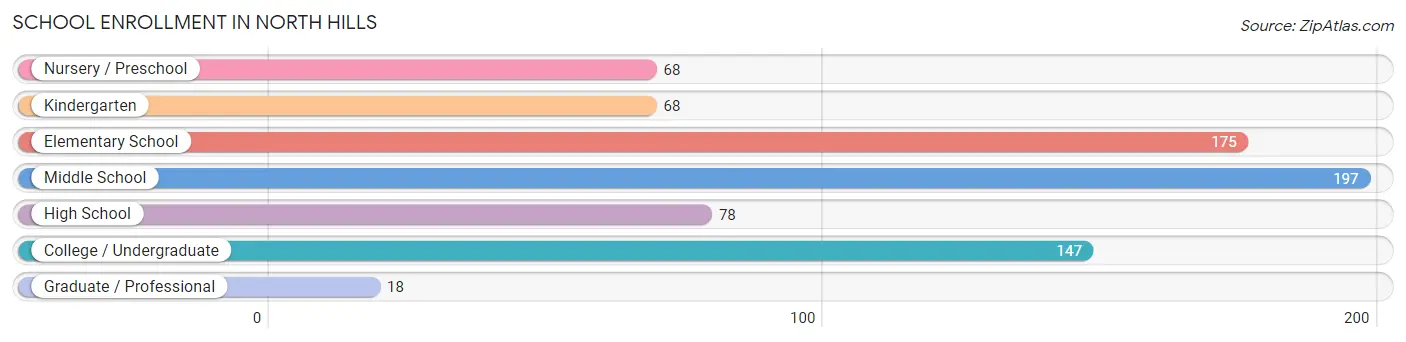
| School Level | # Students | % Students |
| Nursery / Preschool | 68 | 9.0% |
| Kindergarten | 68 | 9.0% |
| Elementary School | 175 | 23.3% |
| Middle School | 197 | 26.2% |
| High School | 78 | 10.4% |
| College / Undergraduate | 147 | 19.6% |
| Graduate / Professional | 18 | 2.4% |
| Total | 751 | 100.0% |
School Enrollment by Age by Funding Source in North Hills
Out of a total of 751 students who are enrolled in schools in North Hills, 269 (35.8%) attend a private institution, while the remaining 482 (64.2%) are enrolled in public schools. The age group of 3 to 4 year olds has the highest likelihood of being enrolled in private schools, with 55 (100.0% in the age bracket) enrolled. Conversely, the age group of 18 to 19 year olds has the lowest likelihood of being enrolled in a private school, with 53 (100.0% in the age bracket) attending a public institution.
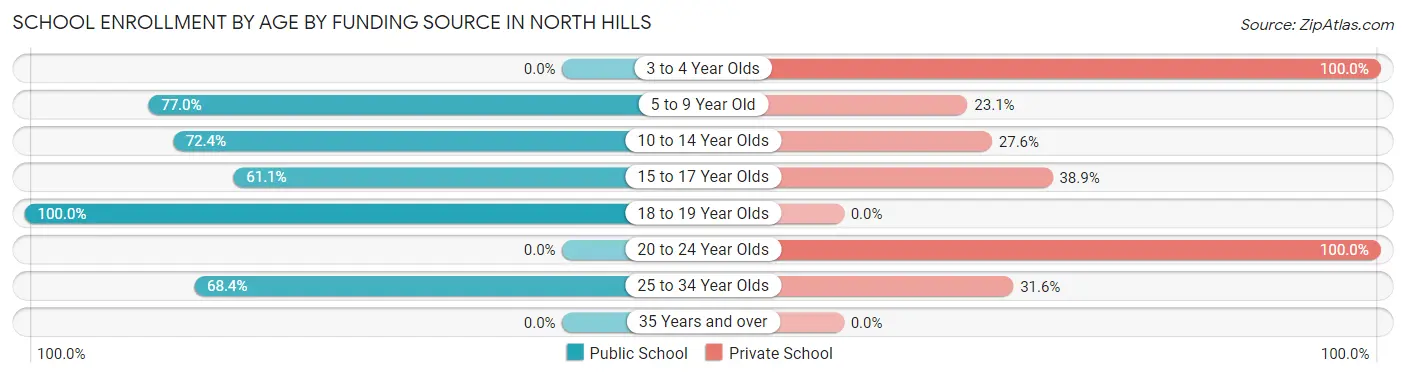
| Age Bracket | Public School | Private School |
| 3 to 4 Year Olds | 0 (0.0%) | 55 (100.0%) |
| 5 to 9 Year Old | 197 (76.9%) | 59 (23.1%) |
| 10 to 14 Year Olds | 160 (72.4%) | 61 (27.6%) |
| 15 to 17 Year Olds | 33 (61.1%) | 21 (38.9%) |
| 18 to 19 Year Olds | 53 (100.0%) | 0 (0.0%) |
| 20 to 24 Year Olds | 0 (0.0%) | 55 (100.0%) |
| 25 to 34 Year Olds | 39 (68.4%) | 18 (31.6%) |
| 35 Years and over | 0 (0.0%) | 0 (0.0%) |
| Total | 482 (64.2%) | 269 (35.8%) |
Educational Attainment by Field of Study in North Hills
Business (950 | 26.7%), education (420 | 11.8%), social sciences (412 | 11.6%), visual & performing arts (331 | 9.3%), and engineering (218 | 6.1%) are the most common fields of study among 3,557 individuals in North Hills who have obtained a bachelor's degree or higher.
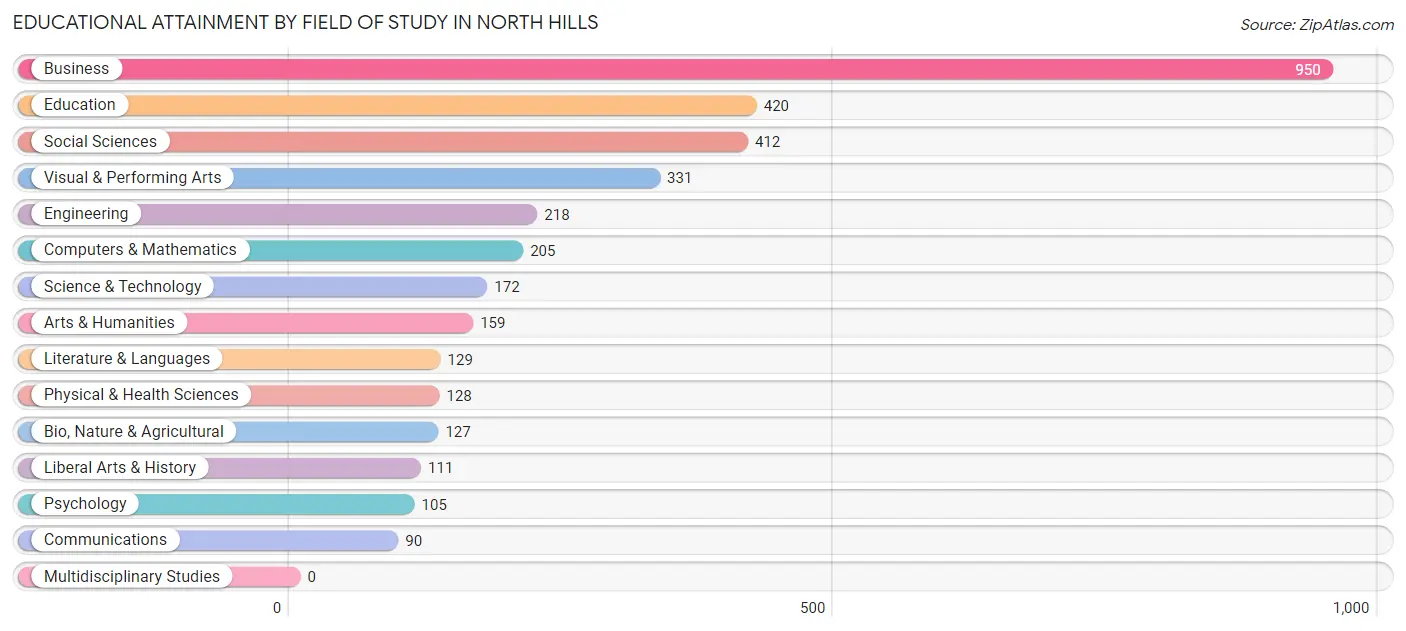
| Field of Study | # Graduates | % Graduates |
| Computers & Mathematics | 205 | 5.8% |
| Bio, Nature & Agricultural | 127 | 3.6% |
| Physical & Health Sciences | 128 | 3.6% |
| Psychology | 105 | 2.9% |
| Social Sciences | 412 | 11.6% |
| Engineering | 218 | 6.1% |
| Multidisciplinary Studies | 0 | 0.0% |
| Science & Technology | 172 | 4.8% |
| Business | 950 | 26.7% |
| Education | 420 | 11.8% |
| Literature & Languages | 129 | 3.6% |
| Liberal Arts & History | 111 | 3.1% |
| Visual & Performing Arts | 331 | 9.3% |
| Communications | 90 | 2.5% |
| Arts & Humanities | 159 | 4.5% |
| Total | 3,557 | 100.0% |
Transportation & Commute in North Hills
Vehicle Availability by Sex in North Hills
The most prevalent vehicle ownership categories in North Hills are males with 2 vehicles (842, accounting for 58.2%) and females with 2 vehicles (427, making up 106.2%).
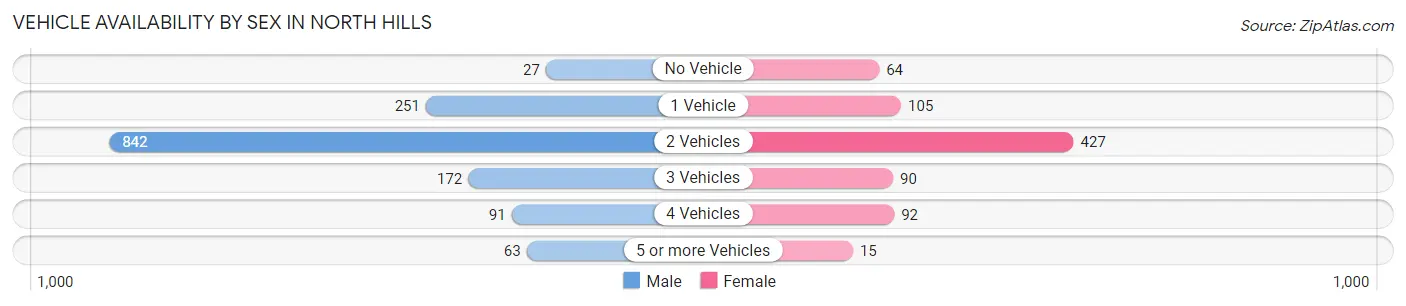
| Vehicles Available | Male | Female |
| No Vehicle | 27 (1.9%) | 64 (8.1%) |
| 1 Vehicle | 251 (17.4%) | 105 (13.2%) |
| 2 Vehicles | 842 (58.2%) | 427 (53.8%) |
| 3 Vehicles | 172 (11.9%) | 90 (11.4%) |
| 4 Vehicles | 91 (6.3%) | 92 (11.6%) |
| 5 or more Vehicles | 63 (4.4%) | 15 (1.9%) |
| Total | 1,446 (100.0%) | 793 (100.0%) |
Commute Time in North Hills
The most frequently occuring commute durations in North Hills are 15 to 19 minutes (358 commuters, 18.8%), 20 to 24 minutes (327 commuters, 17.1%), and 60 to 89 minutes (298 commuters, 15.6%).
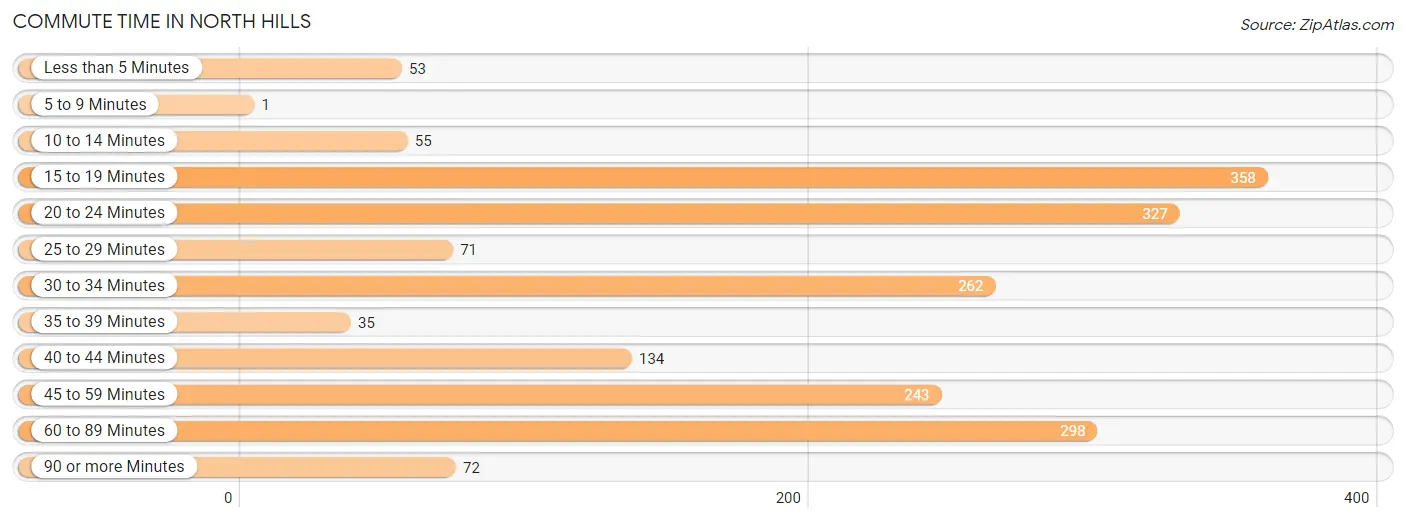
| Commute Time | # Commuters | % Commuters |
| Less than 5 Minutes | 53 | 2.8% |
| 5 to 9 Minutes | 1 | 0.1% |
| 10 to 14 Minutes | 55 | 2.9% |
| 15 to 19 Minutes | 358 | 18.8% |
| 20 to 24 Minutes | 327 | 17.1% |
| 25 to 29 Minutes | 71 | 3.7% |
| 30 to 34 Minutes | 262 | 13.7% |
| 35 to 39 Minutes | 35 | 1.8% |
| 40 to 44 Minutes | 134 | 7.0% |
| 45 to 59 Minutes | 243 | 12.7% |
| 60 to 89 Minutes | 298 | 15.6% |
| 90 or more Minutes | 72 | 3.8% |
Commute Time by Sex in North Hills
The most common commute times in North Hills are 30 to 34 minutes (247 commuters, 19.3%) for males and 15 to 19 minutes (228 commuters, 36.1%) for females.
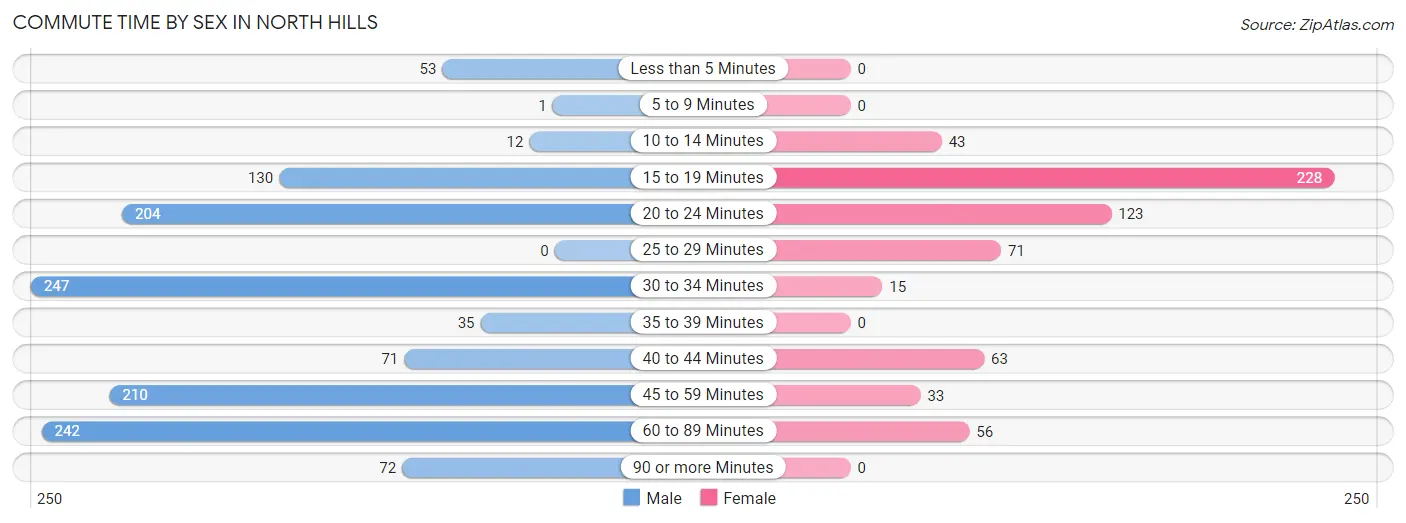
| Commute Time | Male | Female |
| Less than 5 Minutes | 53 (4.2%) | 0 (0.0%) |
| 5 to 9 Minutes | 1 (0.1%) | 0 (0.0%) |
| 10 to 14 Minutes | 12 (0.9%) | 43 (6.8%) |
| 15 to 19 Minutes | 130 (10.2%) | 228 (36.1%) |
| 20 to 24 Minutes | 204 (16.0%) | 123 (19.5%) |
| 25 to 29 Minutes | 0 (0.0%) | 71 (11.2%) |
| 30 to 34 Minutes | 247 (19.3%) | 15 (2.4%) |
| 35 to 39 Minutes | 35 (2.7%) | 0 (0.0%) |
| 40 to 44 Minutes | 71 (5.6%) | 63 (10.0%) |
| 45 to 59 Minutes | 210 (16.4%) | 33 (5.2%) |
| 60 to 89 Minutes | 242 (19.0%) | 56 (8.9%) |
| 90 or more Minutes | 72 (5.6%) | 0 (0.0%) |
Time of Departure to Work by Sex in North Hills
The most frequent times of departure to work in North Hills are 8:00 AM to 8:29 AM (342, 26.8%) for males and 8:00 AM to 8:29 AM (123, 19.5%) for females.
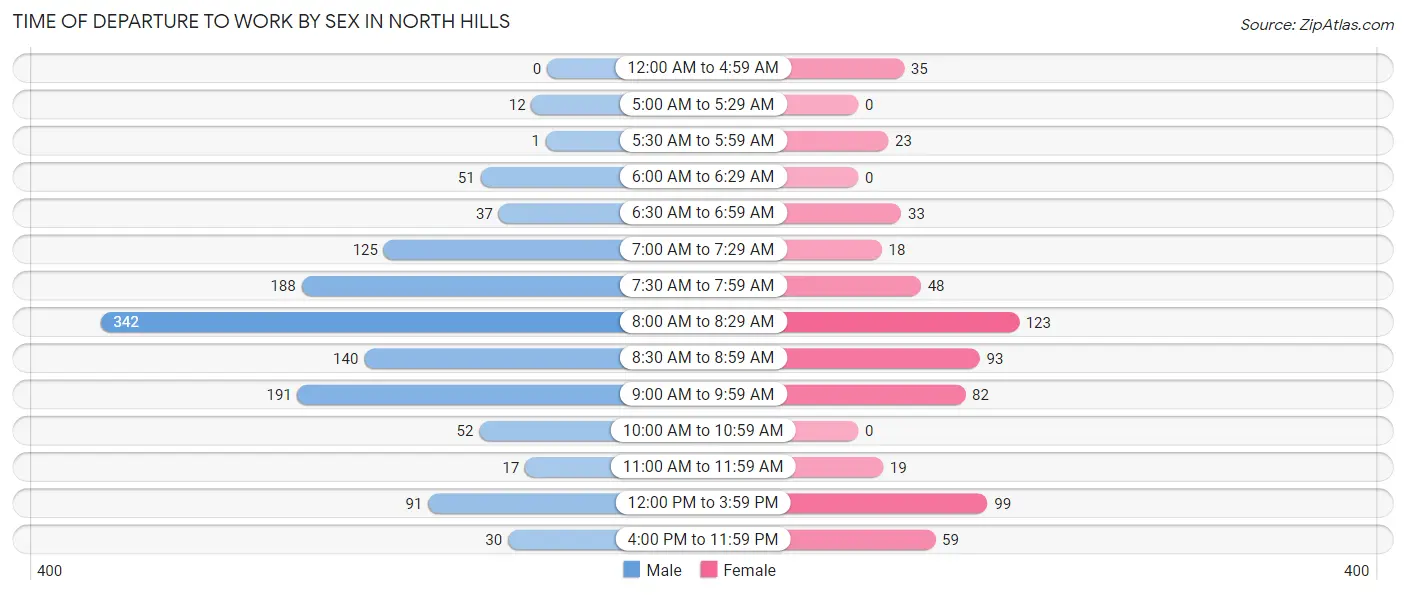
| Time of Departure | Male | Female |
| 12:00 AM to 4:59 AM | 0 (0.0%) | 35 (5.5%) |
| 5:00 AM to 5:29 AM | 12 (0.9%) | 0 (0.0%) |
| 5:30 AM to 5:59 AM | 1 (0.1%) | 23 (3.6%) |
| 6:00 AM to 6:29 AM | 51 (4.0%) | 0 (0.0%) |
| 6:30 AM to 6:59 AM | 37 (2.9%) | 33 (5.2%) |
| 7:00 AM to 7:29 AM | 125 (9.8%) | 18 (2.9%) |
| 7:30 AM to 7:59 AM | 188 (14.7%) | 48 (7.6%) |
| 8:00 AM to 8:29 AM | 342 (26.8%) | 123 (19.5%) |
| 8:30 AM to 8:59 AM | 140 (11.0%) | 93 (14.7%) |
| 9:00 AM to 9:59 AM | 191 (15.0%) | 82 (13.0%) |
| 10:00 AM to 10:59 AM | 52 (4.1%) | 0 (0.0%) |
| 11:00 AM to 11:59 AM | 17 (1.3%) | 19 (3.0%) |
| 12:00 PM to 3:59 PM | 91 (7.1%) | 99 (15.7%) |
| 4:00 PM to 11:59 PM | 30 (2.4%) | 59 (9.3%) |
| Total | 1,277 (100.0%) | 632 (100.0%) |
Housing Occupancy in North Hills
Occupancy by Ownership in North Hills
Of the total 2,319 dwellings in North Hills, owner-occupied units account for 1,919 (82.8%), while renter-occupied units make up 400 (17.2%).
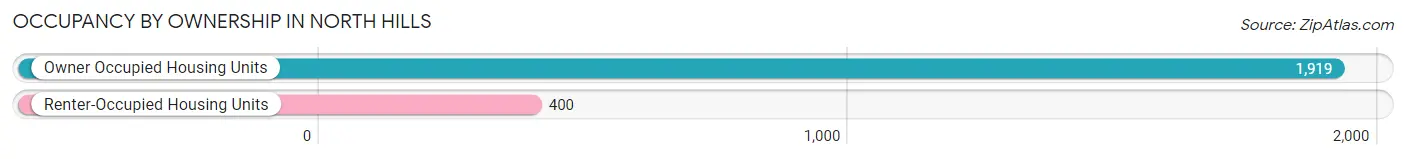
| Occupancy | # Housing Units | % Housing Units |
| Owner Occupied Housing Units | 1,919 | 82.8% |
| Renter-Occupied Housing Units | 400 | 17.2% |
| Total Occupied Housing Units | 2,319 | 100.0% |
Occupancy by Household Size in North Hills
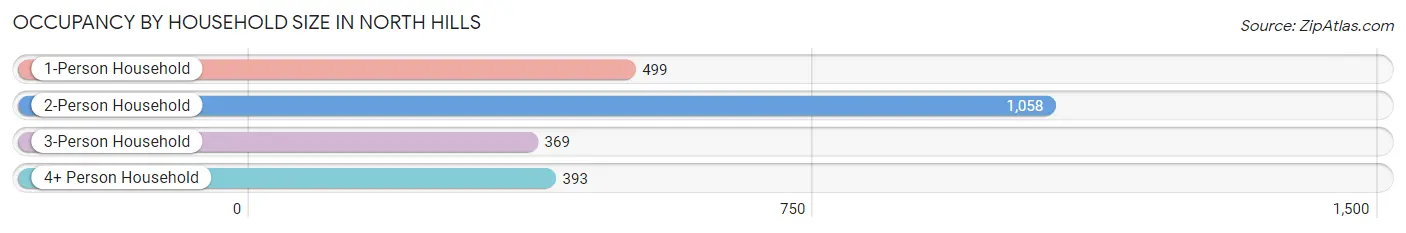
| Household Size | # Housing Units | % Housing Units |
| 1-Person Household | 499 | 21.5% |
| 2-Person Household | 1,058 | 45.6% |
| 3-Person Household | 369 | 15.9% |
| 4+ Person Household | 393 | 17.0% |
| Total Housing Units | 2,319 | 100.0% |
Occupancy by Ownership by Household Size in North Hills
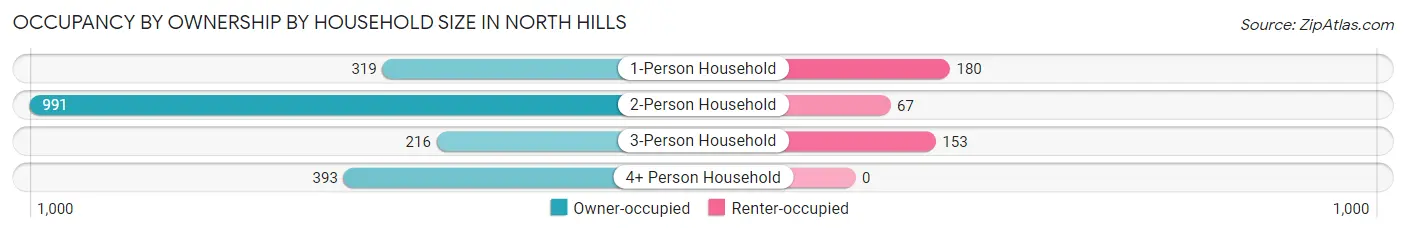
| Household Size | Owner-occupied | Renter-occupied |
| 1-Person Household | 319 (63.9%) | 180 (36.1%) |
| 2-Person Household | 991 (93.7%) | 67 (6.3%) |
| 3-Person Household | 216 (58.5%) | 153 (41.5%) |
| 4+ Person Household | 393 (100.0%) | 0 (0.0%) |
| Total Housing Units | 1,919 (82.8%) | 400 (17.2%) |
Occupancy by Educational Attainment in North Hills
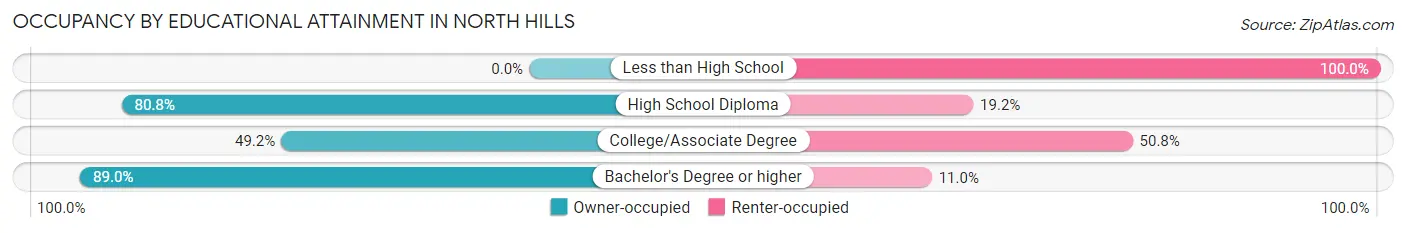
| Household Size | Owner-occupied | Renter-occupied |
| Less than High School | 0 (0.0%) | 63 (100.0%) |
| High School Diploma | 168 (80.8%) | 40 (19.2%) |
| College/Associate Degree | 88 (49.2%) | 91 (50.8%) |
| Bachelor's Degree or higher | 1,663 (89.0%) | 206 (11.0%) |
Occupancy by Age of Householder in North Hills
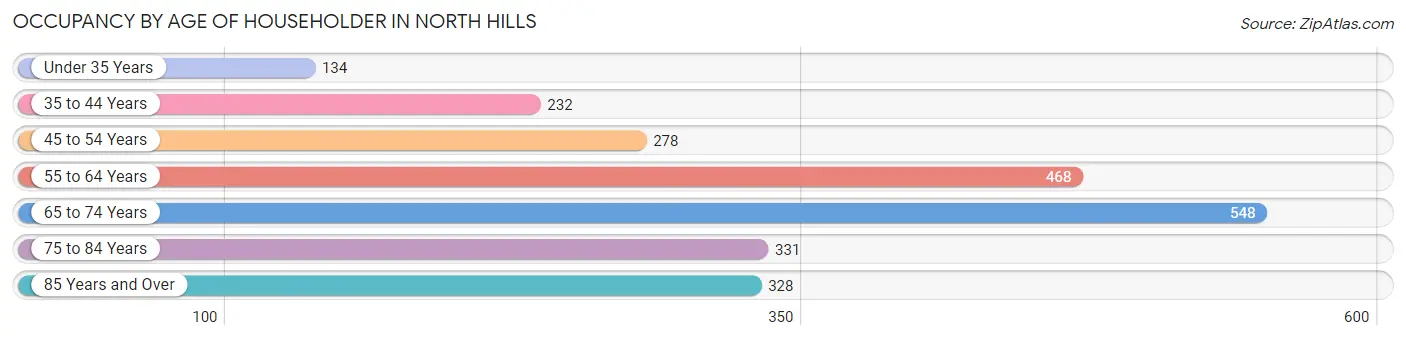
| Age Bracket | # Households | % Households |
| Under 35 Years | 134 | 5.8% |
| 35 to 44 Years | 232 | 10.0% |
| 45 to 54 Years | 278 | 12.0% |
| 55 to 64 Years | 468 | 20.2% |
| 65 to 74 Years | 548 | 23.6% |
| 75 to 84 Years | 331 | 14.3% |
| 85 Years and Over | 328 | 14.1% |
| Total | 2,319 | 100.0% |
Housing Finances in North Hills
Median Income by Occupancy in North Hills
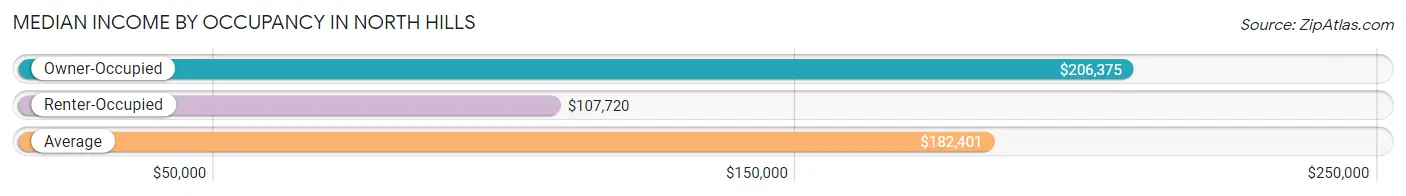
| Occupancy Type | # Households | Median Income |
| Owner-Occupied | 1,919 (82.8%) | $206,375 |
| Renter-Occupied | 400 (17.2%) | $107,720 |
| Average | 2,319 (100.0%) | $182,401 |
Occupancy by Householder Income Bracket in North Hills
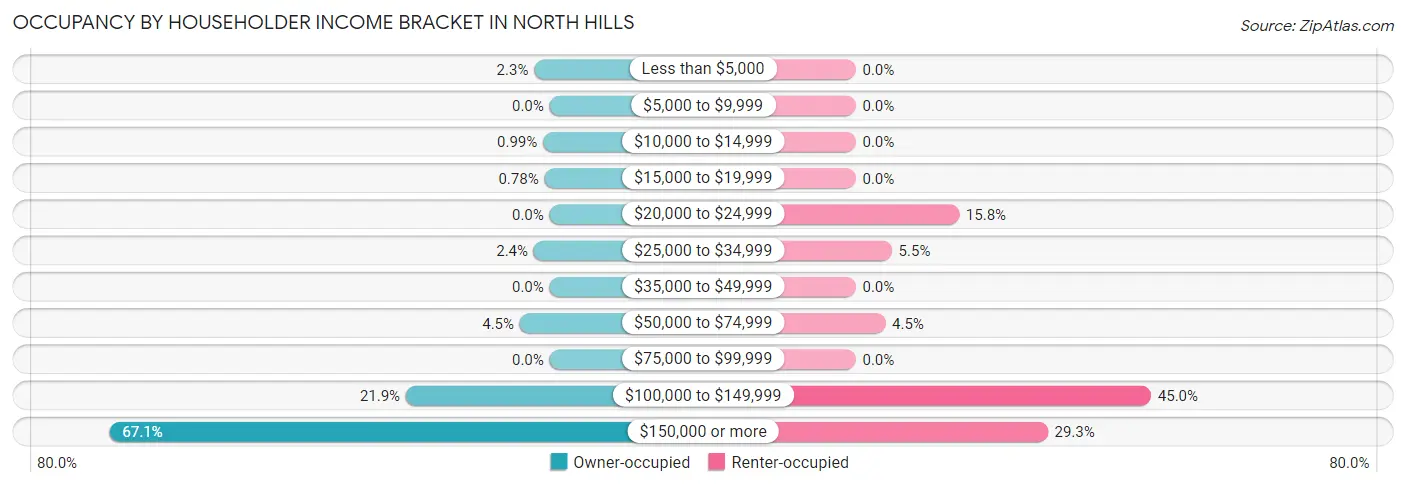
| Income Bracket | Owner-occupied | Renter-occupied |
| Less than $5,000 | 45 (2.3%) | 0 (0.0%) |
| $5,000 to $9,999 | 0 (0.0%) | 0 (0.0%) |
| $10,000 to $14,999 | 19 (1.0%) | 0 (0.0%) |
| $15,000 to $19,999 | 15 (0.8%) | 0 (0.0%) |
| $20,000 to $24,999 | 0 (0.0%) | 63 (15.8%) |
| $25,000 to $34,999 | 46 (2.4%) | 22 (5.5%) |
| $35,000 to $49,999 | 0 (0.0%) | 0 (0.0%) |
| $50,000 to $74,999 | 87 (4.5%) | 18 (4.5%) |
| $75,000 to $99,999 | 0 (0.0%) | 0 (0.0%) |
| $100,000 to $149,999 | 420 (21.9%) | 180 (45.0%) |
| $150,000 or more | 1,287 (67.1%) | 117 (29.2%) |
| Total | 1,919 (100.0%) | 400 (100.0%) |
Monthly Housing Cost Tiers in North Hills
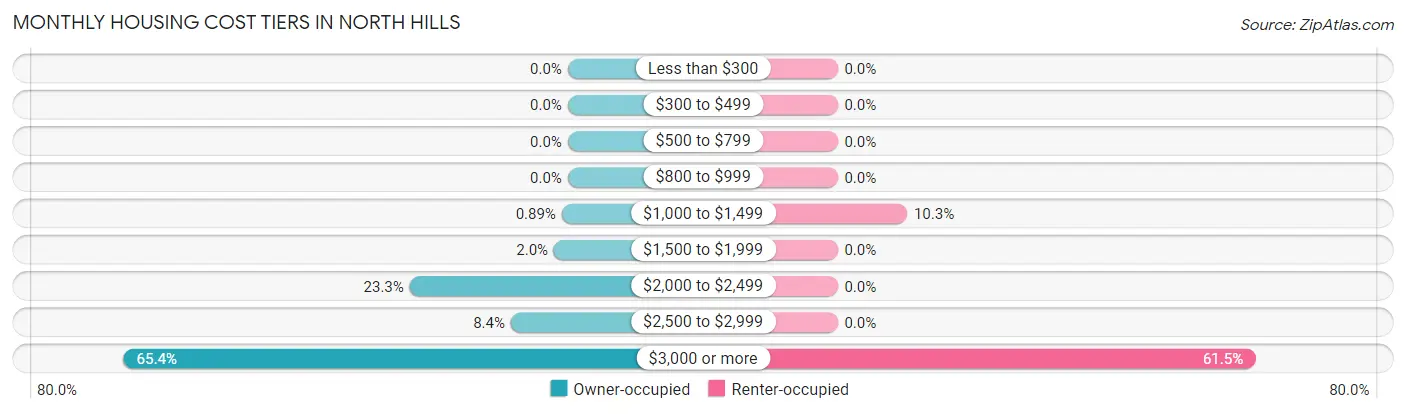
| Monthly Cost | Owner-occupied | Renter-occupied |
| Less than $300 | 0 (0.0%) | 0 (0.0%) |
| $300 to $499 | 0 (0.0%) | 0 (0.0%) |
| $500 to $799 | 0 (0.0%) | 0 (0.0%) |
| $800 to $999 | 0 (0.0%) | 0 (0.0%) |
| $1,000 to $1,499 | 17 (0.9%) | 41 (10.2%) |
| $1,500 to $1,999 | 39 (2.0%) | 0 (0.0%) |
| $2,000 to $2,499 | 447 (23.3%) | 0 (0.0%) |
| $2,500 to $2,999 | 161 (8.4%) | 0 (0.0%) |
| $3,000 or more | 1,255 (65.4%) | 246 (61.5%) |
| Total | 1,919 (100.0%) | 400 (100.0%) |
Physical Housing Characteristics in North Hills
Housing Structures in North Hills
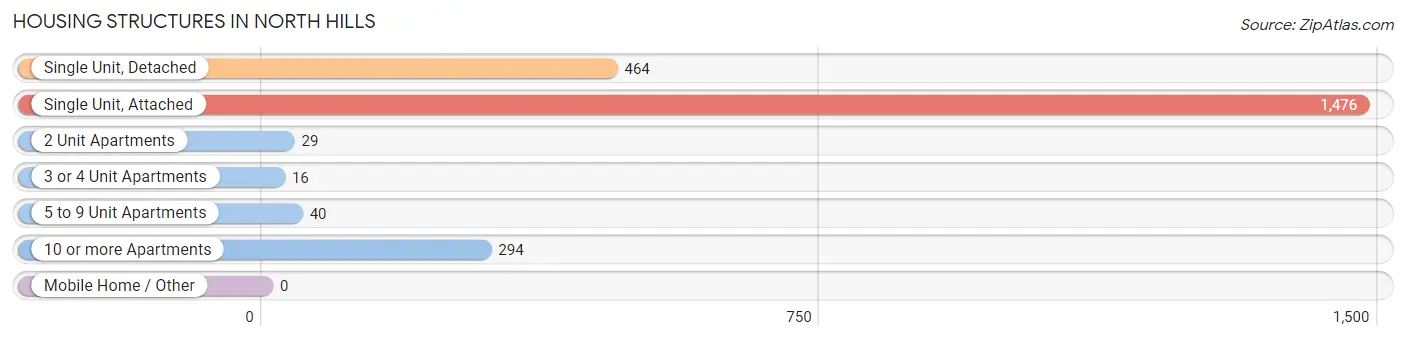
| Structure Type | # Housing Units | % Housing Units |
| Single Unit, Detached | 464 | 20.0% |
| Single Unit, Attached | 1,476 | 63.6% |
| 2 Unit Apartments | 29 | 1.3% |
| 3 or 4 Unit Apartments | 16 | 0.7% |
| 5 to 9 Unit Apartments | 40 | 1.7% |
| 10 or more Apartments | 294 | 12.7% |
| Mobile Home / Other | 0 | 0.0% |
| Total | 2,319 | 100.0% |
Housing Structures by Occupancy in North Hills
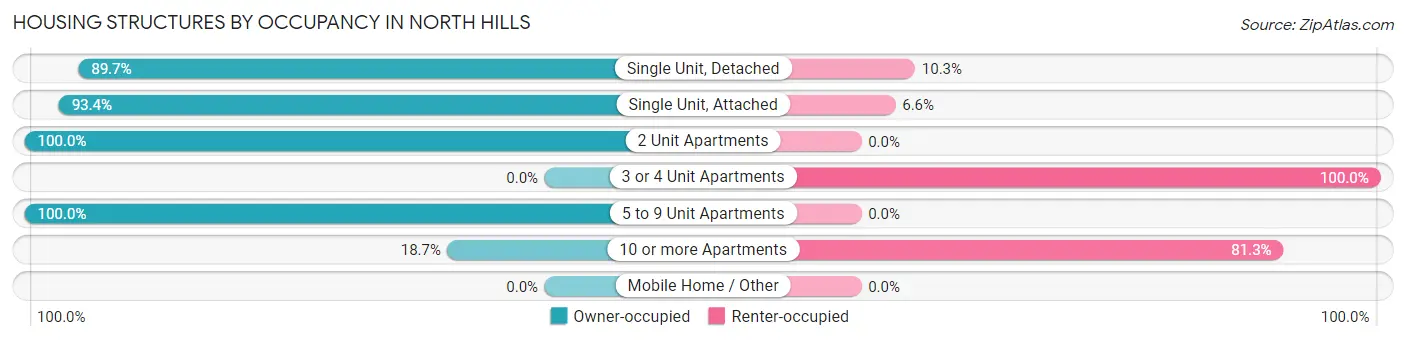
| Structure Type | Owner-occupied | Renter-occupied |
| Single Unit, Detached | 416 (89.7%) | 48 (10.3%) |
| Single Unit, Attached | 1,379 (93.4%) | 97 (6.6%) |
| 2 Unit Apartments | 29 (100.0%) | 0 (0.0%) |
| 3 or 4 Unit Apartments | 0 (0.0%) | 16 (100.0%) |
| 5 to 9 Unit Apartments | 40 (100.0%) | 0 (0.0%) |
| 10 or more Apartments | 55 (18.7%) | 239 (81.3%) |
| Mobile Home / Other | 0 (0.0%) | 0 (0.0%) |
| Total | 1,919 (82.8%) | 400 (17.2%) |
Housing Structures by Number of Rooms in North Hills
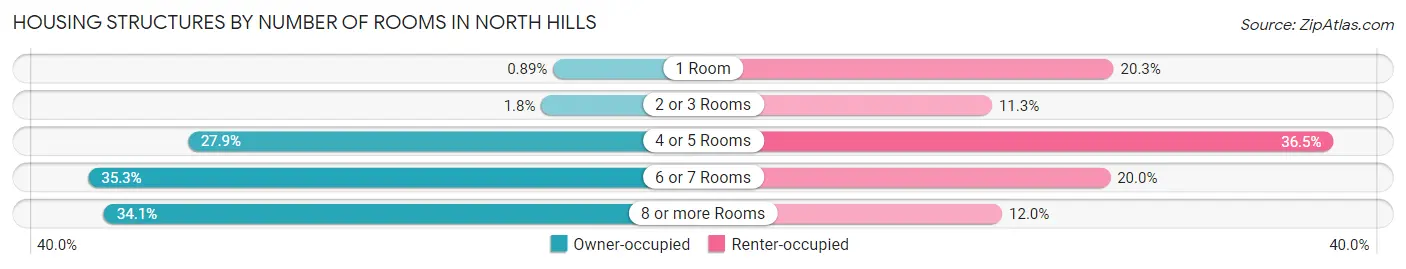
| Number of Rooms | Owner-occupied | Renter-occupied |
| 1 Room | 17 (0.9%) | 81 (20.3%) |
| 2 or 3 Rooms | 34 (1.8%) | 45 (11.3%) |
| 4 or 5 Rooms | 536 (27.9%) | 146 (36.5%) |
| 6 or 7 Rooms | 677 (35.3%) | 80 (20.0%) |
| 8 or more Rooms | 655 (34.1%) | 48 (12.0%) |
| Total | 1,919 (100.0%) | 400 (100.0%) |
Housing Structure by Heating Type in North Hills
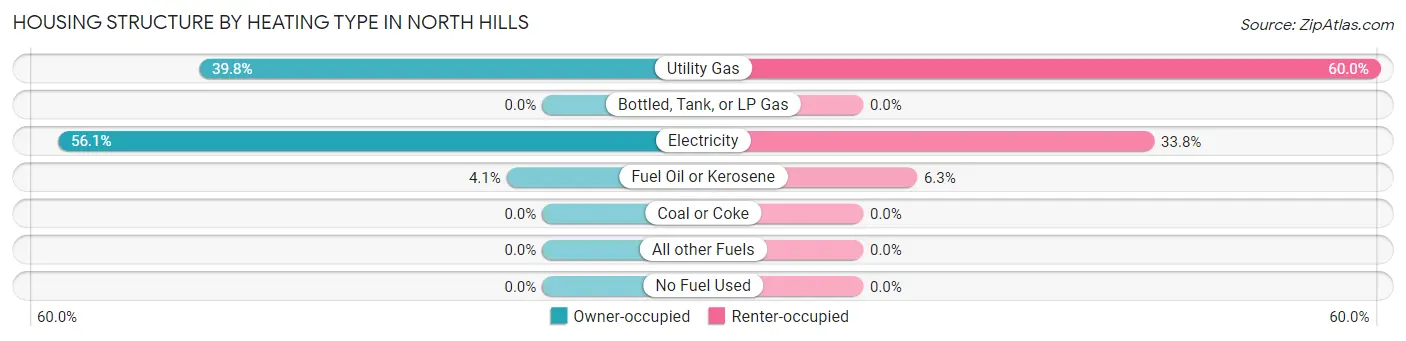
| Heating Type | Owner-occupied | Renter-occupied |
| Utility Gas | 763 (39.8%) | 240 (60.0%) |
| Bottled, Tank, or LP Gas | 0 (0.0%) | 0 (0.0%) |
| Electricity | 1,077 (56.1%) | 135 (33.8%) |
| Fuel Oil or Kerosene | 79 (4.1%) | 25 (6.2%) |
| Coal or Coke | 0 (0.0%) | 0 (0.0%) |
| All other Fuels | 0 (0.0%) | 0 (0.0%) |
| No Fuel Used | 0 (0.0%) | 0 (0.0%) |
| Total | 1,919 (100.0%) | 400 (100.0%) |
Household Vehicle Usage in North Hills
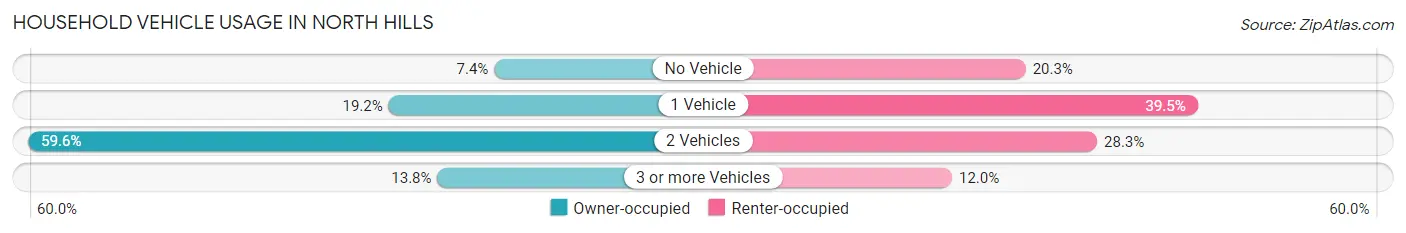
| Vehicles per Household | Owner-occupied | Renter-occupied |
| No Vehicle | 142 (7.4%) | 81 (20.3%) |
| 1 Vehicle | 369 (19.2%) | 158 (39.5%) |
| 2 Vehicles | 1,144 (59.6%) | 113 (28.2%) |
| 3 or more Vehicles | 264 (13.8%) | 48 (12.0%) |
| Total | 1,919 (100.0%) | 400 (100.0%) |
Real Estate & Mortgages in North Hills
Real Estate and Mortgage Overview in North Hills
| Characteristic | Without Mortgage | With Mortgage |
| Housing Units | 1,095 | 824 |
| Median Property Value | $1,391,800 | $1,150,600 |
| Median Household Income | $167,589 | $609 |
| Monthly Housing Costs | $1,501 | $782 |
| Real Estate Taxes | $10,001 | $0 |
Property Value by Mortgage Status in North Hills
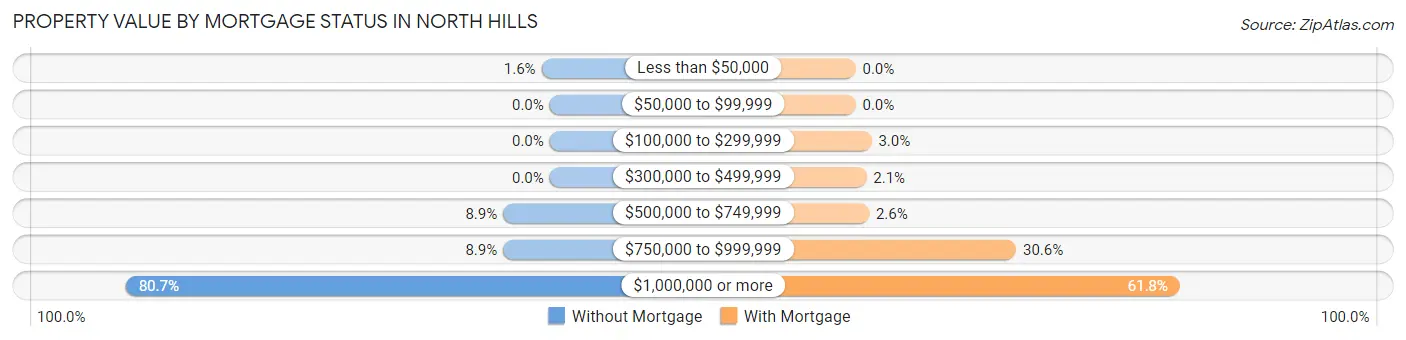
| Property Value | Without Mortgage | With Mortgage |
| Less than $50,000 | 17 (1.5%) | 0 (0.0%) |
| $50,000 to $99,999 | 0 (0.0%) | 0 (0.0%) |
| $100,000 to $299,999 | 0 (0.0%) | 25 (3.0%) |
| $300,000 to $499,999 | 0 (0.0%) | 17 (2.1%) |
| $500,000 to $749,999 | 97 (8.9%) | 21 (2.5%) |
| $750,000 to $999,999 | 97 (8.9%) | 252 (30.6%) |
| $1,000,000 or more | 884 (80.7%) | 509 (61.8%) |
| Total | 1,095 (100.0%) | 824 (100.0%) |
Household Income by Mortgage Status in North Hills
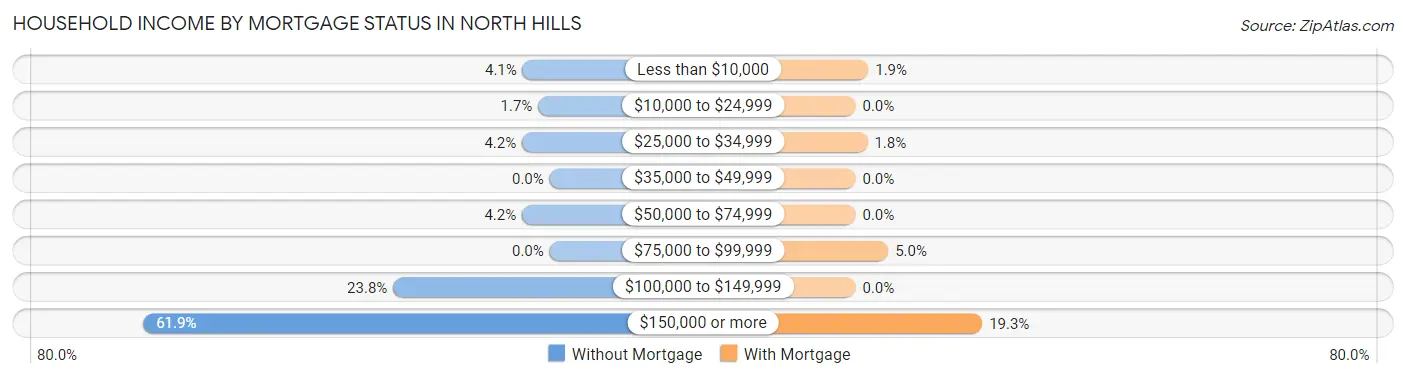
| Household Income | Without Mortgage | With Mortgage |
| Less than $10,000 | 45 (4.1%) | 16 (1.9%) |
| $10,000 to $24,999 | 19 (1.7%) | 0 (0.0%) |
| $25,000 to $34,999 | 46 (4.2%) | 15 (1.8%) |
| $35,000 to $49,999 | 0 (0.0%) | 0 (0.0%) |
| $50,000 to $74,999 | 46 (4.2%) | 0 (0.0%) |
| $75,000 to $99,999 | 0 (0.0%) | 41 (5.0%) |
| $100,000 to $149,999 | 261 (23.8%) | 0 (0.0%) |
| $150,000 or more | 678 (61.9%) | 159 (19.3%) |
| Total | 1,095 (100.0%) | 824 (100.0%) |
Property Value to Household Income Ratio in North Hills
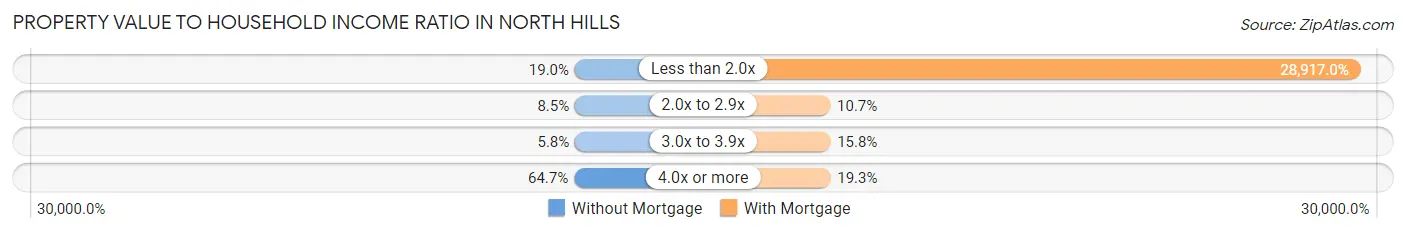
| Value-to-Income Ratio | Without Mortgage | With Mortgage |
| Less than 2.0x | 208 (19.0%) | 238,276 (28,917.0%) |
| 2.0x to 2.9x | 93 (8.5%) | 88 (10.7%) |
| 3.0x to 3.9x | 63 (5.8%) | 130 (15.8%) |
| 4.0x or more | 708 (64.7%) | 159 (19.3%) |
| Total | 1,095 (100.0%) | 824 (100.0%) |
Real Estate Taxes by Mortgage Status in North Hills
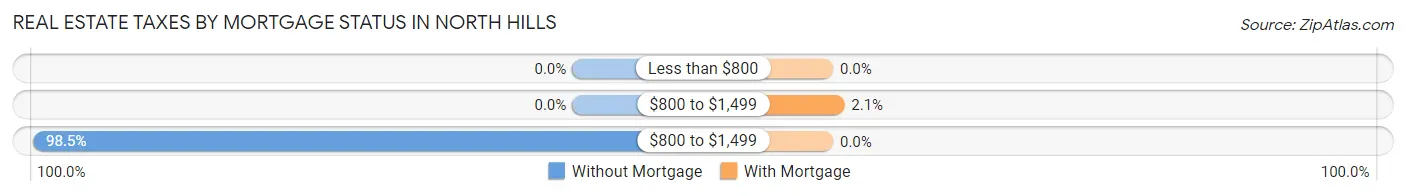
| Property Taxes | Without Mortgage | With Mortgage |
| Less than $800 | 0 (0.0%) | 0 (0.0%) |
| $800 to $1,499 | 0 (0.0%) | 17 (2.1%) |
| $800 to $1,499 | 1,078 (98.5%) | 0 (0.0%) |
| Total | 1,095 (100.0%) | 824 (100.0%) |
Health & Disability in North Hills
Health Insurance Coverage by Age in North Hills
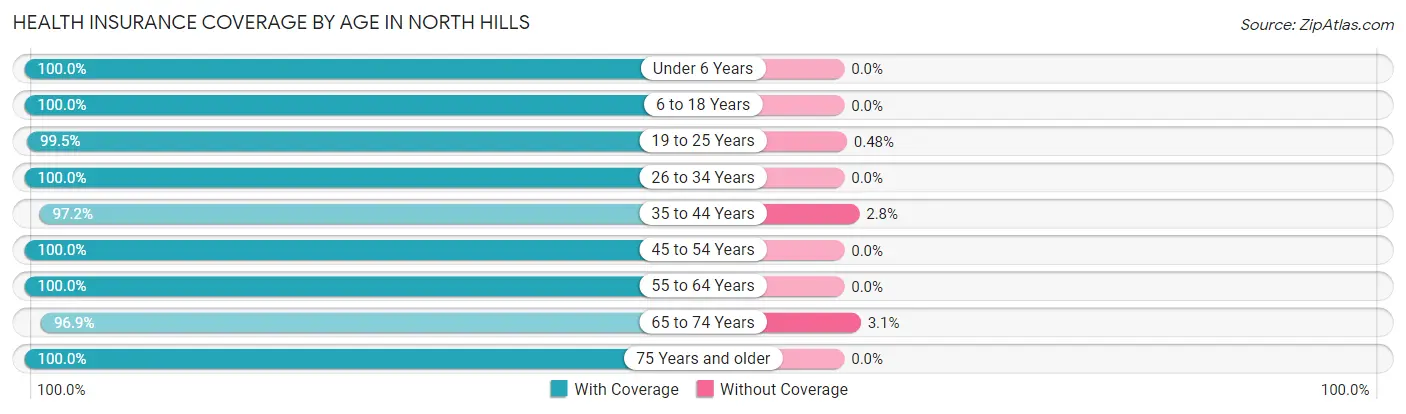
| Age Bracket | With Coverage | Without Coverage |
| Under 6 Years | 363 (100.0%) | 0 (0.0%) |
| 6 to 18 Years | 519 (100.0%) | 0 (0.0%) |
| 19 to 25 Years | 206 (99.5%) | 1 (0.5%) |
| 26 to 34 Years | 563 (100.0%) | 0 (0.0%) |
| 35 to 44 Years | 520 (97.2%) | 15 (2.8%) |
| 45 to 54 Years | 410 (100.0%) | 0 (0.0%) |
| 55 to 64 Years | 878 (100.0%) | 0 (0.0%) |
| 65 to 74 Years | 1,044 (96.9%) | 33 (3.1%) |
| 75 Years and older | 873 (100.0%) | 0 (0.0%) |
| Total | 5,376 (99.1%) | 49 (0.9%) |
Health Insurance Coverage by Citizenship Status in North Hills
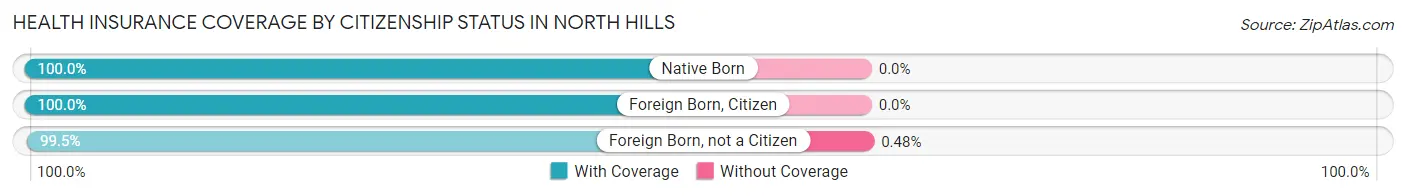
| Citizenship Status | With Coverage | Without Coverage |
| Native Born | 363 (100.0%) | 0 (0.0%) |
| Foreign Born, Citizen | 519 (100.0%) | 0 (0.0%) |
| Foreign Born, not a Citizen | 206 (99.5%) | 1 (0.5%) |
Health Insurance Coverage by Household Income in North Hills
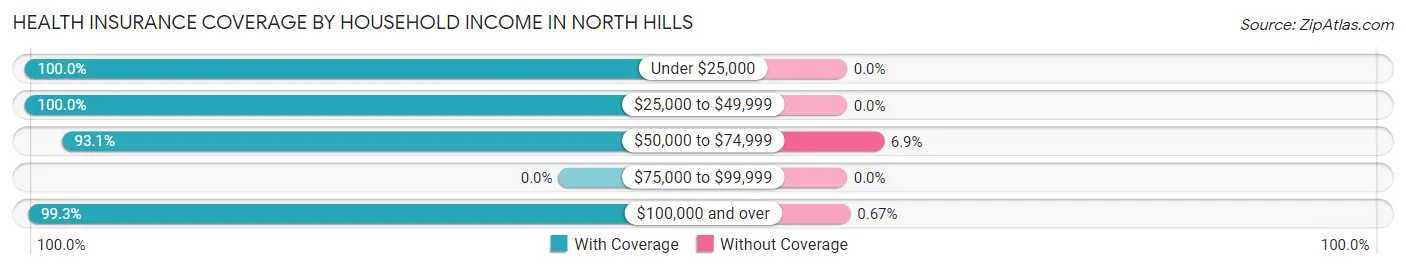
| Household Income | With Coverage | Without Coverage |
| Under $25,000 | 193 (100.0%) | 0 (0.0%) |
| $25,000 to $49,999 | 163 (100.0%) | 0 (0.0%) |
| $50,000 to $74,999 | 215 (93.1%) | 16 (6.9%) |
| $75,000 to $99,999 | 0 (0.0%) | 0 (0.0%) |
| $100,000 and over | 4,762 (99.3%) | 32 (0.7%) |
Public vs Private Health Insurance Coverage by Age in North Hills
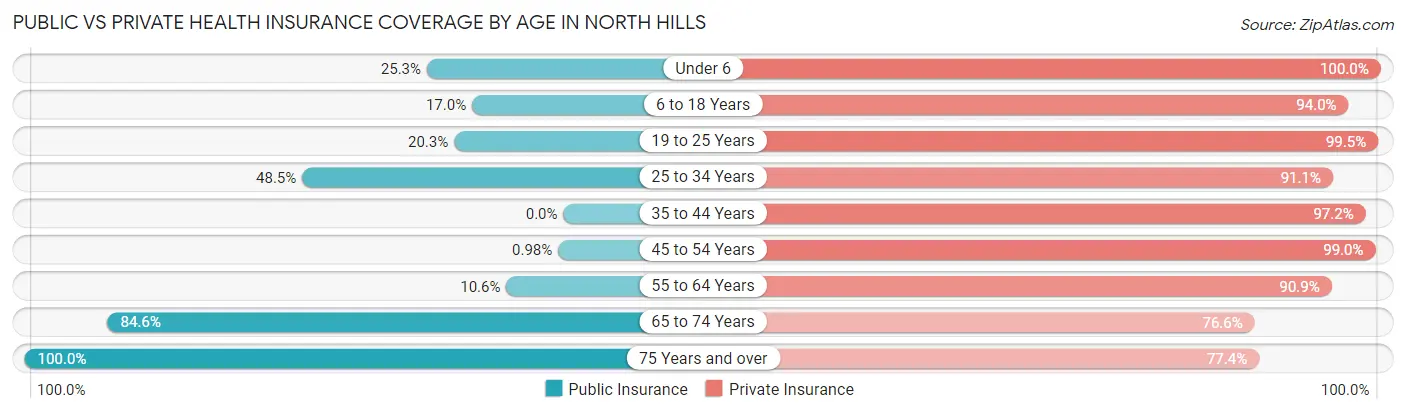
| Age Bracket | Public Insurance | Private Insurance |
| Under 6 | 92 (25.3%) | 363 (100.0%) |
| 6 to 18 Years | 88 (17.0%) | 488 (94.0%) |
| 19 to 25 Years | 42 (20.3%) | 206 (99.5%) |
| 25 to 34 Years | 273 (48.5%) | 513 (91.1%) |
| 35 to 44 Years | 0 (0.0%) | 520 (97.2%) |
| 45 to 54 Years | 4 (1.0%) | 406 (99.0%) |
| 55 to 64 Years | 93 (10.6%) | 798 (90.9%) |
| 65 to 74 Years | 911 (84.6%) | 825 (76.6%) |
| 75 Years and over | 873 (100.0%) | 676 (77.4%) |
| Total | 2,376 (43.8%) | 4,795 (88.4%) |
Disability Status by Sex by Age in North Hills
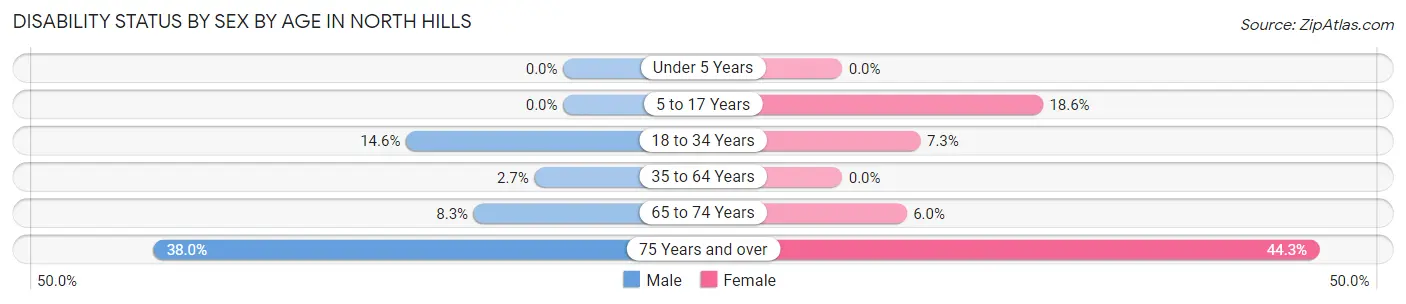
| Age Bracket | Male | Female |
| Under 5 Years | 0 (0.0%) | 0 (0.0%) |
| 5 to 17 Years | 0 (0.0%) | 73 (18.6%) |
| 18 to 34 Years | 42 (14.6%) | 35 (7.3%) |
| 35 to 64 Years | 24 (2.7%) | 0 (0.0%) |
| 65 to 74 Years | 45 (8.3%) | 32 (6.0%) |
| 75 Years and over | 149 (38.0%) | 213 (44.3%) |
Disability Class by Sex by Age in North Hills
Disability Class: Hearing Difficulty
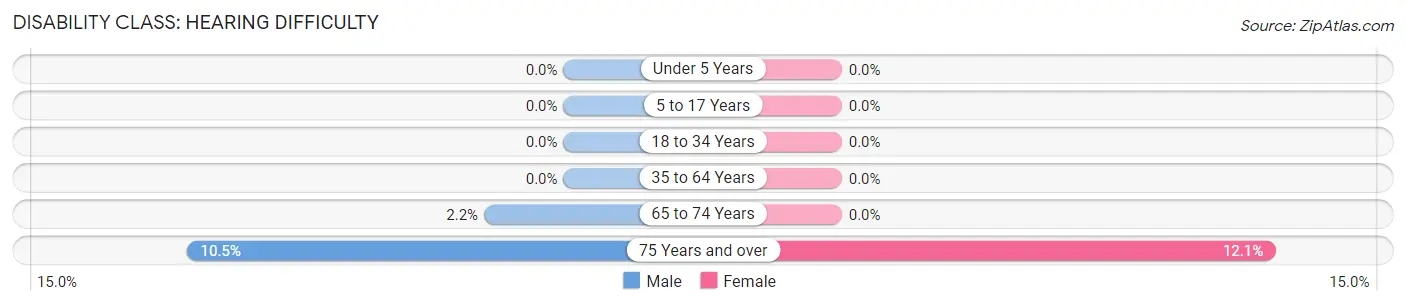
| Age Bracket | Male | Female |
| Under 5 Years | 0 (0.0%) | 0 (0.0%) |
| 5 to 17 Years | 0 (0.0%) | 0 (0.0%) |
| 18 to 34 Years | 0 (0.0%) | 0 (0.0%) |
| 35 to 64 Years | 0 (0.0%) | 0 (0.0%) |
| 65 to 74 Years | 12 (2.2%) | 0 (0.0%) |
| 75 Years and over | 41 (10.5%) | 58 (12.1%) |
Disability Class: Vision Difficulty
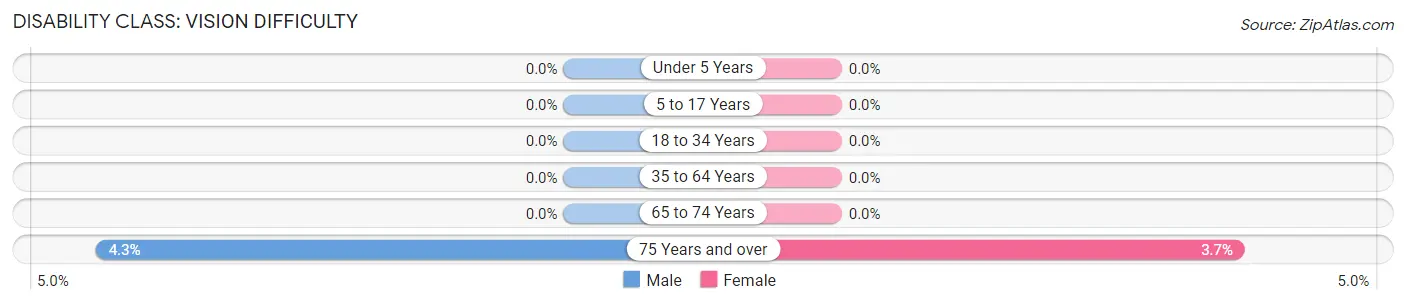
| Age Bracket | Male | Female |
| Under 5 Years | 0 (0.0%) | 0 (0.0%) |
| 5 to 17 Years | 0 (0.0%) | 0 (0.0%) |
| 18 to 34 Years | 0 (0.0%) | 0 (0.0%) |
| 35 to 64 Years | 0 (0.0%) | 0 (0.0%) |
| 65 to 74 Years | 0 (0.0%) | 0 (0.0%) |
| 75 Years and over | 17 (4.3%) | 18 (3.7%) |
Disability Class: Cognitive Difficulty
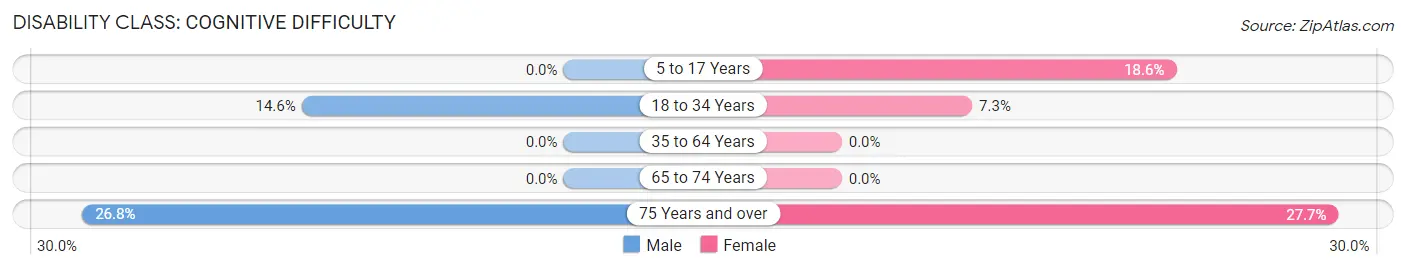
| Age Bracket | Male | Female |
| 5 to 17 Years | 0 (0.0%) | 73 (18.6%) |
| 18 to 34 Years | 42 (14.6%) | 35 (7.3%) |
| 35 to 64 Years | 0 (0.0%) | 0 (0.0%) |
| 65 to 74 Years | 0 (0.0%) | 0 (0.0%) |
| 75 Years and over | 105 (26.8%) | 133 (27.7%) |
Disability Class: Ambulatory Difficulty
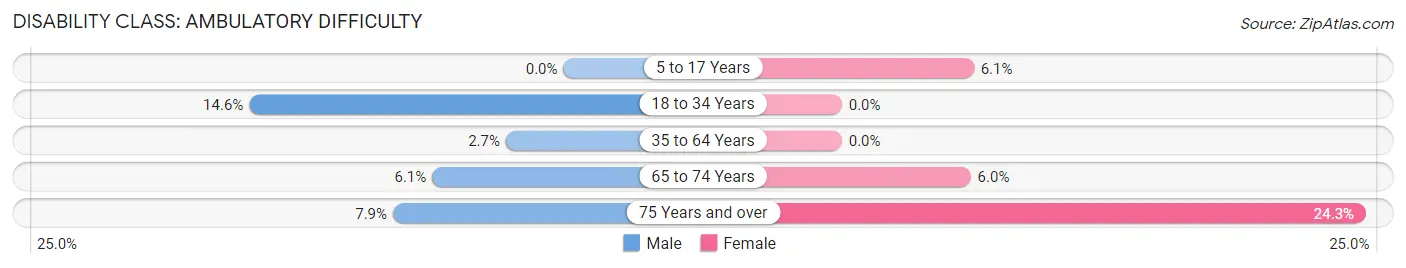
| Age Bracket | Male | Female |
| 5 to 17 Years | 0 (0.0%) | 24 (6.1%) |
| 18 to 34 Years | 42 (14.6%) | 0 (0.0%) |
| 35 to 64 Years | 24 (2.7%) | 0 (0.0%) |
| 65 to 74 Years | 33 (6.1%) | 32 (6.0%) |
| 75 Years and over | 31 (7.9%) | 117 (24.3%) |
Disability Class: Self-Care Difficulty
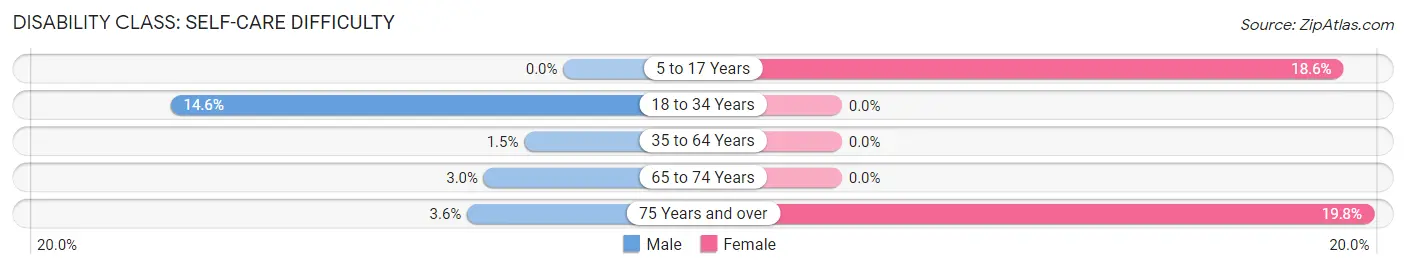
| Age Bracket | Male | Female |
| 5 to 17 Years | 0 (0.0%) | 73 (18.6%) |
| 18 to 34 Years | 42 (14.6%) | 0 (0.0%) |
| 35 to 64 Years | 13 (1.5%) | 0 (0.0%) |
| 65 to 74 Years | 16 (2.9%) | 0 (0.0%) |
| 75 Years and over | 14 (3.6%) | 95 (19.8%) |
Technology Access in North Hills
Computing Device Access in North Hills
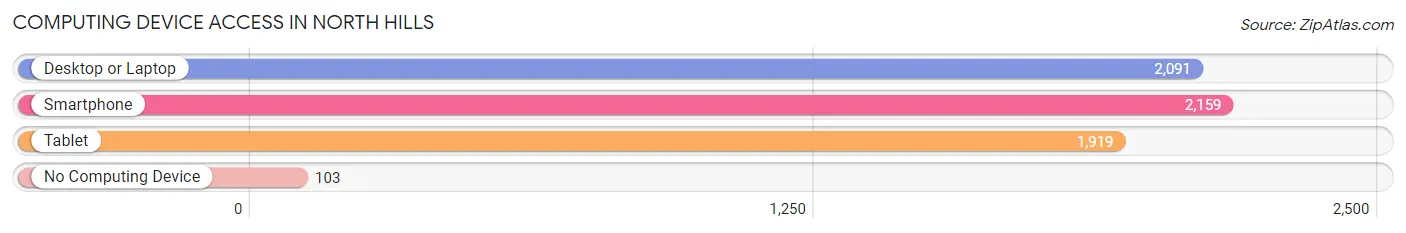
| Device Type | # Households | % Households |
| Desktop or Laptop | 2,091 | 90.2% |
| Smartphone | 2,159 | 93.1% |
| Tablet | 1,919 | 82.8% |
| No Computing Device | 103 | 4.4% |
| Total | 2,319 | 100.0% |
Internet Access in North Hills
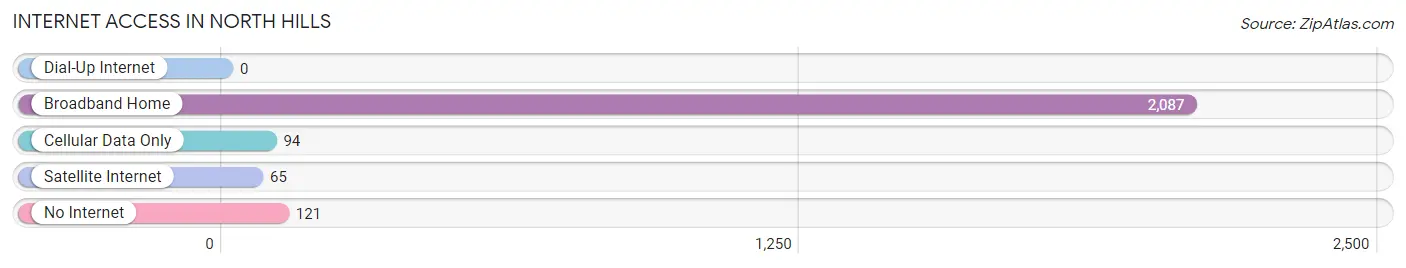
| Internet Type | # Households | % Households |
| Dial-Up Internet | 0 | 0.0% |
| Broadband Home | 2,087 | 90.0% |
| Cellular Data Only | 94 | 4.1% |
| Satellite Internet | 65 | 2.8% |
| No Internet | 121 | 5.2% |
| Total | 2,319 | 100.0% |
North Hills Summary
History
North Hills is a hamlet located in the Town of North Hempstead in Nassau County, New York. It is situated on the north shore of Long Island, approximately 25 miles east of Manhattan. The hamlet was originally part of the Town of Hempstead, but was annexed by the Town of North Hempstead in the late 19th century.
The area was first settled by the Matinecock Native American tribe in the 1600s. The first European settlers arrived in the area in the 1700s, and the hamlet was officially established in 1790. The hamlet was originally known as “North Hempstead”, but was later changed to “North Hills” in 1875.
The hamlet experienced rapid growth in the late 19th and early 20th centuries, as it became a popular summer destination for wealthy New Yorkers. The area was home to several large estates, including the estate of William K. Vanderbilt, which is now the site of the Nassau County Museum of Art.
Geography
North Hills is located in the Town of North Hempstead in Nassau County, New York. It is situated on the north shore of Long Island, approximately 25 miles east of Manhattan. The hamlet is bordered by the hamlets of Roslyn to the east, Manhasset to the south, and Great Neck to the west.
The hamlet is located on a plateau, with elevations ranging from sea level to approximately 200 feet. The area is characterized by rolling hills and wooded areas, with several small ponds and streams. The hamlet is home to several parks, including Christopher Morley Park and North Hempstead Beach Park.
Economy
North Hills is primarily a residential community, with a small commercial district located along Northern Boulevard. The hamlet is home to several small businesses, including restaurants, retail stores, and professional services. The hamlet is also home to several corporate offices, including the headquarters of the North Shore-LIJ Health System.
The hamlet is served by the Long Island Rail Road, with two stations located in the hamlet. The hamlet is also served by several bus routes operated by the Nassau Inter-County Express.
Demographics
As of the 2010 census, the population of North Hills was 8,845. The population is predominantly white (83.3%), with small percentages of African American (7.2%), Asian (4.7%), and Hispanic (3.7%) residents. The median household income is $117,917, and the median home value is $817,000.
The hamlet is home to several religious institutions, including the North Hills Reformed Church, the North Hills Jewish Center, and the North Hills Islamic Center. The hamlet is also home to several private schools, including the North Hills Country Day School and the North Shore Hebrew Academy.
Common Questions
What is Per Capita Income in North Hills?
Per Capita income in North Hills is $125,639.
What is the Median Family Income in North Hills?
Median Family Income in North Hills is $214,600.
What is the Median Household income in North Hills?
Median Household Income in North Hills is $182,401.
What is Income or Wage Gap in North Hills?
Income or Wage Gap in North Hills is 63.9%.
Women in North Hills earn 36.1 cents for every dollar earned by a man.
What is Inequality or Gini Index in North Hills?
Inequality or Gini Index in North Hills is 0.49.
What is the Total Population of North Hills?
Total Population of North Hills is 5,425.
What is the Total Male Population of North Hills?
Total Male Population of North Hills is 2,395.
What is the Total Female Population of North Hills?
Total Female Population of North Hills is 3,030.
What is the Ratio of Males per 100 Females in North Hills?
There are 79.04 Males per 100 Females in North Hills.
What is the Ratio of Females per 100 Males in North Hills?
There are 126.51 Females per 100 Males in North Hills.
What is the Median Population Age in North Hills?
Median Population Age in North Hills is 55.8 Years.
What is the Average Family Size in North Hills
Average Family Size in North Hills is 2.7 People.
What is the Average Household Size in North Hills
Average Household Size in North Hills is 2.3 People.
How Large is the Labor Force in North Hills?
There are 2,520 People in the Labor Forcein in North Hills.
What is the Percentage of People in the Labor Force in North Hills?
55.0% of People are in the Labor Force in North Hills.
What is the Unemployment Rate in North Hills?
Unemployment Rate in North Hills is 1.9%.