Interlaken, NY Map & Demographics
Interlaken Map
Interlaken Overview
$33,136
PER CAPITA INCOME
$83,438
AVG FAMILY INCOME
$59,167
AVG HOUSEHOLD INCOME
25.1%
WAGE / INCOME GAP [ % ]
74.9¢/ $1
WAGE / INCOME GAP [ $ ]
0.33
INEQUALITY / GINI INDEX
503
TOTAL POPULATION
225
MALE POPULATION
278
FEMALE POPULATION
80.94
MALES / 100 FEMALES
123.56
FEMALES / 100 MALES
46.0
MEDIAN AGE
2.7
AVG FAMILY SIZE
1.9
AVG HOUSEHOLD SIZE
257
LABOR FORCE [ PEOPLE ]
60.6%
PERCENT IN LABOR FORCE
1.9%
UNEMPLOYMENT RATE
Interlaken Zip Codes
Interlaken Area Codes
Income in Interlaken
Income Overview in Interlaken
Per Capita Income in Interlaken is $33,136, while median incomes of families and households are $83,438 and $59,167 respectively.
| Characteristic | Number | Measure |
| Per Capita Income | 503 | $33,136 |
| Median Family Income | 124 | $83,438 |
| Mean Family Income | 124 | $79,355 |
| Median Household Income | 256 | $59,167 |
| Mean Household Income | 256 | $64,975 |
| Income Deficit | 124 | $0 |
| Wage / Income Gap (%) | 503 | 25.14% |
| Wage / Income Gap ($) | 503 | 74.86¢ per $1 |
| Gini / Inequality Index | 503 | 0.33 |
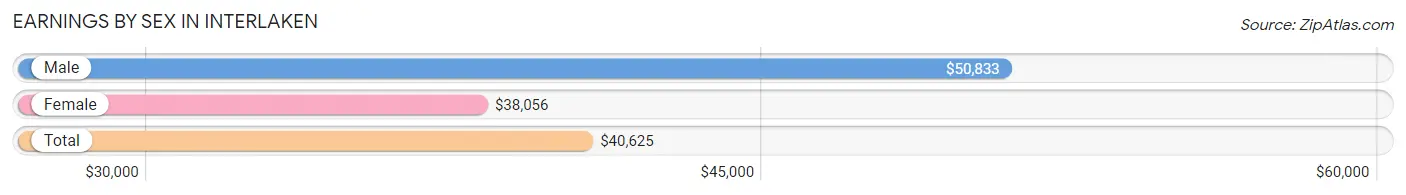
Earnings by Sex in Interlaken
Average Earnings in Interlaken are $40,625, $50,833 for men and $38,056 for women, a difference of 25.1%.
| Sex | Number | Average Earnings |
| Male | 128 (48.1%) | $50,833 |
| Female | 138 (51.9%) | $38,056 |
| Total | 266 (100.0%) | $40,625 |
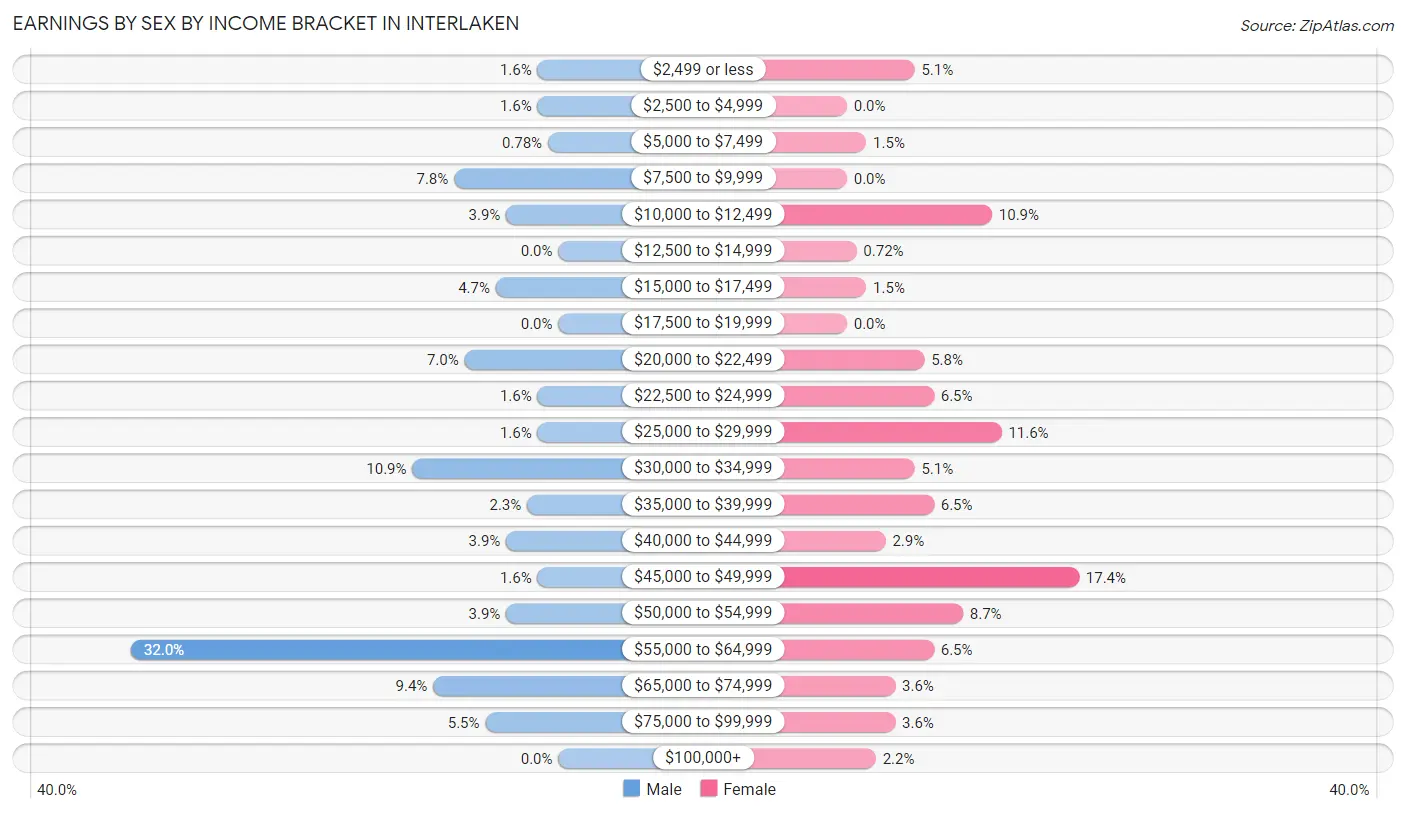
Earnings by Sex by Income Bracket in Interlaken
The most common earnings brackets in Interlaken are $55,000 to $64,999 for men (41 | 32.0%) and $45,000 to $49,999 for women (24 | 17.4%).
| Income | Male | Female |
| $2,499 or less | 2 (1.6%) | 7 (5.1%) |
| $2,500 to $4,999 | 2 (1.6%) | 0 (0.0%) |
| $5,000 to $7,499 | 1 (0.8%) | 2 (1.5%) |
| $7,500 to $9,999 | 10 (7.8%) | 0 (0.0%) |
| $10,000 to $12,499 | 5 (3.9%) | 15 (10.9%) |
| $12,500 to $14,999 | 0 (0.0%) | 1 (0.7%) |
| $15,000 to $17,499 | 6 (4.7%) | 2 (1.5%) |
| $17,500 to $19,999 | 0 (0.0%) | 0 (0.0%) |
| $20,000 to $22,499 | 9 (7.0%) | 8 (5.8%) |
| $22,500 to $24,999 | 2 (1.6%) | 9 (6.5%) |
| $25,000 to $29,999 | 2 (1.6%) | 16 (11.6%) |
| $30,000 to $34,999 | 14 (10.9%) | 7 (5.1%) |
| $35,000 to $39,999 | 3 (2.3%) | 9 (6.5%) |
| $40,000 to $44,999 | 5 (3.9%) | 4 (2.9%) |
| $45,000 to $49,999 | 2 (1.6%) | 24 (17.4%) |
| $50,000 to $54,999 | 5 (3.9%) | 12 (8.7%) |
| $55,000 to $64,999 | 41 (32.0%) | 9 (6.5%) |
| $65,000 to $74,999 | 12 (9.4%) | 5 (3.6%) |
| $75,000 to $99,999 | 7 (5.5%) | 5 (3.6%) |
| $100,000+ | 0 (0.0%) | 3 (2.2%) |
| Total | 128 (100.0%) | 138 (100.0%) |
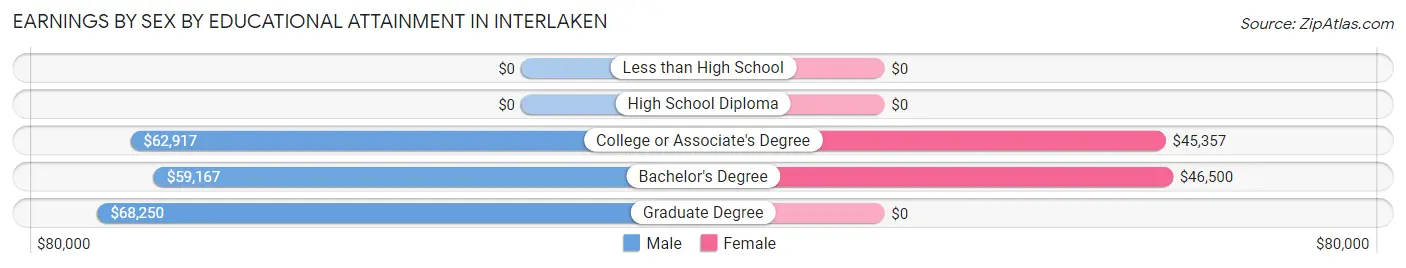
Earnings by Sex by Educational Attainment in Interlaken
Average earnings in Interlaken are $58,333 for men and $39,861 for women, a difference of 31.7%. Men with an educational attainment of graduate degree enjoy the highest average annual earnings of $68,250, while those with bachelor's degree education earn the least with $59,167. Women with an educational attainment of bachelor's degree earn the most with the average annual earnings of $46,500, while those with college or associate's degree education have the smallest earnings of $45,357.
| Educational Attainment | Male Income | Female Income |
| Less than High School | - | - |
| High School Diploma | - | - |
| College or Associate's Degree | $62,917 | $45,357 |
| Bachelor's Degree | $59,167 | $46,500 |
| Graduate Degree | $68,250 | $0 |
| Total | $58,333 | $39,861 |
Family Income in Interlaken
Family Income Brackets in Interlaken
According to the Interlaken family income data, there are 43 families falling into the $75,000 to $99,999 income range, which is the most common income bracket and makes up 34.7% of all families.
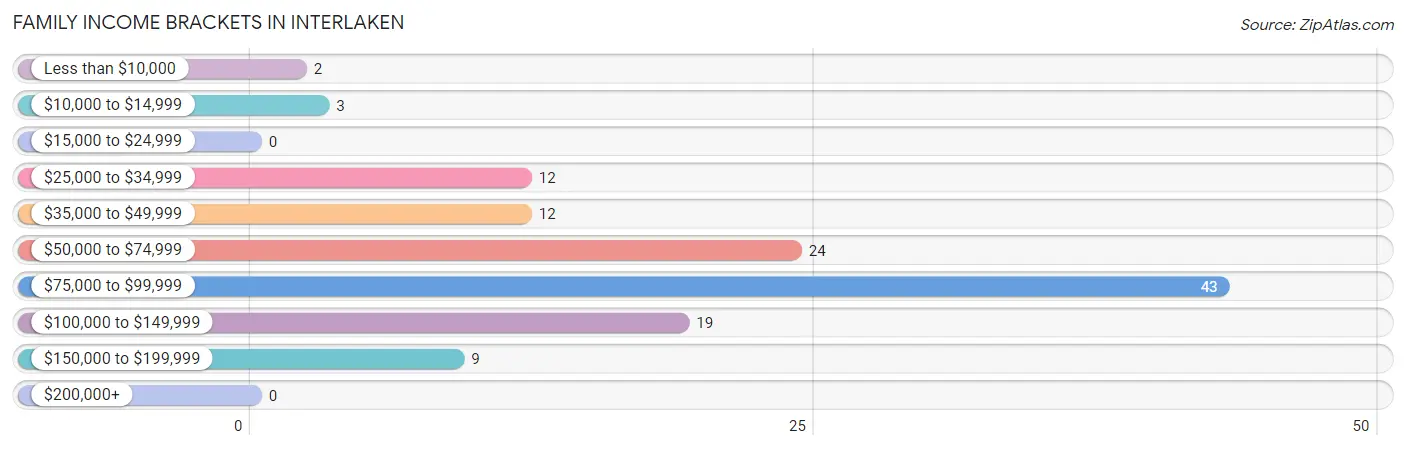
| Income Bracket | # Families | % Families |
| Less than $10,000 | 2 | 1.6% |
| $10,000 to $14,999 | 3 | 2.4% |
| $15,000 to $24,999 | 0 | 0.0% |
| $25,000 to $34,999 | 12 | 9.7% |
| $35,000 to $49,999 | 12 | 9.7% |
| $50,000 to $74,999 | 24 | 19.4% |
| $75,000 to $99,999 | 43 | 34.7% |
| $100,000 to $149,999 | 19 | 15.3% |
| $150,000 to $199,999 | 9 | 7.3% |
| $200,000+ | 0 | 0.0% |
Family Income by Famaliy Size in Interlaken
4-person families (22 | 17.7%) account for the highest median family income in Interlaken with $123,333 per family, while 2-person families (76 | 61.3%) have the highest median income of $37,500 per family member.
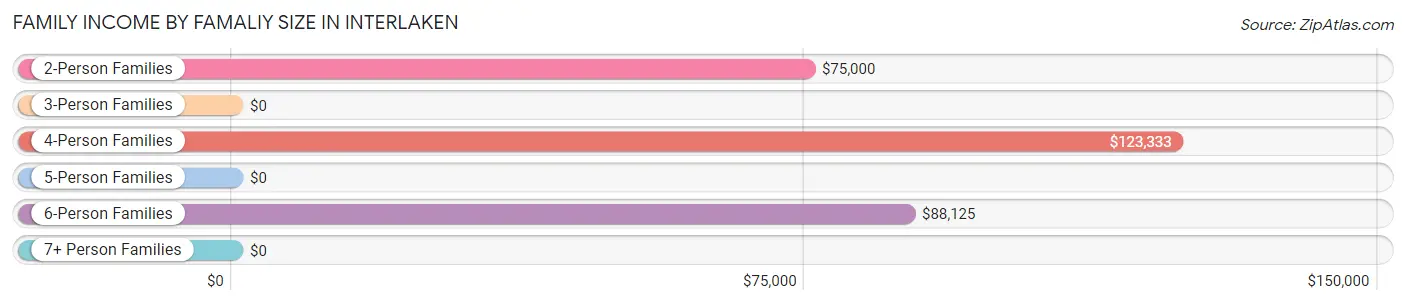
| Income Bracket | # Families | Median Income |
| 2-Person Families | 76 (61.3%) | $75,000 |
| 3-Person Families | 18 (14.5%) | $0 |
| 4-Person Families | 22 (17.7%) | $123,333 |
| 5-Person Families | 1 (0.8%) | $0 |
| 6-Person Families | 7 (5.7%) | $88,125 |
| 7+ Person Families | 0 (0.0%) | $0 |
| Total | 124 (100.0%) | $83,438 |
Family Income by Number of Earners in Interlaken
The median family income in Interlaken is $83,438, with families comprising 3+ earners (12) having the highest median family income of $152,857, while families with no earners (36) have the lowest median family income of $41,500, accounting for 9.7% and 29.0% of families, respectively.
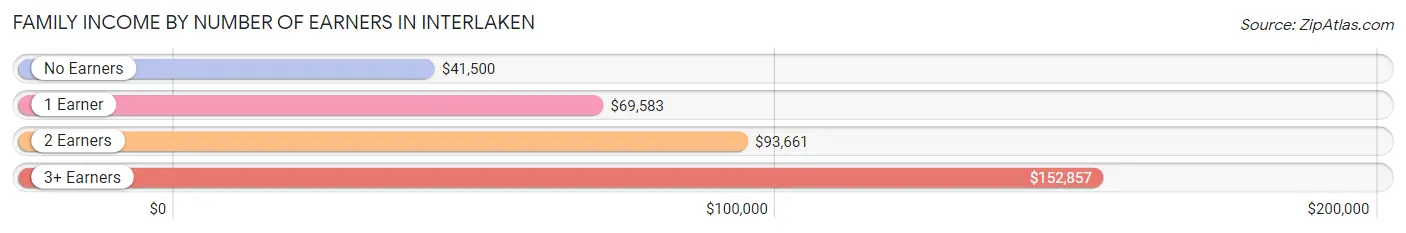
| Number of Earners | # Families | Median Income |
| No Earners | 36 (29.0%) | $41,500 |
| 1 Earner | 25 (20.2%) | $69,583 |
| 2 Earners | 51 (41.1%) | $93,661 |
| 3+ Earners | 12 (9.7%) | $152,857 |
| Total | 124 (100.0%) | $83,438 |
Household Income in Interlaken
Household Income Brackets in Interlaken
With 64 households falling in the category, the $75,000 to $99,999 income range is the most frequent in Interlaken, accounting for 25.0% of all households.
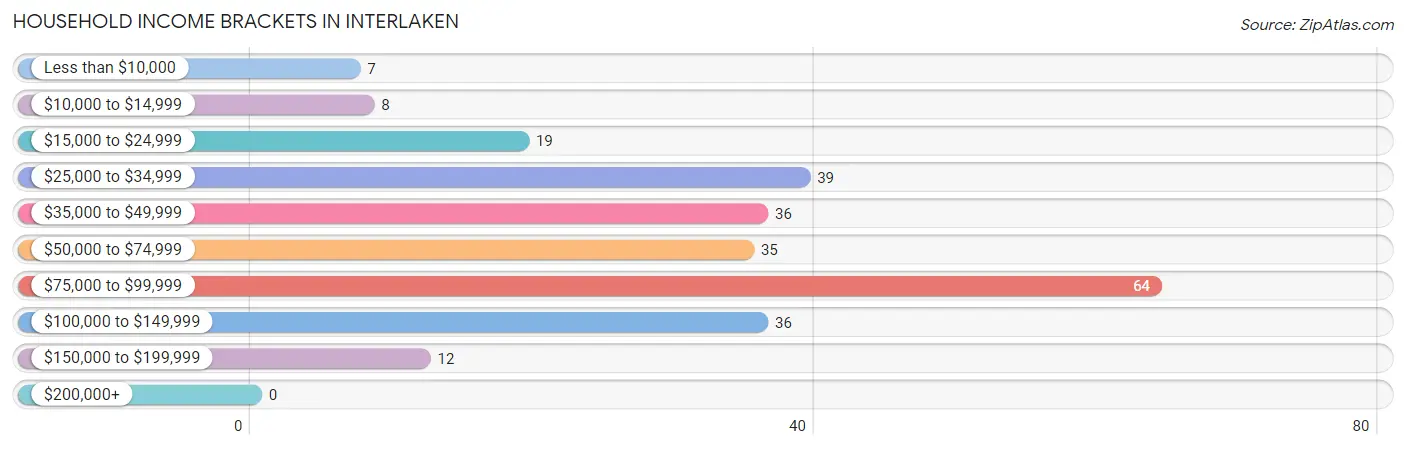
| Income Bracket | # Households | % Households |
| Less than $10,000 | 7 | 2.7% |
| $10,000 to $14,999 | 8 | 3.1% |
| $15,000 to $24,999 | 19 | 7.4% |
| $25,000 to $34,999 | 39 | 15.2% |
| $35,000 to $49,999 | 36 | 14.1% |
| $50,000 to $74,999 | 35 | 13.7% |
| $75,000 to $99,999 | 64 | 25.0% |
| $100,000 to $149,999 | 36 | 14.1% |
| $150,000 to $199,999 | 12 | 4.7% |
| $200,000+ | 0 | 0.0% |
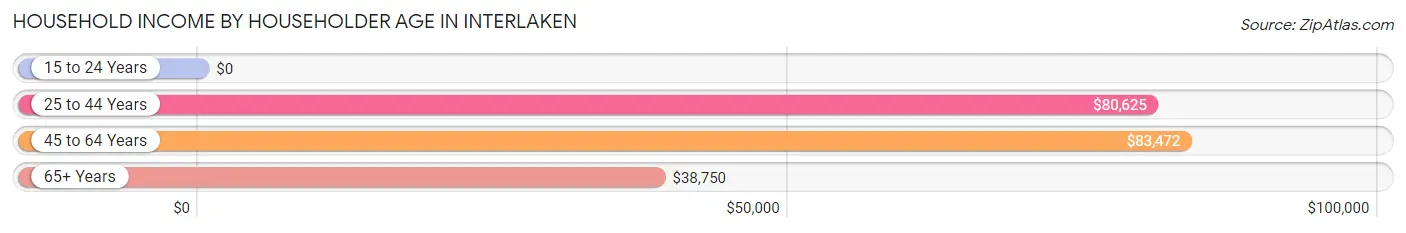
Household Income by Householder Age in Interlaken
The median household income in Interlaken is $59,167, with the highest median household income of $83,472 found in the 45 to 64 years age bracket for the primary householder. A total of 89 households (34.8%) fall into this category. Meanwhile, the 15 to 24 years age bracket for the primary householder has the lowest median household income of $0, with 8 households (3.1%) in this group.
| Income Bracket | # Households | Median Income |
| 15 to 24 Years | 8 (3.1%) | $0 |
| 25 to 44 Years | 65 (25.4%) | $80,625 |
| 45 to 64 Years | 89 (34.8%) | $83,472 |
| 65+ Years | 94 (36.7%) | $38,750 |
| Total | 256 (100.0%) | $59,167 |
Poverty in Interlaken
Income Below Poverty by Sex and Age in Interlaken
With 6.3% poverty level for males and 13.1% for females among the residents of Interlaken, 6 to 11 year old males and 12 to 14 year old females are the most vulnerable to poverty, with 2 males (25.0%) and 2 females (100.0%) in their respective age groups living below the poverty level.
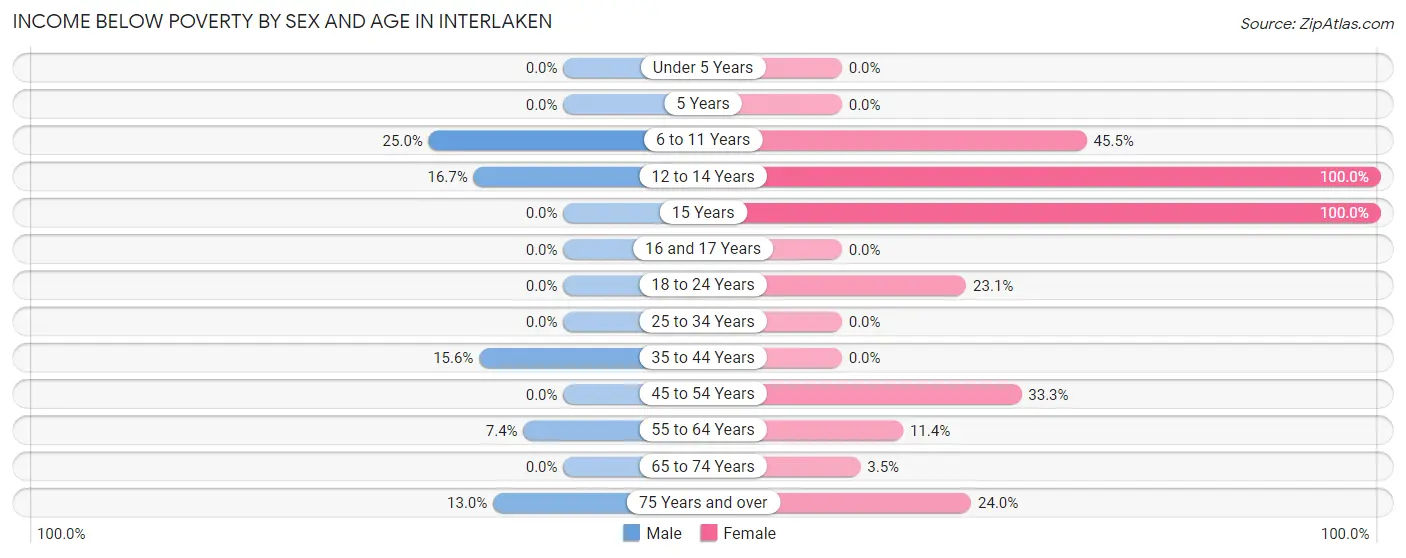
| Age Bracket | Male | Female |
| Under 5 Years | 0 (0.0%) | 0 (0.0%) |
| 5 Years | 0 (0.0%) | 0 (0.0%) |
| 6 to 11 Years | 2 (25.0%) | 5 (45.5%) |
| 12 to 14 Years | 2 (16.7%) | 2 (100.0%) |
| 15 Years | 0 (0.0%) | 2 (100.0%) |
| 16 and 17 Years | 0 (0.0%) | 0 (0.0%) |
| 18 to 24 Years | 0 (0.0%) | 3 (23.1%) |
| 25 to 34 Years | 0 (0.0%) | 0 (0.0%) |
| 35 to 44 Years | 5 (15.6%) | 0 (0.0%) |
| 45 to 54 Years | 0 (0.0%) | 5 (33.3%) |
| 55 to 64 Years | 2 (7.4%) | 5 (11.4%) |
| 65 to 74 Years | 0 (0.0%) | 2 (3.5%) |
| 75 Years and over | 3 (13.0%) | 12 (24.0%) |
| Total | 14 (6.3%) | 36 (13.1%) |
Income Above Poverty by Sex and Age in Interlaken
According to the poverty statistics in Interlaken, males aged under 5 years and females aged under 5 years are the age groups that are most secure financially, with 100.0% of males and 100.0% of females in these age groups living above the poverty line.
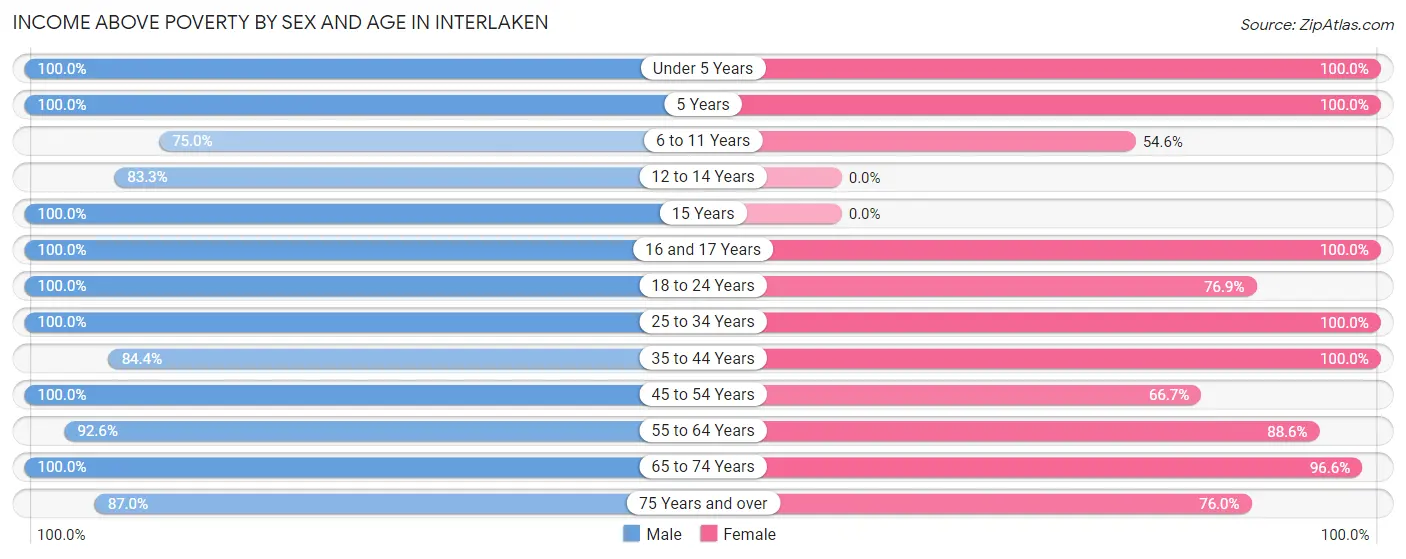
| Age Bracket | Male | Female |
| Under 5 Years | 12 (100.0%) | 14 (100.0%) |
| 5 Years | 4 (100.0%) | 7 (100.0%) |
| 6 to 11 Years | 6 (75.0%) | 6 (54.5%) |
| 12 to 14 Years | 10 (83.3%) | 0 (0.0%) |
| 15 Years | 5 (100.0%) | 0 (0.0%) |
| 16 and 17 Years | 9 (100.0%) | 2 (100.0%) |
| 18 to 24 Years | 25 (100.0%) | 10 (76.9%) |
| 25 to 34 Years | 25 (100.0%) | 28 (100.0%) |
| 35 to 44 Years | 27 (84.4%) | 29 (100.0%) |
| 45 to 54 Years | 27 (100.0%) | 10 (66.7%) |
| 55 to 64 Years | 25 (92.6%) | 39 (88.6%) |
| 65 to 74 Years | 14 (100.0%) | 56 (96.6%) |
| 75 Years and over | 20 (87.0%) | 38 (76.0%) |
| Total | 209 (93.7%) | 239 (86.9%) |
Income Below Poverty Among Married-Couple Families in Interlaken
The poverty statistics for married-couple families in Interlaken show that 5.4% or 5 of the total 92 families live below the poverty line. Families with 1 or 2 children have the highest poverty rate of 19.2%, comprising of 5 families. On the other hand, families with no children have the lowest poverty rate of 0.0%, which includes 0 families.
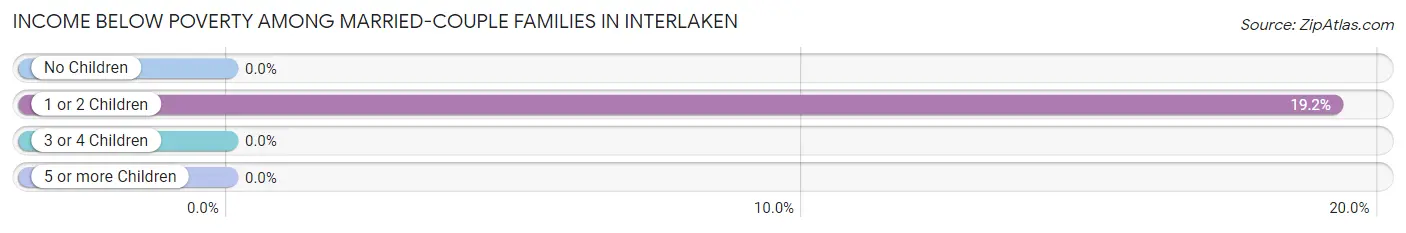
| Children | Above Poverty | Below Poverty |
| No Children | 62 (100.0%) | 0 (0.0%) |
| 1 or 2 Children | 21 (80.8%) | 5 (19.2%) |
| 3 or 4 Children | 4 (100.0%) | 0 (0.0%) |
| 5 or more Children | 0 (0.0%) | 0 (0.0%) |
| Total | 87 (94.6%) | 5 (5.4%) |
Income Below Poverty Among Single-Parent Households in Interlaken
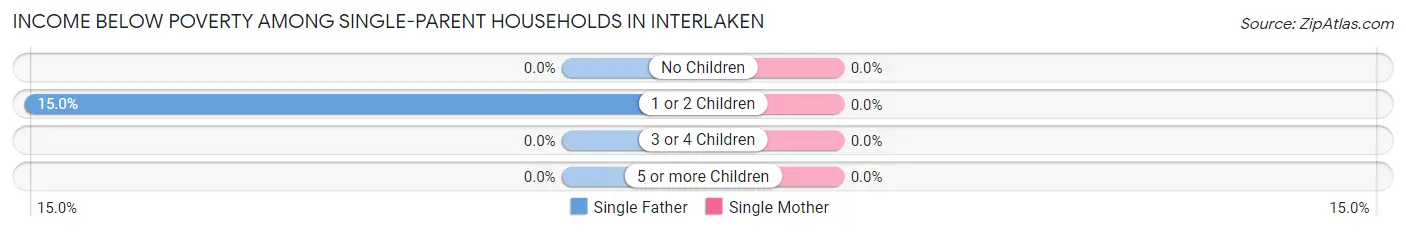
| Children | Single Father | Single Mother |
| No Children | 0 (0.0%) | 0 (0.0%) |
| 1 or 2 Children | 3 (15.0%) | 0 (0.0%) |
| 3 or 4 Children | 0 (0.0%) | 0 (0.0%) |
| 5 or more Children | 0 (0.0%) | 0 (0.0%) |
| Total | 3 (15.0%) | 0 (0.0%) |
Income Below Poverty Among Married-Couple vs Single-Parent Households in Interlaken
The poverty data for Interlaken shows that 5 of the married-couple family households (5.4%) and 3 of the single-parent households (9.4%) are living below the poverty level. Within the married-couple family households, those with 1 or 2 children have the highest poverty rate, with 5 households (19.2%) falling below the poverty line. Among the single-parent households, those with 1 or 2 children have the highest poverty rate, with 3 household (12.5%) living below poverty.
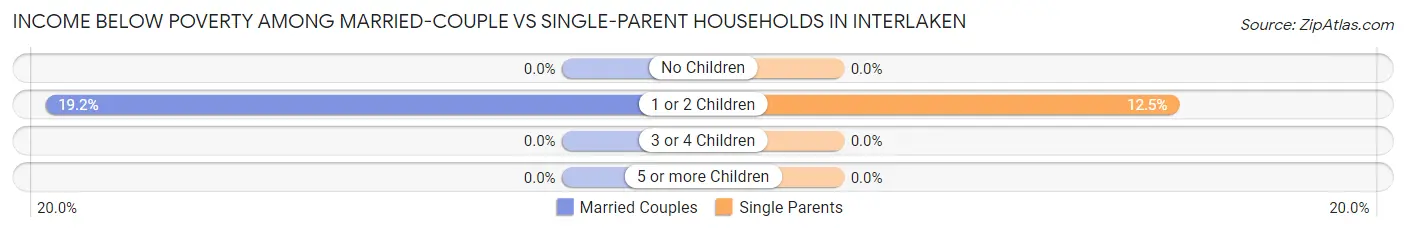
| Children | Married-Couple Families | Single-Parent Households |
| No Children | 0 (0.0%) | 0 (0.0%) |
| 1 or 2 Children | 5 (19.2%) | 3 (12.5%) |
| 3 or 4 Children | 0 (0.0%) | 0 (0.0%) |
| 5 or more Children | 0 (0.0%) | 0 (0.0%) |
| Total | 5 (5.4%) | 3 (9.4%) |
Race in Interlaken
The most populous races in Interlaken are White / Caucasian (439 | 87.3%), Hispanic or Latino (31 | 6.2%), and Two or more Races (25 | 5.0%).
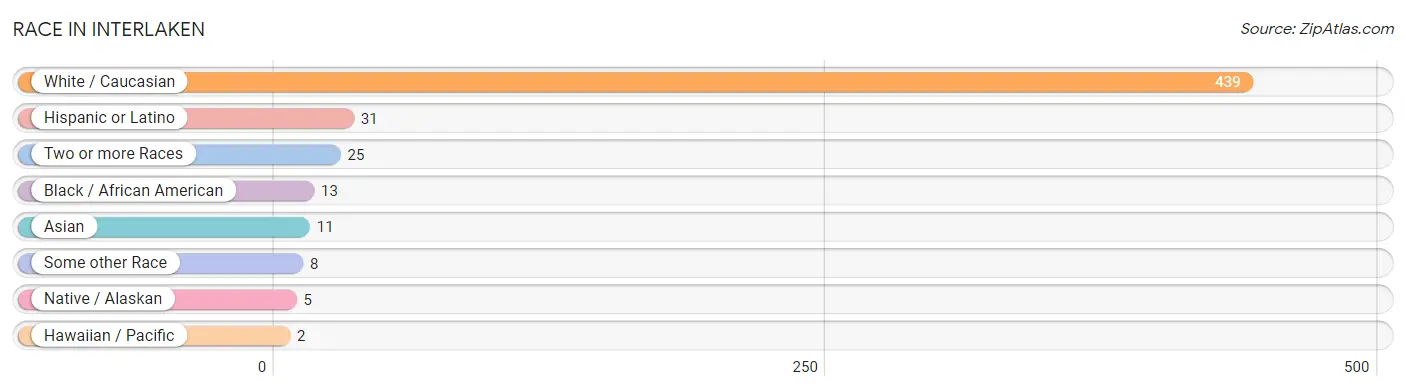
| Race | # Population | % Population |
| Asian | 11 | 2.2% |
| Black / African American | 13 | 2.6% |
| Hawaiian / Pacific | 2 | 0.4% |
| Hispanic or Latino | 31 | 6.2% |
| Native / Alaskan | 5 | 1.0% |
| White / Caucasian | 439 | 87.3% |
| Two or more Races | 25 | 5.0% |
| Some other Race | 8 | 1.6% |
| Total | 503 | 100.0% |
Ancestry in Interlaken
The most populous ancestries reported in Interlaken are German (99 | 19.7%), English (78 | 15.5%), Irish (70 | 13.9%), Dutch (53 | 10.5%), and American (42 | 8.4%), together accounting for 68.0% of all Interlaken residents.
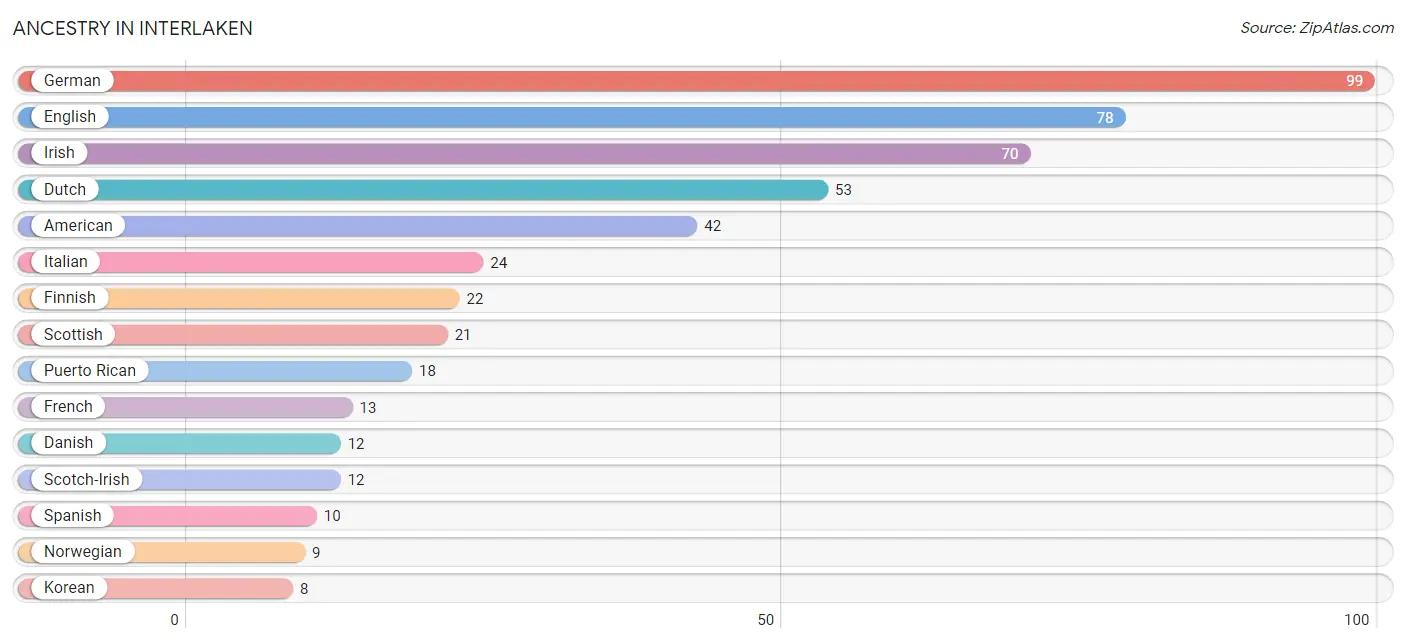
| Ancestry | # Population | % Population |
| American | 42 | 8.4% |
| British | 2 | 0.4% |
| Chippewa | 7 | 1.4% |
| Czech | 2 | 0.4% |
| Danish | 12 | 2.4% |
| Dutch | 53 | 10.5% |
| Eastern European | 1 | 0.2% |
| English | 78 | 15.5% |
| European | 3 | 0.6% |
| Finnish | 22 | 4.4% |
| French | 13 | 2.6% |
| German | 99 | 19.7% |
| Greek | 2 | 0.4% |
| Hungarian | 7 | 1.4% |
| Indian (Asian) | 5 | 1.0% |
| Irish | 70 | 13.9% |
| Italian | 24 | 4.8% |
| Korean | 8 | 1.6% |
| Mexican | 2 | 0.4% |
| Mexican American Indian | 2 | 0.4% |
| Native Hawaiian | 2 | 0.4% |
| Norwegian | 9 | 1.8% |
| Pennsylvania German | 2 | 0.4% |
| Polish | 6 | 1.2% |
| Puerto Rican | 18 | 3.6% |
| Russian | 2 | 0.4% |
| Scotch-Irish | 12 | 2.4% |
| Scottish | 21 | 4.2% |
| Slovak | 2 | 0.4% |
| South African | 2 | 0.4% |
| Spanish | 10 | 2.0% |
| Subsaharan African | 2 | 0.4% |
| Swedish | 7 | 1.4% |
| Ute | 4 | 0.8% |
| Welsh | 1 | 0.2% | View All 35 Rows |
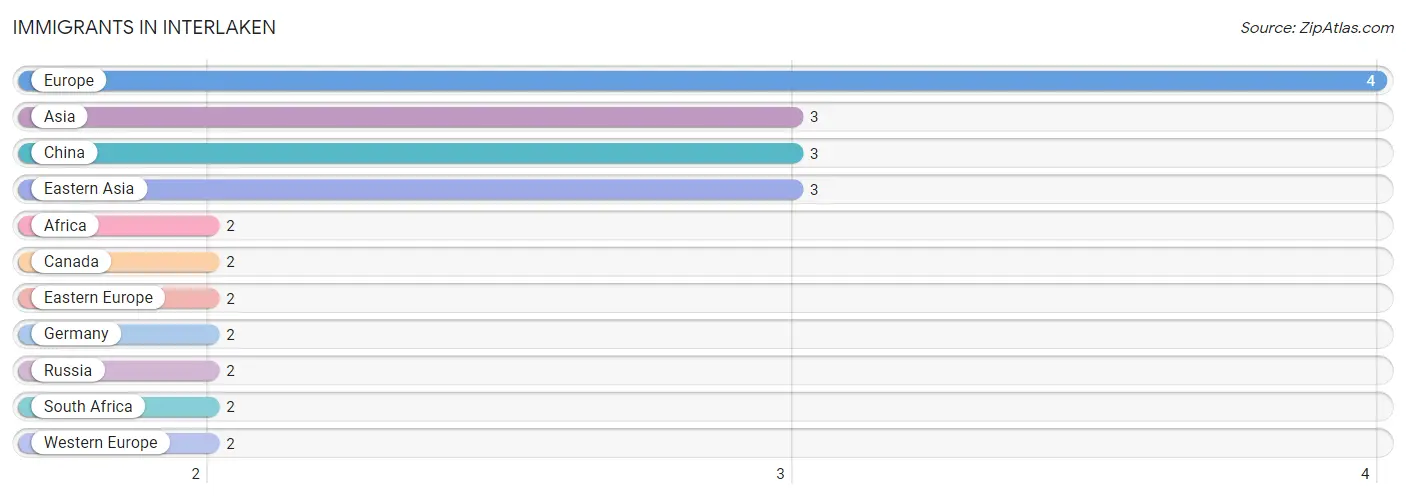
Immigrants in Interlaken
The most numerous immigrant groups reported in Interlaken came from Europe (4 | 0.8%), Asia (3 | 0.6%), China (3 | 0.6%), Eastern Asia (3 | 0.6%), and Africa (2 | 0.4%), together accounting for 3.0% of all Interlaken residents.
| Immigration Origin | # Population | % Population |
| Africa | 2 | 0.4% |
| Asia | 3 | 0.6% |
| Canada | 2 | 0.4% |
| China | 3 | 0.6% |
| Eastern Asia | 3 | 0.6% |
| Eastern Europe | 2 | 0.4% |
| Europe | 4 | 0.8% |
| Germany | 2 | 0.4% |
| Russia | 2 | 0.4% |
| South Africa | 2 | 0.4% |
| Western Europe | 2 | 0.4% | View All 11 Rows |
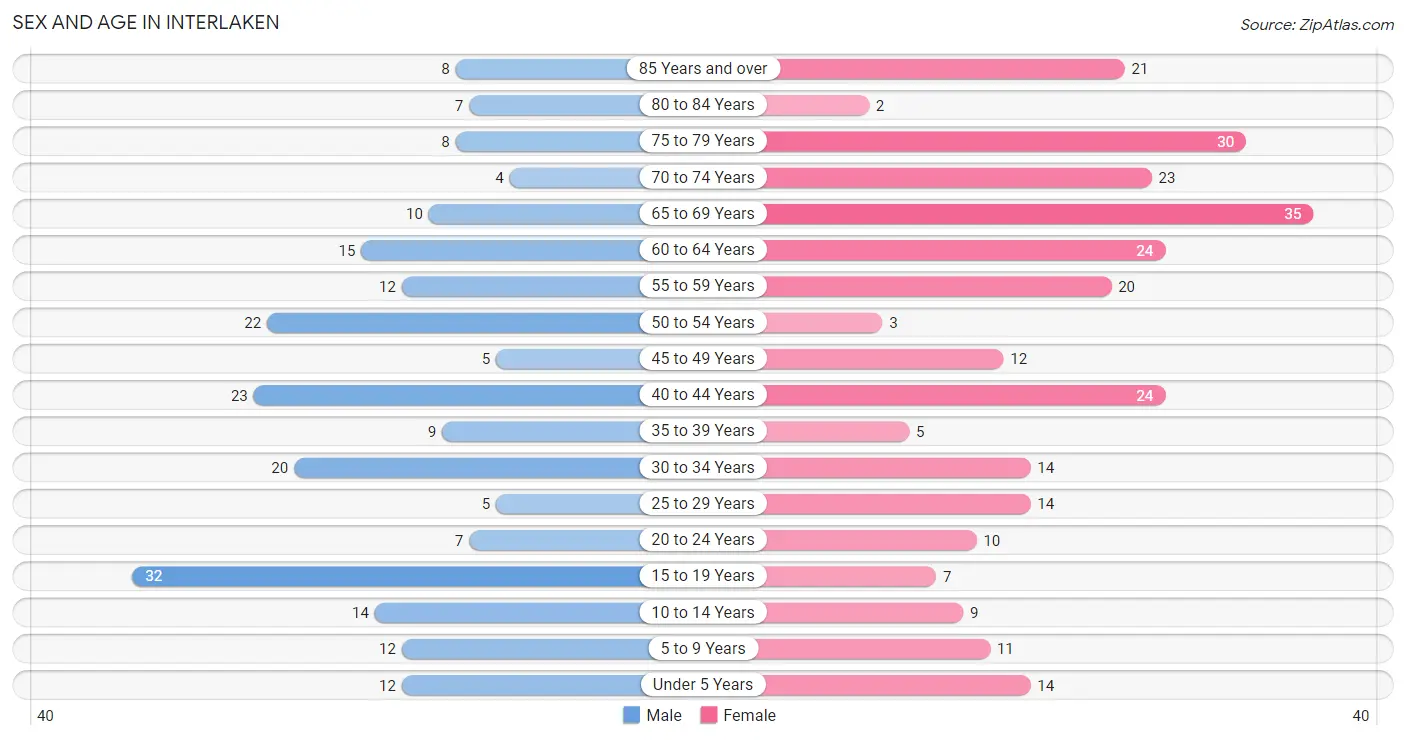
Sex and Age in Interlaken
Sex and Age in Interlaken
The most populous age groups in Interlaken are 15 to 19 Years (32 | 14.2%) for men and 65 to 69 Years (35 | 12.6%) for women.
| Age Bracket | Male | Female |
| Under 5 Years | 12 (5.3%) | 14 (5.0%) |
| 5 to 9 Years | 12 (5.3%) | 11 (4.0%) |
| 10 to 14 Years | 14 (6.2%) | 9 (3.2%) |
| 15 to 19 Years | 32 (14.2%) | 7 (2.5%) |
| 20 to 24 Years | 7 (3.1%) | 10 (3.6%) |
| 25 to 29 Years | 5 (2.2%) | 14 (5.0%) |
| 30 to 34 Years | 20 (8.9%) | 14 (5.0%) |
| 35 to 39 Years | 9 (4.0%) | 5 (1.8%) |
| 40 to 44 Years | 23 (10.2%) | 24 (8.6%) |
| 45 to 49 Years | 5 (2.2%) | 12 (4.3%) |
| 50 to 54 Years | 22 (9.8%) | 3 (1.1%) |
| 55 to 59 Years | 12 (5.3%) | 20 (7.2%) |
| 60 to 64 Years | 15 (6.7%) | 24 (8.6%) |
| 65 to 69 Years | 10 (4.4%) | 35 (12.6%) |
| 70 to 74 Years | 4 (1.8%) | 23 (8.3%) |
| 75 to 79 Years | 8 (3.6%) | 30 (10.8%) |
| 80 to 84 Years | 7 (3.1%) | 2 (0.7%) |
| 85 Years and over | 8 (3.6%) | 21 (7.5%) |
| Total | 225 (100.0%) | 278 (100.0%) |
Families and Households in Interlaken
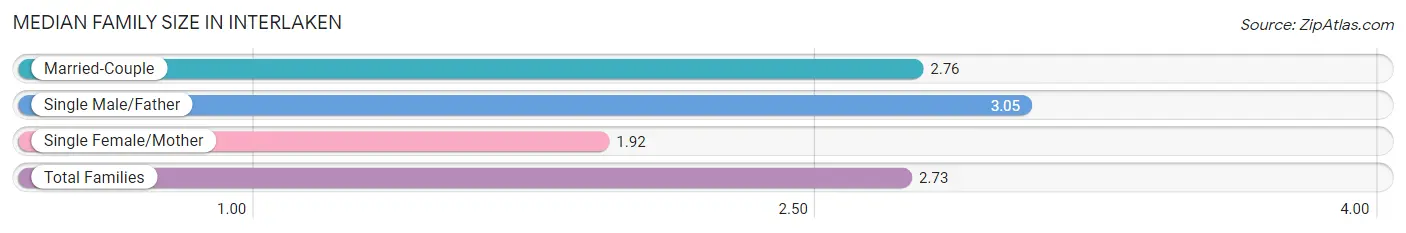
Median Family Size in Interlaken
The median family size in Interlaken is 2.73 persons per family, with single male/father families (20 | 16.1%) accounting for the largest median family size of 3.05 persons per family. On the other hand, single female/mother families (12 | 9.7%) represent the smallest median family size with 1.92 persons per family.
| Family Type | # Families | Family Size |
| Married-Couple | 92 (74.2%) | 2.76 |
| Single Male/Father | 20 (16.1%) | 3.05 |
| Single Female/Mother | 12 (9.7%) | 1.92 |
| Total Families | 124 (100.0%) | 2.73 |
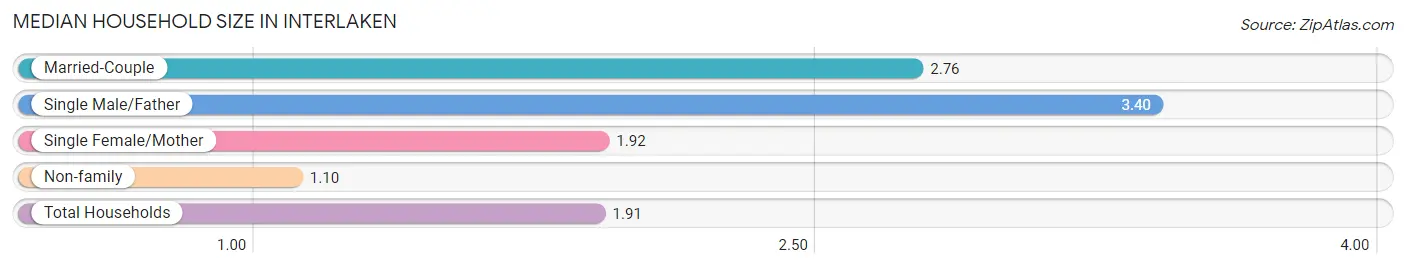
Median Household Size in Interlaken
The median household size in Interlaken is 1.91 persons per household, with single male/father households (20 | 7.8%) accounting for the largest median household size of 3.4 persons per household. non-family households (132 | 51.6%) represent the smallest median household size with 1.10 persons per household.
| Household Type | # Households | Household Size |
| Married-Couple | 92 (35.9%) | 2.76 |
| Single Male/Father | 20 (7.8%) | 3.40 |
| Single Female/Mother | 12 (4.7%) | 1.92 |
| Non-family | 132 (51.6%) | 1.10 |
| Total Households | 256 (100.0%) | 1.91 |
Household Size by Marriage Status in Interlaken
Out of a total of 256 households in Interlaken, 124 (48.4%) are family households, while 132 (51.6%) are nonfamily households. The most numerous type of family households are 2-person households, comprising 71, and the most common type of nonfamily households are 1-person households, comprising 114.
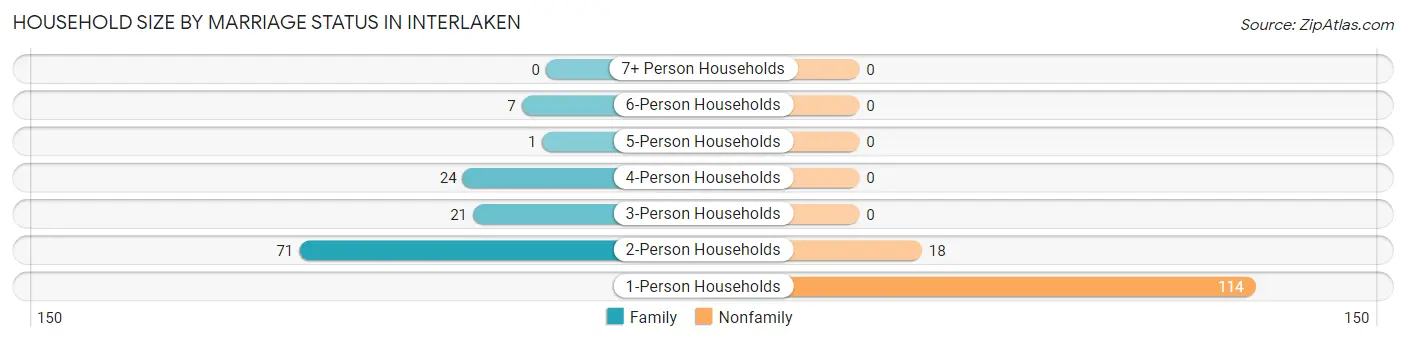
| Household Size | Family Households | Nonfamily Households |
| 1-Person Households | - | 114 (44.5%) |
| 2-Person Households | 71 (27.7%) | 18 (7.0%) |
| 3-Person Households | 21 (8.2%) | 0 (0.0%) |
| 4-Person Households | 24 (9.4%) | 0 (0.0%) |
| 5-Person Households | 1 (0.4%) | 0 (0.0%) |
| 6-Person Households | 7 (2.7%) | 0 (0.0%) |
| 7+ Person Households | 0 (0.0%) | 0 (0.0%) |
| Total | 124 (48.4%) | 132 (51.6%) |
Female Fertility in Interlaken
Fertility by Age in Interlaken
Average fertility rate in Interlaken is 116.0 births per 1,000 women. Women in the age bracket of 20 to 34 years have the highest fertility rate with 263.0 births per 1,000 women. Women in the age bracket of 20 to 34 years acount for 100.0% of all women with births.
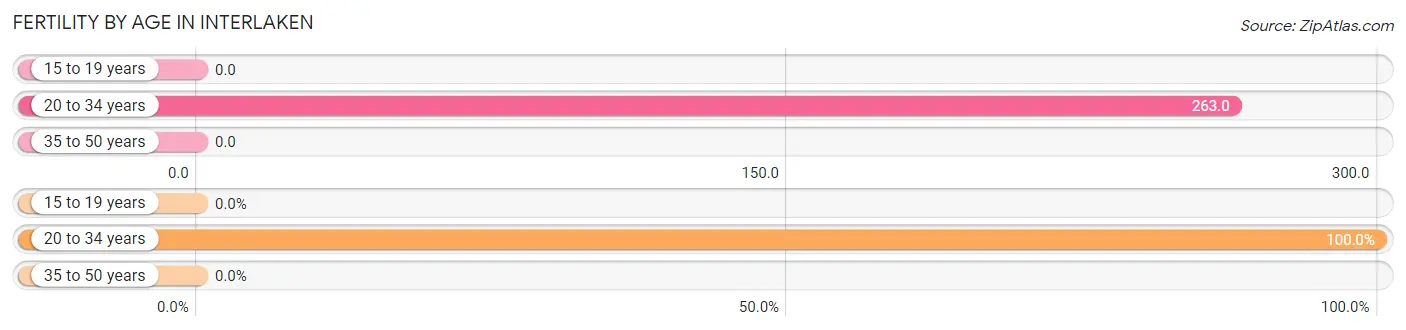
| Age Bracket | Women with Births | Births / 1,000 Women |
| 15 to 19 years | 0 (0.0%) | 0.0 |
| 20 to 34 years | 10 (100.0%) | 263.0 |
| 35 to 50 years | 0 (0.0%) | 0.0 |
| Total | 10 (100.0%) | 116.0 |
Fertility by Age by Marriage Status in Interlaken
70.0% of women with births (10) in Interlaken are married. The highest percentage of unmarried women with births falls into 20 to 34 years age bracket with 30.0% of them unmarried at the time of birth, while the lowest percentage of unmarried women with births belong to 20 to 34 years age bracket with 30.0% of them unmarried.
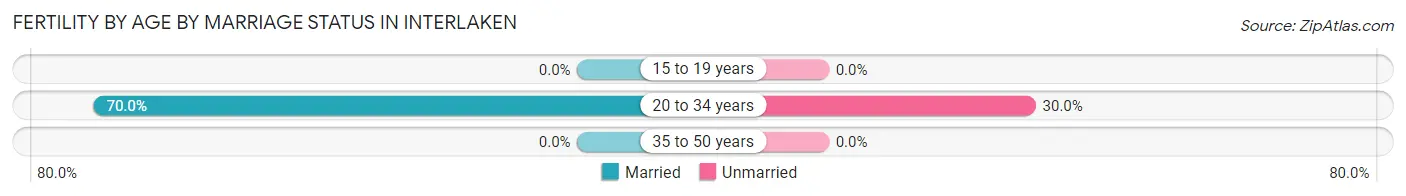
| Age Bracket | Married | Unmarried |
| 15 to 19 years | 0 (0.0%) | 0 (0.0%) |
| 20 to 34 years | 7 (70.0%) | 3 (30.0%) |
| 35 to 50 years | 0 (0.0%) | 0 (0.0%) |
| Total | 7 (70.0%) | 3 (30.0%) |
Fertility by Education in Interlaken
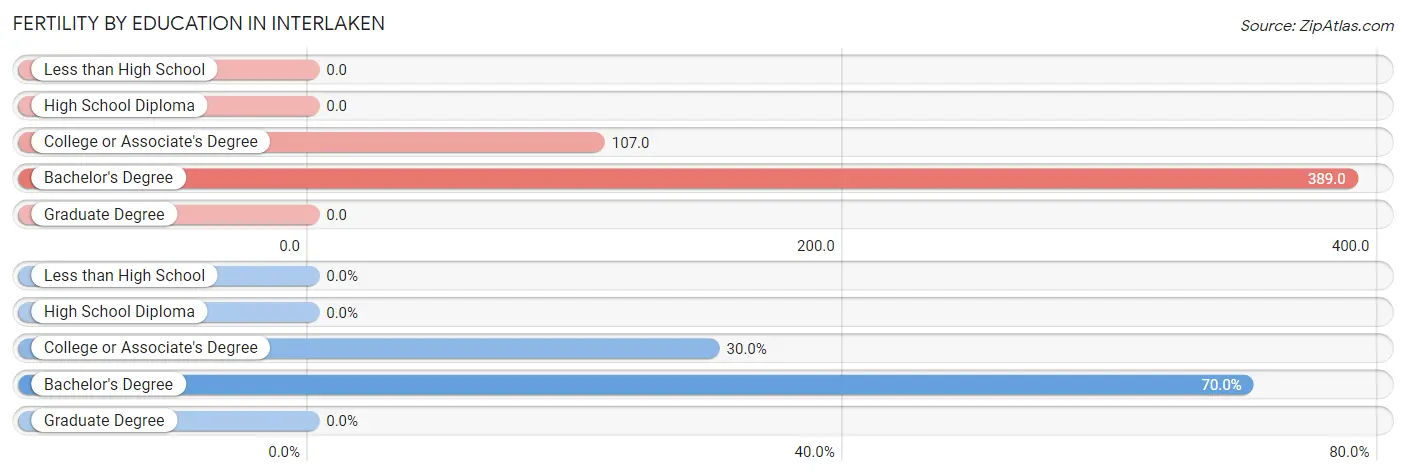
| Educational Attainment | Women with Births | Births / 1,000 Women |
| Less than High School | 0 (0.0%) | 0.0 |
| High School Diploma | 0 (0.0%) | 0.0 |
| College or Associate's Degree | 3 (30.0%) | 107.0 |
| Bachelor's Degree | 7 (70.0%) | 389.0 |
| Graduate Degree | 0 (0.0%) | 0.0 |
| Total | 10 (100.0%) | 116.0 |
Fertility by Education by Marriage Status in Interlaken
30.0% of women with births in Interlaken are unmarried. Women with the educational attainment of bachelor's degree are most likely to be married with 100.0% of them married at childbirth, while women with the educational attainment of college or associate's degree are least likely to be married with 100.0% of them unmarried at childbirth.
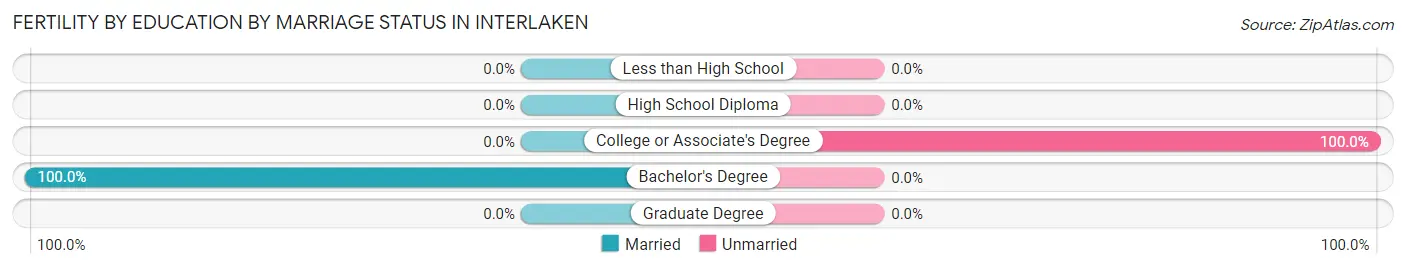
| Educational Attainment | Married | Unmarried |
| Less than High School | 0 (0.0%) | 0 (0.0%) |
| High School Diploma | 0 (0.0%) | 0 (0.0%) |
| College or Associate's Degree | 0 (0.0%) | 3 (100.0%) |
| Bachelor's Degree | 7 (100.0%) | 0 (0.0%) |
| Graduate Degree | 0 (0.0%) | 0 (0.0%) |
| Total | 7 (70.0%) | 3 (30.0%) |
Employment Characteristics in Interlaken
Employment by Class of Employer in Interlaken
Among the 249 employed individuals in Interlaken, private company employees (157 | 63.0%), not-for-profit organizations (46 | 18.5%), and local government employees (18 | 7.2%) make up the most common classes of employment.
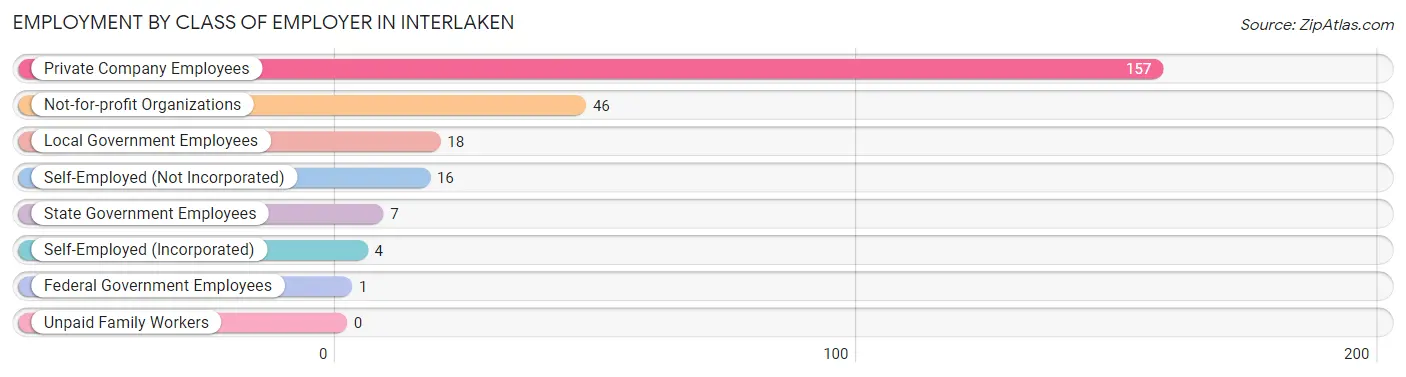
| Employer Class | # Employees | % Employees |
| Private Company Employees | 157 | 63.0% |
| Self-Employed (Incorporated) | 4 | 1.6% |
| Self-Employed (Not Incorporated) | 16 | 6.4% |
| Not-for-profit Organizations | 46 | 18.5% |
| Local Government Employees | 18 | 7.2% |
| State Government Employees | 7 | 2.8% |
| Federal Government Employees | 1 | 0.4% |
| Unpaid Family Workers | 0 | 0.0% |
| Total | 249 | 100.0% |
Employment Status by Age in Interlaken
According to the labor force statistics for Interlaken, out of the total population over 16 years of age (424), 60.6% or 257 individuals are in the labor force, with 1.9% or 5 of them unemployed. The age group with the highest labor force participation rate is 20 to 24 years, with 100.0% or 17 individuals in the labor force. Within the labor force, the 16 to 19 years age range has the highest percentage of unemployed individuals, with 8.0% or 2 of them being unemployed.
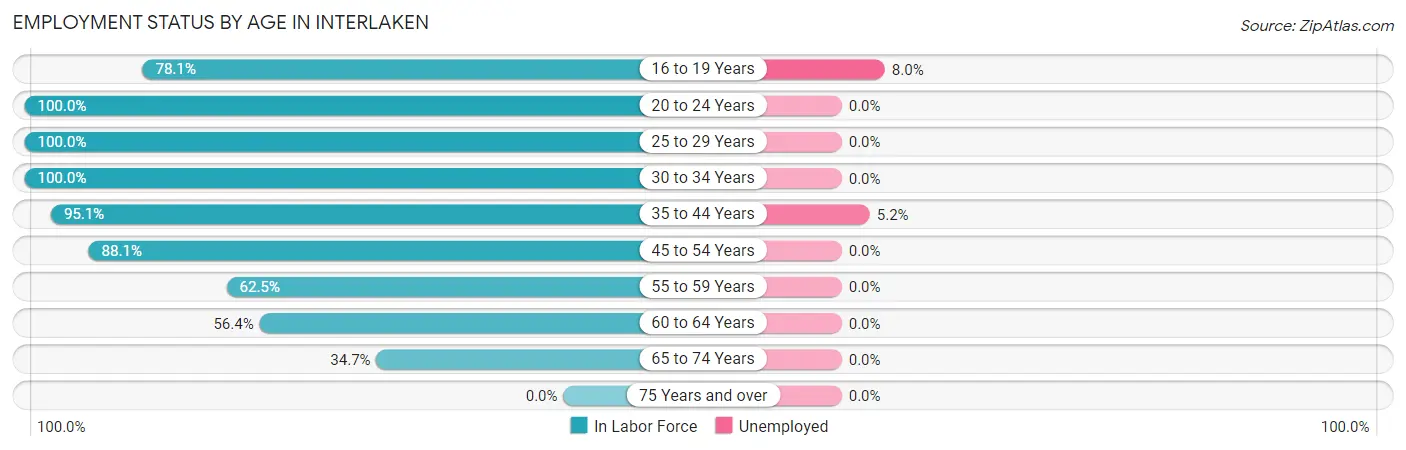
| Age Bracket | In Labor Force | Unemployed |
| 16 to 19 Years | 25 (78.1%) | 2 (8.0%) |
| 20 to 24 Years | 17 (100.0%) | 0 (0.0%) |
| 25 to 29 Years | 19 (100.0%) | 0 (0.0%) |
| 30 to 34 Years | 34 (100.0%) | 0 (0.0%) |
| 35 to 44 Years | 58 (95.1%) | 3 (5.2%) |
| 45 to 54 Years | 37 (88.1%) | 0 (0.0%) |
| 55 to 59 Years | 20 (62.5%) | 0 (0.0%) |
| 60 to 64 Years | 22 (56.4%) | 0 (0.0%) |
| 65 to 74 Years | 25 (34.7%) | 0 (0.0%) |
| 75 Years and over | 0 (0.0%) | 0 (0.0%) |
| Total | 257 (60.6%) | 5 (1.9%) |
Employment Status by Educational Attainment in Interlaken
According to labor force statistics for Interlaken, 83.7% of individuals (190) out of the total population between 25 and 64 years of age (227) are in the labor force, with 1.6% or 3 of them being unemployed. The group with the highest labor force participation rate are those with the educational attainment of college / associate degree, with 86.0% or 74 individuals in the labor force. Within the labor force, individuals with bachelor's degree or higher education have the highest percentage of unemployment, with 4.2% or 3 of them being unemployed.
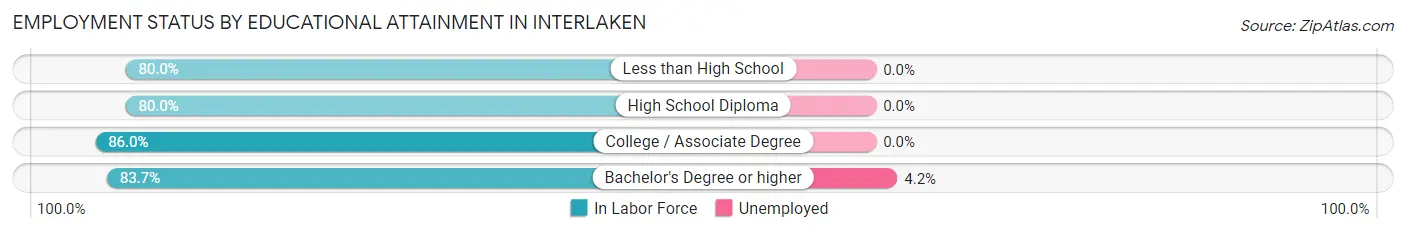
| Educational Attainment | In Labor Force | Unemployed |
| Less than High School | 4 (80.0%) | 0 (0.0%) |
| High School Diploma | 40 (80.0%) | 0 (0.0%) |
| College / Associate Degree | 74 (86.0%) | 0 (0.0%) |
| Bachelor's Degree or higher | 72 (83.7%) | 4 (4.2%) |
| Total | 190 (83.7%) | 4 (1.6%) |
Employment Occupations by Sex in Interlaken
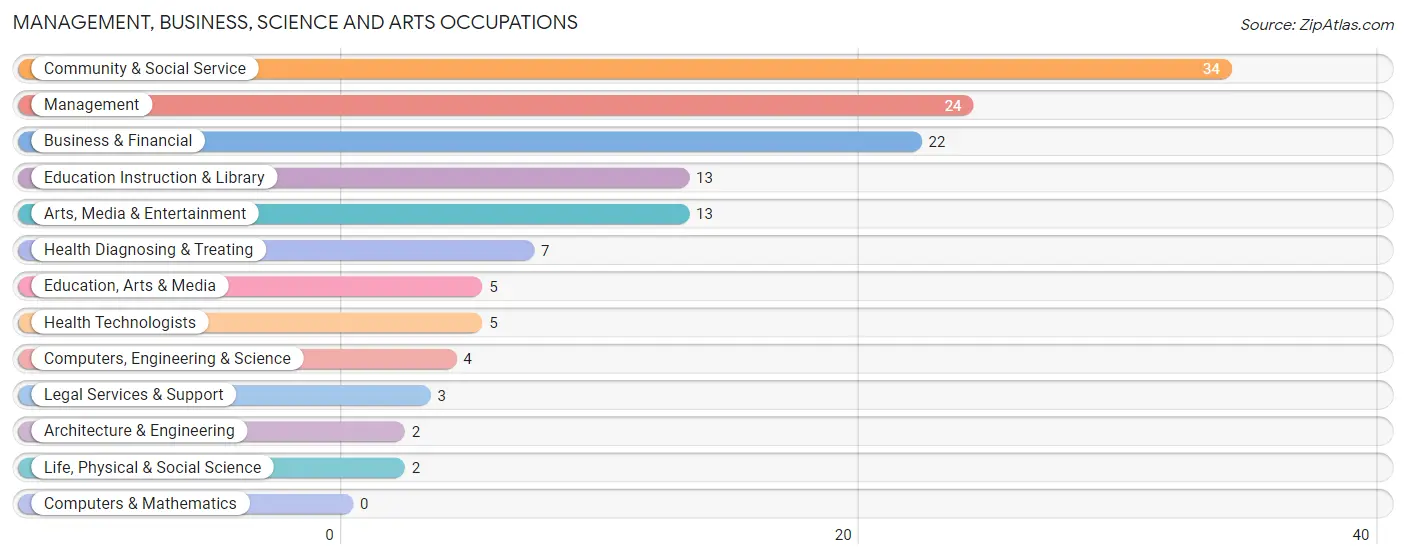
Management, Business, Science and Arts Occupations
The most common Management, Business, Science and Arts occupations in Interlaken are Community & Social Service (34 | 13.5%), Management (24 | 9.5%), Business & Financial (22 | 8.7%), Education Instruction & Library (13 | 5.2%), and Arts, Media & Entertainment (13 | 5.2%).
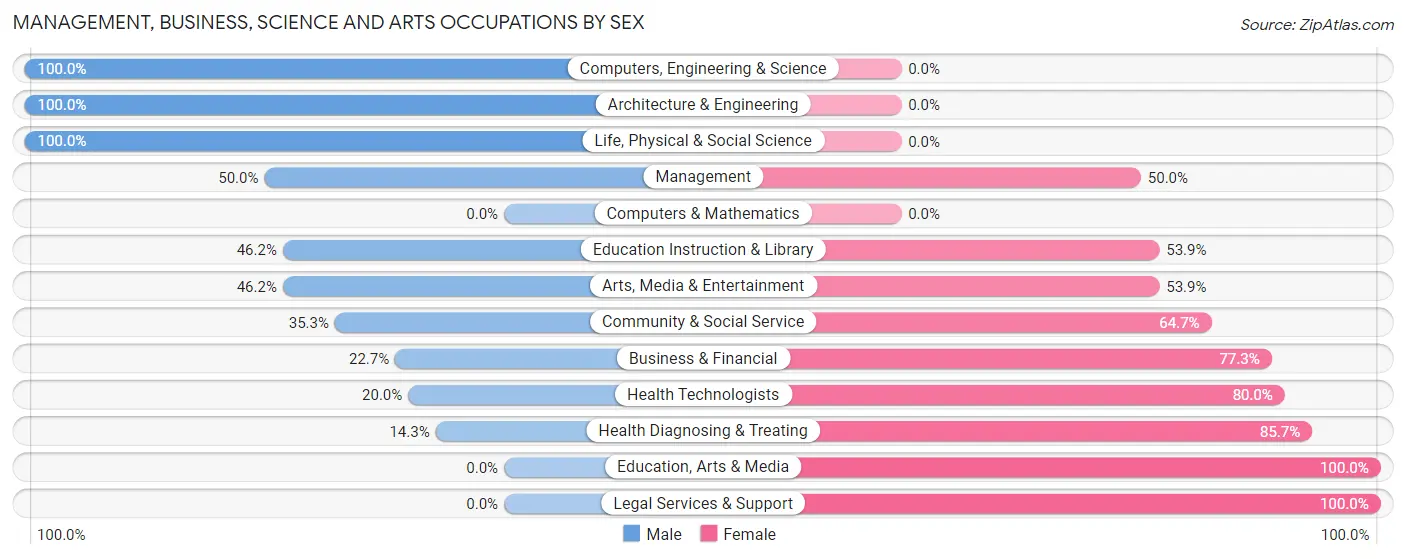
Management, Business, Science and Arts Occupations by Sex
Within the Management, Business, Science and Arts occupations in Interlaken, the most male-oriented occupations are Computers, Engineering & Science (100.0%), Architecture & Engineering (100.0%), and Life, Physical & Social Science (100.0%), while the most female-oriented occupations are Education, Arts & Media (100.0%), Legal Services & Support (100.0%), and Health Diagnosing & Treating (85.7%).
| Occupation | Male | Female |
| Management | 12 (50.0%) | 12 (50.0%) |
| Business & Financial | 5 (22.7%) | 17 (77.3%) |
| Computers, Engineering & Science | 4 (100.0%) | 0 (0.0%) |
| Computers & Mathematics | 0 (0.0%) | 0 (0.0%) |
| Architecture & Engineering | 2 (100.0%) | 0 (0.0%) |
| Life, Physical & Social Science | 2 (100.0%) | 0 (0.0%) |
| Community & Social Service | 12 (35.3%) | 22 (64.7%) |
| Education, Arts & Media | 0 (0.0%) | 5 (100.0%) |
| Legal Services & Support | 0 (0.0%) | 3 (100.0%) |
| Education Instruction & Library | 6 (46.2%) | 7 (53.8%) |
| Arts, Media & Entertainment | 6 (46.2%) | 7 (53.8%) |
| Health Diagnosing & Treating | 1 (14.3%) | 6 (85.7%) |
| Health Technologists | 1 (20.0%) | 4 (80.0%) |
| Total (Category) | 34 (37.4%) | 57 (62.6%) |
| Total (Overall) | 121 (48.0%) | 131 (52.0%) |
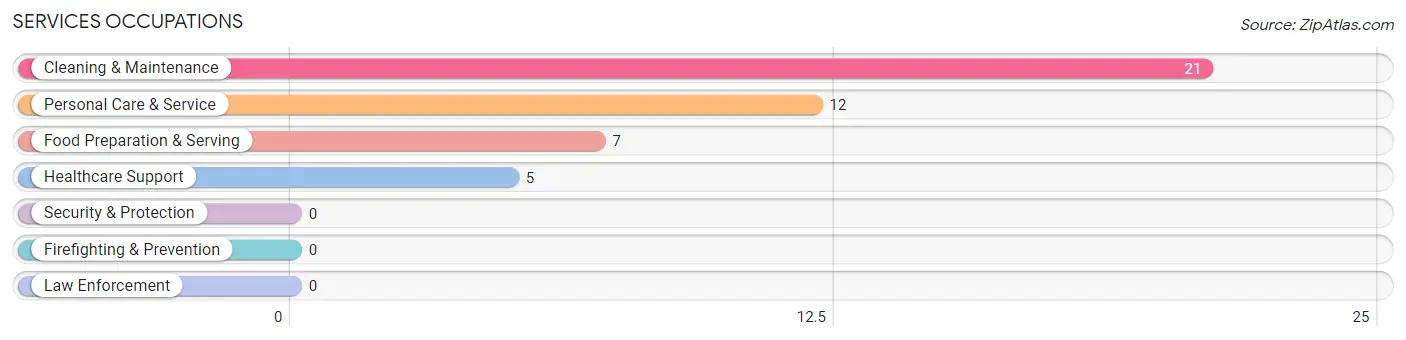
Services Occupations
The most common Services occupations in Interlaken are Cleaning & Maintenance (21 | 8.3%), Personal Care & Service (12 | 4.8%), Food Preparation & Serving (7 | 2.8%), and Healthcare Support (5 | 2.0%).
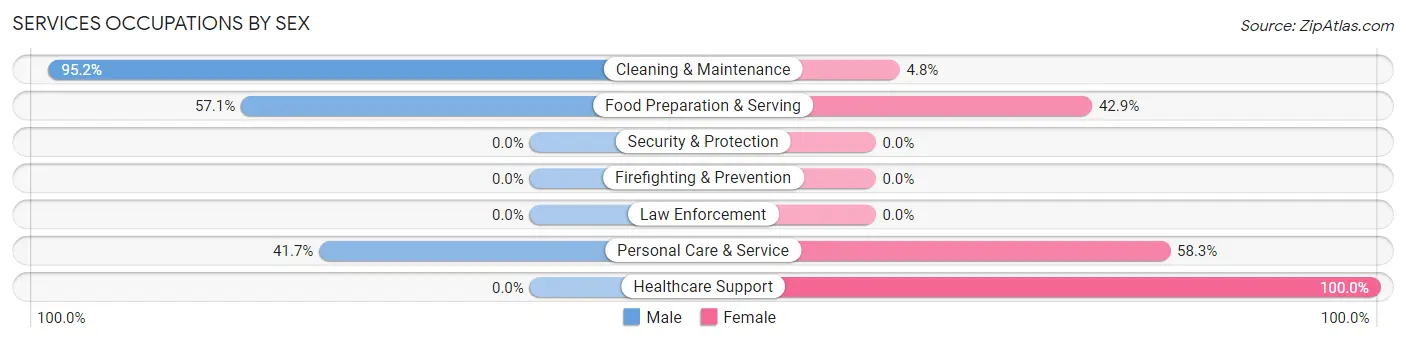
Services Occupations by Sex
Within the Services occupations in Interlaken, the most male-oriented occupations are Cleaning & Maintenance (95.2%), Food Preparation & Serving (57.1%), and Personal Care & Service (41.7%), while the most female-oriented occupations are Healthcare Support (100.0%), Personal Care & Service (58.3%), and Food Preparation & Serving (42.9%).
| Occupation | Male | Female |
| Healthcare Support | 0 (0.0%) | 5 (100.0%) |
| Security & Protection | 0 (0.0%) | 0 (0.0%) |
| Firefighting & Prevention | 0 (0.0%) | 0 (0.0%) |
| Law Enforcement | 0 (0.0%) | 0 (0.0%) |
| Food Preparation & Serving | 4 (57.1%) | 3 (42.9%) |
| Cleaning & Maintenance | 20 (95.2%) | 1 (4.8%) |
| Personal Care & Service | 5 (41.7%) | 7 (58.3%) |
| Total (Category) | 29 (64.4%) | 16 (35.6%) |
| Total (Overall) | 121 (48.0%) | 131 (52.0%) |
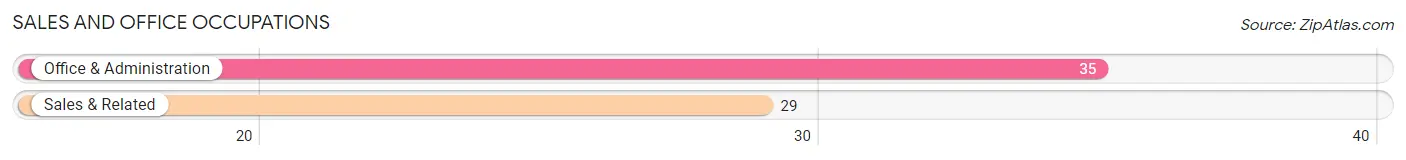
Sales and Office Occupations
The most common Sales and Office occupations in Interlaken are Office & Administration (35 | 13.9%), and Sales & Related (29 | 11.5%).
Sales and Office Occupations by Sex
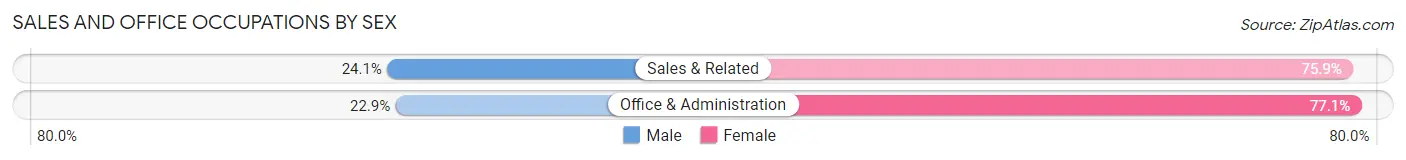
| Occupation | Male | Female |
| Sales & Related | 7 (24.1%) | 22 (75.9%) |
| Office & Administration | 8 (22.9%) | 27 (77.1%) |
| Total (Category) | 15 (23.4%) | 49 (76.6%) |
| Total (Overall) | 121 (48.0%) | 131 (52.0%) |
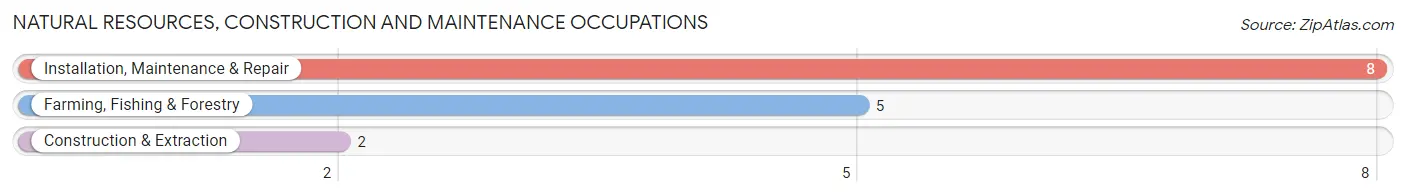
Natural Resources, Construction and Maintenance Occupations
The most common Natural Resources, Construction and Maintenance occupations in Interlaken are Installation, Maintenance & Repair (8 | 3.2%), Farming, Fishing & Forestry (5 | 2.0%), and Construction & Extraction (2 | 0.8%).
Natural Resources, Construction and Maintenance Occupations by Sex
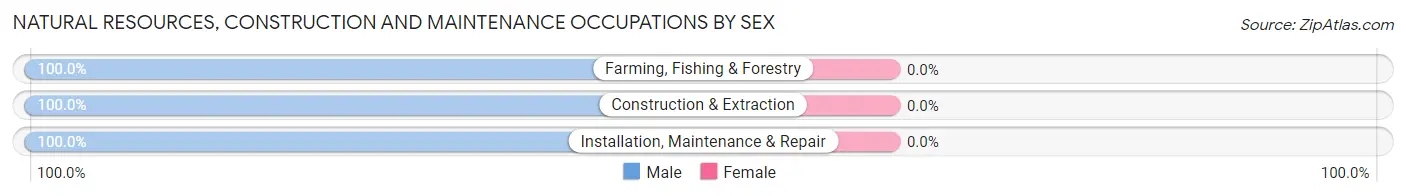
| Occupation | Male | Female |
| Farming, Fishing & Forestry | 5 (100.0%) | 0 (0.0%) |
| Construction & Extraction | 2 (100.0%) | 0 (0.0%) |
| Installation, Maintenance & Repair | 8 (100.0%) | 0 (0.0%) |
| Total (Category) | 15 (100.0%) | 0 (0.0%) |
| Total (Overall) | 121 (48.0%) | 131 (52.0%) |
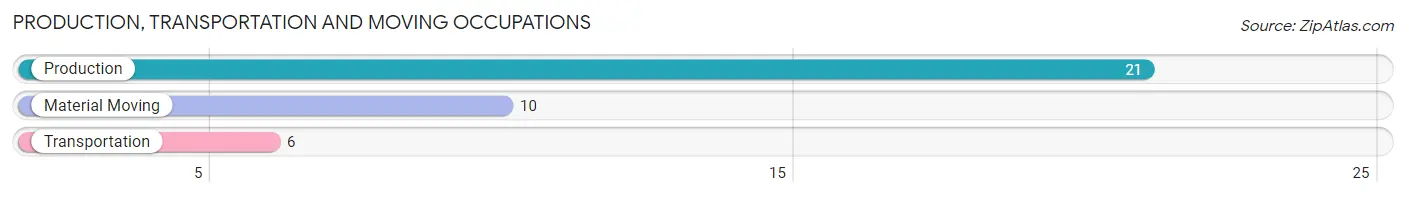
Production, Transportation and Moving Occupations
The most common Production, Transportation and Moving occupations in Interlaken are Production (21 | 8.3%), Material Moving (10 | 4.0%), and Transportation (6 | 2.4%).
Production, Transportation and Moving Occupations by Sex
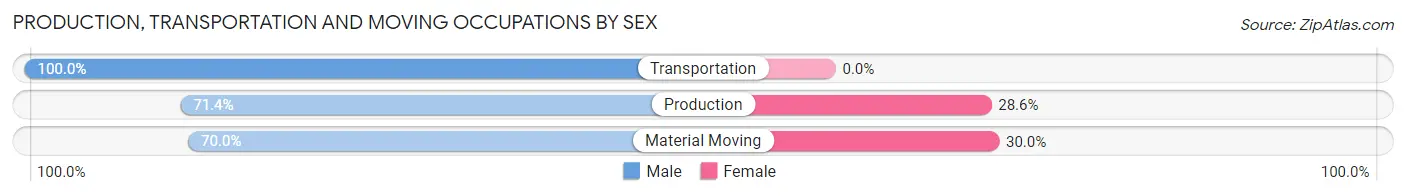
| Occupation | Male | Female |
| Production | 15 (71.4%) | 6 (28.6%) |
| Transportation | 6 (100.0%) | 0 (0.0%) |
| Material Moving | 7 (70.0%) | 3 (30.0%) |
| Total (Category) | 28 (75.7%) | 9 (24.3%) |
| Total (Overall) | 121 (48.0%) | 131 (52.0%) |
Employment Industries by Sex in Interlaken
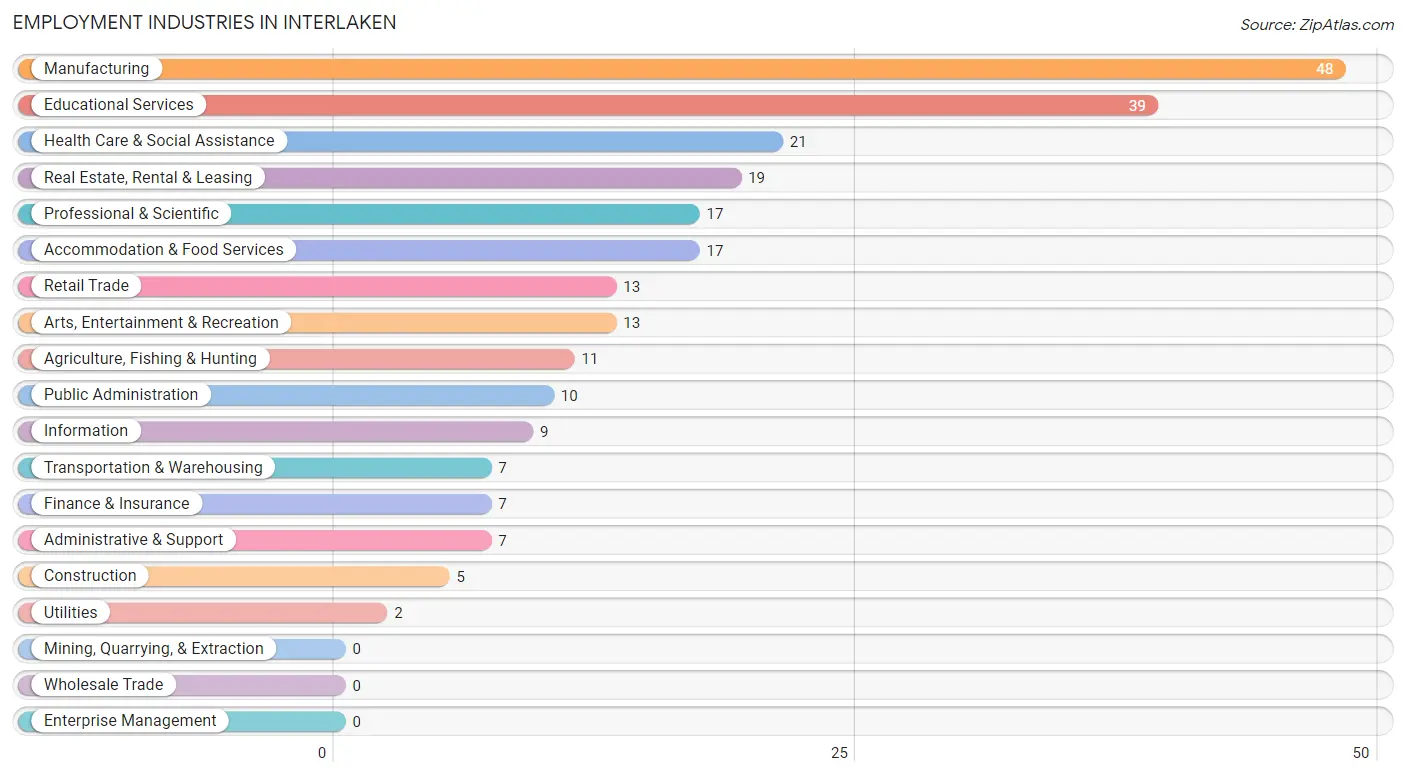
Employment Industries in Interlaken
The major employment industries in Interlaken include Manufacturing (48 | 19.1%), Educational Services (39 | 15.5%), Health Care & Social Assistance (21 | 8.3%), Real Estate, Rental & Leasing (19 | 7.5%), and Professional & Scientific (17 | 6.8%).
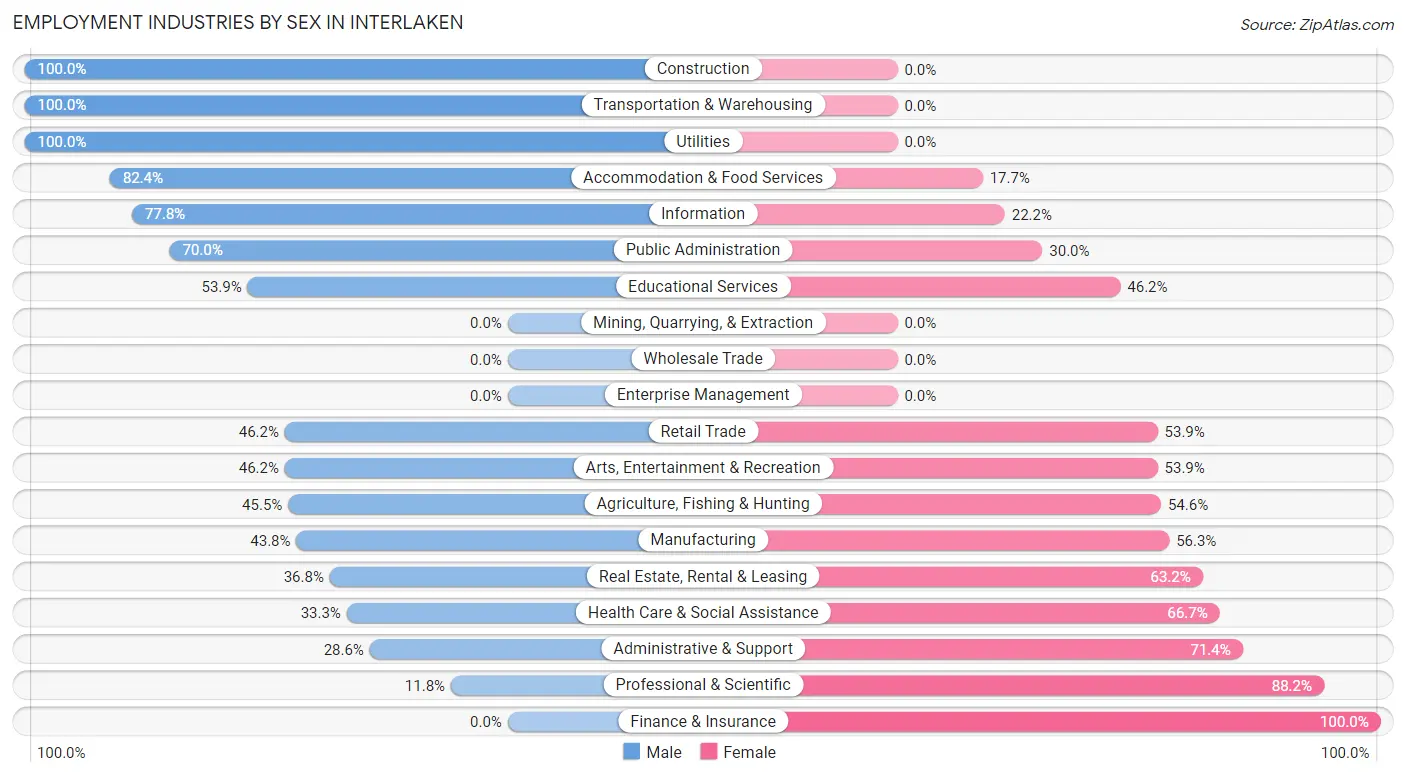
Employment Industries by Sex in Interlaken
The Interlaken industries that see more men than women are Construction (100.0%), Transportation & Warehousing (100.0%), and Utilities (100.0%), whereas the industries that tend to have a higher number of women are Finance & Insurance (100.0%), Professional & Scientific (88.2%), and Administrative & Support (71.4%).
| Industry | Male | Female |
| Agriculture, Fishing & Hunting | 5 (45.5%) | 6 (54.5%) |
| Mining, Quarrying, & Extraction | 0 (0.0%) | 0 (0.0%) |
| Construction | 5 (100.0%) | 0 (0.0%) |
| Manufacturing | 21 (43.8%) | 27 (56.2%) |
| Wholesale Trade | 0 (0.0%) | 0 (0.0%) |
| Retail Trade | 6 (46.2%) | 7 (53.8%) |
| Transportation & Warehousing | 7 (100.0%) | 0 (0.0%) |
| Utilities | 2 (100.0%) | 0 (0.0%) |
| Information | 7 (77.8%) | 2 (22.2%) |
| Finance & Insurance | 0 (0.0%) | 7 (100.0%) |
| Real Estate, Rental & Leasing | 7 (36.8%) | 12 (63.2%) |
| Professional & Scientific | 2 (11.8%) | 15 (88.2%) |
| Enterprise Management | 0 (0.0%) | 0 (0.0%) |
| Administrative & Support | 2 (28.6%) | 5 (71.4%) |
| Educational Services | 21 (53.8%) | 18 (46.2%) |
| Health Care & Social Assistance | 7 (33.3%) | 14 (66.7%) |
| Arts, Entertainment & Recreation | 6 (46.2%) | 7 (53.8%) |
| Accommodation & Food Services | 14 (82.4%) | 3 (17.6%) |
| Public Administration | 7 (70.0%) | 3 (30.0%) |
| Total | 121 (48.0%) | 131 (52.0%) |
Education in Interlaken
School Enrollment in Interlaken
The most common levels of schooling among the 72 students in Interlaken are elementary school (17 | 23.6%), high school (16 | 22.2%), and kindergarten (11 | 15.3%).
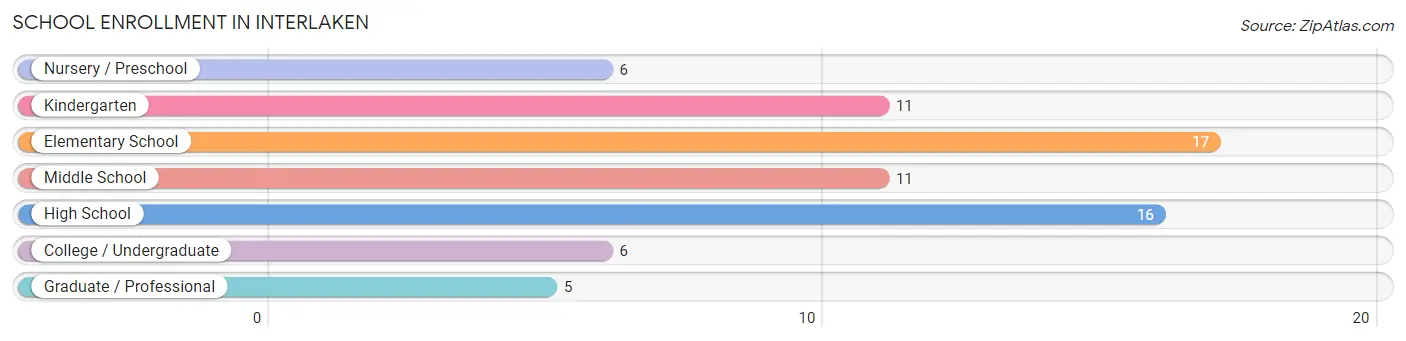
| School Level | # Students | % Students |
| Nursery / Preschool | 6 | 8.3% |
| Kindergarten | 11 | 15.3% |
| Elementary School | 17 | 23.6% |
| Middle School | 11 | 15.3% |
| High School | 16 | 22.2% |
| College / Undergraduate | 6 | 8.3% |
| Graduate / Professional | 5 | 6.9% |
| Total | 72 | 100.0% |
School Enrollment by Age by Funding Source in Interlaken
Out of a total of 72 students who are enrolled in schools in Interlaken, 12 (16.7%) attend a private institution, while the remaining 60 (83.3%) are enrolled in public schools. The age group of 25 to 34 year olds has the highest likelihood of being enrolled in private schools, with 2 (33.3% in the age bracket) enrolled. Conversely, the age group of 3 to 4 year olds has the lowest likelihood of being enrolled in a private school, with 6 (100.0% in the age bracket) attending a public institution.
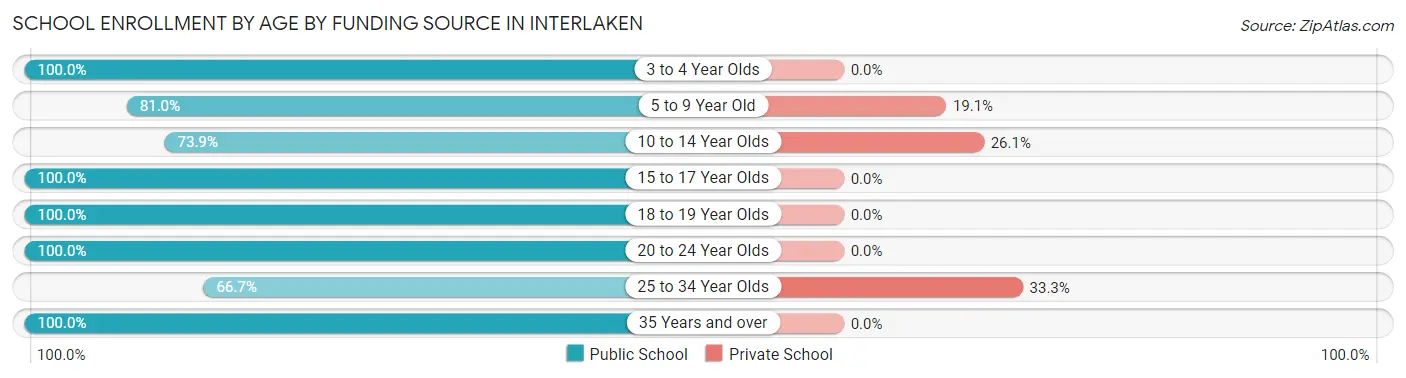
| Age Bracket | Public School | Private School |
| 3 to 4 Year Olds | 6 (100.0%) | 0 (0.0%) |
| 5 to 9 Year Old | 17 (80.9%) | 4 (19.1%) |
| 10 to 14 Year Olds | 17 (73.9%) | 6 (26.1%) |
| 15 to 17 Year Olds | 11 (100.0%) | 0 (0.0%) |
| 18 to 19 Year Olds | 1 (100.0%) | 0 (0.0%) |
| 20 to 24 Year Olds | 2 (100.0%) | 0 (0.0%) |
| 25 to 34 Year Olds | 4 (66.7%) | 2 (33.3%) |
| 35 Years and over | 2 (100.0%) | 0 (0.0%) |
| Total | 60 (83.3%) | 12 (16.7%) |
Educational Attainment by Field of Study in Interlaken
Education (62 | 45.6%), arts & humanities (11 | 8.1%), visual & performing arts (10 | 7.3%), psychology (8 | 5.9%), and liberal arts & history (8 | 5.9%) are the most common fields of study among 136 individuals in Interlaken who have obtained a bachelor's degree or higher.
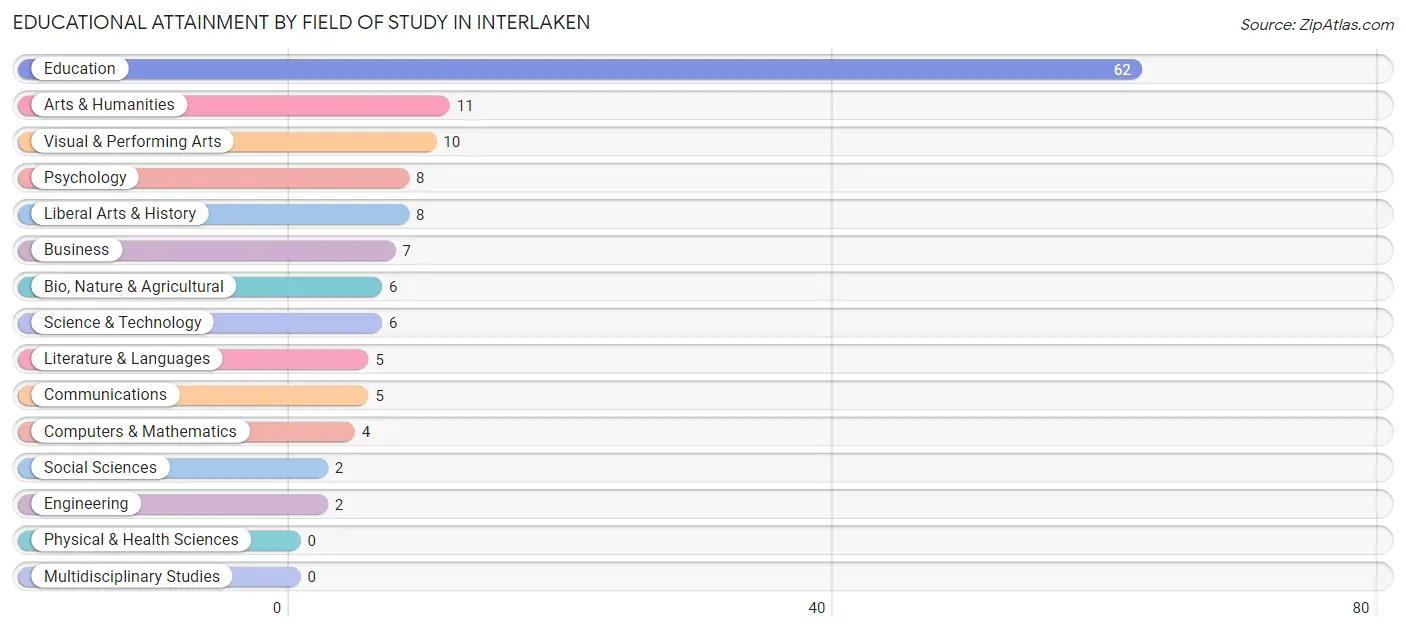
| Field of Study | # Graduates | % Graduates |
| Computers & Mathematics | 4 | 2.9% |
| Bio, Nature & Agricultural | 6 | 4.4% |
| Physical & Health Sciences | 0 | 0.0% |
| Psychology | 8 | 5.9% |
| Social Sciences | 2 | 1.5% |
| Engineering | 2 | 1.5% |
| Multidisciplinary Studies | 0 | 0.0% |
| Science & Technology | 6 | 4.4% |
| Business | 7 | 5.1% |
| Education | 62 | 45.6% |
| Literature & Languages | 5 | 3.7% |
| Liberal Arts & History | 8 | 5.9% |
| Visual & Performing Arts | 10 | 7.3% |
| Communications | 5 | 3.7% |
| Arts & Humanities | 11 | 8.1% |
| Total | 136 | 100.0% |
Transportation & Commute in Interlaken
Vehicle Availability by Sex in Interlaken
The most prevalent vehicle ownership categories in Interlaken are males with 2 vehicles (81, accounting for 67.5%) and females with 2 vehicles (80, making up 62.8%).
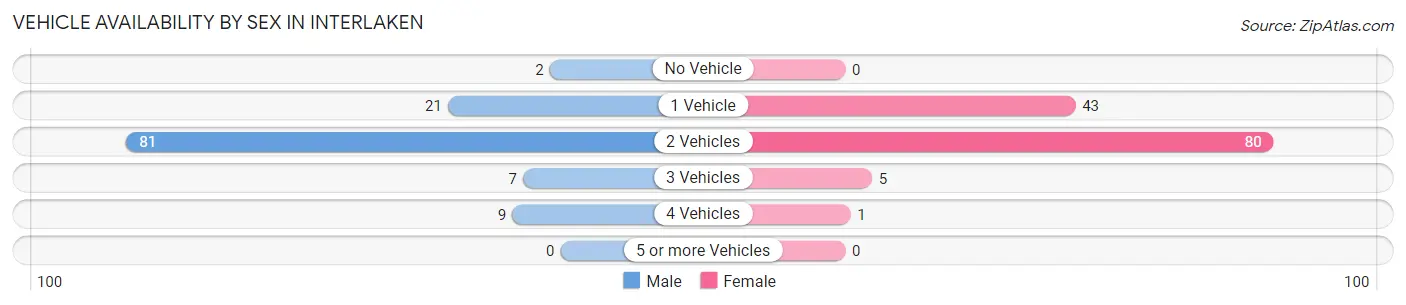
| Vehicles Available | Male | Female |
| No Vehicle | 2 (1.7%) | 0 (0.0%) |
| 1 Vehicle | 21 (17.5%) | 43 (33.3%) |
| 2 Vehicles | 81 (67.5%) | 80 (62.0%) |
| 3 Vehicles | 7 (5.8%) | 5 (3.9%) |
| 4 Vehicles | 9 (7.5%) | 1 (0.8%) |
| 5 or more Vehicles | 0 (0.0%) | 0 (0.0%) |
| Total | 120 (100.0%) | 129 (100.0%) |
Commute Time in Interlaken
The most frequently occuring commute durations in Interlaken are 30 to 34 minutes (72 commuters, 32.3%), 15 to 19 minutes (33 commuters, 14.8%), and less than 5 minutes (31 commuters, 13.9%).
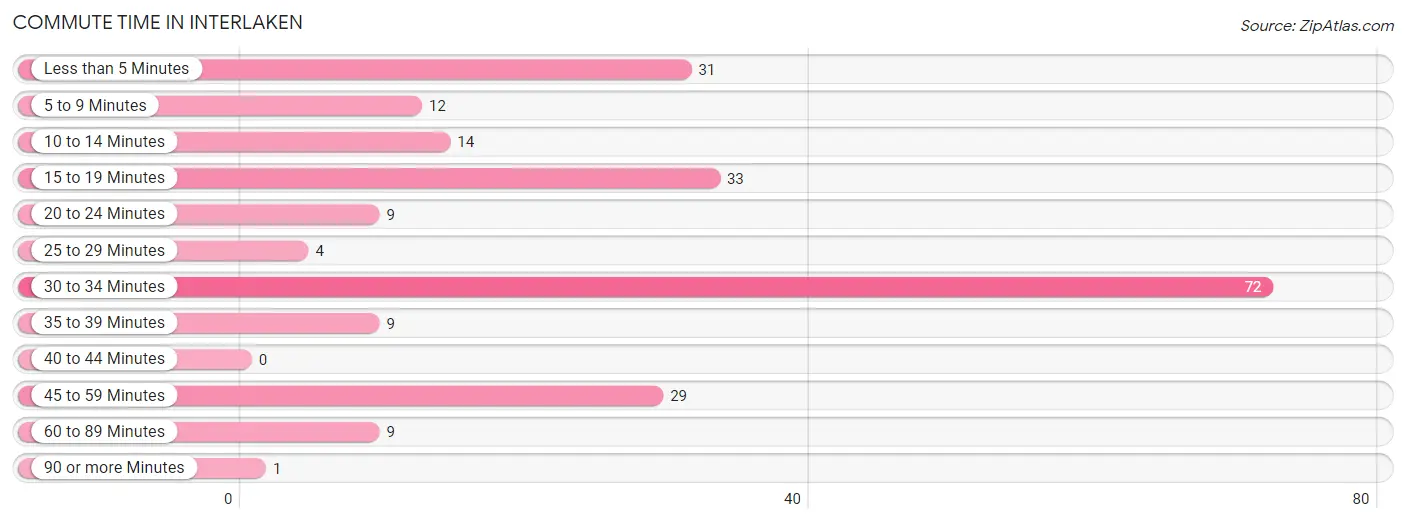
| Commute Time | # Commuters | % Commuters |
| Less than 5 Minutes | 31 | 13.9% |
| 5 to 9 Minutes | 12 | 5.4% |
| 10 to 14 Minutes | 14 | 6.3% |
| 15 to 19 Minutes | 33 | 14.8% |
| 20 to 24 Minutes | 9 | 4.0% |
| 25 to 29 Minutes | 4 | 1.8% |
| 30 to 34 Minutes | 72 | 32.3% |
| 35 to 39 Minutes | 9 | 4.0% |
| 40 to 44 Minutes | 0 | 0.0% |
| 45 to 59 Minutes | 29 | 13.0% |
| 60 to 89 Minutes | 9 | 4.0% |
| 90 or more Minutes | 1 | 0.4% |
Commute Time by Sex in Interlaken
The most common commute times in Interlaken are 30 to 34 minutes (32 commuters, 28.8%) for males and 30 to 34 minutes (40 commuters, 35.7%) for females.
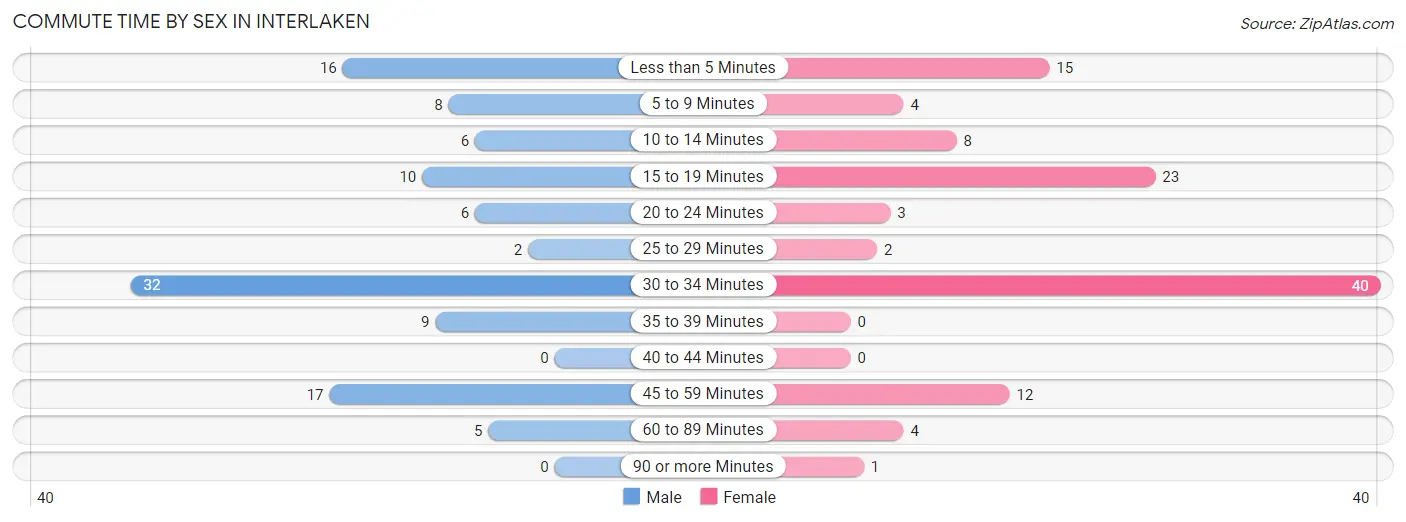
| Commute Time | Male | Female |
| Less than 5 Minutes | 16 (14.4%) | 15 (13.4%) |
| 5 to 9 Minutes | 8 (7.2%) | 4 (3.6%) |
| 10 to 14 Minutes | 6 (5.4%) | 8 (7.1%) |
| 15 to 19 Minutes | 10 (9.0%) | 23 (20.5%) |
| 20 to 24 Minutes | 6 (5.4%) | 3 (2.7%) |
| 25 to 29 Minutes | 2 (1.8%) | 2 (1.8%) |
| 30 to 34 Minutes | 32 (28.8%) | 40 (35.7%) |
| 35 to 39 Minutes | 9 (8.1%) | 0 (0.0%) |
| 40 to 44 Minutes | 0 (0.0%) | 0 (0.0%) |
| 45 to 59 Minutes | 17 (15.3%) | 12 (10.7%) |
| 60 to 89 Minutes | 5 (4.5%) | 4 (3.6%) |
| 90 or more Minutes | 0 (0.0%) | 1 (0.9%) |
Time of Departure to Work by Sex in Interlaken
The most frequent times of departure to work in Interlaken are 8:00 AM to 8:29 AM (20, 18.0%) for males and 8:30 AM to 8:59 AM (31, 27.7%) for females.
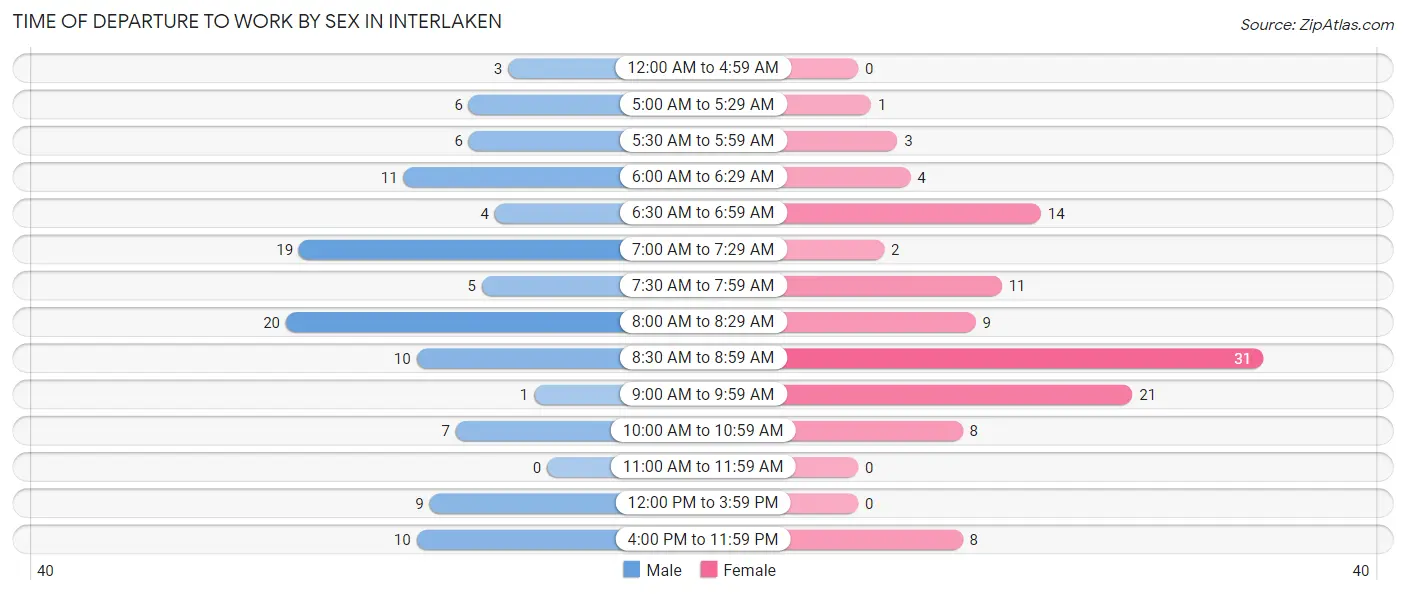
| Time of Departure | Male | Female |
| 12:00 AM to 4:59 AM | 3 (2.7%) | 0 (0.0%) |
| 5:00 AM to 5:29 AM | 6 (5.4%) | 1 (0.9%) |
| 5:30 AM to 5:59 AM | 6 (5.4%) | 3 (2.7%) |
| 6:00 AM to 6:29 AM | 11 (9.9%) | 4 (3.6%) |
| 6:30 AM to 6:59 AM | 4 (3.6%) | 14 (12.5%) |
| 7:00 AM to 7:29 AM | 19 (17.1%) | 2 (1.8%) |
| 7:30 AM to 7:59 AM | 5 (4.5%) | 11 (9.8%) |
| 8:00 AM to 8:29 AM | 20 (18.0%) | 9 (8.0%) |
| 8:30 AM to 8:59 AM | 10 (9.0%) | 31 (27.7%) |
| 9:00 AM to 9:59 AM | 1 (0.9%) | 21 (18.8%) |
| 10:00 AM to 10:59 AM | 7 (6.3%) | 8 (7.1%) |
| 11:00 AM to 11:59 AM | 0 (0.0%) | 0 (0.0%) |
| 12:00 PM to 3:59 PM | 9 (8.1%) | 0 (0.0%) |
| 4:00 PM to 11:59 PM | 10 (9.0%) | 8 (7.1%) |
| Total | 111 (100.0%) | 112 (100.0%) |
Housing Occupancy in Interlaken
Occupancy by Ownership in Interlaken
Of the total 256 dwellings in Interlaken, owner-occupied units account for 180 (70.3%), while renter-occupied units make up 76 (29.7%).
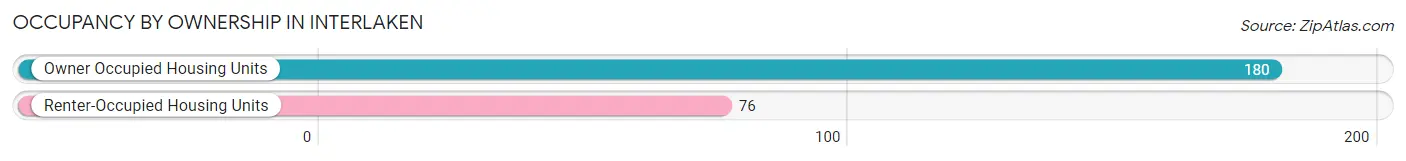
| Occupancy | # Housing Units | % Housing Units |
| Owner Occupied Housing Units | 180 | 70.3% |
| Renter-Occupied Housing Units | 76 | 29.7% |
| Total Occupied Housing Units | 256 | 100.0% |
Occupancy by Household Size in Interlaken
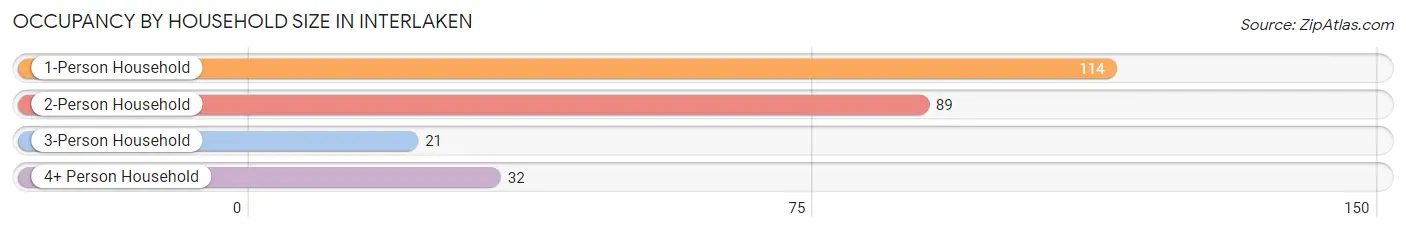
| Household Size | # Housing Units | % Housing Units |
| 1-Person Household | 114 | 44.5% |
| 2-Person Household | 89 | 34.8% |
| 3-Person Household | 21 | 8.2% |
| 4+ Person Household | 32 | 12.5% |
| Total Housing Units | 256 | 100.0% |
Occupancy by Ownership by Household Size in Interlaken
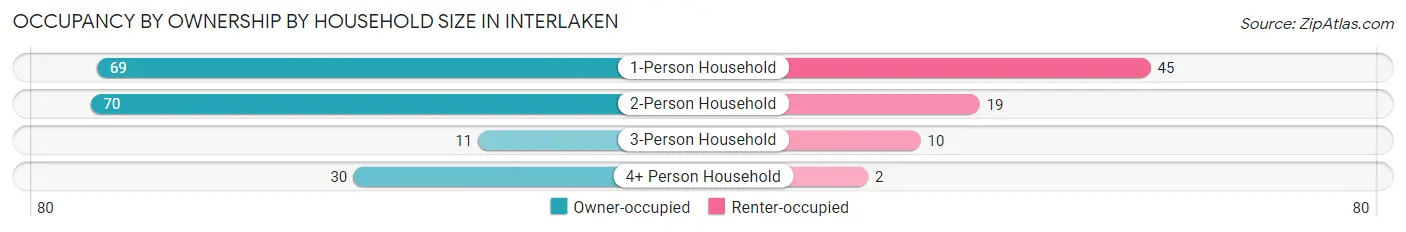
| Household Size | Owner-occupied | Renter-occupied |
| 1-Person Household | 69 (60.5%) | 45 (39.5%) |
| 2-Person Household | 70 (78.6%) | 19 (21.3%) |
| 3-Person Household | 11 (52.4%) | 10 (47.6%) |
| 4+ Person Household | 30 (93.8%) | 2 (6.2%) |
| Total Housing Units | 180 (70.3%) | 76 (29.7%) |
Occupancy by Educational Attainment in Interlaken
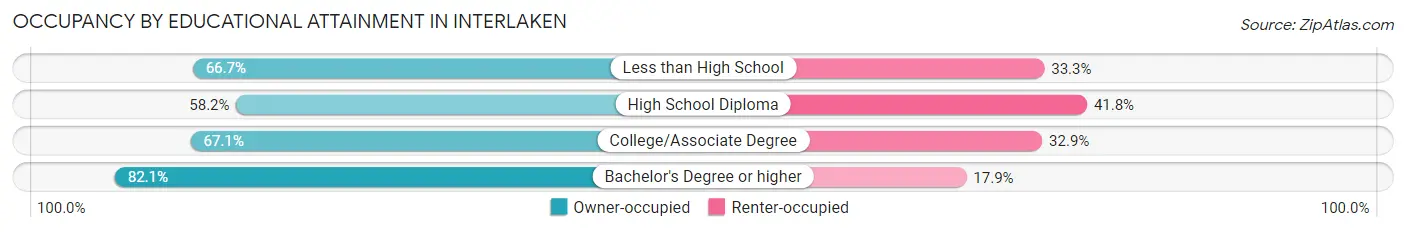
| Household Size | Owner-occupied | Renter-occupied |
| Less than High School | 10 (66.7%) | 5 (33.3%) |
| High School Diploma | 39 (58.2%) | 28 (41.8%) |
| College/Associate Degree | 53 (67.1%) | 26 (32.9%) |
| Bachelor's Degree or higher | 78 (82.1%) | 17 (17.9%) |
Occupancy by Age of Householder in Interlaken
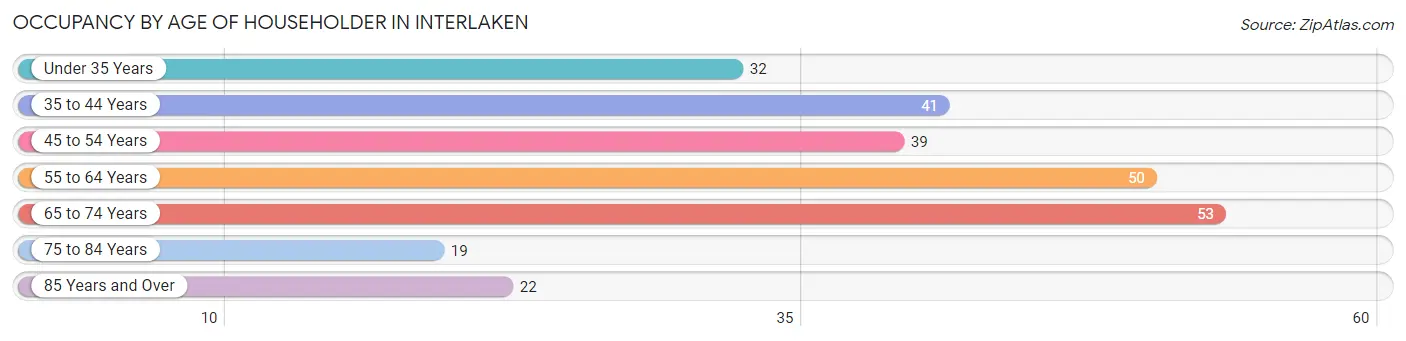
| Age Bracket | # Households | % Households |
| Under 35 Years | 32 | 12.5% |
| 35 to 44 Years | 41 | 16.0% |
| 45 to 54 Years | 39 | 15.2% |
| 55 to 64 Years | 50 | 19.5% |
| 65 to 74 Years | 53 | 20.7% |
| 75 to 84 Years | 19 | 7.4% |
| 85 Years and Over | 22 | 8.6% |
| Total | 256 | 100.0% |
Housing Finances in Interlaken
Median Income by Occupancy in Interlaken
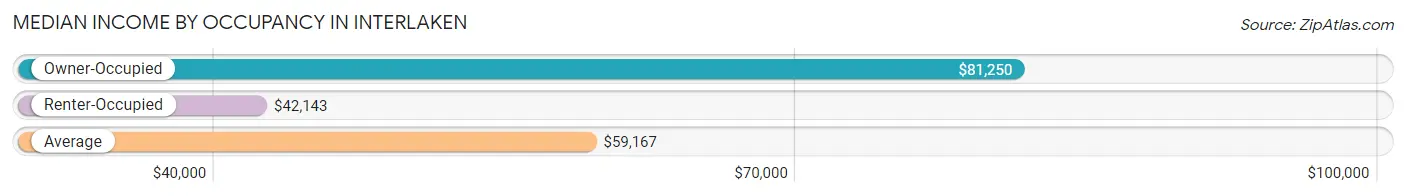
| Occupancy Type | # Households | Median Income |
| Owner-Occupied | 180 (70.3%) | $81,250 |
| Renter-Occupied | 76 (29.7%) | $42,143 |
| Average | 256 (100.0%) | $59,167 |
Occupancy by Householder Income Bracket in Interlaken
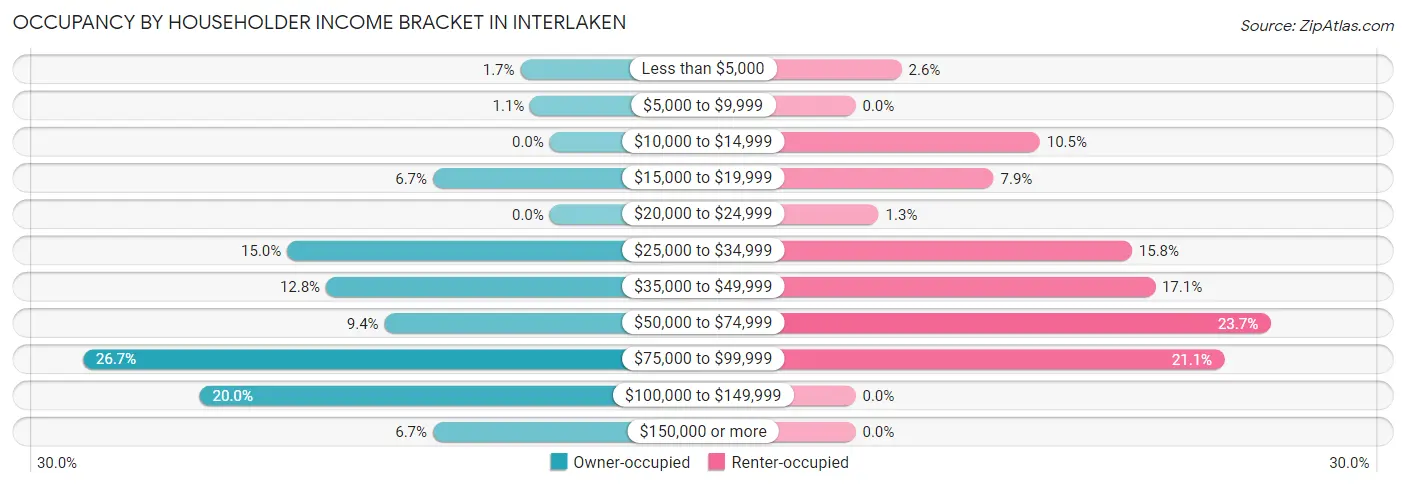
| Income Bracket | Owner-occupied | Renter-occupied |
| Less than $5,000 | 3 (1.7%) | 2 (2.6%) |
| $5,000 to $9,999 | 2 (1.1%) | 0 (0.0%) |
| $10,000 to $14,999 | 0 (0.0%) | 8 (10.5%) |
| $15,000 to $19,999 | 12 (6.7%) | 6 (7.9%) |
| $20,000 to $24,999 | 0 (0.0%) | 1 (1.3%) |
| $25,000 to $34,999 | 27 (15.0%) | 12 (15.8%) |
| $35,000 to $49,999 | 23 (12.8%) | 13 (17.1%) |
| $50,000 to $74,999 | 17 (9.4%) | 18 (23.7%) |
| $75,000 to $99,999 | 48 (26.7%) | 16 (21.0%) |
| $100,000 to $149,999 | 36 (20.0%) | 0 (0.0%) |
| $150,000 or more | 12 (6.7%) | 0 (0.0%) |
| Total | 180 (100.0%) | 76 (100.0%) |
Monthly Housing Cost Tiers in Interlaken
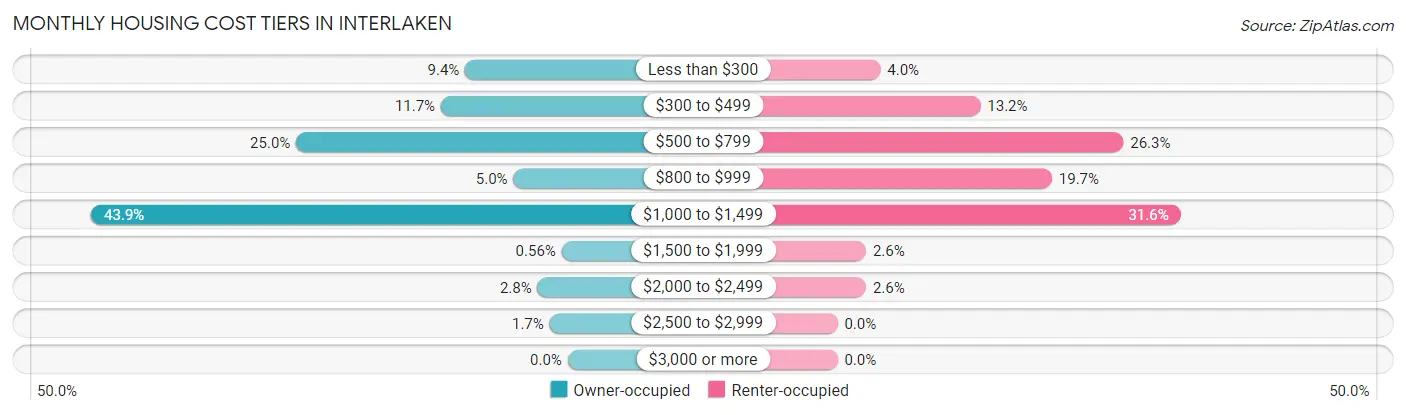
| Monthly Cost | Owner-occupied | Renter-occupied |
| Less than $300 | 17 (9.4%) | 3 (4.0%) |
| $300 to $499 | 21 (11.7%) | 10 (13.2%) |
| $500 to $799 | 45 (25.0%) | 20 (26.3%) |
| $800 to $999 | 9 (5.0%) | 15 (19.7%) |
| $1,000 to $1,499 | 79 (43.9%) | 24 (31.6%) |
| $1,500 to $1,999 | 1 (0.6%) | 2 (2.6%) |
| $2,000 to $2,499 | 5 (2.8%) | 2 (2.6%) |
| $2,500 to $2,999 | 3 (1.7%) | 0 (0.0%) |
| $3,000 or more | 0 (0.0%) | 0 (0.0%) |
| Total | 180 (100.0%) | 76 (100.0%) |
Physical Housing Characteristics in Interlaken
Housing Structures in Interlaken
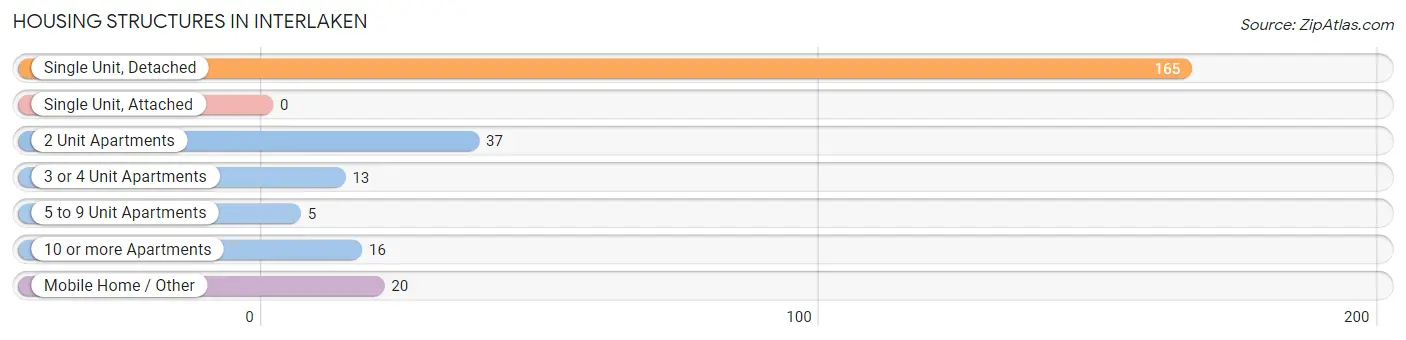
| Structure Type | # Housing Units | % Housing Units |
| Single Unit, Detached | 165 | 64.4% |
| Single Unit, Attached | 0 | 0.0% |
| 2 Unit Apartments | 37 | 14.4% |
| 3 or 4 Unit Apartments | 13 | 5.1% |
| 5 to 9 Unit Apartments | 5 | 1.9% |
| 10 or more Apartments | 16 | 6.2% |
| Mobile Home / Other | 20 | 7.8% |
| Total | 256 | 100.0% |
Housing Structures by Occupancy in Interlaken
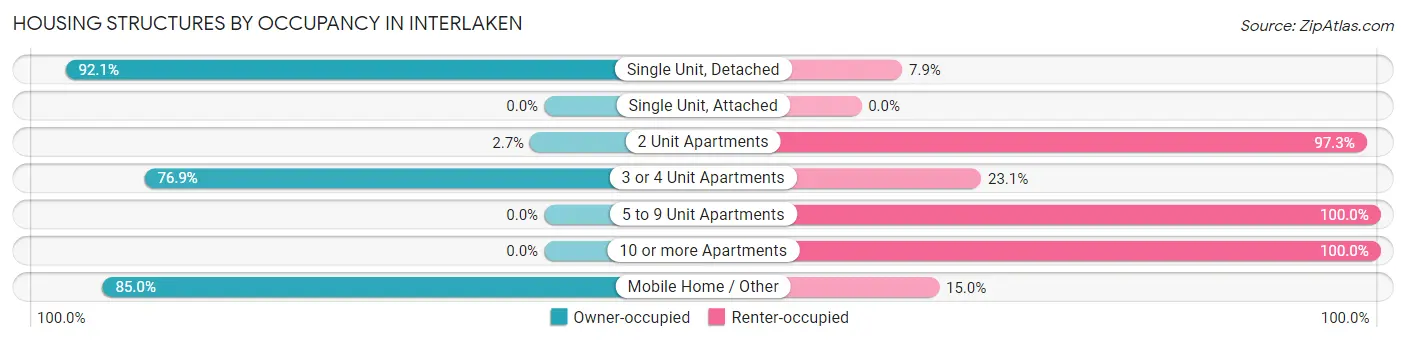
| Structure Type | Owner-occupied | Renter-occupied |
| Single Unit, Detached | 152 (92.1%) | 13 (7.9%) |
| Single Unit, Attached | 0 (0.0%) | 0 (0.0%) |
| 2 Unit Apartments | 1 (2.7%) | 36 (97.3%) |
| 3 or 4 Unit Apartments | 10 (76.9%) | 3 (23.1%) |
| 5 to 9 Unit Apartments | 0 (0.0%) | 5 (100.0%) |
| 10 or more Apartments | 0 (0.0%) | 16 (100.0%) |
| Mobile Home / Other | 17 (85.0%) | 3 (15.0%) |
| Total | 180 (70.3%) | 76 (29.7%) |
Housing Structures by Number of Rooms in Interlaken
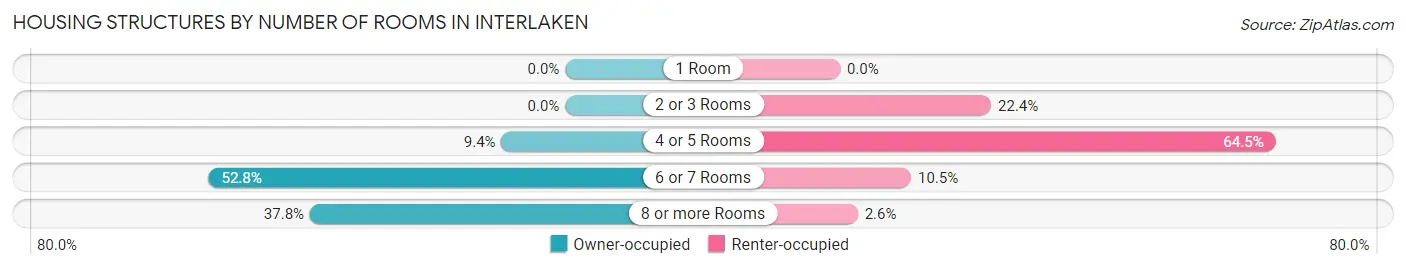
| Number of Rooms | Owner-occupied | Renter-occupied |
| 1 Room | 0 (0.0%) | 0 (0.0%) |
| 2 or 3 Rooms | 0 (0.0%) | 17 (22.4%) |
| 4 or 5 Rooms | 17 (9.4%) | 49 (64.5%) |
| 6 or 7 Rooms | 95 (52.8%) | 8 (10.5%) |
| 8 or more Rooms | 68 (37.8%) | 2 (2.6%) |
| Total | 180 (100.0%) | 76 (100.0%) |
Housing Structure by Heating Type in Interlaken
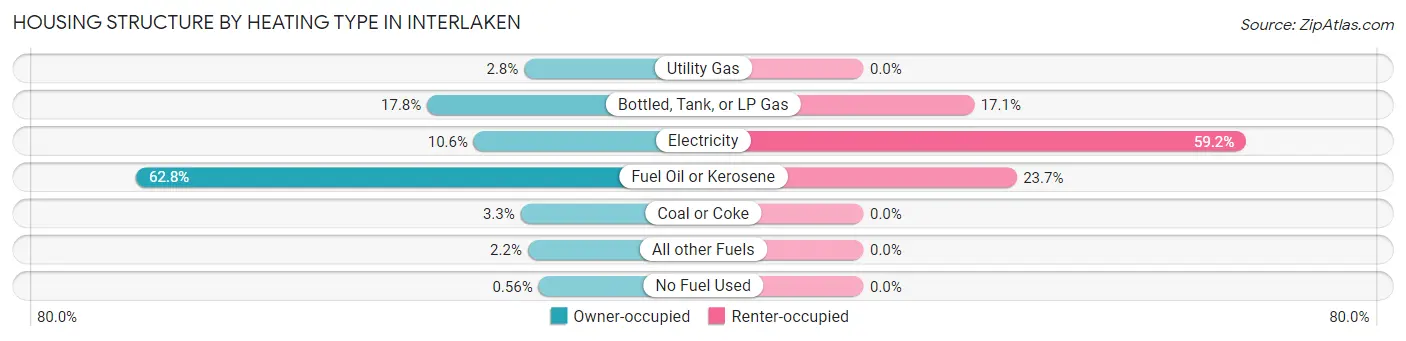
| Heating Type | Owner-occupied | Renter-occupied |
| Utility Gas | 5 (2.8%) | 0 (0.0%) |
| Bottled, Tank, or LP Gas | 32 (17.8%) | 13 (17.1%) |
| Electricity | 19 (10.6%) | 45 (59.2%) |
| Fuel Oil or Kerosene | 113 (62.8%) | 18 (23.7%) |
| Coal or Coke | 6 (3.3%) | 0 (0.0%) |
| All other Fuels | 4 (2.2%) | 0 (0.0%) |
| No Fuel Used | 1 (0.6%) | 0 (0.0%) |
| Total | 180 (100.0%) | 76 (100.0%) |
Household Vehicle Usage in Interlaken
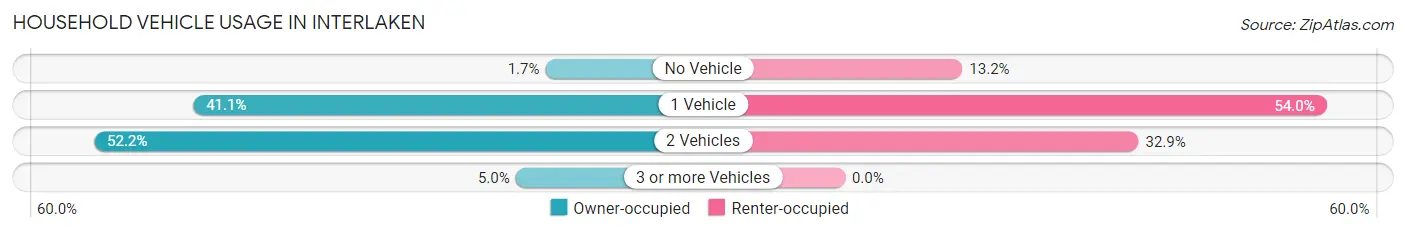
| Vehicles per Household | Owner-occupied | Renter-occupied |
| No Vehicle | 3 (1.7%) | 10 (13.2%) |
| 1 Vehicle | 74 (41.1%) | 41 (53.9%) |
| 2 Vehicles | 94 (52.2%) | 25 (32.9%) |
| 3 or more Vehicles | 9 (5.0%) | 0 (0.0%) |
| Total | 180 (100.0%) | 76 (100.0%) |
Real Estate & Mortgages in Interlaken
Real Estate and Mortgage Overview in Interlaken
| Characteristic | Without Mortgage | With Mortgage |
| Housing Units | 91 | 89 |
| Median Property Value | $130,200 | $132,600 |
| Median Household Income | $48,125 | $7 |
| Monthly Housing Costs | $583 | $0 |
| Real Estate Taxes | $2,692 | $0 |
Property Value by Mortgage Status in Interlaken
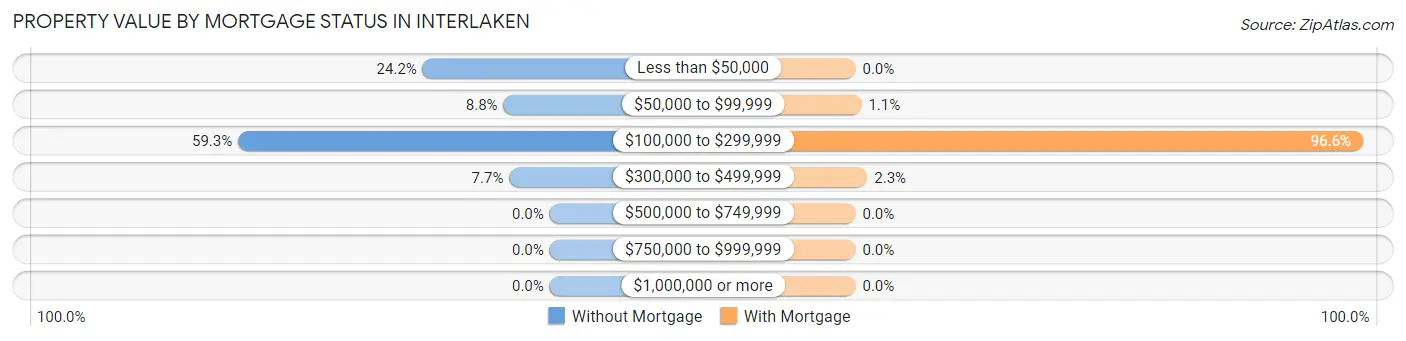
| Property Value | Without Mortgage | With Mortgage |
| Less than $50,000 | 22 (24.2%) | 0 (0.0%) |
| $50,000 to $99,999 | 8 (8.8%) | 1 (1.1%) |
| $100,000 to $299,999 | 54 (59.3%) | 86 (96.6%) |
| $300,000 to $499,999 | 7 (7.7%) | 2 (2.2%) |
| $500,000 to $749,999 | 0 (0.0%) | 0 (0.0%) |
| $750,000 to $999,999 | 0 (0.0%) | 0 (0.0%) |
| $1,000,000 or more | 0 (0.0%) | 0 (0.0%) |
| Total | 91 (100.0%) | 89 (100.0%) |
Household Income by Mortgage Status in Interlaken
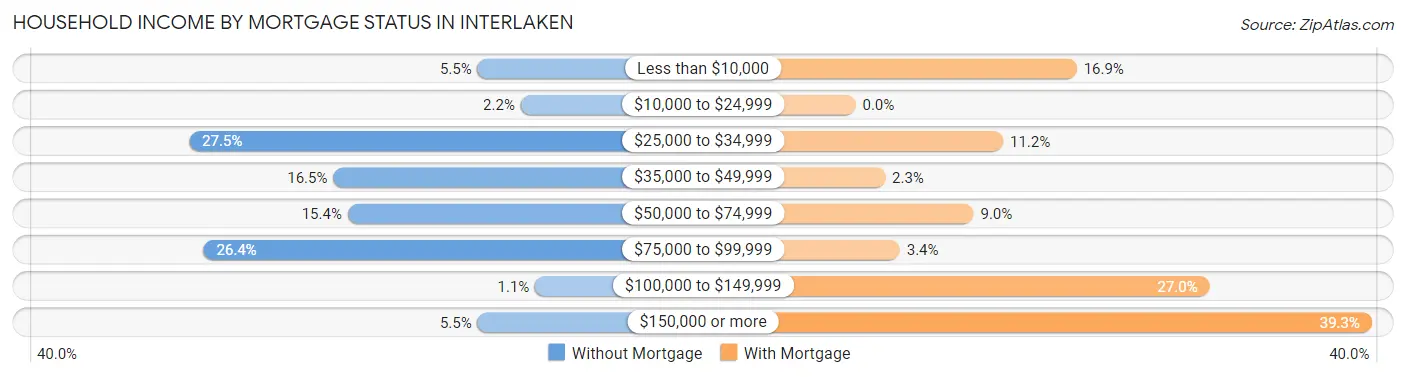
| Household Income | Without Mortgage | With Mortgage |
| Less than $10,000 | 5 (5.5%) | 15 (16.9%) |
| $10,000 to $24,999 | 2 (2.2%) | 0 (0.0%) |
| $25,000 to $34,999 | 25 (27.5%) | 10 (11.2%) |
| $35,000 to $49,999 | 15 (16.5%) | 2 (2.2%) |
| $50,000 to $74,999 | 14 (15.4%) | 8 (9.0%) |
| $75,000 to $99,999 | 24 (26.4%) | 3 (3.4%) |
| $100,000 to $149,999 | 1 (1.1%) | 24 (27.0%) |
| $150,000 or more | 5 (5.5%) | 35 (39.3%) |
| Total | 91 (100.0%) | 89 (100.0%) |
Property Value to Household Income Ratio in Interlaken
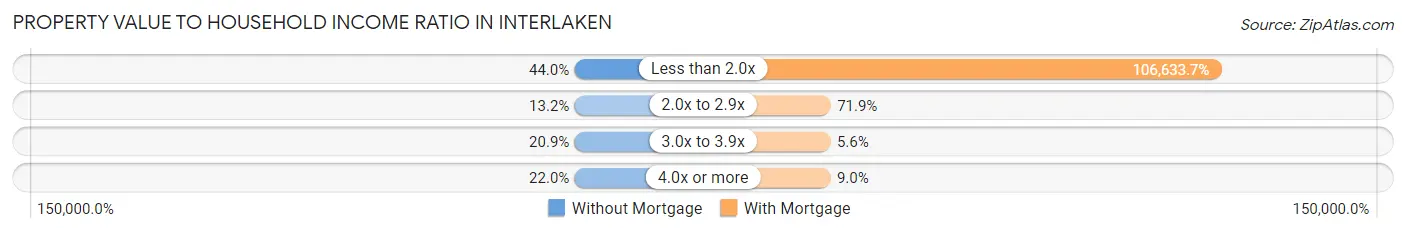
| Value-to-Income Ratio | Without Mortgage | With Mortgage |
| Less than 2.0x | 40 (44.0%) | 94,904 (106,633.7%) |
| 2.0x to 2.9x | 12 (13.2%) | 64 (71.9%) |
| 3.0x to 3.9x | 19 (20.9%) | 5 (5.6%) |
| 4.0x or more | 20 (22.0%) | 8 (9.0%) |
| Total | 91 (100.0%) | 89 (100.0%) |
Real Estate Taxes by Mortgage Status in Interlaken
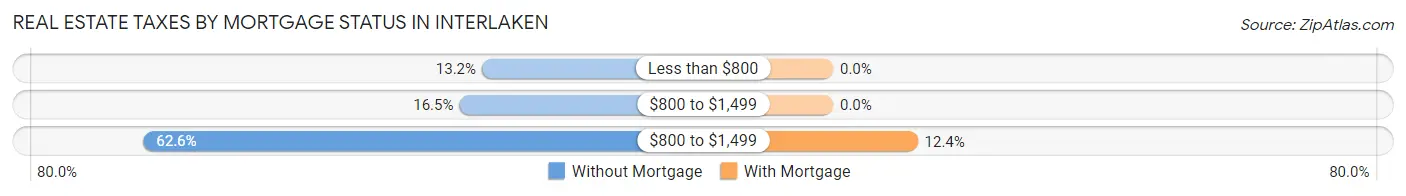
| Property Taxes | Without Mortgage | With Mortgage |
| Less than $800 | 12 (13.2%) | 0 (0.0%) |
| $800 to $1,499 | 15 (16.5%) | 0 (0.0%) |
| $800 to $1,499 | 57 (62.6%) | 11 (12.4%) |
| Total | 91 (100.0%) | 89 (100.0%) |
Health & Disability in Interlaken
Health Insurance Coverage by Age in Interlaken
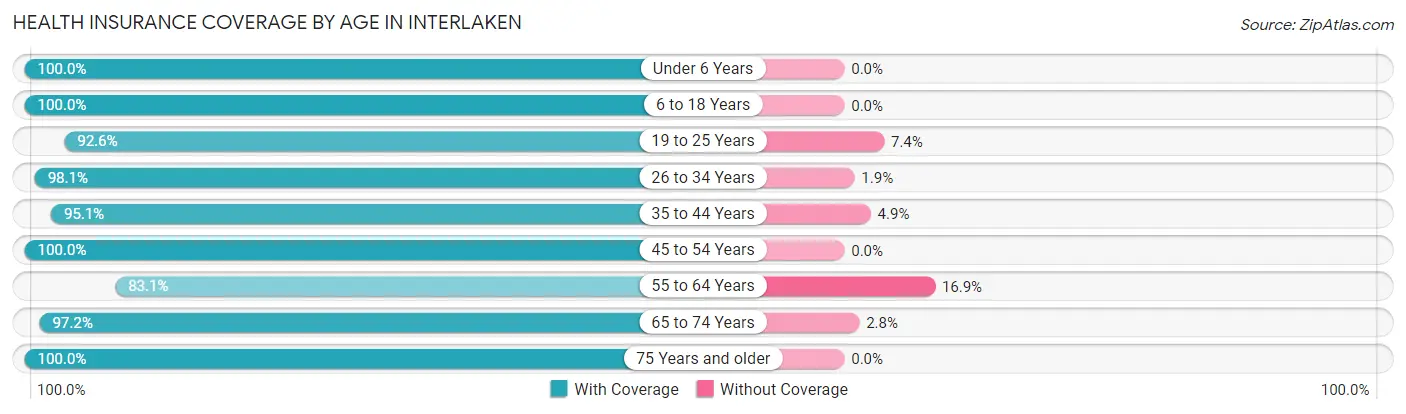
| Age Bracket | With Coverage | Without Coverage |
| Under 6 Years | 37 (100.0%) | 0 (0.0%) |
| 6 to 18 Years | 64 (100.0%) | 0 (0.0%) |
| 19 to 25 Years | 25 (92.6%) | 2 (7.4%) |
| 26 to 34 Years | 52 (98.1%) | 1 (1.9%) |
| 35 to 44 Years | 58 (95.1%) | 3 (4.9%) |
| 45 to 54 Years | 42 (100.0%) | 0 (0.0%) |
| 55 to 64 Years | 59 (83.1%) | 12 (16.9%) |
| 65 to 74 Years | 70 (97.2%) | 2 (2.8%) |
| 75 Years and older | 73 (100.0%) | 0 (0.0%) |
| Total | 480 (96.0%) | 20 (4.0%) |
Health Insurance Coverage by Citizenship Status in Interlaken
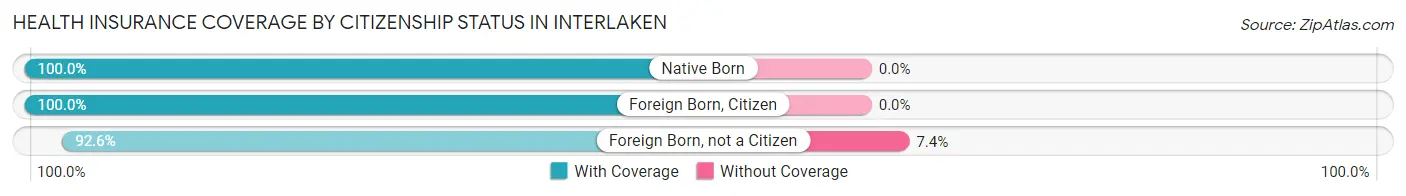
| Citizenship Status | With Coverage | Without Coverage |
| Native Born | 37 (100.0%) | 0 (0.0%) |
| Foreign Born, Citizen | 64 (100.0%) | 0 (0.0%) |
| Foreign Born, not a Citizen | 25 (92.6%) | 2 (7.4%) |
Health Insurance Coverage by Household Income in Interlaken
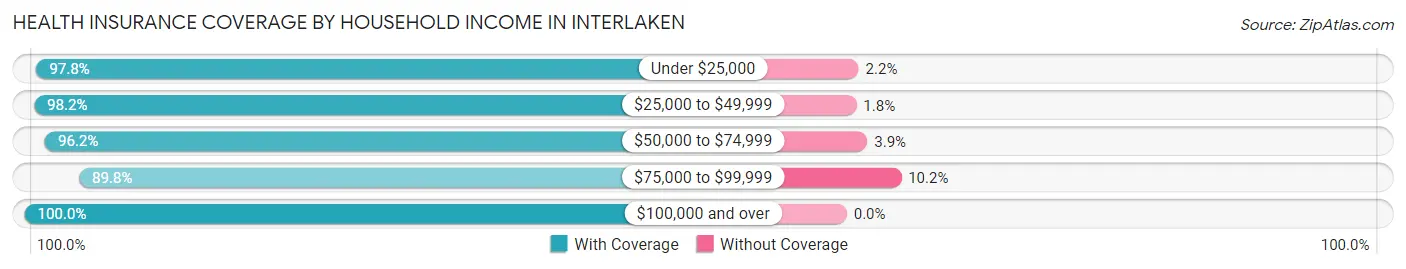
| Household Income | With Coverage | Without Coverage |
| Under $25,000 | 44 (97.8%) | 1 (2.2%) |
| $25,000 to $49,999 | 109 (98.2%) | 2 (1.8%) |
| $50,000 to $74,999 | 50 (96.2%) | 2 (3.8%) |
| $75,000 to $99,999 | 132 (89.8%) | 15 (10.2%) |
| $100,000 and over | 135 (100.0%) | 0 (0.0%) |
Public vs Private Health Insurance Coverage by Age in Interlaken
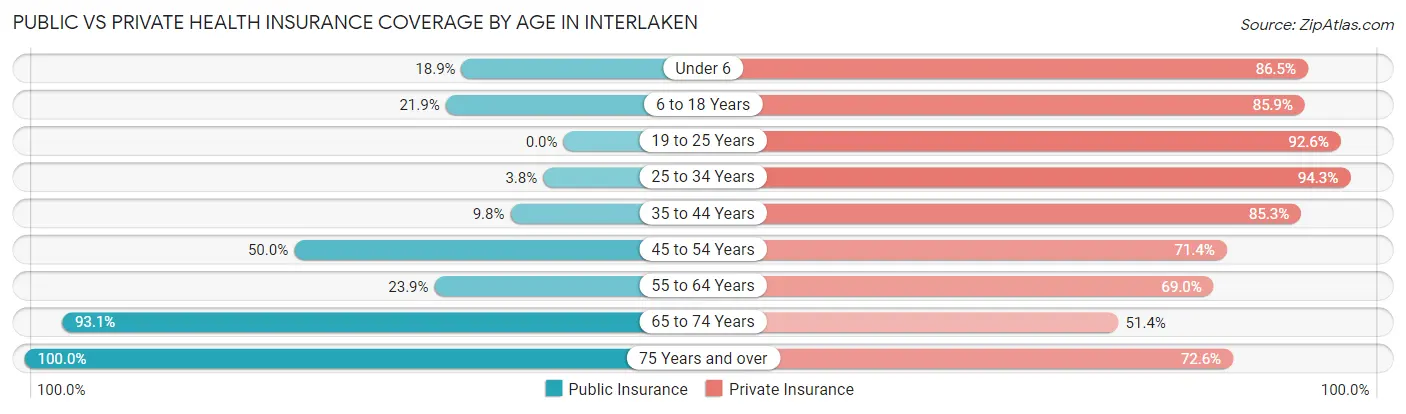
| Age Bracket | Public Insurance | Private Insurance |
| Under 6 | 7 (18.9%) | 32 (86.5%) |
| 6 to 18 Years | 14 (21.9%) | 55 (85.9%) |
| 19 to 25 Years | 0 (0.0%) | 25 (92.6%) |
| 25 to 34 Years | 2 (3.8%) | 50 (94.3%) |
| 35 to 44 Years | 6 (9.8%) | 52 (85.3%) |
| 45 to 54 Years | 21 (50.0%) | 30 (71.4%) |
| 55 to 64 Years | 17 (23.9%) | 49 (69.0%) |
| 65 to 74 Years | 67 (93.1%) | 37 (51.4%) |
| 75 Years and over | 73 (100.0%) | 53 (72.6%) |
| Total | 207 (41.4%) | 383 (76.6%) |
Disability Status by Sex by Age in Interlaken
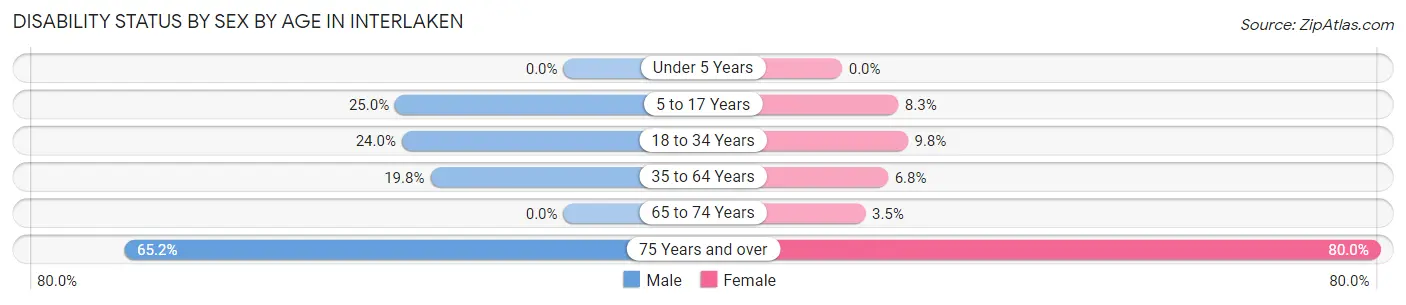
| Age Bracket | Male | Female |
| Under 5 Years | 0 (0.0%) | 0 (0.0%) |
| 5 to 17 Years | 10 (25.0%) | 2 (8.3%) |
| 18 to 34 Years | 12 (24.0%) | 4 (9.8%) |
| 35 to 64 Years | 17 (19.8%) | 6 (6.8%) |
| 65 to 74 Years | 0 (0.0%) | 2 (3.5%) |
| 75 Years and over | 15 (65.2%) | 40 (80.0%) |
Disability Class by Sex by Age in Interlaken
Disability Class: Hearing Difficulty
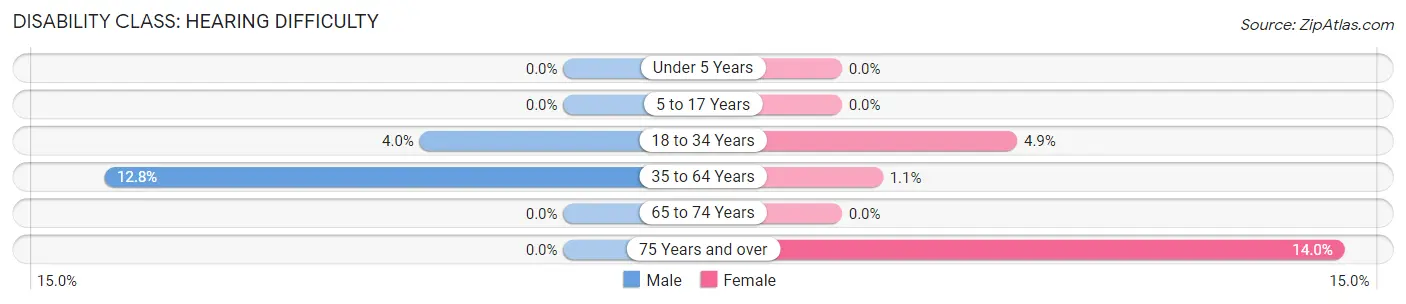
| Age Bracket | Male | Female |
| Under 5 Years | 0 (0.0%) | 0 (0.0%) |
| 5 to 17 Years | 0 (0.0%) | 0 (0.0%) |
| 18 to 34 Years | 2 (4.0%) | 2 (4.9%) |
| 35 to 64 Years | 11 (12.8%) | 1 (1.1%) |
| 65 to 74 Years | 0 (0.0%) | 0 (0.0%) |
| 75 Years and over | 0 (0.0%) | 7 (14.0%) |
Disability Class: Vision Difficulty
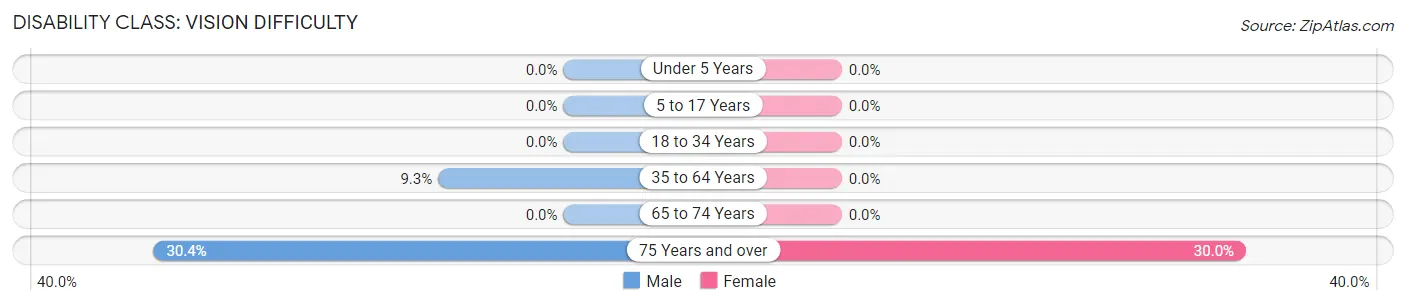
| Age Bracket | Male | Female |
| Under 5 Years | 0 (0.0%) | 0 (0.0%) |
| 5 to 17 Years | 0 (0.0%) | 0 (0.0%) |
| 18 to 34 Years | 0 (0.0%) | 0 (0.0%) |
| 35 to 64 Years | 8 (9.3%) | 0 (0.0%) |
| 65 to 74 Years | 0 (0.0%) | 0 (0.0%) |
| 75 Years and over | 7 (30.4%) | 15 (30.0%) |
Disability Class: Cognitive Difficulty
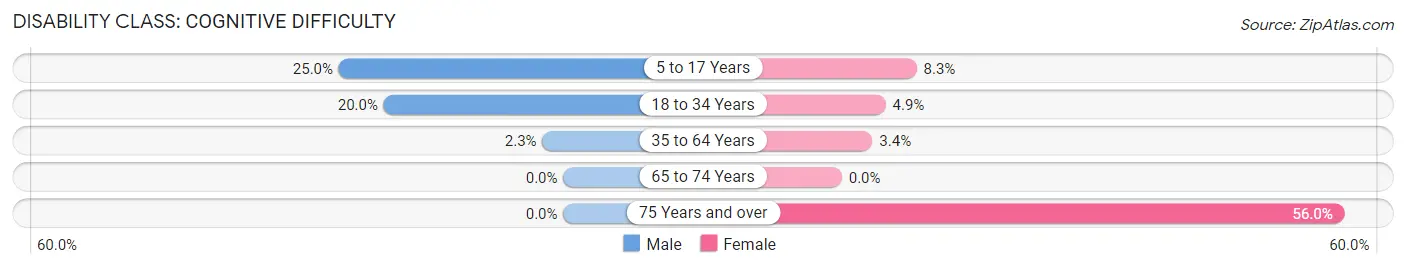
| Age Bracket | Male | Female |
| 5 to 17 Years | 10 (25.0%) | 2 (8.3%) |
| 18 to 34 Years | 10 (20.0%) | 2 (4.9%) |
| 35 to 64 Years | 2 (2.3%) | 3 (3.4%) |
| 65 to 74 Years | 0 (0.0%) | 0 (0.0%) |
| 75 Years and over | 0 (0.0%) | 28 (56.0%) |
Disability Class: Ambulatory Difficulty
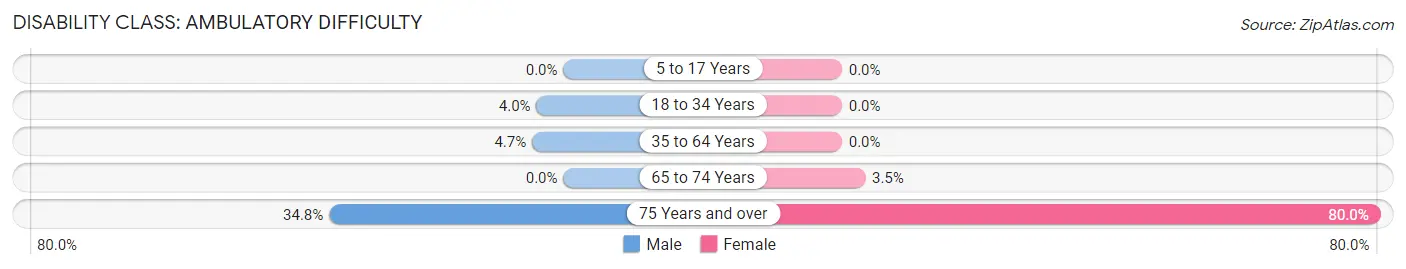
| Age Bracket | Male | Female |
| 5 to 17 Years | 0 (0.0%) | 0 (0.0%) |
| 18 to 34 Years | 2 (4.0%) | 0 (0.0%) |
| 35 to 64 Years | 4 (4.6%) | 0 (0.0%) |
| 65 to 74 Years | 0 (0.0%) | 2 (3.5%) |
| 75 Years and over | 8 (34.8%) | 40 (80.0%) |
Disability Class: Self-Care Difficulty
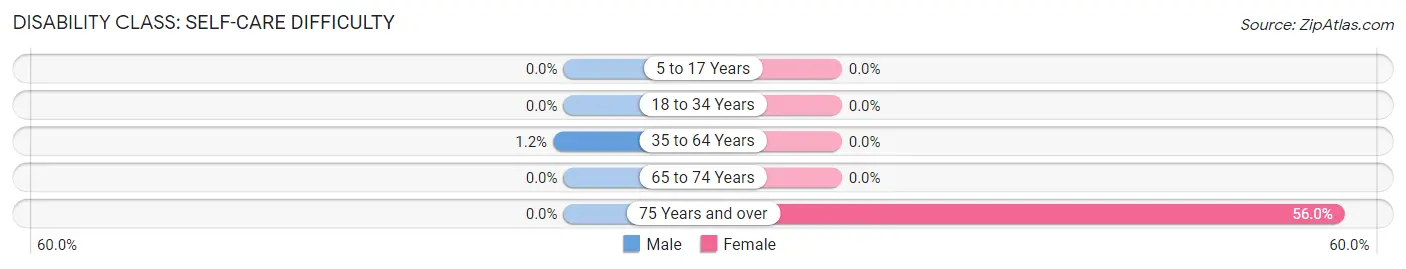
| Age Bracket | Male | Female |
| 5 to 17 Years | 0 (0.0%) | 0 (0.0%) |
| 18 to 34 Years | 0 (0.0%) | 0 (0.0%) |
| 35 to 64 Years | 1 (1.2%) | 0 (0.0%) |
| 65 to 74 Years | 0 (0.0%) | 0 (0.0%) |
| 75 Years and over | 0 (0.0%) | 28 (56.0%) |
Technology Access in Interlaken
Computing Device Access in Interlaken
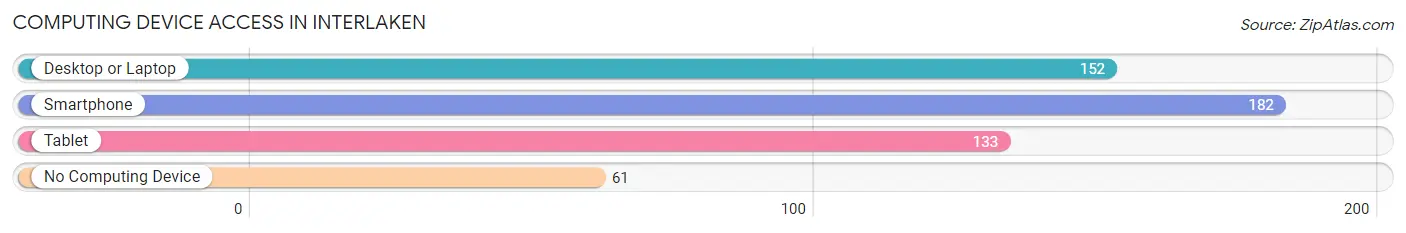
| Device Type | # Households | % Households |
| Desktop or Laptop | 152 | 59.4% |
| Smartphone | 182 | 71.1% |
| Tablet | 133 | 51.9% |
| No Computing Device | 61 | 23.8% |
| Total | 256 | 100.0% |
Internet Access in Interlaken
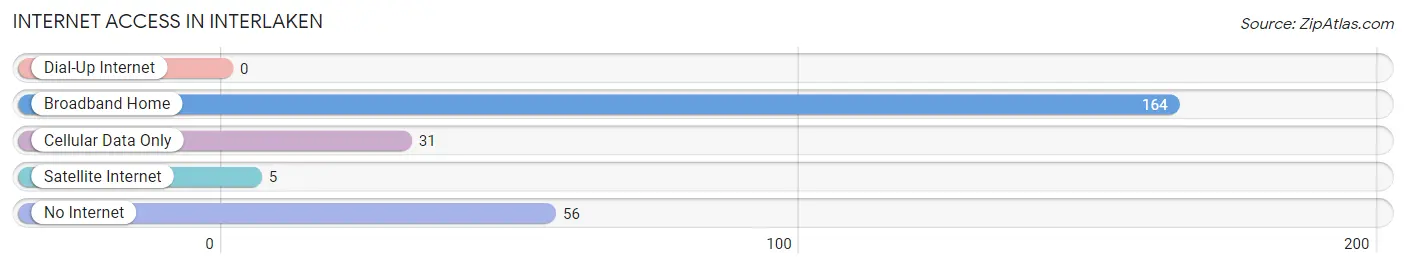
| Internet Type | # Households | % Households |
| Dial-Up Internet | 0 | 0.0% |
| Broadband Home | 164 | 64.1% |
| Cellular Data Only | 31 | 12.1% |
| Satellite Internet | 5 | 1.9% |
| No Internet | 56 | 21.9% |
| Total | 256 | 100.0% |
Interlaken Summary
Interlaken is a small village located in Seneca County, New York, United States. It is situated on the east side of Cayuga Lake, and is part of the Finger Lakes region. The population was 1,072 at the 2010 census.
History
Interlaken was first settled in 1790 by a group of settlers from Connecticut. The village was originally known as "Cayuga Bridge," and was renamed "Interlaken" in 1810. The name is derived from the German phrase "inter lachen," which means "between lakes." The village was incorporated in 1829.
Interlaken was an important stop on the Underground Railroad, and was home to several prominent abolitionists, including the Rev. John Rankin and his family. Rankin's house, which is now a museum, was a major stop on the Underground Railroad.
Geography
Interlaken is located at 42°41'25" North, 76°45'45" West (42.690278, -76.762500). According to the United States Census Bureau, the village has a total area of 0.7 square miles (1.8 km2), all of it land.
Interlaken is located on the east side of Cayuga Lake, and is part of the Finger Lakes region. The village is bordered by the towns of Ovid and Lodi.
Economy
Interlaken's economy is largely based on tourism. The village is home to several wineries, including the Finger Lakes Wine Center, which offers tastings and tours. The village is also home to several bed and breakfasts, as well as a variety of restaurants and shops.
Demographics
As of the census of 2000, there were 1,072 people, 441 households, and 287 families residing in the village. The population density was 1,541.2 people per square mile (595.2/km2). There were 471 housing units at an average density of 672.2 per square mile (259.7/km2). The racial makeup of the village was 97.7% White, 0.7% African American, 0.1% Native American, 0.1% Asian, 0.1% Pacific Islander, 0.4% from other races, and 0.9% from two or more races. Hispanic or Latino of any race were 1.3% of the population.
There were 441 households, out of which 28.2% had children under the age of 18 living with them, 51.6% were married couples living together, 9.3% had a female householder with no husband present, and 35.3% were non-families. 30.2% of all households were made up of individuals, and 14.3% had someone living alone who was 65 years of age or older. The average household size was 2.43 and the average family size was 3.03.
In the village, the population was spread out, with 24.2% under the age of 18, 6.2% from 18 to 24, 28.2% from 25 to 44, 24.2% from 45 to 64, and 17.2% who were 65 years of age or older. The median age was 40 years. For every 100 females, there were 94.2 males. For every 100 females age 18 and over, there were 88.2 males.
The median income for a household in the village was $37,500, and the median income for a family was $45,000. Males had a median income of $31,250 versus $25,000 for females. The per capita income for the village was $18,945. About 4.2% of families and 6.2% of the population were below the poverty line, including 8.2% of those under age 18 and 5.2% of those age 65 or over.
Common Questions
What is Per Capita Income in Interlaken?
Per Capita income in Interlaken is $33,136.
What is the Median Family Income in Interlaken?
Median Family Income in Interlaken is $83,438.
What is the Median Household income in Interlaken?
Median Household Income in Interlaken is $59,167.
What is Income or Wage Gap in Interlaken?
Income or Wage Gap in Interlaken is 25.1%.
Women in Interlaken earn 74.9 cents for every dollar earned by a man.
What is Inequality or Gini Index in Interlaken?
Inequality or Gini Index in Interlaken is 0.33.
What is the Total Population of Interlaken?
Total Population of Interlaken is 503.
What is the Total Male Population of Interlaken?
Total Male Population of Interlaken is 225.
What is the Total Female Population of Interlaken?
Total Female Population of Interlaken is 278.
What is the Ratio of Males per 100 Females in Interlaken?
There are 80.94 Males per 100 Females in Interlaken.
What is the Ratio of Females per 100 Males in Interlaken?
There are 123.56 Females per 100 Males in Interlaken.
What is the Median Population Age in Interlaken?
Median Population Age in Interlaken is 46.0 Years.
What is the Average Family Size in Interlaken
Average Family Size in Interlaken is 2.7 People.
What is the Average Household Size in Interlaken
Average Household Size in Interlaken is 1.9 People.
How Large is the Labor Force in Interlaken?
There are 257 People in the Labor Forcein in Interlaken.
What is the Percentage of People in the Labor Force in Interlaken?
60.6% of People are in the Labor Force in Interlaken.
What is the Unemployment Rate in Interlaken?
Unemployment Rate in Interlaken is 1.9%.