Glenwood Landing, NY Map & Demographics
Glenwood Landing Map
Glenwood Landing Overview
$62,518
PER CAPITA INCOME
$148,864
AVG FAMILY INCOME
$121,612
AVG HOUSEHOLD INCOME
72.5%
WAGE / INCOME GAP [ % ]
27.5¢/ $1
WAGE / INCOME GAP [ $ ]
0.37
INEQUALITY / GINI INDEX
3,694
TOTAL POPULATION
1,666
MALE POPULATION
2,028
FEMALE POPULATION
82.15
MALES / 100 FEMALES
121.73
FEMALES / 100 MALES
48.9
MEDIAN AGE
3.1
AVG FAMILY SIZE
2.5
AVG HOUSEHOLD SIZE
1,619
LABOR FORCE [ PEOPLE ]
54.2%
PERCENT IN LABOR FORCE
3.2%
UNEMPLOYMENT RATE
Glenwood Landing Zip Codes
Glenwood Landing Area Codes
Income in Glenwood Landing
Income Overview in Glenwood Landing
Per Capita Income in Glenwood Landing is $62,518, while median incomes of families and households are $148,864 and $121,612 respectively.
| Characteristic | Number | Measure |
| Per Capita Income | 3,694 | $62,518 |
| Median Family Income | 982 | $148,864 |
| Mean Family Income | 982 | $181,425 |
| Median Household Income | 1,471 | $121,612 |
| Mean Household Income | 1,471 | $154,601 |
| Income Deficit | 982 | $0 |
| Wage / Income Gap (%) | 3,694 | 72.50% |
| Wage / Income Gap ($) | 3,694 | 27.50¢ per $1 |
| Gini / Inequality Index | 3,694 | 0.37 |
Earnings by Sex in Glenwood Landing
Average Earnings in Glenwood Landing are $61,000, $101,471 for men and $27,907 for women, a difference of 72.5%.
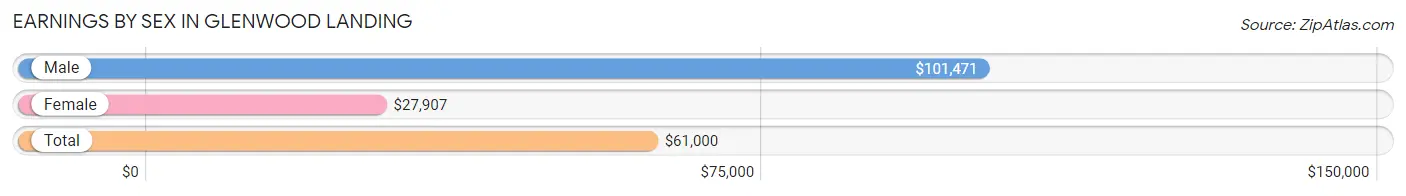
| Sex | Number | Average Earnings |
| Male | 982 (51.6%) | $101,471 |
| Female | 922 (48.4%) | $27,907 |
| Total | 1,904 (100.0%) | $61,000 |
Earnings by Sex by Income Bracket in Glenwood Landing
The most common earnings brackets in Glenwood Landing are $100,000+ for men (501 | 51.0%) and $100,000+ for women (179 | 19.4%).
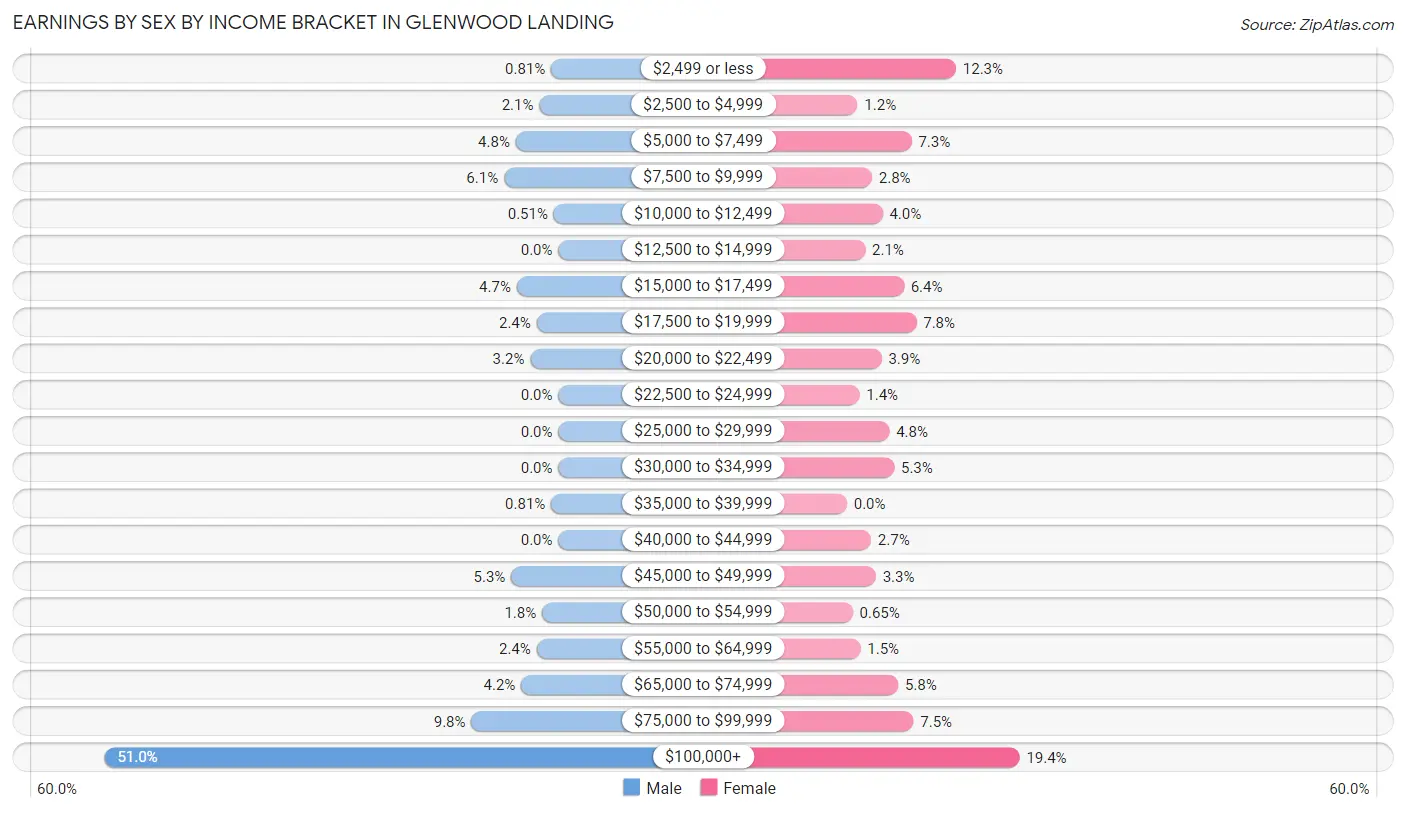
| Income | Male | Female |
| $2,499 or less | 8 (0.8%) | 113 (12.3%) |
| $2,500 to $4,999 | 21 (2.1%) | 11 (1.2%) |
| $5,000 to $7,499 | 47 (4.8%) | 67 (7.3%) |
| $7,500 to $9,999 | 60 (6.1%) | 26 (2.8%) |
| $10,000 to $12,499 | 5 (0.5%) | 37 (4.0%) |
| $12,500 to $14,999 | 0 (0.0%) | 19 (2.1%) |
| $15,000 to $17,499 | 46 (4.7%) | 59 (6.4%) |
| $17,500 to $19,999 | 24 (2.4%) | 72 (7.8%) |
| $20,000 to $22,499 | 31 (3.2%) | 36 (3.9%) |
| $22,500 to $24,999 | 0 (0.0%) | 13 (1.4%) |
| $25,000 to $29,999 | 0 (0.0%) | 44 (4.8%) |
| $30,000 to $34,999 | 0 (0.0%) | 49 (5.3%) |
| $35,000 to $39,999 | 8 (0.8%) | 0 (0.0%) |
| $40,000 to $44,999 | 0 (0.0%) | 25 (2.7%) |
| $45,000 to $49,999 | 52 (5.3%) | 30 (3.3%) |
| $50,000 to $54,999 | 18 (1.8%) | 6 (0.6%) |
| $55,000 to $64,999 | 24 (2.4%) | 14 (1.5%) |
| $65,000 to $74,999 | 41 (4.2%) | 53 (5.8%) |
| $75,000 to $99,999 | 96 (9.8%) | 69 (7.5%) |
| $100,000+ | 501 (51.0%) | 179 (19.4%) |
| Total | 982 (100.0%) | 922 (100.0%) |
Earnings by Sex by Educational Attainment in Glenwood Landing
Average earnings in Glenwood Landing are $112,969 for men and $31,327 for women, a difference of 72.3%. Men with an educational attainment of bachelor's degree enjoy the highest average annual earnings of $149,323, while those with college or associate's degree education earn the least with $99,120. Women with an educational attainment of graduate degree earn the most with the average annual earnings of $87,500, while those with college or associate's degree education have the smallest earnings of $15,972.
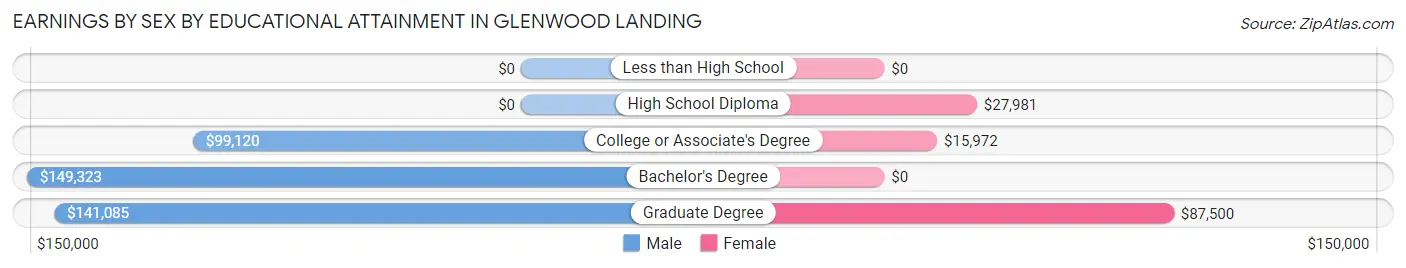
| Educational Attainment | Male Income | Female Income |
| Less than High School | - | - |
| High School Diploma | - | - |
| College or Associate's Degree | $99,120 | $15,972 |
| Bachelor's Degree | $149,323 | $0 |
| Graduate Degree | $141,085 | $87,500 |
| Total | $112,969 | $31,327 |
Family Income in Glenwood Landing
Family Income Brackets in Glenwood Landing
According to the Glenwood Landing family income data, there are 376 families falling into the $200,000+ income range, which is the most common income bracket and makes up 38.3% of all families.
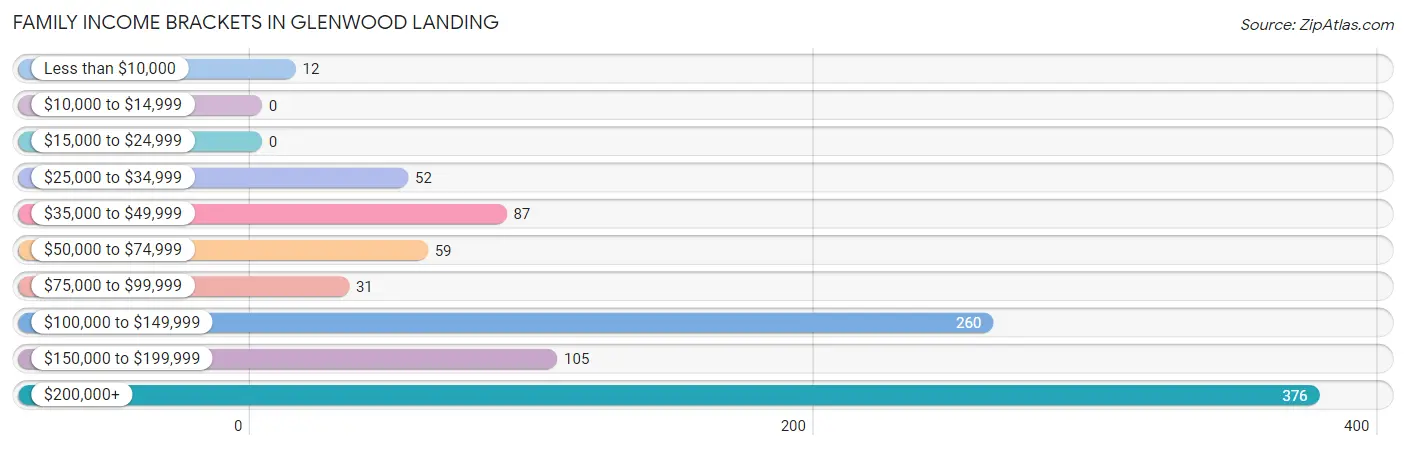
| Income Bracket | # Families | % Families |
| Less than $10,000 | 12 | 1.2% |
| $10,000 to $14,999 | 0 | 0.0% |
| $15,000 to $24,999 | 0 | 0.0% |
| $25,000 to $34,999 | 52 | 5.3% |
| $35,000 to $49,999 | 87 | 8.9% |
| $50,000 to $74,999 | 59 | 6.0% |
| $75,000 to $99,999 | 31 | 3.2% |
| $100,000 to $149,999 | 260 | 26.5% |
| $150,000 to $199,999 | 105 | 10.7% |
| $200,000+ | 376 | 38.3% |
Family Income by Famaliy Size in Glenwood Landing
4-person families (162 | 16.5%) account for the highest median family income in Glenwood Landing with $244,297 per family, while 4-person families (162 | 16.5%) have the highest median income of $61,074 per family member.
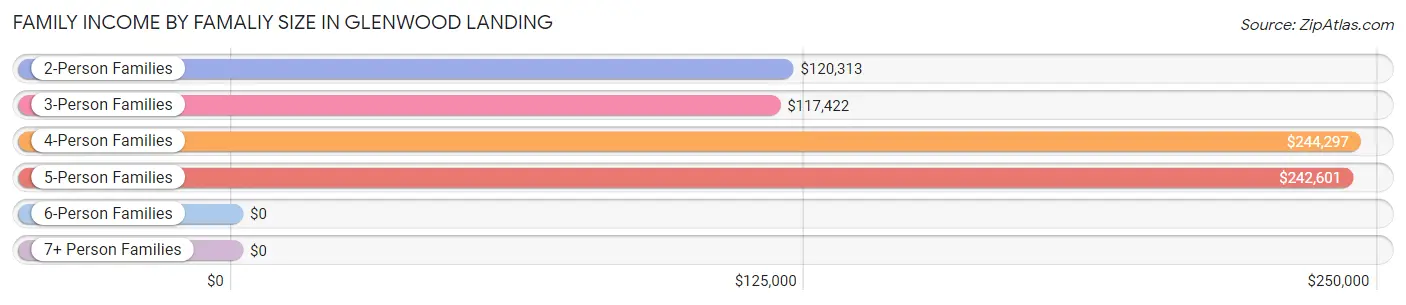
| Income Bracket | # Families | Median Income |
| 2-Person Families | 429 (43.7%) | $120,313 |
| 3-Person Families | 242 (24.6%) | $117,422 |
| 4-Person Families | 162 (16.5%) | $244,297 |
| 5-Person Families | 149 (15.2%) | $242,601 |
| 6-Person Families | 0 (0.0%) | $0 |
| 7+ Person Families | 0 (0.0%) | $0 |
| Total | 982 (100.0%) | $148,864 |
Family Income by Number of Earners in Glenwood Landing
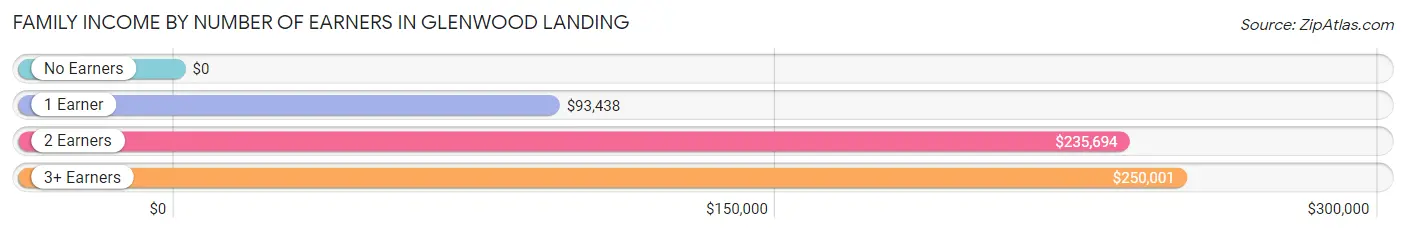
| Number of Earners | # Families | Median Income |
| No Earners | 110 (11.2%) | $0 |
| 1 Earner | 276 (28.1%) | $93,438 |
| 2 Earners | 467 (47.6%) | $235,694 |
| 3+ Earners | 129 (13.1%) | $250,001 |
| Total | 982 (100.0%) | $148,864 |
Household Income in Glenwood Landing
Household Income Brackets in Glenwood Landing
With 494 households falling in the category, the $100,000 to $149,999 income range is the most frequent in Glenwood Landing, accounting for 33.6% of all households.
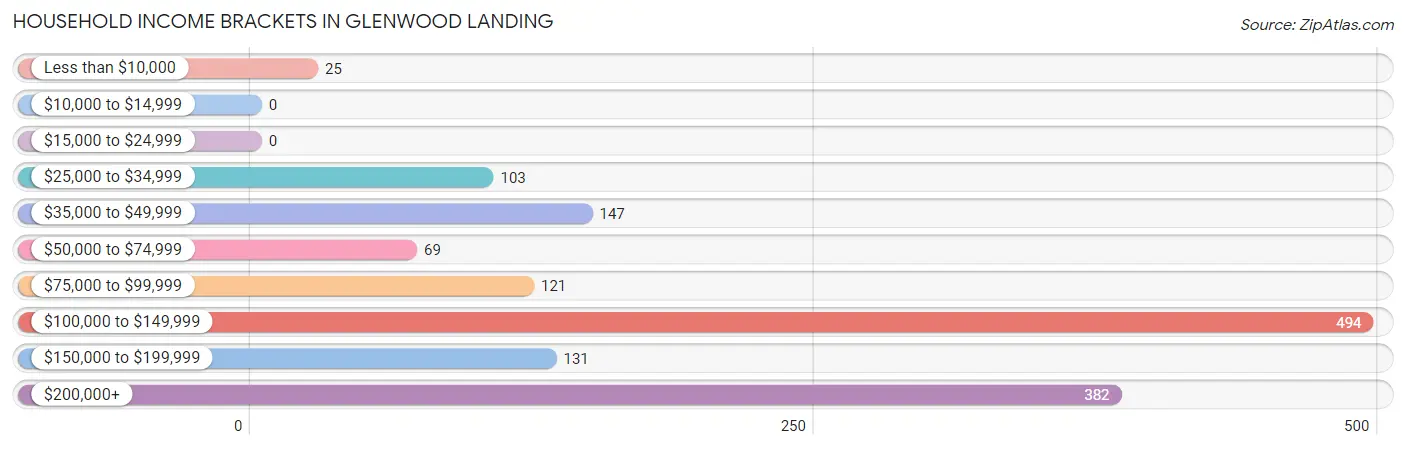
| Income Bracket | # Households | % Households |
| Less than $10,000 | 25 | 1.7% |
| $10,000 to $14,999 | 0 | 0.0% |
| $15,000 to $24,999 | 0 | 0.0% |
| $25,000 to $34,999 | 103 | 7.0% |
| $35,000 to $49,999 | 147 | 10.0% |
| $50,000 to $74,999 | 69 | 4.7% |
| $75,000 to $99,999 | 121 | 8.2% |
| $100,000 to $149,999 | 494 | 33.6% |
| $150,000 to $199,999 | 131 | 8.9% |
| $200,000+ | 382 | 26.0% |
Household Income by Householder Age in Glenwood Landing
The median household income in Glenwood Landing is $121,612, with the highest median household income of $181,944 found in the 45 to 64 years age bracket for the primary householder. A total of 564 households (38.3%) fall into this category.
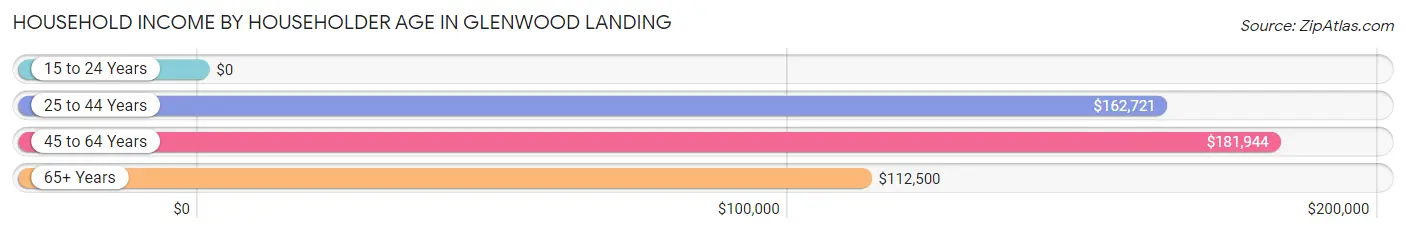
| Income Bracket | # Households | Median Income |
| 15 to 24 Years | 0 (0.0%) | $0 |
| 25 to 44 Years | 227 (15.4%) | $162,721 |
| 45 to 64 Years | 564 (38.3%) | $181,944 |
| 65+ Years | 680 (46.2%) | $112,500 |
| Total | 1,471 (100.0%) | $121,612 |
Poverty in Glenwood Landing
Income Below Poverty by Sex and Age in Glenwood Landing
With 5.6% poverty level for males and 1.2% for females among the residents of Glenwood Landing, 25 to 34 year old males and 75 year old and over females are the most vulnerable to poverty, with 40 males (38.1%) and 13 females (6.2%) in their respective age groups living below the poverty level.
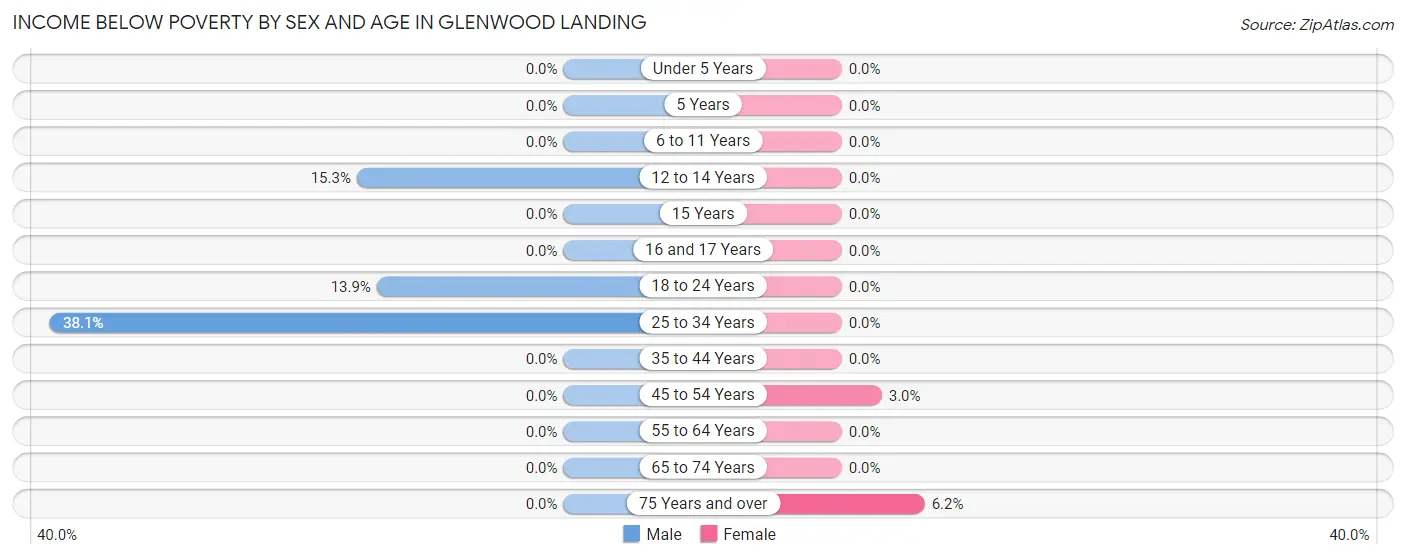
| Age Bracket | Male | Female |
| Under 5 Years | 0 (0.0%) | 0 (0.0%) |
| 5 Years | 0 (0.0%) | 0 (0.0%) |
| 6 to 11 Years | 0 (0.0%) | 0 (0.0%) |
| 12 to 14 Years | 25 (15.3%) | 0 (0.0%) |
| 15 Years | 0 (0.0%) | 0 (0.0%) |
| 16 and 17 Years | 0 (0.0%) | 0 (0.0%) |
| 18 to 24 Years | 28 (13.9%) | 0 (0.0%) |
| 25 to 34 Years | 40 (38.1%) | 0 (0.0%) |
| 35 to 44 Years | 0 (0.0%) | 0 (0.0%) |
| 45 to 54 Years | 0 (0.0%) | 12 (3.0%) |
| 55 to 64 Years | 0 (0.0%) | 0 (0.0%) |
| 65 to 74 Years | 0 (0.0%) | 0 (0.0%) |
| 75 Years and over | 0 (0.0%) | 13 (6.2%) |
| Total | 93 (5.6%) | 25 (1.2%) |
Income Above Poverty by Sex and Age in Glenwood Landing
According to the poverty statistics in Glenwood Landing, males aged under 5 years and females aged 5 years are the age groups that are most secure financially, with 100.0% of males and 100.0% of females in these age groups living above the poverty line.
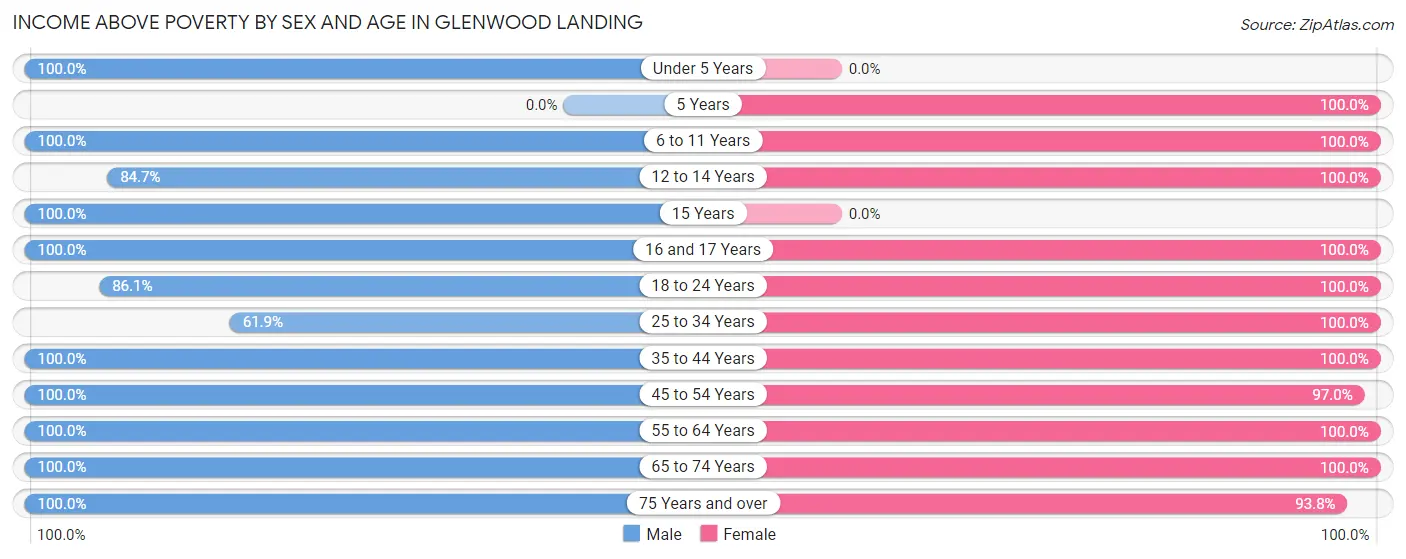
| Age Bracket | Male | Female |
| Under 5 Years | 22 (100.0%) | 0 (0.0%) |
| 5 Years | 0 (0.0%) | 25 (100.0%) |
| 6 to 11 Years | 132 (100.0%) | 129 (100.0%) |
| 12 to 14 Years | 138 (84.7%) | 183 (100.0%) |
| 15 Years | 52 (100.0%) | 0 (0.0%) |
| 16 and 17 Years | 25 (100.0%) | 60 (100.0%) |
| 18 to 24 Years | 174 (86.1%) | 131 (100.0%) |
| 25 to 34 Years | 65 (61.9%) | 68 (100.0%) |
| 35 to 44 Years | 156 (100.0%) | 190 (100.0%) |
| 45 to 54 Years | 227 (100.0%) | 392 (97.0%) |
| 55 to 64 Years | 322 (100.0%) | 171 (100.0%) |
| 65 to 74 Years | 197 (100.0%) | 456 (100.0%) |
| 75 Years and over | 63 (100.0%) | 198 (93.8%) |
| Total | 1,573 (94.4%) | 2,003 (98.8%) |
Income Below Poverty Among Married-Couple Families in Glenwood Landing
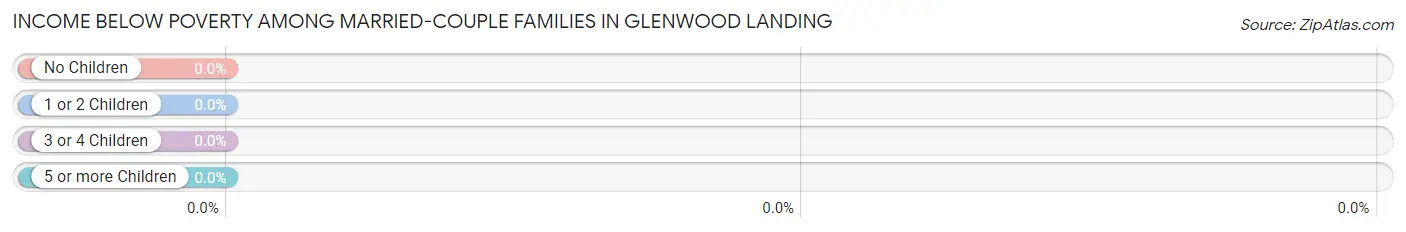
| Children | Above Poverty | Below Poverty |
| No Children | 433 (100.0%) | 0 (0.0%) |
| 1 or 2 Children | 268 (100.0%) | 0 (0.0%) |
| 3 or 4 Children | 54 (100.0%) | 0 (0.0%) |
| 5 or more Children | 0 (0.0%) | 0 (0.0%) |
| Total | 755 (100.0%) | 0 (0.0%) |
Income Below Poverty Among Single-Parent Households in Glenwood Landing
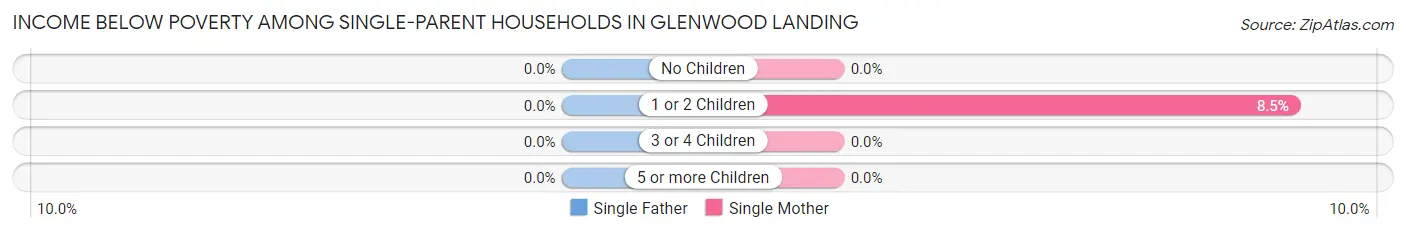
| Children | Single Father | Single Mother |
| No Children | 0 (0.0%) | 0 (0.0%) |
| 1 or 2 Children | 0 (0.0%) | 12 (8.5%) |
| 3 or 4 Children | 0 (0.0%) | 0 (0.0%) |
| 5 or more Children | 0 (0.0%) | 0 (0.0%) |
| Total | 0 (0.0%) | 12 (6.0%) |
Income Below Poverty Among Married-Couple vs Single-Parent Households in Glenwood Landing
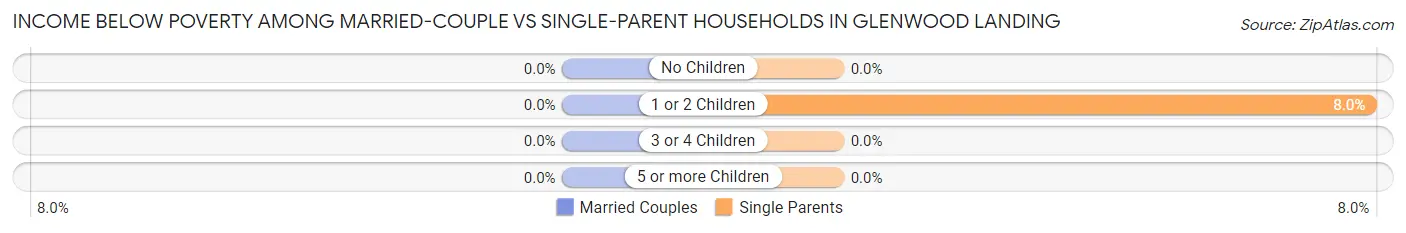
| Children | Married-Couple Families | Single-Parent Households |
| No Children | 0 (0.0%) | 0 (0.0%) |
| 1 or 2 Children | 0 (0.0%) | 12 (8.0%) |
| 3 or 4 Children | 0 (0.0%) | 0 (0.0%) |
| 5 or more Children | 0 (0.0%) | 0 (0.0%) |
| Total | 0 (0.0%) | 12 (5.3%) |
Race in Glenwood Landing
The most populous races in Glenwood Landing are White / Caucasian (3,404 | 92.1%), Hispanic or Latino (246 | 6.7%), and Asian (242 | 6.6%).
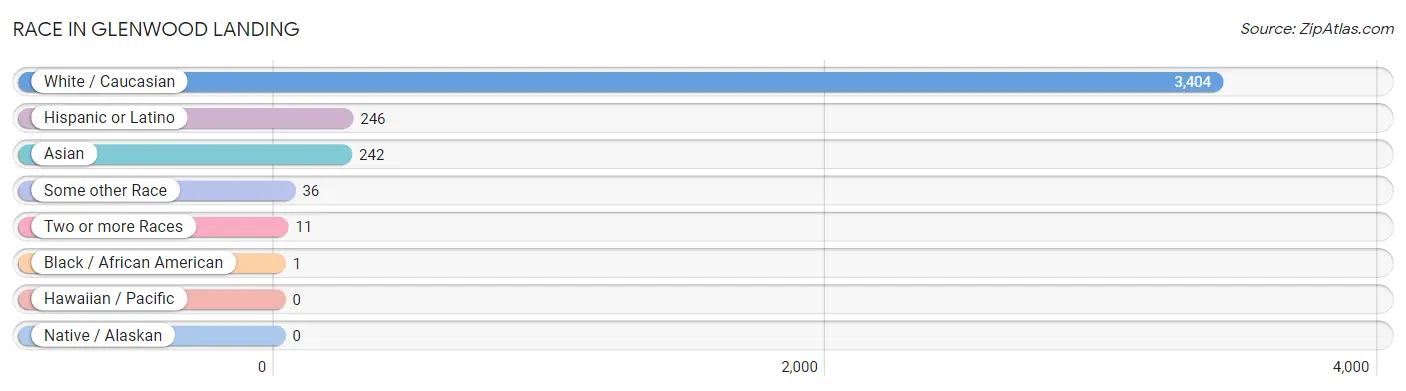
| Race | # Population | % Population |
| Asian | 242 | 6.6% |
| Black / African American | 1 | 0.0% |
| Hawaiian / Pacific | 0 | 0.0% |
| Hispanic or Latino | 246 | 6.7% |
| Native / Alaskan | 0 | 0.0% |
| White / Caucasian | 3,404 | 92.1% |
| Two or more Races | 11 | 0.3% |
| Some other Race | 36 | 1.0% |
| Total | 3,694 | 100.0% |
Ancestry in Glenwood Landing
The most populous ancestries reported in Glenwood Landing are Italian (774 | 20.9%), Irish (770 | 20.8%), German (381 | 10.3%), Polish (273 | 7.4%), and American (232 | 6.3%), together accounting for 65.8% of all Glenwood Landing residents.
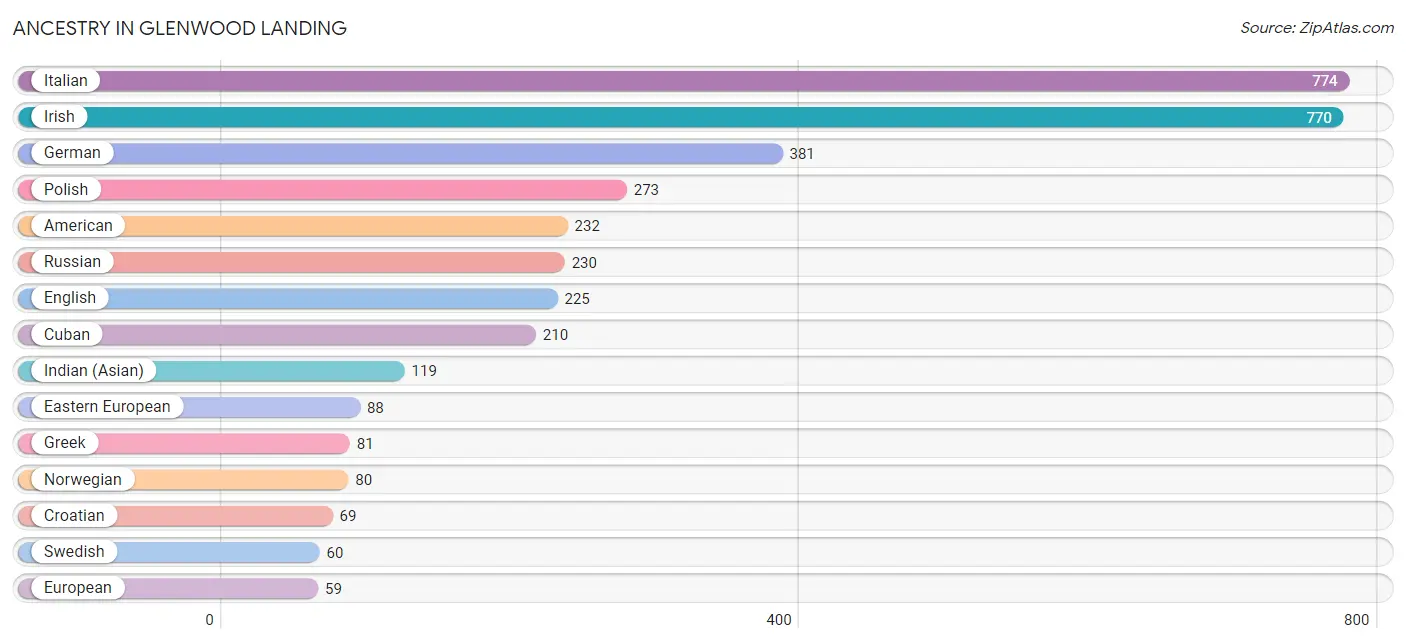
| Ancestry | # Population | % Population |
| American | 232 | 6.3% |
| Arab | 7 | 0.2% |
| Austrian | 8 | 0.2% |
| Brazilian | 35 | 0.9% |
| Burmese | 12 | 0.3% |
| Chilean | 10 | 0.3% |
| Colombian | 26 | 0.7% |
| Croatian | 69 | 1.9% |
| Cuban | 210 | 5.7% |
| Czech | 17 | 0.5% |
| Dutch | 24 | 0.6% |
| Eastern European | 88 | 2.4% |
| English | 225 | 6.1% |
| European | 59 | 1.6% |
| French | 17 | 0.5% |
| German | 381 | 10.3% |
| Greek | 81 | 2.2% |
| Guyanese | 26 | 0.7% |
| Hungarian | 51 | 1.4% |
| Indian (Asian) | 119 | 3.2% |
| Irish | 770 | 20.8% |
| Italian | 774 | 20.9% |
| Lebanese | 7 | 0.2% |
| Norwegian | 80 | 2.2% |
| Polish | 273 | 7.4% |
| Romanian | 22 | 0.6% |
| Russian | 230 | 6.2% |
| Scottish | 18 | 0.5% |
| South American | 36 | 1.0% |
| Swedish | 60 | 1.6% |
| Swiss | 28 | 0.8% |
| Thai | 7 | 0.2% |
| Ukrainian | 11 | 0.3% |
| Yugoslavian | 22 | 0.6% | View All 34 Rows |
Immigrants in Glenwood Landing
The most numerous immigrant groups reported in Glenwood Landing came from Europe (106 | 2.9%), Asia (100 | 2.7%), Eastern Asia (69 | 1.9%), Eastern Europe (69 | 1.9%), and Hungary (47 | 1.3%), together accounting for 10.6% of all Glenwood Landing residents.
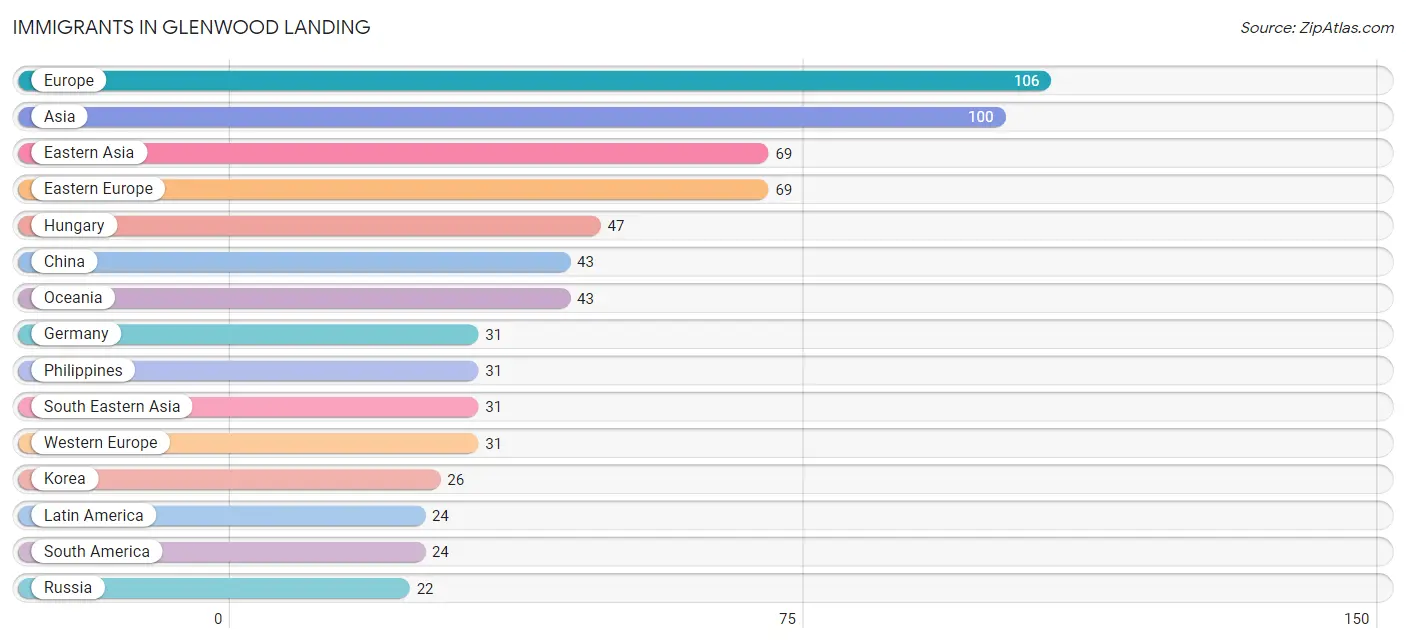
| Immigration Origin | # Population | % Population |
| Asia | 100 | 2.7% |
| Canada | 16 | 0.4% |
| Chile | 10 | 0.3% |
| China | 43 | 1.2% |
| Eastern Asia | 69 | 1.9% |
| Eastern Europe | 69 | 1.9% |
| Europe | 106 | 2.9% |
| Germany | 31 | 0.8% |
| Guyana | 14 | 0.4% |
| Hungary | 47 | 1.3% |
| Korea | 26 | 0.7% |
| Latin America | 24 | 0.6% |
| Northern Europe | 6 | 0.2% |
| Oceania | 43 | 1.2% |
| Philippines | 31 | 0.8% |
| Russia | 22 | 0.6% |
| South America | 24 | 0.6% |
| South Eastern Asia | 31 | 0.8% |
| Taiwan | 13 | 0.4% |
| Western Europe | 31 | 0.8% | View All 20 Rows |
Sex and Age in Glenwood Landing
Sex and Age in Glenwood Landing
The most populous age groups in Glenwood Landing are 10 to 14 Years (231 | 13.9%) for men and 65 to 69 Years (426 | 21.0%) for women.
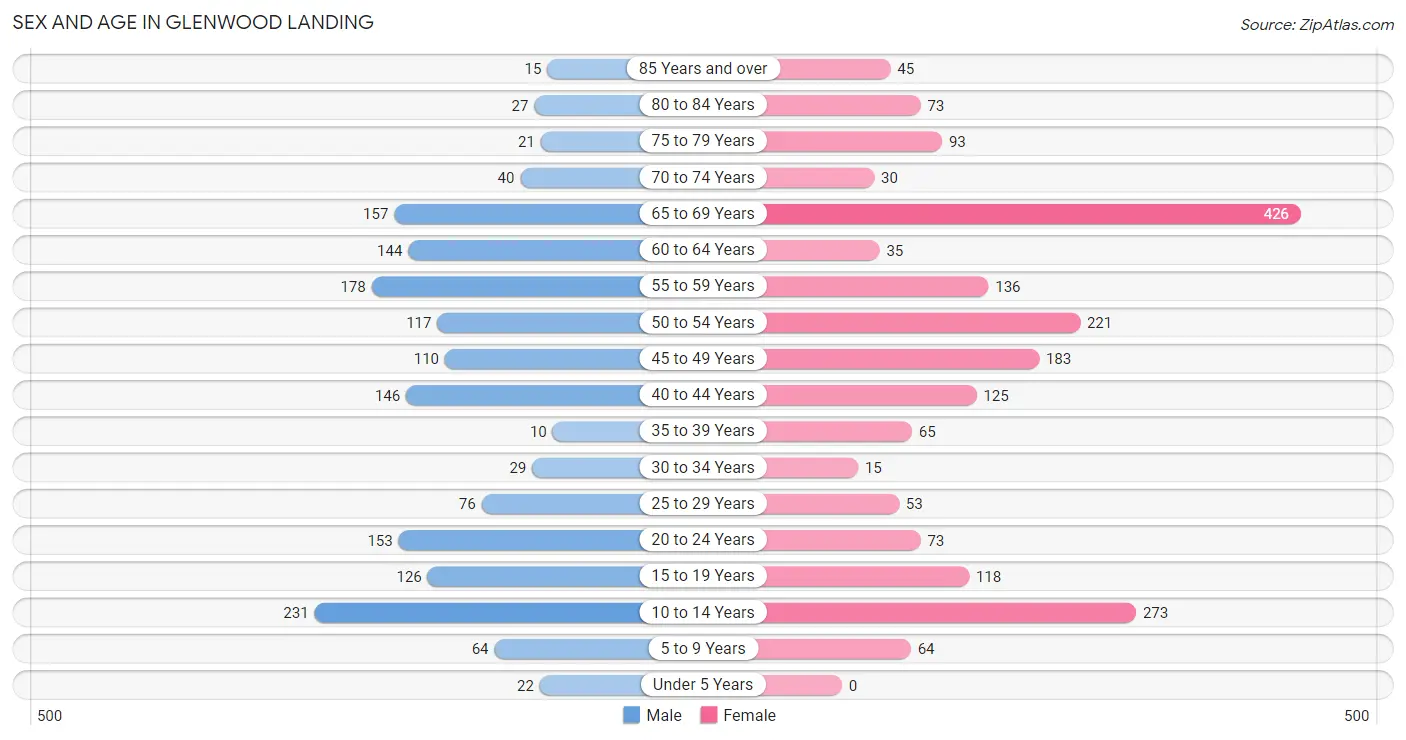
| Age Bracket | Male | Female |
| Under 5 Years | 22 (1.3%) | 0 (0.0%) |
| 5 to 9 Years | 64 (3.8%) | 64 (3.2%) |
| 10 to 14 Years | 231 (13.9%) | 273 (13.5%) |
| 15 to 19 Years | 126 (7.6%) | 118 (5.8%) |
| 20 to 24 Years | 153 (9.2%) | 73 (3.6%) |
| 25 to 29 Years | 76 (4.6%) | 53 (2.6%) |
| 30 to 34 Years | 29 (1.7%) | 15 (0.7%) |
| 35 to 39 Years | 10 (0.6%) | 65 (3.2%) |
| 40 to 44 Years | 146 (8.8%) | 125 (6.2%) |
| 45 to 49 Years | 110 (6.6%) | 183 (9.0%) |
| 50 to 54 Years | 117 (7.0%) | 221 (10.9%) |
| 55 to 59 Years | 178 (10.7%) | 136 (6.7%) |
| 60 to 64 Years | 144 (8.6%) | 35 (1.7%) |
| 65 to 69 Years | 157 (9.4%) | 426 (21.0%) |
| 70 to 74 Years | 40 (2.4%) | 30 (1.5%) |
| 75 to 79 Years | 21 (1.3%) | 93 (4.6%) |
| 80 to 84 Years | 27 (1.6%) | 73 (3.6%) |
| 85 Years and over | 15 (0.9%) | 45 (2.2%) |
| Total | 1,666 (100.0%) | 2,028 (100.0%) |
Families and Households in Glenwood Landing
Median Family Size in Glenwood Landing
The median family size in Glenwood Landing is 3.12 persons per family, with married-couple families (755 | 76.9%) accounting for the largest median family size of 3.25 persons per family. On the other hand, single female/mother families (199 | 20.3%) represent the smallest median family size with 2.64 persons per family.
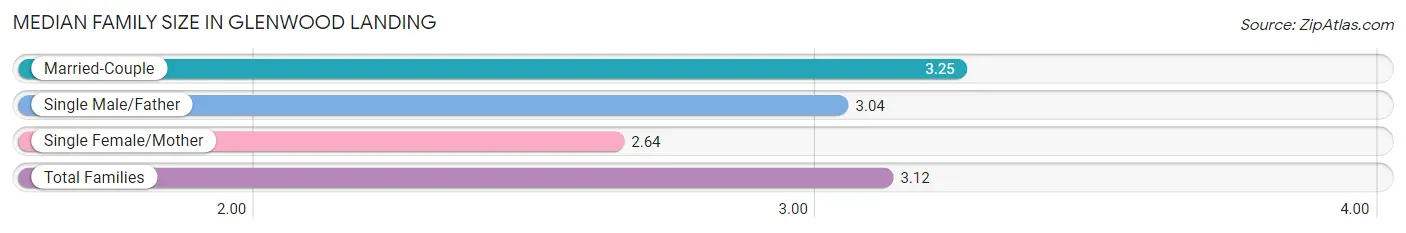
| Family Type | # Families | Family Size |
| Married-Couple | 755 (76.9%) | 3.25 |
| Single Male/Father | 28 (2.9%) | 3.04 |
| Single Female/Mother | 199 (20.3%) | 2.64 |
| Total Families | 982 (100.0%) | 3.12 |
Median Household Size in Glenwood Landing
The median household size in Glenwood Landing is 2.51 persons per household, with married-couple households (755 | 51.3%) accounting for the largest median household size of 3.27 persons per household. non-family households (489 | 33.2%) represent the smallest median household size with 1.14 persons per household.
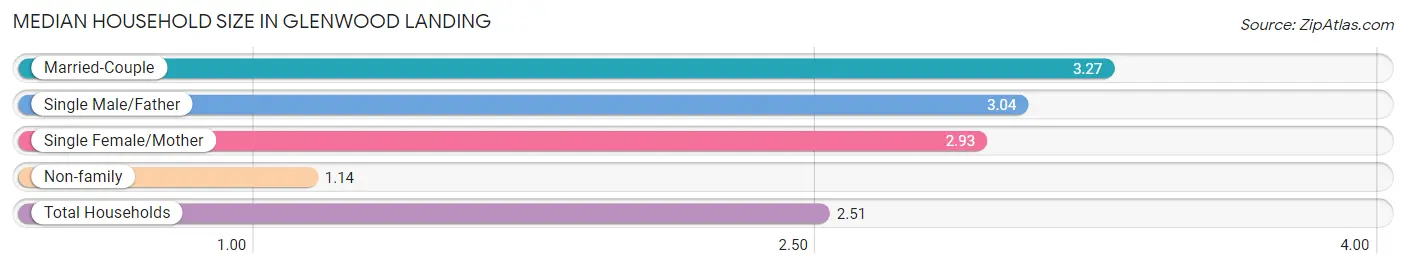
| Household Type | # Households | Household Size |
| Married-Couple | 755 (51.3%) | 3.27 |
| Single Male/Father | 28 (1.9%) | 3.04 |
| Single Female/Mother | 199 (13.5%) | 2.93 |
| Non-family | 489 (33.2%) | 1.14 |
| Total Households | 1,471 (100.0%) | 2.51 |
Household Size by Marriage Status in Glenwood Landing
Out of a total of 1,471 households in Glenwood Landing, 982 (66.8%) are family households, while 489 (33.2%) are nonfamily households. The most numerous type of family households are 2-person households, comprising 401, and the most common type of nonfamily households are 1-person households, comprising 471.
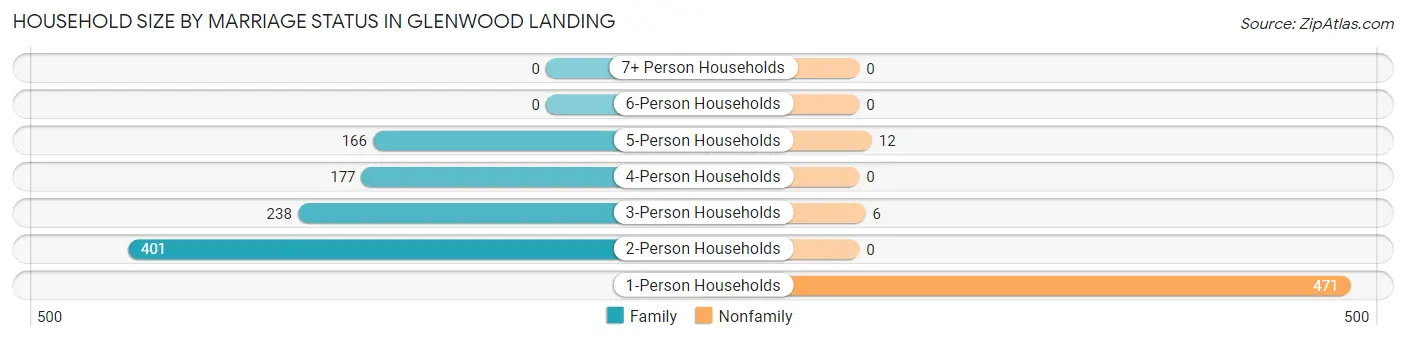
| Household Size | Family Households | Nonfamily Households |
| 1-Person Households | - | 471 (32.0%) |
| 2-Person Households | 401 (27.3%) | 0 (0.0%) |
| 3-Person Households | 238 (16.2%) | 6 (0.4%) |
| 4-Person Households | 177 (12.0%) | 0 (0.0%) |
| 5-Person Households | 166 (11.3%) | 12 (0.8%) |
| 6-Person Households | 0 (0.0%) | 0 (0.0%) |
| 7+ Person Households | 0 (0.0%) | 0 (0.0%) |
| Total | 982 (66.8%) | 489 (33.2%) |
Female Fertility in Glenwood Landing
Fertility by Age in Glenwood Landing
| Age Bracket | Women with Births | Births / 1,000 Women |
| 15 to 19 years | 0 (0.0%) | 0.0 |
| 20 to 34 years | 0 (0.0%) | 0.0 |
| 35 to 50 years | 0 (0.0%) | 0.0 |
| Total | 0 (0.0%) | 0.0 |
Fertility by Age by Marriage Status in Glenwood Landing
| Age Bracket | Married | Unmarried |
| 15 to 19 years | 0 (0.0%) | 0 (0.0%) |
| 20 to 34 years | 0 (0.0%) | 0 (0.0%) |
| 35 to 50 years | 0 (0.0%) | 0 (0.0%) |
| Total | 0 (0.0%) | 0 (0.0%) |
Fertility by Education in Glenwood Landing
| Educational Attainment | Women with Births | Births / 1,000 Women |
| Less than High School | 0 (0.0%) | 0.0 |
| High School Diploma | 0 (0.0%) | 0.0 |
| College or Associate's Degree | 0 (0.0%) | 0.0 |
| Bachelor's Degree | 0 (0.0%) | 0.0 |
| Graduate Degree | 0 (0.0%) | 0.0 |
| Total | 0 (0.0%) | 0.0 |
Fertility by Education by Marriage Status in Glenwood Landing
| Educational Attainment | Married | Unmarried |
| Less than High School | 0 (0.0%) | 0 (0.0%) |
| High School Diploma | 0 (0.0%) | 0 (0.0%) |
| College or Associate's Degree | 0 (0.0%) | 0 (0.0%) |
| Bachelor's Degree | 0 (0.0%) | 0 (0.0%) |
| Graduate Degree | 0 (0.0%) | 0 (0.0%) |
| Total | 0 (0.0%) | 0 (0.0%) |
Employment Characteristics in Glenwood Landing
Employment by Class of Employer in Glenwood Landing
Among the 1,507 employed individuals in Glenwood Landing, private company employees (695 | 46.1%), local government employees (295 | 19.6%), and self-employed (incorporated) (184 | 12.2%) make up the most common classes of employment.
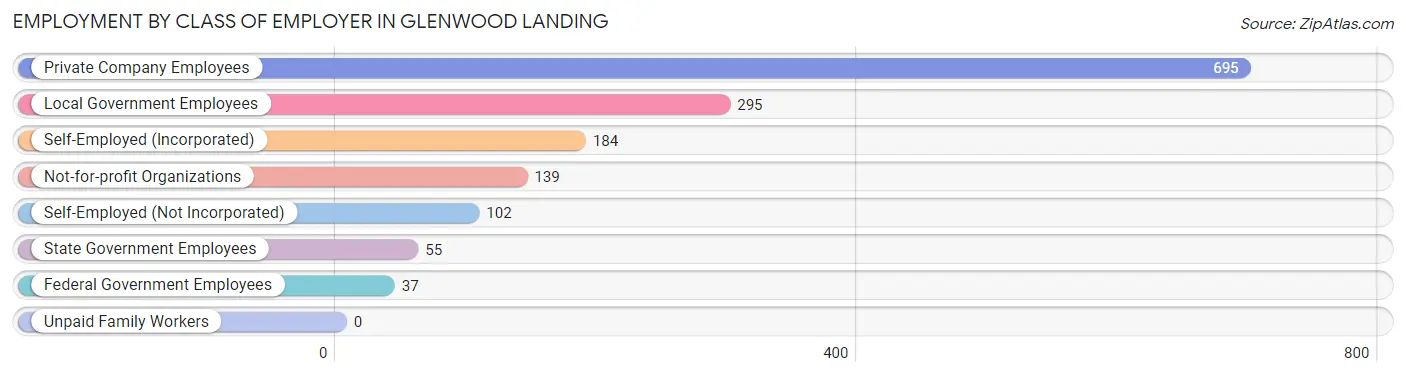
| Employer Class | # Employees | % Employees |
| Private Company Employees | 695 | 46.1% |
| Self-Employed (Incorporated) | 184 | 12.2% |
| Self-Employed (Not Incorporated) | 102 | 6.8% |
| Not-for-profit Organizations | 139 | 9.2% |
| Local Government Employees | 295 | 19.6% |
| State Government Employees | 55 | 3.6% |
| Federal Government Employees | 37 | 2.5% |
| Unpaid Family Workers | 0 | 0.0% |
| Total | 1,507 | 100.0% |
Employment Status by Age in Glenwood Landing
According to the labor force statistics for Glenwood Landing, out of the total population over 16 years of age (2,988), 54.2% or 1,619 individuals are in the labor force, with 3.2% or 52 of them unemployed. The age group with the highest labor force participation rate is 30 to 34 years, with 100.0% or 44 individuals in the labor force. Within the labor force, the 20 to 24 years age range has the highest percentage of unemployed individuals, with 23.0% or 26 of them being unemployed.
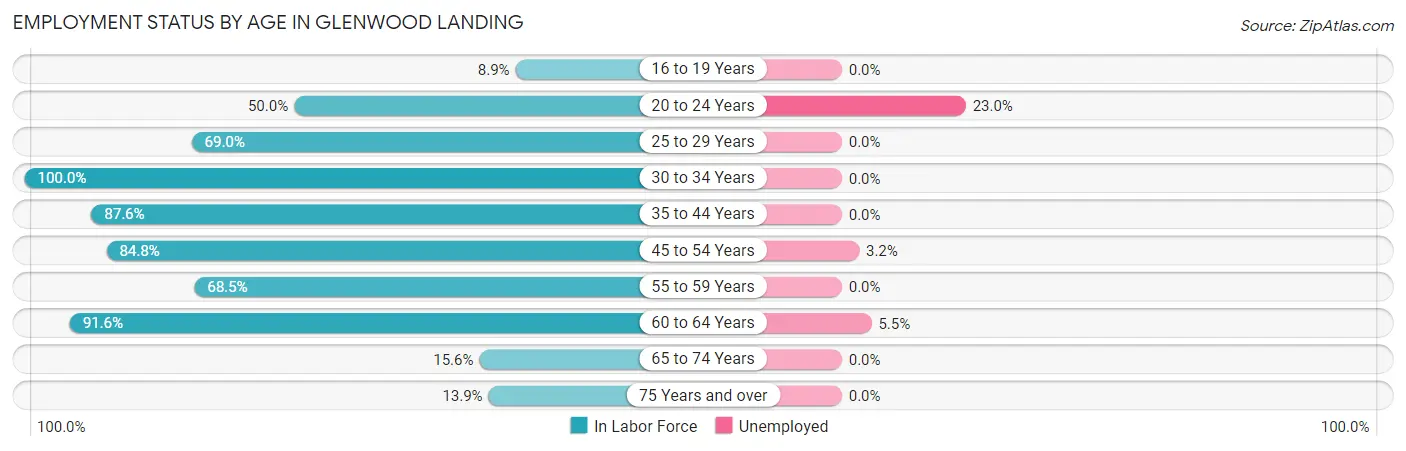
| Age Bracket | In Labor Force | Unemployed |
| 16 to 19 Years | 17 (8.9%) | 0 (0.0%) |
| 20 to 24 Years | 113 (50.0%) | 26 (23.0%) |
| 25 to 29 Years | 89 (69.0%) | 0 (0.0%) |
| 30 to 34 Years | 44 (100.0%) | 0 (0.0%) |
| 35 to 44 Years | 303 (87.6%) | 0 (0.0%) |
| 45 to 54 Years | 535 (84.8%) | 17 (3.2%) |
| 55 to 59 Years | 215 (68.5%) | 0 (0.0%) |
| 60 to 64 Years | 164 (91.6%) | 9 (5.5%) |
| 65 to 74 Years | 102 (15.6%) | 0 (0.0%) |
| 75 Years and over | 38 (13.9%) | 0 (0.0%) |
| Total | 1,619 (54.2%) | 52 (3.2%) |
Employment Status by Educational Attainment in Glenwood Landing
According to labor force statistics for Glenwood Landing, 82.2% of individuals (1,351) out of the total population between 25 and 64 years of age (1,643) are in the labor force, with 1.9% or 26 of them being unemployed. The group with the highest labor force participation rate are those with the educational attainment of bachelor's degree or higher, with 88.3% or 889 individuals in the labor force. Within the labor force, individuals with bachelor's degree or higher education have the highest percentage of unemployment, with 2.9% or 26 of them being unemployed.
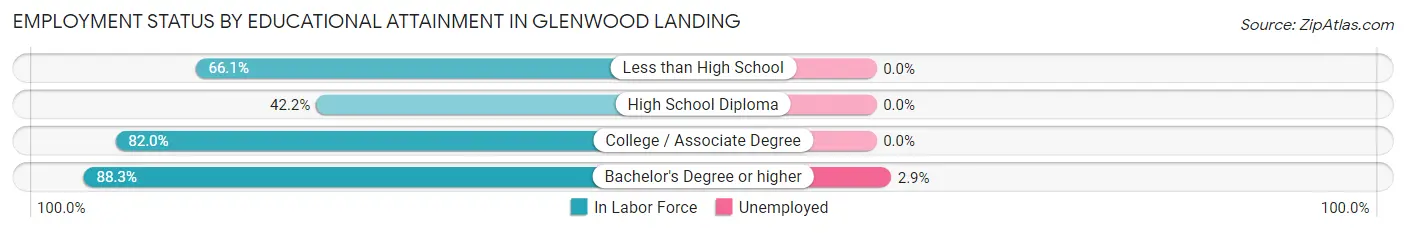
| Educational Attainment | In Labor Force | Unemployed |
| Less than High School | 39 (66.1%) | 0 (0.0%) |
| High School Diploma | 54 (42.2%) | 0 (0.0%) |
| College / Associate Degree | 368 (82.0%) | 0 (0.0%) |
| Bachelor's Degree or higher | 889 (88.3%) | 29 (2.9%) |
| Total | 1,351 (82.2%) | 31 (1.9%) |
Employment Occupations by Sex in Glenwood Landing
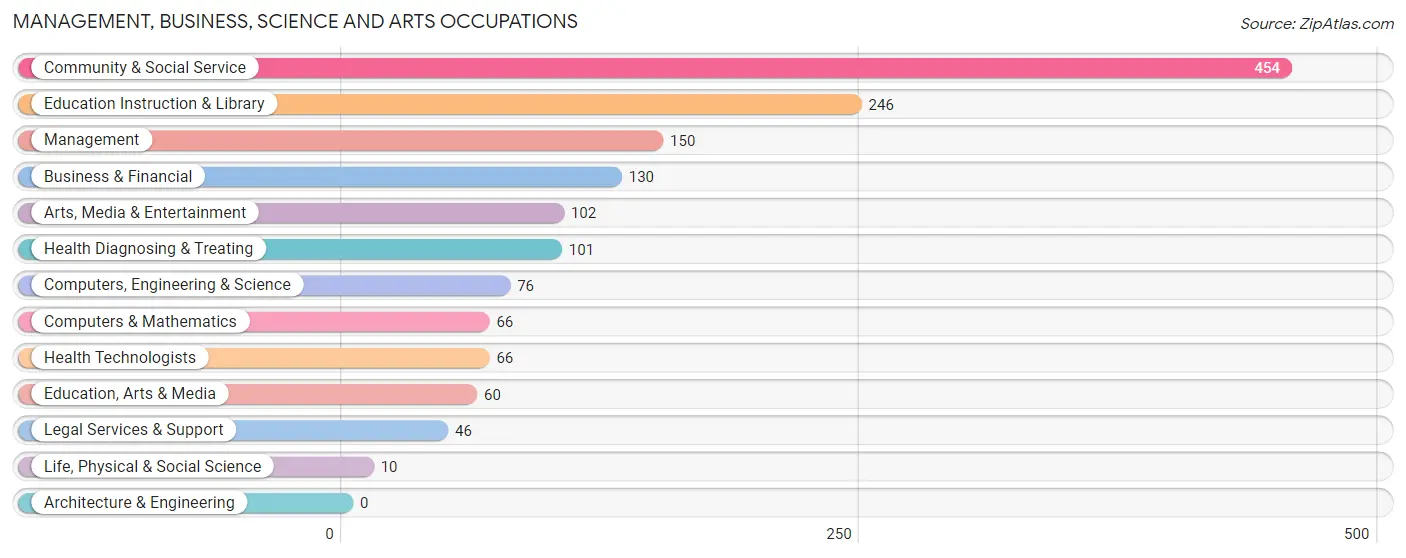
Management, Business, Science and Arts Occupations
The most common Management, Business, Science and Arts occupations in Glenwood Landing are Community & Social Service (454 | 28.9%), Education Instruction & Library (246 | 15.7%), Management (150 | 9.6%), Business & Financial (130 | 8.3%), and Arts, Media & Entertainment (102 | 6.5%).
Management, Business, Science and Arts Occupations by Sex
Within the Management, Business, Science and Arts occupations in Glenwood Landing, the most male-oriented occupations are Computers & Mathematics (100.0%), Computers, Engineering & Science (86.8%), and Arts, Media & Entertainment (85.3%), while the most female-oriented occupations are Life, Physical & Social Science (100.0%), Education Instruction & Library (75.2%), and Business & Financial (56.9%).
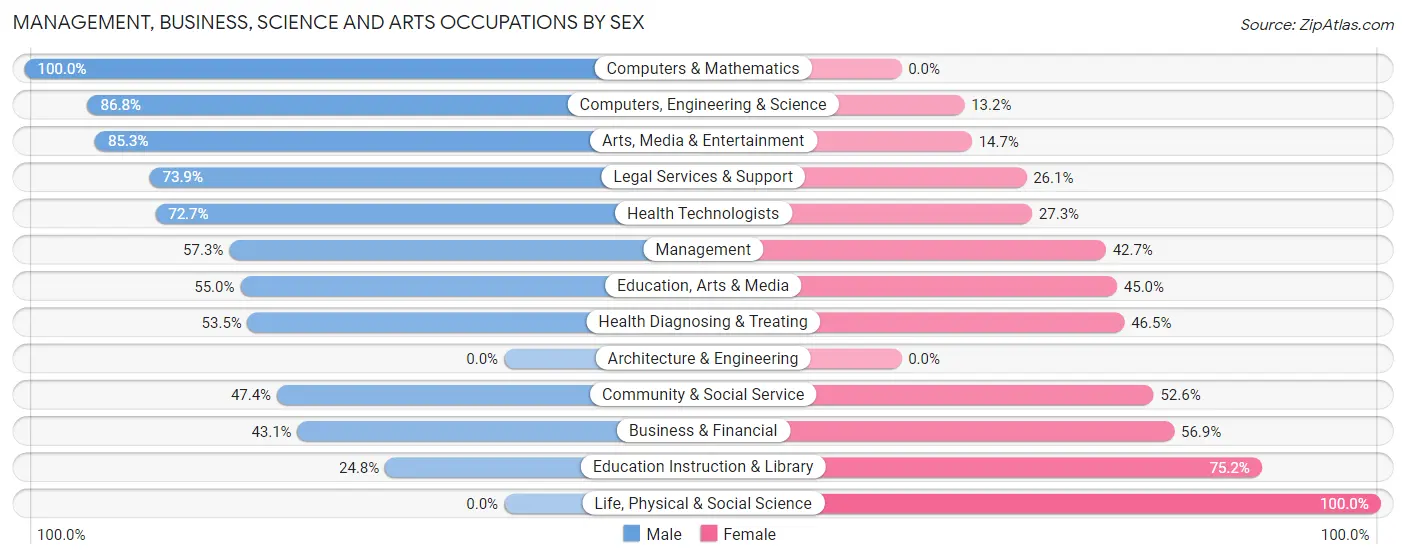
| Occupation | Male | Female |
| Management | 86 (57.3%) | 64 (42.7%) |
| Business & Financial | 56 (43.1%) | 74 (56.9%) |
| Computers, Engineering & Science | 66 (86.8%) | 10 (13.2%) |
| Computers & Mathematics | 66 (100.0%) | 0 (0.0%) |
| Architecture & Engineering | 0 (0.0%) | 0 (0.0%) |
| Life, Physical & Social Science | 0 (0.0%) | 10 (100.0%) |
| Community & Social Service | 215 (47.4%) | 239 (52.6%) |
| Education, Arts & Media | 33 (55.0%) | 27 (45.0%) |
| Legal Services & Support | 34 (73.9%) | 12 (26.1%) |
| Education Instruction & Library | 61 (24.8%) | 185 (75.2%) |
| Arts, Media & Entertainment | 87 (85.3%) | 15 (14.7%) |
| Health Diagnosing & Treating | 54 (53.5%) | 47 (46.5%) |
| Health Technologists | 48 (72.7%) | 18 (27.3%) |
| Total (Category) | 477 (52.4%) | 434 (47.6%) |
| Total (Overall) | 854 (54.5%) | 714 (45.5%) |
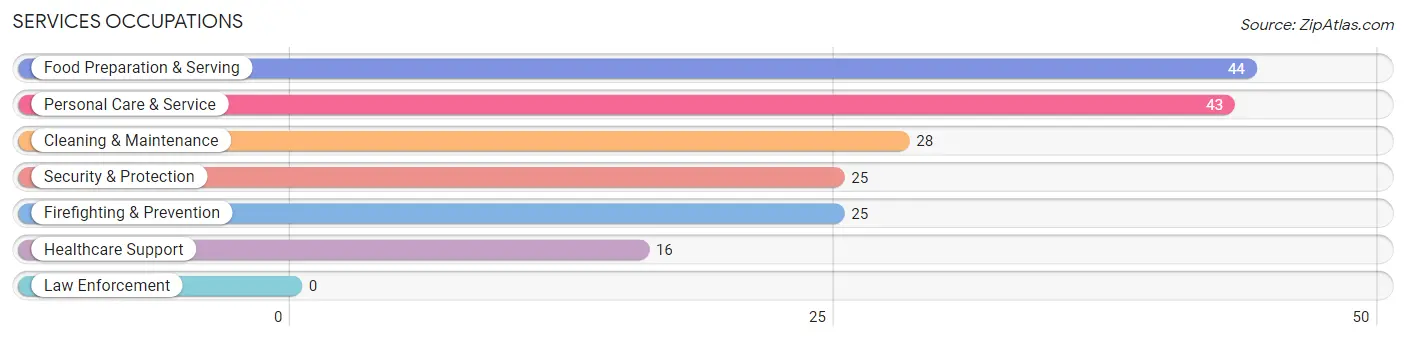
Services Occupations
The most common Services occupations in Glenwood Landing are Food Preparation & Serving (44 | 2.8%), Personal Care & Service (43 | 2.7%), Cleaning & Maintenance (28 | 1.8%), Security & Protection (25 | 1.6%), and Firefighting & Prevention (25 | 1.6%).
Services Occupations by Sex
Within the Services occupations in Glenwood Landing, the most male-oriented occupations are Security & Protection (100.0%), Firefighting & Prevention (100.0%), and Cleaning & Maintenance (100.0%), while the most female-oriented occupations are Healthcare Support (100.0%), Food Preparation & Serving (100.0%), and Personal Care & Service (100.0%).
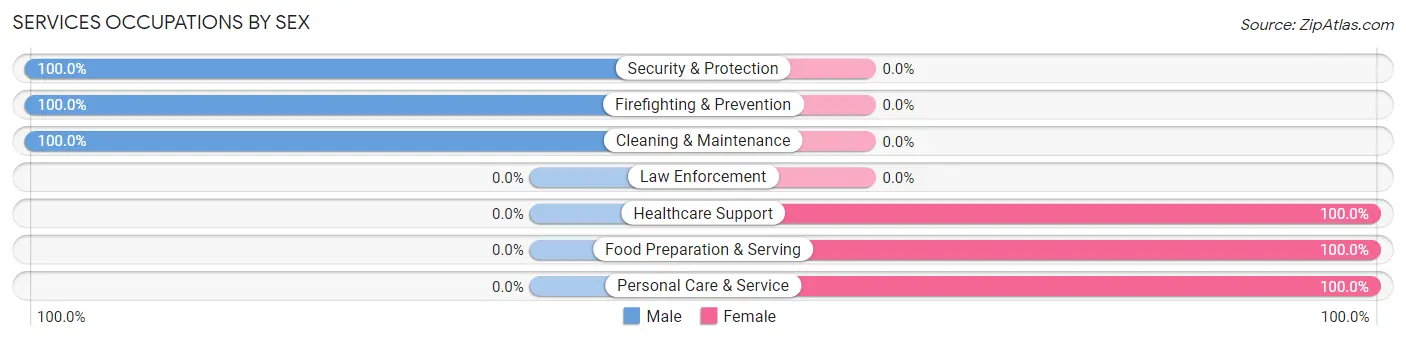
| Occupation | Male | Female |
| Healthcare Support | 0 (0.0%) | 16 (100.0%) |
| Security & Protection | 25 (100.0%) | 0 (0.0%) |
| Firefighting & Prevention | 25 (100.0%) | 0 (0.0%) |
| Law Enforcement | 0 (0.0%) | 0 (0.0%) |
| Food Preparation & Serving | 0 (0.0%) | 44 (100.0%) |
| Cleaning & Maintenance | 28 (100.0%) | 0 (0.0%) |
| Personal Care & Service | 0 (0.0%) | 43 (100.0%) |
| Total (Category) | 53 (34.0%) | 103 (66.0%) |
| Total (Overall) | 854 (54.5%) | 714 (45.5%) |
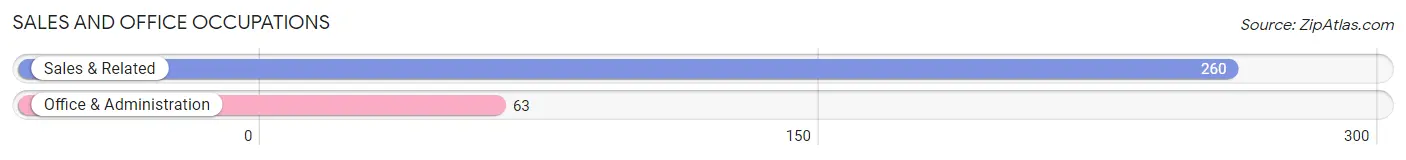
Sales and Office Occupations
The most common Sales and Office occupations in Glenwood Landing are Sales & Related (260 | 16.6%), and Office & Administration (63 | 4.0%).
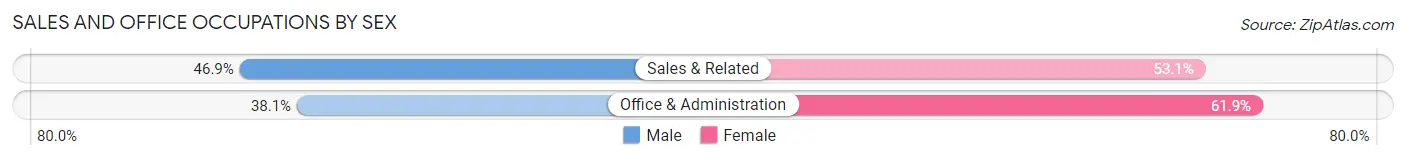
Sales and Office Occupations by Sex
| Occupation | Male | Female |
| Sales & Related | 122 (46.9%) | 138 (53.1%) |
| Office & Administration | 24 (38.1%) | 39 (61.9%) |
| Total (Category) | 146 (45.2%) | 177 (54.8%) |
| Total (Overall) | 854 (54.5%) | 714 (45.5%) |
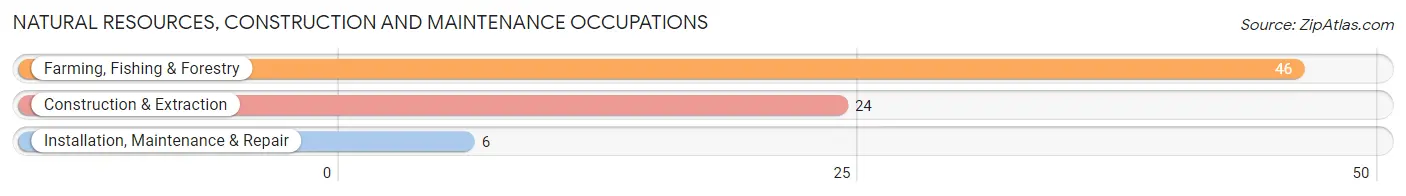
Natural Resources, Construction and Maintenance Occupations
The most common Natural Resources, Construction and Maintenance occupations in Glenwood Landing are Farming, Fishing & Forestry (46 | 2.9%), Construction & Extraction (24 | 1.5%), and Installation, Maintenance & Repair (6 | 0.4%).
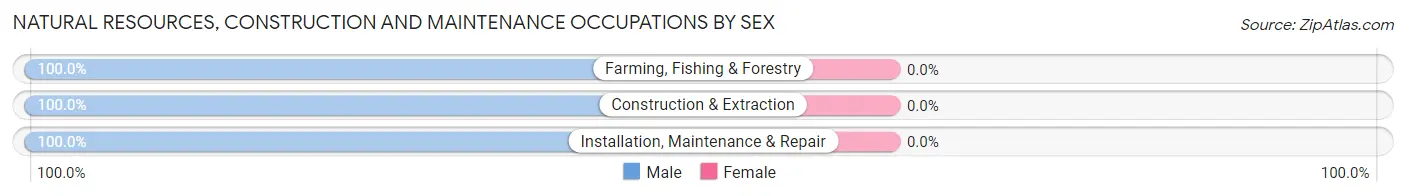
Natural Resources, Construction and Maintenance Occupations by Sex
| Occupation | Male | Female |
| Farming, Fishing & Forestry | 46 (100.0%) | 0 (0.0%) |
| Construction & Extraction | 24 (100.0%) | 0 (0.0%) |
| Installation, Maintenance & Repair | 6 (100.0%) | 0 (0.0%) |
| Total (Category) | 76 (100.0%) | 0 (0.0%) |
| Total (Overall) | 854 (54.5%) | 714 (45.5%) |
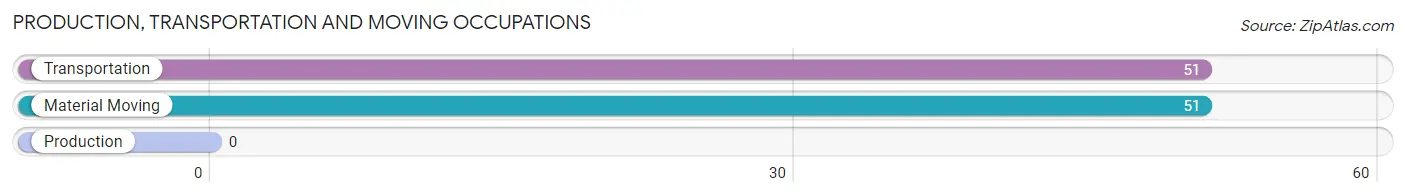
Production, Transportation and Moving Occupations
The most common Production, Transportation and Moving occupations in Glenwood Landing are Transportation (51 | 3.3%), and Material Moving (51 | 3.3%).
Production, Transportation and Moving Occupations by Sex
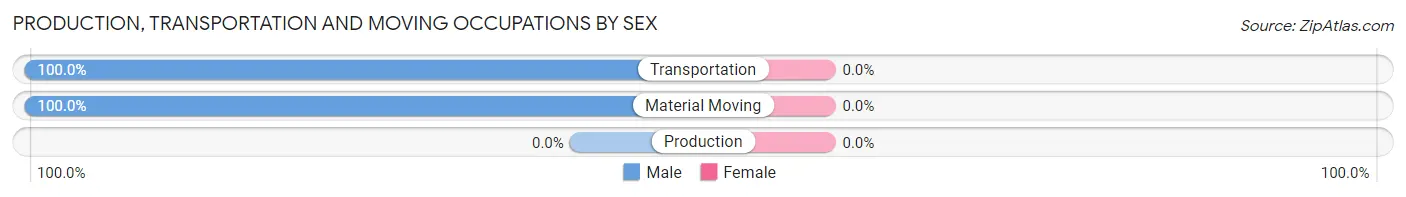
| Occupation | Male | Female |
| Production | 0 (0.0%) | 0 (0.0%) |
| Transportation | 51 (100.0%) | 0 (0.0%) |
| Material Moving | 51 (100.0%) | 0 (0.0%) |
| Total (Category) | 102 (100.0%) | 0 (0.0%) |
| Total (Overall) | 854 (54.5%) | 714 (45.5%) |
Employment Industries by Sex in Glenwood Landing
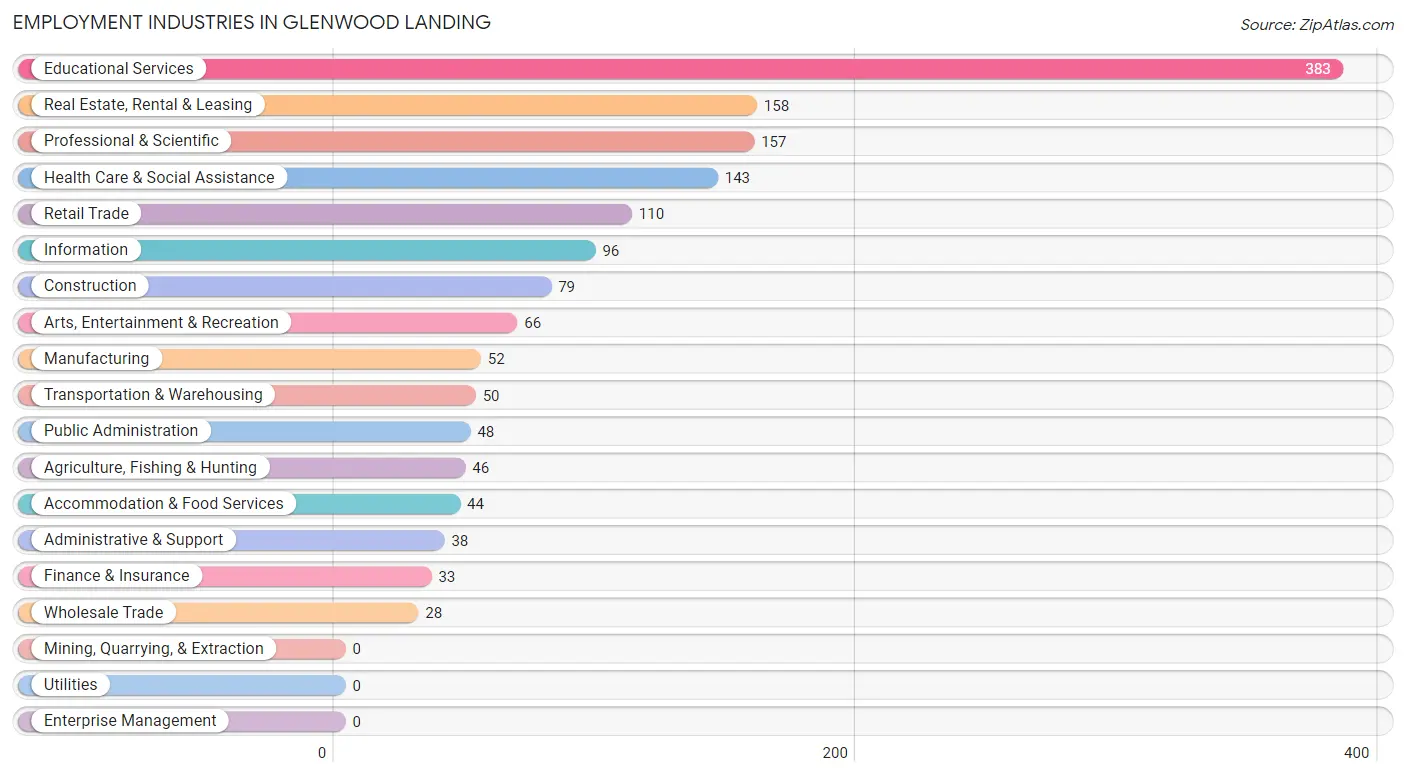
Employment Industries in Glenwood Landing
The major employment industries in Glenwood Landing include Educational Services (383 | 24.4%), Real Estate, Rental & Leasing (158 | 10.1%), Professional & Scientific (157 | 10.0%), Health Care & Social Assistance (143 | 9.1%), and Retail Trade (110 | 7.0%).
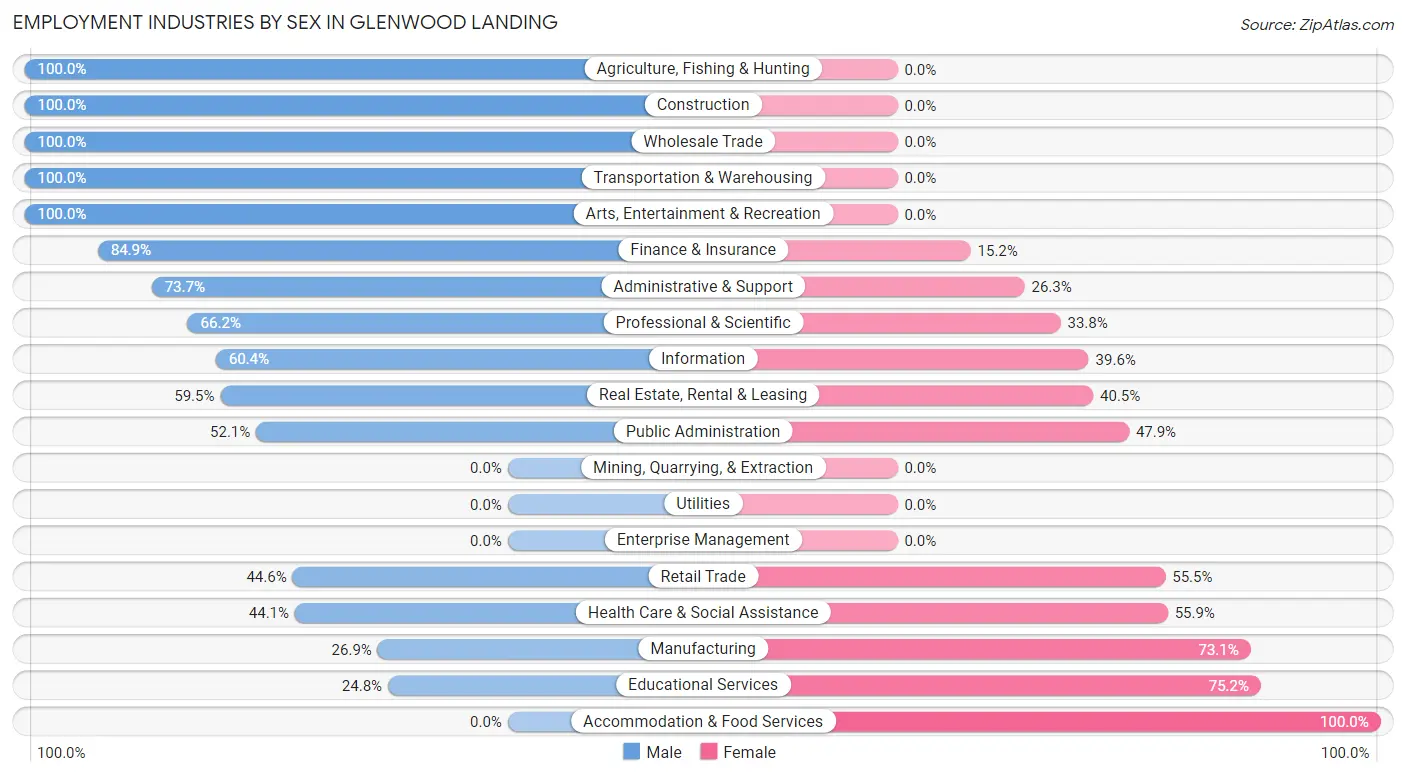
Employment Industries by Sex in Glenwood Landing
The Glenwood Landing industries that see more men than women are Agriculture, Fishing & Hunting (100.0%), Construction (100.0%), and Wholesale Trade (100.0%), whereas the industries that tend to have a higher number of women are Accommodation & Food Services (100.0%), Educational Services (75.2%), and Manufacturing (73.1%).
| Industry | Male | Female |
| Agriculture, Fishing & Hunting | 46 (100.0%) | 0 (0.0%) |
| Mining, Quarrying, & Extraction | 0 (0.0%) | 0 (0.0%) |
| Construction | 79 (100.0%) | 0 (0.0%) |
| Manufacturing | 14 (26.9%) | 38 (73.1%) |
| Wholesale Trade | 28 (100.0%) | 0 (0.0%) |
| Retail Trade | 49 (44.6%) | 61 (55.4%) |
| Transportation & Warehousing | 50 (100.0%) | 0 (0.0%) |
| Utilities | 0 (0.0%) | 0 (0.0%) |
| Information | 58 (60.4%) | 38 (39.6%) |
| Finance & Insurance | 28 (84.9%) | 5 (15.1%) |
| Real Estate, Rental & Leasing | 94 (59.5%) | 64 (40.5%) |
| Professional & Scientific | 104 (66.2%) | 53 (33.8%) |
| Enterprise Management | 0 (0.0%) | 0 (0.0%) |
| Administrative & Support | 28 (73.7%) | 10 (26.3%) |
| Educational Services | 95 (24.8%) | 288 (75.2%) |
| Health Care & Social Assistance | 63 (44.1%) | 80 (55.9%) |
| Arts, Entertainment & Recreation | 66 (100.0%) | 0 (0.0%) |
| Accommodation & Food Services | 0 (0.0%) | 44 (100.0%) |
| Public Administration | 25 (52.1%) | 23 (47.9%) |
| Total | 854 (54.5%) | 714 (45.5%) |
Education in Glenwood Landing
School Enrollment in Glenwood Landing
The most common levels of schooling among the 1,110 students in Glenwood Landing are middle school (367 | 33.1%), high school (268 | 24.1%), and graduate / professional (161 | 14.5%).
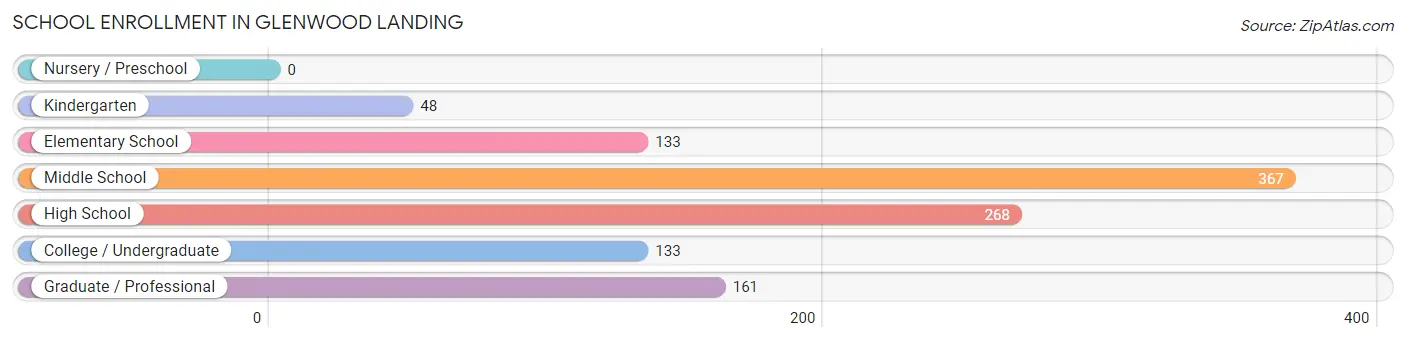
| School Level | # Students | % Students |
| Nursery / Preschool | 0 | 0.0% |
| Kindergarten | 48 | 4.3% |
| Elementary School | 133 | 12.0% |
| Middle School | 367 | 33.1% |
| High School | 268 | 24.1% |
| College / Undergraduate | 133 | 12.0% |
| Graduate / Professional | 161 | 14.5% |
| Total | 1,110 | 100.0% |
School Enrollment by Age by Funding Source in Glenwood Landing
Out of a total of 1,110 students who are enrolled in schools in Glenwood Landing, 341 (30.7%) attend a private institution, while the remaining 769 (69.3%) are enrolled in public schools. The age group of 25 to 34 year olds has the highest likelihood of being enrolled in private schools, with 49 (100.0% in the age bracket) enrolled. Conversely, the age group of 15 to 17 year olds has the lowest likelihood of being enrolled in a private school, with 137 (100.0% in the age bracket) attending a public institution.
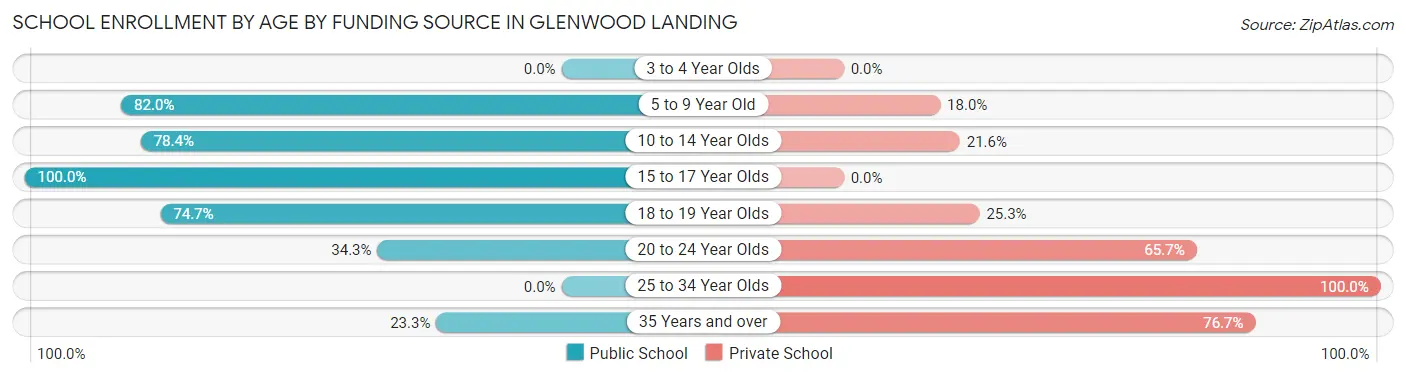
| Age Bracket | Public School | Private School |
| 3 to 4 Year Olds | 0 (0.0%) | 0 (0.0%) |
| 5 to 9 Year Old | 105 (82.0%) | 23 (18.0%) |
| 10 to 14 Year Olds | 395 (78.4%) | 109 (21.6%) |
| 15 to 17 Year Olds | 137 (100.0%) | 0 (0.0%) |
| 18 to 19 Year Olds | 65 (74.7%) | 22 (25.3%) |
| 20 to 24 Year Olds | 60 (34.3%) | 115 (65.7%) |
| 25 to 34 Year Olds | 0 (0.0%) | 49 (100.0%) |
| 35 Years and over | 7 (23.3%) | 23 (76.7%) |
| Total | 769 (69.3%) | 341 (30.7%) |
Educational Attainment by Field of Study in Glenwood Landing
Psychology (400 | 22.3%), business (318 | 17.8%), literature & languages (158 | 8.8%), education (147 | 8.2%), and science & technology (126 | 7.0%) are the most common fields of study among 1,791 individuals in Glenwood Landing who have obtained a bachelor's degree or higher.
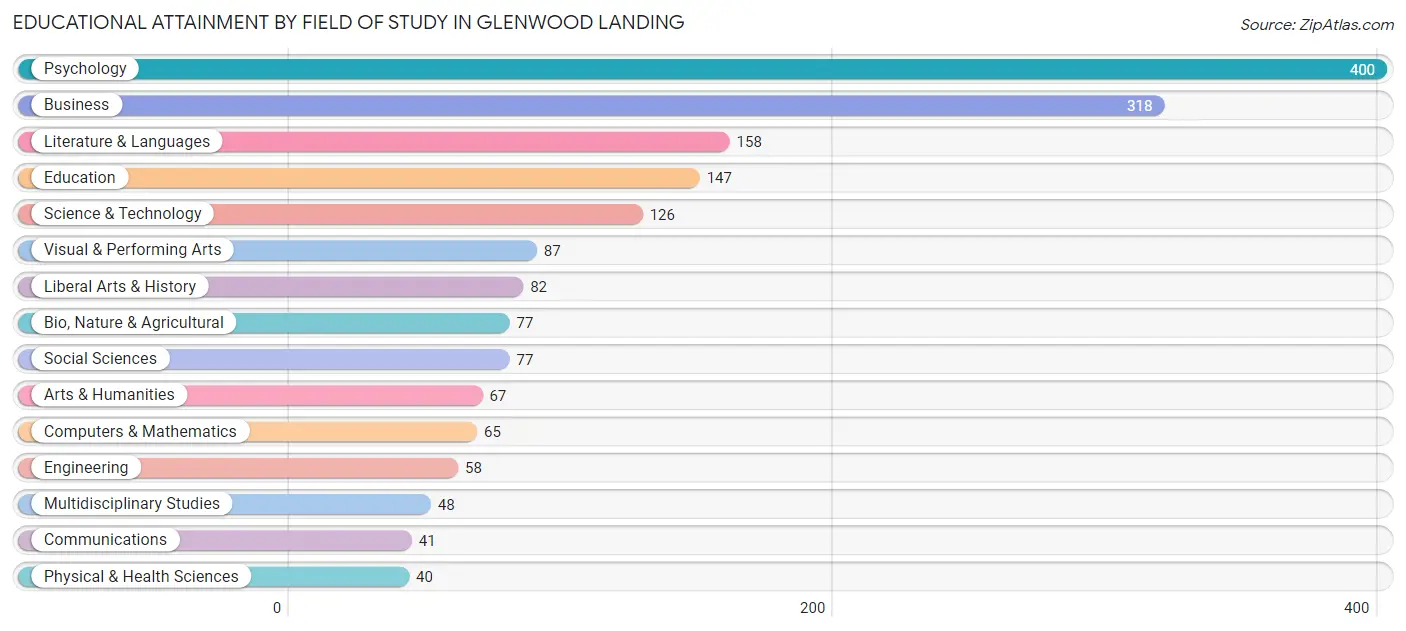
| Field of Study | # Graduates | % Graduates |
| Computers & Mathematics | 65 | 3.6% |
| Bio, Nature & Agricultural | 77 | 4.3% |
| Physical & Health Sciences | 40 | 2.2% |
| Psychology | 400 | 22.3% |
| Social Sciences | 77 | 4.3% |
| Engineering | 58 | 3.2% |
| Multidisciplinary Studies | 48 | 2.7% |
| Science & Technology | 126 | 7.0% |
| Business | 318 | 17.8% |
| Education | 147 | 8.2% |
| Literature & Languages | 158 | 8.8% |
| Liberal Arts & History | 82 | 4.6% |
| Visual & Performing Arts | 87 | 4.9% |
| Communications | 41 | 2.3% |
| Arts & Humanities | 67 | 3.7% |
| Total | 1,791 | 100.0% |
Transportation & Commute in Glenwood Landing
Vehicle Availability by Sex in Glenwood Landing
The most prevalent vehicle ownership categories in Glenwood Landing are males with 2 vehicles (327, accounting for 40.5%) and females with 2 vehicles (290, making up 46.9%).
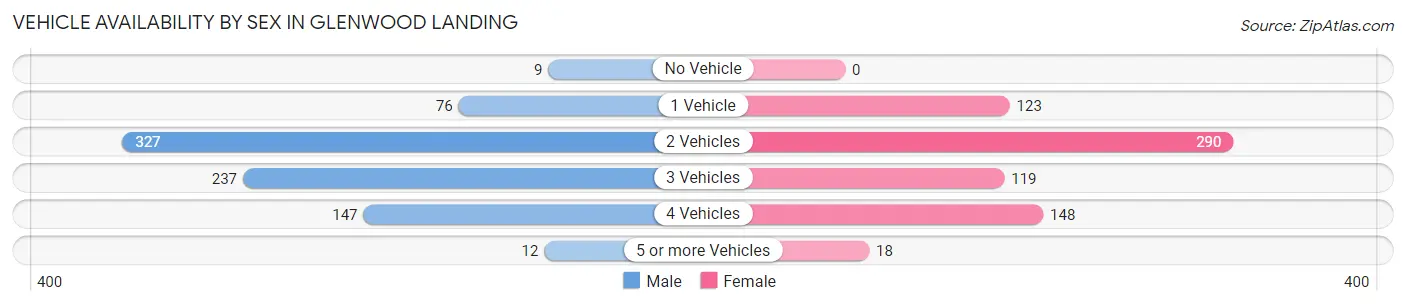
| Vehicles Available | Male | Female |
| No Vehicle | 9 (1.1%) | 0 (0.0%) |
| 1 Vehicle | 76 (9.4%) | 123 (17.6%) |
| 2 Vehicles | 327 (40.5%) | 290 (41.5%) |
| 3 Vehicles | 237 (29.3%) | 119 (17.1%) |
| 4 Vehicles | 147 (18.2%) | 148 (21.2%) |
| 5 or more Vehicles | 12 (1.5%) | 18 (2.6%) |
| Total | 808 (100.0%) | 698 (100.0%) |
Commute Time in Glenwood Landing
The most frequently occuring commute durations in Glenwood Landing are 15 to 19 minutes (212 commuters, 17.3%), 10 to 14 minutes (206 commuters, 16.8%), and 5 to 9 minutes (139 commuters, 11.4%).
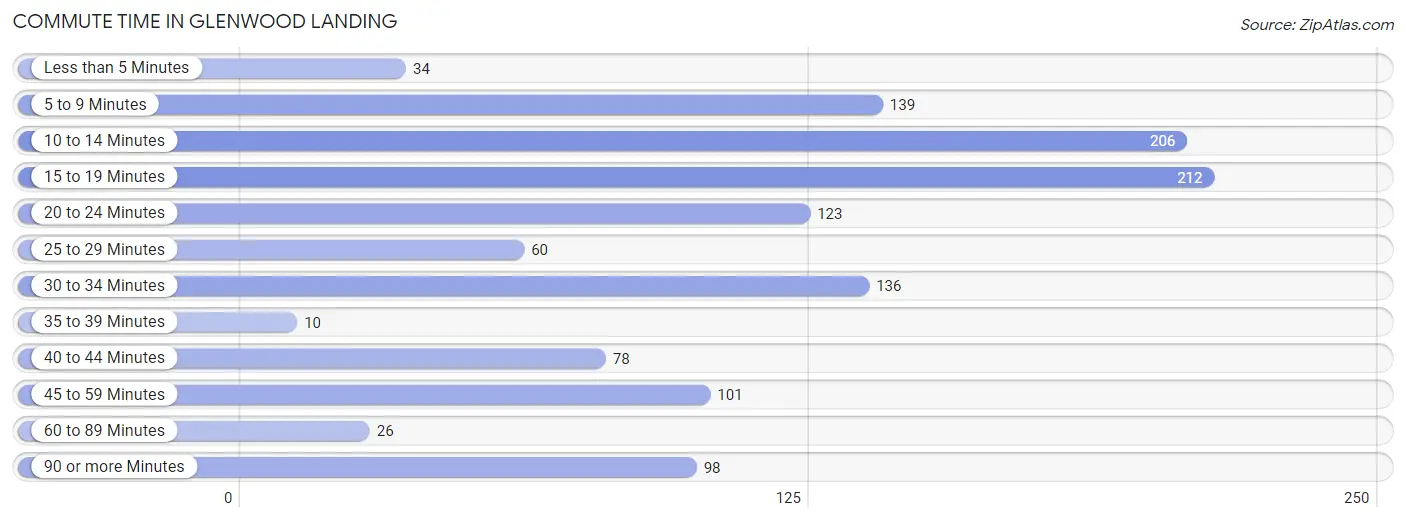
| Commute Time | # Commuters | % Commuters |
| Less than 5 Minutes | 34 | 2.8% |
| 5 to 9 Minutes | 139 | 11.4% |
| 10 to 14 Minutes | 206 | 16.8% |
| 15 to 19 Minutes | 212 | 17.3% |
| 20 to 24 Minutes | 123 | 10.1% |
| 25 to 29 Minutes | 60 | 4.9% |
| 30 to 34 Minutes | 136 | 11.1% |
| 35 to 39 Minutes | 10 | 0.8% |
| 40 to 44 Minutes | 78 | 6.4% |
| 45 to 59 Minutes | 101 | 8.3% |
| 60 to 89 Minutes | 26 | 2.1% |
| 90 or more Minutes | 98 | 8.0% |
Commute Time by Sex in Glenwood Landing
The most common commute times in Glenwood Landing are 20 to 24 minutes (108 commuters, 17.2%) for males and 10 to 14 minutes (164 commuters, 27.6%) for females.
| Commute Time | Male | Female |
| Less than 5 Minutes | 26 (4.1%) | 8 (1.3%) |
| 5 to 9 Minutes | 85 (13.5%) | 54 (9.1%) |
| 10 to 14 Minutes | 42 (6.7%) | 164 (27.6%) |
| 15 to 19 Minutes | 82 (13.0%) | 130 (21.9%) |
| 20 to 24 Minutes | 108 (17.2%) | 15 (2.5%) |
| 25 to 29 Minutes | 17 (2.7%) | 43 (7.2%) |
| 30 to 34 Minutes | 85 (13.5%) | 51 (8.6%) |
| 35 to 39 Minutes | 0 (0.0%) | 10 (1.7%) |
| 40 to 44 Minutes | 40 (6.4%) | 38 (6.4%) |
| 45 to 59 Minutes | 58 (9.2%) | 43 (7.2%) |
| 60 to 89 Minutes | 14 (2.2%) | 12 (2.0%) |
| 90 or more Minutes | 72 (11.5%) | 26 (4.4%) |
Time of Departure to Work by Sex in Glenwood Landing
The most frequent times of departure to work in Glenwood Landing are 6:00 AM to 6:29 AM (96, 15.3%) for males and 8:30 AM to 8:59 AM (125, 21.0%) for females.
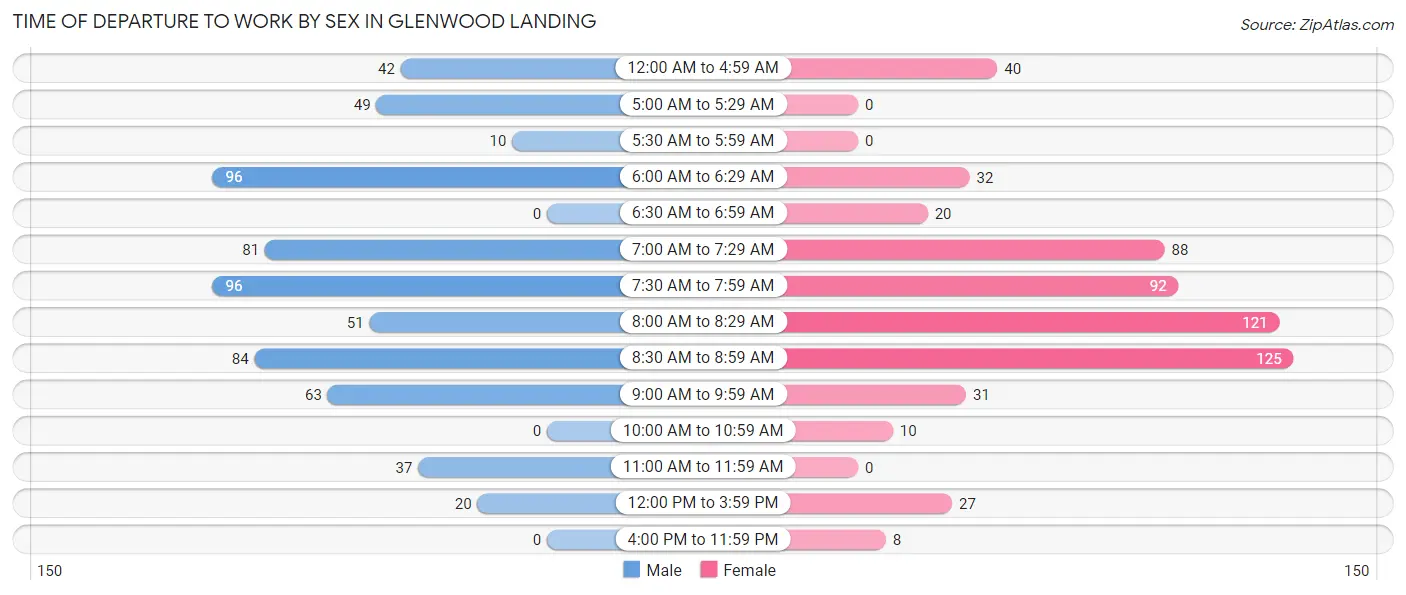
| Time of Departure | Male | Female |
| 12:00 AM to 4:59 AM | 42 (6.7%) | 40 (6.7%) |
| 5:00 AM to 5:29 AM | 49 (7.8%) | 0 (0.0%) |
| 5:30 AM to 5:59 AM | 10 (1.6%) | 0 (0.0%) |
| 6:00 AM to 6:29 AM | 96 (15.3%) | 32 (5.4%) |
| 6:30 AM to 6:59 AM | 0 (0.0%) | 20 (3.4%) |
| 7:00 AM to 7:29 AM | 81 (12.9%) | 88 (14.8%) |
| 7:30 AM to 7:59 AM | 96 (15.3%) | 92 (15.5%) |
| 8:00 AM to 8:29 AM | 51 (8.1%) | 121 (20.4%) |
| 8:30 AM to 8:59 AM | 84 (13.4%) | 125 (21.0%) |
| 9:00 AM to 9:59 AM | 63 (10.0%) | 31 (5.2%) |
| 10:00 AM to 10:59 AM | 0 (0.0%) | 10 (1.7%) |
| 11:00 AM to 11:59 AM | 37 (5.9%) | 0 (0.0%) |
| 12:00 PM to 3:59 PM | 20 (3.2%) | 27 (4.5%) |
| 4:00 PM to 11:59 PM | 0 (0.0%) | 8 (1.3%) |
| Total | 629 (100.0%) | 594 (100.0%) |
Housing Occupancy in Glenwood Landing
Occupancy by Ownership in Glenwood Landing
Of the total 1,471 dwellings in Glenwood Landing, owner-occupied units account for 1,335 (90.7%), while renter-occupied units make up 136 (9.2%).
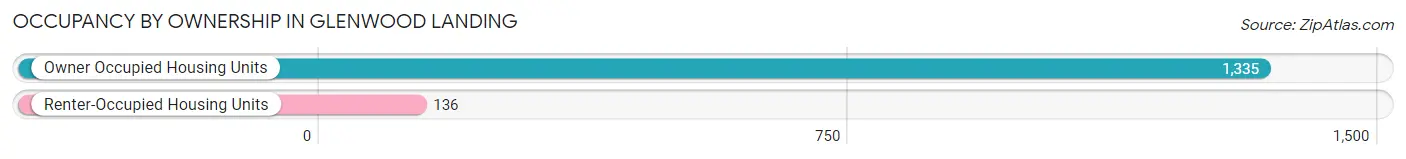
| Occupancy | # Housing Units | % Housing Units |
| Owner Occupied Housing Units | 1,335 | 90.7% |
| Renter-Occupied Housing Units | 136 | 9.2% |
| Total Occupied Housing Units | 1,471 | 100.0% |
Occupancy by Household Size in Glenwood Landing
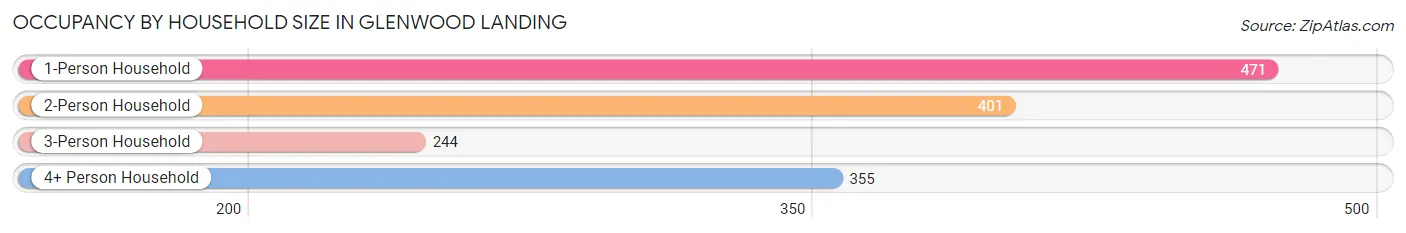
| Household Size | # Housing Units | % Housing Units |
| 1-Person Household | 471 | 32.0% |
| 2-Person Household | 401 | 27.3% |
| 3-Person Household | 244 | 16.6% |
| 4+ Person Household | 355 | 24.1% |
| Total Housing Units | 1,471 | 100.0% |
Occupancy by Ownership by Household Size in Glenwood Landing
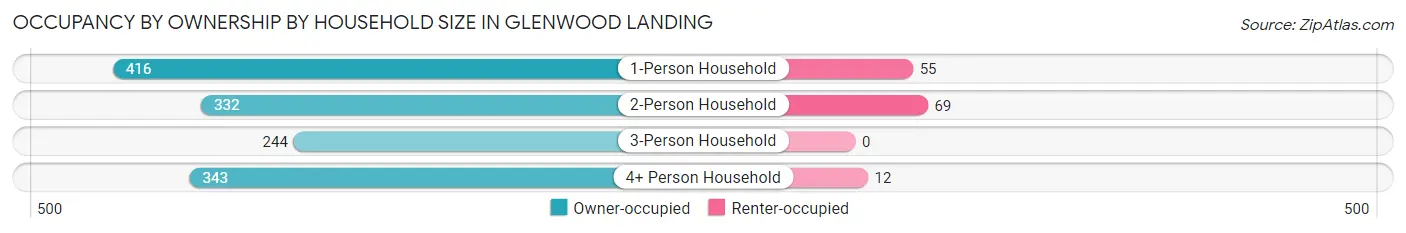
| Household Size | Owner-occupied | Renter-occupied |
| 1-Person Household | 416 (88.3%) | 55 (11.7%) |
| 2-Person Household | 332 (82.8%) | 69 (17.2%) |
| 3-Person Household | 244 (100.0%) | 0 (0.0%) |
| 4+ Person Household | 343 (96.6%) | 12 (3.4%) |
| Total Housing Units | 1,335 (90.7%) | 136 (9.2%) |
Occupancy by Educational Attainment in Glenwood Landing
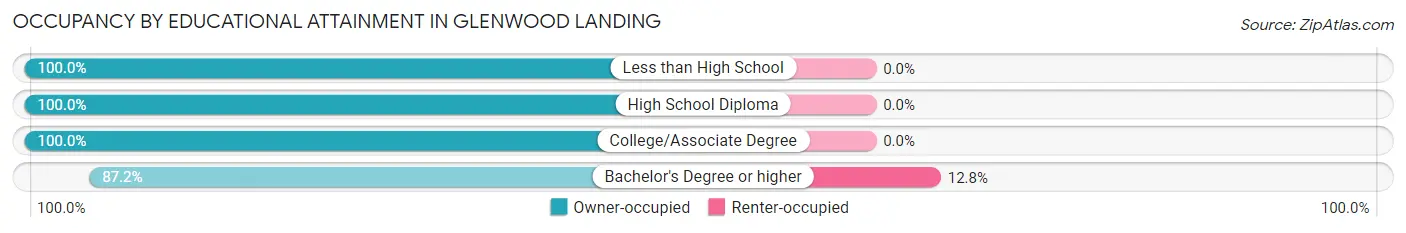
| Household Size | Owner-occupied | Renter-occupied |
| Less than High School | 35 (100.0%) | 0 (0.0%) |
| High School Diploma | 126 (100.0%) | 0 (0.0%) |
| College/Associate Degree | 249 (100.0%) | 0 (0.0%) |
| Bachelor's Degree or higher | 925 (87.2%) | 136 (12.8%) |
Occupancy by Age of Householder in Glenwood Landing
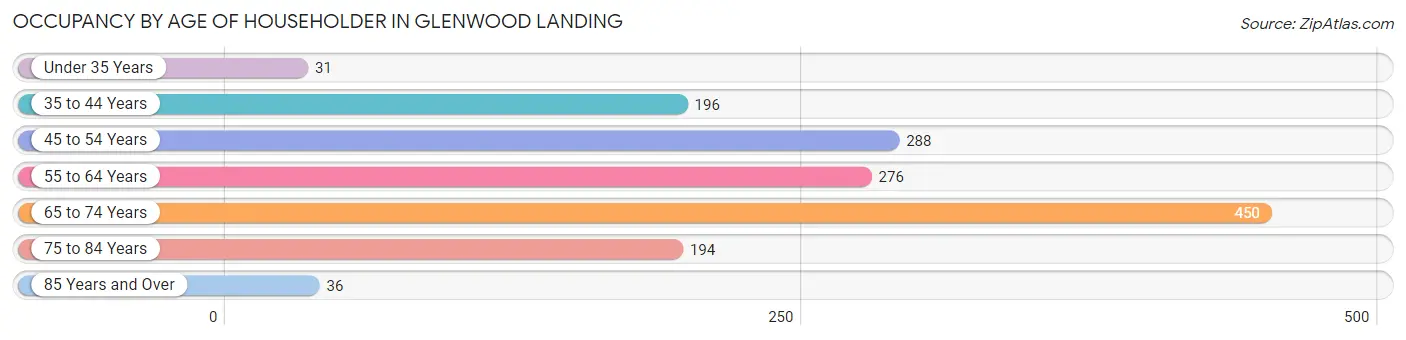
| Age Bracket | # Households | % Households |
| Under 35 Years | 31 | 2.1% |
| 35 to 44 Years | 196 | 13.3% |
| 45 to 54 Years | 288 | 19.6% |
| 55 to 64 Years | 276 | 18.8% |
| 65 to 74 Years | 450 | 30.6% |
| 75 to 84 Years | 194 | 13.2% |
| 85 Years and Over | 36 | 2.5% |
| Total | 1,471 | 100.0% |
Housing Finances in Glenwood Landing
Median Income by Occupancy in Glenwood Landing
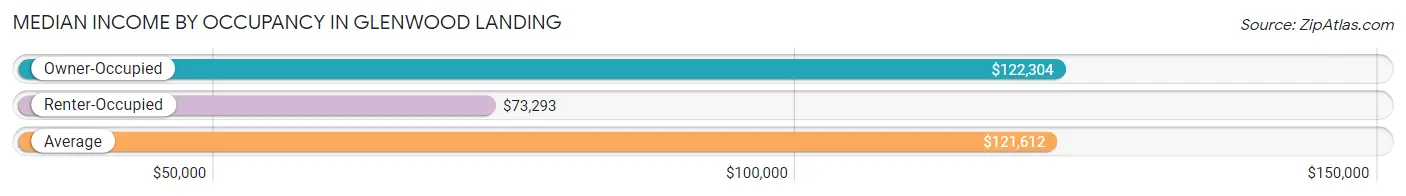
| Occupancy Type | # Households | Median Income |
| Owner-Occupied | 1,335 (90.7%) | $122,304 |
| Renter-Occupied | 136 (9.2%) | $73,293 |
| Average | 1,471 (100.0%) | $121,612 |
Occupancy by Householder Income Bracket in Glenwood Landing
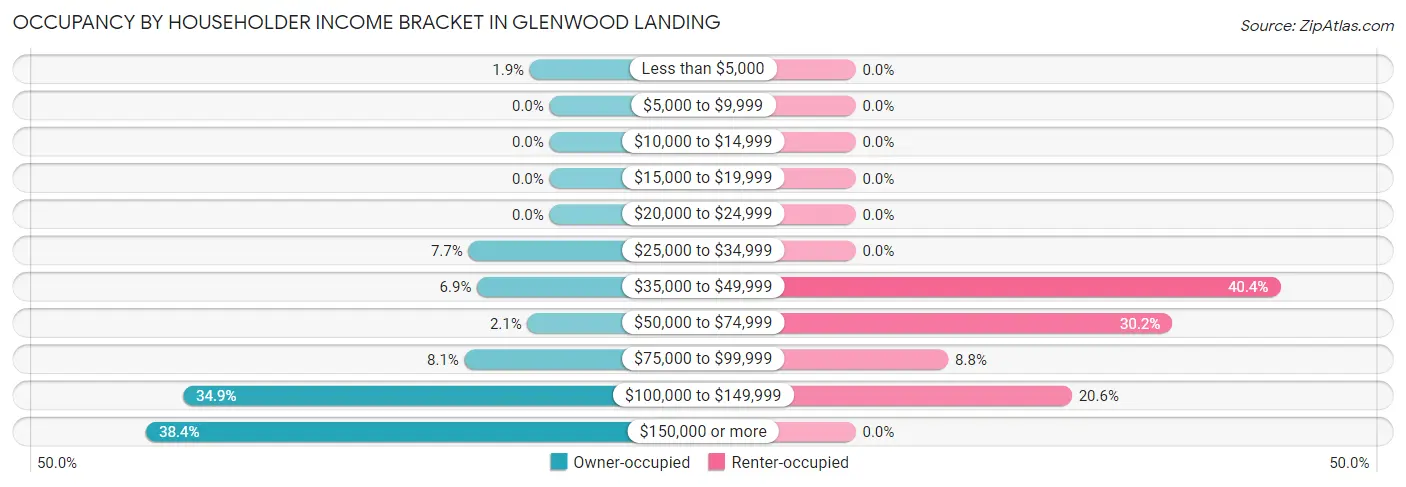
| Income Bracket | Owner-occupied | Renter-occupied |
| Less than $5,000 | 25 (1.9%) | 0 (0.0%) |
| $5,000 to $9,999 | 0 (0.0%) | 0 (0.0%) |
| $10,000 to $14,999 | 0 (0.0%) | 0 (0.0%) |
| $15,000 to $19,999 | 0 (0.0%) | 0 (0.0%) |
| $20,000 to $24,999 | 0 (0.0%) | 0 (0.0%) |
| $25,000 to $34,999 | 103 (7.7%) | 0 (0.0%) |
| $35,000 to $49,999 | 92 (6.9%) | 55 (40.4%) |
| $50,000 to $74,999 | 28 (2.1%) | 41 (30.1%) |
| $75,000 to $99,999 | 108 (8.1%) | 12 (8.8%) |
| $100,000 to $149,999 | 466 (34.9%) | 28 (20.6%) |
| $150,000 or more | 513 (38.4%) | 0 (0.0%) |
| Total | 1,335 (100.0%) | 136 (100.0%) |
Monthly Housing Cost Tiers in Glenwood Landing
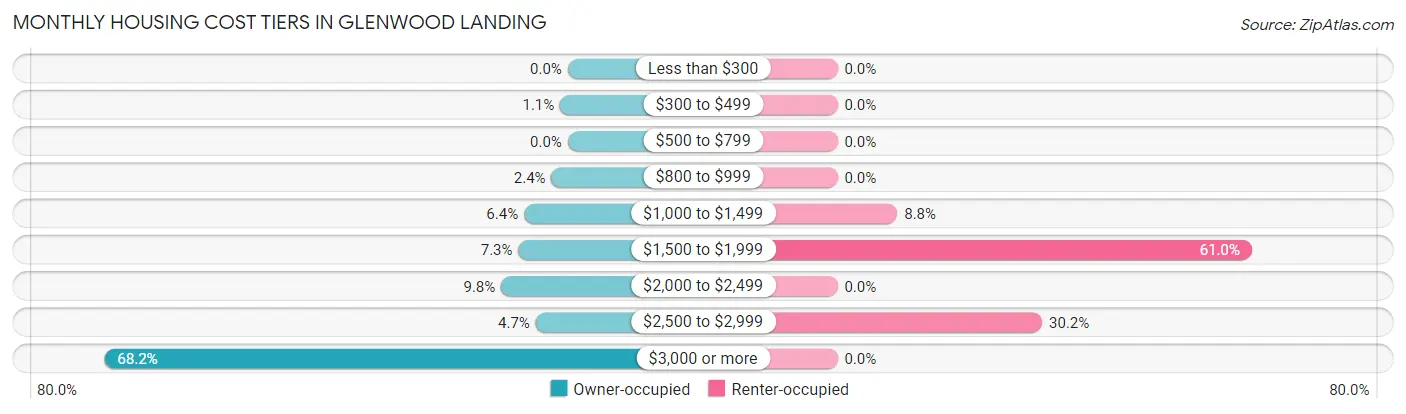
| Monthly Cost | Owner-occupied | Renter-occupied |
| Less than $300 | 0 (0.0%) | 0 (0.0%) |
| $300 to $499 | 15 (1.1%) | 0 (0.0%) |
| $500 to $799 | 0 (0.0%) | 0 (0.0%) |
| $800 to $999 | 32 (2.4%) | 0 (0.0%) |
| $1,000 to $1,499 | 86 (6.4%) | 12 (8.8%) |
| $1,500 to $1,999 | 97 (7.3%) | 83 (61.0%) |
| $2,000 to $2,499 | 131 (9.8%) | 0 (0.0%) |
| $2,500 to $2,999 | 63 (4.7%) | 41 (30.1%) |
| $3,000 or more | 911 (68.2%) | 0 (0.0%) |
| Total | 1,335 (100.0%) | 136 (100.0%) |
Physical Housing Characteristics in Glenwood Landing
Housing Structures in Glenwood Landing
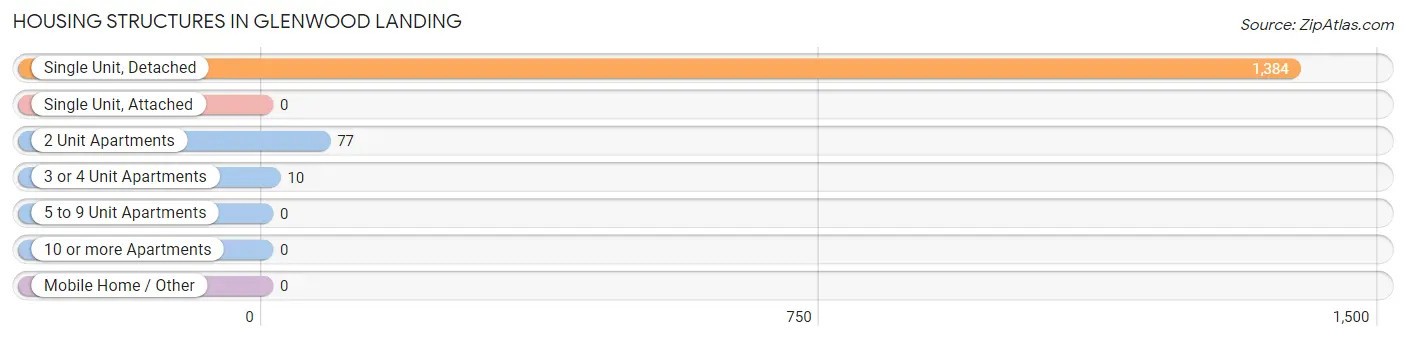
| Structure Type | # Housing Units | % Housing Units |
| Single Unit, Detached | 1,384 | 94.1% |
| Single Unit, Attached | 0 | 0.0% |
| 2 Unit Apartments | 77 | 5.2% |
| 3 or 4 Unit Apartments | 10 | 0.7% |
| 5 to 9 Unit Apartments | 0 | 0.0% |
| 10 or more Apartments | 0 | 0.0% |
| Mobile Home / Other | 0 | 0.0% |
| Total | 1,471 | 100.0% |
Housing Structures by Occupancy in Glenwood Landing
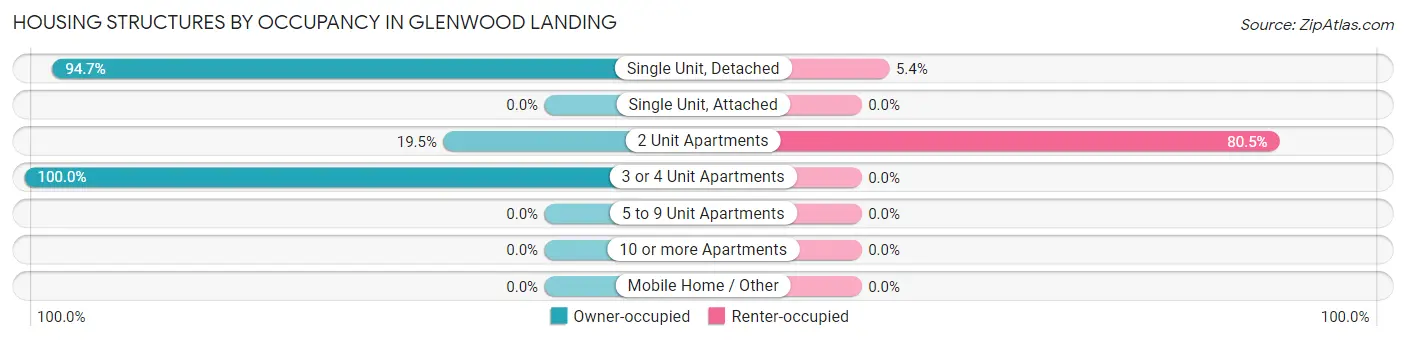
| Structure Type | Owner-occupied | Renter-occupied |
| Single Unit, Detached | 1,310 (94.7%) | 74 (5.3%) |
| Single Unit, Attached | 0 (0.0%) | 0 (0.0%) |
| 2 Unit Apartments | 15 (19.5%) | 62 (80.5%) |
| 3 or 4 Unit Apartments | 10 (100.0%) | 0 (0.0%) |
| 5 to 9 Unit Apartments | 0 (0.0%) | 0 (0.0%) |
| 10 or more Apartments | 0 (0.0%) | 0 (0.0%) |
| Mobile Home / Other | 0 (0.0%) | 0 (0.0%) |
| Total | 1,335 (90.7%) | 136 (9.2%) |
Housing Structures by Number of Rooms in Glenwood Landing
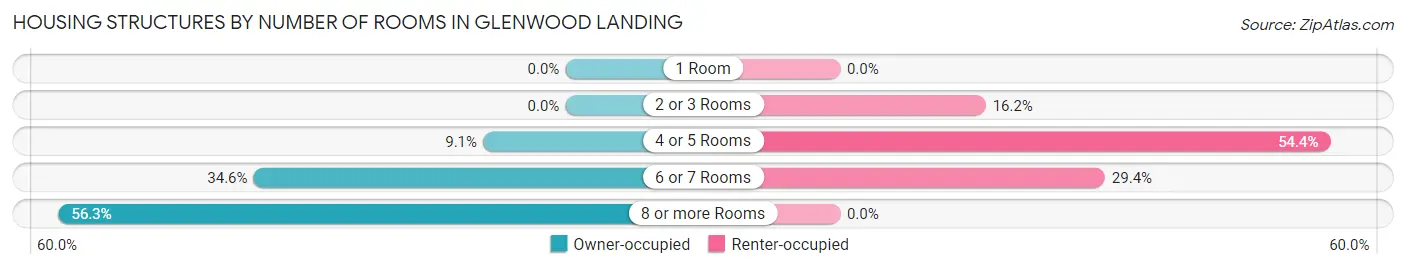
| Number of Rooms | Owner-occupied | Renter-occupied |
| 1 Room | 0 (0.0%) | 0 (0.0%) |
| 2 or 3 Rooms | 0 (0.0%) | 22 (16.2%) |
| 4 or 5 Rooms | 122 (9.1%) | 74 (54.4%) |
| 6 or 7 Rooms | 462 (34.6%) | 40 (29.4%) |
| 8 or more Rooms | 751 (56.2%) | 0 (0.0%) |
| Total | 1,335 (100.0%) | 136 (100.0%) |
Housing Structure by Heating Type in Glenwood Landing
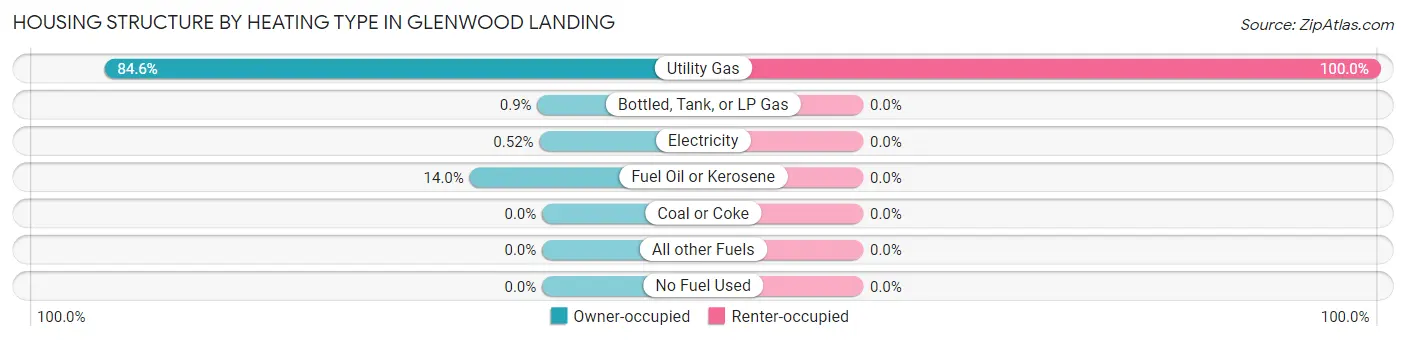
| Heating Type | Owner-occupied | Renter-occupied |
| Utility Gas | 1,129 (84.6%) | 136 (100.0%) |
| Bottled, Tank, or LP Gas | 12 (0.9%) | 0 (0.0%) |
| Electricity | 7 (0.5%) | 0 (0.0%) |
| Fuel Oil or Kerosene | 187 (14.0%) | 0 (0.0%) |
| Coal or Coke | 0 (0.0%) | 0 (0.0%) |
| All other Fuels | 0 (0.0%) | 0 (0.0%) |
| No Fuel Used | 0 (0.0%) | 0 (0.0%) |
| Total | 1,335 (100.0%) | 136 (100.0%) |
Household Vehicle Usage in Glenwood Landing
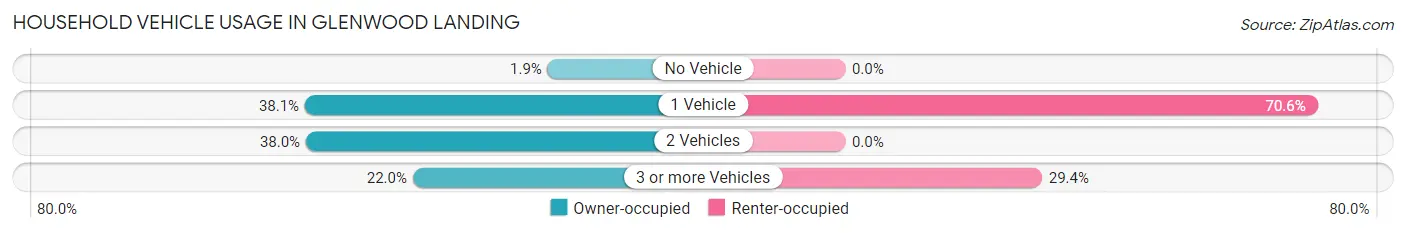
| Vehicles per Household | Owner-occupied | Renter-occupied |
| No Vehicle | 25 (1.9%) | 0 (0.0%) |
| 1 Vehicle | 509 (38.1%) | 96 (70.6%) |
| 2 Vehicles | 507 (38.0%) | 0 (0.0%) |
| 3 or more Vehicles | 294 (22.0%) | 40 (29.4%) |
| Total | 1,335 (100.0%) | 136 (100.0%) |
Real Estate & Mortgages in Glenwood Landing
Real Estate and Mortgage Overview in Glenwood Landing
| Characteristic | Without Mortgage | With Mortgage |
| Housing Units | 335 | 1,000 |
| Median Property Value | $707,300 | $874,800 |
| Median Household Income | $108,352 | $436 |
| Monthly Housing Costs | $1,501 | $881 |
| Real Estate Taxes | $10,001 | $0 |
Property Value by Mortgage Status in Glenwood Landing
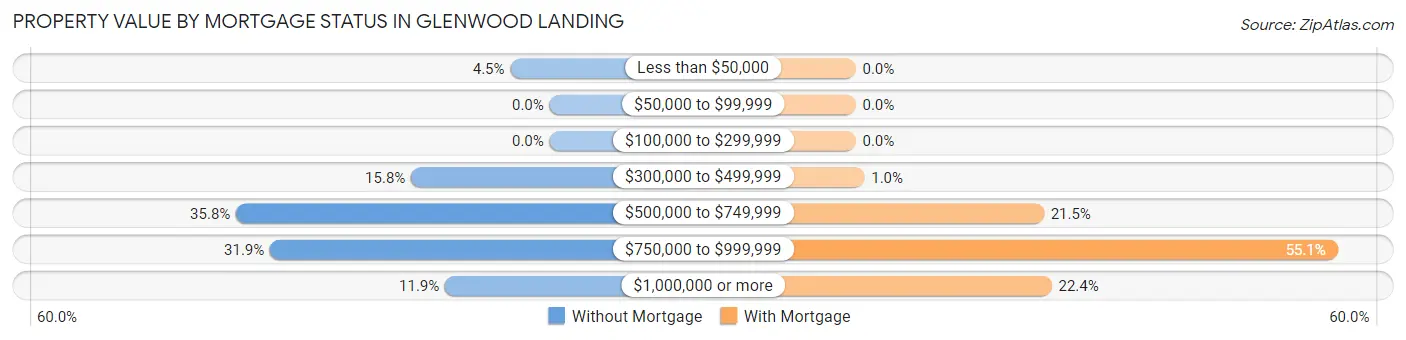
| Property Value | Without Mortgage | With Mortgage |
| Less than $50,000 | 15 (4.5%) | 0 (0.0%) |
| $50,000 to $99,999 | 0 (0.0%) | 0 (0.0%) |
| $100,000 to $299,999 | 0 (0.0%) | 0 (0.0%) |
| $300,000 to $499,999 | 53 (15.8%) | 10 (1.0%) |
| $500,000 to $749,999 | 120 (35.8%) | 215 (21.5%) |
| $750,000 to $999,999 | 107 (31.9%) | 551 (55.1%) |
| $1,000,000 or more | 40 (11.9%) | 224 (22.4%) |
| Total | 335 (100.0%) | 1,000 (100.0%) |
Household Income by Mortgage Status in Glenwood Landing
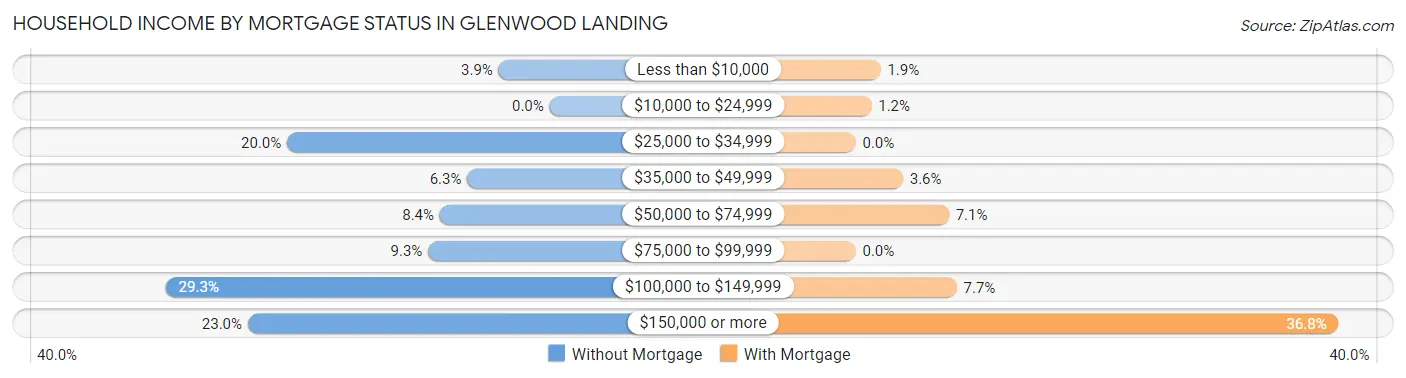
| Household Income | Without Mortgage | With Mortgage |
| Less than $10,000 | 13 (3.9%) | 19 (1.9%) |
| $10,000 to $24,999 | 0 (0.0%) | 12 (1.2%) |
| $25,000 to $34,999 | 67 (20.0%) | 0 (0.0%) |
| $35,000 to $49,999 | 21 (6.3%) | 36 (3.6%) |
| $50,000 to $74,999 | 28 (8.4%) | 71 (7.1%) |
| $75,000 to $99,999 | 31 (9.2%) | 0 (0.0%) |
| $100,000 to $149,999 | 98 (29.2%) | 77 (7.7%) |
| $150,000 or more | 77 (23.0%) | 368 (36.8%) |
| Total | 335 (100.0%) | 1,000 (100.0%) |
Property Value to Household Income Ratio in Glenwood Landing
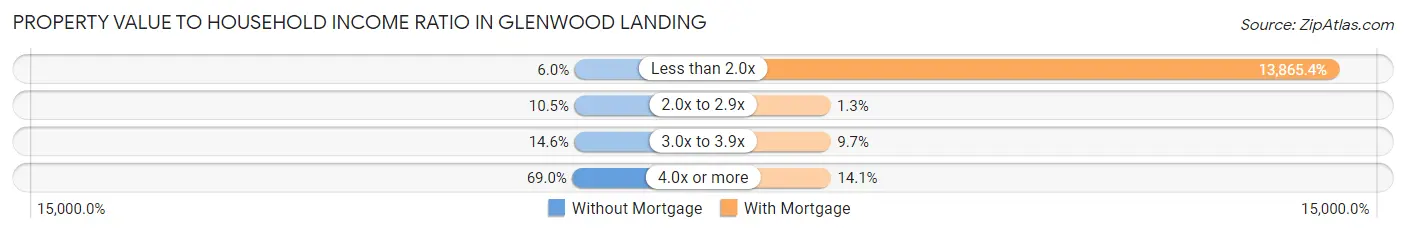
| Value-to-Income Ratio | Without Mortgage | With Mortgage |
| Less than 2.0x | 20 (6.0%) | 138,654 (13,865.4%) |
| 2.0x to 2.9x | 35 (10.4%) | 13 (1.3%) |
| 3.0x to 3.9x | 49 (14.6%) | 97 (9.7%) |
| 4.0x or more | 231 (69.0%) | 141 (14.1%) |
| Total | 335 (100.0%) | 1,000 (100.0%) |
Real Estate Taxes by Mortgage Status in Glenwood Landing
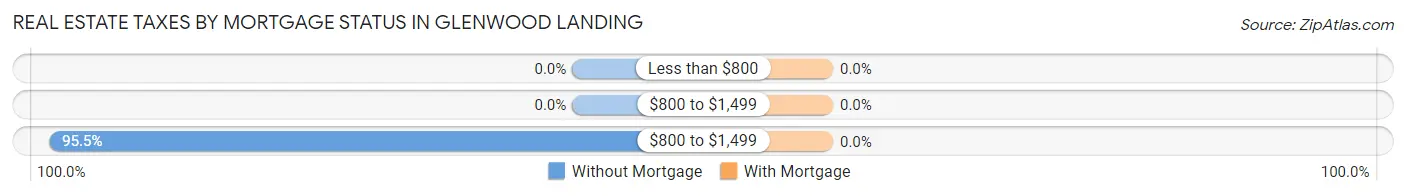
| Property Taxes | Without Mortgage | With Mortgage |
| Less than $800 | 0 (0.0%) | 0 (0.0%) |
| $800 to $1,499 | 0 (0.0%) | 0 (0.0%) |
| $800 to $1,499 | 320 (95.5%) | 0 (0.0%) |
| Total | 335 (100.0%) | 1,000 (100.0%) |
Health & Disability in Glenwood Landing
Health Insurance Coverage by Age in Glenwood Landing
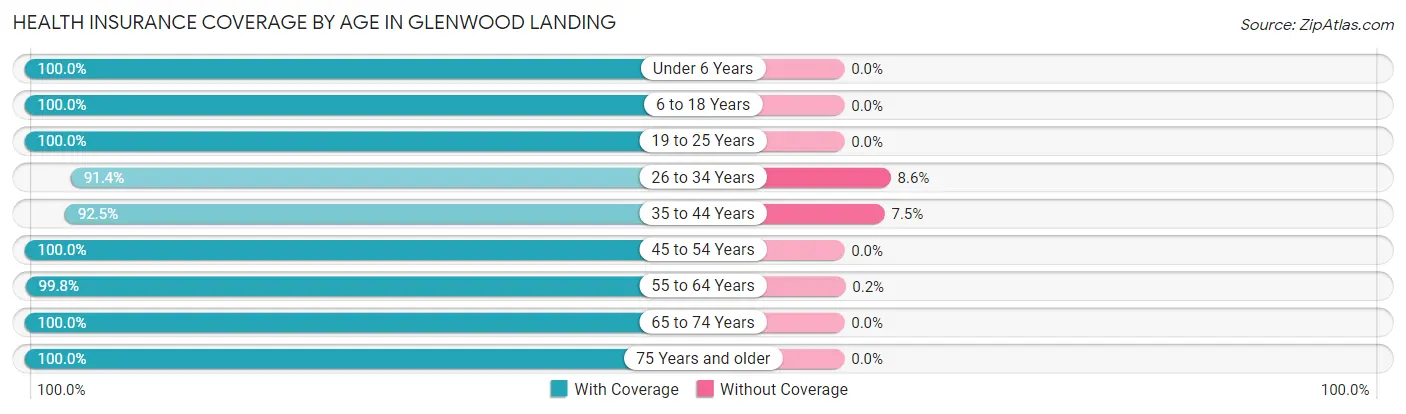
| Age Bracket | With Coverage | Without Coverage |
| Under 6 Years | 47 (100.0%) | 0 (0.0%) |
| 6 to 18 Years | 822 (100.0%) | 0 (0.0%) |
| 19 to 25 Years | 289 (100.0%) | 0 (0.0%) |
| 26 to 34 Years | 127 (91.4%) | 12 (8.6%) |
| 35 to 44 Years | 320 (92.5%) | 26 (7.5%) |
| 45 to 54 Years | 631 (100.0%) | 0 (0.0%) |
| 55 to 64 Years | 492 (99.8%) | 1 (0.2%) |
| 65 to 74 Years | 653 (100.0%) | 0 (0.0%) |
| 75 Years and older | 274 (100.0%) | 0 (0.0%) |
| Total | 3,655 (98.9%) | 39 (1.1%) |
Health Insurance Coverage by Citizenship Status in Glenwood Landing
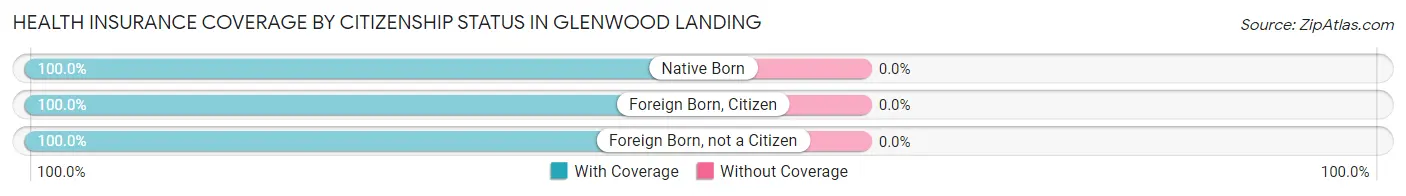
| Citizenship Status | With Coverage | Without Coverage |
| Native Born | 47 (100.0%) | 0 (0.0%) |
| Foreign Born, Citizen | 822 (100.0%) | 0 (0.0%) |
| Foreign Born, not a Citizen | 289 (100.0%) | 0 (0.0%) |
Health Insurance Coverage by Household Income in Glenwood Landing
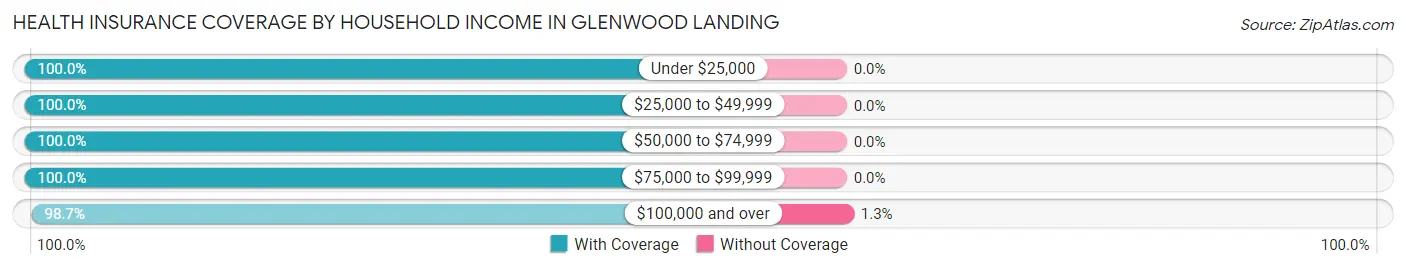
| Household Income | With Coverage | Without Coverage |
| Under $25,000 | 50 (100.0%) | 0 (0.0%) |
| $25,000 to $49,999 | 411 (100.0%) | 0 (0.0%) |
| $50,000 to $74,999 | 141 (100.0%) | 0 (0.0%) |
| $75,000 to $99,999 | 220 (100.0%) | 0 (0.0%) |
| $100,000 and over | 2,833 (98.7%) | 38 (1.3%) |
Public vs Private Health Insurance Coverage by Age in Glenwood Landing
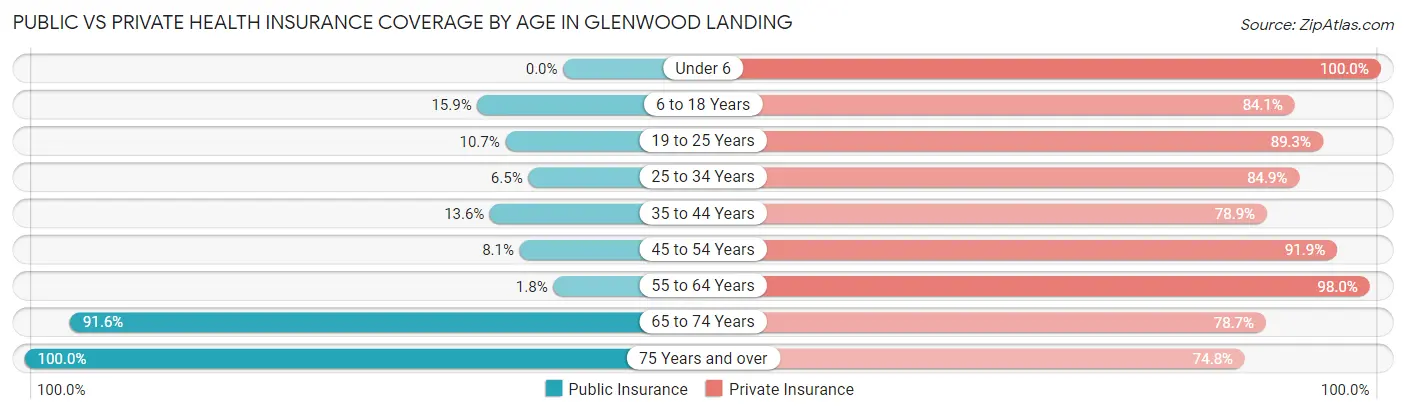
| Age Bracket | Public Insurance | Private Insurance |
| Under 6 | 0 (0.0%) | 47 (100.0%) |
| 6 to 18 Years | 131 (15.9%) | 691 (84.1%) |
| 19 to 25 Years | 31 (10.7%) | 258 (89.3%) |
| 25 to 34 Years | 9 (6.5%) | 118 (84.9%) |
| 35 to 44 Years | 47 (13.6%) | 273 (78.9%) |
| 45 to 54 Years | 51 (8.1%) | 580 (91.9%) |
| 55 to 64 Years | 9 (1.8%) | 483 (98.0%) |
| 65 to 74 Years | 598 (91.6%) | 514 (78.7%) |
| 75 Years and over | 274 (100.0%) | 205 (74.8%) |
| Total | 1,150 (31.1%) | 3,169 (85.8%) |
Disability Status by Sex by Age in Glenwood Landing
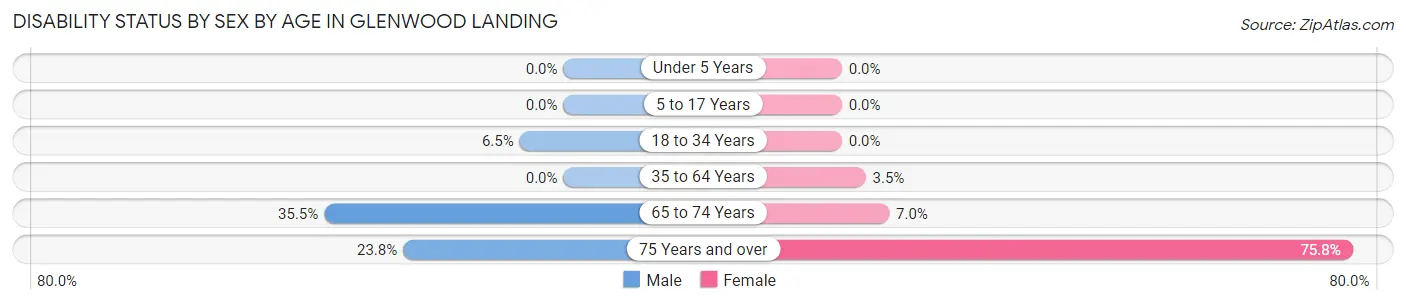
| Age Bracket | Male | Female |
| Under 5 Years | 0 (0.0%) | 0 (0.0%) |
| 5 to 17 Years | 0 (0.0%) | 0 (0.0%) |
| 18 to 34 Years | 20 (6.5%) | 0 (0.0%) |
| 35 to 64 Years | 0 (0.0%) | 27 (3.5%) |
| 65 to 74 Years | 70 (35.5%) | 32 (7.0%) |
| 75 Years and over | 15 (23.8%) | 160 (75.8%) |
Disability Class by Sex by Age in Glenwood Landing
Disability Class: Hearing Difficulty
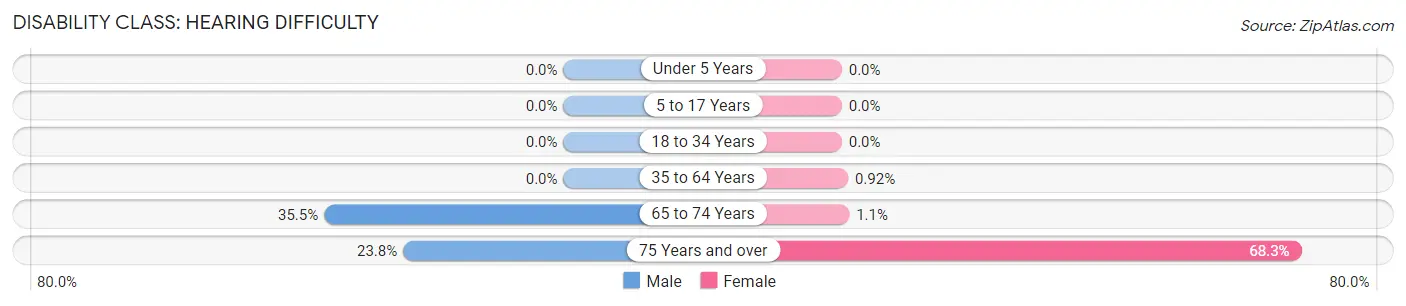
| Age Bracket | Male | Female |
| Under 5 Years | 0 (0.0%) | 0 (0.0%) |
| 5 to 17 Years | 0 (0.0%) | 0 (0.0%) |
| 18 to 34 Years | 0 (0.0%) | 0 (0.0%) |
| 35 to 64 Years | 0 (0.0%) | 7 (0.9%) |
| 65 to 74 Years | 70 (35.5%) | 5 (1.1%) |
| 75 Years and over | 15 (23.8%) | 144 (68.2%) |
Disability Class: Vision Difficulty
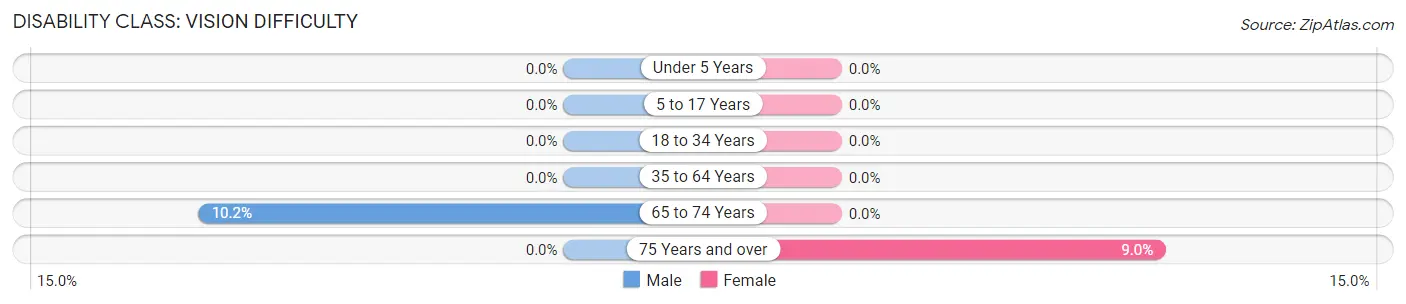
| Age Bracket | Male | Female |
| Under 5 Years | 0 (0.0%) | 0 (0.0%) |
| 5 to 17 Years | 0 (0.0%) | 0 (0.0%) |
| 18 to 34 Years | 0 (0.0%) | 0 (0.0%) |
| 35 to 64 Years | 0 (0.0%) | 0 (0.0%) |
| 65 to 74 Years | 20 (10.2%) | 0 (0.0%) |
| 75 Years and over | 0 (0.0%) | 19 (9.0%) |
Disability Class: Cognitive Difficulty
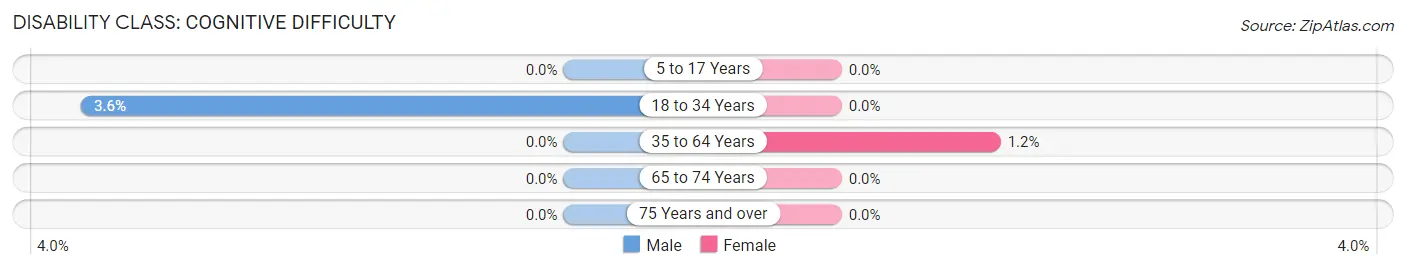
| Age Bracket | Male | Female |
| 5 to 17 Years | 0 (0.0%) | 0 (0.0%) |
| 18 to 34 Years | 11 (3.6%) | 0 (0.0%) |
| 35 to 64 Years | 0 (0.0%) | 9 (1.2%) |
| 65 to 74 Years | 0 (0.0%) | 0 (0.0%) |
| 75 Years and over | 0 (0.0%) | 0 (0.0%) |
Disability Class: Ambulatory Difficulty
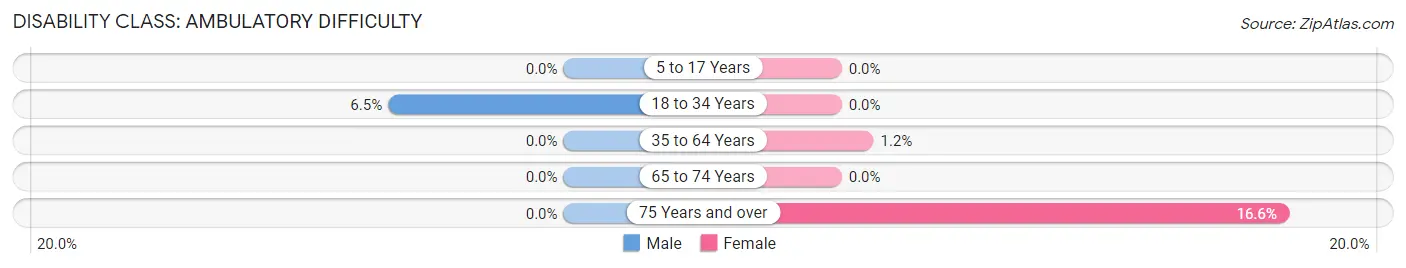
| Age Bracket | Male | Female |
| 5 to 17 Years | 0 (0.0%) | 0 (0.0%) |
| 18 to 34 Years | 20 (6.5%) | 0 (0.0%) |
| 35 to 64 Years | 0 (0.0%) | 9 (1.2%) |
| 65 to 74 Years | 0 (0.0%) | 0 (0.0%) |
| 75 Years and over | 0 (0.0%) | 35 (16.6%) |
Disability Class: Self-Care Difficulty
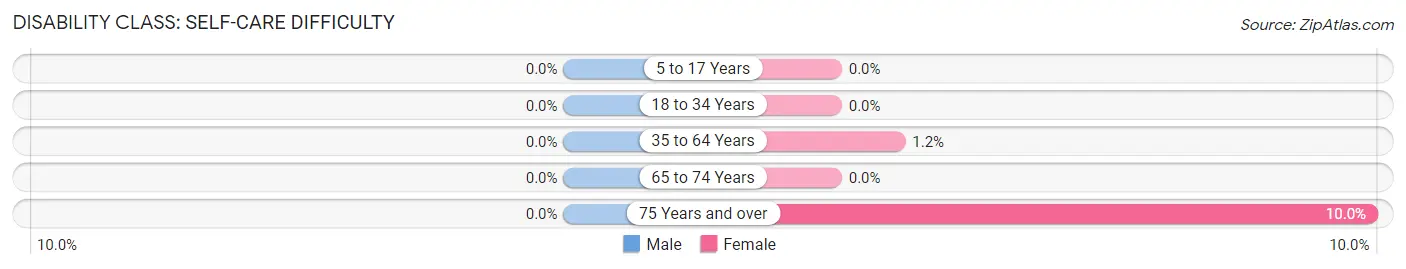
| Age Bracket | Male | Female |
| 5 to 17 Years | 0 (0.0%) | 0 (0.0%) |
| 18 to 34 Years | 0 (0.0%) | 0 (0.0%) |
| 35 to 64 Years | 0 (0.0%) | 9 (1.2%) |
| 65 to 74 Years | 0 (0.0%) | 0 (0.0%) |
| 75 Years and over | 0 (0.0%) | 21 (10.0%) |
Technology Access in Glenwood Landing
Computing Device Access in Glenwood Landing
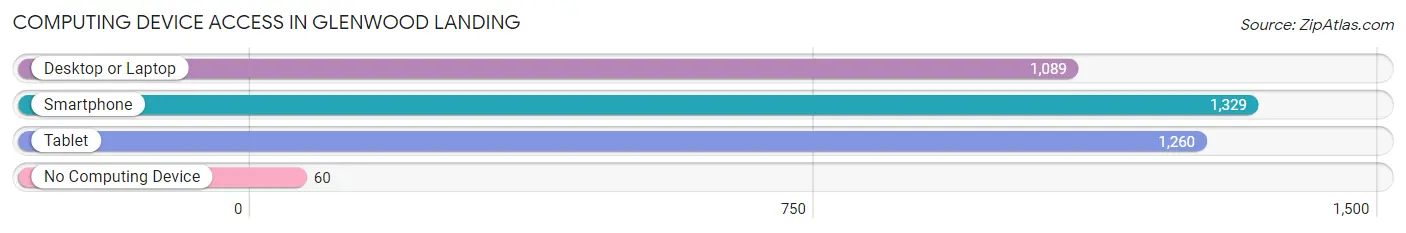
| Device Type | # Households | % Households |
| Desktop or Laptop | 1,089 | 74.0% |
| Smartphone | 1,329 | 90.3% |
| Tablet | 1,260 | 85.7% |
| No Computing Device | 60 | 4.1% |
| Total | 1,471 | 100.0% |
Internet Access in Glenwood Landing
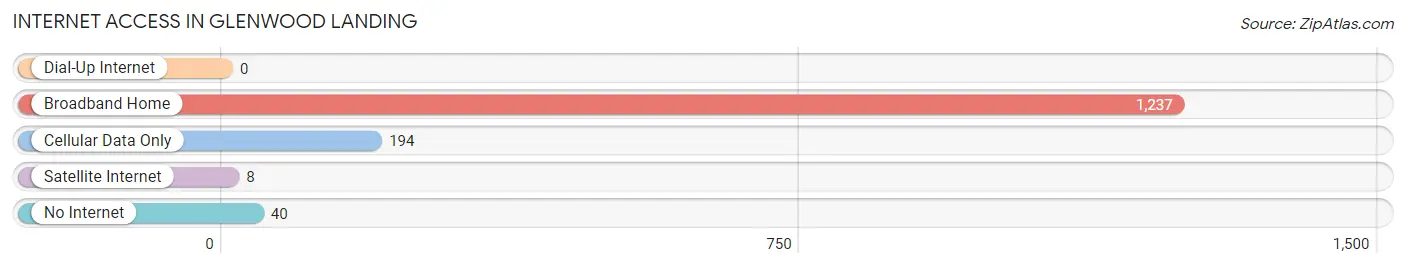
| Internet Type | # Households | % Households |
| Dial-Up Internet | 0 | 0.0% |
| Broadband Home | 1,237 | 84.1% |
| Cellular Data Only | 194 | 13.2% |
| Satellite Internet | 8 | 0.5% |
| No Internet | 40 | 2.7% |
| Total | 1,471 | 100.0% |
Glenwood Landing Summary
Glenwood Landing is a hamlet located in the Town of North Hempstead in Nassau County, New York. It is situated on the north shore of Long Island, approximately 25 miles east of Manhattan. The hamlet is bordered by the villages of Sea Cliff and Glen Cove, and the hamlet of Locust Valley. The population of Glenwood Landing was 2,845 at the 2010 census.
History
The area that is now Glenwood Landing was originally inhabited by the Matinecock Native American tribe. The first European settlers arrived in the area in the late 1600s, and the hamlet was officially established in 1790. The hamlet was named after the Glenwood Hotel, which was built in 1845 and was a popular destination for wealthy New Yorkers.
In the late 1800s, the hamlet became a popular summer resort destination for wealthy New Yorkers. The area was home to several large estates, including the Glenwood Hotel, which was built in 1845 and was a popular destination for wealthy New Yorkers.
In the early 1900s, the hamlet began to develop into a residential community. The area was home to several large estates, including the Glenwood Hotel, which was built in 1845 and was a popular destination for wealthy New Yorkers.
Geography
Glenwood Landing is located at 40°51'17" North, 73°37'17" West (40.854722, -73.621389). The hamlet is situated on the north shore of Long Island, approximately 25 miles east of Manhattan. The hamlet is bordered by the villages of Sea Cliff and Glen Cove, and the hamlet of Locust Valley.
The hamlet is located on the north shore of Long Island, approximately 25 miles east of Manhattan. The area is characterized by rolling hills, wooded areas, and a variety of waterways, including Hempstead Harbor, Oyster Bay, and Cold Spring Harbor.
Economy
The economy of Glenwood Landing is largely based on tourism and retail. The hamlet is home to several small businesses, including restaurants, shops, and galleries. The hamlet is also home to several marinas, which provide services to boaters and fishermen.
The hamlet is also home to several large employers, including North Shore-LIJ Health System, which operates a hospital in the area. The hamlet is also home to several educational institutions, including the Webb Institute, a private college specializing in naval architecture and marine engineering.
Demographics
As of the 2010 census, the population of Glenwood Landing was 2,845. The population is largely white (90.2%), with a small percentage of African Americans (2.2%), Asians (3.2%), and Hispanics (4.4%). The median household income is $90,945, and the median home value is $717,000.
Conclusion
Glenwood Landing is a hamlet located in the Town of North Hempstead in Nassau County, New York. It is situated on the north shore of Long Island, approximately 25 miles east of Manhattan. The hamlet was originally inhabited by the Matinecock Native American tribe, and was officially established in 1790. The economy of Glenwood Landing is largely based on tourism and retail, and the population is largely white. The median household income is $90,945, and the median home value is $717,000.
Common Questions
What is Per Capita Income in Glenwood Landing?
Per Capita income in Glenwood Landing is $62,518.
What is the Median Family Income in Glenwood Landing?
Median Family Income in Glenwood Landing is $148,864.
What is the Median Household income in Glenwood Landing?
Median Household Income in Glenwood Landing is $121,612.
What is Income or Wage Gap in Glenwood Landing?
Income or Wage Gap in Glenwood Landing is 72.5%.
Women in Glenwood Landing earn 27.5 cents for every dollar earned by a man.
What is Inequality or Gini Index in Glenwood Landing?
Inequality or Gini Index in Glenwood Landing is 0.37.
What is the Total Population of Glenwood Landing?
Total Population of Glenwood Landing is 3,694.
What is the Total Male Population of Glenwood Landing?
Total Male Population of Glenwood Landing is 1,666.
What is the Total Female Population of Glenwood Landing?
Total Female Population of Glenwood Landing is 2,028.
What is the Ratio of Males per 100 Females in Glenwood Landing?
There are 82.15 Males per 100 Females in Glenwood Landing.
What is the Ratio of Females per 100 Males in Glenwood Landing?
There are 121.73 Females per 100 Males in Glenwood Landing.
What is the Median Population Age in Glenwood Landing?
Median Population Age in Glenwood Landing is 48.9 Years.
What is the Average Family Size in Glenwood Landing
Average Family Size in Glenwood Landing is 3.1 People.
What is the Average Household Size in Glenwood Landing
Average Household Size in Glenwood Landing is 2.5 People.
How Large is the Labor Force in Glenwood Landing?
There are 1,619 People in the Labor Forcein in Glenwood Landing.
What is the Percentage of People in the Labor Force in Glenwood Landing?
54.2% of People are in the Labor Force in Glenwood Landing.
What is the Unemployment Rate in Glenwood Landing?
Unemployment Rate in Glenwood Landing is 3.2%.