Old Field, NY Map & Demographics
Old Field Map
Old Field Overview
$161,297
PER CAPITA INCOME
$250,001
AVG FAMILY INCOME
$250,001
AVG HOUSEHOLD INCOME
74.3%
WAGE / INCOME GAP [ % ]
25.7¢/ $1
WAGE / INCOME GAP [ $ ]
0.54
INEQUALITY / GINI INDEX
1,020
TOTAL POPULATION
567
MALE POPULATION
453
FEMALE POPULATION
125.17
MALES / 100 FEMALES
79.89
FEMALES / 100 MALES
48.4
MEDIAN AGE
3.0
AVG FAMILY SIZE
2.7
AVG HOUSEHOLD SIZE
533
LABOR FORCE [ PEOPLE ]
62.6%
PERCENT IN LABOR FORCE
3.4%
UNEMPLOYMENT RATE
Income in Old Field
Income Overview in Old Field
Per Capita Income in Old Field is $161,297, while median incomes of families and households are $250,001 and $250,001 respectively.
| Characteristic | Number | Measure |
| Per Capita Income | 1,020 | $161,297 |
| Median Family Income | 313 | $250,001 |
| Mean Family Income | 313 | $490,850 |
| Median Household Income | 370 | $250,001 |
| Mean Household Income | 370 | $446,156 |
| Income Deficit | 313 | $0 |
| Wage / Income Gap (%) | 1,020 | 74.35% |
| Wage / Income Gap ($) | 1,020 | 25.65¢ per $1 |
| Gini / Inequality Index | 1,020 | 0.54 |
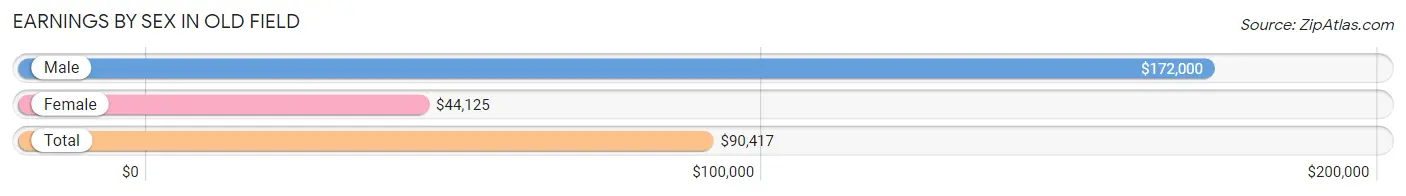
Earnings by Sex in Old Field
Average Earnings in Old Field are $90,417, $172,000 for men and $44,125 for women, a difference of 74.4%.
| Sex | Number | Average Earnings |
| Male | 342 (59.9%) | $172,000 |
| Female | 229 (40.1%) | $44,125 |
| Total | 571 (100.0%) | $90,417 |
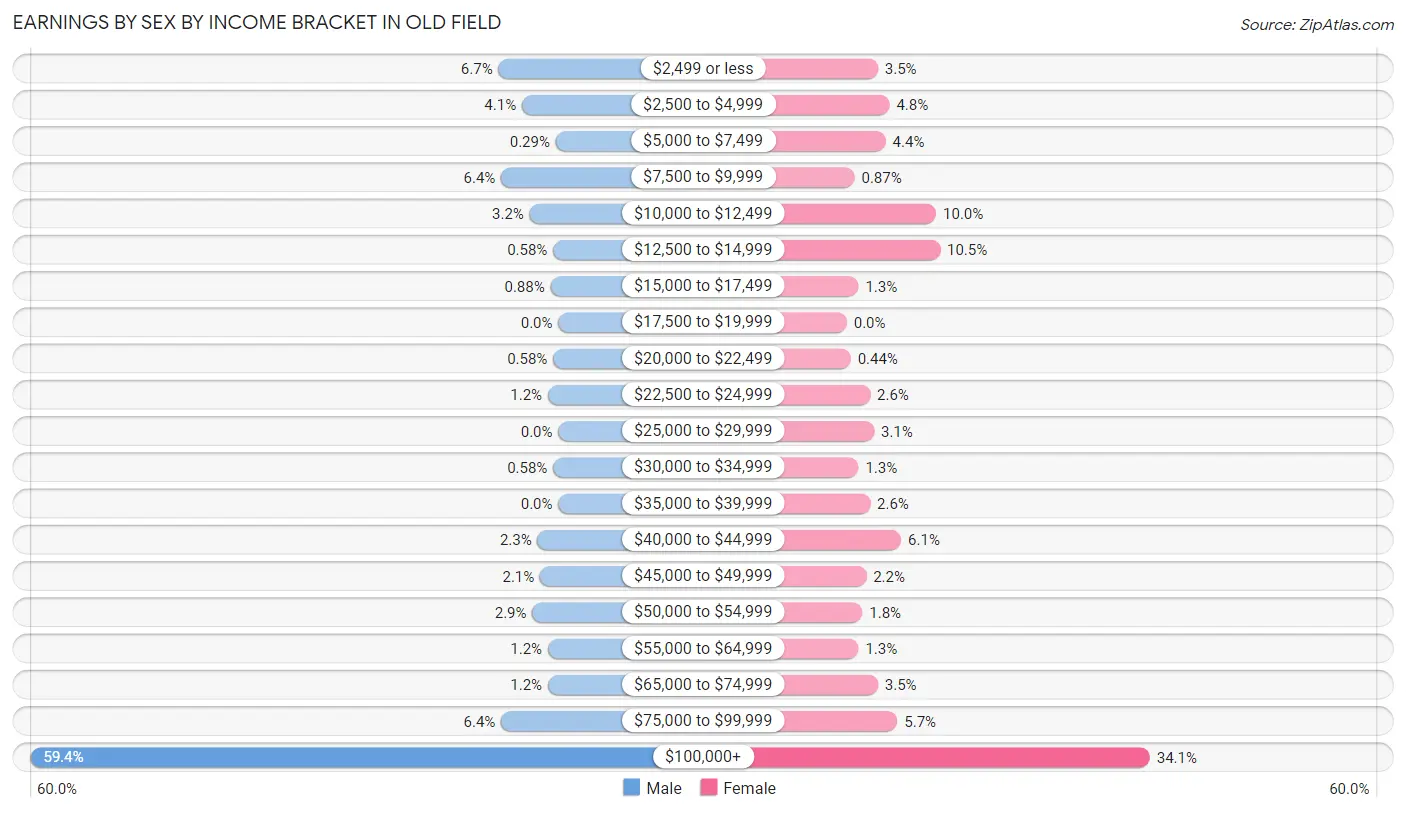
Earnings by Sex by Income Bracket in Old Field
The most common earnings brackets in Old Field are $100,000+ for men (203 | 59.4%) and $100,000+ for women (78 | 34.1%).
| Income | Male | Female |
| $2,499 or less | 23 (6.7%) | 8 (3.5%) |
| $2,500 to $4,999 | 14 (4.1%) | 11 (4.8%) |
| $5,000 to $7,499 | 1 (0.3%) | 10 (4.4%) |
| $7,500 to $9,999 | 22 (6.4%) | 2 (0.9%) |
| $10,000 to $12,499 | 11 (3.2%) | 23 (10.0%) |
| $12,500 to $14,999 | 2 (0.6%) | 24 (10.5%) |
| $15,000 to $17,499 | 3 (0.9%) | 3 (1.3%) |
| $17,500 to $19,999 | 0 (0.0%) | 0 (0.0%) |
| $20,000 to $22,499 | 2 (0.6%) | 1 (0.4%) |
| $22,500 to $24,999 | 4 (1.2%) | 6 (2.6%) |
| $25,000 to $29,999 | 0 (0.0%) | 7 (3.1%) |
| $30,000 to $34,999 | 2 (0.6%) | 3 (1.3%) |
| $35,000 to $39,999 | 0 (0.0%) | 6 (2.6%) |
| $40,000 to $44,999 | 8 (2.3%) | 14 (6.1%) |
| $45,000 to $49,999 | 7 (2.1%) | 5 (2.2%) |
| $50,000 to $54,999 | 10 (2.9%) | 4 (1.8%) |
| $55,000 to $64,999 | 4 (1.2%) | 3 (1.3%) |
| $65,000 to $74,999 | 4 (1.2%) | 8 (3.5%) |
| $75,000 to $99,999 | 22 (6.4%) | 13 (5.7%) |
| $100,000+ | 203 (59.4%) | 78 (34.1%) |
| Total | 342 (100.0%) | 229 (100.0%) |
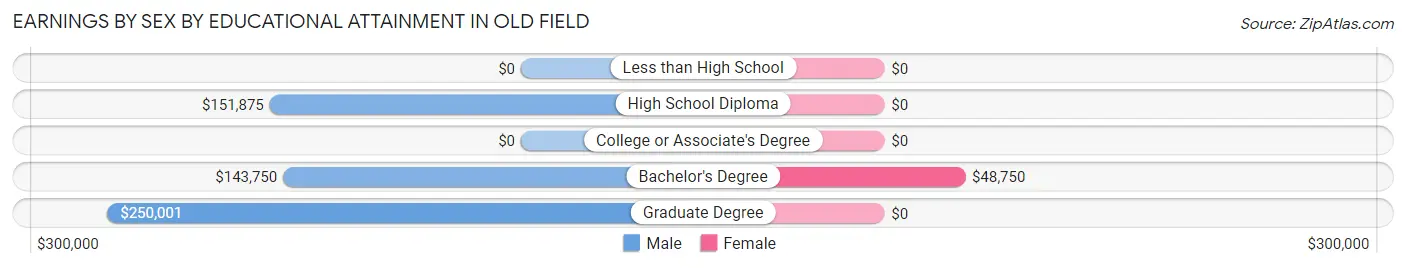
Earnings by Sex by Educational Attainment in Old Field
Average earnings in Old Field are $250,001 for men and $49,500 for women, a difference of 80.2%. Men with an educational attainment of graduate degree enjoy the highest average annual earnings of $250,001, while those with bachelor's degree education earn the least with $143,750. Women with an educational attainment of bachelor's degree earn the most with the average annual earnings of $48,750, while those with bachelor's degree education have the smallest earnings of $48,750.
| Educational Attainment | Male Income | Female Income |
| Less than High School | - | - |
| High School Diploma | $151,875 | $0 |
| College or Associate's Degree | - | - |
| Bachelor's Degree | $143,750 | $48,750 |
| Graduate Degree | $250,001 | $0 |
| Total | $250,001 | $49,500 |
Family Income in Old Field
Family Income Brackets in Old Field
According to the Old Field family income data, there are 191 families falling into the $200,000+ income range, which is the most common income bracket and makes up 61.0% of all families.
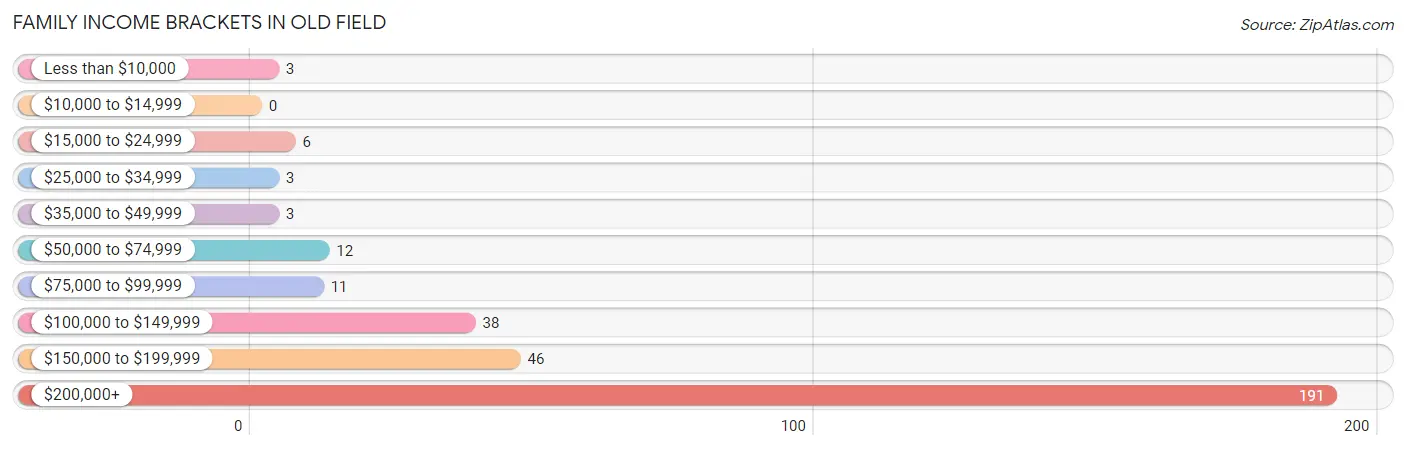
| Income Bracket | # Families | % Families |
| Less than $10,000 | 3 | 1.0% |
| $10,000 to $14,999 | 0 | 0.0% |
| $15,000 to $24,999 | 6 | 1.9% |
| $25,000 to $34,999 | 3 | 1.0% |
| $35,000 to $49,999 | 3 | 1.0% |
| $50,000 to $74,999 | 12 | 3.8% |
| $75,000 to $99,999 | 11 | 3.5% |
| $100,000 to $149,999 | 38 | 12.1% |
| $150,000 to $199,999 | 46 | 14.7% |
| $200,000+ | 191 | 61.0% |
Family Income by Famaliy Size in Old Field
3-person families (73 | 23.3%) account for the highest median family income in Old Field with $250,001 per family, while 2-person families (139 | 44.4%) have the highest median income of $119,532 per family member.
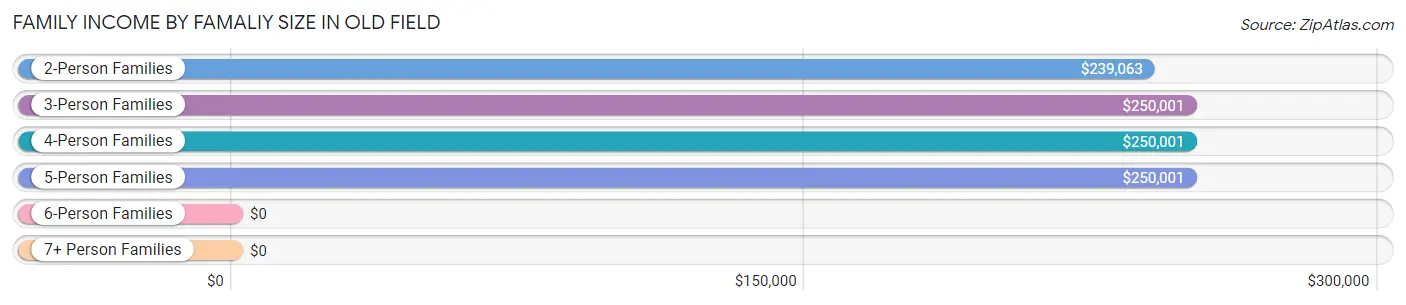
| Income Bracket | # Families | Median Income |
| 2-Person Families | 139 (44.4%) | $239,063 |
| 3-Person Families | 73 (23.3%) | $250,001 |
| 4-Person Families | 78 (24.9%) | $250,001 |
| 5-Person Families | 23 (7.3%) | $250,001 |
| 6-Person Families | 0 (0.0%) | $0 |
| 7+ Person Families | 0 (0.0%) | $0 |
| Total | 313 (100.0%) | $250,001 |
Family Income by Number of Earners in Old Field
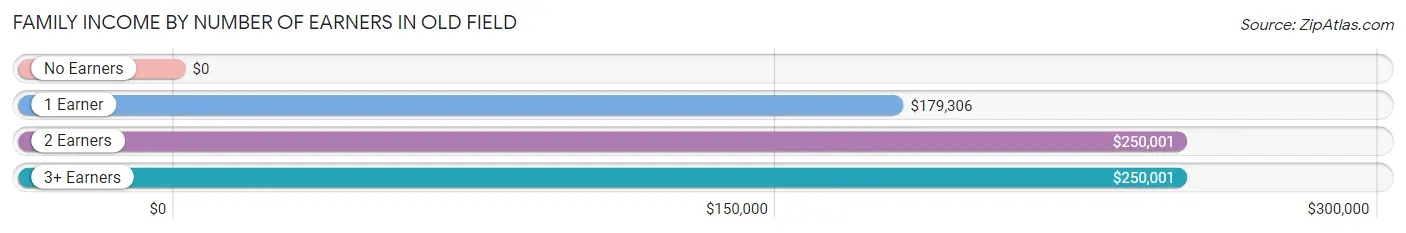
| Number of Earners | # Families | Median Income |
| No Earners | 23 (7.3%) | $0 |
| 1 Earner | 115 (36.7%) | $179,306 |
| 2 Earners | 124 (39.6%) | $250,001 |
| 3+ Earners | 51 (16.3%) | $250,001 |
| Total | 313 (100.0%) | $250,001 |
Household Income in Old Field
Household Income Brackets in Old Field
With 209 households falling in the category, the $200,000+ income range is the most frequent in Old Field, accounting for 56.5% of all households. In contrast, only 3 households (0.8%) fall into the less than $10,000 income bracket, making it the least populous group.
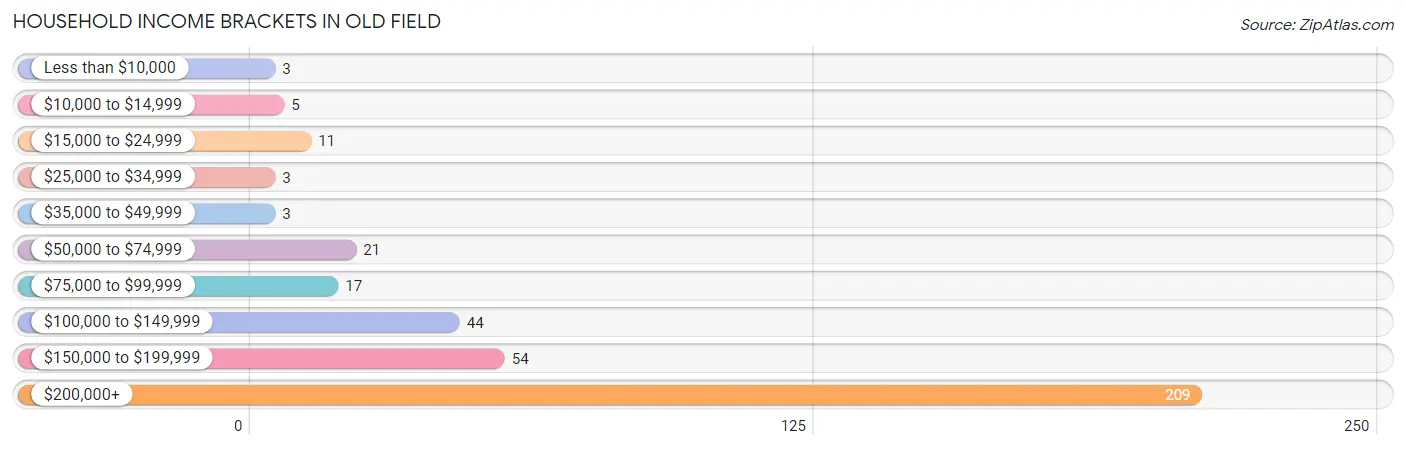
| Income Bracket | # Households | % Households |
| Less than $10,000 | 3 | 0.8% |
| $10,000 to $14,999 | 5 | 1.4% |
| $15,000 to $24,999 | 11 | 3.0% |
| $25,000 to $34,999 | 3 | 0.8% |
| $35,000 to $49,999 | 3 | 0.8% |
| $50,000 to $74,999 | 21 | 5.7% |
| $75,000 to $99,999 | 17 | 4.6% |
| $100,000 to $149,999 | 44 | 11.9% |
| $150,000 to $199,999 | 54 | 14.6% |
| $200,000+ | 209 | 56.5% |
Household Income by Householder Age in Old Field
The median household income in Old Field is $250,001, with the highest median household income of $250,001 found in the 45 to 64 years age bracket for the primary householder. A total of 223 households (60.3%) fall into this category.
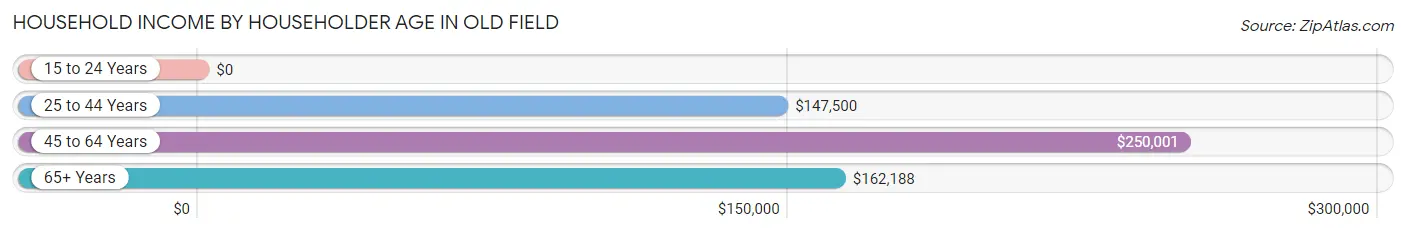
| Income Bracket | # Households | Median Income |
| 15 to 24 Years | 0 (0.0%) | $0 |
| 25 to 44 Years | 50 (13.5%) | $147,500 |
| 45 to 64 Years | 223 (60.3%) | $250,001 |
| 65+ Years | 97 (26.2%) | $162,188 |
| Total | 370 (100.0%) | $250,001 |
Poverty in Old Field
Income Below Poverty by Sex and Age in Old Field
With 2.5% poverty level for males and 2.4% for females among the residents of Old Field, 16 and 17 year old males and 6 to 11 year old females are the most vulnerable to poverty, with 4 males (9.1%) and 3 females (23.1%) in their respective age groups living below the poverty level.
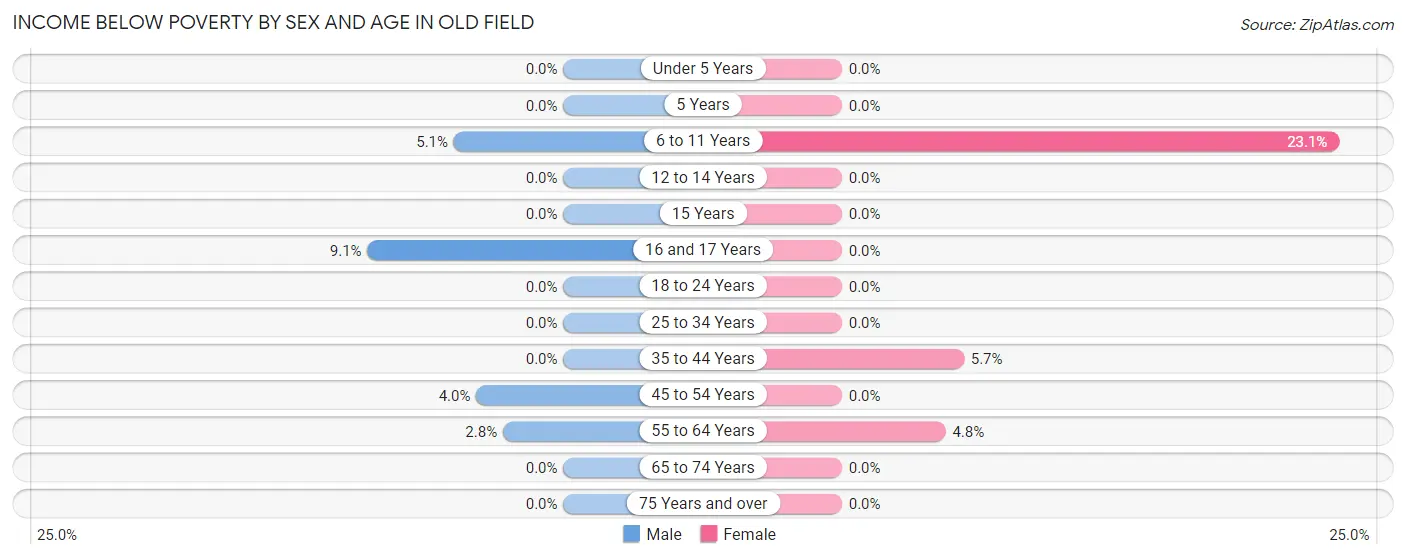
| Age Bracket | Male | Female |
| Under 5 Years | 0 (0.0%) | 0 (0.0%) |
| 5 Years | 0 (0.0%) | 0 (0.0%) |
| 6 to 11 Years | 3 (5.1%) | 3 (23.1%) |
| 12 to 14 Years | 0 (0.0%) | 0 (0.0%) |
| 15 Years | 0 (0.0%) | 0 (0.0%) |
| 16 and 17 Years | 4 (9.1%) | 0 (0.0%) |
| 18 to 24 Years | 0 (0.0%) | 0 (0.0%) |
| 25 to 34 Years | 0 (0.0%) | 0 (0.0%) |
| 35 to 44 Years | 0 (0.0%) | 3 (5.7%) |
| 45 to 54 Years | 4 (4.0%) | 0 (0.0%) |
| 55 to 64 Years | 3 (2.8%) | 5 (4.8%) |
| 65 to 74 Years | 0 (0.0%) | 0 (0.0%) |
| 75 Years and over | 0 (0.0%) | 0 (0.0%) |
| Total | 14 (2.5%) | 11 (2.4%) |
Income Above Poverty by Sex and Age in Old Field
According to the poverty statistics in Old Field, males aged under 5 years and females aged under 5 years are the age groups that are most secure financially, with 100.0% of males and 100.0% of females in these age groups living above the poverty line.
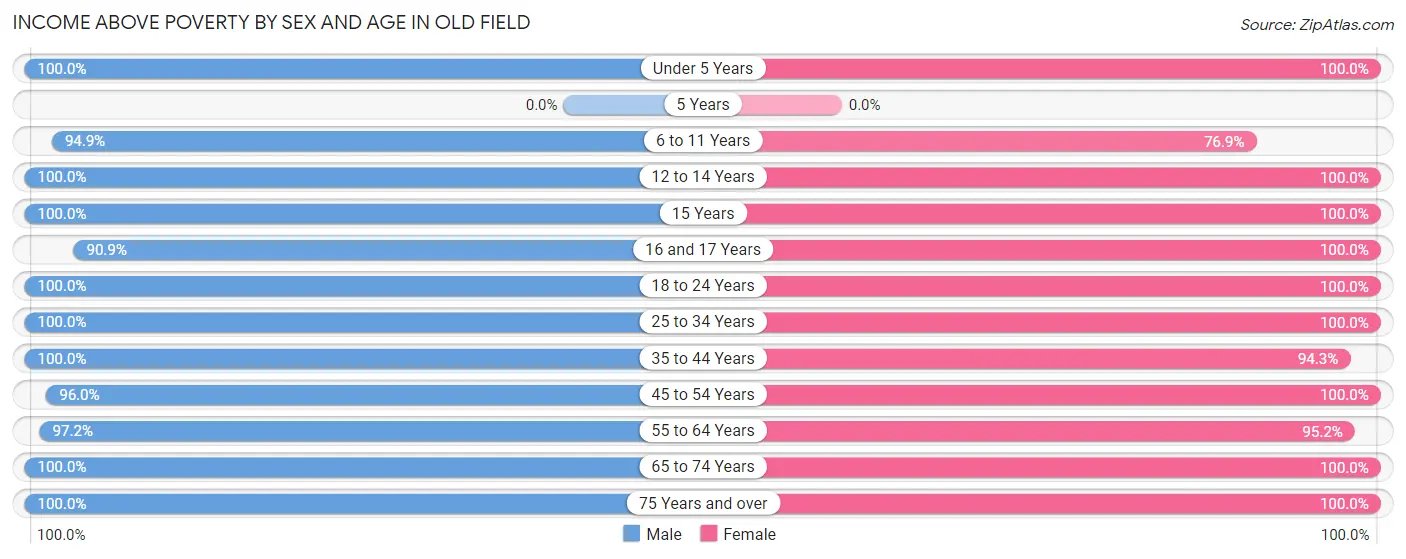
| Age Bracket | Male | Female |
| Under 5 Years | 2 (100.0%) | 14 (100.0%) |
| 5 Years | 0 (0.0%) | 0 (0.0%) |
| 6 to 11 Years | 56 (94.9%) | 10 (76.9%) |
| 12 to 14 Years | 32 (100.0%) | 25 (100.0%) |
| 15 Years | 11 (100.0%) | 13 (100.0%) |
| 16 and 17 Years | 40 (90.9%) | 25 (100.0%) |
| 18 to 24 Years | 76 (100.0%) | 17 (100.0%) |
| 25 to 34 Years | 9 (100.0%) | 18 (100.0%) |
| 35 to 44 Years | 42 (100.0%) | 50 (94.3%) |
| 45 to 54 Years | 95 (96.0%) | 93 (100.0%) |
| 55 to 64 Years | 104 (97.2%) | 99 (95.2%) |
| 65 to 74 Years | 64 (100.0%) | 41 (100.0%) |
| 75 Years and over | 22 (100.0%) | 37 (100.0%) |
| Total | 553 (97.5%) | 442 (97.6%) |
Income Below Poverty Among Married-Couple Families in Old Field
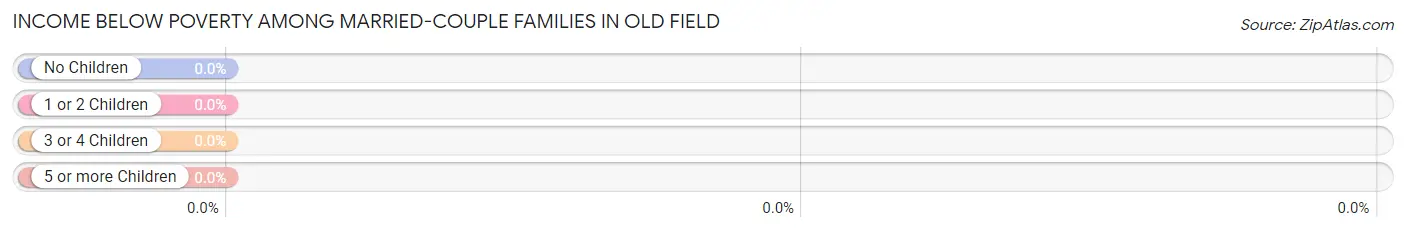
| Children | Above Poverty | Below Poverty |
| No Children | 178 (100.0%) | 0 (0.0%) |
| 1 or 2 Children | 92 (100.0%) | 0 (0.0%) |
| 3 or 4 Children | 9 (100.0%) | 0 (0.0%) |
| 5 or more Children | 0 (0.0%) | 0 (0.0%) |
| Total | 279 (100.0%) | 0 (0.0%) |
Income Below Poverty Among Single-Parent Households in Old Field
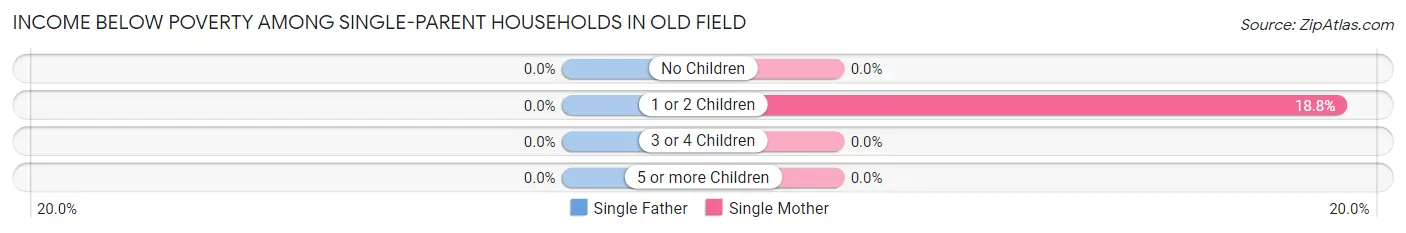
| Children | Single Father | Single Mother |
| No Children | 0 (0.0%) | 0 (0.0%) |
| 1 or 2 Children | 0 (0.0%) | 3 (18.8%) |
| 3 or 4 Children | 0 (0.0%) | 0 (0.0%) |
| 5 or more Children | 0 (0.0%) | 0 (0.0%) |
| Total | 0 (0.0%) | 3 (10.3%) |
Income Below Poverty Among Married-Couple vs Single-Parent Households in Old Field
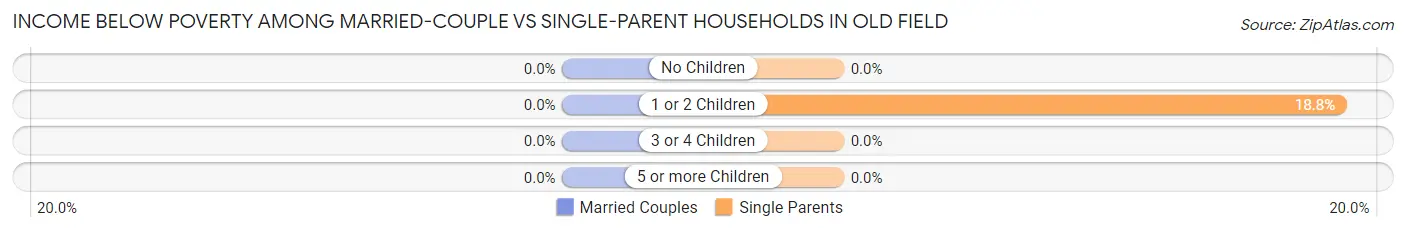
| Children | Married-Couple Families | Single-Parent Households |
| No Children | 0 (0.0%) | 0 (0.0%) |
| 1 or 2 Children | 0 (0.0%) | 3 (18.8%) |
| 3 or 4 Children | 0 (0.0%) | 0 (0.0%) |
| 5 or more Children | 0 (0.0%) | 0 (0.0%) |
| Total | 0 (0.0%) | 3 (8.8%) |
Race in Old Field
The most populous races in Old Field are White / Caucasian (883 | 86.6%), Asian (62 | 6.1%), and Two or more Races (47 | 4.6%).
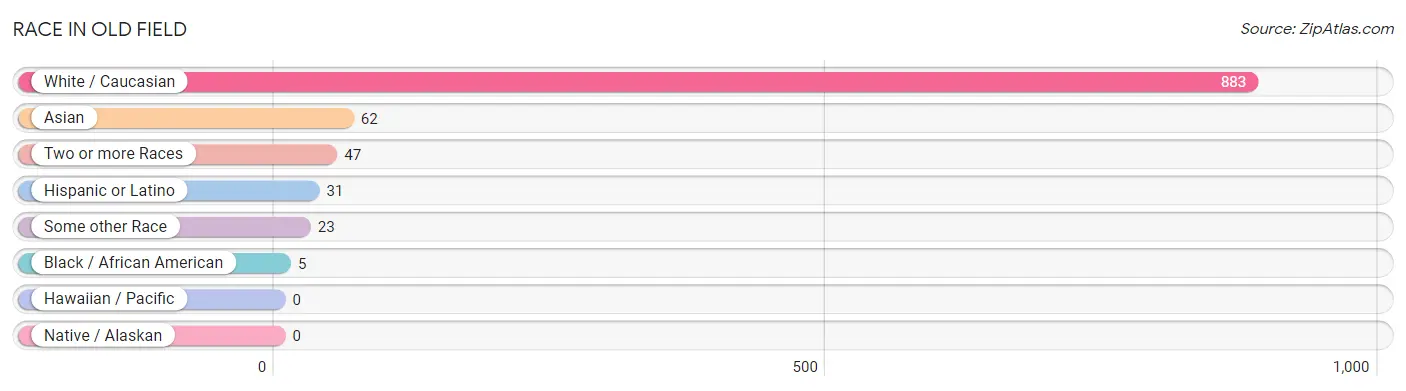
| Race | # Population | % Population |
| Asian | 62 | 6.1% |
| Black / African American | 5 | 0.5% |
| Hawaiian / Pacific | 0 | 0.0% |
| Hispanic or Latino | 31 | 3.0% |
| Native / Alaskan | 0 | 0.0% |
| White / Caucasian | 883 | 86.6% |
| Two or more Races | 47 | 4.6% |
| Some other Race | 23 | 2.2% |
| Total | 1,020 | 100.0% |
Ancestry in Old Field
The most populous ancestries reported in Old Field are Italian (260 | 25.5%), Irish (211 | 20.7%), German (107 | 10.5%), Polish (58 | 5.7%), and Russian (56 | 5.5%), together accounting for 67.8% of all Old Field residents.
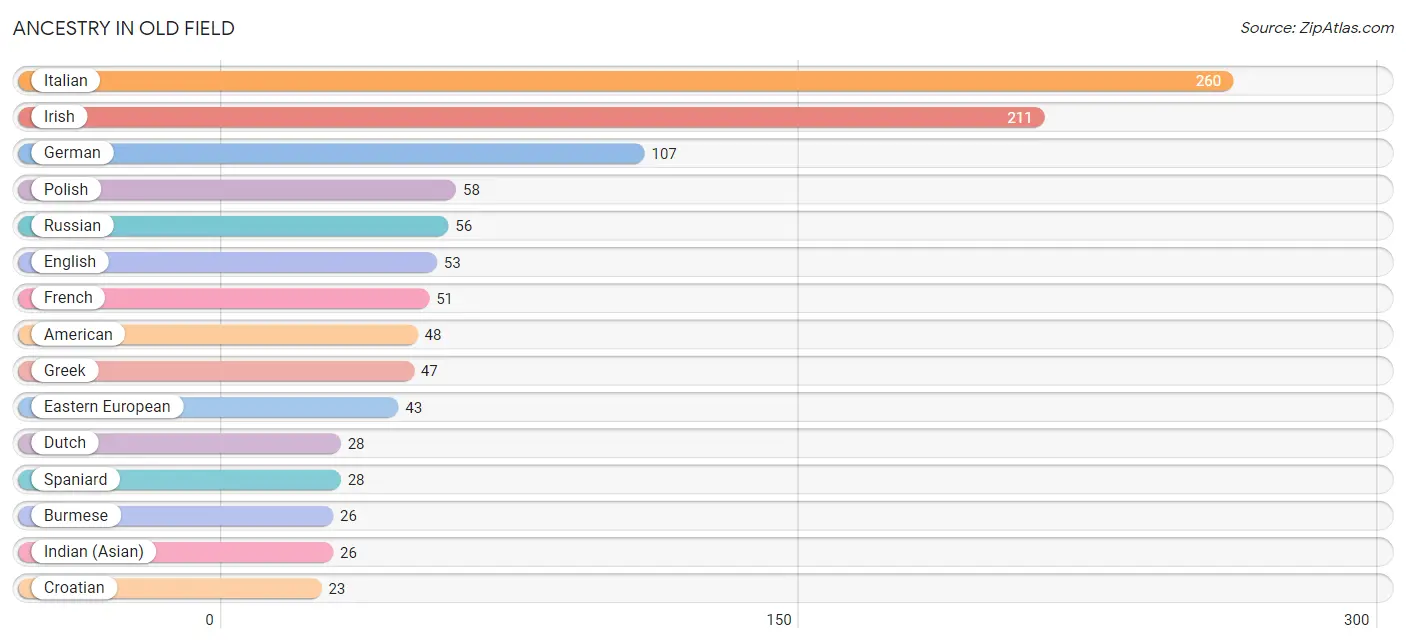
| Ancestry | # Population | % Population |
| American | 48 | 4.7% |
| Arab | 19 | 1.9% |
| Armenian | 8 | 0.8% |
| Austrian | 10 | 1.0% |
| British | 4 | 0.4% |
| Bulgarian | 4 | 0.4% |
| Burmese | 26 | 2.5% |
| Canadian | 2 | 0.2% |
| Celtic | 9 | 0.9% |
| Cherokee | 10 | 1.0% |
| Croatian | 23 | 2.2% |
| Czech | 4 | 0.4% |
| Dutch | 28 | 2.8% |
| Eastern European | 43 | 4.2% |
| Egyptian | 9 | 0.9% |
| English | 53 | 5.2% |
| European | 7 | 0.7% |
| Filipino | 4 | 0.4% |
| French | 51 | 5.0% |
| French Canadian | 2 | 0.2% |
| German | 107 | 10.5% |
| Greek | 47 | 4.6% |
| Hungarian | 22 | 2.2% |
| Icelander | 9 | 0.9% |
| Indian (Asian) | 26 | 2.5% |
| Iranian | 6 | 0.6% |
| Irish | 211 | 20.7% |
| Italian | 260 | 25.5% |
| Lithuanian | 8 | 0.8% |
| Norwegian | 2 | 0.2% |
| Polish | 58 | 5.7% |
| Portuguese | 8 | 0.8% |
| Russian | 56 | 5.5% |
| Scotch-Irish | 9 | 0.9% |
| Scottish | 14 | 1.4% |
| South American | 3 | 0.3% |
| Spaniard | 28 | 2.8% |
| Swedish | 11 | 1.1% |
| Thai | 19 | 1.9% |
| Turkish | 23 | 2.2% |
| Venezuelan | 3 | 0.3% | View All 41 Rows |
Immigrants in Old Field
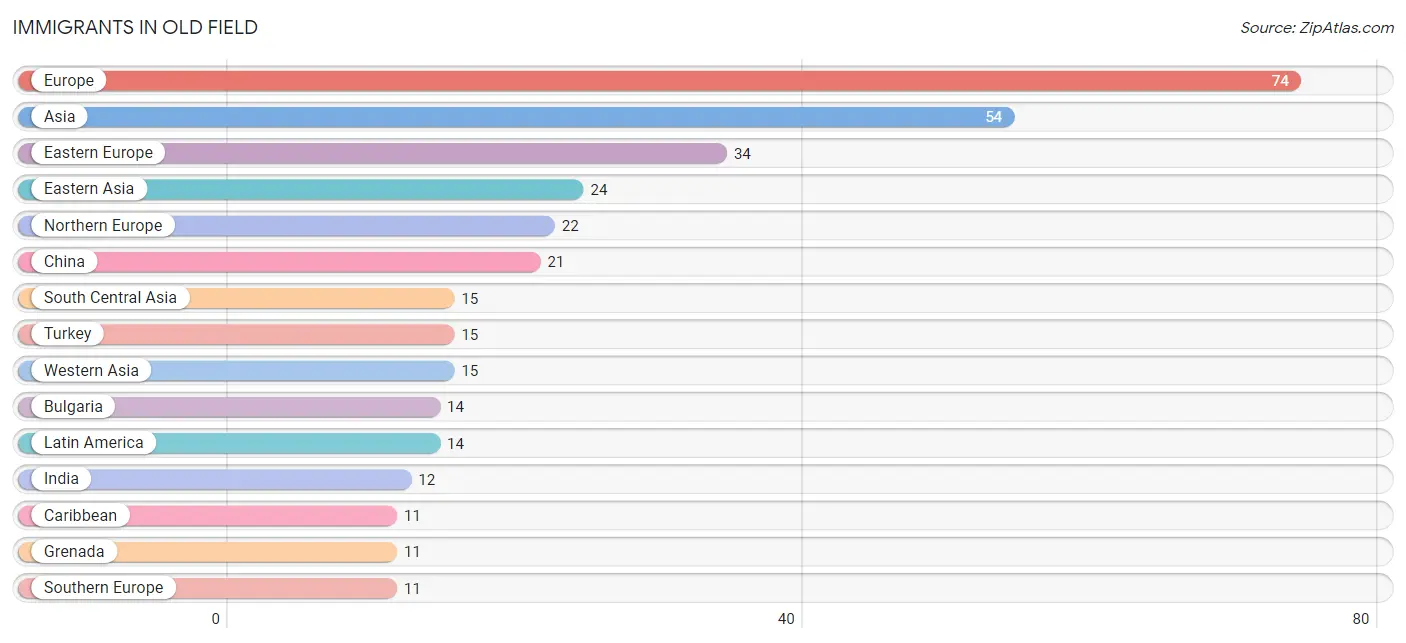
The most numerous immigrant groups reported in Old Field came from Europe (74 | 7.2%), Asia (54 | 5.3%), Eastern Europe (34 | 3.3%), Eastern Asia (24 | 2.4%), and Northern Europe (22 | 2.2%), together accounting for 20.4% of all Old Field residents.
| Immigration Origin | # Population | % Population |
| Africa | 4 | 0.4% |
| Asia | 54 | 5.3% |
| Bulgaria | 14 | 1.4% |
| Canada | 2 | 0.2% |
| Caribbean | 11 | 1.1% |
| Central America | 2 | 0.2% |
| China | 21 | 2.1% |
| Croatia | 6 | 0.6% |
| Eastern Asia | 24 | 2.4% |
| Eastern Europe | 34 | 3.3% |
| England | 6 | 0.6% |
| Europe | 74 | 7.2% |
| France | 2 | 0.2% |
| Germany | 5 | 0.5% |
| Grenada | 11 | 1.1% |
| Guatemala | 2 | 0.2% |
| Hong Kong | 6 | 0.6% |
| India | 12 | 1.2% |
| Iran | 3 | 0.3% |
| Italy | 4 | 0.4% |
| Korea | 3 | 0.3% |
| Latin America | 14 | 1.4% |
| Moldova | 3 | 0.3% |
| Northern Africa | 4 | 0.4% |
| Northern Europe | 22 | 2.2% |
| Poland | 1 | 0.1% |
| South America | 1 | 0.1% |
| South Central Asia | 15 | 1.5% |
| Southern Europe | 11 | 1.1% |
| Spain | 7 | 0.7% |
| Sweden | 7 | 0.7% |
| Turkey | 15 | 1.5% |
| Venezuela | 1 | 0.1% |
| Western Asia | 15 | 1.5% |
| Western Europe | 7 | 0.7% | View All 35 Rows |
Sex and Age in Old Field
Sex and Age in Old Field
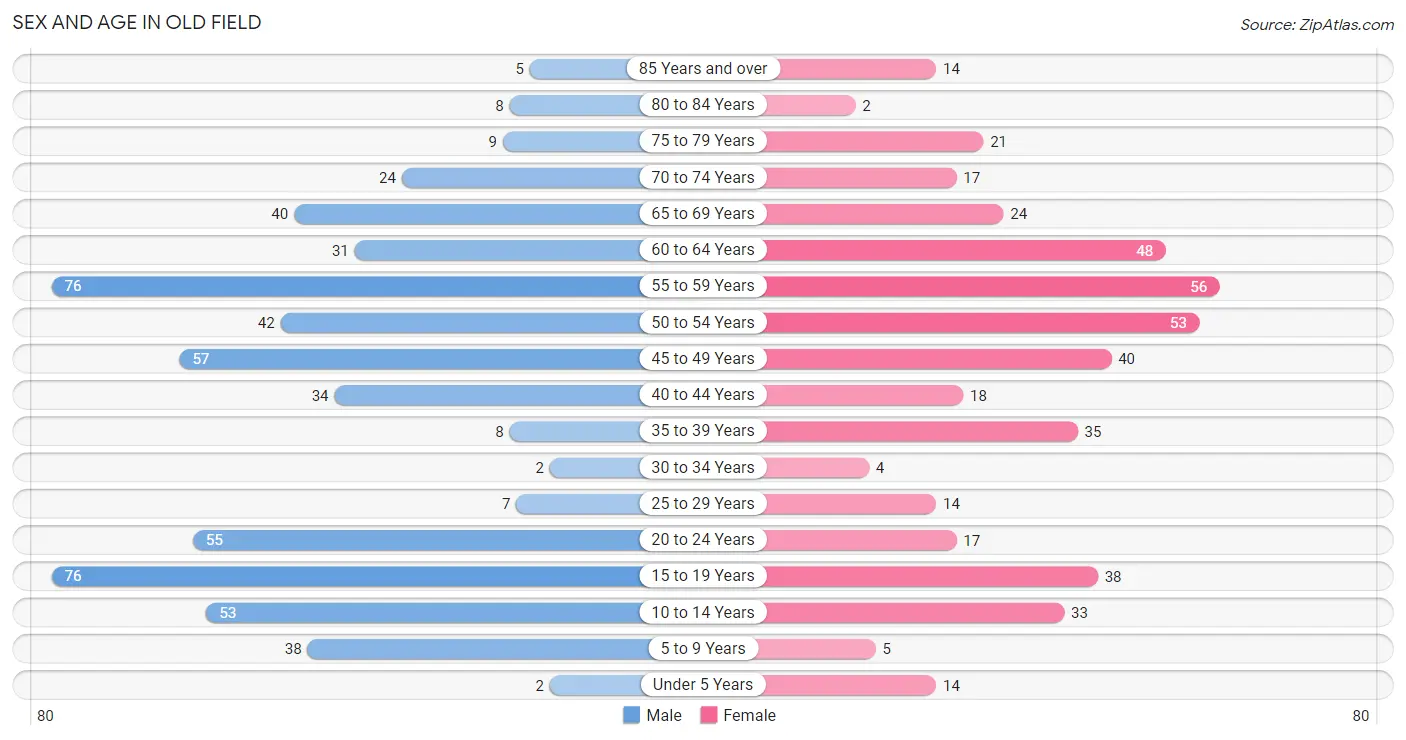
The most populous age groups in Old Field are 15 to 19 Years (76 | 13.4%) for men and 55 to 59 Years (56 | 12.4%) for women.
| Age Bracket | Male | Female |
| Under 5 Years | 2 (0.4%) | 14 (3.1%) |
| 5 to 9 Years | 38 (6.7%) | 5 (1.1%) |
| 10 to 14 Years | 53 (9.3%) | 33 (7.3%) |
| 15 to 19 Years | 76 (13.4%) | 38 (8.4%) |
| 20 to 24 Years | 55 (9.7%) | 17 (3.7%) |
| 25 to 29 Years | 7 (1.2%) | 14 (3.1%) |
| 30 to 34 Years | 2 (0.4%) | 4 (0.9%) |
| 35 to 39 Years | 8 (1.4%) | 35 (7.7%) |
| 40 to 44 Years | 34 (6.0%) | 18 (4.0%) |
| 45 to 49 Years | 57 (10.1%) | 40 (8.8%) |
| 50 to 54 Years | 42 (7.4%) | 53 (11.7%) |
| 55 to 59 Years | 76 (13.4%) | 56 (12.4%) |
| 60 to 64 Years | 31 (5.5%) | 48 (10.6%) |
| 65 to 69 Years | 40 (7.0%) | 24 (5.3%) |
| 70 to 74 Years | 24 (4.2%) | 17 (3.7%) |
| 75 to 79 Years | 9 (1.6%) | 21 (4.6%) |
| 80 to 84 Years | 8 (1.4%) | 2 (0.4%) |
| 85 Years and over | 5 (0.9%) | 14 (3.1%) |
| Total | 567 (100.0%) | 453 (100.0%) |
Families and Households in Old Field
Median Family Size in Old Field
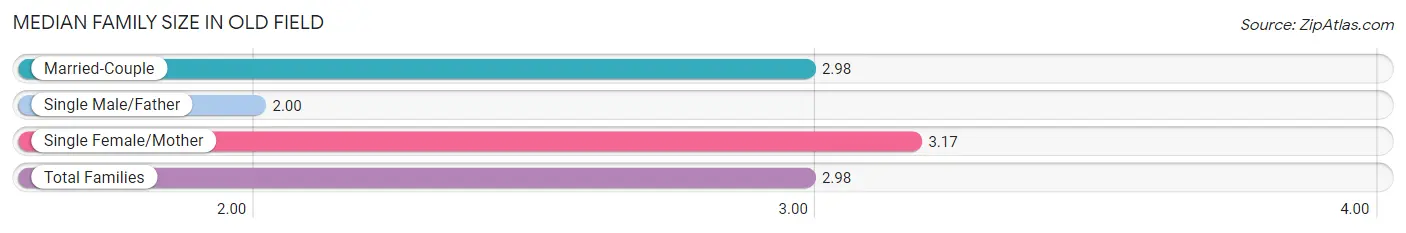
The median family size in Old Field is 2.98 persons per family, with single female/mother families (29 | 9.3%) accounting for the largest median family size of 3.17 persons per family. On the other hand, single male/father families (5 | 1.6%) represent the smallest median family size with 2.00 persons per family.
| Family Type | # Families | Family Size |
| Married-Couple | 279 (89.1%) | 2.98 |
| Single Male/Father | 5 (1.6%) | 2.00 |
| Single Female/Mother | 29 (9.3%) | 3.17 |
| Total Families | 313 (100.0%) | 2.98 |
Median Household Size in Old Field
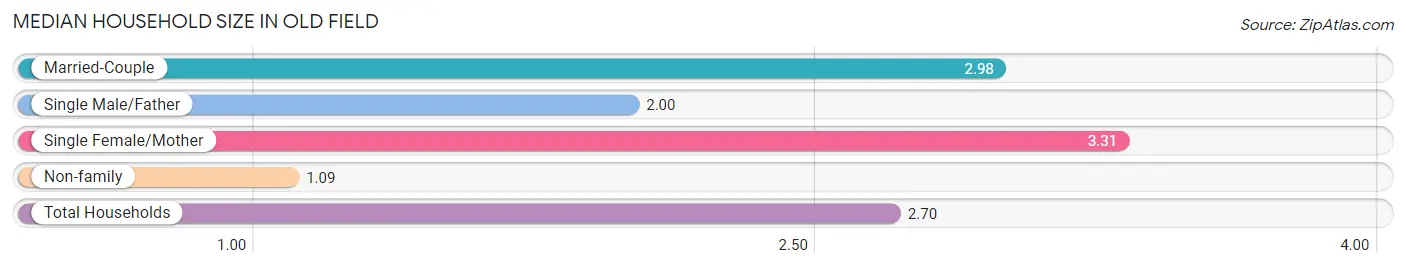
The median household size in Old Field is 2.70 persons per household, with single female/mother households (29 | 7.8%) accounting for the largest median household size of 3.31 persons per household. non-family households (57 | 15.4%) represent the smallest median household size with 1.09 persons per household.
| Household Type | # Households | Household Size |
| Married-Couple | 279 (75.4%) | 2.98 |
| Single Male/Father | 5 (1.3%) | 2.00 |
| Single Female/Mother | 29 (7.8%) | 3.31 |
| Non-family | 57 (15.4%) | 1.09 |
| Total Households | 370 (100.0%) | 2.70 |
Household Size by Marriage Status in Old Field
Out of a total of 370 households in Old Field, 313 (84.6%) are family households, while 57 (15.4%) are nonfamily households. The most numerous type of family households are 2-person households, comprising 139, and the most common type of nonfamily households are 1-person households, comprising 53.
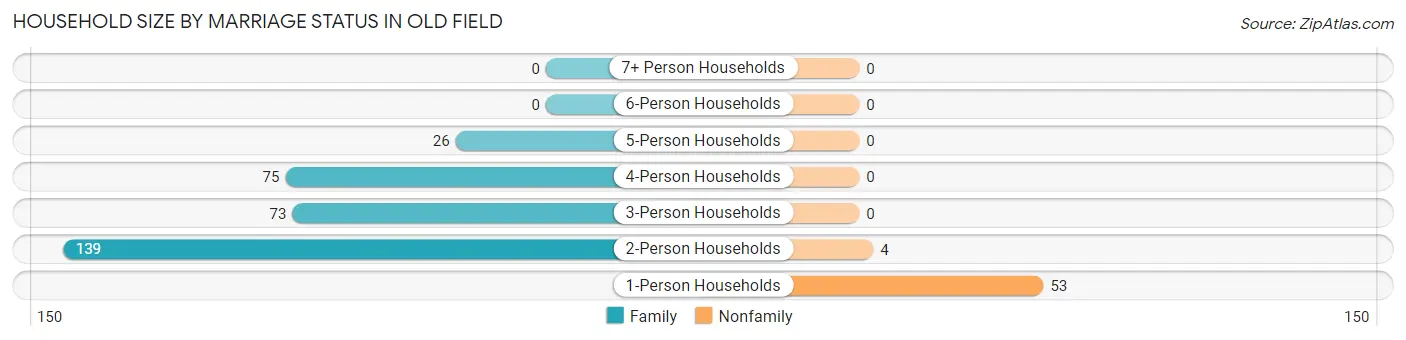
| Household Size | Family Households | Nonfamily Households |
| 1-Person Households | - | 53 (14.3%) |
| 2-Person Households | 139 (37.6%) | 4 (1.1%) |
| 3-Person Households | 73 (19.7%) | 0 (0.0%) |
| 4-Person Households | 75 (20.3%) | 0 (0.0%) |
| 5-Person Households | 26 (7.0%) | 0 (0.0%) |
| 6-Person Households | 0 (0.0%) | 0 (0.0%) |
| 7+ Person Households | 0 (0.0%) | 0 (0.0%) |
| Total | 313 (84.6%) | 57 (15.4%) |
Female Fertility in Old Field
Fertility by Age in Old Field
Average fertility rate in Old Field is 22.0 births per 1,000 women. Women in the age bracket of 35 to 50 years have the highest fertility rate with 38.0 births per 1,000 women. Women in the age bracket of 35 to 50 years acount for 100.0% of all women with births.
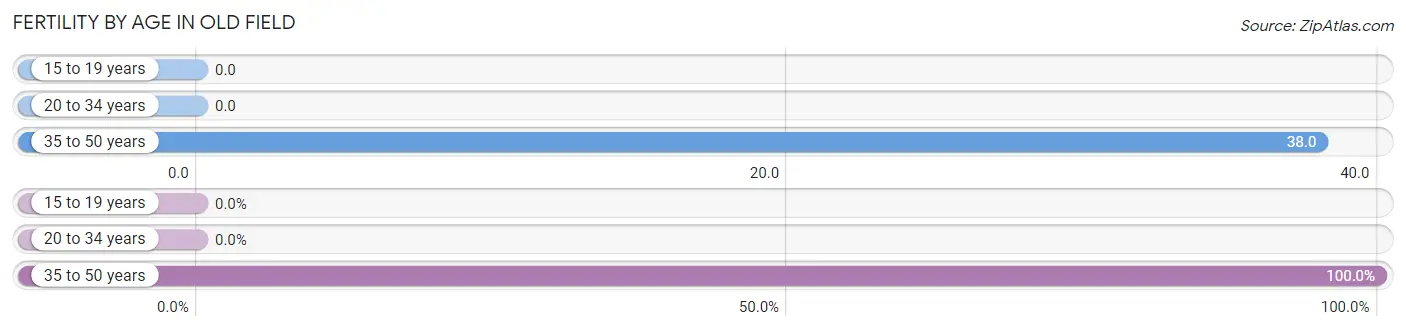
| Age Bracket | Women with Births | Births / 1,000 Women |
| 15 to 19 years | 0 (0.0%) | 0.0 |
| 20 to 34 years | 0 (0.0%) | 0.0 |
| 35 to 50 years | 4 (100.0%) | 38.0 |
| Total | 4 (100.0%) | 22.0 |
Fertility by Age by Marriage Status in Old Field
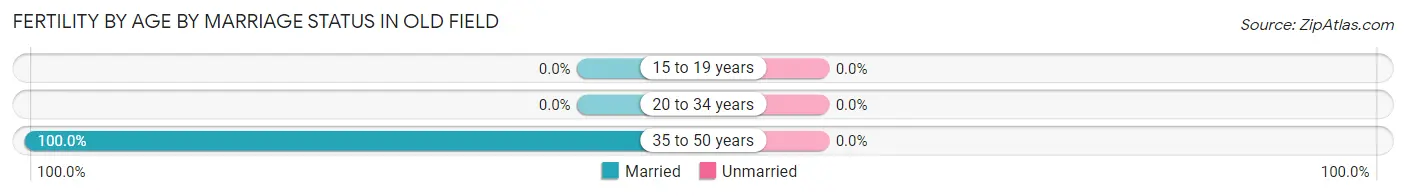
| Age Bracket | Married | Unmarried |
| 15 to 19 years | 0 (0.0%) | 0 (0.0%) |
| 20 to 34 years | 0 (0.0%) | 0 (0.0%) |
| 35 to 50 years | 4 (100.0%) | 0 (0.0%) |
| Total | 4 (100.0%) | 0 (0.0%) |
Fertility by Education in Old Field
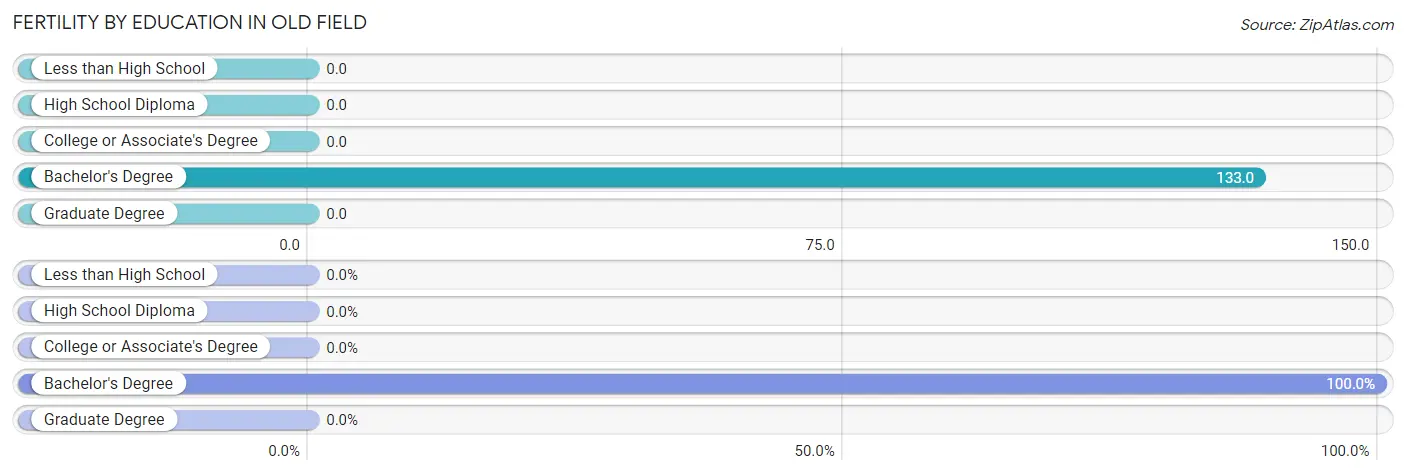
| Educational Attainment | Women with Births | Births / 1,000 Women |
| Less than High School | 0 (0.0%) | 0.0 |
| High School Diploma | 0 (0.0%) | 0.0 |
| College or Associate's Degree | 0 (0.0%) | 0.0 |
| Bachelor's Degree | 4 (100.0%) | 133.0 |
| Graduate Degree | 0 (0.0%) | 0.0 |
| Total | 4 (100.0%) | 22.0 |
Fertility by Education by Marriage Status in Old Field
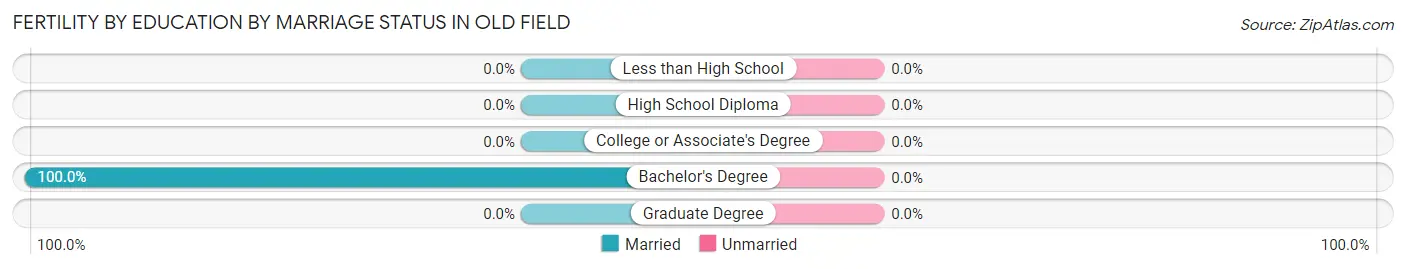
| Educational Attainment | Married | Unmarried |
| Less than High School | 0 (0.0%) | 0 (0.0%) |
| High School Diploma | 0 (0.0%) | 0 (0.0%) |
| College or Associate's Degree | 0 (0.0%) | 0 (0.0%) |
| Bachelor's Degree | 4 (100.0%) | 0 (0.0%) |
| Graduate Degree | 0 (0.0%) | 0 (0.0%) |
| Total | 4 (100.0%) | 0 (0.0%) |
Employment Characteristics in Old Field
Employment by Class of Employer in Old Field
Among the 507 employed individuals in Old Field, private company employees (229 | 45.2%), self-employed (incorporated) (102 | 20.1%), and state government employees (58 | 11.4%) make up the most common classes of employment.
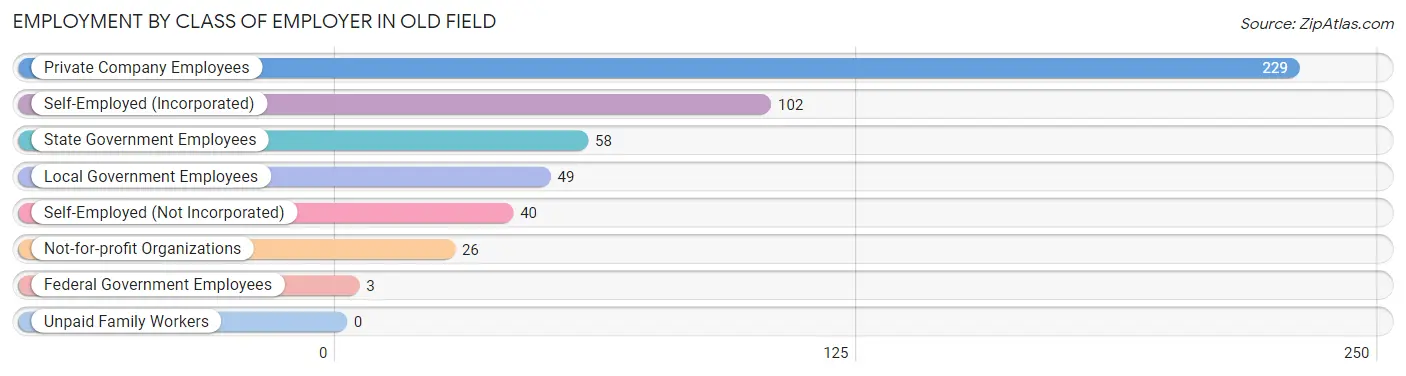
| Employer Class | # Employees | % Employees |
| Private Company Employees | 229 | 45.2% |
| Self-Employed (Incorporated) | 102 | 20.1% |
| Self-Employed (Not Incorporated) | 40 | 7.9% |
| Not-for-profit Organizations | 26 | 5.1% |
| Local Government Employees | 49 | 9.7% |
| State Government Employees | 58 | 11.4% |
| Federal Government Employees | 3 | 0.6% |
| Unpaid Family Workers | 0 | 0.0% |
| Total | 507 | 100.0% |
Employment Status by Age in Old Field
According to the labor force statistics for Old Field, out of the total population over 16 years of age (851), 62.6% or 533 individuals are in the labor force, with 3.4% or 18 of them unemployed. The age group with the highest labor force participation rate is 30 to 34 years, with 100.0% or 6 individuals in the labor force. Within the labor force, the 30 to 34 years age range has the highest percentage of unemployed individuals, with 66.7% or 4 of them being unemployed.
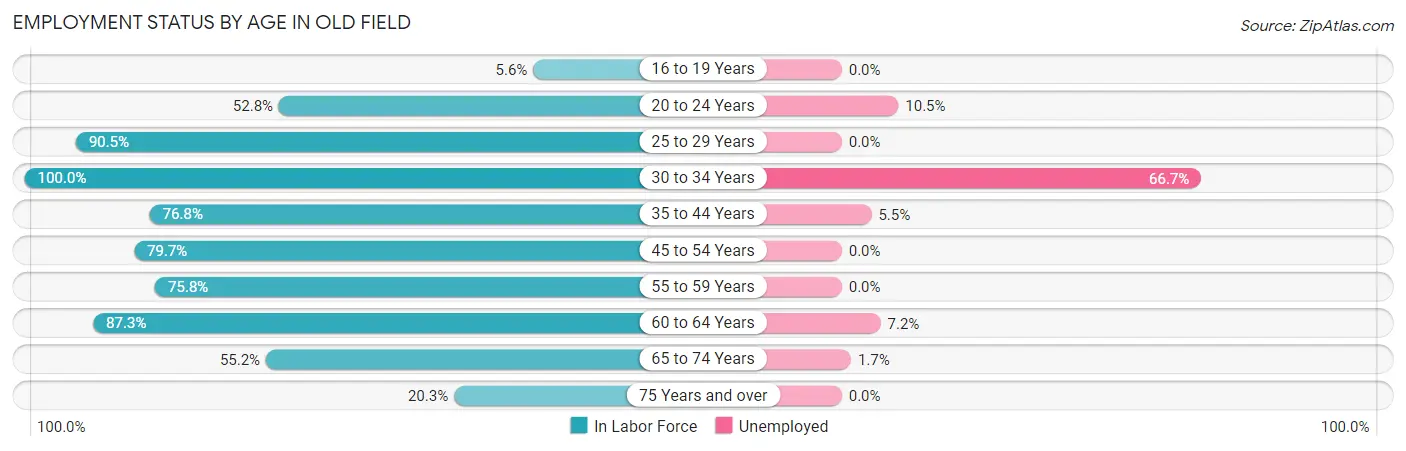
| Age Bracket | In Labor Force | Unemployed |
| 16 to 19 Years | 5 (5.6%) | 0 (0.0%) |
| 20 to 24 Years | 38 (52.8%) | 4 (10.5%) |
| 25 to 29 Years | 19 (90.5%) | 0 (0.0%) |
| 30 to 34 Years | 6 (100.0%) | 4 (66.7%) |
| 35 to 44 Years | 73 (76.8%) | 4 (5.5%) |
| 45 to 54 Years | 153 (79.7%) | 0 (0.0%) |
| 55 to 59 Years | 100 (75.8%) | 0 (0.0%) |
| 60 to 64 Years | 69 (87.3%) | 5 (7.2%) |
| 65 to 74 Years | 58 (55.2%) | 1 (1.7%) |
| 75 Years and over | 12 (20.3%) | 0 (0.0%) |
| Total | 533 (62.6%) | 18 (3.4%) |
Employment Status by Educational Attainment in Old Field
According to labor force statistics for Old Field, 80.0% of individuals (420) out of the total population between 25 and 64 years of age (525) are in the labor force, with 3.1% or 13 of them being unemployed. The group with the highest labor force participation rate are those with the educational attainment of bachelor's degree or higher, with 86.9% or 370 individuals in the labor force. Within the labor force, individuals with bachelor's degree or higher education have the highest percentage of unemployment, with 3.5% or 13 of them being unemployed.
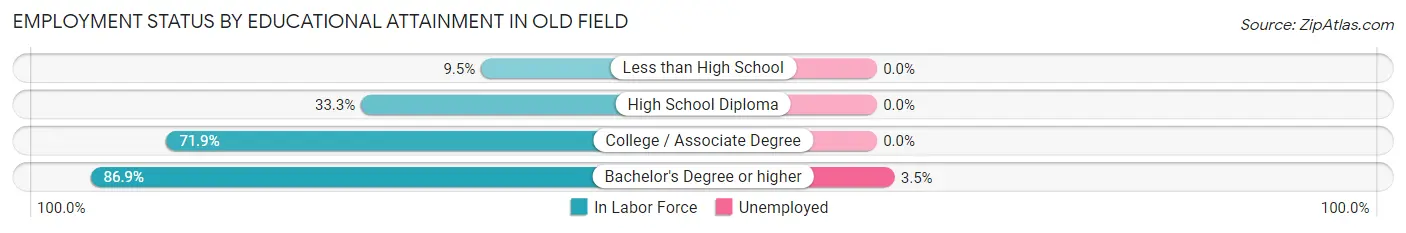
| Educational Attainment | In Labor Force | Unemployed |
| Less than High School | 2 (9.5%) | 0 (0.0%) |
| High School Diploma | 7 (33.3%) | 0 (0.0%) |
| College / Associate Degree | 41 (71.9%) | 0 (0.0%) |
| Bachelor's Degree or higher | 370 (86.9%) | 15 (3.5%) |
| Total | 420 (80.0%) | 16 (3.1%) |
Employment Occupations by Sex in Old Field
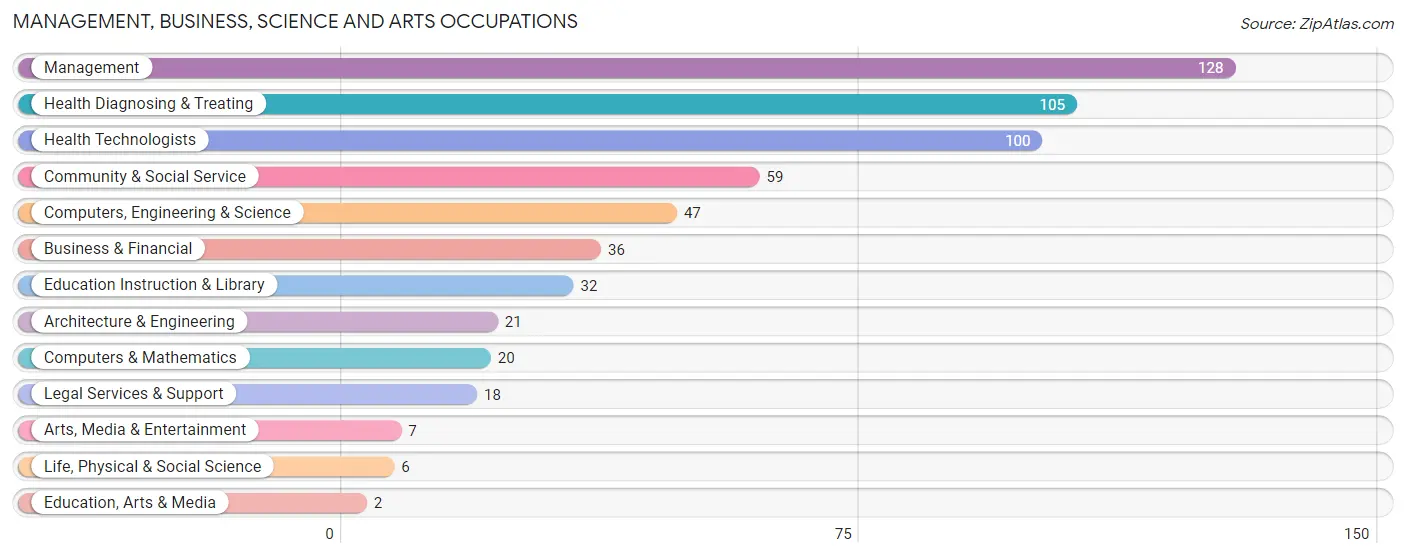
Management, Business, Science and Arts Occupations
The most common Management, Business, Science and Arts occupations in Old Field are Management (128 | 24.8%), Health Diagnosing & Treating (105 | 20.4%), Health Technologists (100 | 19.4%), Community & Social Service (59 | 11.5%), and Computers, Engineering & Science (47 | 9.1%).
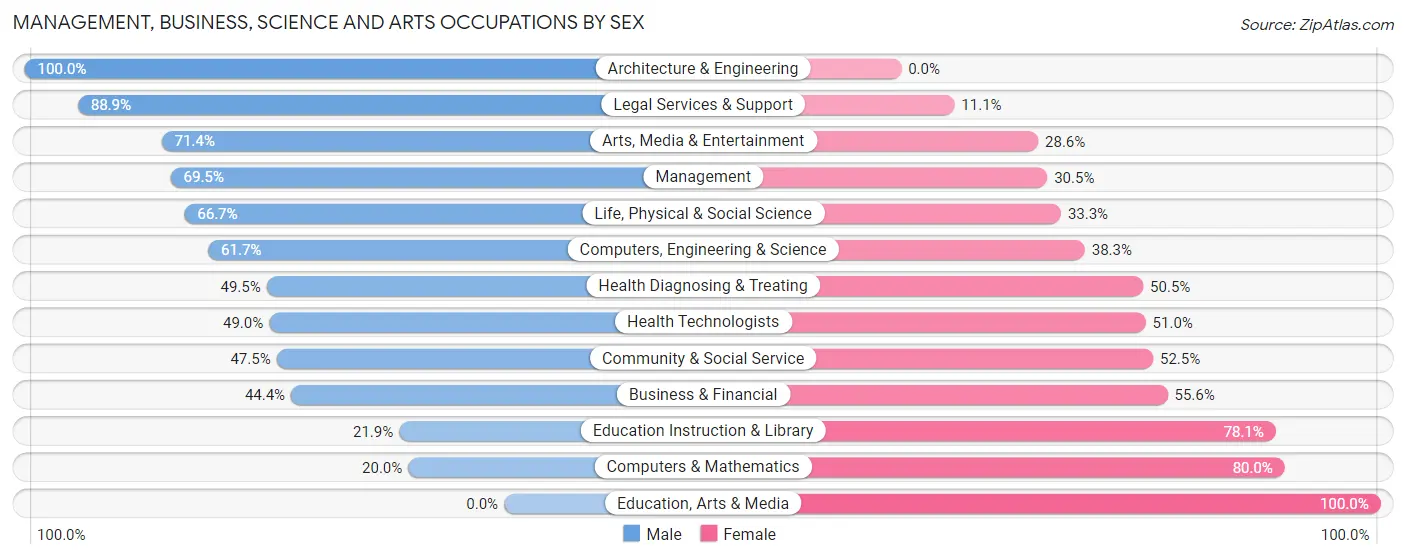
Management, Business, Science and Arts Occupations by Sex
Within the Management, Business, Science and Arts occupations in Old Field, the most male-oriented occupations are Architecture & Engineering (100.0%), Legal Services & Support (88.9%), and Arts, Media & Entertainment (71.4%), while the most female-oriented occupations are Education, Arts & Media (100.0%), Computers & Mathematics (80.0%), and Education Instruction & Library (78.1%).
| Occupation | Male | Female |
| Management | 89 (69.5%) | 39 (30.5%) |
| Business & Financial | 16 (44.4%) | 20 (55.6%) |
| Computers, Engineering & Science | 29 (61.7%) | 18 (38.3%) |
| Computers & Mathematics | 4 (20.0%) | 16 (80.0%) |
| Architecture & Engineering | 21 (100.0%) | 0 (0.0%) |
| Life, Physical & Social Science | 4 (66.7%) | 2 (33.3%) |
| Community & Social Service | 28 (47.5%) | 31 (52.5%) |
| Education, Arts & Media | 0 (0.0%) | 2 (100.0%) |
| Legal Services & Support | 16 (88.9%) | 2 (11.1%) |
| Education Instruction & Library | 7 (21.9%) | 25 (78.1%) |
| Arts, Media & Entertainment | 5 (71.4%) | 2 (28.6%) |
| Health Diagnosing & Treating | 52 (49.5%) | 53 (50.5%) |
| Health Technologists | 49 (49.0%) | 51 (51.0%) |
| Total (Category) | 214 (57.1%) | 161 (42.9%) |
| Total (Overall) | 307 (59.6%) | 208 (40.4%) |
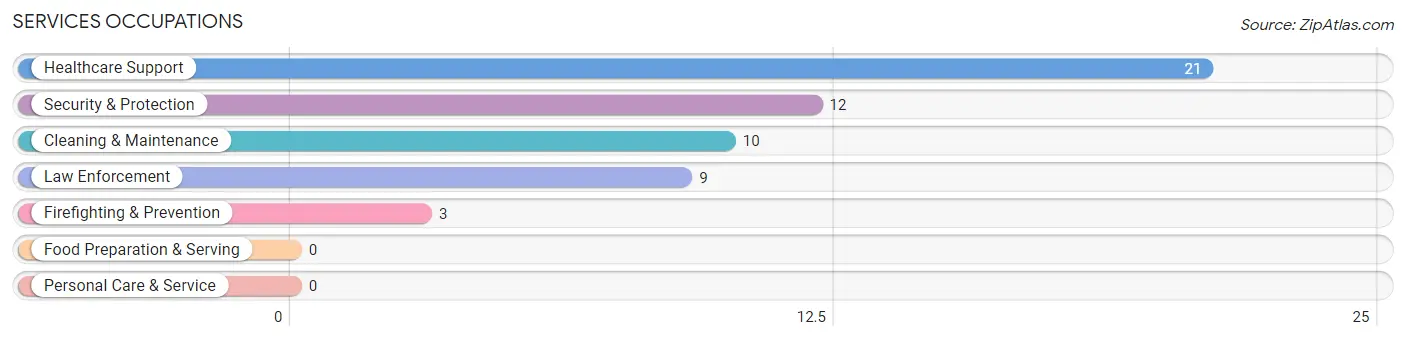
Services Occupations
The most common Services occupations in Old Field are Healthcare Support (21 | 4.1%), Security & Protection (12 | 2.3%), Cleaning & Maintenance (10 | 1.9%), Law Enforcement (9 | 1.8%), and Firefighting & Prevention (3 | 0.6%).
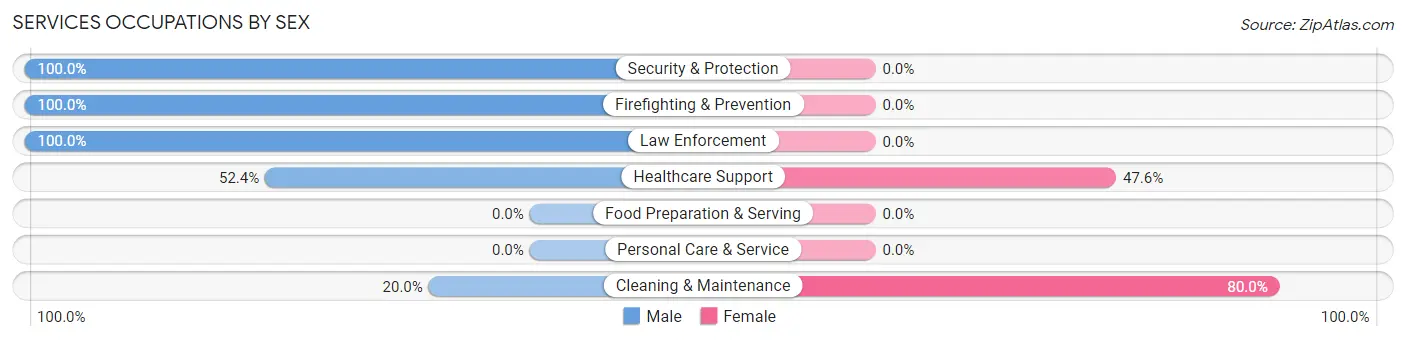
Services Occupations by Sex
Within the Services occupations in Old Field, the most male-oriented occupations are Security & Protection (100.0%), Firefighting & Prevention (100.0%), and Law Enforcement (100.0%), while the most female-oriented occupations are Cleaning & Maintenance (80.0%), and Healthcare Support (47.6%).
| Occupation | Male | Female |
| Healthcare Support | 11 (52.4%) | 10 (47.6%) |
| Security & Protection | 12 (100.0%) | 0 (0.0%) |
| Firefighting & Prevention | 3 (100.0%) | 0 (0.0%) |
| Law Enforcement | 9 (100.0%) | 0 (0.0%) |
| Food Preparation & Serving | 0 (0.0%) | 0 (0.0%) |
| Cleaning & Maintenance | 2 (20.0%) | 8 (80.0%) |
| Personal Care & Service | 0 (0.0%) | 0 (0.0%) |
| Total (Category) | 25 (58.1%) | 18 (41.9%) |
| Total (Overall) | 307 (59.6%) | 208 (40.4%) |
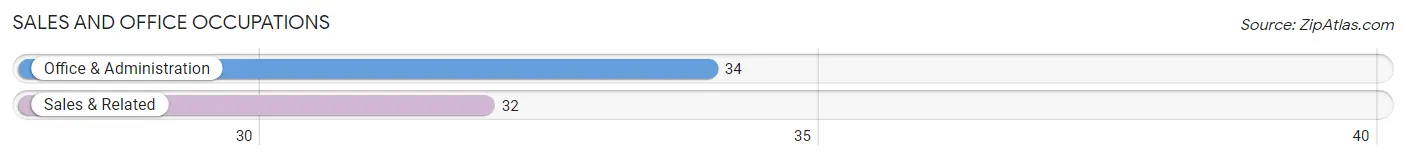
Sales and Office Occupations
The most common Sales and Office occupations in Old Field are Office & Administration (34 | 6.6%), and Sales & Related (32 | 6.2%).
Sales and Office Occupations by Sex
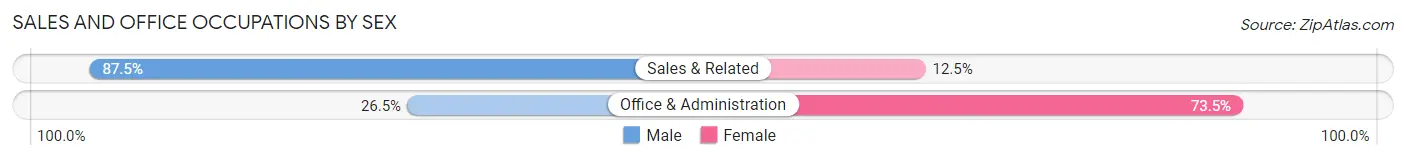
| Occupation | Male | Female |
| Sales & Related | 28 (87.5%) | 4 (12.5%) |
| Office & Administration | 9 (26.5%) | 25 (73.5%) |
| Total (Category) | 37 (56.1%) | 29 (43.9%) |
| Total (Overall) | 307 (59.6%) | 208 (40.4%) |
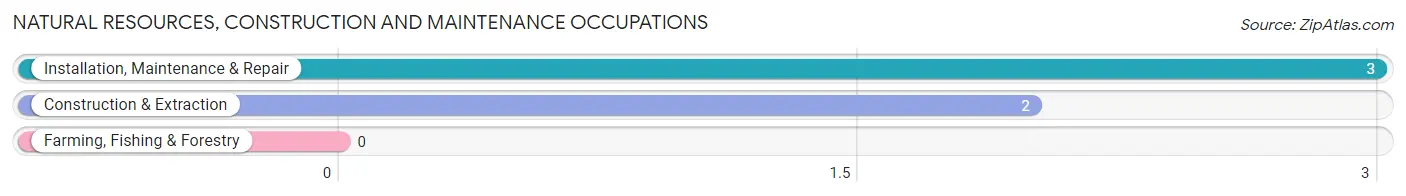
Natural Resources, Construction and Maintenance Occupations
The most common Natural Resources, Construction and Maintenance occupations in Old Field are Installation, Maintenance & Repair (3 | 0.6%), and Construction & Extraction (2 | 0.4%).
Natural Resources, Construction and Maintenance Occupations by Sex
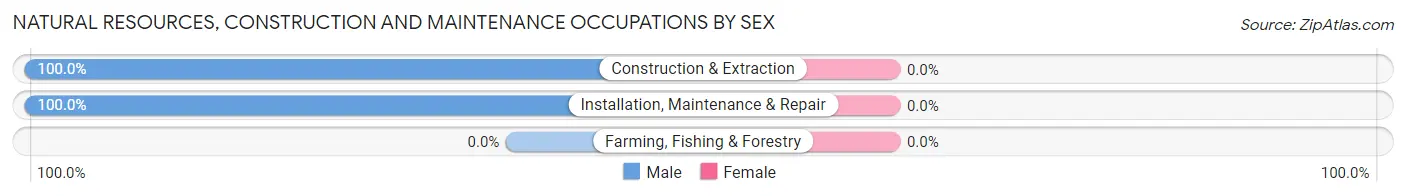
| Occupation | Male | Female |
| Farming, Fishing & Forestry | 0 (0.0%) | 0 (0.0%) |
| Construction & Extraction | 2 (100.0%) | 0 (0.0%) |
| Installation, Maintenance & Repair | 3 (100.0%) | 0 (0.0%) |
| Total (Category) | 5 (100.0%) | 0 (0.0%) |
| Total (Overall) | 307 (59.6%) | 208 (40.4%) |
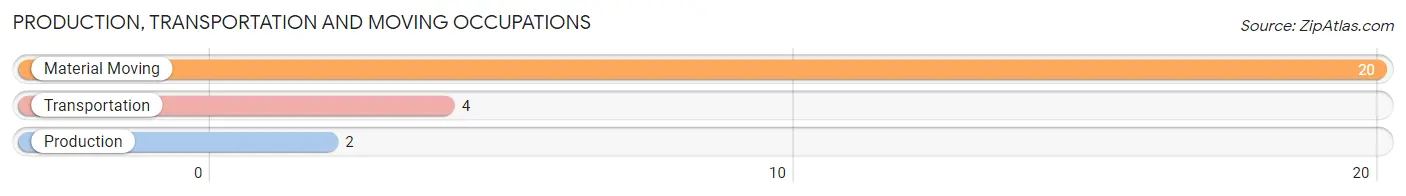
Production, Transportation and Moving Occupations
The most common Production, Transportation and Moving occupations in Old Field are Material Moving (20 | 3.9%), Transportation (4 | 0.8%), and Production (2 | 0.4%).
Production, Transportation and Moving Occupations by Sex
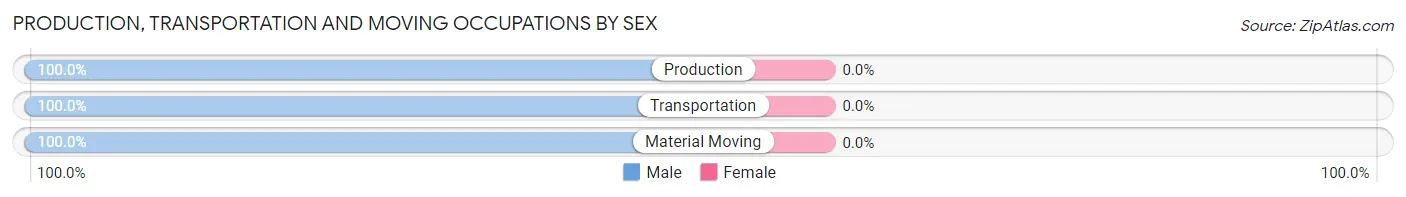
| Occupation | Male | Female |
| Production | 2 (100.0%) | 0 (0.0%) |
| Transportation | 4 (100.0%) | 0 (0.0%) |
| Material Moving | 20 (100.0%) | 0 (0.0%) |
| Total (Category) | 26 (100.0%) | 0 (0.0%) |
| Total (Overall) | 307 (59.6%) | 208 (40.4%) |
Employment Industries by Sex in Old Field
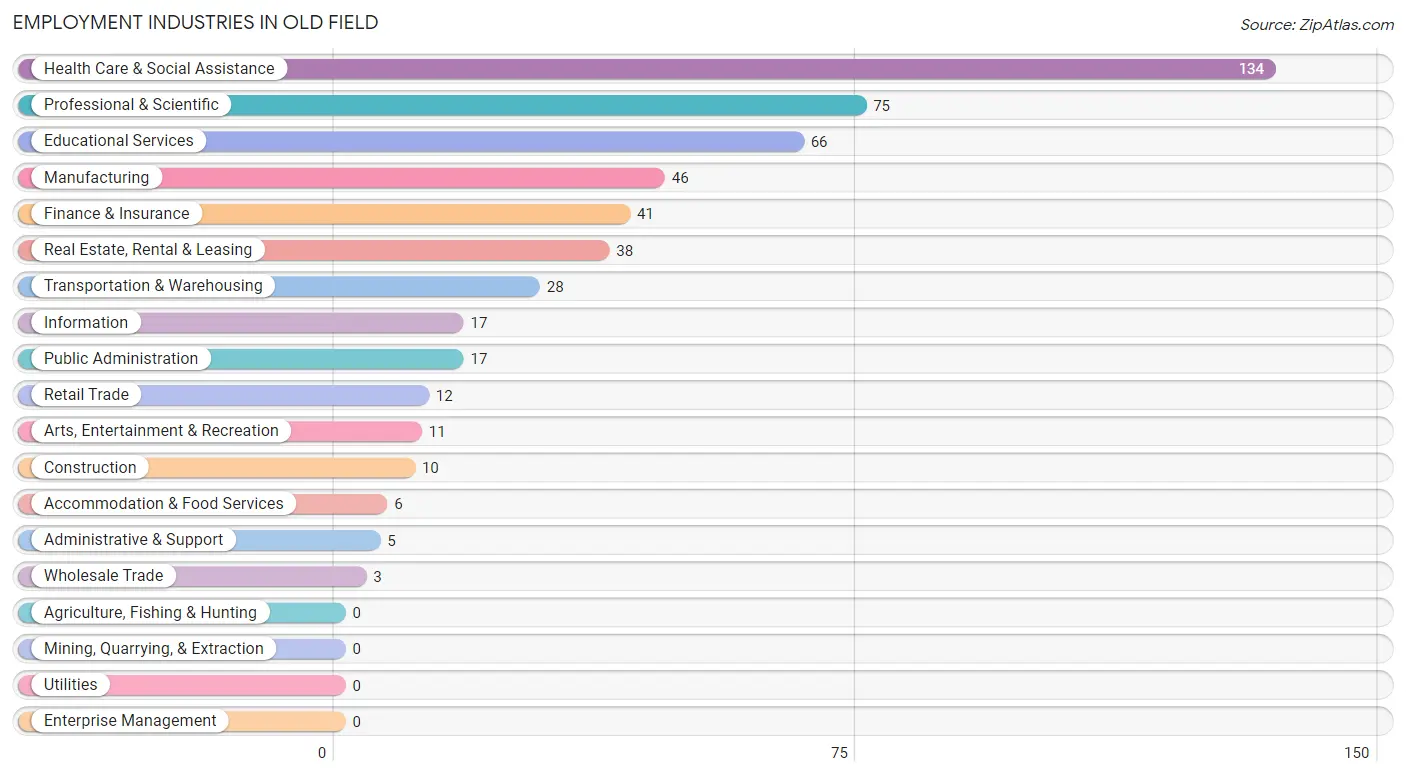
Employment Industries in Old Field
The major employment industries in Old Field include Health Care & Social Assistance (134 | 26.0%), Professional & Scientific (75 | 14.6%), Educational Services (66 | 12.8%), Manufacturing (46 | 8.9%), and Finance & Insurance (41 | 8.0%).
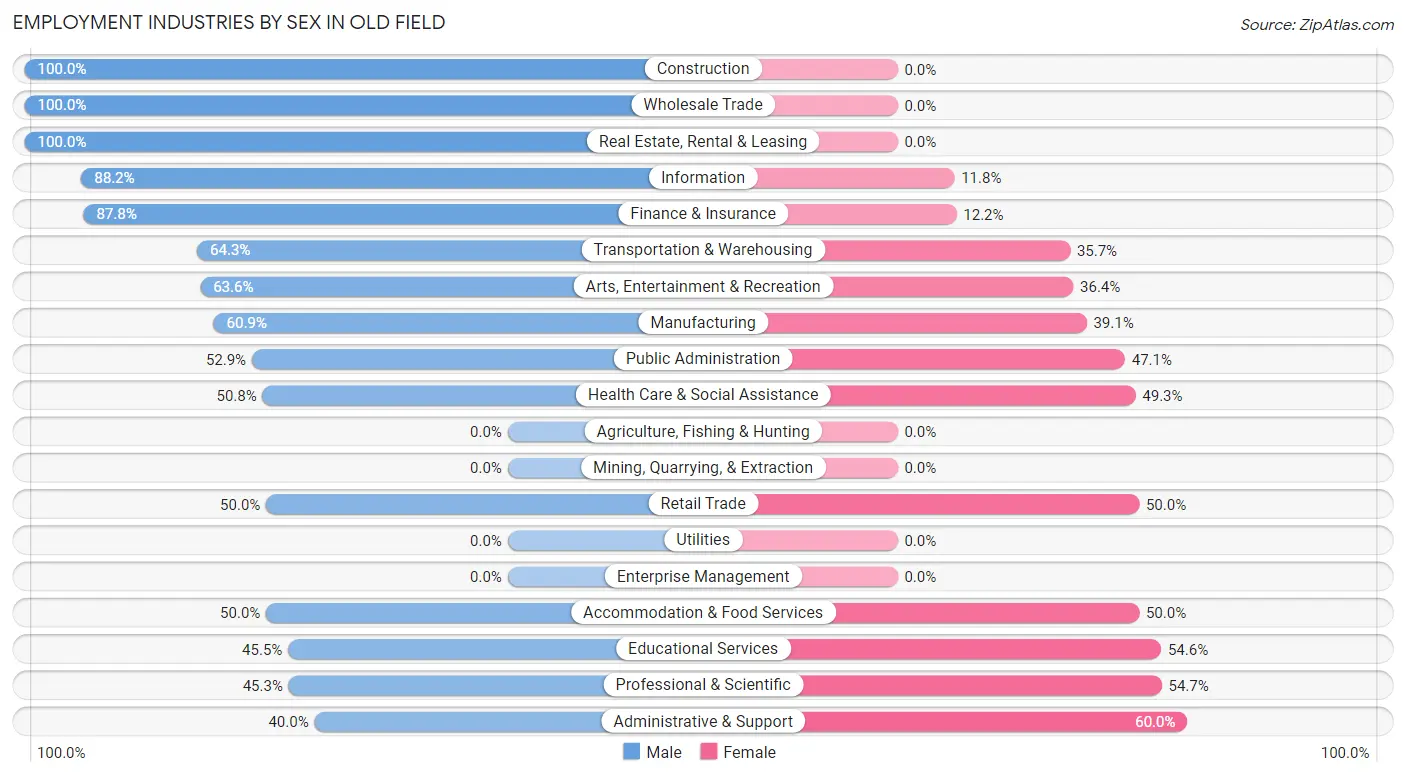
Employment Industries by Sex in Old Field
The Old Field industries that see more men than women are Construction (100.0%), Wholesale Trade (100.0%), and Real Estate, Rental & Leasing (100.0%), whereas the industries that tend to have a higher number of women are Administrative & Support (60.0%), Professional & Scientific (54.7%), and Educational Services (54.5%).
| Industry | Male | Female |
| Agriculture, Fishing & Hunting | 0 (0.0%) | 0 (0.0%) |
| Mining, Quarrying, & Extraction | 0 (0.0%) | 0 (0.0%) |
| Construction | 10 (100.0%) | 0 (0.0%) |
| Manufacturing | 28 (60.9%) | 18 (39.1%) |
| Wholesale Trade | 3 (100.0%) | 0 (0.0%) |
| Retail Trade | 6 (50.0%) | 6 (50.0%) |
| Transportation & Warehousing | 18 (64.3%) | 10 (35.7%) |
| Utilities | 0 (0.0%) | 0 (0.0%) |
| Information | 15 (88.2%) | 2 (11.8%) |
| Finance & Insurance | 36 (87.8%) | 5 (12.2%) |
| Real Estate, Rental & Leasing | 38 (100.0%) | 0 (0.0%) |
| Professional & Scientific | 34 (45.3%) | 41 (54.7%) |
| Enterprise Management | 0 (0.0%) | 0 (0.0%) |
| Administrative & Support | 2 (40.0%) | 3 (60.0%) |
| Educational Services | 30 (45.5%) | 36 (54.5%) |
| Health Care & Social Assistance | 68 (50.7%) | 66 (49.2%) |
| Arts, Entertainment & Recreation | 7 (63.6%) | 4 (36.4%) |
| Accommodation & Food Services | 3 (50.0%) | 3 (50.0%) |
| Public Administration | 9 (52.9%) | 8 (47.1%) |
| Total | 307 (59.6%) | 208 (40.4%) |
Education in Old Field
School Enrollment in Old Field
The most common levels of schooling among the 320 students in Old Field are high school (98 | 30.6%), college / undergraduate (84 | 26.3%), and middle school (63 | 19.7%).
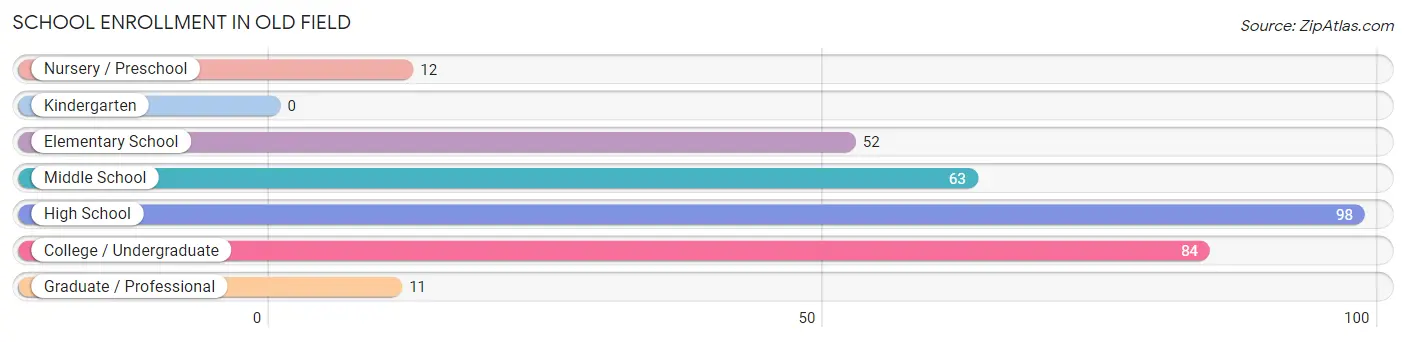
| School Level | # Students | % Students |
| Nursery / Preschool | 12 | 3.7% |
| Kindergarten | 0 | 0.0% |
| Elementary School | 52 | 16.3% |
| Middle School | 63 | 19.7% |
| High School | 98 | 30.6% |
| College / Undergraduate | 84 | 26.3% |
| Graduate / Professional | 11 | 3.4% |
| Total | 320 | 100.0% |
School Enrollment by Age by Funding Source in Old Field
Out of a total of 320 students who are enrolled in schools in Old Field, 76 (23.8%) attend a private institution, while the remaining 244 (76.2%) are enrolled in public schools. The age group of 3 to 4 year olds has the highest likelihood of being enrolled in private schools, with 12 (100.0% in the age bracket) enrolled. Conversely, the age group of 25 to 34 year olds has the lowest likelihood of being enrolled in a private school, with 6 (100.0% in the age bracket) attending a public institution.
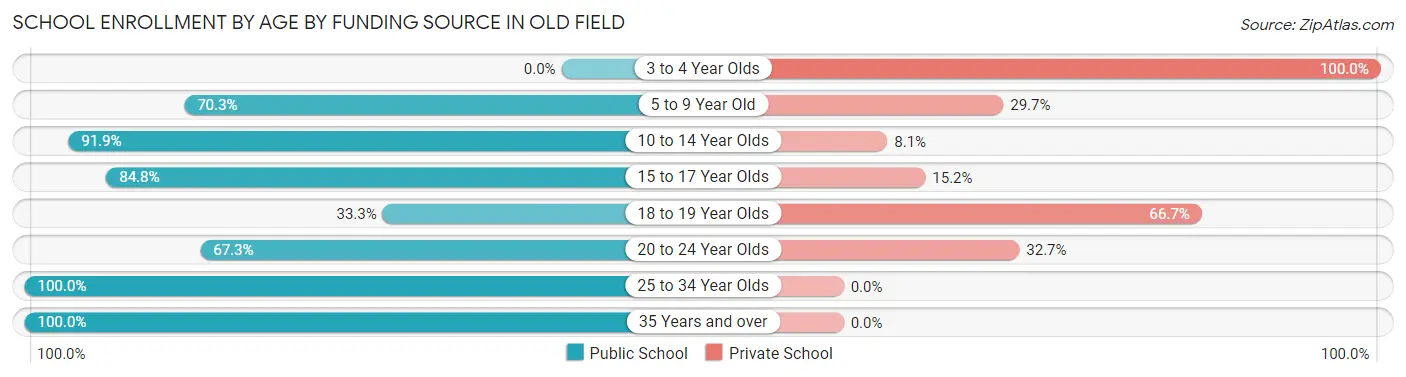
| Age Bracket | Public School | Private School |
| 3 to 4 Year Olds | 0 (0.0%) | 12 (100.0%) |
| 5 to 9 Year Old | 26 (70.3%) | 11 (29.7%) |
| 10 to 14 Year Olds | 79 (91.9%) | 7 (8.1%) |
| 15 to 17 Year Olds | 78 (84.8%) | 14 (15.2%) |
| 18 to 19 Year Olds | 7 (33.3%) | 14 (66.7%) |
| 20 to 24 Year Olds | 37 (67.3%) | 18 (32.7%) |
| 25 to 34 Year Olds | 6 (100.0%) | 0 (0.0%) |
| 35 Years and over | 11 (100.0%) | 0 (0.0%) |
| Total | 244 (76.3%) | 76 (23.8%) |
Educational Attainment by Field of Study in Old Field
Business (107 | 16.7%), bio, nature & agricultural (70 | 11.0%), science & technology (63 | 9.9%), physical & health sciences (61 | 9.6%), and computers & mathematics (59 | 9.2%) are the most common fields of study among 639 individuals in Old Field who have obtained a bachelor's degree or higher.
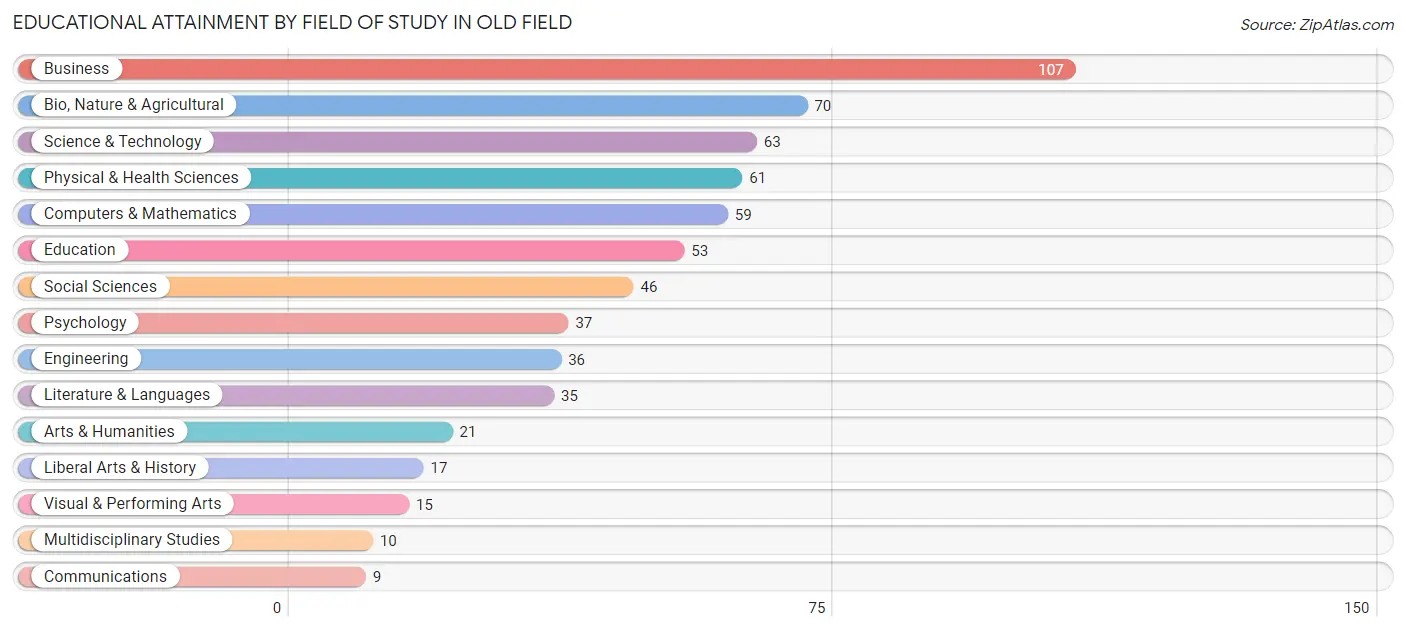
| Field of Study | # Graduates | % Graduates |
| Computers & Mathematics | 59 | 9.2% |
| Bio, Nature & Agricultural | 70 | 11.0% |
| Physical & Health Sciences | 61 | 9.6% |
| Psychology | 37 | 5.8% |
| Social Sciences | 46 | 7.2% |
| Engineering | 36 | 5.6% |
| Multidisciplinary Studies | 10 | 1.6% |
| Science & Technology | 63 | 9.9% |
| Business | 107 | 16.7% |
| Education | 53 | 8.3% |
| Literature & Languages | 35 | 5.5% |
| Liberal Arts & History | 17 | 2.7% |
| Visual & Performing Arts | 15 | 2.4% |
| Communications | 9 | 1.4% |
| Arts & Humanities | 21 | 3.3% |
| Total | 639 | 100.0% |
Transportation & Commute in Old Field
Vehicle Availability by Sex in Old Field
The most prevalent vehicle ownership categories in Old Field are males with 2 vehicles (129, accounting for 42.6%) and females with 2 vehicles (85, making up 63.2%).
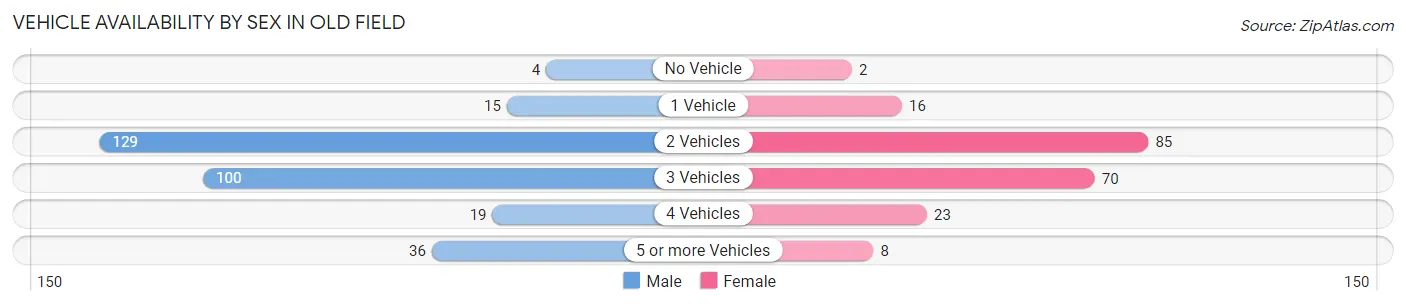
| Vehicles Available | Male | Female |
| No Vehicle | 4 (1.3%) | 2 (1.0%) |
| 1 Vehicle | 15 (5.0%) | 16 (7.8%) |
| 2 Vehicles | 129 (42.6%) | 85 (41.7%) |
| 3 Vehicles | 100 (33.0%) | 70 (34.3%) |
| 4 Vehicles | 19 (6.3%) | 23 (11.3%) |
| 5 or more Vehicles | 36 (11.9%) | 8 (3.9%) |
| Total | 303 (100.0%) | 204 (100.0%) |
Commute Time in Old Field
The most frequently occuring commute durations in Old Field are 10 to 14 minutes (111 commuters, 26.7%), 15 to 19 minutes (70 commuters, 16.8%), and 5 to 9 minutes (47 commuters, 11.3%).
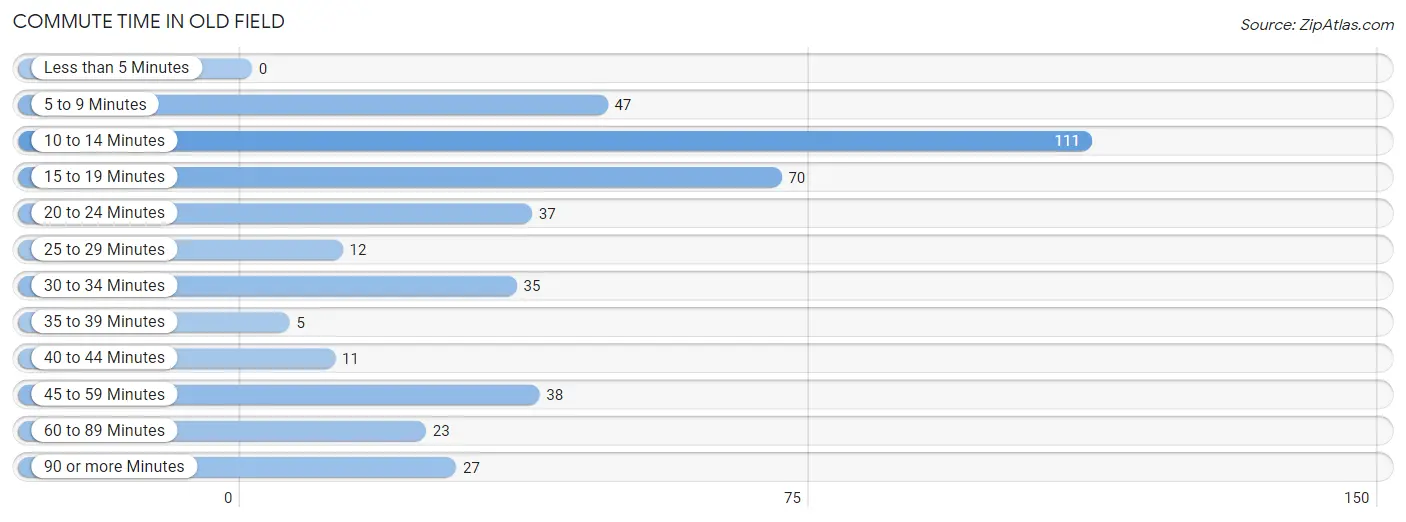
| Commute Time | # Commuters | % Commuters |
| Less than 5 Minutes | 0 | 0.0% |
| 5 to 9 Minutes | 47 | 11.3% |
| 10 to 14 Minutes | 111 | 26.7% |
| 15 to 19 Minutes | 70 | 16.8% |
| 20 to 24 Minutes | 37 | 8.9% |
| 25 to 29 Minutes | 12 | 2.9% |
| 30 to 34 Minutes | 35 | 8.4% |
| 35 to 39 Minutes | 5 | 1.2% |
| 40 to 44 Minutes | 11 | 2.6% |
| 45 to 59 Minutes | 38 | 9.1% |
| 60 to 89 Minutes | 23 | 5.5% |
| 90 or more Minutes | 27 | 6.5% |
Commute Time by Sex in Old Field
The most common commute times in Old Field are 10 to 14 minutes (71 commuters, 27.1%) for males and 10 to 14 minutes (40 commuters, 26.0%) for females.
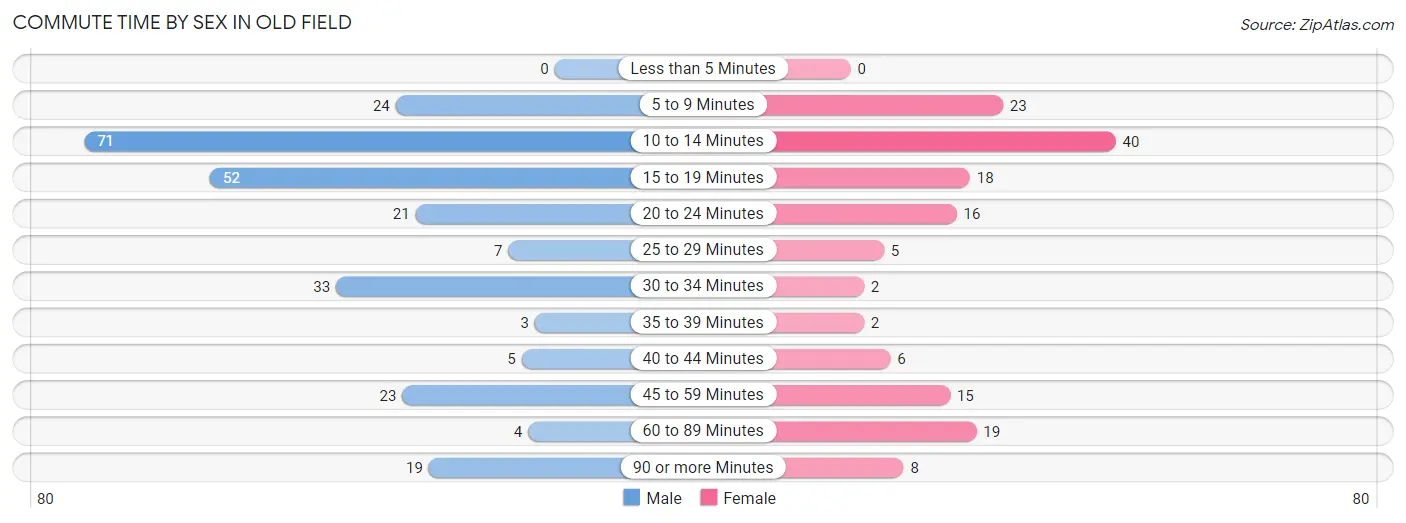
| Commute Time | Male | Female |
| Less than 5 Minutes | 0 (0.0%) | 0 (0.0%) |
| 5 to 9 Minutes | 24 (9.2%) | 23 (14.9%) |
| 10 to 14 Minutes | 71 (27.1%) | 40 (26.0%) |
| 15 to 19 Minutes | 52 (19.9%) | 18 (11.7%) |
| 20 to 24 Minutes | 21 (8.0%) | 16 (10.4%) |
| 25 to 29 Minutes | 7 (2.7%) | 5 (3.3%) |
| 30 to 34 Minutes | 33 (12.6%) | 2 (1.3%) |
| 35 to 39 Minutes | 3 (1.1%) | 2 (1.3%) |
| 40 to 44 Minutes | 5 (1.9%) | 6 (3.9%) |
| 45 to 59 Minutes | 23 (8.8%) | 15 (9.7%) |
| 60 to 89 Minutes | 4 (1.5%) | 19 (12.3%) |
| 90 or more Minutes | 19 (7.2%) | 8 (5.2%) |
Time of Departure to Work by Sex in Old Field
The most frequent times of departure to work in Old Field are 8:30 AM to 8:59 AM (57, 21.8%) for males and 9:00 AM to 9:59 AM (48, 31.2%) for females.
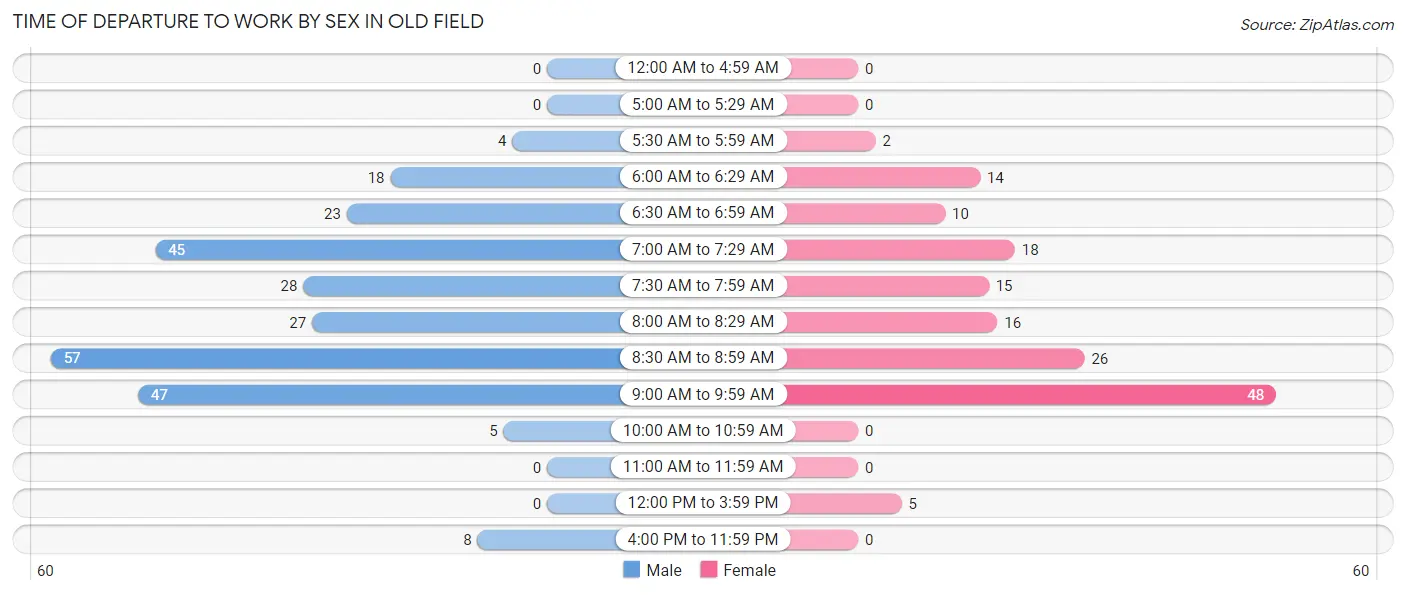
| Time of Departure | Male | Female |
| 12:00 AM to 4:59 AM | 0 (0.0%) | 0 (0.0%) |
| 5:00 AM to 5:29 AM | 0 (0.0%) | 0 (0.0%) |
| 5:30 AM to 5:59 AM | 4 (1.5%) | 2 (1.3%) |
| 6:00 AM to 6:29 AM | 18 (6.9%) | 14 (9.1%) |
| 6:30 AM to 6:59 AM | 23 (8.8%) | 10 (6.5%) |
| 7:00 AM to 7:29 AM | 45 (17.2%) | 18 (11.7%) |
| 7:30 AM to 7:59 AM | 28 (10.7%) | 15 (9.7%) |
| 8:00 AM to 8:29 AM | 27 (10.3%) | 16 (10.4%) |
| 8:30 AM to 8:59 AM | 57 (21.8%) | 26 (16.9%) |
| 9:00 AM to 9:59 AM | 47 (17.9%) | 48 (31.2%) |
| 10:00 AM to 10:59 AM | 5 (1.9%) | 0 (0.0%) |
| 11:00 AM to 11:59 AM | 0 (0.0%) | 0 (0.0%) |
| 12:00 PM to 3:59 PM | 0 (0.0%) | 5 (3.3%) |
| 4:00 PM to 11:59 PM | 8 (3.0%) | 0 (0.0%) |
| Total | 262 (100.0%) | 154 (100.0%) |
Housing Occupancy in Old Field
Occupancy by Ownership in Old Field
Of the total 370 dwellings in Old Field, owner-occupied units account for 320 (86.5%), while renter-occupied units make up 50 (13.5%).
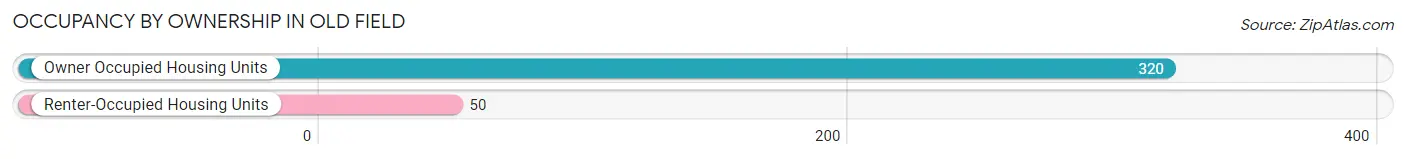
| Occupancy | # Housing Units | % Housing Units |
| Owner Occupied Housing Units | 320 | 86.5% |
| Renter-Occupied Housing Units | 50 | 13.5% |
| Total Occupied Housing Units | 370 | 100.0% |
Occupancy by Household Size in Old Field
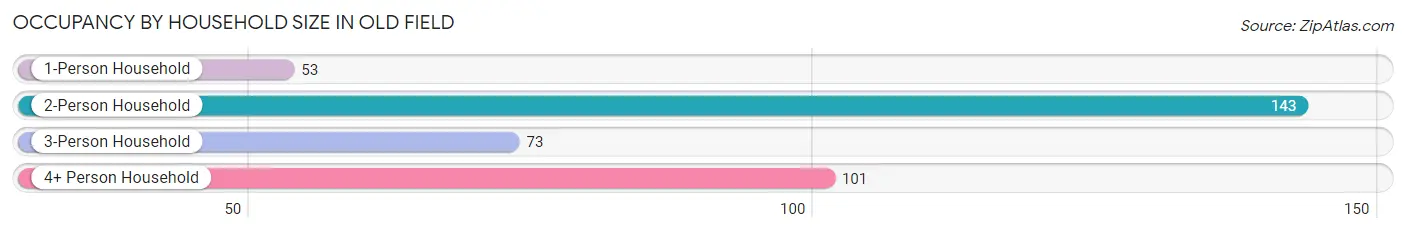
| Household Size | # Housing Units | % Housing Units |
| 1-Person Household | 53 | 14.3% |
| 2-Person Household | 143 | 38.7% |
| 3-Person Household | 73 | 19.7% |
| 4+ Person Household | 101 | 27.3% |
| Total Housing Units | 370 | 100.0% |
Occupancy by Ownership by Household Size in Old Field
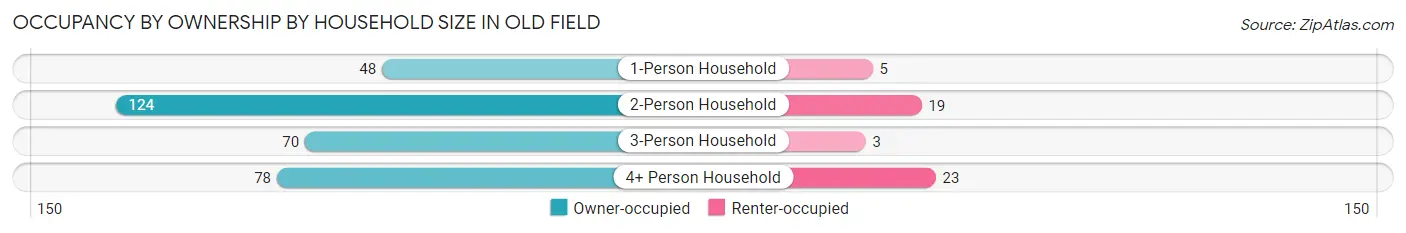
| Household Size | Owner-occupied | Renter-occupied |
| 1-Person Household | 48 (90.6%) | 5 (9.4%) |
| 2-Person Household | 124 (86.7%) | 19 (13.3%) |
| 3-Person Household | 70 (95.9%) | 3 (4.1%) |
| 4+ Person Household | 78 (77.2%) | 23 (22.8%) |
| Total Housing Units | 320 (86.5%) | 50 (13.5%) |
Occupancy by Educational Attainment in Old Field
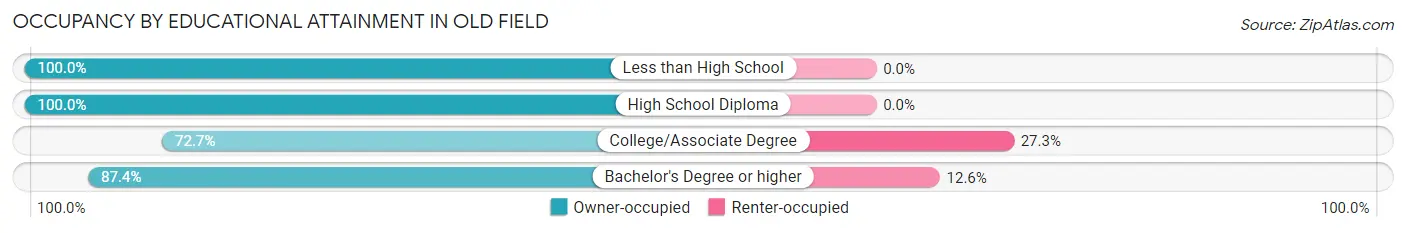
| Household Size | Owner-occupied | Renter-occupied |
| Less than High School | 2 (100.0%) | 0 (0.0%) |
| High School Diploma | 9 (100.0%) | 0 (0.0%) |
| College/Associate Degree | 24 (72.7%) | 9 (27.3%) |
| Bachelor's Degree or higher | 285 (87.4%) | 41 (12.6%) |
Occupancy by Age of Householder in Old Field
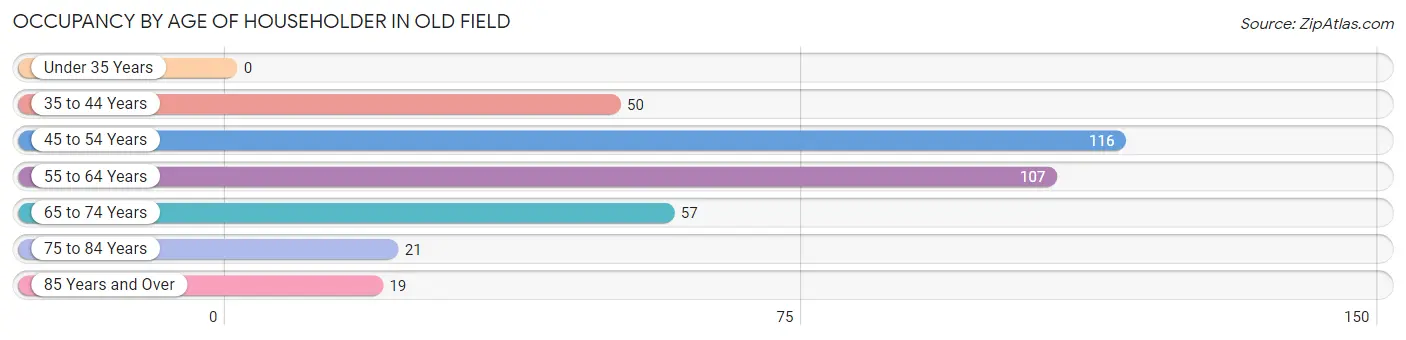
| Age Bracket | # Households | % Households |
| Under 35 Years | 0 | 0.0% |
| 35 to 44 Years | 50 | 13.5% |
| 45 to 54 Years | 116 | 31.4% |
| 55 to 64 Years | 107 | 28.9% |
| 65 to 74 Years | 57 | 15.4% |
| 75 to 84 Years | 21 | 5.7% |
| 85 Years and Over | 19 | 5.1% |
| Total | 370 | 100.0% |
Housing Finances in Old Field
Median Income by Occupancy in Old Field
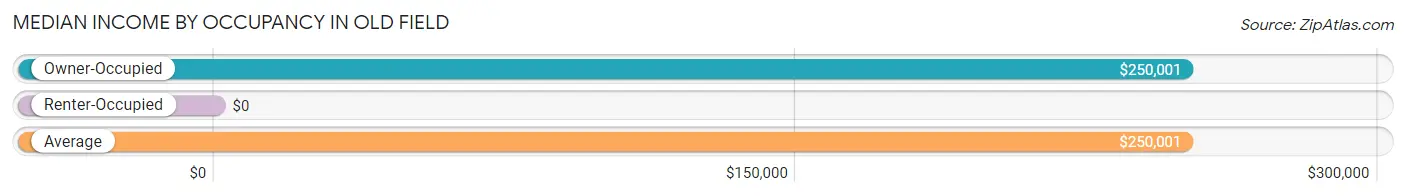
| Occupancy Type | # Households | Median Income |
| Owner-Occupied | 320 (86.5%) | $250,001 |
| Renter-Occupied | 50 (13.5%) | $0 |
| Average | 370 (100.0%) | $250,001 |
Occupancy by Householder Income Bracket in Old Field
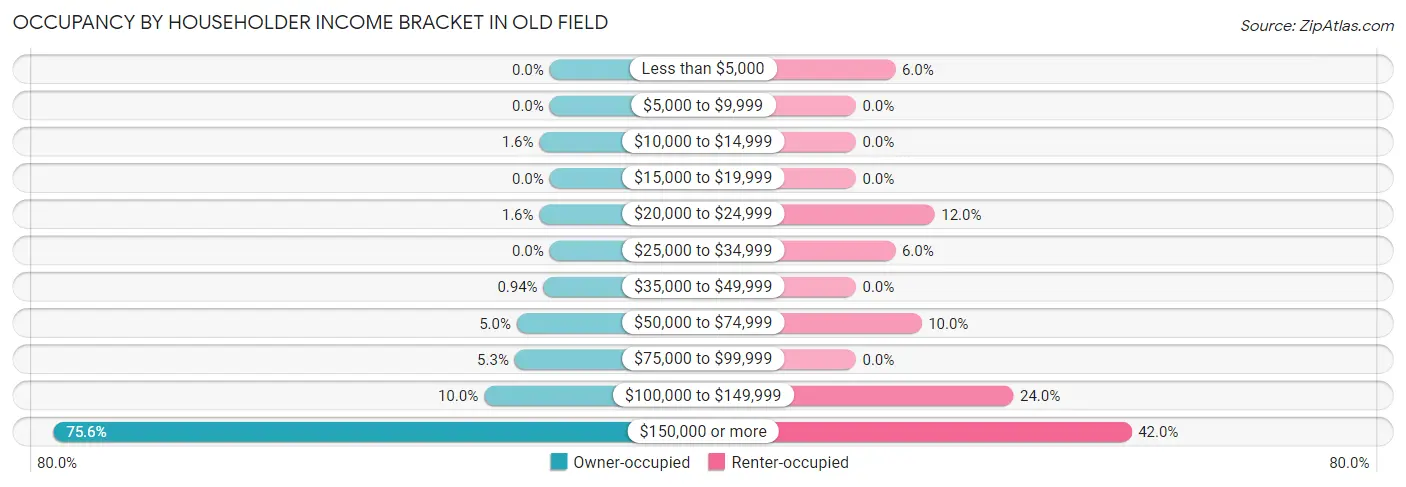
| Income Bracket | Owner-occupied | Renter-occupied |
| Less than $5,000 | 0 (0.0%) | 3 (6.0%) |
| $5,000 to $9,999 | 0 (0.0%) | 0 (0.0%) |
| $10,000 to $14,999 | 5 (1.6%) | 0 (0.0%) |
| $15,000 to $19,999 | 0 (0.0%) | 0 (0.0%) |
| $20,000 to $24,999 | 5 (1.6%) | 6 (12.0%) |
| $25,000 to $34,999 | 0 (0.0%) | 3 (6.0%) |
| $35,000 to $49,999 | 3 (0.9%) | 0 (0.0%) |
| $50,000 to $74,999 | 16 (5.0%) | 5 (10.0%) |
| $75,000 to $99,999 | 17 (5.3%) | 0 (0.0%) |
| $100,000 to $149,999 | 32 (10.0%) | 12 (24.0%) |
| $150,000 or more | 242 (75.6%) | 21 (42.0%) |
| Total | 320 (100.0%) | 50 (100.0%) |
Monthly Housing Cost Tiers in Old Field
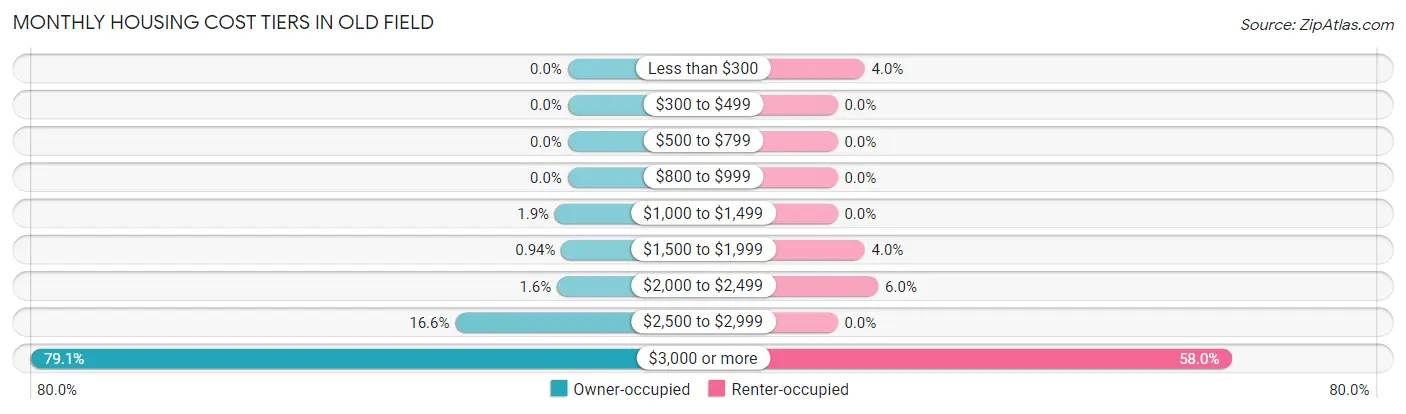
| Monthly Cost | Owner-occupied | Renter-occupied |
| Less than $300 | 0 (0.0%) | 2 (4.0%) |
| $300 to $499 | 0 (0.0%) | 0 (0.0%) |
| $500 to $799 | 0 (0.0%) | 0 (0.0%) |
| $800 to $999 | 0 (0.0%) | 0 (0.0%) |
| $1,000 to $1,499 | 6 (1.9%) | 0 (0.0%) |
| $1,500 to $1,999 | 3 (0.9%) | 2 (4.0%) |
| $2,000 to $2,499 | 5 (1.6%) | 3 (6.0%) |
| $2,500 to $2,999 | 53 (16.6%) | 0 (0.0%) |
| $3,000 or more | 253 (79.1%) | 29 (58.0%) |
| Total | 320 (100.0%) | 50 (100.0%) |
Physical Housing Characteristics in Old Field
Housing Structures in Old Field
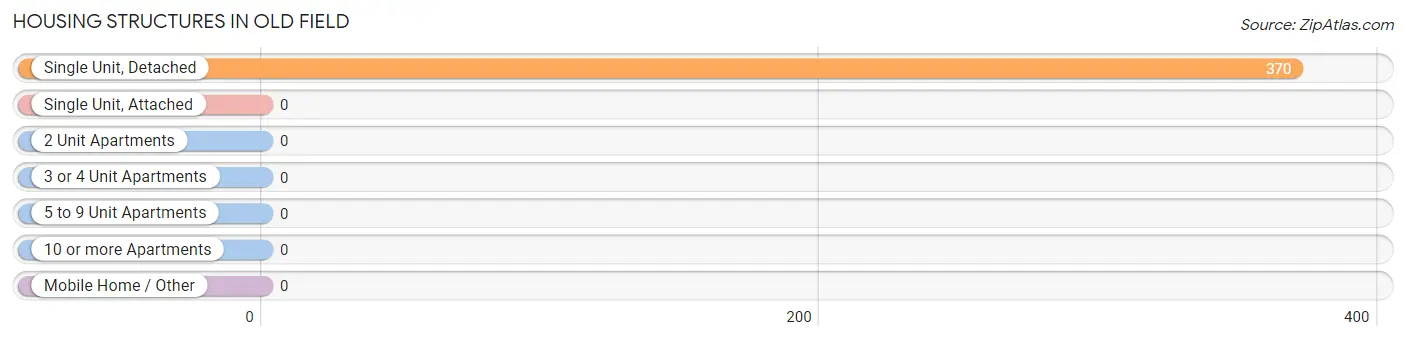
| Structure Type | # Housing Units | % Housing Units |
| Single Unit, Detached | 370 | 100.0% |
| Single Unit, Attached | 0 | 0.0% |
| 2 Unit Apartments | 0 | 0.0% |
| 3 or 4 Unit Apartments | 0 | 0.0% |
| 5 to 9 Unit Apartments | 0 | 0.0% |
| 10 or more Apartments | 0 | 0.0% |
| Mobile Home / Other | 0 | 0.0% |
| Total | 370 | 100.0% |
Housing Structures by Occupancy in Old Field
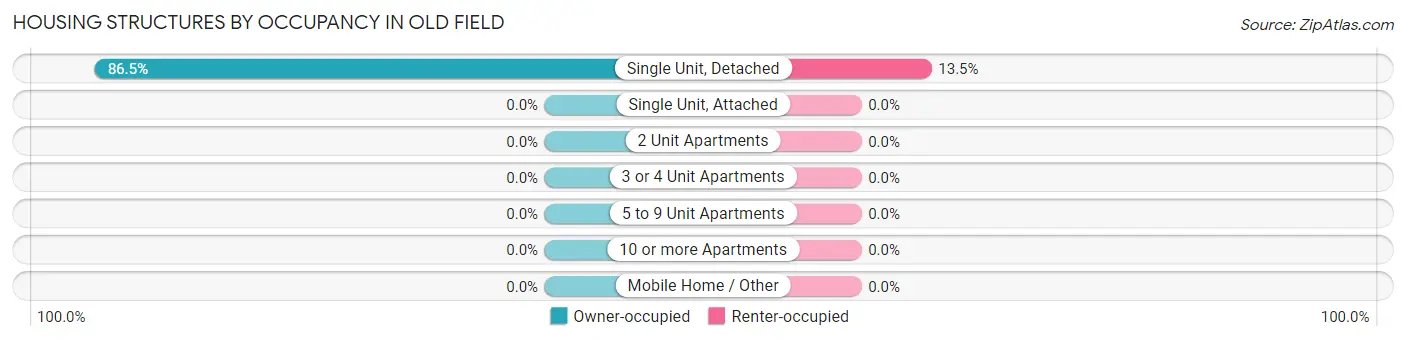
| Structure Type | Owner-occupied | Renter-occupied |
| Single Unit, Detached | 320 (86.5%) | 50 (13.5%) |
| Single Unit, Attached | 0 (0.0%) | 0 (0.0%) |
| 2 Unit Apartments | 0 (0.0%) | 0 (0.0%) |
| 3 or 4 Unit Apartments | 0 (0.0%) | 0 (0.0%) |
| 5 to 9 Unit Apartments | 0 (0.0%) | 0 (0.0%) |
| 10 or more Apartments | 0 (0.0%) | 0 (0.0%) |
| Mobile Home / Other | 0 (0.0%) | 0 (0.0%) |
| Total | 320 (86.5%) | 50 (13.5%) |
Housing Structures by Number of Rooms in Old Field
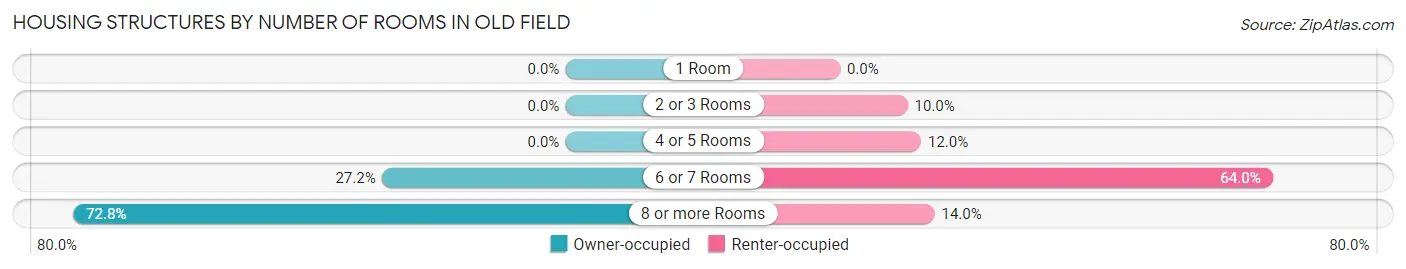
| Number of Rooms | Owner-occupied | Renter-occupied |
| 1 Room | 0 (0.0%) | 0 (0.0%) |
| 2 or 3 Rooms | 0 (0.0%) | 5 (10.0%) |
| 4 or 5 Rooms | 0 (0.0%) | 6 (12.0%) |
| 6 or 7 Rooms | 87 (27.2%) | 32 (64.0%) |
| 8 or more Rooms | 233 (72.8%) | 7 (14.0%) |
| Total | 320 (100.0%) | 50 (100.0%) |
Housing Structure by Heating Type in Old Field
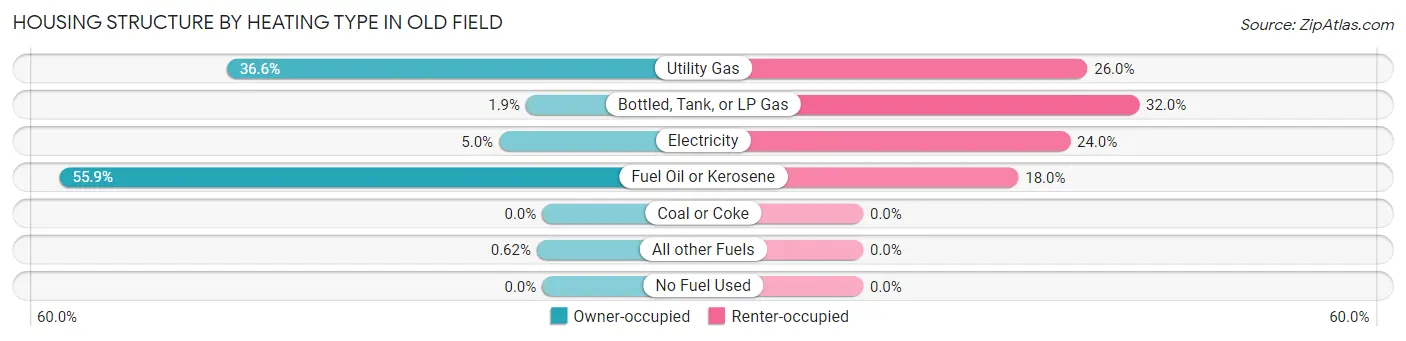
| Heating Type | Owner-occupied | Renter-occupied |
| Utility Gas | 117 (36.6%) | 13 (26.0%) |
| Bottled, Tank, or LP Gas | 6 (1.9%) | 16 (32.0%) |
| Electricity | 16 (5.0%) | 12 (24.0%) |
| Fuel Oil or Kerosene | 179 (55.9%) | 9 (18.0%) |
| Coal or Coke | 0 (0.0%) | 0 (0.0%) |
| All other Fuels | 2 (0.6%) | 0 (0.0%) |
| No Fuel Used | 0 (0.0%) | 0 (0.0%) |
| Total | 320 (100.0%) | 50 (100.0%) |
Household Vehicle Usage in Old Field
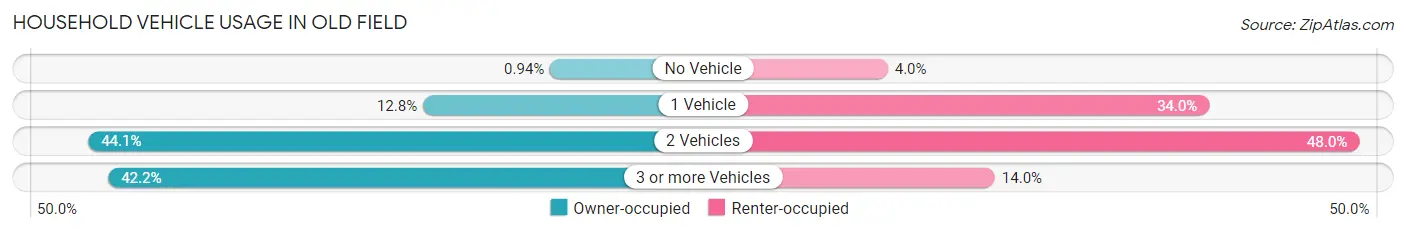
| Vehicles per Household | Owner-occupied | Renter-occupied |
| No Vehicle | 3 (0.9%) | 2 (4.0%) |
| 1 Vehicle | 41 (12.8%) | 17 (34.0%) |
| 2 Vehicles | 141 (44.1%) | 24 (48.0%) |
| 3 or more Vehicles | 135 (42.2%) | 7 (14.0%) |
| Total | 320 (100.0%) | 50 (100.0%) |
Real Estate & Mortgages in Old Field
Real Estate and Mortgage Overview in Old Field
| Characteristic | Without Mortgage | With Mortgage |
| Housing Units | 158 | 162 |
| Median Property Value | $1,208,300 | $1,208,300 |
| Median Household Income | $221,250 | $130 |
| Monthly Housing Costs | $1,501 | $153 |
| Real Estate Taxes | $10,001 | $0 |
Property Value by Mortgage Status in Old Field
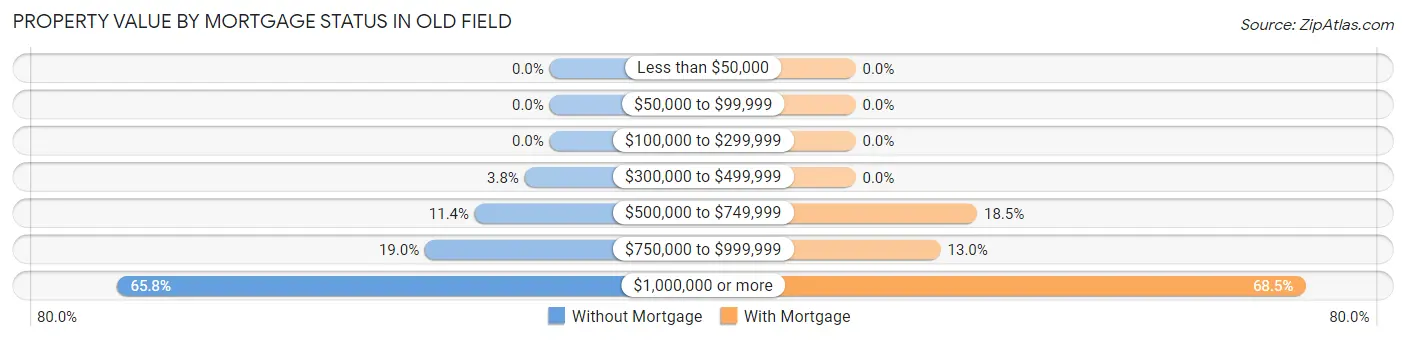
| Property Value | Without Mortgage | With Mortgage |
| Less than $50,000 | 0 (0.0%) | 0 (0.0%) |
| $50,000 to $99,999 | 0 (0.0%) | 0 (0.0%) |
| $100,000 to $299,999 | 0 (0.0%) | 0 (0.0%) |
| $300,000 to $499,999 | 6 (3.8%) | 0 (0.0%) |
| $500,000 to $749,999 | 18 (11.4%) | 30 (18.5%) |
| $750,000 to $999,999 | 30 (19.0%) | 21 (13.0%) |
| $1,000,000 or more | 104 (65.8%) | 111 (68.5%) |
| Total | 158 (100.0%) | 162 (100.0%) |
Household Income by Mortgage Status in Old Field
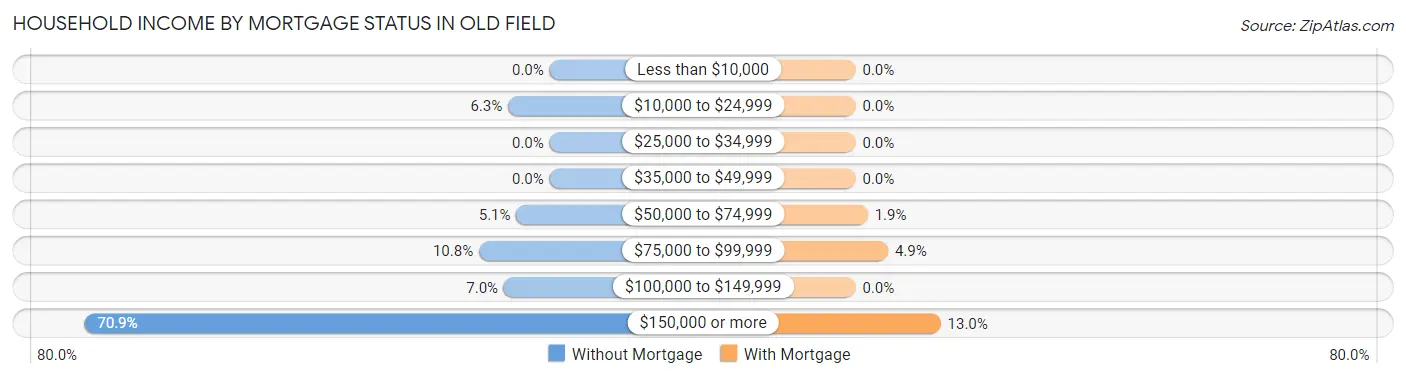
| Household Income | Without Mortgage | With Mortgage |
| Less than $10,000 | 0 (0.0%) | 0 (0.0%) |
| $10,000 to $24,999 | 10 (6.3%) | 0 (0.0%) |
| $25,000 to $34,999 | 0 (0.0%) | 0 (0.0%) |
| $35,000 to $49,999 | 0 (0.0%) | 0 (0.0%) |
| $50,000 to $74,999 | 8 (5.1%) | 3 (1.8%) |
| $75,000 to $99,999 | 17 (10.8%) | 8 (4.9%) |
| $100,000 to $149,999 | 11 (7.0%) | 0 (0.0%) |
| $150,000 or more | 112 (70.9%) | 21 (13.0%) |
| Total | 158 (100.0%) | 162 (100.0%) |
Property Value to Household Income Ratio in Old Field
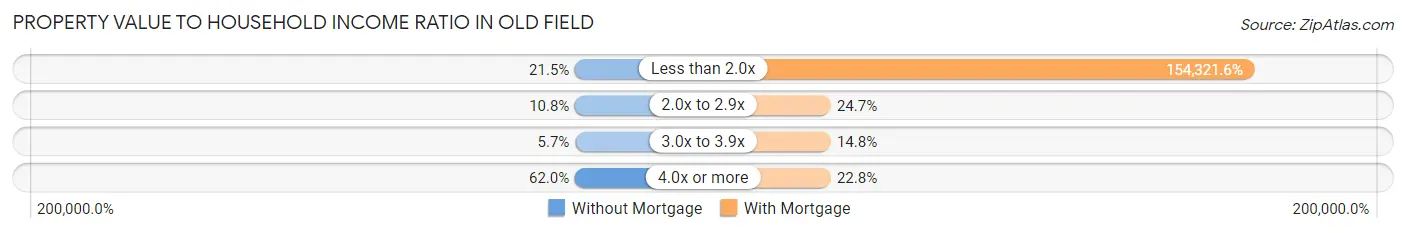
| Value-to-Income Ratio | Without Mortgage | With Mortgage |
| Less than 2.0x | 34 (21.5%) | 250,001 (154,321.6%) |
| 2.0x to 2.9x | 17 (10.8%) | 40 (24.7%) |
| 3.0x to 3.9x | 9 (5.7%) | 24 (14.8%) |
| 4.0x or more | 98 (62.0%) | 37 (22.8%) |
| Total | 158 (100.0%) | 162 (100.0%) |
Real Estate Taxes by Mortgage Status in Old Field
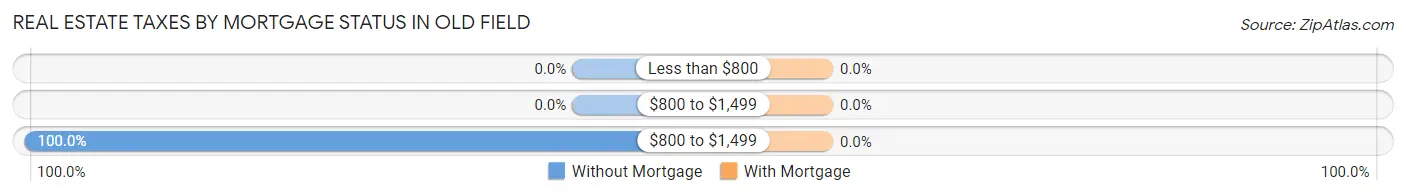
| Property Taxes | Without Mortgage | With Mortgage |
| Less than $800 | 0 (0.0%) | 0 (0.0%) |
| $800 to $1,499 | 0 (0.0%) | 0 (0.0%) |
| $800 to $1,499 | 158 (100.0%) | 0 (0.0%) |
| Total | 158 (100.0%) | 162 (100.0%) |
Health & Disability in Old Field
Health Insurance Coverage by Age in Old Field
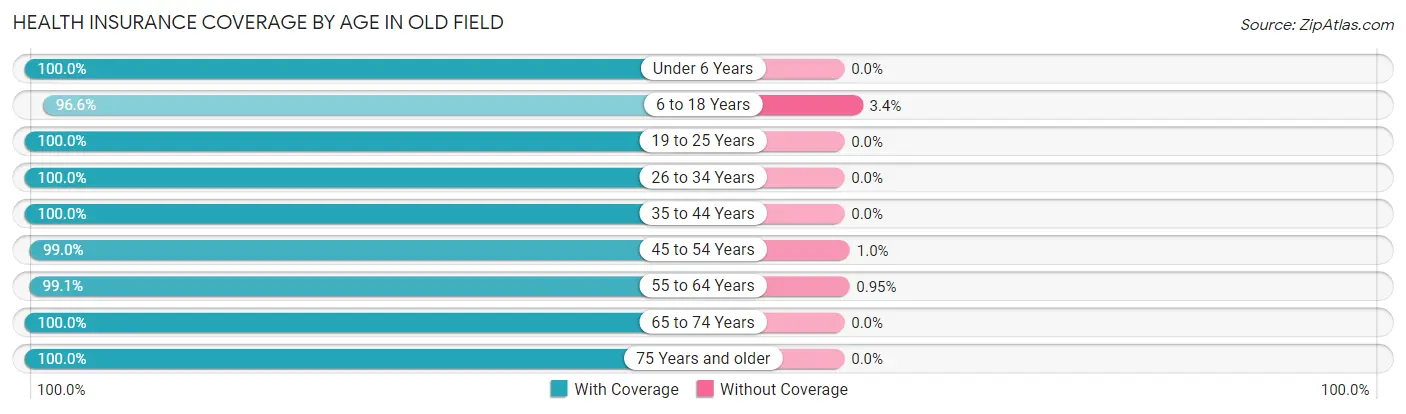
| Age Bracket | With Coverage | Without Coverage |
| Under 6 Years | 16 (100.0%) | 0 (0.0%) |
| 6 to 18 Years | 227 (96.6%) | 8 (3.4%) |
| 19 to 25 Years | 83 (100.0%) | 0 (0.0%) |
| 26 to 34 Years | 24 (100.0%) | 0 (0.0%) |
| 35 to 44 Years | 95 (100.0%) | 0 (0.0%) |
| 45 to 54 Years | 190 (99.0%) | 2 (1.0%) |
| 55 to 64 Years | 209 (99.1%) | 2 (0.9%) |
| 65 to 74 Years | 105 (100.0%) | 0 (0.0%) |
| 75 Years and older | 59 (100.0%) | 0 (0.0%) |
| Total | 1,008 (98.8%) | 12 (1.2%) |
Health Insurance Coverage by Citizenship Status in Old Field
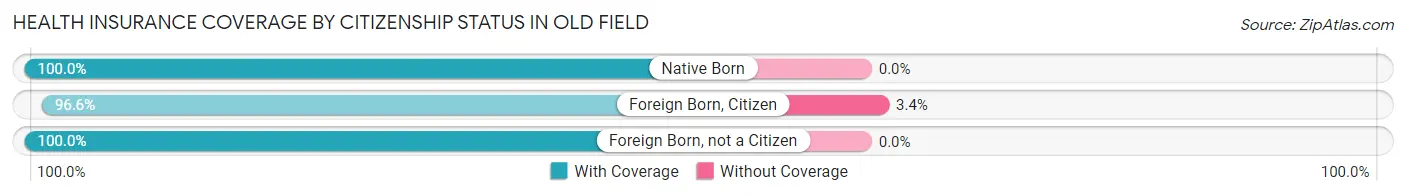
| Citizenship Status | With Coverage | Without Coverage |
| Native Born | 16 (100.0%) | 0 (0.0%) |
| Foreign Born, Citizen | 227 (96.6%) | 8 (3.4%) |
| Foreign Born, not a Citizen | 83 (100.0%) | 0 (0.0%) |
Health Insurance Coverage by Household Income in Old Field
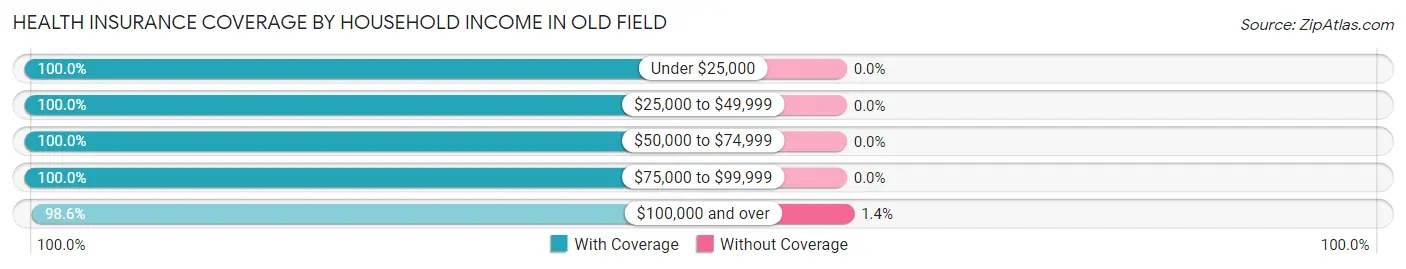
| Household Income | With Coverage | Without Coverage |
| Under $25,000 | 31 (100.0%) | 0 (0.0%) |
| $25,000 to $49,999 | 13 (100.0%) | 0 (0.0%) |
| $50,000 to $74,999 | 67 (100.0%) | 0 (0.0%) |
| $75,000 to $99,999 | 26 (100.0%) | 0 (0.0%) |
| $100,000 and over | 851 (98.6%) | 12 (1.4%) |
Public vs Private Health Insurance Coverage by Age in Old Field
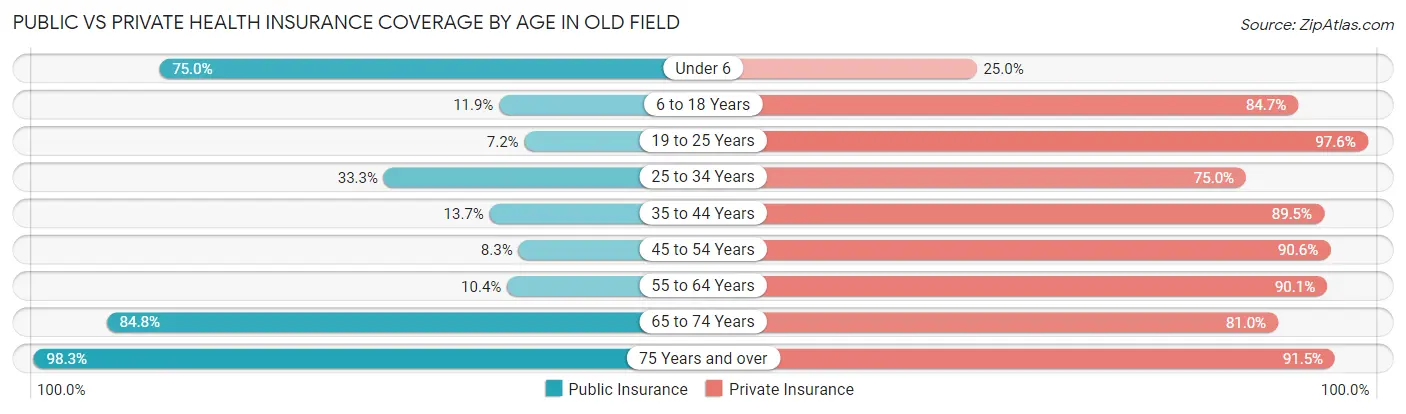
| Age Bracket | Public Insurance | Private Insurance |
| Under 6 | 12 (75.0%) | 4 (25.0%) |
| 6 to 18 Years | 28 (11.9%) | 199 (84.7%) |
| 19 to 25 Years | 6 (7.2%) | 81 (97.6%) |
| 25 to 34 Years | 8 (33.3%) | 18 (75.0%) |
| 35 to 44 Years | 13 (13.7%) | 85 (89.5%) |
| 45 to 54 Years | 16 (8.3%) | 174 (90.6%) |
| 55 to 64 Years | 22 (10.4%) | 190 (90.0%) |
| 65 to 74 Years | 89 (84.8%) | 85 (80.9%) |
| 75 Years and over | 58 (98.3%) | 54 (91.5%) |
| Total | 252 (24.7%) | 890 (87.3%) |
Disability Status by Sex by Age in Old Field
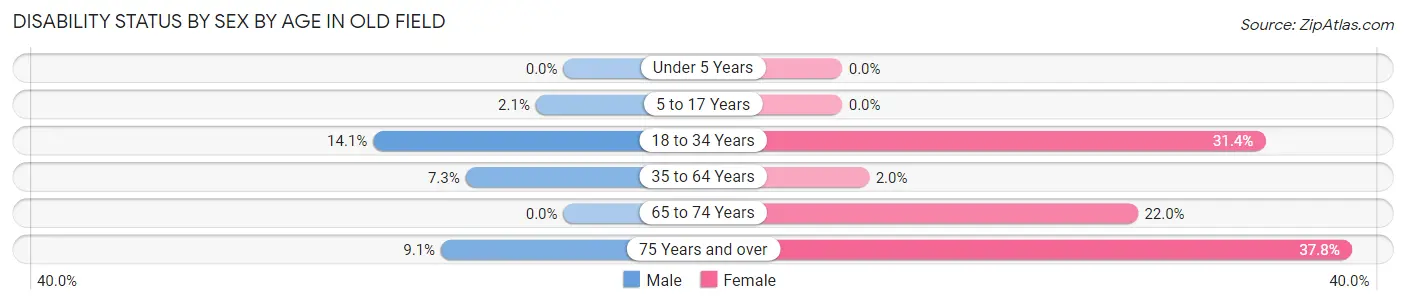
| Age Bracket | Male | Female |
| Under 5 Years | 0 (0.0%) | 0 (0.0%) |
| 5 to 17 Years | 3 (2.1%) | 0 (0.0%) |
| 18 to 34 Years | 12 (14.1%) | 11 (31.4%) |
| 35 to 64 Years | 18 (7.3%) | 5 (2.0%) |
| 65 to 74 Years | 0 (0.0%) | 9 (22.0%) |
| 75 Years and over | 2 (9.1%) | 14 (37.8%) |
Disability Class by Sex by Age in Old Field
Disability Class: Hearing Difficulty
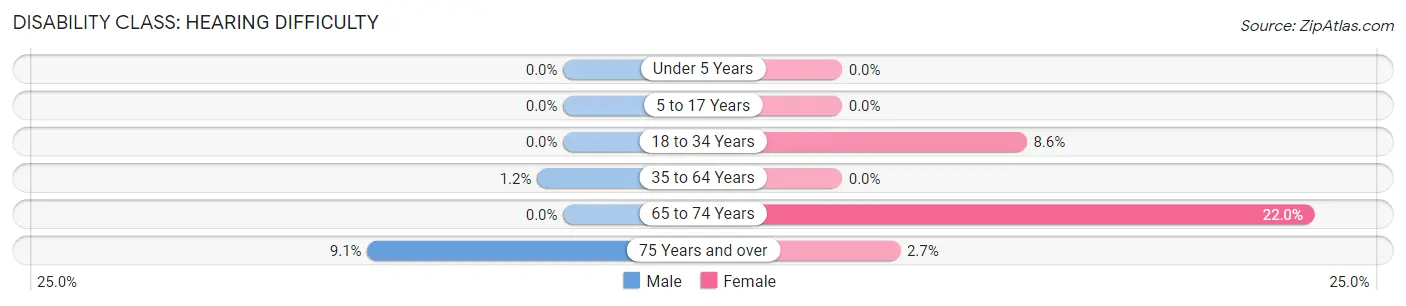
| Age Bracket | Male | Female |
| Under 5 Years | 0 (0.0%) | 0 (0.0%) |
| 5 to 17 Years | 0 (0.0%) | 0 (0.0%) |
| 18 to 34 Years | 0 (0.0%) | 3 (8.6%) |
| 35 to 64 Years | 3 (1.2%) | 0 (0.0%) |
| 65 to 74 Years | 0 (0.0%) | 9 (22.0%) |
| 75 Years and over | 2 (9.1%) | 1 (2.7%) |
Disability Class: Vision Difficulty
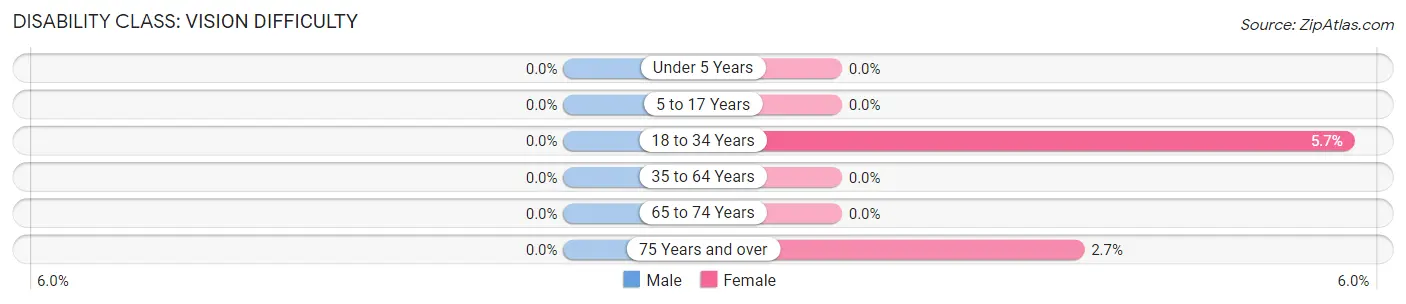
| Age Bracket | Male | Female |
| Under 5 Years | 0 (0.0%) | 0 (0.0%) |
| 5 to 17 Years | 0 (0.0%) | 0 (0.0%) |
| 18 to 34 Years | 0 (0.0%) | 2 (5.7%) |
| 35 to 64 Years | 0 (0.0%) | 0 (0.0%) |
| 65 to 74 Years | 0 (0.0%) | 0 (0.0%) |
| 75 Years and over | 0 (0.0%) | 1 (2.7%) |
Disability Class: Cognitive Difficulty
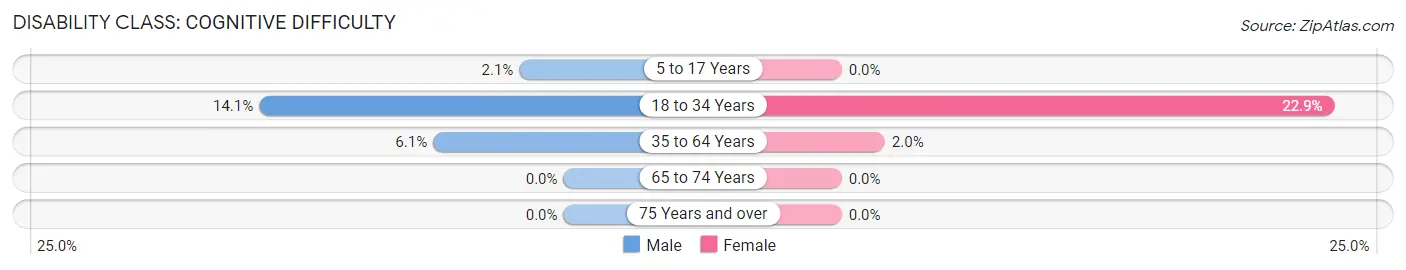
| Age Bracket | Male | Female |
| 5 to 17 Years | 3 (2.1%) | 0 (0.0%) |
| 18 to 34 Years | 12 (14.1%) | 8 (22.9%) |
| 35 to 64 Years | 15 (6.0%) | 5 (2.0%) |
| 65 to 74 Years | 0 (0.0%) | 0 (0.0%) |
| 75 Years and over | 0 (0.0%) | 0 (0.0%) |
Disability Class: Ambulatory Difficulty
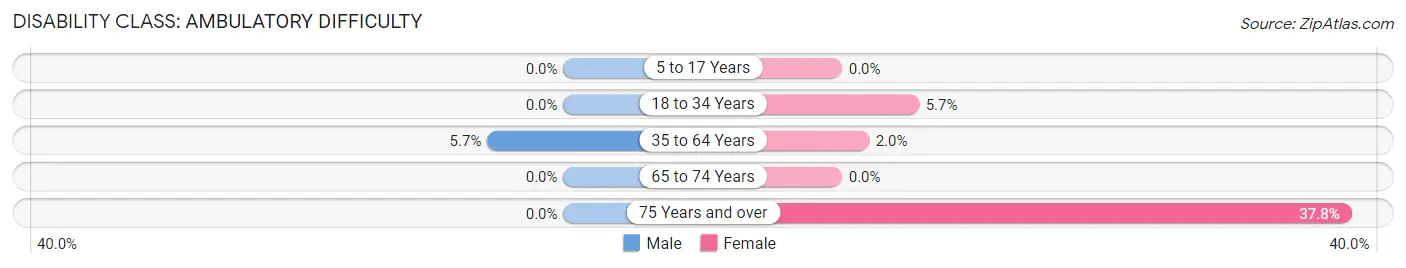
| Age Bracket | Male | Female |
| 5 to 17 Years | 0 (0.0%) | 0 (0.0%) |
| 18 to 34 Years | 0 (0.0%) | 2 (5.7%) |
| 35 to 64 Years | 14 (5.7%) | 5 (2.0%) |
| 65 to 74 Years | 0 (0.0%) | 0 (0.0%) |
| 75 Years and over | 0 (0.0%) | 14 (37.8%) |
Disability Class: Self-Care Difficulty
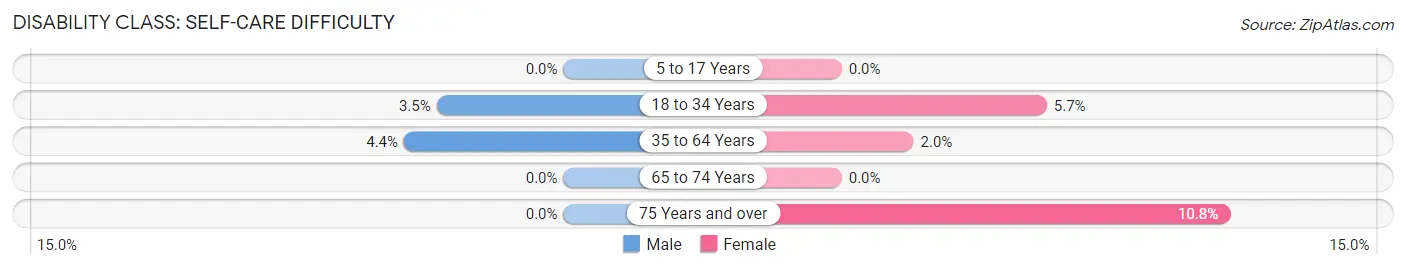
| Age Bracket | Male | Female |
| 5 to 17 Years | 0 (0.0%) | 0 (0.0%) |
| 18 to 34 Years | 3 (3.5%) | 2 (5.7%) |
| 35 to 64 Years | 11 (4.4%) | 5 (2.0%) |
| 65 to 74 Years | 0 (0.0%) | 0 (0.0%) |
| 75 Years and over | 0 (0.0%) | 4 (10.8%) |
Technology Access in Old Field
Computing Device Access in Old Field
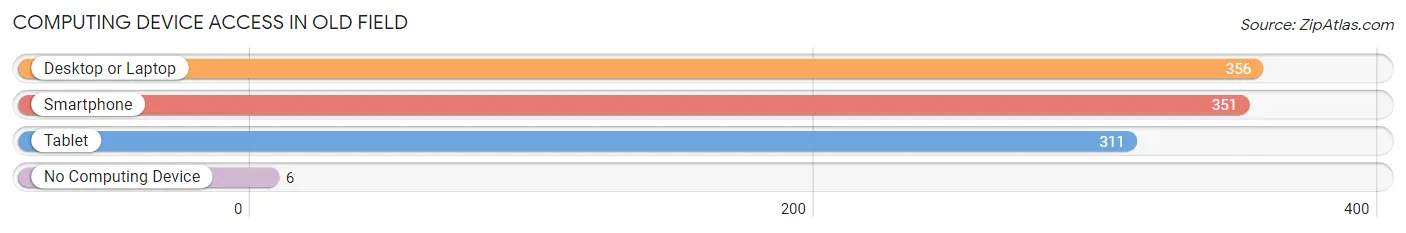
| Device Type | # Households | % Households |
| Desktop or Laptop | 356 | 96.2% |
| Smartphone | 351 | 94.9% |
| Tablet | 311 | 84.1% |
| No Computing Device | 6 | 1.6% |
| Total | 370 | 100.0% |
Internet Access in Old Field
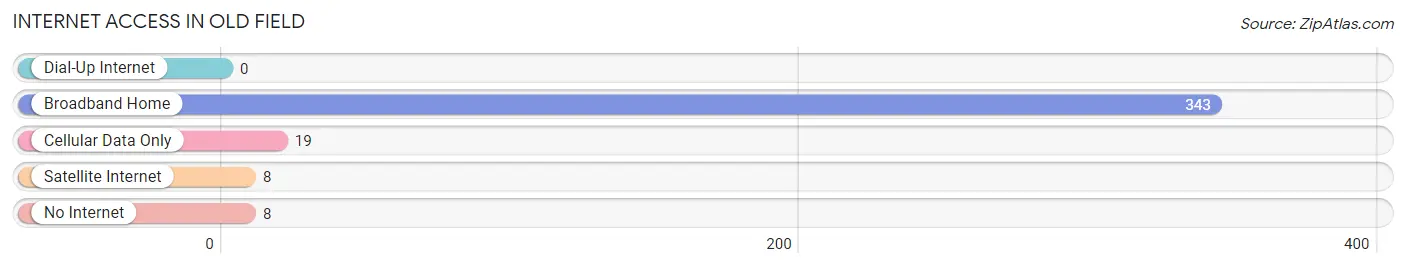
| Internet Type | # Households | % Households |
| Dial-Up Internet | 0 | 0.0% |
| Broadband Home | 343 | 92.7% |
| Cellular Data Only | 19 | 5.1% |
| Satellite Internet | 8 | 2.2% |
| No Internet | 8 | 2.2% |
| Total | 370 | 100.0% |
Old Field Summary
Old Field is a hamlet located in the Town of Brookhaven in Suffolk County, New York. It is situated on the north shore of Long Island, approximately 60 miles east of New York City. The hamlet is bordered by the hamlets of Setauket to the west, Stony Brook to the north, and Port Jefferson to the east.
History
Old Field was originally inhabited by the Setalcott Indians, a branch of the Algonquin tribe. The area was first settled by Europeans in the mid-17th century, when a group of English settlers from Connecticut purchased land from the Setalcott Indians. The settlers named the area Old Field, after the open fields that were used for grazing livestock.
In the late 18th century, Old Field became a popular summer destination for wealthy New Yorkers, who built large estates in the area. The hamlet was also home to a number of prominent families, including the Smiths, the Fosters, and the Brewsters.
In the early 20th century, Old Field became a popular destination for artists and writers, who were drawn to the area’s natural beauty and seclusion. The hamlet was also home to a number of prominent writers, including F. Scott Fitzgerald, who wrote his novel The Great Gatsby while living in Old Field.
Geography
Old Field is located on the north shore of Long Island, approximately 60 miles east of New York City. The hamlet is bordered by the hamlets of Setauket to the west, Stony Brook to the north, and Port Jefferson to the east.
The area is characterized by rolling hills, wooded areas, and a number of small ponds and creeks. The hamlet is home to a number of parks and nature preserves, including the Old Field Preserve, which is managed by the Town of Brookhaven.
Economy
Old Field is primarily a residential community, with a small number of businesses located in the area. The hamlet is home to a number of small retail stores, restaurants, and professional services.
The hamlet is also home to a number of small businesses, including a winery, a brewery, and a number of art galleries. The hamlet is also home to a number of small farms, which produce a variety of fruits and vegetables.
Demographics
As of the 2010 census, Old Field had a population of 1,845. The population is primarily white (90.2%), with a small percentage of African Americans (3.2%), Asians (2.2%), and Hispanics (2.1%). The median household income is $107,917, and the median home value is $619,000.
The hamlet is served by the Three Village Central School District, which includes the elementary schools of Old Field, Setauket, and Stony Brook. The hamlet is also home to a number of private schools, including the Old Field Montessori School and the Stony Brook School.
Common Questions
What is Per Capita Income in Old Field?
Per Capita income in Old Field is $161,297.
What is the Median Family Income in Old Field?
Median Family Income in Old Field is $250,001.
What is the Median Household income in Old Field?
Median Household Income in Old Field is $250,001.
What is Income or Wage Gap in Old Field?
Income or Wage Gap in Old Field is 74.3%.
Women in Old Field earn 25.7 cents for every dollar earned by a man.
What is Inequality or Gini Index in Old Field?
Inequality or Gini Index in Old Field is 0.54.
What is the Total Population of Old Field?
Total Population of Old Field is 1,020.
What is the Total Male Population of Old Field?
Total Male Population of Old Field is 567.
What is the Total Female Population of Old Field?
Total Female Population of Old Field is 453.
What is the Ratio of Males per 100 Females in Old Field?
There are 125.17 Males per 100 Females in Old Field.
What is the Ratio of Females per 100 Males in Old Field?
There are 79.89 Females per 100 Males in Old Field.
What is the Median Population Age in Old Field?
Median Population Age in Old Field is 48.4 Years.
What is the Average Family Size in Old Field
Average Family Size in Old Field is 3.0 People.
What is the Average Household Size in Old Field
Average Household Size in Old Field is 2.7 People.
How Large is the Labor Force in Old Field?
There are 533 People in the Labor Forcein in Old Field.
What is the Percentage of People in the Labor Force in Old Field?
62.6% of People are in the Labor Force in Old Field.
What is the Unemployment Rate in Old Field?
Unemployment Rate in Old Field is 3.4%.