Sands Point, NY Map & Demographics
Sands Point Map
Sands Point Overview
$150,707
PER CAPITA INCOME
$250,001
AVG FAMILY INCOME
$250,001
AVG HOUSEHOLD INCOME
59.5%
WAGE / INCOME GAP [ % ]
40.5¢/ $1
WAGE / INCOME GAP [ $ ]
0.48
INEQUALITY / GINI INDEX
2,702
TOTAL POPULATION
1,446
MALE POPULATION
1,256
FEMALE POPULATION
115.13
MALES / 100 FEMALES
86.86
FEMALES / 100 MALES
45.2
MEDIAN AGE
3.4
AVG FAMILY SIZE
3.3
AVG HOUSEHOLD SIZE
1,201
LABOR FORCE [ PEOPLE ]
60.7%
PERCENT IN LABOR FORCE
5.5%
UNEMPLOYMENT RATE
Sands Point Area Codes
Income in Sands Point
Income Overview in Sands Point
Per Capita Income in Sands Point is $150,707, while median incomes of families and households are $250,001 and $250,001 respectively.
| Characteristic | Number | Measure |
| Per Capita Income | 2,702 | $150,707 |
| Median Family Income | 717 | $250,001 |
| Mean Family Income | 717 | $513,096 |
| Median Household Income | 820 | $250,001 |
| Mean Household Income | 820 | $481,979 |
| Income Deficit | 717 | $0 |
| Wage / Income Gap (%) | 2,702 | 59.48% |
| Wage / Income Gap ($) | 2,702 | 40.52¢ per $1 |
| Gini / Inequality Index | 2,702 | 0.48 |
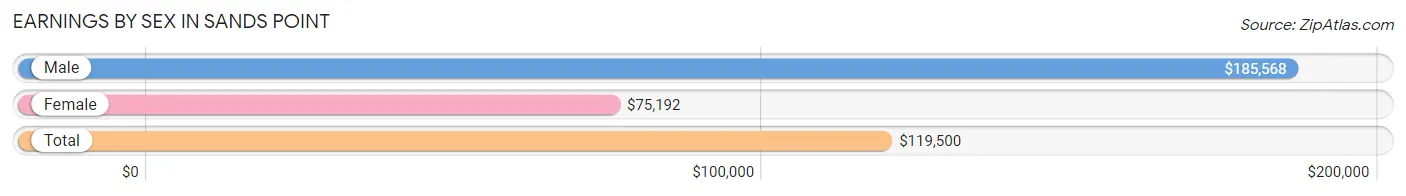
Earnings by Sex in Sands Point
Average Earnings in Sands Point are $119,500, $185,568 for men and $75,192 for women, a difference of 59.5%.
| Sex | Number | Average Earnings |
| Male | 790 (61.8%) | $185,568 |
| Female | 488 (38.2%) | $75,192 |
| Total | 1,278 (100.0%) | $119,500 |
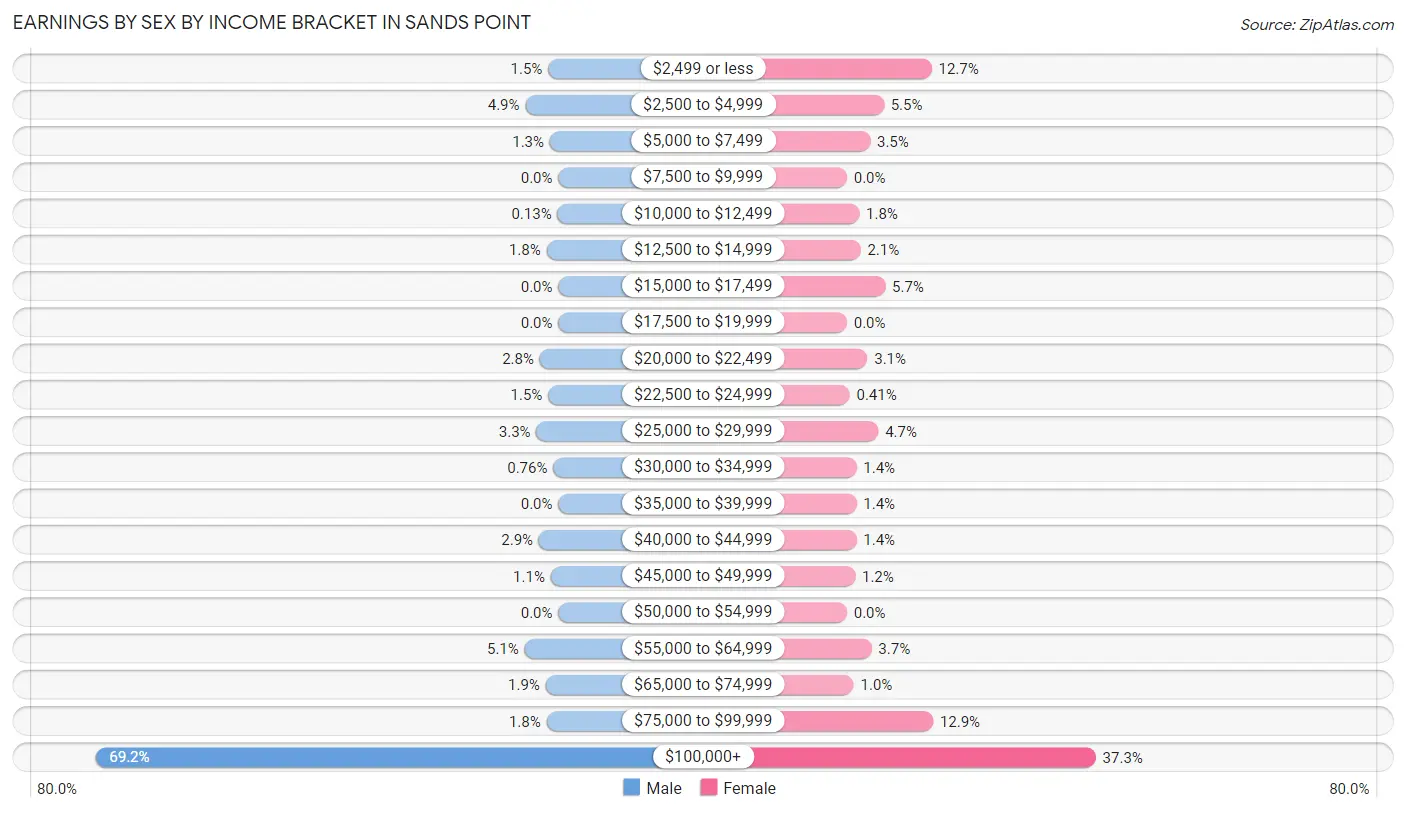
Earnings by Sex by Income Bracket in Sands Point
The most common earnings brackets in Sands Point are $100,000+ for men (547 | 69.2%) and $100,000+ for women (182 | 37.3%).
| Income | Male | Female |
| $2,499 or less | 12 (1.5%) | 62 (12.7%) |
| $2,500 to $4,999 | 39 (4.9%) | 27 (5.5%) |
| $5,000 to $7,499 | 10 (1.3%) | 17 (3.5%) |
| $7,500 to $9,999 | 0 (0.0%) | 0 (0.0%) |
| $10,000 to $12,499 | 1 (0.1%) | 9 (1.8%) |
| $12,500 to $14,999 | 14 (1.8%) | 10 (2.1%) |
| $15,000 to $17,499 | 0 (0.0%) | 28 (5.7%) |
| $17,500 to $19,999 | 0 (0.0%) | 0 (0.0%) |
| $20,000 to $22,499 | 22 (2.8%) | 15 (3.1%) |
| $22,500 to $24,999 | 12 (1.5%) | 2 (0.4%) |
| $25,000 to $29,999 | 26 (3.3%) | 23 (4.7%) |
| $30,000 to $34,999 | 6 (0.8%) | 7 (1.4%) |
| $35,000 to $39,999 | 0 (0.0%) | 7 (1.4%) |
| $40,000 to $44,999 | 23 (2.9%) | 7 (1.4%) |
| $45,000 to $49,999 | 9 (1.1%) | 6 (1.2%) |
| $50,000 to $54,999 | 0 (0.0%) | 0 (0.0%) |
| $55,000 to $64,999 | 40 (5.1%) | 18 (3.7%) |
| $65,000 to $74,999 | 15 (1.9%) | 5 (1.0%) |
| $75,000 to $99,999 | 14 (1.8%) | 63 (12.9%) |
| $100,000+ | 547 (69.2%) | 182 (37.3%) |
| Total | 790 (100.0%) | 488 (100.0%) |
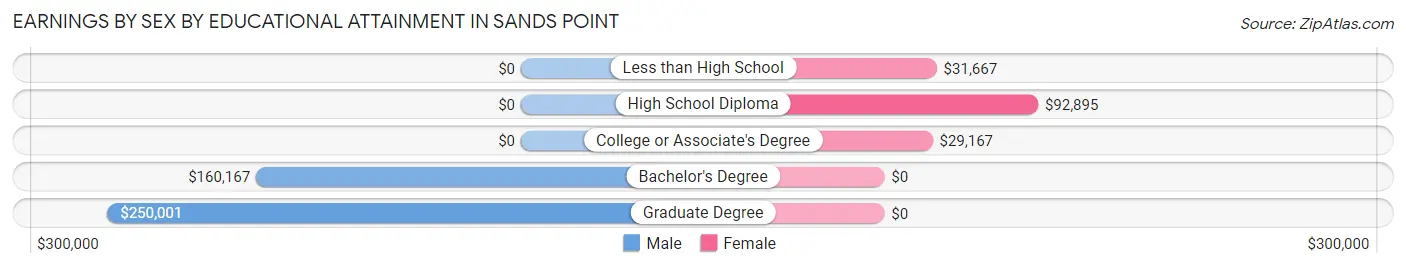
Earnings by Sex by Educational Attainment in Sands Point
Average earnings in Sands Point are $206,563 for men and $89,276 for women, a difference of 56.8%. Men with an educational attainment of graduate degree enjoy the highest average annual earnings of $250,001, while those with bachelor's degree education earn the least with $160,167. Women with an educational attainment of high school diploma earn the most with the average annual earnings of $92,895, while those with college or associate's degree education have the smallest earnings of $29,167.
| Educational Attainment | Male Income | Female Income |
| Less than High School | - | - |
| High School Diploma | - | - |
| College or Associate's Degree | - | - |
| Bachelor's Degree | $160,167 | $0 |
| Graduate Degree | $250,001 | $0 |
| Total | $206,563 | $89,276 |
Family Income in Sands Point
Family Income Brackets in Sands Point
According to the Sands Point family income data, there are 507 families falling into the $200,000+ income range, which is the most common income bracket and makes up 70.7% of all families.
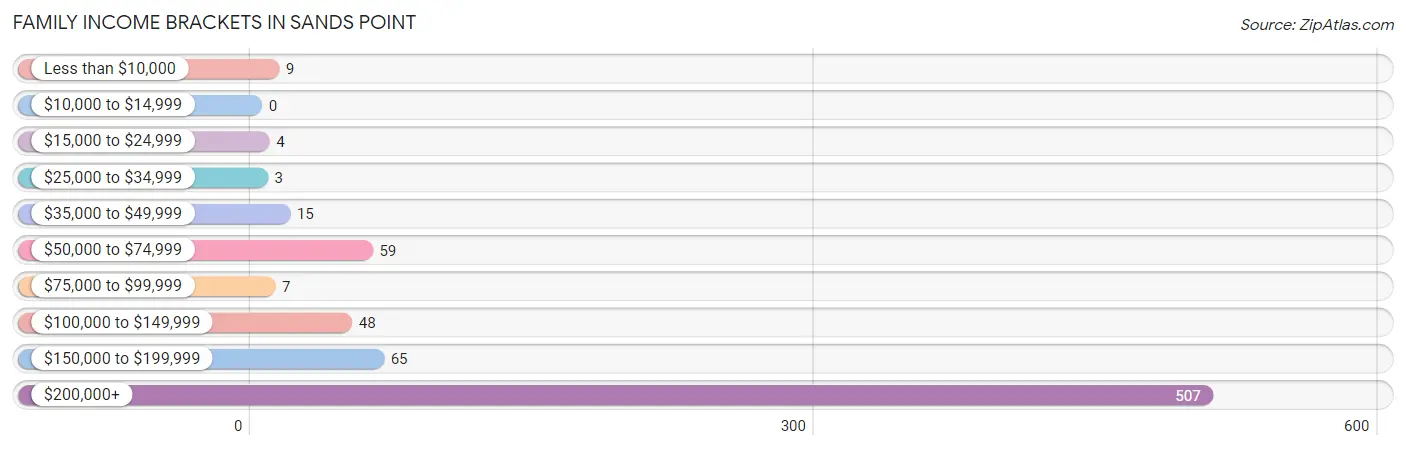
| Income Bracket | # Families | % Families |
| Less than $10,000 | 9 | 1.3% |
| $10,000 to $14,999 | 0 | 0.0% |
| $15,000 to $24,999 | 4 | 0.6% |
| $25,000 to $34,999 | 3 | 0.4% |
| $35,000 to $49,999 | 15 | 2.1% |
| $50,000 to $74,999 | 59 | 8.2% |
| $75,000 to $99,999 | 7 | 1.0% |
| $100,000 to $149,999 | 48 | 6.7% |
| $150,000 to $199,999 | 65 | 9.1% |
| $200,000+ | 507 | 70.7% |
Family Income by Famaliy Size in Sands Point
2-person families (284 | 39.6%) account for the highest median family income in Sands Point with $250,001 per family, while 2-person families (284 | 39.6%) have the highest median income of $125,000 per family member.
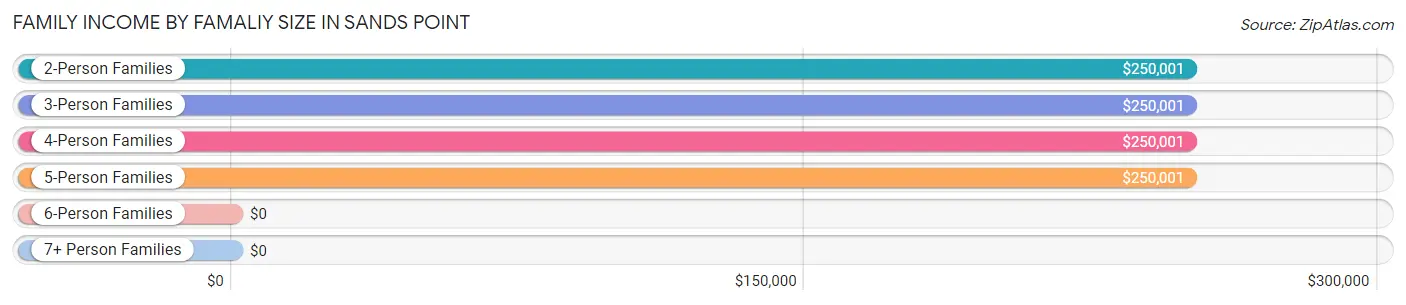
| Income Bracket | # Families | Median Income |
| 2-Person Families | 284 (39.6%) | $250,001 |
| 3-Person Families | 130 (18.1%) | $250,001 |
| 4-Person Families | 164 (22.9%) | $250,001 |
| 5-Person Families | 125 (17.4%) | $250,001 |
| 6-Person Families | 14 (1.9%) | $0 |
| 7+ Person Families | 0 (0.0%) | $0 |
| Total | 717 (100.0%) | $250,001 |
Family Income by Number of Earners in Sands Point
The median family income in Sands Point is $250,001, with families comprising no earners (40) having the highest median family income of $250,001, while families with 1 earner (305) have the lowest median family income of $211,971, accounting for 5.6% and 42.5% of families, respectively.
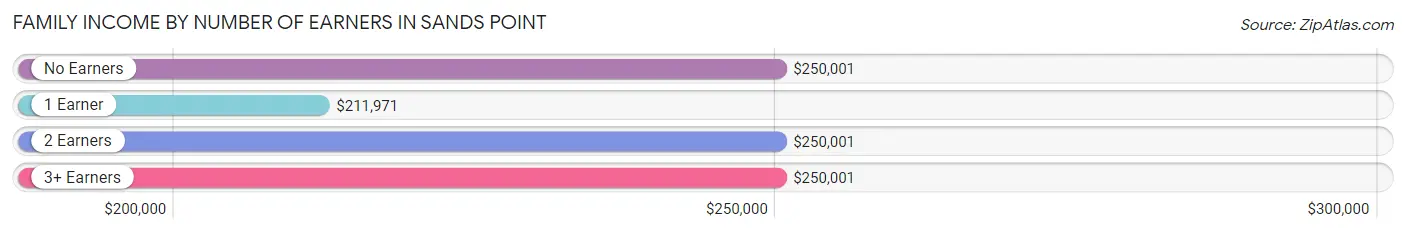
| Number of Earners | # Families | Median Income |
| No Earners | 40 (5.6%) | $250,001 |
| 1 Earner | 305 (42.5%) | $211,971 |
| 2 Earners | 323 (45.1%) | $250,001 |
| 3+ Earners | 49 (6.8%) | $250,001 |
| Total | 717 (100.0%) | $250,001 |
Household Income in Sands Point
Household Income Brackets in Sands Point
With 553 households falling in the category, the $200,000+ income range is the most frequent in Sands Point, accounting for 67.4% of all households. In contrast, only 4 households (0.5%) fall into the $25,000 to $34,999 income bracket, making it the least populous group.
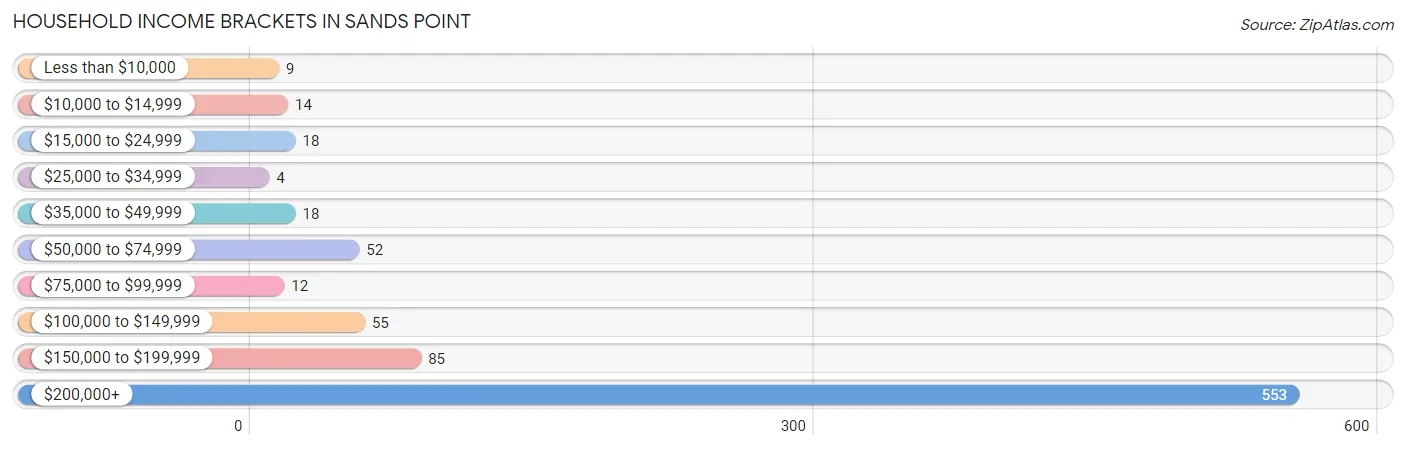
| Income Bracket | # Households | % Households |
| Less than $10,000 | 9 | 1.1% |
| $10,000 to $14,999 | 14 | 1.7% |
| $15,000 to $24,999 | 18 | 2.2% |
| $25,000 to $34,999 | 4 | 0.5% |
| $35,000 to $49,999 | 18 | 2.2% |
| $50,000 to $74,999 | 52 | 6.3% |
| $75,000 to $99,999 | 12 | 1.5% |
| $100,000 to $149,999 | 55 | 6.7% |
| $150,000 to $199,999 | 85 | 10.4% |
| $200,000+ | 553 | 67.4% |
Household Income by Householder Age in Sands Point
The median household income in Sands Point is $250,001, with the highest median household income of $250,001 found in the 25 to 44 years age bracket for the primary householder. A total of 121 households (14.8%) fall into this category. Meanwhile, the 15 to 24 years age bracket for the primary householder has the lowest median household income of $0, with 4 households (0.5%) in this group.
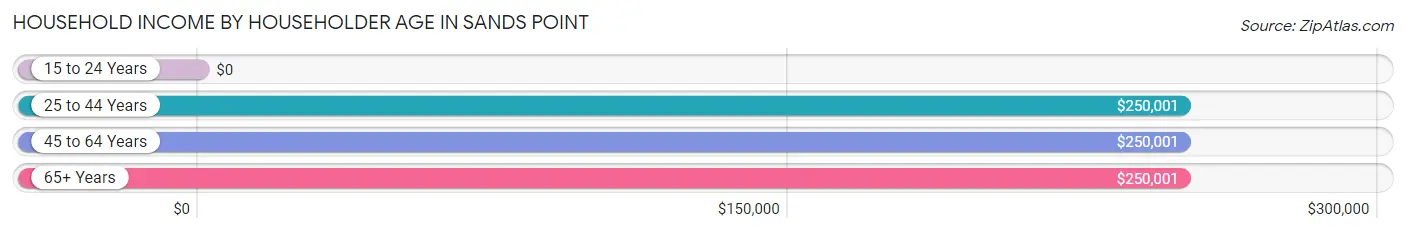
| Income Bracket | # Households | Median Income |
| 15 to 24 Years | 4 (0.5%) | $0 |
| 25 to 44 Years | 121 (14.8%) | $250,001 |
| 45 to 64 Years | 380 (46.3%) | $250,001 |
| 65+ Years | 315 (38.4%) | $250,001 |
| Total | 820 (100.0%) | $250,001 |
Poverty in Sands Point
Income Below Poverty by Sex and Age in Sands Point
With 2.9% poverty level for males and 1.5% for females among the residents of Sands Point, 75 year old and over males and 5 year old females are the most vulnerable to poverty, with 14 males (11.3%) and 4 females (100.0%) in their respective age groups living below the poverty level.
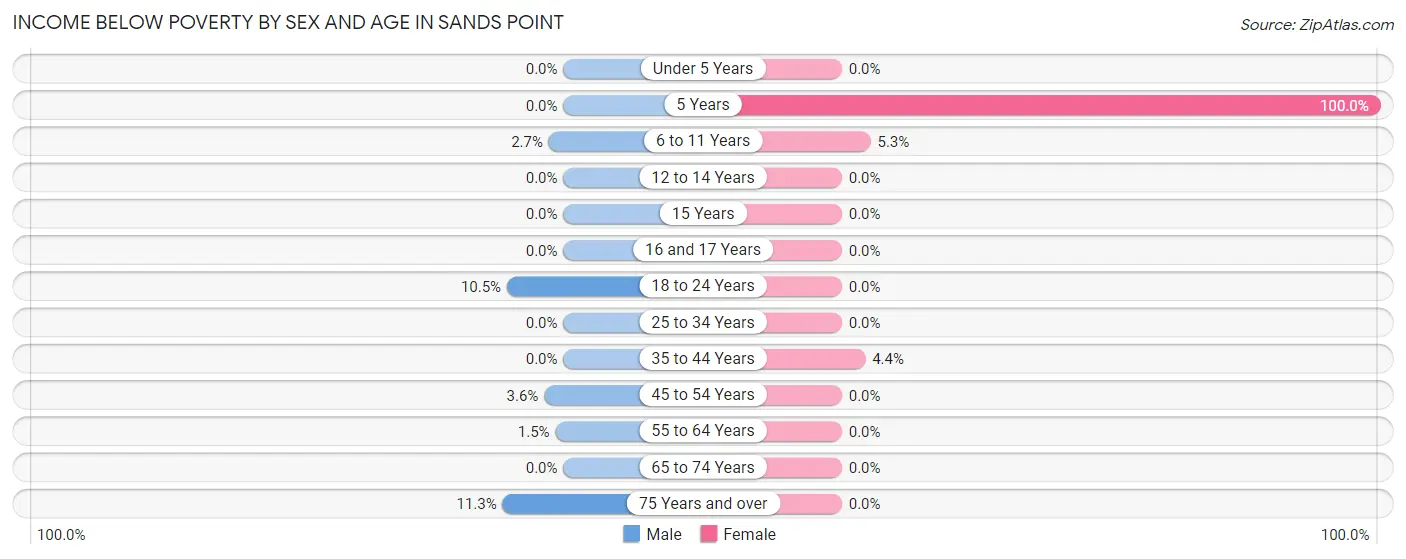
| Age Bracket | Male | Female |
| Under 5 Years | 0 (0.0%) | 0 (0.0%) |
| 5 Years | 0 (0.0%) | 4 (100.0%) |
| 6 to 11 Years | 4 (2.7%) | 7 (5.3%) |
| 12 to 14 Years | 0 (0.0%) | 0 (0.0%) |
| 15 Years | 0 (0.0%) | 0 (0.0%) |
| 16 and 17 Years | 0 (0.0%) | 0 (0.0%) |
| 18 to 24 Years | 9 (10.5%) | 0 (0.0%) |
| 25 to 34 Years | 0 (0.0%) | 0 (0.0%) |
| 35 to 44 Years | 0 (0.0%) | 7 (4.3%) |
| 45 to 54 Years | 9 (3.6%) | 0 (0.0%) |
| 55 to 64 Years | 3 (1.5%) | 0 (0.0%) |
| 65 to 74 Years | 0 (0.0%) | 0 (0.0%) |
| 75 Years and over | 14 (11.3%) | 0 (0.0%) |
| Total | 39 (2.9%) | 18 (1.5%) |
Income Above Poverty by Sex and Age in Sands Point
According to the poverty statistics in Sands Point, males aged under 5 years and females aged under 5 years are the age groups that are most secure financially, with 100.0% of males and 100.0% of females in these age groups living above the poverty line.
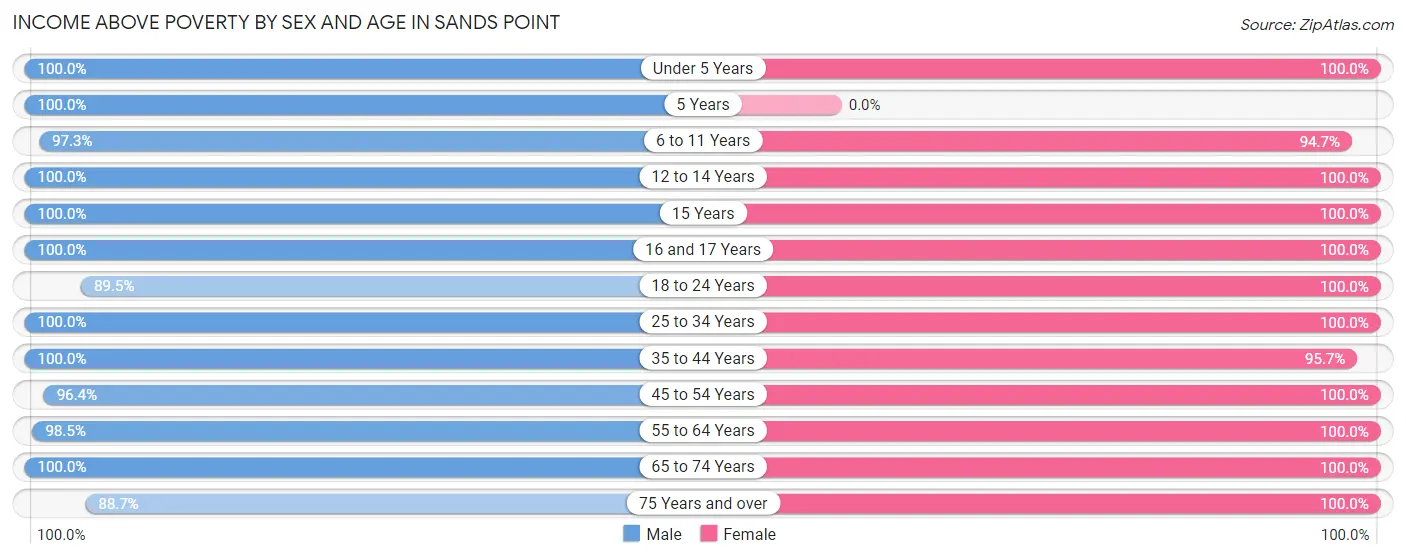
| Age Bracket | Male | Female |
| Under 5 Years | 34 (100.0%) | 66 (100.0%) |
| 5 Years | 12 (100.0%) | 0 (0.0%) |
| 6 to 11 Years | 144 (97.3%) | 124 (94.7%) |
| 12 to 14 Years | 90 (100.0%) | 27 (100.0%) |
| 15 Years | 82 (100.0%) | 31 (100.0%) |
| 16 and 17 Years | 34 (100.0%) | 60 (100.0%) |
| 18 to 24 Years | 77 (89.5%) | 82 (100.0%) |
| 25 to 34 Years | 46 (100.0%) | 34 (100.0%) |
| 35 to 44 Years | 80 (100.0%) | 154 (95.7%) |
| 45 to 54 Years | 244 (96.4%) | 216 (100.0%) |
| 55 to 64 Years | 201 (98.5%) | 150 (100.0%) |
| 65 to 74 Years | 163 (100.0%) | 151 (100.0%) |
| 75 Years and over | 110 (88.7%) | 109 (100.0%) |
| Total | 1,317 (97.1%) | 1,204 (98.5%) |
Income Below Poverty Among Married-Couple Families in Sands Point
The poverty statistics for married-couple families in Sands Point show that 0.6% or 4 of the total 650 families live below the poverty line. Families with 3 or 4 children have the highest poverty rate of 4.0%, comprising of 4 families. On the other hand, families with no children have the lowest poverty rate of 0.0%, which includes 0 families.
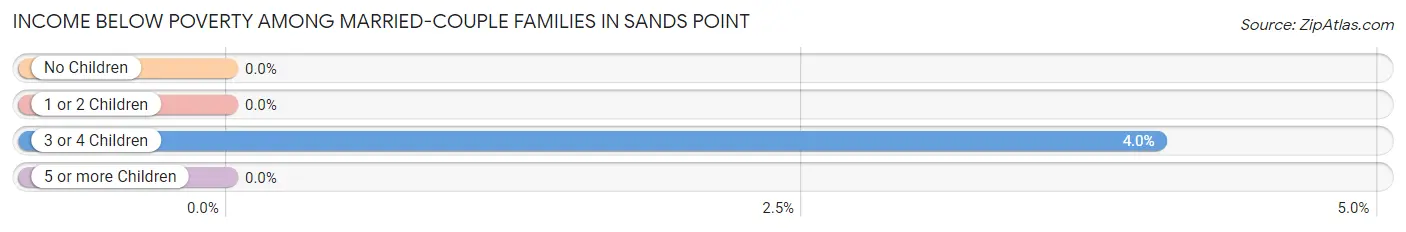
| Children | Above Poverty | Below Poverty |
| No Children | 347 (100.0%) | 0 (0.0%) |
| 1 or 2 Children | 204 (100.0%) | 0 (0.0%) |
| 3 or 4 Children | 95 (96.0%) | 4 (4.0%) |
| 5 or more Children | 0 (0.0%) | 0 (0.0%) |
| Total | 646 (99.4%) | 4 (0.6%) |
Income Below Poverty Among Single-Parent Households in Sands Point
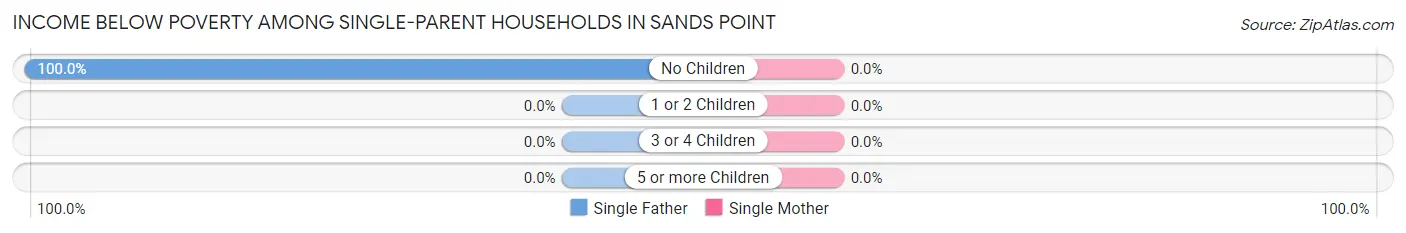
| Children | Single Father | Single Mother |
| No Children | 9 (100.0%) | 0 (0.0%) |
| 1 or 2 Children | 0 (0.0%) | 0 (0.0%) |
| 3 or 4 Children | 0 (0.0%) | 0 (0.0%) |
| 5 or more Children | 0 (0.0%) | 0 (0.0%) |
| Total | 9 (20.0%) | 0 (0.0%) |
Income Below Poverty Among Married-Couple vs Single-Parent Households in Sands Point
The poverty data for Sands Point shows that 4 of the married-couple family households (0.6%) and 9 of the single-parent households (13.4%) are living below the poverty level. Within the married-couple family households, those with 3 or 4 children have the highest poverty rate, with 4 households (4.0%) falling below the poverty line. Among the single-parent households, those with no children have the highest poverty rate, with 9 household (52.9%) living below poverty.
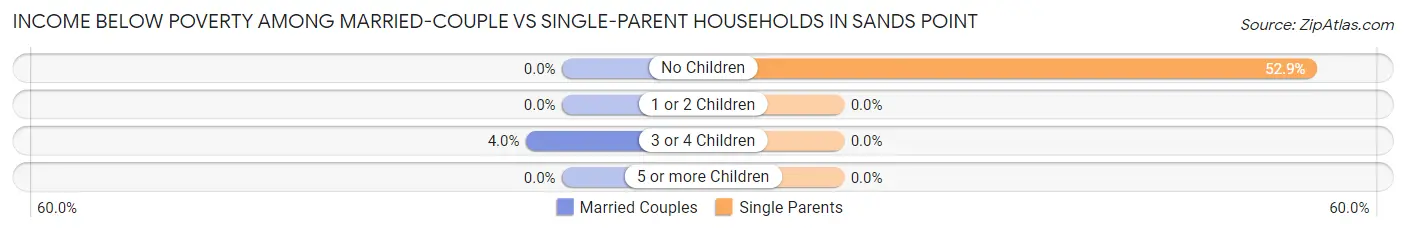
| Children | Married-Couple Families | Single-Parent Households |
| No Children | 0 (0.0%) | 9 (52.9%) |
| 1 or 2 Children | 0 (0.0%) | 0 (0.0%) |
| 3 or 4 Children | 4 (4.0%) | 0 (0.0%) |
| 5 or more Children | 0 (0.0%) | 0 (0.0%) |
| Total | 4 (0.6%) | 9 (13.4%) |
Race in Sands Point
The most populous races in Sands Point are White / Caucasian (2,306 | 85.3%), Asian (236 | 8.7%), and Hispanic or Latino (199 | 7.4%).
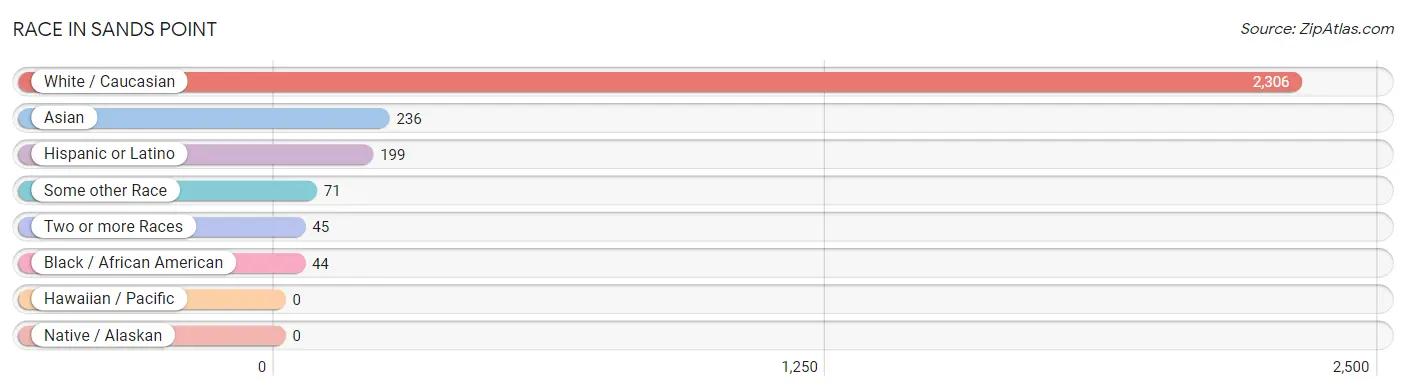
| Race | # Population | % Population |
| Asian | 236 | 8.7% |
| Black / African American | 44 | 1.6% |
| Hawaiian / Pacific | 0 | 0.0% |
| Hispanic or Latino | 199 | 7.4% |
| Native / Alaskan | 0 | 0.0% |
| White / Caucasian | 2,306 | 85.3% |
| Two or more Races | 45 | 1.7% |
| Some other Race | 71 | 2.6% |
| Total | 2,702 | 100.0% |
Ancestry in Sands Point
The most populous ancestries reported in Sands Point are Russian (405 | 15.0%), American (240 | 8.9%), Italian (176 | 6.5%), Eastern European (166 | 6.1%), and Polish (156 | 5.8%), together accounting for 42.3% of all Sands Point residents.
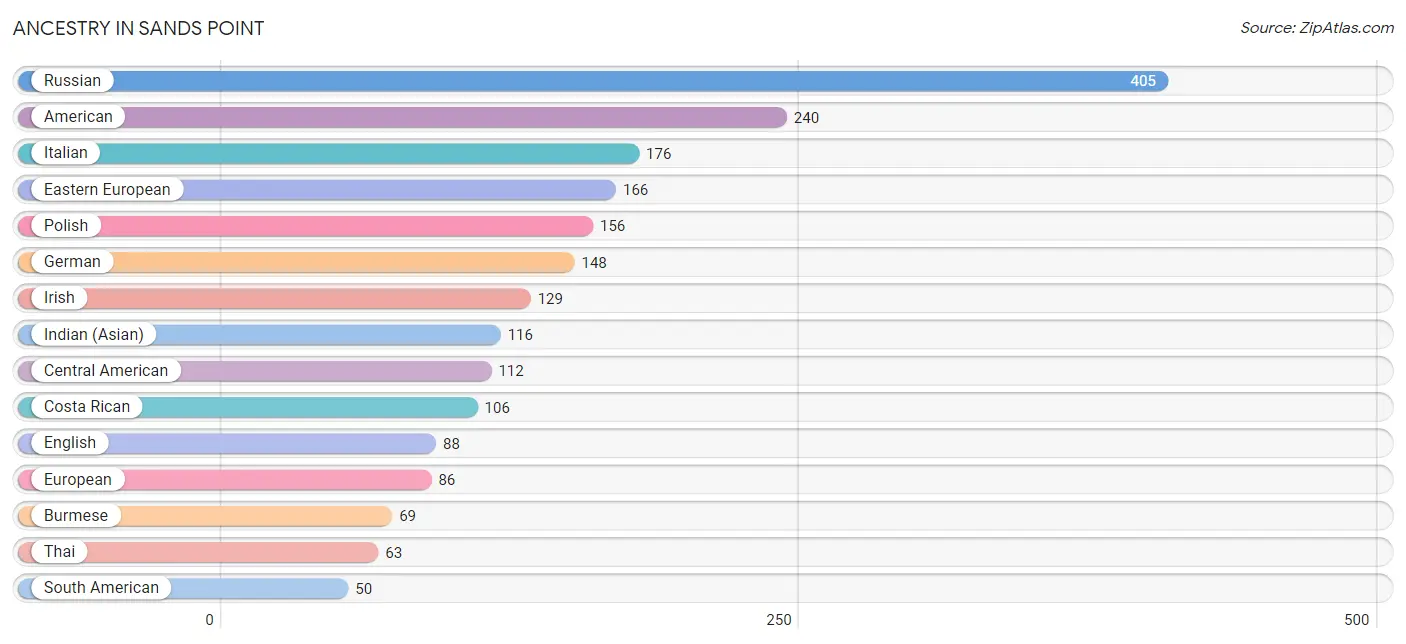
| Ancestry | # Population | % Population |
| American | 240 | 8.9% |
| Arab | 3 | 0.1% |
| Argentinean | 20 | 0.7% |
| Armenian | 1 | 0.0% |
| Australian | 18 | 0.7% |
| Austrian | 7 | 0.3% |
| Bhutanese | 21 | 0.8% |
| British | 22 | 0.8% |
| British West Indian | 3 | 0.1% |
| Burmese | 69 | 2.5% |
| Central American | 112 | 4.2% |
| Chilean | 9 | 0.3% |
| Costa Rican | 106 | 3.9% |
| Cuban | 8 | 0.3% |
| Czech | 24 | 0.9% |
| Eastern European | 166 | 6.1% |
| English | 88 | 3.3% |
| European | 86 | 3.2% |
| French | 7 | 0.3% |
| German | 148 | 5.5% |
| Greek | 44 | 1.6% |
| Guyanese | 2 | 0.1% |
| Hungarian | 8 | 0.3% |
| Indian (Asian) | 116 | 4.3% |
| Iranian | 19 | 0.7% |
| Irish | 129 | 4.8% |
| Israeli | 7 | 0.3% |
| Italian | 176 | 6.5% |
| Jamaican | 25 | 0.9% |
| Korean | 16 | 0.6% |
| Mexican | 29 | 1.1% |
| Northern European | 20 | 0.7% |
| Norwegian | 2 | 0.1% |
| Peruvian | 21 | 0.8% |
| Polish | 156 | 5.8% |
| Romanian | 5 | 0.2% |
| Russian | 405 | 15.0% |
| Salvadoran | 6 | 0.2% |
| Scottish | 6 | 0.2% |
| South American | 50 | 1.8% |
| South American Indian | 21 | 0.8% |
| Swedish | 4 | 0.2% |
| Swiss | 13 | 0.5% |
| Thai | 63 | 2.3% |
| Turkish | 11 | 0.4% | View All 45 Rows |
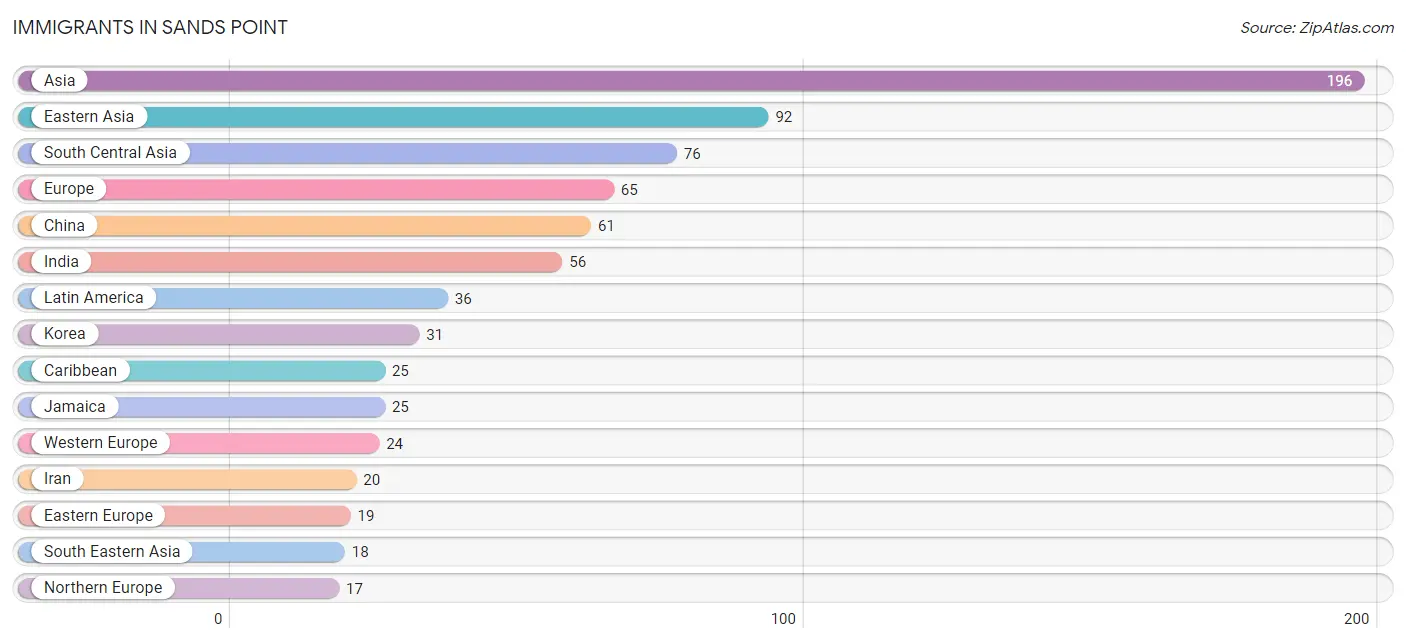
Immigrants in Sands Point
The most numerous immigrant groups reported in Sands Point came from Asia (196 | 7.2%), Eastern Asia (92 | 3.4%), South Central Asia (76 | 2.8%), Europe (65 | 2.4%), and China (61 | 2.3%), together accounting for 18.1% of all Sands Point residents.
| Immigration Origin | # Population | % Population |
| Asia | 196 | 7.2% |
| Australia | 4 | 0.2% |
| Canada | 7 | 0.3% |
| Caribbean | 25 | 0.9% |
| Central America | 6 | 0.2% |
| Chile | 5 | 0.2% |
| China | 61 | 2.3% |
| Eastern Asia | 92 | 3.4% |
| Eastern Europe | 19 | 0.7% |
| El Salvador | 6 | 0.2% |
| Europe | 65 | 2.4% |
| France | 3 | 0.1% |
| Germany | 11 | 0.4% |
| Hong Kong | 4 | 0.2% |
| India | 56 | 2.1% |
| Indonesia | 4 | 0.2% |
| Iran | 20 | 0.7% |
| Italy | 5 | 0.2% |
| Jamaica | 25 | 0.9% |
| Korea | 31 | 1.1% |
| Latin America | 36 | 1.3% |
| Northern Europe | 17 | 0.6% |
| Oceania | 4 | 0.2% |
| Philippines | 14 | 0.5% |
| Poland | 5 | 0.2% |
| South America | 5 | 0.2% |
| South Central Asia | 76 | 2.8% |
| South Eastern Asia | 18 | 0.7% |
| Southern Europe | 5 | 0.2% |
| Switzerland | 10 | 0.4% |
| Taiwan | 9 | 0.3% |
| Turkey | 10 | 0.4% |
| Western Asia | 10 | 0.4% |
| Western Europe | 24 | 0.9% | View All 34 Rows |
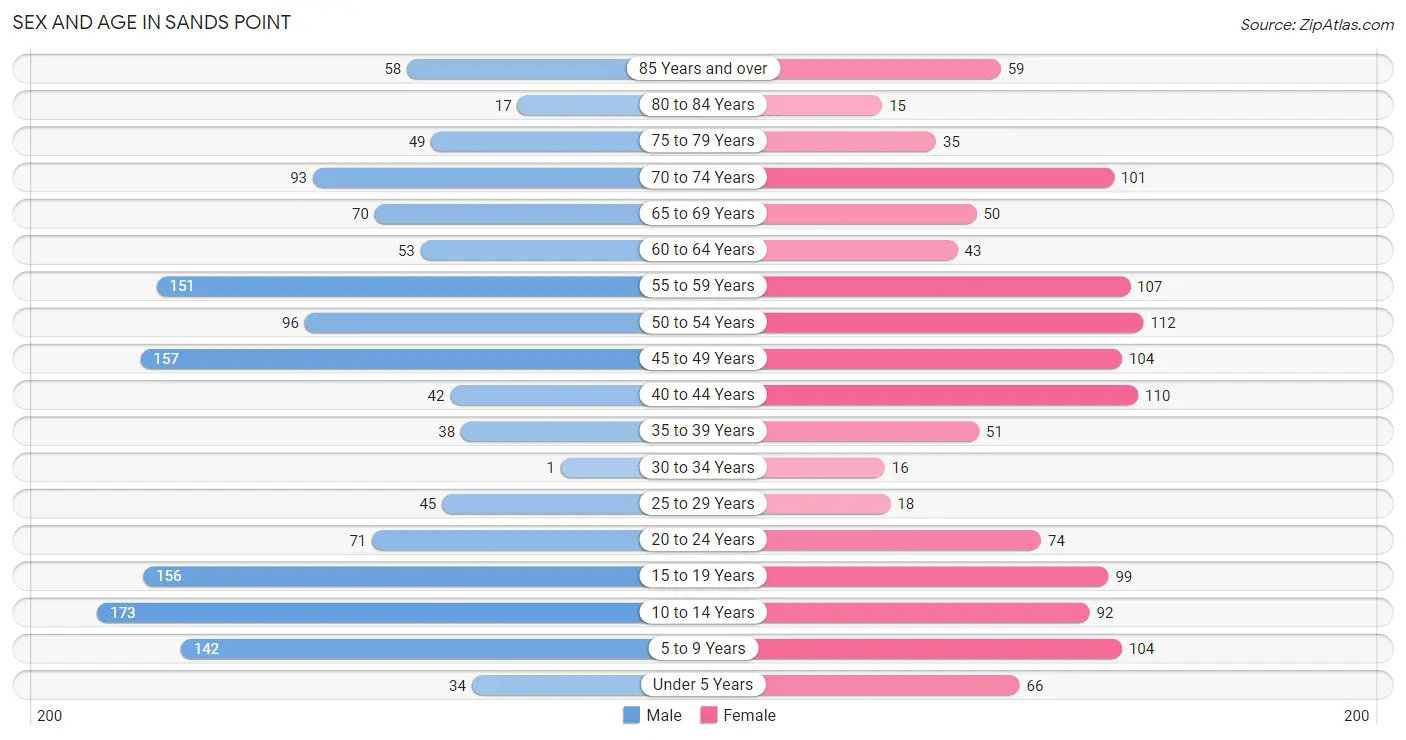
Sex and Age in Sands Point
Sex and Age in Sands Point
The most populous age groups in Sands Point are 10 to 14 Years (173 | 12.0%) for men and 50 to 54 Years (112 | 8.9%) for women.
| Age Bracket | Male | Female |
| Under 5 Years | 34 (2.4%) | 66 (5.2%) |
| 5 to 9 Years | 142 (9.8%) | 104 (8.3%) |
| 10 to 14 Years | 173 (12.0%) | 92 (7.3%) |
| 15 to 19 Years | 156 (10.8%) | 99 (7.9%) |
| 20 to 24 Years | 71 (4.9%) | 74 (5.9%) |
| 25 to 29 Years | 45 (3.1%) | 18 (1.4%) |
| 30 to 34 Years | 1 (0.1%) | 16 (1.3%) |
| 35 to 39 Years | 38 (2.6%) | 51 (4.1%) |
| 40 to 44 Years | 42 (2.9%) | 110 (8.8%) |
| 45 to 49 Years | 157 (10.9%) | 104 (8.3%) |
| 50 to 54 Years | 96 (6.6%) | 112 (8.9%) |
| 55 to 59 Years | 151 (10.4%) | 107 (8.5%) |
| 60 to 64 Years | 53 (3.7%) | 43 (3.4%) |
| 65 to 69 Years | 70 (4.8%) | 50 (4.0%) |
| 70 to 74 Years | 93 (6.4%) | 101 (8.0%) |
| 75 to 79 Years | 49 (3.4%) | 35 (2.8%) |
| 80 to 84 Years | 17 (1.2%) | 15 (1.2%) |
| 85 Years and over | 58 (4.0%) | 59 (4.7%) |
| Total | 1,446 (100.0%) | 1,256 (100.0%) |
Families and Households in Sands Point
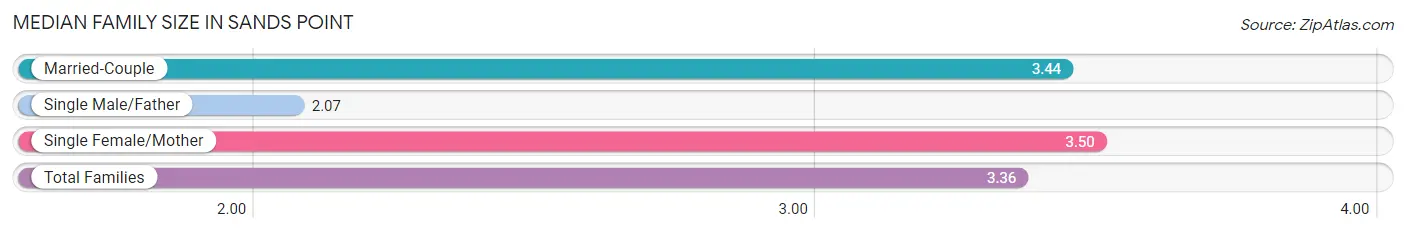
Median Family Size in Sands Point
The median family size in Sands Point is 3.36 persons per family, with single female/mother families (22 | 3.1%) accounting for the largest median family size of 3.5 persons per family. On the other hand, single male/father families (45 | 6.3%) represent the smallest median family size with 2.07 persons per family.
| Family Type | # Families | Family Size |
| Married-Couple | 650 (90.7%) | 3.44 |
| Single Male/Father | 45 (6.3%) | 2.07 |
| Single Female/Mother | 22 (3.1%) | 3.50 |
| Total Families | 717 (100.0%) | 3.36 |
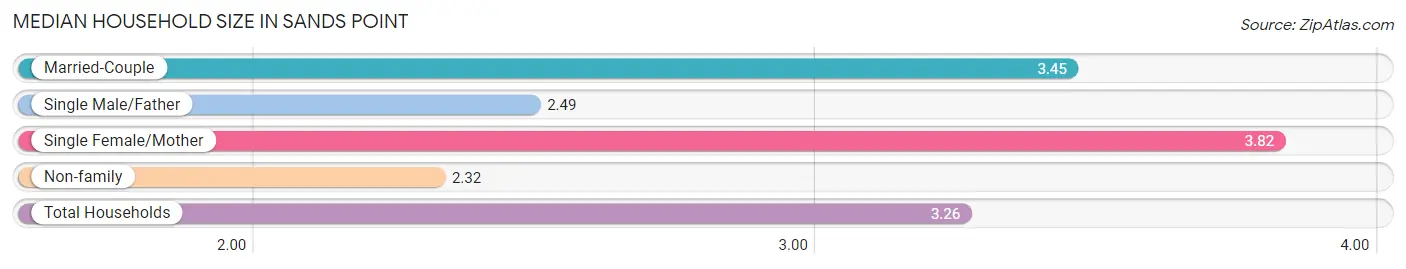
Median Household Size in Sands Point
The median household size in Sands Point is 3.26 persons per household, with single female/mother households (22 | 2.7%) accounting for the largest median household size of 3.82 persons per household. non-family households (103 | 12.6%) represent the smallest median household size with 2.32 persons per household.
| Household Type | # Households | Household Size |
| Married-Couple | 650 (79.3%) | 3.45 |
| Single Male/Father | 45 (5.5%) | 2.49 |
| Single Female/Mother | 22 (2.7%) | 3.82 |
| Non-family | 103 (12.6%) | 2.32 |
| Total Households | 820 (100.0%) | 3.26 |
Household Size by Marriage Status in Sands Point
Out of a total of 820 households in Sands Point, 717 (87.4%) are family households, while 103 (12.6%) are nonfamily households. The most numerous type of family households are 2-person households, comprising 263, and the most common type of nonfamily households are 1-person households, comprising 90.
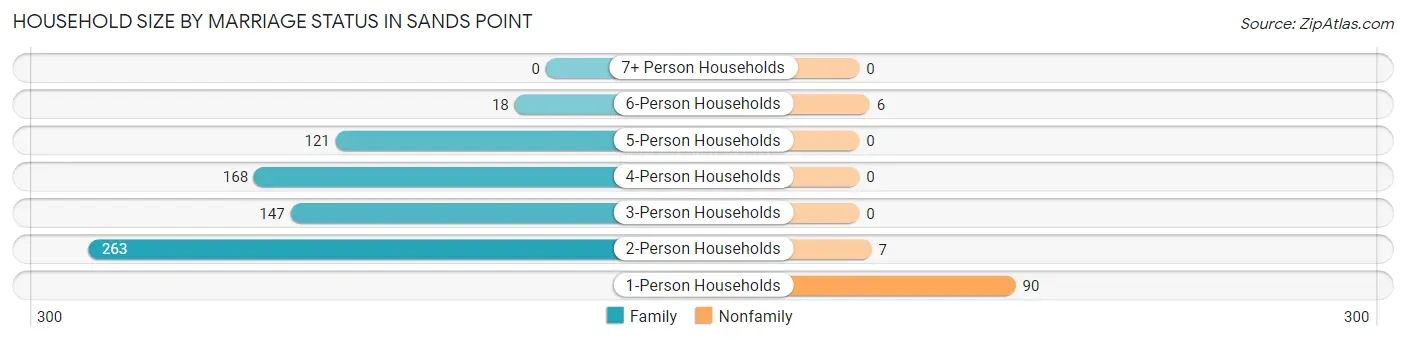
| Household Size | Family Households | Nonfamily Households |
| 1-Person Households | - | 90 (11.0%) |
| 2-Person Households | 263 (32.1%) | 7 (0.9%) |
| 3-Person Households | 147 (17.9%) | 0 (0.0%) |
| 4-Person Households | 168 (20.5%) | 0 (0.0%) |
| 5-Person Households | 121 (14.8%) | 0 (0.0%) |
| 6-Person Households | 18 (2.2%) | 6 (0.7%) |
| 7+ Person Households | 0 (0.0%) | 0 (0.0%) |
| Total | 717 (87.4%) | 103 (12.6%) |
Female Fertility in Sands Point
Fertility by Age in Sands Point
Average fertility rate in Sands Point is 35.0 births per 1,000 women. Women in the age bracket of 20 to 34 years have the highest fertility rate with 46.0 births per 1,000 women. Women in the age bracket of 35 to 50 years acount for 70.6% of all women with births.
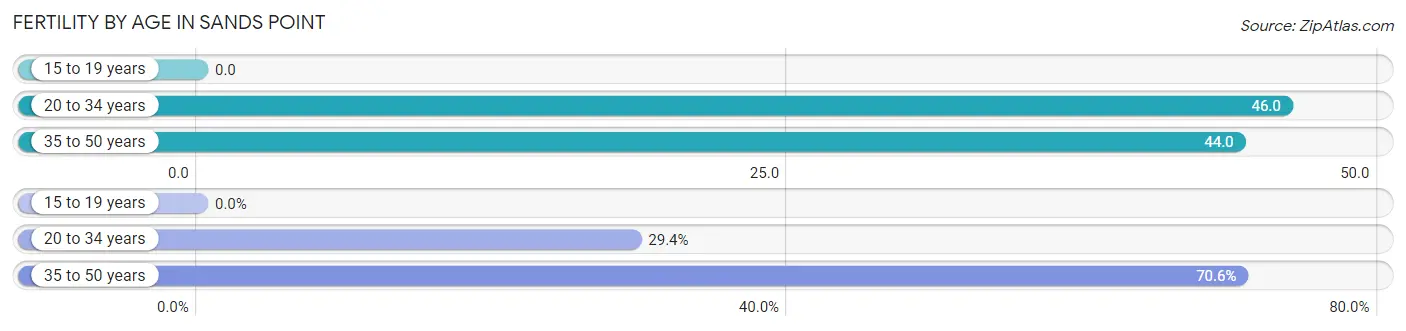
| Age Bracket | Women with Births | Births / 1,000 Women |
| 15 to 19 years | 0 (0.0%) | 0.0 |
| 20 to 34 years | 5 (29.4%) | 46.0 |
| 35 to 50 years | 12 (70.6%) | 44.0 |
| Total | 17 (100.0%) | 35.0 |
Fertility by Age by Marriage Status in Sands Point
82.4% of women with births (17) in Sands Point are married. The highest percentage of unmarried women with births falls into 35 to 50 years age bracket with 25.0% of them unmarried at the time of birth, while the lowest percentage of unmarried women with births belong to 20 to 34 years age bracket with 0.0% of them unmarried.
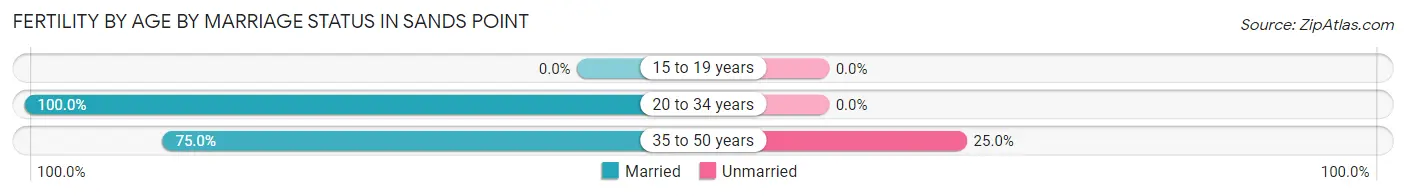
| Age Bracket | Married | Unmarried |
| 15 to 19 years | 0 (0.0%) | 0 (0.0%) |
| 20 to 34 years | 5 (100.0%) | 0 (0.0%) |
| 35 to 50 years | 9 (75.0%) | 3 (25.0%) |
| Total | 14 (82.4%) | 3 (17.6%) |
Fertility by Education in Sands Point
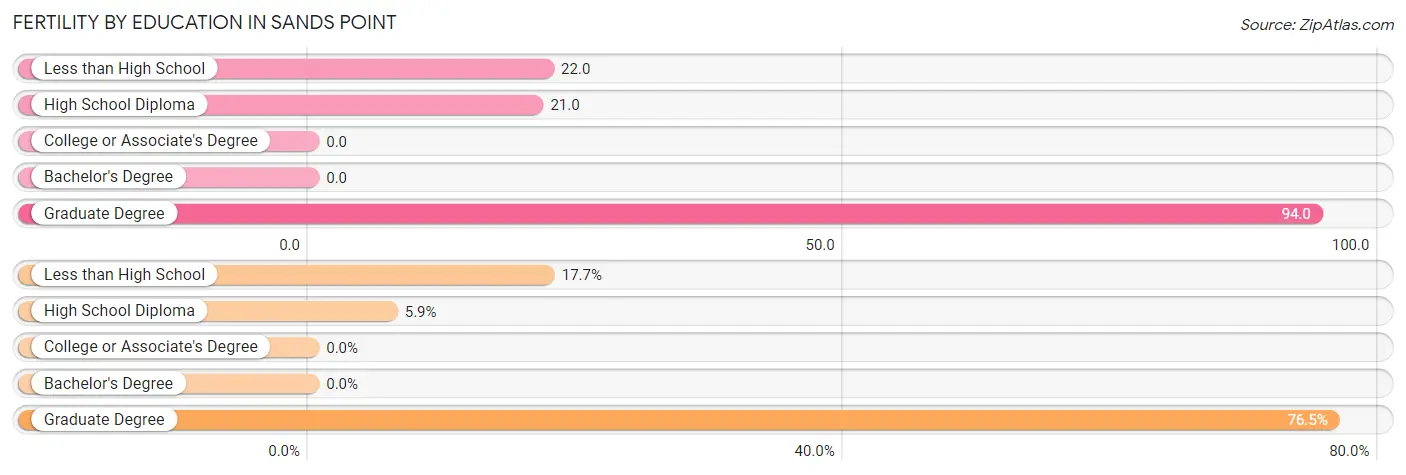
| Educational Attainment | Women with Births | Births / 1,000 Women |
| Less than High School | 3 (17.6%) | 22.0 |
| High School Diploma | 1 (5.9%) | 21.0 |
| College or Associate's Degree | 0 (0.0%) | 0.0 |
| Bachelor's Degree | 0 (0.0%) | 0.0 |
| Graduate Degree | 13 (76.5%) | 94.0 |
| Total | 17 (100.0%) | 35.0 |
Fertility by Education by Marriage Status in Sands Point
17.6% of women with births in Sands Point are unmarried. Women with the educational attainment of high school diploma are most likely to be married with 100.0% of them married at childbirth, while women with the educational attainment of less than high school are least likely to be married with 100.0% of them unmarried at childbirth.
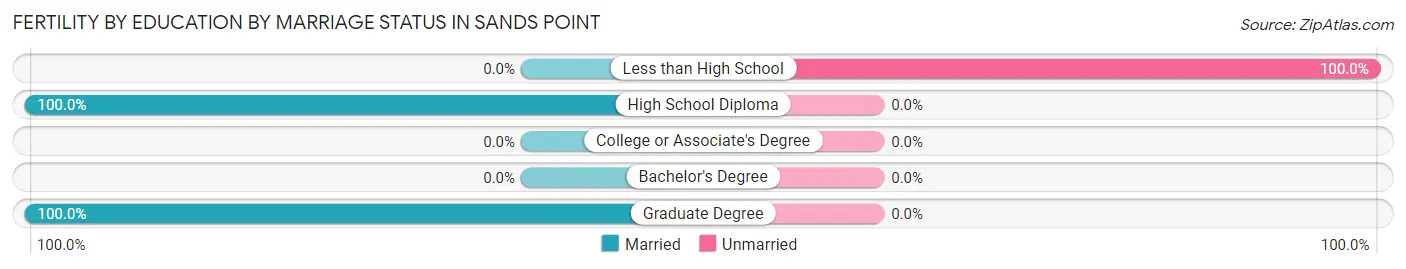
| Educational Attainment | Married | Unmarried |
| Less than High School | 0 (0.0%) | 3 (100.0%) |
| High School Diploma | 1 (100.0%) | 0 (0.0%) |
| College or Associate's Degree | 0 (0.0%) | 0 (0.0%) |
| Bachelor's Degree | 0 (0.0%) | 0 (0.0%) |
| Graduate Degree | 13 (100.0%) | 0 (0.0%) |
| Total | 14 (82.4%) | 3 (17.6%) |
Employment Characteristics in Sands Point
Employment by Class of Employer in Sands Point
Among the 1,113 employed individuals in Sands Point, private company employees (587 | 52.7%), self-employed (incorporated) (159 | 14.3%), and not-for-profit organizations (137 | 12.3%) make up the most common classes of employment.
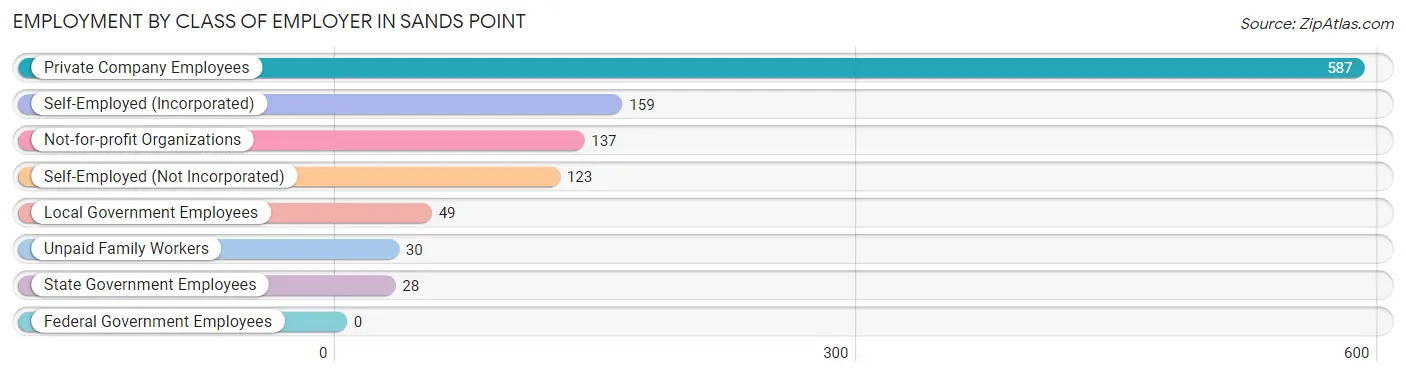
| Employer Class | # Employees | % Employees |
| Private Company Employees | 587 | 52.7% |
| Self-Employed (Incorporated) | 159 | 14.3% |
| Self-Employed (Not Incorporated) | 123 | 11.1% |
| Not-for-profit Organizations | 137 | 12.3% |
| Local Government Employees | 49 | 4.4% |
| State Government Employees | 28 | 2.5% |
| Federal Government Employees | 0 | 0.0% |
| Unpaid Family Workers | 30 | 2.7% |
| Total | 1,113 | 100.0% |
Employment Status by Age in Sands Point
According to the labor force statistics for Sands Point, out of the total population over 16 years of age (1,978), 60.7% or 1,201 individuals are in the labor force, with 5.5% or 66 of them unemployed. The age group with the highest labor force participation rate is 25 to 29 years, with 88.9% or 56 individuals in the labor force. Within the labor force, the 35 to 44 years age range has the highest percentage of unemployed individuals, with 10.9% or 20 of them being unemployed.
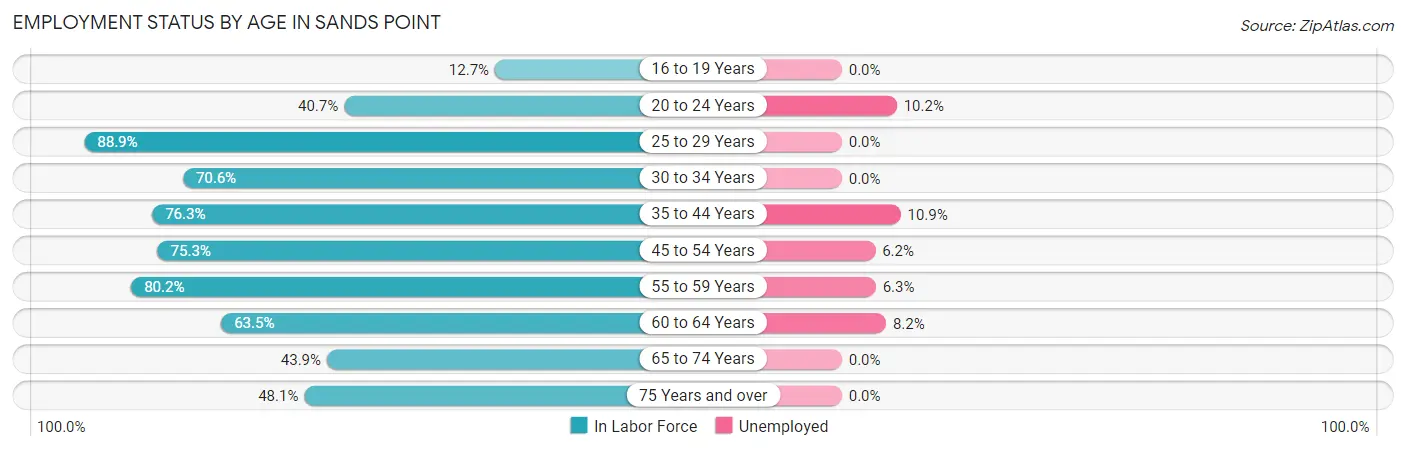
| Age Bracket | In Labor Force | Unemployed |
| 16 to 19 Years | 18 (12.7%) | 0 (0.0%) |
| 20 to 24 Years | 59 (40.7%) | 6 (10.2%) |
| 25 to 29 Years | 56 (88.9%) | 0 (0.0%) |
| 30 to 34 Years | 12 (70.6%) | 0 (0.0%) |
| 35 to 44 Years | 184 (76.3%) | 20 (10.9%) |
| 45 to 54 Years | 353 (75.3%) | 22 (6.2%) |
| 55 to 59 Years | 207 (80.2%) | 13 (6.3%) |
| 60 to 64 Years | 61 (63.5%) | 5 (8.2%) |
| 65 to 74 Years | 138 (43.9%) | 0 (0.0%) |
| 75 Years and over | 112 (48.1%) | 0 (0.0%) |
| Total | 1,201 (60.7%) | 66 (5.5%) |
Employment Status by Educational Attainment in Sands Point
According to labor force statistics for Sands Point, 76.3% of individuals (873) out of the total population between 25 and 64 years of age (1,144) are in the labor force, with 6.9% or 60 of them being unemployed. The group with the highest labor force participation rate are those with the educational attainment of high school diploma, with 96.2% or 25 individuals in the labor force. Within the labor force, individuals with college / associate degree education have the highest percentage of unemployment, with 23.3% or 7 of them being unemployed.
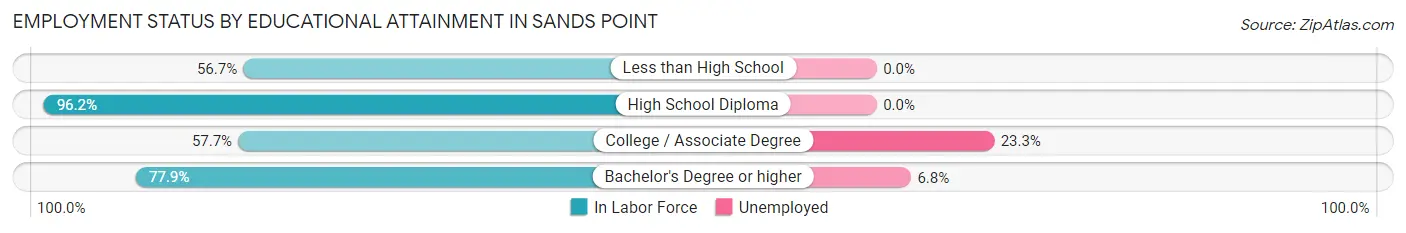
| Educational Attainment | In Labor Force | Unemployed |
| Less than High School | 34 (56.7%) | 0 (0.0%) |
| High School Diploma | 25 (96.2%) | 0 (0.0%) |
| College / Associate Degree | 30 (57.7%) | 12 (23.3%) |
| Bachelor's Degree or higher | 784 (77.9%) | 68 (6.8%) |
| Total | 873 (76.3%) | 79 (6.9%) |
Employment Occupations by Sex in Sands Point
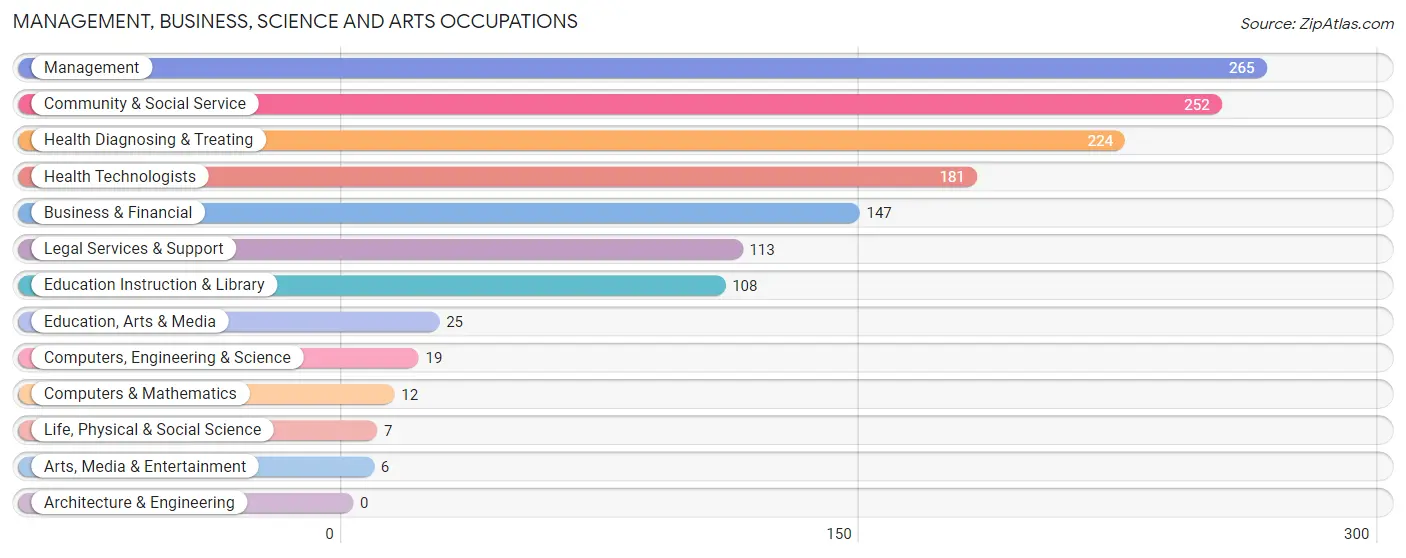
Management, Business, Science and Arts Occupations
The most common Management, Business, Science and Arts occupations in Sands Point are Management (265 | 23.4%), Community & Social Service (252 | 22.2%), Health Diagnosing & Treating (224 | 19.8%), Health Technologists (181 | 16.0%), and Business & Financial (147 | 13.0%).
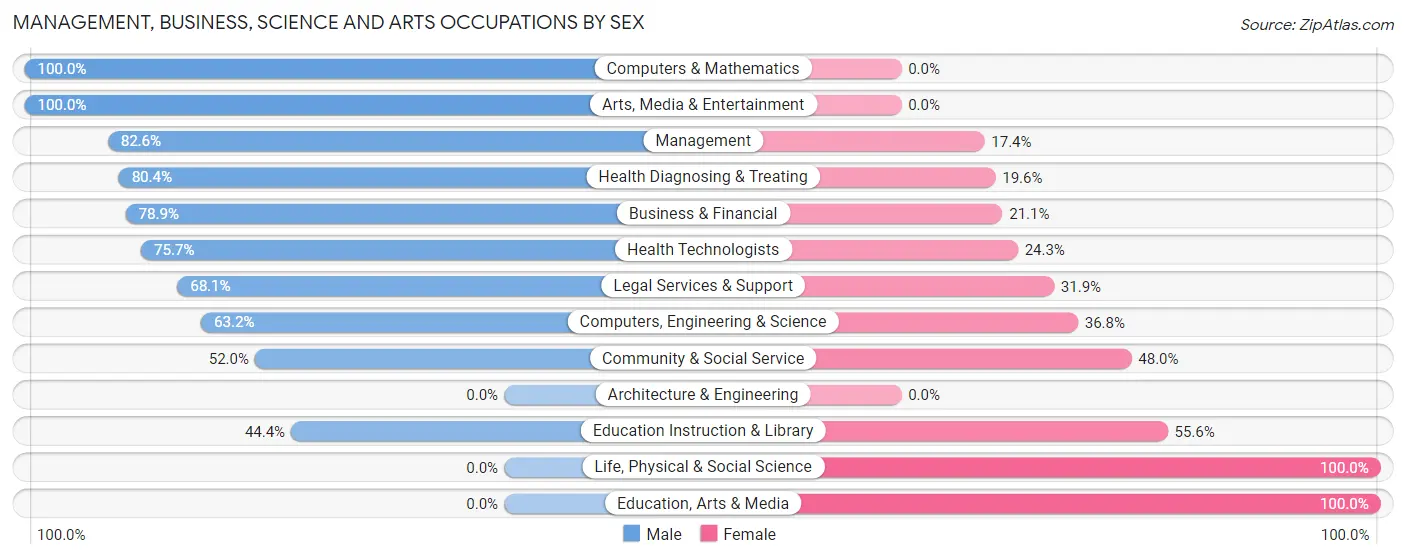
Management, Business, Science and Arts Occupations by Sex
Within the Management, Business, Science and Arts occupations in Sands Point, the most male-oriented occupations are Computers & Mathematics (100.0%), Arts, Media & Entertainment (100.0%), and Management (82.6%), while the most female-oriented occupations are Life, Physical & Social Science (100.0%), Education, Arts & Media (100.0%), and Education Instruction & Library (55.6%).
| Occupation | Male | Female |
| Management | 219 (82.6%) | 46 (17.4%) |
| Business & Financial | 116 (78.9%) | 31 (21.1%) |
| Computers, Engineering & Science | 12 (63.2%) | 7 (36.8%) |
| Computers & Mathematics | 12 (100.0%) | 0 (0.0%) |
| Architecture & Engineering | 0 (0.0%) | 0 (0.0%) |
| Life, Physical & Social Science | 0 (0.0%) | 7 (100.0%) |
| Community & Social Service | 131 (52.0%) | 121 (48.0%) |
| Education, Arts & Media | 0 (0.0%) | 25 (100.0%) |
| Legal Services & Support | 77 (68.1%) | 36 (31.9%) |
| Education Instruction & Library | 48 (44.4%) | 60 (55.6%) |
| Arts, Media & Entertainment | 6 (100.0%) | 0 (0.0%) |
| Health Diagnosing & Treating | 180 (80.4%) | 44 (19.6%) |
| Health Technologists | 137 (75.7%) | 44 (24.3%) |
| Total (Category) | 658 (72.6%) | 249 (27.5%) |
| Total (Overall) | 745 (65.7%) | 389 (34.3%) |
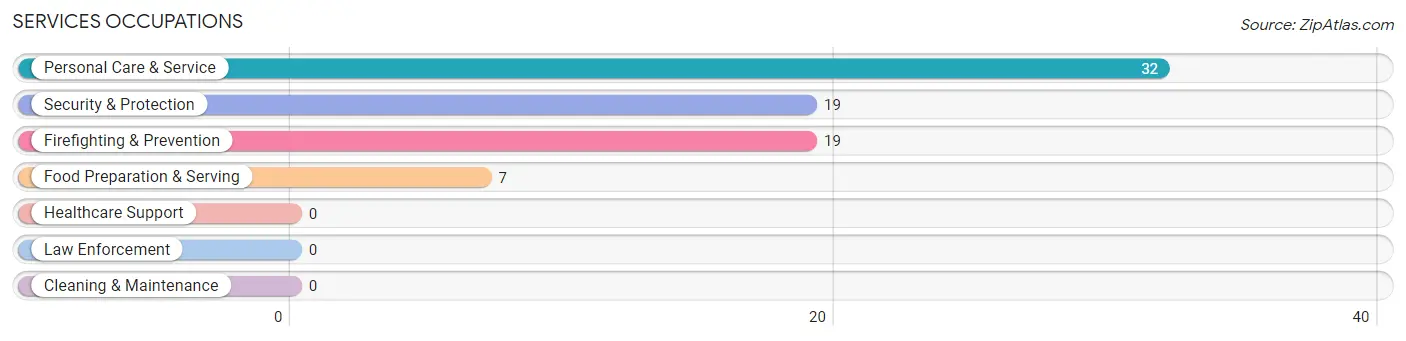
Services Occupations
The most common Services occupations in Sands Point are Personal Care & Service (32 | 2.8%), Security & Protection (19 | 1.7%), Firefighting & Prevention (19 | 1.7%), and Food Preparation & Serving (7 | 0.6%).
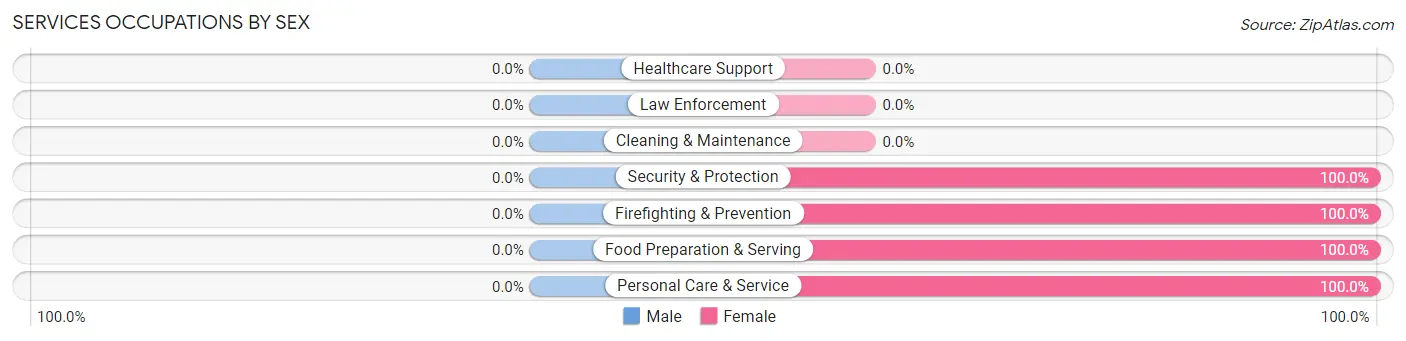
Services Occupations by Sex
| Occupation | Male | Female |
| Healthcare Support | 0 (0.0%) | 0 (0.0%) |
| Security & Protection | 0 (0.0%) | 19 (100.0%) |
| Firefighting & Prevention | 0 (0.0%) | 19 (100.0%) |
| Law Enforcement | 0 (0.0%) | 0 (0.0%) |
| Food Preparation & Serving | 0 (0.0%) | 7 (100.0%) |
| Cleaning & Maintenance | 0 (0.0%) | 0 (0.0%) |
| Personal Care & Service | 0 (0.0%) | 32 (100.0%) |
| Total (Category) | 0 (0.0%) | 58 (100.0%) |
| Total (Overall) | 745 (65.7%) | 389 (34.3%) |
Sales and Office Occupations
The most common Sales and Office occupations in Sands Point are Sales & Related (101 | 8.9%), and Office & Administration (47 | 4.1%).
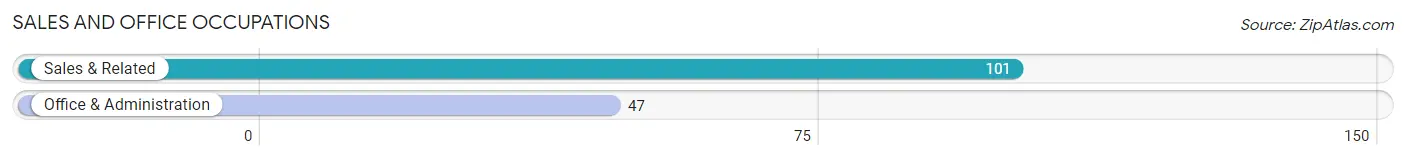
Sales and Office Occupations by Sex
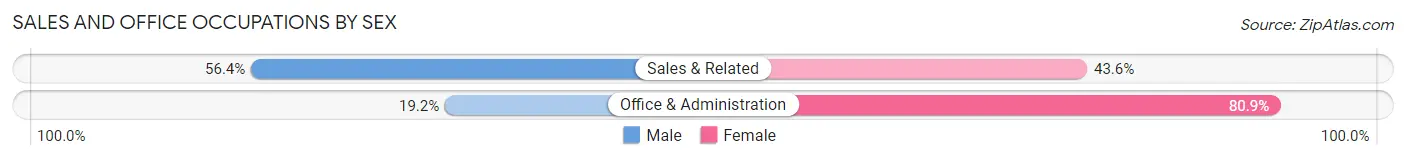
| Occupation | Male | Female |
| Sales & Related | 57 (56.4%) | 44 (43.6%) |
| Office & Administration | 9 (19.2%) | 38 (80.8%) |
| Total (Category) | 66 (44.6%) | 82 (55.4%) |
| Total (Overall) | 745 (65.7%) | 389 (34.3%) |
Natural Resources, Construction and Maintenance Occupations
The most common Natural Resources, Construction and Maintenance occupations in Sands Point are , and Construction & Extraction (11 | 1.0%).
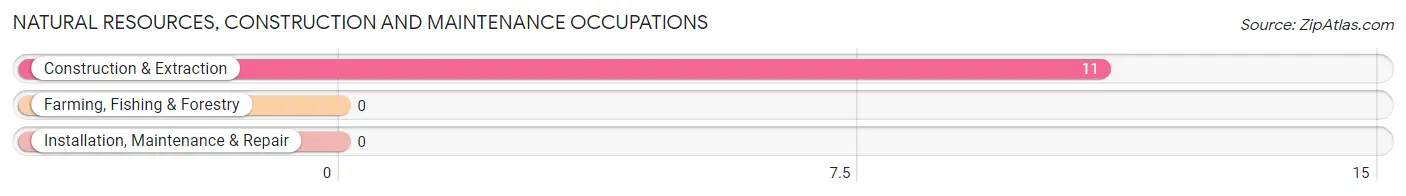
Natural Resources, Construction and Maintenance Occupations by Sex
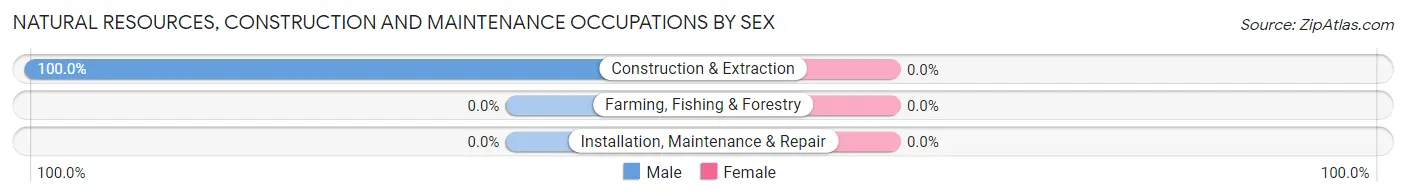
| Occupation | Male | Female |
| Farming, Fishing & Forestry | 0 (0.0%) | 0 (0.0%) |
| Construction & Extraction | 11 (100.0%) | 0 (0.0%) |
| Installation, Maintenance & Repair | 0 (0.0%) | 0 (0.0%) |
| Total (Category) | 11 (100.0%) | 0 (0.0%) |
| Total (Overall) | 745 (65.7%) | 389 (34.3%) |
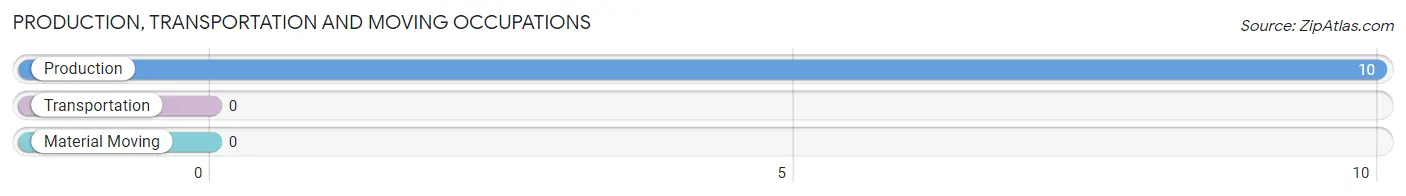
Production, Transportation and Moving Occupations
The most common Production, Transportation and Moving occupations in Sands Point are , and Production (10 | 0.9%).
Production, Transportation and Moving Occupations by Sex
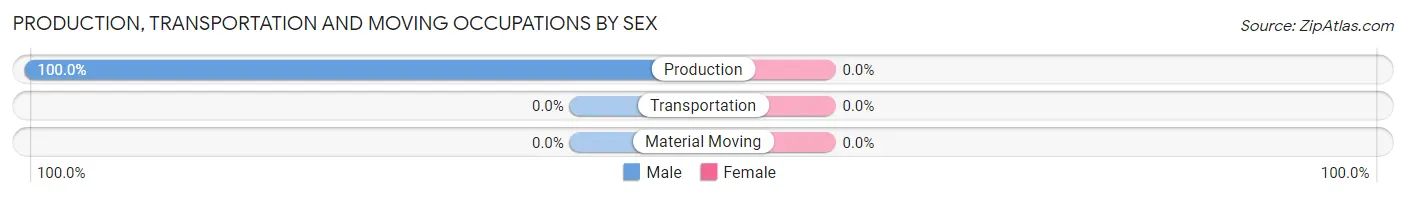
| Occupation | Male | Female |
| Production | 10 (100.0%) | 0 (0.0%) |
| Transportation | 0 (0.0%) | 0 (0.0%) |
| Material Moving | 0 (0.0%) | 0 (0.0%) |
| Total (Category) | 10 (100.0%) | 0 (0.0%) |
| Total (Overall) | 745 (65.7%) | 389 (34.3%) |
Employment Industries by Sex in Sands Point
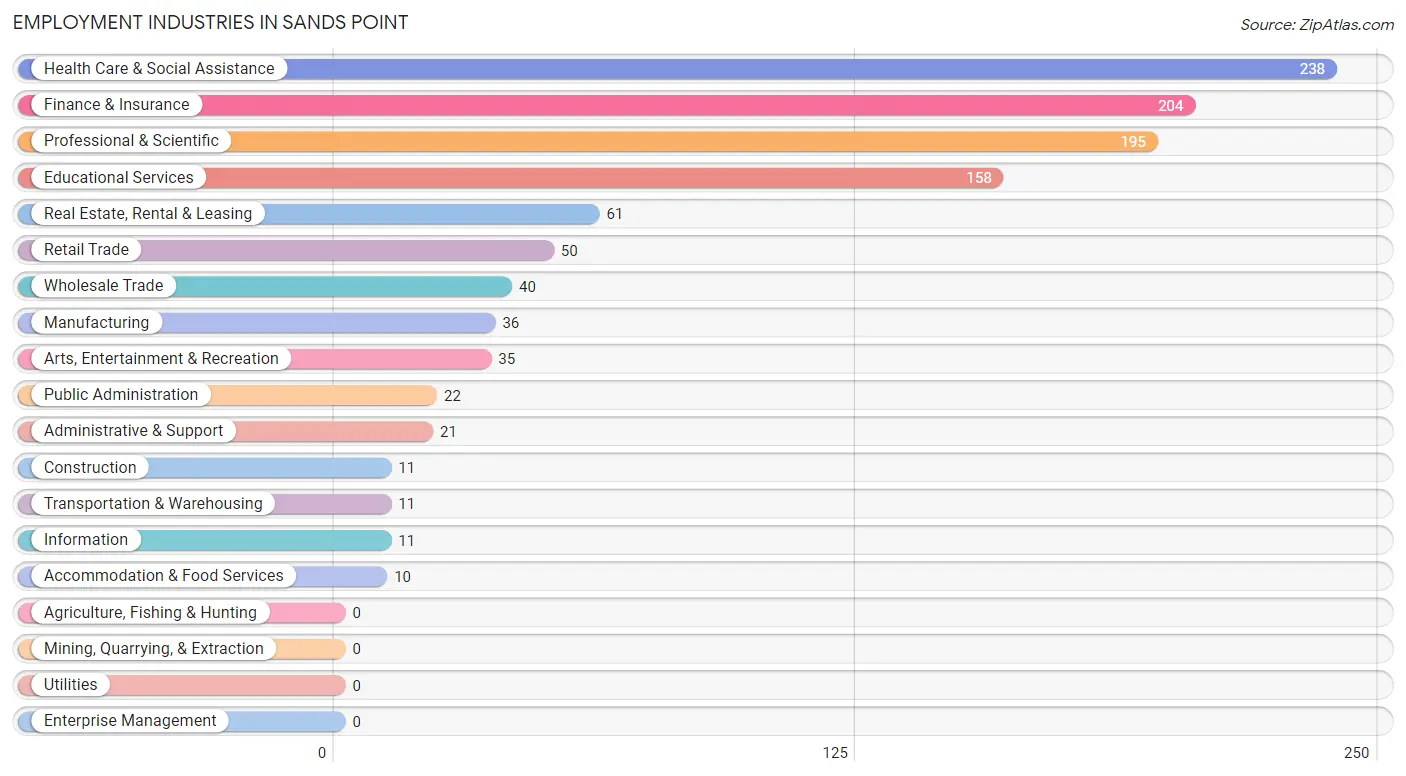
Employment Industries in Sands Point
The major employment industries in Sands Point include Health Care & Social Assistance (238 | 21.0%), Finance & Insurance (204 | 18.0%), Professional & Scientific (195 | 17.2%), Educational Services (158 | 13.9%), and Real Estate, Rental & Leasing (61 | 5.4%).
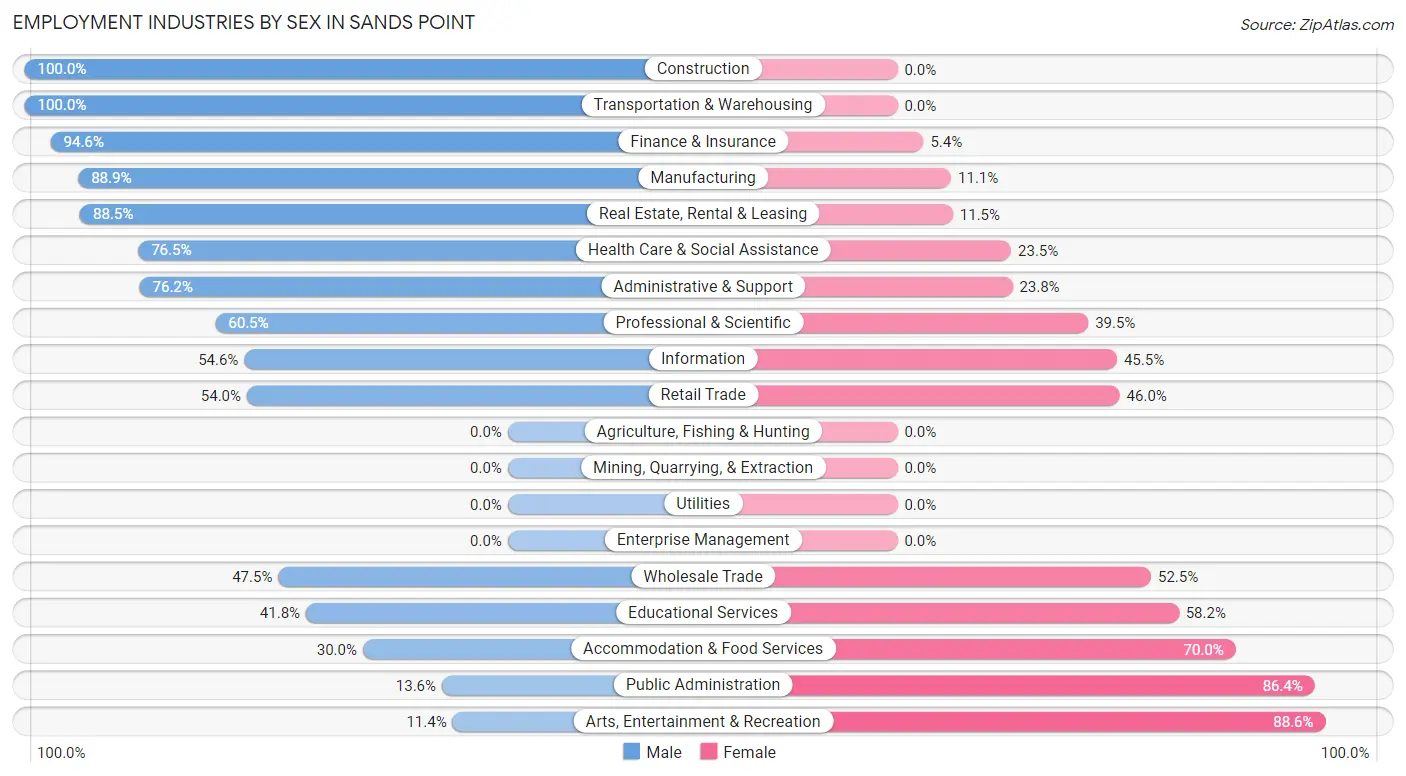
Employment Industries by Sex in Sands Point
The Sands Point industries that see more men than women are Construction (100.0%), Transportation & Warehousing (100.0%), and Finance & Insurance (94.6%), whereas the industries that tend to have a higher number of women are Arts, Entertainment & Recreation (88.6%), Public Administration (86.4%), and Accommodation & Food Services (70.0%).
| Industry | Male | Female |
| Agriculture, Fishing & Hunting | 0 (0.0%) | 0 (0.0%) |
| Mining, Quarrying, & Extraction | 0 (0.0%) | 0 (0.0%) |
| Construction | 11 (100.0%) | 0 (0.0%) |
| Manufacturing | 32 (88.9%) | 4 (11.1%) |
| Wholesale Trade | 19 (47.5%) | 21 (52.5%) |
| Retail Trade | 27 (54.0%) | 23 (46.0%) |
| Transportation & Warehousing | 11 (100.0%) | 0 (0.0%) |
| Utilities | 0 (0.0%) | 0 (0.0%) |
| Information | 6 (54.5%) | 5 (45.5%) |
| Finance & Insurance | 193 (94.6%) | 11 (5.4%) |
| Real Estate, Rental & Leasing | 54 (88.5%) | 7 (11.5%) |
| Professional & Scientific | 118 (60.5%) | 77 (39.5%) |
| Enterprise Management | 0 (0.0%) | 0 (0.0%) |
| Administrative & Support | 16 (76.2%) | 5 (23.8%) |
| Educational Services | 66 (41.8%) | 92 (58.2%) |
| Health Care & Social Assistance | 182 (76.5%) | 56 (23.5%) |
| Arts, Entertainment & Recreation | 4 (11.4%) | 31 (88.6%) |
| Accommodation & Food Services | 3 (30.0%) | 7 (70.0%) |
| Public Administration | 3 (13.6%) | 19 (86.4%) |
| Total | 745 (65.7%) | 389 (34.3%) |
Education in Sands Point
School Enrollment in Sands Point
The most common levels of schooling among the 794 students in Sands Point are high school (228 | 28.7%), elementary school (186 | 23.4%), and middle school (161 | 20.3%).
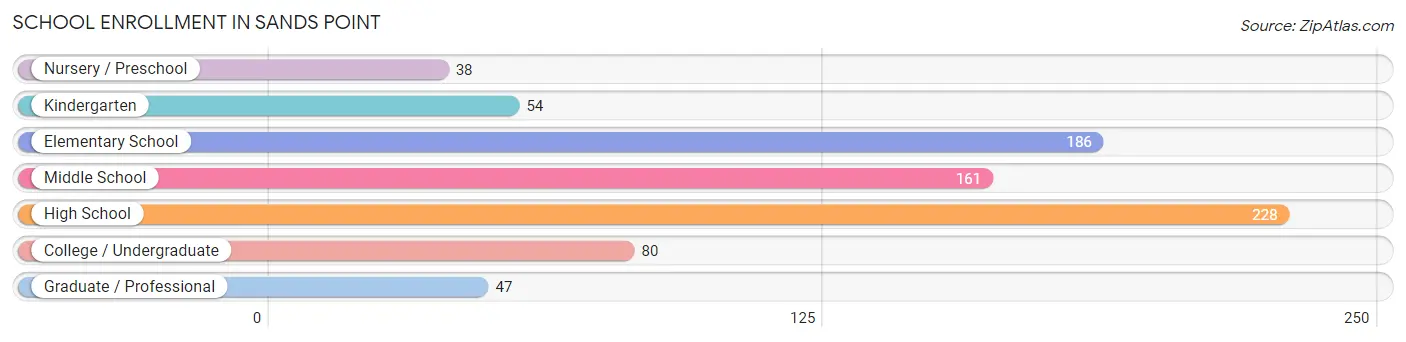
| School Level | # Students | % Students |
| Nursery / Preschool | 38 | 4.8% |
| Kindergarten | 54 | 6.8% |
| Elementary School | 186 | 23.4% |
| Middle School | 161 | 20.3% |
| High School | 228 | 28.7% |
| College / Undergraduate | 80 | 10.1% |
| Graduate / Professional | 47 | 5.9% |
| Total | 794 | 100.0% |
School Enrollment by Age by Funding Source in Sands Point
Out of a total of 794 students who are enrolled in schools in Sands Point, 190 (23.9%) attend a private institution, while the remaining 604 (76.1%) are enrolled in public schools. The age group of 3 to 4 year olds has the highest likelihood of being enrolled in private schools, with 37 (90.2% in the age bracket) enrolled. Conversely, the age group of 18 to 19 year olds has the lowest likelihood of being enrolled in a private school, with 8 (100.0% in the age bracket) attending a public institution.
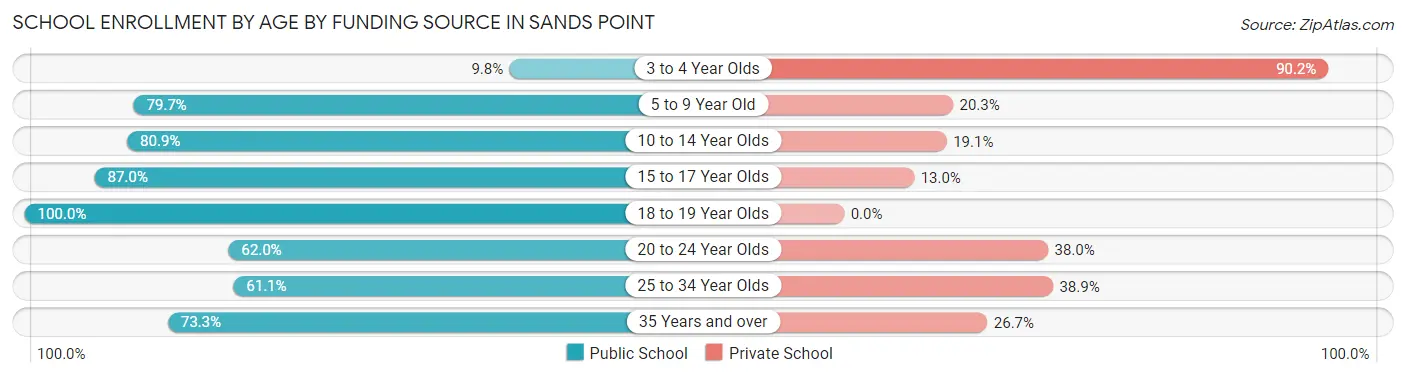
| Age Bracket | Public School | Private School |
| 3 to 4 Year Olds | 4 (9.8%) | 37 (90.2%) |
| 5 to 9 Year Old | 169 (79.7%) | 43 (20.3%) |
| 10 to 14 Year Olds | 161 (80.9%) | 38 (19.1%) |
| 15 to 17 Year Olds | 180 (87.0%) | 27 (13.0%) |
| 18 to 19 Year Olds | 8 (100.0%) | 0 (0.0%) |
| 20 to 24 Year Olds | 49 (62.0%) | 30 (38.0%) |
| 25 to 34 Year Olds | 11 (61.1%) | 7 (38.9%) |
| 35 Years and over | 22 (73.3%) | 8 (26.7%) |
| Total | 604 (76.1%) | 190 (23.9%) |
Educational Attainment by Field of Study in Sands Point
Business (386 | 24.1%), social sciences (202 | 12.6%), psychology (138 | 8.6%), bio, nature & agricultural (123 | 7.7%), and science & technology (119 | 7.4%) are the most common fields of study among 1,603 individuals in Sands Point who have obtained a bachelor's degree or higher.
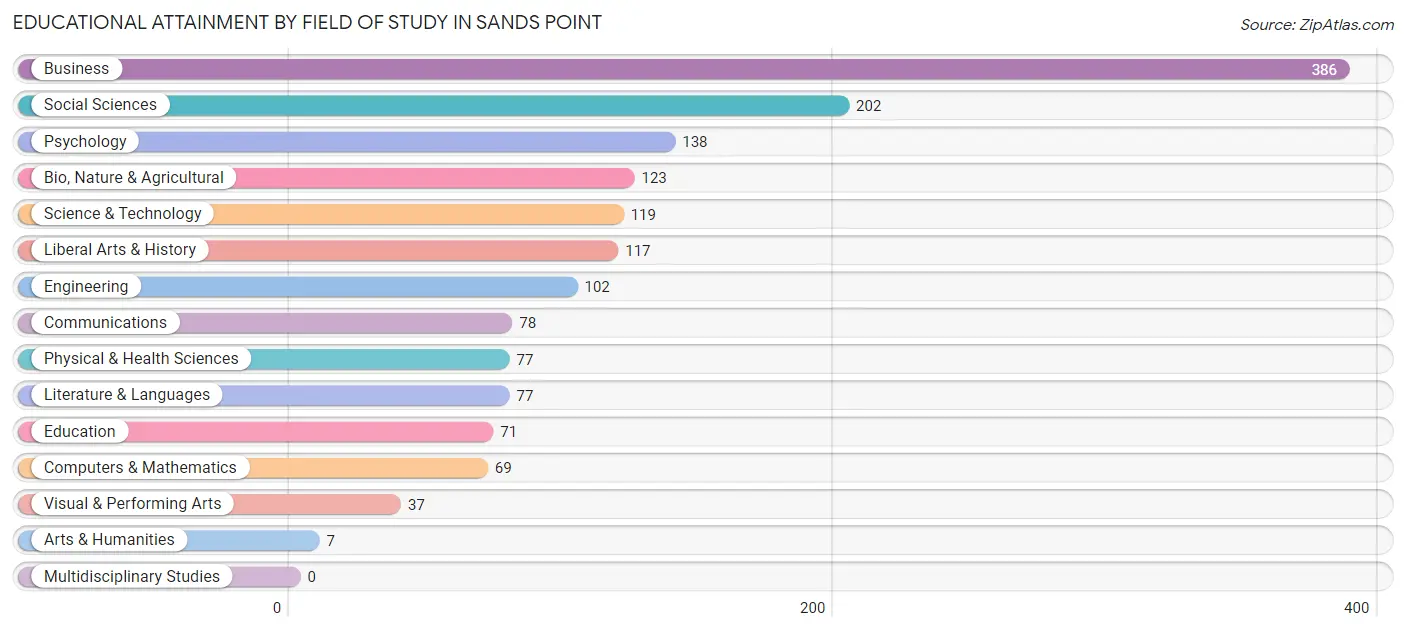
| Field of Study | # Graduates | % Graduates |
| Computers & Mathematics | 69 | 4.3% |
| Bio, Nature & Agricultural | 123 | 7.7% |
| Physical & Health Sciences | 77 | 4.8% |
| Psychology | 138 | 8.6% |
| Social Sciences | 202 | 12.6% |
| Engineering | 102 | 6.4% |
| Multidisciplinary Studies | 0 | 0.0% |
| Science & Technology | 119 | 7.4% |
| Business | 386 | 24.1% |
| Education | 71 | 4.4% |
| Literature & Languages | 77 | 4.8% |
| Liberal Arts & History | 117 | 7.3% |
| Visual & Performing Arts | 37 | 2.3% |
| Communications | 78 | 4.9% |
| Arts & Humanities | 7 | 0.4% |
| Total | 1,603 | 100.0% |
Transportation & Commute in Sands Point
Vehicle Availability by Sex in Sands Point
The most prevalent vehicle ownership categories in Sands Point are males with 2 vehicles (383, accounting for 52.9%) and females with 2 vehicles (211, making up 98.5%).
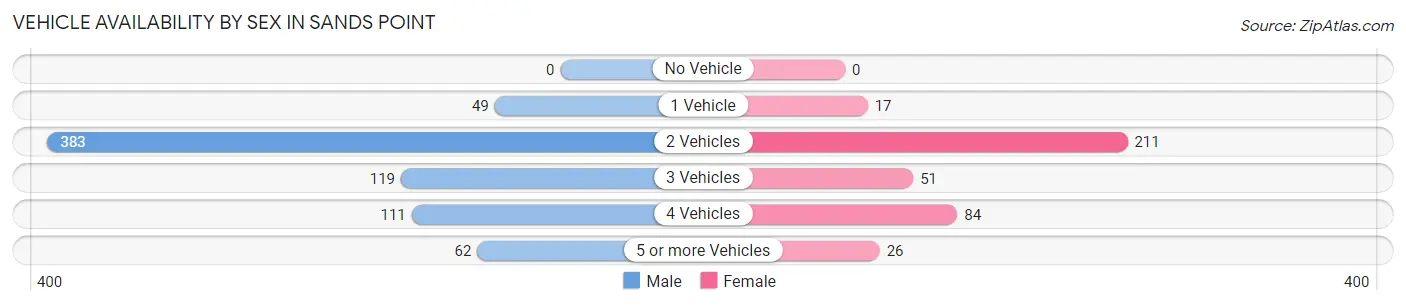
| Vehicles Available | Male | Female |
| No Vehicle | 0 (0.0%) | 0 (0.0%) |
| 1 Vehicle | 49 (6.8%) | 17 (4.4%) |
| 2 Vehicles | 383 (52.9%) | 211 (54.2%) |
| 3 Vehicles | 119 (16.4%) | 51 (13.1%) |
| 4 Vehicles | 111 (15.3%) | 84 (21.6%) |
| 5 or more Vehicles | 62 (8.6%) | 26 (6.7%) |
| Total | 724 (100.0%) | 389 (100.0%) |
Commute Time in Sands Point
The most frequently occuring commute durations in Sands Point are 60 to 89 minutes (313 commuters, 37.2%), 10 to 14 minutes (84 commuters, 10.0%), and 30 to 34 minutes (78 commuters, 9.3%).
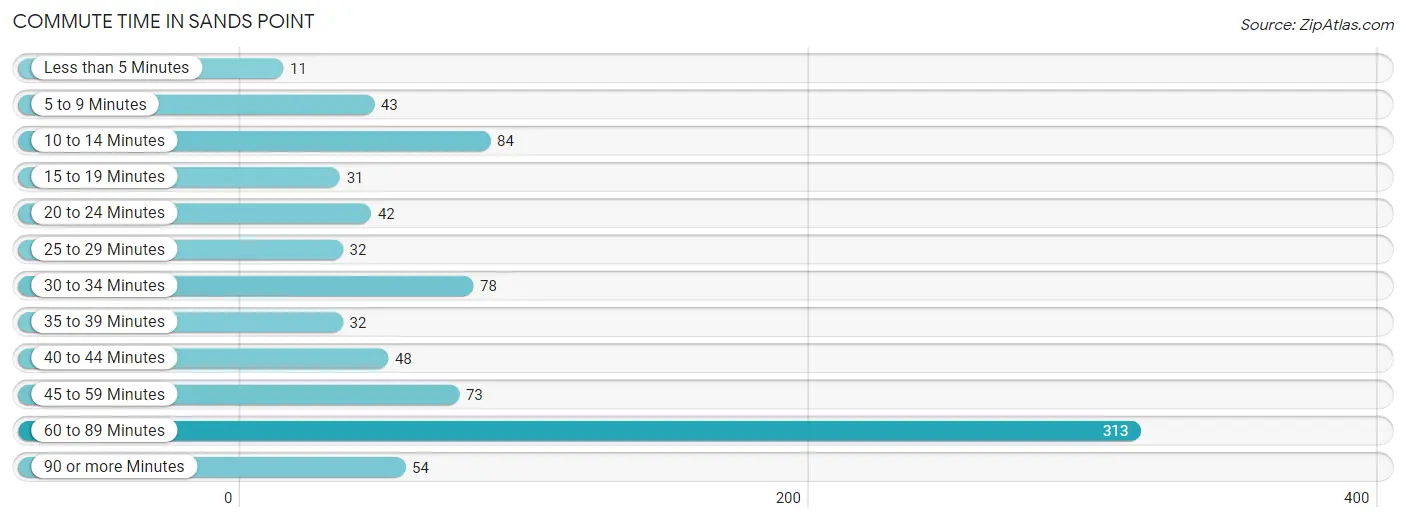
| Commute Time | # Commuters | % Commuters |
| Less than 5 Minutes | 11 | 1.3% |
| 5 to 9 Minutes | 43 | 5.1% |
| 10 to 14 Minutes | 84 | 10.0% |
| 15 to 19 Minutes | 31 | 3.7% |
| 20 to 24 Minutes | 42 | 5.0% |
| 25 to 29 Minutes | 32 | 3.8% |
| 30 to 34 Minutes | 78 | 9.3% |
| 35 to 39 Minutes | 32 | 3.8% |
| 40 to 44 Minutes | 48 | 5.7% |
| 45 to 59 Minutes | 73 | 8.7% |
| 60 to 89 Minutes | 313 | 37.2% |
| 90 or more Minutes | 54 | 6.4% |
Commute Time by Sex in Sands Point
The most common commute times in Sands Point are 60 to 89 minutes (255 commuters, 44.6%) for males and 10 to 14 minutes (60 commuters, 22.3%) for females.
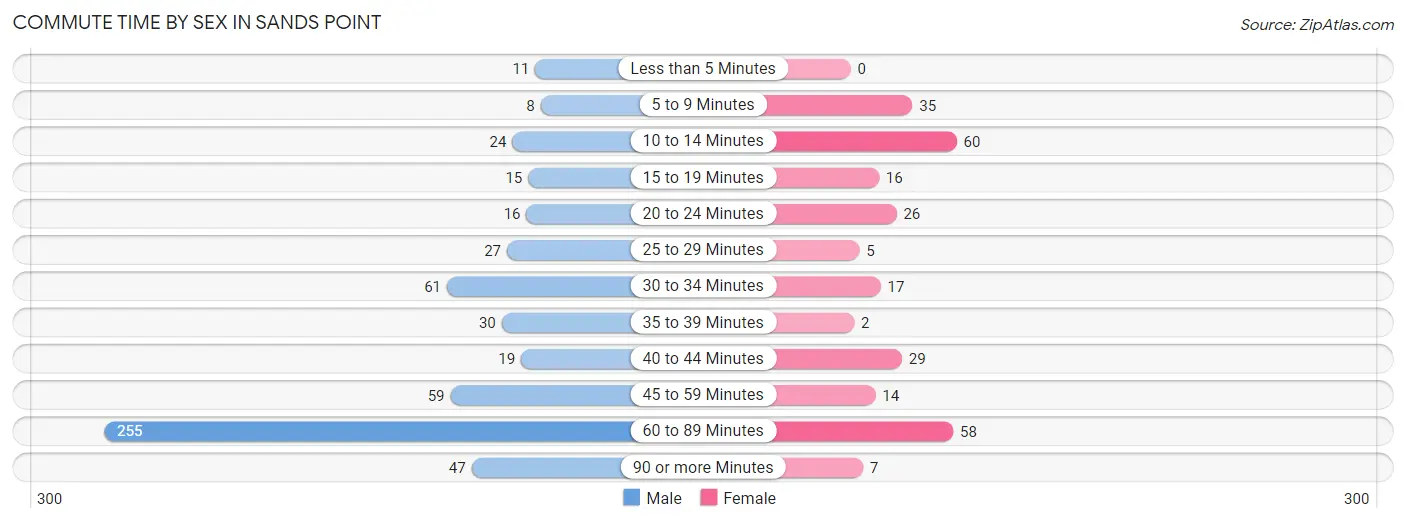
| Commute Time | Male | Female |
| Less than 5 Minutes | 11 (1.9%) | 0 (0.0%) |
| 5 to 9 Minutes | 8 (1.4%) | 35 (13.0%) |
| 10 to 14 Minutes | 24 (4.2%) | 60 (22.3%) |
| 15 to 19 Minutes | 15 (2.6%) | 16 (5.9%) |
| 20 to 24 Minutes | 16 (2.8%) | 26 (9.7%) |
| 25 to 29 Minutes | 27 (4.7%) | 5 (1.9%) |
| 30 to 34 Minutes | 61 (10.7%) | 17 (6.3%) |
| 35 to 39 Minutes | 30 (5.2%) | 2 (0.7%) |
| 40 to 44 Minutes | 19 (3.3%) | 29 (10.8%) |
| 45 to 59 Minutes | 59 (10.3%) | 14 (5.2%) |
| 60 to 89 Minutes | 255 (44.6%) | 58 (21.6%) |
| 90 or more Minutes | 47 (8.2%) | 7 (2.6%) |
Time of Departure to Work by Sex in Sands Point
The most frequent times of departure to work in Sands Point are 7:00 AM to 7:29 AM (150, 26.2%) for males and 9:00 AM to 9:59 AM (86, 32.0%) for females.
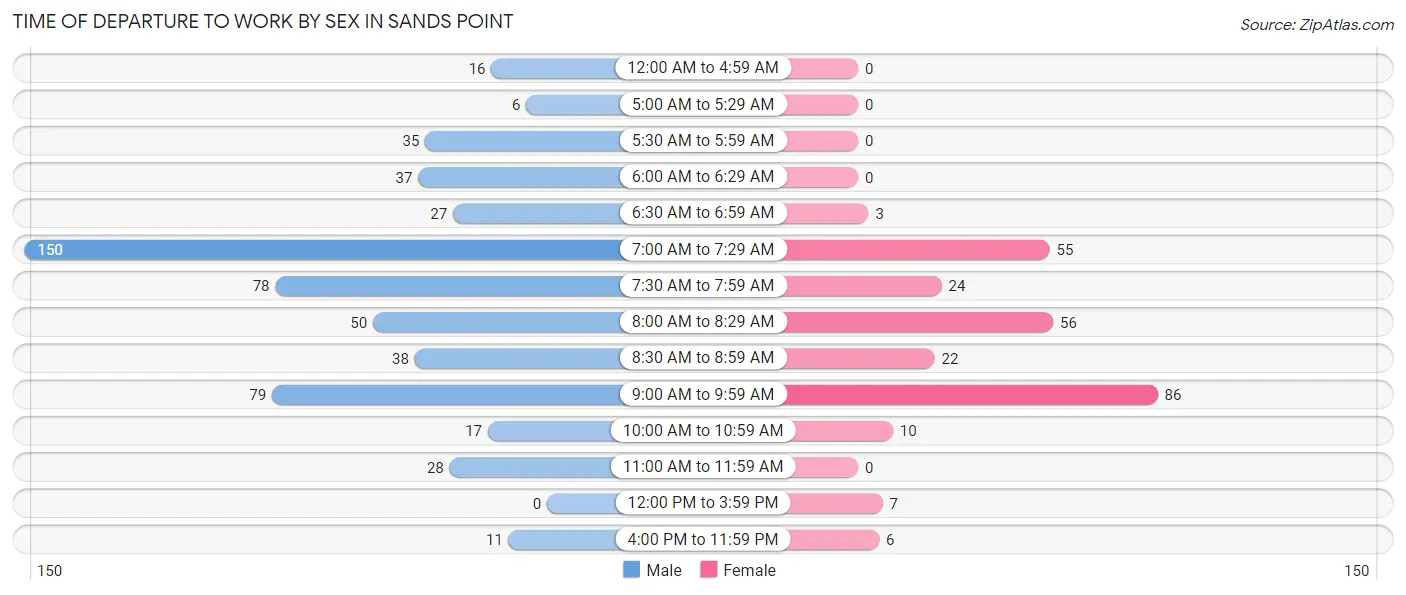
| Time of Departure | Male | Female |
| 12:00 AM to 4:59 AM | 16 (2.8%) | 0 (0.0%) |
| 5:00 AM to 5:29 AM | 6 (1.1%) | 0 (0.0%) |
| 5:30 AM to 5:59 AM | 35 (6.1%) | 0 (0.0%) |
| 6:00 AM to 6:29 AM | 37 (6.5%) | 0 (0.0%) |
| 6:30 AM to 6:59 AM | 27 (4.7%) | 3 (1.1%) |
| 7:00 AM to 7:29 AM | 150 (26.2%) | 55 (20.4%) |
| 7:30 AM to 7:59 AM | 78 (13.6%) | 24 (8.9%) |
| 8:00 AM to 8:29 AM | 50 (8.7%) | 56 (20.8%) |
| 8:30 AM to 8:59 AM | 38 (6.6%) | 22 (8.2%) |
| 9:00 AM to 9:59 AM | 79 (13.8%) | 86 (32.0%) |
| 10:00 AM to 10:59 AM | 17 (3.0%) | 10 (3.7%) |
| 11:00 AM to 11:59 AM | 28 (4.9%) | 0 (0.0%) |
| 12:00 PM to 3:59 PM | 0 (0.0%) | 7 (2.6%) |
| 4:00 PM to 11:59 PM | 11 (1.9%) | 6 (2.2%) |
| Total | 572 (100.0%) | 269 (100.0%) |
Housing Occupancy in Sands Point
Occupancy by Ownership in Sands Point
Of the total 820 dwellings in Sands Point, owner-occupied units account for 791 (96.5%), while renter-occupied units make up 29 (3.5%).
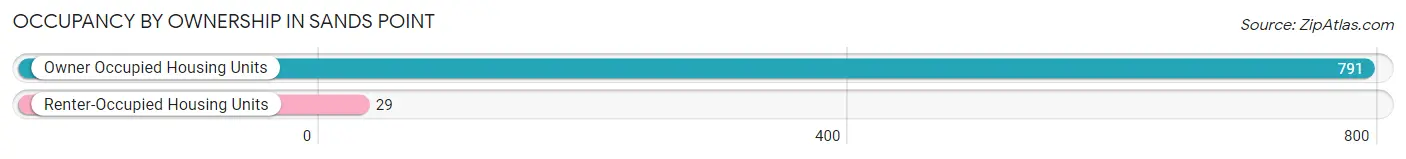
| Occupancy | # Housing Units | % Housing Units |
| Owner Occupied Housing Units | 791 | 96.5% |
| Renter-Occupied Housing Units | 29 | 3.5% |
| Total Occupied Housing Units | 820 | 100.0% |
Occupancy by Household Size in Sands Point
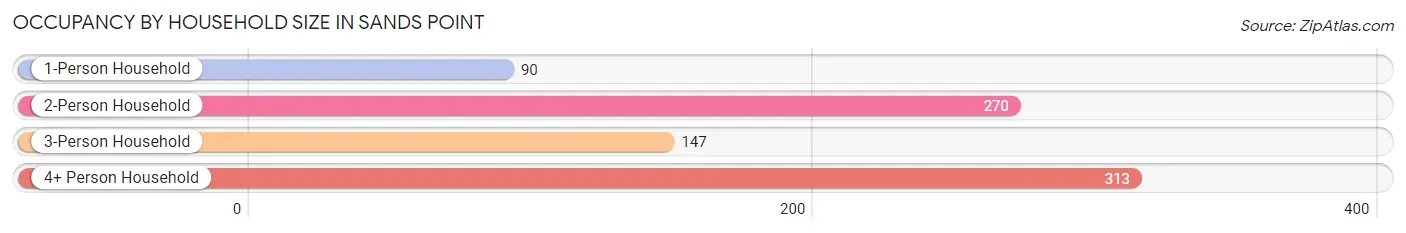
| Household Size | # Housing Units | % Housing Units |
| 1-Person Household | 90 | 11.0% |
| 2-Person Household | 270 | 32.9% |
| 3-Person Household | 147 | 17.9% |
| 4+ Person Household | 313 | 38.2% |
| Total Housing Units | 820 | 100.0% |
Occupancy by Ownership by Household Size in Sands Point
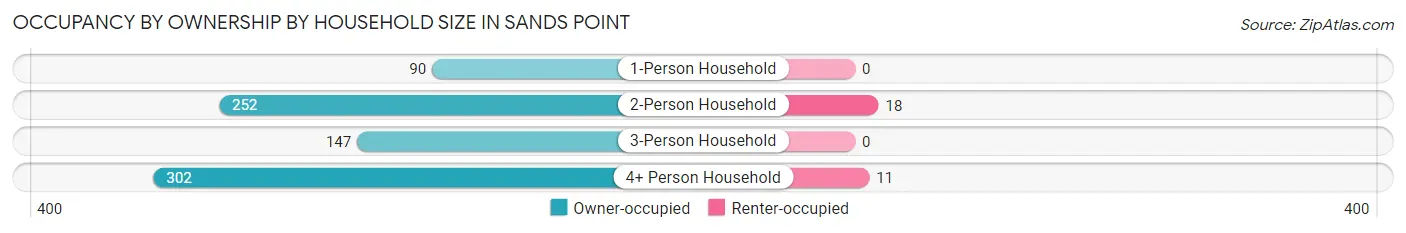
| Household Size | Owner-occupied | Renter-occupied |
| 1-Person Household | 90 (100.0%) | 0 (0.0%) |
| 2-Person Household | 252 (93.3%) | 18 (6.7%) |
| 3-Person Household | 147 (100.0%) | 0 (0.0%) |
| 4+ Person Household | 302 (96.5%) | 11 (3.5%) |
| Total Housing Units | 791 (96.5%) | 29 (3.5%) |
Occupancy by Educational Attainment in Sands Point
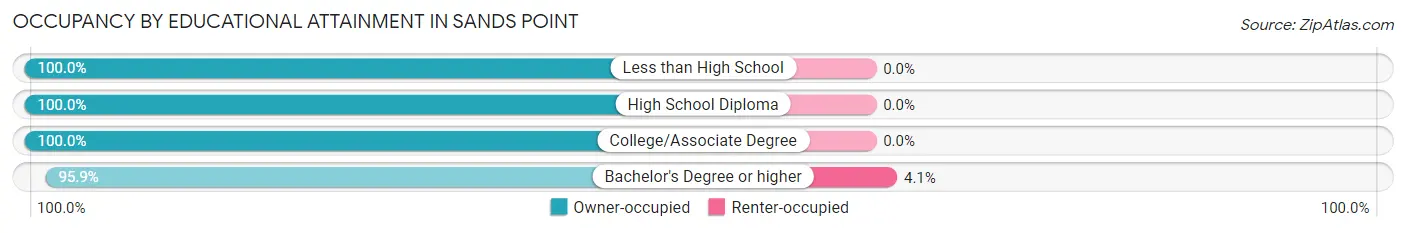
| Household Size | Owner-occupied | Renter-occupied |
| Less than High School | 48 (100.0%) | 0 (0.0%) |
| High School Diploma | 16 (100.0%) | 0 (0.0%) |
| College/Associate Degree | 56 (100.0%) | 0 (0.0%) |
| Bachelor's Degree or higher | 671 (95.9%) | 29 (4.1%) |
Occupancy by Age of Householder in Sands Point
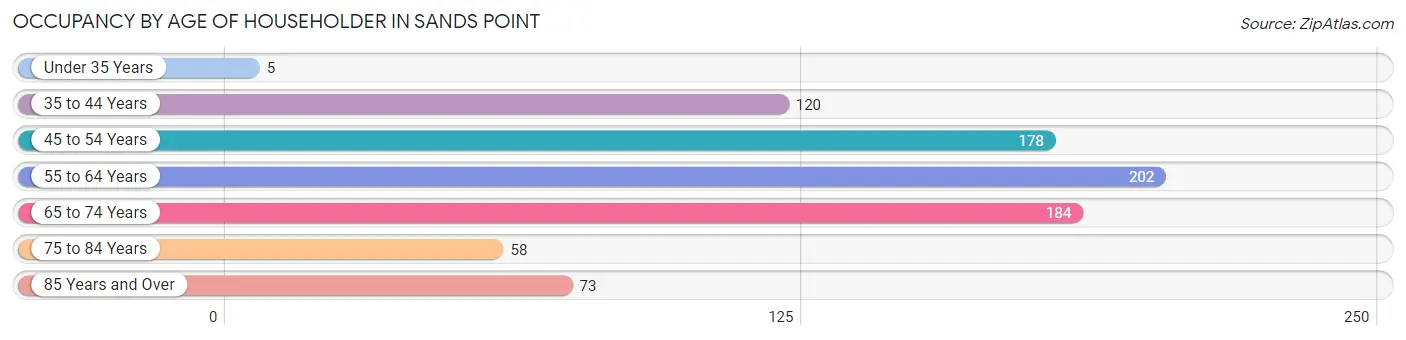
| Age Bracket | # Households | % Households |
| Under 35 Years | 5 | 0.6% |
| 35 to 44 Years | 120 | 14.6% |
| 45 to 54 Years | 178 | 21.7% |
| 55 to 64 Years | 202 | 24.6% |
| 65 to 74 Years | 184 | 22.4% |
| 75 to 84 Years | 58 | 7.1% |
| 85 Years and Over | 73 | 8.9% |
| Total | 820 | 100.0% |
Housing Finances in Sands Point
Median Income by Occupancy in Sands Point
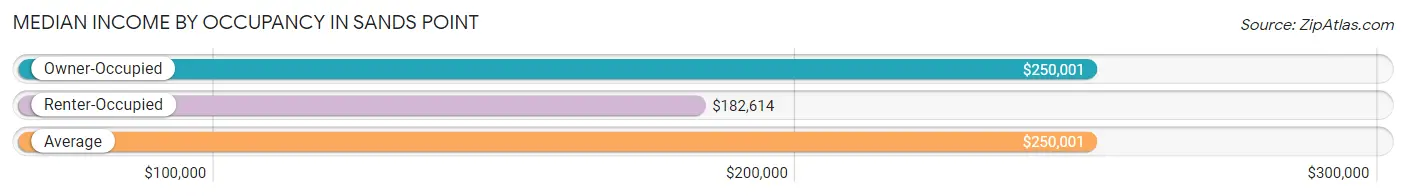
| Occupancy Type | # Households | Median Income |
| Owner-Occupied | 791 (96.5%) | $250,001 |
| Renter-Occupied | 29 (3.5%) | $182,614 |
| Average | 820 (100.0%) | $250,001 |
Occupancy by Householder Income Bracket in Sands Point
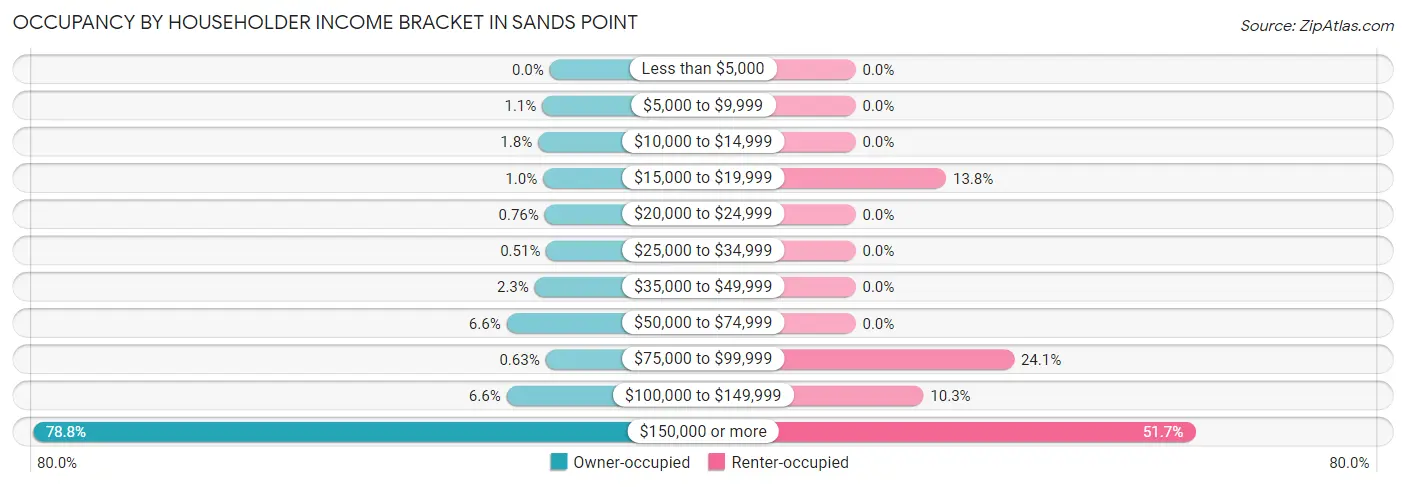
| Income Bracket | Owner-occupied | Renter-occupied |
| Less than $5,000 | 0 (0.0%) | 0 (0.0%) |
| $5,000 to $9,999 | 9 (1.1%) | 0 (0.0%) |
| $10,000 to $14,999 | 14 (1.8%) | 0 (0.0%) |
| $15,000 to $19,999 | 8 (1.0%) | 4 (13.8%) |
| $20,000 to $24,999 | 6 (0.8%) | 0 (0.0%) |
| $25,000 to $34,999 | 4 (0.5%) | 0 (0.0%) |
| $35,000 to $49,999 | 18 (2.3%) | 0 (0.0%) |
| $50,000 to $74,999 | 52 (6.6%) | 0 (0.0%) |
| $75,000 to $99,999 | 5 (0.6%) | 7 (24.1%) |
| $100,000 to $149,999 | 52 (6.6%) | 3 (10.3%) |
| $150,000 or more | 623 (78.8%) | 15 (51.7%) |
| Total | 791 (100.0%) | 29 (100.0%) |
Monthly Housing Cost Tiers in Sands Point
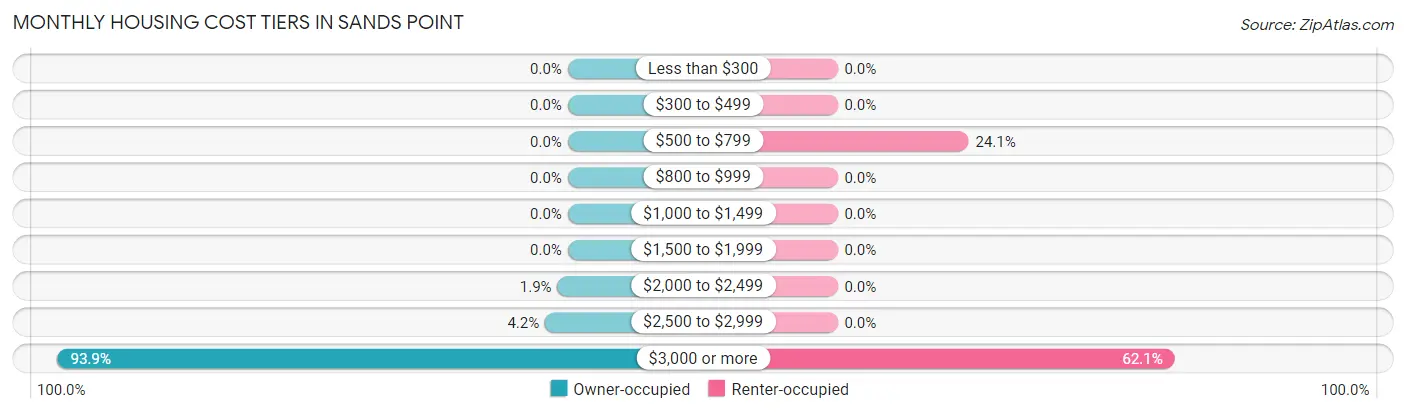
| Monthly Cost | Owner-occupied | Renter-occupied |
| Less than $300 | 0 (0.0%) | 0 (0.0%) |
| $300 to $499 | 0 (0.0%) | 0 (0.0%) |
| $500 to $799 | 0 (0.0%) | 7 (24.1%) |
| $800 to $999 | 0 (0.0%) | 0 (0.0%) |
| $1,000 to $1,499 | 0 (0.0%) | 0 (0.0%) |
| $1,500 to $1,999 | 0 (0.0%) | 0 (0.0%) |
| $2,000 to $2,499 | 15 (1.9%) | 0 (0.0%) |
| $2,500 to $2,999 | 33 (4.2%) | 0 (0.0%) |
| $3,000 or more | 743 (93.9%) | 18 (62.1%) |
| Total | 791 (100.0%) | 29 (100.0%) |
Physical Housing Characteristics in Sands Point
Housing Structures in Sands Point
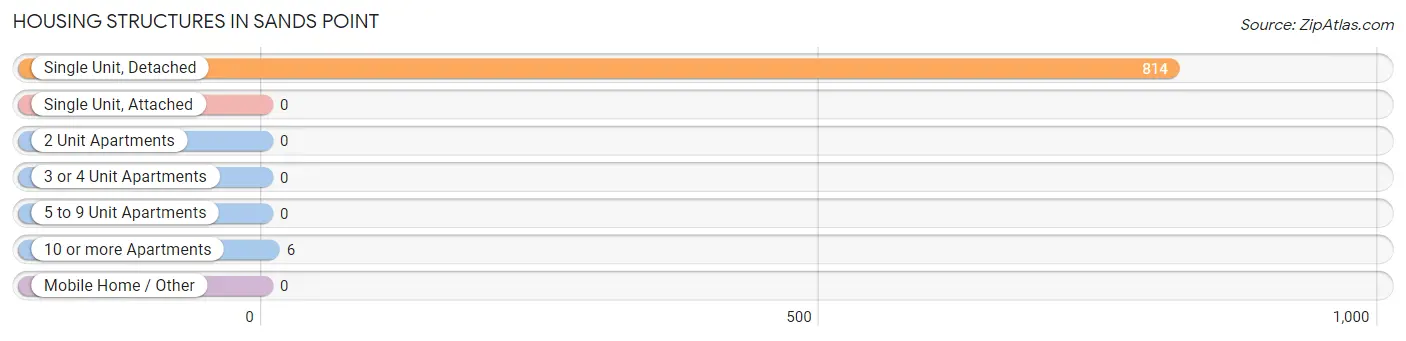
| Structure Type | # Housing Units | % Housing Units |
| Single Unit, Detached | 814 | 99.3% |
| Single Unit, Attached | 0 | 0.0% |
| 2 Unit Apartments | 0 | 0.0% |
| 3 or 4 Unit Apartments | 0 | 0.0% |
| 5 to 9 Unit Apartments | 0 | 0.0% |
| 10 or more Apartments | 6 | 0.7% |
| Mobile Home / Other | 0 | 0.0% |
| Total | 820 | 100.0% |
Housing Structures by Occupancy in Sands Point
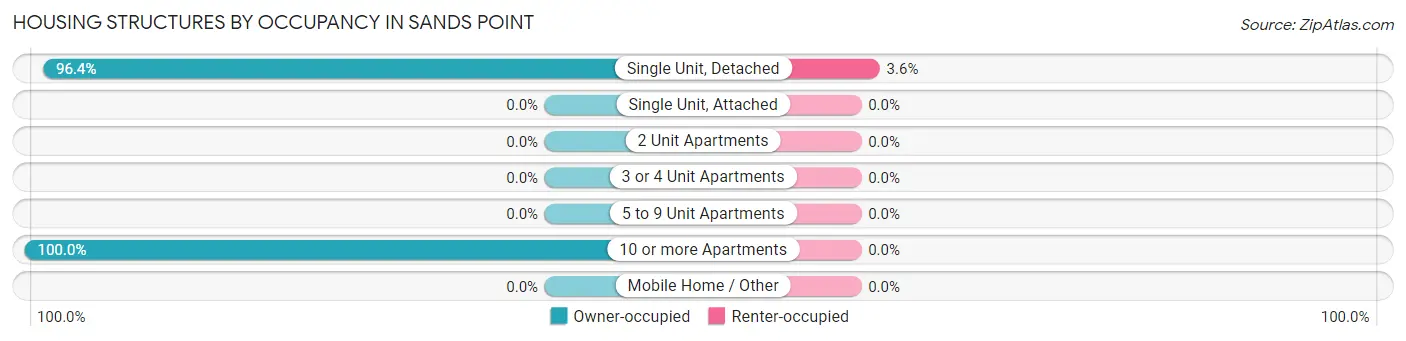
| Structure Type | Owner-occupied | Renter-occupied |
| Single Unit, Detached | 785 (96.4%) | 29 (3.6%) |
| Single Unit, Attached | 0 (0.0%) | 0 (0.0%) |
| 2 Unit Apartments | 0 (0.0%) | 0 (0.0%) |
| 3 or 4 Unit Apartments | 0 (0.0%) | 0 (0.0%) |
| 5 to 9 Unit Apartments | 0 (0.0%) | 0 (0.0%) |
| 10 or more Apartments | 6 (100.0%) | 0 (0.0%) |
| Mobile Home / Other | 0 (0.0%) | 0 (0.0%) |
| Total | 791 (96.5%) | 29 (3.5%) |
Housing Structures by Number of Rooms in Sands Point
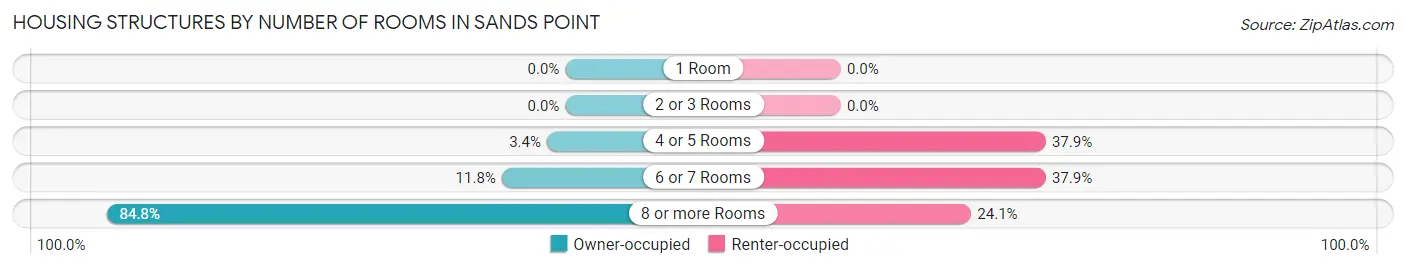
| Number of Rooms | Owner-occupied | Renter-occupied |
| 1 Room | 0 (0.0%) | 0 (0.0%) |
| 2 or 3 Rooms | 0 (0.0%) | 0 (0.0%) |
| 4 or 5 Rooms | 27 (3.4%) | 11 (37.9%) |
| 6 or 7 Rooms | 93 (11.8%) | 11 (37.9%) |
| 8 or more Rooms | 671 (84.8%) | 7 (24.1%) |
| Total | 791 (100.0%) | 29 (100.0%) |
Housing Structure by Heating Type in Sands Point
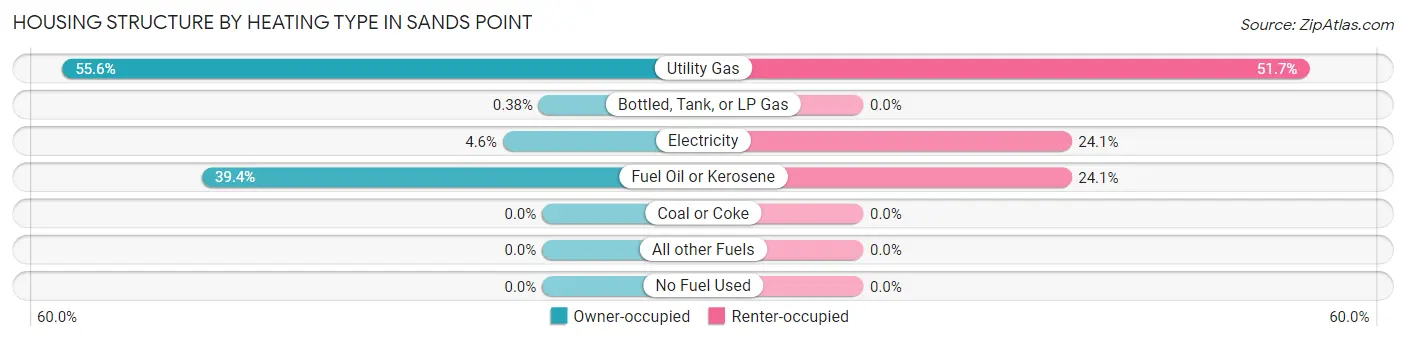
| Heating Type | Owner-occupied | Renter-occupied |
| Utility Gas | 440 (55.6%) | 15 (51.7%) |
| Bottled, Tank, or LP Gas | 3 (0.4%) | 0 (0.0%) |
| Electricity | 36 (4.5%) | 7 (24.1%) |
| Fuel Oil or Kerosene | 312 (39.4%) | 7 (24.1%) |
| Coal or Coke | 0 (0.0%) | 0 (0.0%) |
| All other Fuels | 0 (0.0%) | 0 (0.0%) |
| No Fuel Used | 0 (0.0%) | 0 (0.0%) |
| Total | 791 (100.0%) | 29 (100.0%) |
Household Vehicle Usage in Sands Point
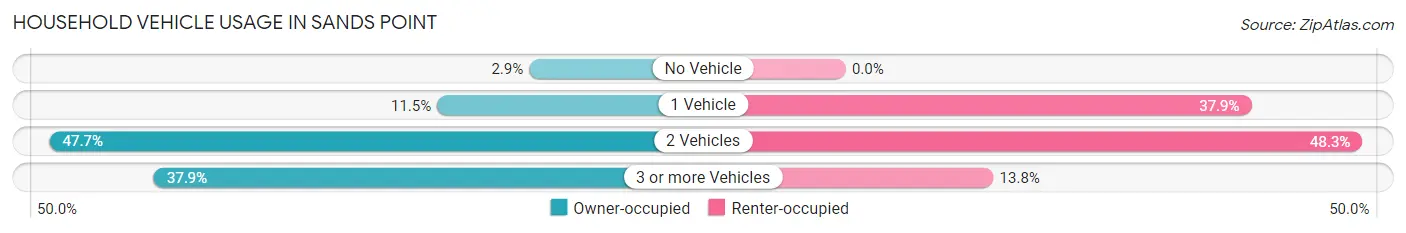
| Vehicles per Household | Owner-occupied | Renter-occupied |
| No Vehicle | 23 (2.9%) | 0 (0.0%) |
| 1 Vehicle | 91 (11.5%) | 11 (37.9%) |
| 2 Vehicles | 377 (47.7%) | 14 (48.3%) |
| 3 or more Vehicles | 300 (37.9%) | 4 (13.8%) |
| Total | 791 (100.0%) | 29 (100.0%) |
Real Estate & Mortgages in Sands Point
Real Estate and Mortgage Overview in Sands Point
| Characteristic | Without Mortgage | With Mortgage |
| Housing Units | 417 | 374 |
| Median Property Value | $2,000,001 | $2,000,001 |
| Median Household Income | $245,893 | $333 |
| Monthly Housing Costs | $1,501 | $368 |
| Real Estate Taxes | $10,001 | $0 |
Property Value by Mortgage Status in Sands Point
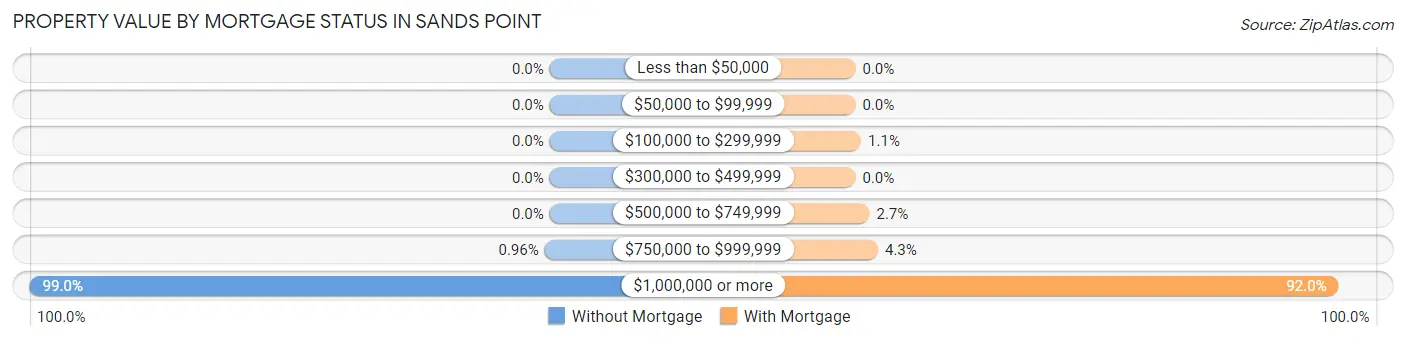
| Property Value | Without Mortgage | With Mortgage |
| Less than $50,000 | 0 (0.0%) | 0 (0.0%) |
| $50,000 to $99,999 | 0 (0.0%) | 0 (0.0%) |
| $100,000 to $299,999 | 0 (0.0%) | 4 (1.1%) |
| $300,000 to $499,999 | 0 (0.0%) | 0 (0.0%) |
| $500,000 to $749,999 | 0 (0.0%) | 10 (2.7%) |
| $750,000 to $999,999 | 4 (1.0%) | 16 (4.3%) |
| $1,000,000 or more | 413 (99.0%) | 344 (92.0%) |
| Total | 417 (100.0%) | 374 (100.0%) |
Household Income by Mortgage Status in Sands Point
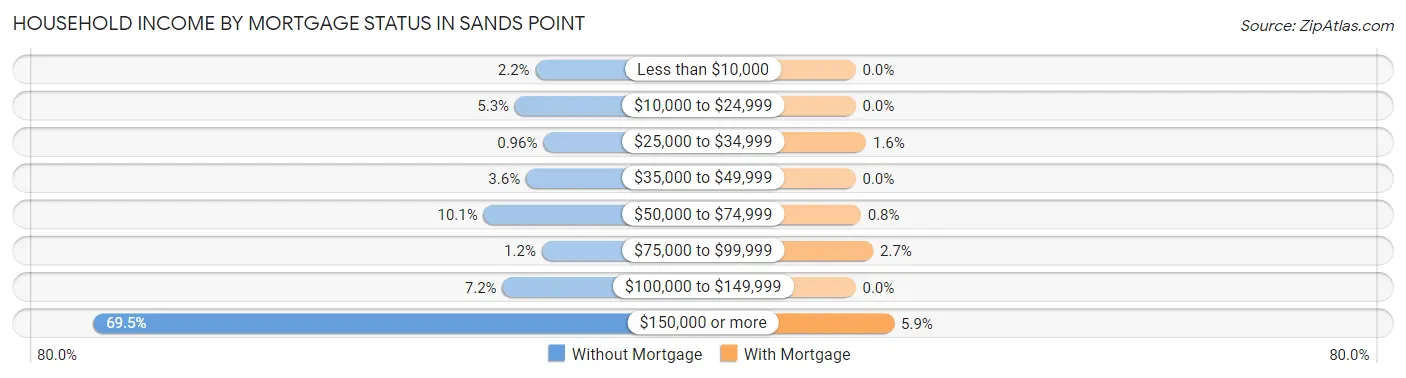
| Household Income | Without Mortgage | With Mortgage |
| Less than $10,000 | 9 (2.2%) | 0 (0.0%) |
| $10,000 to $24,999 | 22 (5.3%) | 0 (0.0%) |
| $25,000 to $34,999 | 4 (1.0%) | 6 (1.6%) |
| $35,000 to $49,999 | 15 (3.6%) | 0 (0.0%) |
| $50,000 to $74,999 | 42 (10.1%) | 3 (0.8%) |
| $75,000 to $99,999 | 5 (1.2%) | 10 (2.7%) |
| $100,000 to $149,999 | 30 (7.2%) | 0 (0.0%) |
| $150,000 or more | 290 (69.5%) | 22 (5.9%) |
| Total | 417 (100.0%) | 374 (100.0%) |
Property Value to Household Income Ratio in Sands Point
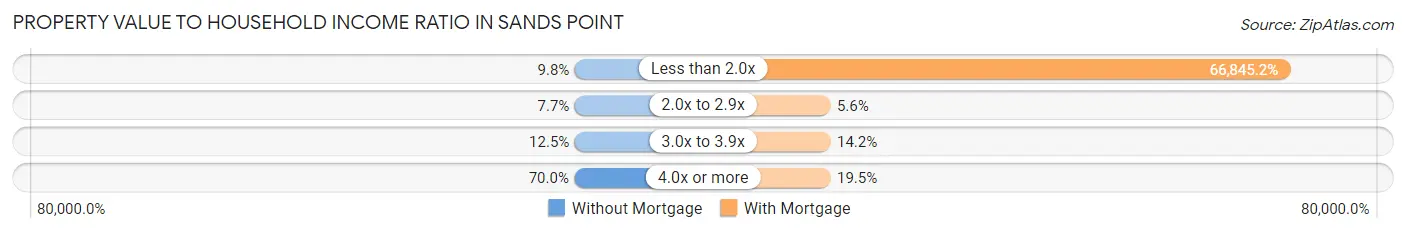
| Value-to-Income Ratio | Without Mortgage | With Mortgage |
| Less than 2.0x | 41 (9.8%) | 250,001 (66,845.2%) |
| 2.0x to 2.9x | 32 (7.7%) | 21 (5.6%) |
| 3.0x to 3.9x | 52 (12.5%) | 53 (14.2%) |
| 4.0x or more | 292 (70.0%) | 73 (19.5%) |
| Total | 417 (100.0%) | 374 (100.0%) |
Real Estate Taxes by Mortgage Status in Sands Point
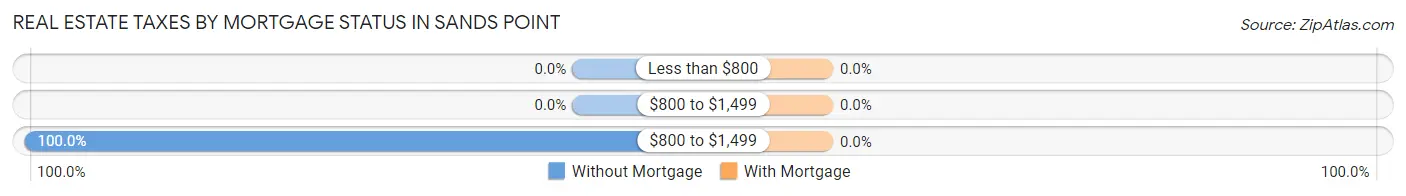
| Property Taxes | Without Mortgage | With Mortgage |
| Less than $800 | 0 (0.0%) | 0 (0.0%) |
| $800 to $1,499 | 0 (0.0%) | 0 (0.0%) |
| $800 to $1,499 | 417 (100.0%) | 0 (0.0%) |
| Total | 417 (100.0%) | 374 (100.0%) |
Health & Disability in Sands Point
Health Insurance Coverage by Age in Sands Point
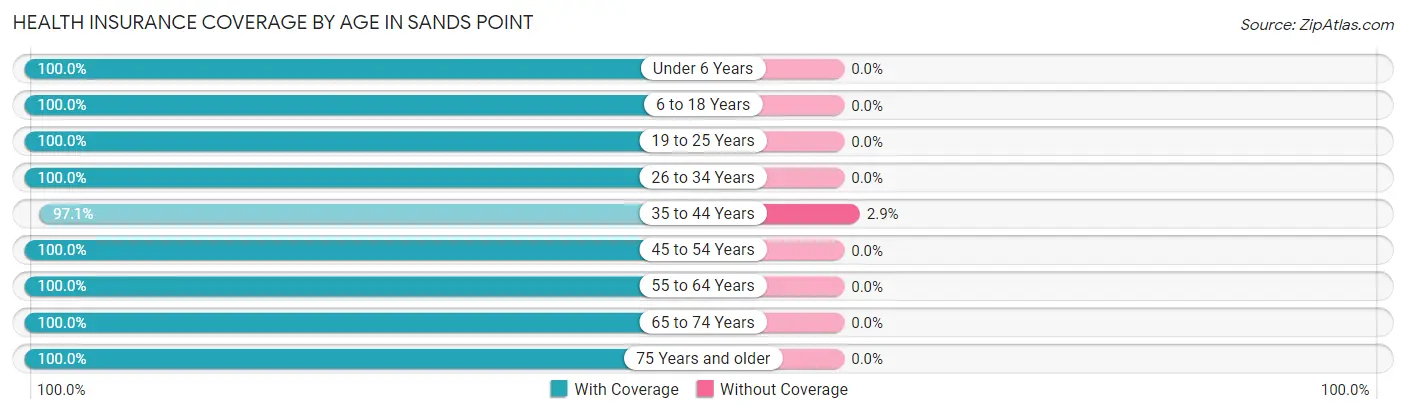
| Age Bracket | With Coverage | Without Coverage |
| Under 6 Years | 116 (100.0%) | 0 (0.0%) |
| 6 to 18 Years | 710 (100.0%) | 0 (0.0%) |
| 19 to 25 Years | 193 (100.0%) | 0 (0.0%) |
| 26 to 34 Years | 47 (100.0%) | 0 (0.0%) |
| 35 to 44 Years | 234 (97.1%) | 7 (2.9%) |
| 45 to 54 Years | 469 (100.0%) | 0 (0.0%) |
| 55 to 64 Years | 354 (100.0%) | 0 (0.0%) |
| 65 to 74 Years | 314 (100.0%) | 0 (0.0%) |
| 75 Years and older | 233 (100.0%) | 0 (0.0%) |
| Total | 2,670 (99.7%) | 7 (0.3%) |
Health Insurance Coverage by Citizenship Status in Sands Point
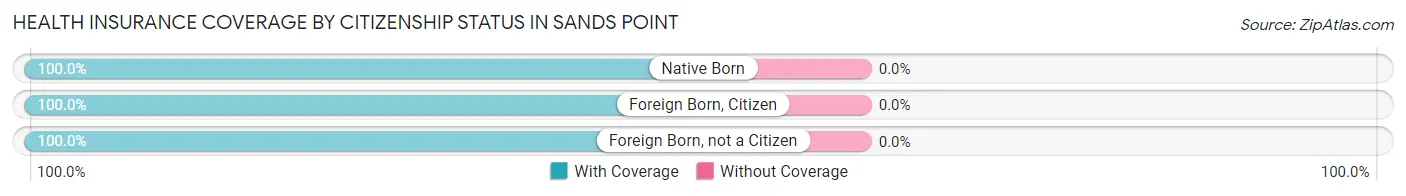
| Citizenship Status | With Coverage | Without Coverage |
| Native Born | 116 (100.0%) | 0 (0.0%) |
| Foreign Born, Citizen | 710 (100.0%) | 0 (0.0%) |
| Foreign Born, not a Citizen | 193 (100.0%) | 0 (0.0%) |
Health Insurance Coverage by Household Income in Sands Point
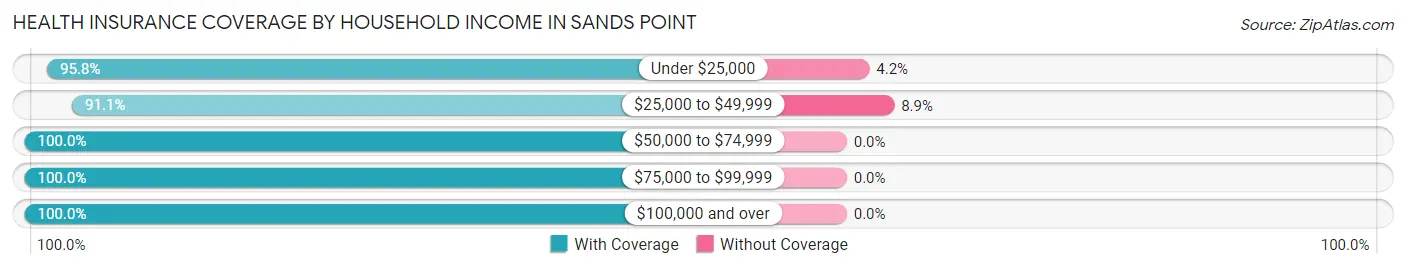
| Household Income | With Coverage | Without Coverage |
| Under $25,000 | 68 (95.8%) | 3 (4.2%) |
| $25,000 to $49,999 | 41 (91.1%) | 4 (8.9%) |
| $50,000 to $74,999 | 128 (100.0%) | 0 (0.0%) |
| $75,000 to $99,999 | 19 (100.0%) | 0 (0.0%) |
| $100,000 and over | 2,414 (100.0%) | 0 (0.0%) |
Public vs Private Health Insurance Coverage by Age in Sands Point
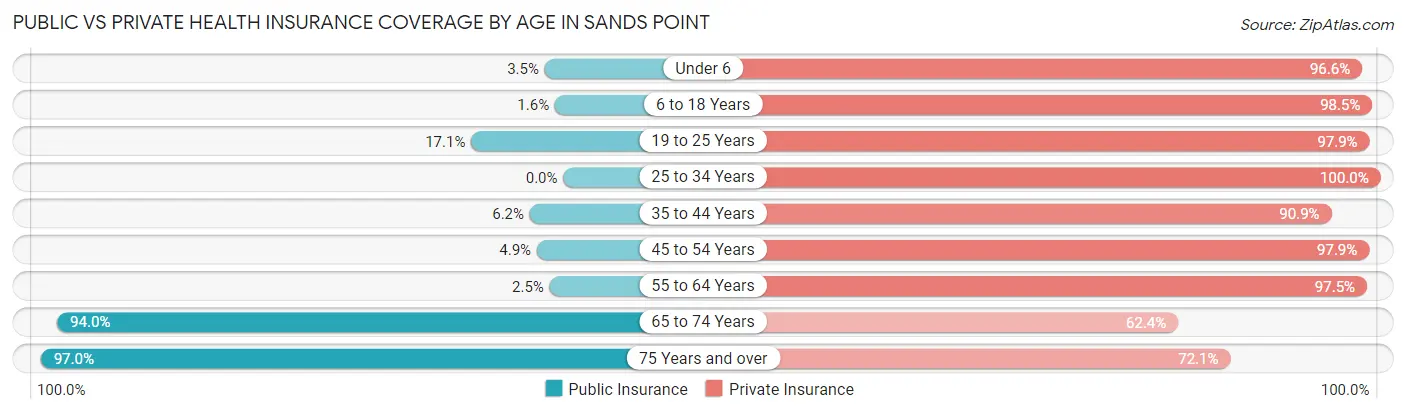
| Age Bracket | Public Insurance | Private Insurance |
| Under 6 | 4 (3.5%) | 112 (96.6%) |
| 6 to 18 Years | 11 (1.5%) | 699 (98.5%) |
| 19 to 25 Years | 33 (17.1%) | 189 (97.9%) |
| 25 to 34 Years | 0 (0.0%) | 47 (100.0%) |
| 35 to 44 Years | 15 (6.2%) | 219 (90.9%) |
| 45 to 54 Years | 23 (4.9%) | 459 (97.9%) |
| 55 to 64 Years | 9 (2.5%) | 345 (97.5%) |
| 65 to 74 Years | 295 (94.0%) | 196 (62.4%) |
| 75 Years and over | 226 (97.0%) | 168 (72.1%) |
| Total | 616 (23.0%) | 2,434 (90.9%) |
Disability Status by Sex by Age in Sands Point
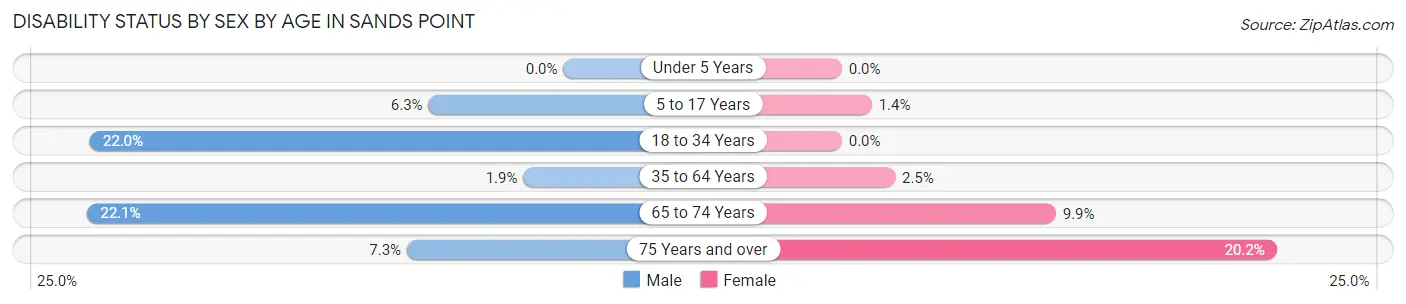
| Age Bracket | Male | Female |
| Under 5 Years | 0 (0.0%) | 0 (0.0%) |
| 5 to 17 Years | 27 (6.3%) | 4 (1.4%) |
| 18 to 34 Years | 29 (22.0%) | 0 (0.0%) |
| 35 to 64 Years | 10 (1.9%) | 13 (2.5%) |
| 65 to 74 Years | 36 (22.1%) | 15 (9.9%) |
| 75 Years and over | 9 (7.3%) | 22 (20.2%) |
Disability Class by Sex by Age in Sands Point
Disability Class: Hearing Difficulty
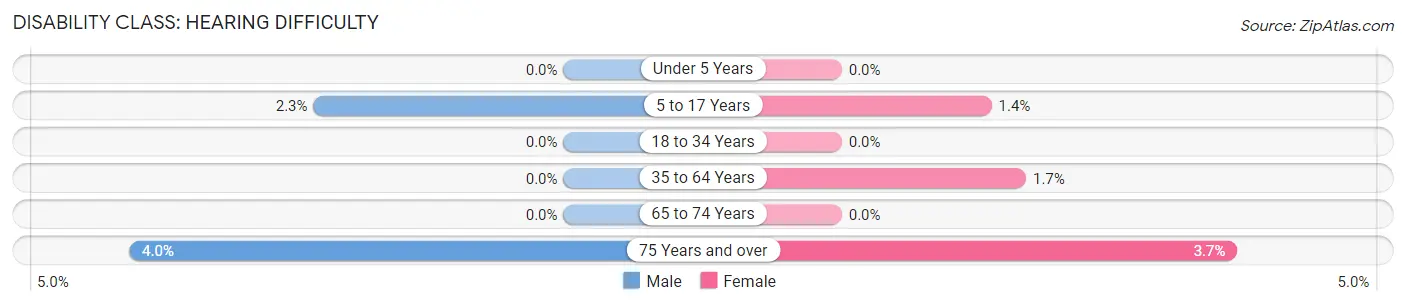
| Age Bracket | Male | Female |
| Under 5 Years | 0 (0.0%) | 0 (0.0%) |
| 5 to 17 Years | 10 (2.3%) | 4 (1.4%) |
| 18 to 34 Years | 0 (0.0%) | 0 (0.0%) |
| 35 to 64 Years | 0 (0.0%) | 9 (1.7%) |
| 65 to 74 Years | 0 (0.0%) | 0 (0.0%) |
| 75 Years and over | 5 (4.0%) | 4 (3.7%) |
Disability Class: Vision Difficulty
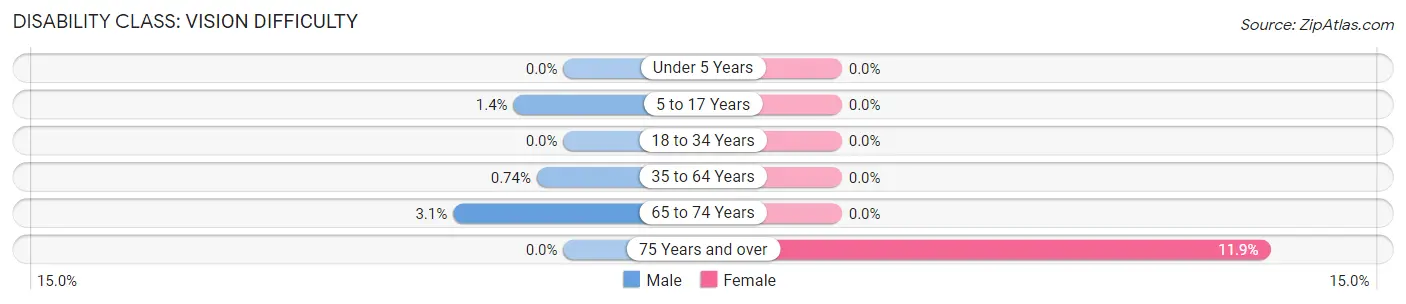
| Age Bracket | Male | Female |
| Under 5 Years | 0 (0.0%) | 0 (0.0%) |
| 5 to 17 Years | 6 (1.4%) | 0 (0.0%) |
| 18 to 34 Years | 0 (0.0%) | 0 (0.0%) |
| 35 to 64 Years | 4 (0.7%) | 0 (0.0%) |
| 65 to 74 Years | 5 (3.1%) | 0 (0.0%) |
| 75 Years and over | 0 (0.0%) | 13 (11.9%) |
Disability Class: Cognitive Difficulty
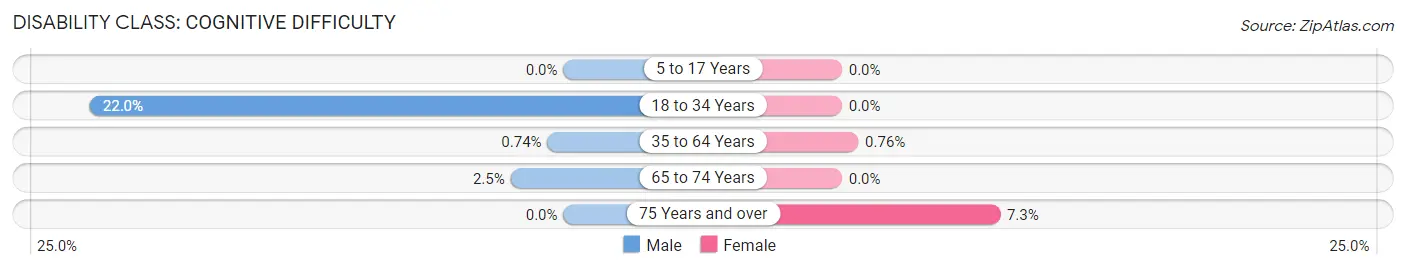
| Age Bracket | Male | Female |
| 5 to 17 Years | 0 (0.0%) | 0 (0.0%) |
| 18 to 34 Years | 29 (22.0%) | 0 (0.0%) |
| 35 to 64 Years | 4 (0.7%) | 4 (0.8%) |
| 65 to 74 Years | 4 (2.5%) | 0 (0.0%) |
| 75 Years and over | 0 (0.0%) | 8 (7.3%) |
Disability Class: Ambulatory Difficulty
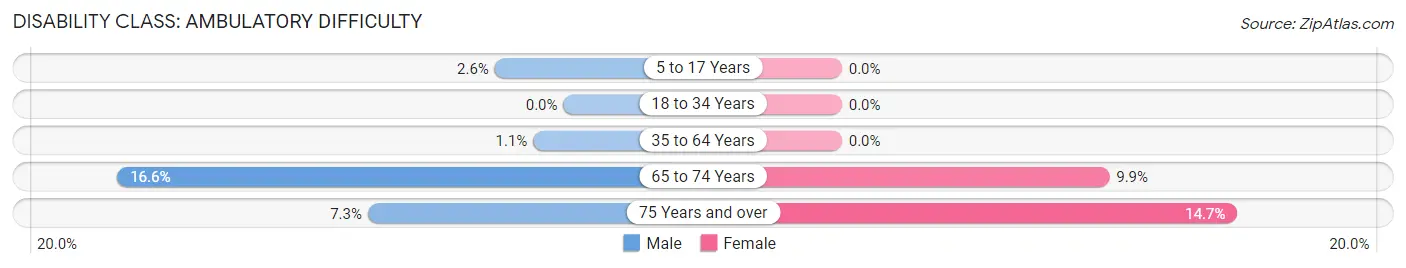
| Age Bracket | Male | Female |
| 5 to 17 Years | 11 (2.5%) | 0 (0.0%) |
| 18 to 34 Years | 0 (0.0%) | 0 (0.0%) |
| 35 to 64 Years | 6 (1.1%) | 0 (0.0%) |
| 65 to 74 Years | 27 (16.6%) | 15 (9.9%) |
| 75 Years and over | 9 (7.3%) | 16 (14.7%) |
Disability Class: Self-Care Difficulty
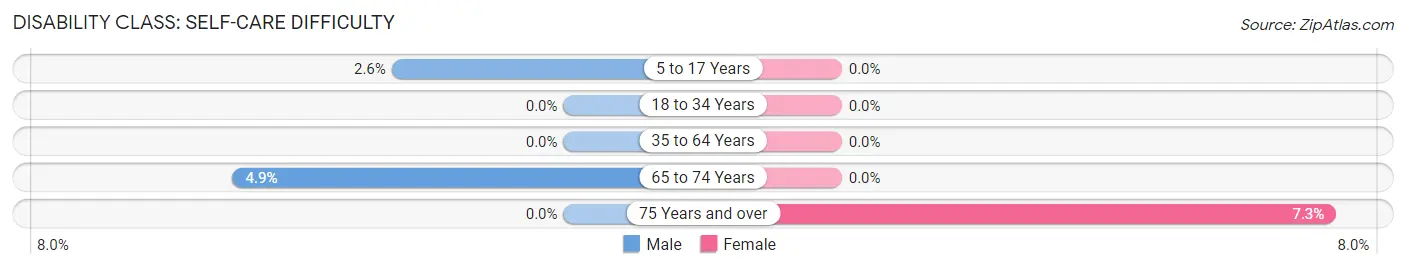
| Age Bracket | Male | Female |
| 5 to 17 Years | 11 (2.5%) | 0 (0.0%) |
| 18 to 34 Years | 0 (0.0%) | 0 (0.0%) |
| 35 to 64 Years | 0 (0.0%) | 0 (0.0%) |
| 65 to 74 Years | 8 (4.9%) | 0 (0.0%) |
| 75 Years and over | 0 (0.0%) | 8 (7.3%) |
Technology Access in Sands Point
Computing Device Access in Sands Point
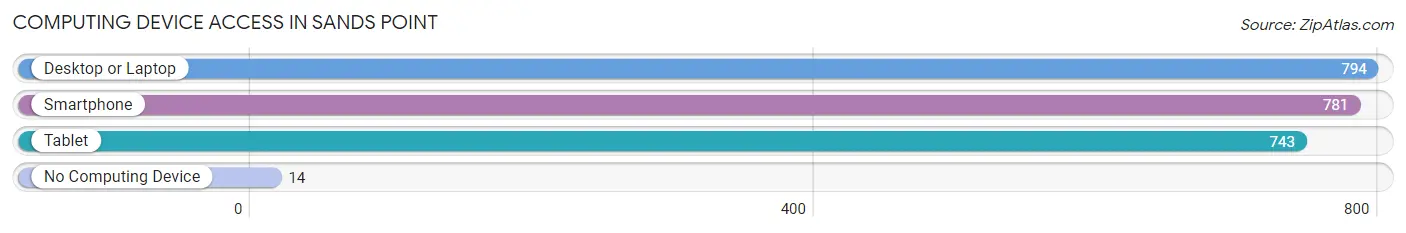
| Device Type | # Households | % Households |
| Desktop or Laptop | 794 | 96.8% |
| Smartphone | 781 | 95.2% |
| Tablet | 743 | 90.6% |
| No Computing Device | 14 | 1.7% |
| Total | 820 | 100.0% |
Internet Access in Sands Point
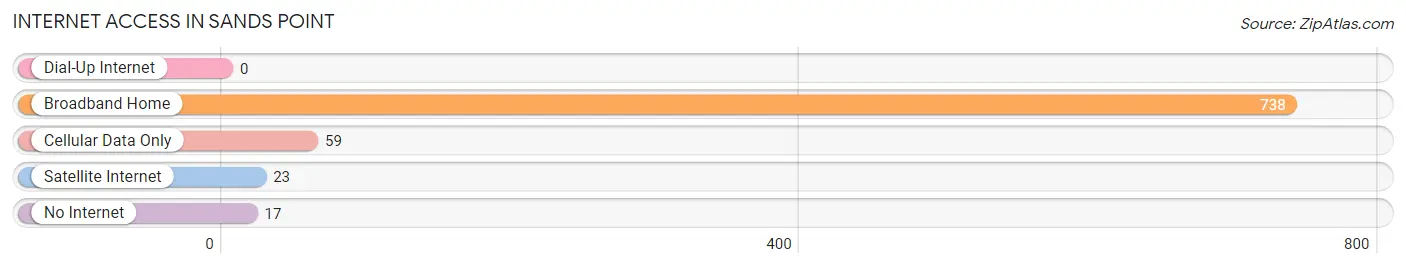
| Internet Type | # Households | % Households |
| Dial-Up Internet | 0 | 0.0% |
| Broadband Home | 738 | 90.0% |
| Cellular Data Only | 59 | 7.2% |
| Satellite Internet | 23 | 2.8% |
| No Internet | 17 | 2.1% |
| Total | 820 | 100.0% |
Sands Point Summary
Sands Point is a village located in Nassau County, New York, United States. The village is located on the North Shore of Long Island and is part of the Town of North Hempstead. As of the 2010 census, the village had a population of 2,675.
Geography
Sands Point is located at 40°51'25" North, 73°41'17" West (40.856944, -73.688056). According to the United States Census Bureau, the village has a total area of 4.2 square miles (10.8 km2), of which, 3.9 square miles (10.1 km2) of it is land and 0.3 square miles (0.7 km2) of it (7.14%) is water.
The village is located on the North Shore of Long Island, and is bordered by the Town of North Hempstead to the east, the Town of Oyster Bay to the south, and the Long Island Sound to the north.
History
Sands Point was originally inhabited by the Matinecock Native American tribe. The first European settlers arrived in the area in the late 1600s. The area was originally known as Cow Neck, and was part of the Town of Hempstead. In 1837, the area was renamed Sands Point after the Sands family, who had purchased the land in 1790.
In the late 1800s, Sands Point became a popular summer destination for wealthy New Yorkers. Many of the grand estates that were built during this time still stand today.
In 1917 Sands Point was incorporated as a village
Economy
Sands Point is a wealthy community, with a median household income of $150,000. The village is home to many wealthy business executives and celebrities.
The village is home to several businesses including a golf course a marina and a yacht club
Demographics
As of the 2010 census, there were 2,675 people, 945 households, and 745 families residing in the village. The population density was 686.3 people per square mile (265.2/km2). There were 1,037 housing units at an average density of 266.2 per square mile (102.9/km2). The racial makeup of the village was 94.2% White, 1.2% African American, 0.2% Native American, 2.3% Asian, 0.1% Pacific Islander, 0.7% from other races, and 1.3% from two or more races. Hispanic or Latino of any race were 4.2% of the population.
There were 945 households, out of which 33.2% had children under the age of 18 living with them, 68.2% were married couples living together, 6.2% had a female householder with no husband present, and 22.7% were non-families. 19.2% of all households were made up of individuals, and 11.2% had someone living alone who was 65 years of age or older. The average household size was 2.82 and the average family size was 3.25.
In the village, the population was spread out, with 25.2% under the age of 18, 4.7% from 18 to 24, 20.2% from 25 to 44, 33.2% from 45 to 64, and 16.7% who were 65 years of age or older. The median age was 44 years. For every 100 females, there were 94.2 males. For every 100 females age 18 and over, there were 91.2 males.
The median income for a household in the village was $150,000, and the median income for a family was $175,000. Males had a median income of $100,000 versus $50,000 for females. The per capita income for the village was $90,000. About 1.7% of families and 2.7% of the population were below the poverty line, including 2.2% of those under age 18 and 2.2% of those age 65 or over.
Common Questions
What is Per Capita Income in Sands Point?
Per Capita income in Sands Point is $150,707.
What is the Median Family Income in Sands Point?
Median Family Income in Sands Point is $250,001.
What is the Median Household income in Sands Point?
Median Household Income in Sands Point is $250,001.
What is Income or Wage Gap in Sands Point?
Income or Wage Gap in Sands Point is 59.5%.
Women in Sands Point earn 40.5 cents for every dollar earned by a man.
What is Inequality or Gini Index in Sands Point?
Inequality or Gini Index in Sands Point is 0.48.
What is the Total Population of Sands Point?
Total Population of Sands Point is 2,702.
What is the Total Male Population of Sands Point?
Total Male Population of Sands Point is 1,446.
What is the Total Female Population of Sands Point?
Total Female Population of Sands Point is 1,256.
What is the Ratio of Males per 100 Females in Sands Point?
There are 115.13 Males per 100 Females in Sands Point.
What is the Ratio of Females per 100 Males in Sands Point?
There are 86.86 Females per 100 Males in Sands Point.
What is the Median Population Age in Sands Point?
Median Population Age in Sands Point is 45.2 Years.
What is the Average Family Size in Sands Point
Average Family Size in Sands Point is 3.4 People.
What is the Average Household Size in Sands Point
Average Household Size in Sands Point is 3.3 People.
How Large is the Labor Force in Sands Point?
There are 1,201 People in the Labor Forcein in Sands Point.
What is the Percentage of People in the Labor Force in Sands Point?
60.7% of People are in the Labor Force in Sands Point.
What is the Unemployment Rate in Sands Point?
Unemployment Rate in Sands Point is 5.5%.