South Hempstead, NY Map & Demographics
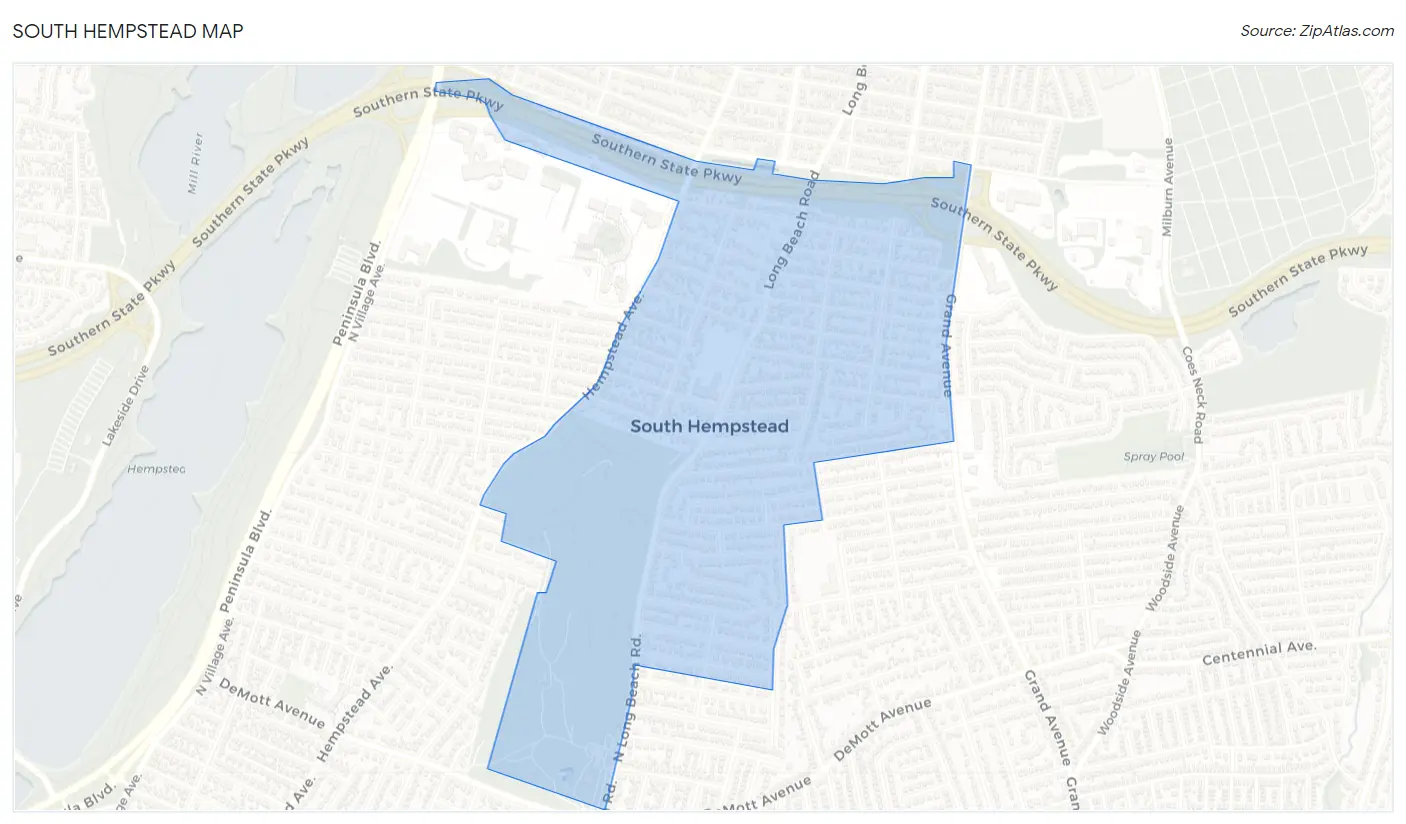
South Hempstead Map
South Hempstead Overview
$74,006
PER CAPITA INCOME
$186,750
AVG FAMILY INCOME
$153,088
AVG HOUSEHOLD INCOME
26.7%
WAGE / INCOME GAP [ % ]
73.3¢/ $1
WAGE / INCOME GAP [ $ ]
0.42
INEQUALITY / GINI INDEX
3,135
TOTAL POPULATION
1,675
MALE POPULATION
1,460
FEMALE POPULATION
114.73
MALES / 100 FEMALES
87.16
FEMALES / 100 MALES
46.1
MEDIAN AGE
3.2
AVG FAMILY SIZE
2.8
AVG HOUSEHOLD SIZE
1,705
LABOR FORCE [ PEOPLE ]
65.7%
PERCENT IN LABOR FORCE
2.0%
UNEMPLOYMENT RATE
Income in South Hempstead
Income Overview in South Hempstead
Per Capita Income in South Hempstead is $74,006, while median incomes of families and households are $186,750 and $153,088 respectively.
| Characteristic | Number | Measure |
| Per Capita Income | 3,135 | $74,006 |
| Median Family Income | 888 | $186,750 |
| Mean Family Income | 888 | $234,541 |
| Median Household Income | 1,138 | $153,088 |
| Mean Household Income | 1,138 | $201,181 |
| Income Deficit | 888 | $0 |
| Wage / Income Gap (%) | 3,135 | 26.66% |
| Wage / Income Gap ($) | 3,135 | 73.34¢ per $1 |
| Gini / Inequality Index | 3,135 | 0.42 |
Earnings by Sex in South Hempstead
Average Earnings in South Hempstead are $85,699, $98,750 for men and $72,421 for women, a difference of 26.7%.
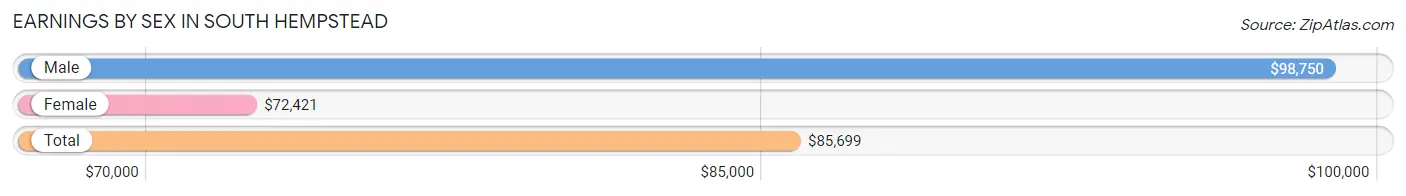
| Sex | Number | Average Earnings |
| Male | 961 (53.2%) | $98,750 |
| Female | 844 (46.8%) | $72,421 |
| Total | 1,805 (100.0%) | $85,699 |
Earnings by Sex by Income Bracket in South Hempstead
The most common earnings brackets in South Hempstead are $100,000+ for men (478 | 49.7%) and $100,000+ for women (306 | 36.3%).
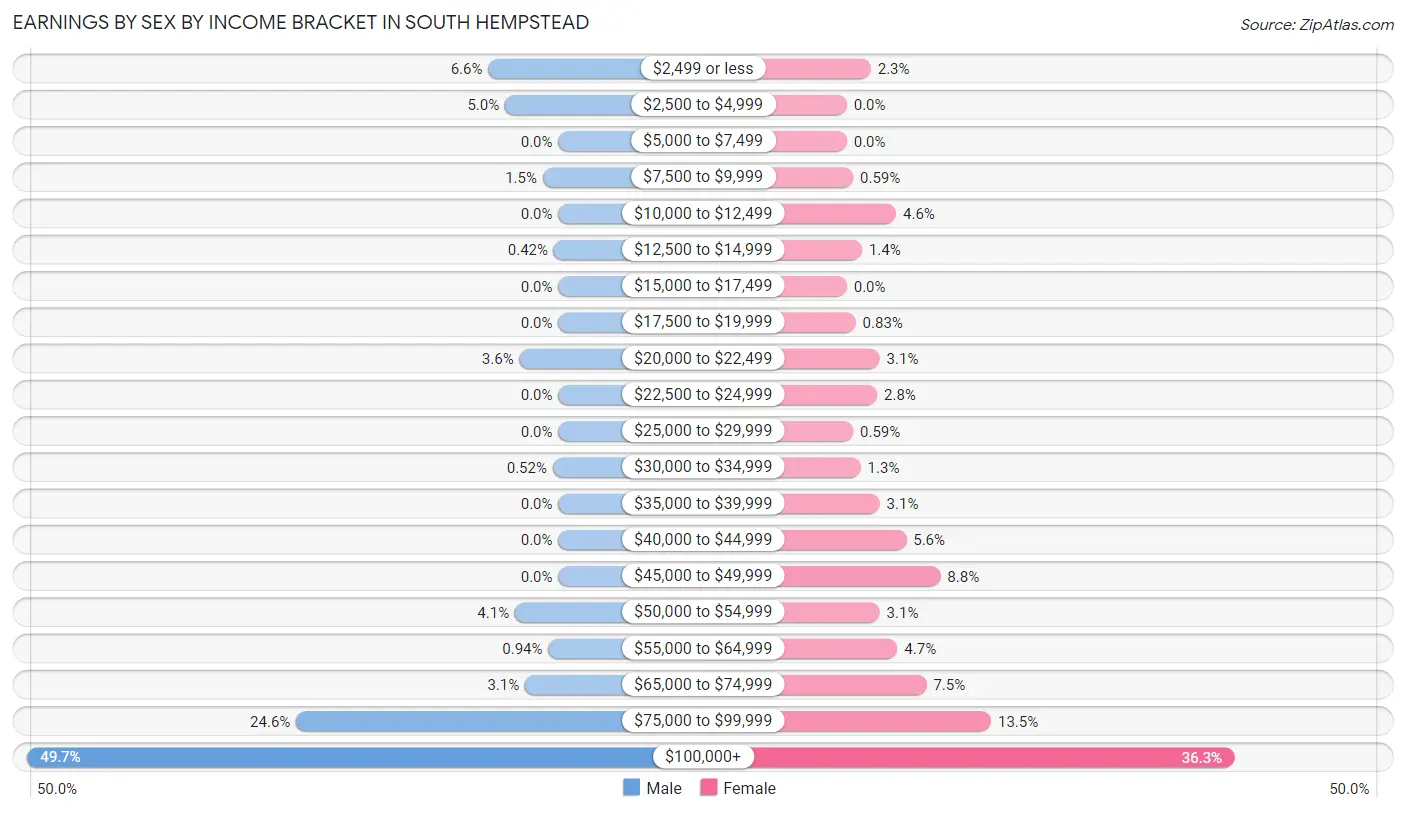
| Income | Male | Female |
| $2,499 or less | 63 (6.6%) | 19 (2.2%) |
| $2,500 to $4,999 | 48 (5.0%) | 0 (0.0%) |
| $5,000 to $7,499 | 0 (0.0%) | 0 (0.0%) |
| $7,500 to $9,999 | 14 (1.5%) | 5 (0.6%) |
| $10,000 to $12,499 | 0 (0.0%) | 39 (4.6%) |
| $12,500 to $14,999 | 4 (0.4%) | 12 (1.4%) |
| $15,000 to $17,499 | 0 (0.0%) | 0 (0.0%) |
| $17,500 to $19,999 | 0 (0.0%) | 7 (0.8%) |
| $20,000 to $22,499 | 35 (3.6%) | 26 (3.1%) |
| $22,500 to $24,999 | 0 (0.0%) | 24 (2.8%) |
| $25,000 to $29,999 | 0 (0.0%) | 5 (0.6%) |
| $30,000 to $34,999 | 5 (0.5%) | 11 (1.3%) |
| $35,000 to $39,999 | 0 (0.0%) | 26 (3.1%) |
| $40,000 to $44,999 | 0 (0.0%) | 47 (5.6%) |
| $45,000 to $49,999 | 0 (0.0%) | 74 (8.8%) |
| $50,000 to $54,999 | 39 (4.1%) | 26 (3.1%) |
| $55,000 to $64,999 | 9 (0.9%) | 40 (4.7%) |
| $65,000 to $74,999 | 30 (3.1%) | 63 (7.5%) |
| $75,000 to $99,999 | 236 (24.6%) | 114 (13.5%) |
| $100,000+ | 478 (49.7%) | 306 (36.3%) |
| Total | 961 (100.0%) | 844 (100.0%) |
Earnings by Sex by Educational Attainment in South Hempstead
Average earnings in South Hempstead are $107,857 for men and $81,754 for women, a difference of 24.2%. Men with an educational attainment of graduate degree enjoy the highest average annual earnings of $146,136, while those with high school diploma education earn the least with $86,348. Women with an educational attainment of graduate degree earn the most with the average annual earnings of $132,647, while those with bachelor's degree education have the smallest earnings of $41,544.
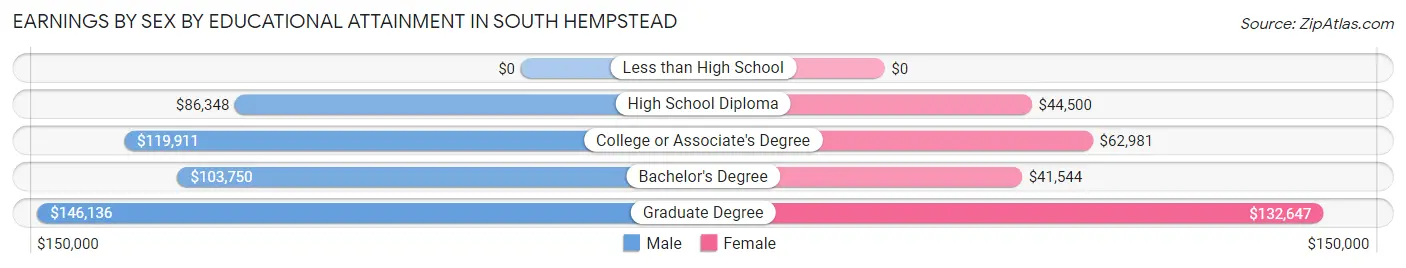
| Educational Attainment | Male Income | Female Income |
| Less than High School | - | - |
| High School Diploma | $86,348 | $44,500 |
| College or Associate's Degree | $119,911 | $62,981 |
| Bachelor's Degree | $103,750 | $41,544 |
| Graduate Degree | $146,136 | $132,647 |
| Total | $107,857 | $81,754 |
Family Income in South Hempstead
Family Income Brackets in South Hempstead
According to the South Hempstead family income data, there are 415 families falling into the $200,000+ income range, which is the most common income bracket and makes up 46.7% of all families.
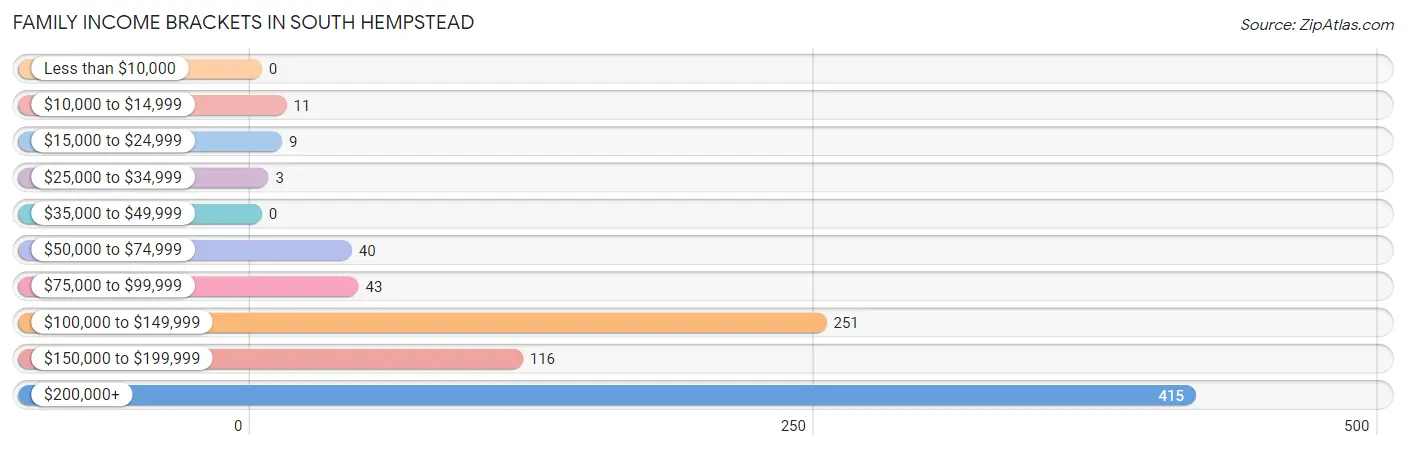
| Income Bracket | # Families | % Families |
| Less than $10,000 | 0 | 0.0% |
| $10,000 to $14,999 | 11 | 1.2% |
| $15,000 to $24,999 | 9 | 1.0% |
| $25,000 to $34,999 | 3 | 0.3% |
| $35,000 to $49,999 | 0 | 0.0% |
| $50,000 to $74,999 | 40 | 4.5% |
| $75,000 to $99,999 | 43 | 4.8% |
| $100,000 to $149,999 | 251 | 28.3% |
| $150,000 to $199,999 | 116 | 13.1% |
| $200,000+ | 415 | 46.7% |
Family Income by Famaliy Size in South Hempstead
4-person families (350 | 39.4%) account for the highest median family income in South Hempstead with $250,001 per family, while 2-person families (295 | 33.2%) have the highest median income of $63,125 per family member.
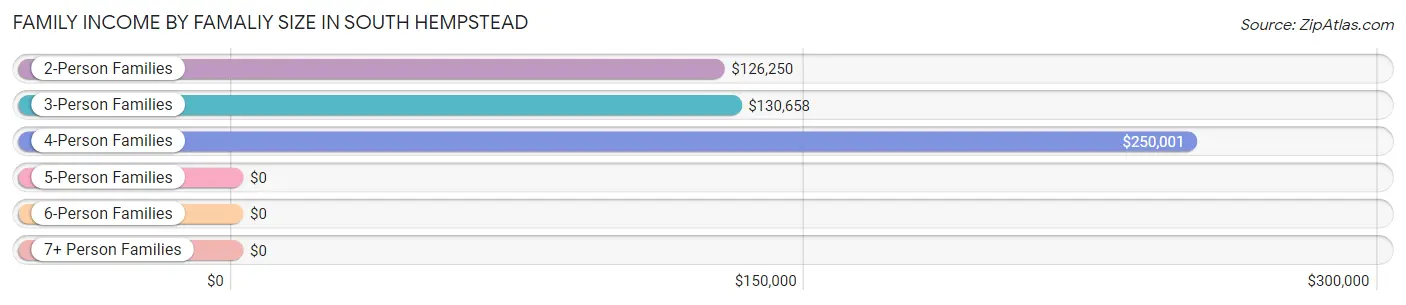
| Income Bracket | # Families | Median Income |
| 2-Person Families | 295 (33.2%) | $126,250 |
| 3-Person Families | 228 (25.7%) | $130,658 |
| 4-Person Families | 350 (39.4%) | $250,001 |
| 5-Person Families | 5 (0.6%) | $0 |
| 6-Person Families | 6 (0.7%) | $0 |
| 7+ Person Families | 4 (0.4%) | $0 |
| Total | 888 (100.0%) | $186,750 |
Family Income by Number of Earners in South Hempstead
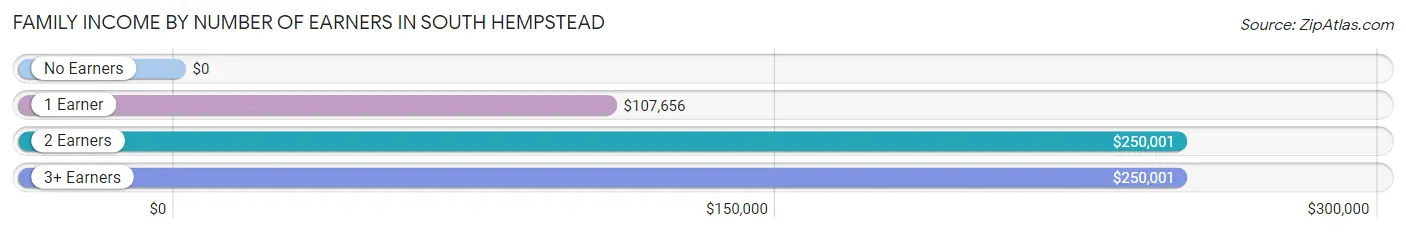
| Number of Earners | # Families | Median Income |
| No Earners | 71 (8.0%) | $0 |
| 1 Earner | 259 (29.2%) | $107,656 |
| 2 Earners | 397 (44.7%) | $250,001 |
| 3+ Earners | 161 (18.1%) | $250,001 |
| Total | 888 (100.0%) | $186,750 |
Household Income in South Hempstead
Household Income Brackets in South Hempstead
With 415 households falling in the category, the $200,000+ income range is the most frequent in South Hempstead, accounting for 36.5% of all households. In contrast, only 3 households (0.3%) fall into the $25,000 to $34,999 income bracket, making it the least populous group.
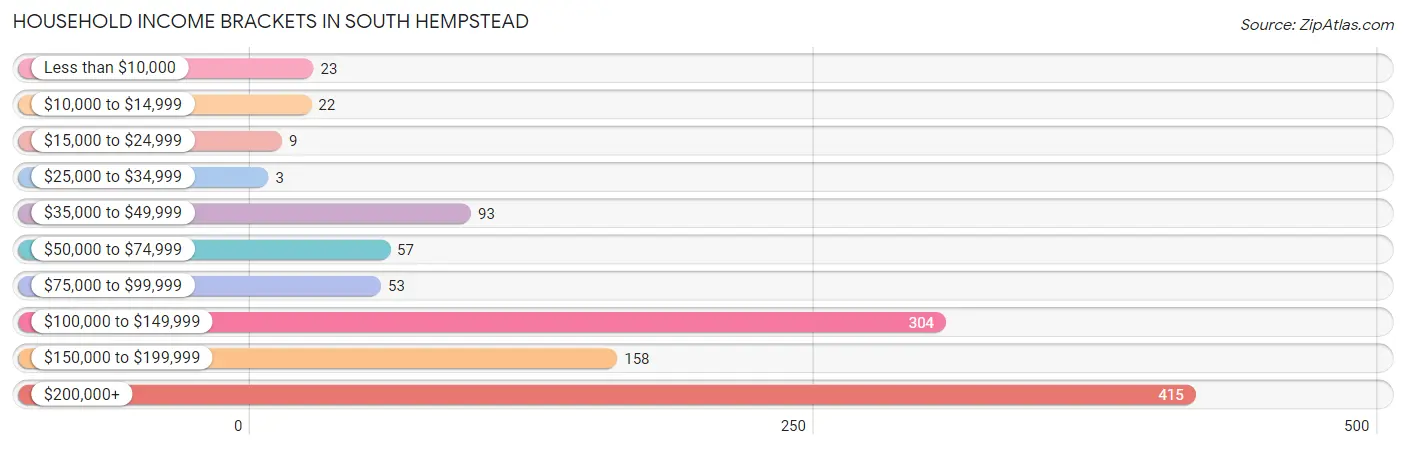
| Income Bracket | # Households | % Households |
| Less than $10,000 | 23 | 2.0% |
| $10,000 to $14,999 | 22 | 1.9% |
| $15,000 to $24,999 | 9 | 0.8% |
| $25,000 to $34,999 | 3 | 0.3% |
| $35,000 to $49,999 | 93 | 8.2% |
| $50,000 to $74,999 | 57 | 5.0% |
| $75,000 to $99,999 | 53 | 4.7% |
| $100,000 to $149,999 | 304 | 26.7% |
| $150,000 to $199,999 | 158 | 13.9% |
| $200,000+ | 415 | 36.5% |
Household Income by Householder Age in South Hempstead
The median household income in South Hempstead is $153,088, with the highest median household income of $186,250 found in the 25 to 44 years age bracket for the primary householder. A total of 266 households (23.4%) fall into this category.
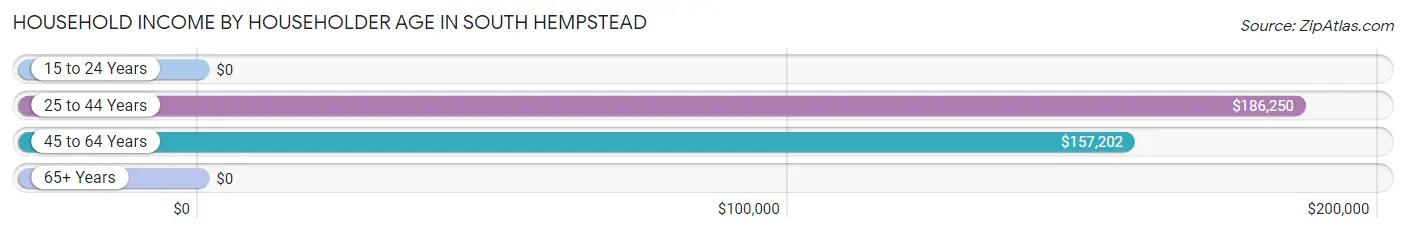
| Income Bracket | # Households | Median Income |
| 15 to 24 Years | 0 (0.0%) | $0 |
| 25 to 44 Years | 266 (23.4%) | $186,250 |
| 45 to 64 Years | 575 (50.5%) | $157,202 |
| 65+ Years | 297 (26.1%) | $0 |
| Total | 1,138 (100.0%) | $153,088 |
Poverty in South Hempstead
Income Below Poverty by Sex and Age in South Hempstead
With 1.3% poverty level for males and 4.0% for females among the residents of South Hempstead, 6 to 11 year old males and 6 to 11 year old females are the most vulnerable to poverty, with 12 males (14.3%) and 11 females (22.5%) in their respective age groups living below the poverty level.
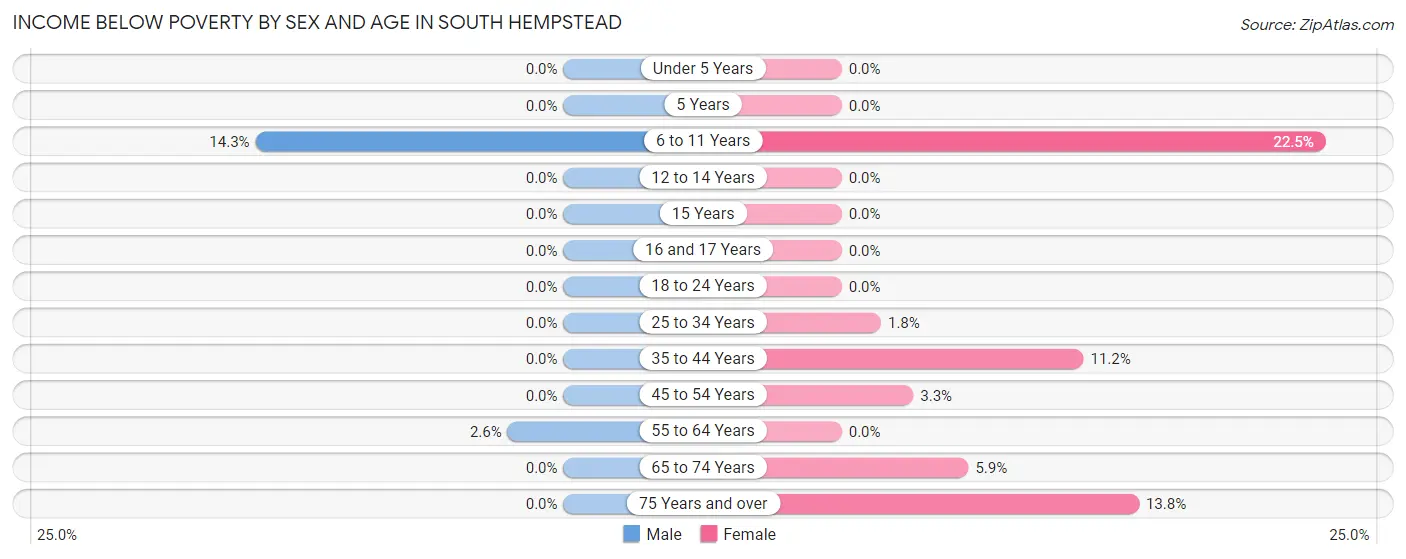
| Age Bracket | Male | Female |
| Under 5 Years | 0 (0.0%) | 0 (0.0%) |
| 5 Years | 0 (0.0%) | 0 (0.0%) |
| 6 to 11 Years | 12 (14.3%) | 11 (22.5%) |
| 12 to 14 Years | 0 (0.0%) | 0 (0.0%) |
| 15 Years | 0 (0.0%) | 0 (0.0%) |
| 16 and 17 Years | 0 (0.0%) | 0 (0.0%) |
| 18 to 24 Years | 0 (0.0%) | 0 (0.0%) |
| 25 to 34 Years | 0 (0.0%) | 3 (1.8%) |
| 35 to 44 Years | 0 (0.0%) | 11 (11.2%) |
| 45 to 54 Years | 0 (0.0%) | 10 (3.3%) |
| 55 to 64 Years | 9 (2.6%) | 0 (0.0%) |
| 65 to 74 Years | 0 (0.0%) | 11 (5.9%) |
| 75 Years and over | 0 (0.0%) | 12 (13.8%) |
| Total | 21 (1.3%) | 58 (4.0%) |
Income Above Poverty by Sex and Age in South Hempstead
According to the poverty statistics in South Hempstead, males aged under 5 years and females aged under 5 years are the age groups that are most secure financially, with 100.0% of males and 100.0% of females in these age groups living above the poverty line.
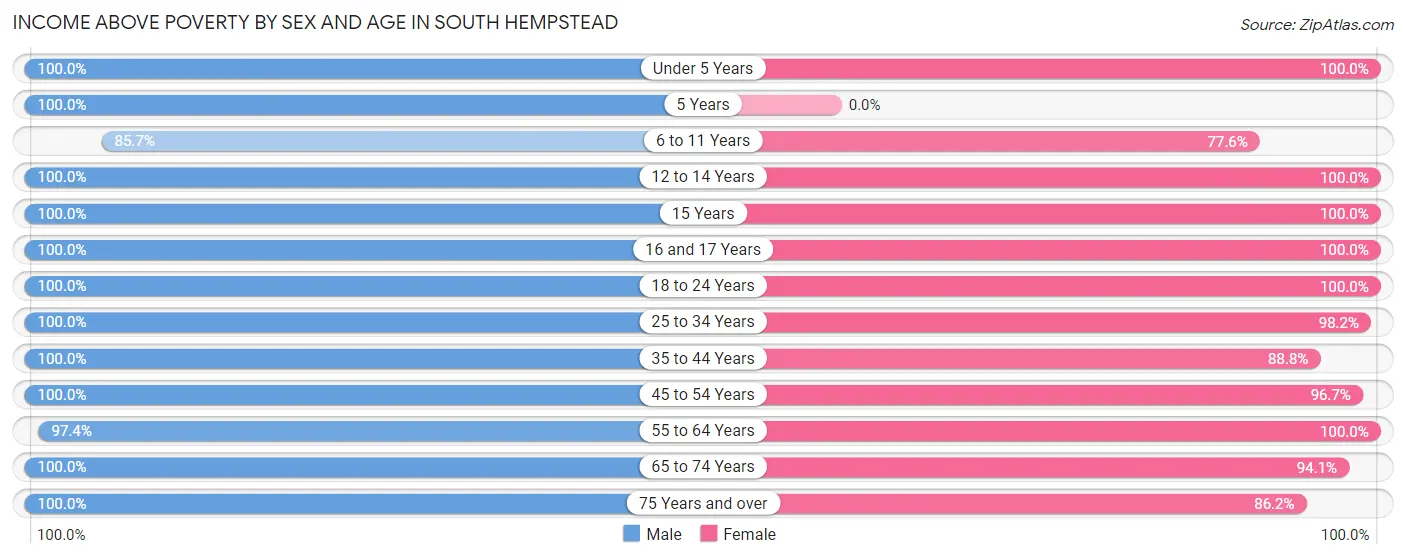
| Age Bracket | Male | Female |
| Under 5 Years | 114 (100.0%) | 60 (100.0%) |
| 5 Years | 13 (100.0%) | 0 (0.0%) |
| 6 to 11 Years | 72 (85.7%) | 38 (77.5%) |
| 12 to 14 Years | 21 (100.0%) | 47 (100.0%) |
| 15 Years | 141 (100.0%) | 2 (100.0%) |
| 16 and 17 Years | 52 (100.0%) | 32 (100.0%) |
| 18 to 24 Years | 120 (100.0%) | 215 (100.0%) |
| 25 to 34 Years | 200 (100.0%) | 162 (98.2%) |
| 35 to 44 Years | 123 (100.0%) | 87 (88.8%) |
| 45 to 54 Years | 178 (100.0%) | 291 (96.7%) |
| 55 to 64 Years | 338 (97.4%) | 212 (100.0%) |
| 65 to 74 Years | 144 (100.0%) | 176 (94.1%) |
| 75 Years and over | 134 (100.0%) | 75 (86.2%) |
| Total | 1,650 (98.7%) | 1,397 (96.0%) |
Income Below Poverty Among Married-Couple Families in South Hempstead
The poverty statistics for married-couple families in South Hempstead show that 1.3% or 9 of the total 705 families live below the poverty line. Families with no children have the highest poverty rate of 2.1%, comprising of 9 families. On the other hand, families with 1 or 2 children have the lowest poverty rate of 0.0%, which includes 0 families.
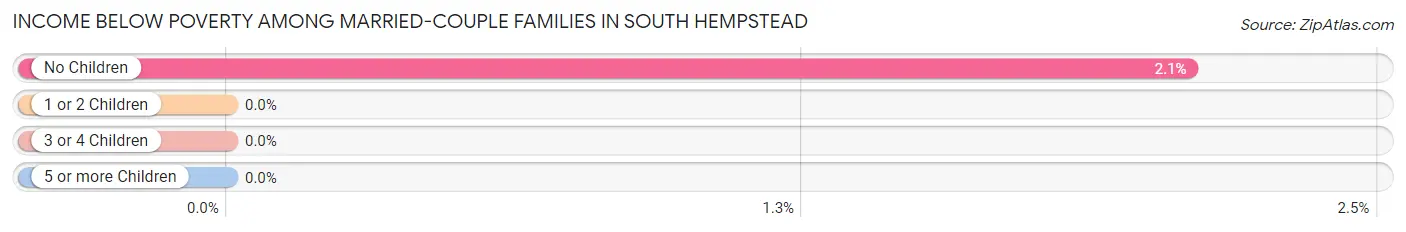
| Children | Above Poverty | Below Poverty |
| No Children | 422 (97.9%) | 9 (2.1%) |
| 1 or 2 Children | 268 (100.0%) | 0 (0.0%) |
| 3 or 4 Children | 6 (100.0%) | 0 (0.0%) |
| 5 or more Children | 0 (0.0%) | 0 (0.0%) |
| Total | 696 (98.7%) | 9 (1.3%) |
Income Below Poverty Among Single-Parent Households in South Hempstead
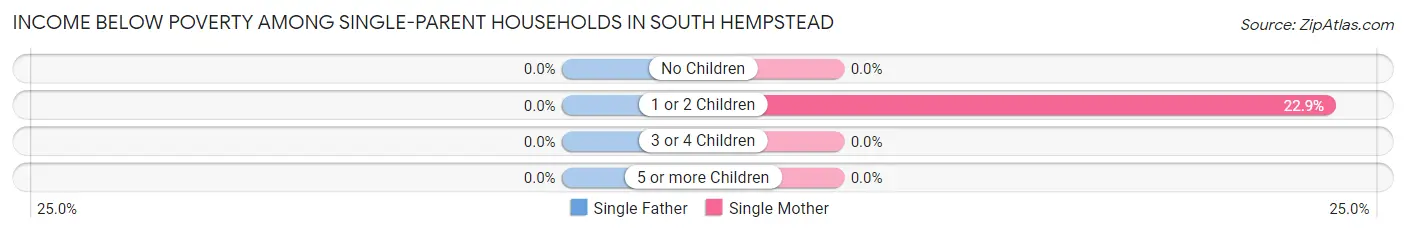
| Children | Single Father | Single Mother |
| No Children | 0 (0.0%) | 0 (0.0%) |
| 1 or 2 Children | 0 (0.0%) | 11 (22.9%) |
| 3 or 4 Children | 0 (0.0%) | 0 (0.0%) |
| 5 or more Children | 0 (0.0%) | 0 (0.0%) |
| Total | 0 (0.0%) | 11 (15.1%) |
Income Below Poverty Among Married-Couple vs Single-Parent Households in South Hempstead
The poverty data for South Hempstead shows that 9 of the married-couple family households (1.3%) and 11 of the single-parent households (6.0%) are living below the poverty level. Within the married-couple family households, those with no children have the highest poverty rate, with 9 households (2.1%) falling below the poverty line. Among the single-parent households, those with 1 or 2 children have the highest poverty rate, with 11 household (10.6%) living below poverty.
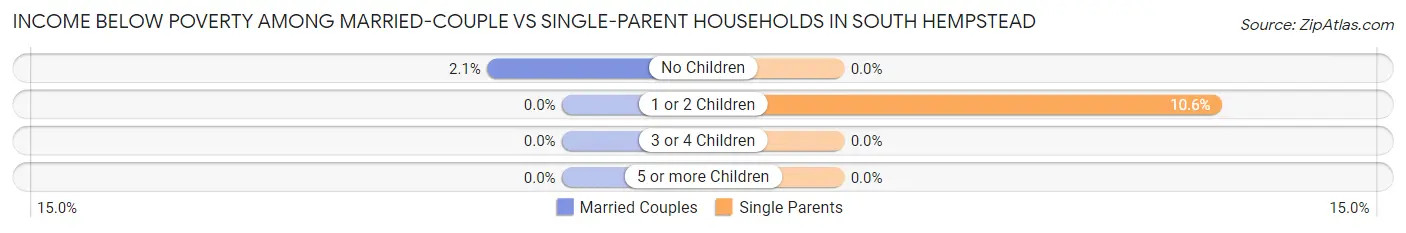
| Children | Married-Couple Families | Single-Parent Households |
| No Children | 9 (2.1%) | 0 (0.0%) |
| 1 or 2 Children | 0 (0.0%) | 11 (10.6%) |
| 3 or 4 Children | 0 (0.0%) | 0 (0.0%) |
| 5 or more Children | 0 (0.0%) | 0 (0.0%) |
| Total | 9 (1.3%) | 11 (6.0%) |
Race in South Hempstead
The most populous races in South Hempstead are White / Caucasian (2,211 | 70.5%), Hispanic or Latino (578 | 18.4%), and Black / African American (482 | 15.4%).
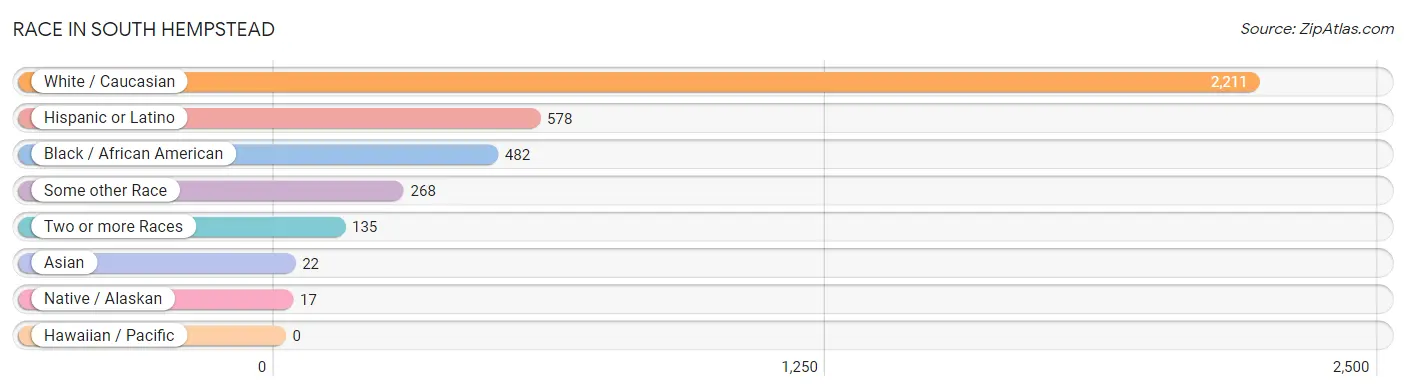
| Race | # Population | % Population |
| Asian | 22 | 0.7% |
| Black / African American | 482 | 15.4% |
| Hawaiian / Pacific | 0 | 0.0% |
| Hispanic or Latino | 578 | 18.4% |
| Native / Alaskan | 17 | 0.5% |
| White / Caucasian | 2,211 | 70.5% |
| Two or more Races | 135 | 4.3% |
| Some other Race | 268 | 8.6% |
| Total | 3,135 | 100.0% |
Ancestry in South Hempstead
The most populous ancestries reported in South Hempstead are Irish (1,195 | 38.1%), Italian (877 | 28.0%), American (228 | 7.3%), German (226 | 7.2%), and Dominican (212 | 6.8%), together accounting for 87.3% of all South Hempstead residents.
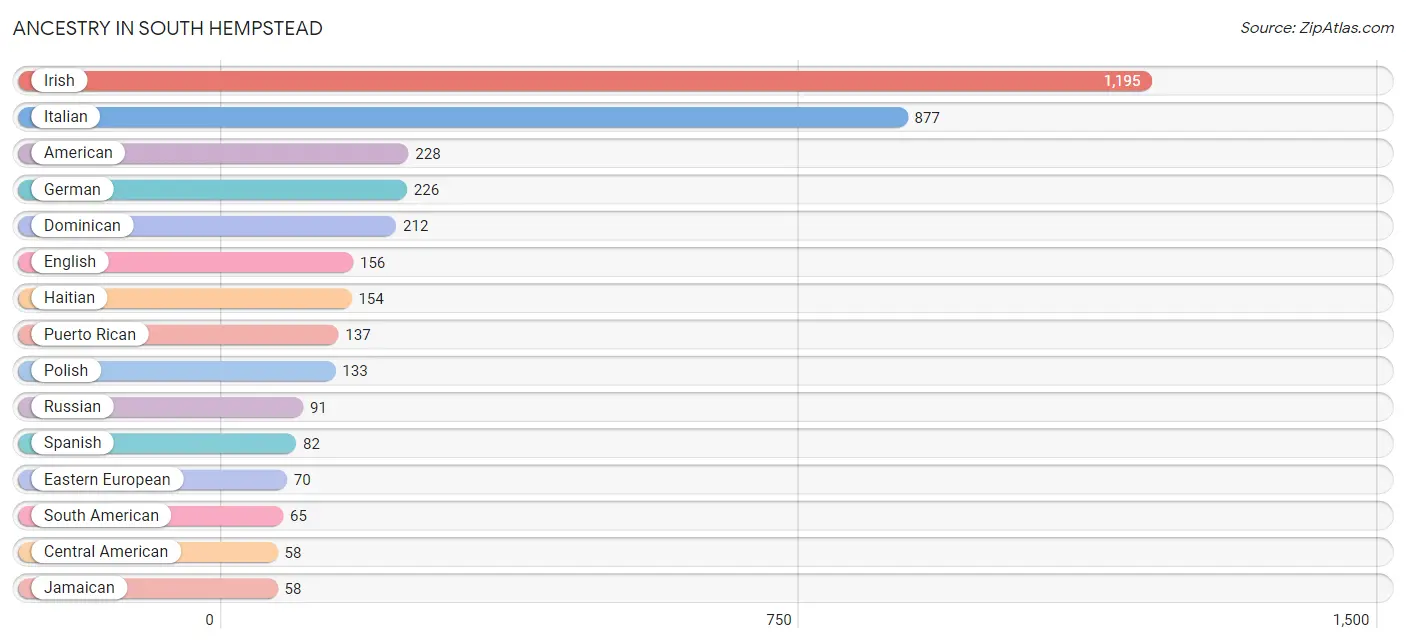
| Ancestry | # Population | % Population |
| American | 228 | 7.3% |
| Austrian | 10 | 0.3% |
| Barbadian | 10 | 0.3% |
| British West Indian | 3 | 0.1% |
| Central American | 58 | 1.8% |
| Central American Indian | 17 | 0.5% |
| Colombian | 13 | 0.4% |
| Cuban | 6 | 0.2% |
| Dominican | 212 | 6.8% |
| Dutch | 32 | 1.0% |
| Eastern European | 70 | 2.2% |
| Ecuadorian | 43 | 1.4% |
| English | 156 | 5.0% |
| European | 27 | 0.9% |
| Filipino | 2 | 0.1% |
| French | 11 | 0.4% |
| French Canadian | 20 | 0.6% |
| German | 226 | 7.2% |
| Haitian | 154 | 4.9% |
| Hungarian | 32 | 1.0% |
| Irish | 1,195 | 38.1% |
| Italian | 877 | 28.0% |
| Jamaican | 58 | 1.8% |
| Korean | 19 | 0.6% |
| Mexican | 2 | 0.1% |
| Norwegian | 5 | 0.2% |
| Peruvian | 9 | 0.3% |
| Polish | 133 | 4.2% |
| Portuguese | 3 | 0.1% |
| Puerto Rican | 137 | 4.4% |
| Russian | 91 | 2.9% |
| Salvadoran | 58 | 1.8% |
| Scottish | 5 | 0.2% |
| South American | 65 | 2.1% |
| Spaniard | 3 | 0.1% |
| Spanish | 82 | 2.6% |
| Thai | 2 | 0.1% |
| Ukrainian | 11 | 0.4% |
| West Indian | 19 | 0.6% | View All 39 Rows |
Immigrants in South Hempstead
The most numerous immigrant groups reported in South Hempstead came from Latin America (371 | 11.8%), Caribbean (278 | 8.9%), Haiti (138 | 4.4%), Dominican Republic (75 | 2.4%), and Central America (58 | 1.8%), together accounting for 29.3% of all South Hempstead residents.
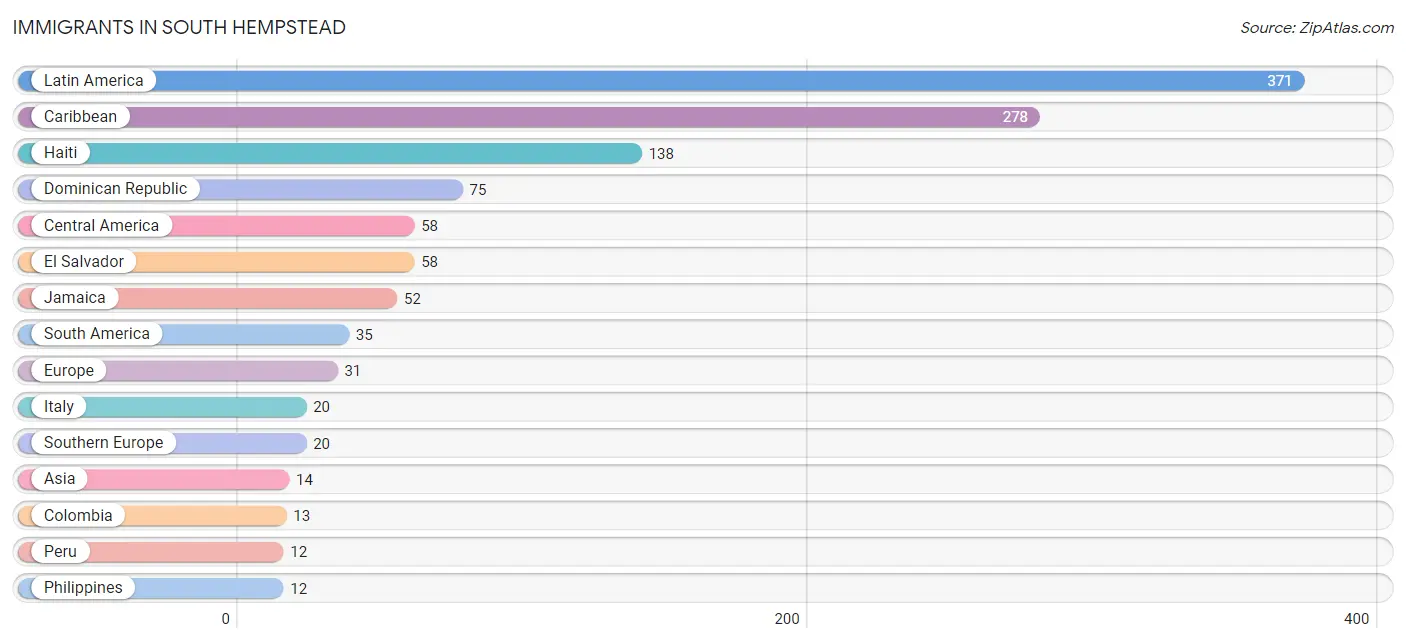
| Immigration Origin | # Population | % Population |
| Asia | 14 | 0.4% |
| Barbados | 10 | 0.3% |
| Caribbean | 278 | 8.9% |
| Central America | 58 | 1.8% |
| Colombia | 13 | 0.4% |
| Dominican Republic | 75 | 2.4% |
| Ecuador | 10 | 0.3% |
| El Salvador | 58 | 1.8% |
| Europe | 31 | 1.0% |
| Germany | 11 | 0.4% |
| Haiti | 138 | 4.4% |
| India | 2 | 0.1% |
| Italy | 20 | 0.6% |
| Jamaica | 52 | 1.7% |
| Latin America | 371 | 11.8% |
| Peru | 12 | 0.4% |
| Philippines | 12 | 0.4% |
| South America | 35 | 1.1% |
| South Central Asia | 2 | 0.1% |
| South Eastern Asia | 12 | 0.4% |
| Southern Europe | 20 | 0.6% |
| St. Vincent and the Grenadines | 3 | 0.1% |
| Western Europe | 11 | 0.4% | View All 23 Rows |
Sex and Age in South Hempstead
Sex and Age in South Hempstead
The most populous age groups in South Hempstead are 15 to 19 Years (232 | 13.9%) for men and 20 to 24 Years (215 | 14.7%) for women.
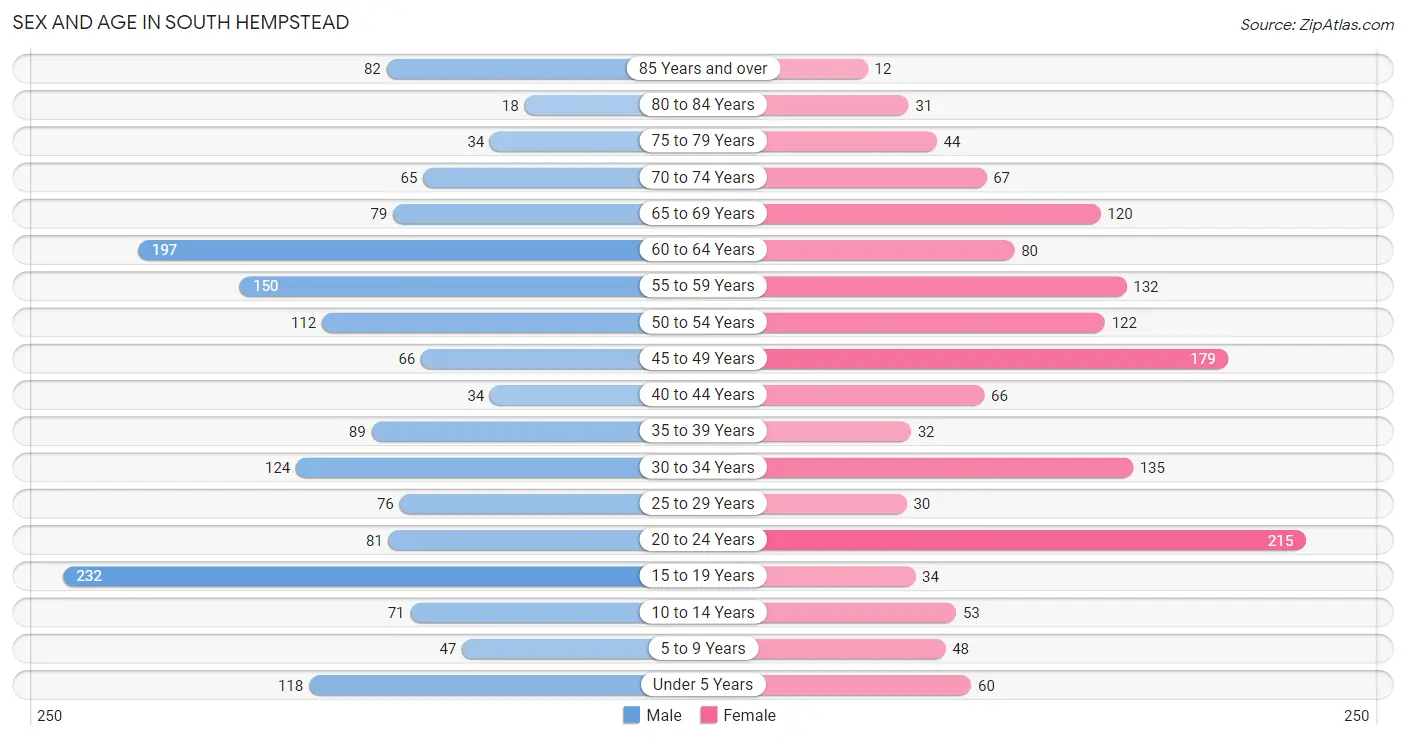
| Age Bracket | Male | Female |
| Under 5 Years | 118 (7.0%) | 60 (4.1%) |
| 5 to 9 Years | 47 (2.8%) | 48 (3.3%) |
| 10 to 14 Years | 71 (4.2%) | 53 (3.6%) |
| 15 to 19 Years | 232 (13.9%) | 34 (2.3%) |
| 20 to 24 Years | 81 (4.8%) | 215 (14.7%) |
| 25 to 29 Years | 76 (4.5%) | 30 (2.1%) |
| 30 to 34 Years | 124 (7.4%) | 135 (9.2%) |
| 35 to 39 Years | 89 (5.3%) | 32 (2.2%) |
| 40 to 44 Years | 34 (2.0%) | 66 (4.5%) |
| 45 to 49 Years | 66 (3.9%) | 179 (12.3%) |
| 50 to 54 Years | 112 (6.7%) | 122 (8.4%) |
| 55 to 59 Years | 150 (9.0%) | 132 (9.0%) |
| 60 to 64 Years | 197 (11.8%) | 80 (5.5%) |
| 65 to 69 Years | 79 (4.7%) | 120 (8.2%) |
| 70 to 74 Years | 65 (3.9%) | 67 (4.6%) |
| 75 to 79 Years | 34 (2.0%) | 44 (3.0%) |
| 80 to 84 Years | 18 (1.1%) | 31 (2.1%) |
| 85 Years and over | 82 (4.9%) | 12 (0.8%) |
| Total | 1,675 (100.0%) | 1,460 (100.0%) |
Families and Households in South Hempstead
Median Family Size in South Hempstead
The median family size in South Hempstead is 3.22 persons per family, with single male/father families (110 | 12.4%) accounting for the largest median family size of 3.79 persons per family. On the other hand, single female/mother families (73 | 8.2%) represent the smallest median family size with 2.71 persons per family.
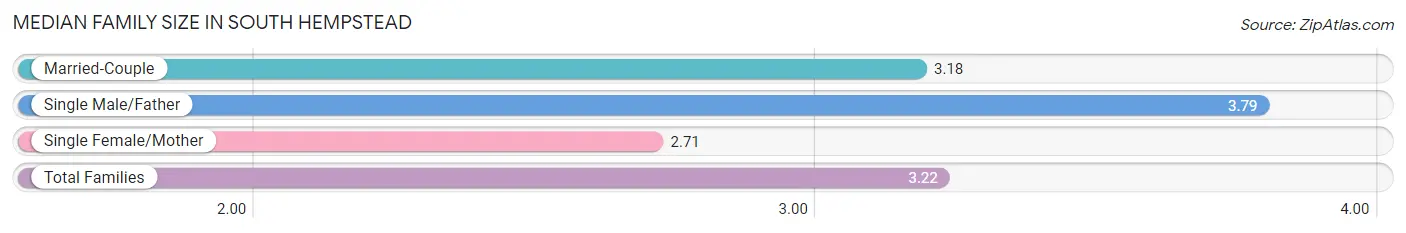
| Family Type | # Families | Family Size |
| Married-Couple | 705 (79.4%) | 3.18 |
| Single Male/Father | 110 (12.4%) | 3.79 |
| Single Female/Mother | 73 (8.2%) | 2.71 |
| Total Families | 888 (100.0%) | 3.22 |
Median Household Size in South Hempstead
The median household size in South Hempstead is 2.75 persons per household, with single male/father households (110 | 9.7%) accounting for the largest median household size of 3.79 persons per household. non-family households (250 | 22.0%) represent the smallest median household size with 1.04 persons per household.
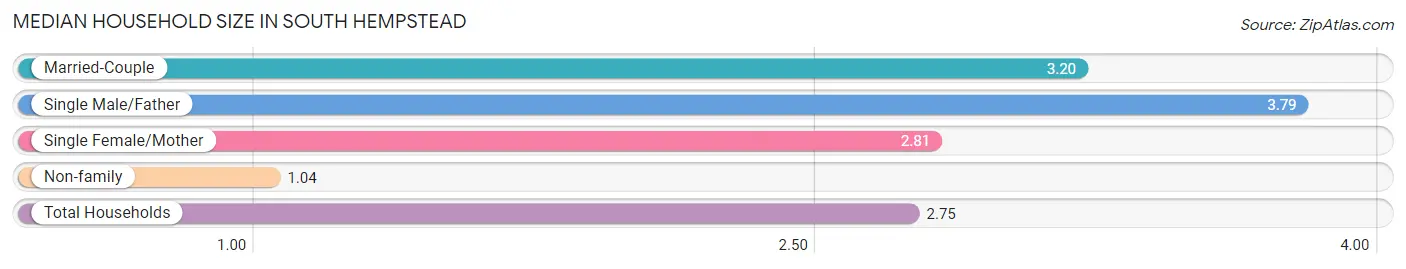
| Household Type | # Households | Household Size |
| Married-Couple | 705 (62.0%) | 3.20 |
| Single Male/Father | 110 (9.7%) | 3.79 |
| Single Female/Mother | 73 (6.4%) | 2.81 |
| Non-family | 250 (22.0%) | 1.04 |
| Total Households | 1,138 (100.0%) | 2.75 |
Household Size by Marriage Status in South Hempstead
Out of a total of 1,138 households in South Hempstead, 888 (78.0%) are family households, while 250 (22.0%) are nonfamily households. The most numerous type of family households are 4-person households, comprising 350, and the most common type of nonfamily households are 1-person households, comprising 241.
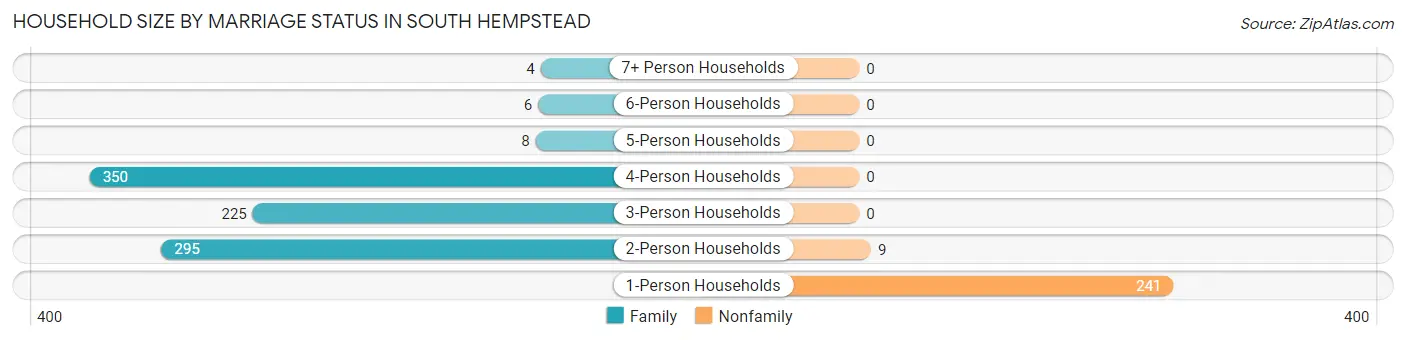
| Household Size | Family Households | Nonfamily Households |
| 1-Person Households | - | 241 (21.2%) |
| 2-Person Households | 295 (25.9%) | 9 (0.8%) |
| 3-Person Households | 225 (19.8%) | 0 (0.0%) |
| 4-Person Households | 350 (30.8%) | 0 (0.0%) |
| 5-Person Households | 8 (0.7%) | 0 (0.0%) |
| 6-Person Households | 6 (0.5%) | 0 (0.0%) |
| 7+ Person Households | 4 (0.4%) | 0 (0.0%) |
| Total | 888 (78.0%) | 250 (22.0%) |
Female Fertility in South Hempstead
Fertility by Age in South Hempstead
Average fertility rate in South Hempstead is 162.0 births per 1,000 women. Women in the age bracket of 20 to 34 years have the highest fertility rate with 250.0 births per 1,000 women. Women in the age bracket of 20 to 34 years acount for 84.8% of all women with births.
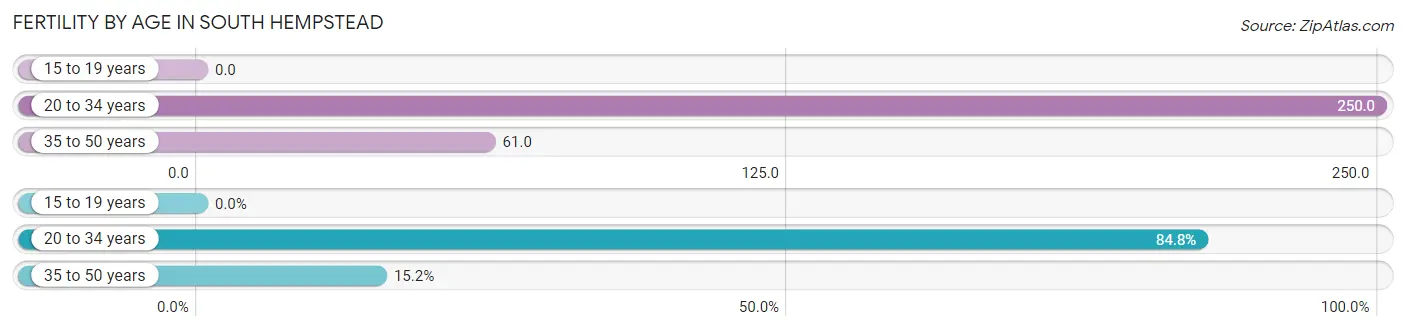
| Age Bracket | Women with Births | Births / 1,000 Women |
| 15 to 19 years | 0 (0.0%) | 0.0 |
| 20 to 34 years | 95 (84.8%) | 250.0 |
| 35 to 50 years | 17 (15.2%) | 61.0 |
| Total | 112 (100.0%) | 162.0 |
Fertility by Age by Marriage Status in South Hempstead
50.0% of women with births (112) in South Hempstead are married. The highest percentage of unmarried women with births falls into 20 to 34 years age bracket with 59.0% of them unmarried at the time of birth, while the lowest percentage of unmarried women with births belong to 35 to 50 years age bracket with 0.0% of them unmarried.
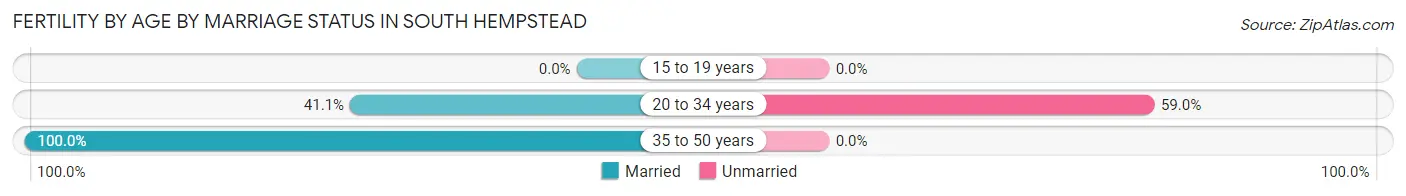
| Age Bracket | Married | Unmarried |
| 15 to 19 years | 0 (0.0%) | 0 (0.0%) |
| 20 to 34 years | 39 (41.0%) | 56 (59.0%) |
| 35 to 50 years | 17 (100.0%) | 0 (0.0%) |
| Total | 56 (50.0%) | 56 (50.0%) |
Fertility by Education in South Hempstead
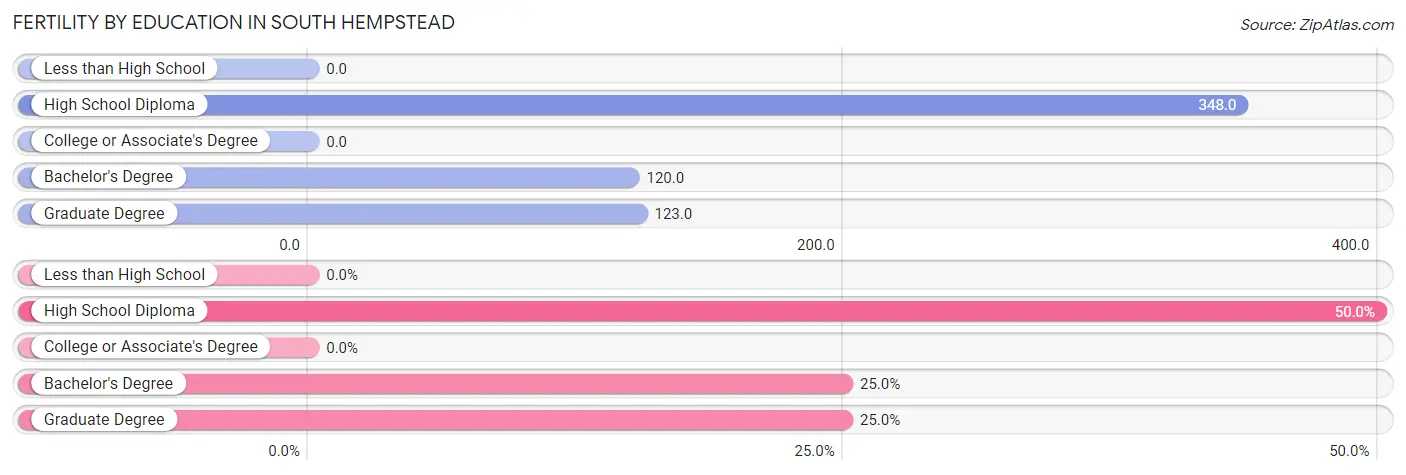
| Educational Attainment | Women with Births | Births / 1,000 Women |
| Less than High School | 0 (0.0%) | 0.0 |
| High School Diploma | 56 (50.0%) | 348.0 |
| College or Associate's Degree | 0 (0.0%) | 0.0 |
| Bachelor's Degree | 28 (25.0%) | 120.0 |
| Graduate Degree | 28 (25.0%) | 123.0 |
| Total | 112 (100.0%) | 162.0 |
Fertility by Education by Marriage Status in South Hempstead
50.0% of women with births in South Hempstead are unmarried. Women with the educational attainment of bachelor's degree are most likely to be married with 100.0% of them married at childbirth, while women with the educational attainment of high school diploma are least likely to be married with 100.0% of them unmarried at childbirth.
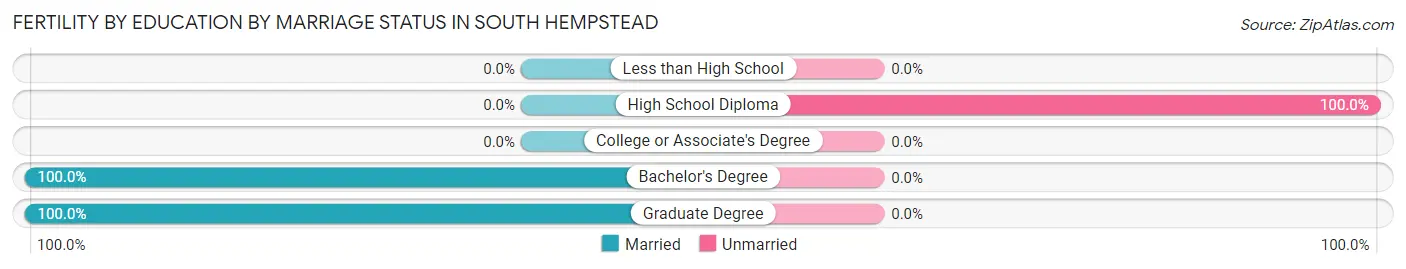
| Educational Attainment | Married | Unmarried |
| Less than High School | 0 (0.0%) | 0 (0.0%) |
| High School Diploma | 0 (0.0%) | 56 (100.0%) |
| College or Associate's Degree | 0 (0.0%) | 0 (0.0%) |
| Bachelor's Degree | 28 (100.0%) | 0 (0.0%) |
| Graduate Degree | 28 (100.0%) | 0 (0.0%) |
| Total | 56 (50.0%) | 56 (50.0%) |
Employment Characteristics in South Hempstead
Employment by Class of Employer in South Hempstead
Among the 1,643 employed individuals in South Hempstead, private company employees (759 | 46.2%), local government employees (368 | 22.4%), and not-for-profit organizations (209 | 12.7%) make up the most common classes of employment.
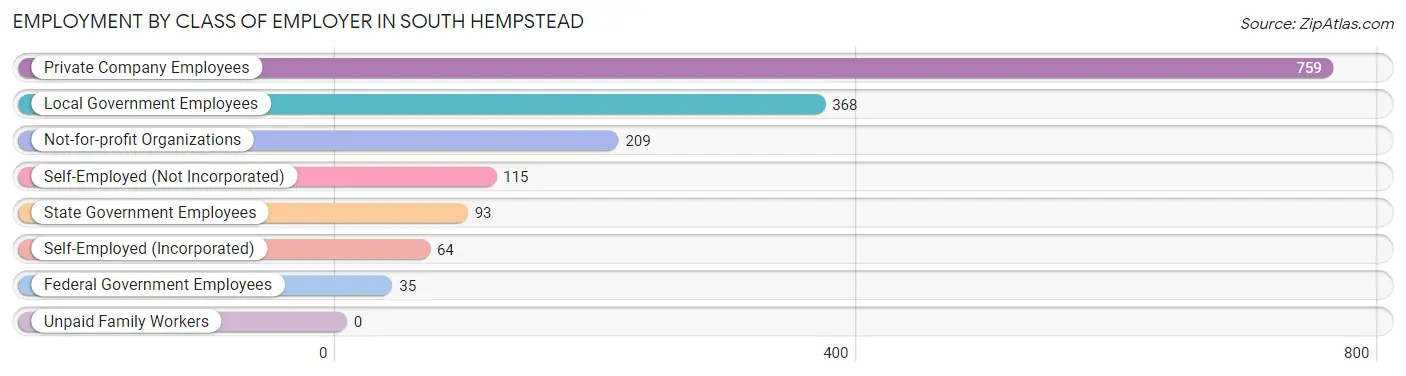
| Employer Class | # Employees | % Employees |
| Private Company Employees | 759 | 46.2% |
| Self-Employed (Incorporated) | 64 | 3.9% |
| Self-Employed (Not Incorporated) | 115 | 7.0% |
| Not-for-profit Organizations | 209 | 12.7% |
| Local Government Employees | 368 | 22.4% |
| State Government Employees | 93 | 5.7% |
| Federal Government Employees | 35 | 2.1% |
| Unpaid Family Workers | 0 | 0.0% |
| Total | 1,643 | 100.0% |
Employment Status by Age in South Hempstead
According to the labor force statistics for South Hempstead, out of the total population over 16 years of age (2,595), 65.7% or 1,705 individuals are in the labor force, with 2.0% or 34 of them unemployed. The age group with the highest labor force participation rate is 35 to 44 years, with 100.0% or 221 individuals in the labor force. Within the labor force, the 25 to 29 years age range has the highest percentage of unemployed individuals, with 11.7% or 9 of them being unemployed.
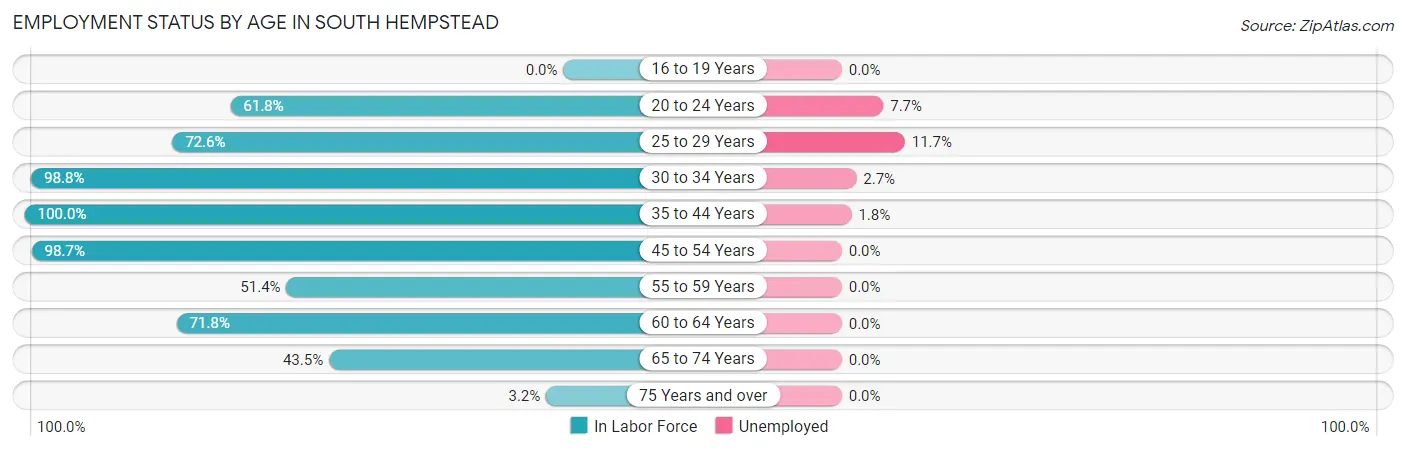
| Age Bracket | In Labor Force | Unemployed |
| 16 to 19 Years | 0 (0.0%) | 0 (0.0%) |
| 20 to 24 Years | 183 (61.8%) | 14 (7.7%) |
| 25 to 29 Years | 77 (72.6%) | 9 (11.7%) |
| 30 to 34 Years | 256 (98.8%) | 7 (2.7%) |
| 35 to 44 Years | 221 (100.0%) | 4 (1.8%) |
| 45 to 54 Years | 473 (98.7%) | 0 (0.0%) |
| 55 to 59 Years | 145 (51.4%) | 0 (0.0%) |
| 60 to 64 Years | 199 (71.8%) | 0 (0.0%) |
| 65 to 74 Years | 144 (43.5%) | 0 (0.0%) |
| 75 Years and over | 7 (3.2%) | 0 (0.0%) |
| Total | 1,705 (65.7%) | 34 (2.0%) |
Employment Status by Educational Attainment in South Hempstead
According to labor force statistics for South Hempstead, 84.4% of individuals (1,371) out of the total population between 25 and 64 years of age (1,624) are in the labor force, with 1.5% or 21 of them being unemployed. The group with the highest labor force participation rate are those with the educational attainment of high school diploma, with 93.9% or 232 individuals in the labor force. Within the labor force, individuals with bachelor's degree or higher education have the highest percentage of unemployment, with 1.8% or 16 of them being unemployed.
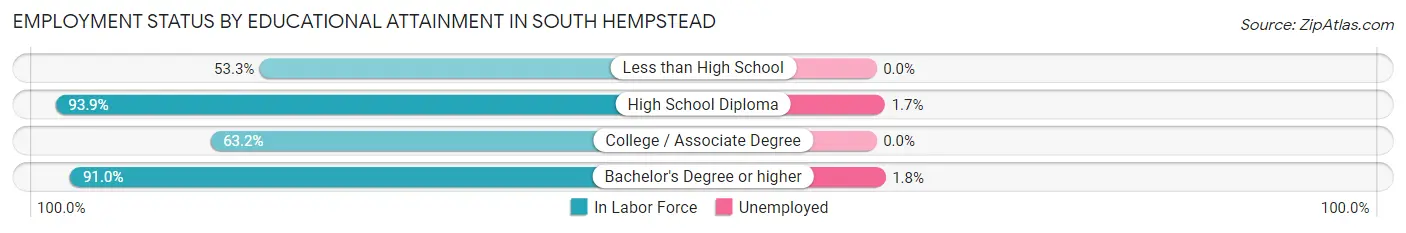
| Educational Attainment | In Labor Force | Unemployed |
| Less than High School | 8 (53.3%) | 0 (0.0%) |
| High School Diploma | 232 (93.9%) | 4 (1.7%) |
| College / Associate Degree | 246 (63.2%) | 0 (0.0%) |
| Bachelor's Degree or higher | 885 (91.0%) | 18 (1.8%) |
| Total | 1,371 (84.4%) | 24 (1.5%) |
Employment Occupations by Sex in South Hempstead
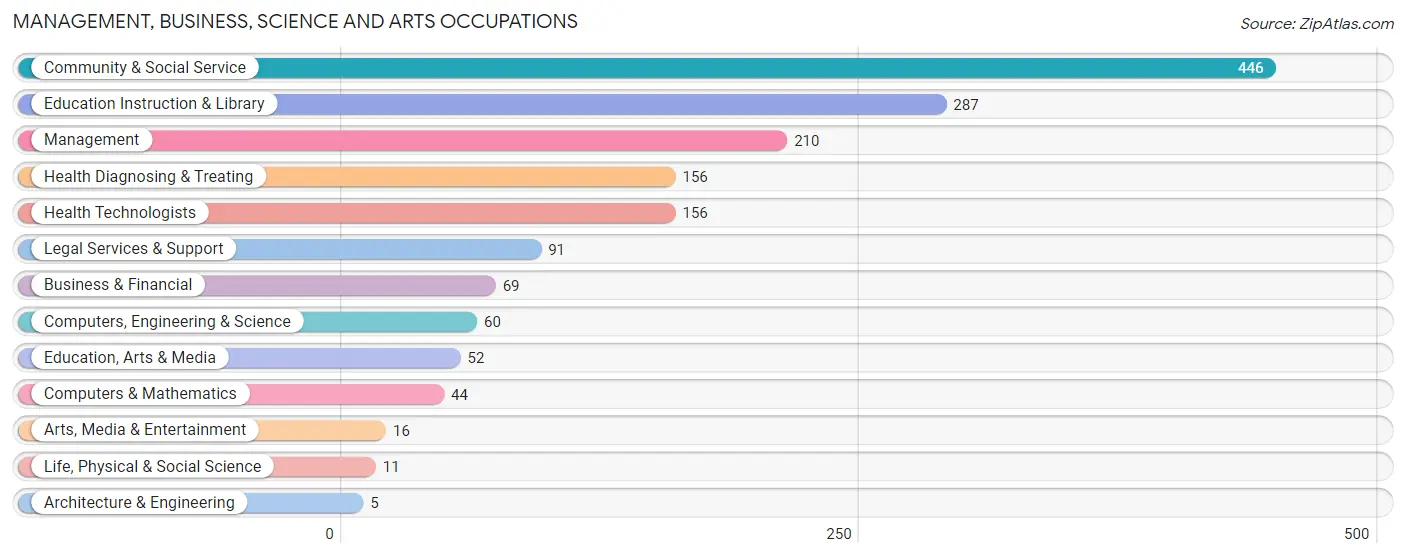
Management, Business, Science and Arts Occupations
The most common Management, Business, Science and Arts occupations in South Hempstead are Community & Social Service (446 | 26.7%), Education Instruction & Library (287 | 17.2%), Management (210 | 12.6%), Health Diagnosing & Treating (156 | 9.3%), and Health Technologists (156 | 9.3%).
Management, Business, Science and Arts Occupations by Sex
Within the Management, Business, Science and Arts occupations in South Hempstead, the most male-oriented occupations are Computers, Engineering & Science (100.0%), Computers & Mathematics (100.0%), and Architecture & Engineering (100.0%), while the most female-oriented occupations are Health Diagnosing & Treating (99.4%), Health Technologists (99.4%), and Legal Services & Support (85.7%).
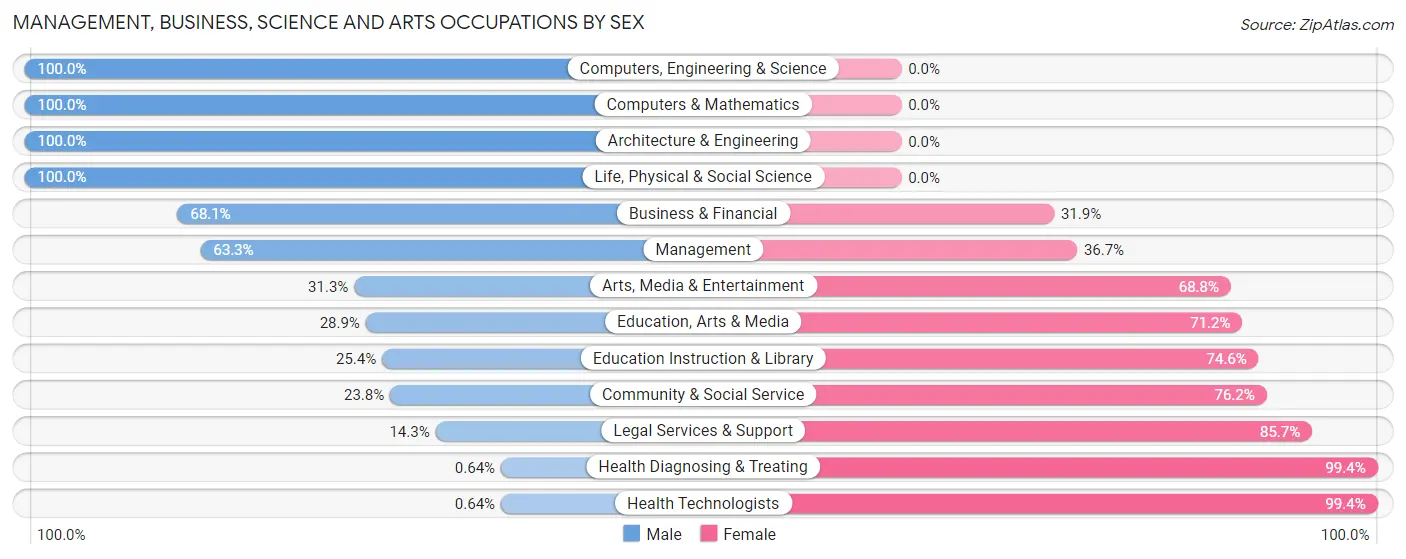
| Occupation | Male | Female |
| Management | 133 (63.3%) | 77 (36.7%) |
| Business & Financial | 47 (68.1%) | 22 (31.9%) |
| Computers, Engineering & Science | 60 (100.0%) | 0 (0.0%) |
| Computers & Mathematics | 44 (100.0%) | 0 (0.0%) |
| Architecture & Engineering | 5 (100.0%) | 0 (0.0%) |
| Life, Physical & Social Science | 11 (100.0%) | 0 (0.0%) |
| Community & Social Service | 106 (23.8%) | 340 (76.2%) |
| Education, Arts & Media | 15 (28.8%) | 37 (71.2%) |
| Legal Services & Support | 13 (14.3%) | 78 (85.7%) |
| Education Instruction & Library | 73 (25.4%) | 214 (74.6%) |
| Arts, Media & Entertainment | 5 (31.2%) | 11 (68.8%) |
| Health Diagnosing & Treating | 1 (0.6%) | 155 (99.4%) |
| Health Technologists | 1 (0.6%) | 155 (99.4%) |
| Total (Category) | 347 (36.9%) | 594 (63.1%) |
| Total (Overall) | 903 (54.0%) | 768 (46.0%) |
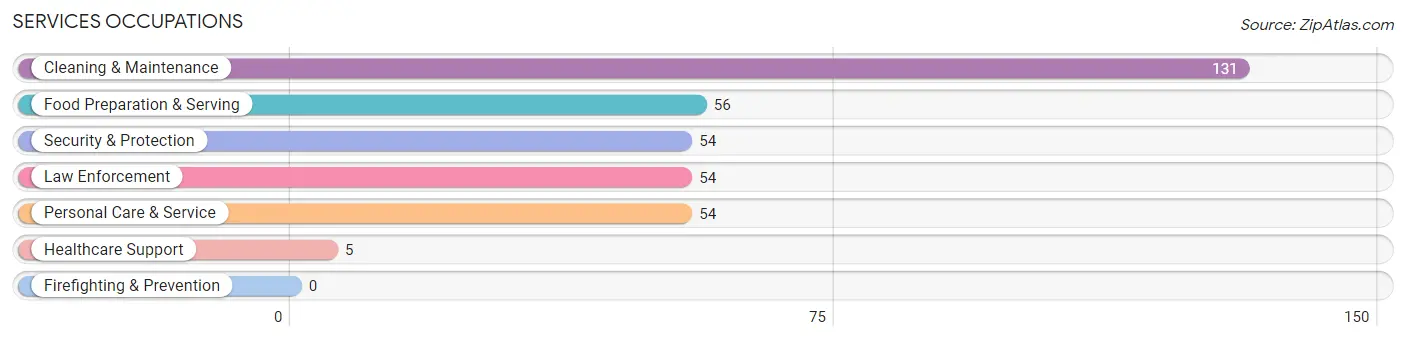
Services Occupations
The most common Services occupations in South Hempstead are Cleaning & Maintenance (131 | 7.8%), Food Preparation & Serving (56 | 3.4%), Security & Protection (54 | 3.2%), Law Enforcement (54 | 3.2%), and Personal Care & Service (54 | 3.2%).
Services Occupations by Sex
Within the Services occupations in South Hempstead, the most male-oriented occupations are Security & Protection (100.0%), Law Enforcement (100.0%), and Food Preparation & Serving (100.0%), while the most female-oriented occupations are Healthcare Support (100.0%), Personal Care & Service (92.6%), and Cleaning & Maintenance (13.7%).
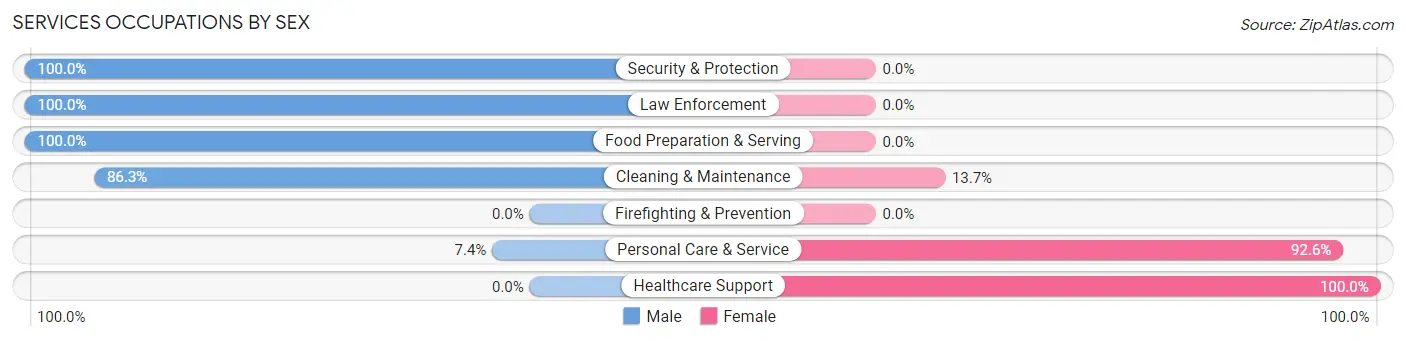
| Occupation | Male | Female |
| Healthcare Support | 0 (0.0%) | 5 (100.0%) |
| Security & Protection | 54 (100.0%) | 0 (0.0%) |
| Firefighting & Prevention | 0 (0.0%) | 0 (0.0%) |
| Law Enforcement | 54 (100.0%) | 0 (0.0%) |
| Food Preparation & Serving | 56 (100.0%) | 0 (0.0%) |
| Cleaning & Maintenance | 113 (86.3%) | 18 (13.7%) |
| Personal Care & Service | 4 (7.4%) | 50 (92.6%) |
| Total (Category) | 227 (75.7%) | 73 (24.3%) |
| Total (Overall) | 903 (54.0%) | 768 (46.0%) |
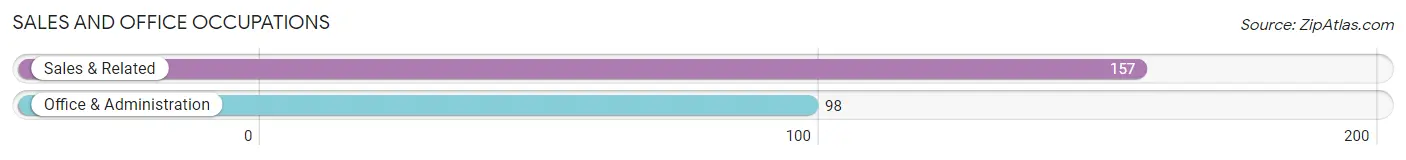
Sales and Office Occupations
The most common Sales and Office occupations in South Hempstead are Sales & Related (157 | 9.4%), and Office & Administration (98 | 5.9%).
Sales and Office Occupations by Sex
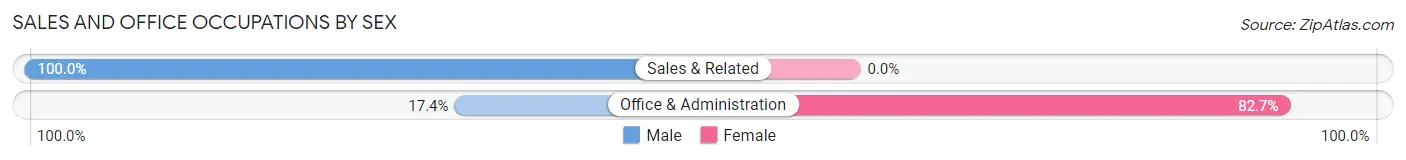
| Occupation | Male | Female |
| Sales & Related | 157 (100.0%) | 0 (0.0%) |
| Office & Administration | 17 (17.3%) | 81 (82.7%) |
| Total (Category) | 174 (68.2%) | 81 (31.8%) |
| Total (Overall) | 903 (54.0%) | 768 (46.0%) |
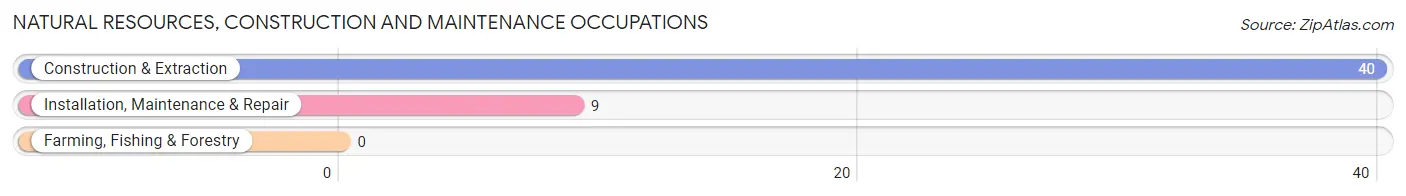
Natural Resources, Construction and Maintenance Occupations
The most common Natural Resources, Construction and Maintenance occupations in South Hempstead are Construction & Extraction (40 | 2.4%), and Installation, Maintenance & Repair (9 | 0.5%).
Natural Resources, Construction and Maintenance Occupations by Sex
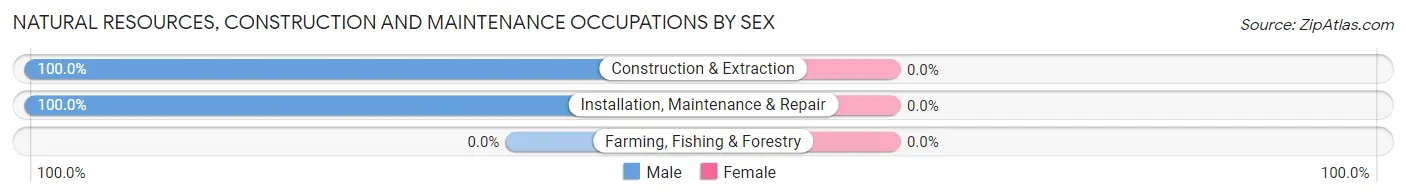
| Occupation | Male | Female |
| Farming, Fishing & Forestry | 0 (0.0%) | 0 (0.0%) |
| Construction & Extraction | 40 (100.0%) | 0 (0.0%) |
| Installation, Maintenance & Repair | 9 (100.0%) | 0 (0.0%) |
| Total (Category) | 49 (100.0%) | 0 (0.0%) |
| Total (Overall) | 903 (54.0%) | 768 (46.0%) |
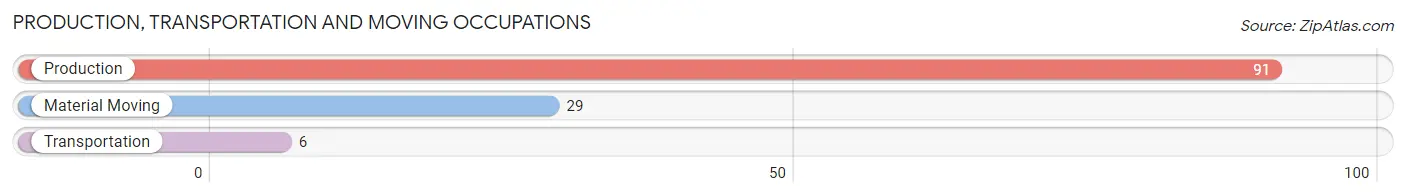
Production, Transportation and Moving Occupations
The most common Production, Transportation and Moving occupations in South Hempstead are Production (91 | 5.4%), Material Moving (29 | 1.7%), and Transportation (6 | 0.4%).
Production, Transportation and Moving Occupations by Sex
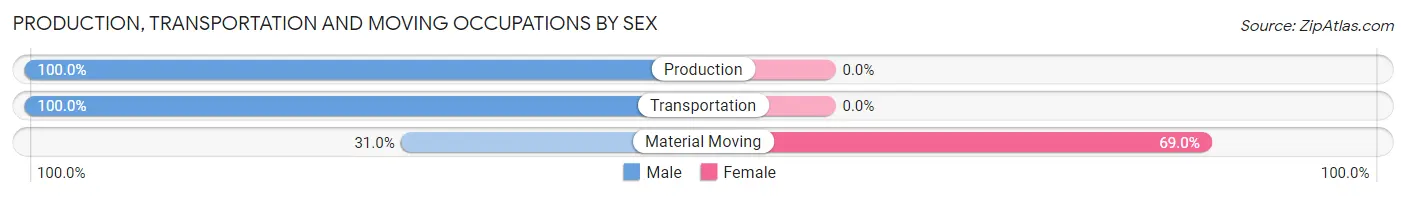
| Occupation | Male | Female |
| Production | 91 (100.0%) | 0 (0.0%) |
| Transportation | 6 (100.0%) | 0 (0.0%) |
| Material Moving | 9 (31.0%) | 20 (69.0%) |
| Total (Category) | 106 (84.1%) | 20 (15.9%) |
| Total (Overall) | 903 (54.0%) | 768 (46.0%) |
Employment Industries by Sex in South Hempstead
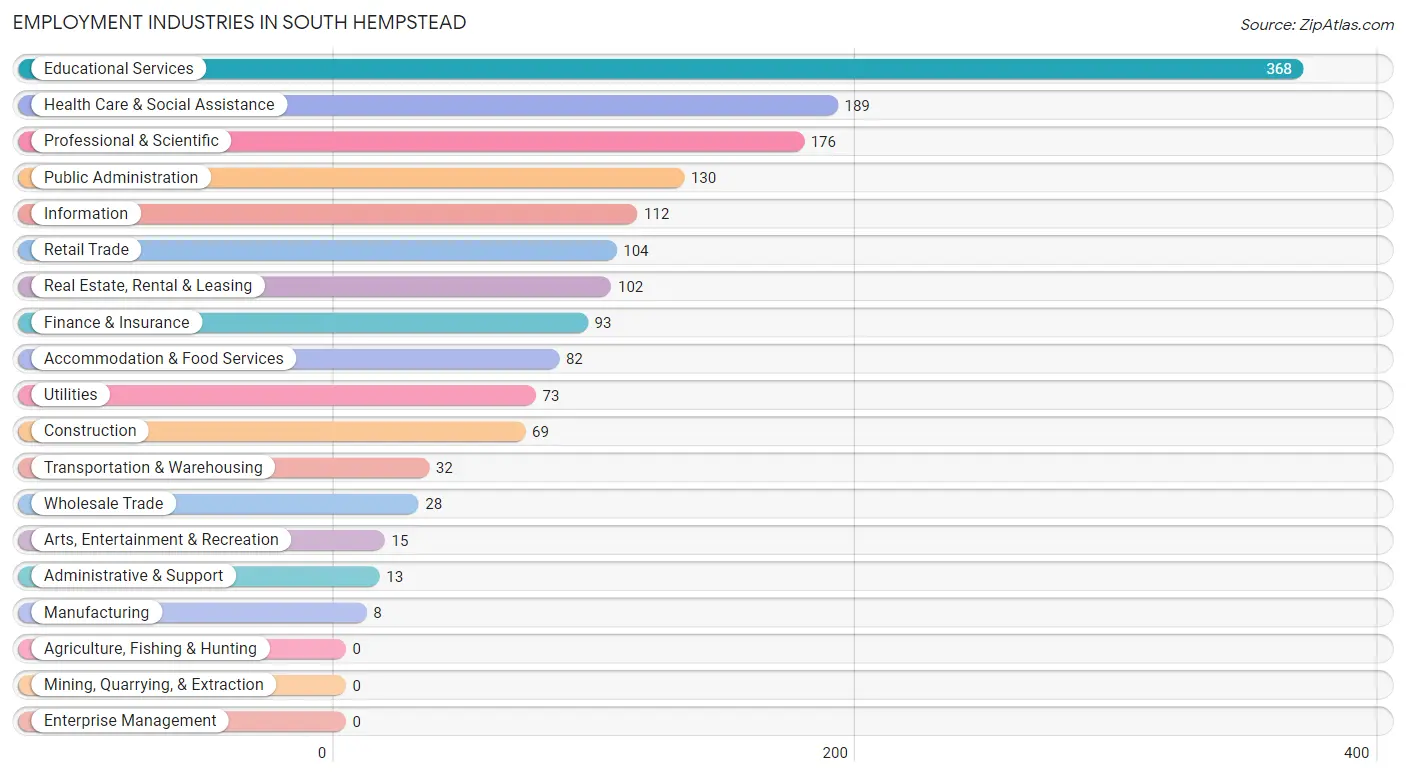
Employment Industries in South Hempstead
The major employment industries in South Hempstead include Educational Services (368 | 22.0%), Health Care & Social Assistance (189 | 11.3%), Professional & Scientific (176 | 10.5%), Public Administration (130 | 7.8%), and Information (112 | 6.7%).
Employment Industries by Sex in South Hempstead
The South Hempstead industries that see more men than women are Manufacturing (100.0%), Wholesale Trade (100.0%), and Utilities (100.0%), whereas the industries that tend to have a higher number of women are Health Care & Social Assistance (96.8%), Finance & Insurance (65.6%), and Educational Services (64.9%).
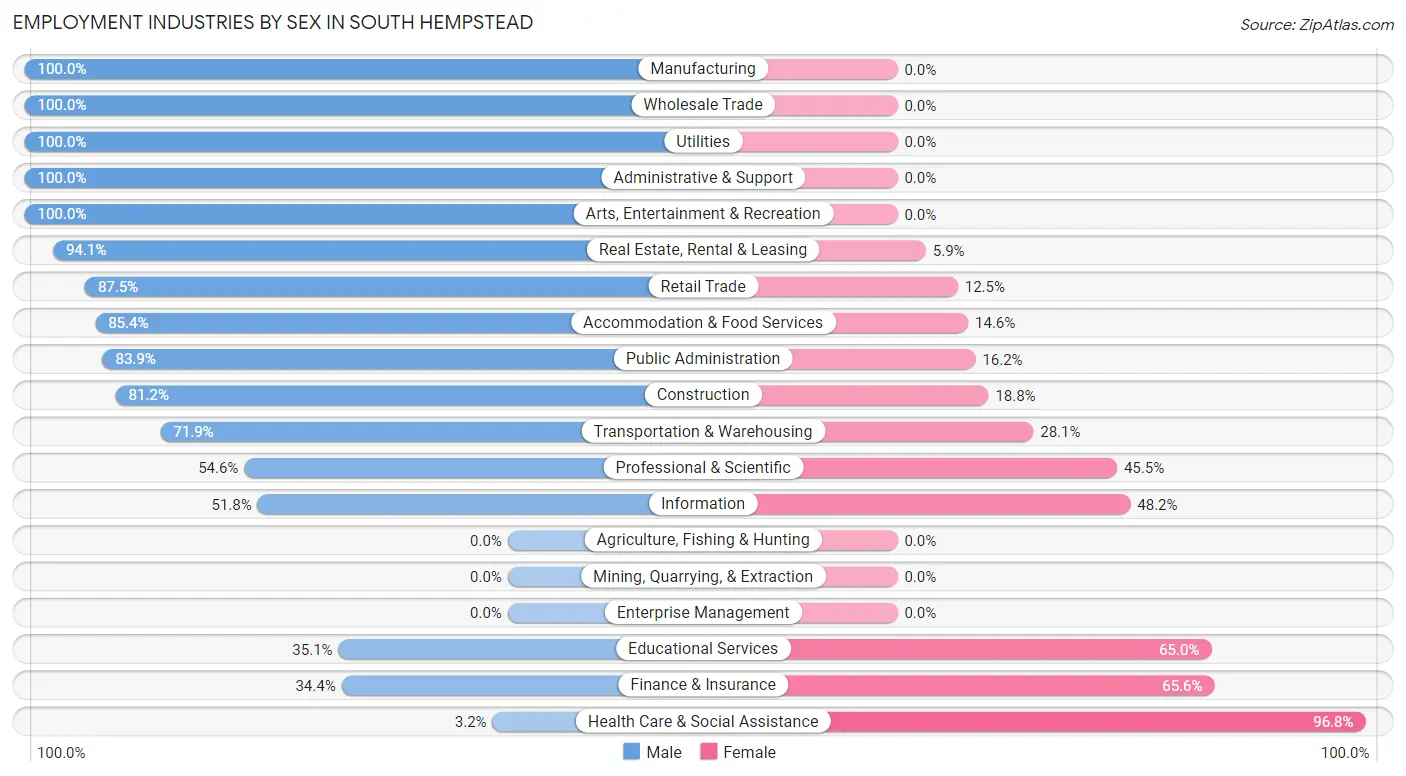
| Industry | Male | Female |
| Agriculture, Fishing & Hunting | 0 (0.0%) | 0 (0.0%) |
| Mining, Quarrying, & Extraction | 0 (0.0%) | 0 (0.0%) |
| Construction | 56 (81.2%) | 13 (18.8%) |
| Manufacturing | 8 (100.0%) | 0 (0.0%) |
| Wholesale Trade | 28 (100.0%) | 0 (0.0%) |
| Retail Trade | 91 (87.5%) | 13 (12.5%) |
| Transportation & Warehousing | 23 (71.9%) | 9 (28.1%) |
| Utilities | 73 (100.0%) | 0 (0.0%) |
| Information | 58 (51.8%) | 54 (48.2%) |
| Finance & Insurance | 32 (34.4%) | 61 (65.6%) |
| Real Estate, Rental & Leasing | 96 (94.1%) | 6 (5.9%) |
| Professional & Scientific | 96 (54.5%) | 80 (45.5%) |
| Enterprise Management | 0 (0.0%) | 0 (0.0%) |
| Administrative & Support | 13 (100.0%) | 0 (0.0%) |
| Educational Services | 129 (35.0%) | 239 (64.9%) |
| Health Care & Social Assistance | 6 (3.2%) | 183 (96.8%) |
| Arts, Entertainment & Recreation | 15 (100.0%) | 0 (0.0%) |
| Accommodation & Food Services | 70 (85.4%) | 12 (14.6%) |
| Public Administration | 109 (83.9%) | 21 (16.2%) |
| Total | 903 (54.0%) | 768 (46.0%) |
Education in South Hempstead
School Enrollment in South Hempstead
The most common levels of schooling among the 673 students in South Hempstead are high school (246 | 36.5%), college / undergraduate (163 | 24.2%), and middle school (107 | 15.9%).
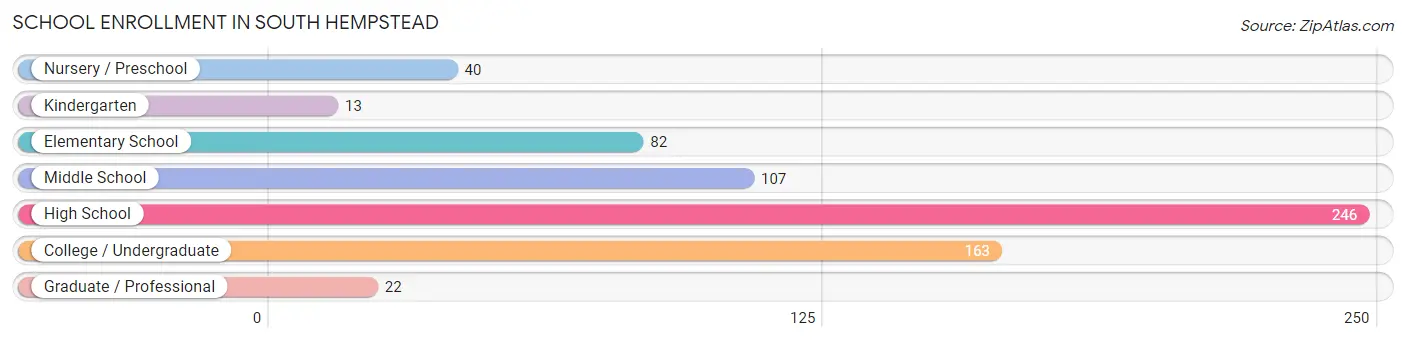
| School Level | # Students | % Students |
| Nursery / Preschool | 40 | 5.9% |
| Kindergarten | 13 | 1.9% |
| Elementary School | 82 | 12.2% |
| Middle School | 107 | 15.9% |
| High School | 246 | 36.5% |
| College / Undergraduate | 163 | 24.2% |
| Graduate / Professional | 22 | 3.3% |
| Total | 673 | 100.0% |
School Enrollment by Age by Funding Source in South Hempstead
Out of a total of 673 students who are enrolled in schools in South Hempstead, 236 (35.1%) attend a private institution, while the remaining 437 (64.9%) are enrolled in public schools. The age group of 35 years and over has the highest likelihood of being enrolled in private schools, with 46 (95.8% in the age bracket) enrolled. Conversely, the age group of 5 to 9 year old has the lowest likelihood of being enrolled in a private school, with 95 (100.0% in the age bracket) attending a public institution.
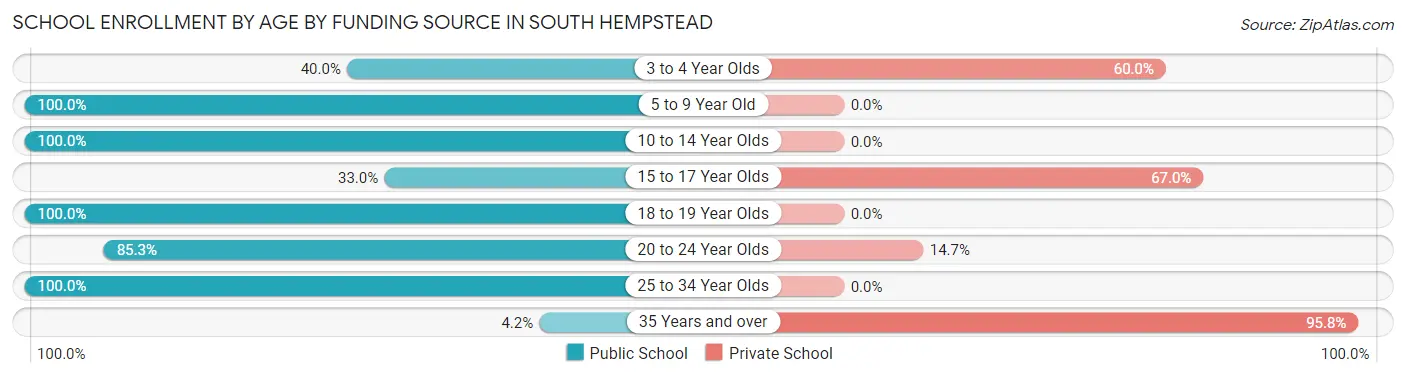
| Age Bracket | Public School | Private School |
| 3 to 4 Year Olds | 16 (40.0%) | 24 (60.0%) |
| 5 to 9 Year Old | 95 (100.0%) | 0 (0.0%) |
| 10 to 14 Year Olds | 124 (100.0%) | 0 (0.0%) |
| 15 to 17 Year Olds | 75 (33.0%) | 152 (67.0%) |
| 18 to 19 Year Olds | 39 (100.0%) | 0 (0.0%) |
| 20 to 24 Year Olds | 81 (85.3%) | 14 (14.7%) |
| 25 to 34 Year Olds | 5 (100.0%) | 0 (0.0%) |
| 35 Years and over | 2 (4.2%) | 46 (95.8%) |
| Total | 437 (64.9%) | 236 (35.1%) |
Educational Attainment by Field of Study in South Hempstead
Business (407 | 32.4%), education (235 | 18.7%), arts & humanities (110 | 8.7%), social sciences (90 | 7.1%), and science & technology (67 | 5.3%) are the most common fields of study among 1,258 individuals in South Hempstead who have obtained a bachelor's degree or higher.
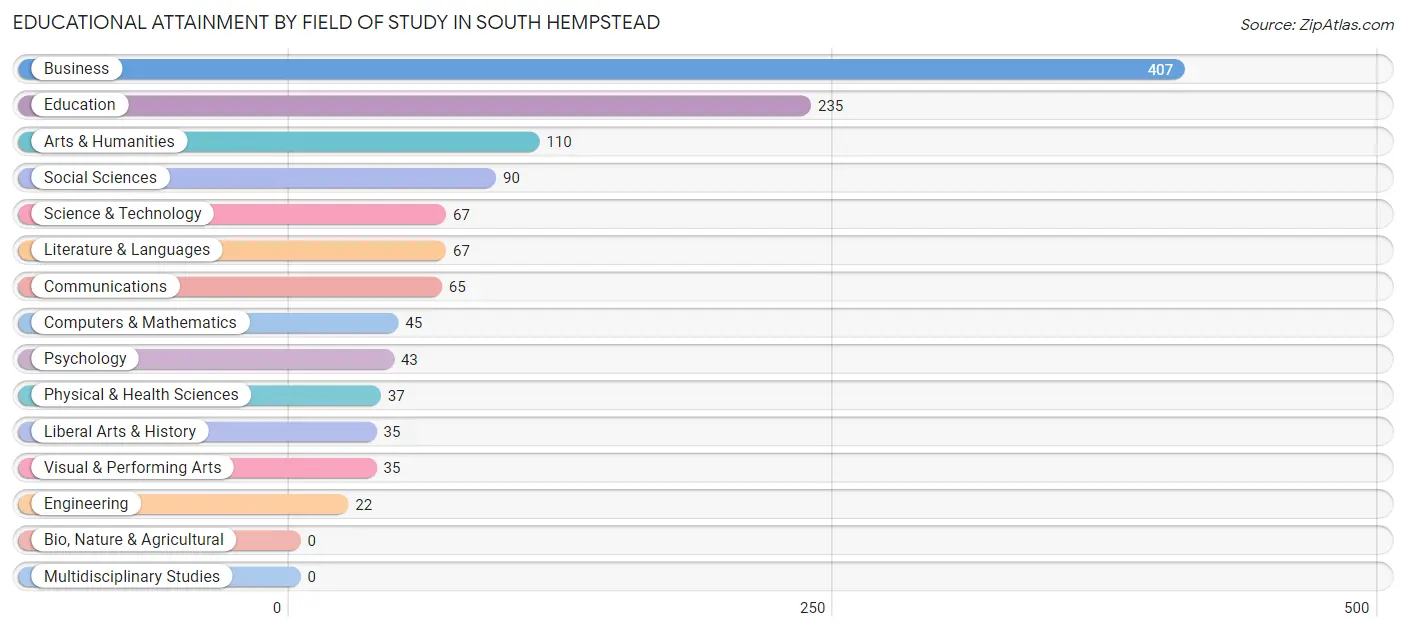
| Field of Study | # Graduates | % Graduates |
| Computers & Mathematics | 45 | 3.6% |
| Bio, Nature & Agricultural | 0 | 0.0% |
| Physical & Health Sciences | 37 | 2.9% |
| Psychology | 43 | 3.4% |
| Social Sciences | 90 | 7.1% |
| Engineering | 22 | 1.8% |
| Multidisciplinary Studies | 0 | 0.0% |
| Science & Technology | 67 | 5.3% |
| Business | 407 | 32.4% |
| Education | 235 | 18.7% |
| Literature & Languages | 67 | 5.3% |
| Liberal Arts & History | 35 | 2.8% |
| Visual & Performing Arts | 35 | 2.8% |
| Communications | 65 | 5.2% |
| Arts & Humanities | 110 | 8.7% |
| Total | 1,258 | 100.0% |
Transportation & Commute in South Hempstead
Vehicle Availability by Sex in South Hempstead
The most prevalent vehicle ownership categories in South Hempstead are males with 2 vehicles (308, accounting for 34.1%) and females with 2 vehicles (297, making up 41.6%).
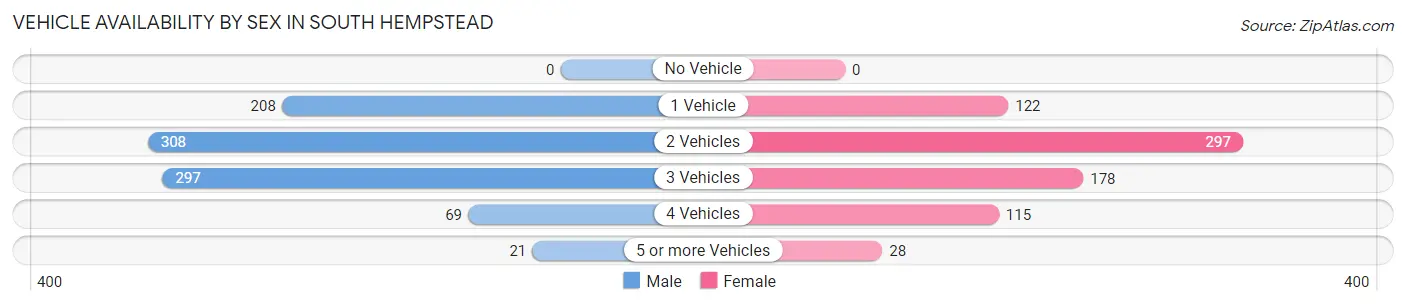
| Vehicles Available | Male | Female |
| No Vehicle | 0 (0.0%) | 0 (0.0%) |
| 1 Vehicle | 208 (23.0%) | 122 (16.5%) |
| 2 Vehicles | 308 (34.1%) | 297 (40.1%) |
| 3 Vehicles | 297 (32.9%) | 178 (24.0%) |
| 4 Vehicles | 69 (7.6%) | 115 (15.5%) |
| 5 or more Vehicles | 21 (2.3%) | 28 (3.8%) |
| Total | 903 (100.0%) | 740 (100.0%) |
Commute Time in South Hempstead
The most frequently occuring commute durations in South Hempstead are 15 to 19 minutes (368 commuters, 24.6%), 5 to 9 minutes (203 commuters, 13.6%), and 60 to 89 minutes (181 commuters, 12.1%).
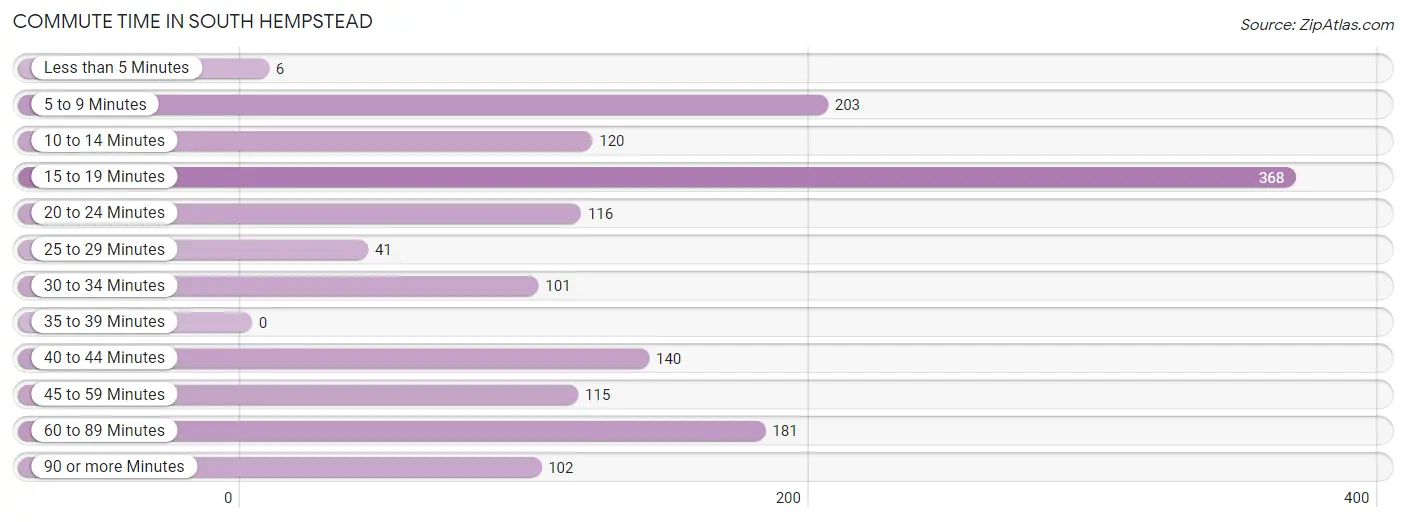
| Commute Time | # Commuters | % Commuters |
| Less than 5 Minutes | 6 | 0.4% |
| 5 to 9 Minutes | 203 | 13.6% |
| 10 to 14 Minutes | 120 | 8.0% |
| 15 to 19 Minutes | 368 | 24.6% |
| 20 to 24 Minutes | 116 | 7.8% |
| 25 to 29 Minutes | 41 | 2.8% |
| 30 to 34 Minutes | 101 | 6.8% |
| 35 to 39 Minutes | 0 | 0.0% |
| 40 to 44 Minutes | 140 | 9.4% |
| 45 to 59 Minutes | 115 | 7.7% |
| 60 to 89 Minutes | 181 | 12.1% |
| 90 or more Minutes | 102 | 6.8% |
Commute Time by Sex in South Hempstead
The most common commute times in South Hempstead are 15 to 19 minutes (188 commuters, 22.7%) for males and 15 to 19 minutes (180 commuters, 27.1%) for females.
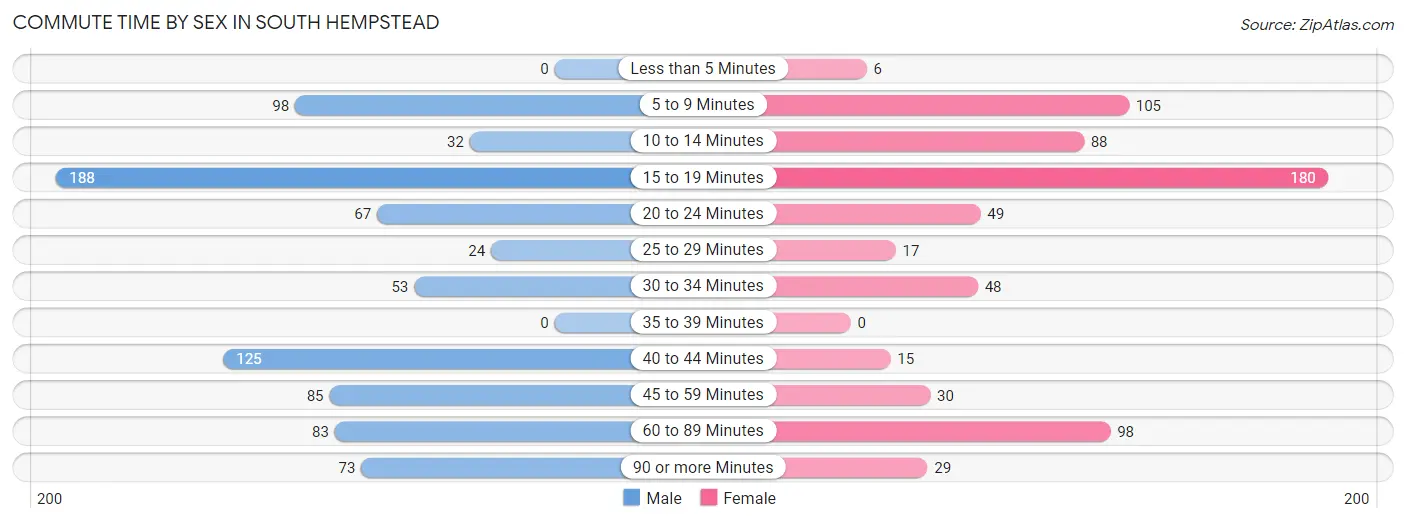
| Commute Time | Male | Female |
| Less than 5 Minutes | 0 (0.0%) | 6 (0.9%) |
| 5 to 9 Minutes | 98 (11.8%) | 105 (15.8%) |
| 10 to 14 Minutes | 32 (3.9%) | 88 (13.2%) |
| 15 to 19 Minutes | 188 (22.7%) | 180 (27.1%) |
| 20 to 24 Minutes | 67 (8.1%) | 49 (7.4%) |
| 25 to 29 Minutes | 24 (2.9%) | 17 (2.6%) |
| 30 to 34 Minutes | 53 (6.4%) | 48 (7.2%) |
| 35 to 39 Minutes | 0 (0.0%) | 0 (0.0%) |
| 40 to 44 Minutes | 125 (15.1%) | 15 (2.3%) |
| 45 to 59 Minutes | 85 (10.3%) | 30 (4.5%) |
| 60 to 89 Minutes | 83 (10.0%) | 98 (14.7%) |
| 90 or more Minutes | 73 (8.8%) | 29 (4.4%) |
Time of Departure to Work by Sex in South Hempstead
The most frequent times of departure to work in South Hempstead are 7:00 AM to 7:29 AM (225, 27.2%) for males and 7:00 AM to 7:29 AM (132, 19.9%) for females.
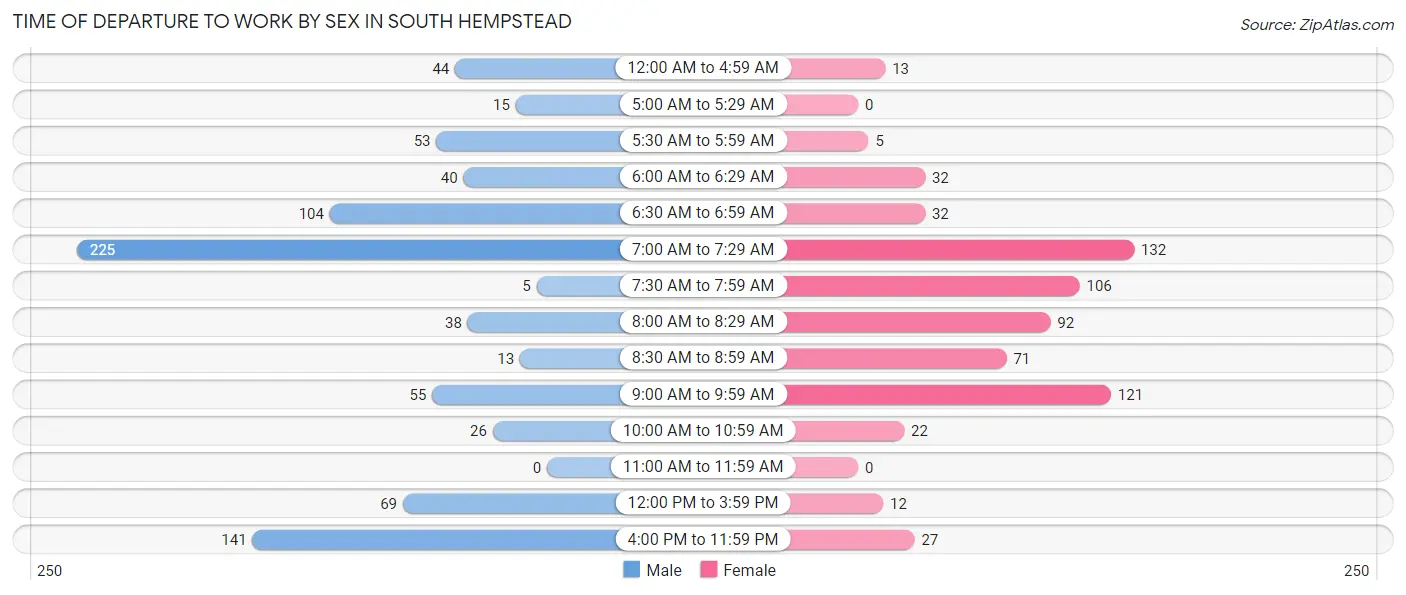
| Time of Departure | Male | Female |
| 12:00 AM to 4:59 AM | 44 (5.3%) | 13 (1.9%) |
| 5:00 AM to 5:29 AM | 15 (1.8%) | 0 (0.0%) |
| 5:30 AM to 5:59 AM | 53 (6.4%) | 5 (0.7%) |
| 6:00 AM to 6:29 AM | 40 (4.8%) | 32 (4.8%) |
| 6:30 AM to 6:59 AM | 104 (12.6%) | 32 (4.8%) |
| 7:00 AM to 7:29 AM | 225 (27.2%) | 132 (19.9%) |
| 7:30 AM to 7:59 AM | 5 (0.6%) | 106 (15.9%) |
| 8:00 AM to 8:29 AM | 38 (4.6%) | 92 (13.8%) |
| 8:30 AM to 8:59 AM | 13 (1.6%) | 71 (10.7%) |
| 9:00 AM to 9:59 AM | 55 (6.6%) | 121 (18.2%) |
| 10:00 AM to 10:59 AM | 26 (3.1%) | 22 (3.3%) |
| 11:00 AM to 11:59 AM | 0 (0.0%) | 0 (0.0%) |
| 12:00 PM to 3:59 PM | 69 (8.3%) | 12 (1.8%) |
| 4:00 PM to 11:59 PM | 141 (17.0%) | 27 (4.1%) |
| Total | 828 (100.0%) | 665 (100.0%) |
Housing Occupancy in South Hempstead
Occupancy by Ownership in South Hempstead
Of the total 1,138 dwellings in South Hempstead, owner-occupied units account for 1,099 (96.6%), while renter-occupied units make up 39 (3.4%).
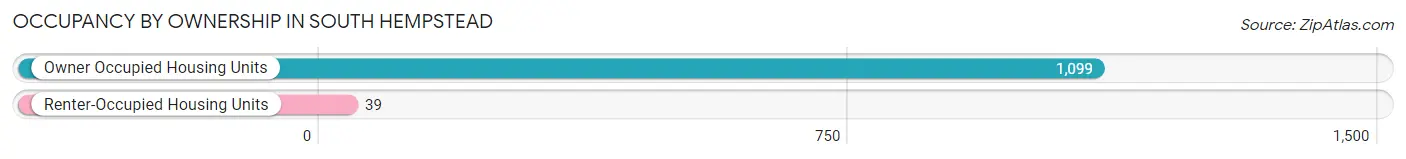
| Occupancy | # Housing Units | % Housing Units |
| Owner Occupied Housing Units | 1,099 | 96.6% |
| Renter-Occupied Housing Units | 39 | 3.4% |
| Total Occupied Housing Units | 1,138 | 100.0% |
Occupancy by Household Size in South Hempstead
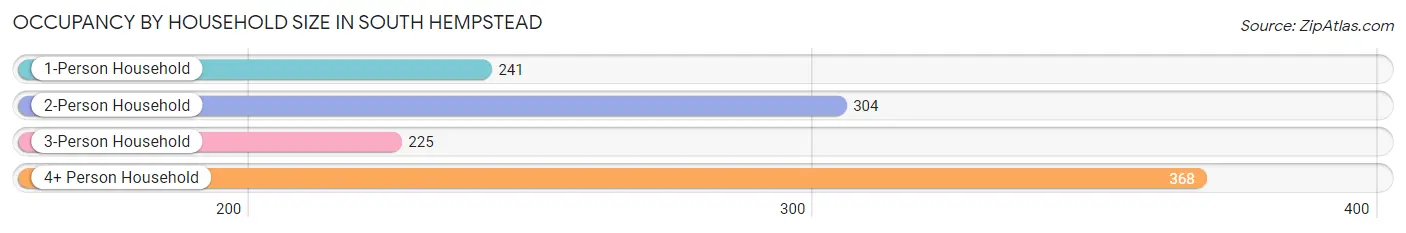
| Household Size | # Housing Units | % Housing Units |
| 1-Person Household | 241 | 21.2% |
| 2-Person Household | 304 | 26.7% |
| 3-Person Household | 225 | 19.8% |
| 4+ Person Household | 368 | 32.3% |
| Total Housing Units | 1,138 | 100.0% |
Occupancy by Ownership by Household Size in South Hempstead
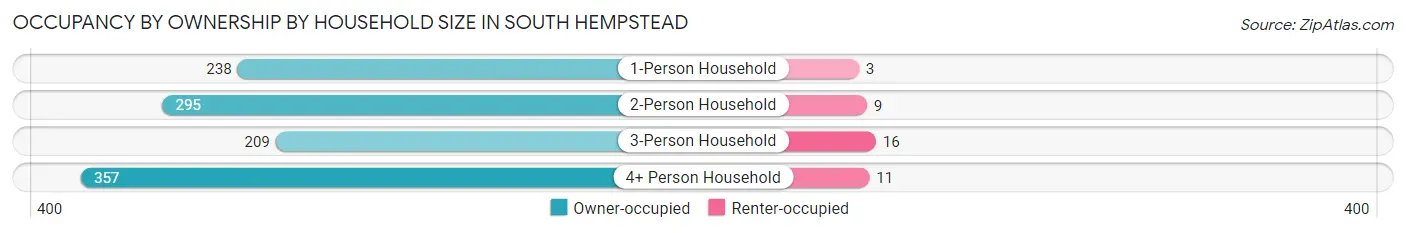
| Household Size | Owner-occupied | Renter-occupied |
| 1-Person Household | 238 (98.8%) | 3 (1.2%) |
| 2-Person Household | 295 (97.0%) | 9 (3.0%) |
| 3-Person Household | 209 (92.9%) | 16 (7.1%) |
| 4+ Person Household | 357 (97.0%) | 11 (3.0%) |
| Total Housing Units | 1,099 (96.6%) | 39 (3.4%) |
Occupancy by Educational Attainment in South Hempstead
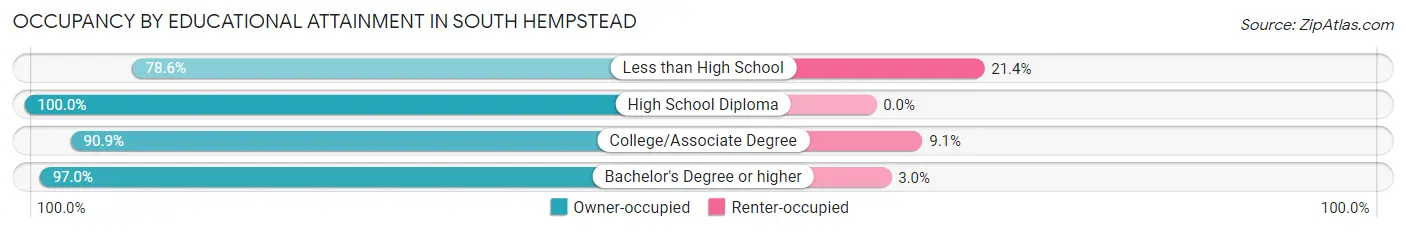
| Household Size | Owner-occupied | Renter-occupied |
| Less than High School | 11 (78.6%) | 3 (21.4%) |
| High School Diploma | 305 (100.0%) | 0 (0.0%) |
| College/Associate Degree | 169 (90.9%) | 17 (9.1%) |
| Bachelor's Degree or higher | 614 (97.0%) | 19 (3.0%) |
Occupancy by Age of Householder in South Hempstead

| Age Bracket | # Households | % Households |
| Under 35 Years | 137 | 12.0% |
| 35 to 44 Years | 129 | 11.3% |
| 45 to 54 Years | 245 | 21.5% |
| 55 to 64 Years | 330 | 29.0% |
| 65 to 74 Years | 127 | 11.2% |
| 75 to 84 Years | 76 | 6.7% |
| 85 Years and Over | 94 | 8.3% |
| Total | 1,138 | 100.0% |
Housing Finances in South Hempstead
Median Income by Occupancy in South Hempstead
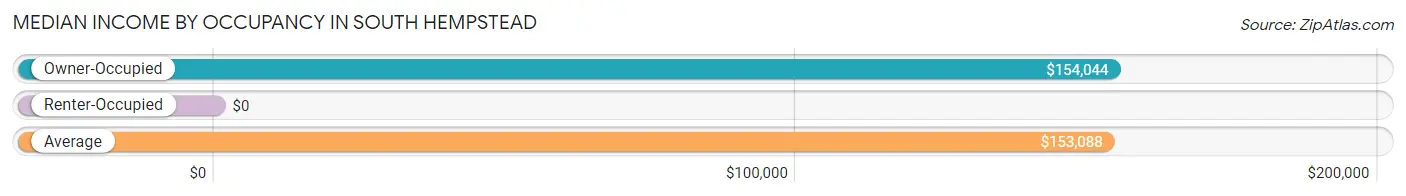
| Occupancy Type | # Households | Median Income |
| Owner-Occupied | 1,099 (96.6%) | $154,044 |
| Renter-Occupied | 39 (3.4%) | $0 |
| Average | 1,138 (100.0%) | $153,088 |
Occupancy by Householder Income Bracket in South Hempstead
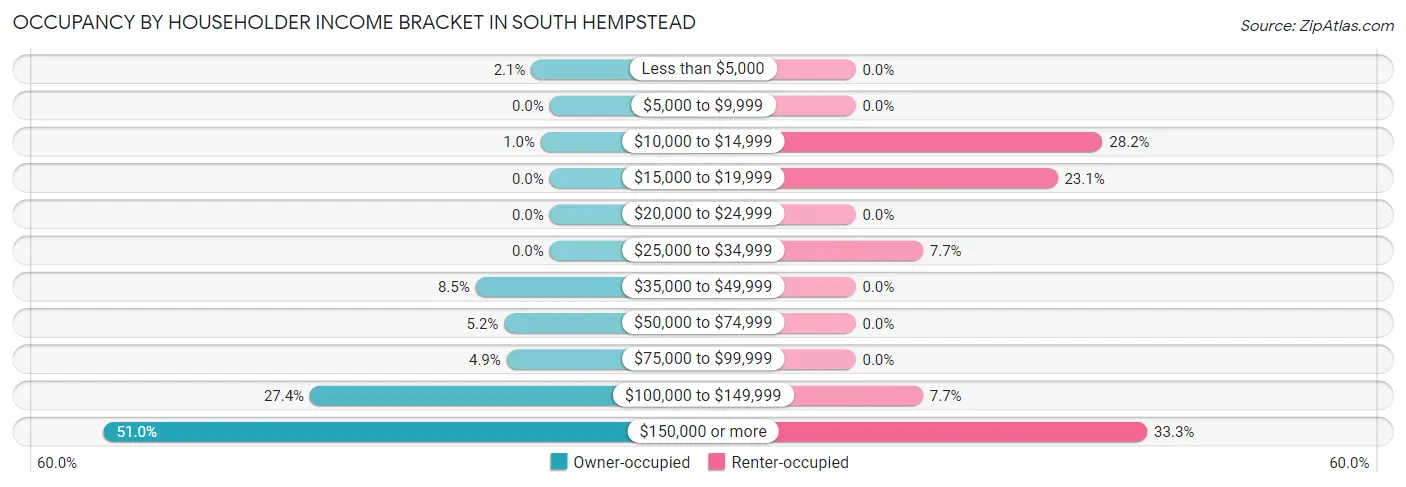
| Income Bracket | Owner-occupied | Renter-occupied |
| Less than $5,000 | 23 (2.1%) | 0 (0.0%) |
| $5,000 to $9,999 | 0 (0.0%) | 0 (0.0%) |
| $10,000 to $14,999 | 11 (1.0%) | 11 (28.2%) |
| $15,000 to $19,999 | 0 (0.0%) | 9 (23.1%) |
| $20,000 to $24,999 | 0 (0.0%) | 0 (0.0%) |
| $25,000 to $34,999 | 0 (0.0%) | 3 (7.7%) |
| $35,000 to $49,999 | 93 (8.5%) | 0 (0.0%) |
| $50,000 to $74,999 | 57 (5.2%) | 0 (0.0%) |
| $75,000 to $99,999 | 54 (4.9%) | 0 (0.0%) |
| $100,000 to $149,999 | 301 (27.4%) | 3 (7.7%) |
| $150,000 or more | 560 (51.0%) | 13 (33.3%) |
| Total | 1,099 (100.0%) | 39 (100.0%) |
Monthly Housing Cost Tiers in South Hempstead
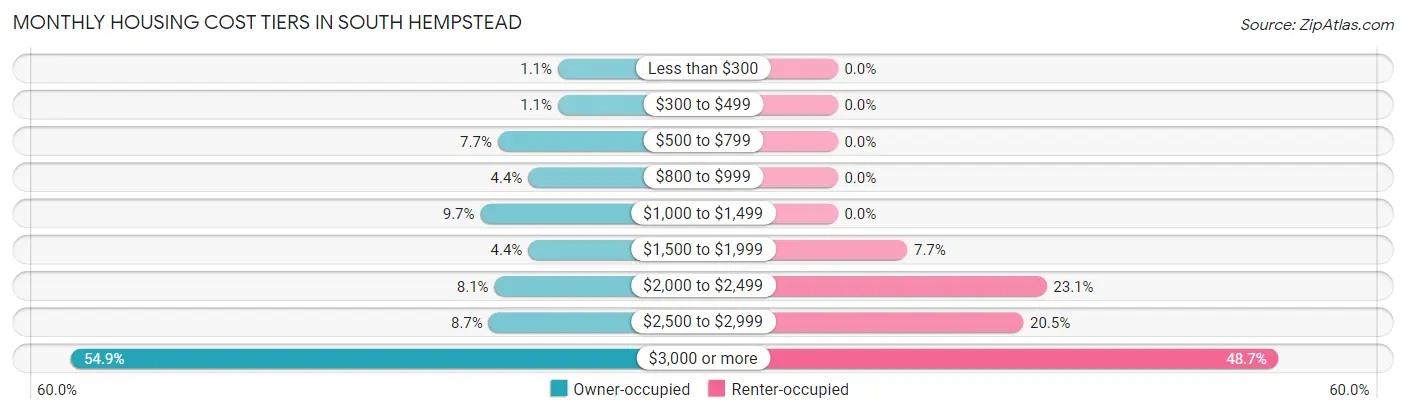
| Monthly Cost | Owner-occupied | Renter-occupied |
| Less than $300 | 12 (1.1%) | 0 (0.0%) |
| $300 to $499 | 12 (1.1%) | 0 (0.0%) |
| $500 to $799 | 85 (7.7%) | 0 (0.0%) |
| $800 to $999 | 48 (4.4%) | 0 (0.0%) |
| $1,000 to $1,499 | 106 (9.7%) | 0 (0.0%) |
| $1,500 to $1,999 | 48 (4.4%) | 3 (7.7%) |
| $2,000 to $2,499 | 89 (8.1%) | 9 (23.1%) |
| $2,500 to $2,999 | 96 (8.7%) | 8 (20.5%) |
| $3,000 or more | 603 (54.9%) | 19 (48.7%) |
| Total | 1,099 (100.0%) | 39 (100.0%) |
Physical Housing Characteristics in South Hempstead
Housing Structures in South Hempstead
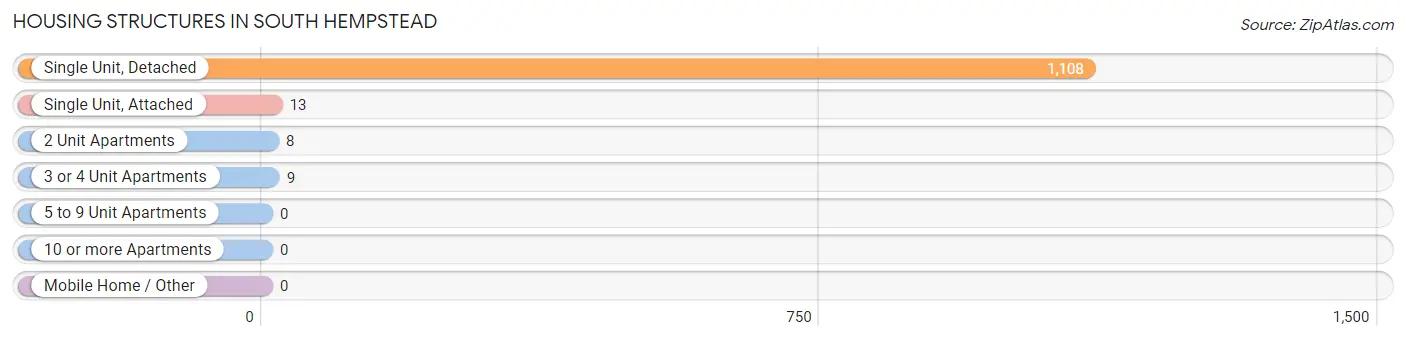
| Structure Type | # Housing Units | % Housing Units |
| Single Unit, Detached | 1,108 | 97.4% |
| Single Unit, Attached | 13 | 1.1% |
| 2 Unit Apartments | 8 | 0.7% |
| 3 or 4 Unit Apartments | 9 | 0.8% |
| 5 to 9 Unit Apartments | 0 | 0.0% |
| 10 or more Apartments | 0 | 0.0% |
| Mobile Home / Other | 0 | 0.0% |
| Total | 1,138 | 100.0% |
Housing Structures by Occupancy in South Hempstead
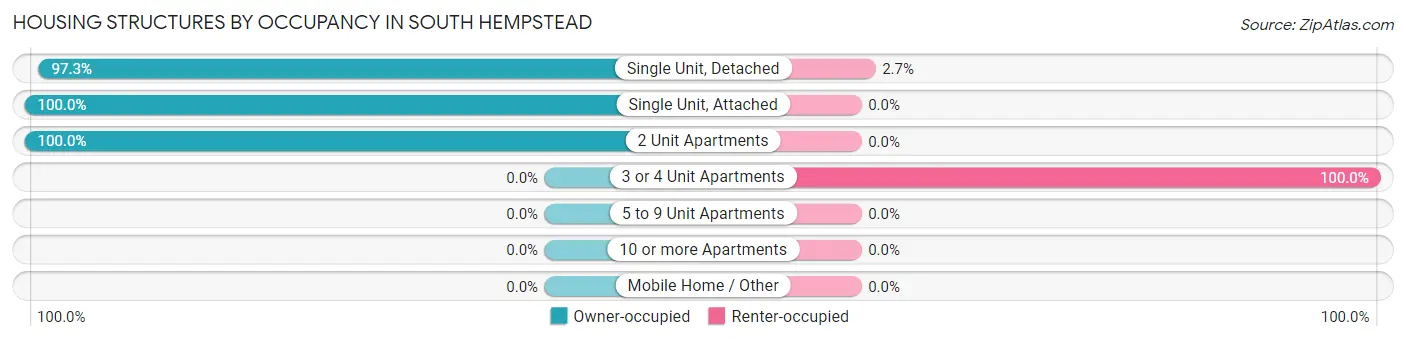
| Structure Type | Owner-occupied | Renter-occupied |
| Single Unit, Detached | 1,078 (97.3%) | 30 (2.7%) |
| Single Unit, Attached | 13 (100.0%) | 0 (0.0%) |
| 2 Unit Apartments | 8 (100.0%) | 0 (0.0%) |
| 3 or 4 Unit Apartments | 0 (0.0%) | 9 (100.0%) |
| 5 to 9 Unit Apartments | 0 (0.0%) | 0 (0.0%) |
| 10 or more Apartments | 0 (0.0%) | 0 (0.0%) |
| Mobile Home / Other | 0 (0.0%) | 0 (0.0%) |
| Total | 1,099 (96.6%) | 39 (3.4%) |
Housing Structures by Number of Rooms in South Hempstead
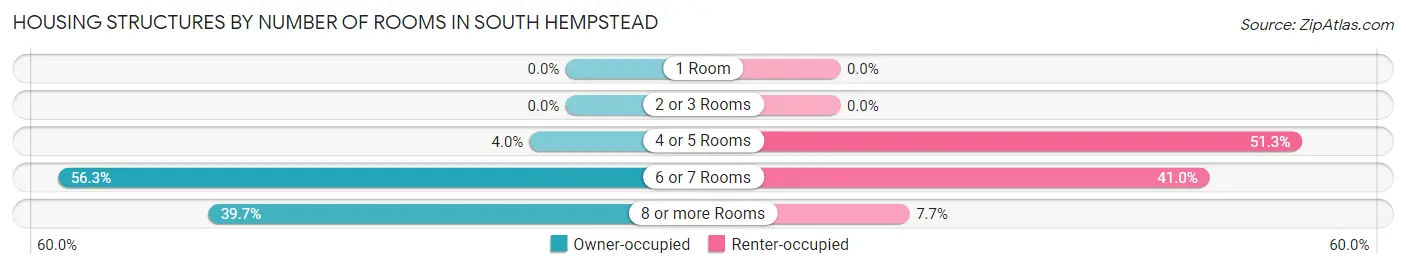
| Number of Rooms | Owner-occupied | Renter-occupied |
| 1 Room | 0 (0.0%) | 0 (0.0%) |
| 2 or 3 Rooms | 0 (0.0%) | 0 (0.0%) |
| 4 or 5 Rooms | 44 (4.0%) | 20 (51.3%) |
| 6 or 7 Rooms | 619 (56.3%) | 16 (41.0%) |
| 8 or more Rooms | 436 (39.7%) | 3 (7.7%) |
| Total | 1,099 (100.0%) | 39 (100.0%) |
Housing Structure by Heating Type in South Hempstead
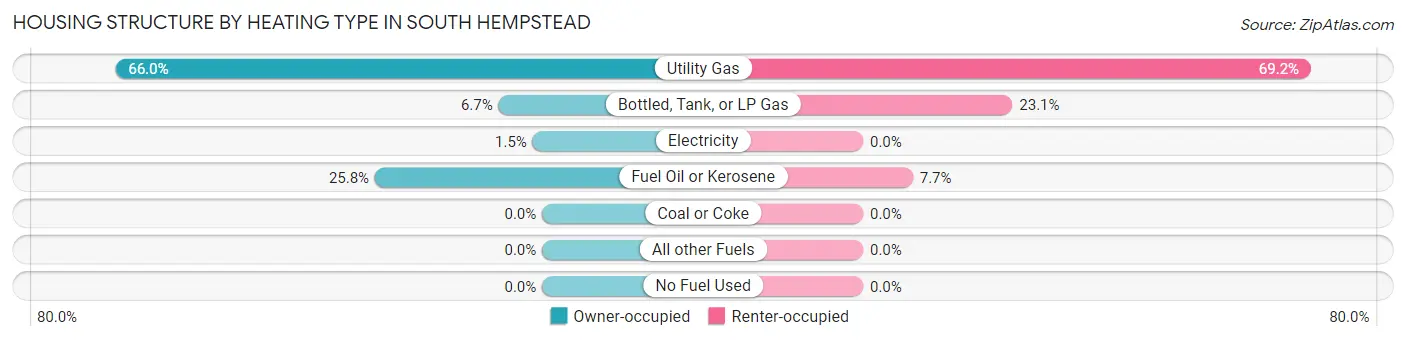
| Heating Type | Owner-occupied | Renter-occupied |
| Utility Gas | 725 (66.0%) | 27 (69.2%) |
| Bottled, Tank, or LP Gas | 74 (6.7%) | 9 (23.1%) |
| Electricity | 16 (1.5%) | 0 (0.0%) |
| Fuel Oil or Kerosene | 284 (25.8%) | 3 (7.7%) |
| Coal or Coke | 0 (0.0%) | 0 (0.0%) |
| All other Fuels | 0 (0.0%) | 0 (0.0%) |
| No Fuel Used | 0 (0.0%) | 0 (0.0%) |
| Total | 1,099 (100.0%) | 39 (100.0%) |
Household Vehicle Usage in South Hempstead

| Vehicles per Household | Owner-occupied | Renter-occupied |
| No Vehicle | 11 (1.0%) | 0 (0.0%) |
| 1 Vehicle | 459 (41.8%) | 25 (64.1%) |
| 2 Vehicles | 322 (29.3%) | 14 (35.9%) |
| 3 or more Vehicles | 307 (27.9%) | 0 (0.0%) |
| Total | 1,099 (100.0%) | 39 (100.0%) |
Real Estate & Mortgages in South Hempstead
Real Estate and Mortgage Overview in South Hempstead
| Characteristic | Without Mortgage | With Mortgage |
| Housing Units | 372 | 727 |
| Median Property Value | $497,700 | $596,500 |
| Median Household Income | $122,083 | $397 |
| Monthly Housing Costs | $1,405 | $571 |
| Real Estate Taxes | $10,001 | $0 |
Property Value by Mortgage Status in South Hempstead
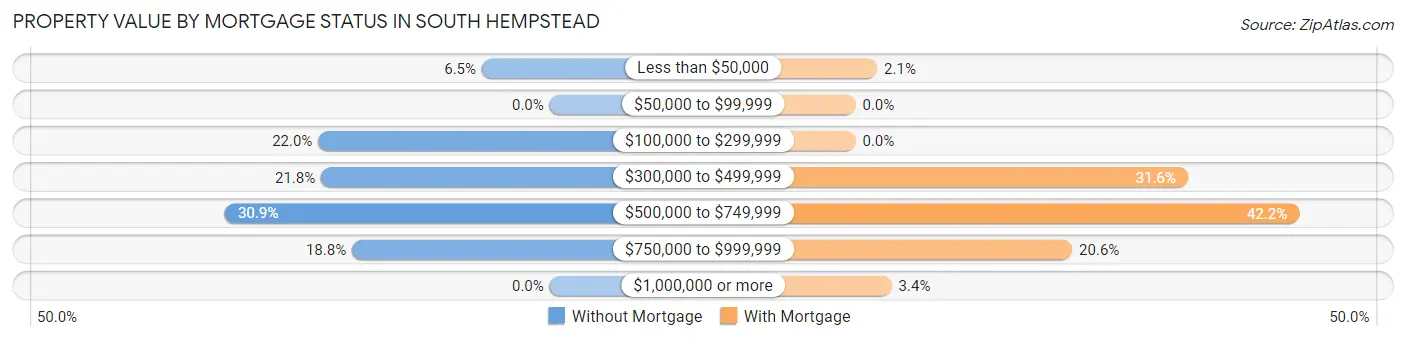
| Property Value | Without Mortgage | With Mortgage |
| Less than $50,000 | 24 (6.5%) | 15 (2.1%) |
| $50,000 to $99,999 | 0 (0.0%) | 0 (0.0%) |
| $100,000 to $299,999 | 82 (22.0%) | 0 (0.0%) |
| $300,000 to $499,999 | 81 (21.8%) | 230 (31.6%) |
| $500,000 to $749,999 | 115 (30.9%) | 307 (42.2%) |
| $750,000 to $999,999 | 70 (18.8%) | 150 (20.6%) |
| $1,000,000 or more | 0 (0.0%) | 25 (3.4%) |
| Total | 372 (100.0%) | 727 (100.0%) |
Household Income by Mortgage Status in South Hempstead
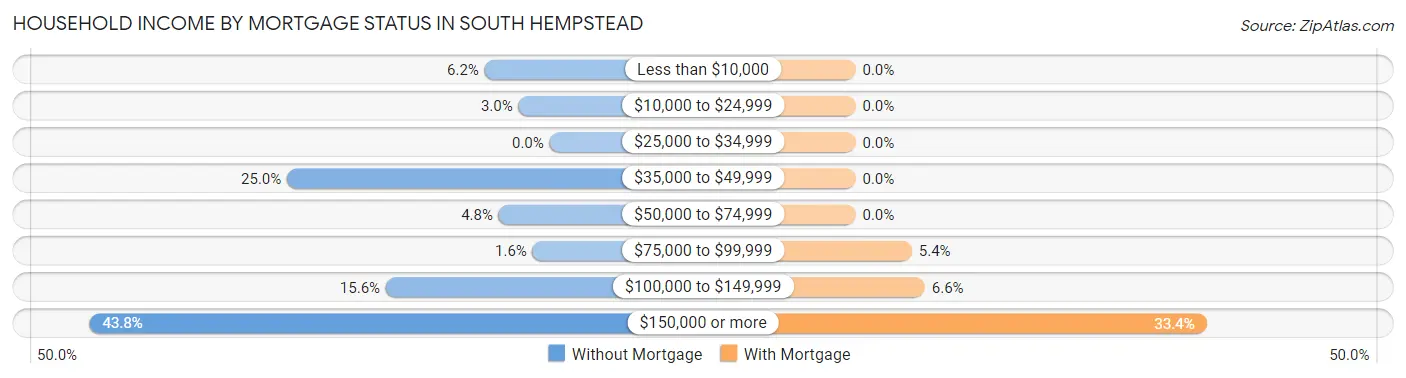
| Household Income | Without Mortgage | With Mortgage |
| Less than $10,000 | 23 (6.2%) | 0 (0.0%) |
| $10,000 to $24,999 | 11 (3.0%) | 0 (0.0%) |
| $25,000 to $34,999 | 0 (0.0%) | 0 (0.0%) |
| $35,000 to $49,999 | 93 (25.0%) | 0 (0.0%) |
| $50,000 to $74,999 | 18 (4.8%) | 0 (0.0%) |
| $75,000 to $99,999 | 6 (1.6%) | 39 (5.4%) |
| $100,000 to $149,999 | 58 (15.6%) | 48 (6.6%) |
| $150,000 or more | 163 (43.8%) | 243 (33.4%) |
| Total | 372 (100.0%) | 727 (100.0%) |
Property Value to Household Income Ratio in South Hempstead
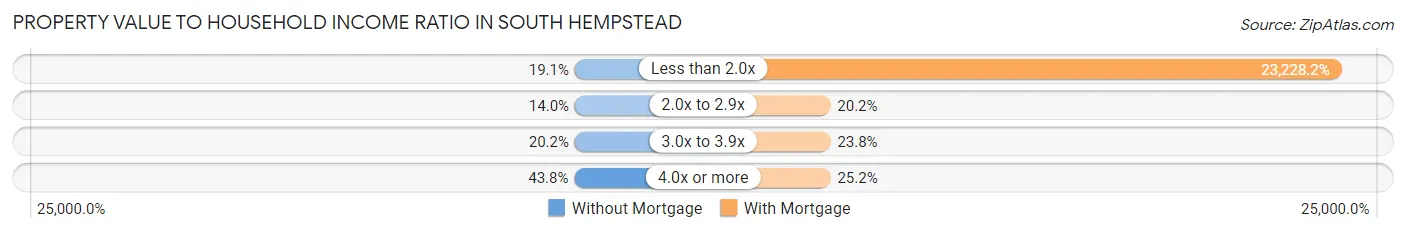
| Value-to-Income Ratio | Without Mortgage | With Mortgage |
| Less than 2.0x | 71 (19.1%) | 168,869 (23,228.2%) |
| 2.0x to 2.9x | 52 (14.0%) | 147 (20.2%) |
| 3.0x to 3.9x | 75 (20.2%) | 173 (23.8%) |
| 4.0x or more | 163 (43.8%) | 183 (25.2%) |
| Total | 372 (100.0%) | 727 (100.0%) |
Real Estate Taxes by Mortgage Status in South Hempstead
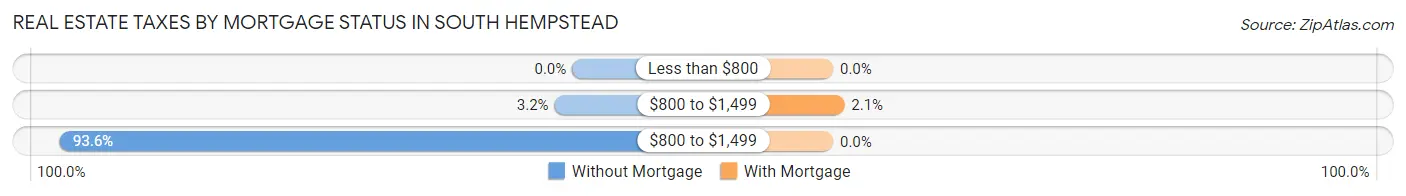
| Property Taxes | Without Mortgage | With Mortgage |
| Less than $800 | 0 (0.0%) | 0 (0.0%) |
| $800 to $1,499 | 12 (3.2%) | 15 (2.1%) |
| $800 to $1,499 | 348 (93.5%) | 0 (0.0%) |
| Total | 372 (100.0%) | 727 (100.0%) |
Health & Disability in South Hempstead
Health Insurance Coverage by Age in South Hempstead
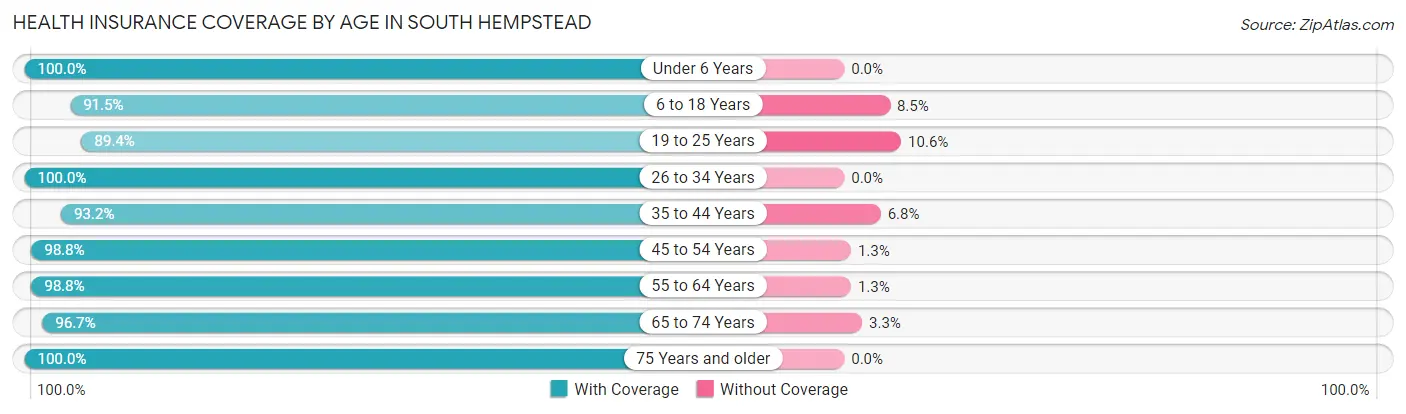
| Age Bracket | With Coverage | Without Coverage |
| Under 6 Years | 191 (100.0%) | 0 (0.0%) |
| 6 to 18 Years | 398 (91.5%) | 37 (8.5%) |
| 19 to 25 Years | 312 (89.4%) | 37 (10.6%) |
| 26 to 34 Years | 349 (100.0%) | 0 (0.0%) |
| 35 to 44 Years | 206 (93.2%) | 15 (6.8%) |
| 45 to 54 Years | 473 (98.8%) | 6 (1.3%) |
| 55 to 64 Years | 552 (98.8%) | 7 (1.3%) |
| 65 to 74 Years | 320 (96.7%) | 11 (3.3%) |
| 75 Years and older | 221 (100.0%) | 0 (0.0%) |
| Total | 3,022 (96.4%) | 113 (3.6%) |
Health Insurance Coverage by Citizenship Status in South Hempstead
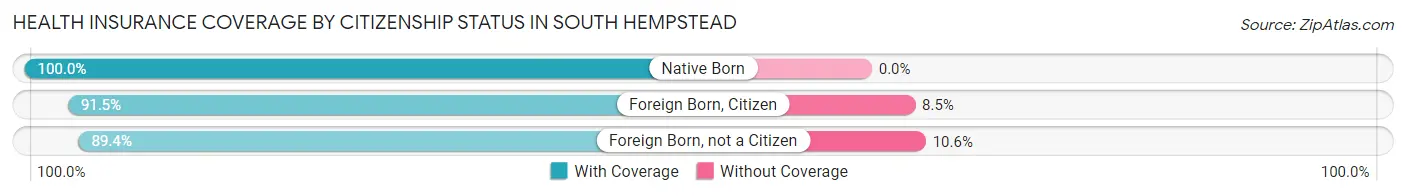
| Citizenship Status | With Coverage | Without Coverage |
| Native Born | 191 (100.0%) | 0 (0.0%) |
| Foreign Born, Citizen | 398 (91.5%) | 37 (8.5%) |
| Foreign Born, not a Citizen | 312 (89.4%) | 37 (10.6%) |
Health Insurance Coverage by Household Income in South Hempstead
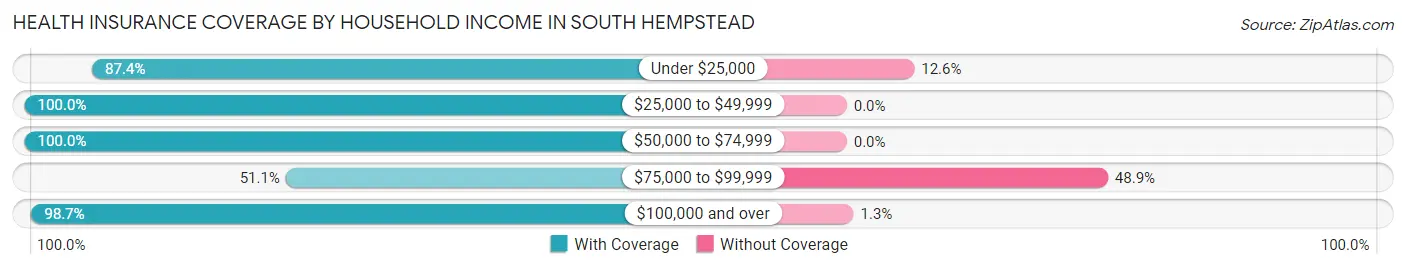
| Household Income | With Coverage | Without Coverage |
| Under $25,000 | 76 (87.4%) | 11 (12.6%) |
| $25,000 to $49,999 | 110 (100.0%) | 0 (0.0%) |
| $50,000 to $74,999 | 116 (100.0%) | 0 (0.0%) |
| $75,000 to $99,999 | 71 (51.1%) | 68 (48.9%) |
| $100,000 and over | 2,649 (98.7%) | 34 (1.3%) |
Public vs Private Health Insurance Coverage by Age in South Hempstead
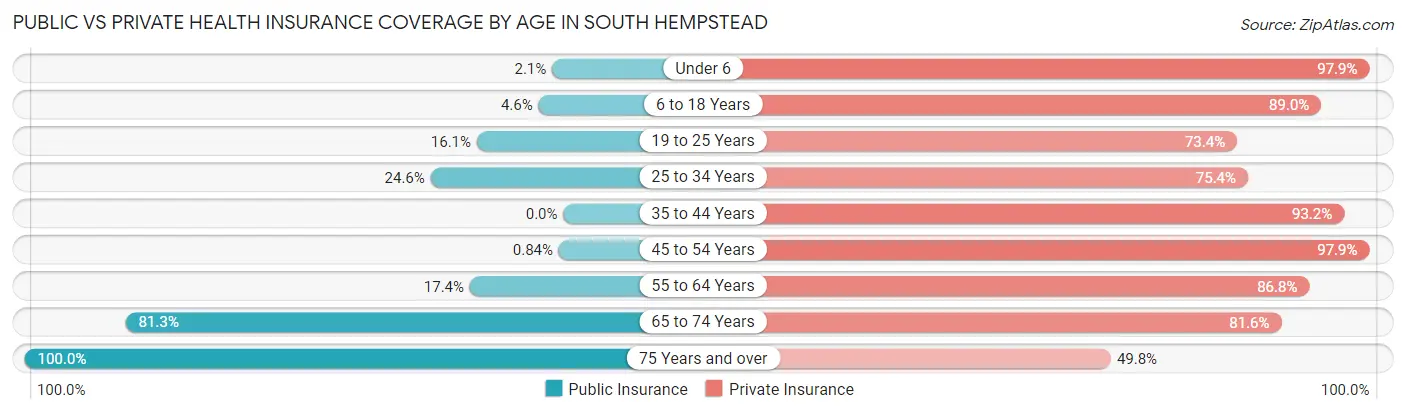
| Age Bracket | Public Insurance | Private Insurance |
| Under 6 | 4 (2.1%) | 187 (97.9%) |
| 6 to 18 Years | 20 (4.6%) | 387 (89.0%) |
| 19 to 25 Years | 56 (16.1%) | 256 (73.4%) |
| 25 to 34 Years | 86 (24.6%) | 263 (75.4%) |
| 35 to 44 Years | 0 (0.0%) | 206 (93.2%) |
| 45 to 54 Years | 4 (0.8%) | 469 (97.9%) |
| 55 to 64 Years | 97 (17.3%) | 485 (86.8%) |
| 65 to 74 Years | 269 (81.3%) | 270 (81.6%) |
| 75 Years and over | 221 (100.0%) | 110 (49.8%) |
| Total | 757 (24.1%) | 2,633 (84.0%) |
Disability Status by Sex by Age in South Hempstead
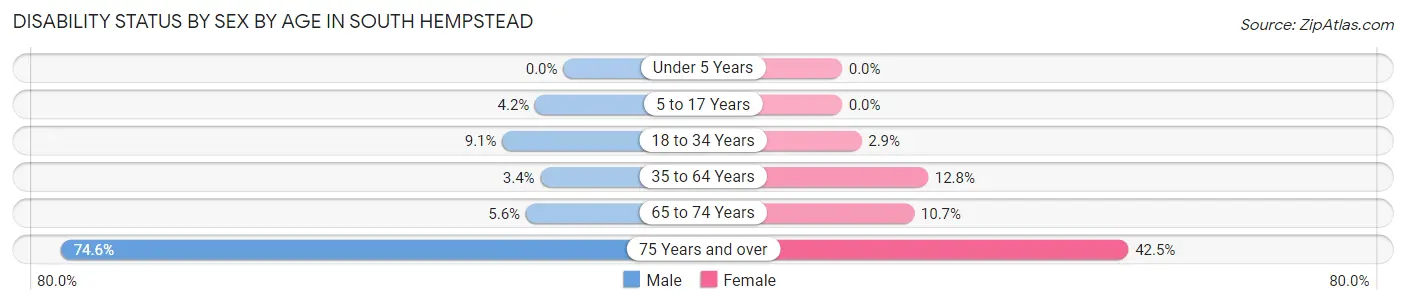
| Age Bracket | Male | Female |
| Under 5 Years | 0 (0.0%) | 0 (0.0%) |
| 5 to 17 Years | 13 (4.2%) | 0 (0.0%) |
| 18 to 34 Years | 29 (9.1%) | 11 (2.9%) |
| 35 to 64 Years | 22 (3.4%) | 78 (12.8%) |
| 65 to 74 Years | 8 (5.6%) | 20 (10.7%) |
| 75 Years and over | 100 (74.6%) | 37 (42.5%) |
Disability Class by Sex by Age in South Hempstead
Disability Class: Hearing Difficulty
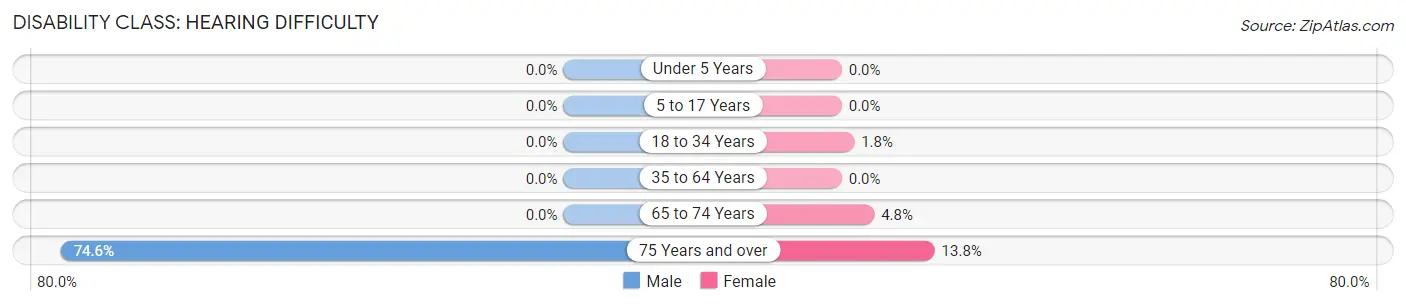
| Age Bracket | Male | Female |
| Under 5 Years | 0 (0.0%) | 0 (0.0%) |
| 5 to 17 Years | 0 (0.0%) | 0 (0.0%) |
| 18 to 34 Years | 0 (0.0%) | 7 (1.8%) |
| 35 to 64 Years | 0 (0.0%) | 0 (0.0%) |
| 65 to 74 Years | 0 (0.0%) | 9 (4.8%) |
| 75 Years and over | 100 (74.6%) | 12 (13.8%) |
Disability Class: Vision Difficulty
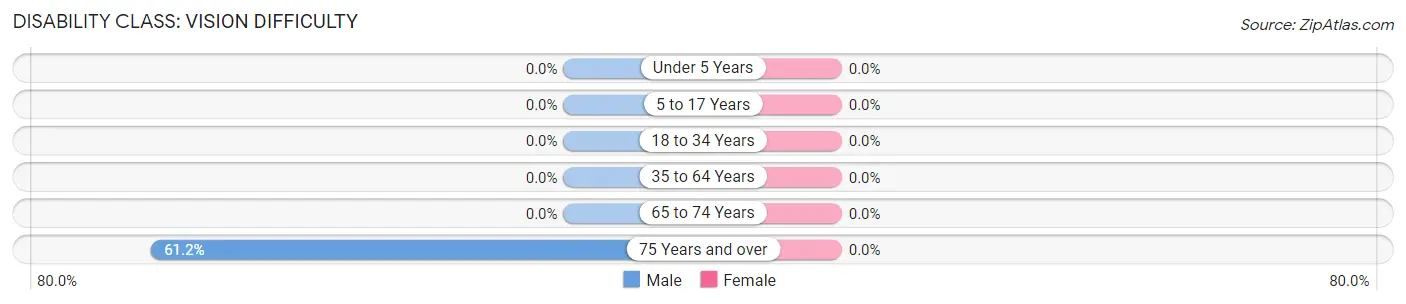
| Age Bracket | Male | Female |
| Under 5 Years | 0 (0.0%) | 0 (0.0%) |
| 5 to 17 Years | 0 (0.0%) | 0 (0.0%) |
| 18 to 34 Years | 0 (0.0%) | 0 (0.0%) |
| 35 to 64 Years | 0 (0.0%) | 0 (0.0%) |
| 65 to 74 Years | 0 (0.0%) | 0 (0.0%) |
| 75 Years and over | 82 (61.2%) | 0 (0.0%) |
Disability Class: Cognitive Difficulty
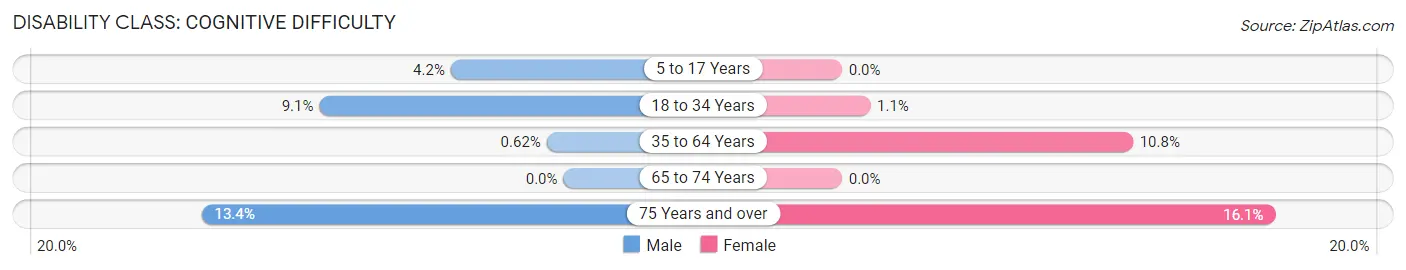
| Age Bracket | Male | Female |
| 5 to 17 Years | 13 (4.2%) | 0 (0.0%) |
| 18 to 34 Years | 29 (9.1%) | 4 (1.1%) |
| 35 to 64 Years | 4 (0.6%) | 66 (10.8%) |
| 65 to 74 Years | 0 (0.0%) | 0 (0.0%) |
| 75 Years and over | 18 (13.4%) | 14 (16.1%) |
Disability Class: Ambulatory Difficulty
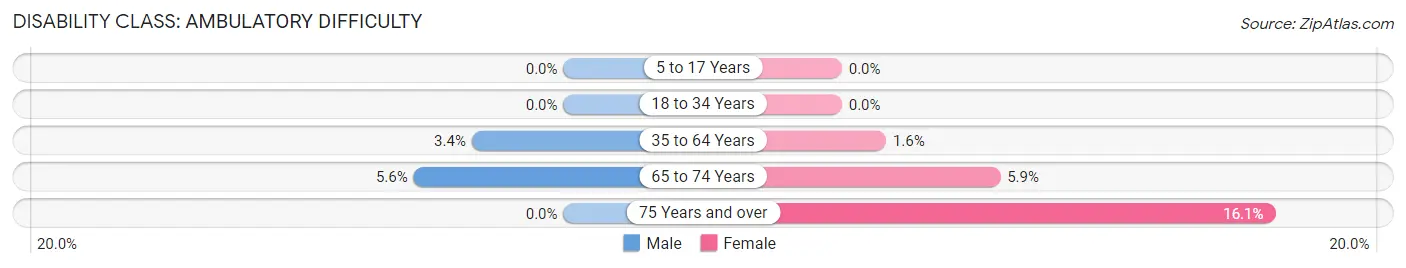
| Age Bracket | Male | Female |
| 5 to 17 Years | 0 (0.0%) | 0 (0.0%) |
| 18 to 34 Years | 0 (0.0%) | 0 (0.0%) |
| 35 to 64 Years | 22 (3.4%) | 10 (1.6%) |
| 65 to 74 Years | 8 (5.6%) | 11 (5.9%) |
| 75 Years and over | 0 (0.0%) | 14 (16.1%) |
Disability Class: Self-Care Difficulty
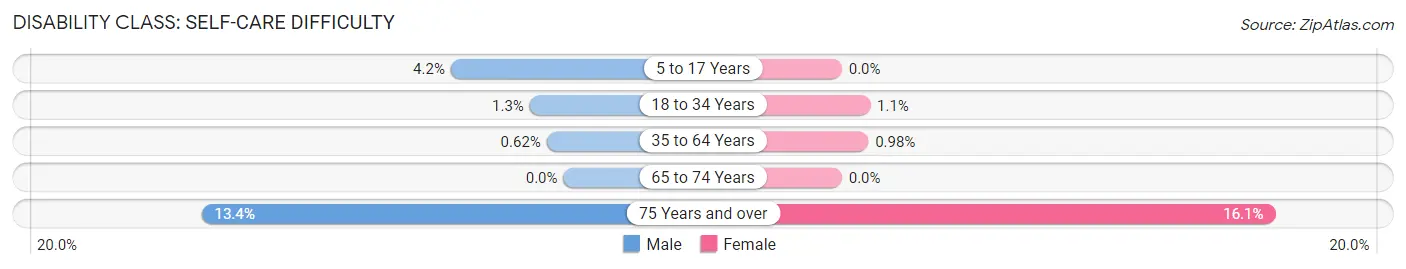
| Age Bracket | Male | Female |
| 5 to 17 Years | 13 (4.2%) | 0 (0.0%) |
| 18 to 34 Years | 4 (1.3%) | 4 (1.1%) |
| 35 to 64 Years | 4 (0.6%) | 6 (1.0%) |
| 65 to 74 Years | 0 (0.0%) | 0 (0.0%) |
| 75 Years and over | 18 (13.4%) | 14 (16.1%) |
Technology Access in South Hempstead
Computing Device Access in South Hempstead
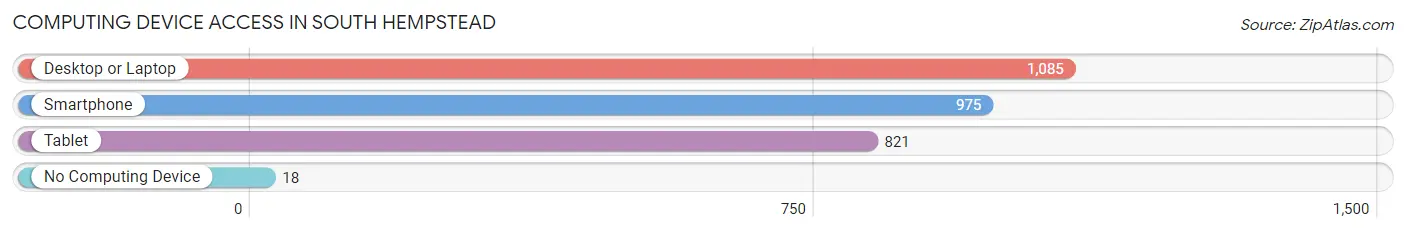
| Device Type | # Households | % Households |
| Desktop or Laptop | 1,085 | 95.3% |
| Smartphone | 975 | 85.7% |
| Tablet | 821 | 72.1% |
| No Computing Device | 18 | 1.6% |
| Total | 1,138 | 100.0% |
Internet Access in South Hempstead
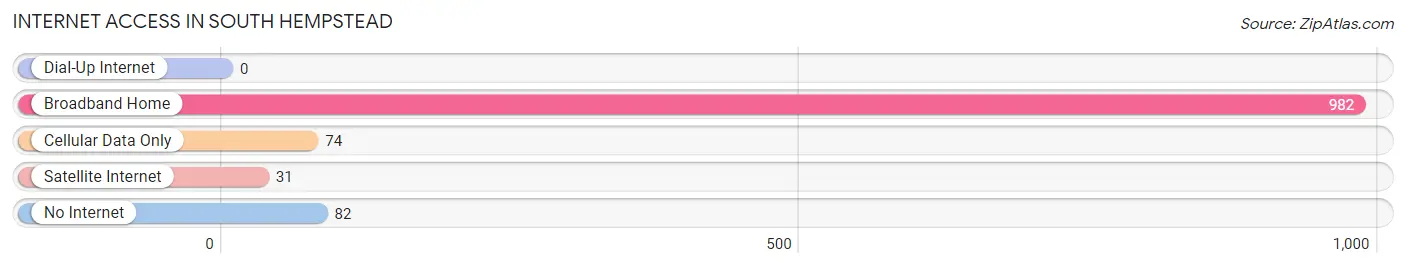
| Internet Type | # Households | % Households |
| Dial-Up Internet | 0 | 0.0% |
| Broadband Home | 982 | 86.3% |
| Cellular Data Only | 74 | 6.5% |
| Satellite Internet | 31 | 2.7% |
| No Internet | 82 | 7.2% |
| Total | 1,138 | 100.0% |
South Hempstead Summary
Hempstead is a town located in Nassau County, New York, United States. It is the most populous town in the state of New York, with a population of 759,757 as of the 2010 census. The town of Hempstead is located in the southwestern part of Nassau County, and is divided into two villages, Hempstead and South Hempstead. South Hempstead is located in the southern part of the town, and is bordered by the towns of Hempstead, North Hempstead, and Oyster Bay.
History
The area that is now South Hempstead was originally inhabited by the Rockaway Indians, a sub-tribe of the Lenape Indians. The area was first settled by Europeans in 1644, when a group of English settlers from Hempstead, Long Island, purchased land from the Rockaway Indians. The area was known as "Hempstead Plains" and was part of the town of Hempstead.
In 1853, the town of Hempstead was divided into two towns, Hempstead and South Hempstead. The town of South Hempstead was officially incorporated in 1858.
Geography
South Hempstead is located in the southwestern part of Nassau County, and is bordered by the towns of Hempstead, North Hempstead, and Oyster Bay. The town has a total area of 4.2 square miles, of which 4.1 square miles is land and 0.1 square miles is water.
The town is located on the south shore of Long Island, and is bordered by the Atlantic Ocean to the south. The town is located in the Hempstead Plains, a flat, low-lying area of Long Island.
Economy
The economy of South Hempstead is largely based on retail and services. The town is home to several shopping centers, including the South Shore Mall, the South Shore Plaza, and the South Shore Commons. The town is also home to several large employers, including the Northwell Health System, the Nassau County Police Department, and the Nassau County Fire Department.
Demographics
As of the 2010 census, there were 7,597 people, 2,845 households, and 1,945 families residing in the town. The population density was 1,845.3 people per square mile. The racial makeup of the town was 63.3% White, 16.2% African American, 0.3% Native American, 8.2% Asian, 0.1% Pacific Islander, 8.2% from other races, and 3.9% from two or more races. Hispanic or Latino of any race were 18.3% of the population.
The median income for a household in the town was $63,945, and the median income for a family was $76,945. The per capita income for the town was $30,945. About 5.2% of families and 7.2% of the population were below the poverty line, including 8.2% of those under age 18 and 5.2% of those age 65 or over.
Common Questions
What is Per Capita Income in South Hempstead?
Per Capita income in South Hempstead is $74,006.
What is the Median Family Income in South Hempstead?
Median Family Income in South Hempstead is $186,750.
What is the Median Household income in South Hempstead?
Median Household Income in South Hempstead is $153,088.
What is Income or Wage Gap in South Hempstead?
Income or Wage Gap in South Hempstead is 26.7%.
Women in South Hempstead earn 73.3 cents for every dollar earned by a man.
What is Inequality or Gini Index in South Hempstead?
Inequality or Gini Index in South Hempstead is 0.42.
What is the Total Population of South Hempstead?
Total Population of South Hempstead is 3,135.
What is the Total Male Population of South Hempstead?
Total Male Population of South Hempstead is 1,675.
What is the Total Female Population of South Hempstead?
Total Female Population of South Hempstead is 1,460.
What is the Ratio of Males per 100 Females in South Hempstead?
There are 114.73 Males per 100 Females in South Hempstead.
What is the Ratio of Females per 100 Males in South Hempstead?
There are 87.16 Females per 100 Males in South Hempstead.
What is the Median Population Age in South Hempstead?
Median Population Age in South Hempstead is 46.1 Years.
What is the Average Family Size in South Hempstead
Average Family Size in South Hempstead is 3.2 People.
What is the Average Household Size in South Hempstead
Average Household Size in South Hempstead is 2.8 People.
How Large is the Labor Force in South Hempstead?
There are 1,705 People in the Labor Forcein in South Hempstead.
What is the Percentage of People in the Labor Force in South Hempstead?
65.7% of People are in the Labor Force in South Hempstead.
What is the Unemployment Rate in South Hempstead?
Unemployment Rate in South Hempstead is 2.0%.