Cold Spring Harbor, NY Map & Demographics
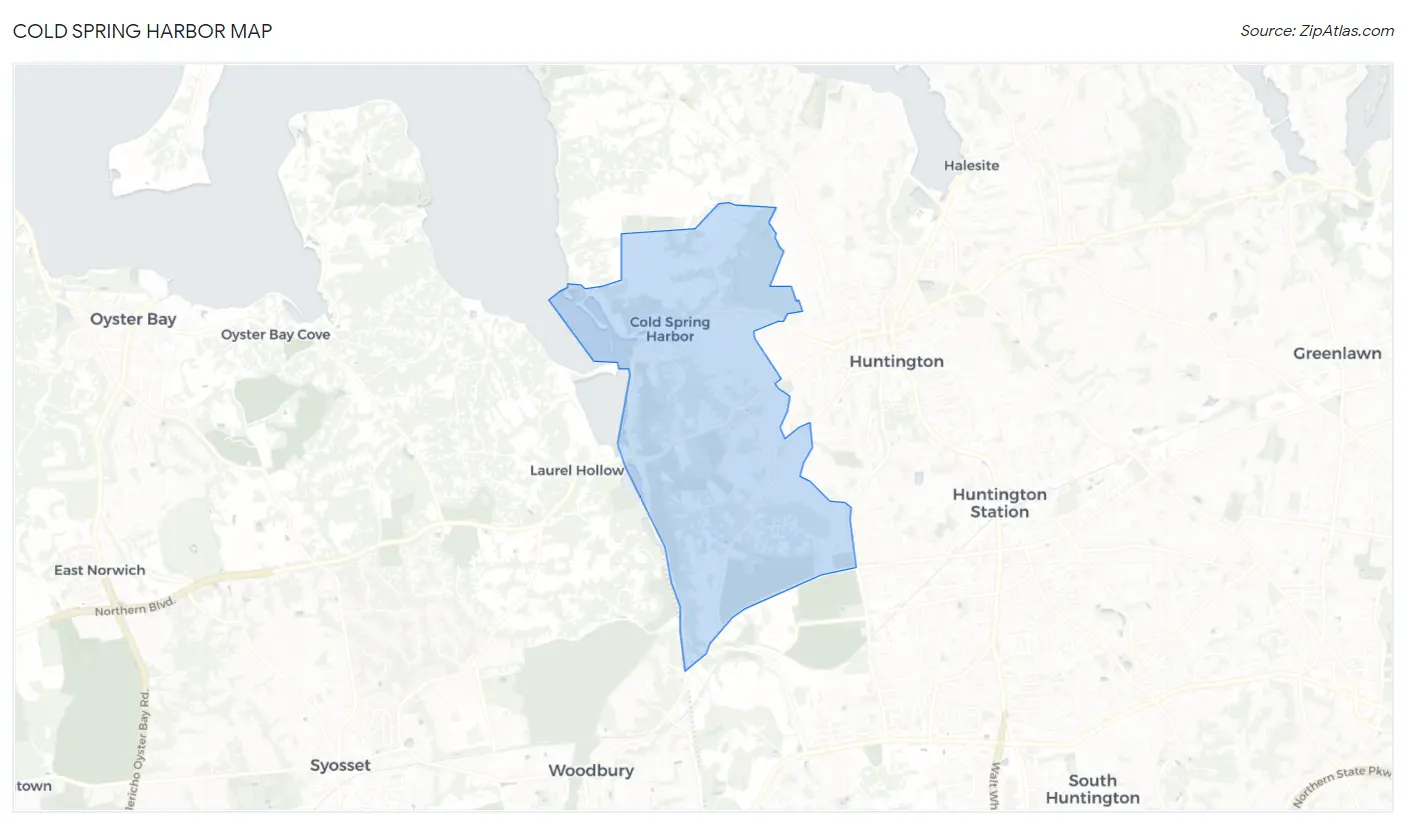
Cold Spring Harbor Map
Cold Spring Harbor Overview
$90,961
PER CAPITA INCOME
$250,001
AVG FAMILY INCOME
$250,001
AVG HOUSEHOLD INCOME
79.5%
WAGE / INCOME GAP [ % ]
20.5¢/ $1
WAGE / INCOME GAP [ $ ]
0.35
INEQUALITY / GINI INDEX
2,979
TOTAL POPULATION
1,597
MALE POPULATION
1,382
FEMALE POPULATION
115.56
MALES / 100 FEMALES
86.54
FEMALES / 100 MALES
36.5
MEDIAN AGE
3.5
AVG FAMILY SIZE
3.0
AVG HOUSEHOLD SIZE
1,612
LABOR FORCE [ PEOPLE ]
72.8%
PERCENT IN LABOR FORCE
2.5%
UNEMPLOYMENT RATE
Cold Spring Harbor Zip Codes
Income in Cold Spring Harbor
Income Overview in Cold Spring Harbor
Per Capita Income in Cold Spring Harbor is $90,961, while median incomes of families and households are $250,001 and $250,001 respectively.
| Characteristic | Number | Measure |
| Per Capita Income | 2,979 | $90,961 |
| Median Family Income | 753 | $250,001 |
| Mean Family Income | 753 | $308,358 |
| Median Household Income | 967 | $250,001 |
| Mean Household Income | 967 | $274,665 |
| Income Deficit | 753 | $0 |
| Wage / Income Gap (%) | 2,979 | 79.55% |
| Wage / Income Gap ($) | 2,979 | 20.45¢ per $1 |
| Gini / Inequality Index | 2,979 | 0.35 |
Earnings by Sex in Cold Spring Harbor
Average Earnings in Cold Spring Harbor are $86,008, $145,859 for men and $29,833 for women, a difference of 79.5%.
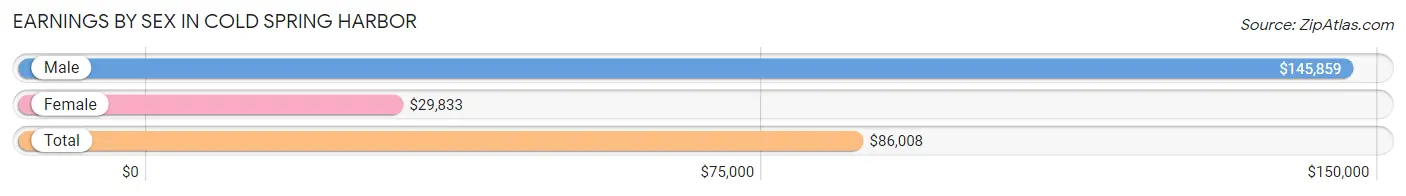
| Sex | Number | Average Earnings |
| Male | 1,007 (58.4%) | $145,859 |
| Female | 718 (41.6%) | $29,833 |
| Total | 1,725 (100.0%) | $86,008 |
Earnings by Sex by Income Bracket in Cold Spring Harbor
The most common earnings brackets in Cold Spring Harbor are $100,000+ for men (650 | 64.5%) and $100,000+ for women (139 | 19.4%).
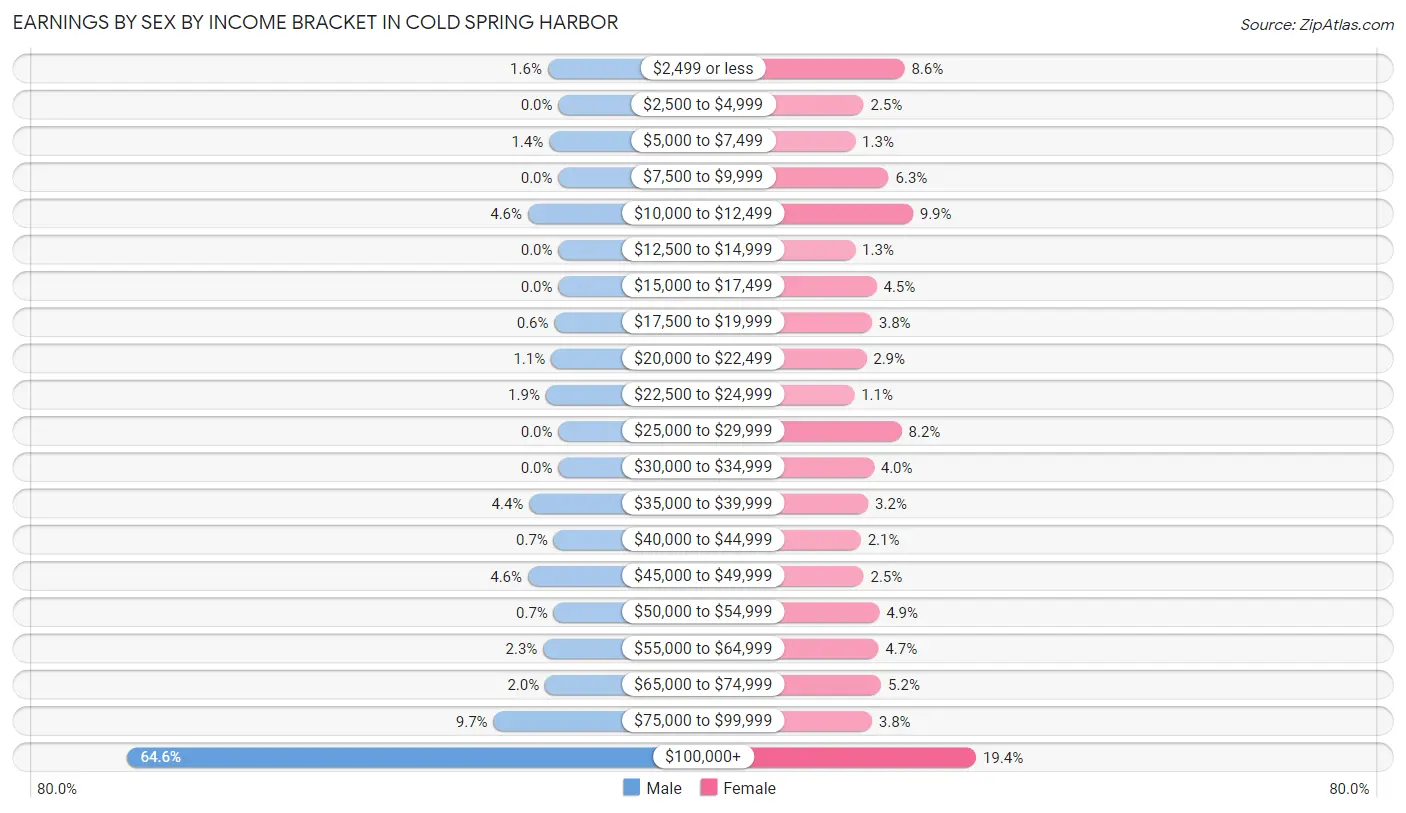
| Income | Male | Female |
| $2,499 or less | 16 (1.6%) | 62 (8.6%) |
| $2,500 to $4,999 | 0 (0.0%) | 18 (2.5%) |
| $5,000 to $7,499 | 14 (1.4%) | 9 (1.3%) |
| $7,500 to $9,999 | 0 (0.0%) | 45 (6.3%) |
| $10,000 to $12,499 | 46 (4.6%) | 71 (9.9%) |
| $12,500 to $14,999 | 0 (0.0%) | 9 (1.3%) |
| $15,000 to $17,499 | 0 (0.0%) | 32 (4.5%) |
| $17,500 to $19,999 | 6 (0.6%) | 27 (3.8%) |
| $20,000 to $22,499 | 11 (1.1%) | 21 (2.9%) |
| $22,500 to $24,999 | 19 (1.9%) | 8 (1.1%) |
| $25,000 to $29,999 | 0 (0.0%) | 59 (8.2%) |
| $30,000 to $34,999 | 0 (0.0%) | 29 (4.0%) |
| $35,000 to $39,999 | 44 (4.4%) | 23 (3.2%) |
| $40,000 to $44,999 | 7 (0.7%) | 15 (2.1%) |
| $45,000 to $49,999 | 46 (4.6%) | 18 (2.5%) |
| $50,000 to $54,999 | 7 (0.7%) | 35 (4.9%) |
| $55,000 to $64,999 | 23 (2.3%) | 34 (4.7%) |
| $65,000 to $74,999 | 20 (2.0%) | 37 (5.1%) |
| $75,000 to $99,999 | 98 (9.7%) | 27 (3.8%) |
| $100,000+ | 650 (64.5%) | 139 (19.4%) |
| Total | 1,007 (100.0%) | 718 (100.0%) |
Earnings by Sex by Educational Attainment in Cold Spring Harbor
Average earnings in Cold Spring Harbor are $216,583 for men and $39,620 for women, a difference of 81.7%. Men with an educational attainment of graduate degree enjoy the highest average annual earnings of $241,607, while those with bachelor's degree education earn the least with $141,628. Women with an educational attainment of graduate degree earn the most with the average annual earnings of $51,071, while those with high school diploma education have the smallest earnings of $19,907.
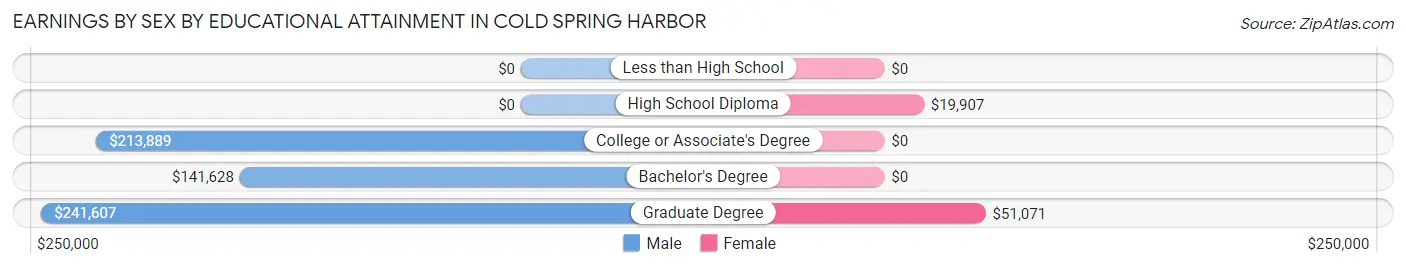
| Educational Attainment | Male Income | Female Income |
| Less than High School | - | - |
| High School Diploma | - | - |
| College or Associate's Degree | $213,889 | $0 |
| Bachelor's Degree | $141,628 | $0 |
| Graduate Degree | $241,607 | $51,071 |
| Total | $216,583 | $39,620 |
Family Income in Cold Spring Harbor
Family Income Brackets in Cold Spring Harbor
According to the Cold Spring Harbor family income data, there are 520 families falling into the $200,000+ income range, which is the most common income bracket and makes up 69.1% of all families.
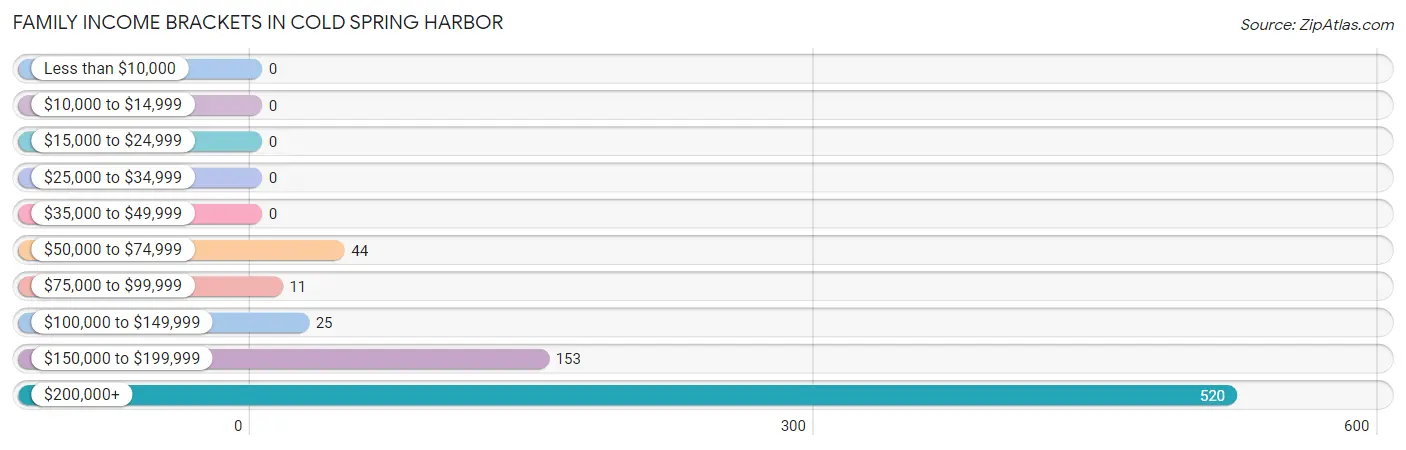
| Income Bracket | # Families | % Families |
| Less than $10,000 | 0 | 0.0% |
| $10,000 to $14,999 | 0 | 0.0% |
| $15,000 to $24,999 | 0 | 0.0% |
| $25,000 to $34,999 | 0 | 0.0% |
| $35,000 to $49,999 | 0 | 0.0% |
| $50,000 to $74,999 | 44 | 5.8% |
| $75,000 to $99,999 | 11 | 1.5% |
| $100,000 to $149,999 | 25 | 3.3% |
| $150,000 to $199,999 | 153 | 20.3% |
| $200,000+ | 520 | 69.1% |
Family Income by Famaliy Size in Cold Spring Harbor
2-person families (192 | 25.5%) account for the highest median family income in Cold Spring Harbor with $250,001 per family, while 2-person families (192 | 25.5%) have the highest median income of $125,000 per family member.
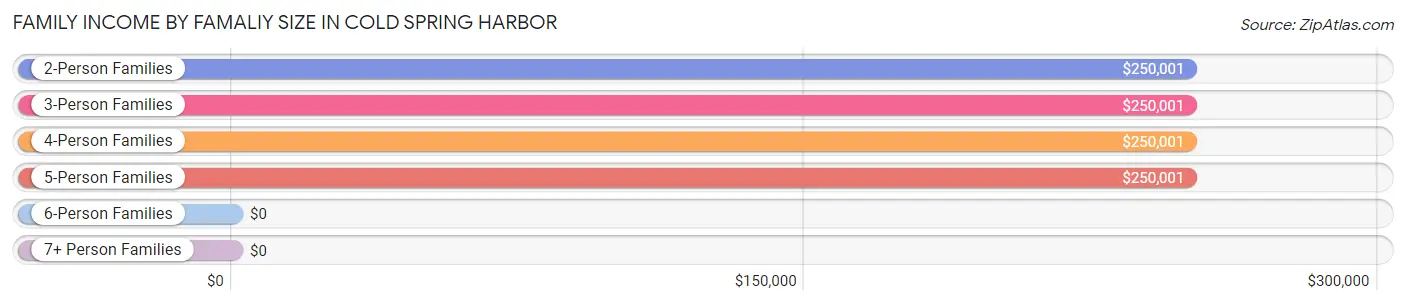
| Income Bracket | # Families | Median Income |
| 2-Person Families | 192 (25.5%) | $250,001 |
| 3-Person Families | 253 (33.6%) | $250,001 |
| 4-Person Families | 184 (24.4%) | $250,001 |
| 5-Person Families | 95 (12.6%) | $250,001 |
| 6-Person Families | 8 (1.1%) | $0 |
| 7+ Person Families | 21 (2.8%) | $0 |
| Total | 753 (100.0%) | $250,001 |
Family Income by Number of Earners in Cold Spring Harbor
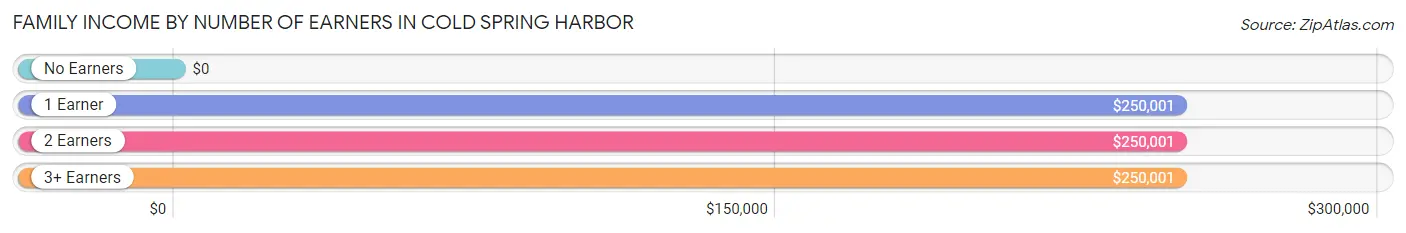
| Number of Earners | # Families | Median Income |
| No Earners | 23 (3.0%) | $0 |
| 1 Earner | 168 (22.3%) | $250,001 |
| 2 Earners | 443 (58.8%) | $250,001 |
| 3+ Earners | 119 (15.8%) | $250,001 |
| Total | 753 (100.0%) | $250,001 |
Household Income in Cold Spring Harbor
Household Income Brackets in Cold Spring Harbor
With 576 households falling in the category, the $200,000+ income range is the most frequent in Cold Spring Harbor, accounting for 59.6% of all households.
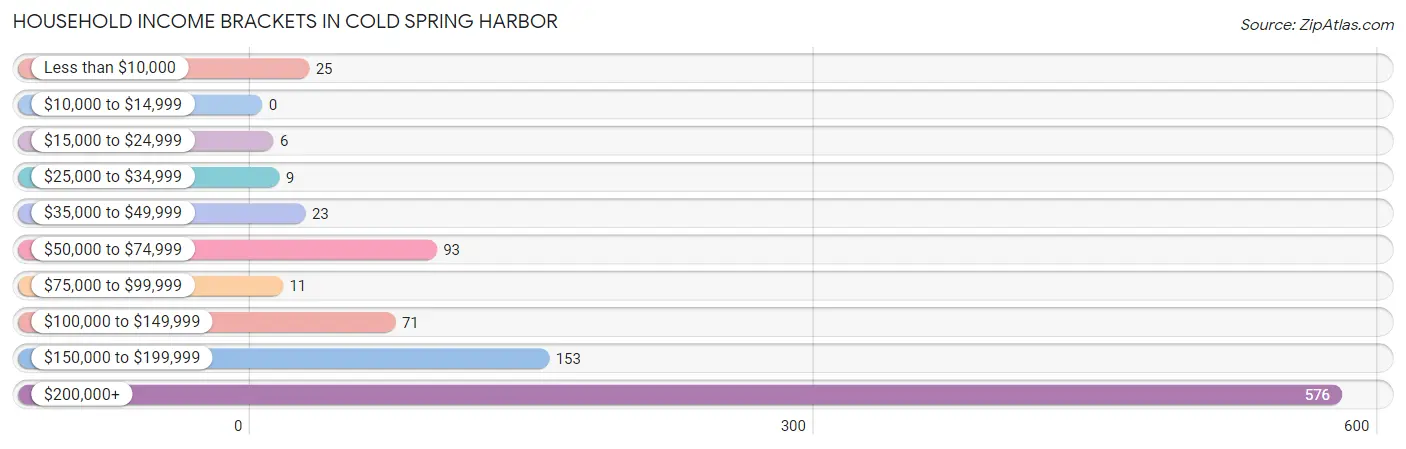
| Income Bracket | # Households | % Households |
| Less than $10,000 | 25 | 2.6% |
| $10,000 to $14,999 | 0 | 0.0% |
| $15,000 to $24,999 | 6 | 0.6% |
| $25,000 to $34,999 | 9 | 0.9% |
| $35,000 to $49,999 | 23 | 2.4% |
| $50,000 to $74,999 | 93 | 9.6% |
| $75,000 to $99,999 | 11 | 1.1% |
| $100,000 to $149,999 | 71 | 7.3% |
| $150,000 to $199,999 | 153 | 15.8% |
| $200,000+ | 576 | 59.6% |
Household Income by Householder Age in Cold Spring Harbor
The median household income in Cold Spring Harbor is $250,001, with the highest median household income of $250,001 found in the 45 to 64 years age bracket for the primary householder. A total of 488 households (50.5%) fall into this category.
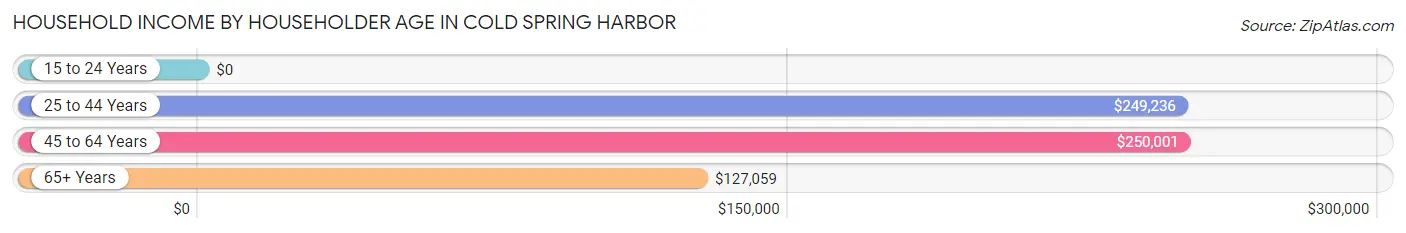
| Income Bracket | # Households | Median Income |
| 15 to 24 Years | 0 (0.0%) | $0 |
| 25 to 44 Years | 219 (22.7%) | $249,236 |
| 45 to 64 Years | 488 (50.5%) | $250,001 |
| 65+ Years | 260 (26.9%) | $127,059 |
| Total | 967 (100.0%) | $250,001 |
Poverty in Cold Spring Harbor
Income Below Poverty by Sex and Age in Cold Spring Harbor
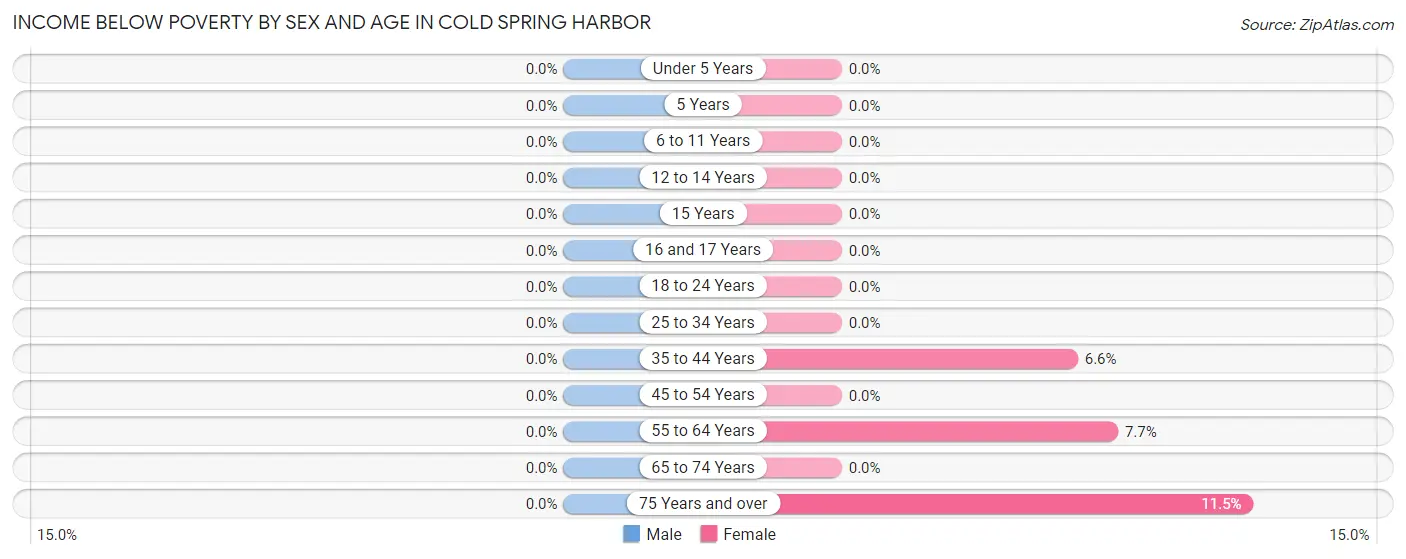
| Age Bracket | Male | Female |
| Under 5 Years | 0 (0.0%) | 0 (0.0%) |
| 5 Years | 0 (0.0%) | 0 (0.0%) |
| 6 to 11 Years | 0 (0.0%) | 0 (0.0%) |
| 12 to 14 Years | 0 (0.0%) | 0 (0.0%) |
| 15 Years | 0 (0.0%) | 0 (0.0%) |
| 16 and 17 Years | 0 (0.0%) | 0 (0.0%) |
| 18 to 24 Years | 0 (0.0%) | 0 (0.0%) |
| 25 to 34 Years | 0 (0.0%) | 0 (0.0%) |
| 35 to 44 Years | 0 (0.0%) | 9 (6.6%) |
| 45 to 54 Years | 0 (0.0%) | 0 (0.0%) |
| 55 to 64 Years | 0 (0.0%) | 14 (7.7%) |
| 65 to 74 Years | 0 (0.0%) | 0 (0.0%) |
| 75 Years and over | 0 (0.0%) | 11 (11.5%) |
| Total | 0 (0.0%) | 34 (2.5%) |
Income Above Poverty by Sex and Age in Cold Spring Harbor
According to the poverty statistics in Cold Spring Harbor, males aged under 5 years and females aged under 5 years are the age groups that are most secure financially, with 100.0% of males and 100.0% of females in these age groups living above the poverty line.
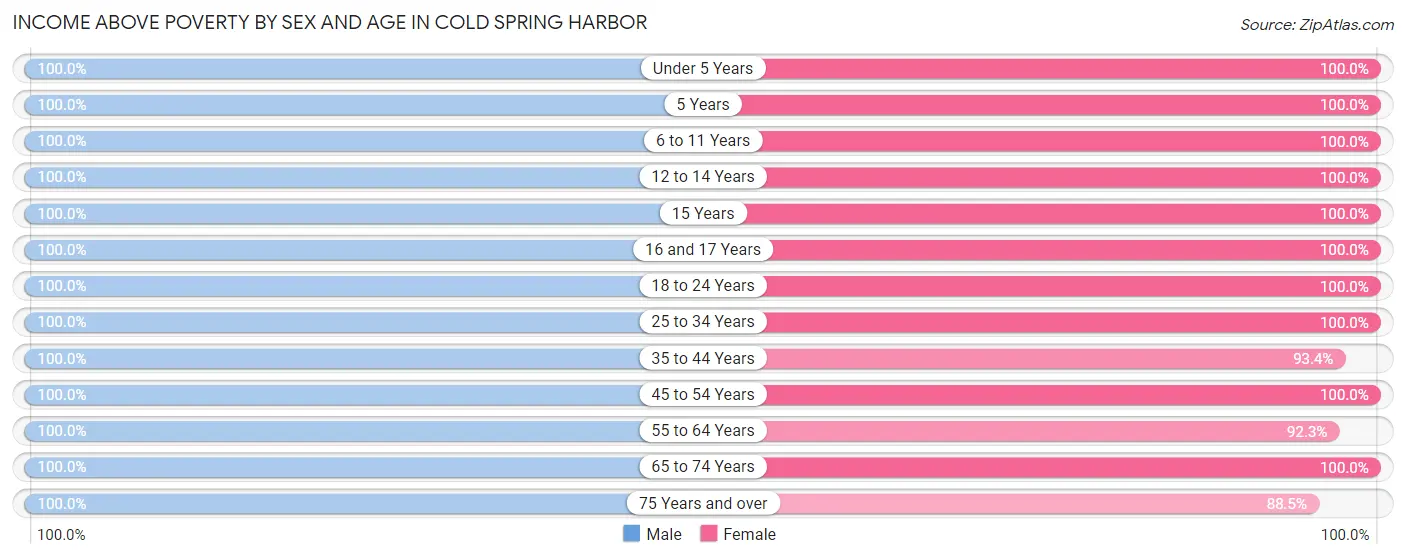
| Age Bracket | Male | Female |
| Under 5 Years | 87 (100.0%) | 170 (100.0%) |
| 5 Years | 21 (100.0%) | 30 (100.0%) |
| 6 to 11 Years | 174 (100.0%) | 107 (100.0%) |
| 12 to 14 Years | 49 (100.0%) | 54 (100.0%) |
| 15 Years | 54 (100.0%) | 19 (100.0%) |
| 16 and 17 Years | 45 (100.0%) | 24 (100.0%) |
| 18 to 24 Years | 120 (100.0%) | 98 (100.0%) |
| 25 to 34 Years | 191 (100.0%) | 130 (100.0%) |
| 35 to 44 Years | 129 (100.0%) | 128 (93.4%) |
| 45 to 54 Years | 246 (100.0%) | 216 (100.0%) |
| 55 to 64 Years | 252 (100.0%) | 168 (92.3%) |
| 65 to 74 Years | 151 (100.0%) | 92 (100.0%) |
| 75 Years and over | 39 (100.0%) | 85 (88.5%) |
| Total | 1,558 (100.0%) | 1,321 (97.5%) |
Income Below Poverty Among Married-Couple Families in Cold Spring Harbor
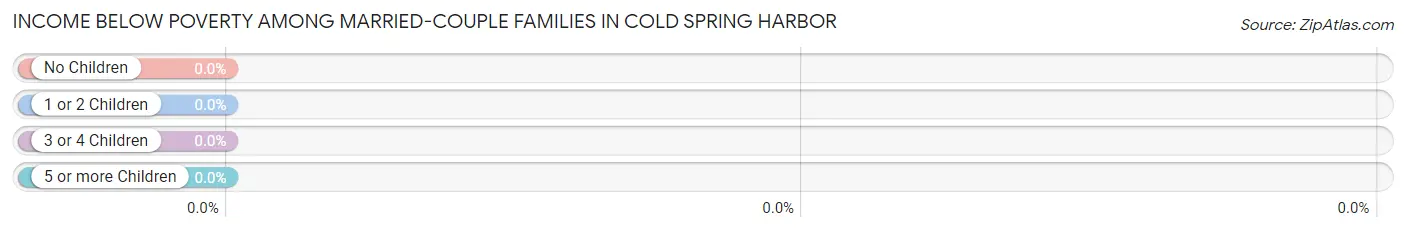
| Children | Above Poverty | Below Poverty |
| No Children | 258 (100.0%) | 0 (0.0%) |
| 1 or 2 Children | 374 (100.0%) | 0 (0.0%) |
| 3 or 4 Children | 50 (100.0%) | 0 (0.0%) |
| 5 or more Children | 21 (100.0%) | 0 (0.0%) |
| Total | 703 (100.0%) | 0 (0.0%) |
Income Below Poverty Among Single-Parent Households in Cold Spring Harbor
| Children | Single Father | Single Mother |
| No Children | 0 (0.0%) | 0 (0.0%) |
| 1 or 2 Children | 0 (0.0%) | 0 (0.0%) |
| 3 or 4 Children | 0 (0.0%) | 0 (0.0%) |
| 5 or more Children | 0 (0.0%) | 0 (0.0%) |
| Total | 0 (0.0%) | 0 (0.0%) |
Income Below Poverty Among Married-Couple vs Single-Parent Households in Cold Spring Harbor
| Children | Married-Couple Families | Single-Parent Households |
| No Children | 0 (0.0%) | 0 (0.0%) |
| 1 or 2 Children | 0 (0.0%) | 0 (0.0%) |
| 3 or 4 Children | 0 (0.0%) | 0 (0.0%) |
| 5 or more Children | 0 (0.0%) | 0 (0.0%) |
| Total | 0 (0.0%) | 0 (0.0%) |
Race in Cold Spring Harbor
The most populous races in Cold Spring Harbor are White / Caucasian (2,618 | 87.9%), Two or more Races (202 | 6.8%), and Hispanic or Latino (123 | 4.1%).
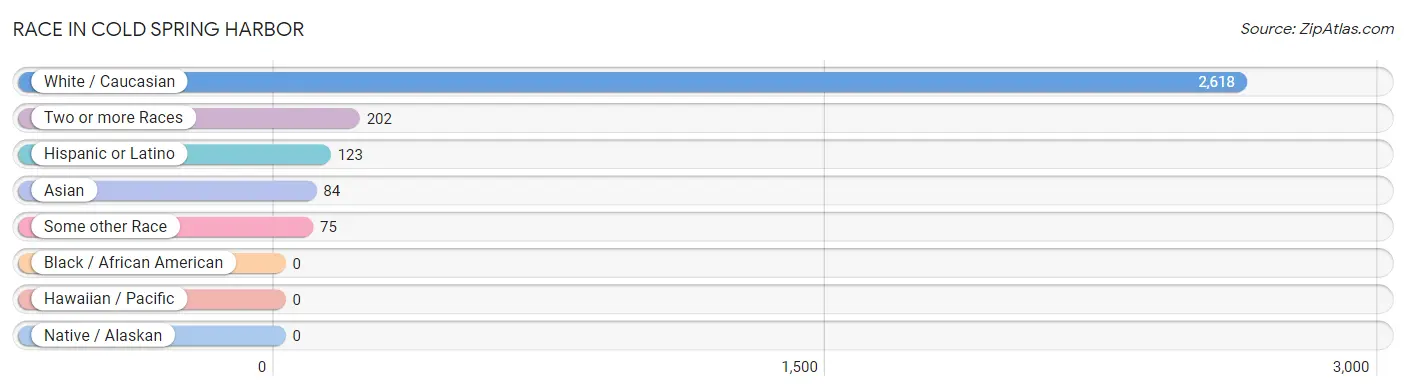
| Race | # Population | % Population |
| Asian | 84 | 2.8% |
| Black / African American | 0 | 0.0% |
| Hawaiian / Pacific | 0 | 0.0% |
| Hispanic or Latino | 123 | 4.1% |
| Native / Alaskan | 0 | 0.0% |
| White / Caucasian | 2,618 | 87.9% |
| Two or more Races | 202 | 6.8% |
| Some other Race | 75 | 2.5% |
| Total | 2,979 | 100.0% |
Ancestry in Cold Spring Harbor
The most populous ancestries reported in Cold Spring Harbor are Irish (861 | 28.9%), Italian (629 | 21.1%), German (337 | 11.3%), English (312 | 10.5%), and Polish (270 | 9.1%), together accounting for 80.8% of all Cold Spring Harbor residents.
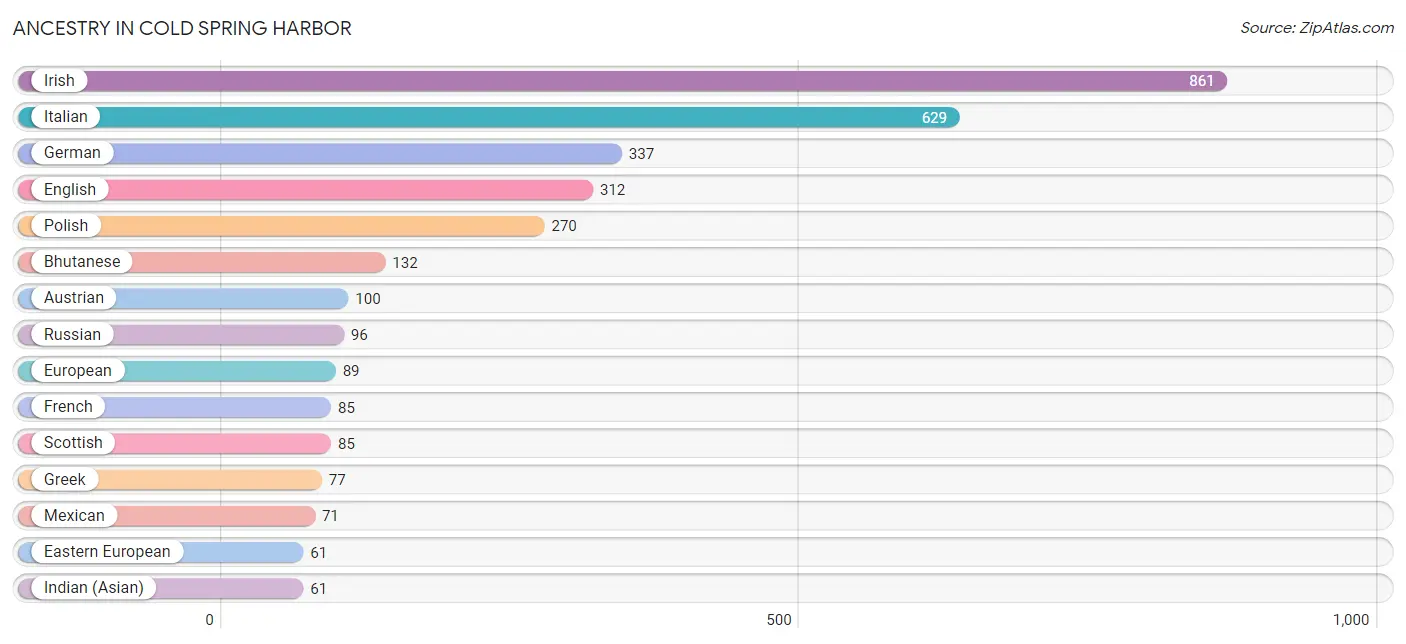
| Ancestry | # Population | % Population |
| American | 42 | 1.4% |
| Arab | 3 | 0.1% |
| Armenian | 19 | 0.6% |
| Austrian | 100 | 3.4% |
| Belgian | 6 | 0.2% |
| Bhutanese | 132 | 4.4% |
| Colombian | 18 | 0.6% |
| Croatian | 55 | 1.8% |
| Czech | 22 | 0.7% |
| Dutch | 59 | 2.0% |
| Eastern European | 61 | 2.1% |
| Ecuadorian | 11 | 0.4% |
| Egyptian | 3 | 0.1% |
| English | 312 | 10.5% |
| European | 89 | 3.0% |
| French | 85 | 2.9% |
| German | 337 | 11.3% |
| Greek | 77 | 2.6% |
| Hungarian | 18 | 0.6% |
| Indian (Asian) | 61 | 2.1% |
| Irish | 861 | 28.9% |
| Italian | 629 | 21.1% |
| Lithuanian | 16 | 0.5% |
| Mexican | 71 | 2.4% |
| Northern European | 19 | 0.6% |
| Norwegian | 3 | 0.1% |
| Polish | 270 | 9.1% |
| Puerto Rican | 15 | 0.5% |
| Russian | 96 | 3.2% |
| Scotch-Irish | 52 | 1.8% |
| Scottish | 85 | 2.9% |
| Slovene | 50 | 1.7% |
| South American | 29 | 1.0% |
| Swedish | 9 | 0.3% |
| Swiss | 7 | 0.2% |
| Thai | 19 | 0.6% |
| Turkish | 18 | 0.6% |
| Welsh | 55 | 1.8% | View All 38 Rows |
Immigrants in Cold Spring Harbor
The most numerous immigrant groups reported in Cold Spring Harbor came from Europe (97 | 3.3%), Western Europe (65 | 2.2%), Latin America (35 | 1.2%), Austria (31 | 1.0%), and Italy (29 | 1.0%), together accounting for 8.6% of all Cold Spring Harbor residents.
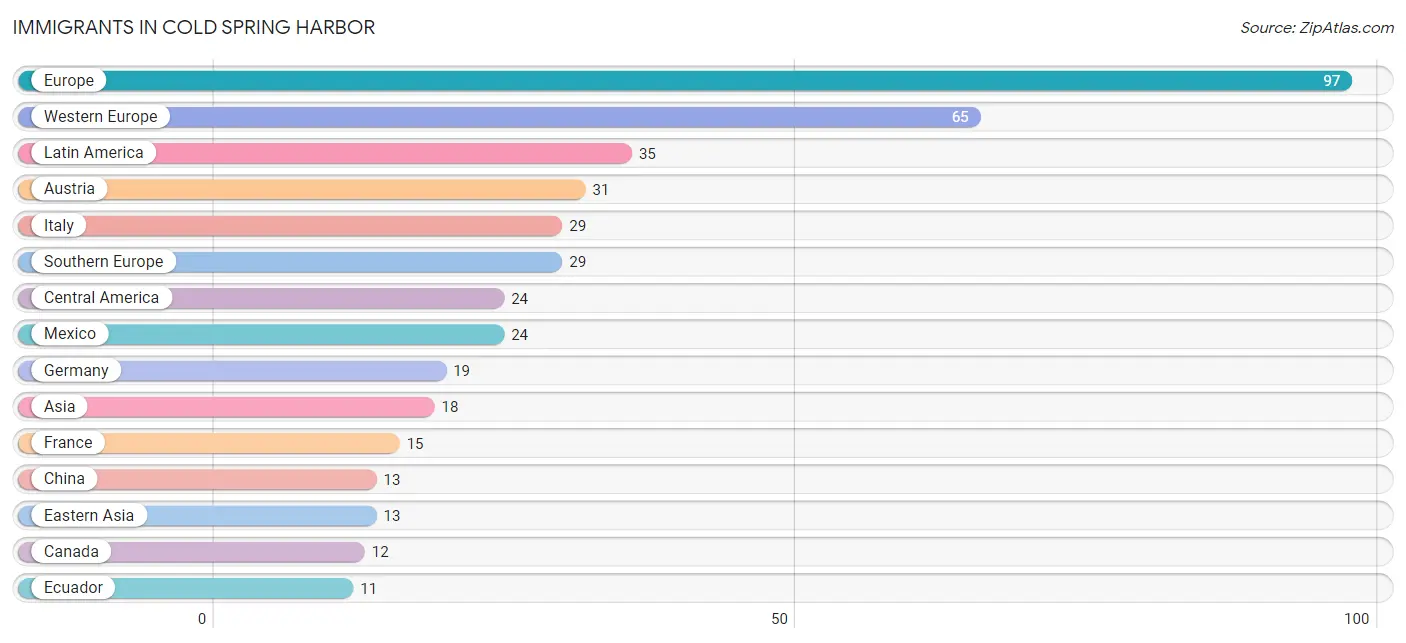
| Immigration Origin | # Population | % Population |
| Africa | 2 | 0.1% |
| Asia | 18 | 0.6% |
| Austria | 31 | 1.0% |
| Canada | 12 | 0.4% |
| Central America | 24 | 0.8% |
| China | 13 | 0.4% |
| Eastern Asia | 13 | 0.4% |
| Ecuador | 11 | 0.4% |
| Egypt | 1 | 0.0% |
| Europe | 97 | 3.3% |
| France | 15 | 0.5% |
| Germany | 19 | 0.6% |
| Italy | 29 | 1.0% |
| Latin America | 35 | 1.2% |
| Mexico | 24 | 0.8% |
| Northern Africa | 1 | 0.0% |
| Northern Europe | 3 | 0.1% |
| Norway | 3 | 0.1% |
| Singapore | 5 | 0.2% |
| South Africa | 1 | 0.0% |
| South America | 11 | 0.4% |
| South Eastern Asia | 5 | 0.2% |
| Southern Europe | 29 | 1.0% |
| Western Europe | 65 | 2.2% | View All 24 Rows |
Sex and Age in Cold Spring Harbor
Sex and Age in Cold Spring Harbor
The most populous age groups in Cold Spring Harbor are 15 to 19 Years (158 | 9.9%) for men and Under 5 Years (170 | 12.3%) for women.
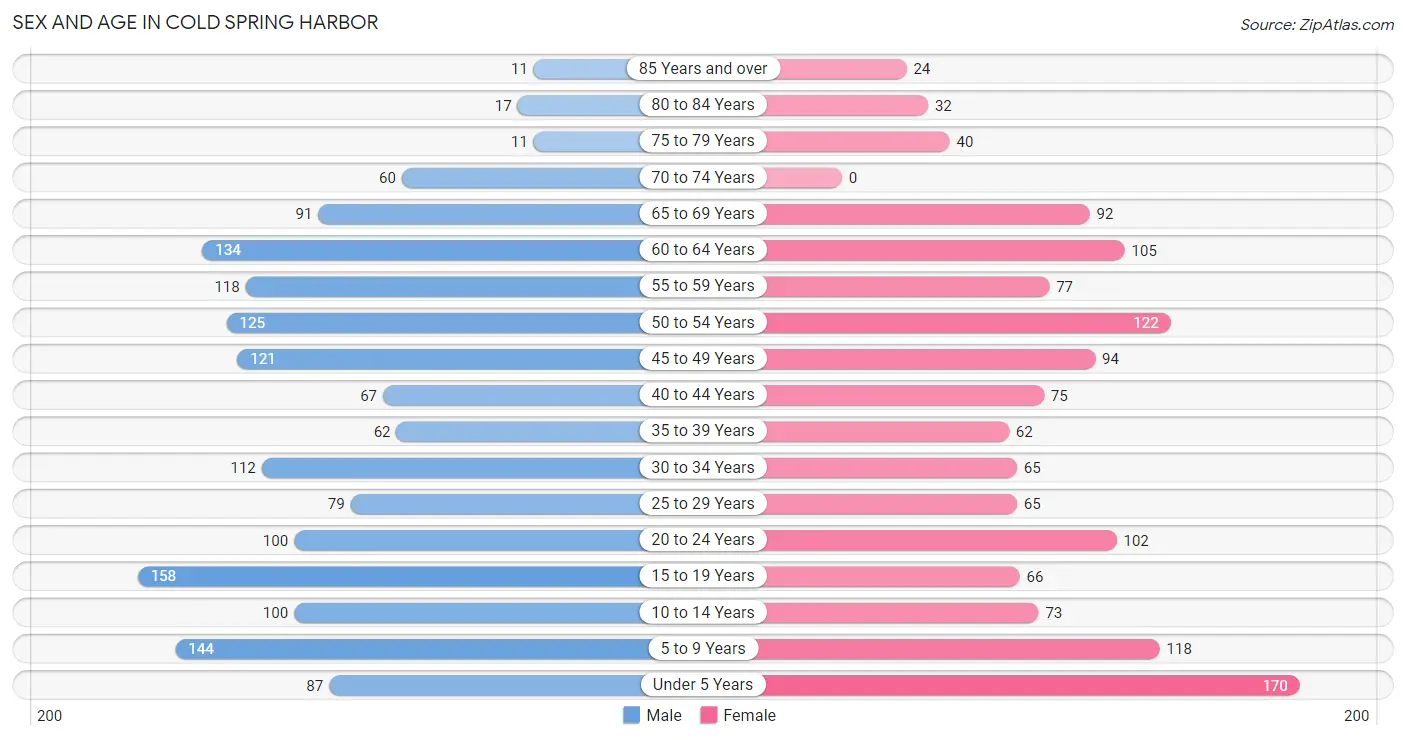
| Age Bracket | Male | Female |
| Under 5 Years | 87 (5.4%) | 170 (12.3%) |
| 5 to 9 Years | 144 (9.0%) | 118 (8.5%) |
| 10 to 14 Years | 100 (6.3%) | 73 (5.3%) |
| 15 to 19 Years | 158 (9.9%) | 66 (4.8%) |
| 20 to 24 Years | 100 (6.3%) | 102 (7.4%) |
| 25 to 29 Years | 79 (5.0%) | 65 (4.7%) |
| 30 to 34 Years | 112 (7.0%) | 65 (4.7%) |
| 35 to 39 Years | 62 (3.9%) | 62 (4.5%) |
| 40 to 44 Years | 67 (4.2%) | 75 (5.4%) |
| 45 to 49 Years | 121 (7.6%) | 94 (6.8%) |
| 50 to 54 Years | 125 (7.8%) | 122 (8.8%) |
| 55 to 59 Years | 118 (7.4%) | 77 (5.6%) |
| 60 to 64 Years | 134 (8.4%) | 105 (7.6%) |
| 65 to 69 Years | 91 (5.7%) | 92 (6.7%) |
| 70 to 74 Years | 60 (3.8%) | 0 (0.0%) |
| 75 to 79 Years | 11 (0.7%) | 40 (2.9%) |
| 80 to 84 Years | 17 (1.1%) | 32 (2.3%) |
| 85 Years and over | 11 (0.7%) | 24 (1.7%) |
| Total | 1,597 (100.0%) | 1,382 (100.0%) |
Families and Households in Cold Spring Harbor
Median Family Size in Cold Spring Harbor
The median family size in Cold Spring Harbor is 3.49 persons per family, with married-couple families (703 | 93.4%) accounting for the largest median family size of 3.54 persons per family. On the other hand, single male/father families (31 | 4.1%) represent the smallest median family size with 2.58 persons per family.
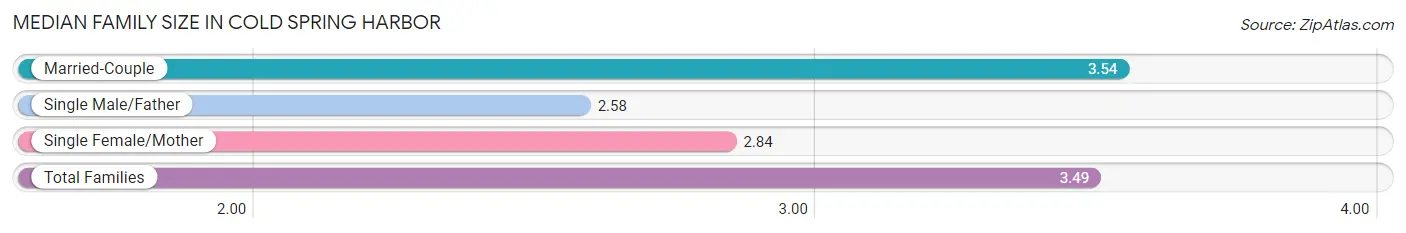
| Family Type | # Families | Family Size |
| Married-Couple | 703 (93.4%) | 3.54 |
| Single Male/Father | 31 (4.1%) | 2.58 |
| Single Female/Mother | 19 (2.5%) | 2.84 |
| Total Families | 753 (100.0%) | 3.49 |
Median Household Size in Cold Spring Harbor
The median household size in Cold Spring Harbor is 2.99 persons per household, with single male/father households (31 | 3.2%) accounting for the largest median household size of 3.55 persons per household. non-family households (214 | 22.1%) represent the smallest median household size with 1.05 persons per household.
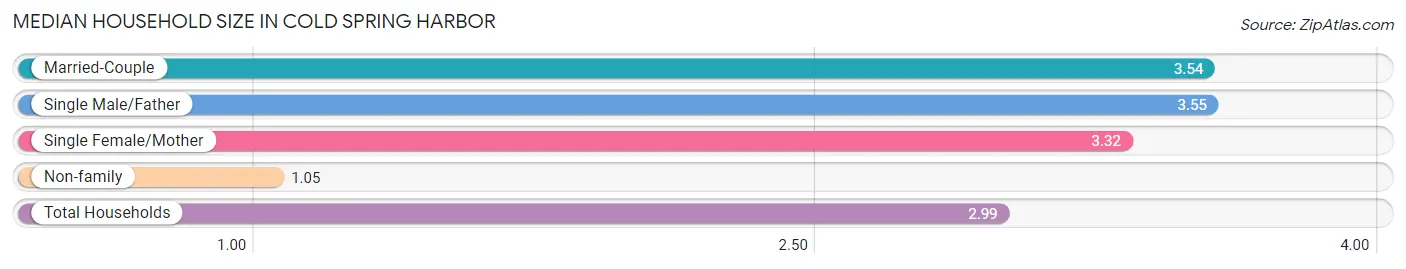
| Household Type | # Households | Household Size |
| Married-Couple | 703 (72.7%) | 3.54 |
| Single Male/Father | 31 (3.2%) | 3.55 |
| Single Female/Mother | 19 (2.0%) | 3.32 |
| Non-family | 214 (22.1%) | 1.05 |
| Total Households | 967 (100.0%) | 2.99 |
Household Size by Marriage Status in Cold Spring Harbor
Out of a total of 967 households in Cold Spring Harbor, 753 (77.9%) are family households, while 214 (22.1%) are nonfamily households. The most numerous type of family households are 3-person households, comprising 262, and the most common type of nonfamily households are 1-person households, comprising 205.
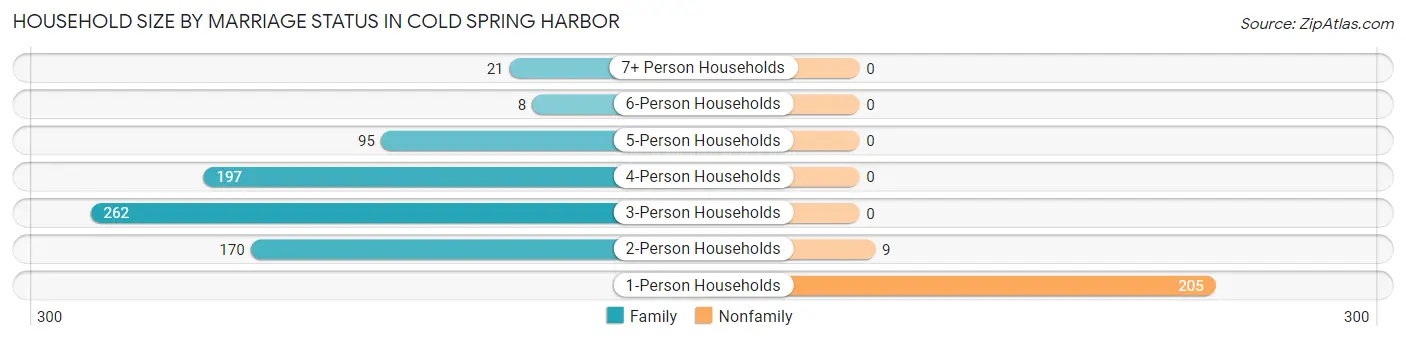
| Household Size | Family Households | Nonfamily Households |
| 1-Person Households | - | 205 (21.2%) |
| 2-Person Households | 170 (17.6%) | 9 (0.9%) |
| 3-Person Households | 262 (27.1%) | 0 (0.0%) |
| 4-Person Households | 197 (20.4%) | 0 (0.0%) |
| 5-Person Households | 95 (9.8%) | 0 (0.0%) |
| 6-Person Households | 8 (0.8%) | 0 (0.0%) |
| 7+ Person Households | 21 (2.2%) | 0 (0.0%) |
| Total | 753 (77.9%) | 214 (22.1%) |
Female Fertility in Cold Spring Harbor
Fertility by Age in Cold Spring Harbor
Average fertility rate in Cold Spring Harbor is 17.0 births per 1,000 women. Women in the age bracket of 20 to 34 years have the highest fertility rate with 39.0 births per 1,000 women. Women in the age bracket of 20 to 34 years acount for 100.0% of all women with births.
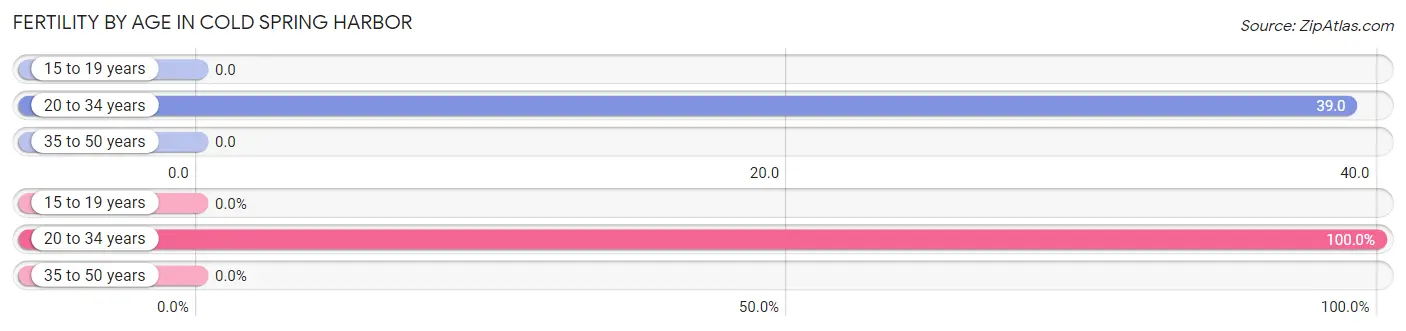
| Age Bracket | Women with Births | Births / 1,000 Women |
| 15 to 19 years | 0 (0.0%) | 0.0 |
| 20 to 34 years | 9 (100.0%) | 39.0 |
| 35 to 50 years | 0 (0.0%) | 0.0 |
| Total | 9 (100.0%) | 17.0 |
Fertility by Age by Marriage Status in Cold Spring Harbor
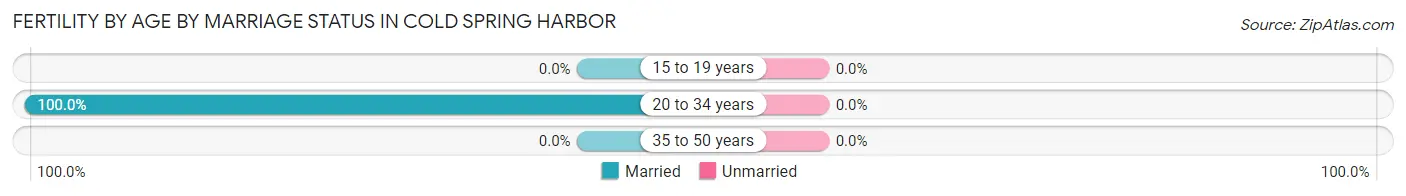
| Age Bracket | Married | Unmarried |
| 15 to 19 years | 0 (0.0%) | 0 (0.0%) |
| 20 to 34 years | 9 (100.0%) | 0 (0.0%) |
| 35 to 50 years | 0 (0.0%) | 0 (0.0%) |
| Total | 9 (100.0%) | 0 (0.0%) |
Fertility by Education in Cold Spring Harbor
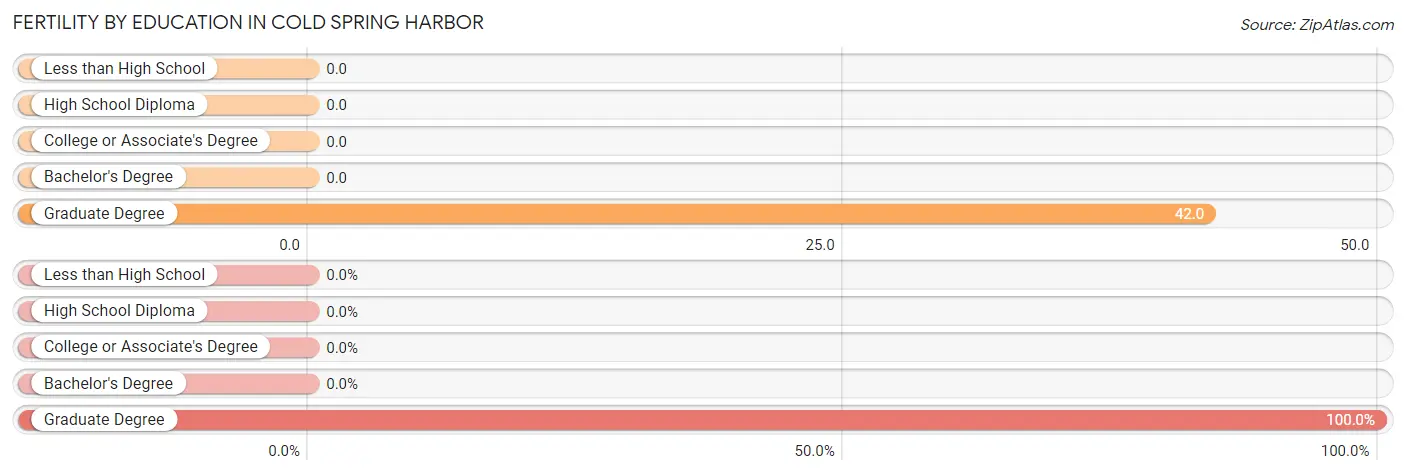
| Educational Attainment | Women with Births | Births / 1,000 Women |
| Less than High School | 0 (0.0%) | 0.0 |
| High School Diploma | 0 (0.0%) | 0.0 |
| College or Associate's Degree | 0 (0.0%) | 0.0 |
| Bachelor's Degree | 0 (0.0%) | 0.0 |
| Graduate Degree | 9 (100.0%) | 42.0 |
| Total | 9 (100.0%) | 17.0 |
Fertility by Education by Marriage Status in Cold Spring Harbor
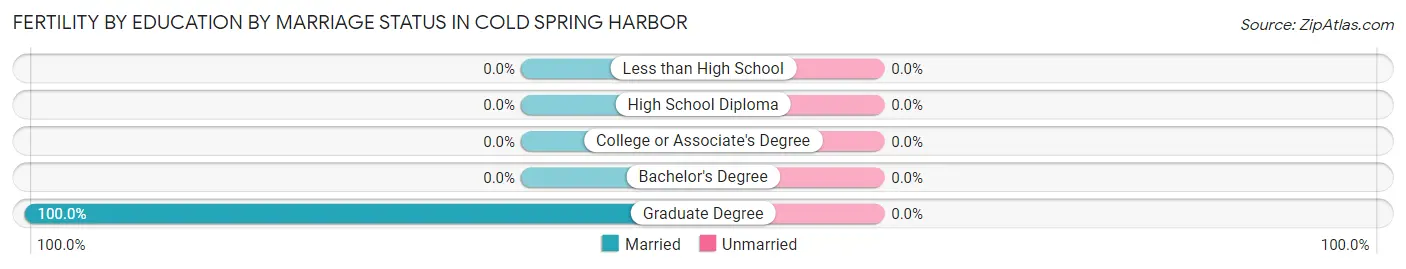
| Educational Attainment | Married | Unmarried |
| Less than High School | 0 (0.0%) | 0 (0.0%) |
| High School Diploma | 0 (0.0%) | 0 (0.0%) |
| College or Associate's Degree | 0 (0.0%) | 0 (0.0%) |
| Bachelor's Degree | 0 (0.0%) | 0 (0.0%) |
| Graduate Degree | 9 (100.0%) | 0 (0.0%) |
| Total | 9 (100.0%) | 0 (0.0%) |
Employment Characteristics in Cold Spring Harbor
Employment by Class of Employer in Cold Spring Harbor
Among the 1,572 employed individuals in Cold Spring Harbor, private company employees (908 | 57.8%), self-employed (incorporated) (230 | 14.6%), and not-for-profit organizations (219 | 13.9%) make up the most common classes of employment.
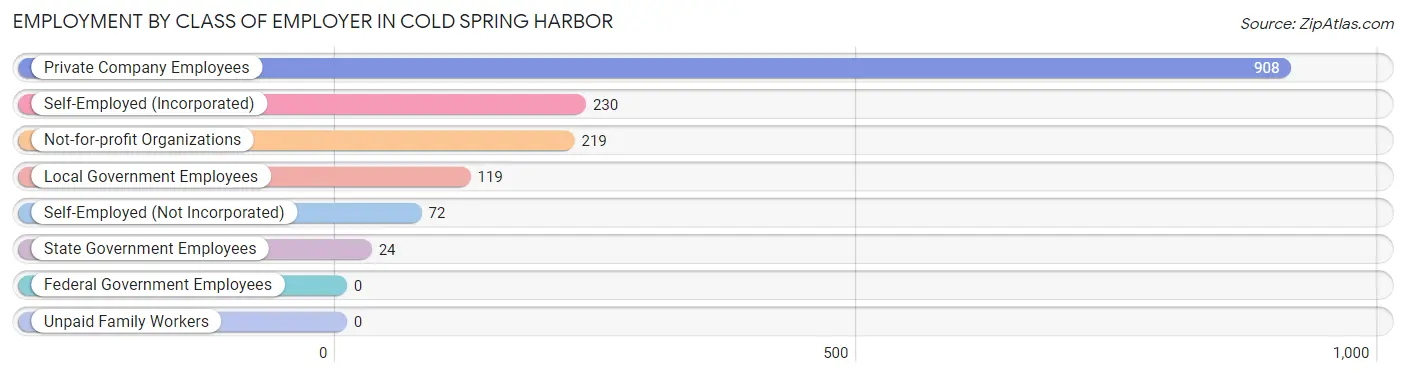
| Employer Class | # Employees | % Employees |
| Private Company Employees | 908 | 57.8% |
| Self-Employed (Incorporated) | 230 | 14.6% |
| Self-Employed (Not Incorporated) | 72 | 4.6% |
| Not-for-profit Organizations | 219 | 13.9% |
| Local Government Employees | 119 | 7.6% |
| State Government Employees | 24 | 1.5% |
| Federal Government Employees | 0 | 0.0% |
| Unpaid Family Workers | 0 | 0.0% |
| Total | 1,572 | 100.0% |
Employment Status by Age in Cold Spring Harbor
According to the labor force statistics for Cold Spring Harbor, out of the total population over 16 years of age (2,214), 72.8% or 1,612 individuals are in the labor force, with 2.5% or 40 of them unemployed. The age group with the highest labor force participation rate is 55 to 59 years, with 93.8% or 183 individuals in the labor force. Within the labor force, the 60 to 64 years age range has the highest percentage of unemployed individuals, with 7.4% or 14 of them being unemployed.
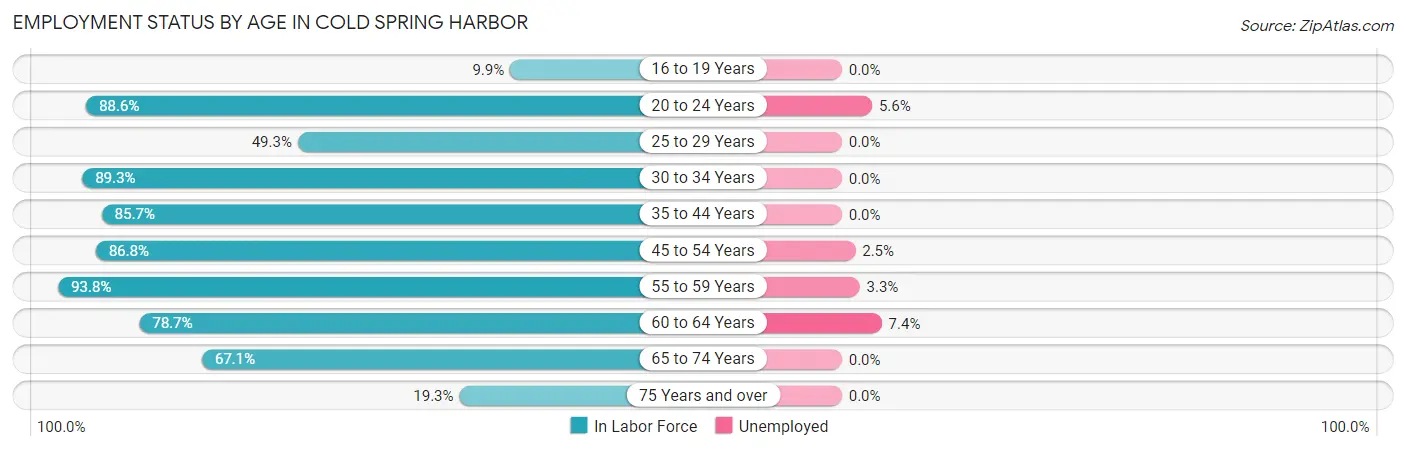
| Age Bracket | In Labor Force | Unemployed |
| 16 to 19 Years | 15 (9.9%) | 0 (0.0%) |
| 20 to 24 Years | 179 (88.6%) | 10 (5.6%) |
| 25 to 29 Years | 71 (49.3%) | 0 (0.0%) |
| 30 to 34 Years | 158 (89.3%) | 0 (0.0%) |
| 35 to 44 Years | 228 (85.7%) | 0 (0.0%) |
| 45 to 54 Years | 401 (86.8%) | 10 (2.5%) |
| 55 to 59 Years | 183 (93.8%) | 6 (3.3%) |
| 60 to 64 Years | 188 (78.7%) | 14 (7.4%) |
| 65 to 74 Years | 163 (67.1%) | 0 (0.0%) |
| 75 Years and over | 26 (19.3%) | 0 (0.0%) |
| Total | 1,612 (72.8%) | 40 (2.5%) |
Employment Status by Educational Attainment in Cold Spring Harbor
According to labor force statistics for Cold Spring Harbor, 82.9% of individuals (1,229) out of the total population between 25 and 64 years of age (1,483) are in the labor force, with 2.4% or 29 of them being unemployed. The group with the highest labor force participation rate are those with the educational attainment of high school diploma, with 90.6% or 58 individuals in the labor force. Within the labor force, individuals with bachelor's degree or higher education have the highest percentage of unemployment, with 3.0% or 30 of them being unemployed.
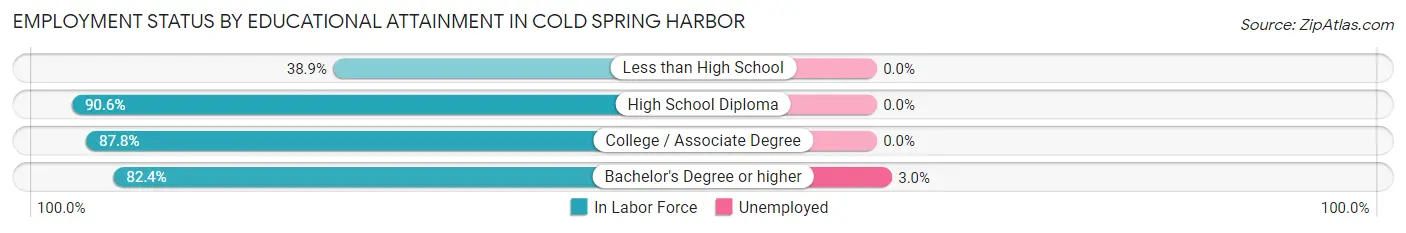
| Educational Attainment | In Labor Force | Unemployed |
| Less than High School | 7 (38.9%) | 0 (0.0%) |
| High School Diploma | 58 (90.6%) | 0 (0.0%) |
| College / Associate Degree | 151 (87.8%) | 0 (0.0%) |
| Bachelor's Degree or higher | 1,013 (82.4%) | 37 (3.0%) |
| Total | 1,229 (82.9%) | 36 (2.4%) |
Employment Occupations by Sex in Cold Spring Harbor
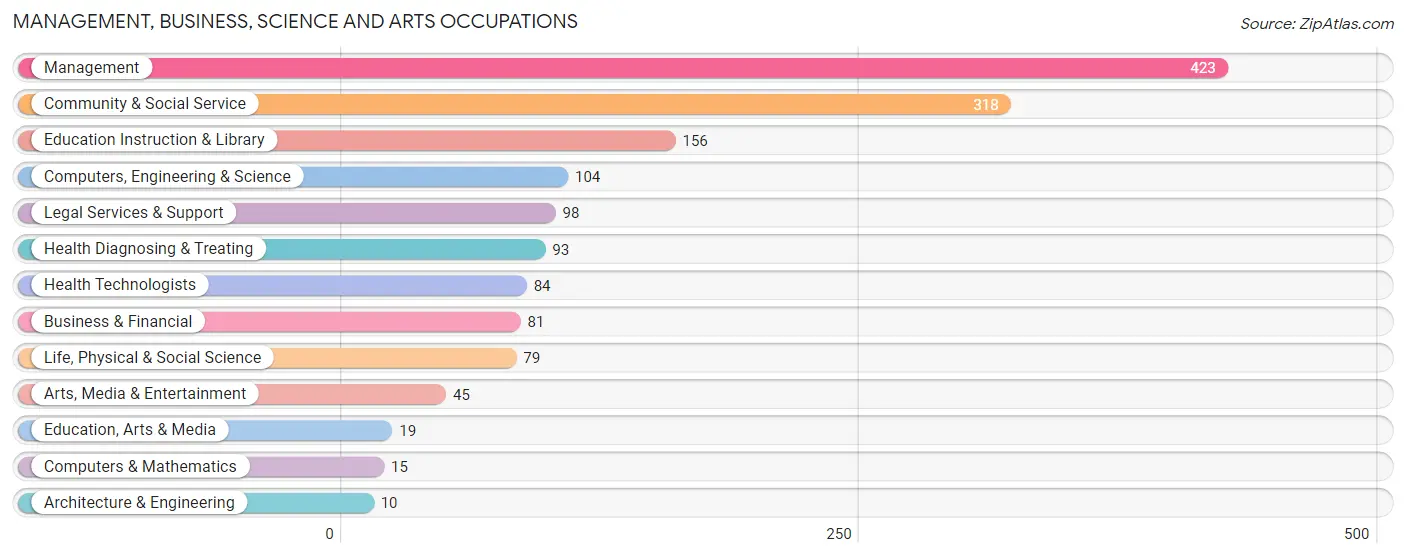
Management, Business, Science and Arts Occupations
The most common Management, Business, Science and Arts occupations in Cold Spring Harbor are Management (423 | 26.9%), Community & Social Service (318 | 20.2%), Education Instruction & Library (156 | 9.9%), Computers, Engineering & Science (104 | 6.6%), and Legal Services & Support (98 | 6.2%).
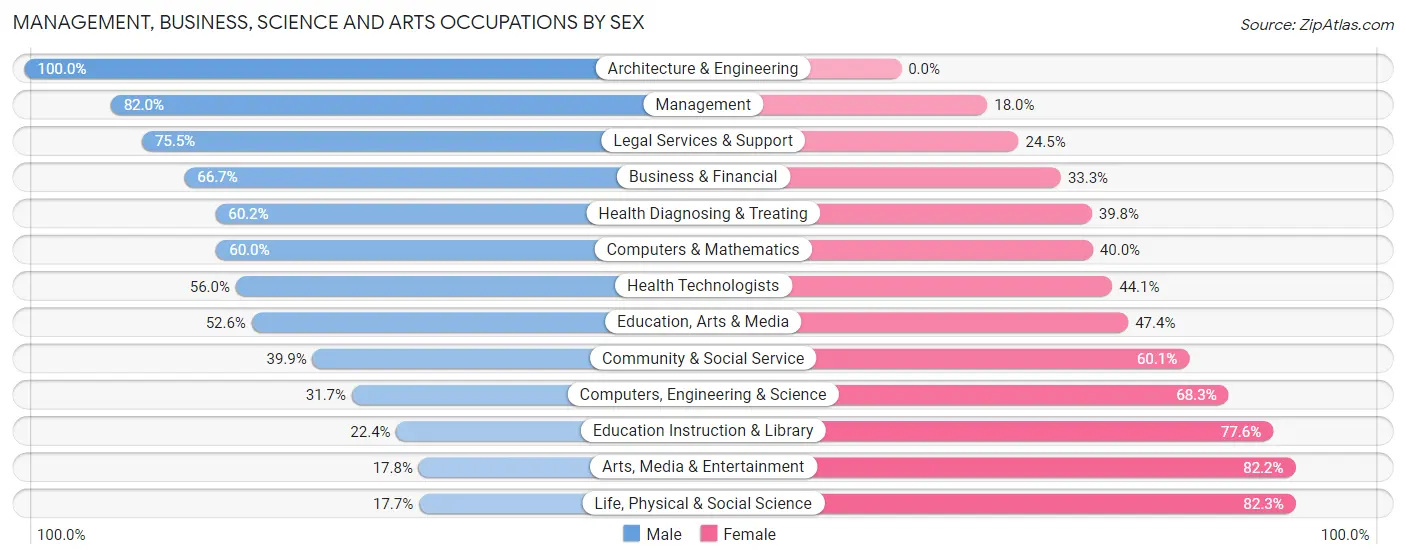
Management, Business, Science and Arts Occupations by Sex
Within the Management, Business, Science and Arts occupations in Cold Spring Harbor, the most male-oriented occupations are Architecture & Engineering (100.0%), Management (82.0%), and Legal Services & Support (75.5%), while the most female-oriented occupations are Life, Physical & Social Science (82.3%), Arts, Media & Entertainment (82.2%), and Education Instruction & Library (77.6%).
| Occupation | Male | Female |
| Management | 347 (82.0%) | 76 (18.0%) |
| Business & Financial | 54 (66.7%) | 27 (33.3%) |
| Computers, Engineering & Science | 33 (31.7%) | 71 (68.3%) |
| Computers & Mathematics | 9 (60.0%) | 6 (40.0%) |
| Architecture & Engineering | 10 (100.0%) | 0 (0.0%) |
| Life, Physical & Social Science | 14 (17.7%) | 65 (82.3%) |
| Community & Social Service | 127 (39.9%) | 191 (60.1%) |
| Education, Arts & Media | 10 (52.6%) | 9 (47.4%) |
| Legal Services & Support | 74 (75.5%) | 24 (24.5%) |
| Education Instruction & Library | 35 (22.4%) | 121 (77.6%) |
| Arts, Media & Entertainment | 8 (17.8%) | 37 (82.2%) |
| Health Diagnosing & Treating | 56 (60.2%) | 37 (39.8%) |
| Health Technologists | 47 (55.9%) | 37 (44.1%) |
| Total (Category) | 617 (60.6%) | 402 (39.5%) |
| Total (Overall) | 922 (58.7%) | 650 (41.3%) |
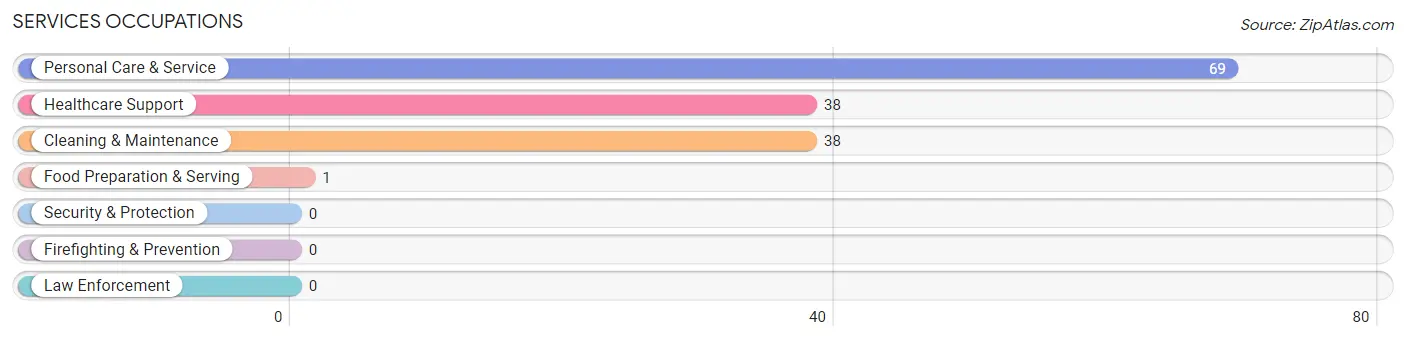
Services Occupations
The most common Services occupations in Cold Spring Harbor are Personal Care & Service (69 | 4.4%), Healthcare Support (38 | 2.4%), Cleaning & Maintenance (38 | 2.4%), and Food Preparation & Serving (1 | 0.1%).
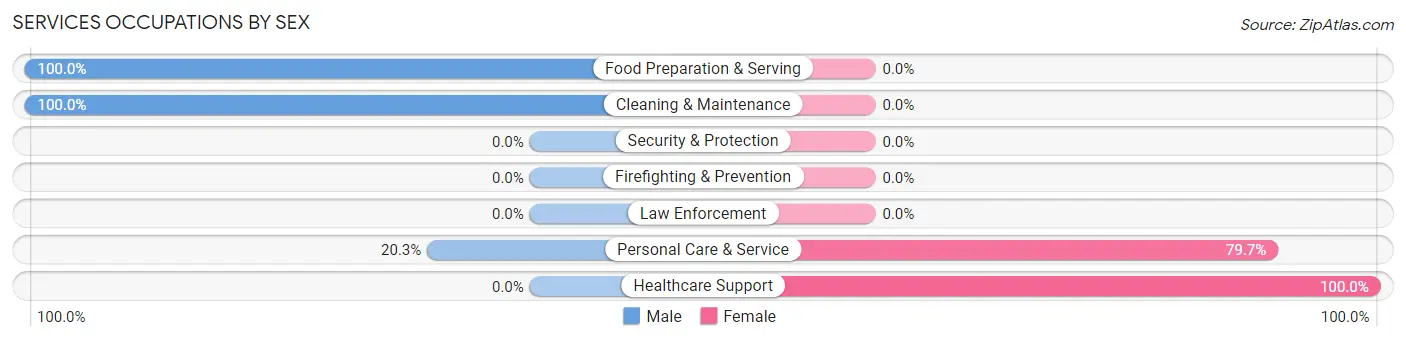
Services Occupations by Sex
Within the Services occupations in Cold Spring Harbor, the most male-oriented occupations are Food Preparation & Serving (100.0%), Cleaning & Maintenance (100.0%), and Personal Care & Service (20.3%), while the most female-oriented occupations are Healthcare Support (100.0%), and Personal Care & Service (79.7%).
| Occupation | Male | Female |
| Healthcare Support | 0 (0.0%) | 38 (100.0%) |
| Security & Protection | 0 (0.0%) | 0 (0.0%) |
| Firefighting & Prevention | 0 (0.0%) | 0 (0.0%) |
| Law Enforcement | 0 (0.0%) | 0 (0.0%) |
| Food Preparation & Serving | 1 (100.0%) | 0 (0.0%) |
| Cleaning & Maintenance | 38 (100.0%) | 0 (0.0%) |
| Personal Care & Service | 14 (20.3%) | 55 (79.7%) |
| Total (Category) | 53 (36.3%) | 93 (63.7%) |
| Total (Overall) | 922 (58.7%) | 650 (41.3%) |
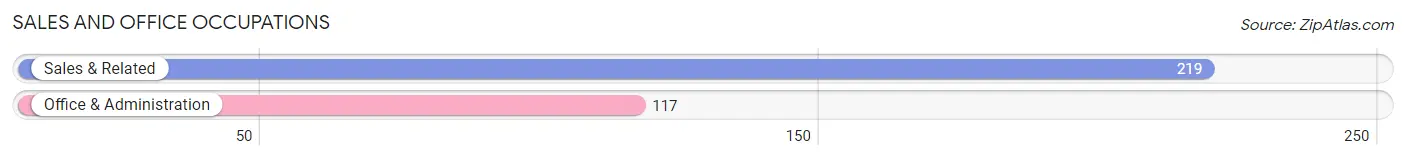
Sales and Office Occupations
The most common Sales and Office occupations in Cold Spring Harbor are Sales & Related (219 | 13.9%), and Office & Administration (117 | 7.4%).
Sales and Office Occupations by Sex
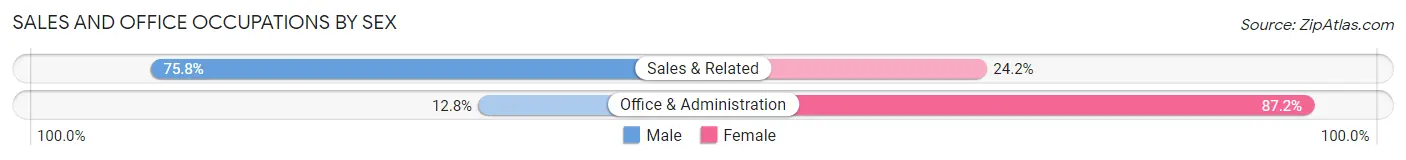
| Occupation | Male | Female |
| Sales & Related | 166 (75.8%) | 53 (24.2%) |
| Office & Administration | 15 (12.8%) | 102 (87.2%) |
| Total (Category) | 181 (53.9%) | 155 (46.1%) |
| Total (Overall) | 922 (58.7%) | 650 (41.3%) |
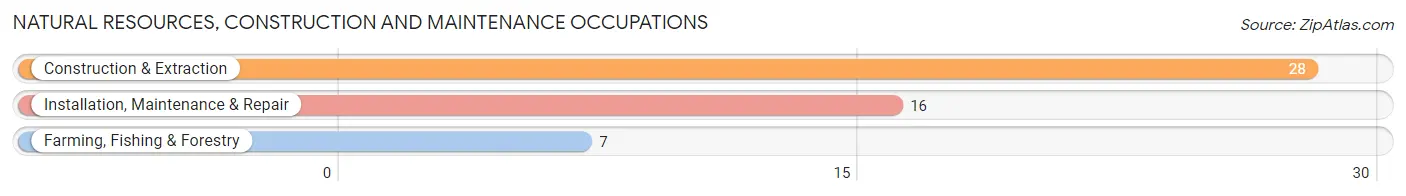
Natural Resources, Construction and Maintenance Occupations
The most common Natural Resources, Construction and Maintenance occupations in Cold Spring Harbor are Construction & Extraction (28 | 1.8%), Installation, Maintenance & Repair (16 | 1.0%), and Farming, Fishing & Forestry (7 | 0.4%).
Natural Resources, Construction and Maintenance Occupations by Sex
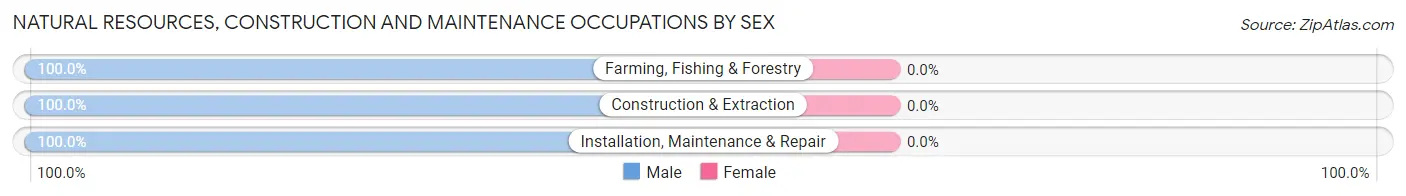
| Occupation | Male | Female |
| Farming, Fishing & Forestry | 7 (100.0%) | 0 (0.0%) |
| Construction & Extraction | 28 (100.0%) | 0 (0.0%) |
| Installation, Maintenance & Repair | 16 (100.0%) | 0 (0.0%) |
| Total (Category) | 51 (100.0%) | 0 (0.0%) |
| Total (Overall) | 922 (58.7%) | 650 (41.3%) |
Production, Transportation and Moving Occupations
The most common Production, Transportation and Moving occupations in Cold Spring Harbor are Production (11 | 0.7%), and Transportation (9 | 0.6%).
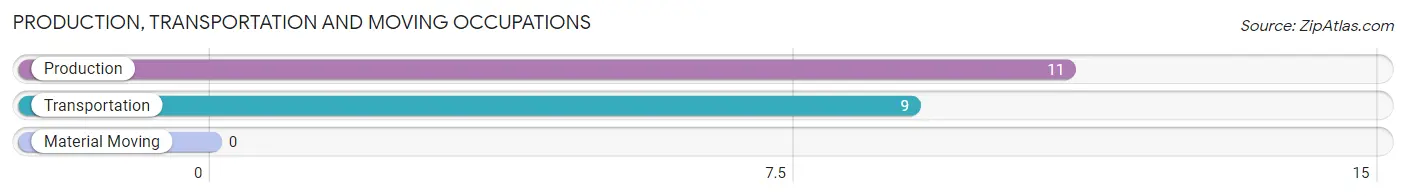
Production, Transportation and Moving Occupations by Sex
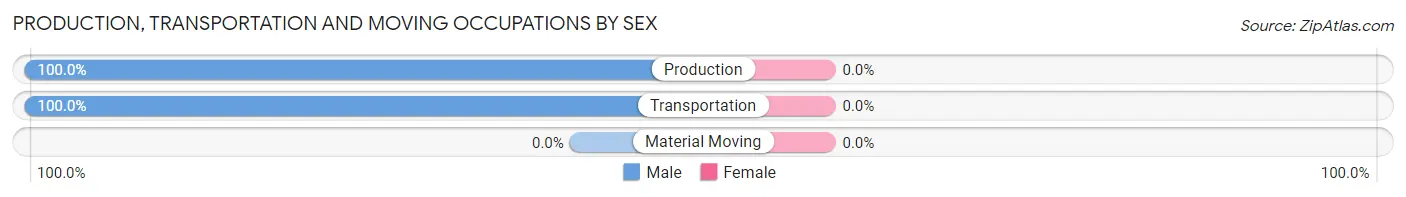
| Occupation | Male | Female |
| Production | 11 (100.0%) | 0 (0.0%) |
| Transportation | 9 (100.0%) | 0 (0.0%) |
| Material Moving | 0 (0.0%) | 0 (0.0%) |
| Total (Category) | 20 (100.0%) | 0 (0.0%) |
| Total (Overall) | 922 (58.7%) | 650 (41.3%) |
Employment Industries by Sex in Cold Spring Harbor
Employment Industries in Cold Spring Harbor
The major employment industries in Cold Spring Harbor include Professional & Scientific (303 | 19.3%), Health Care & Social Assistance (230 | 14.6%), Finance & Insurance (197 | 12.5%), Educational Services (177 | 11.3%), and Retail Trade (118 | 7.5%).
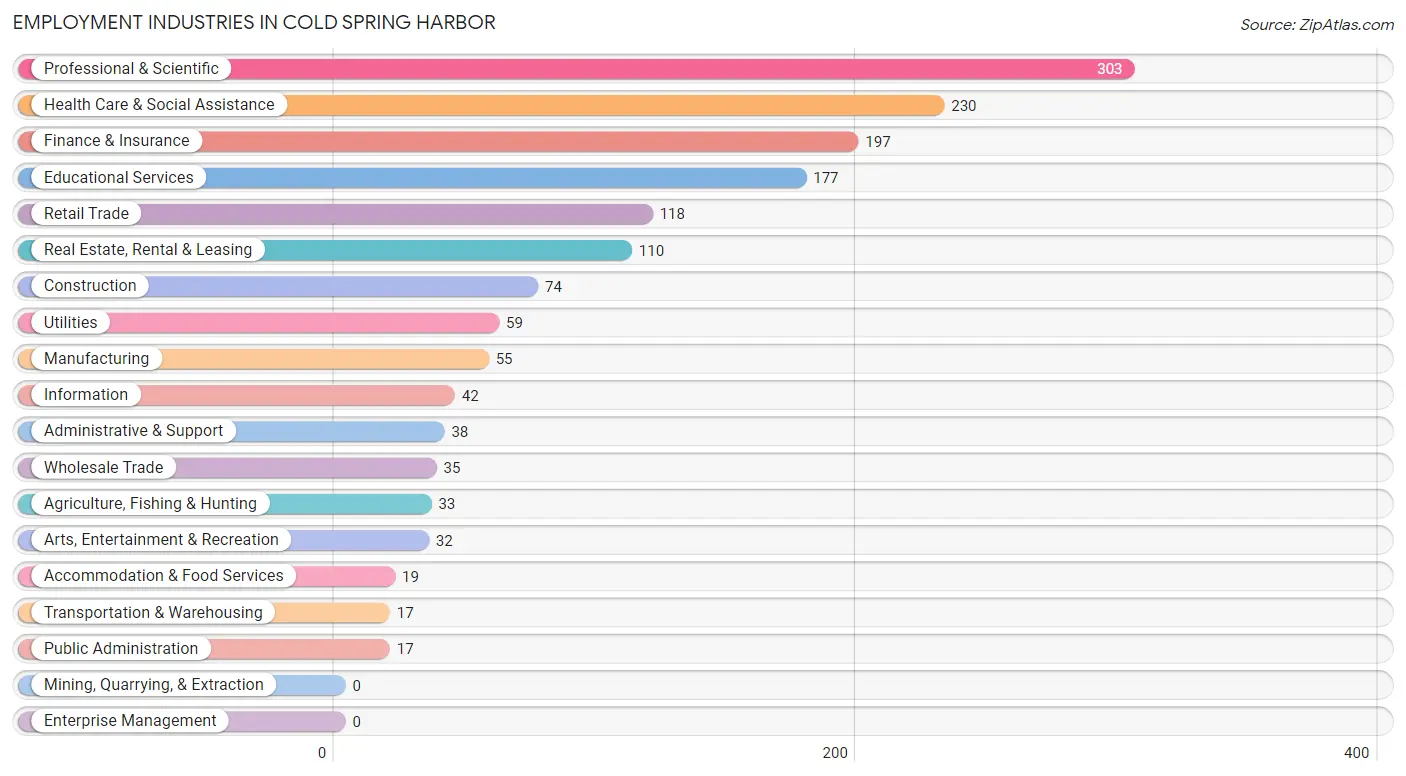
Employment Industries by Sex in Cold Spring Harbor
The Cold Spring Harbor industries that see more men than women are Wholesale Trade (100.0%), Transportation & Warehousing (100.0%), and Utilities (100.0%), whereas the industries that tend to have a higher number of women are Educational Services (85.9%), Arts, Entertainment & Recreation (71.9%), and Retail Trade (69.5%).
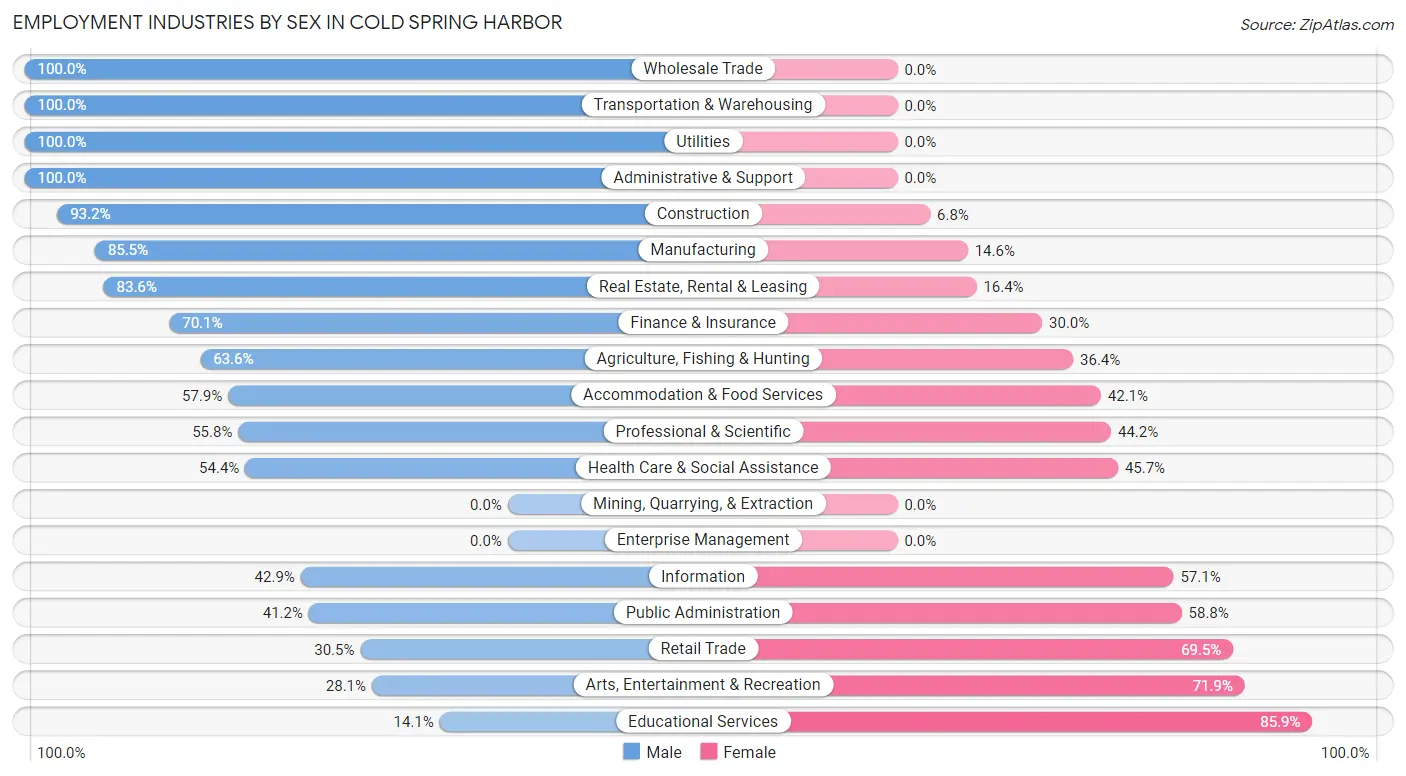
| Industry | Male | Female |
| Agriculture, Fishing & Hunting | 21 (63.6%) | 12 (36.4%) |
| Mining, Quarrying, & Extraction | 0 (0.0%) | 0 (0.0%) |
| Construction | 69 (93.2%) | 5 (6.8%) |
| Manufacturing | 47 (85.5%) | 8 (14.5%) |
| Wholesale Trade | 35 (100.0%) | 0 (0.0%) |
| Retail Trade | 36 (30.5%) | 82 (69.5%) |
| Transportation & Warehousing | 17 (100.0%) | 0 (0.0%) |
| Utilities | 59 (100.0%) | 0 (0.0%) |
| Information | 18 (42.9%) | 24 (57.1%) |
| Finance & Insurance | 138 (70.1%) | 59 (29.9%) |
| Real Estate, Rental & Leasing | 92 (83.6%) | 18 (16.4%) |
| Professional & Scientific | 169 (55.8%) | 134 (44.2%) |
| Enterprise Management | 0 (0.0%) | 0 (0.0%) |
| Administrative & Support | 38 (100.0%) | 0 (0.0%) |
| Educational Services | 25 (14.1%) | 152 (85.9%) |
| Health Care & Social Assistance | 125 (54.3%) | 105 (45.7%) |
| Arts, Entertainment & Recreation | 9 (28.1%) | 23 (71.9%) |
| Accommodation & Food Services | 11 (57.9%) | 8 (42.1%) |
| Public Administration | 7 (41.2%) | 10 (58.8%) |
| Total | 922 (58.7%) | 650 (41.3%) |
Education in Cold Spring Harbor
School Enrollment in Cold Spring Harbor
The most common levels of schooling among the 936 students in Cold Spring Harbor are high school (188 | 20.1%), elementary school (175 | 18.7%), and middle school (151 | 16.1%).
| School Level | # Students | % Students |
| Nursery / Preschool | 141 | 15.1% |
| Kindergarten | 87 | 9.3% |
| Elementary School | 175 | 18.7% |
| Middle School | 151 | 16.1% |
| High School | 188 | 20.1% |
| College / Undergraduate | 110 | 11.7% |
| Graduate / Professional | 84 | 9.0% |
| Total | 936 | 100.0% |
School Enrollment by Age by Funding Source in Cold Spring Harbor
Out of a total of 936 students who are enrolled in schools in Cold Spring Harbor, 255 (27.2%) attend a private institution, while the remaining 681 (72.8%) are enrolled in public schools. The age group of 35 years and over has the highest likelihood of being enrolled in private schools, with 65 (100.0% in the age bracket) enrolled. Conversely, the age group of 15 to 17 year olds has the lowest likelihood of being enrolled in a private school, with 137 (89.5% in the age bracket) attending a public institution.
| Age Bracket | Public School | Private School |
| 3 to 4 Year Olds | 88 (62.4%) | 53 (37.6%) |
| 5 to 9 Year Old | 221 (84.4%) | 41 (15.7%) |
| 10 to 14 Year Olds | 135 (78.0%) | 38 (22.0%) |
| 15 to 17 Year Olds | 137 (89.5%) | 16 (10.5%) |
| 18 to 19 Year Olds | 53 (88.3%) | 7 (11.7%) |
| 20 to 24 Year Olds | 36 (66.7%) | 18 (33.3%) |
| 25 to 34 Year Olds | 11 (39.3%) | 17 (60.7%) |
| 35 Years and over | 0 (0.0%) | 65 (100.0%) |
| Total | 681 (72.8%) | 255 (27.2%) |
Educational Attainment by Field of Study in Cold Spring Harbor
Business (340 | 20.5%), social sciences (218 | 13.2%), education (189 | 11.4%), psychology (159 | 9.6%), and visual & performing arts (124 | 7.5%) are the most common fields of study among 1,658 individuals in Cold Spring Harbor who have obtained a bachelor's degree or higher.
| Field of Study | # Graduates | % Graduates |
| Computers & Mathematics | 80 | 4.8% |
| Bio, Nature & Agricultural | 95 | 5.7% |
| Physical & Health Sciences | 45 | 2.7% |
| Psychology | 159 | 9.6% |
| Social Sciences | 218 | 13.2% |
| Engineering | 68 | 4.1% |
| Multidisciplinary Studies | 8 | 0.5% |
| Science & Technology | 98 | 5.9% |
| Business | 340 | 20.5% |
| Education | 189 | 11.4% |
| Literature & Languages | 27 | 1.6% |
| Liberal Arts & History | 111 | 6.7% |
| Visual & Performing Arts | 124 | 7.5% |
| Communications | 55 | 3.3% |
| Arts & Humanities | 41 | 2.5% |
| Total | 1,658 | 100.0% |
Transportation & Commute in Cold Spring Harbor
Vehicle Availability by Sex in Cold Spring Harbor
The most prevalent vehicle ownership categories in Cold Spring Harbor are males with 2 vehicles (383, accounting for 42.0%) and females with 2 vehicles (277, making up 59.8%).
| Vehicles Available | Male | Female |
| No Vehicle | 59 (6.5%) | 0 (0.0%) |
| 1 Vehicle | 63 (6.9%) | 42 (6.6%) |
| 2 Vehicles | 383 (42.0%) | 277 (43.2%) |
| 3 Vehicles | 207 (22.7%) | 141 (22.0%) |
| 4 Vehicles | 89 (9.8%) | 83 (13.0%) |
| 5 or more Vehicles | 111 (12.2%) | 98 (15.3%) |
| Total | 912 (100.0%) | 641 (100.0%) |
Commute Time in Cold Spring Harbor
The most frequently occuring commute durations in Cold Spring Harbor are 25 to 29 minutes (207 commuters, 17.7%), 60 to 89 minutes (169 commuters, 14.5%), and 15 to 19 minutes (120 commuters, 10.3%).
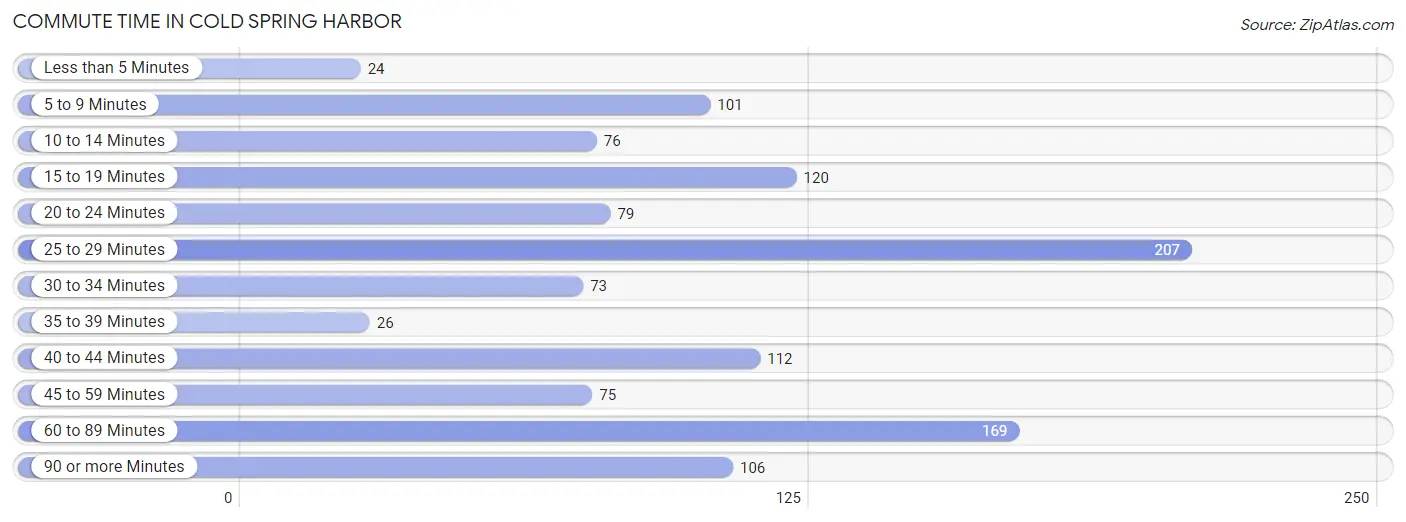
| Commute Time | # Commuters | % Commuters |
| Less than 5 Minutes | 24 | 2.1% |
| 5 to 9 Minutes | 101 | 8.6% |
| 10 to 14 Minutes | 76 | 6.5% |
| 15 to 19 Minutes | 120 | 10.3% |
| 20 to 24 Minutes | 79 | 6.8% |
| 25 to 29 Minutes | 207 | 17.7% |
| 30 to 34 Minutes | 73 | 6.2% |
| 35 to 39 Minutes | 26 | 2.2% |
| 40 to 44 Minutes | 112 | 9.6% |
| 45 to 59 Minutes | 75 | 6.4% |
| 60 to 89 Minutes | 169 | 14.5% |
| 90 or more Minutes | 106 | 9.1% |
Commute Time by Sex in Cold Spring Harbor
The most common commute times in Cold Spring Harbor are 25 to 29 minutes (106 commuters, 15.7%) for males and 25 to 29 minutes (101 commuters, 20.6%) for females.
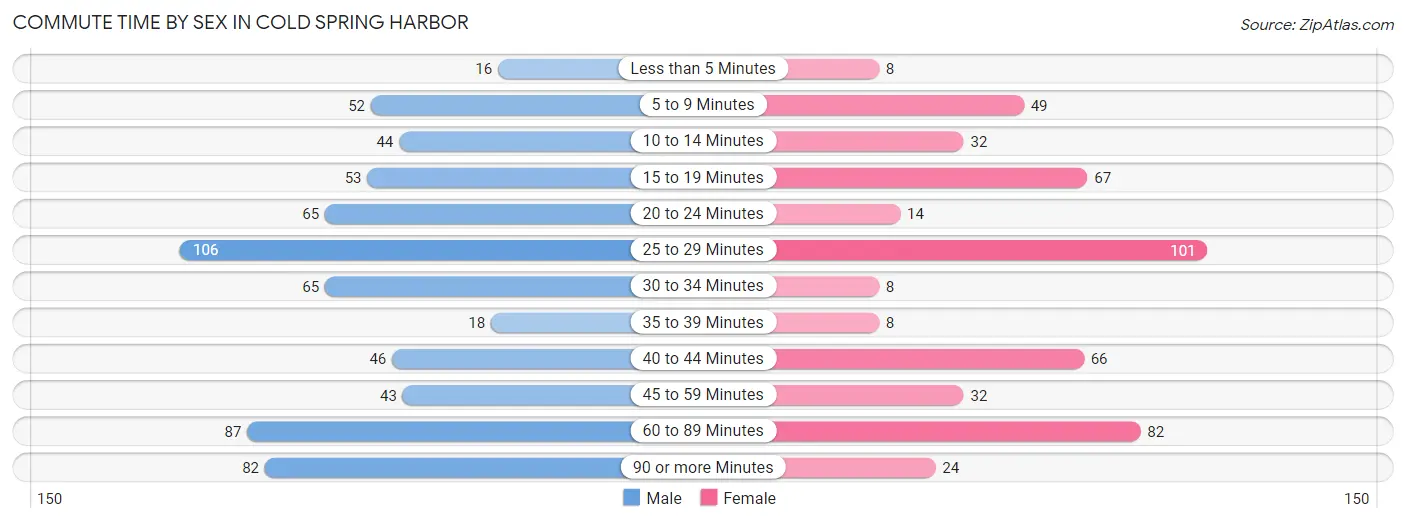
| Commute Time | Male | Female |
| Less than 5 Minutes | 16 (2.4%) | 8 (1.6%) |
| 5 to 9 Minutes | 52 (7.7%) | 49 (10.0%) |
| 10 to 14 Minutes | 44 (6.5%) | 32 (6.5%) |
| 15 to 19 Minutes | 53 (7.8%) | 67 (13.7%) |
| 20 to 24 Minutes | 65 (9.6%) | 14 (2.9%) |
| 25 to 29 Minutes | 106 (15.7%) | 101 (20.6%) |
| 30 to 34 Minutes | 65 (9.6%) | 8 (1.6%) |
| 35 to 39 Minutes | 18 (2.7%) | 8 (1.6%) |
| 40 to 44 Minutes | 46 (6.8%) | 66 (13.4%) |
| 45 to 59 Minutes | 43 (6.4%) | 32 (6.5%) |
| 60 to 89 Minutes | 87 (12.9%) | 82 (16.7%) |
| 90 or more Minutes | 82 (12.1%) | 24 (4.9%) |
Time of Departure to Work by Sex in Cold Spring Harbor
The most frequent times of departure to work in Cold Spring Harbor are 8:00 AM to 8:29 AM (105, 15.5%) for males and 8:30 AM to 8:59 AM (124, 25.3%) for females.

| Time of Departure | Male | Female |
| 12:00 AM to 4:59 AM | 45 (6.7%) | 0 (0.0%) |
| 5:00 AM to 5:29 AM | 9 (1.3%) | 0 (0.0%) |
| 5:30 AM to 5:59 AM | 95 (14.0%) | 0 (0.0%) |
| 6:00 AM to 6:29 AM | 51 (7.5%) | 39 (7.9%) |
| 6:30 AM to 6:59 AM | 27 (4.0%) | 45 (9.2%) |
| 7:00 AM to 7:29 AM | 77 (11.4%) | 70 (14.3%) |
| 7:30 AM to 7:59 AM | 46 (6.8%) | 49 (10.0%) |
| 8:00 AM to 8:29 AM | 105 (15.5%) | 71 (14.5%) |
| 8:30 AM to 8:59 AM | 71 (10.5%) | 124 (25.3%) |
| 9:00 AM to 9:59 AM | 78 (11.5%) | 72 (14.7%) |
| 10:00 AM to 10:59 AM | 51 (7.5%) | 0 (0.0%) |
| 11:00 AM to 11:59 AM | 13 (1.9%) | 0 (0.0%) |
| 12:00 PM to 3:59 PM | 9 (1.3%) | 18 (3.7%) |
| 4:00 PM to 11:59 PM | 0 (0.0%) | 3 (0.6%) |
| Total | 677 (100.0%) | 491 (100.0%) |
Housing Occupancy in Cold Spring Harbor
Occupancy by Ownership in Cold Spring Harbor
Of the total 967 dwellings in Cold Spring Harbor, owner-occupied units account for 948 (98.0%), while renter-occupied units make up 19 (2.0%).
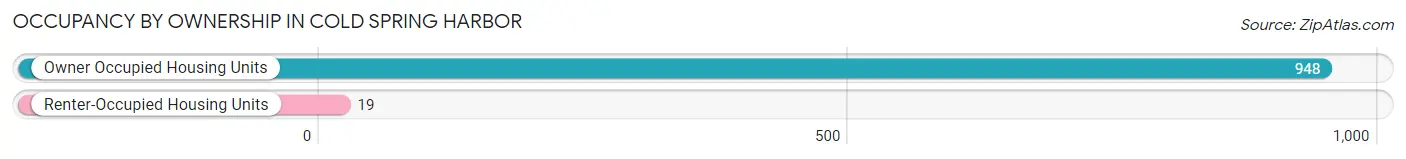
| Occupancy | # Housing Units | % Housing Units |
| Owner Occupied Housing Units | 948 | 98.0% |
| Renter-Occupied Housing Units | 19 | 2.0% |
| Total Occupied Housing Units | 967 | 100.0% |
Occupancy by Household Size in Cold Spring Harbor
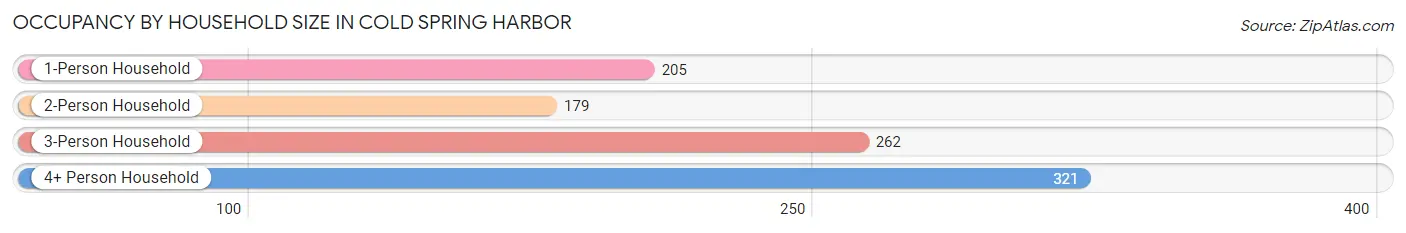
| Household Size | # Housing Units | % Housing Units |
| 1-Person Household | 205 | 21.2% |
| 2-Person Household | 179 | 18.5% |
| 3-Person Household | 262 | 27.1% |
| 4+ Person Household | 321 | 33.2% |
| Total Housing Units | 967 | 100.0% |
Occupancy by Ownership by Household Size in Cold Spring Harbor
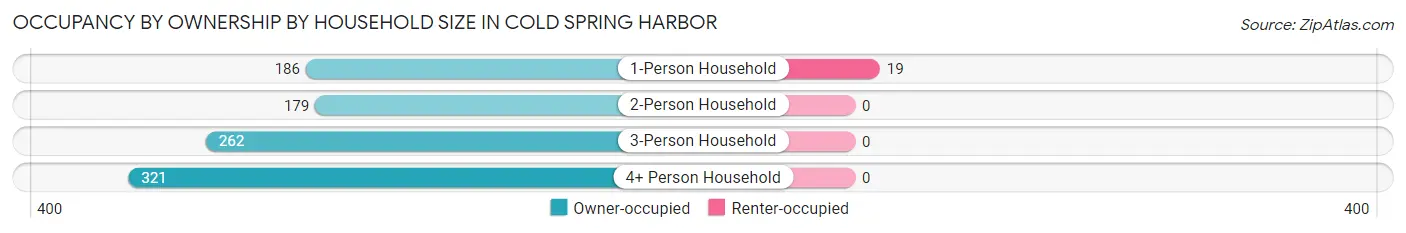
| Household Size | Owner-occupied | Renter-occupied |
| 1-Person Household | 186 (90.7%) | 19 (9.3%) |
| 2-Person Household | 179 (100.0%) | 0 (0.0%) |
| 3-Person Household | 262 (100.0%) | 0 (0.0%) |
| 4+ Person Household | 321 (100.0%) | 0 (0.0%) |
| Total Housing Units | 948 (98.0%) | 19 (2.0%) |
Occupancy by Educational Attainment in Cold Spring Harbor
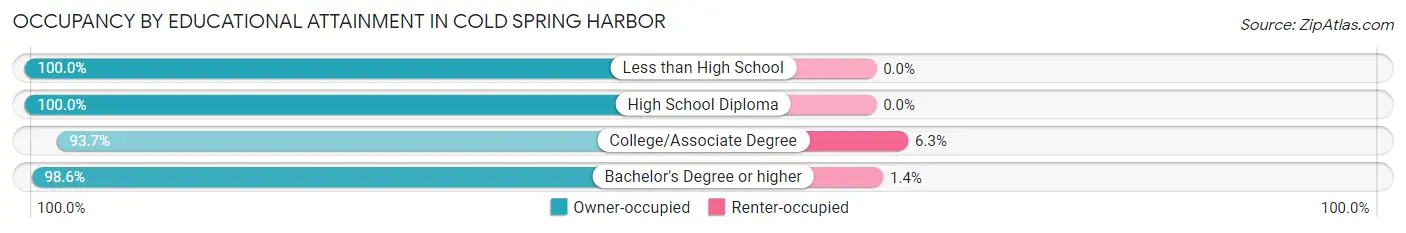
| Household Size | Owner-occupied | Renter-occupied |
| Less than High School | 43 (100.0%) | 0 (0.0%) |
| High School Diploma | 50 (100.0%) | 0 (0.0%) |
| College/Associate Degree | 133 (93.7%) | 9 (6.3%) |
| Bachelor's Degree or higher | 722 (98.6%) | 10 (1.4%) |
Occupancy by Age of Householder in Cold Spring Harbor
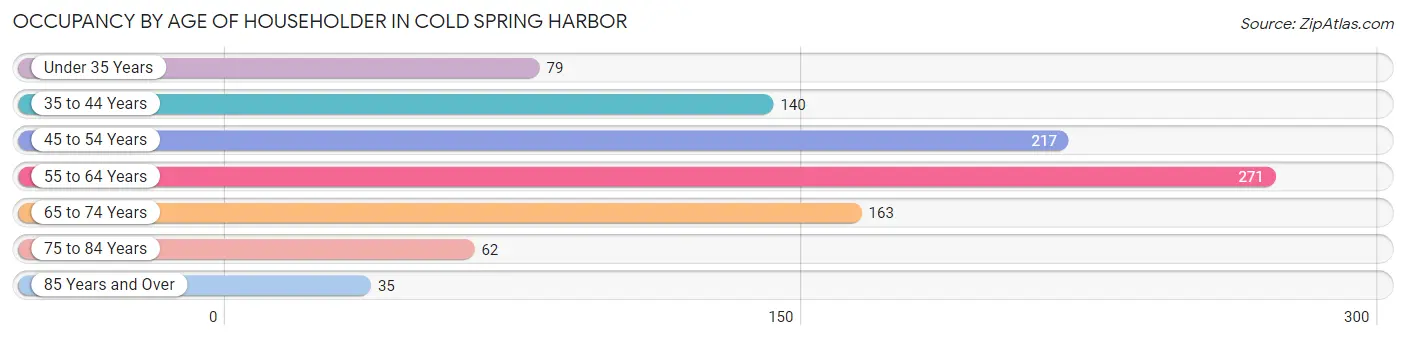
| Age Bracket | # Households | % Households |
| Under 35 Years | 79 | 8.2% |
| 35 to 44 Years | 140 | 14.5% |
| 45 to 54 Years | 217 | 22.4% |
| 55 to 64 Years | 271 | 28.0% |
| 65 to 74 Years | 163 | 16.9% |
| 75 to 84 Years | 62 | 6.4% |
| 85 Years and Over | 35 | 3.6% |
| Total | 967 | 100.0% |
Housing Finances in Cold Spring Harbor
Median Income by Occupancy in Cold Spring Harbor
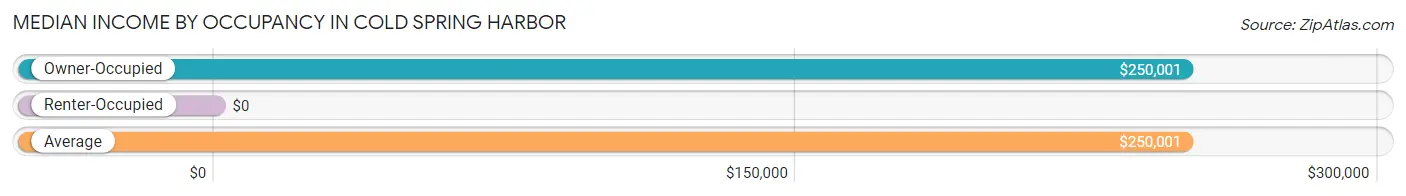
| Occupancy Type | # Households | Median Income |
| Owner-Occupied | 948 (98.0%) | $250,001 |
| Renter-Occupied | 19 (2.0%) | $0 |
| Average | 967 (100.0%) | $250,001 |
Occupancy by Householder Income Bracket in Cold Spring Harbor
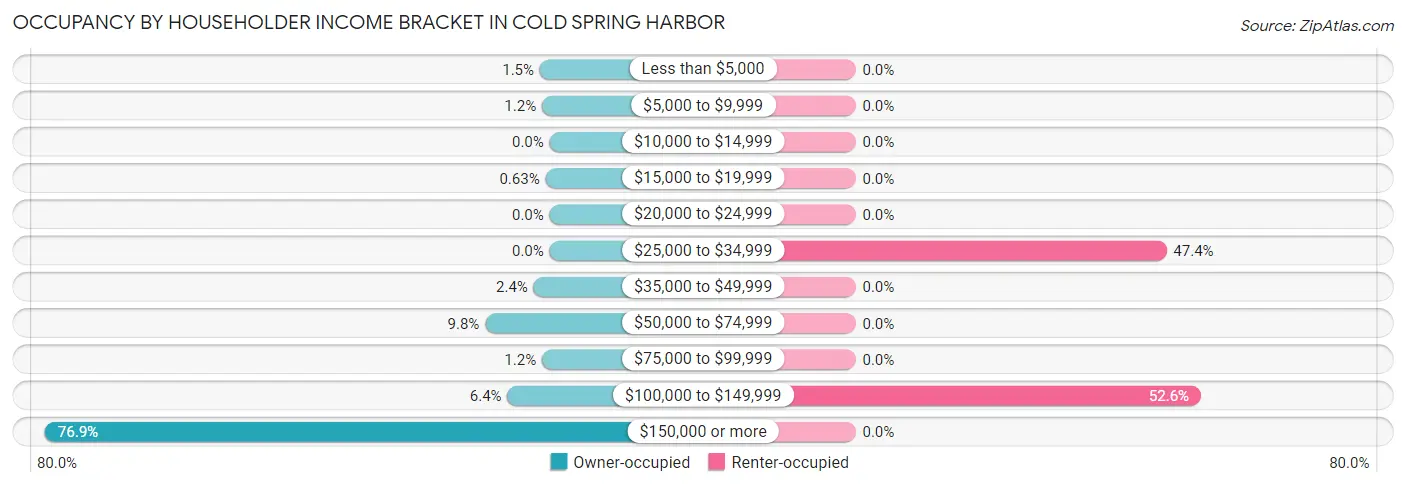
| Income Bracket | Owner-occupied | Renter-occupied |
| Less than $5,000 | 14 (1.5%) | 0 (0.0%) |
| $5,000 to $9,999 | 11 (1.2%) | 0 (0.0%) |
| $10,000 to $14,999 | 0 (0.0%) | 0 (0.0%) |
| $15,000 to $19,999 | 6 (0.6%) | 0 (0.0%) |
| $20,000 to $24,999 | 0 (0.0%) | 0 (0.0%) |
| $25,000 to $34,999 | 0 (0.0%) | 9 (47.4%) |
| $35,000 to $49,999 | 23 (2.4%) | 0 (0.0%) |
| $50,000 to $74,999 | 93 (9.8%) | 0 (0.0%) |
| $75,000 to $99,999 | 11 (1.2%) | 0 (0.0%) |
| $100,000 to $149,999 | 61 (6.4%) | 10 (52.6%) |
| $150,000 or more | 729 (76.9%) | 0 (0.0%) |
| Total | 948 (100.0%) | 19 (100.0%) |
Monthly Housing Cost Tiers in Cold Spring Harbor
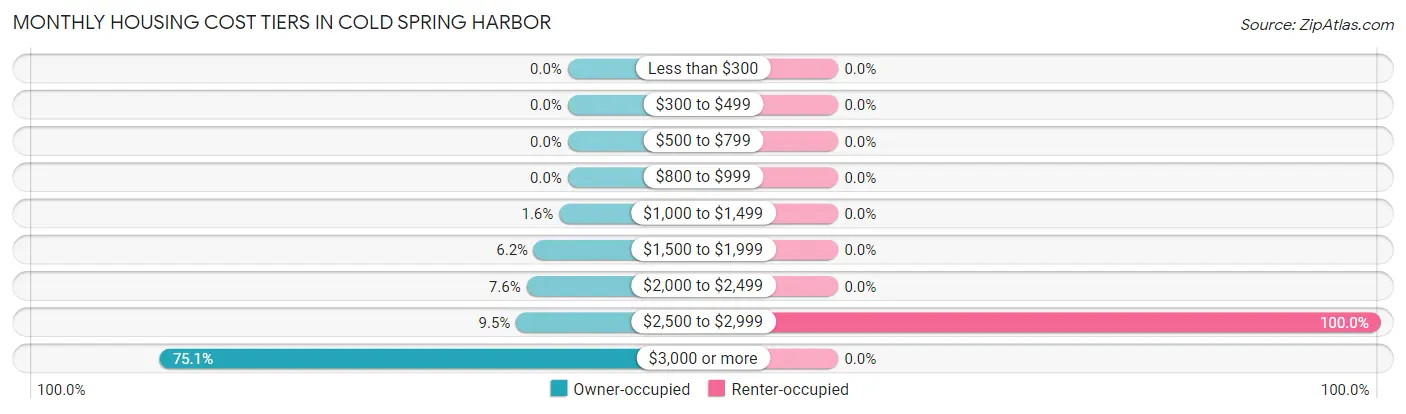
| Monthly Cost | Owner-occupied | Renter-occupied |
| Less than $300 | 0 (0.0%) | 0 (0.0%) |
| $300 to $499 | 0 (0.0%) | 0 (0.0%) |
| $500 to $799 | 0 (0.0%) | 0 (0.0%) |
| $800 to $999 | 0 (0.0%) | 0 (0.0%) |
| $1,000 to $1,499 | 15 (1.6%) | 0 (0.0%) |
| $1,500 to $1,999 | 59 (6.2%) | 0 (0.0%) |
| $2,000 to $2,499 | 72 (7.6%) | 0 (0.0%) |
| $2,500 to $2,999 | 90 (9.5%) | 19 (100.0%) |
| $3,000 or more | 712 (75.1%) | 0 (0.0%) |
| Total | 948 (100.0%) | 19 (100.0%) |
Physical Housing Characteristics in Cold Spring Harbor
Housing Structures in Cold Spring Harbor
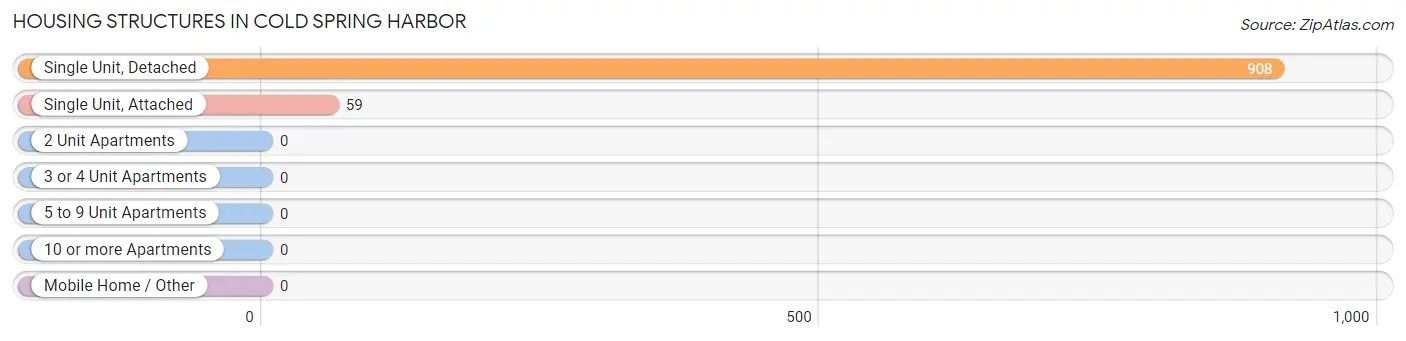
| Structure Type | # Housing Units | % Housing Units |
| Single Unit, Detached | 908 | 93.9% |
| Single Unit, Attached | 59 | 6.1% |
| 2 Unit Apartments | 0 | 0.0% |
| 3 or 4 Unit Apartments | 0 | 0.0% |
| 5 to 9 Unit Apartments | 0 | 0.0% |
| 10 or more Apartments | 0 | 0.0% |
| Mobile Home / Other | 0 | 0.0% |
| Total | 967 | 100.0% |
Housing Structures by Occupancy in Cold Spring Harbor
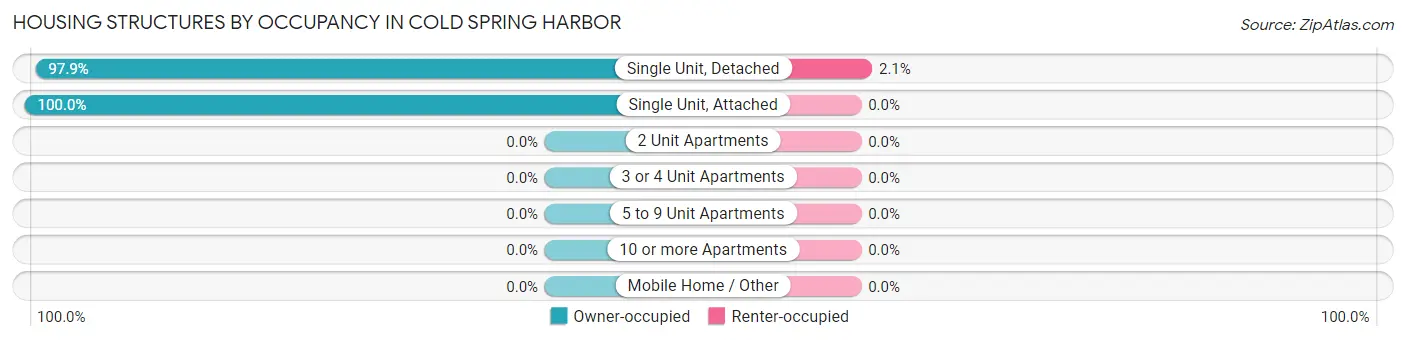
| Structure Type | Owner-occupied | Renter-occupied |
| Single Unit, Detached | 889 (97.9%) | 19 (2.1%) |
| Single Unit, Attached | 59 (100.0%) | 0 (0.0%) |
| 2 Unit Apartments | 0 (0.0%) | 0 (0.0%) |
| 3 or 4 Unit Apartments | 0 (0.0%) | 0 (0.0%) |
| 5 to 9 Unit Apartments | 0 (0.0%) | 0 (0.0%) |
| 10 or more Apartments | 0 (0.0%) | 0 (0.0%) |
| Mobile Home / Other | 0 (0.0%) | 0 (0.0%) |
| Total | 948 (98.0%) | 19 (2.0%) |
Housing Structures by Number of Rooms in Cold Spring Harbor
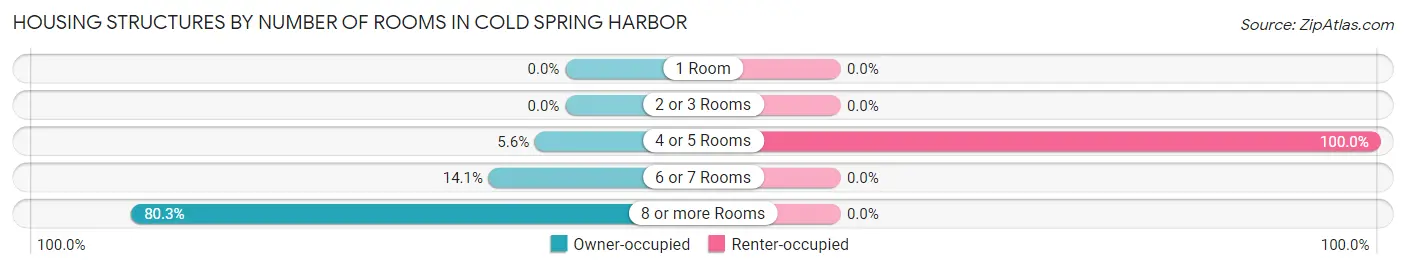
| Number of Rooms | Owner-occupied | Renter-occupied |
| 1 Room | 0 (0.0%) | 0 (0.0%) |
| 2 or 3 Rooms | 0 (0.0%) | 0 (0.0%) |
| 4 or 5 Rooms | 53 (5.6%) | 19 (100.0%) |
| 6 or 7 Rooms | 134 (14.1%) | 0 (0.0%) |
| 8 or more Rooms | 761 (80.3%) | 0 (0.0%) |
| Total | 948 (100.0%) | 19 (100.0%) |
Housing Structure by Heating Type in Cold Spring Harbor
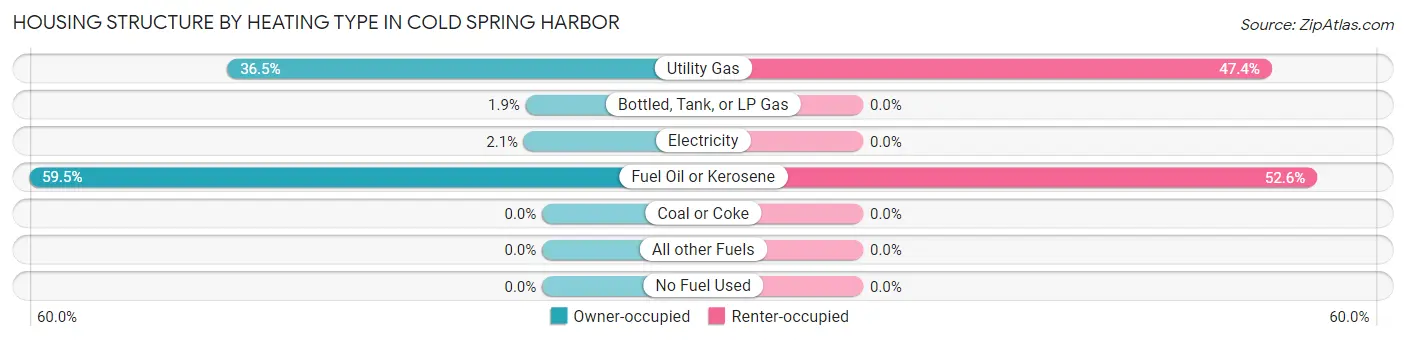
| Heating Type | Owner-occupied | Renter-occupied |
| Utility Gas | 346 (36.5%) | 9 (47.4%) |
| Bottled, Tank, or LP Gas | 18 (1.9%) | 0 (0.0%) |
| Electricity | 20 (2.1%) | 0 (0.0%) |
| Fuel Oil or Kerosene | 564 (59.5%) | 10 (52.6%) |
| Coal or Coke | 0 (0.0%) | 0 (0.0%) |
| All other Fuels | 0 (0.0%) | 0 (0.0%) |
| No Fuel Used | 0 (0.0%) | 0 (0.0%) |
| Total | 948 (100.0%) | 19 (100.0%) |
Household Vehicle Usage in Cold Spring Harbor
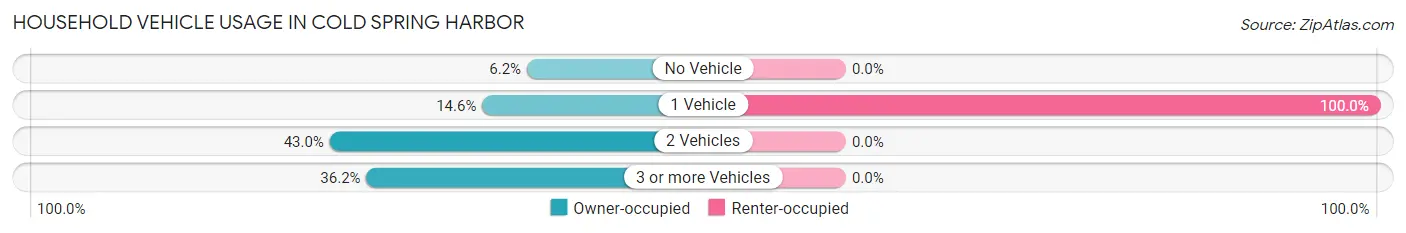
| Vehicles per Household | Owner-occupied | Renter-occupied |
| No Vehicle | 59 (6.2%) | 0 (0.0%) |
| 1 Vehicle | 138 (14.6%) | 19 (100.0%) |
| 2 Vehicles | 408 (43.0%) | 0 (0.0%) |
| 3 or more Vehicles | 343 (36.2%) | 0 (0.0%) |
| Total | 948 (100.0%) | 19 (100.0%) |
Real Estate & Mortgages in Cold Spring Harbor
Real Estate and Mortgage Overview in Cold Spring Harbor
| Characteristic | Without Mortgage | With Mortgage |
| Housing Units | 315 | 633 |
| Median Property Value | $1,190,500 | $1,508,200 |
| Median Household Income | $157,361 | $563 |
| Monthly Housing Costs | $1,501 | $606 |
| Real Estate Taxes | $10,001 | $0 |
Property Value by Mortgage Status in Cold Spring Harbor
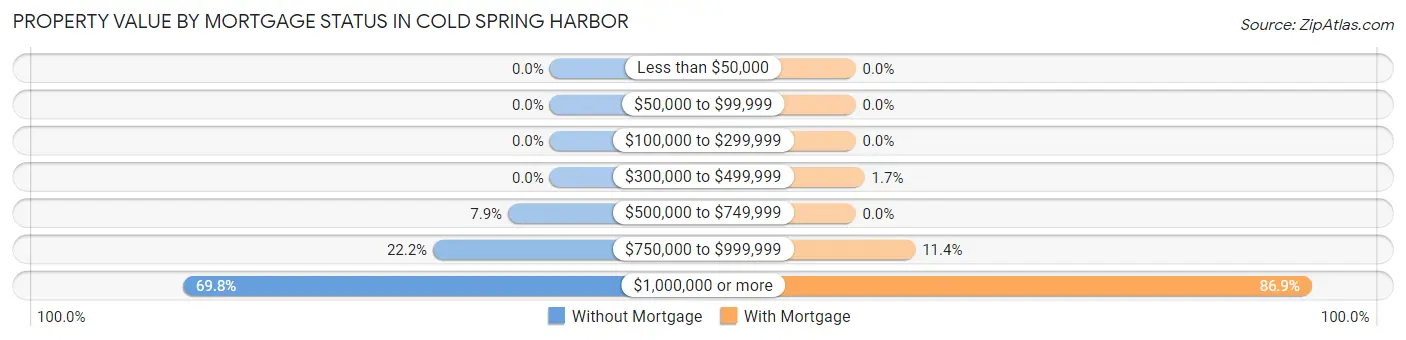
| Property Value | Without Mortgage | With Mortgage |
| Less than $50,000 | 0 (0.0%) | 0 (0.0%) |
| $50,000 to $99,999 | 0 (0.0%) | 0 (0.0%) |
| $100,000 to $299,999 | 0 (0.0%) | 0 (0.0%) |
| $300,000 to $499,999 | 0 (0.0%) | 11 (1.7%) |
| $500,000 to $749,999 | 25 (7.9%) | 0 (0.0%) |
| $750,000 to $999,999 | 70 (22.2%) | 72 (11.4%) |
| $1,000,000 or more | 220 (69.8%) | 550 (86.9%) |
| Total | 315 (100.0%) | 633 (100.0%) |
Household Income by Mortgage Status in Cold Spring Harbor
| Household Income | Without Mortgage | With Mortgage |
| Less than $10,000 | 25 (7.9%) | 0 (0.0%) |
| $10,000 to $24,999 | 6 (1.9%) | 0 (0.0%) |
| $25,000 to $34,999 | 0 (0.0%) | 0 (0.0%) |
| $35,000 to $49,999 | 8 (2.5%) | 0 (0.0%) |
| $50,000 to $74,999 | 80 (25.4%) | 15 (2.4%) |
| $75,000 to $99,999 | 6 (1.9%) | 13 (2.1%) |
| $100,000 to $149,999 | 24 (7.6%) | 5 (0.8%) |
| $150,000 or more | 166 (52.7%) | 37 (5.9%) |
| Total | 315 (100.0%) | 633 (100.0%) |
Property Value to Household Income Ratio in Cold Spring Harbor
| Value-to-Income Ratio | Without Mortgage | With Mortgage |
| Less than 2.0x | 32 (10.2%) | 250,001 (39,494.6%) |
| 2.0x to 2.9x | 7 (2.2%) | 27 (4.3%) |
| 3.0x to 3.9x | 30 (9.5%) | 58 (9.2%) |
| 4.0x or more | 232 (73.7%) | 185 (29.2%) |
| Total | 315 (100.0%) | 633 (100.0%) |
Real Estate Taxes by Mortgage Status in Cold Spring Harbor
| Property Taxes | Without Mortgage | With Mortgage |
| Less than $800 | 0 (0.0%) | 0 (0.0%) |
| $800 to $1,499 | 0 (0.0%) | 0 (0.0%) |
| $800 to $1,499 | 315 (100.0%) | 0 (0.0%) |
| Total | 315 (100.0%) | 633 (100.0%) |
Health & Disability in Cold Spring Harbor
Health Insurance Coverage by Age in Cold Spring Harbor
| Age Bracket | With Coverage | Without Coverage |
| Under 6 Years | 308 (100.0%) | 0 (0.0%) |
| 6 to 18 Years | 592 (100.0%) | 0 (0.0%) |
| 19 to 25 Years | 255 (100.0%) | 0 (0.0%) |
| 26 to 34 Years | 283 (99.7%) | 1 (0.4%) |
| 35 to 44 Years | 252 (94.7%) | 14 (5.3%) |
| 45 to 54 Years | 445 (96.3%) | 17 (3.7%) |
| 55 to 64 Years | 424 (97.7%) | 10 (2.3%) |
| 65 to 74 Years | 243 (100.0%) | 0 (0.0%) |
| 75 Years and older | 135 (100.0%) | 0 (0.0%) |
| Total | 2,937 (98.6%) | 42 (1.4%) |
Health Insurance Coverage by Citizenship Status in Cold Spring Harbor
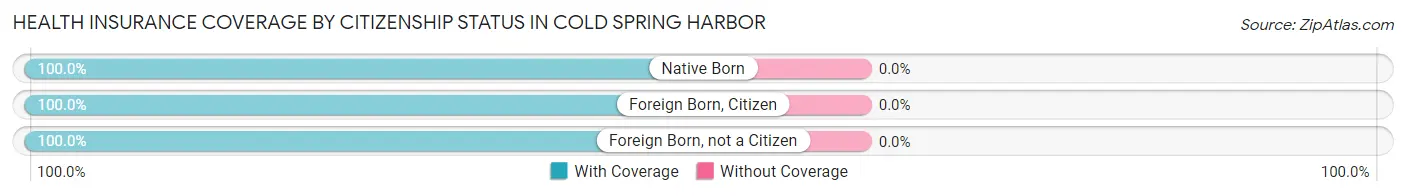
| Citizenship Status | With Coverage | Without Coverage |
| Native Born | 308 (100.0%) | 0 (0.0%) |
| Foreign Born, Citizen | 592 (100.0%) | 0 (0.0%) |
| Foreign Born, not a Citizen | 255 (100.0%) | 0 (0.0%) |
Health Insurance Coverage by Household Income in Cold Spring Harbor
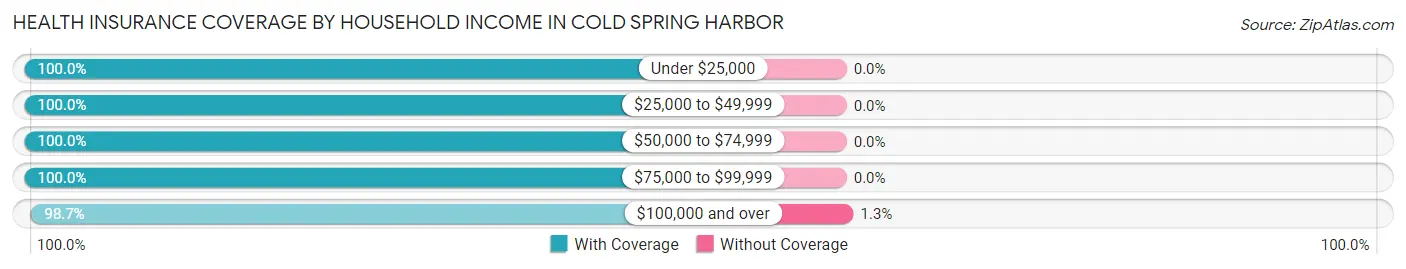
| Household Income | With Coverage | Without Coverage |
| Under $25,000 | 31 (100.0%) | 0 (0.0%) |
| $25,000 to $49,999 | 32 (100.0%) | 0 (0.0%) |
| $50,000 to $74,999 | 144 (100.0%) | 0 (0.0%) |
| $75,000 to $99,999 | 22 (100.0%) | 0 (0.0%) |
| $100,000 and over | 2,626 (98.7%) | 34 (1.3%) |
Public vs Private Health Insurance Coverage by Age in Cold Spring Harbor
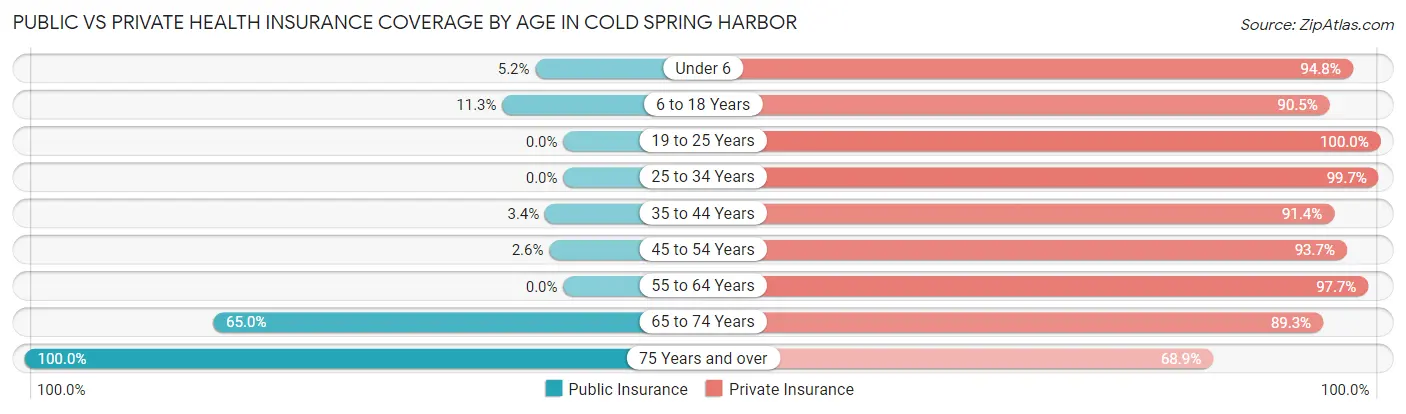
| Age Bracket | Public Insurance | Private Insurance |
| Under 6 | 16 (5.2%) | 292 (94.8%) |
| 6 to 18 Years | 67 (11.3%) | 536 (90.5%) |
| 19 to 25 Years | 0 (0.0%) | 255 (100.0%) |
| 25 to 34 Years | 0 (0.0%) | 283 (99.7%) |
| 35 to 44 Years | 9 (3.4%) | 243 (91.3%) |
| 45 to 54 Years | 12 (2.6%) | 433 (93.7%) |
| 55 to 64 Years | 0 (0.0%) | 424 (97.7%) |
| 65 to 74 Years | 158 (65.0%) | 217 (89.3%) |
| 75 Years and over | 135 (100.0%) | 93 (68.9%) |
| Total | 397 (13.3%) | 2,776 (93.2%) |
Disability Status by Sex by Age in Cold Spring Harbor
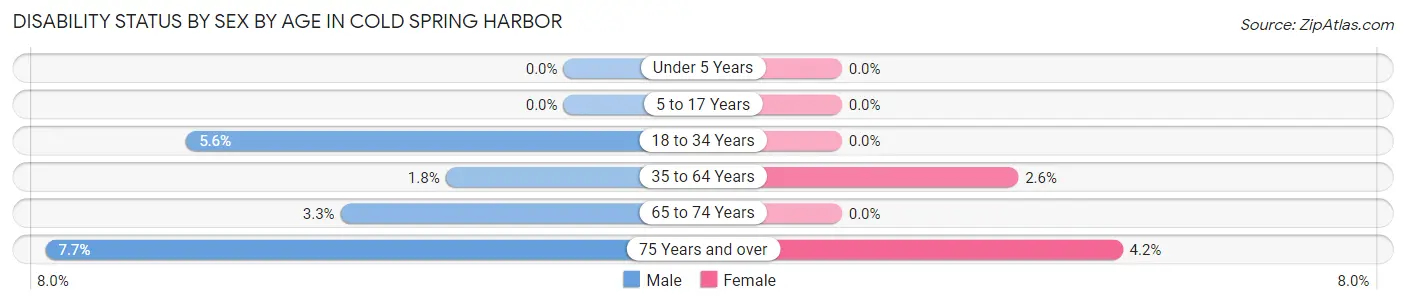
| Age Bracket | Male | Female |
| Under 5 Years | 0 (0.0%) | 0 (0.0%) |
| 5 to 17 Years | 0 (0.0%) | 0 (0.0%) |
| 18 to 34 Years | 19 (5.6%) | 0 (0.0%) |
| 35 to 64 Years | 11 (1.8%) | 14 (2.6%) |
| 65 to 74 Years | 5 (3.3%) | 0 (0.0%) |
| 75 Years and over | 3 (7.7%) | 4 (4.2%) |
Disability Class by Sex by Age in Cold Spring Harbor
Disability Class: Hearing Difficulty
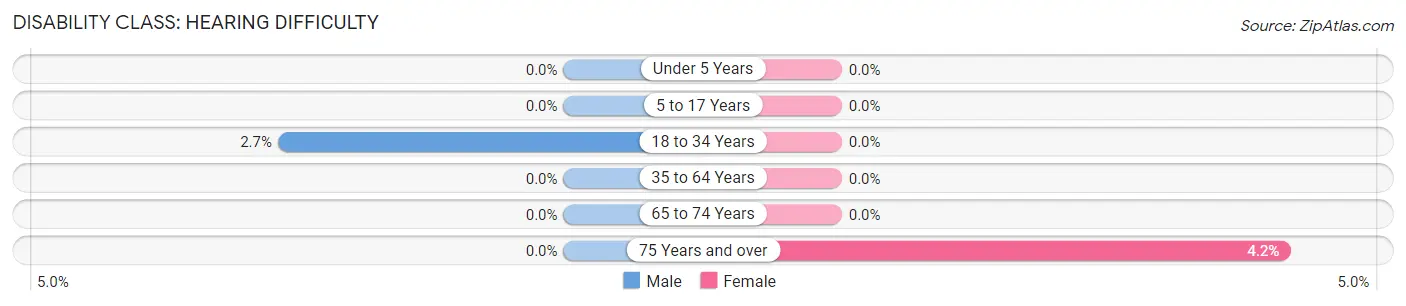
| Age Bracket | Male | Female |
| Under 5 Years | 0 (0.0%) | 0 (0.0%) |
| 5 to 17 Years | 0 (0.0%) | 0 (0.0%) |
| 18 to 34 Years | 9 (2.6%) | 0 (0.0%) |
| 35 to 64 Years | 0 (0.0%) | 0 (0.0%) |
| 65 to 74 Years | 0 (0.0%) | 0 (0.0%) |
| 75 Years and over | 0 (0.0%) | 4 (4.2%) |
Disability Class: Vision Difficulty
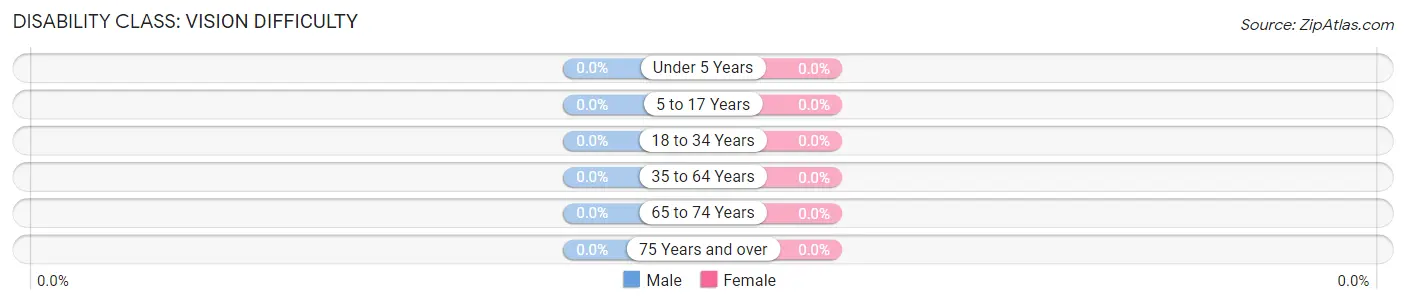
| Age Bracket | Male | Female |
| Under 5 Years | 0 (0.0%) | 0 (0.0%) |
| 5 to 17 Years | 0 (0.0%) | 0 (0.0%) |
| 18 to 34 Years | 0 (0.0%) | 0 (0.0%) |
| 35 to 64 Years | 0 (0.0%) | 0 (0.0%) |
| 65 to 74 Years | 0 (0.0%) | 0 (0.0%) |
| 75 Years and over | 0 (0.0%) | 0 (0.0%) |
Disability Class: Cognitive Difficulty
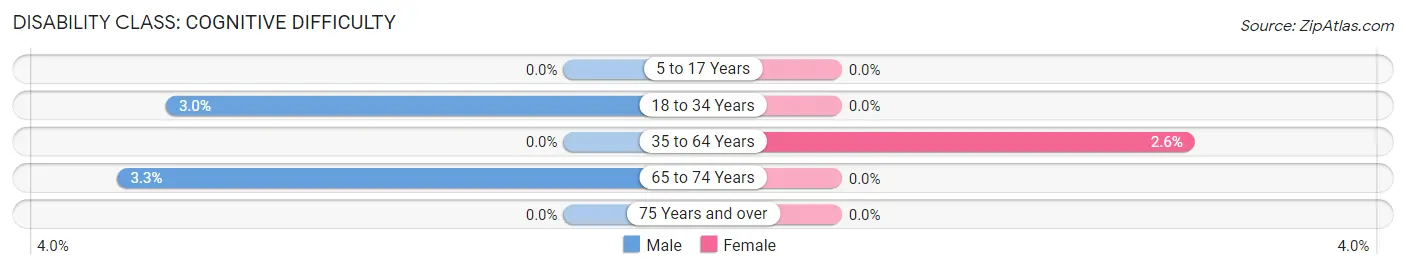
| Age Bracket | Male | Female |
| 5 to 17 Years | 0 (0.0%) | 0 (0.0%) |
| 18 to 34 Years | 10 (2.9%) | 0 (0.0%) |
| 35 to 64 Years | 0 (0.0%) | 14 (2.6%) |
| 65 to 74 Years | 5 (3.3%) | 0 (0.0%) |
| 75 Years and over | 0 (0.0%) | 0 (0.0%) |
Disability Class: Ambulatory Difficulty
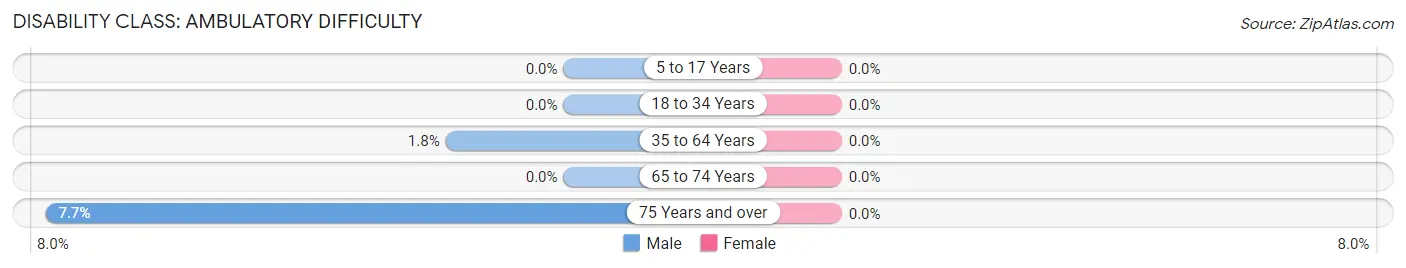
| Age Bracket | Male | Female |
| 5 to 17 Years | 0 (0.0%) | 0 (0.0%) |
| 18 to 34 Years | 0 (0.0%) | 0 (0.0%) |
| 35 to 64 Years | 11 (1.8%) | 0 (0.0%) |
| 65 to 74 Years | 0 (0.0%) | 0 (0.0%) |
| 75 Years and over | 3 (7.7%) | 0 (0.0%) |
Disability Class: Self-Care Difficulty
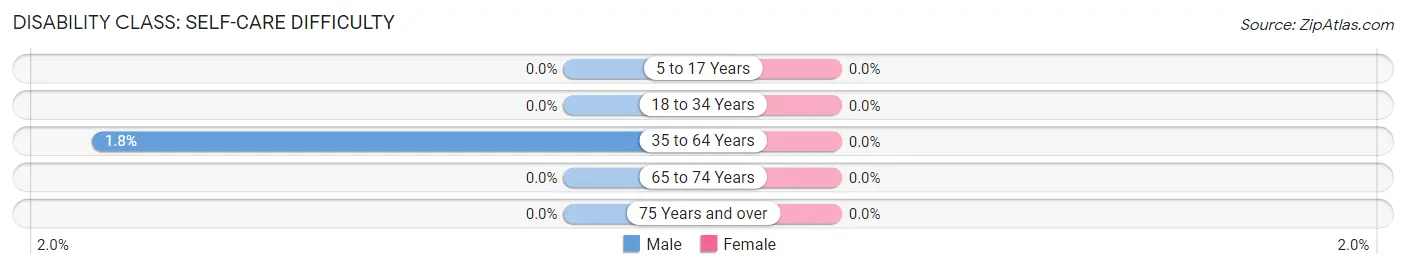
| Age Bracket | Male | Female |
| 5 to 17 Years | 0 (0.0%) | 0 (0.0%) |
| 18 to 34 Years | 0 (0.0%) | 0 (0.0%) |
| 35 to 64 Years | 11 (1.8%) | 0 (0.0%) |
| 65 to 74 Years | 0 (0.0%) | 0 (0.0%) |
| 75 Years and over | 0 (0.0%) | 0 (0.0%) |
Technology Access in Cold Spring Harbor
Computing Device Access in Cold Spring Harbor
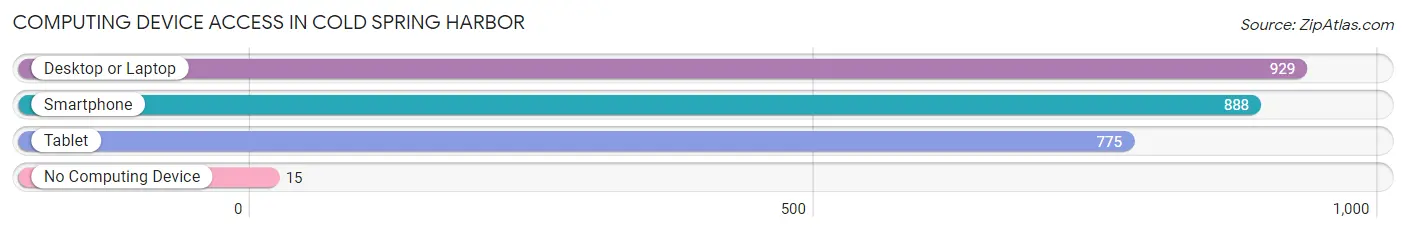
| Device Type | # Households | % Households |
| Desktop or Laptop | 929 | 96.1% |
| Smartphone | 888 | 91.8% |
| Tablet | 775 | 80.1% |
| No Computing Device | 15 | 1.5% |
| Total | 967 | 100.0% |
Internet Access in Cold Spring Harbor
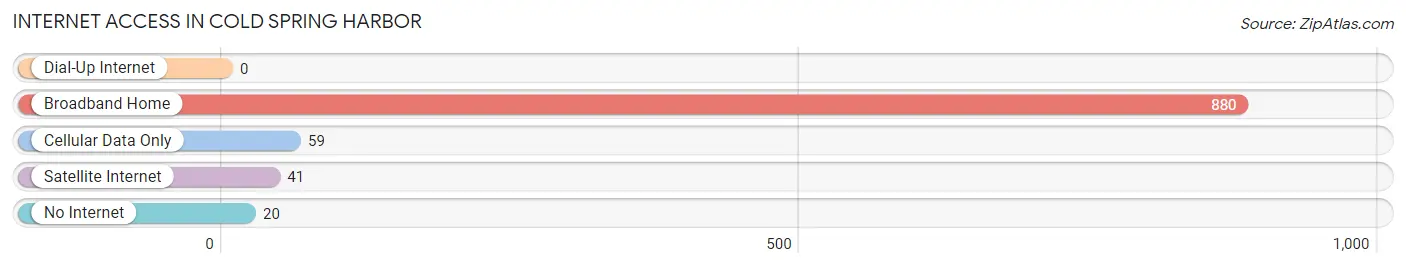
| Internet Type | # Households | % Households |
| Dial-Up Internet | 0 | 0.0% |
| Broadband Home | 880 | 91.0% |
| Cellular Data Only | 59 | 6.1% |
| Satellite Internet | 41 | 4.2% |
| No Internet | 20 | 2.1% |
| Total | 967 | 100.0% |
Cold Spring Harbor Summary
Spring Harbor is a hamlet located in the Town of Huntington in Suffolk County, New York. It is located on the north shore of Long Island, approximately 50 miles east of New York City. The hamlet is situated on the Cold Spring Harbor, a tidal estuary of the Long Island Sound. The hamlet is home to a variety of businesses, including a marina, a yacht club, and a number of restaurants.
History
The area now known as Cold Spring Harbor was originally inhabited by the Matinecock Native American tribe. The first European settlers arrived in the area in the 1650s, and the hamlet was officially established in 1793. The hamlet was named after the cold spring that was located near the harbor.
In the 19th century, the hamlet became a popular summer resort destination for wealthy New Yorkers. The area was also home to a number of large estates, including the estate of William K. Vanderbilt. The Vanderbilt estate was later donated to the Cold Spring Harbor Laboratory, which is now a world-renowned research institution.
Geography
Cold Spring Harbor is located on the north shore of Long Island, approximately 50 miles east of New York City. The hamlet is situated on the Cold Spring Harbor, a tidal estuary of the Long Island Sound. The harbor is surrounded by a number of small islands, including Centre Island, Lloyd Neck, and West Neck. The hamlet is bordered by the Town of Oyster Bay to the west and the Town of Huntington to the east.
The hamlet has a total area of 2.2 square miles, all of which is land. The terrain is mostly flat, with some rolling hills. The highest point in the hamlet is located at the intersection of West Neck Road and Lloyd Neck Road, which has an elevation of approximately 100 feet.
Economy
The economy of Cold Spring Harbor is largely based on tourism and recreation. The hamlet is home to a number of businesses, including a marina, a yacht club, and a number of restaurants. The hamlet is also home to the Cold Spring Harbor Laboratory, which is a world-renowned research institution.
Demographics
As of the 2010 census, the population of Cold Spring Harbor was 5,070. The racial makeup of the hamlet was 94.3% White, 1.3% African American, 0.2% Native American, 2.2% Asian, 0.1% Pacific Islander, 0.7% from other races, and 1.3% from two or more races. Hispanic or Latino of any race were 3.2% of the population.
The median household income in Cold Spring Harbor was $133,917, and the median family income was $150,917. The per capita income for the hamlet was $63,917. About 2.3% of families and 3.2% of the population were below the poverty line, including 3.7% of those under age 18 and 2.2% of those age 65 or over.
Common Questions
What is Per Capita Income in Cold Spring Harbor?
Per Capita income in Cold Spring Harbor is $90,961.
What is the Median Family Income in Cold Spring Harbor?
Median Family Income in Cold Spring Harbor is $250,001.
What is the Median Household income in Cold Spring Harbor?
Median Household Income in Cold Spring Harbor is $250,001.
What is Income or Wage Gap in Cold Spring Harbor?
Income or Wage Gap in Cold Spring Harbor is 79.5%.
Women in Cold Spring Harbor earn 20.5 cents for every dollar earned by a man.
What is Inequality or Gini Index in Cold Spring Harbor?
Inequality or Gini Index in Cold Spring Harbor is 0.35.
What is the Total Population of Cold Spring Harbor?
Total Population of Cold Spring Harbor is 2,979.
What is the Total Male Population of Cold Spring Harbor?
Total Male Population of Cold Spring Harbor is 1,597.
What is the Total Female Population of Cold Spring Harbor?
Total Female Population of Cold Spring Harbor is 1,382.
What is the Ratio of Males per 100 Females in Cold Spring Harbor?
There are 115.56 Males per 100 Females in Cold Spring Harbor.
What is the Ratio of Females per 100 Males in Cold Spring Harbor?
There are 86.54 Females per 100 Males in Cold Spring Harbor.
What is the Median Population Age in Cold Spring Harbor?
Median Population Age in Cold Spring Harbor is 36.5 Years.
What is the Average Family Size in Cold Spring Harbor
Average Family Size in Cold Spring Harbor is 3.5 People.
What is the Average Household Size in Cold Spring Harbor
Average Household Size in Cold Spring Harbor is 3.0 People.
How Large is the Labor Force in Cold Spring Harbor?
There are 1,612 People in the Labor Forcein in Cold Spring Harbor.
What is the Percentage of People in the Labor Force in Cold Spring Harbor?
72.8% of People are in the Labor Force in Cold Spring Harbor.
What is the Unemployment Rate in Cold Spring Harbor?
Unemployment Rate in Cold Spring Harbor is 2.5%.