Shelter Island Heights, NY Map & Demographics
Shelter Island Heights Map
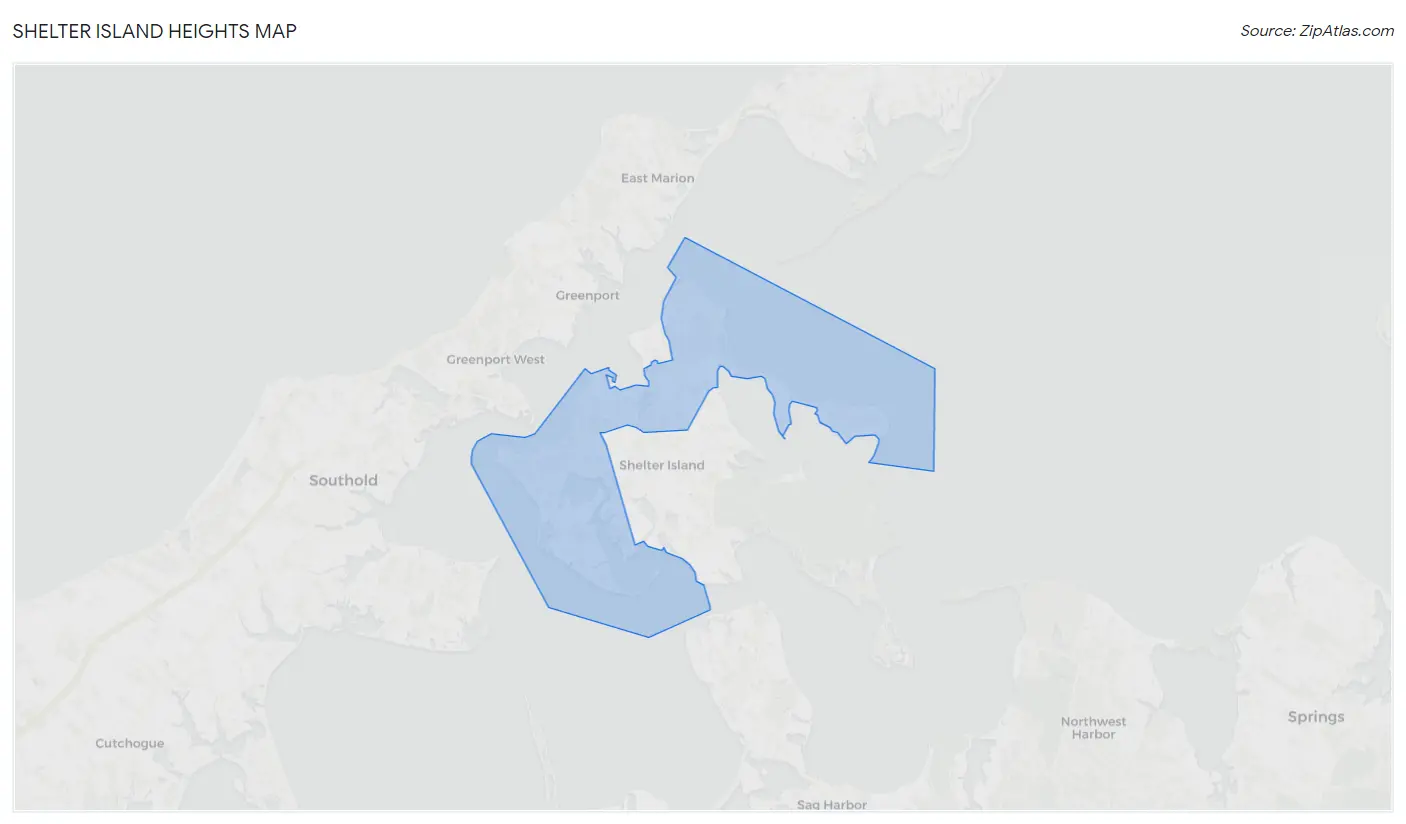
Shelter Island Heights Overview
$63,962
PER CAPITA INCOME
$144,583
AVG FAMILY INCOME
$81,463
AVG HOUSEHOLD INCOME
0.42
INEQUALITY / GINI INDEX
1,056
TOTAL POPULATION
511
MALE POPULATION
545
FEMALE POPULATION
93.76
MALES / 100 FEMALES
106.65
FEMALES / 100 MALES
65.5
MEDIAN AGE
2.4
AVG FAMILY SIZE
1.6
AVG HOUSEHOLD SIZE
411
LABOR FORCE [ PEOPLE ]
38.9%
PERCENT IN LABOR FORCE
1.2%
UNEMPLOYMENT RATE
Shelter Island Heights Zip Codes
Shelter Island Heights Area Codes
Income in Shelter Island Heights
Income Overview in Shelter Island Heights
Per Capita Income in Shelter Island Heights is $63,962, while median incomes of families and households are $144,583 and $81,463 respectively.
| Characteristic | Number | Measure |
| Per Capita Income | 1,056 | $63,962 |
| Median Family Income | 254 | $144,583 |
| Mean Family Income | 254 | $117,731 |
| Median Household Income | 649 | $81,463 |
| Mean Household Income | 649 | $102,698 |
| Income Deficit | 254 | $0 |
| Wage / Income Gap (%) | 1,056 | 0.00% |
| Wage / Income Gap ($) | 1,056 | 100.00¢ per $1 |
| Gini / Inequality Index | 1,056 | 0.42 |
Earnings by Sex in Shelter Island Heights
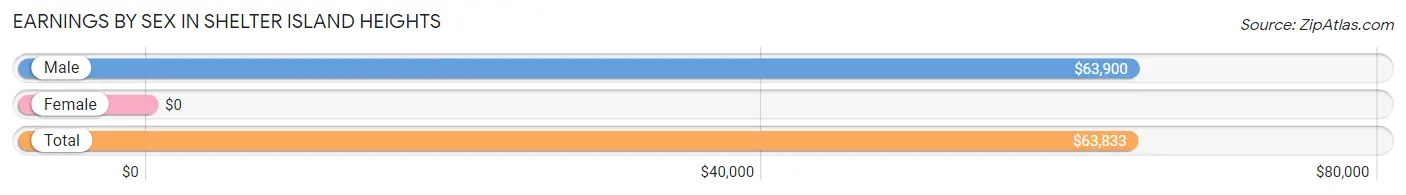
| Sex | Number | Average Earnings |
| Male | 234 (57.6%) | $63,900 |
| Female | 172 (42.4%) | $0 |
| Total | 406 (100.0%) | $63,833 |
Earnings by Sex by Income Bracket in Shelter Island Heights
The most common earnings brackets in Shelter Island Heights are $100,000+ for men (84 | 35.9%) and $75,000 to $99,999 for women (84 | 48.8%).
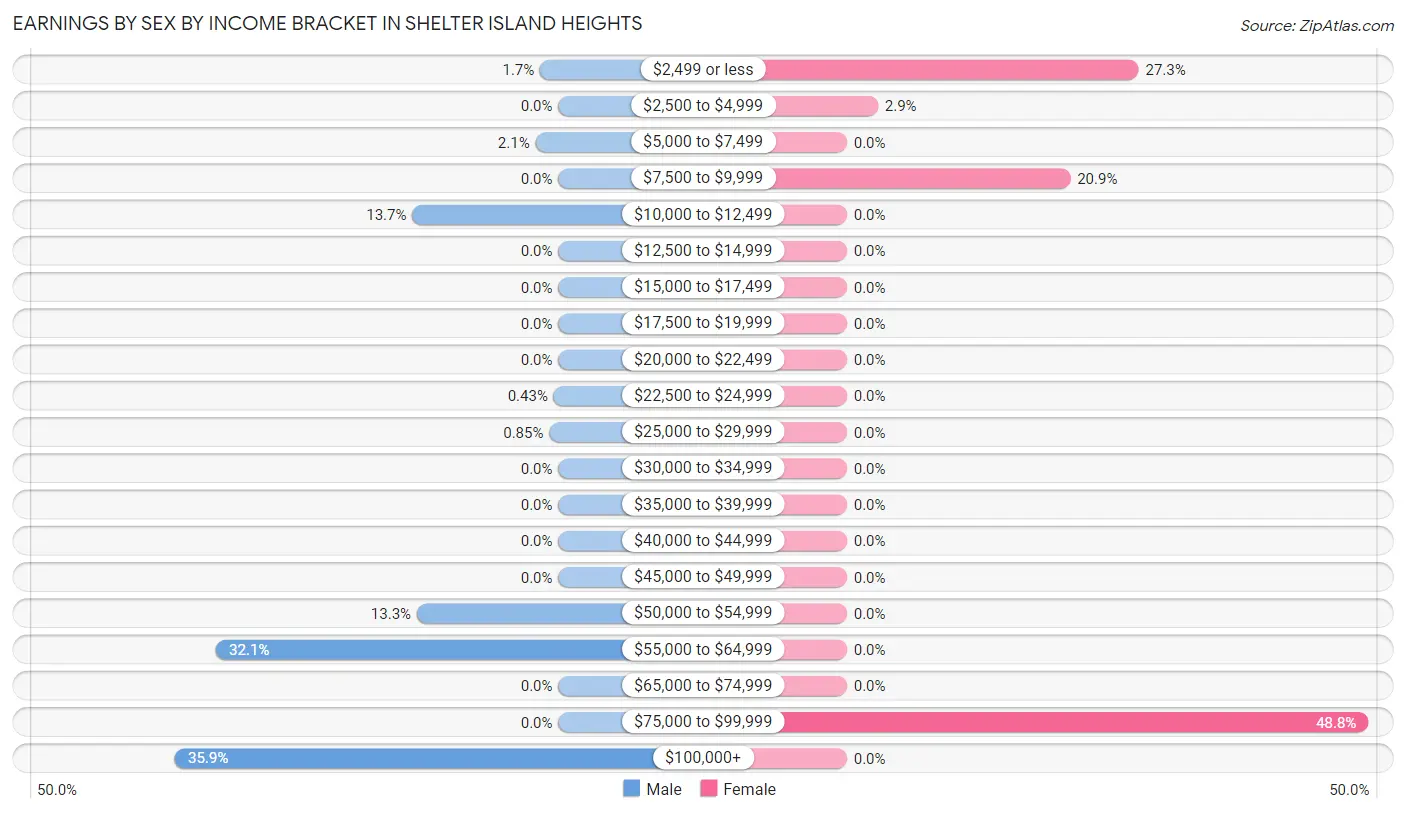
| Income | Male | Female |
| $2,499 or less | 4 (1.7%) | 47 (27.3%) |
| $2,500 to $4,999 | 0 (0.0%) | 5 (2.9%) |
| $5,000 to $7,499 | 5 (2.1%) | 0 (0.0%) |
| $7,500 to $9,999 | 0 (0.0%) | 36 (20.9%) |
| $10,000 to $12,499 | 32 (13.7%) | 0 (0.0%) |
| $12,500 to $14,999 | 0 (0.0%) | 0 (0.0%) |
| $15,000 to $17,499 | 0 (0.0%) | 0 (0.0%) |
| $17,500 to $19,999 | 0 (0.0%) | 0 (0.0%) |
| $20,000 to $22,499 | 0 (0.0%) | 0 (0.0%) |
| $22,500 to $24,999 | 1 (0.4%) | 0 (0.0%) |
| $25,000 to $29,999 | 2 (0.9%) | 0 (0.0%) |
| $30,000 to $34,999 | 0 (0.0%) | 0 (0.0%) |
| $35,000 to $39,999 | 0 (0.0%) | 0 (0.0%) |
| $40,000 to $44,999 | 0 (0.0%) | 0 (0.0%) |
| $45,000 to $49,999 | 0 (0.0%) | 0 (0.0%) |
| $50,000 to $54,999 | 31 (13.3%) | 0 (0.0%) |
| $55,000 to $64,999 | 75 (32.1%) | 0 (0.0%) |
| $65,000 to $74,999 | 0 (0.0%) | 0 (0.0%) |
| $75,000 to $99,999 | 0 (0.0%) | 84 (48.8%) |
| $100,000+ | 84 (35.9%) | 0 (0.0%) |
| Total | 234 (100.0%) | 172 (100.0%) |
Earnings by Sex by Educational Attainment in Shelter Island Heights
| Educational Attainment | Male Income | Female Income |
| Less than High School | - | - |
| High School Diploma | - | - |
| College or Associate's Degree | - | - |
| Bachelor's Degree | - | - |
| Graduate Degree | - | - |
| Total | - | - |
Family Income in Shelter Island Heights
Family Income Brackets in Shelter Island Heights
According to the Shelter Island Heights family income data, there are 58 families falling into the $150,000 to $199,999 income range, which is the most common income bracket and makes up 22.8% of all families.
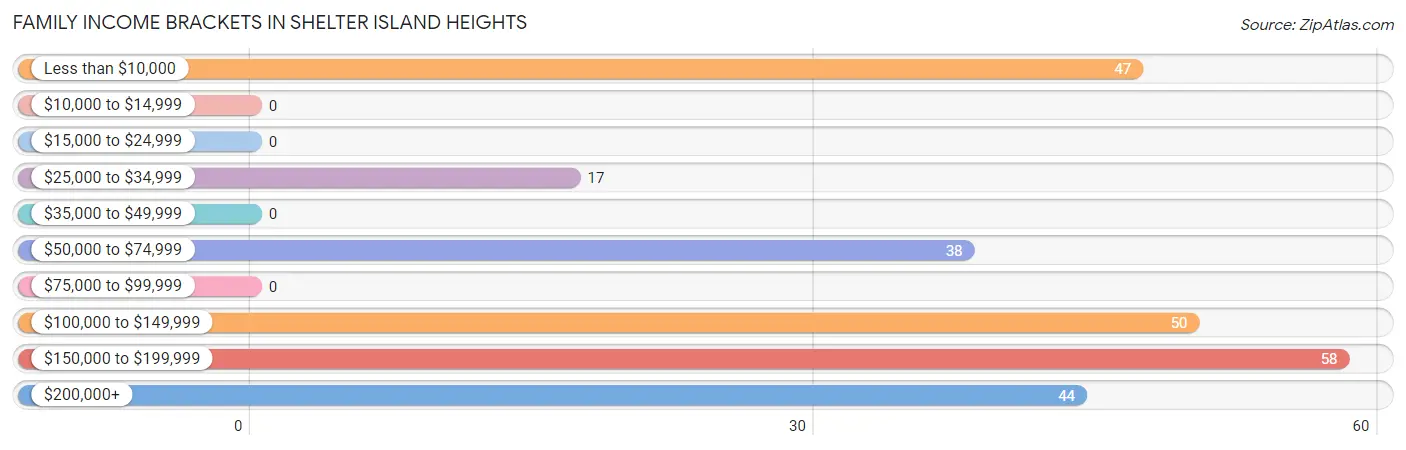
| Income Bracket | # Families | % Families |
| Less than $10,000 | 47 | 18.5% |
| $10,000 to $14,999 | 0 | 0.0% |
| $15,000 to $24,999 | 0 | 0.0% |
| $25,000 to $34,999 | 17 | 6.7% |
| $35,000 to $49,999 | 0 | 0.0% |
| $50,000 to $74,999 | 38 | 15.0% |
| $75,000 to $99,999 | 0 | 0.0% |
| $100,000 to $149,999 | 50 | 19.7% |
| $150,000 to $199,999 | 58 | 22.8% |
| $200,000+ | 44 | 17.3% |
Family Income by Famaliy Size in Shelter Island Heights
2-person families (237 | 93.3%) account for the highest median family income in Shelter Island Heights with $145,438 per family, while 2-person families (237 | 93.3%) have the highest median income of $72,719 per family member.
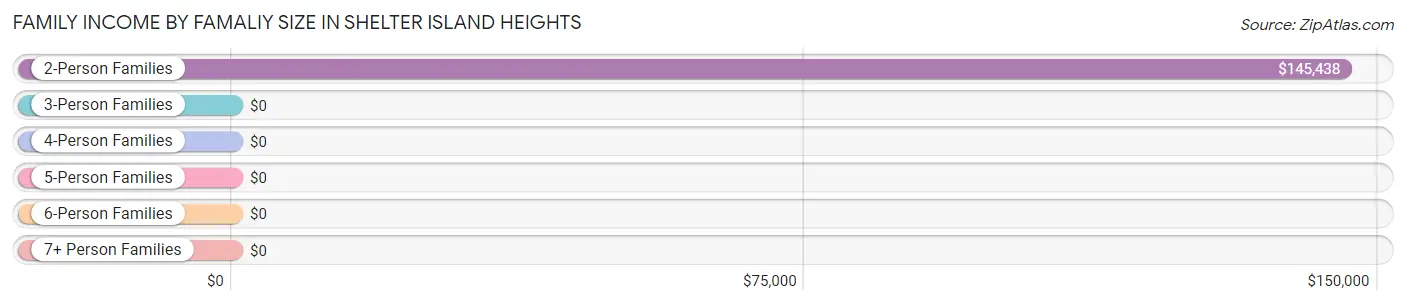
| Income Bracket | # Families | Median Income |
| 2-Person Families | 237 (93.3%) | $145,438 |
| 3-Person Families | 17 (6.7%) | $0 |
| 4-Person Families | 0 (0.0%) | $0 |
| 5-Person Families | 0 (0.0%) | $0 |
| 6-Person Families | 0 (0.0%) | $0 |
| 7+ Person Families | 0 (0.0%) | $0 |
| Total | 254 (100.0%) | $144,583 |
Family Income by Number of Earners in Shelter Island Heights
| Number of Earners | # Families | Median Income |
| No Earners | 133 (52.4%) | $0 |
| 1 Earner | 121 (47.6%) | $0 |
| 2 Earners | 0 (0.0%) | $0 |
| 3+ Earners | 0 (0.0%) | $0 |
| Total | 254 (100.0%) | $144,583 |
Household Income in Shelter Island Heights
Household Income Brackets in Shelter Island Heights
With 150 households falling in the category, the $50,000 to $74,999 income range is the most frequent in Shelter Island Heights, accounting for 23.1% of all households.
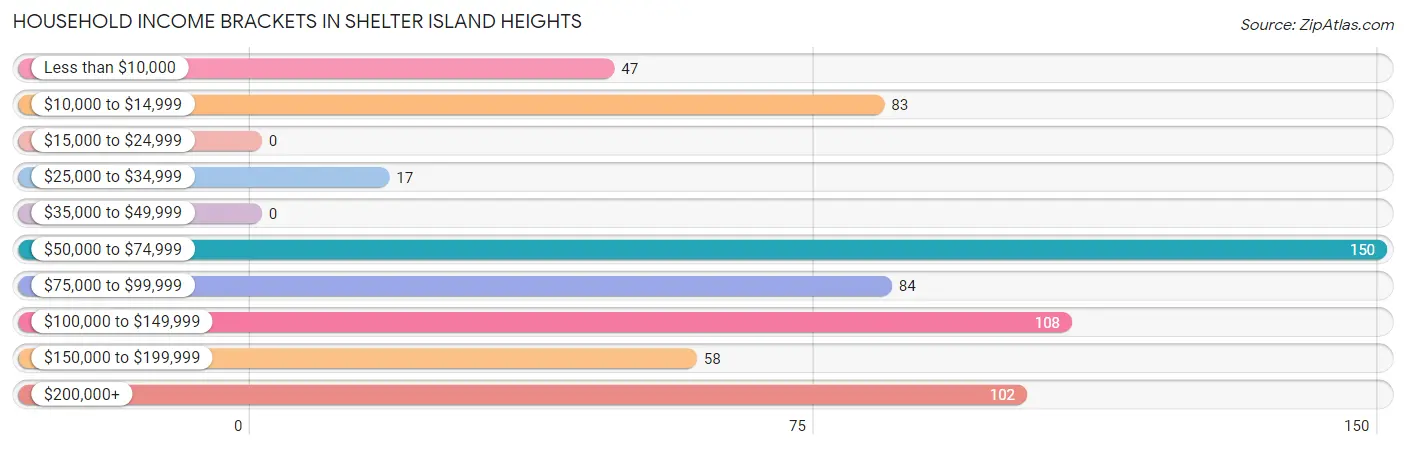
| Income Bracket | # Households | % Households |
| Less than $10,000 | 47 | 7.2% |
| $10,000 to $14,999 | 83 | 12.8% |
| $15,000 to $24,999 | 0 | 0.0% |
| $25,000 to $34,999 | 17 | 2.6% |
| $35,000 to $49,999 | 0 | 0.0% |
| $50,000 to $74,999 | 150 | 23.1% |
| $75,000 to $99,999 | 84 | 12.9% |
| $100,000 to $149,999 | 108 | 16.6% |
| $150,000 to $199,999 | 58 | 8.9% |
| $200,000+ | 102 | 15.7% |
Household Income by Householder Age in Shelter Island Heights
| Income Bracket | # Households | Median Income |
| 15 to 24 Years | 0 (0.0%) | $0 |
| 25 to 44 Years | 0 (0.0%) | $0 |
| 45 to 64 Years | 211 (32.5%) | $0 |
| 65+ Years | 438 (67.5%) | $0 |
| Total | 649 (100.0%) | $81,463 |
Poverty in Shelter Island Heights
Income Below Poverty by Sex and Age in Shelter Island Heights
With 21.6% poverty level for males and 20.6% for females among the residents of Shelter Island Heights, 35 to 44 year old males and 18 to 24 year old females are the most vulnerable to poverty, with 22 males (95.7%) and 64 females (100.0%) in their respective age groups living below the poverty level.
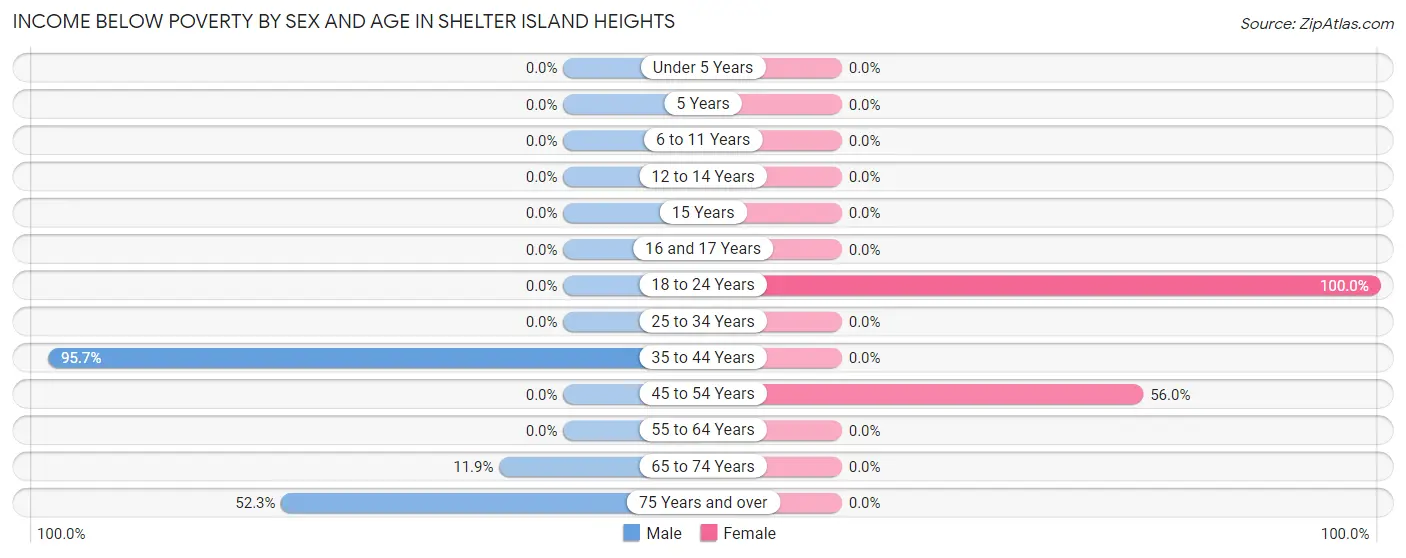
| Age Bracket | Male | Female |
| Under 5 Years | 0 (0.0%) | 0 (0.0%) |
| 5 Years | 0 (0.0%) | 0 (0.0%) |
| 6 to 11 Years | 0 (0.0%) | 0 (0.0%) |
| 12 to 14 Years | 0 (0.0%) | 0 (0.0%) |
| 15 Years | 0 (0.0%) | 0 (0.0%) |
| 16 and 17 Years | 0 (0.0%) | 0 (0.0%) |
| 18 to 24 Years | 0 (0.0%) | 64 (100.0%) |
| 25 to 34 Years | 0 (0.0%) | 0 (0.0%) |
| 35 to 44 Years | 22 (95.7%) | 0 (0.0%) |
| 45 to 54 Years | 0 (0.0%) | 47 (55.9%) |
| 55 to 64 Years | 0 (0.0%) | 0 (0.0%) |
| 65 to 74 Years | 27 (11.9%) | 0 (0.0%) |
| 75 Years and over | 56 (52.3%) | 0 (0.0%) |
| Total | 105 (21.6%) | 111 (20.6%) |
Income Above Poverty by Sex and Age in Shelter Island Heights
According to the poverty statistics in Shelter Island Heights, males aged 45 to 54 years and females aged 35 to 44 years are the age groups that are most secure financially, with 100.0% of males and 100.0% of females in these age groups living above the poverty line.
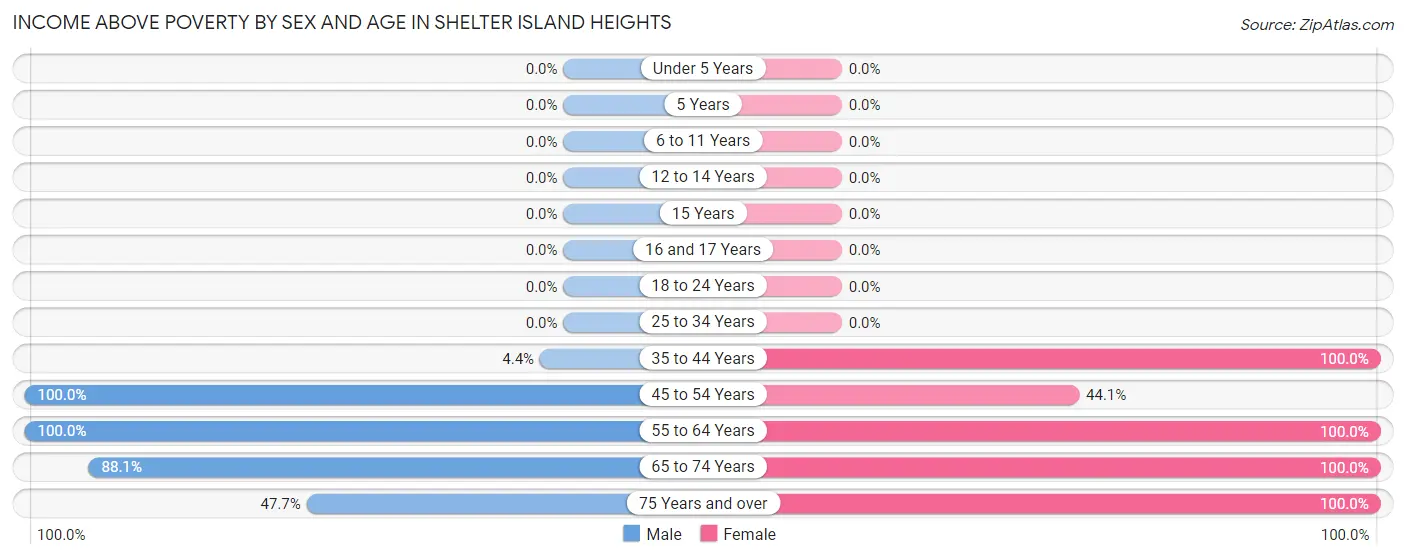
| Age Bracket | Male | Female |
| Under 5 Years | 0 (0.0%) | 0 (0.0%) |
| 5 Years | 0 (0.0%) | 0 (0.0%) |
| 6 to 11 Years | 0 (0.0%) | 0 (0.0%) |
| 12 to 14 Years | 0 (0.0%) | 0 (0.0%) |
| 15 Years | 0 (0.0%) | 0 (0.0%) |
| 16 and 17 Years | 0 (0.0%) | 0 (0.0%) |
| 18 to 24 Years | 0 (0.0%) | 0 (0.0%) |
| 25 to 34 Years | 0 (0.0%) | 0 (0.0%) |
| 35 to 44 Years | 1 (4.3%) | 64 (100.0%) |
| 45 to 54 Years | 75 (100.0%) | 37 (44.1%) |
| 55 to 64 Years | 55 (100.0%) | 90 (100.0%) |
| 65 to 74 Years | 200 (88.1%) | 202 (100.0%) |
| 75 Years and over | 51 (47.7%) | 36 (100.0%) |
| Total | 382 (78.4%) | 429 (79.4%) |
Income Below Poverty Among Married-Couple Families in Shelter Island Heights
| Children | Above Poverty | Below Poverty |
| No Children | 207 (100.0%) | 0 (0.0%) |
| 1 or 2 Children | 0 (0.0%) | 0 (0.0%) |
| 3 or 4 Children | 0 (0.0%) | 0 (0.0%) |
| 5 or more Children | 0 (0.0%) | 0 (0.0%) |
| Total | 207 (100.0%) | 0 (0.0%) |
Income Below Poverty Among Single-Parent Households in Shelter Island Heights
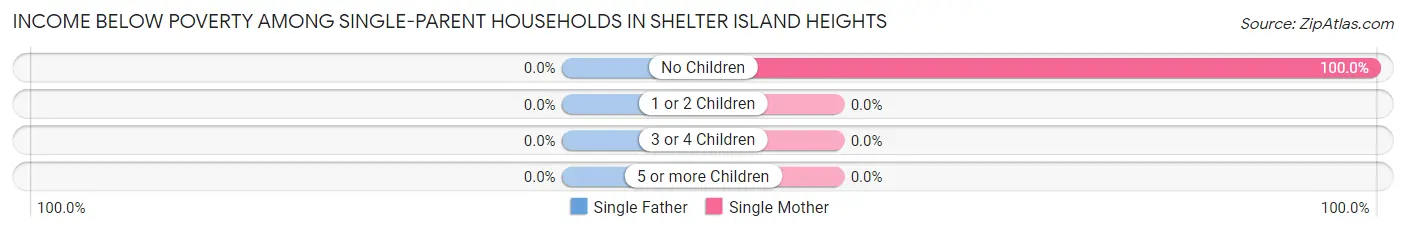
| Children | Single Father | Single Mother |
| No Children | 0 (0.0%) | 47 (100.0%) |
| 1 or 2 Children | 0 (0.0%) | 0 (0.0%) |
| 3 or 4 Children | 0 (0.0%) | 0 (0.0%) |
| 5 or more Children | 0 (0.0%) | 0 (0.0%) |
| Total | 0 (0.0%) | 47 (100.0%) |
Income Below Poverty Among Married-Couple vs Single-Parent Households in Shelter Island Heights
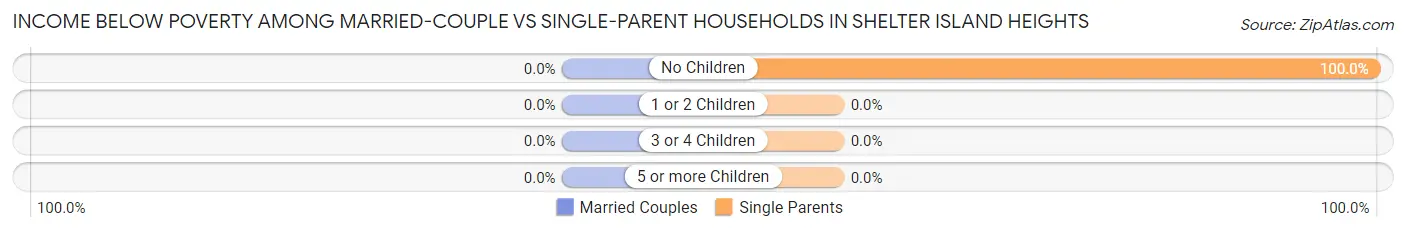
| Children | Married-Couple Families | Single-Parent Households |
| No Children | 0 (0.0%) | 47 (100.0%) |
| 1 or 2 Children | 0 (0.0%) | 0 (0.0%) |
| 3 or 4 Children | 0 (0.0%) | 0 (0.0%) |
| 5 or more Children | 0 (0.0%) | 0 (0.0%) |
| Total | 0 (0.0%) | 47 (100.0%) |
Race in Shelter Island Heights
The most populous races in Shelter Island Heights are White / Caucasian (927 | 87.8%), Native / Alaskan (81 | 7.7%), and Black / African American (32 | 3.0%).
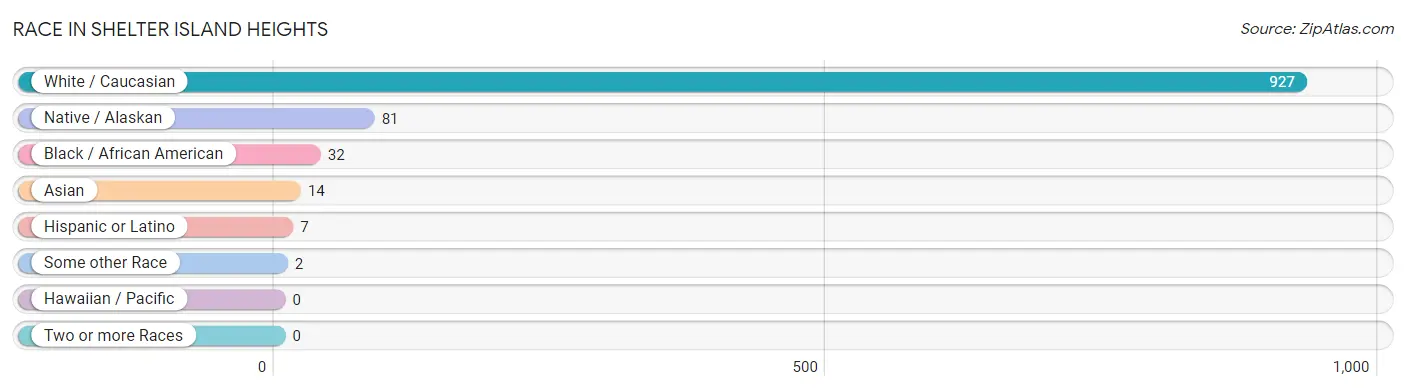
| Race | # Population | % Population |
| Asian | 14 | 1.3% |
| Black / African American | 32 | 3.0% |
| Hawaiian / Pacific | 0 | 0.0% |
| Hispanic or Latino | 7 | 0.7% |
| Native / Alaskan | 81 | 7.7% |
| White / Caucasian | 927 | 87.8% |
| Two or more Races | 0 | 0.0% |
| Some other Race | 2 | 0.2% |
| Total | 1,056 | 100.0% |
Ancestry in Shelter Island Heights
The most populous ancestries reported in Shelter Island Heights are Irish (279 | 26.4%), English (193 | 18.3%), German (190 | 18.0%), Northern European (111 | 10.5%), and Swedish (75 | 7.1%), together accounting for 80.3% of all Shelter Island Heights residents.
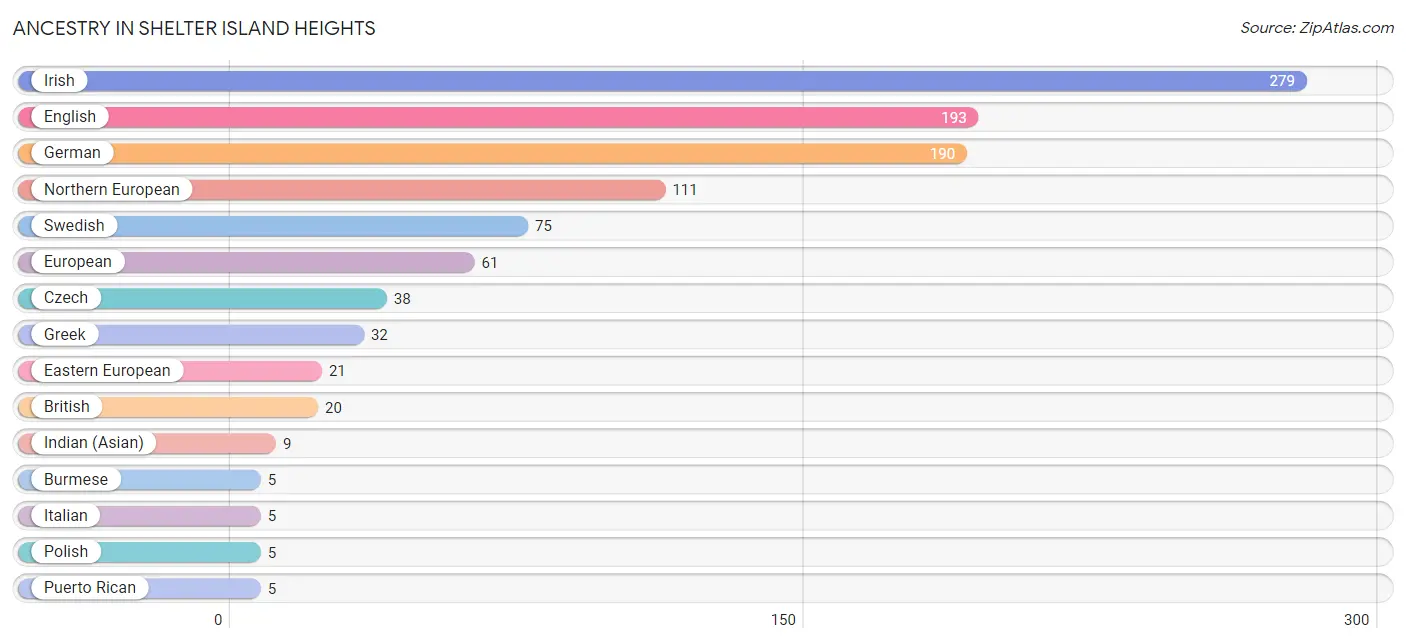
| Ancestry | # Population | % Population |
| British | 20 | 1.9% |
| Burmese | 5 | 0.5% |
| Central American | 2 | 0.2% |
| Czech | 38 | 3.6% |
| Eastern European | 21 | 2.0% |
| English | 193 | 18.3% |
| European | 61 | 5.8% |
| German | 190 | 18.0% |
| Greek | 32 | 3.0% |
| Indian (Asian) | 9 | 0.9% |
| Irish | 279 | 26.4% |
| Italian | 5 | 0.5% |
| Northern European | 111 | 10.5% |
| Polish | 5 | 0.5% |
| Puerto Rican | 5 | 0.5% |
| Salvadoran | 2 | 0.2% |
| South African | 1 | 0.1% |
| Subsaharan African | 1 | 0.1% |
| Swedish | 75 | 7.1% | View All 19 Rows |
Immigrants in Shelter Island Heights
The most numerous immigrant groups reported in Shelter Island Heights came from Europe (57 | 5.4%), Northern Europe (57 | 5.4%), England (37 | 3.5%), Asia (5 | 0.5%), and Eastern Asia (5 | 0.5%), together accounting for 15.2% of all Shelter Island Heights residents.
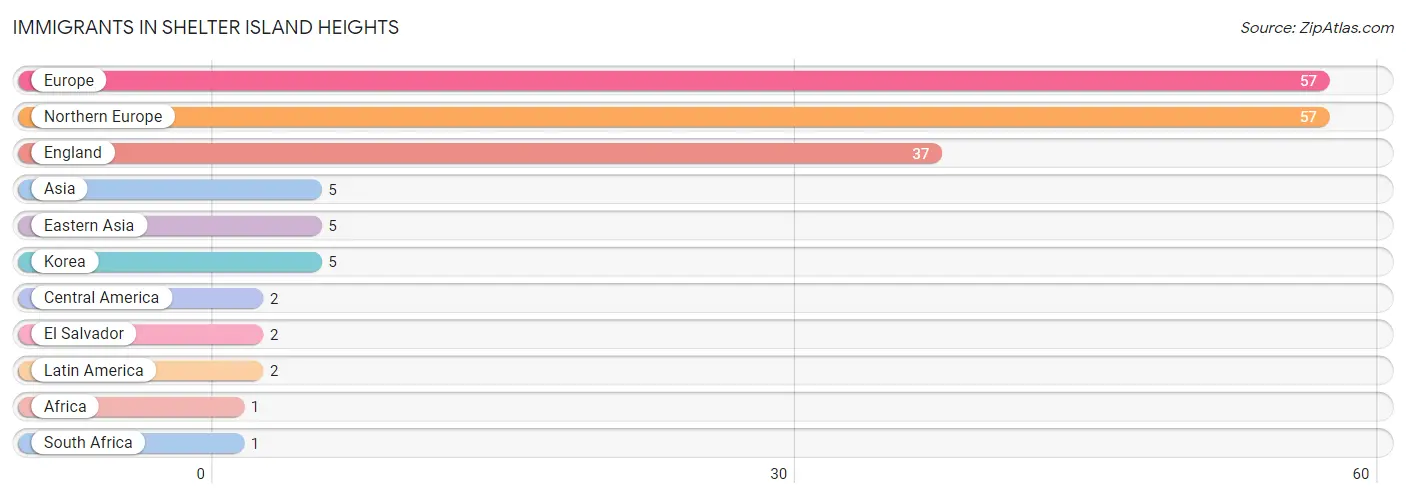
| Immigration Origin | # Population | % Population |
| Africa | 1 | 0.1% |
| Asia | 5 | 0.5% |
| Central America | 2 | 0.2% |
| Eastern Asia | 5 | 0.5% |
| El Salvador | 2 | 0.2% |
| England | 37 | 3.5% |
| Europe | 57 | 5.4% |
| Korea | 5 | 0.5% |
| Latin America | 2 | 0.2% |
| Northern Europe | 57 | 5.4% |
| South Africa | 1 | 0.1% | View All 11 Rows |
Sex and Age in Shelter Island Heights
Sex and Age in Shelter Island Heights
The most populous age groups in Shelter Island Heights are 65 to 69 Years (142 | 27.8%) for men and 70 to 74 Years (202 | 37.1%) for women.
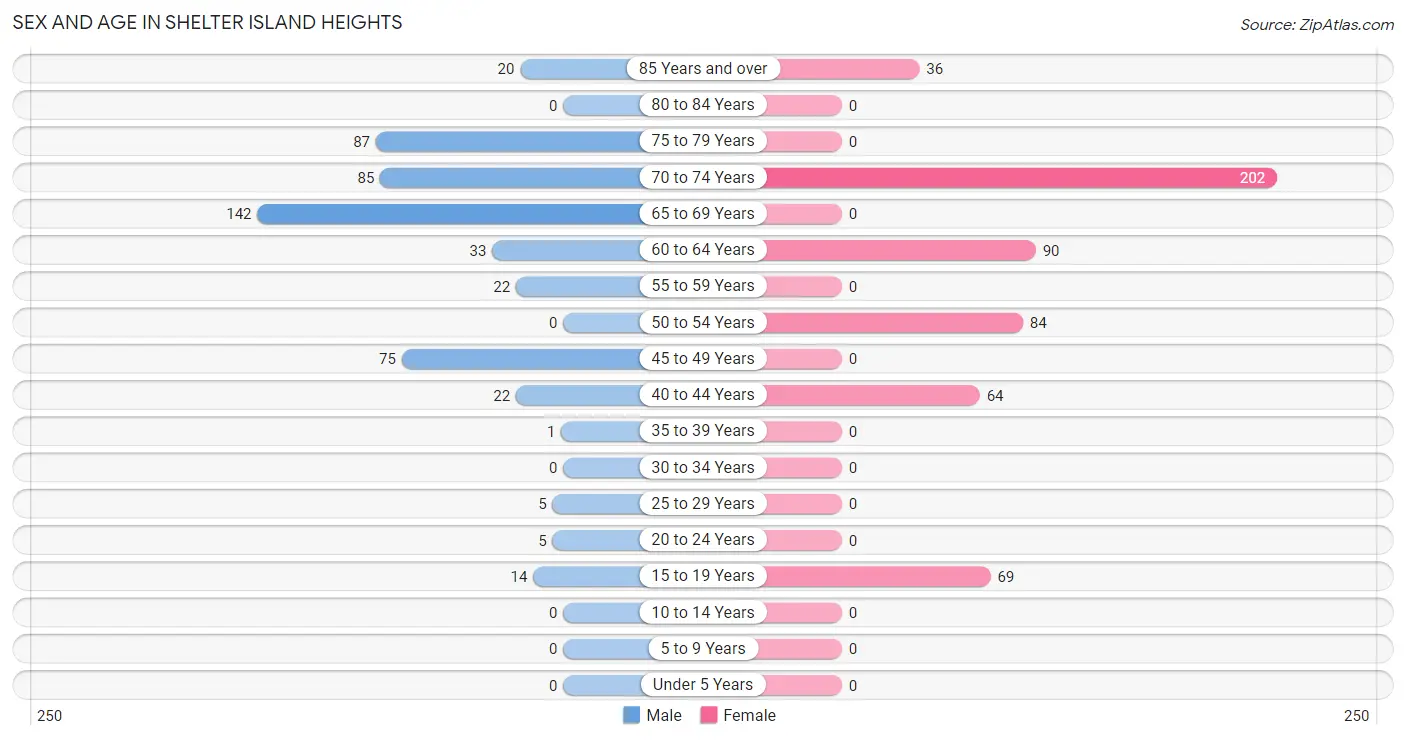
| Age Bracket | Male | Female |
| Under 5 Years | 0 (0.0%) | 0 (0.0%) |
| 5 to 9 Years | 0 (0.0%) | 0 (0.0%) |
| 10 to 14 Years | 0 (0.0%) | 0 (0.0%) |
| 15 to 19 Years | 14 (2.7%) | 69 (12.7%) |
| 20 to 24 Years | 5 (1.0%) | 0 (0.0%) |
| 25 to 29 Years | 5 (1.0%) | 0 (0.0%) |
| 30 to 34 Years | 0 (0.0%) | 0 (0.0%) |
| 35 to 39 Years | 1 (0.2%) | 0 (0.0%) |
| 40 to 44 Years | 22 (4.3%) | 64 (11.7%) |
| 45 to 49 Years | 75 (14.7%) | 0 (0.0%) |
| 50 to 54 Years | 0 (0.0%) | 84 (15.4%) |
| 55 to 59 Years | 22 (4.3%) | 0 (0.0%) |
| 60 to 64 Years | 33 (6.5%) | 90 (16.5%) |
| 65 to 69 Years | 142 (27.8%) | 0 (0.0%) |
| 70 to 74 Years | 85 (16.6%) | 202 (37.1%) |
| 75 to 79 Years | 87 (17.0%) | 0 (0.0%) |
| 80 to 84 Years | 0 (0.0%) | 0 (0.0%) |
| 85 Years and over | 20 (3.9%) | 36 (6.6%) |
| Total | 511 (100.0%) | 545 (100.0%) |
Families and Households in Shelter Island Heights
Median Family Size in Shelter Island Heights
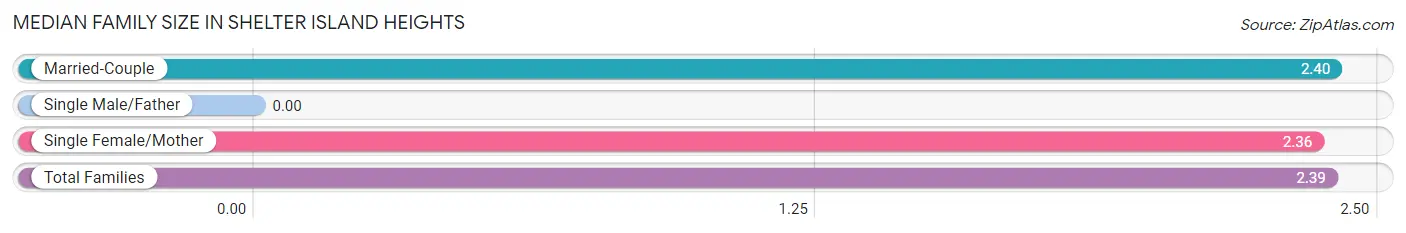
| Family Type | # Families | Family Size |
| Married-Couple | 207 (81.5%) | 2.40 |
| Single Male/Father | 0 (0.0%) | - |
| Single Female/Mother | 47 (18.5%) | 2.36 |
| Total Families | 254 (100.0%) | 2.39 |
Median Household Size in Shelter Island Heights
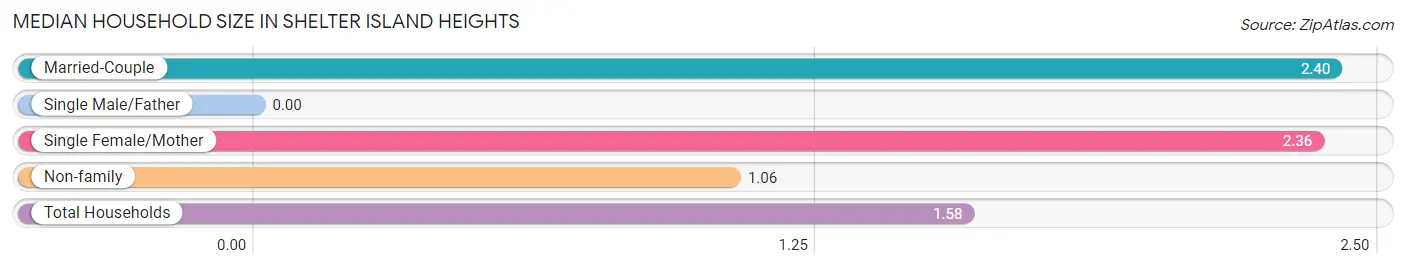
| Household Type | # Households | Household Size |
| Married-Couple | 207 (31.9%) | 2.40 |
| Single Male/Father | 0 (0.0%) | - |
| Single Female/Mother | 47 (7.2%) | 2.36 |
| Non-family | 395 (60.9%) | 1.06 |
| Total Households | 649 (100.0%) | 1.58 |
Household Size by Marriage Status in Shelter Island Heights
Out of a total of 649 households in Shelter Island Heights, 254 (39.1%) are family households, while 395 (60.9%) are nonfamily households. The most numerous type of family households are 2-person households, comprising 237, and the most common type of nonfamily households are 1-person households, comprising 373.
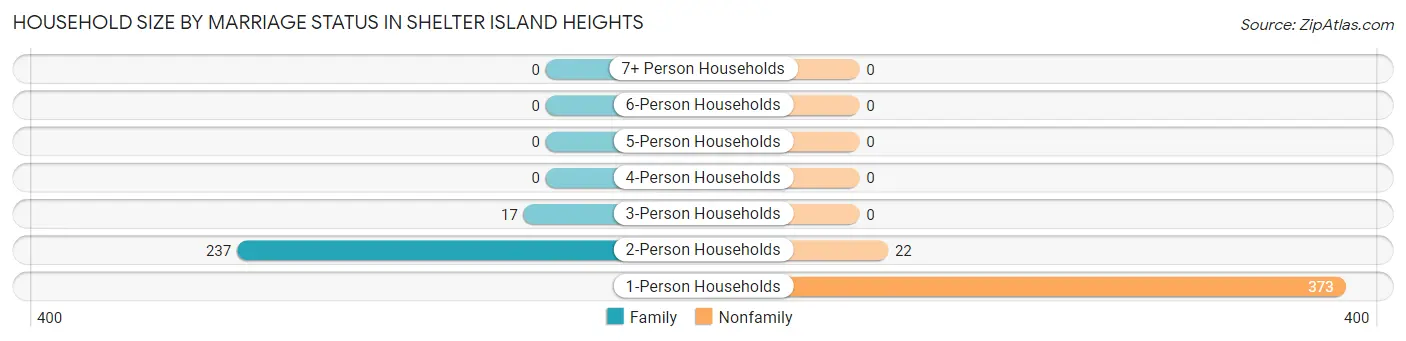
| Household Size | Family Households | Nonfamily Households |
| 1-Person Households | - | 373 (57.5%) |
| 2-Person Households | 237 (36.5%) | 22 (3.4%) |
| 3-Person Households | 17 (2.6%) | 0 (0.0%) |
| 4-Person Households | 0 (0.0%) | 0 (0.0%) |
| 5-Person Households | 0 (0.0%) | 0 (0.0%) |
| 6-Person Households | 0 (0.0%) | 0 (0.0%) |
| 7+ Person Households | 0 (0.0%) | 0 (0.0%) |
| Total | 254 (39.1%) | 395 (60.9%) |
Female Fertility in Shelter Island Heights
Fertility by Age in Shelter Island Heights
| Age Bracket | Women with Births | Births / 1,000 Women |
| 15 to 19 years | 0 (0.0%) | 0.0 |
| 20 to 34 years | 0 (0.0%) | 0.0 |
| 35 to 50 years | 0 (0.0%) | 0.0 |
| Total | 0 (0.0%) | 0.0 |
Fertility by Age by Marriage Status in Shelter Island Heights
| Age Bracket | Married | Unmarried |
| 15 to 19 years | 0 (0.0%) | 0 (0.0%) |
| 20 to 34 years | 0 (0.0%) | 0 (0.0%) |
| 35 to 50 years | 0 (0.0%) | 0 (0.0%) |
| Total | 0 (0.0%) | 0 (0.0%) |
Fertility by Education in Shelter Island Heights
| Educational Attainment | Women with Births | Births / 1,000 Women |
| Less than High School | 0 (0.0%) | 0.0 |
| High School Diploma | 0 (0.0%) | 0.0 |
| College or Associate's Degree | 0 (0.0%) | 0.0 |
| Bachelor's Degree | 0 (0.0%) | 0.0 |
| Graduate Degree | 0 (0.0%) | 0.0 |
| Total | 0 (0.0%) | 0.0 |
Fertility by Education by Marriage Status in Shelter Island Heights
| Educational Attainment | Married | Unmarried |
| Less than High School | 0 (0.0%) | 0 (0.0%) |
| High School Diploma | 0 (0.0%) | 0 (0.0%) |
| College or Associate's Degree | 0 (0.0%) | 0 (0.0%) |
| Bachelor's Degree | 0 (0.0%) | 0 (0.0%) |
| Graduate Degree | 0 (0.0%) | 0 (0.0%) |
| Total | 0 (0.0%) | 0 (0.0%) |
Employment Characteristics in Shelter Island Heights
Employment by Class of Employer in Shelter Island Heights
Among the 406 employed individuals in Shelter Island Heights, private company employees (204 | 50.2%), self-employed (not incorporated) (83 | 20.4%), and local government employees (74 | 18.2%) make up the most common classes of employment.
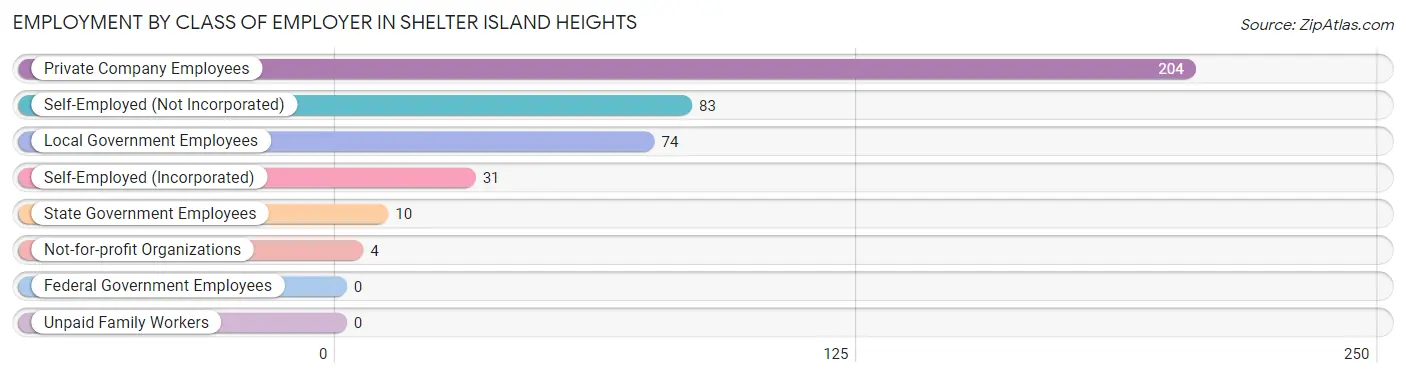
| Employer Class | # Employees | % Employees |
| Private Company Employees | 204 | 50.2% |
| Self-Employed (Incorporated) | 31 | 7.6% |
| Self-Employed (Not Incorporated) | 83 | 20.4% |
| Not-for-profit Organizations | 4 | 1.0% |
| Local Government Employees | 74 | 18.2% |
| State Government Employees | 10 | 2.5% |
| Federal Government Employees | 0 | 0.0% |
| Unpaid Family Workers | 0 | 0.0% |
| Total | 406 | 100.0% |
Employment Status by Age in Shelter Island Heights
According to the labor force statistics for Shelter Island Heights, out of the total population over 16 years of age (1,056), 38.9% or 411 individuals are in the labor force, with 1.2% or 5 of them unemployed. The age group with the highest labor force participation rate is 20 to 24 years, with 100.0% or 5 individuals in the labor force. Within the labor force, the 16 to 19 years age range has the highest percentage of unemployed individuals, with 35.7% or 5 of them being unemployed.
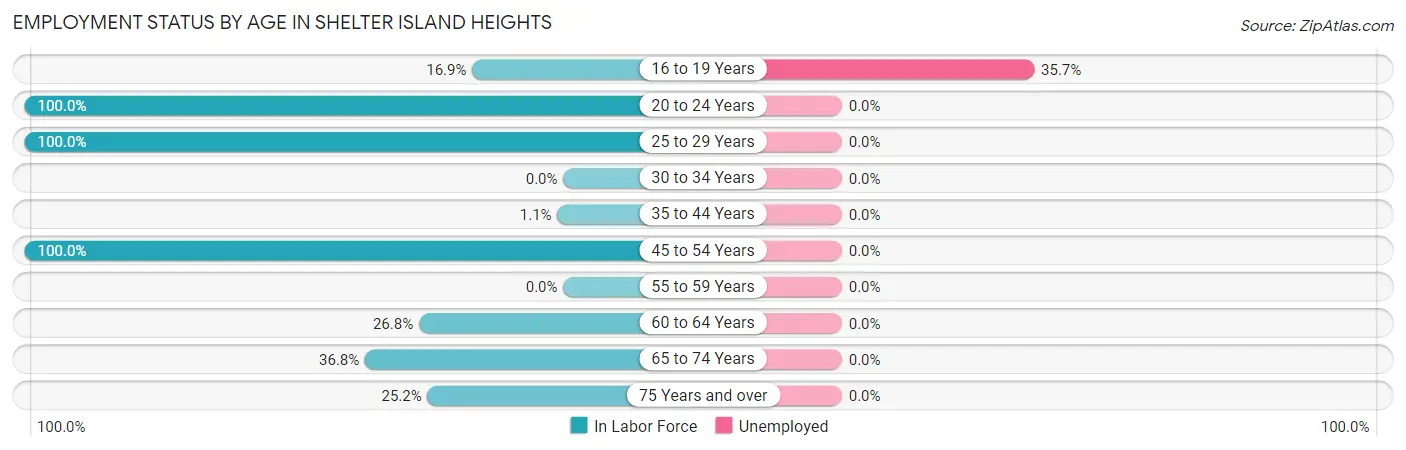
| Age Bracket | In Labor Force | Unemployed |
| 16 to 19 Years | 14 (16.9%) | 5 (35.7%) |
| 20 to 24 Years | 5 (100.0%) | 0 (0.0%) |
| 25 to 29 Years | 5 (100.0%) | 0 (0.0%) |
| 30 to 34 Years | 0 (0.0%) | 0 (0.0%) |
| 35 to 44 Years | 1 (1.1%) | 0 (0.0%) |
| 45 to 54 Years | 159 (100.0%) | 0 (0.0%) |
| 55 to 59 Years | 0 (0.0%) | 0 (0.0%) |
| 60 to 64 Years | 33 (26.8%) | 0 (0.0%) |
| 65 to 74 Years | 158 (36.8%) | 0 (0.0%) |
| 75 Years and over | 36 (25.2%) | 0 (0.0%) |
| Total | 411 (38.9%) | 5 (1.2%) |
Employment Status by Educational Attainment in Shelter Island Heights
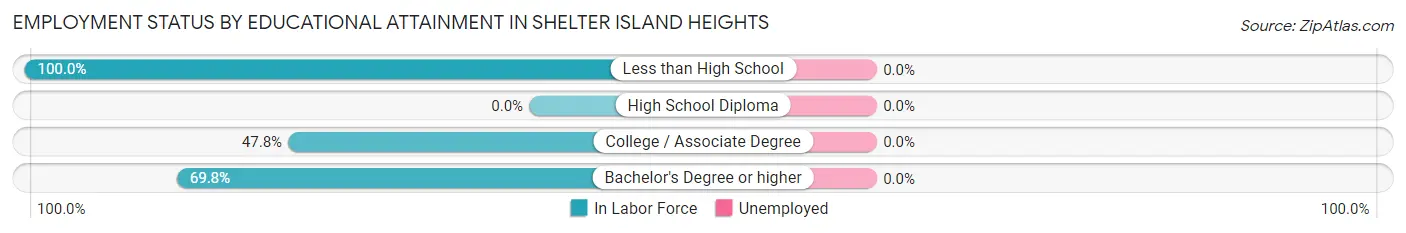
| Educational Attainment | In Labor Force | Unemployed |
| Less than High School | 3 (100.0%) | 0 (0.0%) |
| High School Diploma | 0 (0.0%) | 0 (0.0%) |
| College / Associate Degree | 75 (47.8%) | 0 (0.0%) |
| Bachelor's Degree or higher | 120 (69.8%) | 0 (0.0%) |
| Total | 198 (50.0%) | 0 (0.0%) |
Employment Occupations by Sex in Shelter Island Heights
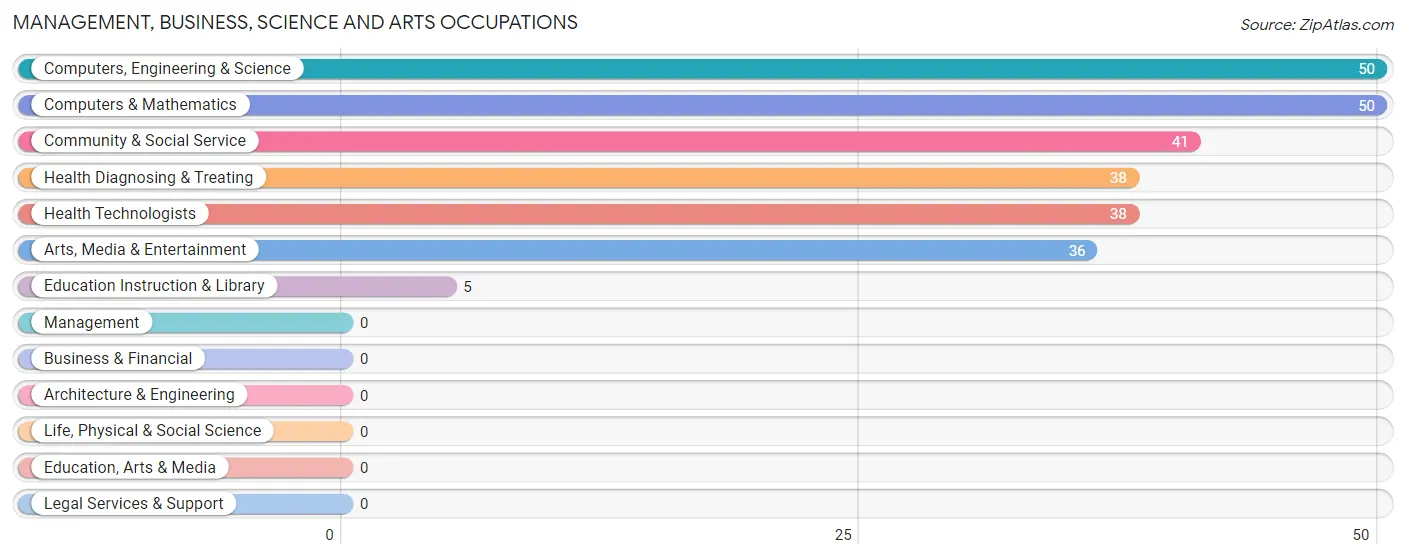
Management, Business, Science and Arts Occupations
The most common Management, Business, Science and Arts occupations in Shelter Island Heights are Computers, Engineering & Science (50 | 12.3%), Computers & Mathematics (50 | 12.3%), Community & Social Service (41 | 10.1%), Health Diagnosing & Treating (38 | 9.4%), and Health Technologists (38 | 9.4%).
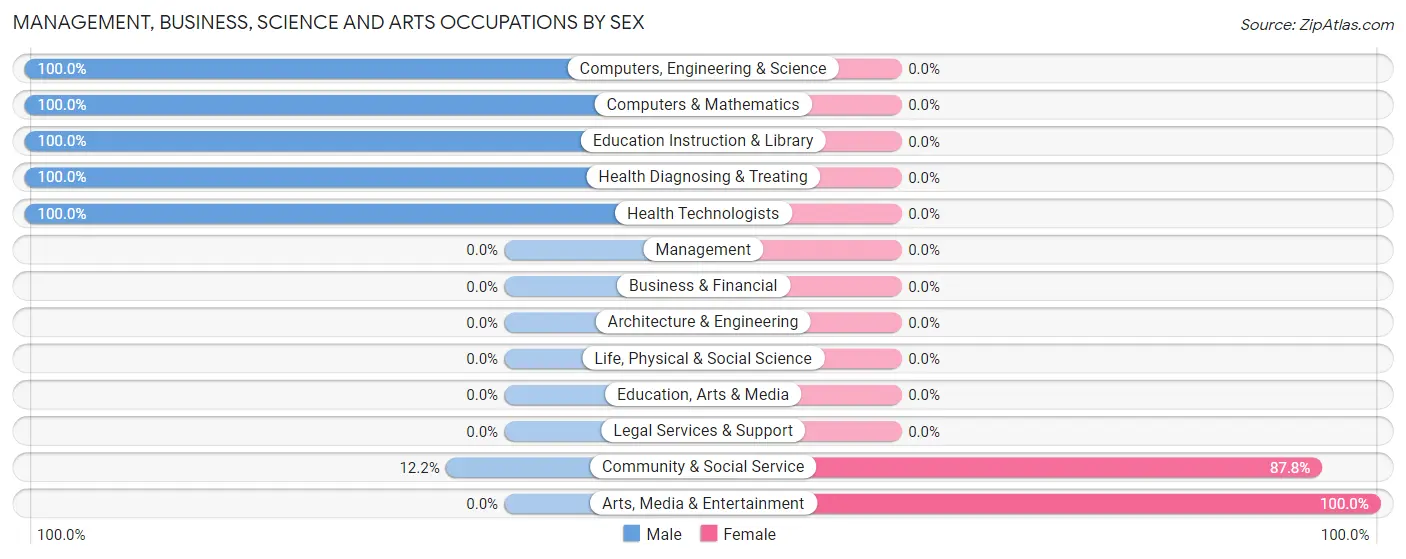
Management, Business, Science and Arts Occupations by Sex
Within the Management, Business, Science and Arts occupations in Shelter Island Heights, the most male-oriented occupations are Computers, Engineering & Science (100.0%), Computers & Mathematics (100.0%), and Education Instruction & Library (100.0%), while the most female-oriented occupations are Arts, Media & Entertainment (100.0%), and Community & Social Service (87.8%).
| Occupation | Male | Female |
| Management | 0 (0.0%) | 0 (0.0%) |
| Business & Financial | 0 (0.0%) | 0 (0.0%) |
| Computers, Engineering & Science | 50 (100.0%) | 0 (0.0%) |
| Computers & Mathematics | 50 (100.0%) | 0 (0.0%) |
| Architecture & Engineering | 0 (0.0%) | 0 (0.0%) |
| Life, Physical & Social Science | 0 (0.0%) | 0 (0.0%) |
| Community & Social Service | 5 (12.2%) | 36 (87.8%) |
| Education, Arts & Media | 0 (0.0%) | 0 (0.0%) |
| Legal Services & Support | 0 (0.0%) | 0 (0.0%) |
| Education Instruction & Library | 5 (100.0%) | 0 (0.0%) |
| Arts, Media & Entertainment | 0 (0.0%) | 36 (100.0%) |
| Health Diagnosing & Treating | 38 (100.0%) | 0 (0.0%) |
| Health Technologists | 38 (100.0%) | 0 (0.0%) |
| Total (Category) | 93 (72.1%) | 36 (27.9%) |
| Total (Overall) | 234 (57.6%) | 172 (42.4%) |
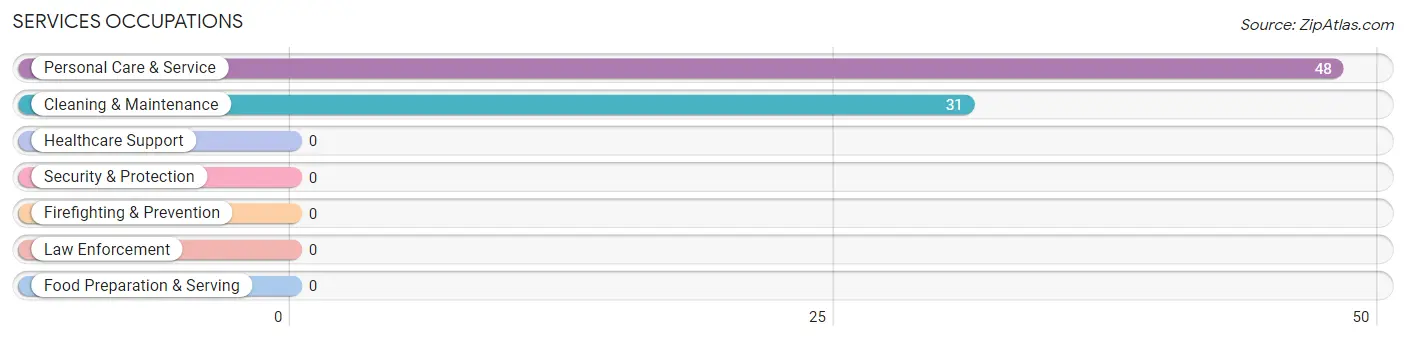
Services Occupations
The most common Services occupations in Shelter Island Heights are Personal Care & Service (48 | 11.8%), and Cleaning & Maintenance (31 | 7.6%).
Services Occupations by Sex
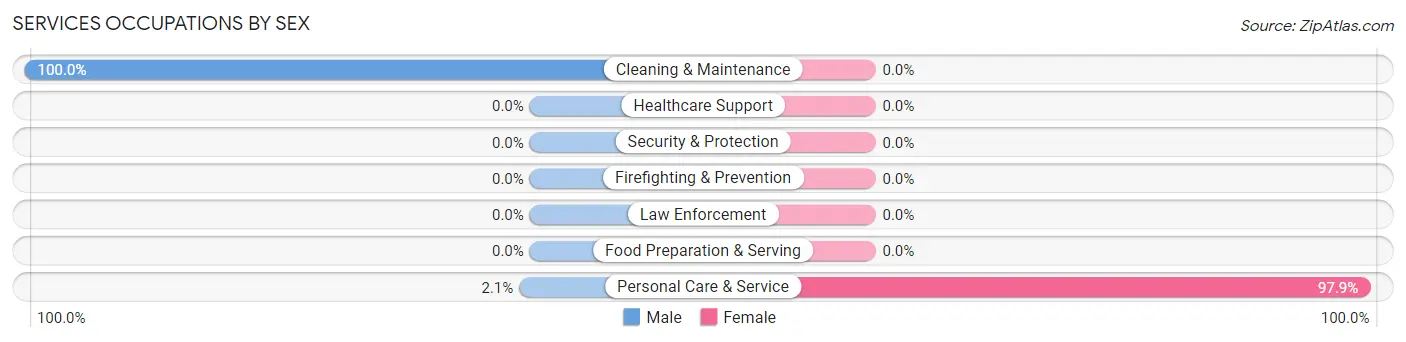
| Occupation | Male | Female |
| Healthcare Support | 0 (0.0%) | 0 (0.0%) |
| Security & Protection | 0 (0.0%) | 0 (0.0%) |
| Firefighting & Prevention | 0 (0.0%) | 0 (0.0%) |
| Law Enforcement | 0 (0.0%) | 0 (0.0%) |
| Food Preparation & Serving | 0 (0.0%) | 0 (0.0%) |
| Cleaning & Maintenance | 31 (100.0%) | 0 (0.0%) |
| Personal Care & Service | 1 (2.1%) | 47 (97.9%) |
| Total (Category) | 32 (40.5%) | 47 (59.5%) |
| Total (Overall) | 234 (57.6%) | 172 (42.4%) |
Sales and Office Occupations
The most common Sales and Office occupations in Shelter Island Heights are Office & Administration (52 | 12.8%), and Sales & Related (42 | 10.3%).
Sales and Office Occupations by Sex
| Occupation | Male | Female |
| Sales & Related | 0 (0.0%) | 42 (100.0%) |
| Office & Administration | 5 (9.6%) | 47 (90.4%) |
| Total (Category) | 5 (5.3%) | 89 (94.7%) |
| Total (Overall) | 234 (57.6%) | 172 (42.4%) |
Natural Resources, Construction and Maintenance Occupations
The most common Natural Resources, Construction and Maintenance occupations in Shelter Island Heights are , and Construction & Extraction (77 | 19.0%).
Natural Resources, Construction and Maintenance Occupations by Sex
| Occupation | Male | Female |
| Farming, Fishing & Forestry | 0 (0.0%) | 0 (0.0%) |
| Construction & Extraction | 77 (100.0%) | 0 (0.0%) |
| Installation, Maintenance & Repair | 0 (0.0%) | 0 (0.0%) |
| Total (Category) | 77 (100.0%) | 0 (0.0%) |
| Total (Overall) | 234 (57.6%) | 172 (42.4%) |
Production, Transportation and Moving Occupations
The most common Production, Transportation and Moving occupations in Shelter Island Heights are , and Transportation (27 | 6.7%).
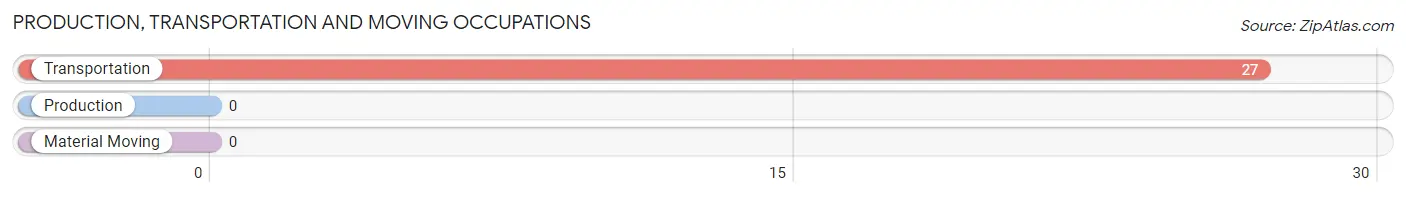
Production, Transportation and Moving Occupations by Sex
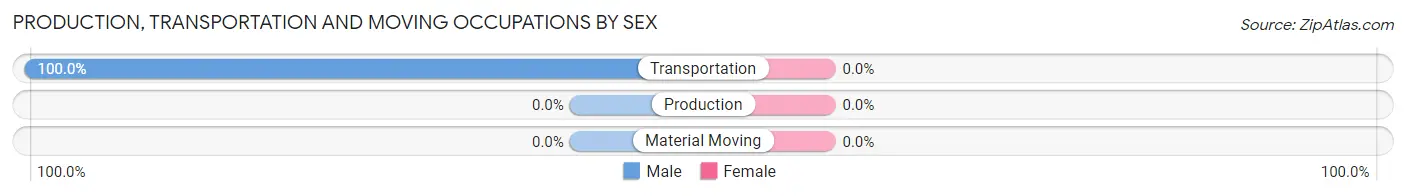
| Occupation | Male | Female |
| Production | 0 (0.0%) | 0 (0.0%) |
| Transportation | 27 (100.0%) | 0 (0.0%) |
| Material Moving | 0 (0.0%) | 0 (0.0%) |
| Total (Category) | 27 (100.0%) | 0 (0.0%) |
| Total (Overall) | 234 (57.6%) | 172 (42.4%) |
Employment Industries by Sex in Shelter Island Heights
Employment Industries in Shelter Island Heights
The major employment industries in Shelter Island Heights include Arts, Entertainment & Recreation (114 | 28.1%), Health Care & Social Assistance (70 | 17.2%), Public Administration (47 | 11.6%), Information (46 | 11.3%), and Real Estate, Rental & Leasing (37 | 9.1%).
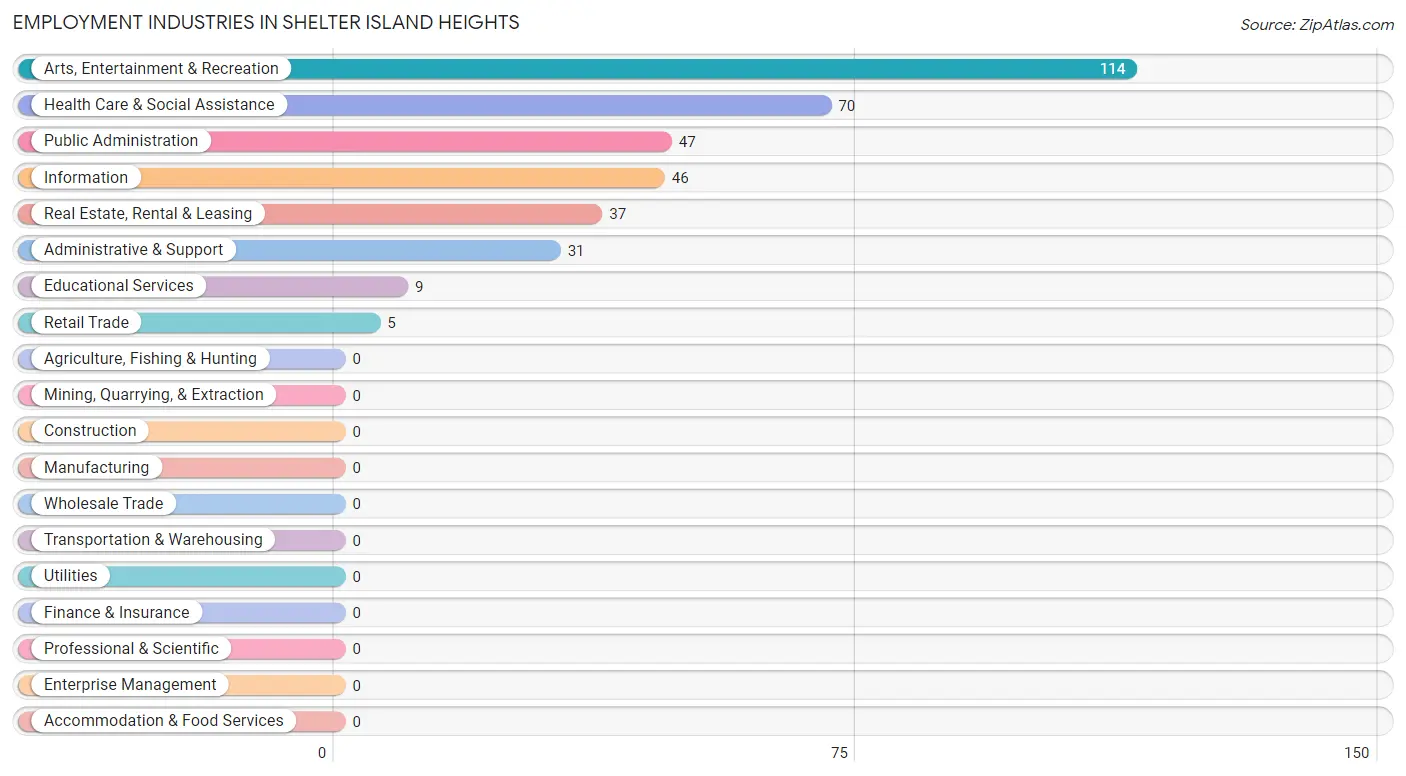
Employment Industries by Sex in Shelter Island Heights
The Shelter Island Heights industries that see more men than women are Information (100.0%), Administrative & Support (100.0%), and Educational Services (100.0%), whereas the industries that tend to have a higher number of women are Retail Trade (100.0%), Real Estate, Rental & Leasing (100.0%), and Public Administration (100.0%).
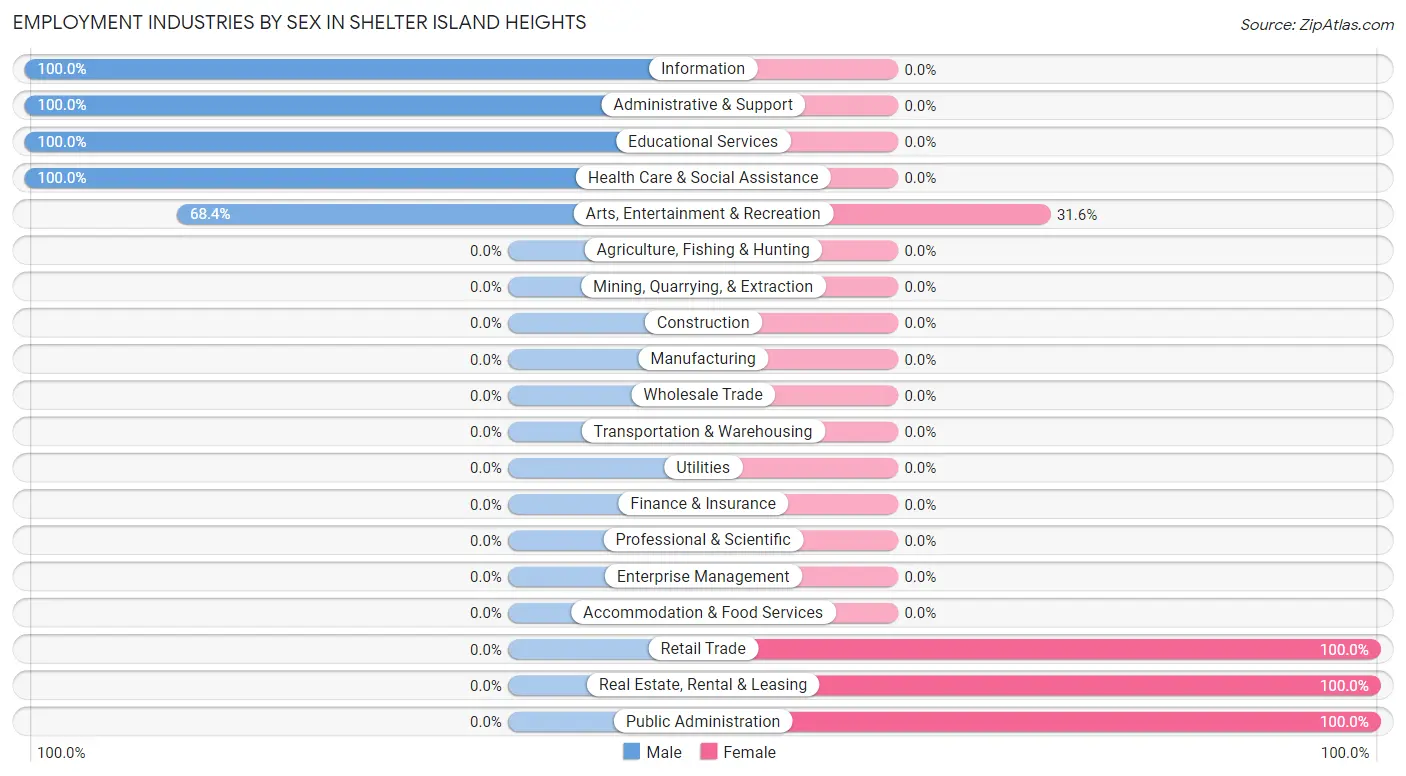
| Industry | Male | Female |
| Agriculture, Fishing & Hunting | 0 (0.0%) | 0 (0.0%) |
| Mining, Quarrying, & Extraction | 0 (0.0%) | 0 (0.0%) |
| Construction | 0 (0.0%) | 0 (0.0%) |
| Manufacturing | 0 (0.0%) | 0 (0.0%) |
| Wholesale Trade | 0 (0.0%) | 0 (0.0%) |
| Retail Trade | 0 (0.0%) | 5 (100.0%) |
| Transportation & Warehousing | 0 (0.0%) | 0 (0.0%) |
| Utilities | 0 (0.0%) | 0 (0.0%) |
| Information | 46 (100.0%) | 0 (0.0%) |
| Finance & Insurance | 0 (0.0%) | 0 (0.0%) |
| Real Estate, Rental & Leasing | 0 (0.0%) | 37 (100.0%) |
| Professional & Scientific | 0 (0.0%) | 0 (0.0%) |
| Enterprise Management | 0 (0.0%) | 0 (0.0%) |
| Administrative & Support | 31 (100.0%) | 0 (0.0%) |
| Educational Services | 9 (100.0%) | 0 (0.0%) |
| Health Care & Social Assistance | 70 (100.0%) | 0 (0.0%) |
| Arts, Entertainment & Recreation | 78 (68.4%) | 36 (31.6%) |
| Accommodation & Food Services | 0 (0.0%) | 0 (0.0%) |
| Public Administration | 0 (0.0%) | 47 (100.0%) |
| Total | 234 (57.6%) | 172 (42.4%) |
Education in Shelter Island Heights
School Enrollment in Shelter Island Heights
The most common levels of schooling among the 29 students in Shelter Island Heights are college / undergraduate (24 | 82.8%), and graduate / professional (5 | 17.2%).
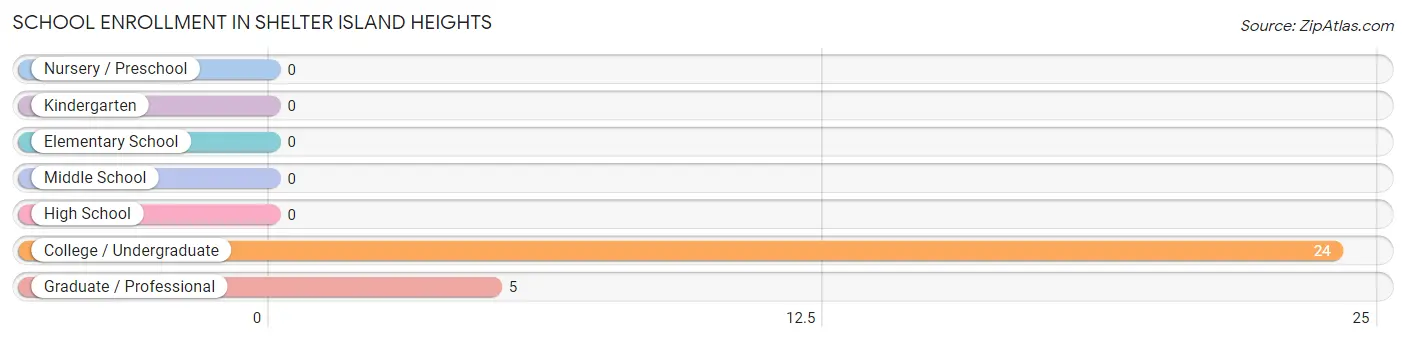
| School Level | # Students | % Students |
| Nursery / Preschool | 0 | 0.0% |
| Kindergarten | 0 | 0.0% |
| Elementary School | 0 | 0.0% |
| Middle School | 0 | 0.0% |
| High School | 0 | 0.0% |
| College / Undergraduate | 24 | 82.8% |
| Graduate / Professional | 5 | 17.2% |
| Total | 29 | 100.0% |
School Enrollment by Age by Funding Source in Shelter Island Heights
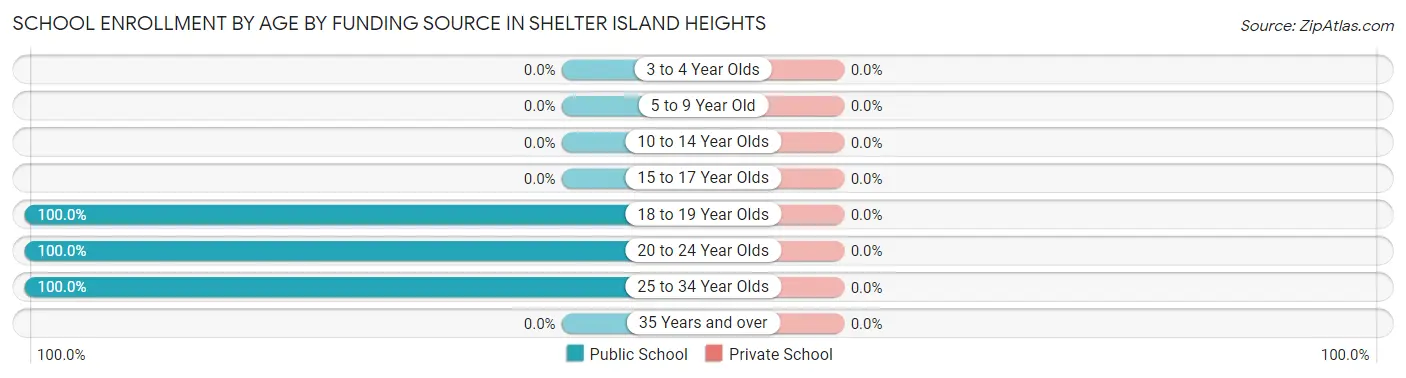
| Age Bracket | Public School | Private School |
| 3 to 4 Year Olds | 0 (0.0%) | 0 (0.0%) |
| 5 to 9 Year Old | 0 (0.0%) | 0 (0.0%) |
| 10 to 14 Year Olds | 0 (0.0%) | 0 (0.0%) |
| 15 to 17 Year Olds | 0 (0.0%) | 0 (0.0%) |
| 18 to 19 Year Olds | 19 (100.0%) | 0 (0.0%) |
| 20 to 24 Year Olds | 5 (100.0%) | 0 (0.0%) |
| 25 to 34 Year Olds | 5 (100.0%) | 0 (0.0%) |
| 35 Years and over | 0 (0.0%) | 0 (0.0%) |
| Total | 29 (100.0%) | 0 (0.0%) |
Educational Attainment by Field of Study in Shelter Island Heights
Education (120 | 22.4%), visual & performing arts (73 | 13.6%), bio, nature & agricultural (59 | 11.0%), business (59 | 11.0%), and physical & health sciences (58 | 10.8%) are the most common fields of study among 535 individuals in Shelter Island Heights who have obtained a bachelor's degree or higher.
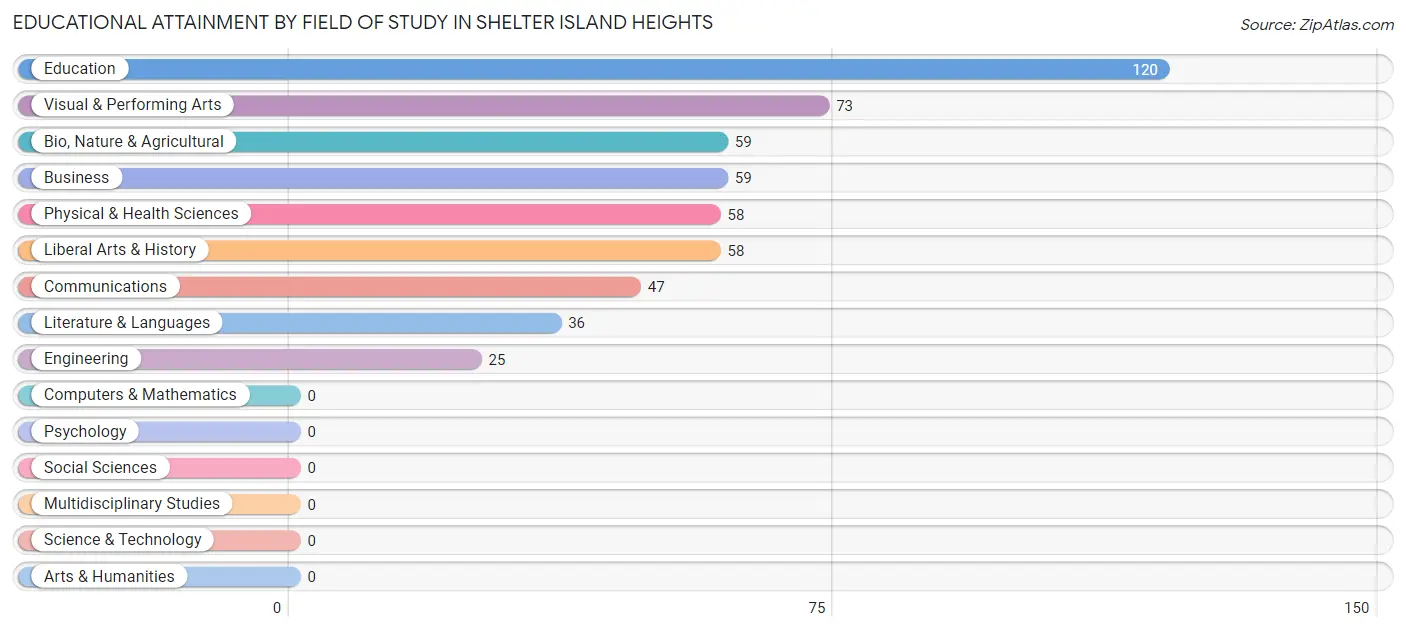
| Field of Study | # Graduates | % Graduates |
| Computers & Mathematics | 0 | 0.0% |
| Bio, Nature & Agricultural | 59 | 11.0% |
| Physical & Health Sciences | 58 | 10.8% |
| Psychology | 0 | 0.0% |
| Social Sciences | 0 | 0.0% |
| Engineering | 25 | 4.7% |
| Multidisciplinary Studies | 0 | 0.0% |
| Science & Technology | 0 | 0.0% |
| Business | 59 | 11.0% |
| Education | 120 | 22.4% |
| Literature & Languages | 36 | 6.7% |
| Liberal Arts & History | 58 | 10.8% |
| Visual & Performing Arts | 73 | 13.6% |
| Communications | 47 | 8.8% |
| Arts & Humanities | 0 | 0.0% |
| Total | 535 | 100.0% |
Transportation & Commute in Shelter Island Heights
Vehicle Availability by Sex in Shelter Island Heights
The most prevalent vehicle ownership categories in Shelter Island Heights are males with 2 vehicles (111, accounting for 51.1%) and females with 2 vehicles (47, making up 66.5%).
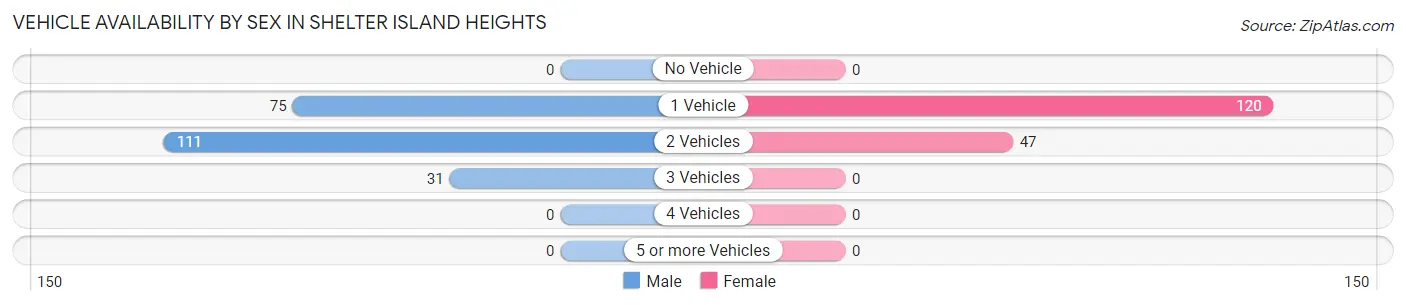
| Vehicles Available | Male | Female |
| No Vehicle | 0 (0.0%) | 0 (0.0%) |
| 1 Vehicle | 75 (34.6%) | 120 (71.9%) |
| 2 Vehicles | 111 (51.1%) | 47 (28.1%) |
| 3 Vehicles | 31 (14.3%) | 0 (0.0%) |
| 4 Vehicles | 0 (0.0%) | 0 (0.0%) |
| 5 or more Vehicles | 0 (0.0%) | 0 (0.0%) |
| Total | 217 (100.0%) | 167 (100.0%) |
Commute Time in Shelter Island Heights
The most frequently occuring commute durations in Shelter Island Heights are 10 to 14 minutes (122 commuters, 42.5%), 5 to 9 minutes (75 commuters, 26.1%), and 45 to 59 minutes (42 commuters, 14.6%).
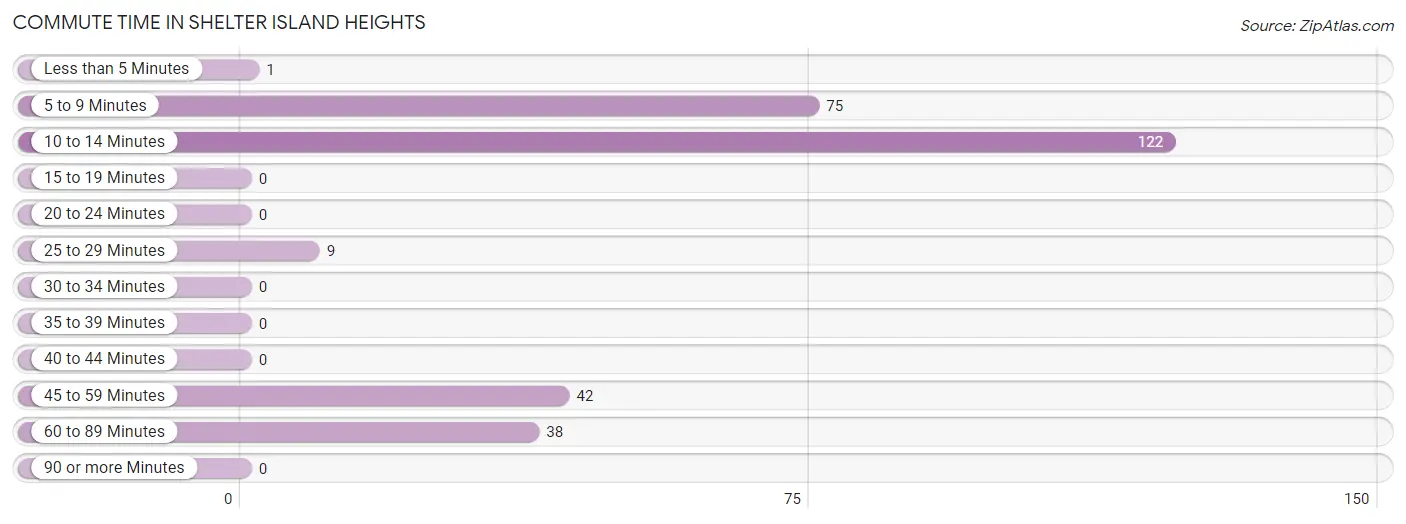
| Commute Time | # Commuters | % Commuters |
| Less than 5 Minutes | 1 | 0.4% |
| 5 to 9 Minutes | 75 | 26.1% |
| 10 to 14 Minutes | 122 | 42.5% |
| 15 to 19 Minutes | 0 | 0.0% |
| 20 to 24 Minutes | 0 | 0.0% |
| 25 to 29 Minutes | 9 | 3.1% |
| 30 to 34 Minutes | 0 | 0.0% |
| 35 to 39 Minutes | 0 | 0.0% |
| 40 to 44 Minutes | 0 | 0.0% |
| 45 to 59 Minutes | 42 | 14.6% |
| 60 to 89 Minutes | 38 | 13.2% |
| 90 or more Minutes | 0 | 0.0% |
Commute Time by Sex in Shelter Island Heights
The most common commute times in Shelter Island Heights are 5 to 9 minutes (75 commuters, 37.9%) for males and 10 to 14 minutes (47 commuters, 52.8%) for females.
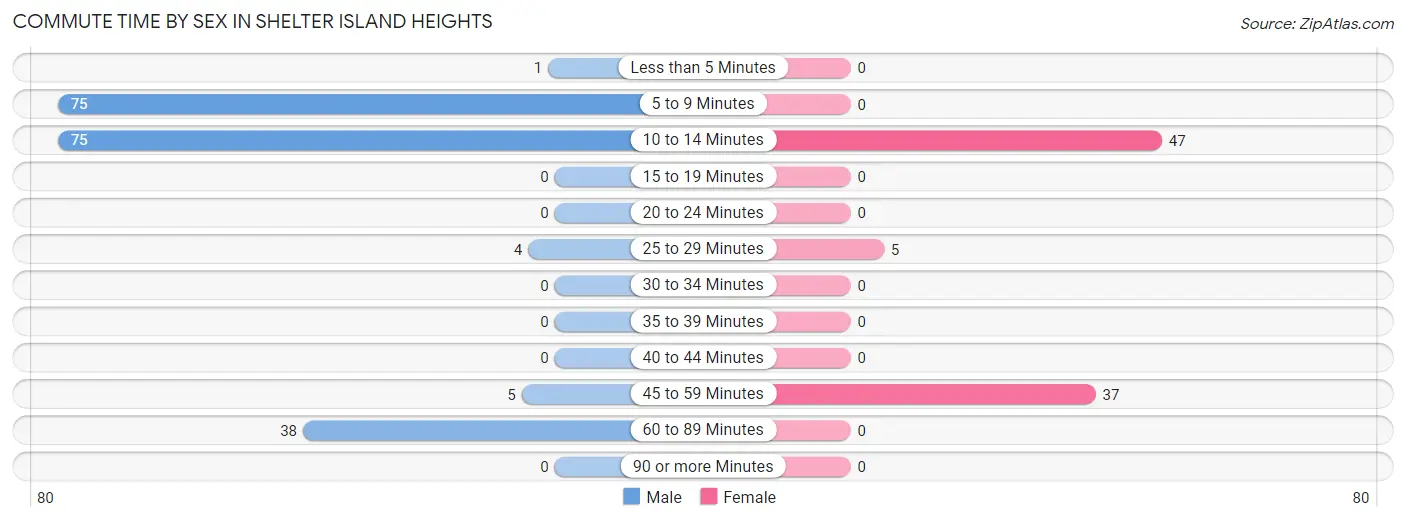
| Commute Time | Male | Female |
| Less than 5 Minutes | 1 (0.5%) | 0 (0.0%) |
| 5 to 9 Minutes | 75 (37.9%) | 0 (0.0%) |
| 10 to 14 Minutes | 75 (37.9%) | 47 (52.8%) |
| 15 to 19 Minutes | 0 (0.0%) | 0 (0.0%) |
| 20 to 24 Minutes | 0 (0.0%) | 0 (0.0%) |
| 25 to 29 Minutes | 4 (2.0%) | 5 (5.6%) |
| 30 to 34 Minutes | 0 (0.0%) | 0 (0.0%) |
| 35 to 39 Minutes | 0 (0.0%) | 0 (0.0%) |
| 40 to 44 Minutes | 0 (0.0%) | 0 (0.0%) |
| 45 to 59 Minutes | 5 (2.5%) | 37 (41.6%) |
| 60 to 89 Minutes | 38 (19.2%) | 0 (0.0%) |
| 90 or more Minutes | 0 (0.0%) | 0 (0.0%) |
Time of Departure to Work by Sex in Shelter Island Heights
The most frequent times of departure to work in Shelter Island Heights are 8:00 AM to 8:29 AM (79, 39.9%) for males and 8:30 AM to 8:59 AM (52, 58.4%) for females.
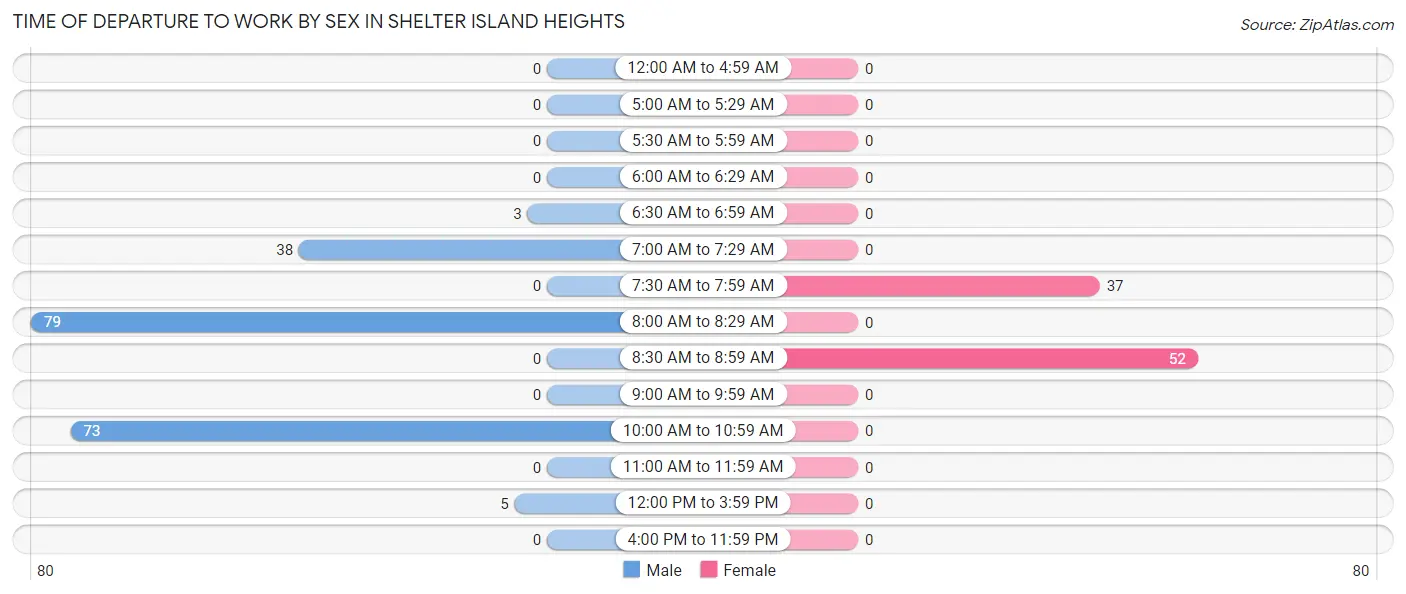
| Time of Departure | Male | Female |
| 12:00 AM to 4:59 AM | 0 (0.0%) | 0 (0.0%) |
| 5:00 AM to 5:29 AM | 0 (0.0%) | 0 (0.0%) |
| 5:30 AM to 5:59 AM | 0 (0.0%) | 0 (0.0%) |
| 6:00 AM to 6:29 AM | 0 (0.0%) | 0 (0.0%) |
| 6:30 AM to 6:59 AM | 3 (1.5%) | 0 (0.0%) |
| 7:00 AM to 7:29 AM | 38 (19.2%) | 0 (0.0%) |
| 7:30 AM to 7:59 AM | 0 (0.0%) | 37 (41.6%) |
| 8:00 AM to 8:29 AM | 79 (39.9%) | 0 (0.0%) |
| 8:30 AM to 8:59 AM | 0 (0.0%) | 52 (58.4%) |
| 9:00 AM to 9:59 AM | 0 (0.0%) | 0 (0.0%) |
| 10:00 AM to 10:59 AM | 73 (36.9%) | 0 (0.0%) |
| 11:00 AM to 11:59 AM | 0 (0.0%) | 0 (0.0%) |
| 12:00 PM to 3:59 PM | 5 (2.5%) | 0 (0.0%) |
| 4:00 PM to 11:59 PM | 0 (0.0%) | 0 (0.0%) |
| Total | 198 (100.0%) | 89 (100.0%) |
Housing Occupancy in Shelter Island Heights
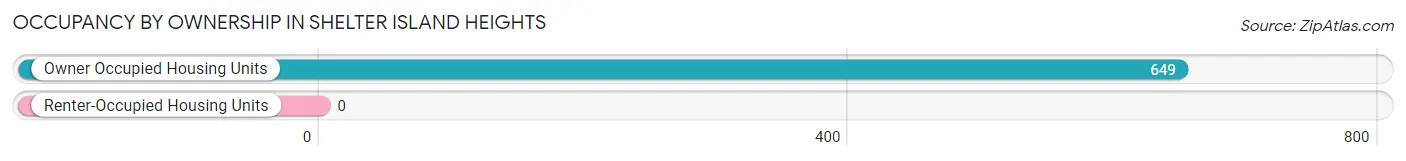
Occupancy by Ownership in Shelter Island Heights
Of the total 649 dwellings in Shelter Island Heights, owner-occupied units account for 649 (100.0%), while renter-occupied units make up 0 (0.0%).
| Occupancy | # Housing Units | % Housing Units |
| Owner Occupied Housing Units | 649 | 100.0% |
| Renter-Occupied Housing Units | 0 | 0.0% |
| Total Occupied Housing Units | 649 | 100.0% |
Occupancy by Household Size in Shelter Island Heights
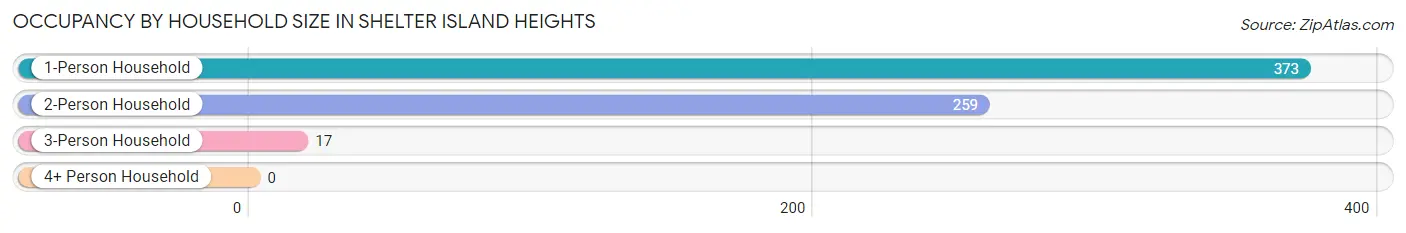
| Household Size | # Housing Units | % Housing Units |
| 1-Person Household | 373 | 57.5% |
| 2-Person Household | 259 | 39.9% |
| 3-Person Household | 17 | 2.6% |
| 4+ Person Household | 0 | 0.0% |
| Total Housing Units | 649 | 100.0% |
Occupancy by Ownership by Household Size in Shelter Island Heights
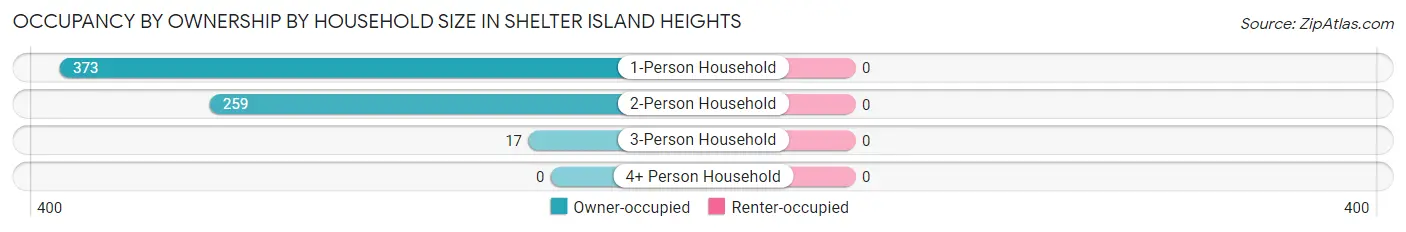
| Household Size | Owner-occupied | Renter-occupied |
| 1-Person Household | 373 (100.0%) | 0 (0.0%) |
| 2-Person Household | 259 (100.0%) | 0 (0.0%) |
| 3-Person Household | 17 (100.0%) | 0 (0.0%) |
| 4+ Person Household | 0 (0.0%) | 0 (0.0%) |
| Total Housing Units | 649 (100.0%) | 0 (0.0%) |
Occupancy by Educational Attainment in Shelter Island Heights
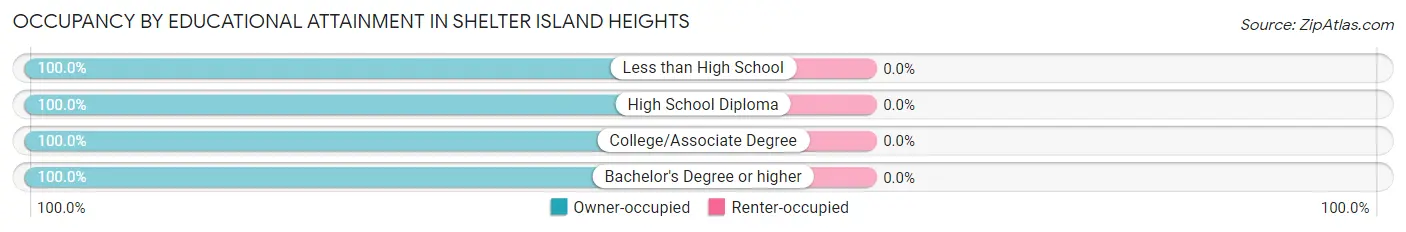
| Household Size | Owner-occupied | Renter-occupied |
| Less than High School | 56 (100.0%) | 0 (0.0%) |
| High School Diploma | 17 (100.0%) | 0 (0.0%) |
| College/Associate Degree | 180 (100.0%) | 0 (0.0%) |
| Bachelor's Degree or higher | 396 (100.0%) | 0 (0.0%) |
Occupancy by Age of Householder in Shelter Island Heights
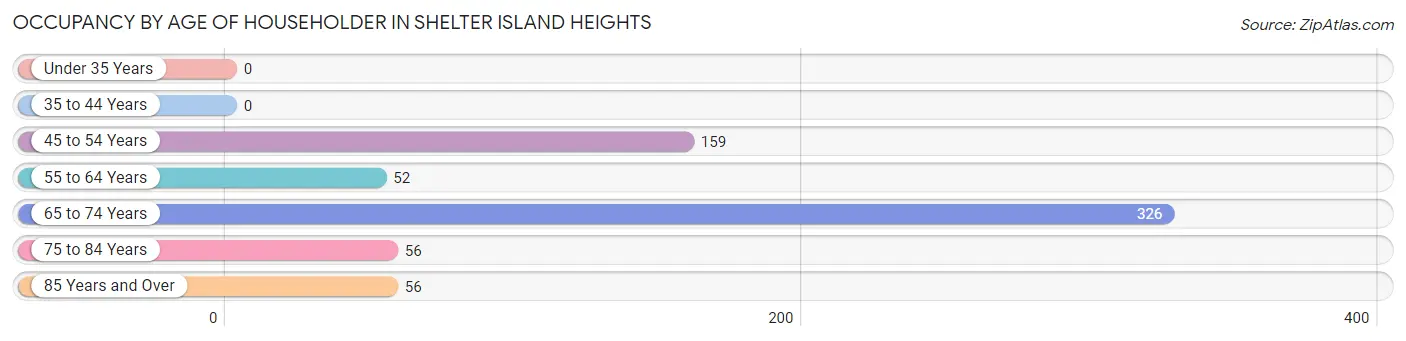
| Age Bracket | # Households | % Households |
| Under 35 Years | 0 | 0.0% |
| 35 to 44 Years | 0 | 0.0% |
| 45 to 54 Years | 159 | 24.5% |
| 55 to 64 Years | 52 | 8.0% |
| 65 to 74 Years | 326 | 50.2% |
| 75 to 84 Years | 56 | 8.6% |
| 85 Years and Over | 56 | 8.6% |
| Total | 649 | 100.0% |
Housing Finances in Shelter Island Heights
Median Income by Occupancy in Shelter Island Heights
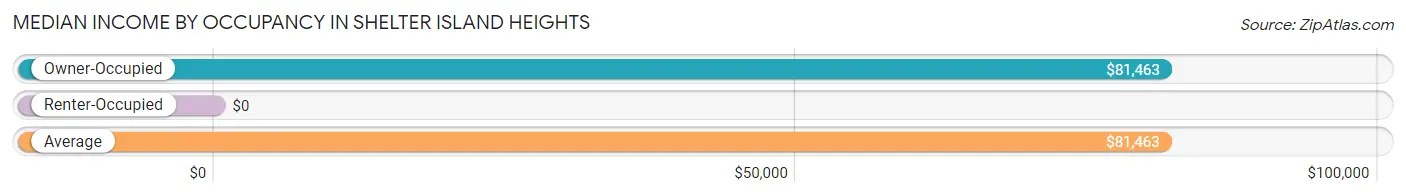
| Occupancy Type | # Households | Median Income |
| Owner-Occupied | 649 (100.0%) | $81,463 |
| Renter-Occupied | 0 (0.0%) | $0 |
| Average | 649 (100.0%) | $81,463 |
Occupancy by Householder Income Bracket in Shelter Island Heights
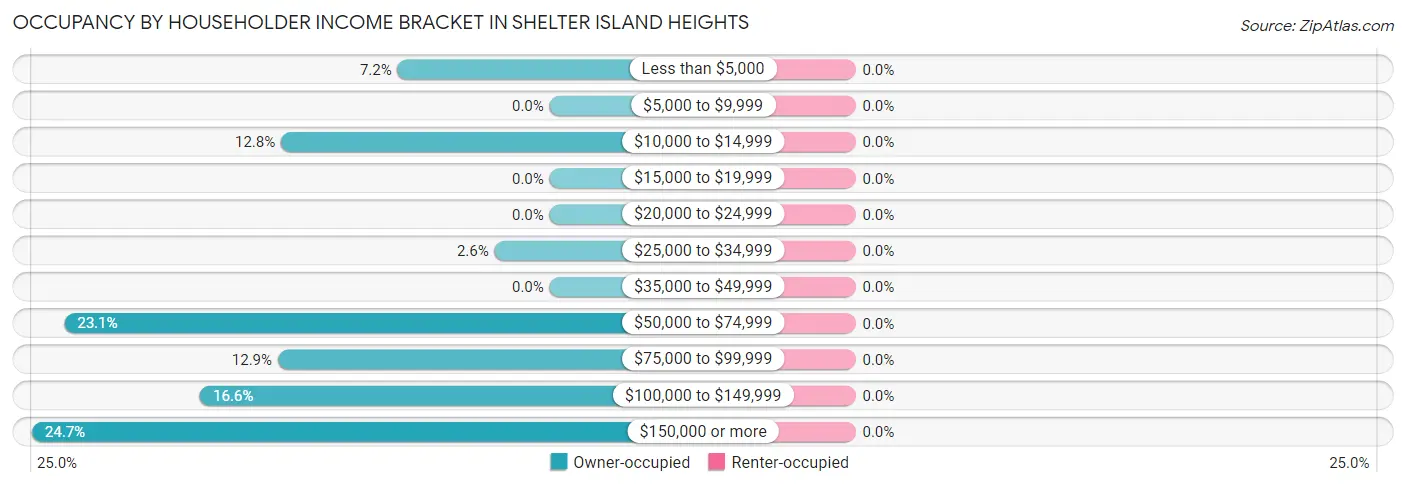
| Income Bracket | Owner-occupied | Renter-occupied |
| Less than $5,000 | 47 (7.2%) | 0 (0.0%) |
| $5,000 to $9,999 | 0 (0.0%) | 0 (0.0%) |
| $10,000 to $14,999 | 83 (12.8%) | 0 (0.0%) |
| $15,000 to $19,999 | 0 (0.0%) | 0 (0.0%) |
| $20,000 to $24,999 | 0 (0.0%) | 0 (0.0%) |
| $25,000 to $34,999 | 17 (2.6%) | 0 (0.0%) |
| $35,000 to $49,999 | 0 (0.0%) | 0 (0.0%) |
| $50,000 to $74,999 | 150 (23.1%) | 0 (0.0%) |
| $75,000 to $99,999 | 84 (12.9%) | 0 (0.0%) |
| $100,000 to $149,999 | 108 (16.6%) | 0 (0.0%) |
| $150,000 or more | 160 (24.6%) | 0 (0.0%) |
| Total | 649 (100.0%) | 0 (0.0%) |
Monthly Housing Cost Tiers in Shelter Island Heights
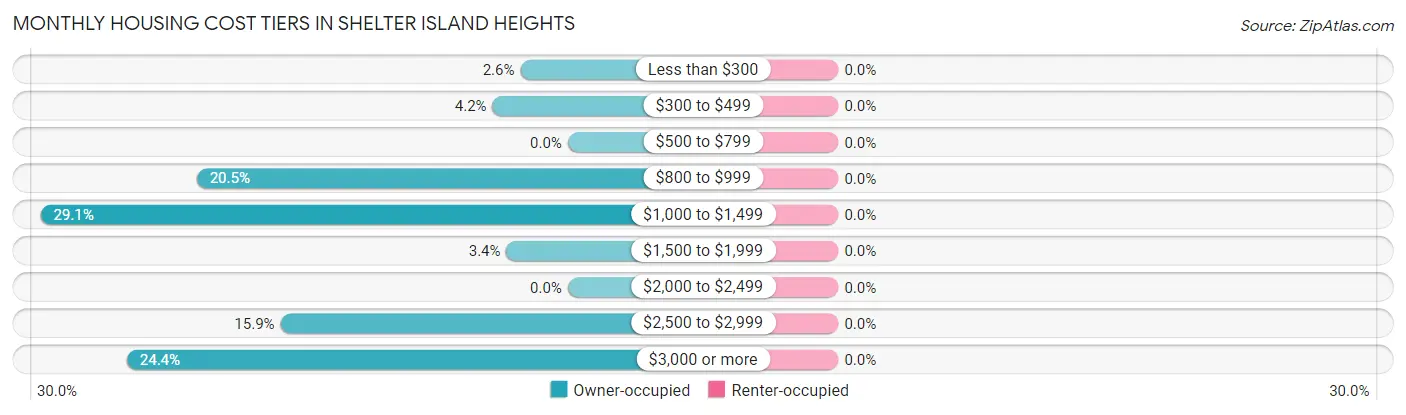
| Monthly Cost | Owner-occupied | Renter-occupied |
| Less than $300 | 17 (2.6%) | 0 (0.0%) |
| $300 to $499 | 27 (4.2%) | 0 (0.0%) |
| $500 to $799 | 0 (0.0%) | 0 (0.0%) |
| $800 to $999 | 133 (20.5%) | 0 (0.0%) |
| $1,000 to $1,499 | 189 (29.1%) | 0 (0.0%) |
| $1,500 to $1,999 | 22 (3.4%) | 0 (0.0%) |
| $2,000 to $2,499 | 0 (0.0%) | 0 (0.0%) |
| $2,500 to $2,999 | 103 (15.9%) | 0 (0.0%) |
| $3,000 or more | 158 (24.3%) | 0 (0.0%) |
| Total | 649 (100.0%) | 0 (0.0%) |
Physical Housing Characteristics in Shelter Island Heights
Housing Structures in Shelter Island Heights
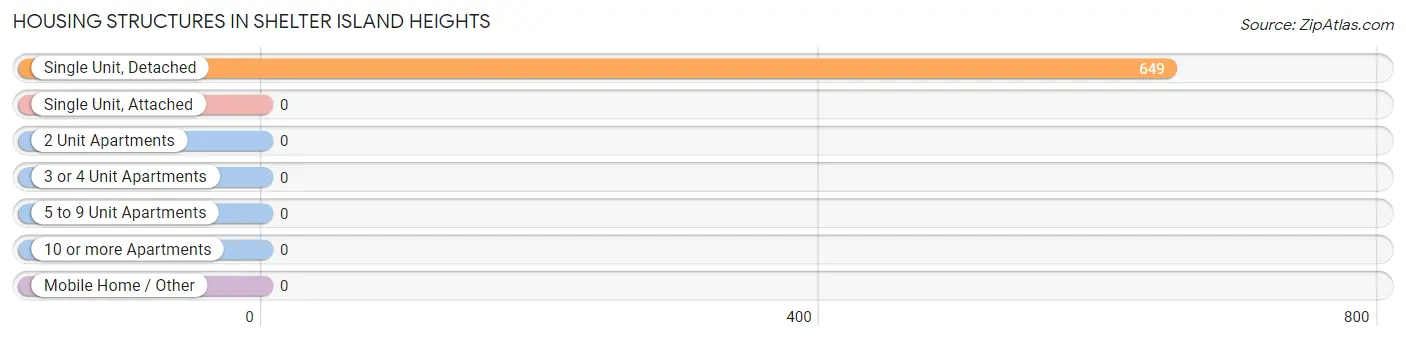
| Structure Type | # Housing Units | % Housing Units |
| Single Unit, Detached | 649 | 100.0% |
| Single Unit, Attached | 0 | 0.0% |
| 2 Unit Apartments | 0 | 0.0% |
| 3 or 4 Unit Apartments | 0 | 0.0% |
| 5 to 9 Unit Apartments | 0 | 0.0% |
| 10 or more Apartments | 0 | 0.0% |
| Mobile Home / Other | 0 | 0.0% |
| Total | 649 | 100.0% |
Housing Structures by Occupancy in Shelter Island Heights
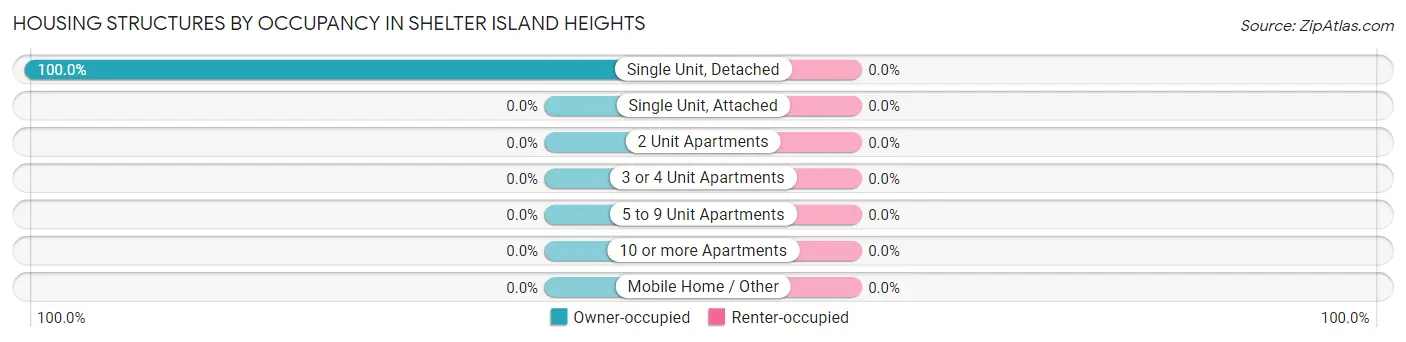
| Structure Type | Owner-occupied | Renter-occupied |
| Single Unit, Detached | 649 (100.0%) | 0 (0.0%) |
| Single Unit, Attached | 0 (0.0%) | 0 (0.0%) |
| 2 Unit Apartments | 0 (0.0%) | 0 (0.0%) |
| 3 or 4 Unit Apartments | 0 (0.0%) | 0 (0.0%) |
| 5 to 9 Unit Apartments | 0 (0.0%) | 0 (0.0%) |
| 10 or more Apartments | 0 (0.0%) | 0 (0.0%) |
| Mobile Home / Other | 0 (0.0%) | 0 (0.0%) |
| Total | 649 (100.0%) | 0 (0.0%) |
Housing Structures by Number of Rooms in Shelter Island Heights
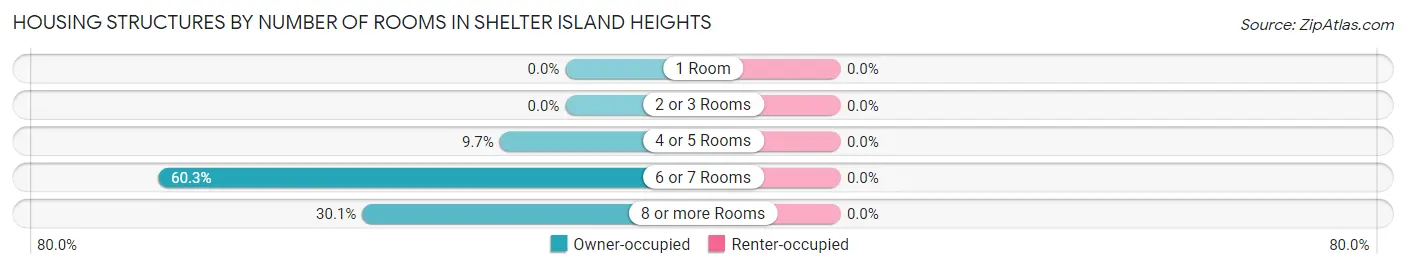
| Number of Rooms | Owner-occupied | Renter-occupied |
| 1 Room | 0 (0.0%) | 0 (0.0%) |
| 2 or 3 Rooms | 0 (0.0%) | 0 (0.0%) |
| 4 or 5 Rooms | 63 (9.7%) | 0 (0.0%) |
| 6 or 7 Rooms | 391 (60.3%) | 0 (0.0%) |
| 8 or more Rooms | 195 (30.0%) | 0 (0.0%) |
| Total | 649 (100.0%) | 0 (0.0%) |
Housing Structure by Heating Type in Shelter Island Heights
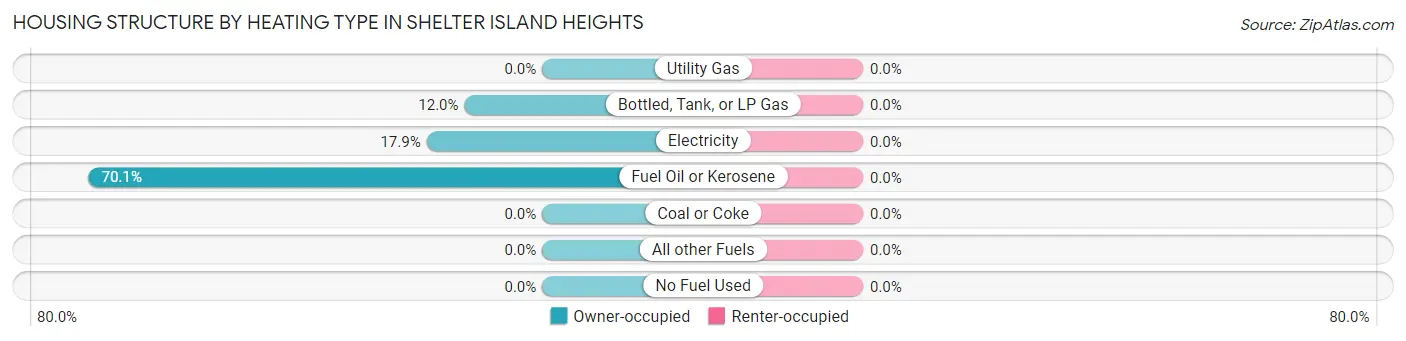
| Heating Type | Owner-occupied | Renter-occupied |
| Utility Gas | 0 (0.0%) | 0 (0.0%) |
| Bottled, Tank, or LP Gas | 78 (12.0%) | 0 (0.0%) |
| Electricity | 116 (17.9%) | 0 (0.0%) |
| Fuel Oil or Kerosene | 455 (70.1%) | 0 (0.0%) |
| Coal or Coke | 0 (0.0%) | 0 (0.0%) |
| All other Fuels | 0 (0.0%) | 0 (0.0%) |
| No Fuel Used | 0 (0.0%) | 0 (0.0%) |
| Total | 649 (100.0%) | 0 (0.0%) |
Household Vehicle Usage in Shelter Island Heights
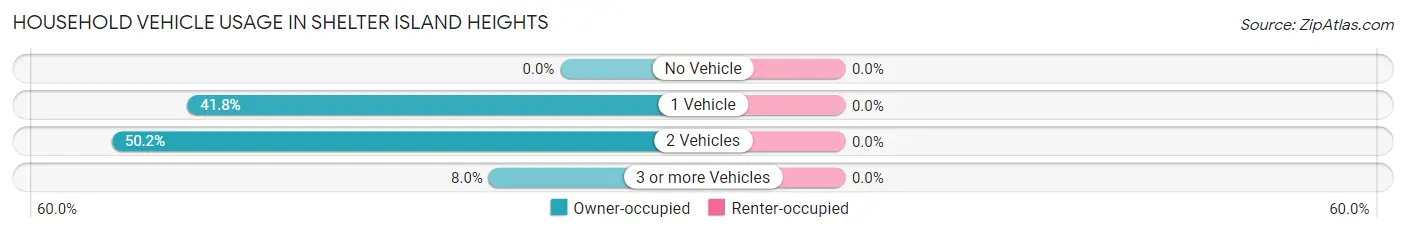
| Vehicles per Household | Owner-occupied | Renter-occupied |
| No Vehicle | 0 (0.0%) | 0 (0.0%) |
| 1 Vehicle | 271 (41.8%) | 0 (0.0%) |
| 2 Vehicles | 326 (50.2%) | 0 (0.0%) |
| 3 or more Vehicles | 52 (8.0%) | 0 (0.0%) |
| Total | 649 (100.0%) | 0 (0.0%) |
Real Estate & Mortgages in Shelter Island Heights
Real Estate and Mortgage Overview in Shelter Island Heights
| Characteristic | Without Mortgage | With Mortgage |
| Housing Units | 386 | 263 |
| Median Property Value | $803,100 | $1,125,000 |
| Median Household Income | $63,929 | $82 |
| Monthly Housing Costs | $1,028 | $138 |
| Real Estate Taxes | $6,093 | $0 |
Property Value by Mortgage Status in Shelter Island Heights
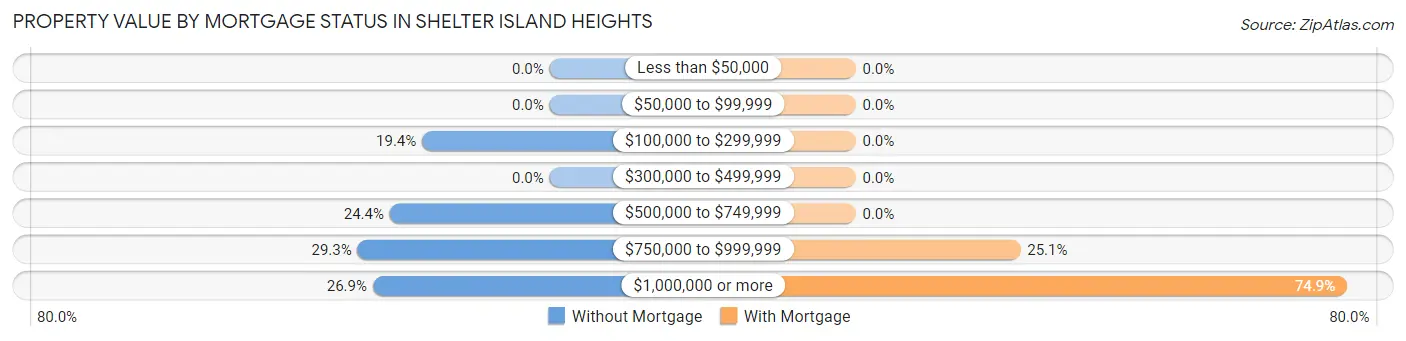
| Property Value | Without Mortgage | With Mortgage |
| Less than $50,000 | 0 (0.0%) | 0 (0.0%) |
| $50,000 to $99,999 | 0 (0.0%) | 0 (0.0%) |
| $100,000 to $299,999 | 75 (19.4%) | 0 (0.0%) |
| $300,000 to $499,999 | 0 (0.0%) | 0 (0.0%) |
| $500,000 to $749,999 | 94 (24.3%) | 0 (0.0%) |
| $750,000 to $999,999 | 113 (29.3%) | 66 (25.1%) |
| $1,000,000 or more | 104 (26.9%) | 197 (74.9%) |
| Total | 386 (100.0%) | 263 (100.0%) |
Household Income by Mortgage Status in Shelter Island Heights
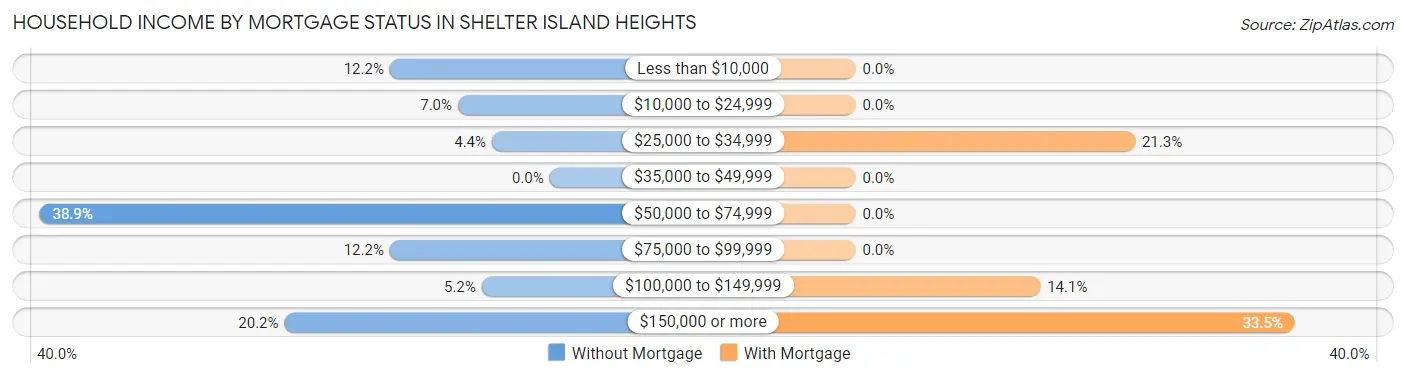
| Household Income | Without Mortgage | With Mortgage |
| Less than $10,000 | 47 (12.2%) | 0 (0.0%) |
| $10,000 to $24,999 | 27 (7.0%) | 0 (0.0%) |
| $25,000 to $34,999 | 17 (4.4%) | 56 (21.3%) |
| $35,000 to $49,999 | 0 (0.0%) | 0 (0.0%) |
| $50,000 to $74,999 | 150 (38.9%) | 0 (0.0%) |
| $75,000 to $99,999 | 47 (12.2%) | 0 (0.0%) |
| $100,000 to $149,999 | 20 (5.2%) | 37 (14.1%) |
| $150,000 or more | 78 (20.2%) | 88 (33.5%) |
| Total | 386 (100.0%) | 263 (100.0%) |
Property Value to Household Income Ratio in Shelter Island Heights
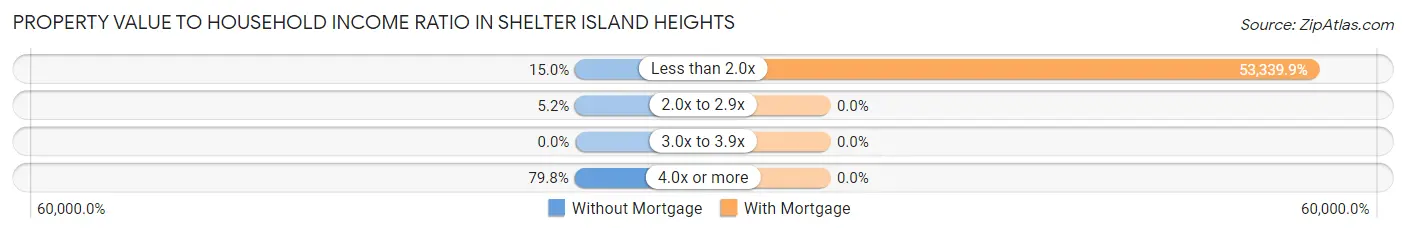
| Value-to-Income Ratio | Without Mortgage | With Mortgage |
| Less than 2.0x | 58 (15.0%) | 140,284 (53,339.9%) |
| 2.0x to 2.9x | 20 (5.2%) | 0 (0.0%) |
| 3.0x to 3.9x | 0 (0.0%) | 0 (0.0%) |
| 4.0x or more | 308 (79.8%) | 0 (0.0%) |
| Total | 386 (100.0%) | 263 (100.0%) |
Real Estate Taxes by Mortgage Status in Shelter Island Heights
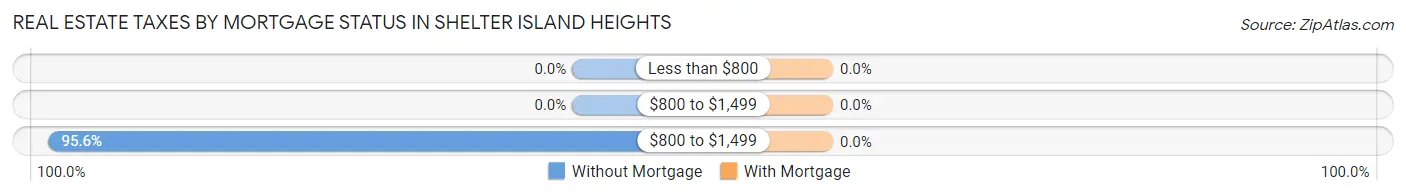
| Property Taxes | Without Mortgage | With Mortgage |
| Less than $800 | 0 (0.0%) | 0 (0.0%) |
| $800 to $1,499 | 0 (0.0%) | 0 (0.0%) |
| $800 to $1,499 | 369 (95.6%) | 0 (0.0%) |
| Total | 386 (100.0%) | 263 (100.0%) |
Health & Disability in Shelter Island Heights
Health Insurance Coverage by Age in Shelter Island Heights
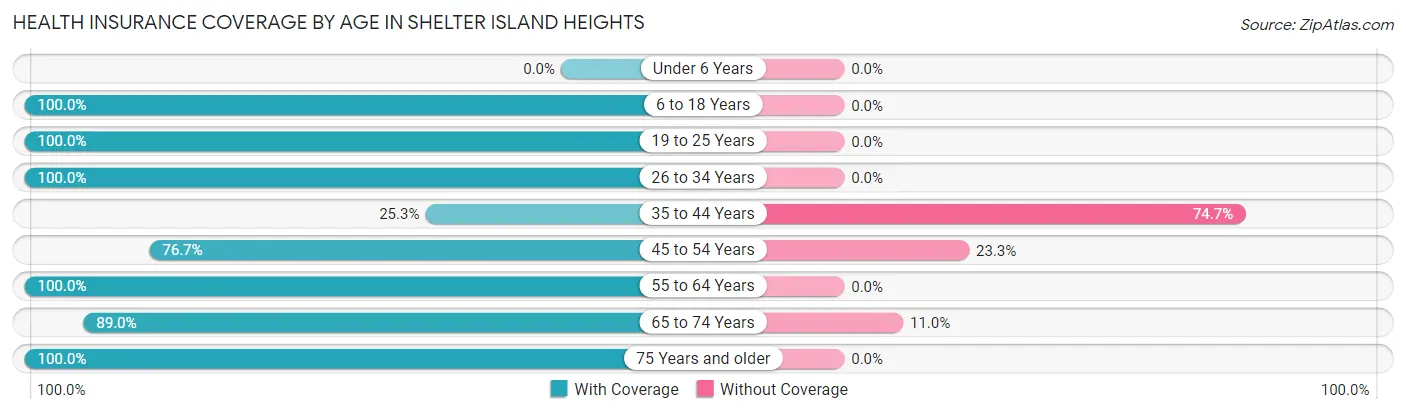
| Age Bracket | With Coverage | Without Coverage |
| Under 6 Years | 0 (0.0%) | 0 (0.0%) |
| 6 to 18 Years | 19 (100.0%) | 0 (0.0%) |
| 19 to 25 Years | 69 (100.0%) | 0 (0.0%) |
| 26 to 34 Years | 5 (100.0%) | 0 (0.0%) |
| 35 to 44 Years | 22 (25.3%) | 65 (74.7%) |
| 45 to 54 Years | 122 (76.7%) | 37 (23.3%) |
| 55 to 64 Years | 145 (100.0%) | 0 (0.0%) |
| 65 to 74 Years | 382 (89.0%) | 47 (11.0%) |
| 75 Years and older | 143 (100.0%) | 0 (0.0%) |
| Total | 907 (85.9%) | 149 (14.1%) |
Health Insurance Coverage by Citizenship Status in Shelter Island Heights
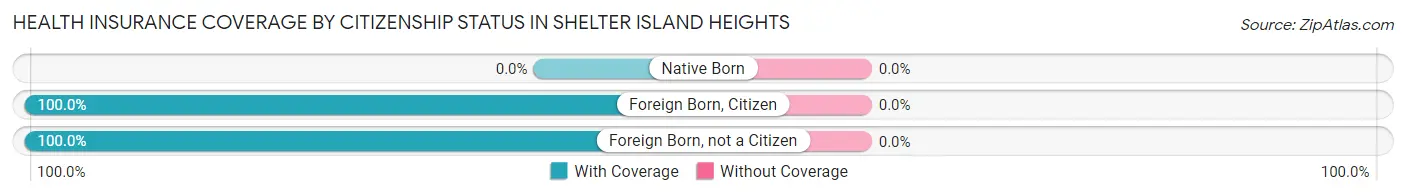
| Citizenship Status | With Coverage | Without Coverage |
| Native Born | 0 (0.0%) | 0 (0.0%) |
| Foreign Born, Citizen | 19 (100.0%) | 0 (0.0%) |
| Foreign Born, not a Citizen | 69 (100.0%) | 0 (0.0%) |
Health Insurance Coverage by Household Income in Shelter Island Heights
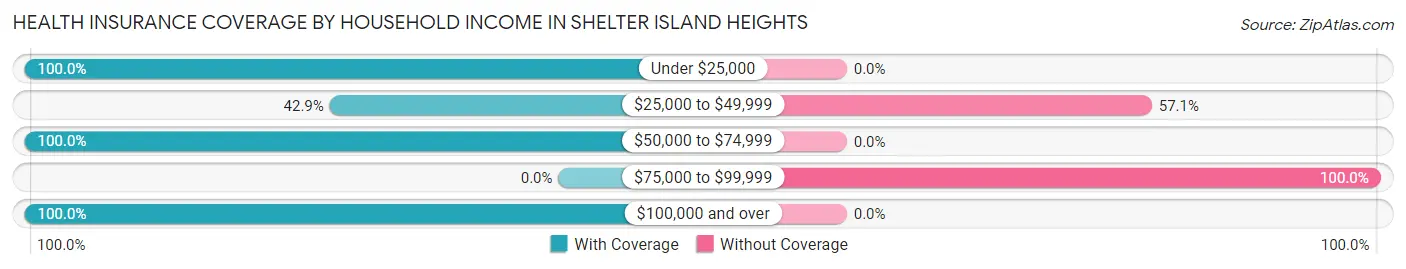
| Household Income | With Coverage | Without Coverage |
| Under $25,000 | 194 (100.0%) | 0 (0.0%) |
| $25,000 to $49,999 | 48 (42.9%) | 64 (57.1%) |
| $50,000 to $74,999 | 186 (100.0%) | 0 (0.0%) |
| $75,000 to $99,999 | 0 (0.0%) | 84 (100.0%) |
| $100,000 and over | 448 (100.0%) | 0 (0.0%) |
Public vs Private Health Insurance Coverage by Age in Shelter Island Heights
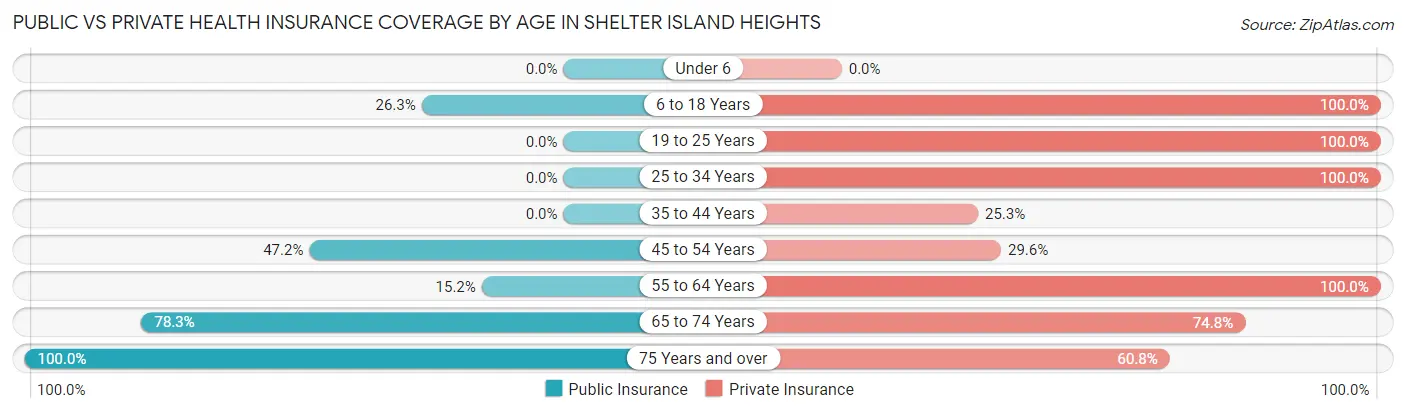
| Age Bracket | Public Insurance | Private Insurance |
| Under 6 | 0 (0.0%) | 0 (0.0%) |
| 6 to 18 Years | 5 (26.3%) | 19 (100.0%) |
| 19 to 25 Years | 0 (0.0%) | 69 (100.0%) |
| 25 to 34 Years | 0 (0.0%) | 5 (100.0%) |
| 35 to 44 Years | 0 (0.0%) | 22 (25.3%) |
| 45 to 54 Years | 75 (47.2%) | 47 (29.6%) |
| 55 to 64 Years | 22 (15.2%) | 145 (100.0%) |
| 65 to 74 Years | 336 (78.3%) | 321 (74.8%) |
| 75 Years and over | 143 (100.0%) | 87 (60.8%) |
| Total | 581 (55.0%) | 715 (67.7%) |
Disability Status by Sex by Age in Shelter Island Heights
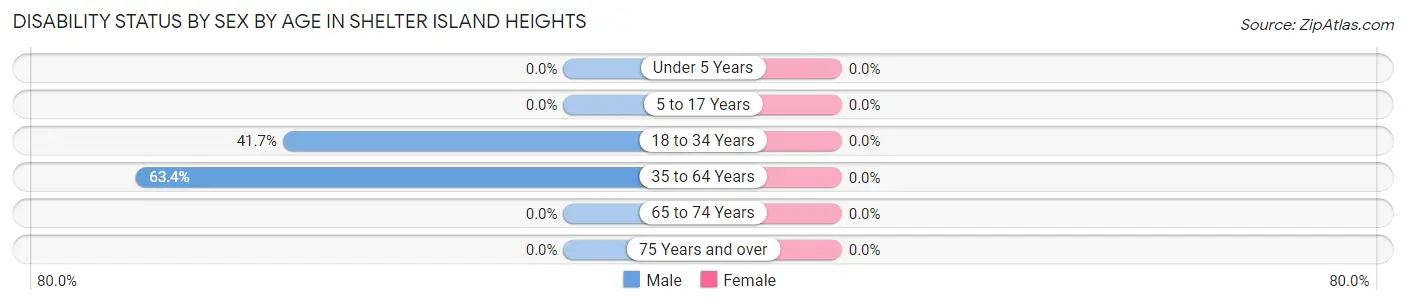
| Age Bracket | Male | Female |
| Under 5 Years | 0 (0.0%) | 0 (0.0%) |
| 5 to 17 Years | 0 (0.0%) | 0 (0.0%) |
| 18 to 34 Years | 10 (41.7%) | 0 (0.0%) |
| 35 to 64 Years | 97 (63.4%) | 0 (0.0%) |
| 65 to 74 Years | 0 (0.0%) | 0 (0.0%) |
| 75 Years and over | 0 (0.0%) | 0 (0.0%) |
Disability Class by Sex by Age in Shelter Island Heights
Disability Class: Hearing Difficulty
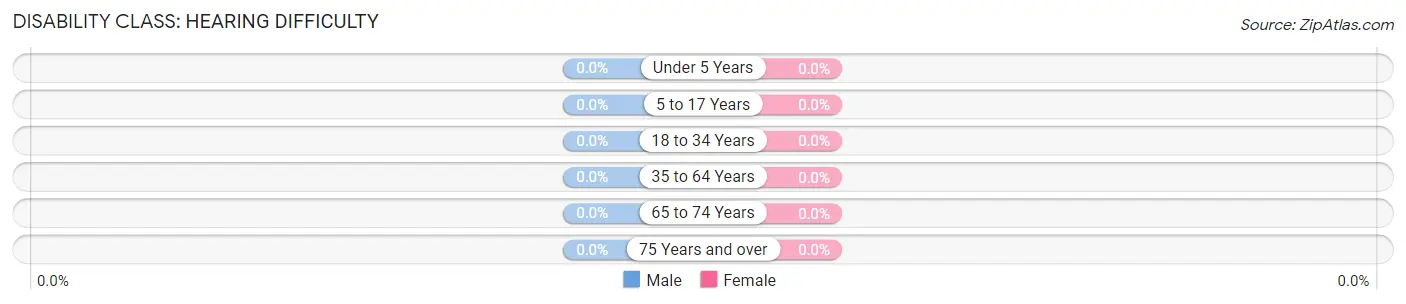
| Age Bracket | Male | Female |
| Under 5 Years | 0 (0.0%) | 0 (0.0%) |
| 5 to 17 Years | 0 (0.0%) | 0 (0.0%) |
| 18 to 34 Years | 0 (0.0%) | 0 (0.0%) |
| 35 to 64 Years | 0 (0.0%) | 0 (0.0%) |
| 65 to 74 Years | 0 (0.0%) | 0 (0.0%) |
| 75 Years and over | 0 (0.0%) | 0 (0.0%) |
Disability Class: Vision Difficulty
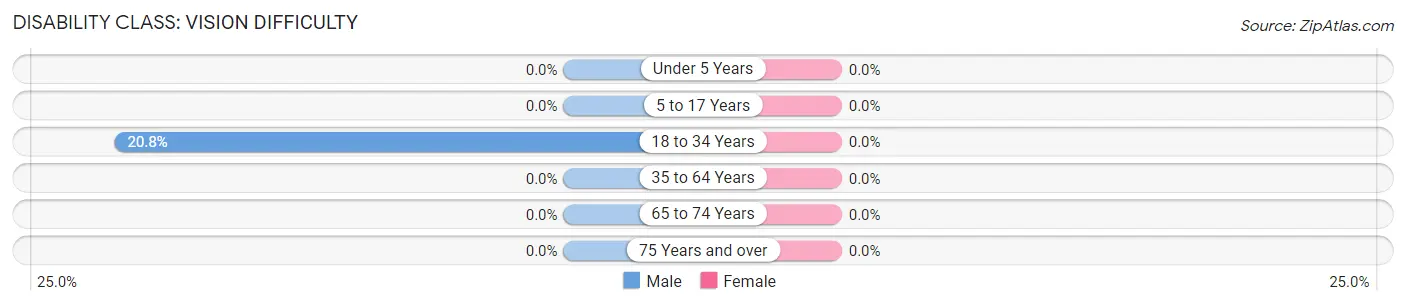
| Age Bracket | Male | Female |
| Under 5 Years | 0 (0.0%) | 0 (0.0%) |
| 5 to 17 Years | 0 (0.0%) | 0 (0.0%) |
| 18 to 34 Years | 5 (20.8%) | 0 (0.0%) |
| 35 to 64 Years | 0 (0.0%) | 0 (0.0%) |
| 65 to 74 Years | 0 (0.0%) | 0 (0.0%) |
| 75 Years and over | 0 (0.0%) | 0 (0.0%) |
Disability Class: Cognitive Difficulty
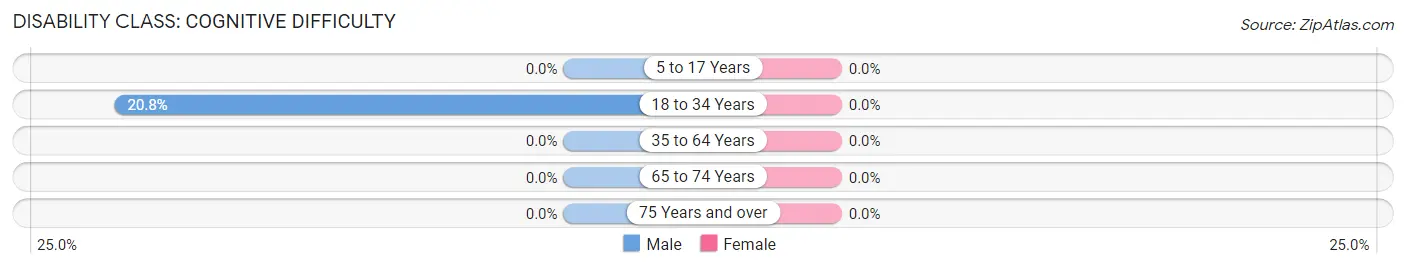
| Age Bracket | Male | Female |
| 5 to 17 Years | 0 (0.0%) | 0 (0.0%) |
| 18 to 34 Years | 5 (20.8%) | 0 (0.0%) |
| 35 to 64 Years | 0 (0.0%) | 0 (0.0%) |
| 65 to 74 Years | 0 (0.0%) | 0 (0.0%) |
| 75 Years and over | 0 (0.0%) | 0 (0.0%) |
Disability Class: Ambulatory Difficulty
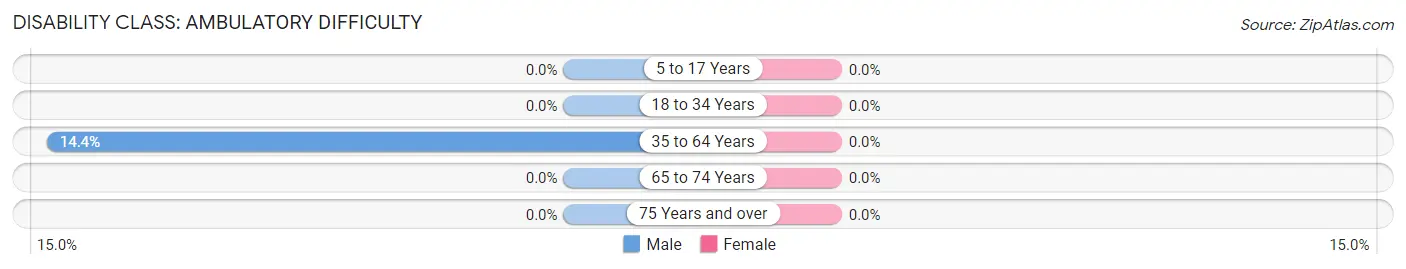
| Age Bracket | Male | Female |
| 5 to 17 Years | 0 (0.0%) | 0 (0.0%) |
| 18 to 34 Years | 0 (0.0%) | 0 (0.0%) |
| 35 to 64 Years | 22 (14.4%) | 0 (0.0%) |
| 65 to 74 Years | 0 (0.0%) | 0 (0.0%) |
| 75 Years and over | 0 (0.0%) | 0 (0.0%) |
Disability Class: Self-Care Difficulty
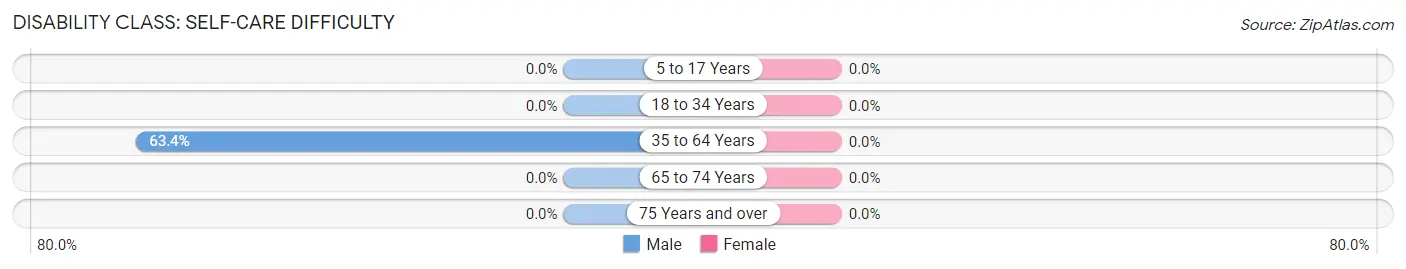
| Age Bracket | Male | Female |
| 5 to 17 Years | 0 (0.0%) | 0 (0.0%) |
| 18 to 34 Years | 0 (0.0%) | 0 (0.0%) |
| 35 to 64 Years | 97 (63.4%) | 0 (0.0%) |
| 65 to 74 Years | 0 (0.0%) | 0 (0.0%) |
| 75 Years and over | 0 (0.0%) | 0 (0.0%) |
Technology Access in Shelter Island Heights
Computing Device Access in Shelter Island Heights
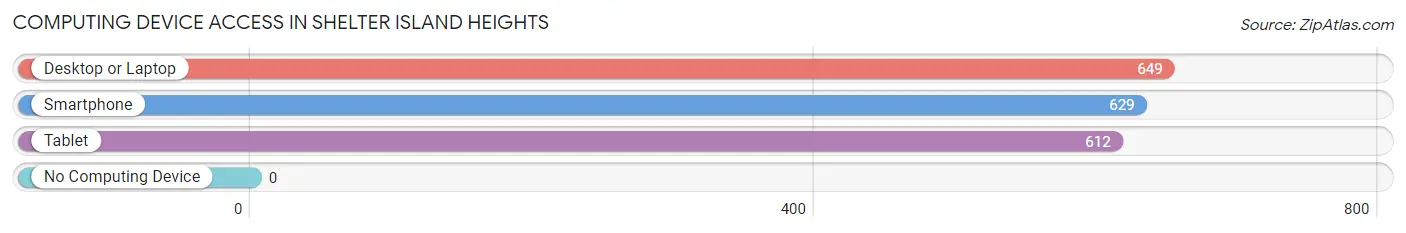
| Device Type | # Households | % Households |
| Desktop or Laptop | 649 | 100.0% |
| Smartphone | 629 | 96.9% |
| Tablet | 612 | 94.3% |
| No Computing Device | 0 | 0.0% |
| Total | 649 | 100.0% |
Internet Access in Shelter Island Heights
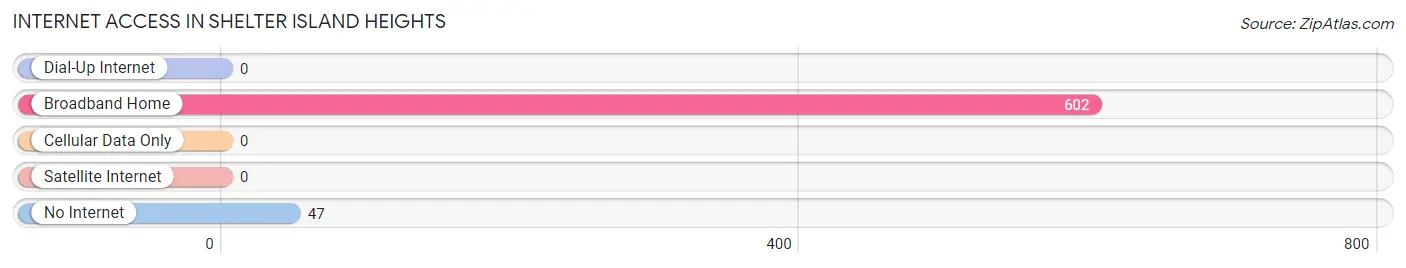
| Internet Type | # Households | % Households |
| Dial-Up Internet | 0 | 0.0% |
| Broadband Home | 602 | 92.8% |
| Cellular Data Only | 0 | 0.0% |
| Satellite Internet | 0 | 0.0% |
| No Internet | 47 | 7.2% |
| Total | 649 | 100.0% |
Shelter Island Heights Summary
Shelter Island Heights is a village located on Shelter Island, a small island off the eastern end of Long Island, New York. The village is located in Suffolk County and is part of the Town of Shelter Island. As of the 2010 census, the village had a population of 867.
History
The area that is now Shelter Island Heights was originally inhabited by the Manhanset Indians, who were part of the Algonquin tribe. The first European settlers arrived in the area in 1652, when the English purchased the island from the Manhanset. The island was used primarily for farming and fishing until the late 19th century, when it began to be developed as a resort destination.
In 1871, the Shelter Island Heights Company was formed to develop the area as a resort. The company purchased land from the island’s original settlers and began to build a hotel, a casino, and other amenities. The hotel, called the Shelter Island House, opened in 1872 and quickly became a popular destination for wealthy New Yorkers.
In 1883, the village of Shelter Island Heights was incorporated. The village was designed to be a summer resort, and it quickly became a popular destination for wealthy New Yorkers. The village was home to several large hotels, including the Shelter Island House, the Ram’s Head Inn, and the Grand Hotel.
Geography
Shelter Island Heights is located on Shelter Island, a small island off the eastern end of Long Island, New York. The village is located in Suffolk County and is part of the Town of Shelter Island. The village is located on the northern end of the island, and is bordered by the Peconic Bay to the north and the Long Island Sound to the south.
The village has a total area of 0.6 square miles, all of which is land. The terrain of the village is mostly flat, with some rolling hills. The highest point in the village is located at an elevation of 40 feet.
Economy
The economy of Shelter Island Heights is largely based on tourism. The village is home to several hotels and resorts, as well as restaurants, shops, and other businesses catering to tourists. The village is also home to several marinas, which provide services to boaters.
The village is also home to several businesses that provide services to the local community, such as a grocery store, a pharmacy, and a hardware store.
Demographics
As of the 2010 census, there were 867 people, 393 households, and 246 families residing in the village. The population density was 1,444.3 people per square mile. The racial makeup of the village was 97.2% White, 0.9% African American, 0.1% Native American, 0.6% Asian, 0.1% Pacific Islander, 0.2% from other races, and 0.9% from two or more races. Hispanic or Latino of any race were 1.7% of the population.
The median age in the village was 53.2 years. About 24.2% of residents were under the age of 18, 4.2% were between the ages of 18 and 24, 16.2% were from 25 to 44, 33.2% were from 45 to 64, and 22.2% were 65 years of age or older. The gender makeup of the village was 48.2% male and 51.8% female.
The median income for a household in the village was $87,917, and the median income for a family was $107,917. About 4.2% of families and 6.2% of the population were below the poverty line, including 8.2% of those under age 18 and 4.2% of those age 65 or over.
Common Questions
What is Per Capita Income in Shelter Island Heights?
Per Capita income in Shelter Island Heights is $63,962.
What is the Median Family Income in Shelter Island Heights?
Median Family Income in Shelter Island Heights is $144,583.
What is the Median Household income in Shelter Island Heights?
Median Household Income in Shelter Island Heights is $81,463.
What is Inequality or Gini Index in Shelter Island Heights?
Inequality or Gini Index in Shelter Island Heights is 0.42.
What is the Total Population of Shelter Island Heights?
Total Population of Shelter Island Heights is 1,056.
What is the Total Male Population of Shelter Island Heights?
Total Male Population of Shelter Island Heights is 511.
What is the Total Female Population of Shelter Island Heights?
Total Female Population of Shelter Island Heights is 545.
What is the Ratio of Males per 100 Females in Shelter Island Heights?
There are 93.76 Males per 100 Females in Shelter Island Heights.
What is the Ratio of Females per 100 Males in Shelter Island Heights?
There are 106.65 Females per 100 Males in Shelter Island Heights.
What is the Median Population Age in Shelter Island Heights?
Median Population Age in Shelter Island Heights is 65.5 Years.
What is the Average Family Size in Shelter Island Heights
Average Family Size in Shelter Island Heights is 2.4 People.
What is the Average Household Size in Shelter Island Heights
Average Household Size in Shelter Island Heights is 1.6 People.
How Large is the Labor Force in Shelter Island Heights?
There are 411 People in the Labor Forcein in Shelter Island Heights.
What is the Percentage of People in the Labor Force in Shelter Island Heights?
38.9% of People are in the Labor Force in Shelter Island Heights.
What is the Unemployment Rate in Shelter Island Heights?
Unemployment Rate in Shelter Island Heights is 1.2%.