North Ballston Spa, NY Map & Demographics
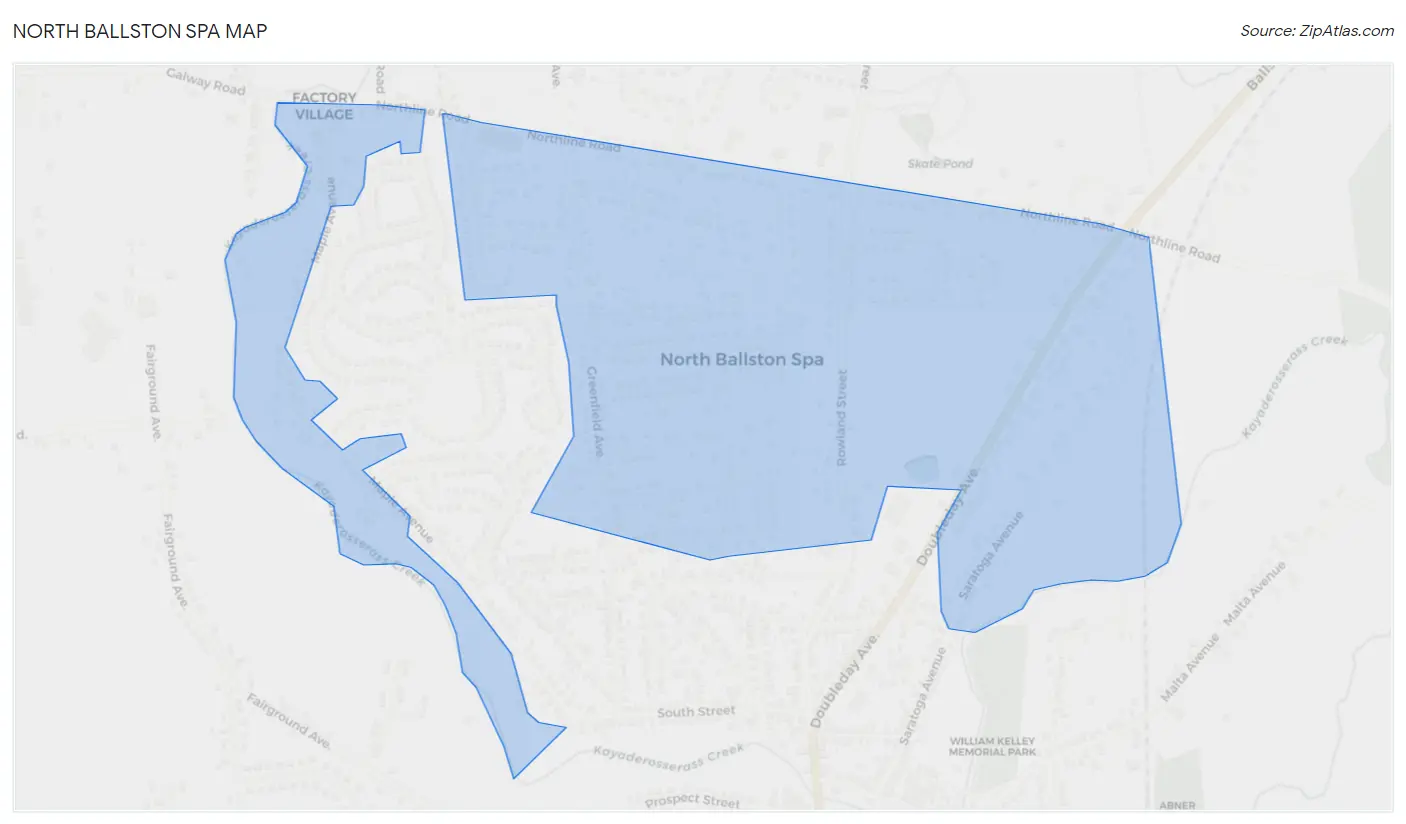
North Ballston Spa Map
North Ballston Spa Overview
$45,726
PER CAPITA INCOME
$95,500
AVG FAMILY INCOME
$79,894
AVG HOUSEHOLD INCOME
0.27
INEQUALITY / GINI INDEX
1,283
TOTAL POPULATION
607
MALE POPULATION
676
FEMALE POPULATION
89.79
MALES / 100 FEMALES
111.37
FEMALES / 100 MALES
52.6
MEDIAN AGE
2.7
AVG FAMILY SIZE
2.0
AVG HOUSEHOLD SIZE
604
LABOR FORCE [ PEOPLE ]
52.4%
PERCENT IN LABOR FORCE
7.6%
UNEMPLOYMENT RATE
Income in North Ballston Spa
Income Overview in North Ballston Spa
Per Capita Income in North Ballston Spa is $45,726, while median incomes of families and households are $95,500 and $79,894 respectively.
| Characteristic | Number | Measure |
| Per Capita Income | 1,283 | $45,726 |
| Median Family Income | 360 | $95,500 |
| Mean Family Income | 360 | $110,264 |
| Median Household Income | 631 | $79,894 |
| Mean Household Income | 631 | $91,647 |
| Income Deficit | 360 | $0 |
| Wage / Income Gap (%) | 1,283 | 0.00% |
| Wage / Income Gap ($) | 1,283 | 100.00¢ per $1 |
| Gini / Inequality Index | 1,283 | 0.27 |
Earnings by Sex in North Ballston Spa
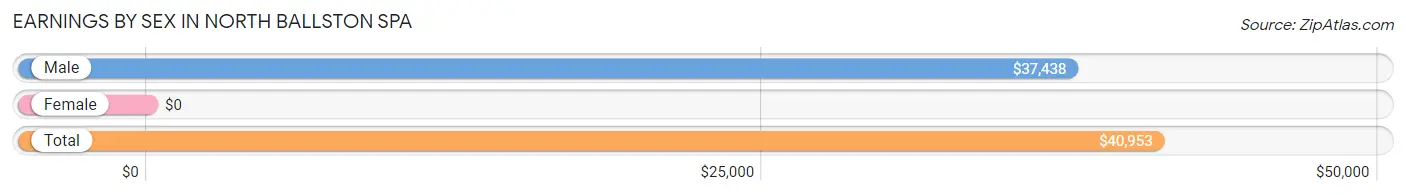
| Sex | Number | Average Earnings |
| Male | 419 (63.6%) | $37,438 |
| Female | 240 (36.4%) | $0 |
| Total | 659 (100.0%) | $40,953 |
Earnings by Sex by Income Bracket in North Ballston Spa
The most common earnings brackets in North Ballston Spa are $40,000 to $44,999 for men (59 | 14.1%) and $30,000 to $34,999 for women (60 | 25.0%).
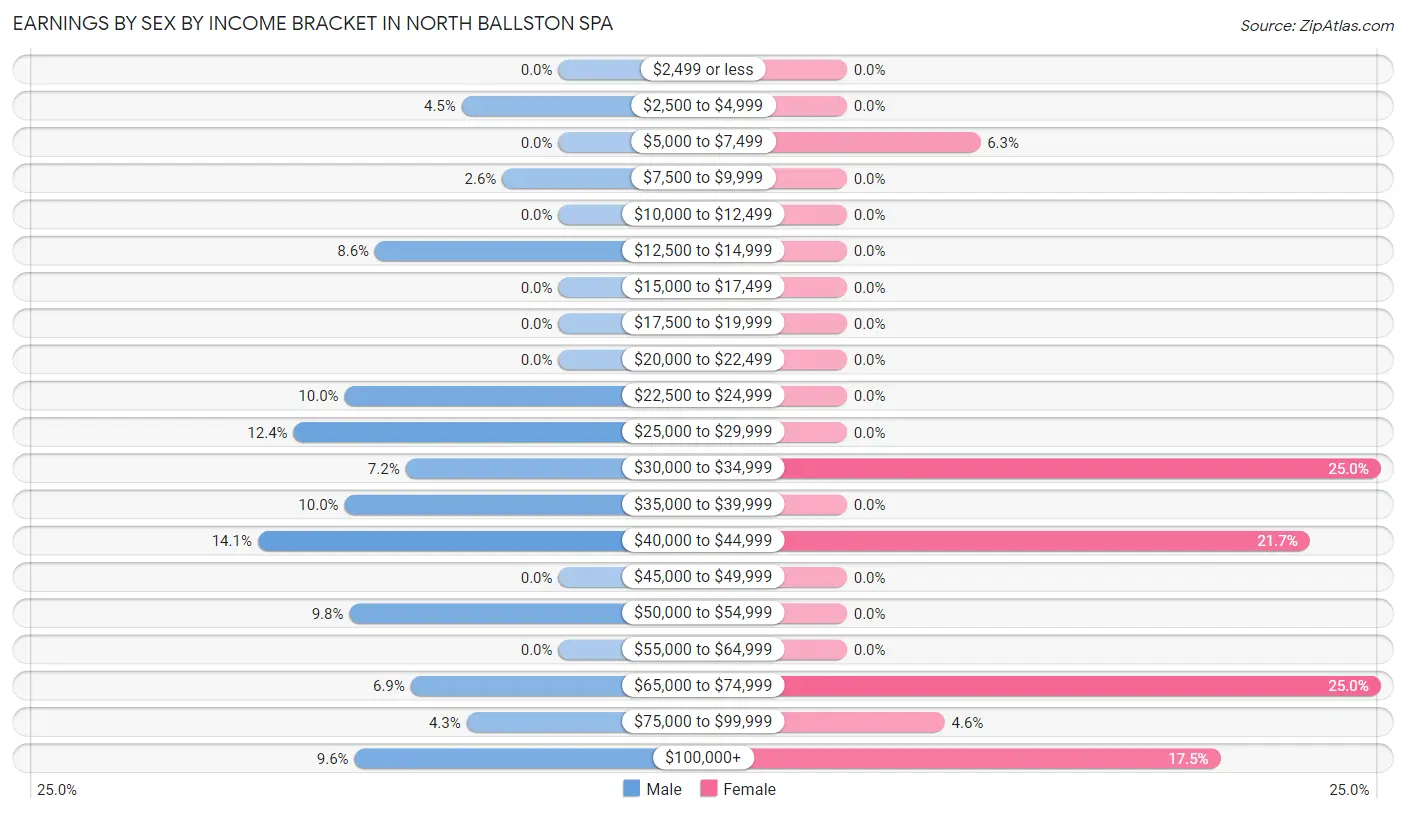
| Income | Male | Female |
| $2,499 or less | 0 (0.0%) | 0 (0.0%) |
| $2,500 to $4,999 | 19 (4.5%) | 0 (0.0%) |
| $5,000 to $7,499 | 0 (0.0%) | 15 (6.2%) |
| $7,500 to $9,999 | 11 (2.6%) | 0 (0.0%) |
| $10,000 to $12,499 | 0 (0.0%) | 0 (0.0%) |
| $12,500 to $14,999 | 36 (8.6%) | 0 (0.0%) |
| $15,000 to $17,499 | 0 (0.0%) | 0 (0.0%) |
| $17,500 to $19,999 | 0 (0.0%) | 0 (0.0%) |
| $20,000 to $22,499 | 0 (0.0%) | 0 (0.0%) |
| $22,500 to $24,999 | 42 (10.0%) | 0 (0.0%) |
| $25,000 to $29,999 | 52 (12.4%) | 0 (0.0%) |
| $30,000 to $34,999 | 30 (7.2%) | 60 (25.0%) |
| $35,000 to $39,999 | 42 (10.0%) | 0 (0.0%) |
| $40,000 to $44,999 | 59 (14.1%) | 52 (21.7%) |
| $45,000 to $49,999 | 0 (0.0%) | 0 (0.0%) |
| $50,000 to $54,999 | 41 (9.8%) | 0 (0.0%) |
| $55,000 to $64,999 | 0 (0.0%) | 0 (0.0%) |
| $65,000 to $74,999 | 29 (6.9%) | 60 (25.0%) |
| $75,000 to $99,999 | 18 (4.3%) | 11 (4.6%) |
| $100,000+ | 40 (9.6%) | 42 (17.5%) |
| Total | 419 (100.0%) | 240 (100.0%) |
Earnings by Sex by Educational Attainment in North Ballston Spa
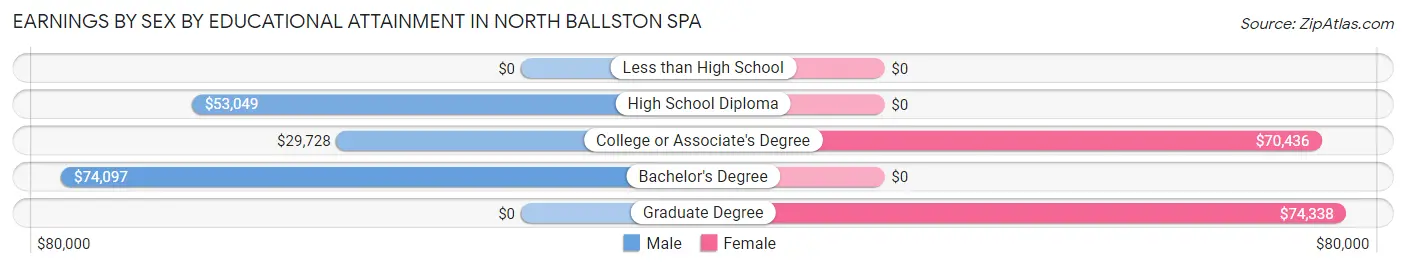
| Educational Attainment | Male Income | Female Income |
| Less than High School | - | - |
| High School Diploma | $53,049 | $0 |
| College or Associate's Degree | $29,728 | $70,436 |
| Bachelor's Degree | $74,097 | $0 |
| Graduate Degree | - | - |
| Total | $39,830 | $0 |
Family Income in North Ballston Spa
Family Income Brackets in North Ballston Spa
According to the North Ballston Spa family income data, there are 133 families falling into the $75,000 to $99,999 income range, which is the most common income bracket and makes up 36.9% of all families.
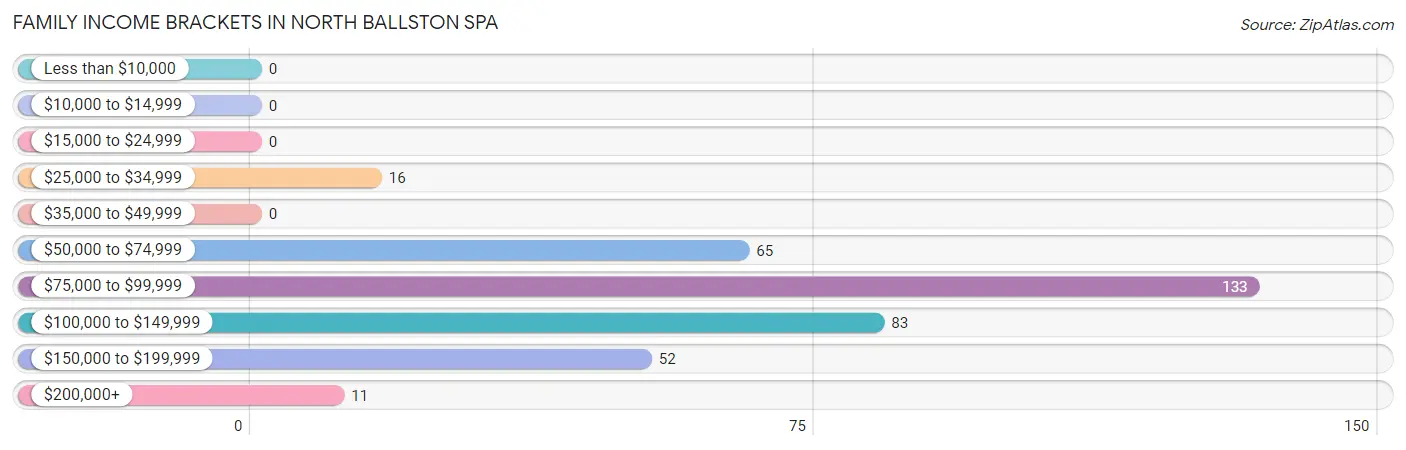
| Income Bracket | # Families | % Families |
| Less than $10,000 | 0 | 0.0% |
| $10,000 to $14,999 | 0 | 0.0% |
| $15,000 to $24,999 | 0 | 0.0% |
| $25,000 to $34,999 | 16 | 4.4% |
| $35,000 to $49,999 | 0 | 0.0% |
| $50,000 to $74,999 | 65 | 18.1% |
| $75,000 to $99,999 | 133 | 36.9% |
| $100,000 to $149,999 | 83 | 23.1% |
| $150,000 to $199,999 | 52 | 14.4% |
| $200,000+ | 11 | 3.1% |
Family Income by Famaliy Size in North Ballston Spa
4-person families (70 | 19.4%) account for the highest median family income in North Ballston Spa with $186,037 per family, while 4-person families (70 | 19.4%) have the highest median income of $46,509 per family member.
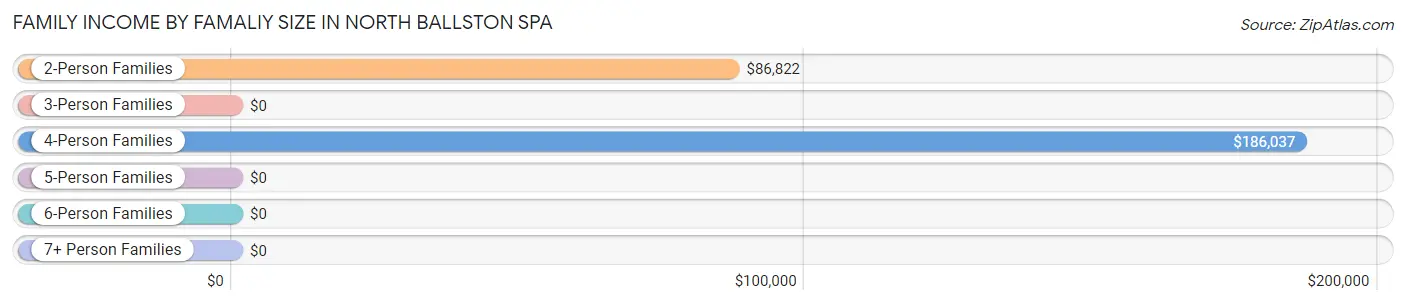
| Income Bracket | # Families | Median Income |
| 2-Person Families | 250 (69.4%) | $86,822 |
| 3-Person Families | 22 (6.1%) | $0 |
| 4-Person Families | 70 (19.4%) | $186,037 |
| 5-Person Families | 18 (5.0%) | $0 |
| 6-Person Families | 0 (0.0%) | $0 |
| 7+ Person Families | 0 (0.0%) | $0 |
| Total | 360 (100.0%) | $95,500 |
Family Income by Number of Earners in North Ballston Spa
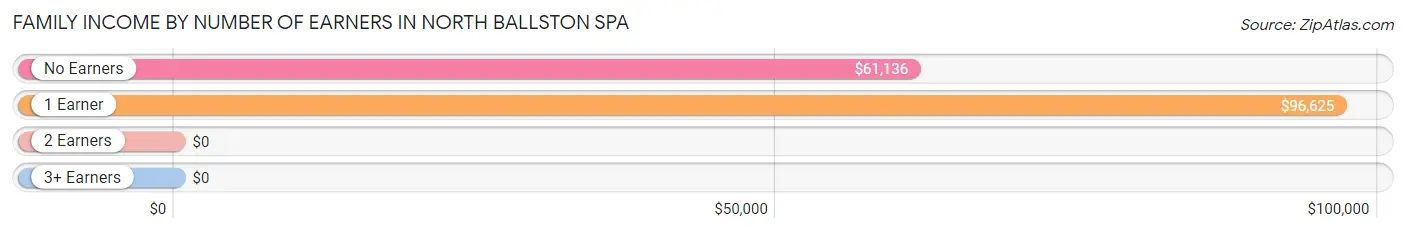
| Number of Earners | # Families | Median Income |
| No Earners | 52 (14.4%) | $61,136 |
| 1 Earner | 130 (36.1%) | $96,625 |
| 2 Earners | 137 (38.1%) | $0 |
| 3+ Earners | 41 (11.4%) | $0 |
| Total | 360 (100.0%) | $95,500 |
Household Income in North Ballston Spa
Household Income Brackets in North Ballston Spa
With 297 households falling in the category, the $75,000 to $99,999 income range is the most frequent in North Ballston Spa, accounting for 47.1% of all households.
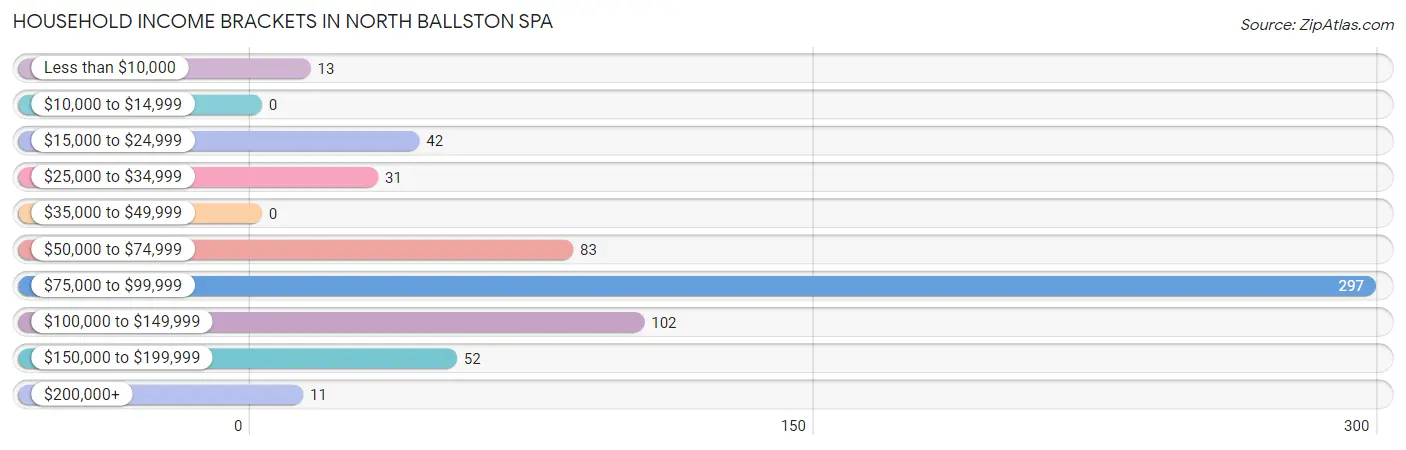
| Income Bracket | # Households | % Households |
| Less than $10,000 | 13 | 2.1% |
| $10,000 to $14,999 | 0 | 0.0% |
| $15,000 to $24,999 | 42 | 6.7% |
| $25,000 to $34,999 | 31 | 4.9% |
| $35,000 to $49,999 | 0 | 0.0% |
| $50,000 to $74,999 | 83 | 13.2% |
| $75,000 to $99,999 | 297 | 47.1% |
| $100,000 to $149,999 | 102 | 16.2% |
| $150,000 to $199,999 | 52 | 8.2% |
| $200,000+ | 11 | 1.7% |
Household Income by Householder Age in North Ballston Spa
The median household income in North Ballston Spa is $79,894, with the highest median household income of $122,269 found in the 45 to 64 years age bracket for the primary householder. A total of 195 households (30.9%) fall into this category. Meanwhile, the 15 to 24 years age bracket for the primary householder has the lowest median household income of $0, with 42 households (6.7%) in this group.
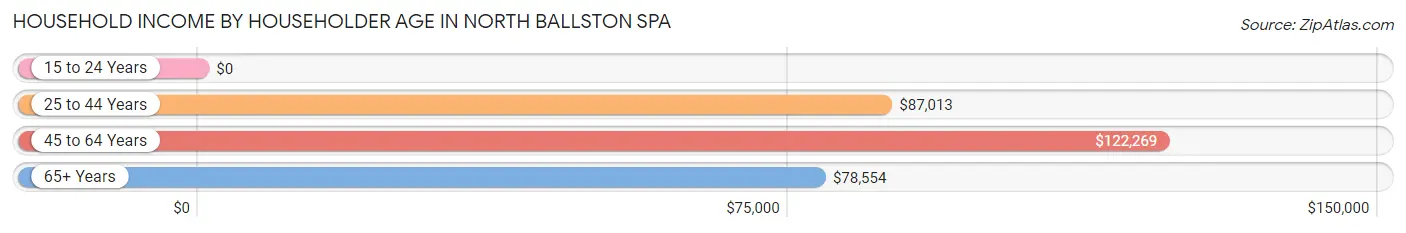
| Income Bracket | # Households | Median Income |
| 15 to 24 Years | 42 (6.7%) | $0 |
| 25 to 44 Years | 95 (15.1%) | $87,013 |
| 45 to 64 Years | 195 (30.9%) | $122,269 |
| 65+ Years | 299 (47.4%) | $78,554 |
| Total | 631 (100.0%) | $79,894 |
Poverty in North Ballston Spa
Income Below Poverty by Sex and Age in North Ballston Spa
With 2.1% poverty level for males and 2.7% for females among the residents of North Ballston Spa, 45 to 54 year old males and 55 to 64 year old females are the most vulnerable to poverty, with 11 males (17.7%) and 13 females (23.2%) in their respective age groups living below the poverty level.
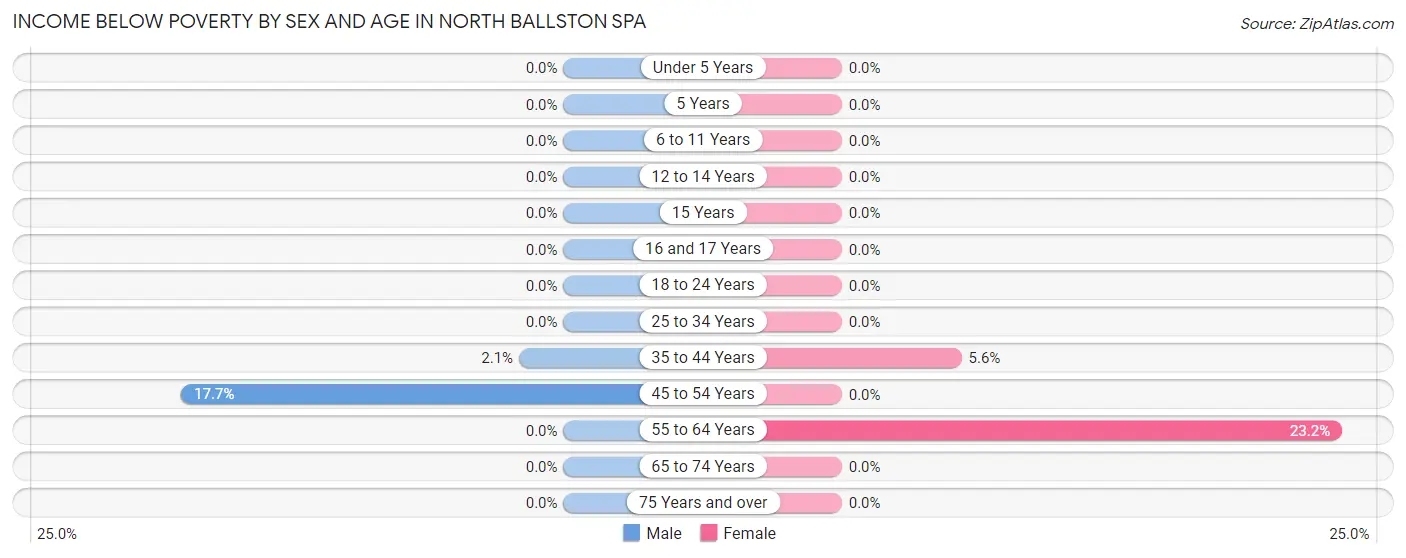
| Age Bracket | Male | Female |
| Under 5 Years | 0 (0.0%) | 0 (0.0%) |
| 5 Years | 0 (0.0%) | 0 (0.0%) |
| 6 to 11 Years | 0 (0.0%) | 0 (0.0%) |
| 12 to 14 Years | 0 (0.0%) | 0 (0.0%) |
| 15 Years | 0 (0.0%) | 0 (0.0%) |
| 16 and 17 Years | 0 (0.0%) | 0 (0.0%) |
| 18 to 24 Years | 0 (0.0%) | 0 (0.0%) |
| 25 to 34 Years | 0 (0.0%) | 0 (0.0%) |
| 35 to 44 Years | 2 (2.1%) | 5 (5.6%) |
| 45 to 54 Years | 11 (17.7%) | 0 (0.0%) |
| 55 to 64 Years | 0 (0.0%) | 13 (23.2%) |
| 65 to 74 Years | 0 (0.0%) | 0 (0.0%) |
| 75 Years and over | 0 (0.0%) | 0 (0.0%) |
| Total | 13 (2.1%) | 18 (2.7%) |
Income Above Poverty by Sex and Age in North Ballston Spa
According to the poverty statistics in North Ballston Spa, males aged under 5 years and females aged 6 to 11 years are the age groups that are most secure financially, with 100.0% of males and 100.0% of females in these age groups living above the poverty line.
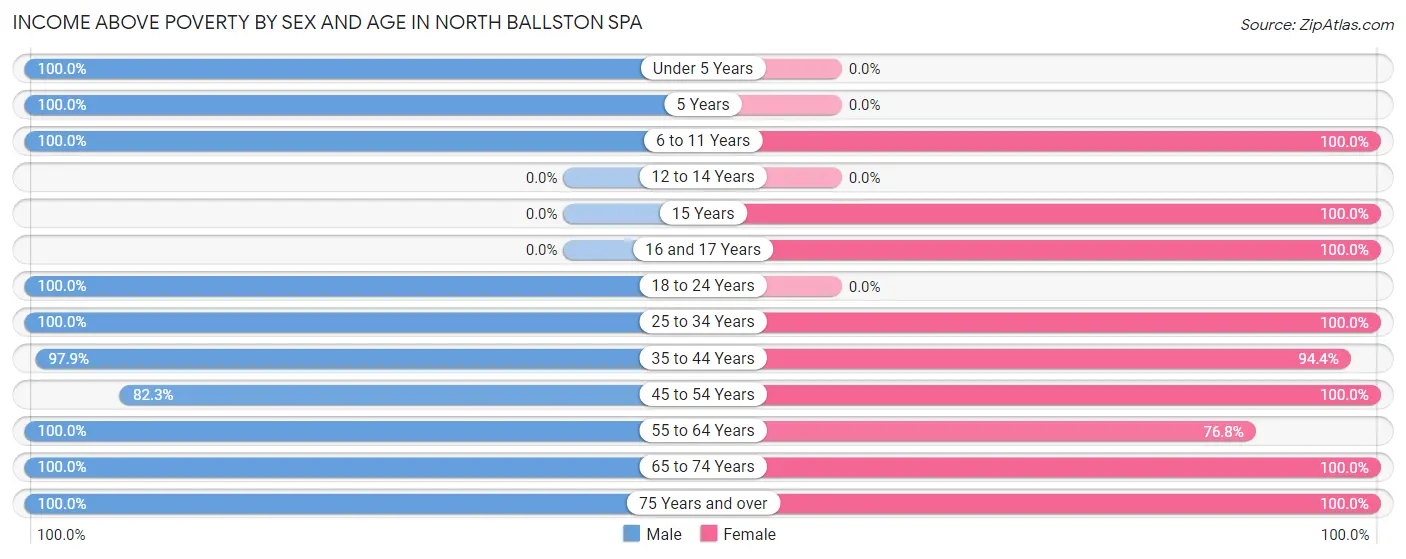
| Age Bracket | Male | Female |
| Under 5 Years | 34 (100.0%) | 0 (0.0%) |
| 5 Years | 17 (100.0%) | 0 (0.0%) |
| 6 to 11 Years | 17 (100.0%) | 43 (100.0%) |
| 12 to 14 Years | 0 (0.0%) | 0 (0.0%) |
| 15 Years | 0 (0.0%) | 19 (100.0%) |
| 16 and 17 Years | 0 (0.0%) | 15 (100.0%) |
| 18 to 24 Years | 42 (100.0%) | 0 (0.0%) |
| 25 to 34 Years | 106 (100.0%) | 65 (100.0%) |
| 35 to 44 Years | 95 (97.9%) | 85 (94.4%) |
| 45 to 54 Years | 51 (82.3%) | 108 (100.0%) |
| 55 to 64 Years | 115 (100.0%) | 43 (76.8%) |
| 65 to 74 Years | 70 (100.0%) | 51 (100.0%) |
| 75 Years and over | 47 (100.0%) | 229 (100.0%) |
| Total | 594 (97.9%) | 658 (97.3%) |
Income Below Poverty Among Married-Couple Families in North Ballston Spa
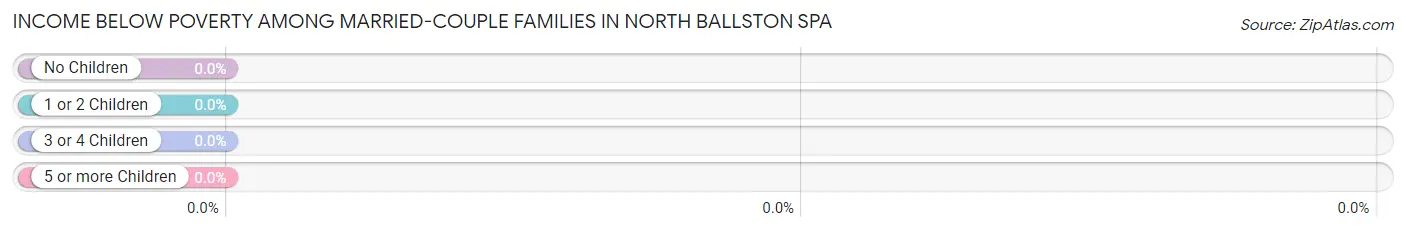
| Children | Above Poverty | Below Poverty |
| No Children | 234 (100.0%) | 0 (0.0%) |
| 1 or 2 Children | 45 (100.0%) | 0 (0.0%) |
| 3 or 4 Children | 18 (100.0%) | 0 (0.0%) |
| 5 or more Children | 0 (0.0%) | 0 (0.0%) |
| Total | 297 (100.0%) | 0 (0.0%) |
Income Below Poverty Among Single-Parent Households in North Ballston Spa
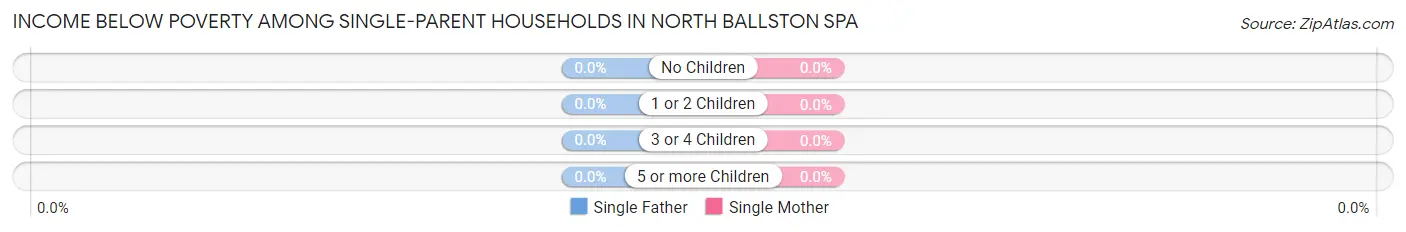
| Children | Single Father | Single Mother |
| No Children | 0 (0.0%) | 0 (0.0%) |
| 1 or 2 Children | 0 (0.0%) | 0 (0.0%) |
| 3 or 4 Children | 0 (0.0%) | 0 (0.0%) |
| 5 or more Children | 0 (0.0%) | 0 (0.0%) |
| Total | 0 (0.0%) | 0 (0.0%) |
Income Below Poverty Among Married-Couple vs Single-Parent Households in North Ballston Spa
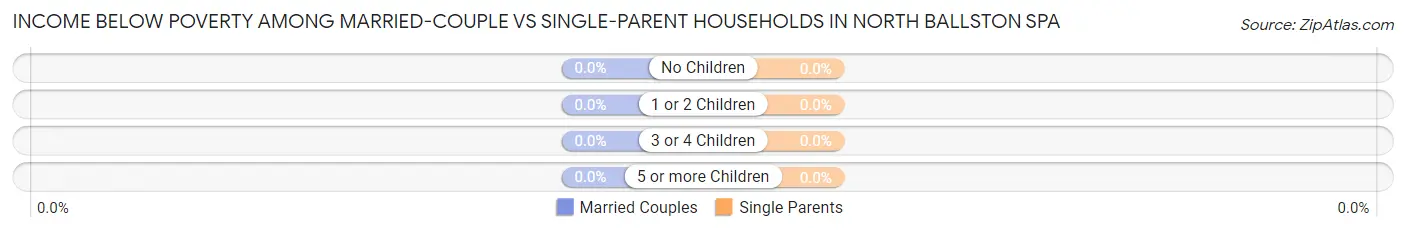
| Children | Married-Couple Families | Single-Parent Households |
| No Children | 0 (0.0%) | 0 (0.0%) |
| 1 or 2 Children | 0 (0.0%) | 0 (0.0%) |
| 3 or 4 Children | 0 (0.0%) | 0 (0.0%) |
| 5 or more Children | 0 (0.0%) | 0 (0.0%) |
| Total | 0 (0.0%) | 0 (0.0%) |
Race in North Ballston Spa
The most populous races in North Ballston Spa are White / Caucasian (1,205 | 93.9%), Two or more Races (67 | 5.2%), and Hispanic or Latino (38 | 3.0%).
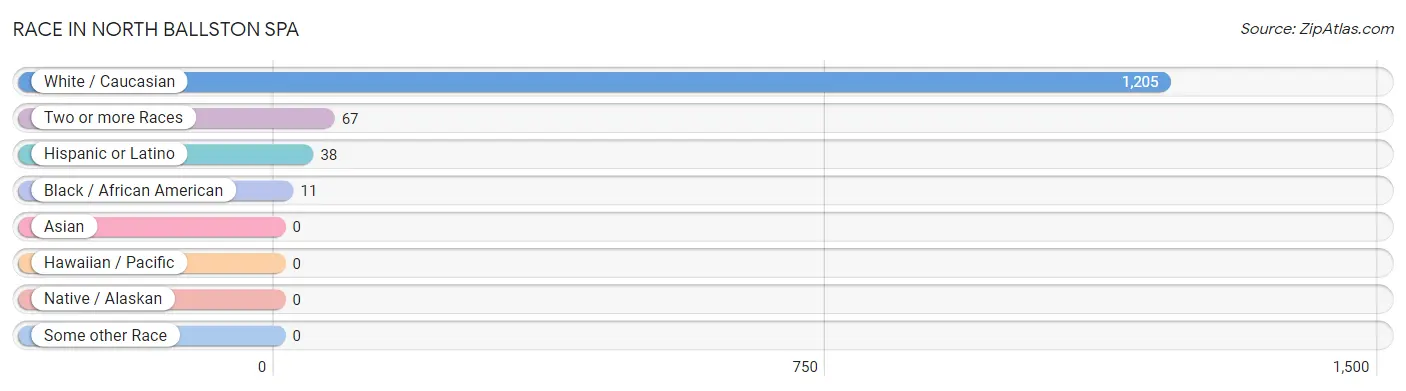
| Race | # Population | % Population |
| Asian | 0 | 0.0% |
| Black / African American | 11 | 0.9% |
| Hawaiian / Pacific | 0 | 0.0% |
| Hispanic or Latino | 38 | 3.0% |
| Native / Alaskan | 0 | 0.0% |
| White / Caucasian | 1,205 | 93.9% |
| Two or more Races | 67 | 5.2% |
| Some other Race | 0 | 0.0% |
| Total | 1,283 | 100.0% |
Ancestry in North Ballston Spa
The most populous ancestries reported in North Ballston Spa are German (485 | 37.8%), Irish (310 | 24.2%), English (214 | 16.7%), Italian (88 | 6.9%), and Swedish (74 | 5.8%), together accounting for 91.3% of all North Ballston Spa residents.
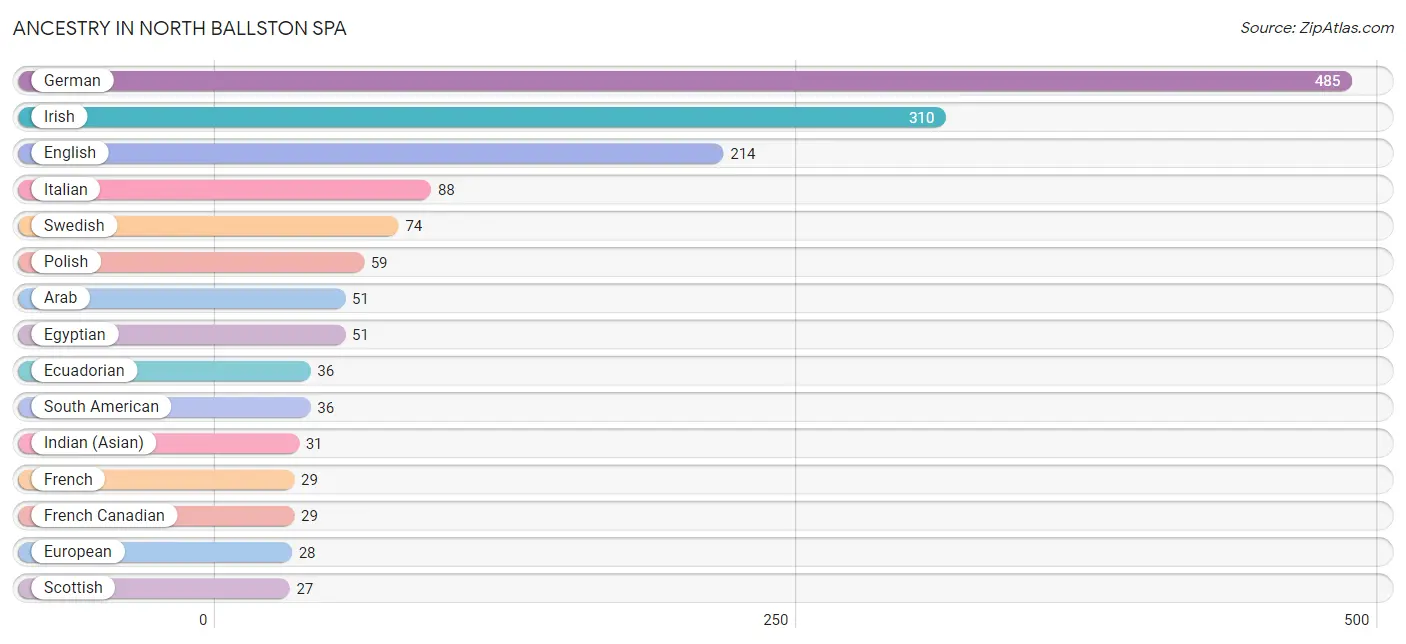
| Ancestry | # Population | % Population |
| Arab | 51 | 4.0% |
| Dutch | 25 | 1.9% |
| Ecuadorian | 36 | 2.8% |
| Egyptian | 51 | 4.0% |
| English | 214 | 16.7% |
| European | 28 | 2.2% |
| French | 29 | 2.3% |
| French Canadian | 29 | 2.3% |
| German | 485 | 37.8% |
| Hungarian | 2 | 0.2% |
| Indian (Asian) | 31 | 2.4% |
| Irish | 310 | 24.2% |
| Italian | 88 | 6.9% |
| Norwegian | 15 | 1.2% |
| Polish | 59 | 4.6% |
| Scotch-Irish | 15 | 1.2% |
| Scottish | 27 | 2.1% |
| South American | 36 | 2.8% |
| Swedish | 74 | 5.8% | View All 19 Rows |
Immigrants in North Ballston Spa
The most numerous immigrant groups reported in North Ballston Spa came from Africa (32 | 2.5%), Egypt (32 | 2.5%), and Northern Africa (32 | 2.5%), together accounting for 7.5% of all North Ballston Spa residents.
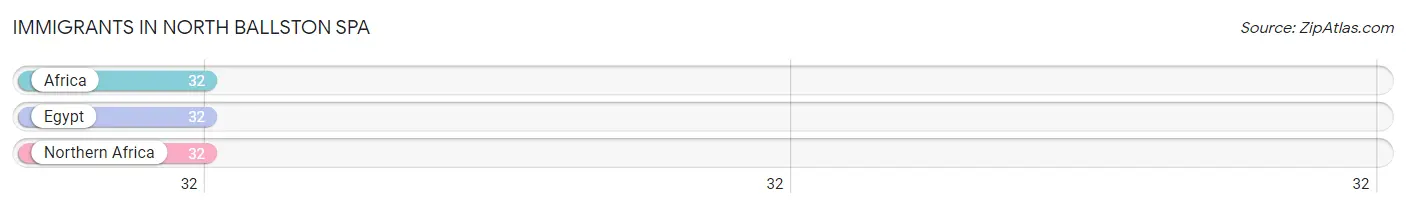
| Immigration Origin | # Population | % Population |
| Africa | 32 | 2.5% |
| Egypt | 32 | 2.5% |
| Northern Africa | 32 | 2.5% | View All 3 Rows |
Sex and Age in North Ballston Spa
Sex and Age in North Ballston Spa
The most populous age groups in North Ballston Spa are 25 to 29 Years (104 | 17.1%) for men and 80 to 84 Years (156 | 23.1%) for women.
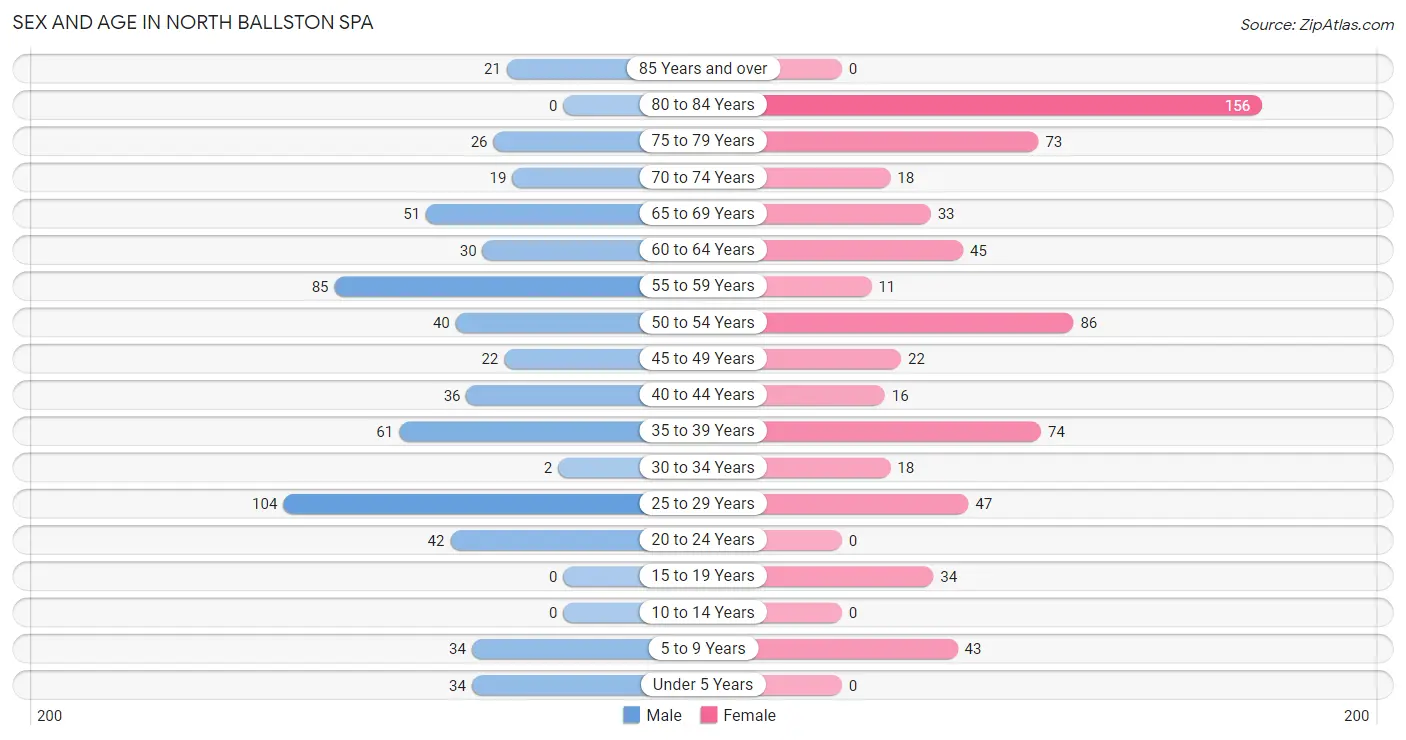
| Age Bracket | Male | Female |
| Under 5 Years | 34 (5.6%) | 0 (0.0%) |
| 5 to 9 Years | 34 (5.6%) | 43 (6.4%) |
| 10 to 14 Years | 0 (0.0%) | 0 (0.0%) |
| 15 to 19 Years | 0 (0.0%) | 34 (5.0%) |
| 20 to 24 Years | 42 (6.9%) | 0 (0.0%) |
| 25 to 29 Years | 104 (17.1%) | 47 (7.0%) |
| 30 to 34 Years | 2 (0.3%) | 18 (2.7%) |
| 35 to 39 Years | 61 (10.1%) | 74 (11.0%) |
| 40 to 44 Years | 36 (5.9%) | 16 (2.4%) |
| 45 to 49 Years | 22 (3.6%) | 22 (3.3%) |
| 50 to 54 Years | 40 (6.6%) | 86 (12.7%) |
| 55 to 59 Years | 85 (14.0%) | 11 (1.6%) |
| 60 to 64 Years | 30 (4.9%) | 45 (6.7%) |
| 65 to 69 Years | 51 (8.4%) | 33 (4.9%) |
| 70 to 74 Years | 19 (3.1%) | 18 (2.7%) |
| 75 to 79 Years | 26 (4.3%) | 73 (10.8%) |
| 80 to 84 Years | 0 (0.0%) | 156 (23.1%) |
| 85 Years and over | 21 (3.5%) | 0 (0.0%) |
| Total | 607 (100.0%) | 676 (100.0%) |
Families and Households in North Ballston Spa
Median Family Size in North Ballston Spa
The median family size in North Ballston Spa is 2.70 persons per family, with married-couple families (297 | 82.5%) accounting for the largest median family size of 2.78 persons per family. On the other hand, single male/father families (33 | 9.2%) represent the smallest median family size with 2.12 persons per family.
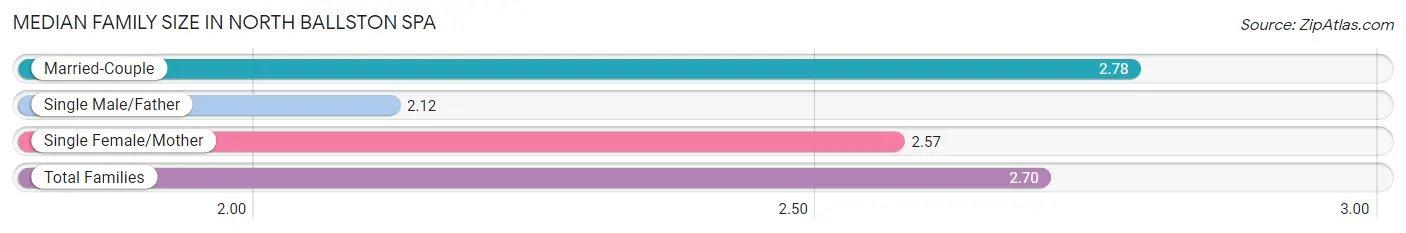
| Family Type | # Families | Family Size |
| Married-Couple | 297 (82.5%) | 2.78 |
| Single Male/Father | 33 (9.2%) | 2.12 |
| Single Female/Mother | 30 (8.3%) | 2.57 |
| Total Families | 360 (100.0%) | 2.70 |
Median Household Size in North Ballston Spa
The median household size in North Ballston Spa is 2.02 persons per household, with married-couple households (297 | 47.1%) accounting for the largest median household size of 2.78 persons per household. non-family households (271 | 42.9%) represent the smallest median household size with 1.11 persons per household.
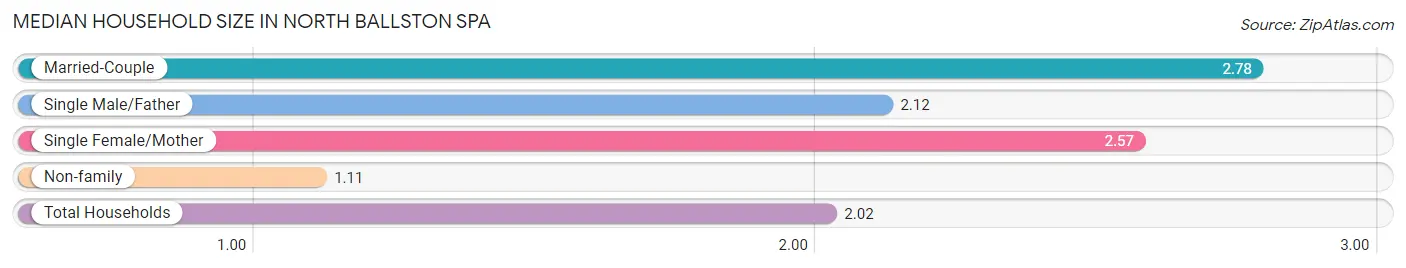
| Household Type | # Households | Household Size |
| Married-Couple | 297 (47.1%) | 2.78 |
| Single Male/Father | 33 (5.2%) | 2.12 |
| Single Female/Mother | 30 (4.8%) | 2.57 |
| Non-family | 271 (42.9%) | 1.11 |
| Total Households | 631 (100.0%) | 2.02 |
Household Size by Marriage Status in North Ballston Spa
Out of a total of 631 households in North Ballston Spa, 360 (57.1%) are family households, while 271 (42.9%) are nonfamily households. The most numerous type of family households are 2-person households, comprising 250, and the most common type of nonfamily households are 1-person households, comprising 241.
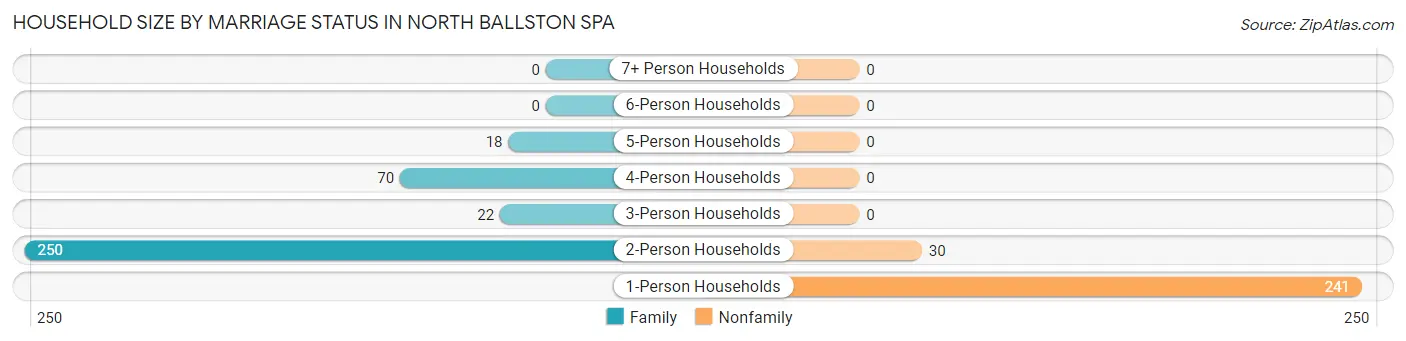
| Household Size | Family Households | Nonfamily Households |
| 1-Person Households | - | 241 (38.2%) |
| 2-Person Households | 250 (39.6%) | 30 (4.8%) |
| 3-Person Households | 22 (3.5%) | 0 (0.0%) |
| 4-Person Households | 70 (11.1%) | 0 (0.0%) |
| 5-Person Households | 18 (2.9%) | 0 (0.0%) |
| 6-Person Households | 0 (0.0%) | 0 (0.0%) |
| 7+ Person Households | 0 (0.0%) | 0 (0.0%) |
| Total | 360 (57.1%) | 271 (42.9%) |
Female Fertility in North Ballston Spa
Fertility by Age in North Ballston Spa
| Age Bracket | Women with Births | Births / 1,000 Women |
| 15 to 19 years | 0 (0.0%) | 0.0 |
| 20 to 34 years | 0 (0.0%) | 0.0 |
| 35 to 50 years | 0 (0.0%) | 0.0 |
| Total | 0 (0.0%) | 0.0 |
Fertility by Age by Marriage Status in North Ballston Spa
| Age Bracket | Married | Unmarried |
| 15 to 19 years | 0 (0.0%) | 0 (0.0%) |
| 20 to 34 years | 0 (0.0%) | 0 (0.0%) |
| 35 to 50 years | 0 (0.0%) | 0 (0.0%) |
| Total | 0 (0.0%) | 0 (0.0%) |
Fertility by Education in North Ballston Spa
| Educational Attainment | Women with Births | Births / 1,000 Women |
| Less than High School | 0 (0.0%) | 0.0 |
| High School Diploma | 0 (0.0%) | 0.0 |
| College or Associate's Degree | 0 (0.0%) | 0.0 |
| Bachelor's Degree | 0 (0.0%) | 0.0 |
| Graduate Degree | 0 (0.0%) | 0.0 |
| Total | 0 (0.0%) | 0.0 |
Fertility by Education by Marriage Status in North Ballston Spa
| Educational Attainment | Married | Unmarried |
| Less than High School | 0 (0.0%) | 0 (0.0%) |
| High School Diploma | 0 (0.0%) | 0 (0.0%) |
| College or Associate's Degree | 0 (0.0%) | 0 (0.0%) |
| Bachelor's Degree | 0 (0.0%) | 0 (0.0%) |
| Graduate Degree | 0 (0.0%) | 0 (0.0%) |
| Total | 0 (0.0%) | 0 (0.0%) |
Employment Characteristics in North Ballston Spa
Employment by Class of Employer in North Ballston Spa
Among the 534 employed individuals in North Ballston Spa, private company employees (452 | 84.6%), local government employees (51 | 9.6%), and not-for-profit organizations (16 | 3.0%) make up the most common classes of employment.
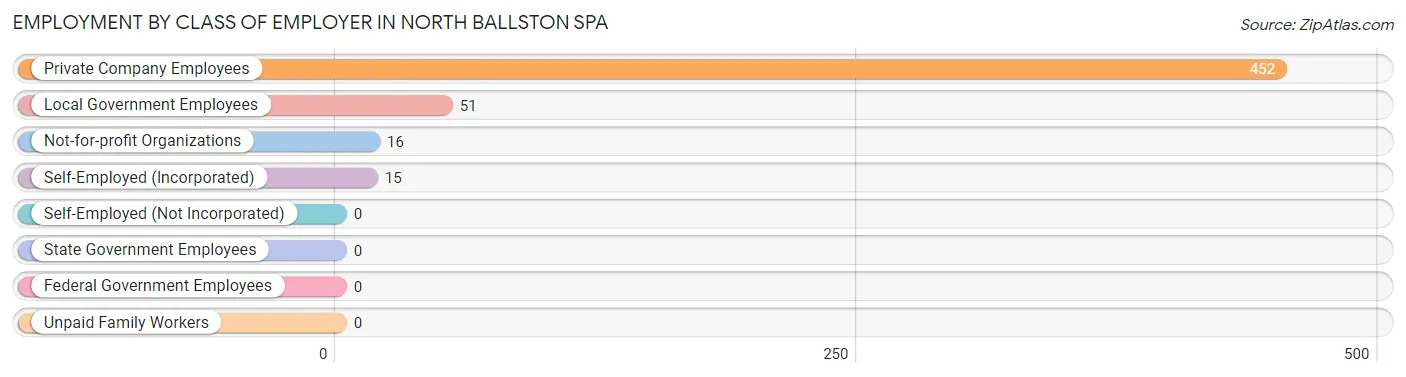
| Employer Class | # Employees | % Employees |
| Private Company Employees | 452 | 84.6% |
| Self-Employed (Incorporated) | 15 | 2.8% |
| Self-Employed (Not Incorporated) | 0 | 0.0% |
| Not-for-profit Organizations | 16 | 3.0% |
| Local Government Employees | 51 | 9.6% |
| State Government Employees | 0 | 0.0% |
| Federal Government Employees | 0 | 0.0% |
| Unpaid Family Workers | 0 | 0.0% |
| Total | 534 | 100.0% |
Employment Status by Age in North Ballston Spa
According to the labor force statistics for North Ballston Spa, out of the total population over 16 years of age (1,153), 52.4% or 604 individuals are in the labor force, with 7.6% or 46 of them unemployed. The age group with the highest labor force participation rate is 20 to 24 years, with 100.0% or 42 individuals in the labor force. Within the labor force, the 25 to 29 years age range has the highest percentage of unemployed individuals, with 49.5% or 46 of them being unemployed.
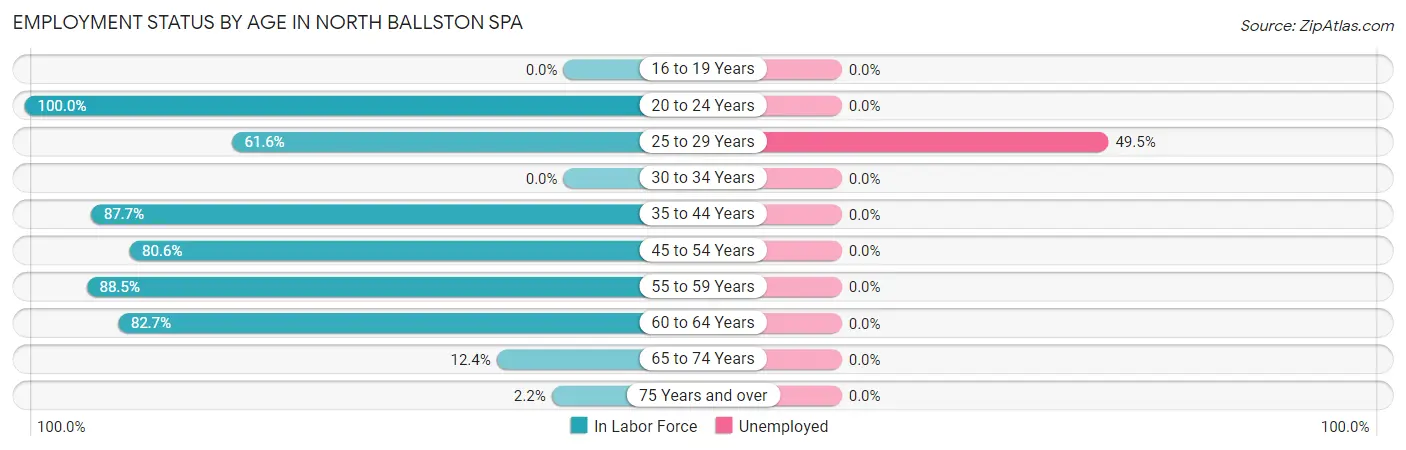
| Age Bracket | In Labor Force | Unemployed |
| 16 to 19 Years | 0 (0.0%) | 0 (0.0%) |
| 20 to 24 Years | 42 (100.0%) | 0 (0.0%) |
| 25 to 29 Years | 93 (61.6%) | 46 (49.5%) |
| 30 to 34 Years | 0 (0.0%) | 0 (0.0%) |
| 35 to 44 Years | 164 (87.7%) | 0 (0.0%) |
| 45 to 54 Years | 137 (80.6%) | 0 (0.0%) |
| 55 to 59 Years | 85 (88.5%) | 0 (0.0%) |
| 60 to 64 Years | 62 (82.7%) | 0 (0.0%) |
| 65 to 74 Years | 15 (12.4%) | 0 (0.0%) |
| 75 Years and over | 6 (2.2%) | 0 (0.0%) |
| Total | 604 (52.4%) | 46 (7.6%) |
Employment Status by Educational Attainment in North Ballston Spa
According to labor force statistics for North Ballston Spa, 77.4% of individuals (541) out of the total population between 25 and 64 years of age (699) are in the labor force, with 8.5% or 46 of them being unemployed. The group with the highest labor force participation rate are those with the educational attainment of bachelor's degree or higher, with 100.0% or 199 individuals in the labor force. Within the labor force, individuals with college / associate degree education have the highest percentage of unemployment, with 18.5% or 46 of them being unemployed.
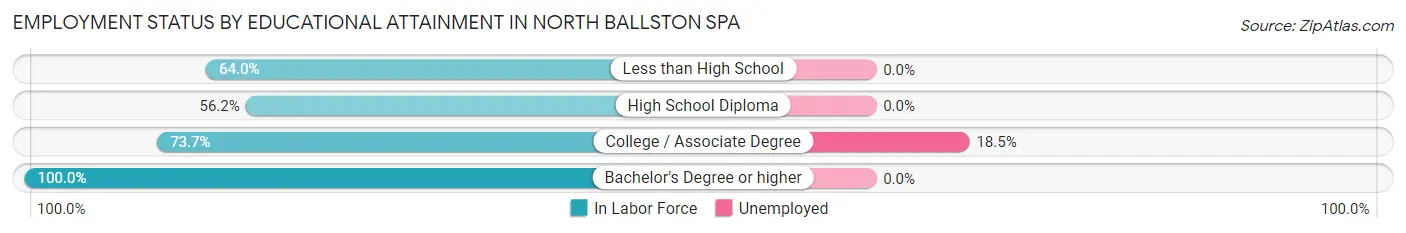
| Educational Attainment | In Labor Force | Unemployed |
| Less than High School | 16 (64.0%) | 0 (0.0%) |
| High School Diploma | 77 (56.2%) | 0 (0.0%) |
| College / Associate Degree | 249 (73.7%) | 63 (18.5%) |
| Bachelor's Degree or higher | 199 (100.0%) | 0 (0.0%) |
| Total | 541 (77.4%) | 59 (8.5%) |
Employment Occupations by Sex in North Ballston Spa
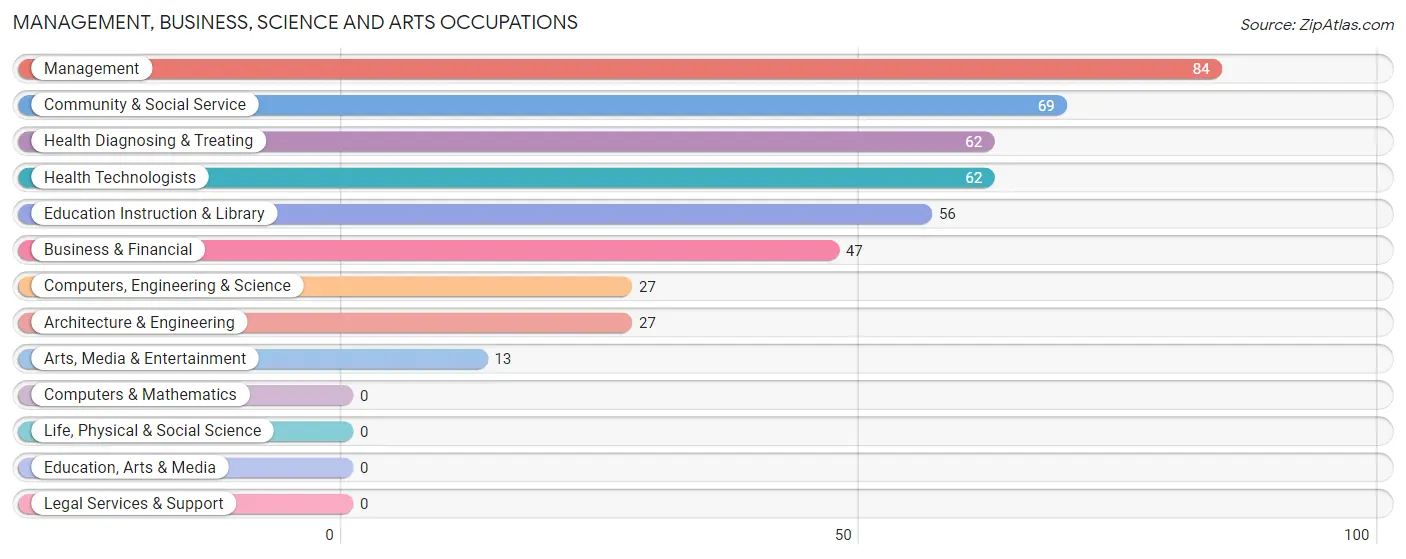
Management, Business, Science and Arts Occupations
The most common Management, Business, Science and Arts occupations in North Ballston Spa are Management (84 | 15.0%), Community & Social Service (69 | 12.4%), Health Diagnosing & Treating (62 | 11.1%), Health Technologists (62 | 11.1%), and Education Instruction & Library (56 | 10.0%).
Management, Business, Science and Arts Occupations by Sex
Within the Management, Business, Science and Arts occupations in North Ballston Spa, the most male-oriented occupations are Computers, Engineering & Science (100.0%), Architecture & Engineering (100.0%), and Arts, Media & Entertainment (100.0%), while the most female-oriented occupations are Business & Financial (100.0%), Health Diagnosing & Treating (100.0%), and Health Technologists (100.0%).
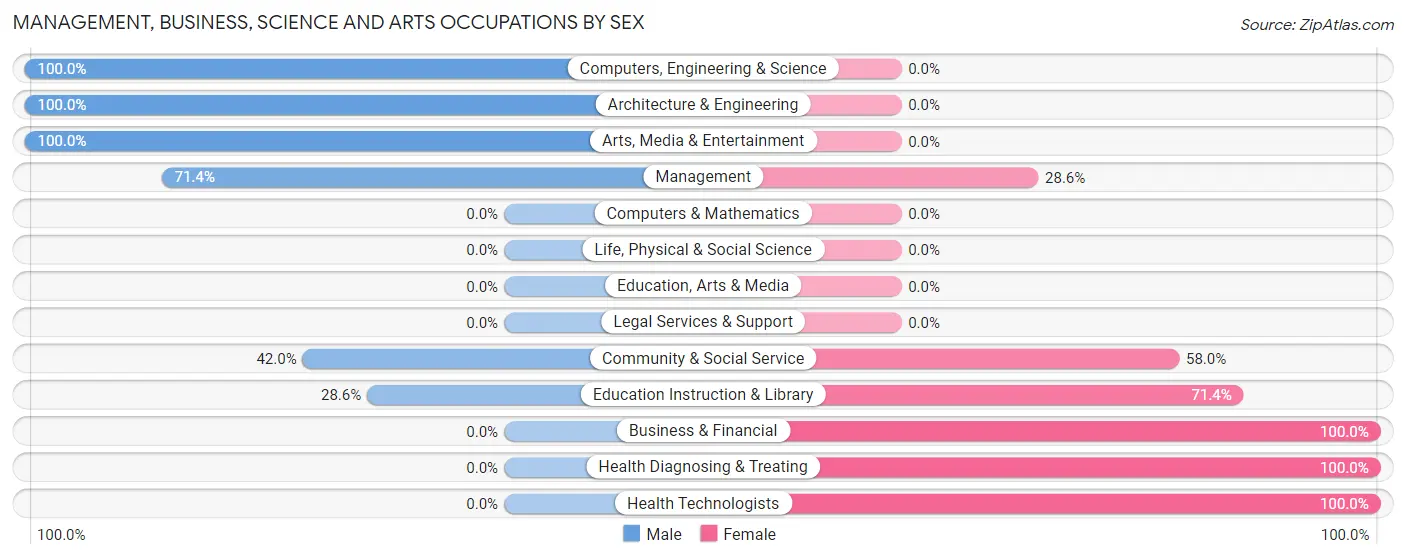
| Occupation | Male | Female |
| Management | 60 (71.4%) | 24 (28.6%) |
| Business & Financial | 0 (0.0%) | 47 (100.0%) |
| Computers, Engineering & Science | 27 (100.0%) | 0 (0.0%) |
| Computers & Mathematics | 0 (0.0%) | 0 (0.0%) |
| Architecture & Engineering | 27 (100.0%) | 0 (0.0%) |
| Life, Physical & Social Science | 0 (0.0%) | 0 (0.0%) |
| Community & Social Service | 29 (42.0%) | 40 (58.0%) |
| Education, Arts & Media | 0 (0.0%) | 0 (0.0%) |
| Legal Services & Support | 0 (0.0%) | 0 (0.0%) |
| Education Instruction & Library | 16 (28.6%) | 40 (71.4%) |
| Arts, Media & Entertainment | 13 (100.0%) | 0 (0.0%) |
| Health Diagnosing & Treating | 0 (0.0%) | 62 (100.0%) |
| Health Technologists | 0 (0.0%) | 62 (100.0%) |
| Total (Category) | 116 (40.1%) | 173 (59.9%) |
| Total (Overall) | 318 (57.0%) | 240 (43.0%) |
Services Occupations
The most common Services occupations in North Ballston Spa are Cleaning & Maintenance (73 | 13.1%), and Personal Care & Service (15 | 2.7%).
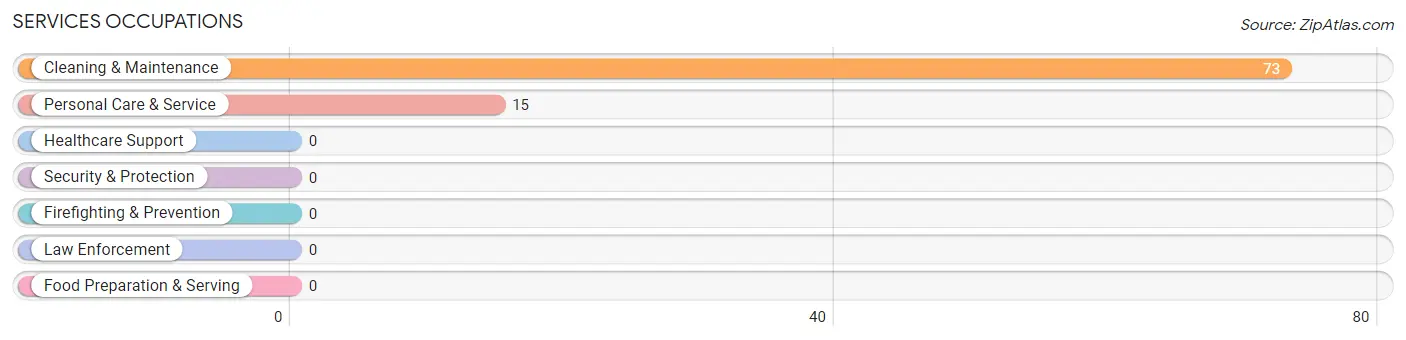
Services Occupations by Sex
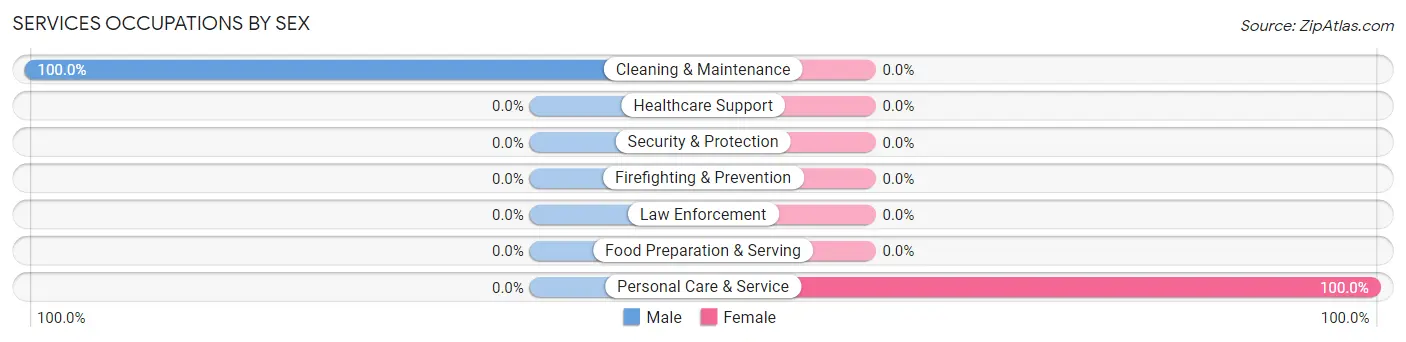
| Occupation | Male | Female |
| Healthcare Support | 0 (0.0%) | 0 (0.0%) |
| Security & Protection | 0 (0.0%) | 0 (0.0%) |
| Firefighting & Prevention | 0 (0.0%) | 0 (0.0%) |
| Law Enforcement | 0 (0.0%) | 0 (0.0%) |
| Food Preparation & Serving | 0 (0.0%) | 0 (0.0%) |
| Cleaning & Maintenance | 73 (100.0%) | 0 (0.0%) |
| Personal Care & Service | 0 (0.0%) | 15 (100.0%) |
| Total (Category) | 73 (83.0%) | 15 (17.1%) |
| Total (Overall) | 318 (57.0%) | 240 (43.0%) |
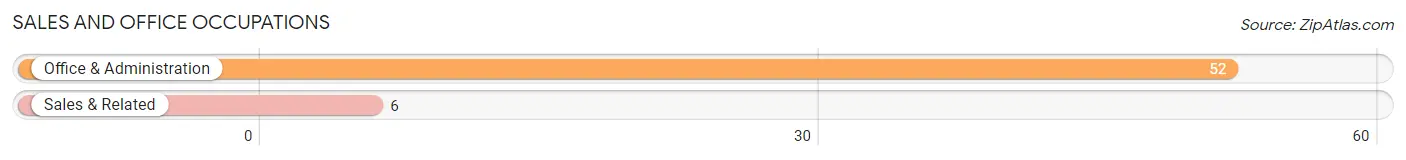
Sales and Office Occupations
The most common Sales and Office occupations in North Ballston Spa are Office & Administration (52 | 9.3%), and Sales & Related (6 | 1.1%).
Sales and Office Occupations by Sex
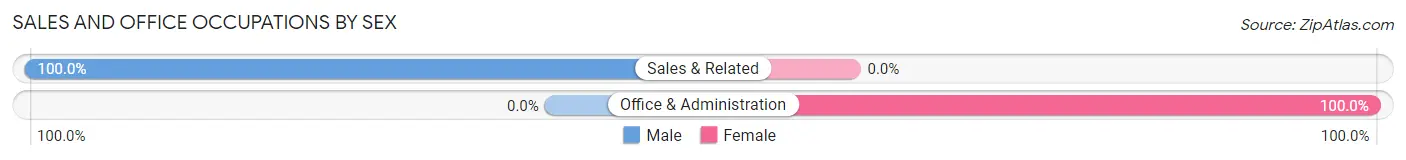
| Occupation | Male | Female |
| Sales & Related | 6 (100.0%) | 0 (0.0%) |
| Office & Administration | 0 (0.0%) | 52 (100.0%) |
| Total (Category) | 6 (10.3%) | 52 (89.7%) |
| Total (Overall) | 318 (57.0%) | 240 (43.0%) |
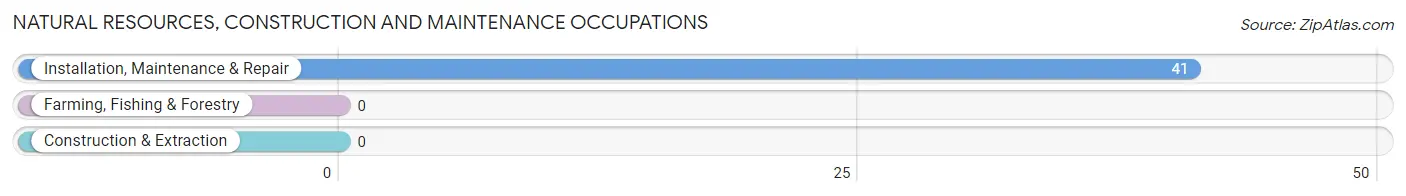
Natural Resources, Construction and Maintenance Occupations
The most common Natural Resources, Construction and Maintenance occupations in North Ballston Spa are , and Installation, Maintenance & Repair (41 | 7.3%).
Natural Resources, Construction and Maintenance Occupations by Sex
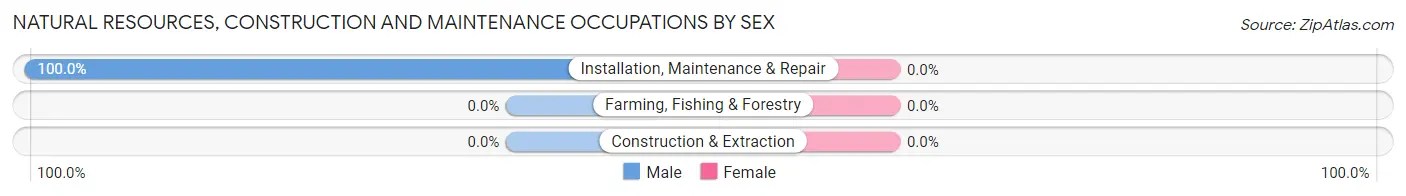
| Occupation | Male | Female |
| Farming, Fishing & Forestry | 0 (0.0%) | 0 (0.0%) |
| Construction & Extraction | 0 (0.0%) | 0 (0.0%) |
| Installation, Maintenance & Repair | 41 (100.0%) | 0 (0.0%) |
| Total (Category) | 41 (100.0%) | 0 (0.0%) |
| Total (Overall) | 318 (57.0%) | 240 (43.0%) |
Production, Transportation and Moving Occupations
The most common Production, Transportation and Moving occupations in North Ballston Spa are Transportation (53 | 9.5%), and Material Moving (29 | 5.2%).
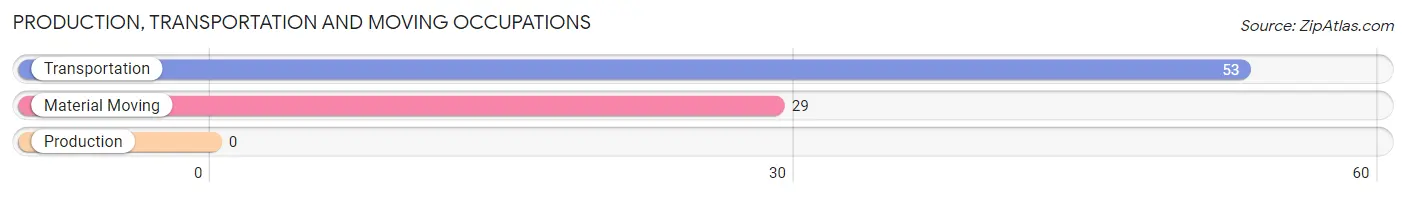
Production, Transportation and Moving Occupations by Sex
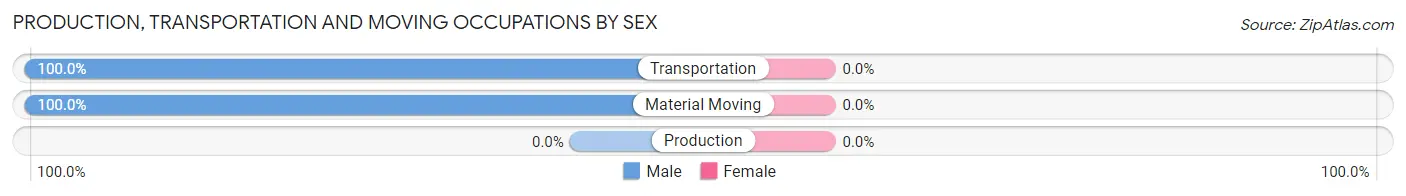
| Occupation | Male | Female |
| Production | 0 (0.0%) | 0 (0.0%) |
| Transportation | 53 (100.0%) | 0 (0.0%) |
| Material Moving | 29 (100.0%) | 0 (0.0%) |
| Total (Category) | 82 (100.0%) | 0 (0.0%) |
| Total (Overall) | 318 (57.0%) | 240 (43.0%) |
Employment Industries by Sex in North Ballston Spa
Employment Industries in North Ballston Spa
The major employment industries in North Ballston Spa include Manufacturing (86 | 15.4%), Professional & Scientific (72 | 12.9%), Transportation & Warehousing (63 | 11.3%), Health Care & Social Assistance (62 | 11.1%), and Real Estate, Rental & Leasing (59 | 10.6%).
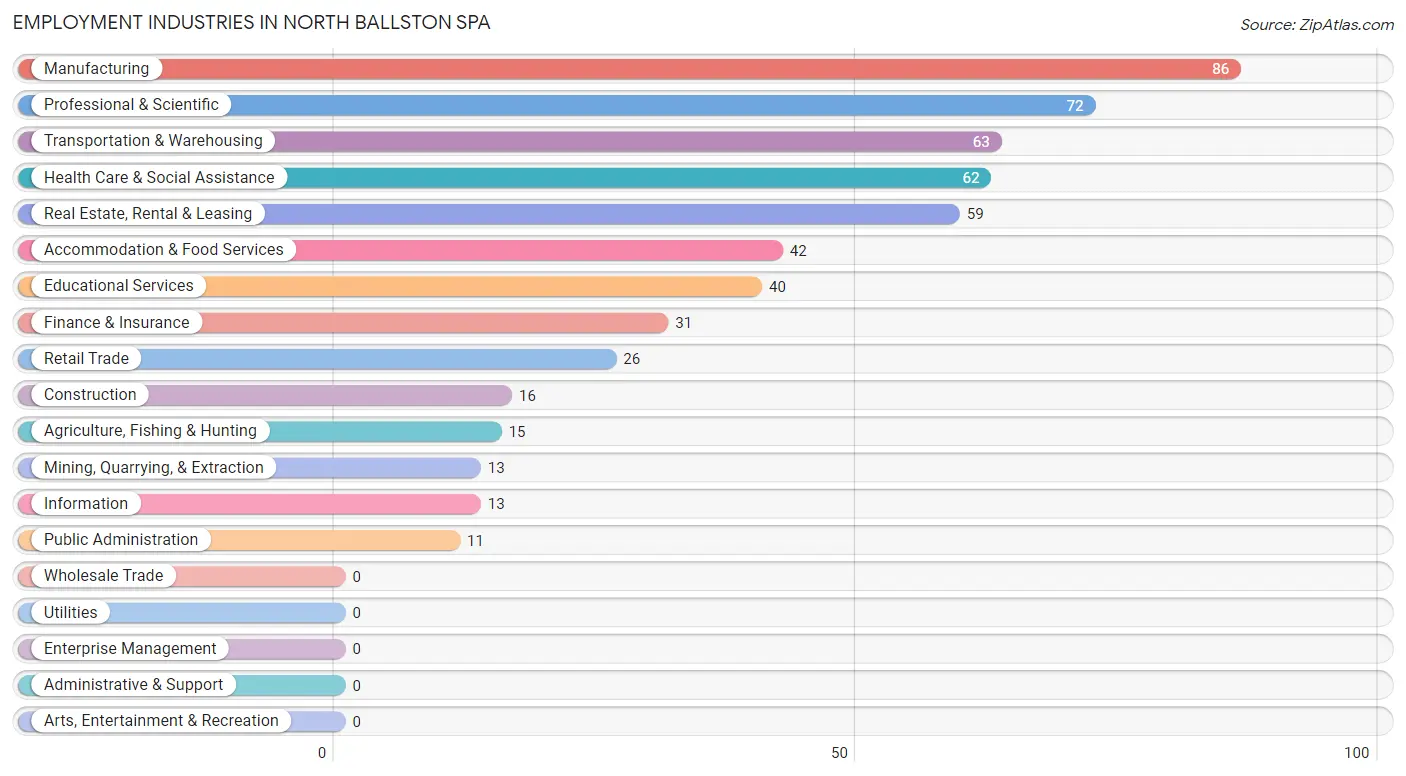
Employment Industries by Sex in North Ballston Spa
The North Ballston Spa industries that see more men than women are Mining, Quarrying, & Extraction (100.0%), Construction (100.0%), and Manufacturing (100.0%), whereas the industries that tend to have a higher number of women are Agriculture, Fishing & Hunting (100.0%), Educational Services (100.0%), and Health Care & Social Assistance (100.0%).
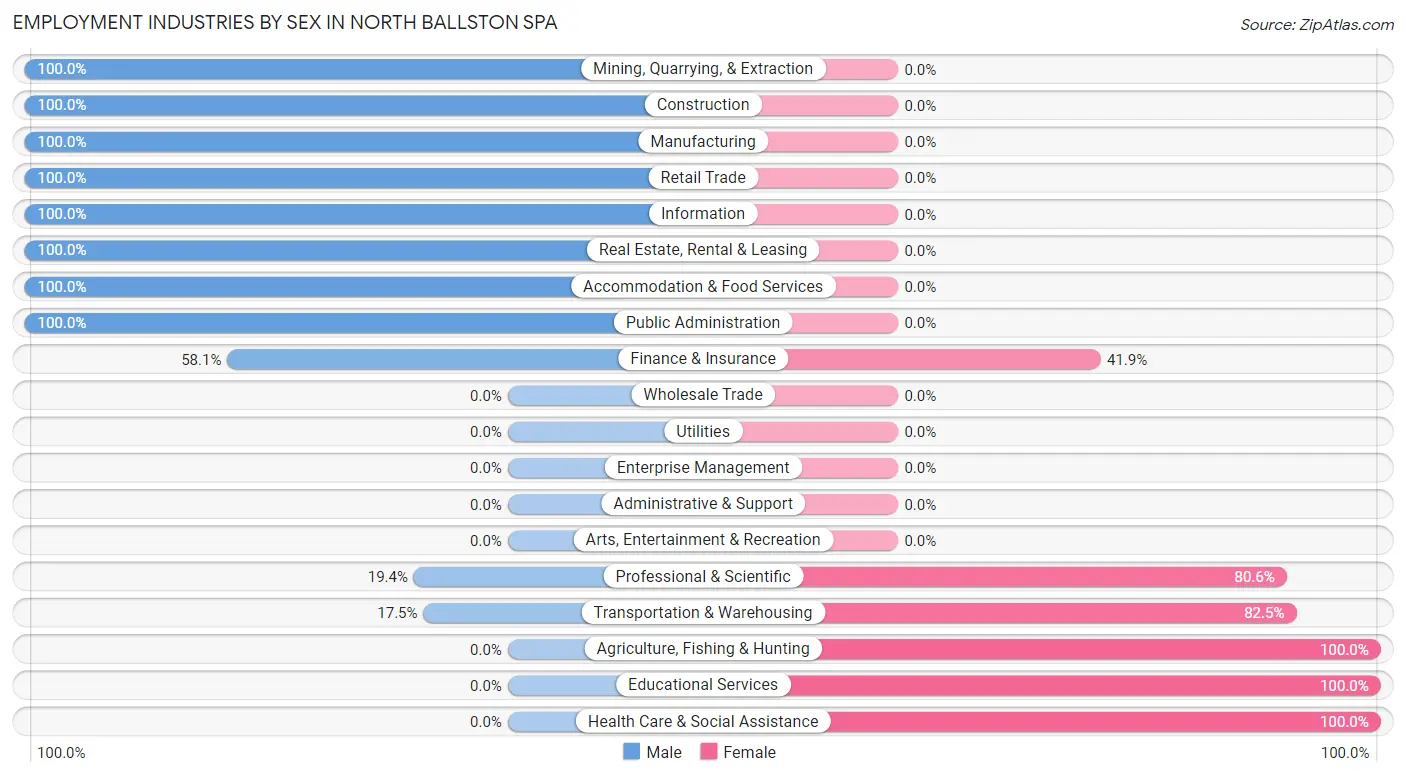
| Industry | Male | Female |
| Agriculture, Fishing & Hunting | 0 (0.0%) | 15 (100.0%) |
| Mining, Quarrying, & Extraction | 13 (100.0%) | 0 (0.0%) |
| Construction | 16 (100.0%) | 0 (0.0%) |
| Manufacturing | 86 (100.0%) | 0 (0.0%) |
| Wholesale Trade | 0 (0.0%) | 0 (0.0%) |
| Retail Trade | 26 (100.0%) | 0 (0.0%) |
| Transportation & Warehousing | 11 (17.5%) | 52 (82.5%) |
| Utilities | 0 (0.0%) | 0 (0.0%) |
| Information | 13 (100.0%) | 0 (0.0%) |
| Finance & Insurance | 18 (58.1%) | 13 (41.9%) |
| Real Estate, Rental & Leasing | 59 (100.0%) | 0 (0.0%) |
| Professional & Scientific | 14 (19.4%) | 58 (80.6%) |
| Enterprise Management | 0 (0.0%) | 0 (0.0%) |
| Administrative & Support | 0 (0.0%) | 0 (0.0%) |
| Educational Services | 0 (0.0%) | 40 (100.0%) |
| Health Care & Social Assistance | 0 (0.0%) | 62 (100.0%) |
| Arts, Entertainment & Recreation | 0 (0.0%) | 0 (0.0%) |
| Accommodation & Food Services | 42 (100.0%) | 0 (0.0%) |
| Public Administration | 11 (100.0%) | 0 (0.0%) |
| Total | 318 (57.0%) | 240 (43.0%) |
Education in North Ballston Spa
School Enrollment in North Ballston Spa
The most common levels of schooling among the 147 students in North Ballston Spa are elementary school (60 | 40.8%), high school (34 | 23.1%), and college / undergraduate (22 | 15.0%).
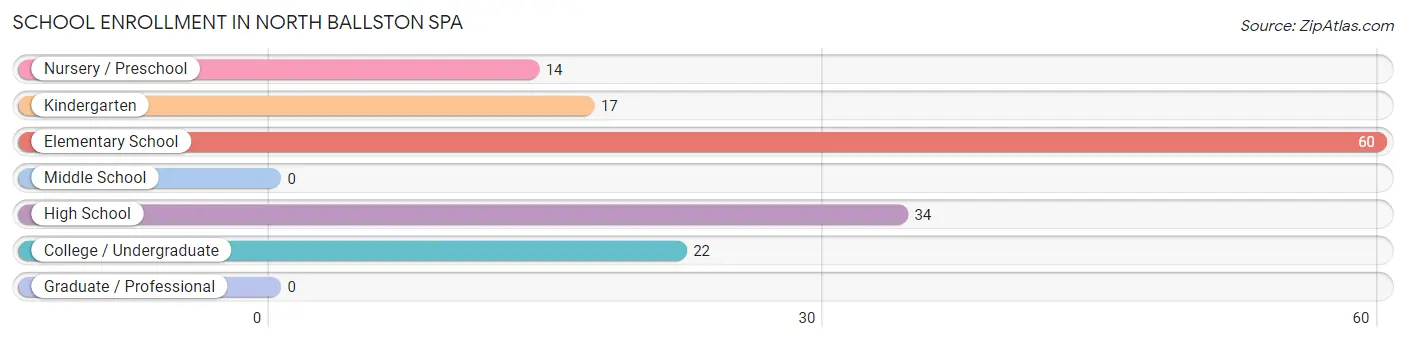
| School Level | # Students | % Students |
| Nursery / Preschool | 14 | 9.5% |
| Kindergarten | 17 | 11.6% |
| Elementary School | 60 | 40.8% |
| Middle School | 0 | 0.0% |
| High School | 34 | 23.1% |
| College / Undergraduate | 22 | 15.0% |
| Graduate / Professional | 0 | 0.0% |
| Total | 147 | 100.0% |
School Enrollment by Age by Funding Source in North Ballston Spa
Out of a total of 147 students who are enrolled in schools in North Ballston Spa, 66 (44.9%) attend a private institution, while the remaining 81 (55.1%) are enrolled in public schools. The age group of 5 to 9 year old has the highest likelihood of being enrolled in private schools, with 66 (85.7% in the age bracket) enrolled. Conversely, the age group of 3 to 4 year olds has the lowest likelihood of being enrolled in a private school, with 14 (100.0% in the age bracket) attending a public institution.
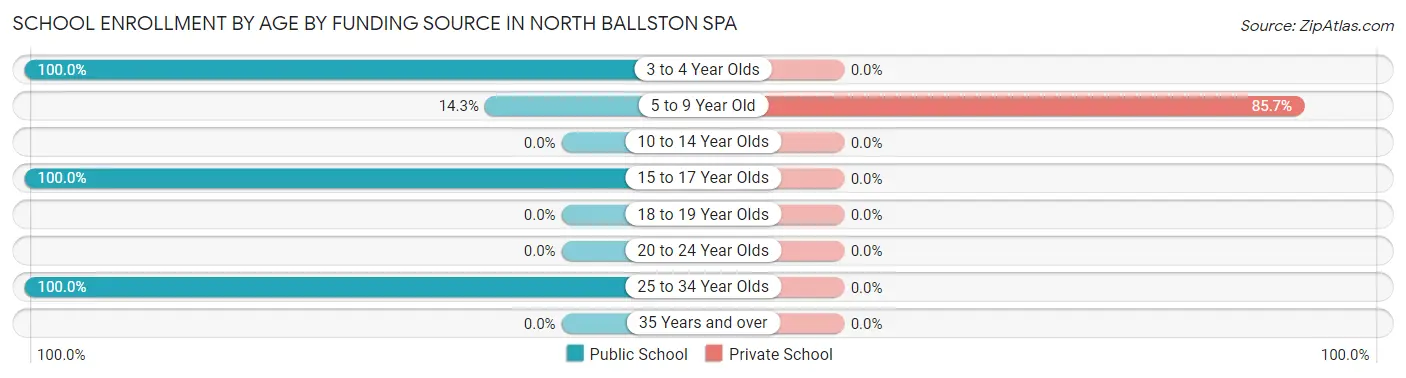
| Age Bracket | Public School | Private School |
| 3 to 4 Year Olds | 14 (100.0%) | 0 (0.0%) |
| 5 to 9 Year Old | 11 (14.3%) | 66 (85.7%) |
| 10 to 14 Year Olds | 0 (0.0%) | 0 (0.0%) |
| 15 to 17 Year Olds | 34 (100.0%) | 0 (0.0%) |
| 18 to 19 Year Olds | 0 (0.0%) | 0 (0.0%) |
| 20 to 24 Year Olds | 0 (0.0%) | 0 (0.0%) |
| 25 to 34 Year Olds | 22 (100.0%) | 0 (0.0%) |
| 35 Years and over | 0 (0.0%) | 0 (0.0%) |
| Total | 81 (55.1%) | 66 (44.9%) |
Educational Attainment by Field of Study in North Ballston Spa
Business (70 | 22.6%), engineering (65 | 21.0%), social sciences (51 | 16.5%), education (40 | 12.9%), and literature & languages (21 | 6.8%) are the most common fields of study among 310 individuals in North Ballston Spa who have obtained a bachelor's degree or higher.
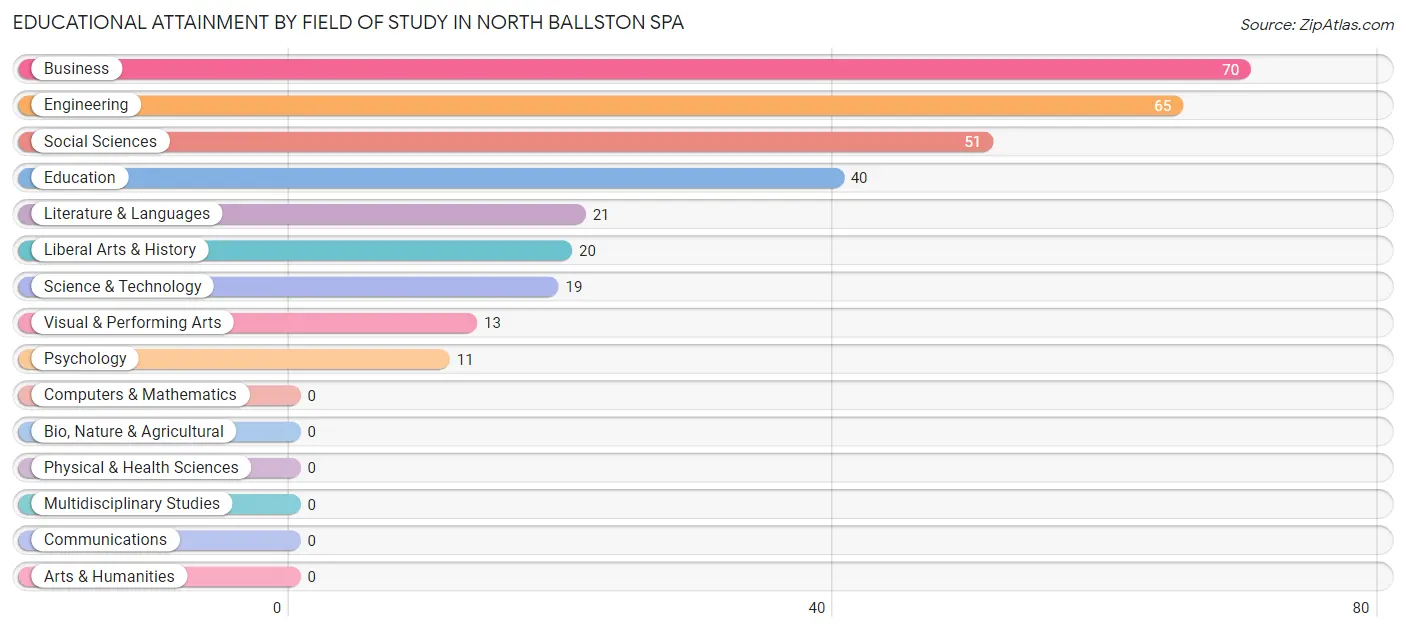
| Field of Study | # Graduates | % Graduates |
| Computers & Mathematics | 0 | 0.0% |
| Bio, Nature & Agricultural | 0 | 0.0% |
| Physical & Health Sciences | 0 | 0.0% |
| Psychology | 11 | 3.5% |
| Social Sciences | 51 | 16.5% |
| Engineering | 65 | 21.0% |
| Multidisciplinary Studies | 0 | 0.0% |
| Science & Technology | 19 | 6.1% |
| Business | 70 | 22.6% |
| Education | 40 | 12.9% |
| Literature & Languages | 21 | 6.8% |
| Liberal Arts & History | 20 | 6.5% |
| Visual & Performing Arts | 13 | 4.2% |
| Communications | 0 | 0.0% |
| Arts & Humanities | 0 | 0.0% |
| Total | 310 | 100.0% |
Transportation & Commute in North Ballston Spa
Vehicle Availability by Sex in North Ballston Spa
The most prevalent vehicle ownership categories in North Ballston Spa are males with 2 vehicles (138, accounting for 46.9%) and females with 2 vehicles (133, making up 57.5%).
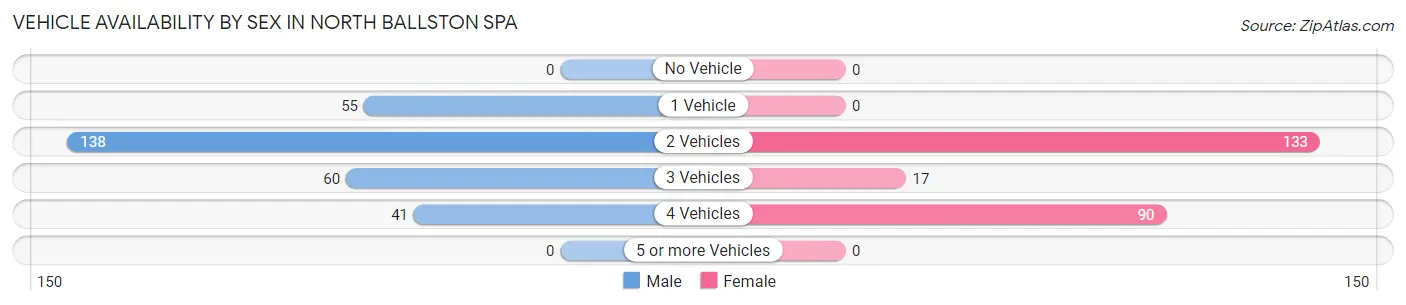
| Vehicles Available | Male | Female |
| No Vehicle | 0 (0.0%) | 0 (0.0%) |
| 1 Vehicle | 55 (18.7%) | 0 (0.0%) |
| 2 Vehicles | 138 (46.9%) | 133 (55.4%) |
| 3 Vehicles | 60 (20.4%) | 17 (7.1%) |
| 4 Vehicles | 41 (14.0%) | 90 (37.5%) |
| 5 or more Vehicles | 0 (0.0%) | 0 (0.0%) |
| Total | 294 (100.0%) | 240 (100.0%) |
Commute Time in North Ballston Spa
The most frequently occuring commute durations in North Ballston Spa are 10 to 14 minutes (158 commuters, 33.3%), 5 to 9 minutes (67 commuters, 14.1%), and 30 to 34 minutes (61 commuters, 12.8%).
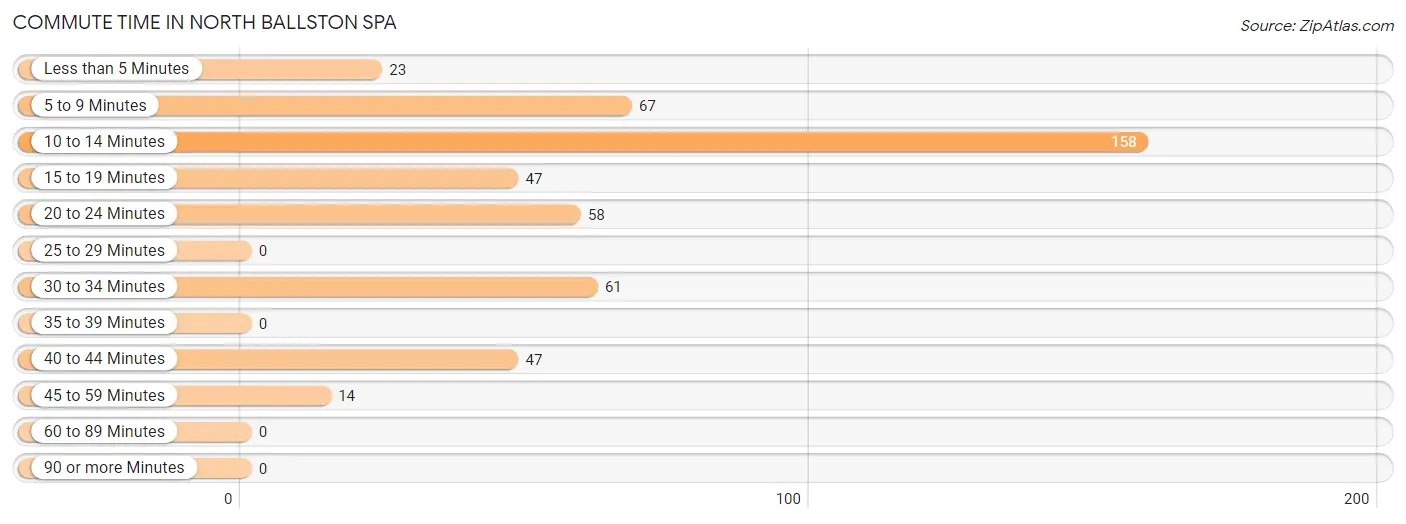
| Commute Time | # Commuters | % Commuters |
| Less than 5 Minutes | 23 | 4.8% |
| 5 to 9 Minutes | 67 | 14.1% |
| 10 to 14 Minutes | 158 | 33.3% |
| 15 to 19 Minutes | 47 | 9.9% |
| 20 to 24 Minutes | 58 | 12.2% |
| 25 to 29 Minutes | 0 | 0.0% |
| 30 to 34 Minutes | 61 | 12.8% |
| 35 to 39 Minutes | 0 | 0.0% |
| 40 to 44 Minutes | 47 | 9.9% |
| 45 to 59 Minutes | 14 | 2.9% |
| 60 to 89 Minutes | 0 | 0.0% |
| 90 or more Minutes | 0 | 0.0% |
Commute Time by Sex in North Ballston Spa
The most common commute times in North Ballston Spa are 10 to 14 minutes (100 commuters, 38.0%) for males and 10 to 14 minutes (58 commuters, 27.4%) for females.
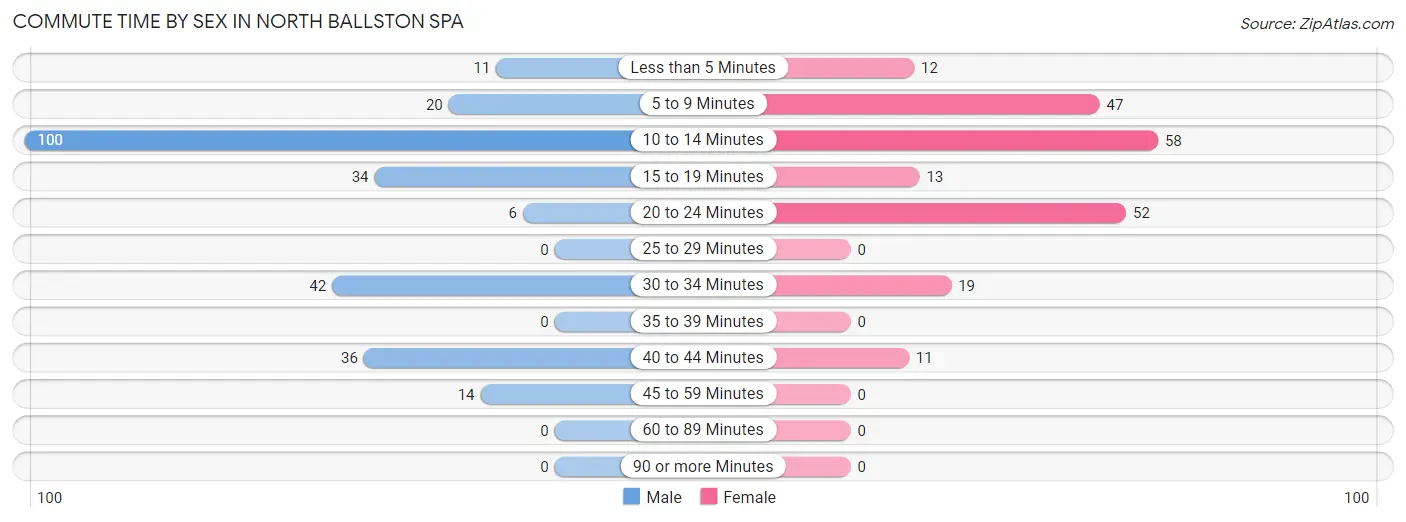
| Commute Time | Male | Female |
| Less than 5 Minutes | 11 (4.2%) | 12 (5.7%) |
| 5 to 9 Minutes | 20 (7.6%) | 47 (22.2%) |
| 10 to 14 Minutes | 100 (38.0%) | 58 (27.4%) |
| 15 to 19 Minutes | 34 (12.9%) | 13 (6.1%) |
| 20 to 24 Minutes | 6 (2.3%) | 52 (24.5%) |
| 25 to 29 Minutes | 0 (0.0%) | 0 (0.0%) |
| 30 to 34 Minutes | 42 (16.0%) | 19 (9.0%) |
| 35 to 39 Minutes | 0 (0.0%) | 0 (0.0%) |
| 40 to 44 Minutes | 36 (13.7%) | 11 (5.2%) |
| 45 to 59 Minutes | 14 (5.3%) | 0 (0.0%) |
| 60 to 89 Minutes | 0 (0.0%) | 0 (0.0%) |
| 90 or more Minutes | 0 (0.0%) | 0 (0.0%) |
Time of Departure to Work by Sex in North Ballston Spa
The most frequent times of departure to work in North Ballston Spa are 7:00 AM to 7:29 AM (77, 29.3%) for males and 8:30 AM to 8:59 AM (62, 29.2%) for females.
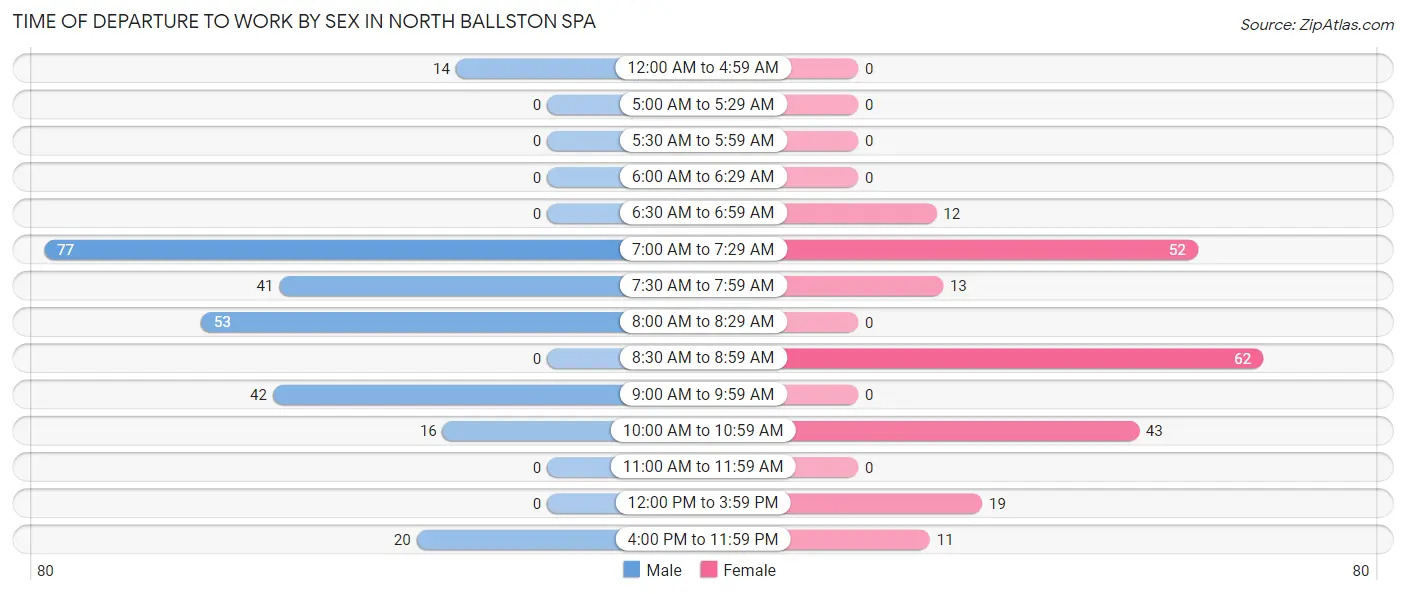
| Time of Departure | Male | Female |
| 12:00 AM to 4:59 AM | 14 (5.3%) | 0 (0.0%) |
| 5:00 AM to 5:29 AM | 0 (0.0%) | 0 (0.0%) |
| 5:30 AM to 5:59 AM | 0 (0.0%) | 0 (0.0%) |
| 6:00 AM to 6:29 AM | 0 (0.0%) | 0 (0.0%) |
| 6:30 AM to 6:59 AM | 0 (0.0%) | 12 (5.7%) |
| 7:00 AM to 7:29 AM | 77 (29.3%) | 52 (24.5%) |
| 7:30 AM to 7:59 AM | 41 (15.6%) | 13 (6.1%) |
| 8:00 AM to 8:29 AM | 53 (20.2%) | 0 (0.0%) |
| 8:30 AM to 8:59 AM | 0 (0.0%) | 62 (29.2%) |
| 9:00 AM to 9:59 AM | 42 (16.0%) | 0 (0.0%) |
| 10:00 AM to 10:59 AM | 16 (6.1%) | 43 (20.3%) |
| 11:00 AM to 11:59 AM | 0 (0.0%) | 0 (0.0%) |
| 12:00 PM to 3:59 PM | 0 (0.0%) | 19 (9.0%) |
| 4:00 PM to 11:59 PM | 20 (7.6%) | 11 (5.2%) |
| Total | 263 (100.0%) | 212 (100.0%) |
Housing Occupancy in North Ballston Spa
Occupancy by Ownership in North Ballston Spa
Of the total 631 dwellings in North Ballston Spa, owner-occupied units account for 494 (78.3%), while renter-occupied units make up 137 (21.7%).
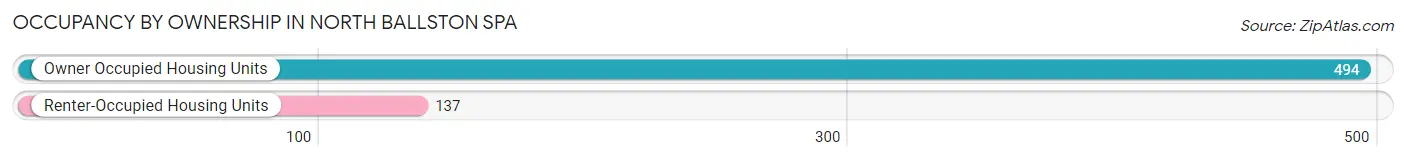
| Occupancy | # Housing Units | % Housing Units |
| Owner Occupied Housing Units | 494 | 78.3% |
| Renter-Occupied Housing Units | 137 | 21.7% |
| Total Occupied Housing Units | 631 | 100.0% |
Occupancy by Household Size in North Ballston Spa
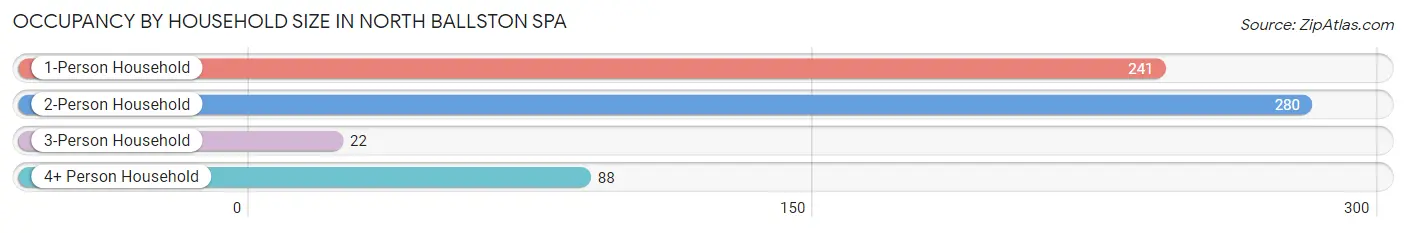
| Household Size | # Housing Units | % Housing Units |
| 1-Person Household | 241 | 38.2% |
| 2-Person Household | 280 | 44.4% |
| 3-Person Household | 22 | 3.5% |
| 4+ Person Household | 88 | 14.0% |
| Total Housing Units | 631 | 100.0% |
Occupancy by Ownership by Household Size in North Ballston Spa
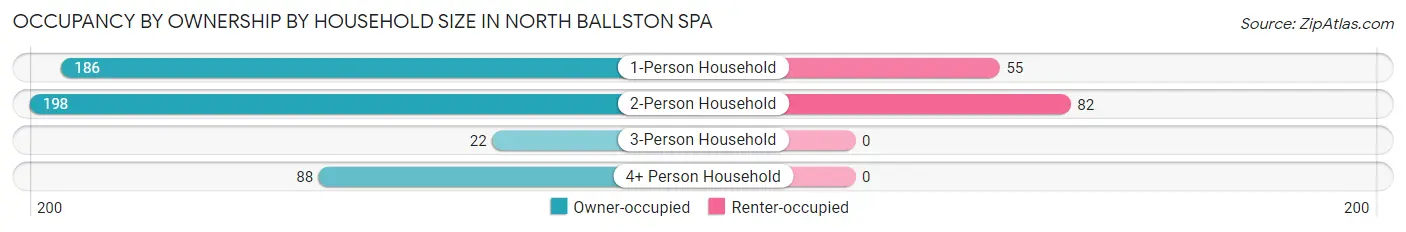
| Household Size | Owner-occupied | Renter-occupied |
| 1-Person Household | 186 (77.2%) | 55 (22.8%) |
| 2-Person Household | 198 (70.7%) | 82 (29.3%) |
| 3-Person Household | 22 (100.0%) | 0 (0.0%) |
| 4+ Person Household | 88 (100.0%) | 0 (0.0%) |
| Total Housing Units | 494 (78.3%) | 137 (21.7%) |
Occupancy by Educational Attainment in North Ballston Spa
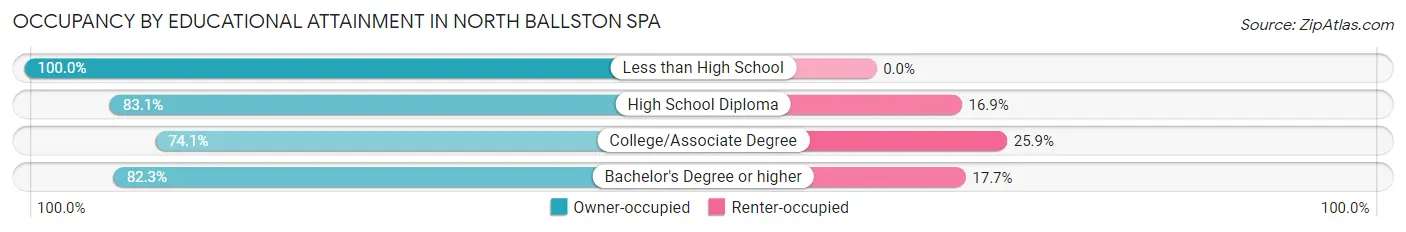
| Household Size | Owner-occupied | Renter-occupied |
| Less than High School | 22 (100.0%) | 0 (0.0%) |
| High School Diploma | 54 (83.1%) | 11 (16.9%) |
| College/Associate Degree | 269 (74.1%) | 94 (25.9%) |
| Bachelor's Degree or higher | 149 (82.3%) | 32 (17.7%) |
Occupancy by Age of Householder in North Ballston Spa
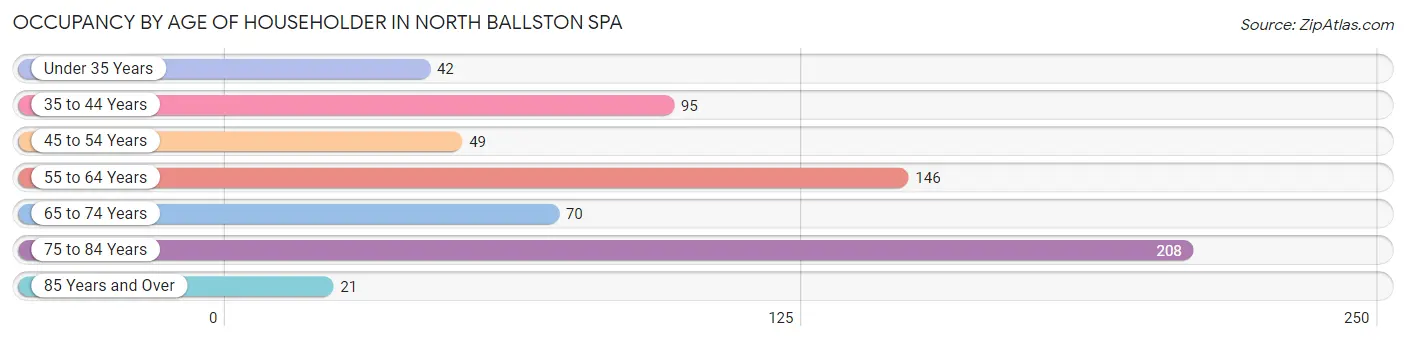
| Age Bracket | # Households | % Households |
| Under 35 Years | 42 | 6.7% |
| 35 to 44 Years | 95 | 15.1% |
| 45 to 54 Years | 49 | 7.8% |
| 55 to 64 Years | 146 | 23.1% |
| 65 to 74 Years | 70 | 11.1% |
| 75 to 84 Years | 208 | 33.0% |
| 85 Years and Over | 21 | 3.3% |
| Total | 631 | 100.0% |
Housing Finances in North Ballston Spa
Median Income by Occupancy in North Ballston Spa
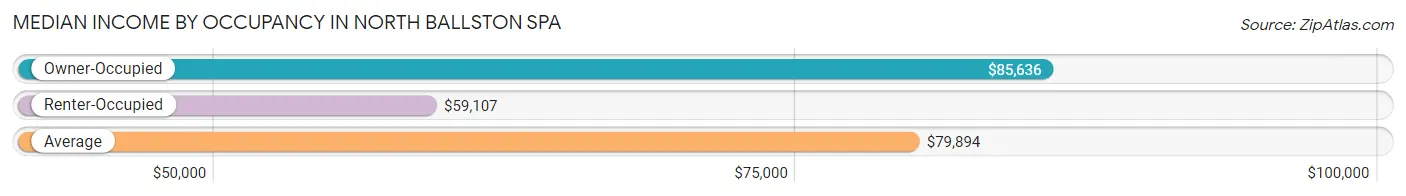
| Occupancy Type | # Households | Median Income |
| Owner-Occupied | 494 (78.3%) | $85,636 |
| Renter-Occupied | 137 (21.7%) | $59,107 |
| Average | 631 (100.0%) | $79,894 |
Occupancy by Householder Income Bracket in North Ballston Spa
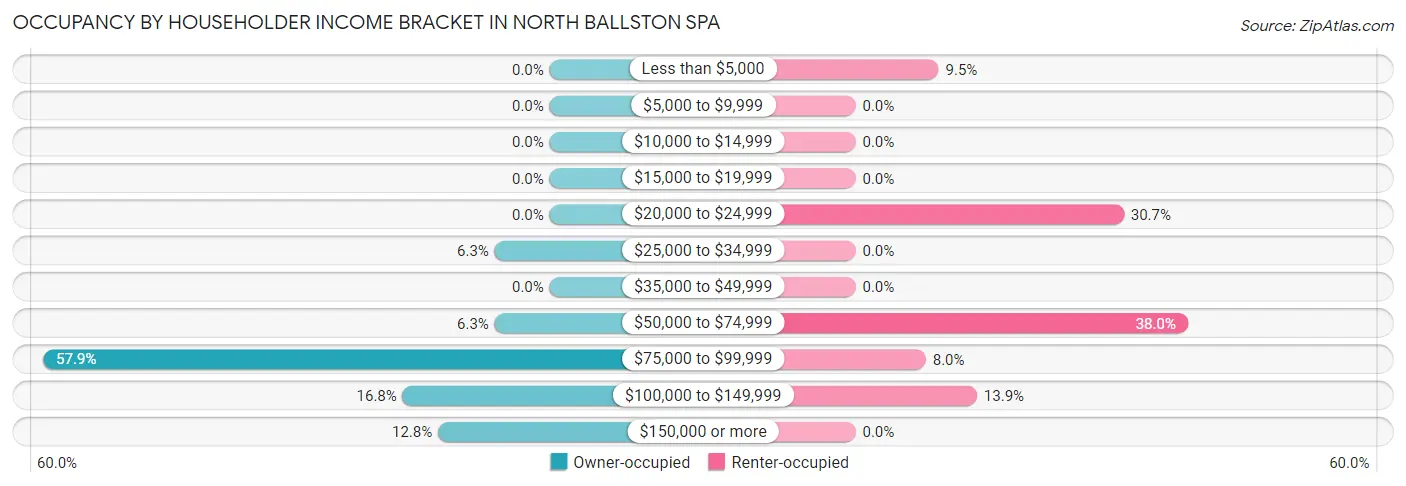
| Income Bracket | Owner-occupied | Renter-occupied |
| Less than $5,000 | 0 (0.0%) | 13 (9.5%) |
| $5,000 to $9,999 | 0 (0.0%) | 0 (0.0%) |
| $10,000 to $14,999 | 0 (0.0%) | 0 (0.0%) |
| $15,000 to $19,999 | 0 (0.0%) | 0 (0.0%) |
| $20,000 to $24,999 | 0 (0.0%) | 42 (30.7%) |
| $25,000 to $34,999 | 31 (6.3%) | 0 (0.0%) |
| $35,000 to $49,999 | 0 (0.0%) | 0 (0.0%) |
| $50,000 to $74,999 | 31 (6.3%) | 52 (38.0%) |
| $75,000 to $99,999 | 286 (57.9%) | 11 (8.0%) |
| $100,000 to $149,999 | 83 (16.8%) | 19 (13.9%) |
| $150,000 or more | 63 (12.8%) | 0 (0.0%) |
| Total | 494 (100.0%) | 137 (100.0%) |
Monthly Housing Cost Tiers in North Ballston Spa
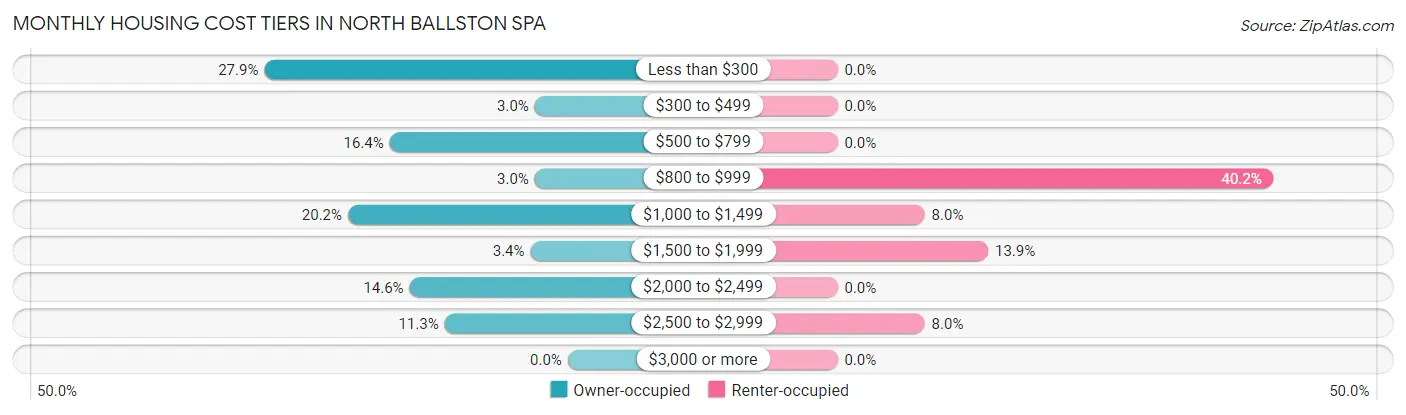
| Monthly Cost | Owner-occupied | Renter-occupied |
| Less than $300 | 138 (27.9%) | 0 (0.0%) |
| $300 to $499 | 15 (3.0%) | 0 (0.0%) |
| $500 to $799 | 81 (16.4%) | 0 (0.0%) |
| $800 to $999 | 15 (3.0%) | 55 (40.2%) |
| $1,000 to $1,499 | 100 (20.2%) | 11 (8.0%) |
| $1,500 to $1,999 | 17 (3.4%) | 19 (13.9%) |
| $2,000 to $2,499 | 72 (14.6%) | 0 (0.0%) |
| $2,500 to $2,999 | 56 (11.3%) | 11 (8.0%) |
| $3,000 or more | 0 (0.0%) | 0 (0.0%) |
| Total | 494 (100.0%) | 137 (100.0%) |
Physical Housing Characteristics in North Ballston Spa
Housing Structures in North Ballston Spa
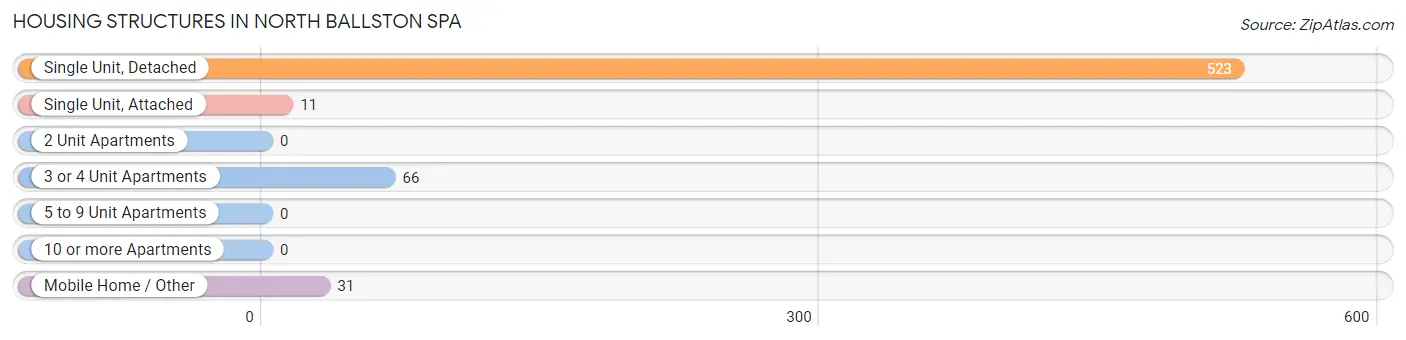
| Structure Type | # Housing Units | % Housing Units |
| Single Unit, Detached | 523 | 82.9% |
| Single Unit, Attached | 11 | 1.7% |
| 2 Unit Apartments | 0 | 0.0% |
| 3 or 4 Unit Apartments | 66 | 10.5% |
| 5 to 9 Unit Apartments | 0 | 0.0% |
| 10 or more Apartments | 0 | 0.0% |
| Mobile Home / Other | 31 | 4.9% |
| Total | 631 | 100.0% |
Housing Structures by Occupancy in North Ballston Spa
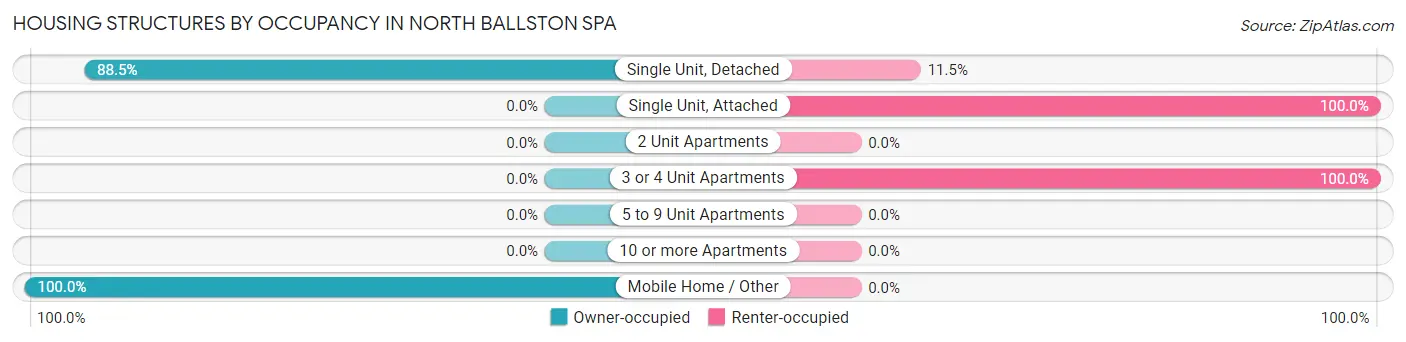
| Structure Type | Owner-occupied | Renter-occupied |
| Single Unit, Detached | 463 (88.5%) | 60 (11.5%) |
| Single Unit, Attached | 0 (0.0%) | 11 (100.0%) |
| 2 Unit Apartments | 0 (0.0%) | 0 (0.0%) |
| 3 or 4 Unit Apartments | 0 (0.0%) | 66 (100.0%) |
| 5 to 9 Unit Apartments | 0 (0.0%) | 0 (0.0%) |
| 10 or more Apartments | 0 (0.0%) | 0 (0.0%) |
| Mobile Home / Other | 31 (100.0%) | 0 (0.0%) |
| Total | 494 (78.3%) | 137 (21.7%) |
Housing Structures by Number of Rooms in North Ballston Spa
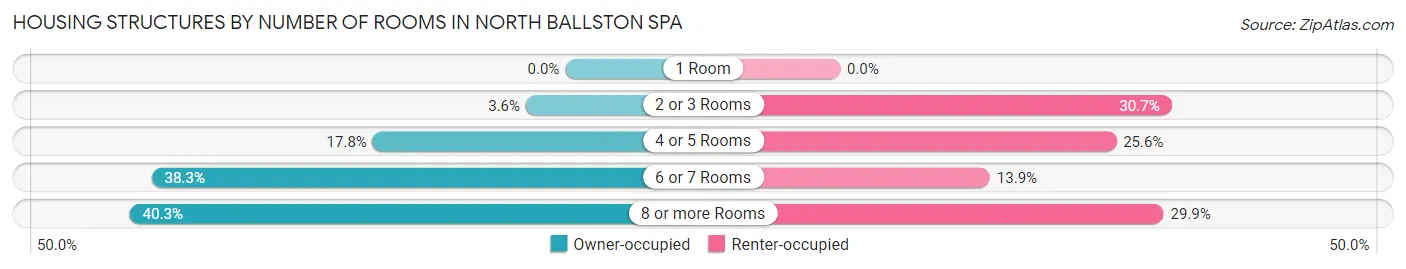
| Number of Rooms | Owner-occupied | Renter-occupied |
| 1 Room | 0 (0.0%) | 0 (0.0%) |
| 2 or 3 Rooms | 18 (3.6%) | 42 (30.7%) |
| 4 or 5 Rooms | 88 (17.8%) | 35 (25.6%) |
| 6 or 7 Rooms | 189 (38.3%) | 19 (13.9%) |
| 8 or more Rooms | 199 (40.3%) | 41 (29.9%) |
| Total | 494 (100.0%) | 137 (100.0%) |
Housing Structure by Heating Type in North Ballston Spa
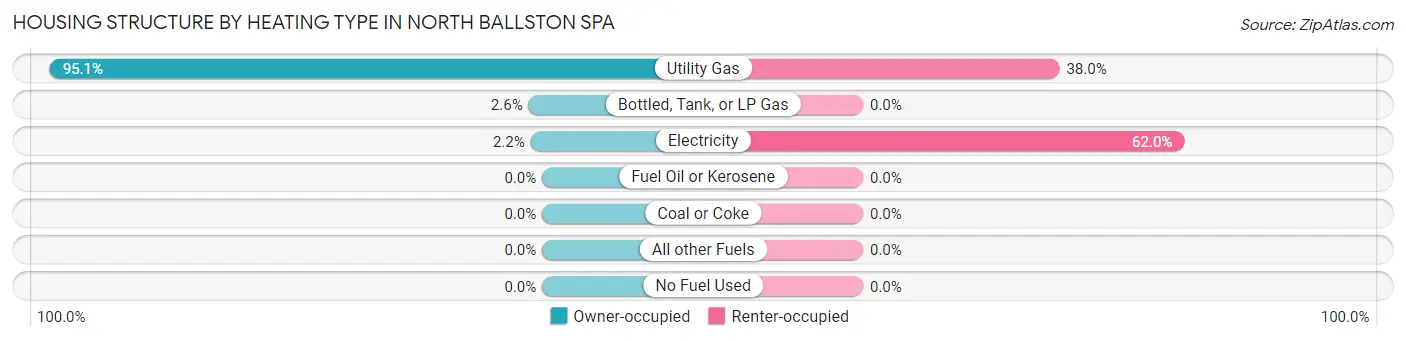
| Heating Type | Owner-occupied | Renter-occupied |
| Utility Gas | 470 (95.1%) | 52 (38.0%) |
| Bottled, Tank, or LP Gas | 13 (2.6%) | 0 (0.0%) |
| Electricity | 11 (2.2%) | 85 (62.0%) |
| Fuel Oil or Kerosene | 0 (0.0%) | 0 (0.0%) |
| Coal or Coke | 0 (0.0%) | 0 (0.0%) |
| All other Fuels | 0 (0.0%) | 0 (0.0%) |
| No Fuel Used | 0 (0.0%) | 0 (0.0%) |
| Total | 494 (100.0%) | 137 (100.0%) |
Household Vehicle Usage in North Ballston Spa
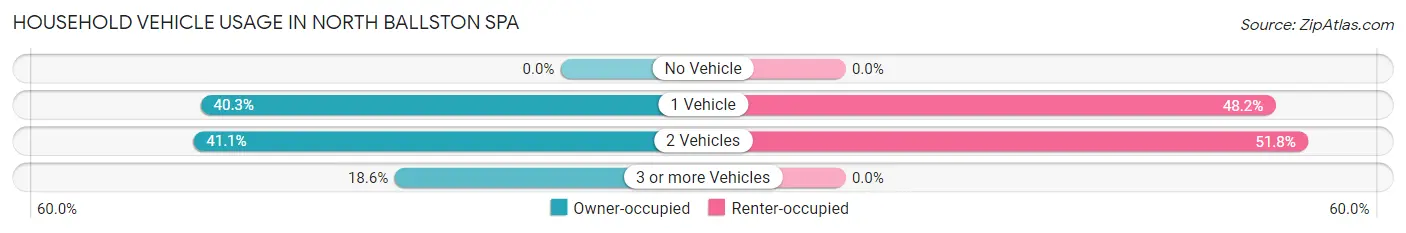
| Vehicles per Household | Owner-occupied | Renter-occupied |
| No Vehicle | 0 (0.0%) | 0 (0.0%) |
| 1 Vehicle | 199 (40.3%) | 66 (48.2%) |
| 2 Vehicles | 203 (41.1%) | 71 (51.8%) |
| 3 or more Vehicles | 92 (18.6%) | 0 (0.0%) |
| Total | 494 (100.0%) | 137 (100.0%) |
Real Estate & Mortgages in North Ballston Spa
Real Estate and Mortgage Overview in North Ballston Spa
| Characteristic | Without Mortgage | With Mortgage |
| Housing Units | 218 | 276 |
| Median Property Value | - | - |
| Median Household Income | $78,742 | $63 |
| Monthly Housing Costs | - | - |
| Real Estate Taxes | - | - |
Property Value by Mortgage Status in North Ballston Spa
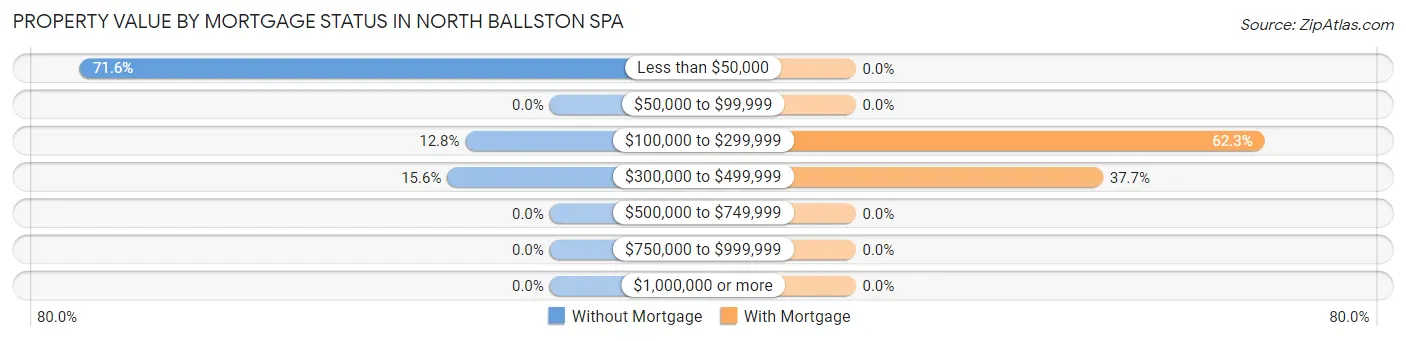
| Property Value | Without Mortgage | With Mortgage |
| Less than $50,000 | 156 (71.6%) | 0 (0.0%) |
| $50,000 to $99,999 | 0 (0.0%) | 0 (0.0%) |
| $100,000 to $299,999 | 28 (12.8%) | 172 (62.3%) |
| $300,000 to $499,999 | 34 (15.6%) | 104 (37.7%) |
| $500,000 to $749,999 | 0 (0.0%) | 0 (0.0%) |
| $750,000 to $999,999 | 0 (0.0%) | 0 (0.0%) |
| $1,000,000 or more | 0 (0.0%) | 0 (0.0%) |
| Total | 218 (100.0%) | 276 (100.0%) |
Household Income by Mortgage Status in North Ballston Spa
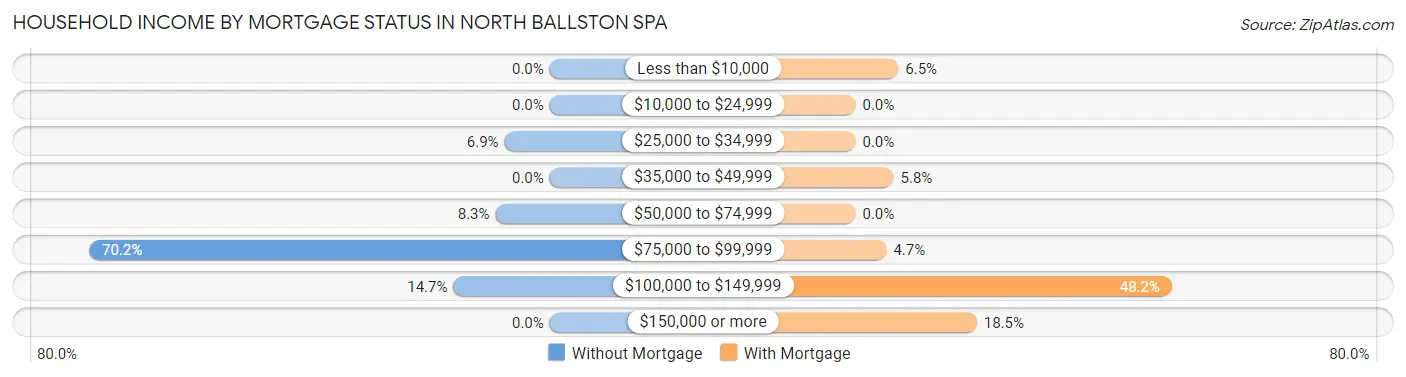
| Household Income | Without Mortgage | With Mortgage |
| Less than $10,000 | 0 (0.0%) | 18 (6.5%) |
| $10,000 to $24,999 | 0 (0.0%) | 0 (0.0%) |
| $25,000 to $34,999 | 15 (6.9%) | 0 (0.0%) |
| $35,000 to $49,999 | 0 (0.0%) | 16 (5.8%) |
| $50,000 to $74,999 | 18 (8.3%) | 0 (0.0%) |
| $75,000 to $99,999 | 153 (70.2%) | 13 (4.7%) |
| $100,000 to $149,999 | 32 (14.7%) | 133 (48.2%) |
| $150,000 or more | 0 (0.0%) | 51 (18.5%) |
| Total | 218 (100.0%) | 276 (100.0%) |
Property Value to Household Income Ratio in North Ballston Spa
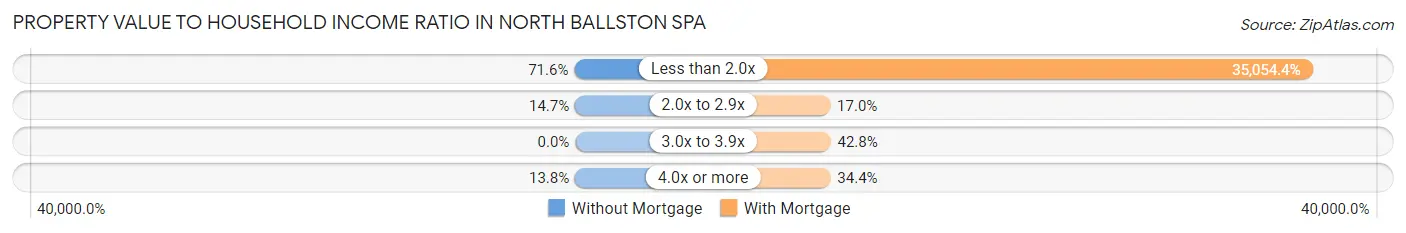
| Value-to-Income Ratio | Without Mortgage | With Mortgage |
| Less than 2.0x | 156 (71.6%) | 96,750 (35,054.3%) |
| 2.0x to 2.9x | 32 (14.7%) | 47 (17.0%) |
| 3.0x to 3.9x | 0 (0.0%) | 118 (42.7%) |
| 4.0x or more | 30 (13.8%) | 95 (34.4%) |
| Total | 218 (100.0%) | 276 (100.0%) |
Real Estate Taxes by Mortgage Status in North Ballston Spa
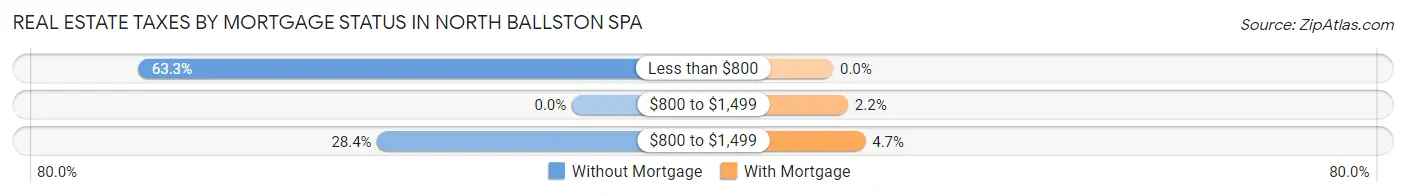
| Property Taxes | Without Mortgage | With Mortgage |
| Less than $800 | 138 (63.3%) | 0 (0.0%) |
| $800 to $1,499 | 0 (0.0%) | 6 (2.2%) |
| $800 to $1,499 | 62 (28.4%) | 13 (4.7%) |
| Total | 218 (100.0%) | 276 (100.0%) |
Health & Disability in North Ballston Spa
Health Insurance Coverage by Age in North Ballston Spa
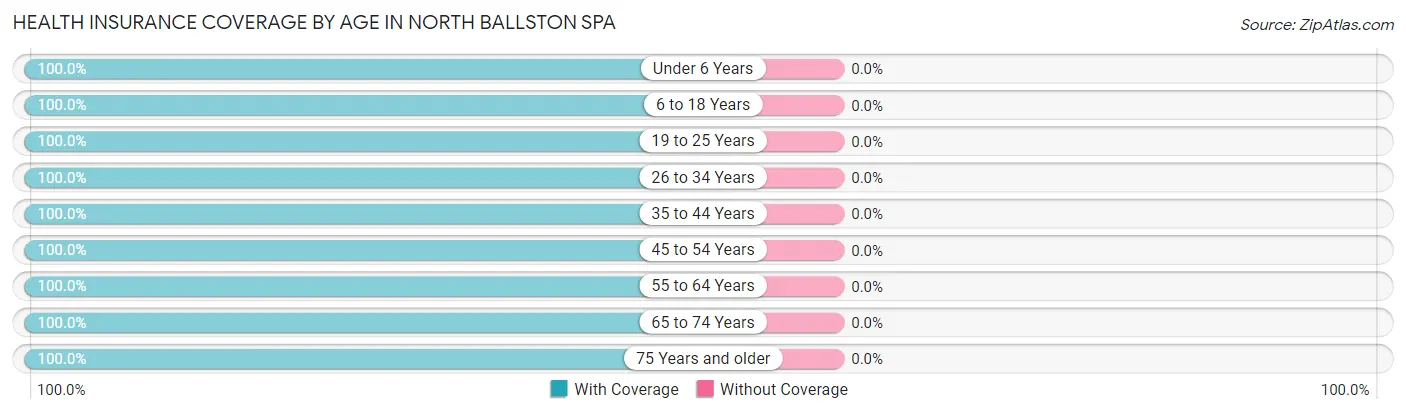
| Age Bracket | With Coverage | Without Coverage |
| Under 6 Years | 51 (100.0%) | 0 (0.0%) |
| 6 to 18 Years | 94 (100.0%) | 0 (0.0%) |
| 19 to 25 Years | 42 (100.0%) | 0 (0.0%) |
| 26 to 34 Years | 171 (100.0%) | 0 (0.0%) |
| 35 to 44 Years | 187 (100.0%) | 0 (0.0%) |
| 45 to 54 Years | 170 (100.0%) | 0 (0.0%) |
| 55 to 64 Years | 171 (100.0%) | 0 (0.0%) |
| 65 to 74 Years | 121 (100.0%) | 0 (0.0%) |
| 75 Years and older | 276 (100.0%) | 0 (0.0%) |
| Total | 1,283 (100.0%) | 0 (0.0%) |
Health Insurance Coverage by Citizenship Status in North Ballston Spa
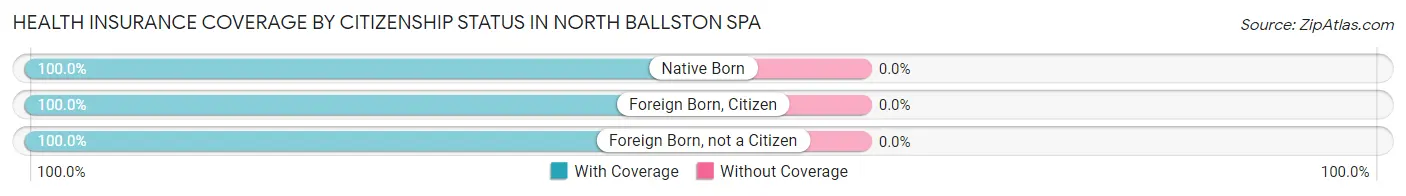
| Citizenship Status | With Coverage | Without Coverage |
| Native Born | 51 (100.0%) | 0 (0.0%) |
| Foreign Born, Citizen | 94 (100.0%) | 0 (0.0%) |
| Foreign Born, not a Citizen | 42 (100.0%) | 0 (0.0%) |
Health Insurance Coverage by Household Income in North Ballston Spa
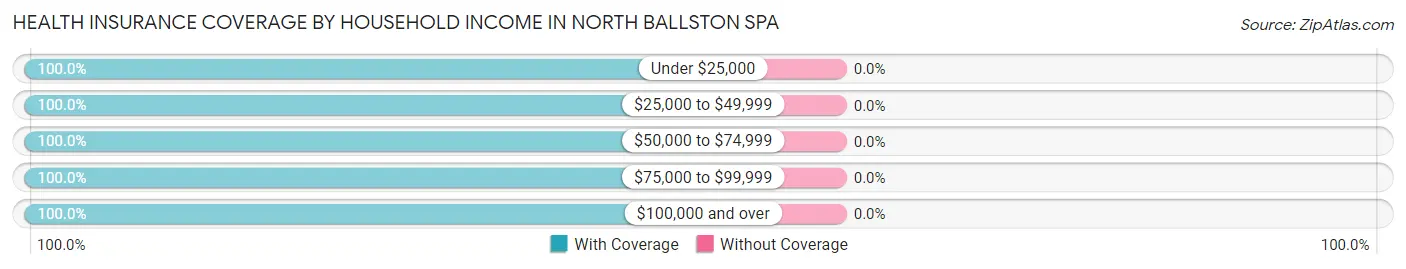
| Household Income | With Coverage | Without Coverage |
| Under $25,000 | 55 (100.0%) | 0 (0.0%) |
| $25,000 to $49,999 | 66 (100.0%) | 0 (0.0%) |
| $50,000 to $74,999 | 150 (100.0%) | 0 (0.0%) |
| $75,000 to $99,999 | 483 (100.0%) | 0 (0.0%) |
| $100,000 and over | 518 (100.0%) | 0 (0.0%) |
Public vs Private Health Insurance Coverage by Age in North Ballston Spa
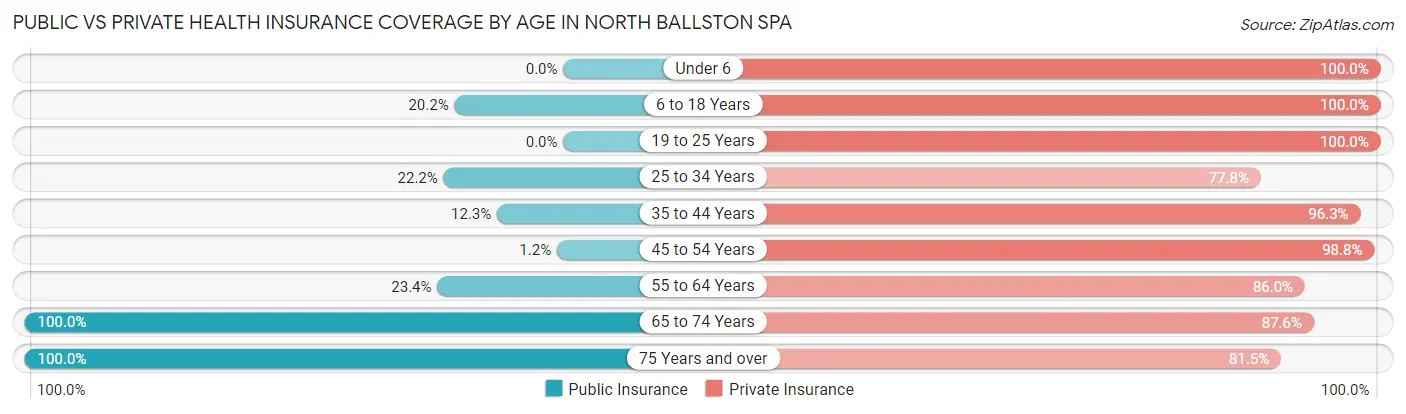
| Age Bracket | Public Insurance | Private Insurance |
| Under 6 | 0 (0.0%) | 51 (100.0%) |
| 6 to 18 Years | 19 (20.2%) | 94 (100.0%) |
| 19 to 25 Years | 0 (0.0%) | 42 (100.0%) |
| 25 to 34 Years | 38 (22.2%) | 133 (77.8%) |
| 35 to 44 Years | 23 (12.3%) | 180 (96.3%) |
| 45 to 54 Years | 2 (1.2%) | 168 (98.8%) |
| 55 to 64 Years | 40 (23.4%) | 147 (86.0%) |
| 65 to 74 Years | 121 (100.0%) | 106 (87.6%) |
| 75 Years and over | 276 (100.0%) | 225 (81.5%) |
| Total | 519 (40.5%) | 1,146 (89.3%) |
Disability Status by Sex by Age in North Ballston Spa
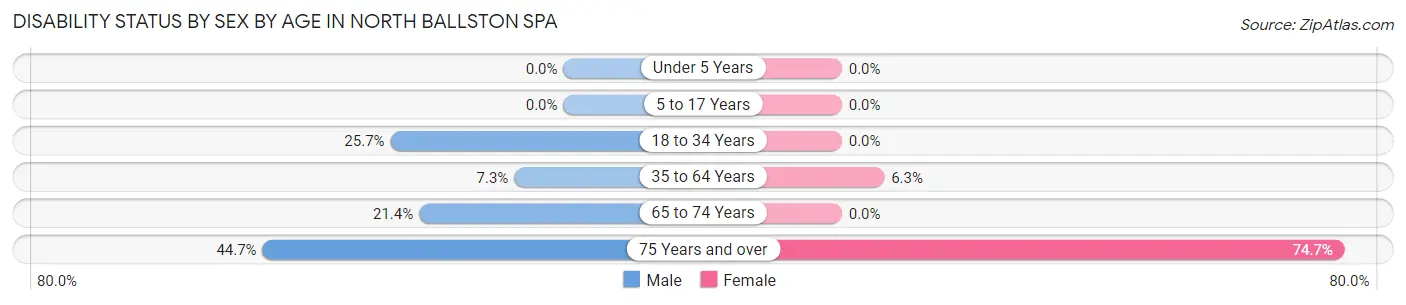
| Age Bracket | Male | Female |
| Under 5 Years | 0 (0.0%) | 0 (0.0%) |
| 5 to 17 Years | 0 (0.0%) | 0 (0.0%) |
| 18 to 34 Years | 38 (25.7%) | 0 (0.0%) |
| 35 to 64 Years | 20 (7.3%) | 16 (6.3%) |
| 65 to 74 Years | 15 (21.4%) | 0 (0.0%) |
| 75 Years and over | 21 (44.7%) | 171 (74.7%) |
Disability Class by Sex by Age in North Ballston Spa
Disability Class: Hearing Difficulty
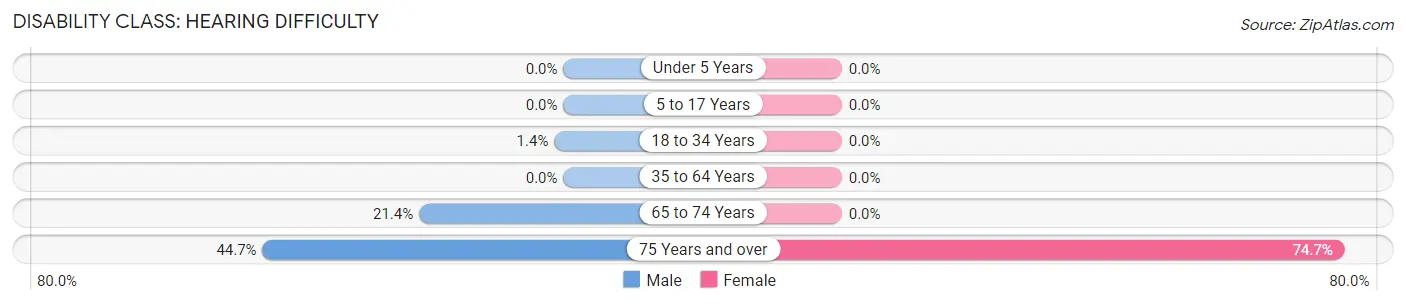
| Age Bracket | Male | Female |
| Under 5 Years | 0 (0.0%) | 0 (0.0%) |
| 5 to 17 Years | 0 (0.0%) | 0 (0.0%) |
| 18 to 34 Years | 2 (1.3%) | 0 (0.0%) |
| 35 to 64 Years | 0 (0.0%) | 0 (0.0%) |
| 65 to 74 Years | 15 (21.4%) | 0 (0.0%) |
| 75 Years and over | 21 (44.7%) | 171 (74.7%) |
Disability Class: Vision Difficulty
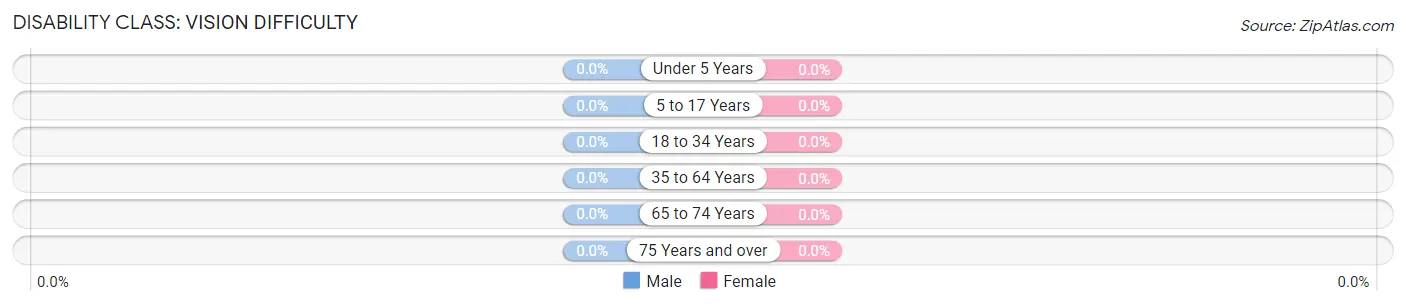
| Age Bracket | Male | Female |
| Under 5 Years | 0 (0.0%) | 0 (0.0%) |
| 5 to 17 Years | 0 (0.0%) | 0 (0.0%) |
| 18 to 34 Years | 0 (0.0%) | 0 (0.0%) |
| 35 to 64 Years | 0 (0.0%) | 0 (0.0%) |
| 65 to 74 Years | 0 (0.0%) | 0 (0.0%) |
| 75 Years and over | 0 (0.0%) | 0 (0.0%) |
Disability Class: Cognitive Difficulty
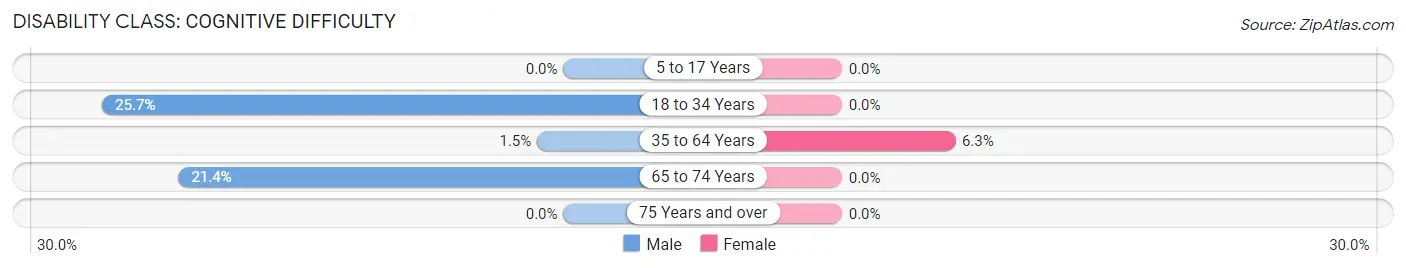
| Age Bracket | Male | Female |
| 5 to 17 Years | 0 (0.0%) | 0 (0.0%) |
| 18 to 34 Years | 38 (25.7%) | 0 (0.0%) |
| 35 to 64 Years | 4 (1.5%) | 16 (6.3%) |
| 65 to 74 Years | 15 (21.4%) | 0 (0.0%) |
| 75 Years and over | 0 (0.0%) | 0 (0.0%) |
Disability Class: Ambulatory Difficulty
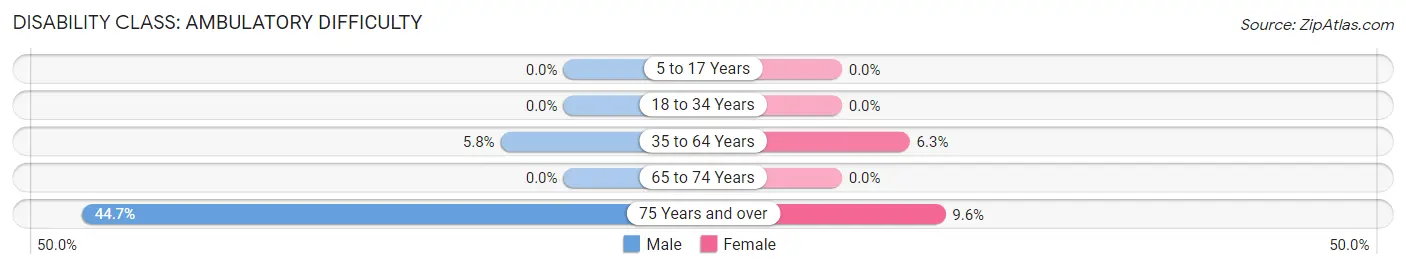
| Age Bracket | Male | Female |
| 5 to 17 Years | 0 (0.0%) | 0 (0.0%) |
| 18 to 34 Years | 0 (0.0%) | 0 (0.0%) |
| 35 to 64 Years | 16 (5.8%) | 16 (6.3%) |
| 65 to 74 Years | 0 (0.0%) | 0 (0.0%) |
| 75 Years and over | 21 (44.7%) | 22 (9.6%) |
Disability Class: Self-Care Difficulty
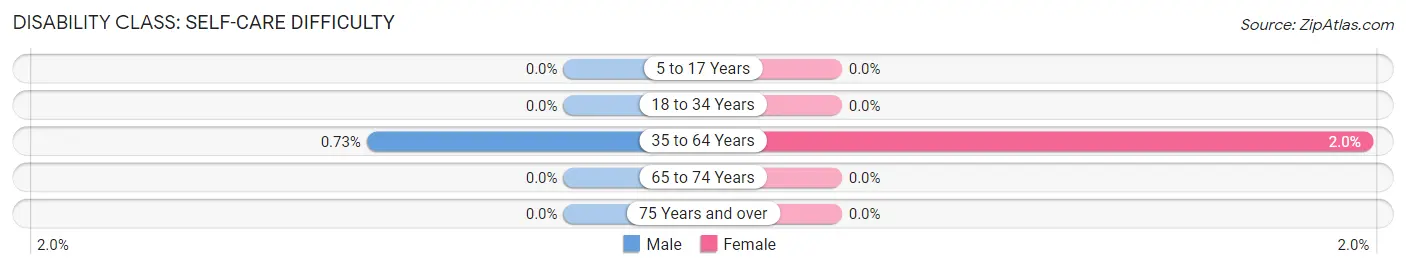
| Age Bracket | Male | Female |
| 5 to 17 Years | 0 (0.0%) | 0 (0.0%) |
| 18 to 34 Years | 0 (0.0%) | 0 (0.0%) |
| 35 to 64 Years | 2 (0.7%) | 5 (2.0%) |
| 65 to 74 Years | 0 (0.0%) | 0 (0.0%) |
| 75 Years and over | 0 (0.0%) | 0 (0.0%) |
Technology Access in North Ballston Spa
Computing Device Access in North Ballston Spa
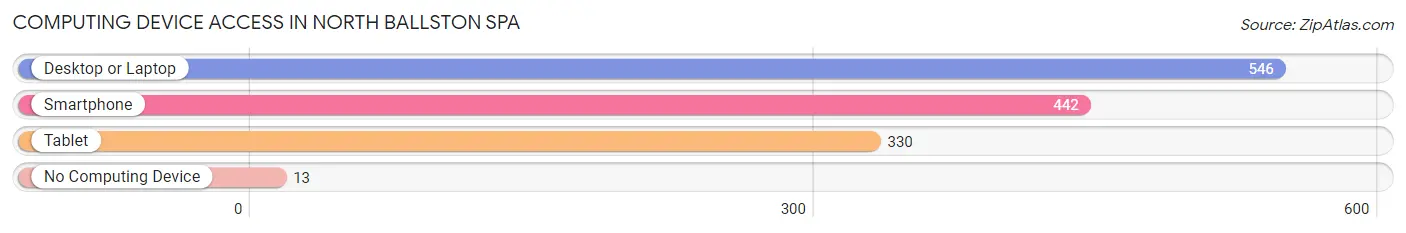
| Device Type | # Households | % Households |
| Desktop or Laptop | 546 | 86.5% |
| Smartphone | 442 | 70.1% |
| Tablet | 330 | 52.3% |
| No Computing Device | 13 | 2.1% |
| Total | 631 | 100.0% |
Internet Access in North Ballston Spa
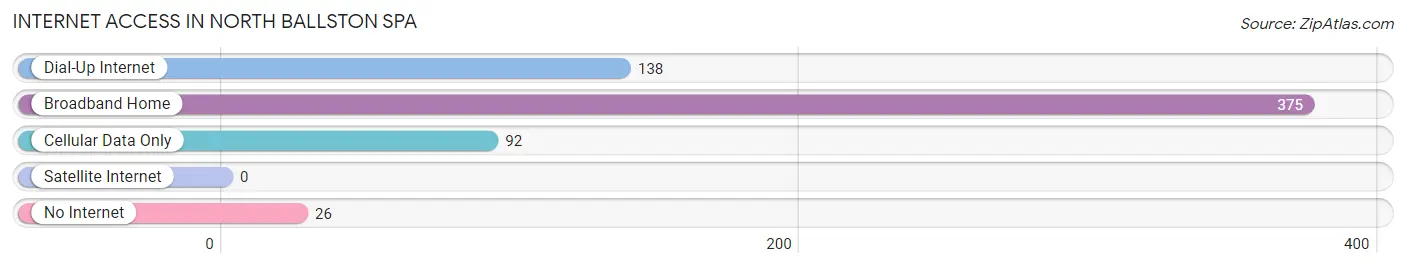
| Internet Type | # Households | % Households |
| Dial-Up Internet | 138 | 21.9% |
| Broadband Home | 375 | 59.4% |
| Cellular Data Only | 92 | 14.6% |
| Satellite Internet | 0 | 0.0% |
| No Internet | 26 | 4.1% |
| Total | 631 | 100.0% |
North Ballston Spa Summary
Ballston Spa is a village located in Saratoga County, New York, United States. It is part of the town of Ballston and is located approximately 10 miles north of the city of Saratoga Springs. The village is located in the heart of the Capital District and is home to a population of approximately 5,000 people.
History
The area that is now Ballston Spa was originally inhabited by the Mohawk and Iroquois Native American tribes. The first European settlers arrived in the area in the late 17th century and the village was officially founded in 1771. The village was named after the Ball family, who were among the first settlers in the area.
The village quickly grew and became an important center for commerce and industry. In the early 19th century, the village was home to several mills, including a paper mill, a grist mill, and a saw mill. The village was also home to several tanneries and a distillery.
In the mid-19th century, the village became a popular destination for tourists. The village was home to several resorts and spas, including the famous Saratoga Springs. The village was also home to several mineral springs, which were believed to have healing properties.
Geography
Ballston Spa is located in the heart of the Capital District of New York. The village is located approximately 10 miles north of the city of Saratoga Springs and is bordered by the towns of Malta, Clifton Park, and Halfmoon. The village is located on the banks of the Kayaderosseras Creek and is surrounded by rolling hills and forests.
The village has a total area of 1.3 square miles, all of which is land. The village is located at an elevation of approximately 500 feet above sea level.
Economy
The economy of Ballston Spa is largely based on tourism and retail. The village is home to several restaurants, shops, and other businesses. The village is also home to several manufacturing companies, including a paper mill and a printing company.
The village is also home to several educational institutions, including the Ballston Spa Central School District and the Saratoga County Community College.
Demographics
As of the 2010 census, the population of Ballston Spa was 5,303. The racial makeup of the village was 94.3% White, 1.7% African American, 0.3% Native American, 1.2% Asian, 0.1% Pacific Islander, 1.2% from other races, and 1.4% from two or more races. Hispanic or Latino of any race were 3.3% of the population.
The median household income in the village was $50,945 and the median family income was $62,917. The per capita income for the village was $25,945. About 8.2% of families and 10.3% of the population were below the poverty line, including 14.2% of those under age 18 and 5.2% of those age 65 or over.
Common Questions
What is Per Capita Income in North Ballston Spa?
Per Capita income in North Ballston Spa is $45,726.
What is the Median Family Income in North Ballston Spa?
Median Family Income in North Ballston Spa is $95,500.
What is the Median Household income in North Ballston Spa?
Median Household Income in North Ballston Spa is $79,894.
What is Inequality or Gini Index in North Ballston Spa?
Inequality or Gini Index in North Ballston Spa is 0.27.
What is the Total Population of North Ballston Spa?
Total Population of North Ballston Spa is 1,283.
What is the Total Male Population of North Ballston Spa?
Total Male Population of North Ballston Spa is 607.
What is the Total Female Population of North Ballston Spa?
Total Female Population of North Ballston Spa is 676.
What is the Ratio of Males per 100 Females in North Ballston Spa?
There are 89.79 Males per 100 Females in North Ballston Spa.
What is the Ratio of Females per 100 Males in North Ballston Spa?
There are 111.37 Females per 100 Males in North Ballston Spa.
What is the Median Population Age in North Ballston Spa?
Median Population Age in North Ballston Spa is 52.6 Years.
What is the Average Family Size in North Ballston Spa
Average Family Size in North Ballston Spa is 2.7 People.
What is the Average Household Size in North Ballston Spa
Average Household Size in North Ballston Spa is 2.0 People.
How Large is the Labor Force in North Ballston Spa?
There are 604 People in the Labor Forcein in North Ballston Spa.
What is the Percentage of People in the Labor Force in North Ballston Spa?
52.4% of People are in the Labor Force in North Ballston Spa.
What is the Unemployment Rate in North Ballston Spa?
Unemployment Rate in North Ballston Spa is 7.6%.