Great Neck Estates, NY Map & Demographics
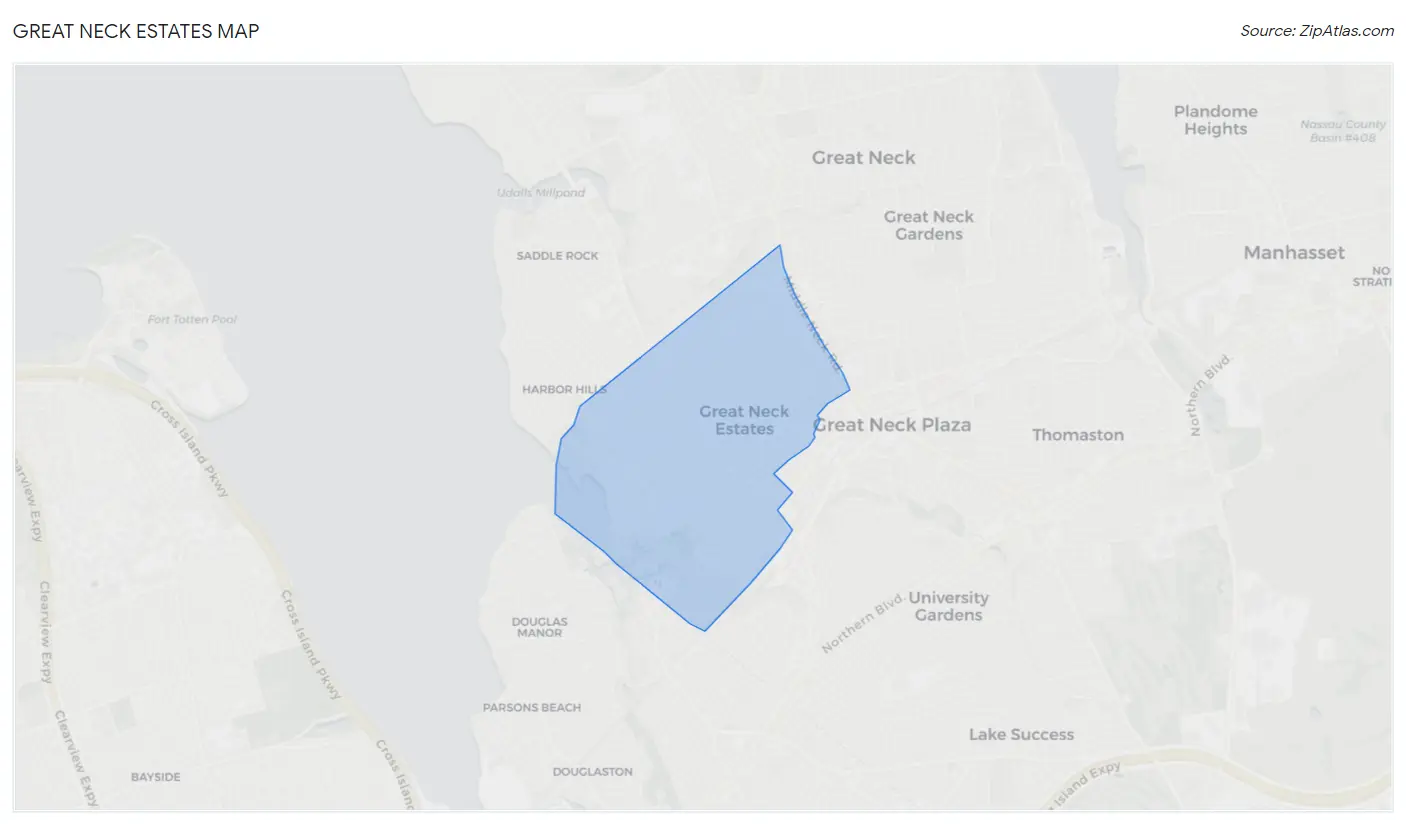
Great Neck Estates Map
Great Neck Estates Overview
$100,782
PER CAPITA INCOME
$208,819
AVG FAMILY INCOME
$175,515
AVG HOUSEHOLD INCOME
71.2%
WAGE / INCOME GAP [ % ]
28.8¢/ $1
WAGE / INCOME GAP [ $ ]
0.55
INEQUALITY / GINI INDEX
2,936
TOTAL POPULATION
1,472
MALE POPULATION
1,464
FEMALE POPULATION
100.55
MALES / 100 FEMALES
99.46
FEMALES / 100 MALES
44.3
MEDIAN AGE
3.5
AVG FAMILY SIZE
3.2
AVG HOUSEHOLD SIZE
1,356
LABOR FORCE [ PEOPLE ]
58.2%
PERCENT IN LABOR FORCE
1.4%
UNEMPLOYMENT RATE
Income in Great Neck Estates
Income Overview in Great Neck Estates
Per Capita Income in Great Neck Estates is $100,782, while median incomes of families and households are $208,819 and $175,515 respectively.
| Characteristic | Number | Measure |
| Per Capita Income | 2,936 | $100,782 |
| Median Family Income | 785 | $208,819 |
| Mean Family Income | 785 | $357,596 |
| Median Household Income | 913 | $175,515 |
| Mean Household Income | 913 | $318,641 |
| Income Deficit | 785 | $0 |
| Wage / Income Gap (%) | 2,936 | 71.16% |
| Wage / Income Gap ($) | 2,936 | 28.84¢ per $1 |
| Gini / Inequality Index | 2,936 | 0.55 |
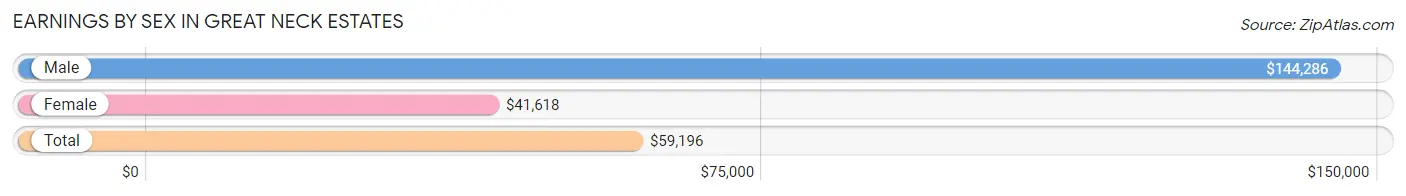
Earnings by Sex in Great Neck Estates
Average Earnings in Great Neck Estates are $59,196, $144,286 for men and $41,618 for women, a difference of 71.2%.
| Sex | Number | Average Earnings |
| Male | 832 (58.2%) | $144,286 |
| Female | 598 (41.8%) | $41,618 |
| Total | 1,430 (100.0%) | $59,196 |
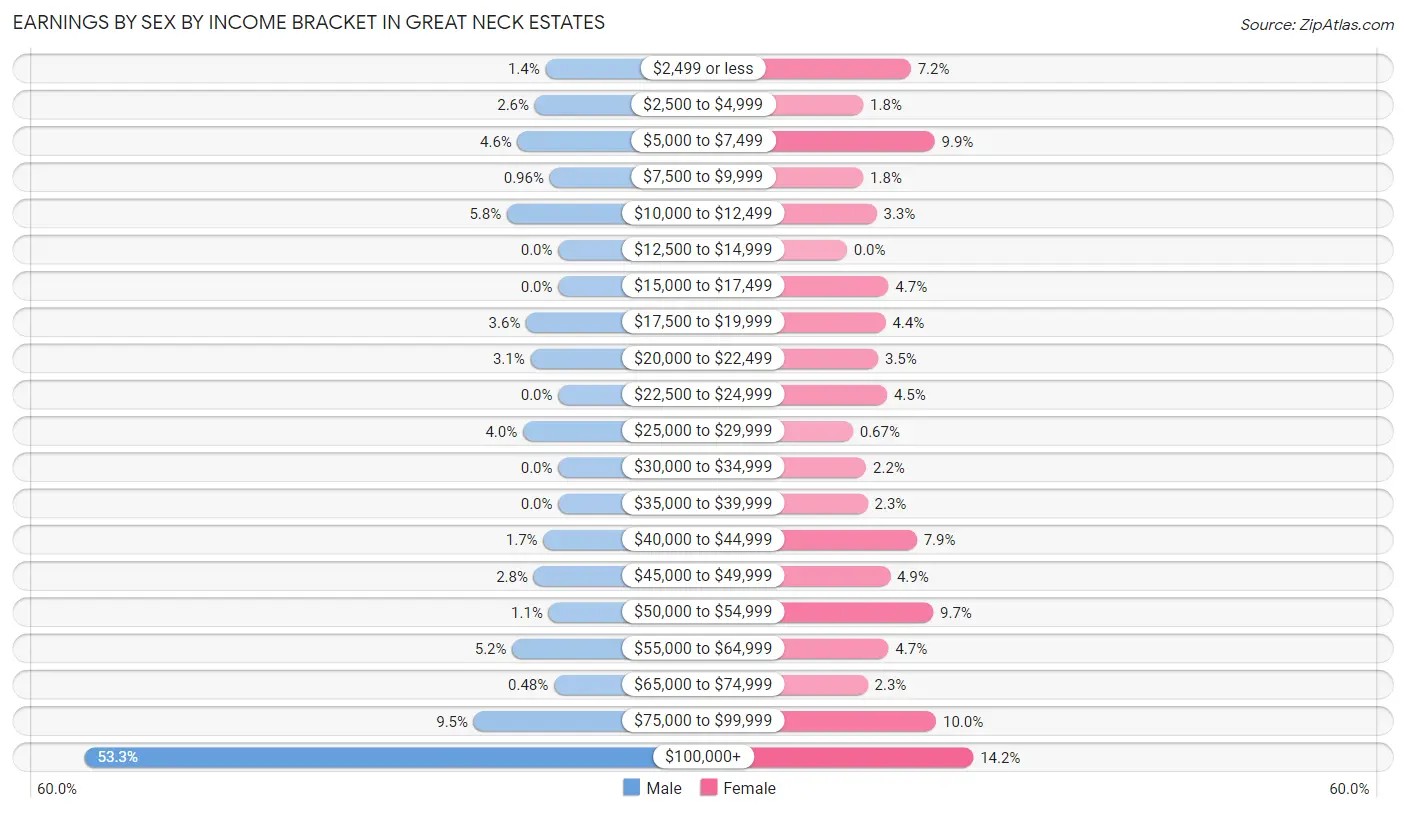
Earnings by Sex by Income Bracket in Great Neck Estates
The most common earnings brackets in Great Neck Estates are $100,000+ for men (443 | 53.2%) and $100,000+ for women (85 | 14.2%).
| Income | Male | Female |
| $2,499 or less | 12 (1.4%) | 43 (7.2%) |
| $2,500 to $4,999 | 22 (2.6%) | 11 (1.8%) |
| $5,000 to $7,499 | 38 (4.6%) | 59 (9.9%) |
| $7,500 to $9,999 | 8 (1.0%) | 11 (1.8%) |
| $10,000 to $12,499 | 48 (5.8%) | 20 (3.3%) |
| $12,500 to $14,999 | 0 (0.0%) | 0 (0.0%) |
| $15,000 to $17,499 | 0 (0.0%) | 28 (4.7%) |
| $17,500 to $19,999 | 30 (3.6%) | 26 (4.3%) |
| $20,000 to $22,499 | 26 (3.1%) | 21 (3.5%) |
| $22,500 to $24,999 | 0 (0.0%) | 27 (4.5%) |
| $25,000 to $29,999 | 33 (4.0%) | 4 (0.7%) |
| $30,000 to $34,999 | 0 (0.0%) | 13 (2.2%) |
| $35,000 to $39,999 | 0 (0.0%) | 14 (2.3%) |
| $40,000 to $44,999 | 14 (1.7%) | 47 (7.9%) |
| $45,000 to $49,999 | 23 (2.8%) | 29 (4.9%) |
| $50,000 to $54,999 | 9 (1.1%) | 58 (9.7%) |
| $55,000 to $64,999 | 43 (5.2%) | 28 (4.7%) |
| $65,000 to $74,999 | 4 (0.5%) | 14 (2.3%) |
| $75,000 to $99,999 | 79 (9.5%) | 60 (10.0%) |
| $100,000+ | 443 (53.2%) | 85 (14.2%) |
| Total | 832 (100.0%) | 598 (100.0%) |
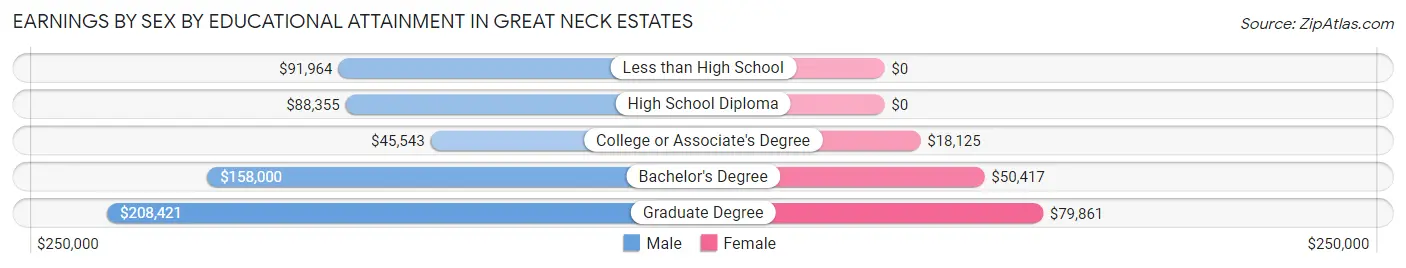
Earnings by Sex by Educational Attainment in Great Neck Estates
Average earnings in Great Neck Estates are $157,891 for men and $45,978 for women, a difference of 70.9%. Men with an educational attainment of graduate degree enjoy the highest average annual earnings of $208,421, while those with college or associate's degree education earn the least with $45,543. Women with an educational attainment of graduate degree earn the most with the average annual earnings of $79,861, while those with college or associate's degree education have the smallest earnings of $18,125.
| Educational Attainment | Male Income | Female Income |
| Less than High School | $91,964 | $0 |
| High School Diploma | $88,355 | $0 |
| College or Associate's Degree | $45,543 | $18,125 |
| Bachelor's Degree | $158,000 | $50,417 |
| Graduate Degree | $208,421 | $79,861 |
| Total | $157,891 | $45,978 |
Family Income in Great Neck Estates
Family Income Brackets in Great Neck Estates
According to the Great Neck Estates family income data, there are 407 families falling into the $200,000+ income range, which is the most common income bracket and makes up 51.8% of all families.
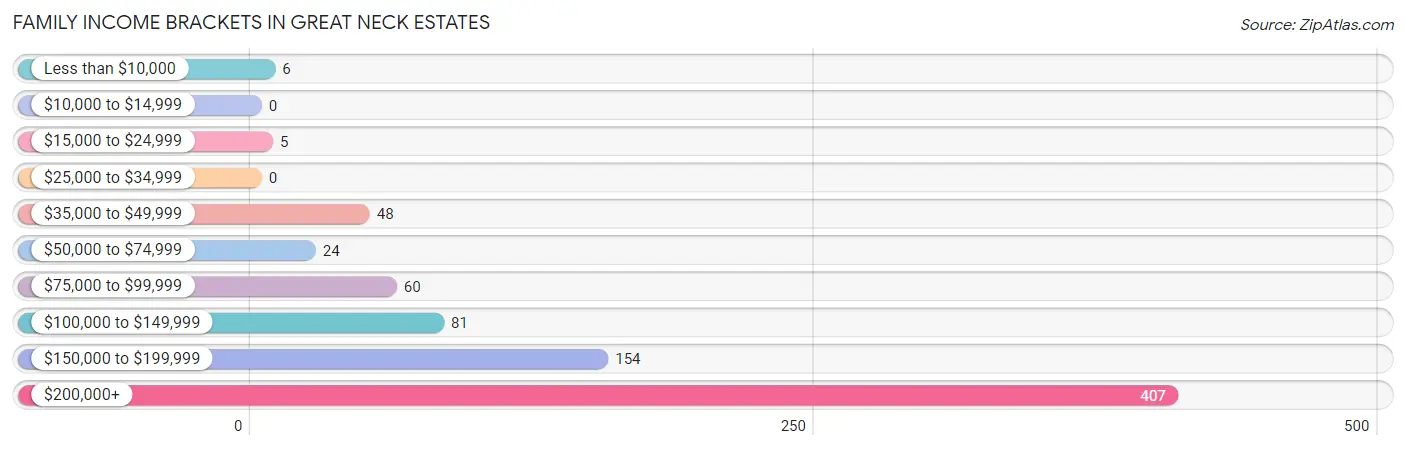
| Income Bracket | # Families | % Families |
| Less than $10,000 | 6 | 0.8% |
| $10,000 to $14,999 | 0 | 0.0% |
| $15,000 to $24,999 | 5 | 0.6% |
| $25,000 to $34,999 | 0 | 0.0% |
| $35,000 to $49,999 | 48 | 6.1% |
| $50,000 to $74,999 | 24 | 3.1% |
| $75,000 to $99,999 | 60 | 7.6% |
| $100,000 to $149,999 | 81 | 10.3% |
| $150,000 to $199,999 | 154 | 19.6% |
| $200,000+ | 407 | 51.8% |
Family Income by Famaliy Size in Great Neck Estates
5-person families (129 | 16.4%) account for the highest median family income in Great Neck Estates with $250,001 per family, while 2-person families (288 | 36.7%) have the highest median income of $87,678 per family member.
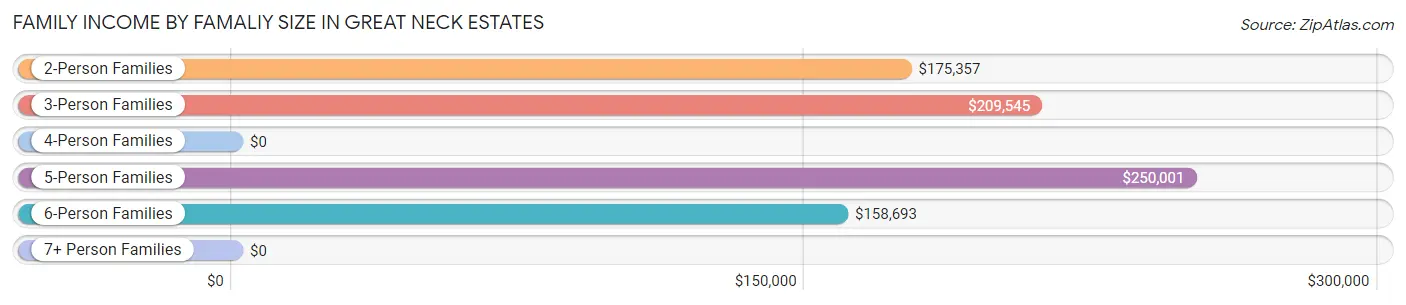
| Income Bracket | # Families | Median Income |
| 2-Person Families | 288 (36.7%) | $175,357 |
| 3-Person Families | 138 (17.6%) | $209,545 |
| 4-Person Families | 171 (21.8%) | $0 |
| 5-Person Families | 129 (16.4%) | $250,001 |
| 6-Person Families | 41 (5.2%) | $158,693 |
| 7+ Person Families | 18 (2.3%) | $0 |
| Total | 785 (100.0%) | $208,819 |
Family Income by Number of Earners in Great Neck Estates
The median family income in Great Neck Estates is $208,819, with families comprising 3+ earners (152) having the highest median family income of $250,001, while families with no earners (110) have the lowest median family income of $127,083, accounting for 19.4% and 14.0% of families, respectively.
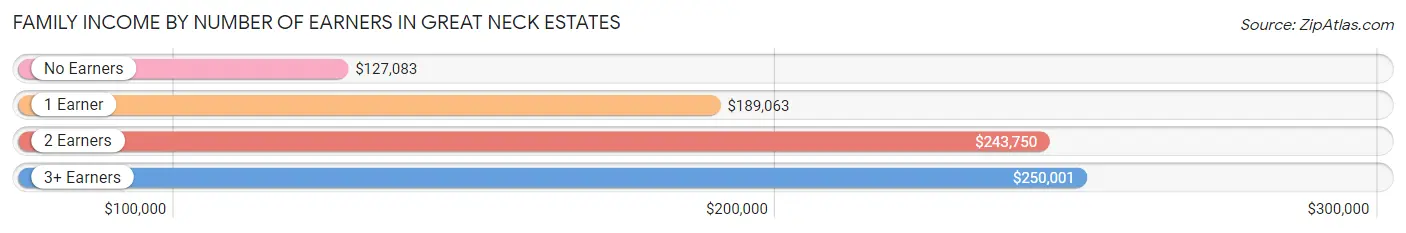
| Number of Earners | # Families | Median Income |
| No Earners | 110 (14.0%) | $127,083 |
| 1 Earner | 248 (31.6%) | $189,063 |
| 2 Earners | 275 (35.0%) | $243,750 |
| 3+ Earners | 152 (19.4%) | $250,001 |
| Total | 785 (100.0%) | $208,819 |
Household Income in Great Neck Estates
Household Income Brackets in Great Neck Estates
With 417 households falling in the category, the $200,000+ income range is the most frequent in Great Neck Estates, accounting for 45.7% of all households.
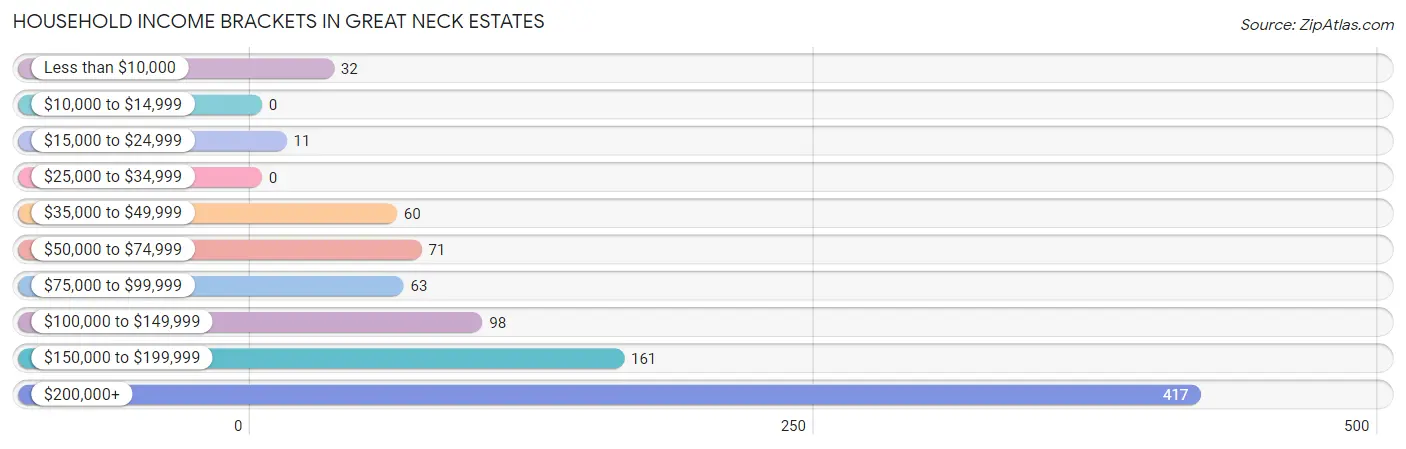
| Income Bracket | # Households | % Households |
| Less than $10,000 | 32 | 3.5% |
| $10,000 to $14,999 | 0 | 0.0% |
| $15,000 to $24,999 | 11 | 1.2% |
| $25,000 to $34,999 | 0 | 0.0% |
| $35,000 to $49,999 | 60 | 6.6% |
| $50,000 to $74,999 | 71 | 7.8% |
| $75,000 to $99,999 | 63 | 6.9% |
| $100,000 to $149,999 | 98 | 10.7% |
| $150,000 to $199,999 | 161 | 17.6% |
| $200,000+ | 417 | 45.7% |
Household Income by Householder Age in Great Neck Estates
The median household income in Great Neck Estates is $175,515, with the highest median household income of $212,500 found in the 45 to 64 years age bracket for the primary householder. A total of 378 households (41.4%) fall into this category.
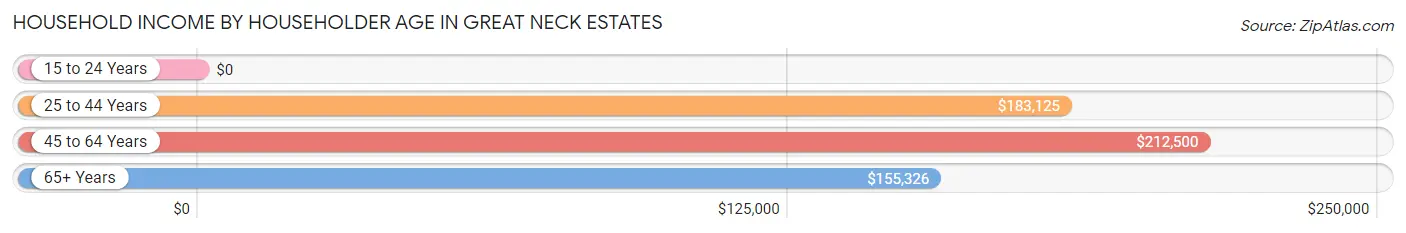
| Income Bracket | # Households | Median Income |
| 15 to 24 Years | 0 (0.0%) | $0 |
| 25 to 44 Years | 171 (18.7%) | $183,125 |
| 45 to 64 Years | 378 (41.4%) | $212,500 |
| 65+ Years | 364 (39.9%) | $155,326 |
| Total | 913 (100.0%) | $175,515 |
Poverty in Great Neck Estates
Income Below Poverty by Sex and Age in Great Neck Estates
With 1.8% poverty level for males and 2.3% for females among the residents of Great Neck Estates, 45 to 54 year old males and 75 year old and over females are the most vulnerable to poverty, with 16 males (10.9%) and 12 females (6.5%) in their respective age groups living below the poverty level.
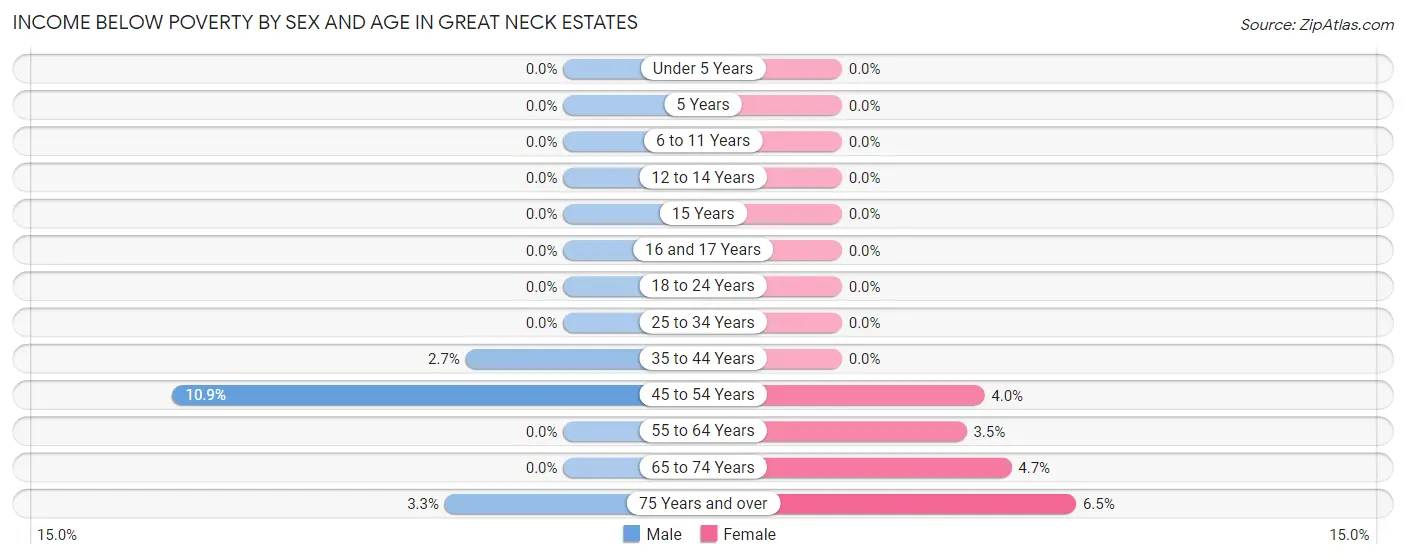
| Age Bracket | Male | Female |
| Under 5 Years | 0 (0.0%) | 0 (0.0%) |
| 5 Years | 0 (0.0%) | 0 (0.0%) |
| 6 to 11 Years | 0 (0.0%) | 0 (0.0%) |
| 12 to 14 Years | 0 (0.0%) | 0 (0.0%) |
| 15 Years | 0 (0.0%) | 0 (0.0%) |
| 16 and 17 Years | 0 (0.0%) | 0 (0.0%) |
| 18 to 24 Years | 0 (0.0%) | 0 (0.0%) |
| 25 to 34 Years | 0 (0.0%) | 0 (0.0%) |
| 35 to 44 Years | 4 (2.7%) | 0 (0.0%) |
| 45 to 54 Years | 16 (10.9%) | 11 (4.0%) |
| 55 to 64 Years | 0 (0.0%) | 5 (3.5%) |
| 65 to 74 Years | 0 (0.0%) | 6 (4.7%) |
| 75 Years and over | 6 (3.3%) | 12 (6.5%) |
| Total | 26 (1.8%) | 34 (2.3%) |
Income Above Poverty by Sex and Age in Great Neck Estates
According to the poverty statistics in Great Neck Estates, males aged under 5 years and females aged under 5 years are the age groups that are most secure financially, with 100.0% of males and 100.0% of females in these age groups living above the poverty line.
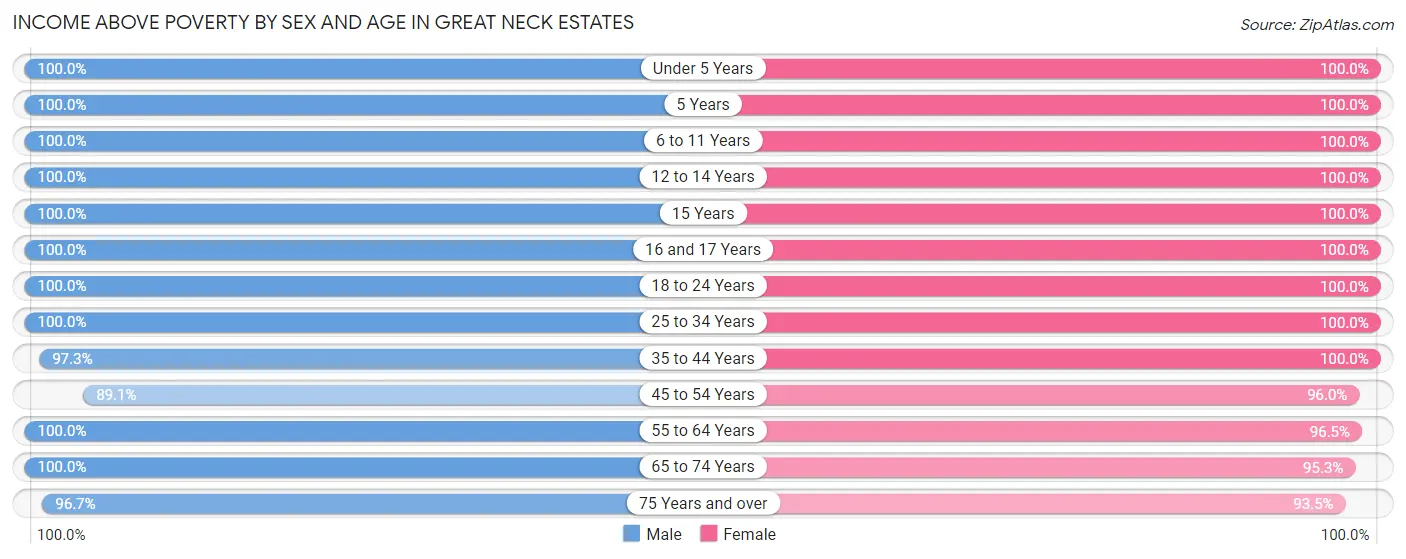
| Age Bracket | Male | Female |
| Under 5 Years | 29 (100.0%) | 66 (100.0%) |
| 5 Years | 59 (100.0%) | 33 (100.0%) |
| 6 to 11 Years | 100 (100.0%) | 132 (100.0%) |
| 12 to 14 Years | 77 (100.0%) | 49 (100.0%) |
| 15 Years | 14 (100.0%) | 47 (100.0%) |
| 16 and 17 Years | 40 (100.0%) | 60 (100.0%) |
| 18 to 24 Years | 161 (100.0%) | 94 (100.0%) |
| 25 to 34 Years | 137 (100.0%) | 73 (100.0%) |
| 35 to 44 Years | 143 (97.3%) | 178 (100.0%) |
| 45 to 54 Years | 131 (89.1%) | 266 (96.0%) |
| 55 to 64 Years | 224 (100.0%) | 139 (96.5%) |
| 65 to 74 Years | 155 (100.0%) | 121 (95.3%) |
| 75 Years and over | 176 (96.7%) | 172 (93.5%) |
| Total | 1,446 (98.2%) | 1,430 (97.7%) |
Income Below Poverty Among Married-Couple Families in Great Neck Estates
The poverty statistics for married-couple families in Great Neck Estates show that 0.8% or 6 of the total 729 families live below the poverty line. Families with no children have the highest poverty rate of 1.3%, comprising of 6 families. On the other hand, families with 1 or 2 children have the lowest poverty rate of 0.0%, which includes 0 families.
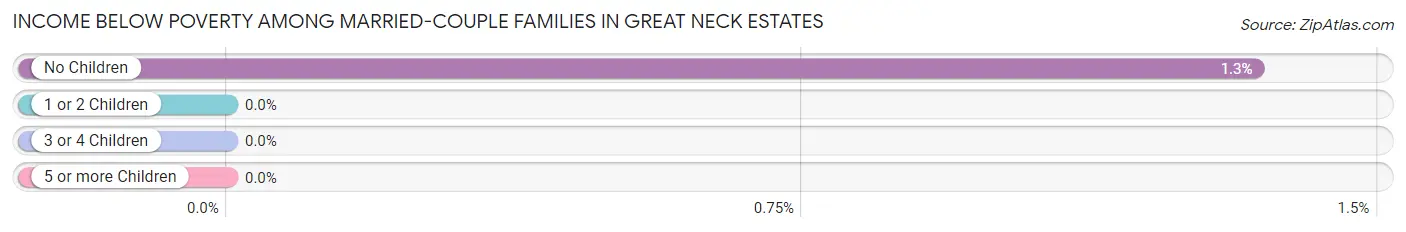
| Children | Above Poverty | Below Poverty |
| No Children | 442 (98.7%) | 6 (1.3%) |
| 1 or 2 Children | 152 (100.0%) | 0 (0.0%) |
| 3 or 4 Children | 117 (100.0%) | 0 (0.0%) |
| 5 or more Children | 12 (100.0%) | 0 (0.0%) |
| Total | 723 (99.2%) | 6 (0.8%) |
Income Below Poverty Among Single-Parent Households in Great Neck Estates
| Children | Single Father | Single Mother |
| No Children | 0 (0.0%) | 0 (0.0%) |
| 1 or 2 Children | 0 (0.0%) | 0 (0.0%) |
| 3 or 4 Children | 0 (0.0%) | 0 (0.0%) |
| 5 or more Children | 0 (0.0%) | 0 (0.0%) |
| Total | 0 (0.0%) | 0 (0.0%) |
Income Below Poverty Among Married-Couple vs Single-Parent Households in Great Neck Estates
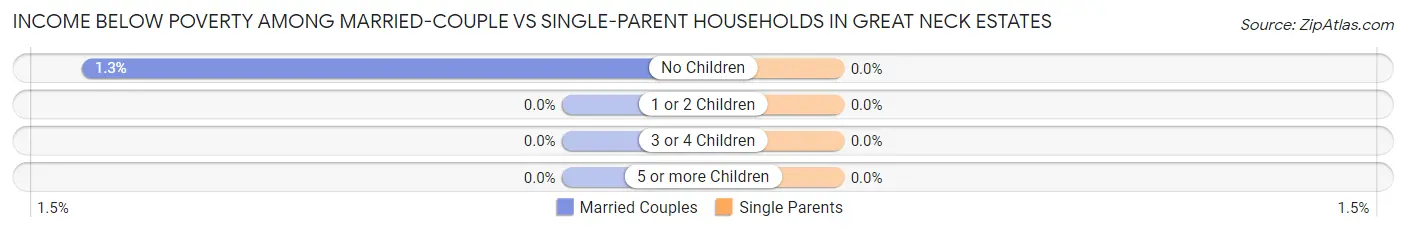
| Children | Married-Couple Families | Single-Parent Households |
| No Children | 6 (1.3%) | 0 (0.0%) |
| 1 or 2 Children | 0 (0.0%) | 0 (0.0%) |
| 3 or 4 Children | 0 (0.0%) | 0 (0.0%) |
| 5 or more Children | 0 (0.0%) | 0 (0.0%) |
| Total | 6 (0.8%) | 0 (0.0%) |
Race in Great Neck Estates
The most populous races in Great Neck Estates are White / Caucasian (2,176 | 74.1%), Asian (518 | 17.6%), and Native / Alaskan (143 | 4.9%).
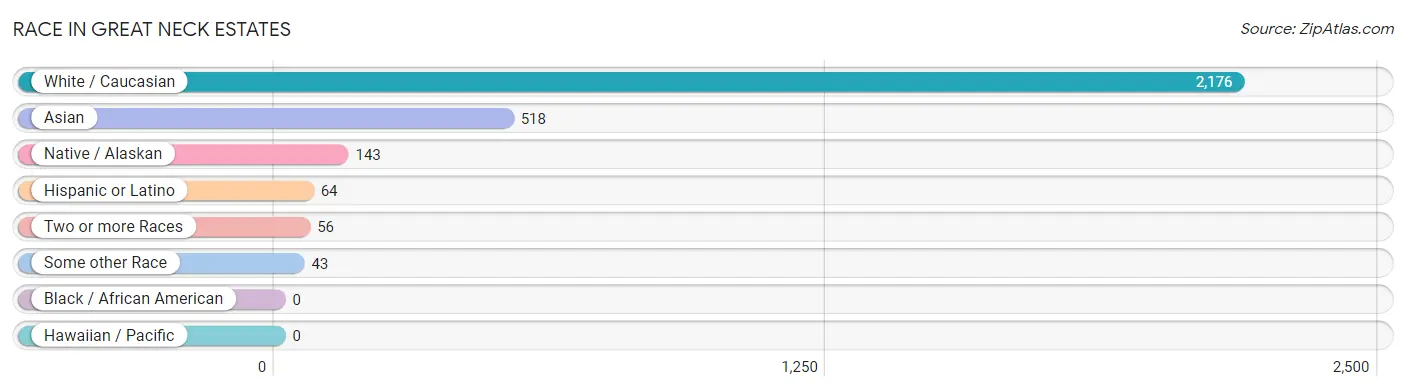
| Race | # Population | % Population |
| Asian | 518 | 17.6% |
| Black / African American | 0 | 0.0% |
| Hawaiian / Pacific | 0 | 0.0% |
| Hispanic or Latino | 64 | 2.2% |
| Native / Alaskan | 143 | 4.9% |
| White / Caucasian | 2,176 | 74.1% |
| Two or more Races | 56 | 1.9% |
| Some other Race | 43 | 1.5% |
| Total | 2,936 | 100.0% |
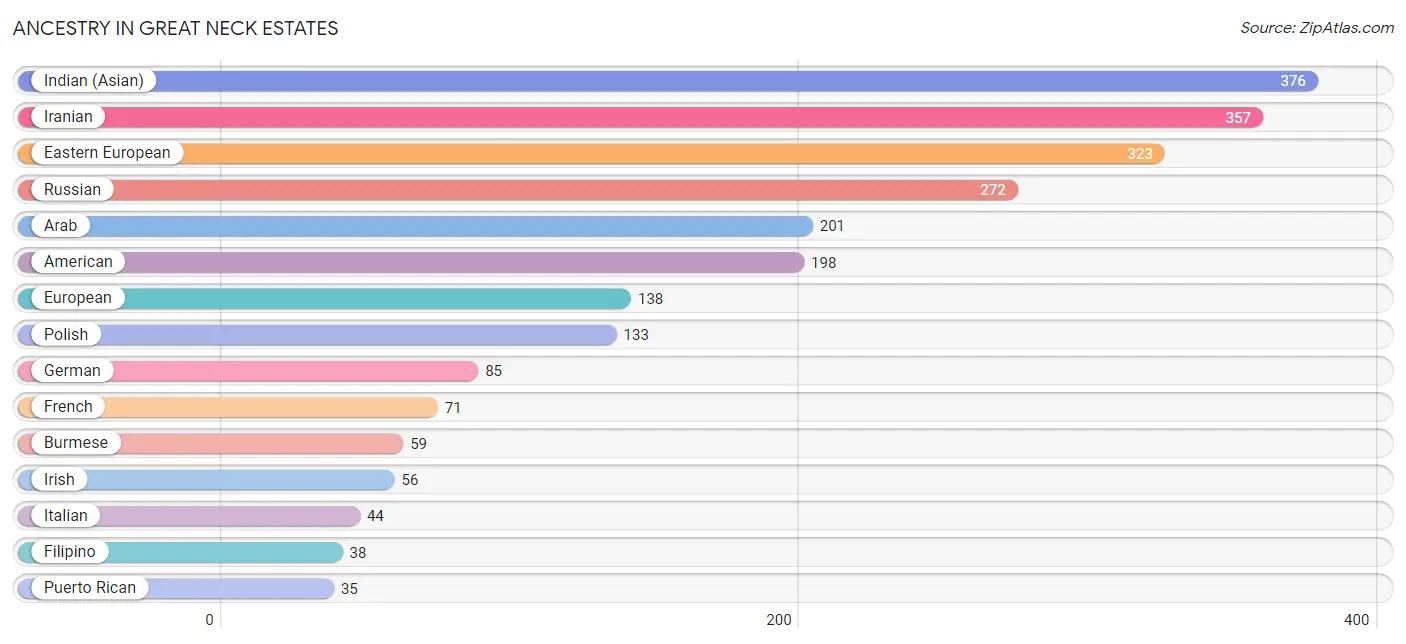
Ancestry in Great Neck Estates
The most populous ancestries reported in Great Neck Estates are Indian (Asian) (376 | 12.8%), Iranian (357 | 12.2%), Eastern European (323 | 11.0%), Russian (272 | 9.3%), and Arab (201 | 6.9%), together accounting for 52.1% of all Great Neck Estates residents.
| Ancestry | # Population | % Population |
| American | 198 | 6.7% |
| Arab | 201 | 6.9% |
| Argentinean | 13 | 0.4% |
| Austrian | 24 | 0.8% |
| Burmese | 59 | 2.0% |
| Danish | 6 | 0.2% |
| Dominican | 8 | 0.3% |
| Dutch | 7 | 0.2% |
| Eastern European | 323 | 11.0% |
| Egyptian | 16 | 0.5% |
| English | 7 | 0.2% |
| European | 138 | 4.7% |
| Filipino | 38 | 1.3% |
| French | 71 | 2.4% |
| German | 85 | 2.9% |
| Greek | 8 | 0.3% |
| Guyanese | 6 | 0.2% |
| Hungarian | 13 | 0.4% |
| Indian (Asian) | 376 | 12.8% |
| Indonesian | 10 | 0.3% |
| Iranian | 357 | 12.2% |
| Iraqi | 8 | 0.3% |
| Irish | 56 | 1.9% |
| Israeli | 7 | 0.2% |
| Italian | 44 | 1.5% |
| Korean | 8 | 0.3% |
| Latvian | 18 | 0.6% |
| Native Hawaiian | 30 | 1.0% |
| Norwegian | 6 | 0.2% |
| Polish | 133 | 4.5% |
| Puerto Rican | 35 | 1.2% |
| Romanian | 16 | 0.5% |
| Russian | 272 | 9.3% |
| South African | 21 | 0.7% |
| South American | 13 | 0.4% |
| Subsaharan African | 21 | 0.7% |
| Ukrainian | 21 | 0.7% | View All 37 Rows |
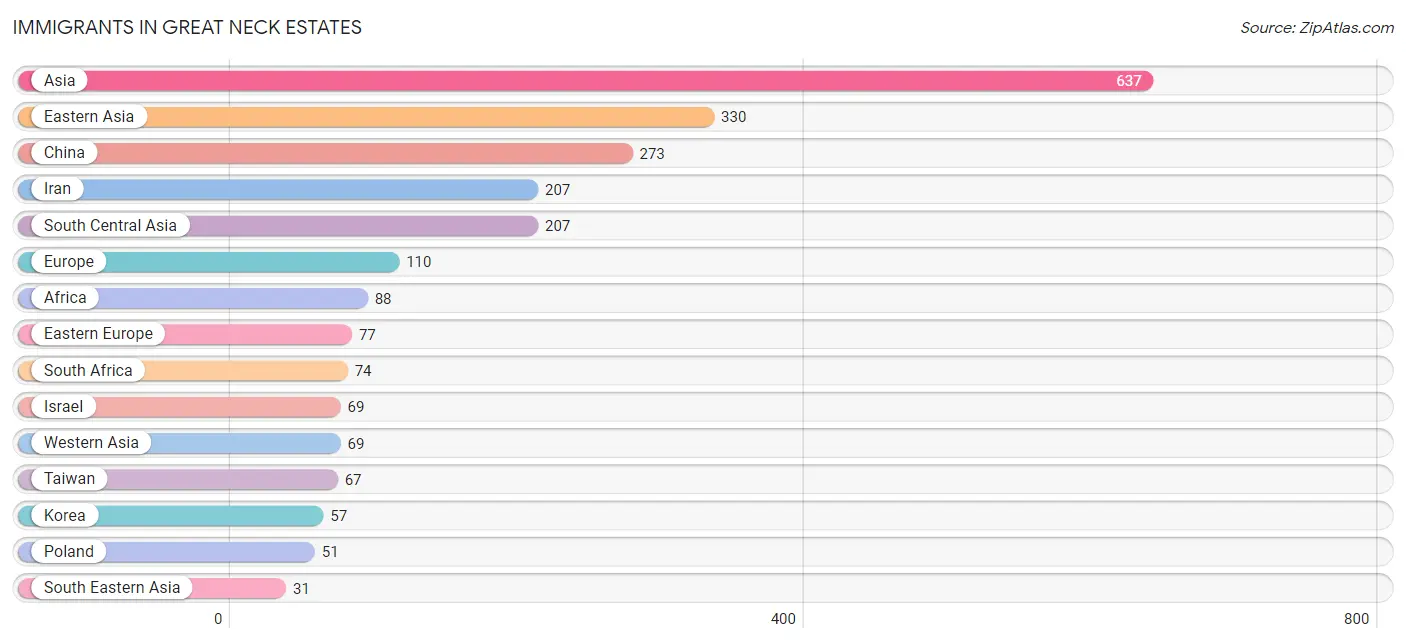
Immigrants in Great Neck Estates
The most numerous immigrant groups reported in Great Neck Estates came from Asia (637 | 21.7%), Eastern Asia (330 | 11.2%), China (273 | 9.3%), Iran (207 | 7.0%), and South Central Asia (207 | 7.0%), together accounting for 56.3% of all Great Neck Estates residents.
| Immigration Origin | # Population | % Population |
| Africa | 88 | 3.0% |
| Argentina | 13 | 0.4% |
| Asia | 637 | 21.7% |
| Caribbean | 6 | 0.2% |
| China | 273 | 9.3% |
| Dominican Republic | 6 | 0.2% |
| Eastern Africa | 6 | 0.2% |
| Eastern Asia | 330 | 11.2% |
| Eastern Europe | 77 | 2.6% |
| Egypt | 8 | 0.3% |
| Europe | 110 | 3.7% |
| Germany | 12 | 0.4% |
| Greece | 8 | 0.3% |
| Guyana | 6 | 0.2% |
| Hong Kong | 4 | 0.1% |
| Indonesia | 26 | 0.9% |
| Iran | 207 | 7.0% |
| Israel | 69 | 2.4% |
| Korea | 57 | 1.9% |
| Latin America | 25 | 0.9% |
| Northern Africa | 8 | 0.3% |
| Northern Europe | 13 | 0.4% |
| Poland | 51 | 1.7% |
| Romania | 10 | 0.3% |
| South Africa | 74 | 2.5% |
| South America | 19 | 0.6% |
| South Central Asia | 207 | 7.0% |
| South Eastern Asia | 31 | 1.1% |
| Southern Europe | 8 | 0.3% |
| Sweden | 6 | 0.2% |
| Taiwan | 67 | 2.3% |
| Ukraine | 16 | 0.5% |
| Western Asia | 69 | 2.4% |
| Western Europe | 12 | 0.4% |
| Zimbabwe | 6 | 0.2% | View All 35 Rows |
Sex and Age in Great Neck Estates
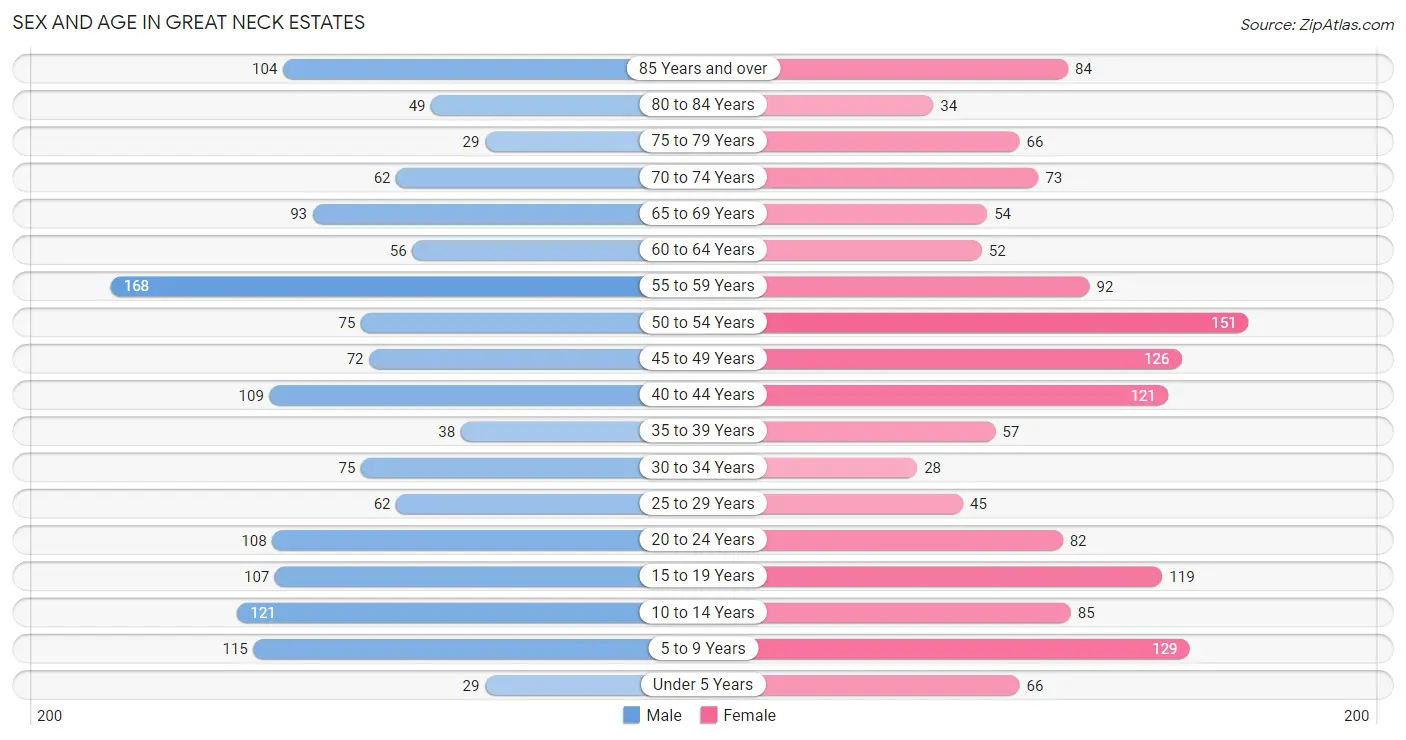
Sex and Age in Great Neck Estates
The most populous age groups in Great Neck Estates are 55 to 59 Years (168 | 11.4%) for men and 50 to 54 Years (151 | 10.3%) for women.
| Age Bracket | Male | Female |
| Under 5 Years | 29 (2.0%) | 66 (4.5%) |
| 5 to 9 Years | 115 (7.8%) | 129 (8.8%) |
| 10 to 14 Years | 121 (8.2%) | 85 (5.8%) |
| 15 to 19 Years | 107 (7.3%) | 119 (8.1%) |
| 20 to 24 Years | 108 (7.3%) | 82 (5.6%) |
| 25 to 29 Years | 62 (4.2%) | 45 (3.1%) |
| 30 to 34 Years | 75 (5.1%) | 28 (1.9%) |
| 35 to 39 Years | 38 (2.6%) | 57 (3.9%) |
| 40 to 44 Years | 109 (7.4%) | 121 (8.3%) |
| 45 to 49 Years | 72 (4.9%) | 126 (8.6%) |
| 50 to 54 Years | 75 (5.1%) | 151 (10.3%) |
| 55 to 59 Years | 168 (11.4%) | 92 (6.3%) |
| 60 to 64 Years | 56 (3.8%) | 52 (3.5%) |
| 65 to 69 Years | 93 (6.3%) | 54 (3.7%) |
| 70 to 74 Years | 62 (4.2%) | 73 (5.0%) |
| 75 to 79 Years | 29 (2.0%) | 66 (4.5%) |
| 80 to 84 Years | 49 (3.3%) | 34 (2.3%) |
| 85 Years and over | 104 (7.1%) | 84 (5.7%) |
| Total | 1,472 (100.0%) | 1,464 (100.0%) |
Families and Households in Great Neck Estates
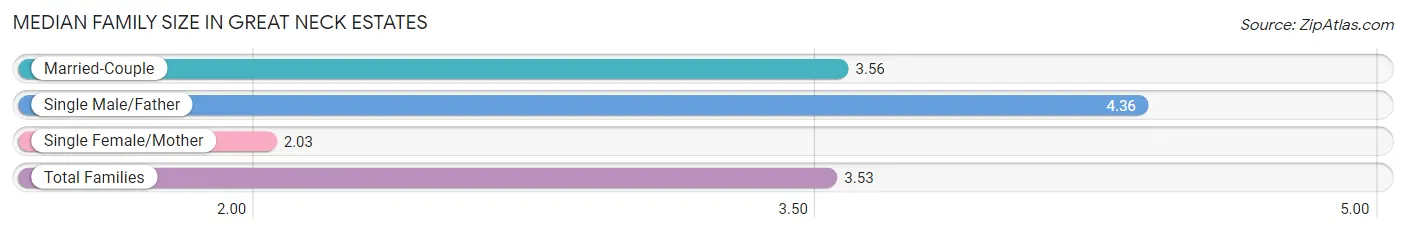
Median Family Size in Great Neck Estates
The median family size in Great Neck Estates is 3.53 persons per family, with single male/father families (25 | 3.2%) accounting for the largest median family size of 4.36 persons per family. On the other hand, single female/mother families (31 | 4.0%) represent the smallest median family size with 2.03 persons per family.
| Family Type | # Families | Family Size |
| Married-Couple | 729 (92.9%) | 3.56 |
| Single Male/Father | 25 (3.2%) | 4.36 |
| Single Female/Mother | 31 (4.0%) | 2.03 |
| Total Families | 785 (100.0%) | 3.53 |
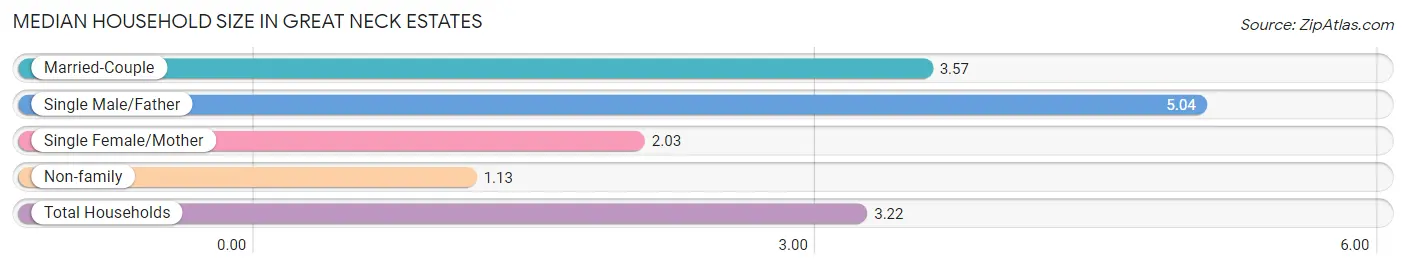
Median Household Size in Great Neck Estates
The median household size in Great Neck Estates is 3.22 persons per household, with single male/father households (25 | 2.7%) accounting for the largest median household size of 5.04 persons per household. non-family households (128 | 14.0%) represent the smallest median household size with 1.13 persons per household.
| Household Type | # Households | Household Size |
| Married-Couple | 729 (79.8%) | 3.57 |
| Single Male/Father | 25 (2.7%) | 5.04 |
| Single Female/Mother | 31 (3.4%) | 2.03 |
| Non-family | 128 (14.0%) | 1.13 |
| Total Households | 913 (100.0%) | 3.22 |
Household Size by Marriage Status in Great Neck Estates
Out of a total of 913 households in Great Neck Estates, 785 (86.0%) are family households, while 128 (14.0%) are nonfamily households. The most numerous type of family households are 2-person households, comprising 288, and the most common type of nonfamily households are 1-person households, comprising 112.
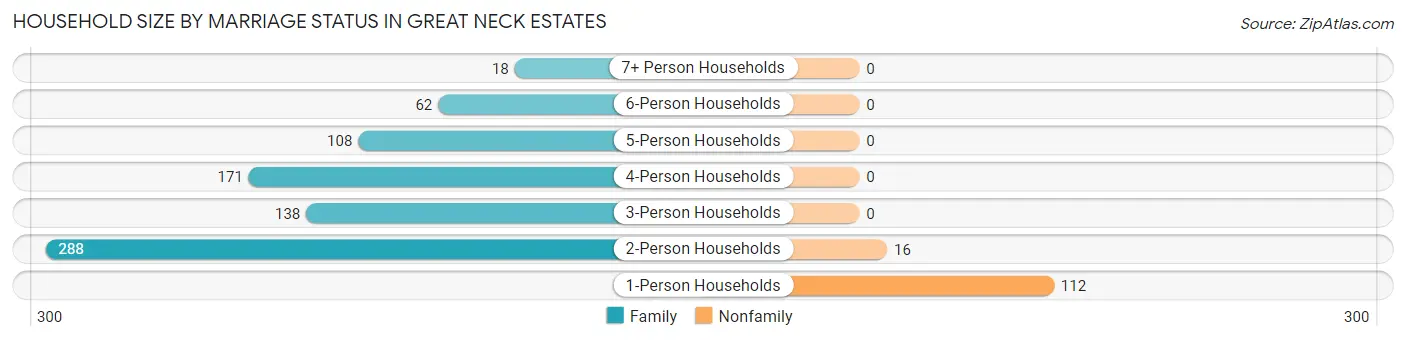
| Household Size | Family Households | Nonfamily Households |
| 1-Person Households | - | 112 (12.3%) |
| 2-Person Households | 288 (31.5%) | 16 (1.8%) |
| 3-Person Households | 138 (15.1%) | 0 (0.0%) |
| 4-Person Households | 171 (18.7%) | 0 (0.0%) |
| 5-Person Households | 108 (11.8%) | 0 (0.0%) |
| 6-Person Households | 62 (6.8%) | 0 (0.0%) |
| 7+ Person Households | 18 (2.0%) | 0 (0.0%) |
| Total | 785 (86.0%) | 128 (14.0%) |
Female Fertility in Great Neck Estates
Fertility by Age in Great Neck Estates
Average fertility rate in Great Neck Estates is 104.0 births per 1,000 women. Women in the age bracket of 35 to 50 years have the highest fertility rate with 193.0 births per 1,000 women. Women in the age bracket of 35 to 50 years acount for 100.0% of all women with births.
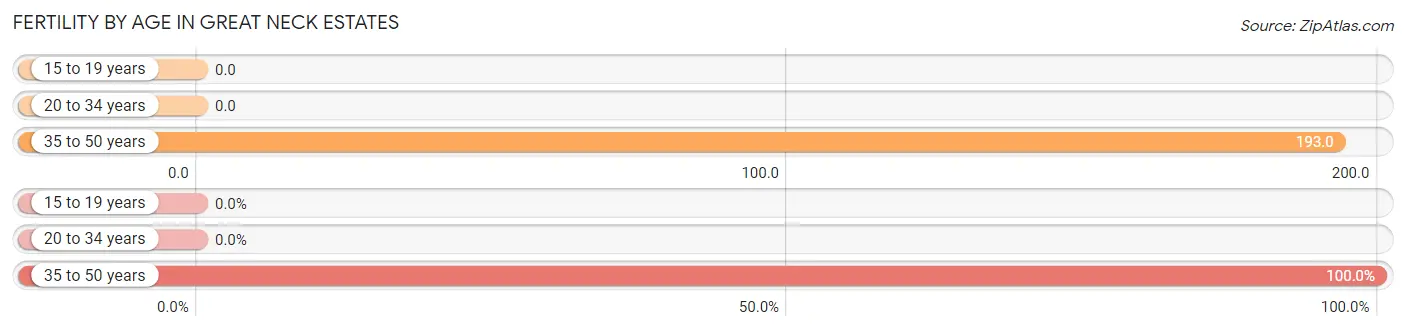
| Age Bracket | Women with Births | Births / 1,000 Women |
| 15 to 19 years | 0 (0.0%) | 0.0 |
| 20 to 34 years | 0 (0.0%) | 0.0 |
| 35 to 50 years | 62 (100.0%) | 193.0 |
| Total | 62 (100.0%) | 104.0 |
Fertility by Age by Marriage Status in Great Neck Estates
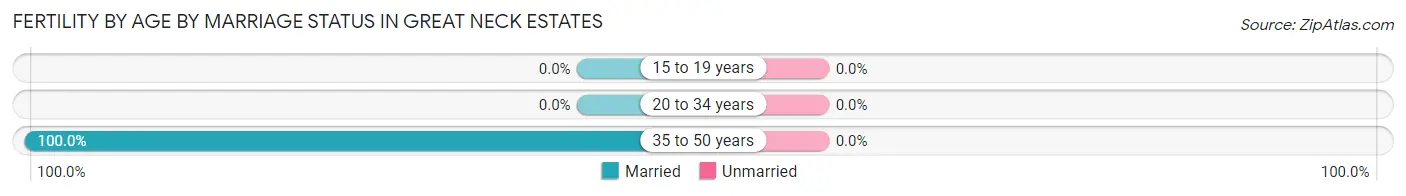
| Age Bracket | Married | Unmarried |
| 15 to 19 years | 0 (0.0%) | 0 (0.0%) |
| 20 to 34 years | 0 (0.0%) | 0 (0.0%) |
| 35 to 50 years | 62 (100.0%) | 0 (0.0%) |
| Total | 62 (100.0%) | 0 (0.0%) |
Fertility by Education in Great Neck Estates
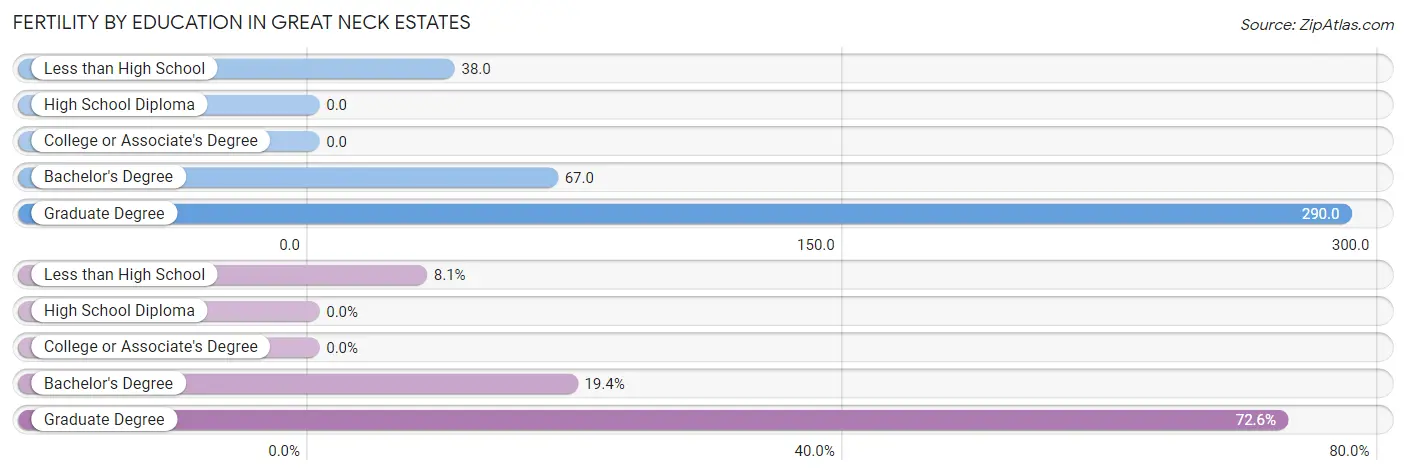
| Educational Attainment | Women with Births | Births / 1,000 Women |
| Less than High School | 5 (8.1%) | 38.0 |
| High School Diploma | 0 (0.0%) | 0.0 |
| College or Associate's Degree | 0 (0.0%) | 0.0 |
| Bachelor's Degree | 12 (19.4%) | 67.0 |
| Graduate Degree | 45 (72.6%) | 290.0 |
| Total | 62 (100.0%) | 104.0 |
Fertility by Education by Marriage Status in Great Neck Estates
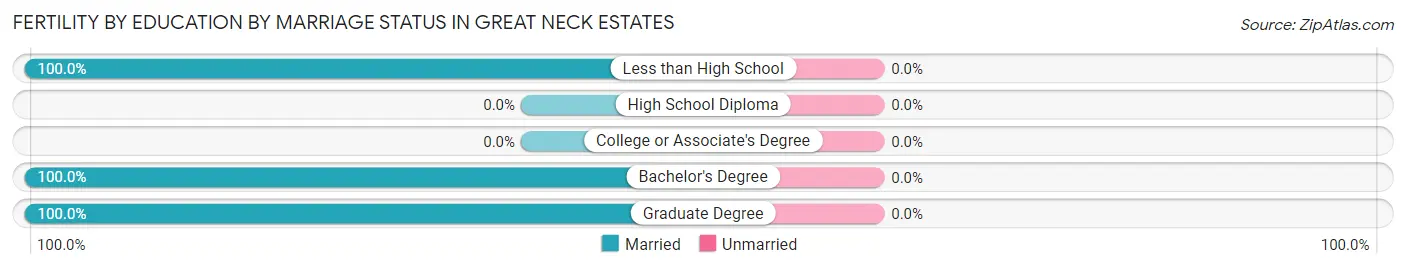
| Educational Attainment | Married | Unmarried |
| Less than High School | 5 (100.0%) | 0 (0.0%) |
| High School Diploma | 0 (0.0%) | 0 (0.0%) |
| College or Associate's Degree | 0 (0.0%) | 0 (0.0%) |
| Bachelor's Degree | 12 (100.0%) | 0 (0.0%) |
| Graduate Degree | 45 (100.0%) | 0 (0.0%) |
| Total | 62 (100.0%) | 0 (0.0%) |
Employment Characteristics in Great Neck Estates
Employment by Class of Employer in Great Neck Estates
Among the 1,312 employed individuals in Great Neck Estates, private company employees (716 | 54.6%), not-for-profit organizations (191 | 14.6%), and self-employed (incorporated) (161 | 12.3%) make up the most common classes of employment.
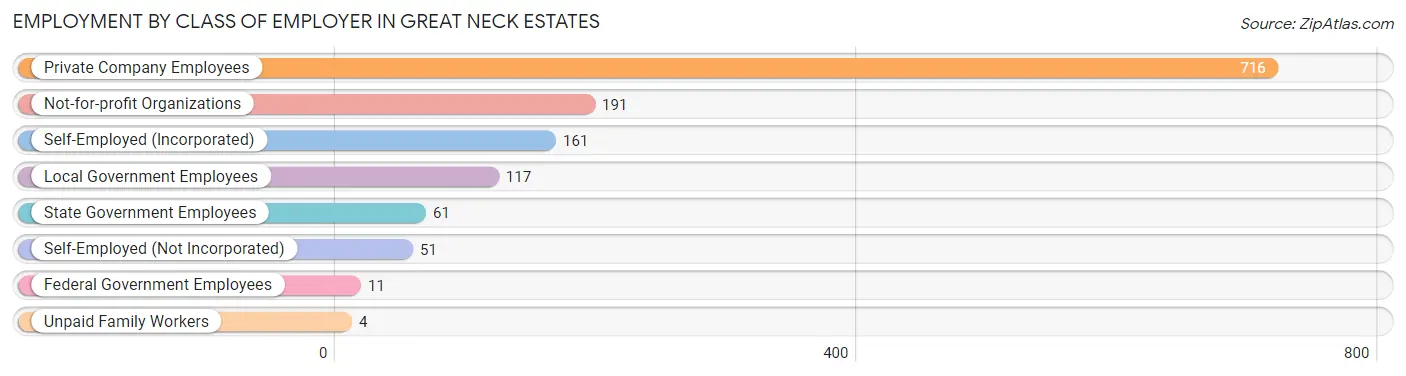
| Employer Class | # Employees | % Employees |
| Private Company Employees | 716 | 54.6% |
| Self-Employed (Incorporated) | 161 | 12.3% |
| Self-Employed (Not Incorporated) | 51 | 3.9% |
| Not-for-profit Organizations | 191 | 14.6% |
| Local Government Employees | 117 | 8.9% |
| State Government Employees | 61 | 4.6% |
| Federal Government Employees | 11 | 0.8% |
| Unpaid Family Workers | 4 | 0.3% |
| Total | 1,312 | 100.0% |
Employment Status by Age in Great Neck Estates
According to the labor force statistics for Great Neck Estates, out of the total population over 16 years of age (2,330), 58.2% or 1,356 individuals are in the labor force, with 1.4% or 19 of them unemployed. The age group with the highest labor force participation rate is 55 to 59 years, with 93.1% or 242 individuals in the labor force. Within the labor force, the 55 to 59 years age range has the highest percentage of unemployed individuals, with 4.1% or 10 of them being unemployed.
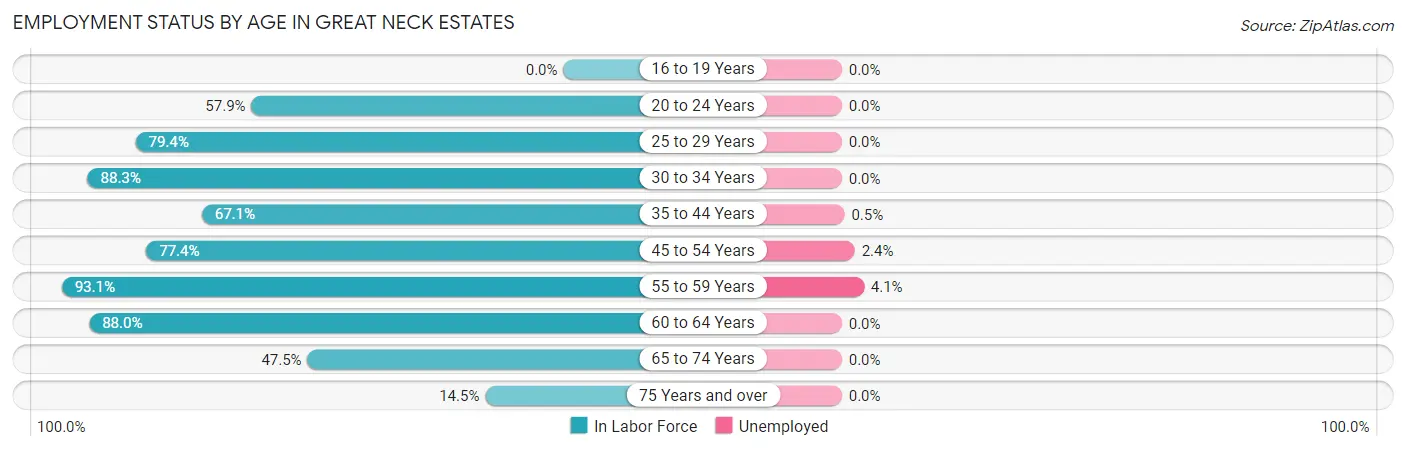
| Age Bracket | In Labor Force | Unemployed |
| 16 to 19 Years | 0 (0.0%) | 0 (0.0%) |
| 20 to 24 Years | 110 (57.9%) | 0 (0.0%) |
| 25 to 29 Years | 85 (79.4%) | 0 (0.0%) |
| 30 to 34 Years | 91 (88.3%) | 0 (0.0%) |
| 35 to 44 Years | 218 (67.1%) | 1 (0.5%) |
| 45 to 54 Years | 328 (77.4%) | 8 (2.4%) |
| 55 to 59 Years | 242 (93.1%) | 10 (4.1%) |
| 60 to 64 Years | 95 (88.0%) | 0 (0.0%) |
| 65 to 74 Years | 134 (47.5%) | 0 (0.0%) |
| 75 Years and over | 53 (14.5%) | 0 (0.0%) |
| Total | 1,356 (58.2%) | 19 (1.4%) |
Employment Status by Educational Attainment in Great Neck Estates
According to labor force statistics for Great Neck Estates, 79.8% of individuals (1,059) out of the total population between 25 and 64 years of age (1,327) are in the labor force, with 1.8% or 19 of them being unemployed. The group with the highest labor force participation rate are those with the educational attainment of college / associate degree, with 85.7% or 156 individuals in the labor force. Within the labor force, individuals with college / associate degree education have the highest percentage of unemployment, with 5.1% or 8 of them being unemployed.
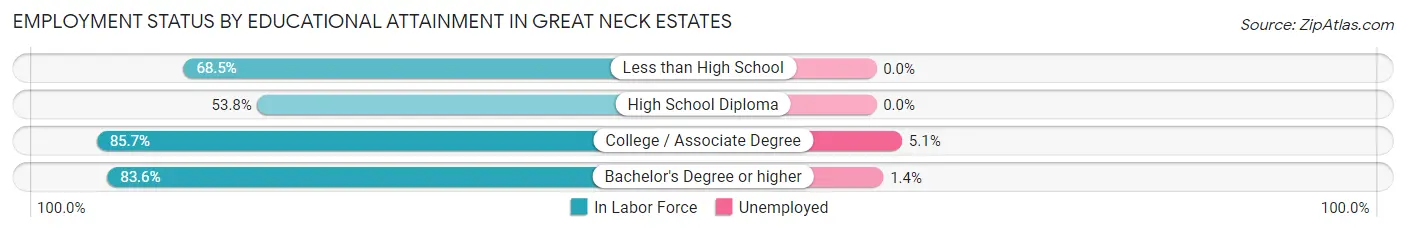
| Educational Attainment | In Labor Force | Unemployed |
| Less than High School | 37 (68.5%) | 0 (0.0%) |
| High School Diploma | 84 (53.8%) | 0 (0.0%) |
| College / Associate Degree | 156 (85.7%) | 9 (5.1%) |
| Bachelor's Degree or higher | 782 (83.6%) | 13 (1.4%) |
| Total | 1,059 (79.8%) | 24 (1.8%) |
Employment Occupations by Sex in Great Neck Estates
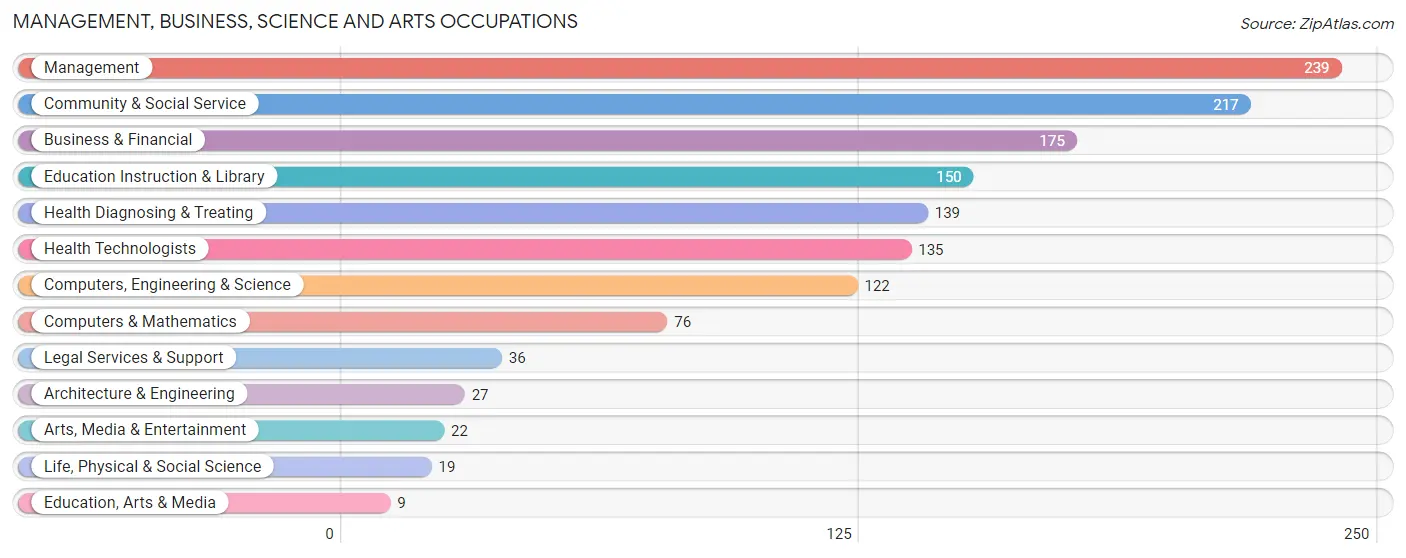
Management, Business, Science and Arts Occupations
The most common Management, Business, Science and Arts occupations in Great Neck Estates are Management (239 | 17.9%), Community & Social Service (217 | 16.2%), Business & Financial (175 | 13.1%), Education Instruction & Library (150 | 11.2%), and Health Diagnosing & Treating (139 | 10.4%).
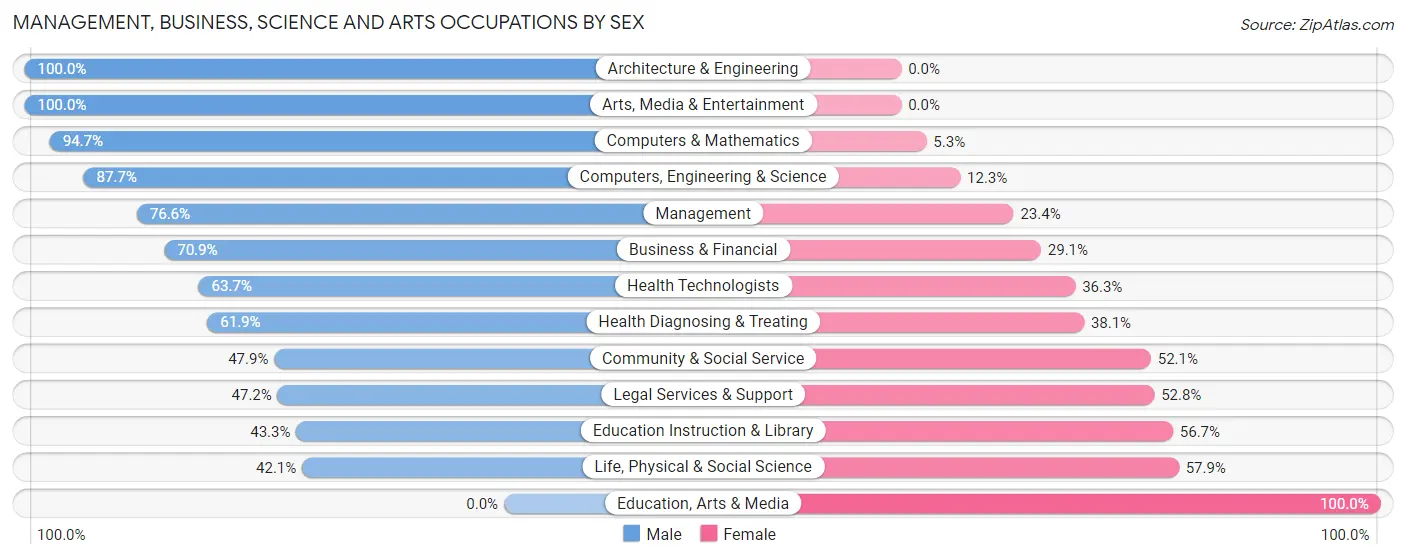
Management, Business, Science and Arts Occupations by Sex
Within the Management, Business, Science and Arts occupations in Great Neck Estates, the most male-oriented occupations are Architecture & Engineering (100.0%), Arts, Media & Entertainment (100.0%), and Computers & Mathematics (94.7%), while the most female-oriented occupations are Education, Arts & Media (100.0%), Life, Physical & Social Science (57.9%), and Education Instruction & Library (56.7%).
| Occupation | Male | Female |
| Management | 183 (76.6%) | 56 (23.4%) |
| Business & Financial | 124 (70.9%) | 51 (29.1%) |
| Computers, Engineering & Science | 107 (87.7%) | 15 (12.3%) |
| Computers & Mathematics | 72 (94.7%) | 4 (5.3%) |
| Architecture & Engineering | 27 (100.0%) | 0 (0.0%) |
| Life, Physical & Social Science | 8 (42.1%) | 11 (57.9%) |
| Community & Social Service | 104 (47.9%) | 113 (52.1%) |
| Education, Arts & Media | 0 (0.0%) | 9 (100.0%) |
| Legal Services & Support | 17 (47.2%) | 19 (52.8%) |
| Education Instruction & Library | 65 (43.3%) | 85 (56.7%) |
| Arts, Media & Entertainment | 22 (100.0%) | 0 (0.0%) |
| Health Diagnosing & Treating | 86 (61.9%) | 53 (38.1%) |
| Health Technologists | 86 (63.7%) | 49 (36.3%) |
| Total (Category) | 604 (67.7%) | 288 (32.3%) |
| Total (Overall) | 823 (61.6%) | 514 (38.4%) |
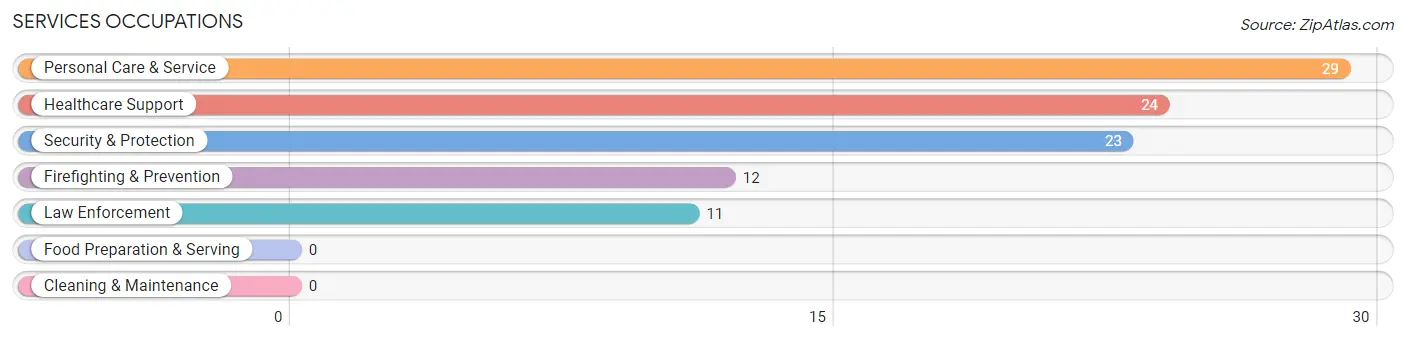
Services Occupations
The most common Services occupations in Great Neck Estates are Personal Care & Service (29 | 2.2%), Healthcare Support (24 | 1.8%), Security & Protection (23 | 1.7%), Firefighting & Prevention (12 | 0.9%), and Law Enforcement (11 | 0.8%).
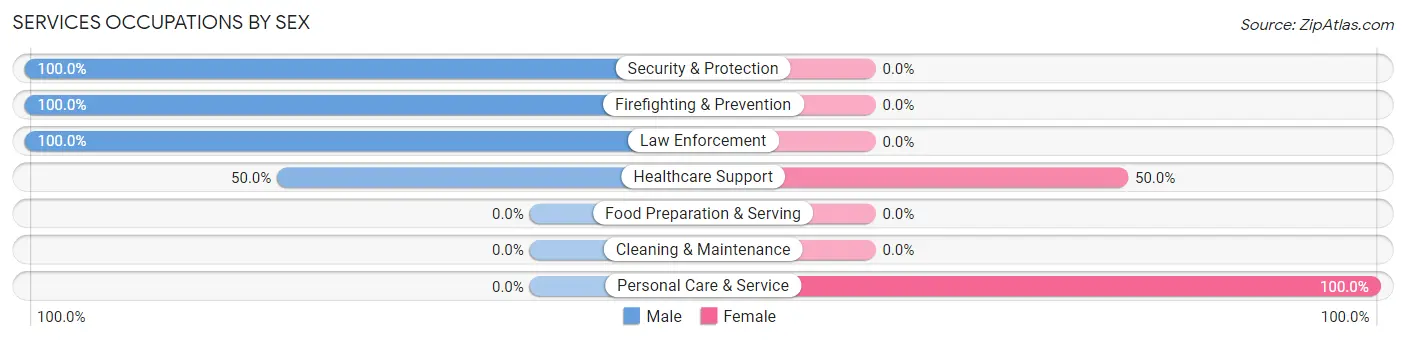
Services Occupations by Sex
Within the Services occupations in Great Neck Estates, the most male-oriented occupations are Security & Protection (100.0%), Firefighting & Prevention (100.0%), and Law Enforcement (100.0%), while the most female-oriented occupations are Personal Care & Service (100.0%), and Healthcare Support (50.0%).
| Occupation | Male | Female |
| Healthcare Support | 12 (50.0%) | 12 (50.0%) |
| Security & Protection | 23 (100.0%) | 0 (0.0%) |
| Firefighting & Prevention | 12 (100.0%) | 0 (0.0%) |
| Law Enforcement | 11 (100.0%) | 0 (0.0%) |
| Food Preparation & Serving | 0 (0.0%) | 0 (0.0%) |
| Cleaning & Maintenance | 0 (0.0%) | 0 (0.0%) |
| Personal Care & Service | 0 (0.0%) | 29 (100.0%) |
| Total (Category) | 35 (46.1%) | 41 (53.9%) |
| Total (Overall) | 823 (61.6%) | 514 (38.4%) |
Sales and Office Occupations
The most common Sales and Office occupations in Great Neck Estates are Sales & Related (171 | 12.8%), and Office & Administration (89 | 6.7%).
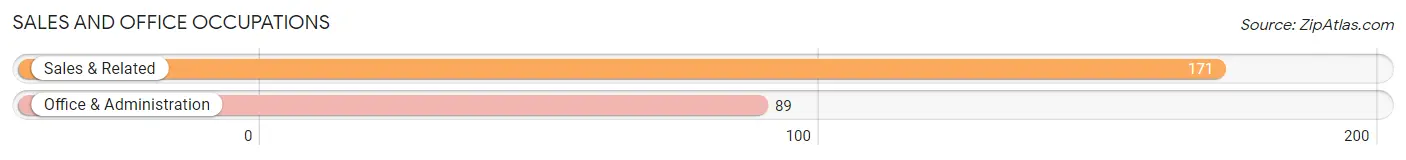
Sales and Office Occupations by Sex

| Occupation | Male | Female |
| Sales & Related | 96 (56.1%) | 75 (43.9%) |
| Office & Administration | 0 (0.0%) | 89 (100.0%) |
| Total (Category) | 96 (36.9%) | 164 (63.1%) |
| Total (Overall) | 823 (61.6%) | 514 (38.4%) |
Natural Resources, Construction and Maintenance Occupations
The most common Natural Resources, Construction and Maintenance occupations in Great Neck Estates are , and Construction & Extraction (35 | 2.6%).
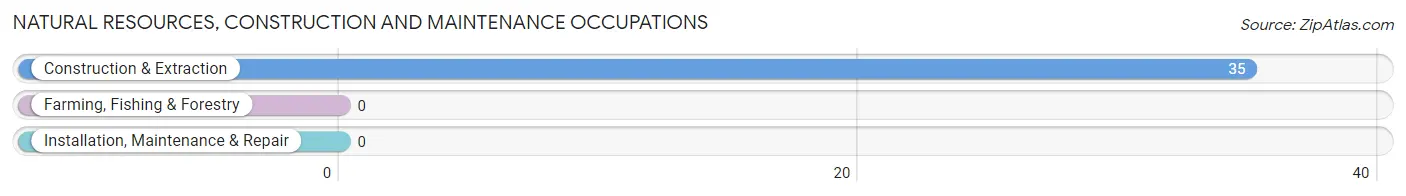
Natural Resources, Construction and Maintenance Occupations by Sex
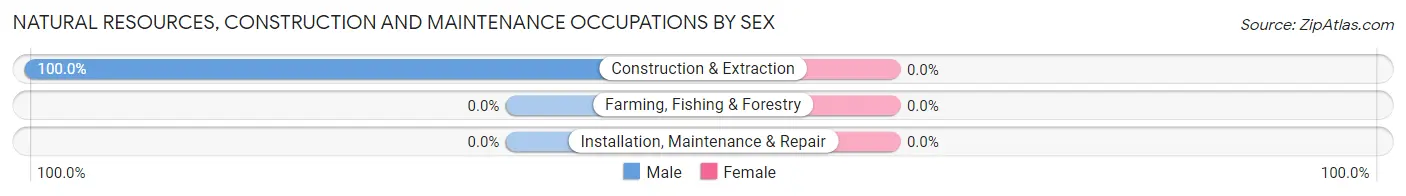
| Occupation | Male | Female |
| Farming, Fishing & Forestry | 0 (0.0%) | 0 (0.0%) |
| Construction & Extraction | 35 (100.0%) | 0 (0.0%) |
| Installation, Maintenance & Repair | 0 (0.0%) | 0 (0.0%) |
| Total (Category) | 35 (100.0%) | 0 (0.0%) |
| Total (Overall) | 823 (61.6%) | 514 (38.4%) |
Production, Transportation and Moving Occupations
The most common Production, Transportation and Moving occupations in Great Neck Estates are Material Moving (46 | 3.4%), Transportation (17 | 1.3%), and Production (11 | 0.8%).
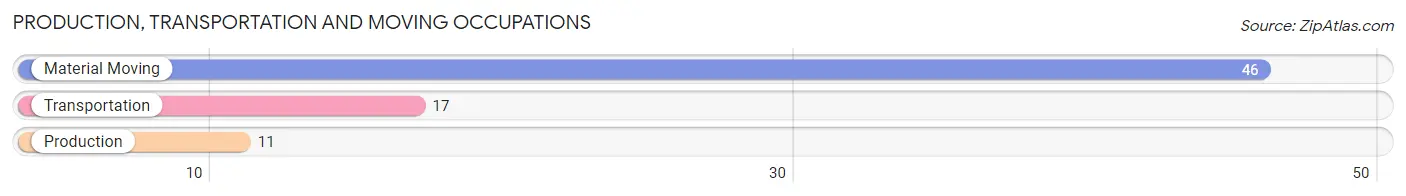
Production, Transportation and Moving Occupations by Sex
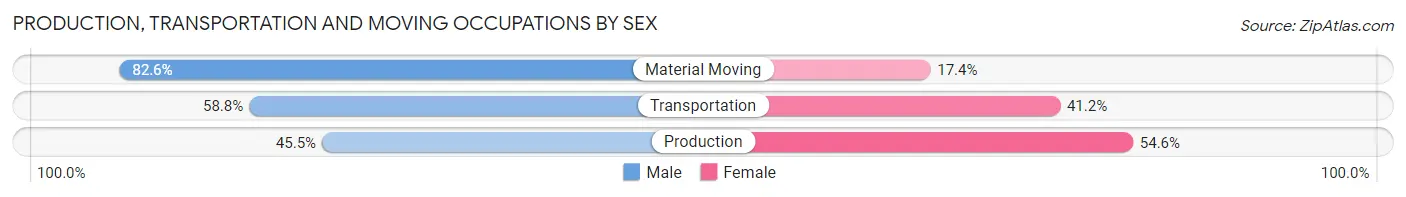
| Occupation | Male | Female |
| Production | 5 (45.5%) | 6 (54.5%) |
| Transportation | 10 (58.8%) | 7 (41.2%) |
| Material Moving | 38 (82.6%) | 8 (17.4%) |
| Total (Category) | 53 (71.6%) | 21 (28.4%) |
| Total (Overall) | 823 (61.6%) | 514 (38.4%) |
Employment Industries by Sex in Great Neck Estates
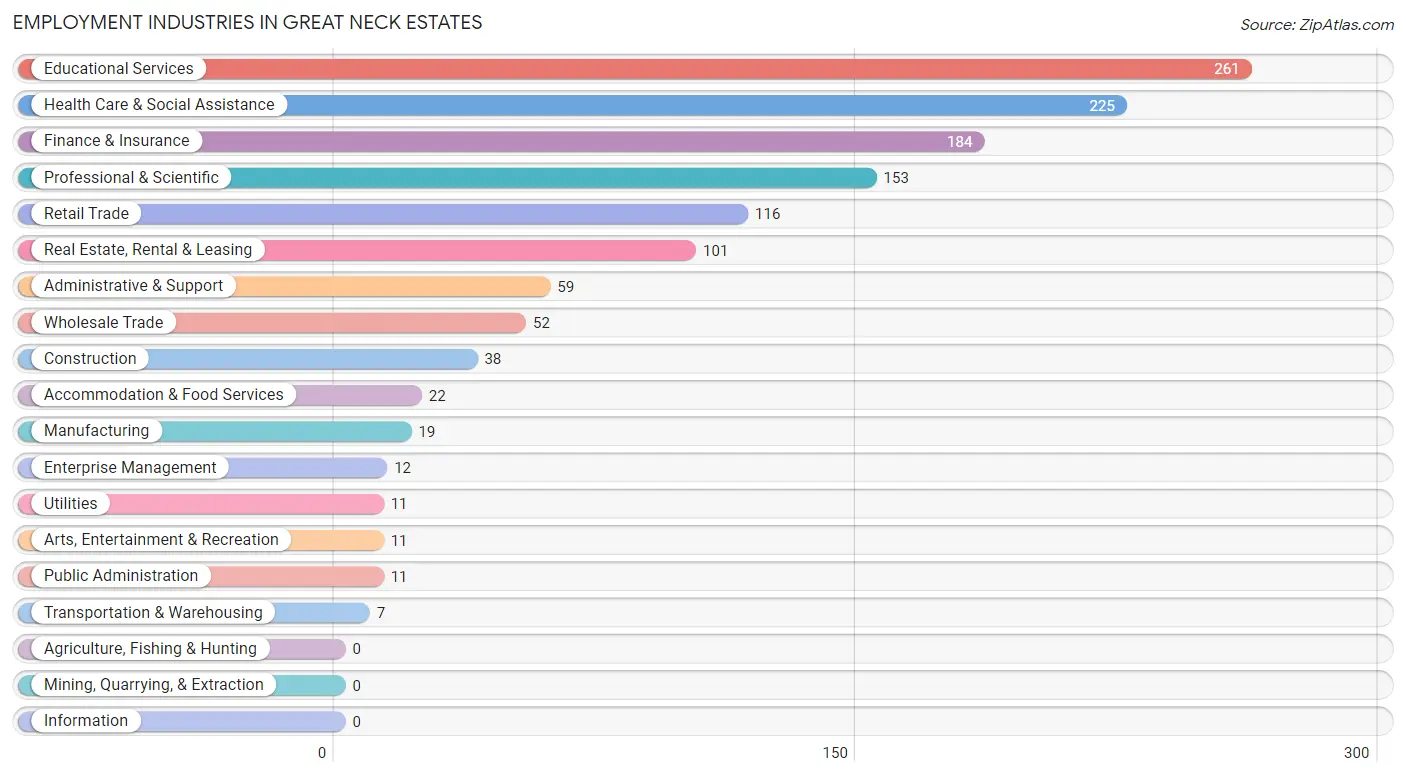
Employment Industries in Great Neck Estates
The major employment industries in Great Neck Estates include Educational Services (261 | 19.5%), Health Care & Social Assistance (225 | 16.8%), Finance & Insurance (184 | 13.8%), Professional & Scientific (153 | 11.4%), and Retail Trade (116 | 8.7%).
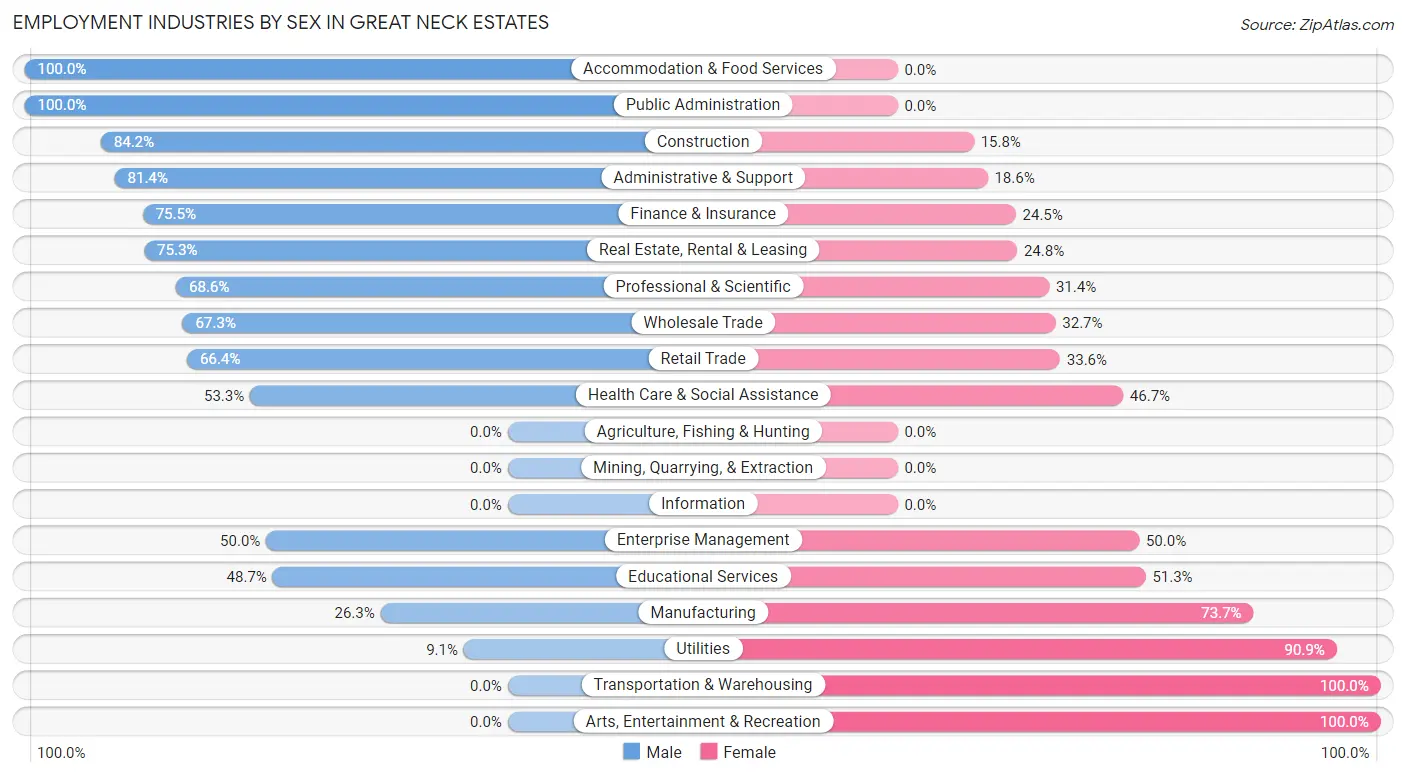
Employment Industries by Sex in Great Neck Estates
The Great Neck Estates industries that see more men than women are Accommodation & Food Services (100.0%), Public Administration (100.0%), and Construction (84.2%), whereas the industries that tend to have a higher number of women are Transportation & Warehousing (100.0%), Arts, Entertainment & Recreation (100.0%), and Utilities (90.9%).
| Industry | Male | Female |
| Agriculture, Fishing & Hunting | 0 (0.0%) | 0 (0.0%) |
| Mining, Quarrying, & Extraction | 0 (0.0%) | 0 (0.0%) |
| Construction | 32 (84.2%) | 6 (15.8%) |
| Manufacturing | 5 (26.3%) | 14 (73.7%) |
| Wholesale Trade | 35 (67.3%) | 17 (32.7%) |
| Retail Trade | 77 (66.4%) | 39 (33.6%) |
| Transportation & Warehousing | 0 (0.0%) | 7 (100.0%) |
| Utilities | 1 (9.1%) | 10 (90.9%) |
| Information | 0 (0.0%) | 0 (0.0%) |
| Finance & Insurance | 139 (75.5%) | 45 (24.5%) |
| Real Estate, Rental & Leasing | 76 (75.2%) | 25 (24.7%) |
| Professional & Scientific | 105 (68.6%) | 48 (31.4%) |
| Enterprise Management | 6 (50.0%) | 6 (50.0%) |
| Administrative & Support | 48 (81.4%) | 11 (18.6%) |
| Educational Services | 127 (48.7%) | 134 (51.3%) |
| Health Care & Social Assistance | 120 (53.3%) | 105 (46.7%) |
| Arts, Entertainment & Recreation | 0 (0.0%) | 11 (100.0%) |
| Accommodation & Food Services | 22 (100.0%) | 0 (0.0%) |
| Public Administration | 11 (100.0%) | 0 (0.0%) |
| Total | 823 (61.6%) | 514 (38.4%) |
Education in Great Neck Estates
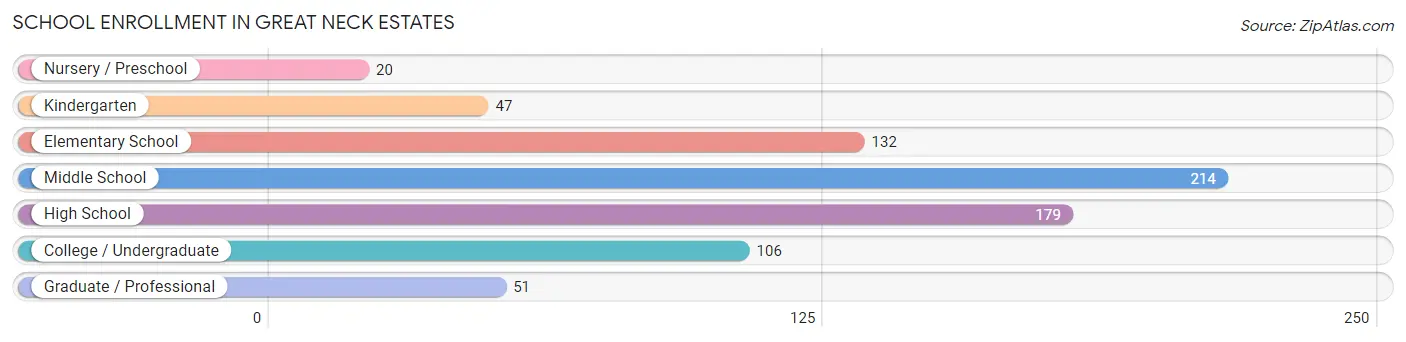
School Enrollment in Great Neck Estates
The most common levels of schooling among the 749 students in Great Neck Estates are middle school (214 | 28.6%), high school (179 | 23.9%), and elementary school (132 | 17.6%).
| School Level | # Students | % Students |
| Nursery / Preschool | 20 | 2.7% |
| Kindergarten | 47 | 6.3% |
| Elementary School | 132 | 17.6% |
| Middle School | 214 | 28.6% |
| High School | 179 | 23.9% |
| College / Undergraduate | 106 | 14.1% |
| Graduate / Professional | 51 | 6.8% |
| Total | 749 | 100.0% |
School Enrollment by Age by Funding Source in Great Neck Estates
Out of a total of 749 students who are enrolled in schools in Great Neck Estates, 286 (38.2%) attend a private institution, while the remaining 463 (61.8%) are enrolled in public schools. The age group of 3 to 4 year olds has the highest likelihood of being enrolled in private schools, with 5 (100.0% in the age bracket) enrolled. Conversely, the age group of 15 to 17 year olds has the lowest likelihood of being enrolled in a private school, with 126 (82.9% in the age bracket) attending a public institution.
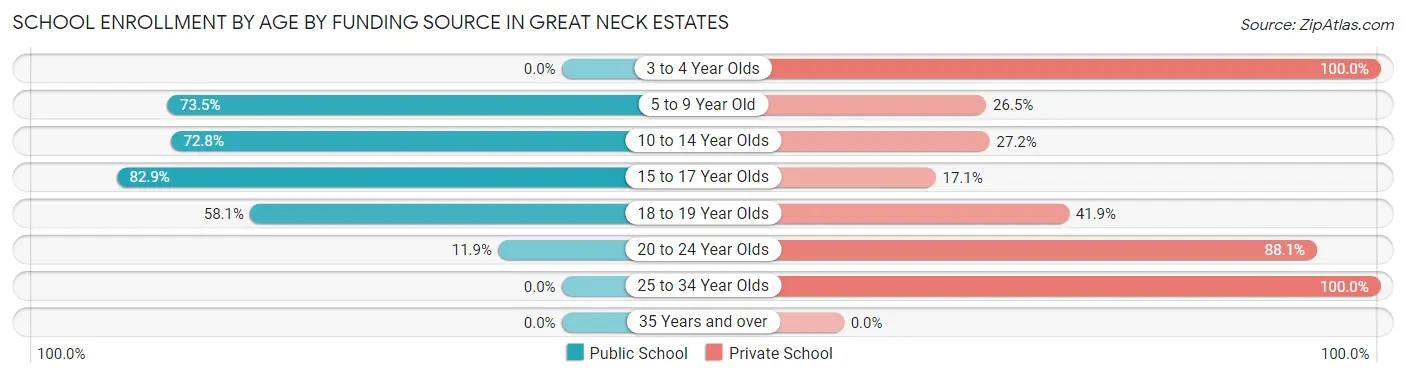
| Age Bracket | Public School | Private School |
| 3 to 4 Year Olds | 0 (0.0%) | 5 (100.0%) |
| 5 to 9 Year Old | 155 (73.5%) | 56 (26.5%) |
| 10 to 14 Year Olds | 150 (72.8%) | 56 (27.2%) |
| 15 to 17 Year Olds | 126 (82.9%) | 26 (17.1%) |
| 18 to 19 Year Olds | 18 (58.1%) | 13 (41.9%) |
| 20 to 24 Year Olds | 14 (11.9%) | 104 (88.1%) |
| 25 to 34 Year Olds | 0 (0.0%) | 26 (100.0%) |
| 35 Years and over | 0 (0.0%) | 0 (0.0%) |
| Total | 463 (61.8%) | 286 (38.2%) |
Educational Attainment by Field of Study in Great Neck Estates
Business (317 | 20.4%), social sciences (243 | 15.6%), education (170 | 10.9%), bio, nature & agricultural (130 | 8.4%), and psychology (118 | 7.6%) are the most common fields of study among 1,554 individuals in Great Neck Estates who have obtained a bachelor's degree or higher.
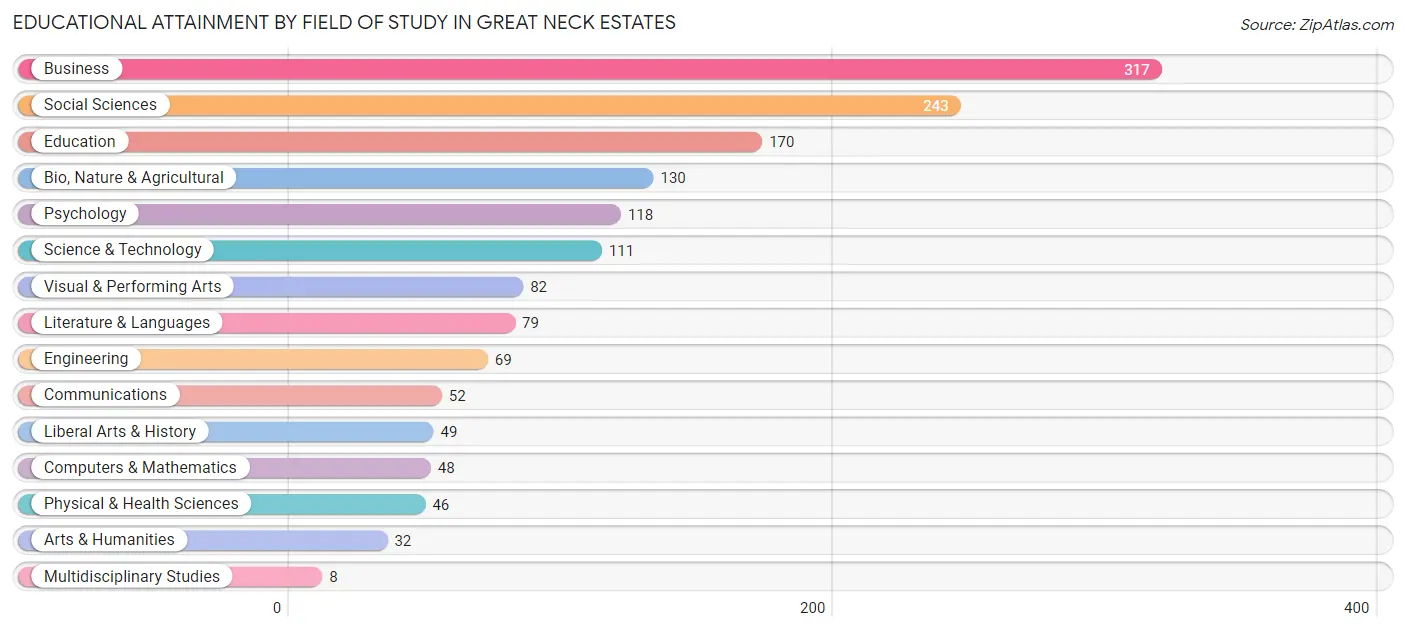
| Field of Study | # Graduates | % Graduates |
| Computers & Mathematics | 48 | 3.1% |
| Bio, Nature & Agricultural | 130 | 8.4% |
| Physical & Health Sciences | 46 | 3.0% |
| Psychology | 118 | 7.6% |
| Social Sciences | 243 | 15.6% |
| Engineering | 69 | 4.4% |
| Multidisciplinary Studies | 8 | 0.5% |
| Science & Technology | 111 | 7.1% |
| Business | 317 | 20.4% |
| Education | 170 | 10.9% |
| Literature & Languages | 79 | 5.1% |
| Liberal Arts & History | 49 | 3.2% |
| Visual & Performing Arts | 82 | 5.3% |
| Communications | 52 | 3.4% |
| Arts & Humanities | 32 | 2.1% |
| Total | 1,554 | 100.0% |
Transportation & Commute in Great Neck Estates
Vehicle Availability by Sex in Great Neck Estates
The most prevalent vehicle ownership categories in Great Neck Estates are males with 2 vehicles (487, accounting for 60.5%) and females with 2 vehicles (235, making up 96.1%).
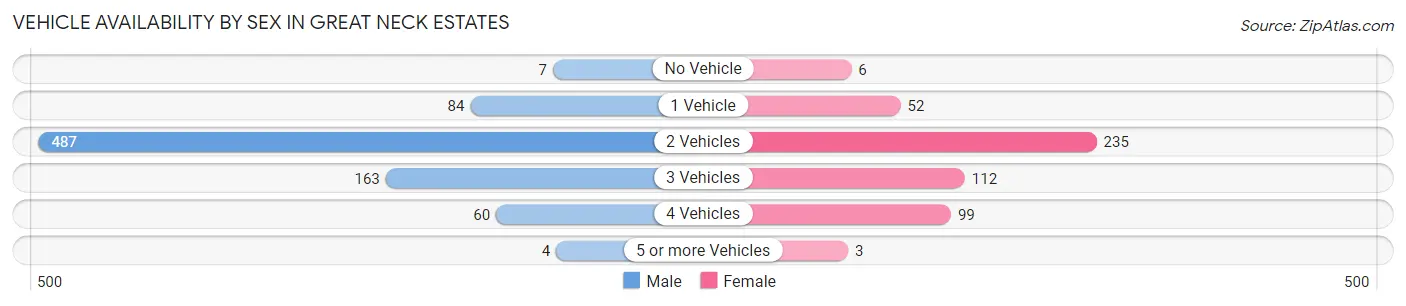
| Vehicles Available | Male | Female |
| No Vehicle | 7 (0.9%) | 6 (1.2%) |
| 1 Vehicle | 84 (10.4%) | 52 (10.3%) |
| 2 Vehicles | 487 (60.5%) | 235 (46.4%) |
| 3 Vehicles | 163 (20.3%) | 112 (22.1%) |
| 4 Vehicles | 60 (7.4%) | 99 (19.5%) |
| 5 or more Vehicles | 4 (0.5%) | 3 (0.6%) |
| Total | 805 (100.0%) | 507 (100.0%) |
Commute Time in Great Neck Estates
The most frequently occuring commute durations in Great Neck Estates are 60 to 89 minutes (267 commuters, 26.4%), 30 to 34 minutes (259 commuters, 25.6%), and 25 to 29 minutes (71 commuters, 7.0%).
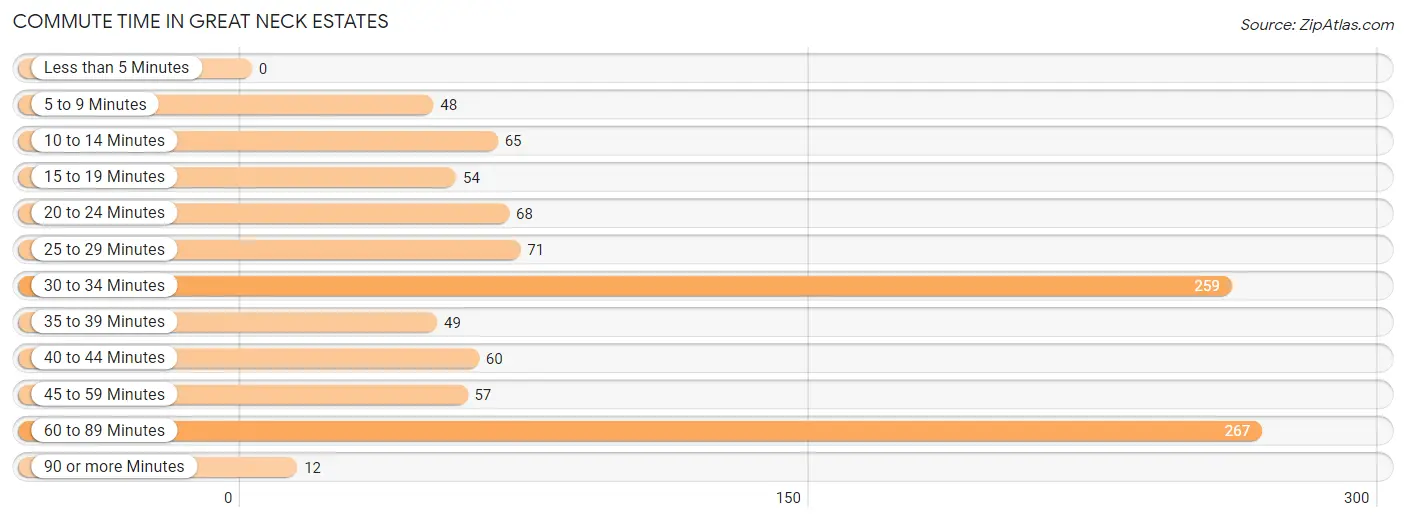
| Commute Time | # Commuters | % Commuters |
| Less than 5 Minutes | 0 | 0.0% |
| 5 to 9 Minutes | 48 | 4.8% |
| 10 to 14 Minutes | 65 | 6.4% |
| 15 to 19 Minutes | 54 | 5.3% |
| 20 to 24 Minutes | 68 | 6.7% |
| 25 to 29 Minutes | 71 | 7.0% |
| 30 to 34 Minutes | 259 | 25.6% |
| 35 to 39 Minutes | 49 | 4.9% |
| 40 to 44 Minutes | 60 | 5.9% |
| 45 to 59 Minutes | 57 | 5.6% |
| 60 to 89 Minutes | 267 | 26.4% |
| 90 or more Minutes | 12 | 1.2% |
Commute Time by Sex in Great Neck Estates
The most common commute times in Great Neck Estates are 60 to 89 minutes (214 commuters, 35.3%) for males and 30 to 34 minutes (130 commuters, 32.2%) for females.
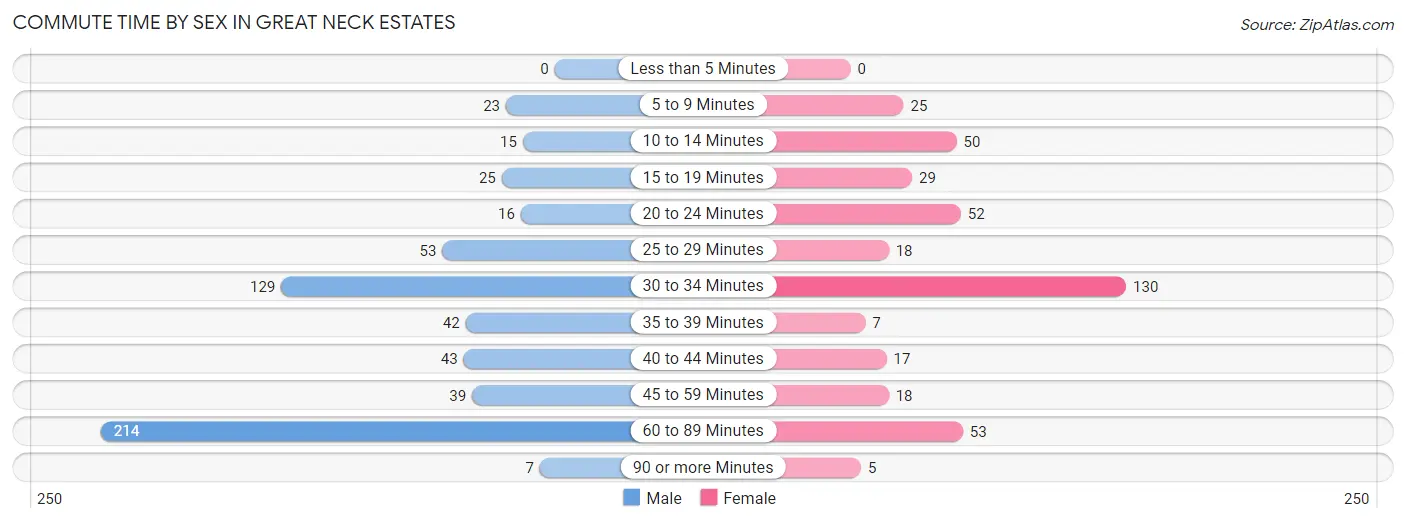
| Commute Time | Male | Female |
| Less than 5 Minutes | 0 (0.0%) | 0 (0.0%) |
| 5 to 9 Minutes | 23 (3.8%) | 25 (6.2%) |
| 10 to 14 Minutes | 15 (2.5%) | 50 (12.4%) |
| 15 to 19 Minutes | 25 (4.1%) | 29 (7.2%) |
| 20 to 24 Minutes | 16 (2.6%) | 52 (12.9%) |
| 25 to 29 Minutes | 53 (8.7%) | 18 (4.5%) |
| 30 to 34 Minutes | 129 (21.3%) | 130 (32.2%) |
| 35 to 39 Minutes | 42 (6.9%) | 7 (1.7%) |
| 40 to 44 Minutes | 43 (7.1%) | 17 (4.2%) |
| 45 to 59 Minutes | 39 (6.4%) | 18 (4.5%) |
| 60 to 89 Minutes | 214 (35.3%) | 53 (13.1%) |
| 90 or more Minutes | 7 (1.2%) | 5 (1.2%) |
Time of Departure to Work by Sex in Great Neck Estates
The most frequent times of departure to work in Great Neck Estates are 9:00 AM to 9:59 AM (199, 32.8%) for males and 8:00 AM to 8:29 AM (137, 33.9%) for females.
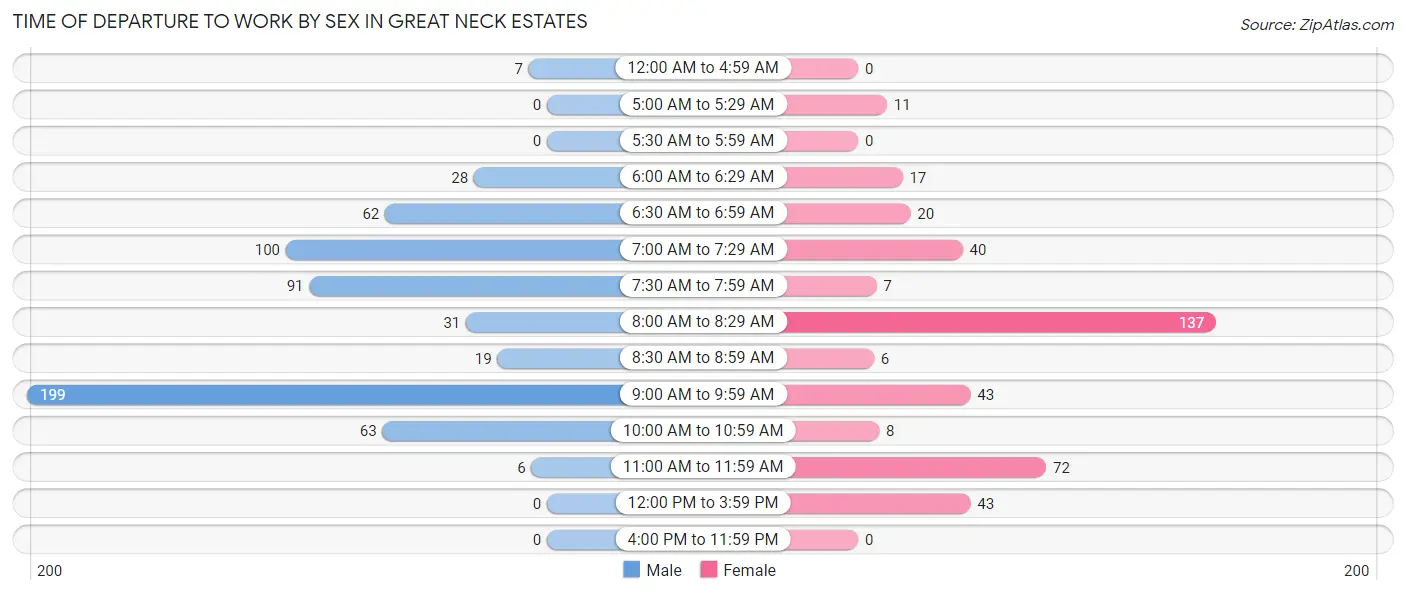
| Time of Departure | Male | Female |
| 12:00 AM to 4:59 AM | 7 (1.2%) | 0 (0.0%) |
| 5:00 AM to 5:29 AM | 0 (0.0%) | 11 (2.7%) |
| 5:30 AM to 5:59 AM | 0 (0.0%) | 0 (0.0%) |
| 6:00 AM to 6:29 AM | 28 (4.6%) | 17 (4.2%) |
| 6:30 AM to 6:59 AM | 62 (10.2%) | 20 (5.0%) |
| 7:00 AM to 7:29 AM | 100 (16.5%) | 40 (9.9%) |
| 7:30 AM to 7:59 AM | 91 (15.0%) | 7 (1.7%) |
| 8:00 AM to 8:29 AM | 31 (5.1%) | 137 (33.9%) |
| 8:30 AM to 8:59 AM | 19 (3.1%) | 6 (1.5%) |
| 9:00 AM to 9:59 AM | 199 (32.8%) | 43 (10.6%) |
| 10:00 AM to 10:59 AM | 63 (10.4%) | 8 (2.0%) |
| 11:00 AM to 11:59 AM | 6 (1.0%) | 72 (17.8%) |
| 12:00 PM to 3:59 PM | 0 (0.0%) | 43 (10.6%) |
| 4:00 PM to 11:59 PM | 0 (0.0%) | 0 (0.0%) |
| Total | 606 (100.0%) | 404 (100.0%) |
Housing Occupancy in Great Neck Estates
Occupancy by Ownership in Great Neck Estates
Of the total 913 dwellings in Great Neck Estates, owner-occupied units account for 796 (87.2%), while renter-occupied units make up 117 (12.8%).
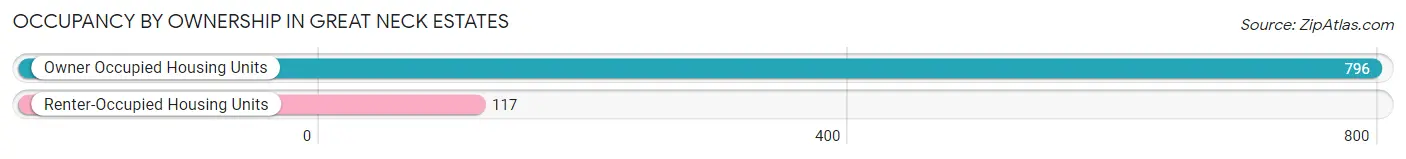
| Occupancy | # Housing Units | % Housing Units |
| Owner Occupied Housing Units | 796 | 87.2% |
| Renter-Occupied Housing Units | 117 | 12.8% |
| Total Occupied Housing Units | 913 | 100.0% |
Occupancy by Household Size in Great Neck Estates
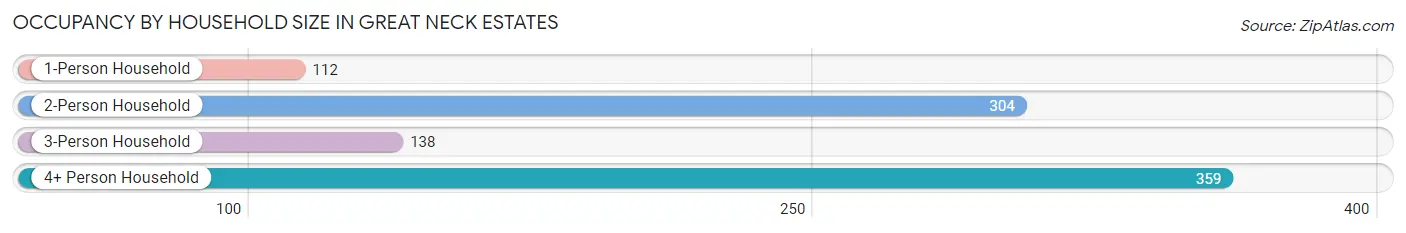
| Household Size | # Housing Units | % Housing Units |
| 1-Person Household | 112 | 12.3% |
| 2-Person Household | 304 | 33.3% |
| 3-Person Household | 138 | 15.1% |
| 4+ Person Household | 359 | 39.3% |
| Total Housing Units | 913 | 100.0% |
Occupancy by Ownership by Household Size in Great Neck Estates
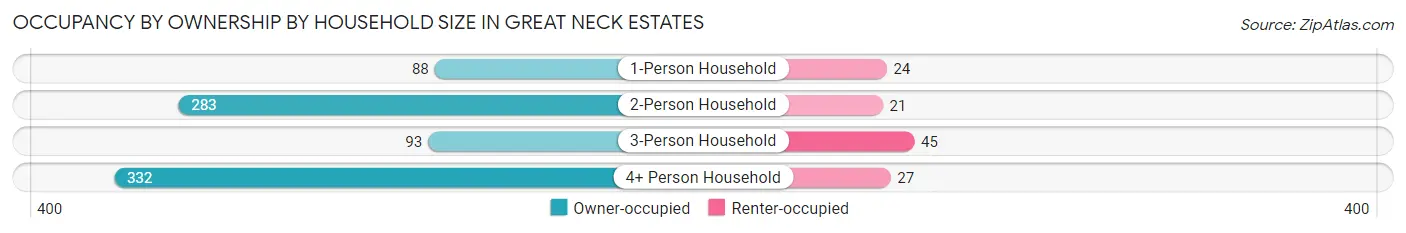
| Household Size | Owner-occupied | Renter-occupied |
| 1-Person Household | 88 (78.6%) | 24 (21.4%) |
| 2-Person Household | 283 (93.1%) | 21 (6.9%) |
| 3-Person Household | 93 (67.4%) | 45 (32.6%) |
| 4+ Person Household | 332 (92.5%) | 27 (7.5%) |
| Total Housing Units | 796 (87.2%) | 117 (12.8%) |
Occupancy by Educational Attainment in Great Neck Estates
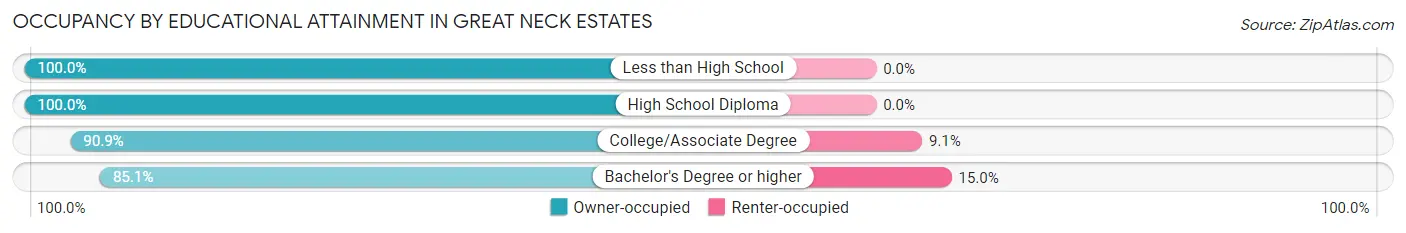
| Household Size | Owner-occupied | Renter-occupied |
| Less than High School | 29 (100.0%) | 0 (0.0%) |
| High School Diploma | 80 (100.0%) | 0 (0.0%) |
| College/Associate Degree | 50 (90.9%) | 5 (9.1%) |
| Bachelor's Degree or higher | 637 (85.1%) | 112 (14.9%) |
Occupancy by Age of Householder in Great Neck Estates
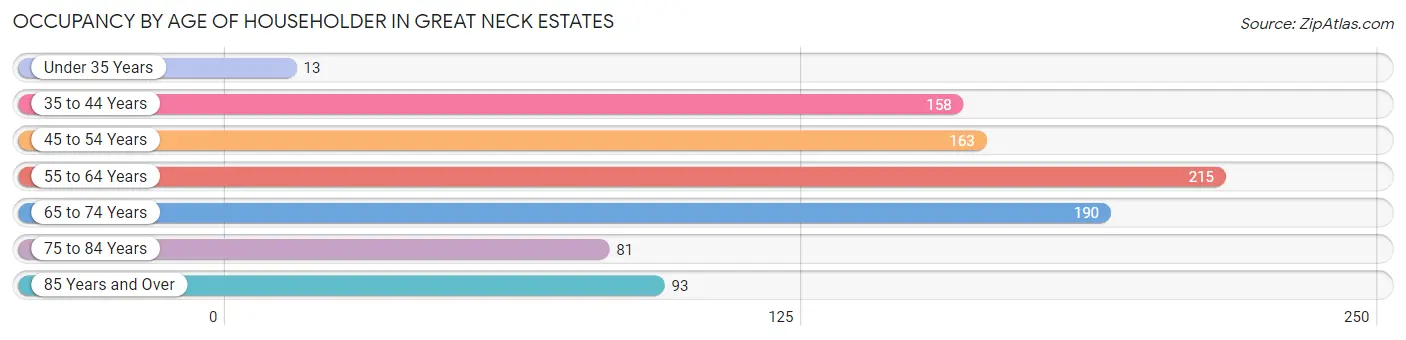
| Age Bracket | # Households | % Households |
| Under 35 Years | 13 | 1.4% |
| 35 to 44 Years | 158 | 17.3% |
| 45 to 54 Years | 163 | 17.8% |
| 55 to 64 Years | 215 | 23.5% |
| 65 to 74 Years | 190 | 20.8% |
| 75 to 84 Years | 81 | 8.9% |
| 85 Years and Over | 93 | 10.2% |
| Total | 913 | 100.0% |
Housing Finances in Great Neck Estates
Median Income by Occupancy in Great Neck Estates
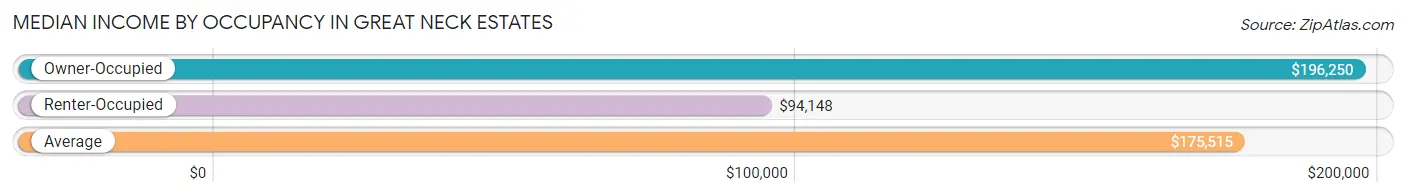
| Occupancy Type | # Households | Median Income |
| Owner-Occupied | 796 (87.2%) | $196,250 |
| Renter-Occupied | 117 (12.8%) | $94,148 |
| Average | 913 (100.0%) | $175,515 |
Occupancy by Householder Income Bracket in Great Neck Estates
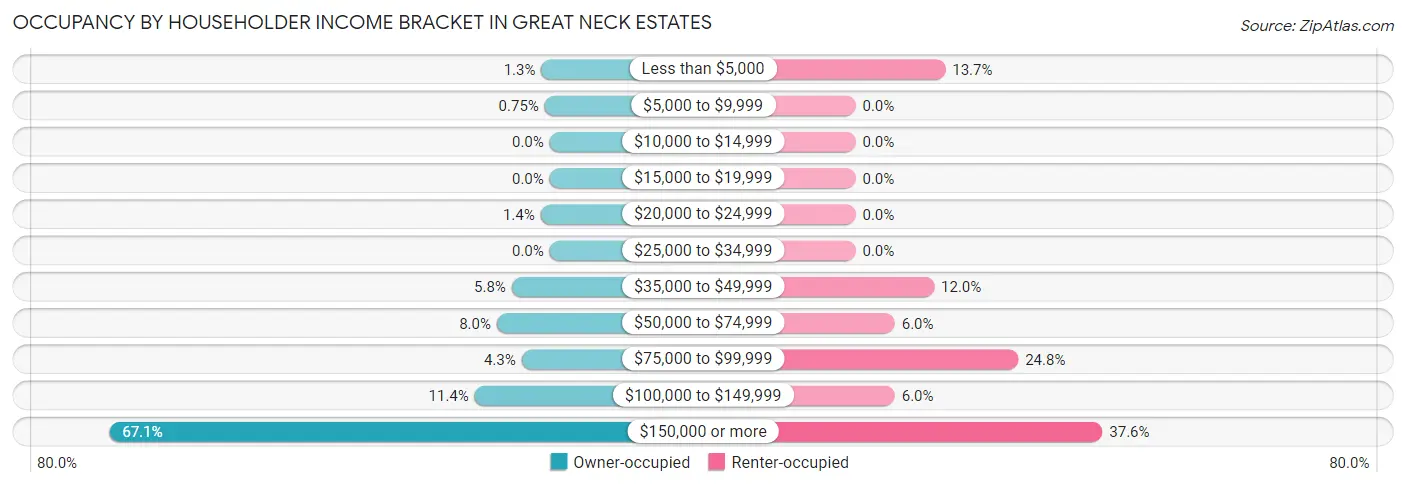
| Income Bracket | Owner-occupied | Renter-occupied |
| Less than $5,000 | 10 (1.3%) | 16 (13.7%) |
| $5,000 to $9,999 | 6 (0.7%) | 0 (0.0%) |
| $10,000 to $14,999 | 0 (0.0%) | 0 (0.0%) |
| $15,000 to $19,999 | 0 (0.0%) | 0 (0.0%) |
| $20,000 to $24,999 | 11 (1.4%) | 0 (0.0%) |
| $25,000 to $34,999 | 0 (0.0%) | 0 (0.0%) |
| $35,000 to $49,999 | 46 (5.8%) | 14 (12.0%) |
| $50,000 to $74,999 | 64 (8.0%) | 7 (6.0%) |
| $75,000 to $99,999 | 34 (4.3%) | 29 (24.8%) |
| $100,000 to $149,999 | 91 (11.4%) | 7 (6.0%) |
| $150,000 or more | 534 (67.1%) | 44 (37.6%) |
| Total | 796 (100.0%) | 117 (100.0%) |
Monthly Housing Cost Tiers in Great Neck Estates
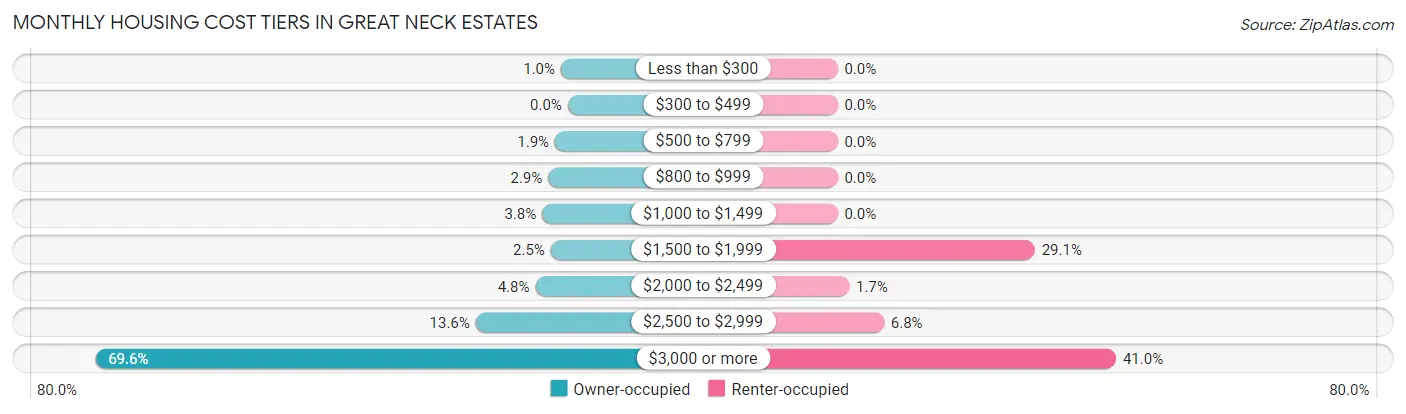
| Monthly Cost | Owner-occupied | Renter-occupied |
| Less than $300 | 8 (1.0%) | 0 (0.0%) |
| $300 to $499 | 0 (0.0%) | 0 (0.0%) |
| $500 to $799 | 15 (1.9%) | 0 (0.0%) |
| $800 to $999 | 23 (2.9%) | 0 (0.0%) |
| $1,000 to $1,499 | 30 (3.8%) | 0 (0.0%) |
| $1,500 to $1,999 | 20 (2.5%) | 34 (29.1%) |
| $2,000 to $2,499 | 38 (4.8%) | 2 (1.7%) |
| $2,500 to $2,999 | 108 (13.6%) | 8 (6.8%) |
| $3,000 or more | 554 (69.6%) | 48 (41.0%) |
| Total | 796 (100.0%) | 117 (100.0%) |
Physical Housing Characteristics in Great Neck Estates
Housing Structures in Great Neck Estates
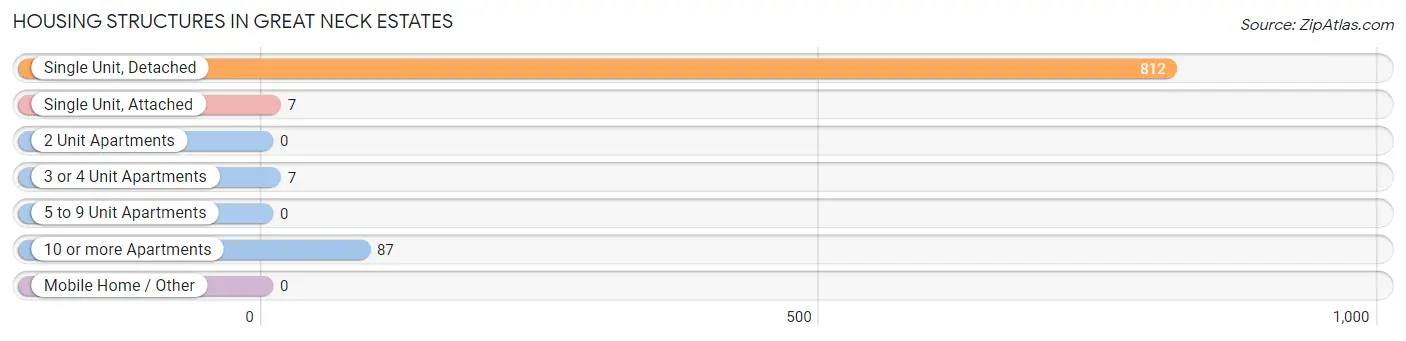
| Structure Type | # Housing Units | % Housing Units |
| Single Unit, Detached | 812 | 88.9% |
| Single Unit, Attached | 7 | 0.8% |
| 2 Unit Apartments | 0 | 0.0% |
| 3 or 4 Unit Apartments | 7 | 0.8% |
| 5 to 9 Unit Apartments | 0 | 0.0% |
| 10 or more Apartments | 87 | 9.5% |
| Mobile Home / Other | 0 | 0.0% |
| Total | 913 | 100.0% |
Housing Structures by Occupancy in Great Neck Estates
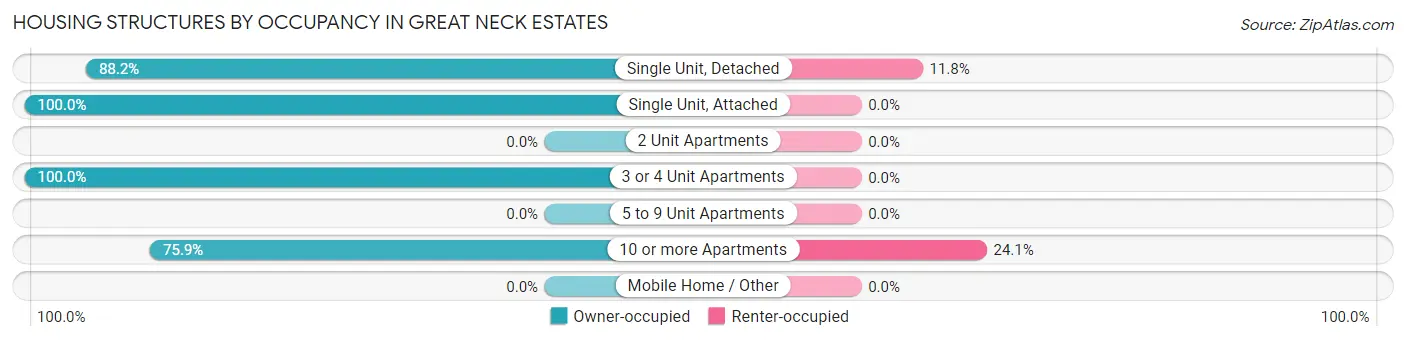
| Structure Type | Owner-occupied | Renter-occupied |
| Single Unit, Detached | 716 (88.2%) | 96 (11.8%) |
| Single Unit, Attached | 7 (100.0%) | 0 (0.0%) |
| 2 Unit Apartments | 0 (0.0%) | 0 (0.0%) |
| 3 or 4 Unit Apartments | 7 (100.0%) | 0 (0.0%) |
| 5 to 9 Unit Apartments | 0 (0.0%) | 0 (0.0%) |
| 10 or more Apartments | 66 (75.9%) | 21 (24.1%) |
| Mobile Home / Other | 0 (0.0%) | 0 (0.0%) |
| Total | 796 (87.2%) | 117 (12.8%) |
Housing Structures by Number of Rooms in Great Neck Estates
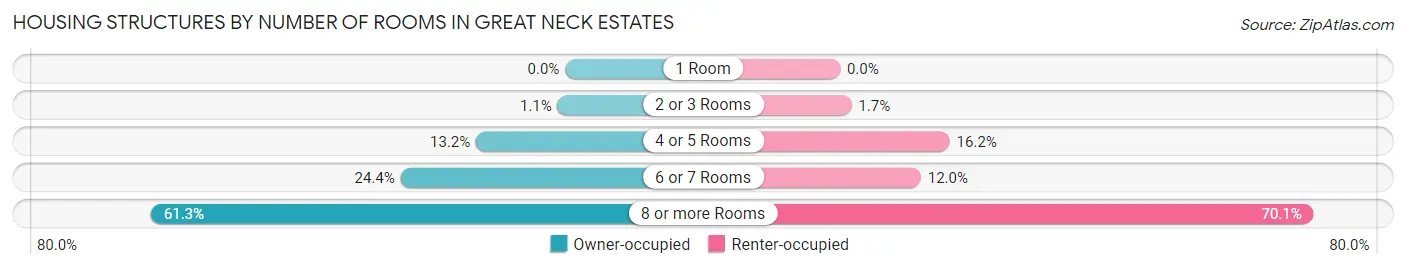
| Number of Rooms | Owner-occupied | Renter-occupied |
| 1 Room | 0 (0.0%) | 0 (0.0%) |
| 2 or 3 Rooms | 9 (1.1%) | 2 (1.7%) |
| 4 or 5 Rooms | 105 (13.2%) | 19 (16.2%) |
| 6 or 7 Rooms | 194 (24.4%) | 14 (12.0%) |
| 8 or more Rooms | 488 (61.3%) | 82 (70.1%) |
| Total | 796 (100.0%) | 117 (100.0%) |
Housing Structure by Heating Type in Great Neck Estates
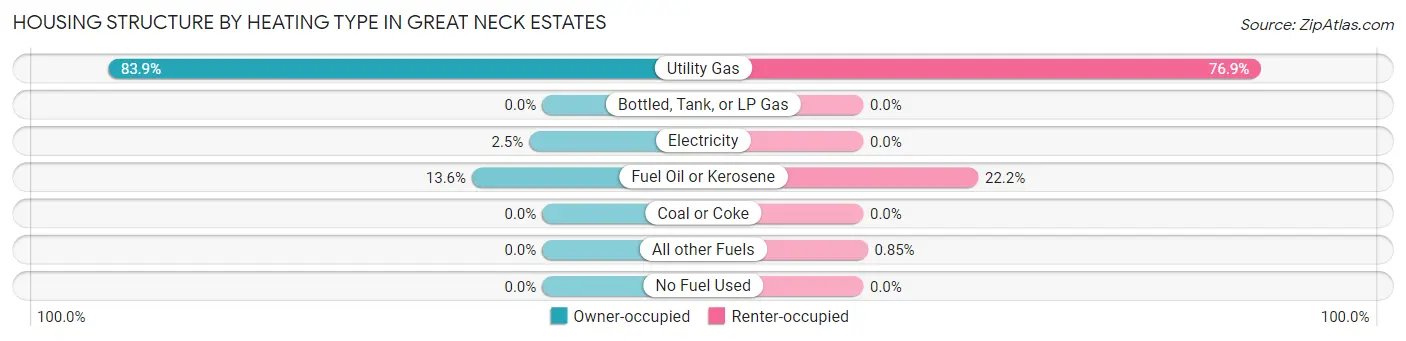
| Heating Type | Owner-occupied | Renter-occupied |
| Utility Gas | 668 (83.9%) | 90 (76.9%) |
| Bottled, Tank, or LP Gas | 0 (0.0%) | 0 (0.0%) |
| Electricity | 20 (2.5%) | 0 (0.0%) |
| Fuel Oil or Kerosene | 108 (13.6%) | 26 (22.2%) |
| Coal or Coke | 0 (0.0%) | 0 (0.0%) |
| All other Fuels | 0 (0.0%) | 1 (0.9%) |
| No Fuel Used | 0 (0.0%) | 0 (0.0%) |
| Total | 796 (100.0%) | 117 (100.0%) |
Household Vehicle Usage in Great Neck Estates
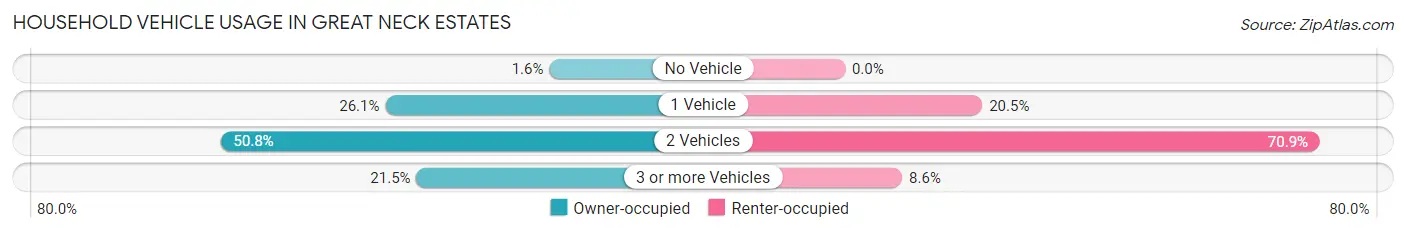
| Vehicles per Household | Owner-occupied | Renter-occupied |
| No Vehicle | 13 (1.6%) | 0 (0.0%) |
| 1 Vehicle | 208 (26.1%) | 24 (20.5%) |
| 2 Vehicles | 404 (50.7%) | 83 (70.9%) |
| 3 or more Vehicles | 171 (21.5%) | 10 (8.6%) |
| Total | 796 (100.0%) | 117 (100.0%) |
Real Estate & Mortgages in Great Neck Estates
Real Estate and Mortgage Overview in Great Neck Estates
| Characteristic | Without Mortgage | With Mortgage |
| Housing Units | 411 | 385 |
| Median Property Value | $1,662,300 | $1,561,500 |
| Median Household Income | $166,853 | $307 |
| Monthly Housing Costs | $1,501 | $346 |
| Real Estate Taxes | $10,001 | $0 |
Property Value by Mortgage Status in Great Neck Estates
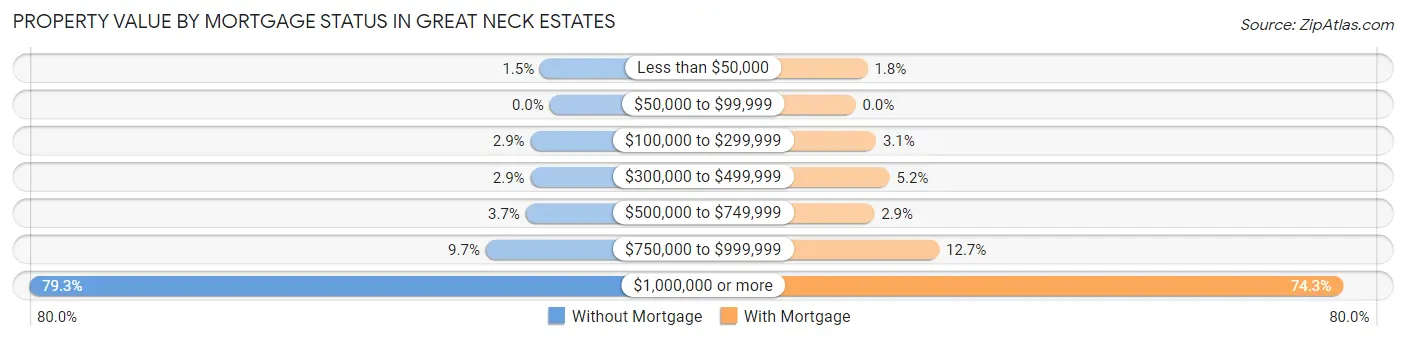
| Property Value | Without Mortgage | With Mortgage |
| Less than $50,000 | 6 (1.5%) | 7 (1.8%) |
| $50,000 to $99,999 | 0 (0.0%) | 0 (0.0%) |
| $100,000 to $299,999 | 12 (2.9%) | 12 (3.1%) |
| $300,000 to $499,999 | 12 (2.9%) | 20 (5.2%) |
| $500,000 to $749,999 | 15 (3.6%) | 11 (2.9%) |
| $750,000 to $999,999 | 40 (9.7%) | 49 (12.7%) |
| $1,000,000 or more | 326 (79.3%) | 286 (74.3%) |
| Total | 411 (100.0%) | 385 (100.0%) |
Household Income by Mortgage Status in Great Neck Estates
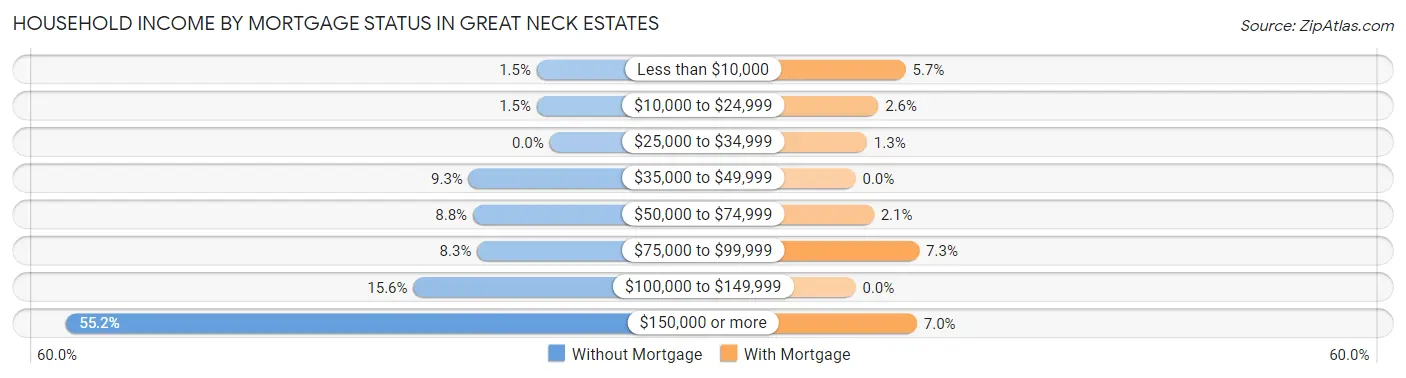
| Household Income | Without Mortgage | With Mortgage |
| Less than $10,000 | 6 (1.5%) | 22 (5.7%) |
| $10,000 to $24,999 | 6 (1.5%) | 10 (2.6%) |
| $25,000 to $34,999 | 0 (0.0%) | 5 (1.3%) |
| $35,000 to $49,999 | 38 (9.2%) | 0 (0.0%) |
| $50,000 to $74,999 | 36 (8.8%) | 8 (2.1%) |
| $75,000 to $99,999 | 34 (8.3%) | 28 (7.3%) |
| $100,000 to $149,999 | 64 (15.6%) | 0 (0.0%) |
| $150,000 or more | 227 (55.2%) | 27 (7.0%) |
| Total | 411 (100.0%) | 385 (100.0%) |
Property Value to Household Income Ratio in Great Neck Estates
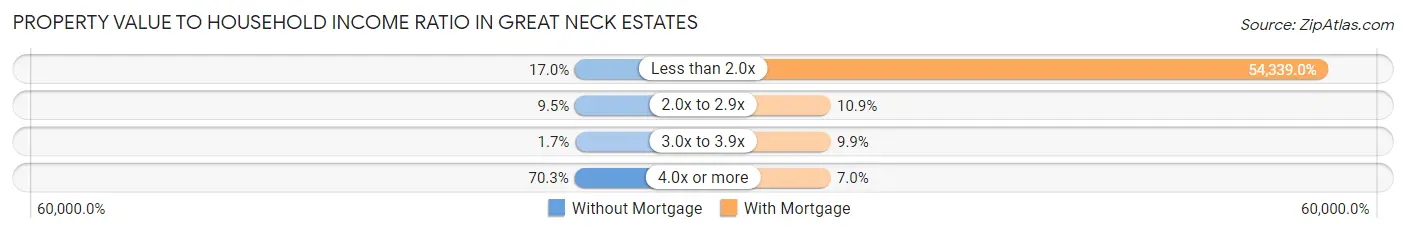
| Value-to-Income Ratio | Without Mortgage | With Mortgage |
| Less than 2.0x | 70 (17.0%) | 209,205 (54,339.0%) |
| 2.0x to 2.9x | 39 (9.5%) | 42 (10.9%) |
| 3.0x to 3.9x | 7 (1.7%) | 38 (9.9%) |
| 4.0x or more | 289 (70.3%) | 27 (7.0%) |
| Total | 411 (100.0%) | 385 (100.0%) |
Real Estate Taxes by Mortgage Status in Great Neck Estates

| Property Taxes | Without Mortgage | With Mortgage |
| Less than $800 | 3 (0.7%) | 0 (0.0%) |
| $800 to $1,499 | 0 (0.0%) | 7 (1.8%) |
| $800 to $1,499 | 403 (98.1%) | 0 (0.0%) |
| Total | 411 (100.0%) | 385 (100.0%) |
Health & Disability in Great Neck Estates
Health Insurance Coverage by Age in Great Neck Estates
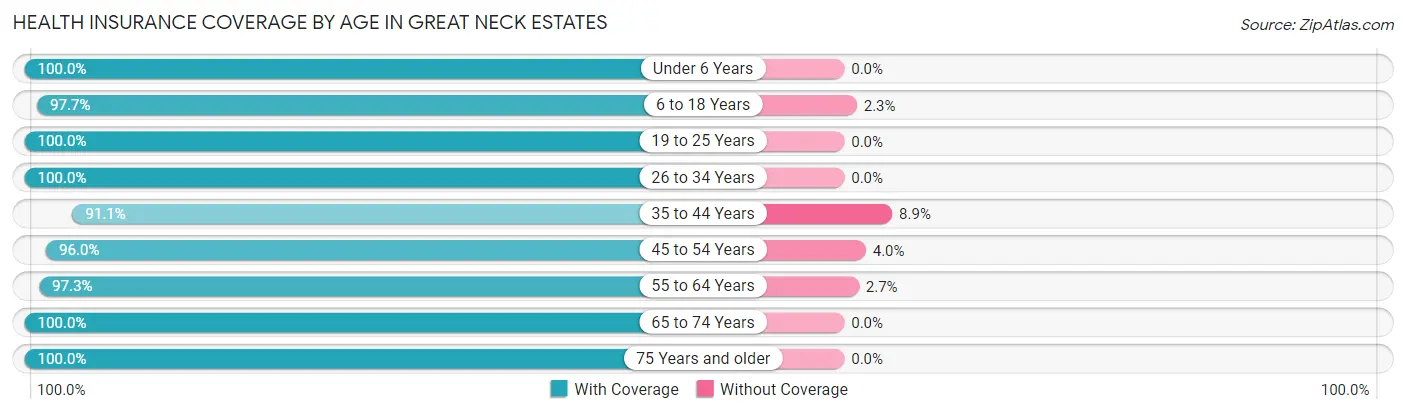
| Age Bracket | With Coverage | Without Coverage |
| Under 6 Years | 187 (100.0%) | 0 (0.0%) |
| 6 to 18 Years | 546 (97.7%) | 13 (2.3%) |
| 19 to 25 Years | 227 (100.0%) | 0 (0.0%) |
| 26 to 34 Years | 198 (100.0%) | 0 (0.0%) |
| 35 to 44 Years | 296 (91.1%) | 29 (8.9%) |
| 45 to 54 Years | 407 (96.0%) | 17 (4.0%) |
| 55 to 64 Years | 358 (97.3%) | 10 (2.7%) |
| 65 to 74 Years | 282 (100.0%) | 0 (0.0%) |
| 75 Years and older | 366 (100.0%) | 0 (0.0%) |
| Total | 2,867 (97.7%) | 69 (2.4%) |
Health Insurance Coverage by Citizenship Status in Great Neck Estates

| Citizenship Status | With Coverage | Without Coverage |
| Native Born | 187 (100.0%) | 0 (0.0%) |
| Foreign Born, Citizen | 546 (97.7%) | 13 (2.3%) |
| Foreign Born, not a Citizen | 227 (100.0%) | 0 (0.0%) |
Health Insurance Coverage by Household Income in Great Neck Estates
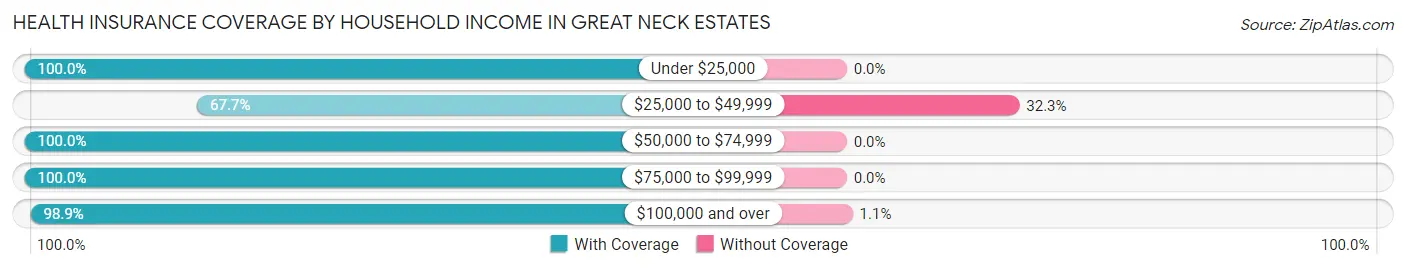
| Household Income | With Coverage | Without Coverage |
| Under $25,000 | 50 (100.0%) | 0 (0.0%) |
| $25,000 to $49,999 | 90 (67.7%) | 43 (32.3%) |
| $50,000 to $74,999 | 124 (100.0%) | 0 (0.0%) |
| $75,000 to $99,999 | 258 (100.0%) | 0 (0.0%) |
| $100,000 and over | 2,345 (98.9%) | 26 (1.1%) |
Public vs Private Health Insurance Coverage by Age in Great Neck Estates
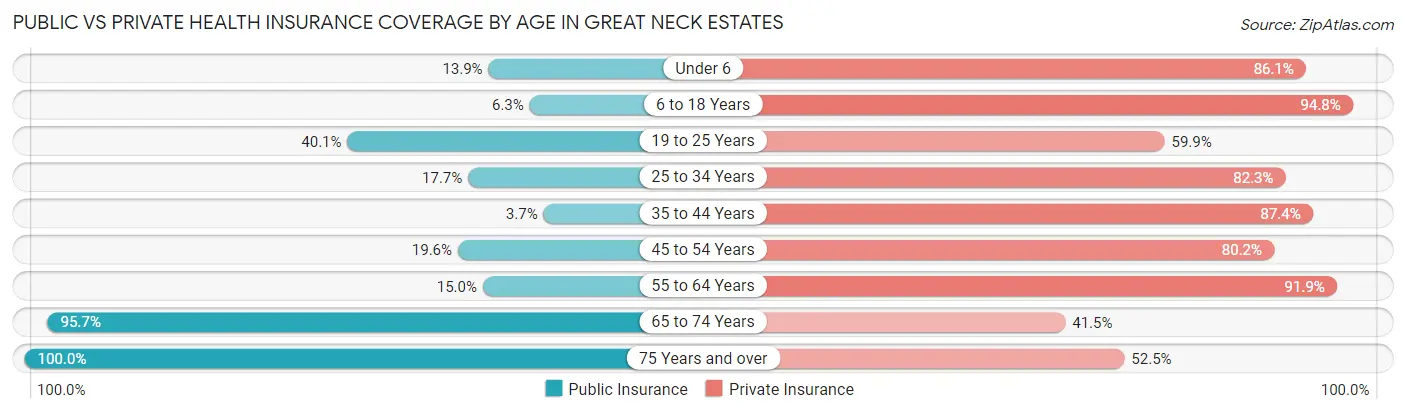
| Age Bracket | Public Insurance | Private Insurance |
| Under 6 | 26 (13.9%) | 161 (86.1%) |
| 6 to 18 Years | 35 (6.3%) | 530 (94.8%) |
| 19 to 25 Years | 91 (40.1%) | 136 (59.9%) |
| 25 to 34 Years | 35 (17.7%) | 163 (82.3%) |
| 35 to 44 Years | 12 (3.7%) | 284 (87.4%) |
| 45 to 54 Years | 83 (19.6%) | 340 (80.2%) |
| 55 to 64 Years | 55 (14.9%) | 338 (91.8%) |
| 65 to 74 Years | 270 (95.7%) | 117 (41.5%) |
| 75 Years and over | 366 (100.0%) | 192 (52.5%) |
| Total | 973 (33.1%) | 2,261 (77.0%) |
Disability Status by Sex by Age in Great Neck Estates
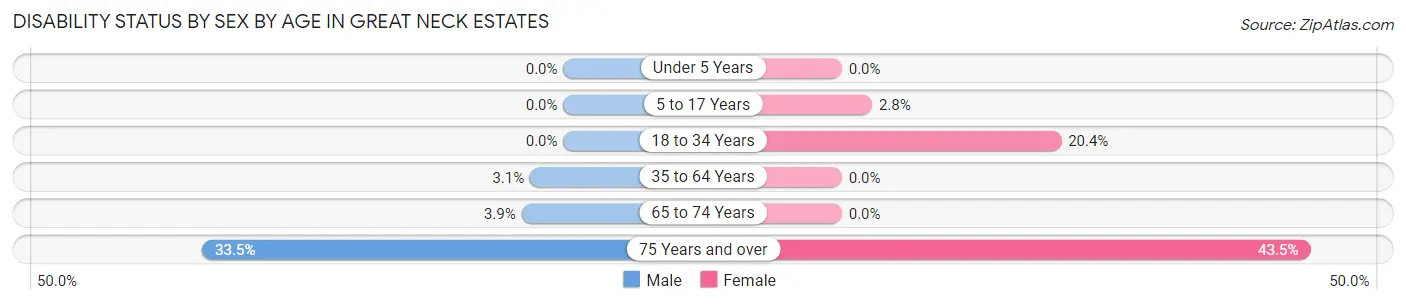
| Age Bracket | Male | Female |
| Under 5 Years | 0 (0.0%) | 0 (0.0%) |
| 5 to 17 Years | 0 (0.0%) | 9 (2.8%) |
| 18 to 34 Years | 0 (0.0%) | 34 (20.4%) |
| 35 to 64 Years | 16 (3.1%) | 0 (0.0%) |
| 65 to 74 Years | 6 (3.9%) | 0 (0.0%) |
| 75 Years and over | 61 (33.5%) | 80 (43.5%) |
Disability Class by Sex by Age in Great Neck Estates
Disability Class: Hearing Difficulty
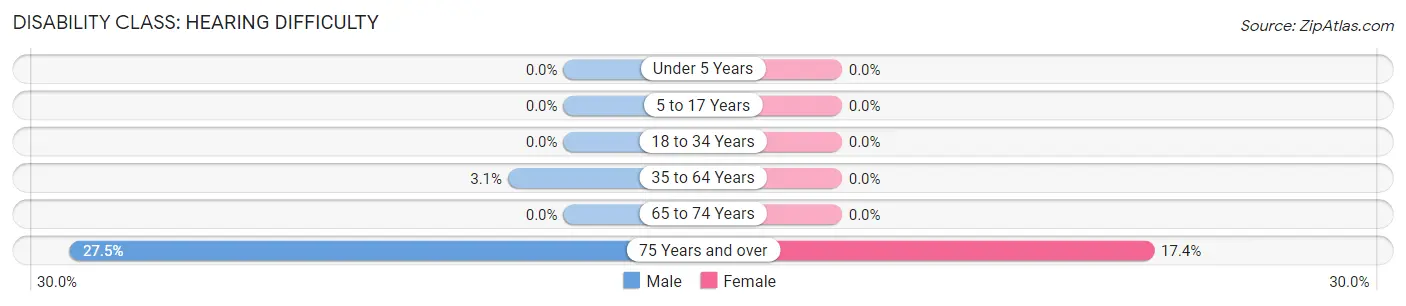
| Age Bracket | Male | Female |
| Under 5 Years | 0 (0.0%) | 0 (0.0%) |
| 5 to 17 Years | 0 (0.0%) | 0 (0.0%) |
| 18 to 34 Years | 0 (0.0%) | 0 (0.0%) |
| 35 to 64 Years | 16 (3.1%) | 0 (0.0%) |
| 65 to 74 Years | 0 (0.0%) | 0 (0.0%) |
| 75 Years and over | 50 (27.5%) | 32 (17.4%) |
Disability Class: Vision Difficulty
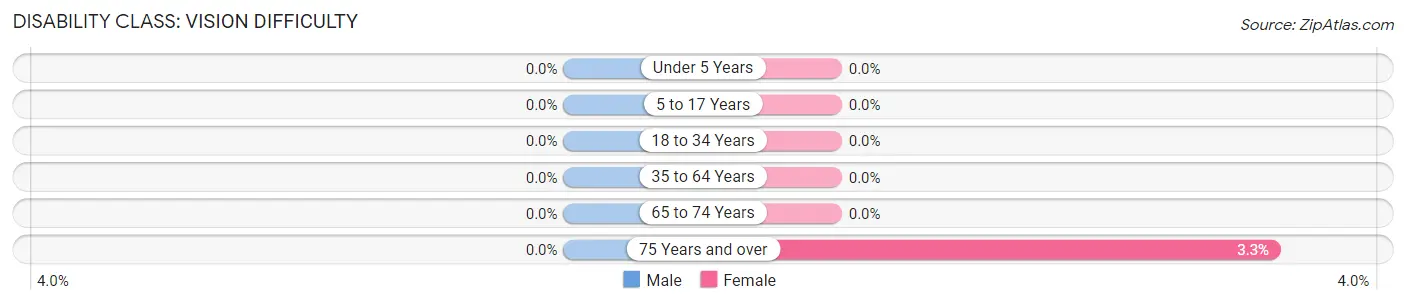
| Age Bracket | Male | Female |
| Under 5 Years | 0 (0.0%) | 0 (0.0%) |
| 5 to 17 Years | 0 (0.0%) | 0 (0.0%) |
| 18 to 34 Years | 0 (0.0%) | 0 (0.0%) |
| 35 to 64 Years | 0 (0.0%) | 0 (0.0%) |
| 65 to 74 Years | 0 (0.0%) | 0 (0.0%) |
| 75 Years and over | 0 (0.0%) | 6 (3.3%) |
Disability Class: Cognitive Difficulty
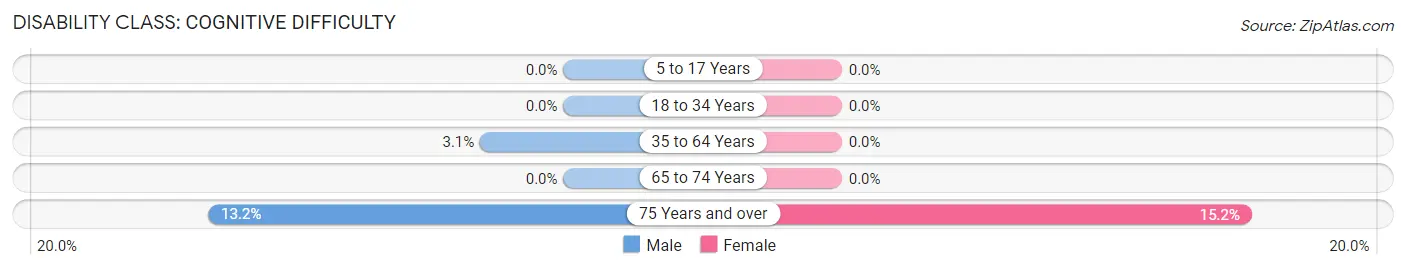
| Age Bracket | Male | Female |
| 5 to 17 Years | 0 (0.0%) | 0 (0.0%) |
| 18 to 34 Years | 0 (0.0%) | 0 (0.0%) |
| 35 to 64 Years | 16 (3.1%) | 0 (0.0%) |
| 65 to 74 Years | 0 (0.0%) | 0 (0.0%) |
| 75 Years and over | 24 (13.2%) | 28 (15.2%) |
Disability Class: Ambulatory Difficulty
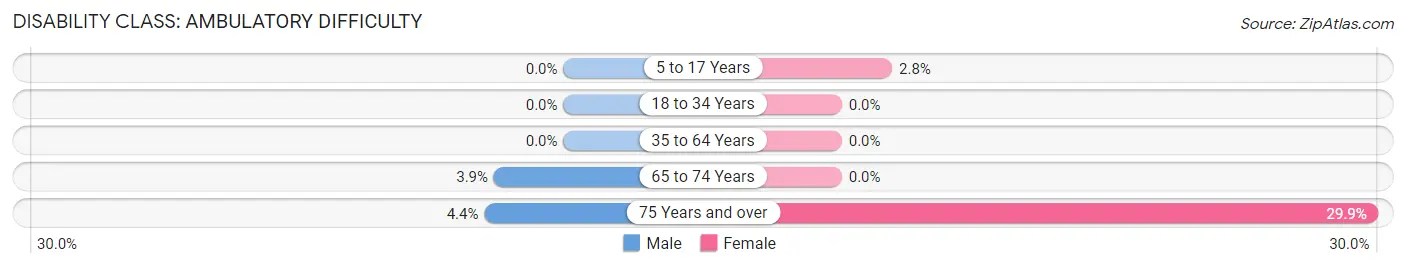
| Age Bracket | Male | Female |
| 5 to 17 Years | 0 (0.0%) | 9 (2.8%) |
| 18 to 34 Years | 0 (0.0%) | 0 (0.0%) |
| 35 to 64 Years | 0 (0.0%) | 0 (0.0%) |
| 65 to 74 Years | 6 (3.9%) | 0 (0.0%) |
| 75 Years and over | 8 (4.4%) | 55 (29.9%) |
Disability Class: Self-Care Difficulty
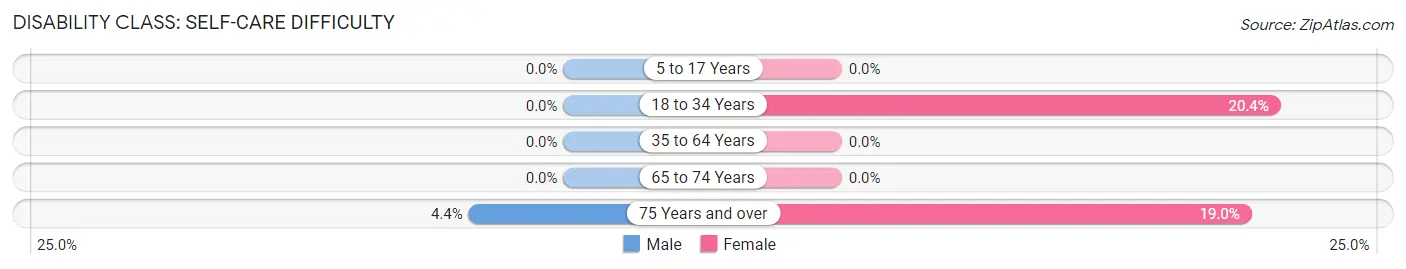
| Age Bracket | Male | Female |
| 5 to 17 Years | 0 (0.0%) | 0 (0.0%) |
| 18 to 34 Years | 0 (0.0%) | 34 (20.4%) |
| 35 to 64 Years | 0 (0.0%) | 0 (0.0%) |
| 65 to 74 Years | 0 (0.0%) | 0 (0.0%) |
| 75 Years and over | 8 (4.4%) | 35 (19.0%) |
Technology Access in Great Neck Estates
Computing Device Access in Great Neck Estates
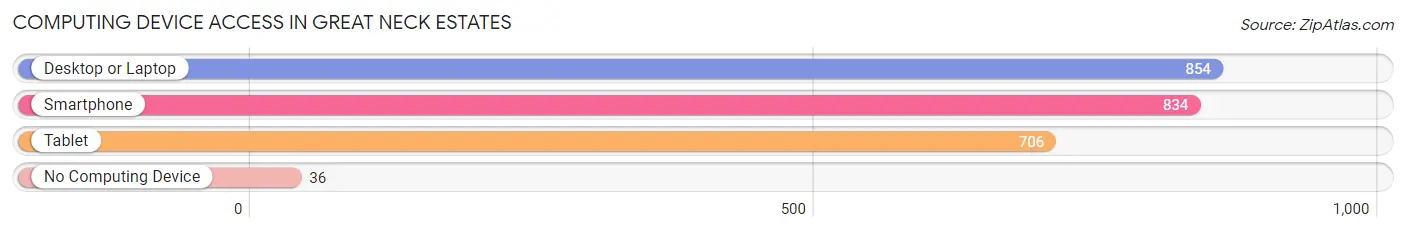
| Device Type | # Households | % Households |
| Desktop or Laptop | 854 | 93.5% |
| Smartphone | 834 | 91.3% |
| Tablet | 706 | 77.3% |
| No Computing Device | 36 | 3.9% |
| Total | 913 | 100.0% |
Internet Access in Great Neck Estates
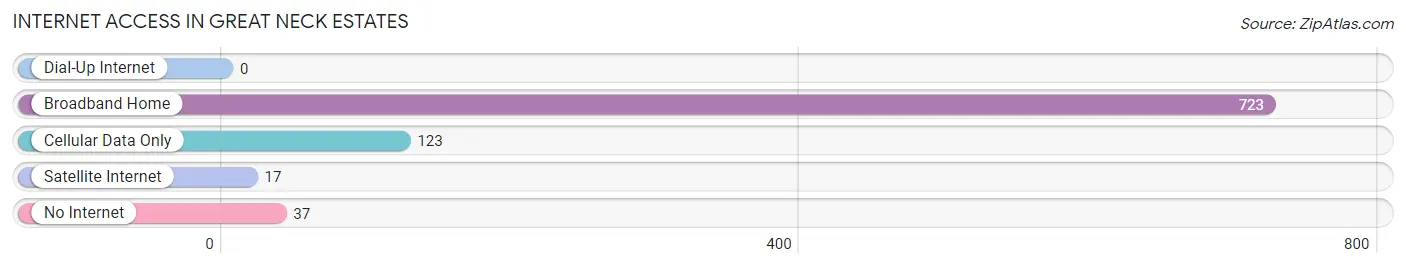
| Internet Type | # Households | % Households |
| Dial-Up Internet | 0 | 0.0% |
| Broadband Home | 723 | 79.2% |
| Cellular Data Only | 123 | 13.5% |
| Satellite Internet | 17 | 1.9% |
| No Internet | 37 | 4.1% |
| Total | 913 | 100.0% |
Great Neck Estates Summary
Geography
Great Neck Estates is a village located in Nassau County, New York, United States. It is part of the Greater Great Neck area, which includes the villages of Great Neck, Great Neck Plaza, and Great Neck Gardens, as well as an unincorporated area. The village is located on the North Shore of Long Island, and is bordered by the village of Great Neck to the east, the village of Kings Point to the south, and the village of Thomaston to the west. The village is situated on a peninsula, with Manhasset Bay to the north and Hempstead Harbor to the south. The village has a total area of 0.6 square miles, all of which is land.
History
The area that is now Great Neck Estates was originally inhabited by the Matinecock Native American tribe. The first European settlers arrived in the area in the 1640s, and the area was part of the town of North Hempstead until the formation of the village in 1931. The village was incorporated in 1931, and was originally known as “Great Neck Point”. The name was changed to “Great Neck Estates” in 1933.
The village was originally developed as a residential community, and was home to many wealthy and influential families. The village was home to many prominent figures, including the Roosevelts, the Vanderbilts, and the Astors. The village was also home to many prominent businesses, including the Great Neck Estates Country Club, which was founded in 1931.
Economy
The economy of Great Neck Estates is largely based on the service industry. The village is home to many restaurants, retail stores, and professional services. The village is also home to many financial services firms, including banks, investment firms, and insurance companies. The village is also home to many medical and healthcare facilities, including hospitals, clinics, and medical offices.
Demographics
As of the 2010 census, the village had a population of 5,845. The population was 48.3% male and 51.7% female. The median age was 43.7 years. The racial makeup of the village was 73.2% White, 8.2% Asian, 6.3% African American, 0.3% Native American, 0.1% Pacific Islander, and 11.9% from other races. The median household income was $125,000, and the median family income was $150,000.
Conclusion
Great Neck Estates is a village located in Nassau County, New York, United States. It is part of the Greater Great Neck area, and is situated on a peninsula, with Manhasset Bay to the north and Hempstead Harbor to the south. The village was originally inhabited by the Matinecock Native American tribe, and was incorporated in 1931. The economy of Great Neck Estates is largely based on the service industry, and the village has a population of 5,845, with a median age of 43.7 years. The village is home to many prominent businesses, and is a popular residential community for wealthy and influential families.
Common Questions
What is Per Capita Income in Great Neck Estates?
Per Capita income in Great Neck Estates is $100,782.
What is the Median Family Income in Great Neck Estates?
Median Family Income in Great Neck Estates is $208,819.
What is the Median Household income in Great Neck Estates?
Median Household Income in Great Neck Estates is $175,515.
What is Income or Wage Gap in Great Neck Estates?
Income or Wage Gap in Great Neck Estates is 71.2%.
Women in Great Neck Estates earn 28.8 cents for every dollar earned by a man.
What is Inequality or Gini Index in Great Neck Estates?
Inequality or Gini Index in Great Neck Estates is 0.55.
What is the Total Population of Great Neck Estates?
Total Population of Great Neck Estates is 2,936.
What is the Total Male Population of Great Neck Estates?
Total Male Population of Great Neck Estates is 1,472.
What is the Total Female Population of Great Neck Estates?
Total Female Population of Great Neck Estates is 1,464.
What is the Ratio of Males per 100 Females in Great Neck Estates?
There are 100.55 Males per 100 Females in Great Neck Estates.
What is the Ratio of Females per 100 Males in Great Neck Estates?
There are 99.46 Females per 100 Males in Great Neck Estates.
What is the Median Population Age in Great Neck Estates?
Median Population Age in Great Neck Estates is 44.3 Years.
What is the Average Family Size in Great Neck Estates
Average Family Size in Great Neck Estates is 3.5 People.
What is the Average Household Size in Great Neck Estates
Average Household Size in Great Neck Estates is 3.2 People.
How Large is the Labor Force in Great Neck Estates?
There are 1,356 People in the Labor Forcein in Great Neck Estates.
What is the Percentage of People in the Labor Force in Great Neck Estates?
58.2% of People are in the Labor Force in Great Neck Estates.
What is the Unemployment Rate in Great Neck Estates?
Unemployment Rate in Great Neck Estates is 1.4%.