Bolton Landing, NY Map & Demographics
Bolton Landing Map
Bolton Landing Overview
$55,386
PER CAPITA INCOME
$103,487
AVG FAMILY INCOME
$82,679
AVG HOUSEHOLD INCOME
0.47
INEQUALITY / GINI INDEX
325
TOTAL POPULATION
174
MALE POPULATION
151
FEMALE POPULATION
115.23
MALES / 100 FEMALES
86.78
FEMALES / 100 MALES
64.7
MEDIAN AGE
2.4
AVG FAMILY SIZE
1.9
AVG HOUSEHOLD SIZE
165
LABOR FORCE [ PEOPLE ]
50.8%
PERCENT IN LABOR FORCE
5.5%
UNEMPLOYMENT RATE
Bolton Landing Zip Codes
Bolton Landing Area Codes
Income in Bolton Landing
Income Overview in Bolton Landing
Per Capita Income in Bolton Landing is $55,386, while median incomes of families and households are $103,487 and $82,679 respectively.
| Characteristic | Number | Measure |
| Per Capita Income | 325 | $55,386 |
| Median Family Income | 105 | $103,487 |
| Mean Family Income | 105 | $127,561 |
| Median Household Income | 176 | $82,679 |
| Mean Household Income | 176 | $102,444 |
| Income Deficit | 105 | $0 |
| Wage / Income Gap (%) | 325 | 0.00% |
| Wage / Income Gap ($) | 325 | 100.00¢ per $1 |
| Gini / Inequality Index | 325 | 0.47 |
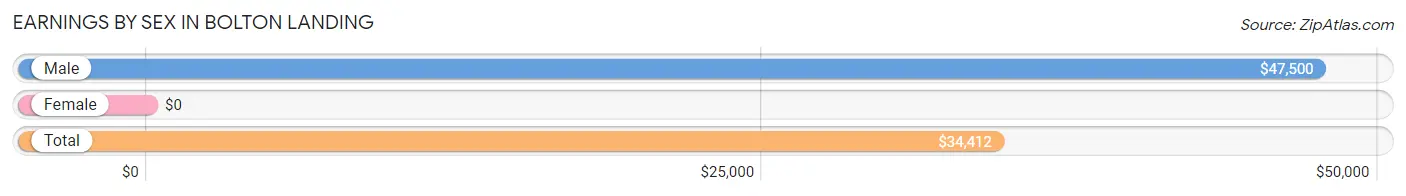
Earnings by Sex in Bolton Landing
| Sex | Number | Average Earnings |
| Male | 108 (62.8%) | $47,500 |
| Female | 64 (37.2%) | $0 |
| Total | 172 (100.0%) | $34,412 |
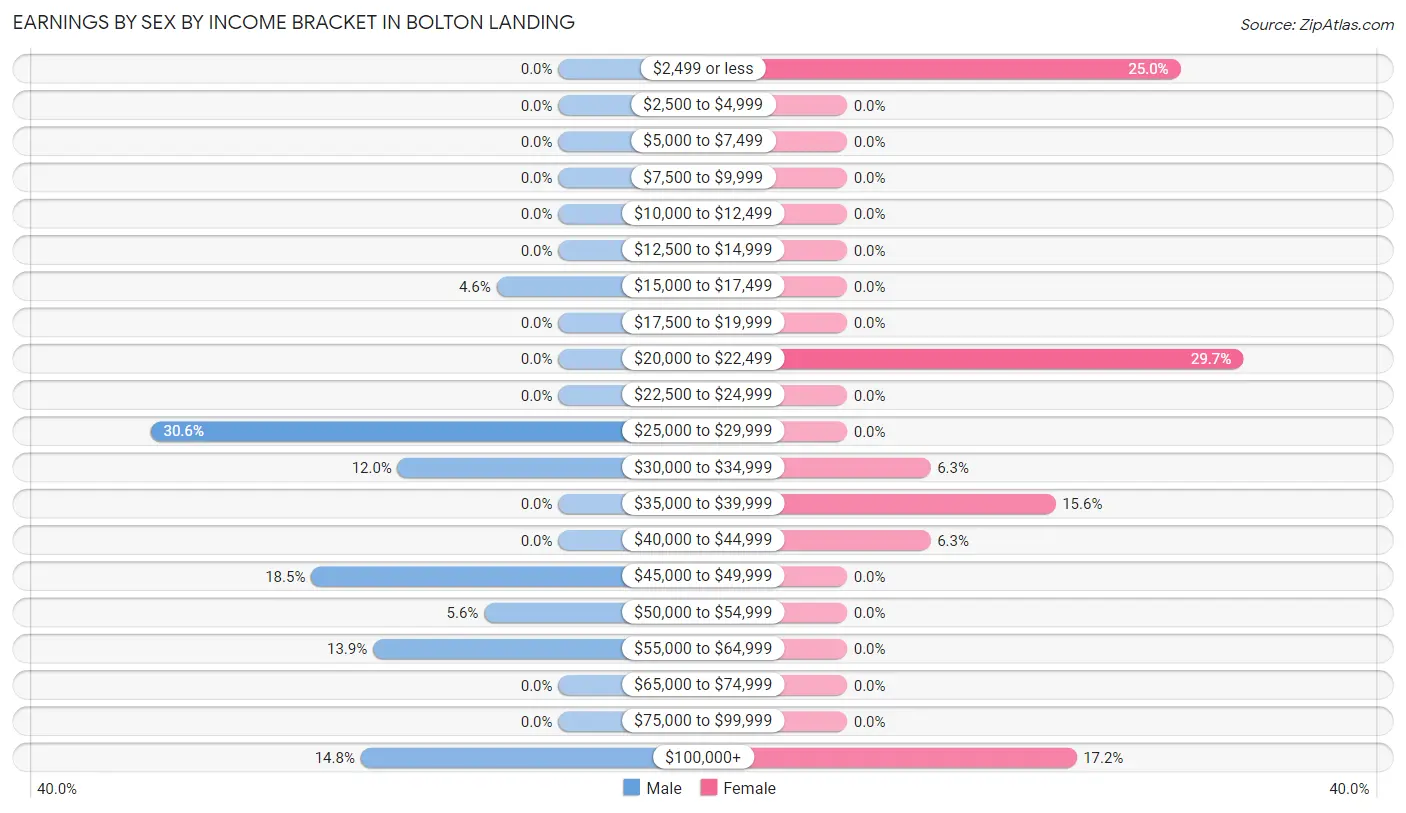
Earnings by Sex by Income Bracket in Bolton Landing
The most common earnings brackets in Bolton Landing are $25,000 to $29,999 for men (33 | 30.6%) and $20,000 to $22,499 for women (19 | 29.7%).
| Income | Male | Female |
| $2,499 or less | 0 (0.0%) | 16 (25.0%) |
| $2,500 to $4,999 | 0 (0.0%) | 0 (0.0%) |
| $5,000 to $7,499 | 0 (0.0%) | 0 (0.0%) |
| $7,500 to $9,999 | 0 (0.0%) | 0 (0.0%) |
| $10,000 to $12,499 | 0 (0.0%) | 0 (0.0%) |
| $12,500 to $14,999 | 0 (0.0%) | 0 (0.0%) |
| $15,000 to $17,499 | 5 (4.6%) | 0 (0.0%) |
| $17,500 to $19,999 | 0 (0.0%) | 0 (0.0%) |
| $20,000 to $22,499 | 0 (0.0%) | 19 (29.7%) |
| $22,500 to $24,999 | 0 (0.0%) | 0 (0.0%) |
| $25,000 to $29,999 | 33 (30.6%) | 0 (0.0%) |
| $30,000 to $34,999 | 13 (12.0%) | 4 (6.2%) |
| $35,000 to $39,999 | 0 (0.0%) | 10 (15.6%) |
| $40,000 to $44,999 | 0 (0.0%) | 4 (6.2%) |
| $45,000 to $49,999 | 20 (18.5%) | 0 (0.0%) |
| $50,000 to $54,999 | 6 (5.6%) | 0 (0.0%) |
| $55,000 to $64,999 | 15 (13.9%) | 0 (0.0%) |
| $65,000 to $74,999 | 0 (0.0%) | 0 (0.0%) |
| $75,000 to $99,999 | 0 (0.0%) | 0 (0.0%) |
| $100,000+ | 16 (14.8%) | 11 (17.2%) |
| Total | 108 (100.0%) | 64 (100.0%) |
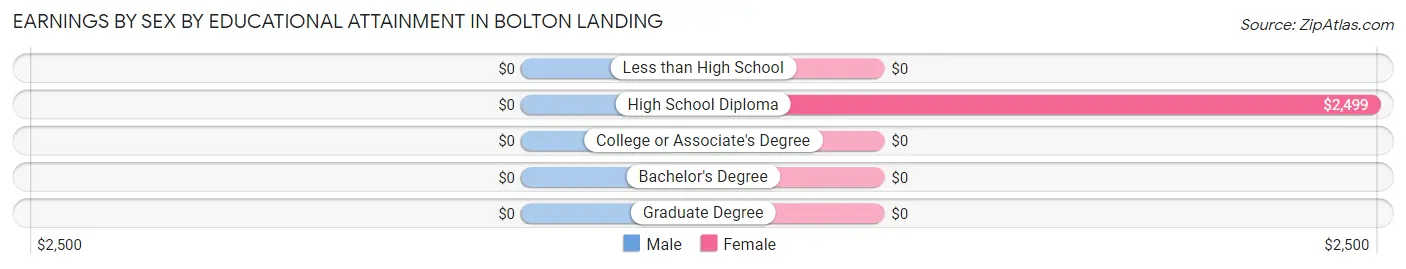
Earnings by Sex by Educational Attainment in Bolton Landing
| Educational Attainment | Male Income | Female Income |
| Less than High School | - | - |
| High School Diploma | - | - |
| College or Associate's Degree | - | - |
| Bachelor's Degree | - | - |
| Graduate Degree | - | - |
| Total | $46,667 | $0 |
Family Income in Bolton Landing
Family Income Brackets in Bolton Landing
According to the Bolton Landing family income data, there are 28 families falling into the $25,000 to $34,999 income range, which is the most common income bracket and makes up 26.7% of all families.
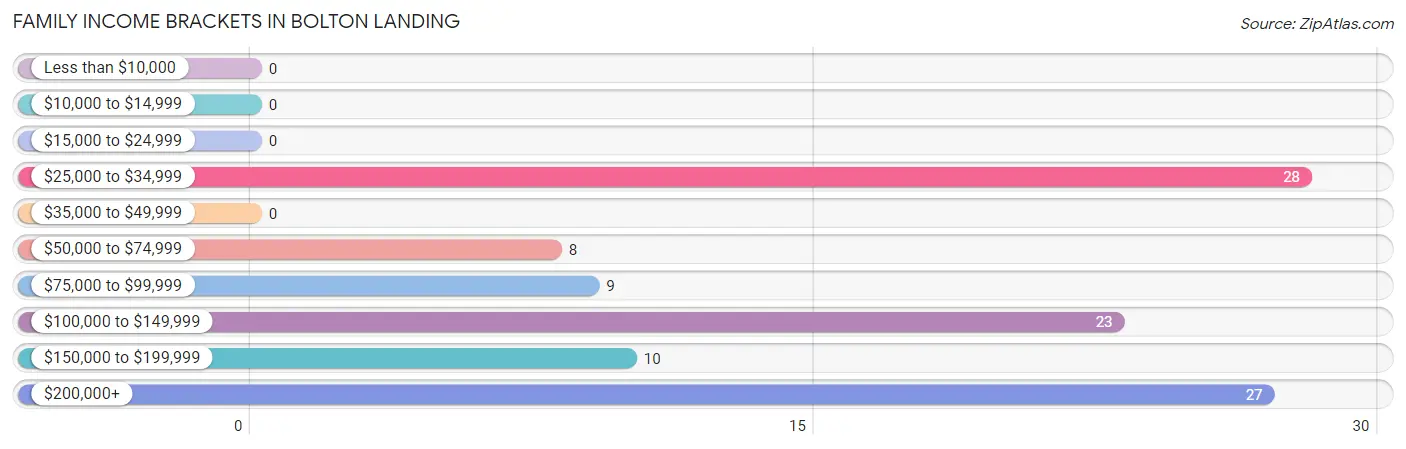
| Income Bracket | # Families | % Families |
| Less than $10,000 | 0 | 0.0% |
| $10,000 to $14,999 | 0 | 0.0% |
| $15,000 to $24,999 | 0 | 0.0% |
| $25,000 to $34,999 | 28 | 26.7% |
| $35,000 to $49,999 | 0 | 0.0% |
| $50,000 to $74,999 | 8 | 7.6% |
| $75,000 to $99,999 | 9 | 8.6% |
| $100,000 to $149,999 | 23 | 21.9% |
| $150,000 to $199,999 | 10 | 9.5% |
| $200,000+ | 27 | 25.7% |
Family Income by Famaliy Size in Bolton Landing
2-person families (61 | 58.1%) account for the highest median family income in Bolton Landing with $103,092 per family, while 2-person families (61 | 58.1%) have the highest median income of $51,546 per family member.
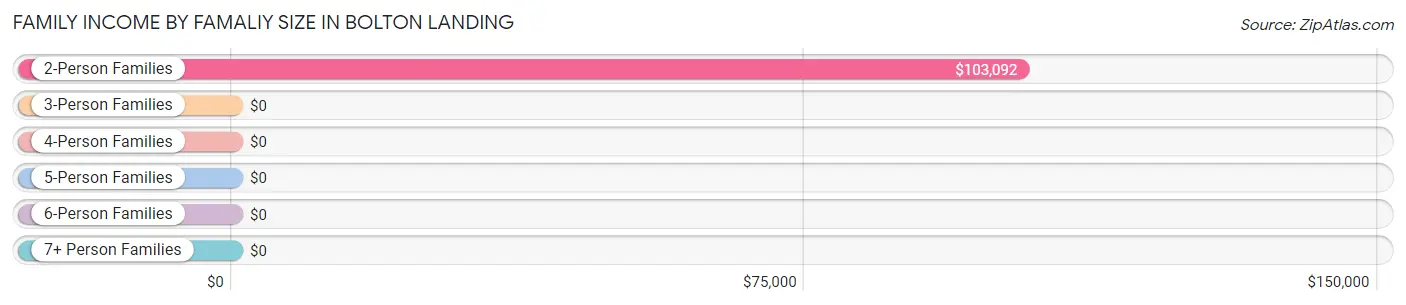
| Income Bracket | # Families | Median Income |
| 2-Person Families | 61 (58.1%) | $103,092 |
| 3-Person Families | 40 (38.1%) | $0 |
| 4-Person Families | 4 (3.8%) | $0 |
| 5-Person Families | 0 (0.0%) | $0 |
| 6-Person Families | 0 (0.0%) | $0 |
| 7+ Person Families | 0 (0.0%) | $0 |
| Total | 105 (100.0%) | $103,487 |
Family Income by Number of Earners in Bolton Landing
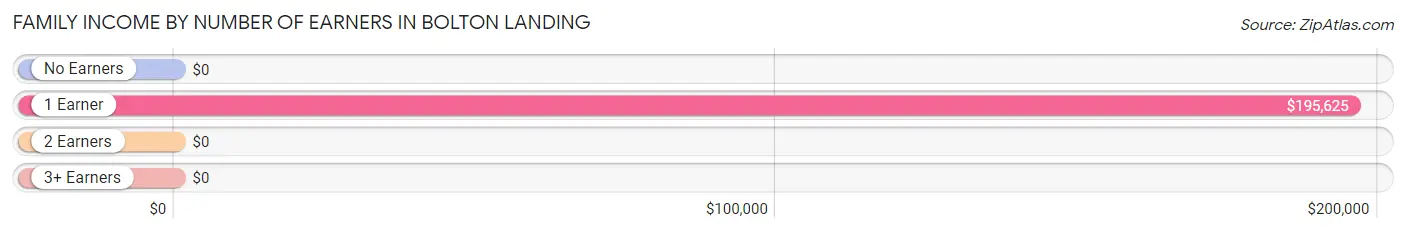
| Number of Earners | # Families | Median Income |
| No Earners | 27 (25.7%) | $0 |
| 1 Earner | 21 (20.0%) | $195,625 |
| 2 Earners | 49 (46.7%) | $0 |
| 3+ Earners | 8 (7.6%) | $0 |
| Total | 105 (100.0%) | $103,487 |
Household Income in Bolton Landing
Household Income Brackets in Bolton Landing
With 33 households falling in the category, the $200,000+ income range is the most frequent in Bolton Landing, accounting for 18.8% of all households.
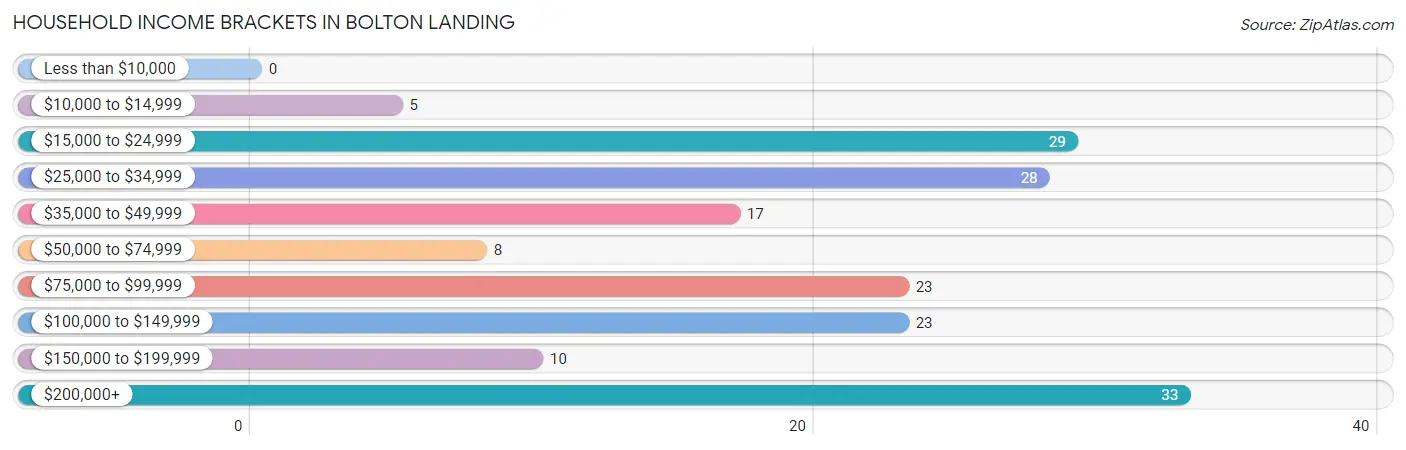
| Income Bracket | # Households | % Households |
| Less than $10,000 | 0 | 0.0% |
| $10,000 to $14,999 | 5 | 2.8% |
| $15,000 to $24,999 | 29 | 16.5% |
| $25,000 to $34,999 | 28 | 15.9% |
| $35,000 to $49,999 | 17 | 9.7% |
| $50,000 to $74,999 | 8 | 4.5% |
| $75,000 to $99,999 | 23 | 13.1% |
| $100,000 to $149,999 | 23 | 13.1% |
| $150,000 to $199,999 | 10 | 5.7% |
| $200,000+ | 33 | 18.8% |
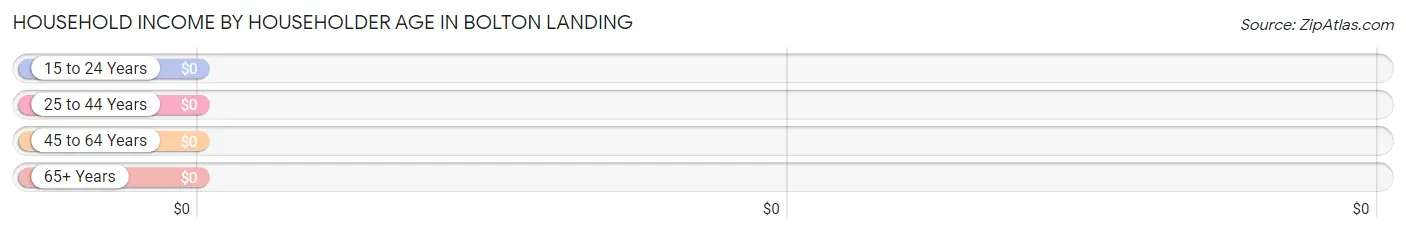
Household Income by Householder Age in Bolton Landing
| Income Bracket | # Households | Median Income |
| 15 to 24 Years | 0 (0.0%) | $0 |
| 25 to 44 Years | 6 (3.4%) | $0 |
| 45 to 64 Years | 79 (44.9%) | $0 |
| 65+ Years | 91 (51.7%) | $0 |
| Total | 176 (100.0%) | $82,679 |
Poverty in Bolton Landing
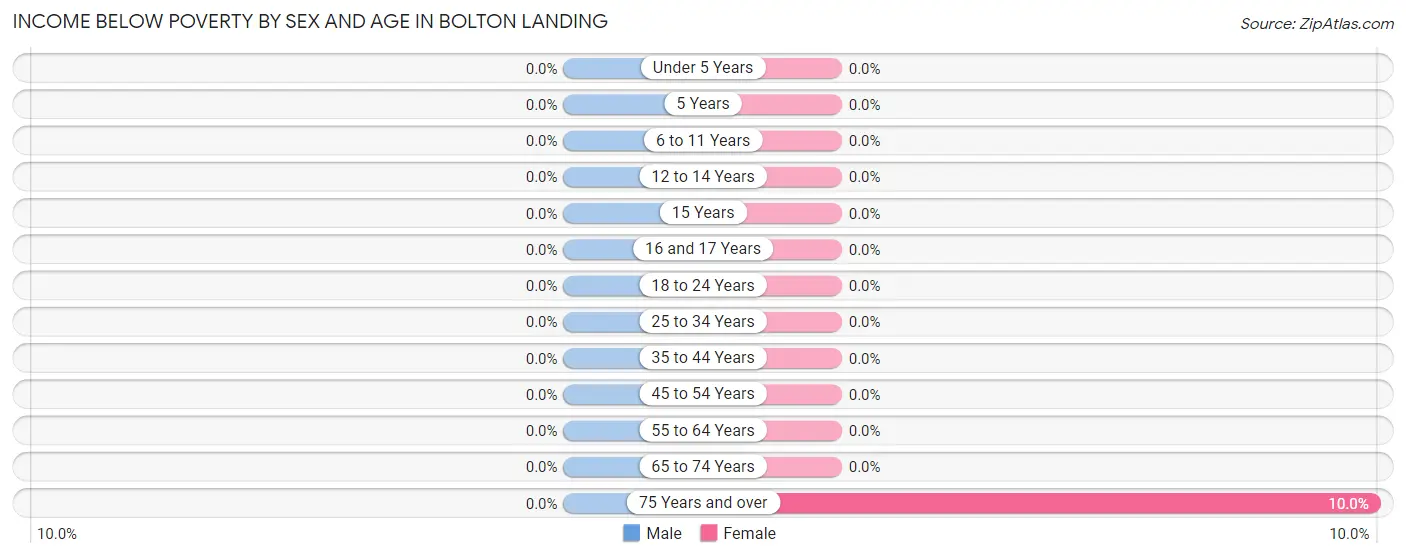
Income Below Poverty by Sex and Age in Bolton Landing
| Age Bracket | Male | Female |
| Under 5 Years | 0 (0.0%) | 0 (0.0%) |
| 5 Years | 0 (0.0%) | 0 (0.0%) |
| 6 to 11 Years | 0 (0.0%) | 0 (0.0%) |
| 12 to 14 Years | 0 (0.0%) | 0 (0.0%) |
| 15 Years | 0 (0.0%) | 0 (0.0%) |
| 16 and 17 Years | 0 (0.0%) | 0 (0.0%) |
| 18 to 24 Years | 0 (0.0%) | 0 (0.0%) |
| 25 to 34 Years | 0 (0.0%) | 0 (0.0%) |
| 35 to 44 Years | 0 (0.0%) | 0 (0.0%) |
| 45 to 54 Years | 0 (0.0%) | 0 (0.0%) |
| 55 to 64 Years | 0 (0.0%) | 0 (0.0%) |
| 65 to 74 Years | 0 (0.0%) | 0 (0.0%) |
| 75 Years and over | 0 (0.0%) | 5 (10.0%) |
| Total | 0 (0.0%) | 5 (3.3%) |
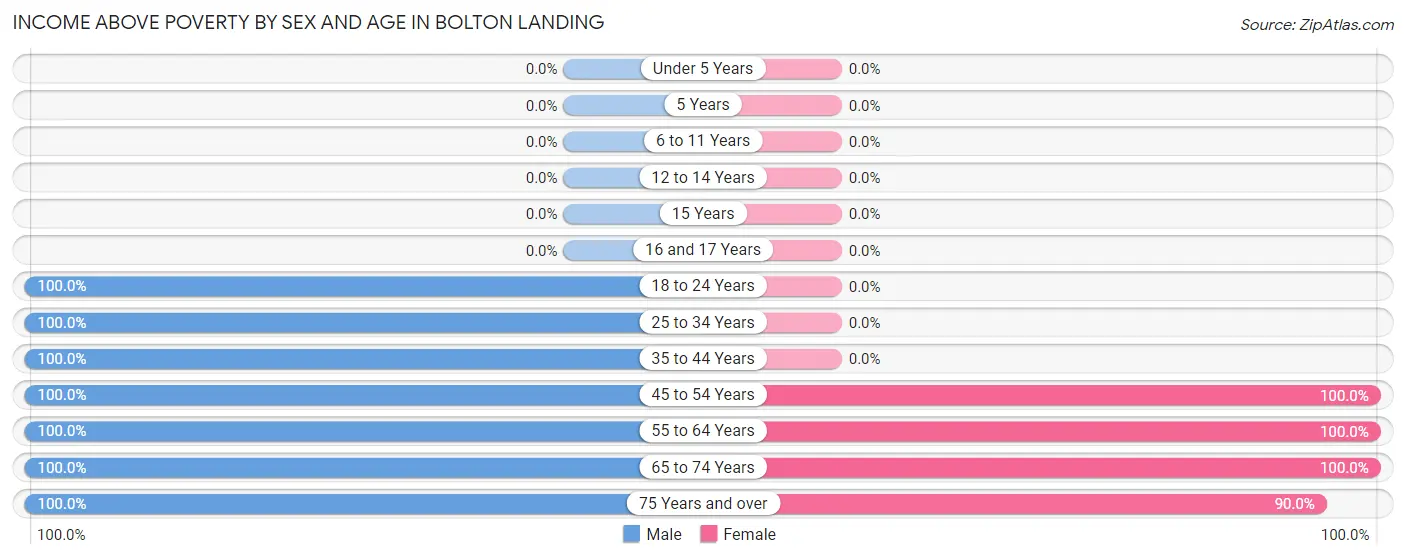
Income Above Poverty by Sex and Age in Bolton Landing
According to the poverty statistics in Bolton Landing, males aged 18 to 24 years and females aged 45 to 54 years are the age groups that are most secure financially, with 100.0% of males and 100.0% of females in these age groups living above the poverty line.
| Age Bracket | Male | Female |
| Under 5 Years | 0 (0.0%) | 0 (0.0%) |
| 5 Years | 0 (0.0%) | 0 (0.0%) |
| 6 to 11 Years | 0 (0.0%) | 0 (0.0%) |
| 12 to 14 Years | 0 (0.0%) | 0 (0.0%) |
| 15 Years | 0 (0.0%) | 0 (0.0%) |
| 16 and 17 Years | 0 (0.0%) | 0 (0.0%) |
| 18 to 24 Years | 10 (100.0%) | 0 (0.0%) |
| 25 to 34 Years | 17 (100.0%) | 0 (0.0%) |
| 35 to 44 Years | 6 (100.0%) | 0 (0.0%) |
| 45 to 54 Years | 33 (100.0%) | 7 (100.0%) |
| 55 to 64 Years | 39 (100.0%) | 53 (100.0%) |
| 65 to 74 Years | 31 (100.0%) | 41 (100.0%) |
| 75 Years and over | 38 (100.0%) | 45 (90.0%) |
| Total | 174 (100.0%) | 146 (96.7%) |
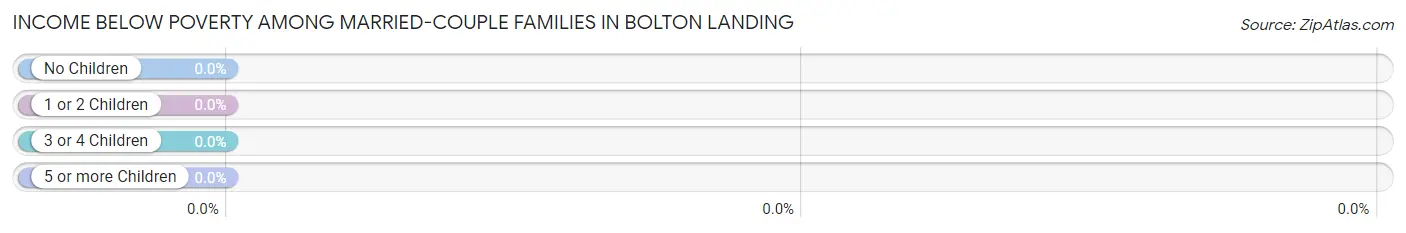
Income Below Poverty Among Married-Couple Families in Bolton Landing
| Children | Above Poverty | Below Poverty |
| No Children | 105 (100.0%) | 0 (0.0%) |
| 1 or 2 Children | 0 (0.0%) | 0 (0.0%) |
| 3 or 4 Children | 0 (0.0%) | 0 (0.0%) |
| 5 or more Children | 0 (0.0%) | 0 (0.0%) |
| Total | 105 (100.0%) | 0 (0.0%) |
Income Below Poverty Among Single-Parent Households in Bolton Landing
| Children | Single Father | Single Mother |
| No Children | 0 (0.0%) | 0 (0.0%) |
| 1 or 2 Children | 0 (0.0%) | 0 (0.0%) |
| 3 or 4 Children | 0 (0.0%) | 0 (0.0%) |
| 5 or more Children | 0 (0.0%) | 0 (0.0%) |
| Total | 0 (0.0%) | 0 (0.0%) |
Income Below Poverty Among Married-Couple vs Single-Parent Households in Bolton Landing
| Children | Married-Couple Families | Single-Parent Households |
| No Children | 0 (0.0%) | 0 (0.0%) |
| 1 or 2 Children | 0 (0.0%) | 0 (0.0%) |
| 3 or 4 Children | 0 (0.0%) | 0 (0.0%) |
| 5 or more Children | 0 (0.0%) | 0 (0.0%) |
| Total | 0 (0.0%) | 0 (0.0%) |
Race in Bolton Landing
The most populous races in Bolton Landing are , and White / Caucasian (325 | 100.0%).
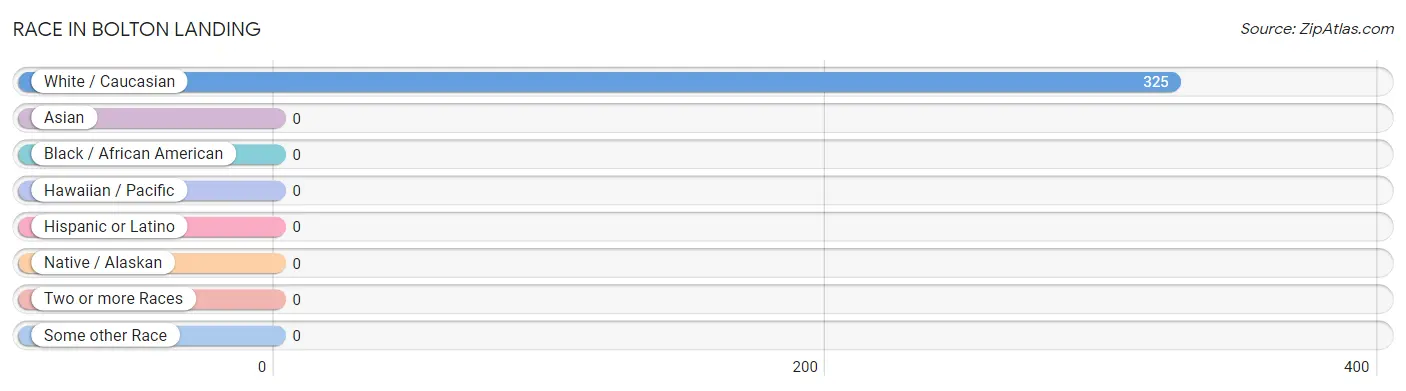
| Race | # Population | % Population |
| Asian | 0 | 0.0% |
| Black / African American | 0 | 0.0% |
| Hawaiian / Pacific | 0 | 0.0% |
| Hispanic or Latino | 0 | 0.0% |
| Native / Alaskan | 0 | 0.0% |
| White / Caucasian | 325 | 100.0% |
| Two or more Races | 0 | 0.0% |
| Some other Race | 0 | 0.0% |
| Total | 325 | 100.0% |
Ancestry in Bolton Landing
The most populous ancestries reported in Bolton Landing are Irish (105 | 32.3%), English (77 | 23.7%), Italian (55 | 16.9%), Scottish (30 | 9.2%), and Welsh (23 | 7.1%), together accounting for 89.2% of all Bolton Landing residents.
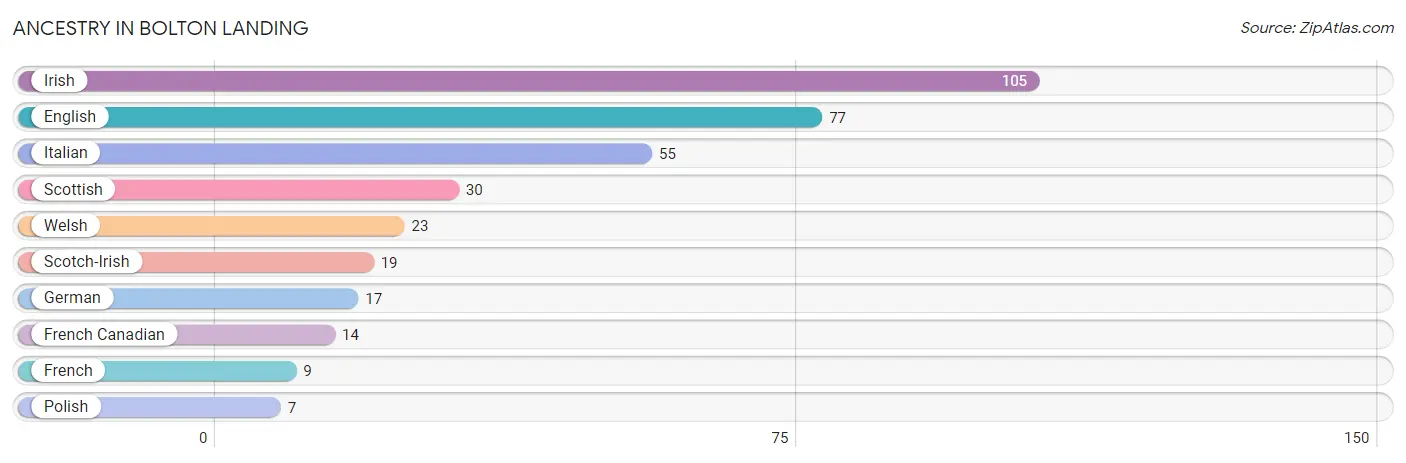
| Ancestry | # Population | % Population |
| English | 77 | 23.7% |
| French | 9 | 2.8% |
| French Canadian | 14 | 4.3% |
| German | 17 | 5.2% |
| Irish | 105 | 32.3% |
| Italian | 55 | 16.9% |
| Polish | 7 | 2.1% |
| Scotch-Irish | 19 | 5.9% |
| Scottish | 30 | 9.2% |
| Welsh | 23 | 7.1% | View All 10 Rows |
Immigrants in Bolton Landing

| Immigration Origin | # Population | % Population | View All 0 Rows |
Sex and Age in Bolton Landing
Sex and Age in Bolton Landing
The most populous age groups in Bolton Landing are 45 to 49 Years (26 | 14.9%) for men and 70 to 74 Years (41 | 27.2%) for women.
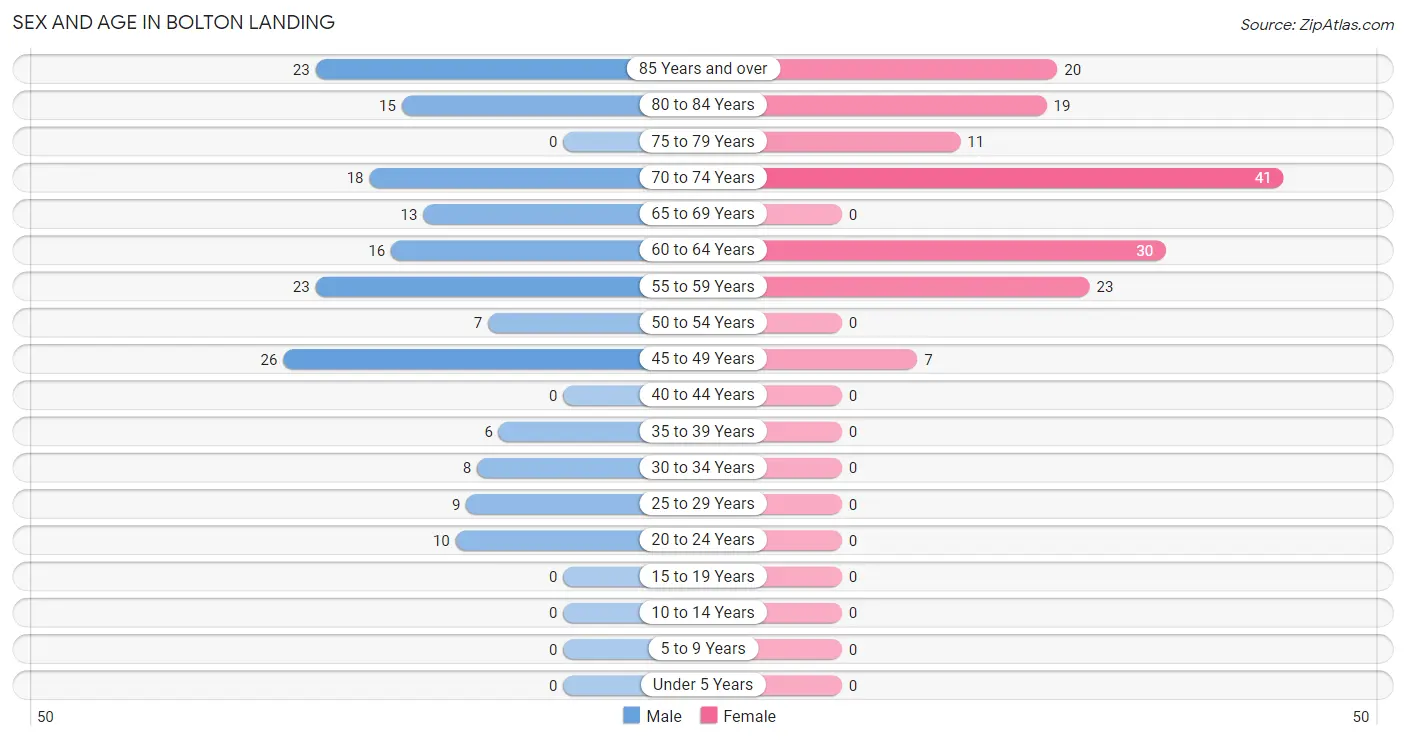
| Age Bracket | Male | Female |
| Under 5 Years | 0 (0.0%) | 0 (0.0%) |
| 5 to 9 Years | 0 (0.0%) | 0 (0.0%) |
| 10 to 14 Years | 0 (0.0%) | 0 (0.0%) |
| 15 to 19 Years | 0 (0.0%) | 0 (0.0%) |
| 20 to 24 Years | 10 (5.8%) | 0 (0.0%) |
| 25 to 29 Years | 9 (5.2%) | 0 (0.0%) |
| 30 to 34 Years | 8 (4.6%) | 0 (0.0%) |
| 35 to 39 Years | 6 (3.5%) | 0 (0.0%) |
| 40 to 44 Years | 0 (0.0%) | 0 (0.0%) |
| 45 to 49 Years | 26 (14.9%) | 7 (4.6%) |
| 50 to 54 Years | 7 (4.0%) | 0 (0.0%) |
| 55 to 59 Years | 23 (13.2%) | 23 (15.2%) |
| 60 to 64 Years | 16 (9.2%) | 30 (19.9%) |
| 65 to 69 Years | 13 (7.5%) | 0 (0.0%) |
| 70 to 74 Years | 18 (10.3%) | 41 (27.2%) |
| 75 to 79 Years | 0 (0.0%) | 11 (7.3%) |
| 80 to 84 Years | 15 (8.6%) | 19 (12.6%) |
| 85 Years and over | 23 (13.2%) | 20 (13.3%) |
| Total | 174 (100.0%) | 151 (100.0%) |
Families and Households in Bolton Landing
Median Family Size in Bolton Landing
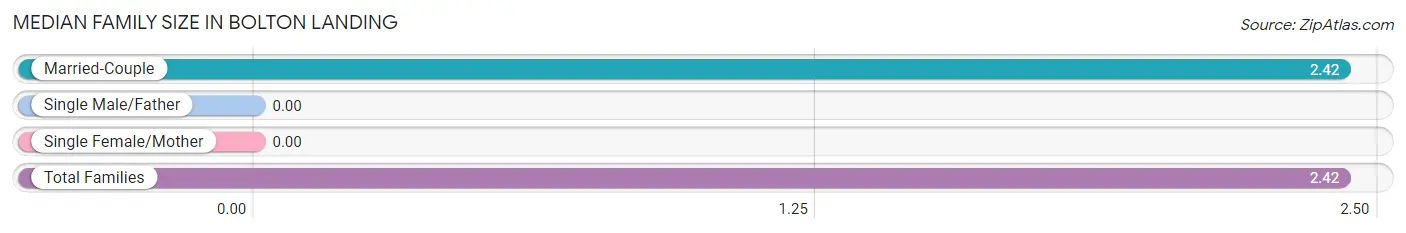
| Family Type | # Families | Family Size |
| Married-Couple | 105 (100.0%) | 2.42 |
| Single Male/Father | 0 (0.0%) | - |
| Single Female/Mother | 0 (0.0%) | - |
| Total Families | 105 (100.0%) | 2.42 |
Median Household Size in Bolton Landing
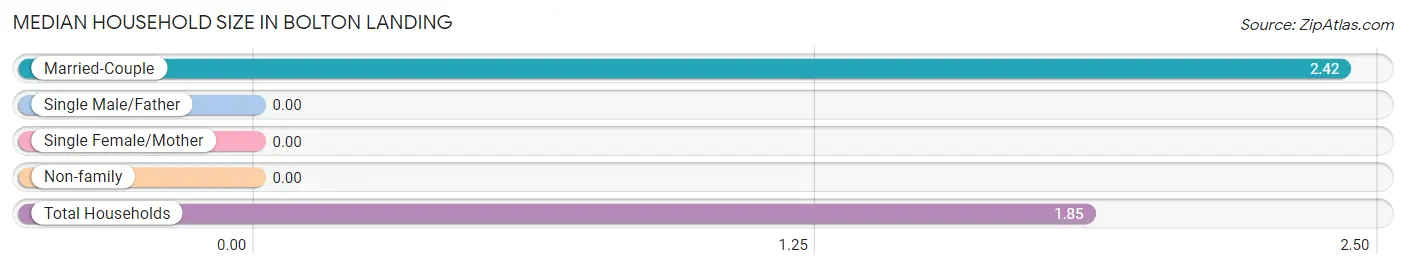
| Household Type | # Households | Household Size |
| Married-Couple | 105 (59.7%) | 2.42 |
| Single Male/Father | 0 (0.0%) | - |
| Single Female/Mother | 0 (0.0%) | - |
| Non-family | 71 (40.3%) | - |
| Total Households | 176 (100.0%) | 1.85 |
Household Size by Marriage Status in Bolton Landing
Out of a total of 176 households in Bolton Landing, 105 (59.7%) are family households, while 71 (40.3%) are nonfamily households. The most numerous type of family households are 2-person households, comprising 61, and the most common type of nonfamily households are 1-person households, comprising 71.
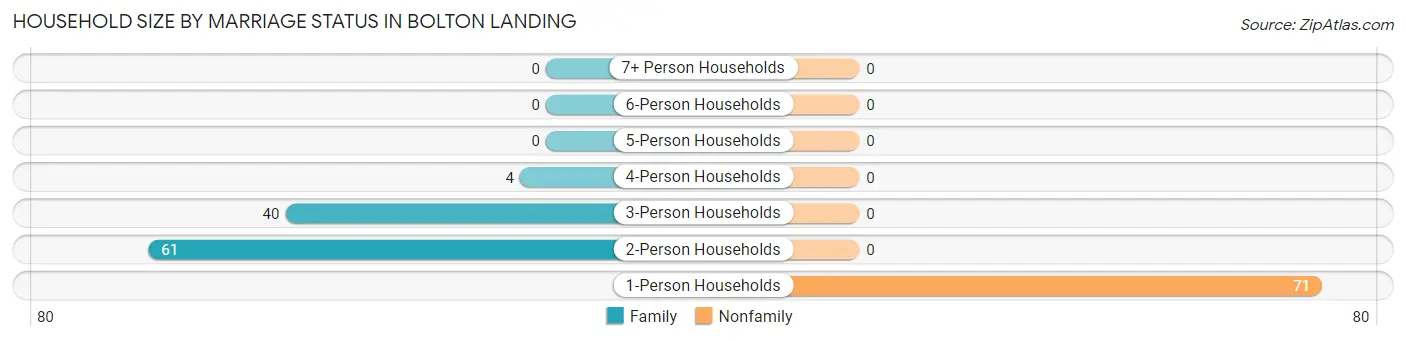
| Household Size | Family Households | Nonfamily Households |
| 1-Person Households | - | 71 (40.3%) |
| 2-Person Households | 61 (34.7%) | 0 (0.0%) |
| 3-Person Households | 40 (22.7%) | 0 (0.0%) |
| 4-Person Households | 4 (2.3%) | 0 (0.0%) |
| 5-Person Households | 0 (0.0%) | 0 (0.0%) |
| 6-Person Households | 0 (0.0%) | 0 (0.0%) |
| 7+ Person Households | 0 (0.0%) | 0 (0.0%) |
| Total | 105 (59.7%) | 71 (40.3%) |
Female Fertility in Bolton Landing
Fertility by Age in Bolton Landing
| Age Bracket | Women with Births | Births / 1,000 Women |
| 15 to 19 years | 0 (0.0%) | 0.0 |
| 20 to 34 years | 0 (0.0%) | 0.0 |
| 35 to 50 years | 0 (0.0%) | 0.0 |
| Total | 0 (0.0%) | 0.0 |
Fertility by Age by Marriage Status in Bolton Landing
| Age Bracket | Married | Unmarried |
| 15 to 19 years | 0 (0.0%) | 0 (0.0%) |
| 20 to 34 years | 0 (0.0%) | 0 (0.0%) |
| 35 to 50 years | 0 (0.0%) | 0 (0.0%) |
| Total | 0 (0.0%) | 0 (0.0%) |
Fertility by Education in Bolton Landing
| Educational Attainment | Women with Births | Births / 1,000 Women |
| Less than High School | 0 (0.0%) | 0.0 |
| High School Diploma | 0 (0.0%) | 0.0 |
| College or Associate's Degree | 0 (0.0%) | 0.0 |
| Bachelor's Degree | 0 (0.0%) | 0.0 |
| Graduate Degree | 0 (0.0%) | 0.0 |
| Total | 0 (0.0%) | 0.0 |
Fertility by Education by Marriage Status in Bolton Landing
| Educational Attainment | Married | Unmarried |
| Less than High School | 0 (0.0%) | 0 (0.0%) |
| High School Diploma | 0 (0.0%) | 0 (0.0%) |
| College or Associate's Degree | 0 (0.0%) | 0 (0.0%) |
| Bachelor's Degree | 0 (0.0%) | 0 (0.0%) |
| Graduate Degree | 0 (0.0%) | 0 (0.0%) |
| Total | 0 (0.0%) | 0 (0.0%) |
Employment Characteristics in Bolton Landing
Employment by Class of Employer in Bolton Landing
Among the 156 employed individuals in Bolton Landing, private company employees (55 | 35.3%), local government employees (55 | 35.3%), and self-employed (incorporated) (20 | 12.8%) make up the most common classes of employment.
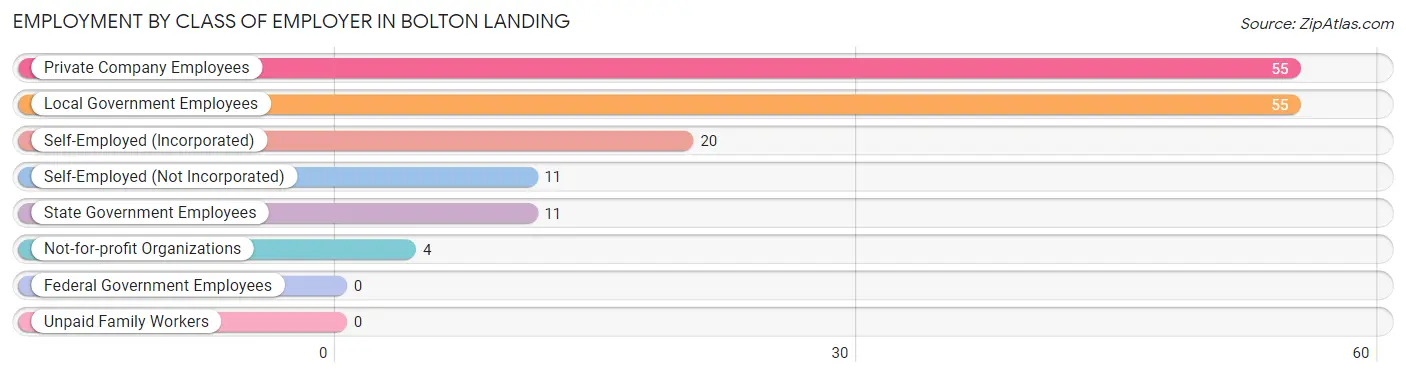
| Employer Class | # Employees | % Employees |
| Private Company Employees | 55 | 35.3% |
| Self-Employed (Incorporated) | 20 | 12.8% |
| Self-Employed (Not Incorporated) | 11 | 7.0% |
| Not-for-profit Organizations | 4 | 2.6% |
| Local Government Employees | 55 | 35.3% |
| State Government Employees | 11 | 7.0% |
| Federal Government Employees | 0 | 0.0% |
| Unpaid Family Workers | 0 | 0.0% |
| Total | 156 | 100.0% |
Employment Status by Age in Bolton Landing
According to the labor force statistics for Bolton Landing, out of the total population over 16 years of age (325), 50.8% or 165 individuals are in the labor force, with 5.5% or 9 of them unemployed. The age group with the highest labor force participation rate is 20 to 24 years, with 100.0% or 10 individuals in the labor force. Within the labor force, the 25 to 29 years age range has the highest percentage of unemployed individuals, with 55.6% or 5 of them being unemployed.
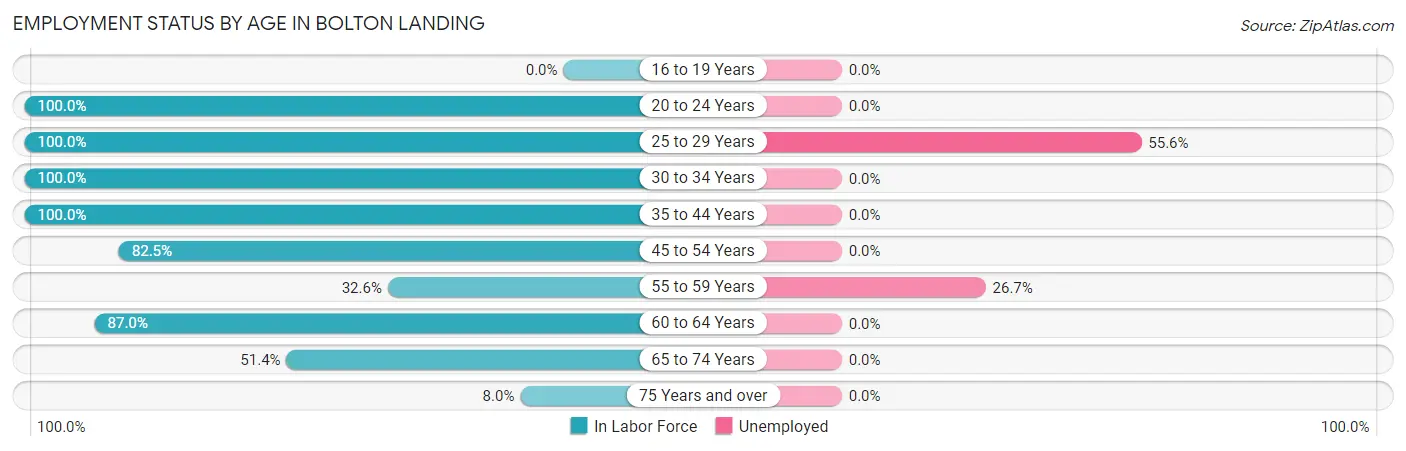
| Age Bracket | In Labor Force | Unemployed |
| 16 to 19 Years | 0 (0.0%) | 0 (0.0%) |
| 20 to 24 Years | 10 (100.0%) | 0 (0.0%) |
| 25 to 29 Years | 9 (100.0%) | 5 (55.6%) |
| 30 to 34 Years | 8 (100.0%) | 0 (0.0%) |
| 35 to 44 Years | 6 (100.0%) | 0 (0.0%) |
| 45 to 54 Years | 33 (82.5%) | 0 (0.0%) |
| 55 to 59 Years | 15 (32.6%) | 4 (26.7%) |
| 60 to 64 Years | 40 (87.0%) | 0 (0.0%) |
| 65 to 74 Years | 37 (51.4%) | 0 (0.0%) |
| 75 Years and over | 7 (8.0%) | 0 (0.0%) |
| Total | 165 (50.8%) | 9 (5.5%) |
Employment Status by Educational Attainment in Bolton Landing
According to labor force statistics for Bolton Landing, 71.6% of individuals (111) out of the total population between 25 and 64 years of age (155) are in the labor force, with 8.1% or 9 of them being unemployed. The group with the highest labor force participation rate are those with the educational attainment of less than high school, with 100.0% or 9 individuals in the labor force. Within the labor force, individuals with high school diploma education have the highest percentage of unemployment, with 18.0% or 9 of them being unemployed.
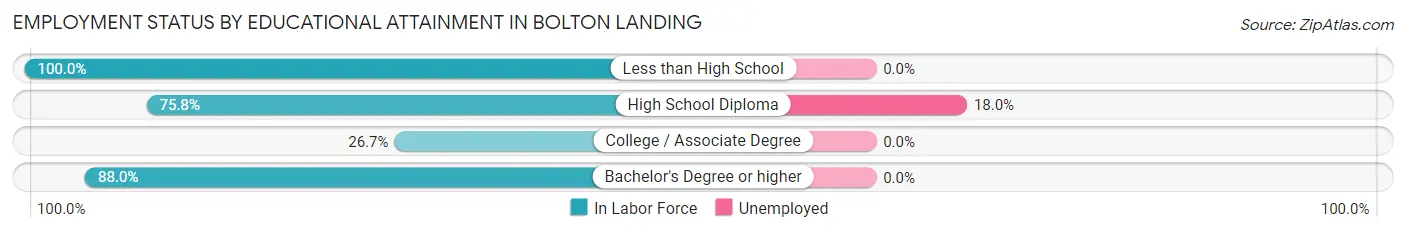
| Educational Attainment | In Labor Force | Unemployed |
| Less than High School | 9 (100.0%) | 0 (0.0%) |
| High School Diploma | 50 (75.8%) | 12 (18.0%) |
| College / Associate Degree | 8 (26.7%) | 0 (0.0%) |
| Bachelor's Degree or higher | 44 (88.0%) | 0 (0.0%) |
| Total | 111 (71.6%) | 13 (8.1%) |
Employment Occupations by Sex in Bolton Landing
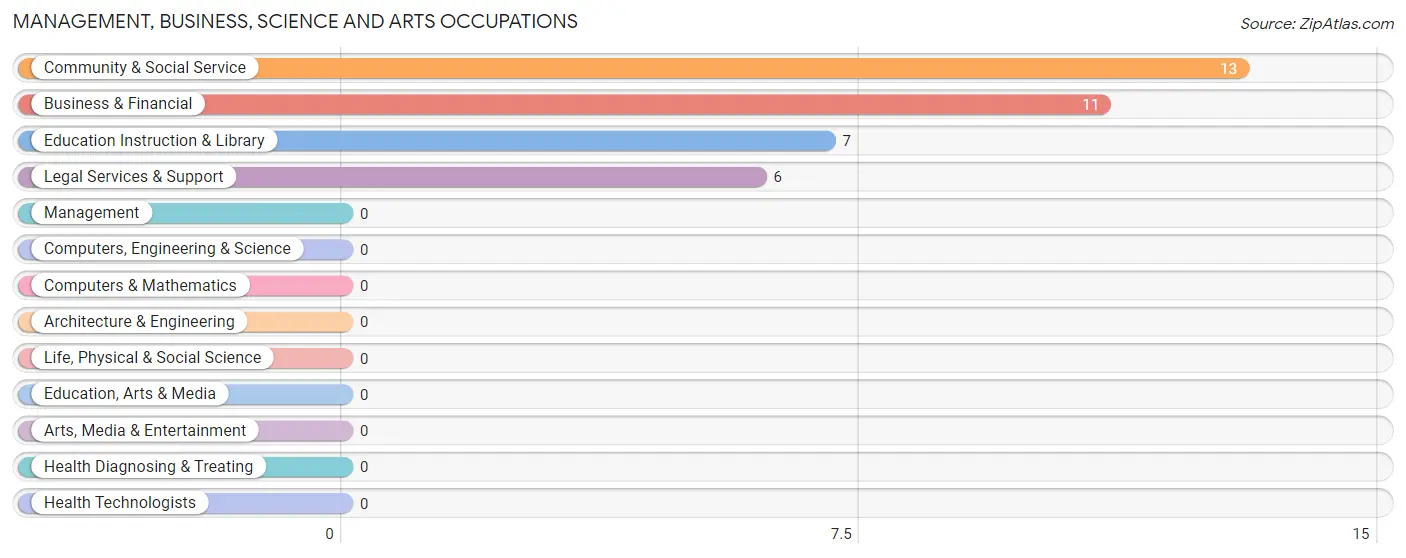
Management, Business, Science and Arts Occupations
The most common Management, Business, Science and Arts occupations in Bolton Landing are Community & Social Service (13 | 8.3%), Business & Financial (11 | 7.0%), Education Instruction & Library (7 | 4.5%), and Legal Services & Support (6 | 3.8%).
Management, Business, Science and Arts Occupations by Sex
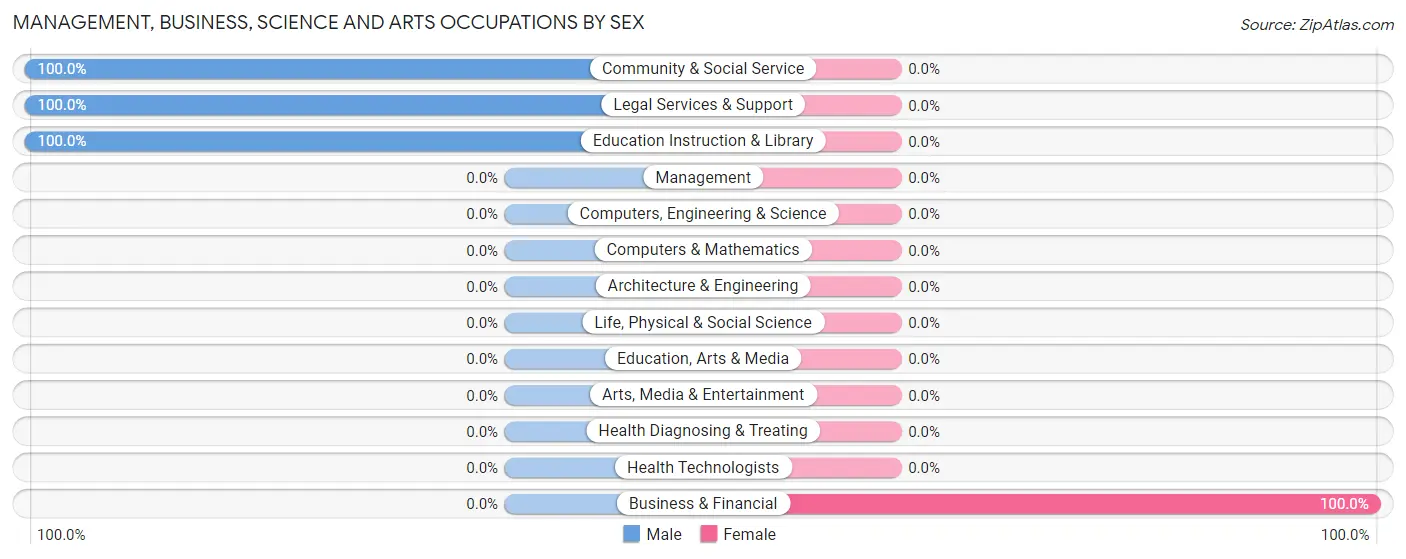
| Occupation | Male | Female |
| Management | 0 (0.0%) | 0 (0.0%) |
| Business & Financial | 0 (0.0%) | 11 (100.0%) |
| Computers, Engineering & Science | 0 (0.0%) | 0 (0.0%) |
| Computers & Mathematics | 0 (0.0%) | 0 (0.0%) |
| Architecture & Engineering | 0 (0.0%) | 0 (0.0%) |
| Life, Physical & Social Science | 0 (0.0%) | 0 (0.0%) |
| Community & Social Service | 13 (100.0%) | 0 (0.0%) |
| Education, Arts & Media | 0 (0.0%) | 0 (0.0%) |
| Legal Services & Support | 6 (100.0%) | 0 (0.0%) |
| Education Instruction & Library | 7 (100.0%) | 0 (0.0%) |
| Arts, Media & Entertainment | 0 (0.0%) | 0 (0.0%) |
| Health Diagnosing & Treating | 0 (0.0%) | 0 (0.0%) |
| Health Technologists | 0 (0.0%) | 0 (0.0%) |
| Total (Category) | 13 (54.2%) | 11 (45.8%) |
| Total (Overall) | 103 (66.0%) | 53 (34.0%) |
Services Occupations
The most common Services occupations in Bolton Landing are Food Preparation & Serving (8 | 5.1%), and Cleaning & Maintenance (3 | 1.9%).
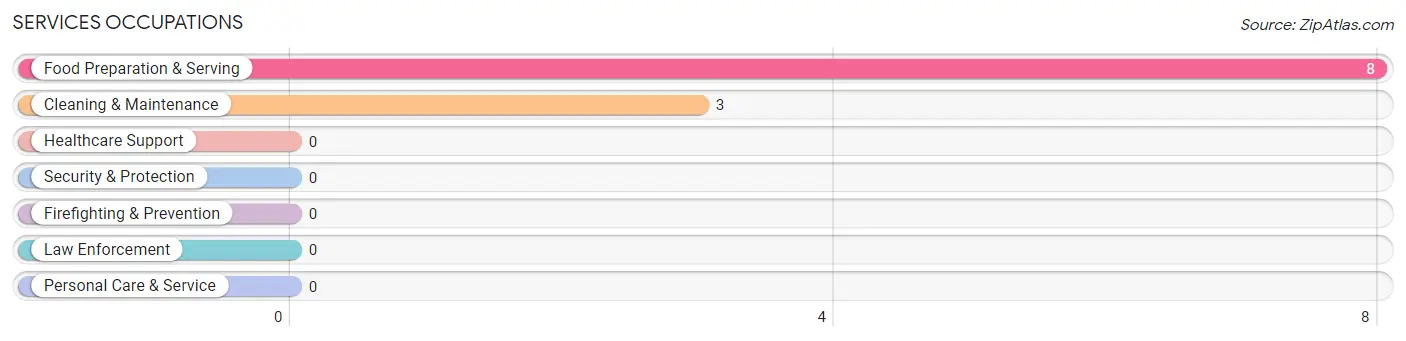
Services Occupations by Sex
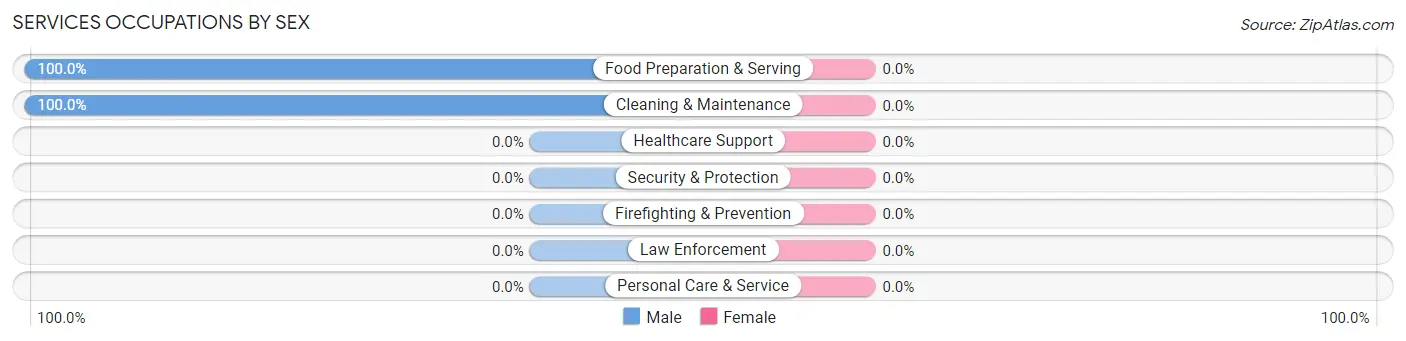
| Occupation | Male | Female |
| Healthcare Support | 0 (0.0%) | 0 (0.0%) |
| Security & Protection | 0 (0.0%) | 0 (0.0%) |
| Firefighting & Prevention | 0 (0.0%) | 0 (0.0%) |
| Law Enforcement | 0 (0.0%) | 0 (0.0%) |
| Food Preparation & Serving | 8 (100.0%) | 0 (0.0%) |
| Cleaning & Maintenance | 3 (100.0%) | 0 (0.0%) |
| Personal Care & Service | 0 (0.0%) | 0 (0.0%) |
| Total (Category) | 11 (100.0%) | 0 (0.0%) |
| Total (Overall) | 103 (66.0%) | 53 (34.0%) |
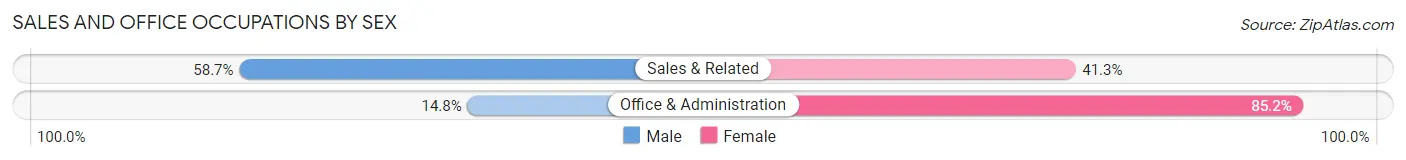
Sales and Office Occupations
The most common Sales and Office occupations in Bolton Landing are Sales & Related (46 | 29.5%), and Office & Administration (27 | 17.3%).
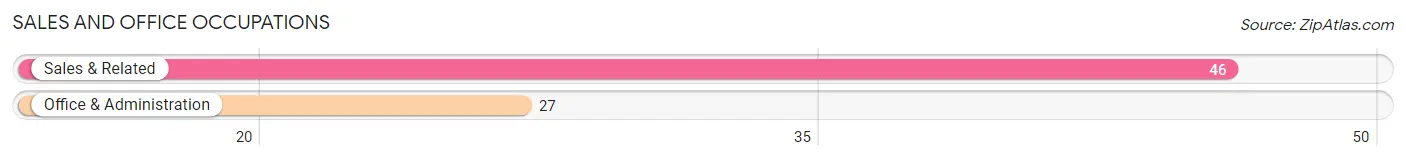
Sales and Office Occupations by Sex
| Occupation | Male | Female |
| Sales & Related | 27 (58.7%) | 19 (41.3%) |
| Office & Administration | 4 (14.8%) | 23 (85.2%) |
| Total (Category) | 31 (42.5%) | 42 (57.5%) |
| Total (Overall) | 103 (66.0%) | 53 (34.0%) |
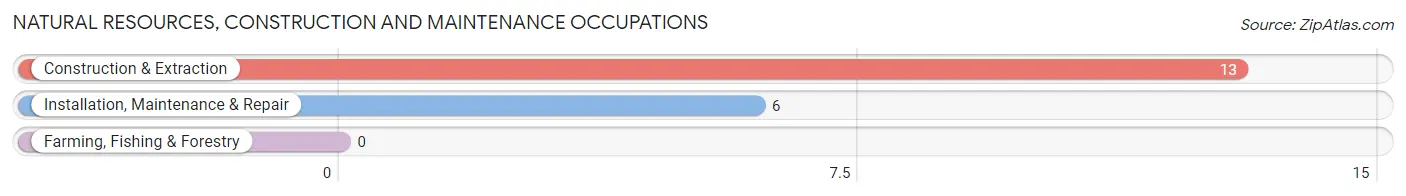
Natural Resources, Construction and Maintenance Occupations
The most common Natural Resources, Construction and Maintenance occupations in Bolton Landing are Construction & Extraction (13 | 8.3%), and Installation, Maintenance & Repair (6 | 3.8%).
Natural Resources, Construction and Maintenance Occupations by Sex
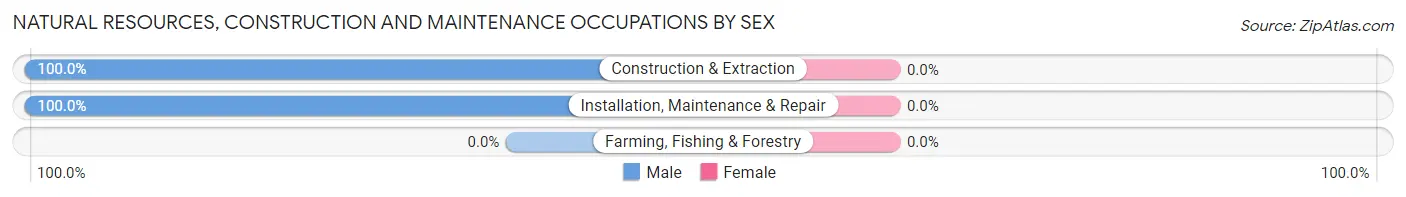
| Occupation | Male | Female |
| Farming, Fishing & Forestry | 0 (0.0%) | 0 (0.0%) |
| Construction & Extraction | 13 (100.0%) | 0 (0.0%) |
| Installation, Maintenance & Repair | 6 (100.0%) | 0 (0.0%) |
| Total (Category) | 19 (100.0%) | 0 (0.0%) |
| Total (Overall) | 103 (66.0%) | 53 (34.0%) |
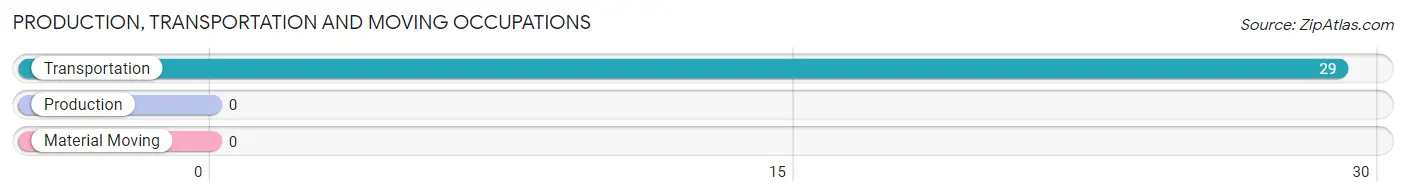
Production, Transportation and Moving Occupations
The most common Production, Transportation and Moving occupations in Bolton Landing are , and Transportation (29 | 18.6%).
Production, Transportation and Moving Occupations by Sex
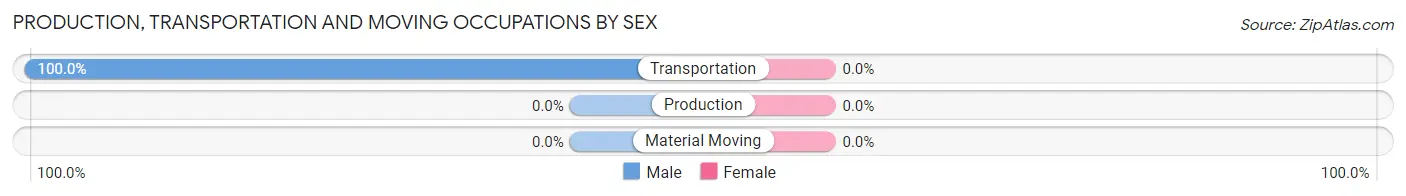
| Occupation | Male | Female |
| Production | 0 (0.0%) | 0 (0.0%) |
| Transportation | 29 (100.0%) | 0 (0.0%) |
| Material Moving | 0 (0.0%) | 0 (0.0%) |
| Total (Category) | 29 (100.0%) | 0 (0.0%) |
| Total (Overall) | 103 (66.0%) | 53 (34.0%) |
Employment Industries by Sex in Bolton Landing
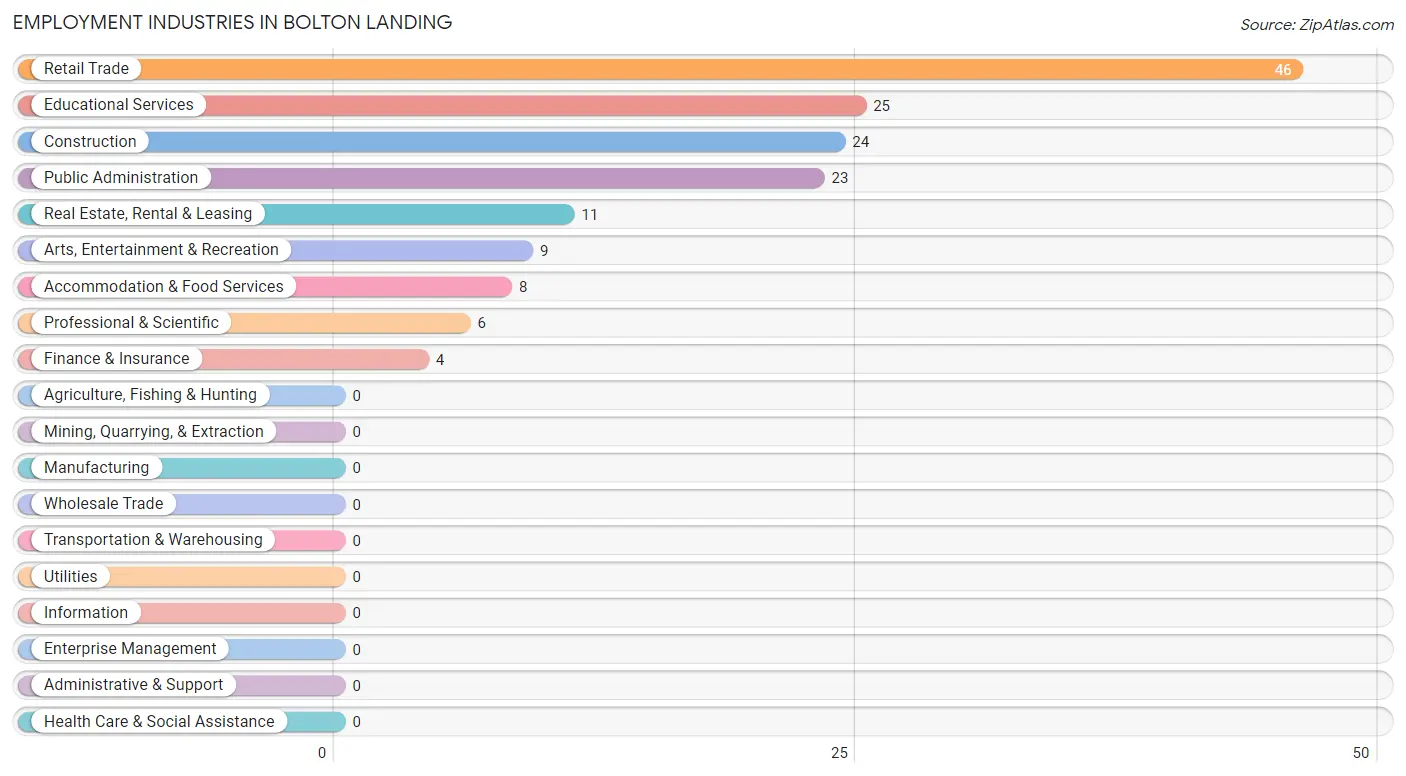
Employment Industries in Bolton Landing
The major employment industries in Bolton Landing include Retail Trade (46 | 29.5%), Educational Services (25 | 16.0%), Construction (24 | 15.4%), Public Administration (23 | 14.7%), and Real Estate, Rental & Leasing (11 | 7.0%).
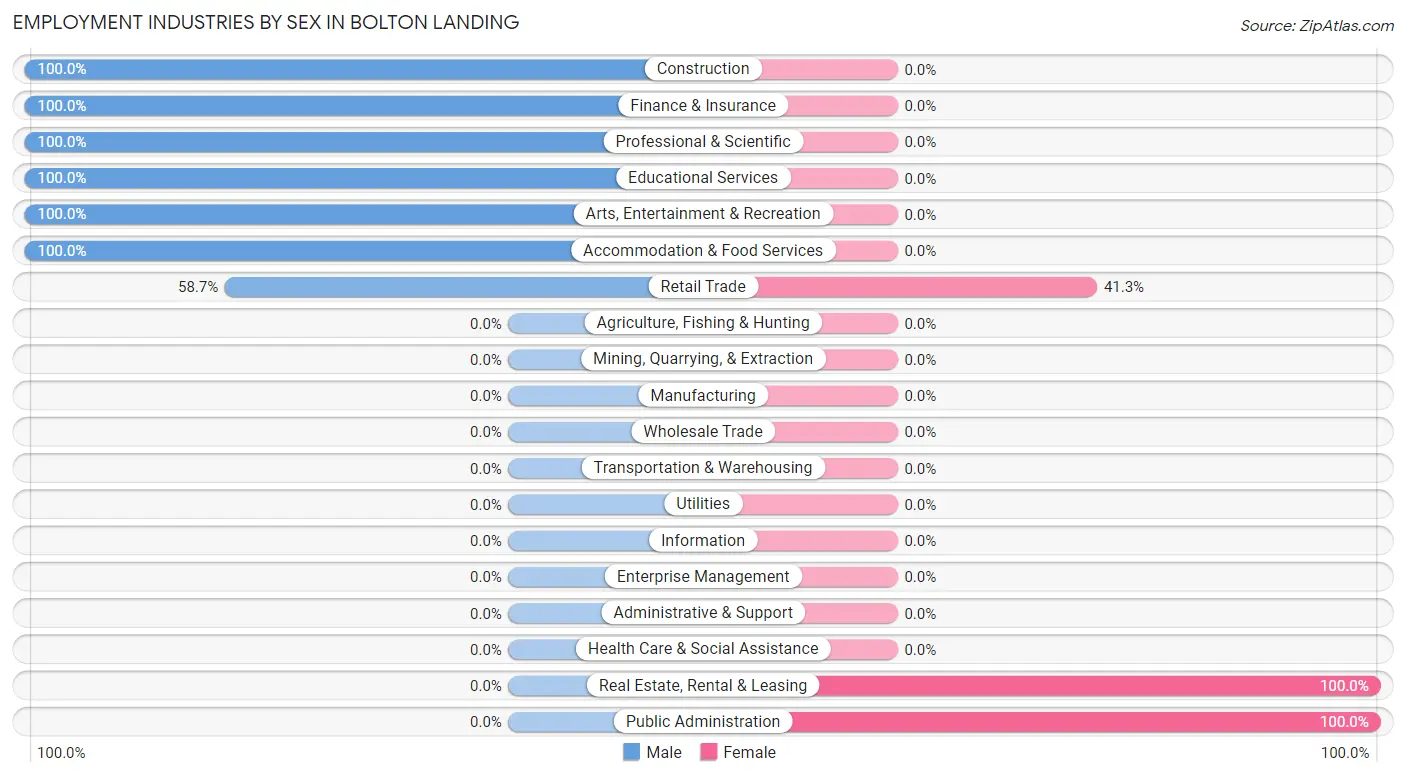
Employment Industries by Sex in Bolton Landing
The Bolton Landing industries that see more men than women are Construction (100.0%), Finance & Insurance (100.0%), and Professional & Scientific (100.0%), whereas the industries that tend to have a higher number of women are Real Estate, Rental & Leasing (100.0%), Public Administration (100.0%), and Retail Trade (41.3%).
| Industry | Male | Female |
| Agriculture, Fishing & Hunting | 0 (0.0%) | 0 (0.0%) |
| Mining, Quarrying, & Extraction | 0 (0.0%) | 0 (0.0%) |
| Construction | 24 (100.0%) | 0 (0.0%) |
| Manufacturing | 0 (0.0%) | 0 (0.0%) |
| Wholesale Trade | 0 (0.0%) | 0 (0.0%) |
| Retail Trade | 27 (58.7%) | 19 (41.3%) |
| Transportation & Warehousing | 0 (0.0%) | 0 (0.0%) |
| Utilities | 0 (0.0%) | 0 (0.0%) |
| Information | 0 (0.0%) | 0 (0.0%) |
| Finance & Insurance | 4 (100.0%) | 0 (0.0%) |
| Real Estate, Rental & Leasing | 0 (0.0%) | 11 (100.0%) |
| Professional & Scientific | 6 (100.0%) | 0 (0.0%) |
| Enterprise Management | 0 (0.0%) | 0 (0.0%) |
| Administrative & Support | 0 (0.0%) | 0 (0.0%) |
| Educational Services | 25 (100.0%) | 0 (0.0%) |
| Health Care & Social Assistance | 0 (0.0%) | 0 (0.0%) |
| Arts, Entertainment & Recreation | 9 (100.0%) | 0 (0.0%) |
| Accommodation & Food Services | 8 (100.0%) | 0 (0.0%) |
| Public Administration | 0 (0.0%) | 23 (100.0%) |
| Total | 103 (66.0%) | 53 (34.0%) |
Education in Bolton Landing
School Enrollment in Bolton Landing
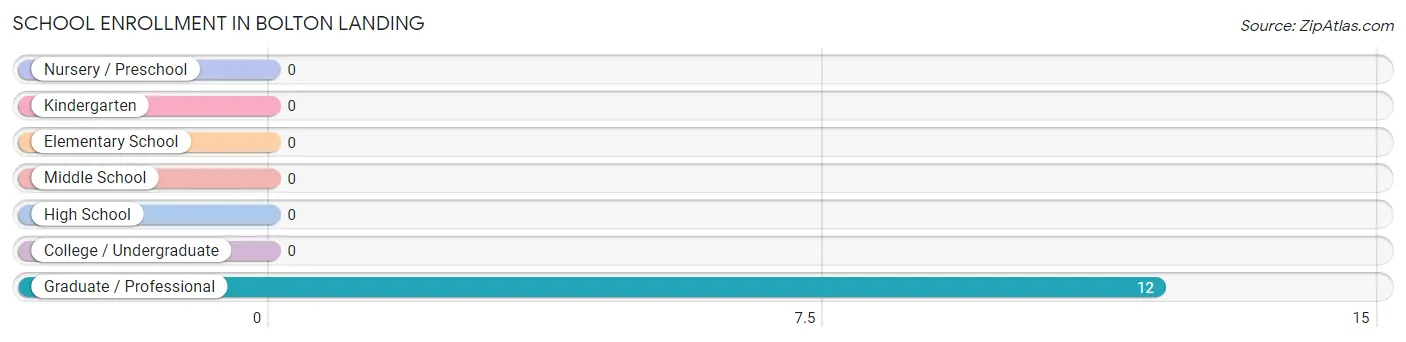
| School Level | # Students | % Students |
| Nursery / Preschool | 0 | 0.0% |
| Kindergarten | 0 | 0.0% |
| Elementary School | 0 | 0.0% |
| Middle School | 0 | 0.0% |
| High School | 0 | 0.0% |
| College / Undergraduate | 0 | 0.0% |
| Graduate / Professional | 12 | 100.0% |
| Total | 12 | 100.0% |
School Enrollment by Age by Funding Source in Bolton Landing
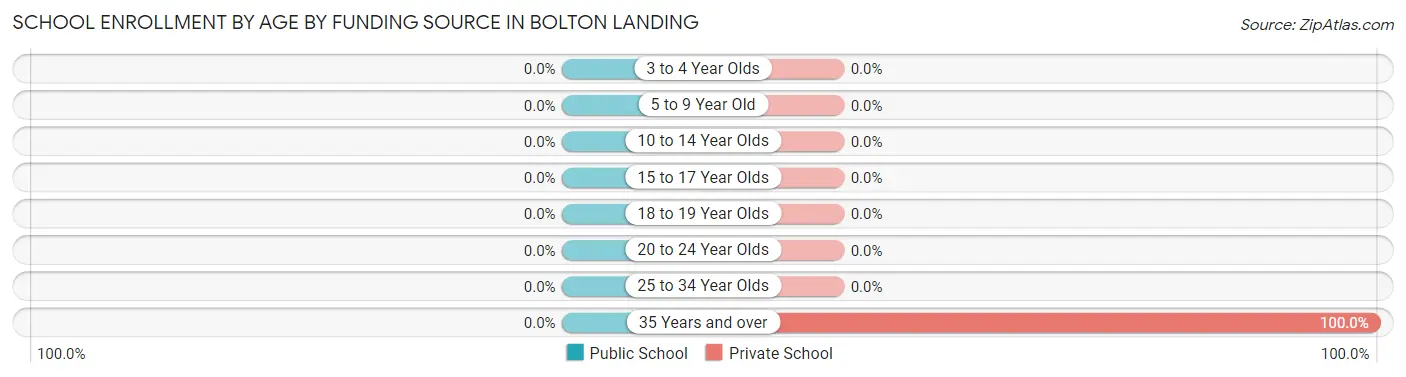
| Age Bracket | Public School | Private School |
| 3 to 4 Year Olds | 0 (0.0%) | 0 (0.0%) |
| 5 to 9 Year Old | 0 (0.0%) | 0 (0.0%) |
| 10 to 14 Year Olds | 0 (0.0%) | 0 (0.0%) |
| 15 to 17 Year Olds | 0 (0.0%) | 0 (0.0%) |
| 18 to 19 Year Olds | 0 (0.0%) | 0 (0.0%) |
| 20 to 24 Year Olds | 0 (0.0%) | 0 (0.0%) |
| 25 to 34 Year Olds | 0 (0.0%) | 0 (0.0%) |
| 35 Years and over | 0 (0.0%) | 12 (100.0%) |
| Total | 0 (0.0%) | 12 (100.0%) |
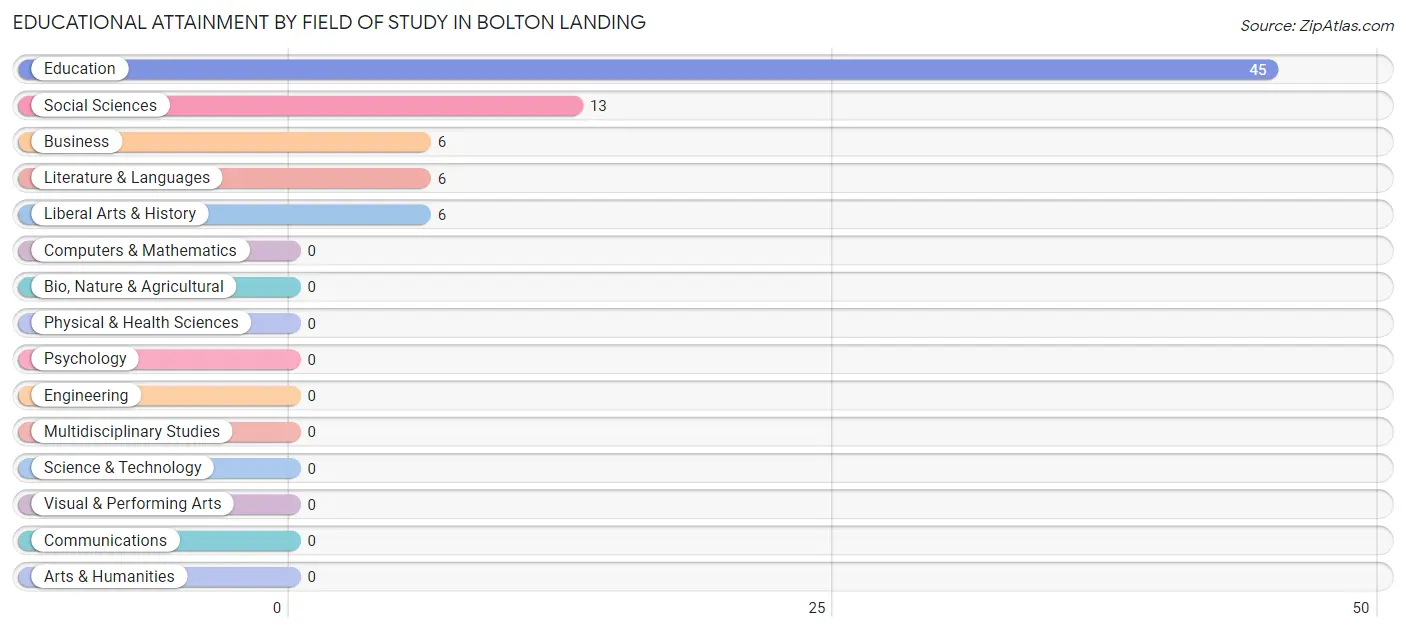
Educational Attainment by Field of Study in Bolton Landing
Education (45 | 59.2%), social sciences (13 | 17.1%), business (6 | 7.9%), literature & languages (6 | 7.9%), and liberal arts & history (6 | 7.9%) are the most common fields of study among 76 individuals in Bolton Landing who have obtained a bachelor's degree or higher.
| Field of Study | # Graduates | % Graduates |
| Computers & Mathematics | 0 | 0.0% |
| Bio, Nature & Agricultural | 0 | 0.0% |
| Physical & Health Sciences | 0 | 0.0% |
| Psychology | 0 | 0.0% |
| Social Sciences | 13 | 17.1% |
| Engineering | 0 | 0.0% |
| Multidisciplinary Studies | 0 | 0.0% |
| Science & Technology | 0 | 0.0% |
| Business | 6 | 7.9% |
| Education | 45 | 59.2% |
| Literature & Languages | 6 | 7.9% |
| Liberal Arts & History | 6 | 7.9% |
| Visual & Performing Arts | 0 | 0.0% |
| Communications | 0 | 0.0% |
| Arts & Humanities | 0 | 0.0% |
| Total | 76 | 100.0% |
Transportation & Commute in Bolton Landing
Vehicle Availability by Sex in Bolton Landing
The most prevalent vehicle ownership categories in Bolton Landing are males with 2 vehicles (40, accounting for 38.8%) and females with 2 vehicles (30, making up 75.5%).
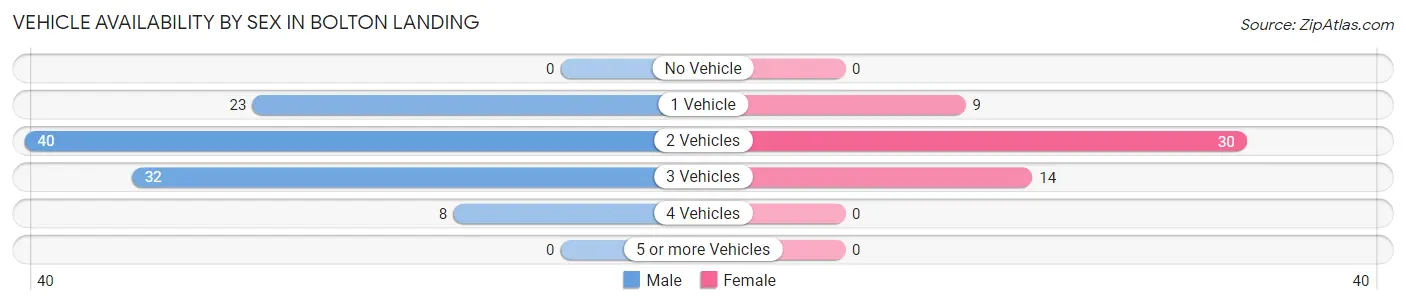
| Vehicles Available | Male | Female |
| No Vehicle | 0 (0.0%) | 0 (0.0%) |
| 1 Vehicle | 23 (22.3%) | 9 (17.0%) |
| 2 Vehicles | 40 (38.8%) | 30 (56.6%) |
| 3 Vehicles | 32 (31.1%) | 14 (26.4%) |
| 4 Vehicles | 8 (7.8%) | 0 (0.0%) |
| 5 or more Vehicles | 0 (0.0%) | 0 (0.0%) |
| Total | 103 (100.0%) | 53 (100.0%) |
Commute Time in Bolton Landing
The most frequently occuring commute durations in Bolton Landing are 5 to 9 minutes (79 commuters, 56.8%), less than 5 minutes (36 commuters, 25.9%), and 90 or more minutes (16 commuters, 11.5%).
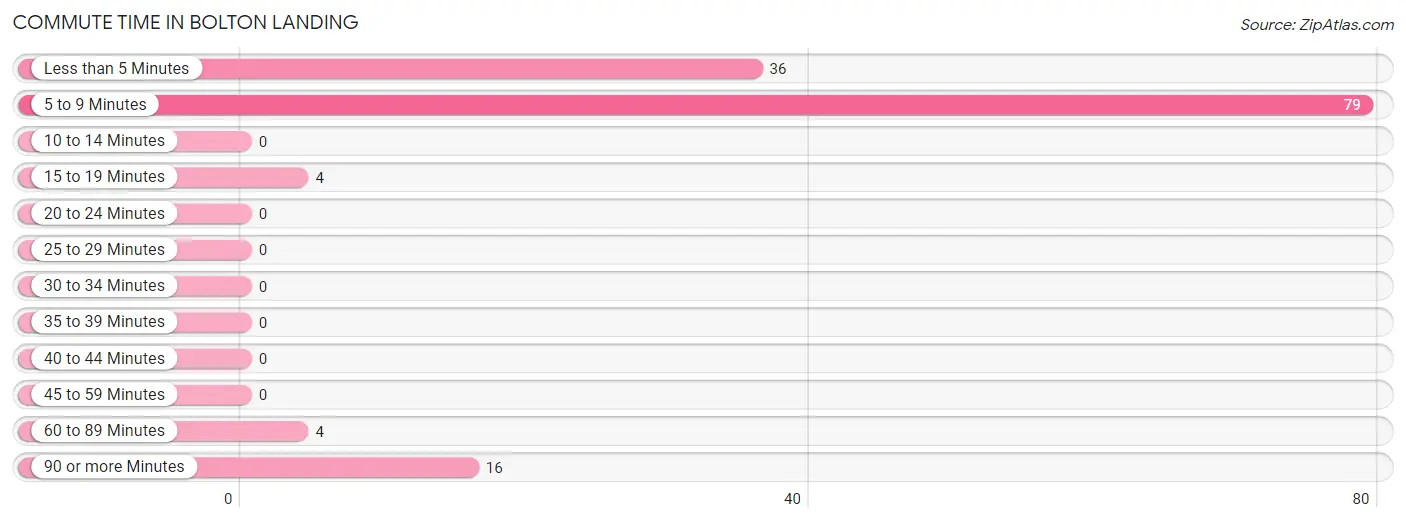
| Commute Time | # Commuters | % Commuters |
| Less than 5 Minutes | 36 | 25.9% |
| 5 to 9 Minutes | 79 | 56.8% |
| 10 to 14 Minutes | 0 | 0.0% |
| 15 to 19 Minutes | 4 | 2.9% |
| 20 to 24 Minutes | 0 | 0.0% |
| 25 to 29 Minutes | 0 | 0.0% |
| 30 to 34 Minutes | 0 | 0.0% |
| 35 to 39 Minutes | 0 | 0.0% |
| 40 to 44 Minutes | 0 | 0.0% |
| 45 to 59 Minutes | 0 | 0.0% |
| 60 to 89 Minutes | 4 | 2.9% |
| 90 or more Minutes | 16 | 11.5% |
Commute Time by Sex in Bolton Landing
The most common commute times in Bolton Landing are 5 to 9 minutes (56 commuters, 57.7%) for males and 5 to 9 minutes (23 commuters, 54.8%) for females.
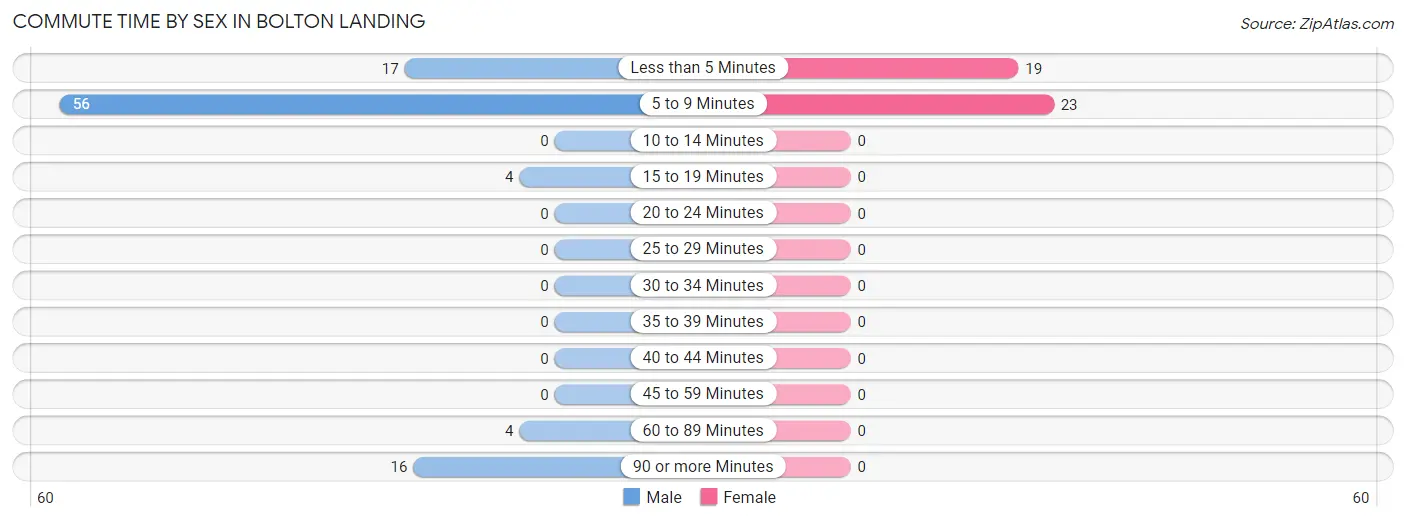
| Commute Time | Male | Female |
| Less than 5 Minutes | 17 (17.5%) | 19 (45.2%) |
| 5 to 9 Minutes | 56 (57.7%) | 23 (54.8%) |
| 10 to 14 Minutes | 0 (0.0%) | 0 (0.0%) |
| 15 to 19 Minutes | 4 (4.1%) | 0 (0.0%) |
| 20 to 24 Minutes | 0 (0.0%) | 0 (0.0%) |
| 25 to 29 Minutes | 0 (0.0%) | 0 (0.0%) |
| 30 to 34 Minutes | 0 (0.0%) | 0 (0.0%) |
| 35 to 39 Minutes | 0 (0.0%) | 0 (0.0%) |
| 40 to 44 Minutes | 0 (0.0%) | 0 (0.0%) |
| 45 to 59 Minutes | 0 (0.0%) | 0 (0.0%) |
| 60 to 89 Minutes | 4 (4.1%) | 0 (0.0%) |
| 90 or more Minutes | 16 (16.5%) | 0 (0.0%) |
Time of Departure to Work by Sex in Bolton Landing
The most frequent times of departure to work in Bolton Landing are 8:00 AM to 8:29 AM (26, 26.8%) for males and 8:30 AM to 8:59 AM (19, 45.2%) for females.
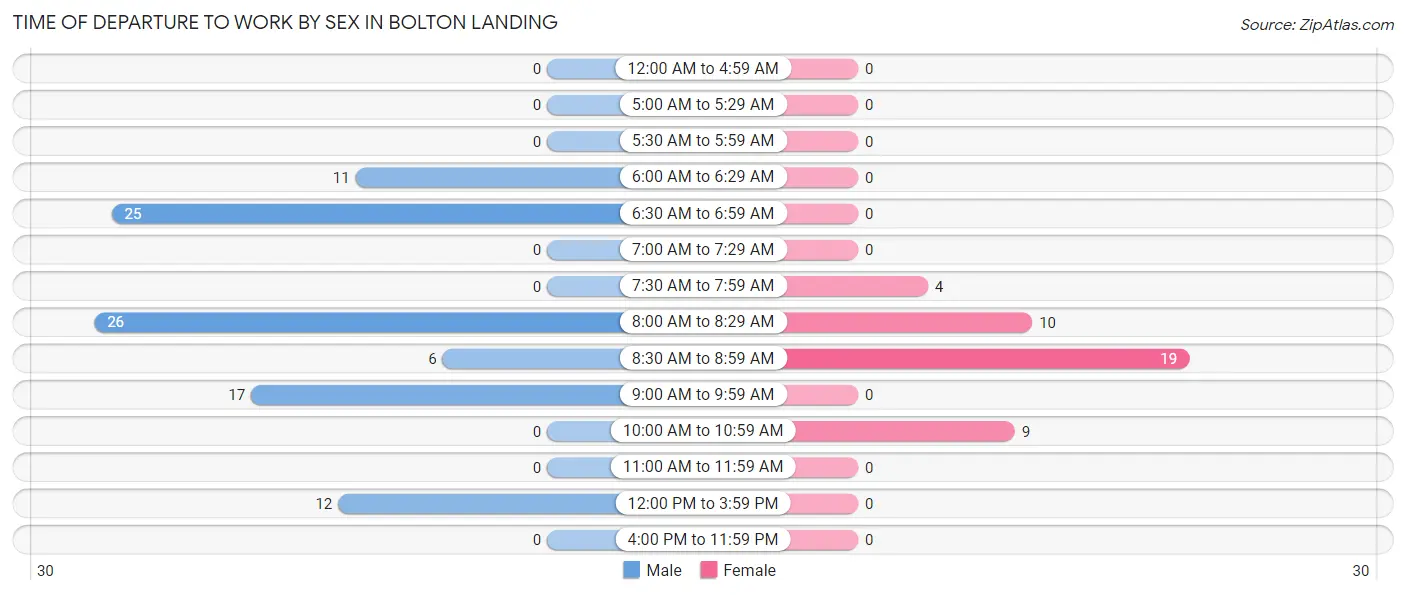
| Time of Departure | Male | Female |
| 12:00 AM to 4:59 AM | 0 (0.0%) | 0 (0.0%) |
| 5:00 AM to 5:29 AM | 0 (0.0%) | 0 (0.0%) |
| 5:30 AM to 5:59 AM | 0 (0.0%) | 0 (0.0%) |
| 6:00 AM to 6:29 AM | 11 (11.3%) | 0 (0.0%) |
| 6:30 AM to 6:59 AM | 25 (25.8%) | 0 (0.0%) |
| 7:00 AM to 7:29 AM | 0 (0.0%) | 0 (0.0%) |
| 7:30 AM to 7:59 AM | 0 (0.0%) | 4 (9.5%) |
| 8:00 AM to 8:29 AM | 26 (26.8%) | 10 (23.8%) |
| 8:30 AM to 8:59 AM | 6 (6.2%) | 19 (45.2%) |
| 9:00 AM to 9:59 AM | 17 (17.5%) | 0 (0.0%) |
| 10:00 AM to 10:59 AM | 0 (0.0%) | 9 (21.4%) |
| 11:00 AM to 11:59 AM | 0 (0.0%) | 0 (0.0%) |
| 12:00 PM to 3:59 PM | 12 (12.4%) | 0 (0.0%) |
| 4:00 PM to 11:59 PM | 0 (0.0%) | 0 (0.0%) |
| Total | 97 (100.0%) | 42 (100.0%) |
Housing Occupancy in Bolton Landing
Occupancy by Ownership in Bolton Landing
Of the total 176 dwellings in Bolton Landing, owner-occupied units account for 150 (85.2%), while renter-occupied units make up 26 (14.8%).
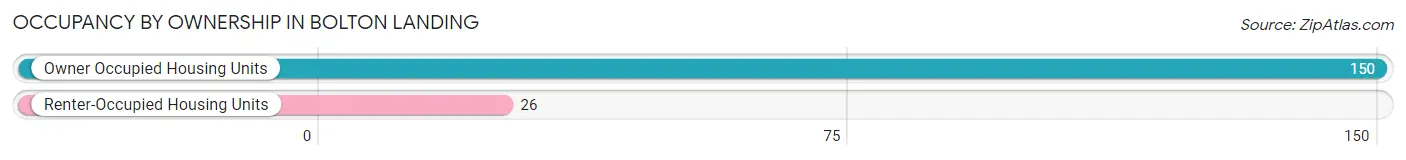
| Occupancy | # Housing Units | % Housing Units |
| Owner Occupied Housing Units | 150 | 85.2% |
| Renter-Occupied Housing Units | 26 | 14.8% |
| Total Occupied Housing Units | 176 | 100.0% |
Occupancy by Household Size in Bolton Landing
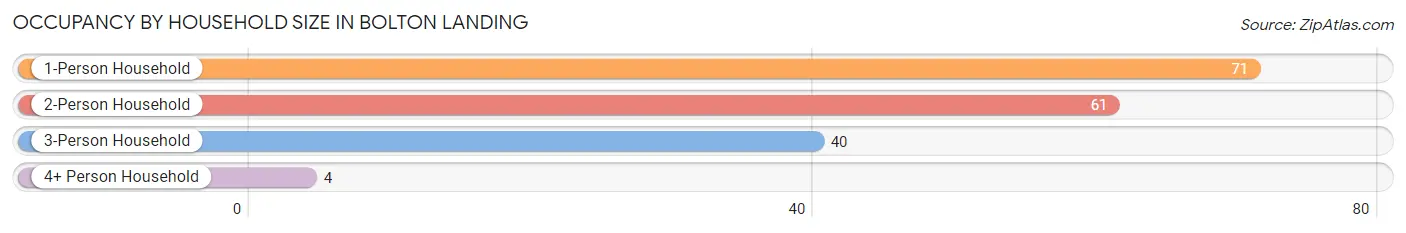
| Household Size | # Housing Units | % Housing Units |
| 1-Person Household | 71 | 40.3% |
| 2-Person Household | 61 | 34.7% |
| 3-Person Household | 40 | 22.7% |
| 4+ Person Household | 4 | 2.3% |
| Total Housing Units | 176 | 100.0% |
Occupancy by Ownership by Household Size in Bolton Landing
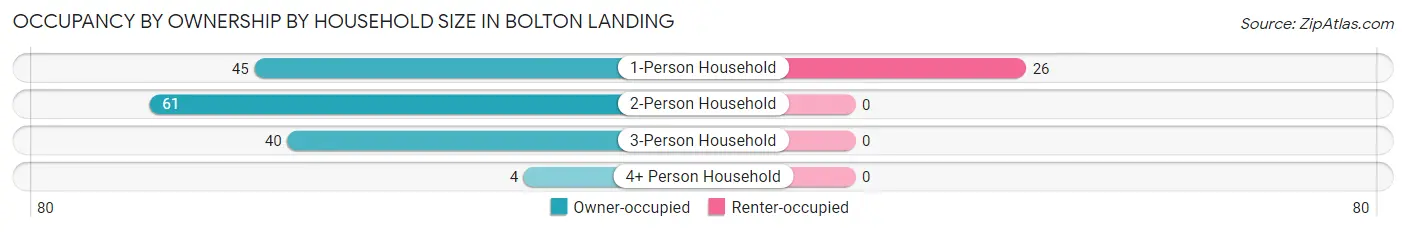
| Household Size | Owner-occupied | Renter-occupied |
| 1-Person Household | 45 (63.4%) | 26 (36.6%) |
| 2-Person Household | 61 (100.0%) | 0 (0.0%) |
| 3-Person Household | 40 (100.0%) | 0 (0.0%) |
| 4+ Person Household | 4 (100.0%) | 0 (0.0%) |
| Total Housing Units | 150 (85.2%) | 26 (14.8%) |
Occupancy by Educational Attainment in Bolton Landing
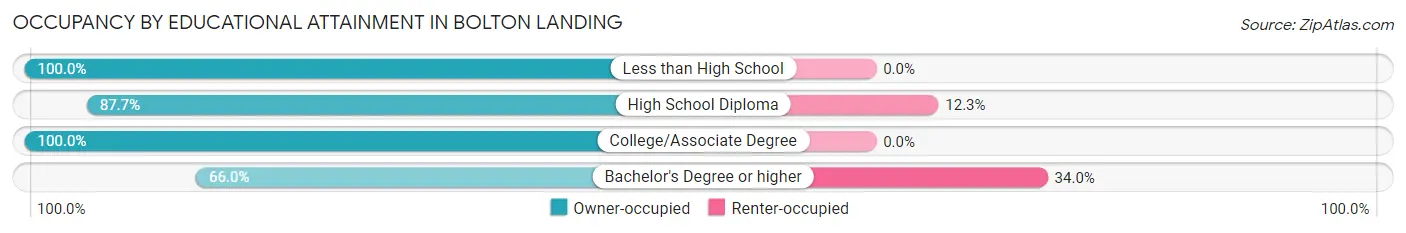
| Household Size | Owner-occupied | Renter-occupied |
| Less than High School | 9 (100.0%) | 0 (0.0%) |
| High School Diploma | 64 (87.7%) | 9 (12.3%) |
| College/Associate Degree | 44 (100.0%) | 0 (0.0%) |
| Bachelor's Degree or higher | 33 (66.0%) | 17 (34.0%) |
Occupancy by Age of Householder in Bolton Landing
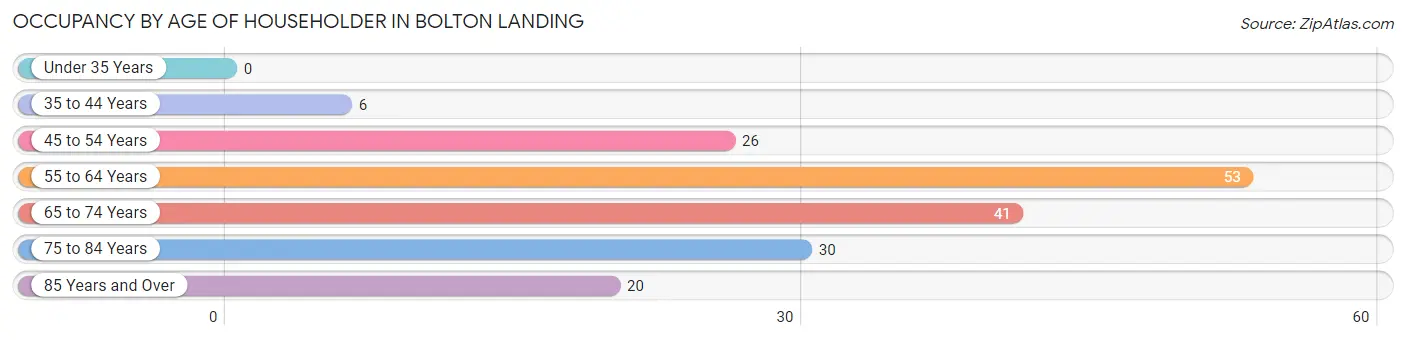
| Age Bracket | # Households | % Households |
| Under 35 Years | 0 | 0.0% |
| 35 to 44 Years | 6 | 3.4% |
| 45 to 54 Years | 26 | 14.8% |
| 55 to 64 Years | 53 | 30.1% |
| 65 to 74 Years | 41 | 23.3% |
| 75 to 84 Years | 30 | 17.1% |
| 85 Years and Over | 20 | 11.4% |
| Total | 176 | 100.0% |
Housing Finances in Bolton Landing
Median Income by Occupancy in Bolton Landing
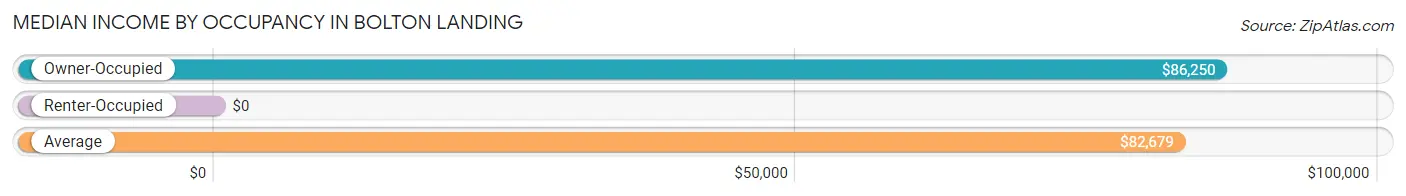
| Occupancy Type | # Households | Median Income |
| Owner-Occupied | 150 (85.2%) | $86,250 |
| Renter-Occupied | 26 (14.8%) | $0 |
| Average | 176 (100.0%) | $82,679 |
Occupancy by Householder Income Bracket in Bolton Landing
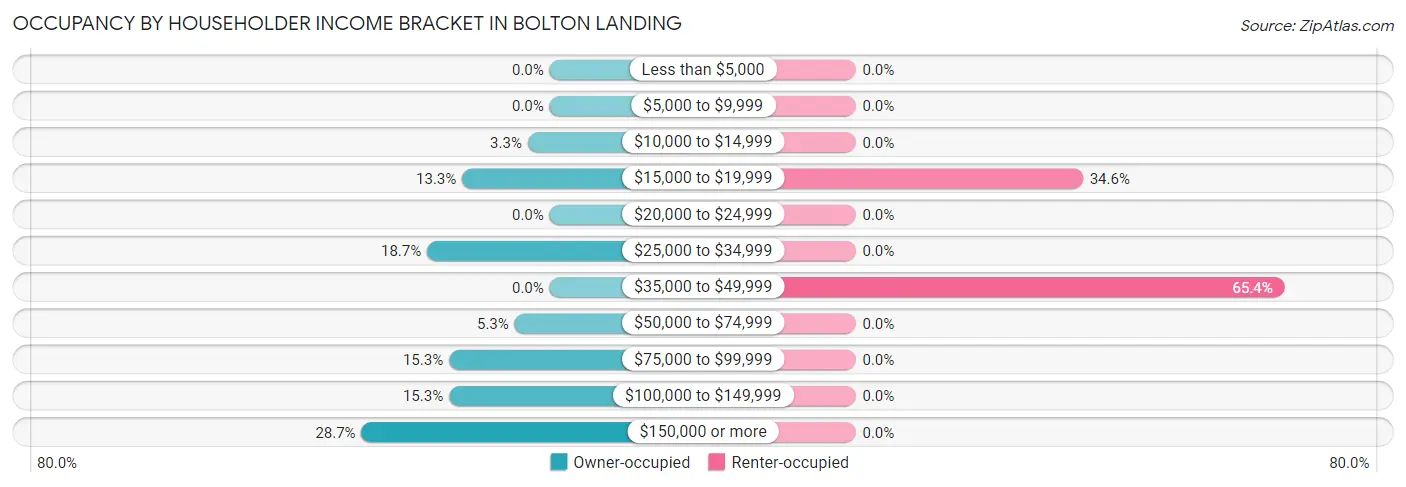
| Income Bracket | Owner-occupied | Renter-occupied |
| Less than $5,000 | 0 (0.0%) | 0 (0.0%) |
| $5,000 to $9,999 | 0 (0.0%) | 0 (0.0%) |
| $10,000 to $14,999 | 5 (3.3%) | 0 (0.0%) |
| $15,000 to $19,999 | 20 (13.3%) | 9 (34.6%) |
| $20,000 to $24,999 | 0 (0.0%) | 0 (0.0%) |
| $25,000 to $34,999 | 28 (18.7%) | 0 (0.0%) |
| $35,000 to $49,999 | 0 (0.0%) | 17 (65.4%) |
| $50,000 to $74,999 | 8 (5.3%) | 0 (0.0%) |
| $75,000 to $99,999 | 23 (15.3%) | 0 (0.0%) |
| $100,000 to $149,999 | 23 (15.3%) | 0 (0.0%) |
| $150,000 or more | 43 (28.7%) | 0 (0.0%) |
| Total | 150 (100.0%) | 26 (100.0%) |
Monthly Housing Cost Tiers in Bolton Landing
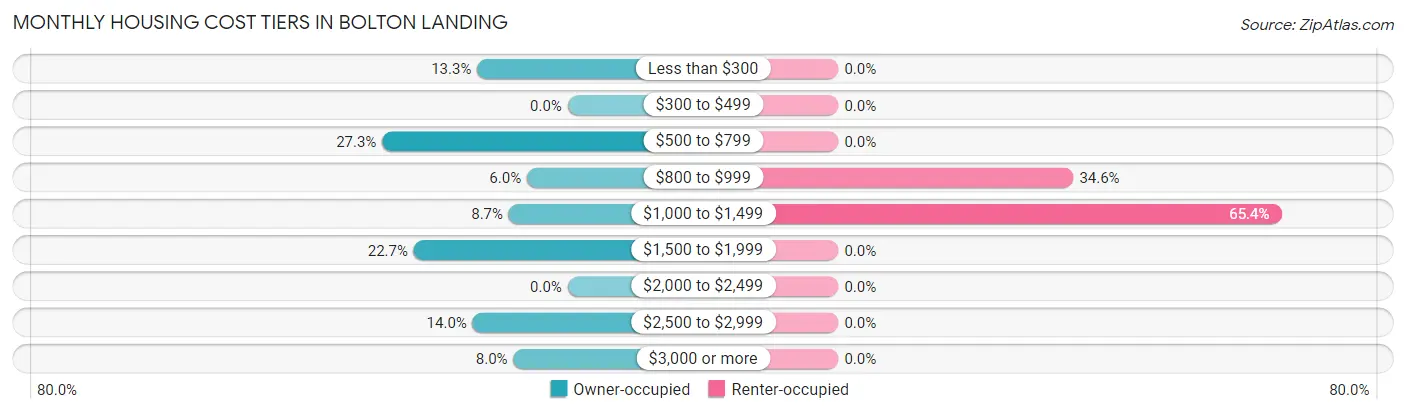
| Monthly Cost | Owner-occupied | Renter-occupied |
| Less than $300 | 20 (13.3%) | 0 (0.0%) |
| $300 to $499 | 0 (0.0%) | 0 (0.0%) |
| $500 to $799 | 41 (27.3%) | 0 (0.0%) |
| $800 to $999 | 9 (6.0%) | 9 (34.6%) |
| $1,000 to $1,499 | 13 (8.7%) | 17 (65.4%) |
| $1,500 to $1,999 | 34 (22.7%) | 0 (0.0%) |
| $2,000 to $2,499 | 0 (0.0%) | 0 (0.0%) |
| $2,500 to $2,999 | 21 (14.0%) | 0 (0.0%) |
| $3,000 or more | 12 (8.0%) | 0 (0.0%) |
| Total | 150 (100.0%) | 26 (100.0%) |
Physical Housing Characteristics in Bolton Landing
Housing Structures in Bolton Landing
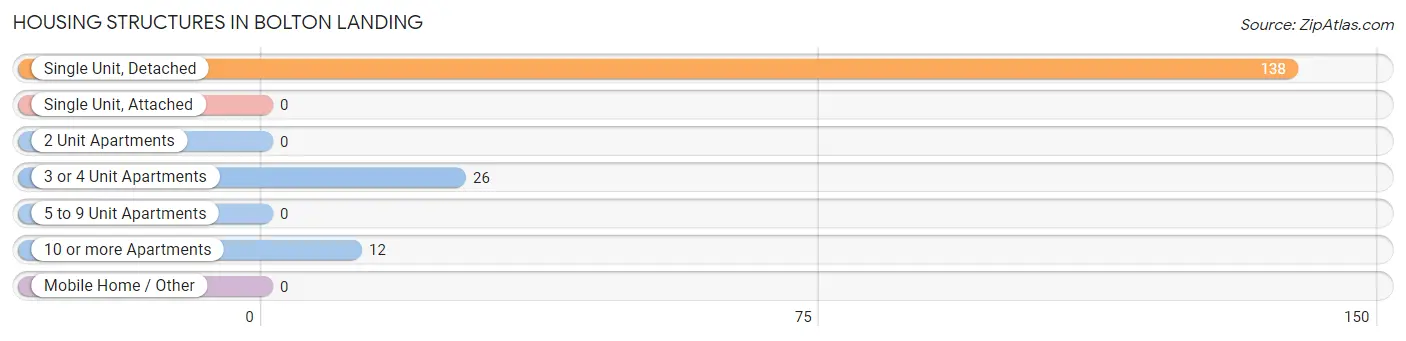
| Structure Type | # Housing Units | % Housing Units |
| Single Unit, Detached | 138 | 78.4% |
| Single Unit, Attached | 0 | 0.0% |
| 2 Unit Apartments | 0 | 0.0% |
| 3 or 4 Unit Apartments | 26 | 14.8% |
| 5 to 9 Unit Apartments | 0 | 0.0% |
| 10 or more Apartments | 12 | 6.8% |
| Mobile Home / Other | 0 | 0.0% |
| Total | 176 | 100.0% |
Housing Structures by Occupancy in Bolton Landing
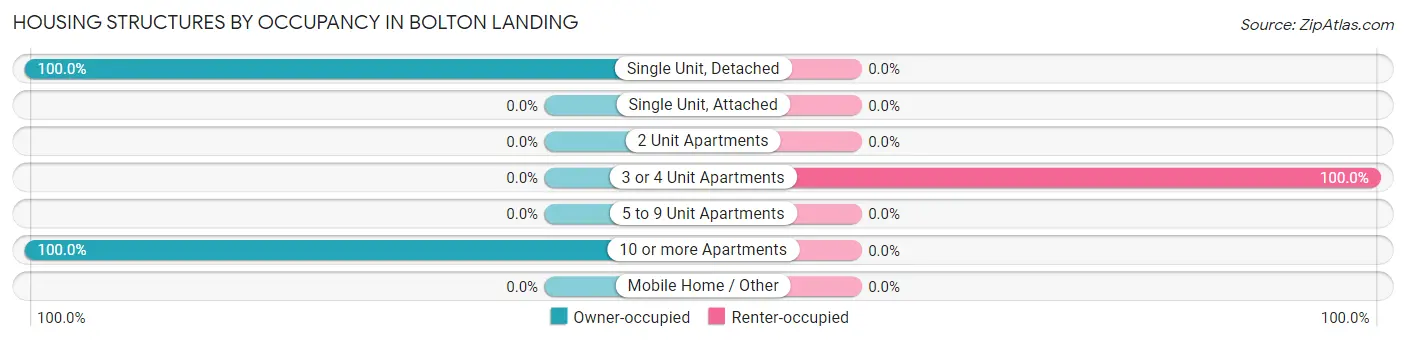
| Structure Type | Owner-occupied | Renter-occupied |
| Single Unit, Detached | 138 (100.0%) | 0 (0.0%) |
| Single Unit, Attached | 0 (0.0%) | 0 (0.0%) |
| 2 Unit Apartments | 0 (0.0%) | 0 (0.0%) |
| 3 or 4 Unit Apartments | 0 (0.0%) | 26 (100.0%) |
| 5 to 9 Unit Apartments | 0 (0.0%) | 0 (0.0%) |
| 10 or more Apartments | 12 (100.0%) | 0 (0.0%) |
| Mobile Home / Other | 0 (0.0%) | 0 (0.0%) |
| Total | 150 (85.2%) | 26 (14.8%) |
Housing Structures by Number of Rooms in Bolton Landing
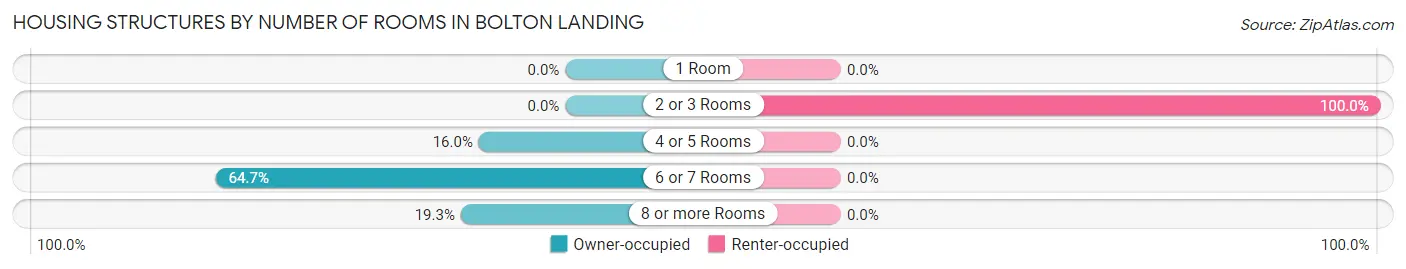
| Number of Rooms | Owner-occupied | Renter-occupied |
| 1 Room | 0 (0.0%) | 0 (0.0%) |
| 2 or 3 Rooms | 0 (0.0%) | 26 (100.0%) |
| 4 or 5 Rooms | 24 (16.0%) | 0 (0.0%) |
| 6 or 7 Rooms | 97 (64.7%) | 0 (0.0%) |
| 8 or more Rooms | 29 (19.3%) | 0 (0.0%) |
| Total | 150 (100.0%) | 26 (100.0%) |
Housing Structure by Heating Type in Bolton Landing
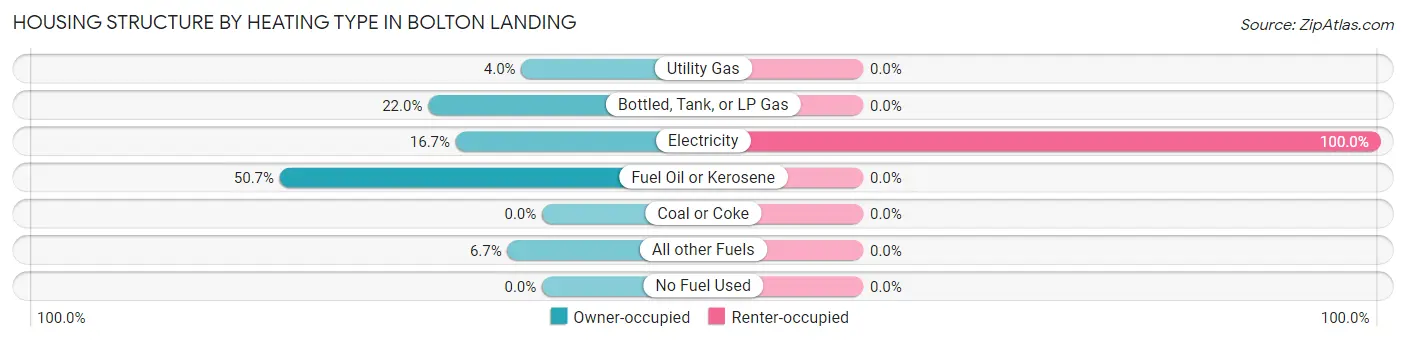
| Heating Type | Owner-occupied | Renter-occupied |
| Utility Gas | 6 (4.0%) | 0 (0.0%) |
| Bottled, Tank, or LP Gas | 33 (22.0%) | 0 (0.0%) |
| Electricity | 25 (16.7%) | 26 (100.0%) |
| Fuel Oil or Kerosene | 76 (50.7%) | 0 (0.0%) |
| Coal or Coke | 0 (0.0%) | 0 (0.0%) |
| All other Fuels | 10 (6.7%) | 0 (0.0%) |
| No Fuel Used | 0 (0.0%) | 0 (0.0%) |
| Total | 150 (100.0%) | 26 (100.0%) |
Household Vehicle Usage in Bolton Landing
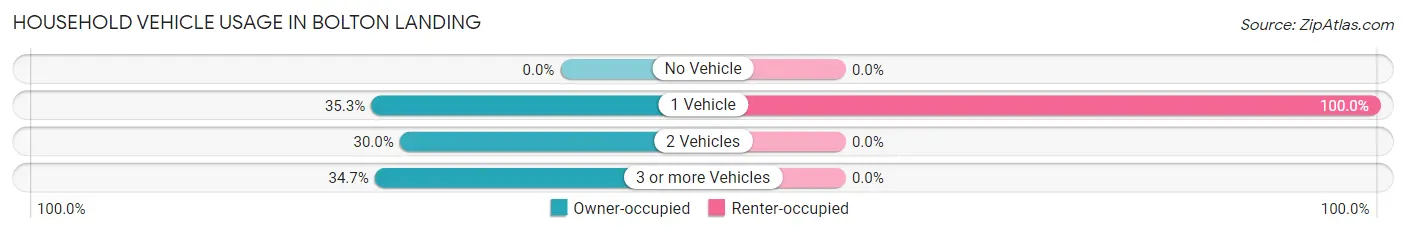
| Vehicles per Household | Owner-occupied | Renter-occupied |
| No Vehicle | 0 (0.0%) | 0 (0.0%) |
| 1 Vehicle | 53 (35.3%) | 26 (100.0%) |
| 2 Vehicles | 45 (30.0%) | 0 (0.0%) |
| 3 or more Vehicles | 52 (34.7%) | 0 (0.0%) |
| Total | 150 (100.0%) | 26 (100.0%) |
Real Estate & Mortgages in Bolton Landing
Real Estate and Mortgage Overview in Bolton Landing
| Characteristic | Without Mortgage | With Mortgage |
| Housing Units | 82 | 68 |
| Median Property Value | - | - |
| Median Household Income | - | - |
| Monthly Housing Costs | $564 | $12 |
| Real Estate Taxes | - | - |
Property Value by Mortgage Status in Bolton Landing
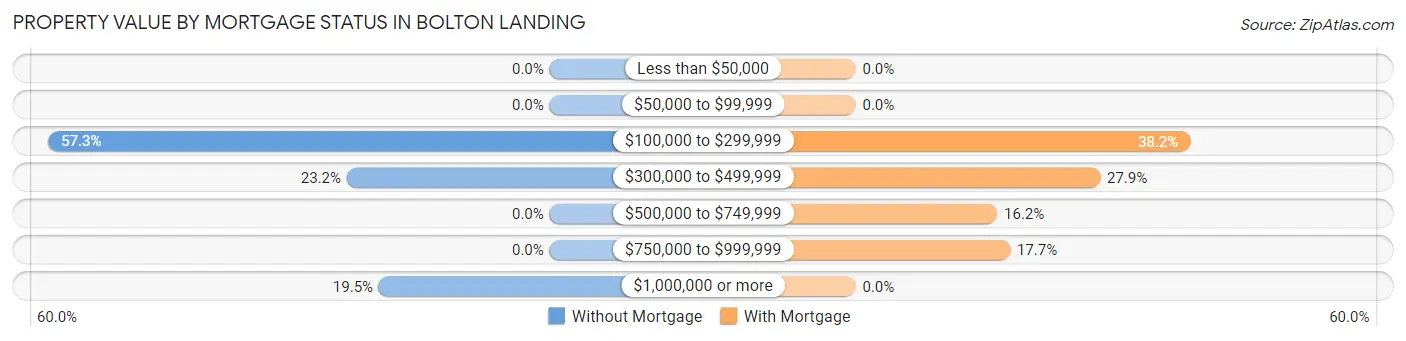
| Property Value | Without Mortgage | With Mortgage |
| Less than $50,000 | 0 (0.0%) | 0 (0.0%) |
| $50,000 to $99,999 | 0 (0.0%) | 0 (0.0%) |
| $100,000 to $299,999 | 47 (57.3%) | 26 (38.2%) |
| $300,000 to $499,999 | 19 (23.2%) | 19 (27.9%) |
| $500,000 to $749,999 | 0 (0.0%) | 11 (16.2%) |
| $750,000 to $999,999 | 0 (0.0%) | 12 (17.6%) |
| $1,000,000 or more | 16 (19.5%) | 0 (0.0%) |
| Total | 82 (100.0%) | 68 (100.0%) |
Household Income by Mortgage Status in Bolton Landing
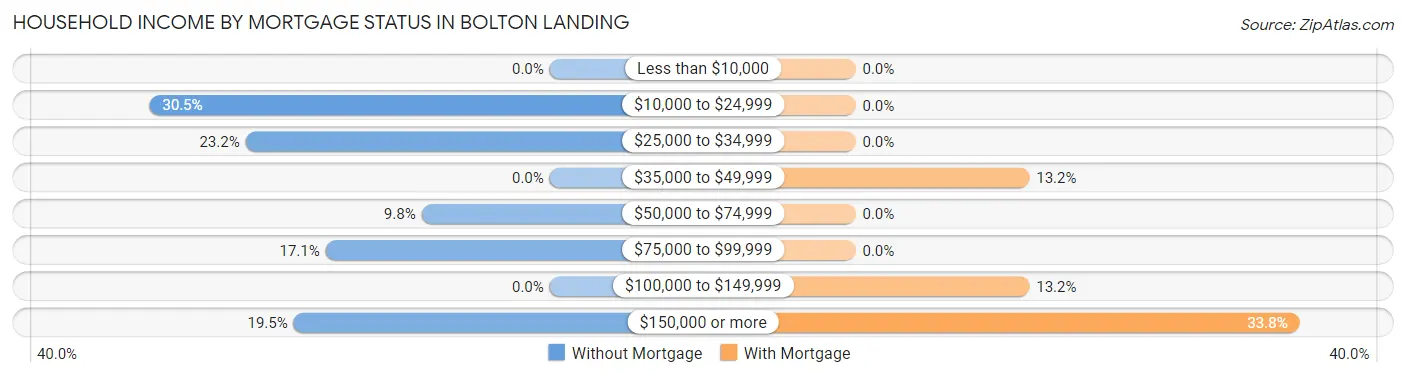
| Household Income | Without Mortgage | With Mortgage |
| Less than $10,000 | 0 (0.0%) | 0 (0.0%) |
| $10,000 to $24,999 | 25 (30.5%) | 0 (0.0%) |
| $25,000 to $34,999 | 19 (23.2%) | 0 (0.0%) |
| $35,000 to $49,999 | 0 (0.0%) | 9 (13.2%) |
| $50,000 to $74,999 | 8 (9.8%) | 0 (0.0%) |
| $75,000 to $99,999 | 14 (17.1%) | 0 (0.0%) |
| $100,000 to $149,999 | 0 (0.0%) | 9 (13.2%) |
| $150,000 or more | 16 (19.5%) | 23 (33.8%) |
| Total | 82 (100.0%) | 68 (100.0%) |
Property Value to Household Income Ratio in Bolton Landing
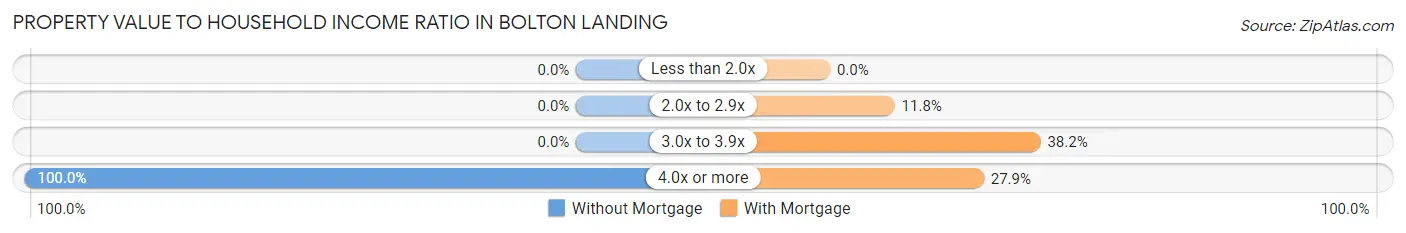
| Value-to-Income Ratio | Without Mortgage | With Mortgage |
| Less than 2.0x | 0 (0.0%) | 0 (0.0%) |
| 2.0x to 2.9x | 0 (0.0%) | 8 (11.8%) |
| 3.0x to 3.9x | 0 (0.0%) | 26 (38.2%) |
| 4.0x or more | 82 (100.0%) | 19 (27.9%) |
| Total | 82 (100.0%) | 68 (100.0%) |
Real Estate Taxes by Mortgage Status in Bolton Landing
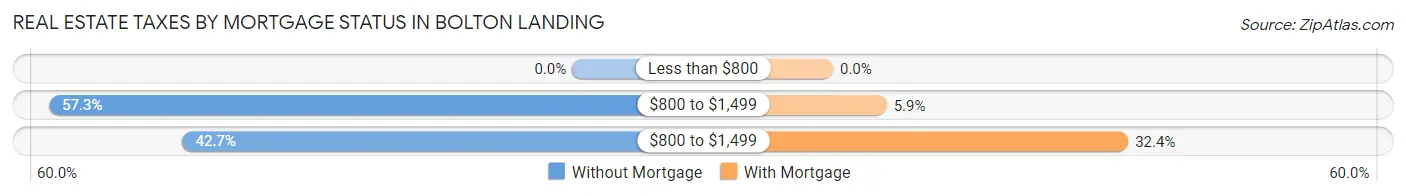
| Property Taxes | Without Mortgage | With Mortgage |
| Less than $800 | 0 (0.0%) | 0 (0.0%) |
| $800 to $1,499 | 47 (57.3%) | 4 (5.9%) |
| $800 to $1,499 | 35 (42.7%) | 22 (32.4%) |
| Total | 82 (100.0%) | 68 (100.0%) |
Health & Disability in Bolton Landing
Health Insurance Coverage by Age in Bolton Landing
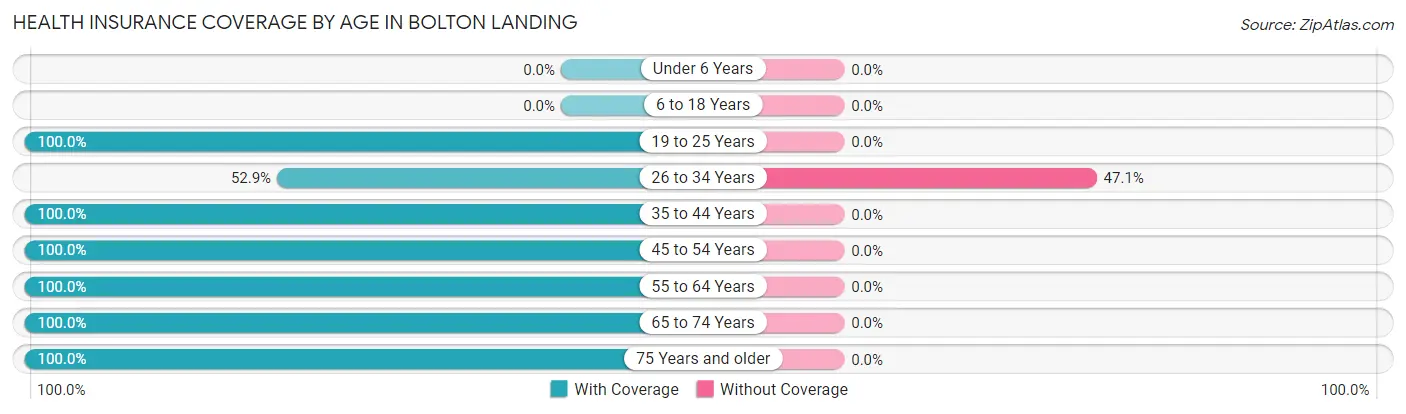
| Age Bracket | With Coverage | Without Coverage |
| Under 6 Years | 0 (0.0%) | 0 (0.0%) |
| 6 to 18 Years | 0 (0.0%) | 0 (0.0%) |
| 19 to 25 Years | 10 (100.0%) | 0 (0.0%) |
| 26 to 34 Years | 9 (52.9%) | 8 (47.1%) |
| 35 to 44 Years | 6 (100.0%) | 0 (0.0%) |
| 45 to 54 Years | 40 (100.0%) | 0 (0.0%) |
| 55 to 64 Years | 92 (100.0%) | 0 (0.0%) |
| 65 to 74 Years | 72 (100.0%) | 0 (0.0%) |
| 75 Years and older | 88 (100.0%) | 0 (0.0%) |
| Total | 317 (97.5%) | 8 (2.5%) |
Health Insurance Coverage by Citizenship Status in Bolton Landing
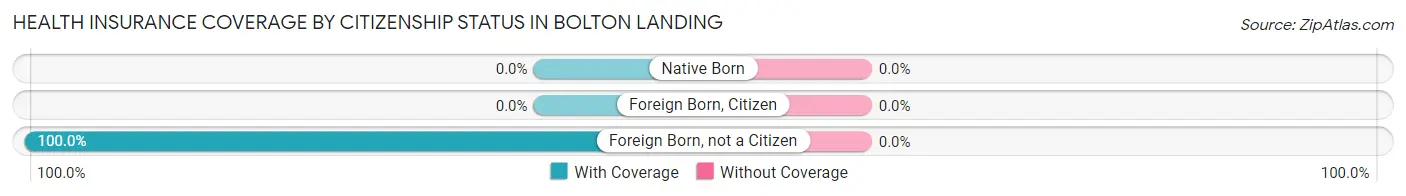
| Citizenship Status | With Coverage | Without Coverage |
| Native Born | 0 (0.0%) | 0 (0.0%) |
| Foreign Born, Citizen | 0 (0.0%) | 0 (0.0%) |
| Foreign Born, not a Citizen | 10 (100.0%) | 0 (0.0%) |
Health Insurance Coverage by Household Income in Bolton Landing
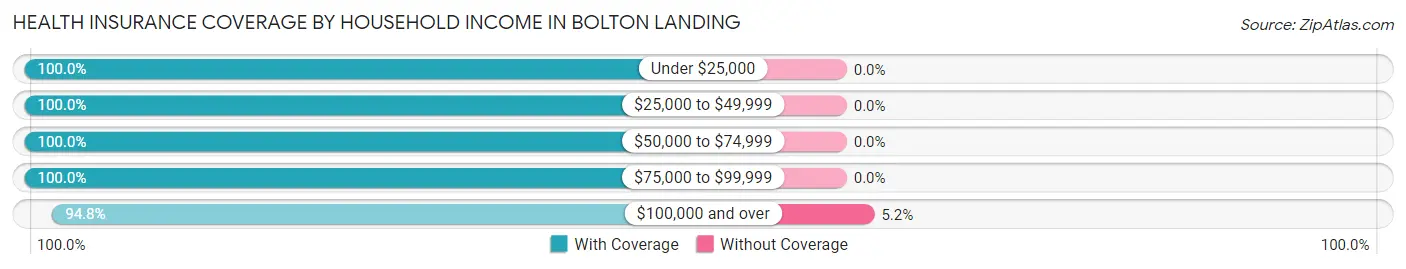
| Household Income | With Coverage | Without Coverage |
| Under $25,000 | 34 (100.0%) | 0 (0.0%) |
| $25,000 to $49,999 | 91 (100.0%) | 0 (0.0%) |
| $50,000 to $74,999 | 16 (100.0%) | 0 (0.0%) |
| $75,000 to $99,999 | 30 (100.0%) | 0 (0.0%) |
| $100,000 and over | 146 (94.8%) | 8 (5.2%) |
Public vs Private Health Insurance Coverage by Age in Bolton Landing
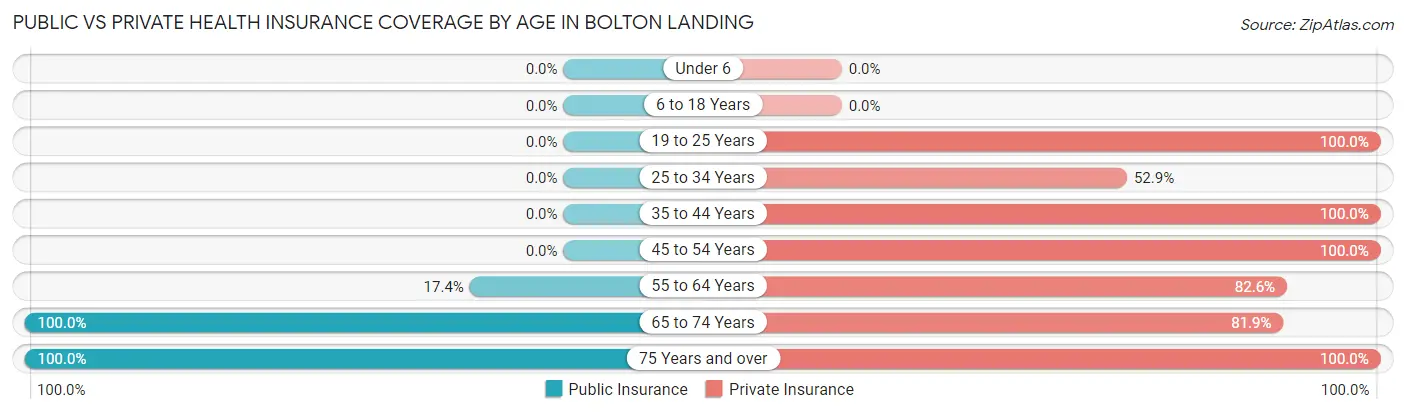
| Age Bracket | Public Insurance | Private Insurance |
| Under 6 | 0 (0.0%) | 0 (0.0%) |
| 6 to 18 Years | 0 (0.0%) | 0 (0.0%) |
| 19 to 25 Years | 0 (0.0%) | 10 (100.0%) |
| 25 to 34 Years | 0 (0.0%) | 9 (52.9%) |
| 35 to 44 Years | 0 (0.0%) | 6 (100.0%) |
| 45 to 54 Years | 0 (0.0%) | 40 (100.0%) |
| 55 to 64 Years | 16 (17.4%) | 76 (82.6%) |
| 65 to 74 Years | 72 (100.0%) | 59 (81.9%) |
| 75 Years and over | 88 (100.0%) | 88 (100.0%) |
| Total | 176 (54.1%) | 288 (88.6%) |
Disability Status by Sex by Age in Bolton Landing
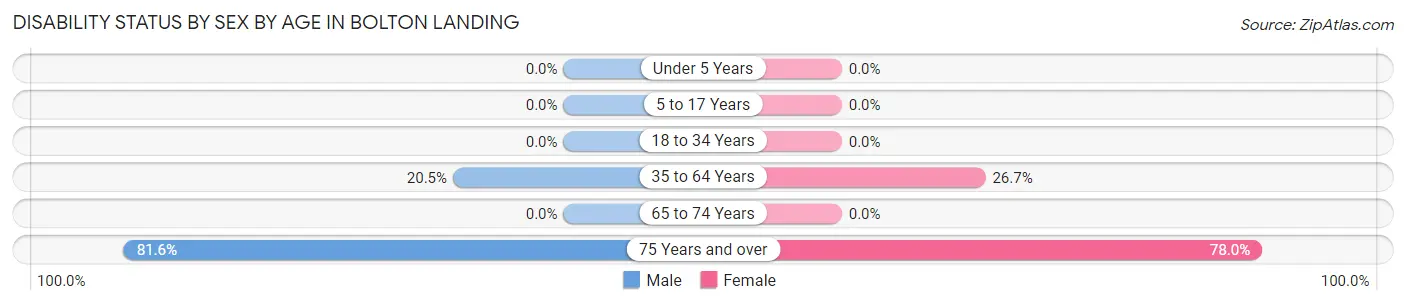
| Age Bracket | Male | Female |
| Under 5 Years | 0 (0.0%) | 0 (0.0%) |
| 5 to 17 Years | 0 (0.0%) | 0 (0.0%) |
| 18 to 34 Years | 0 (0.0%) | 0 (0.0%) |
| 35 to 64 Years | 16 (20.5%) | 16 (26.7%) |
| 65 to 74 Years | 0 (0.0%) | 0 (0.0%) |
| 75 Years and over | 31 (81.6%) | 39 (78.0%) |
Disability Class by Sex by Age in Bolton Landing
Disability Class: Hearing Difficulty
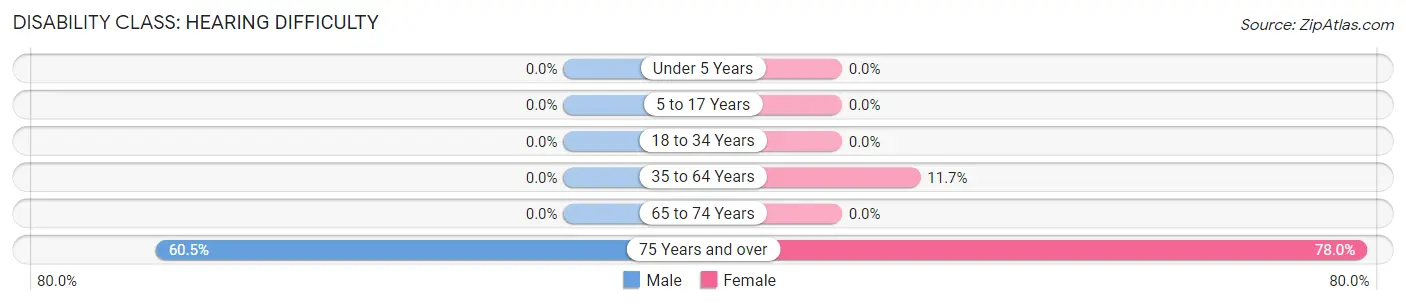
| Age Bracket | Male | Female |
| Under 5 Years | 0 (0.0%) | 0 (0.0%) |
| 5 to 17 Years | 0 (0.0%) | 0 (0.0%) |
| 18 to 34 Years | 0 (0.0%) | 0 (0.0%) |
| 35 to 64 Years | 0 (0.0%) | 7 (11.7%) |
| 65 to 74 Years | 0 (0.0%) | 0 (0.0%) |
| 75 Years and over | 23 (60.5%) | 39 (78.0%) |
Disability Class: Vision Difficulty
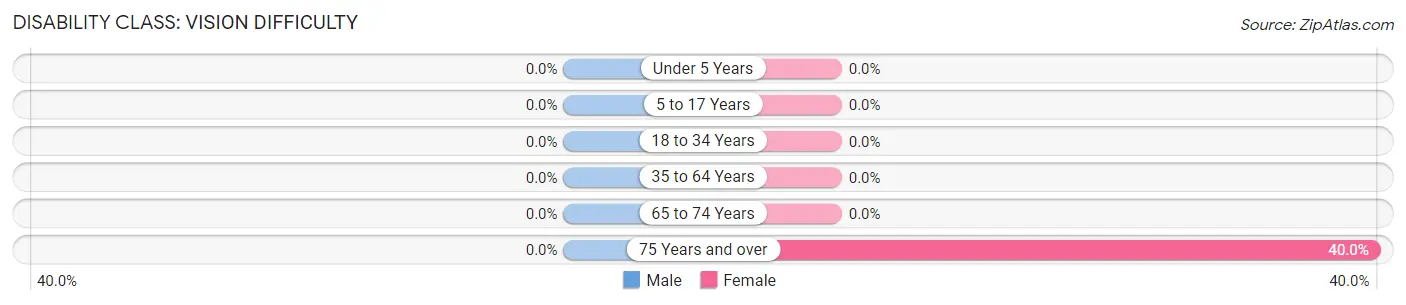
| Age Bracket | Male | Female |
| Under 5 Years | 0 (0.0%) | 0 (0.0%) |
| 5 to 17 Years | 0 (0.0%) | 0 (0.0%) |
| 18 to 34 Years | 0 (0.0%) | 0 (0.0%) |
| 35 to 64 Years | 0 (0.0%) | 0 (0.0%) |
| 65 to 74 Years | 0 (0.0%) | 0 (0.0%) |
| 75 Years and over | 0 (0.0%) | 20 (40.0%) |
Disability Class: Cognitive Difficulty
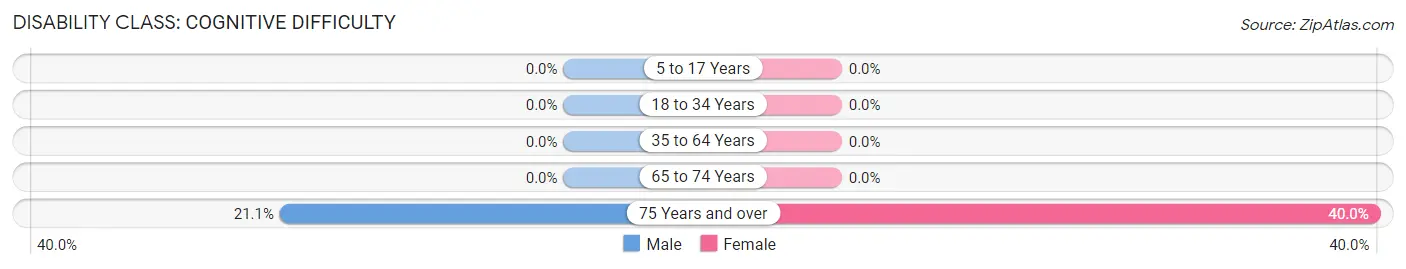
| Age Bracket | Male | Female |
| 5 to 17 Years | 0 (0.0%) | 0 (0.0%) |
| 18 to 34 Years | 0 (0.0%) | 0 (0.0%) |
| 35 to 64 Years | 0 (0.0%) | 0 (0.0%) |
| 65 to 74 Years | 0 (0.0%) | 0 (0.0%) |
| 75 Years and over | 8 (21.0%) | 20 (40.0%) |
Disability Class: Ambulatory Difficulty
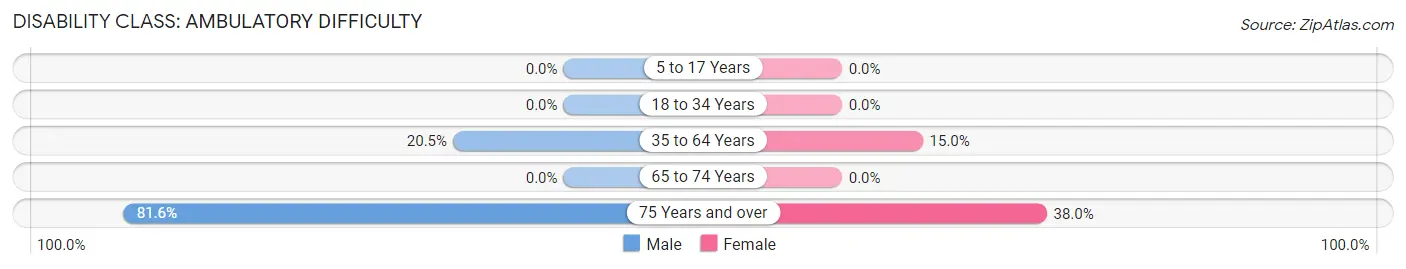
| Age Bracket | Male | Female |
| 5 to 17 Years | 0 (0.0%) | 0 (0.0%) |
| 18 to 34 Years | 0 (0.0%) | 0 (0.0%) |
| 35 to 64 Years | 16 (20.5%) | 9 (15.0%) |
| 65 to 74 Years | 0 (0.0%) | 0 (0.0%) |
| 75 Years and over | 31 (81.6%) | 19 (38.0%) |
Disability Class: Self-Care Difficulty
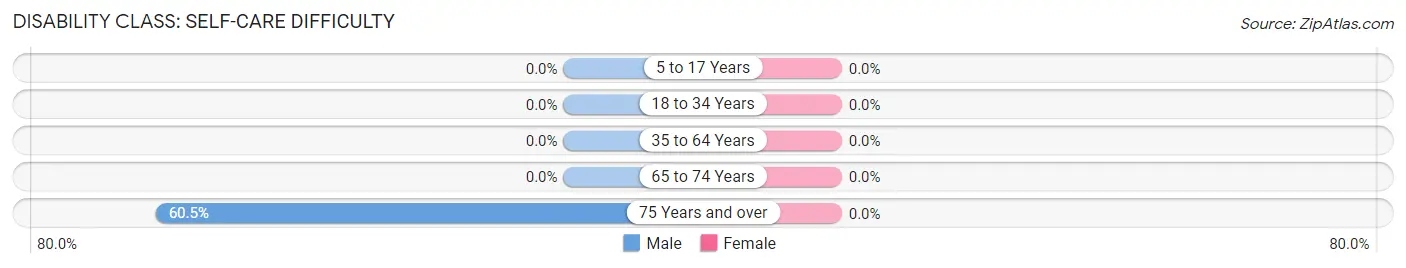
| Age Bracket | Male | Female |
| 5 to 17 Years | 0 (0.0%) | 0 (0.0%) |
| 18 to 34 Years | 0 (0.0%) | 0 (0.0%) |
| 35 to 64 Years | 0 (0.0%) | 0 (0.0%) |
| 65 to 74 Years | 0 (0.0%) | 0 (0.0%) |
| 75 Years and over | 23 (60.5%) | 0 (0.0%) |
Technology Access in Bolton Landing
Computing Device Access in Bolton Landing
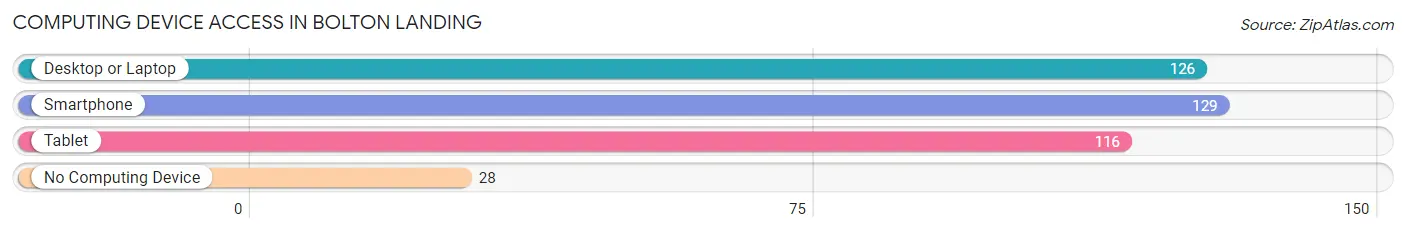
| Device Type | # Households | % Households |
| Desktop or Laptop | 126 | 71.6% |
| Smartphone | 129 | 73.3% |
| Tablet | 116 | 65.9% |
| No Computing Device | 28 | 15.9% |
| Total | 176 | 100.0% |
Internet Access in Bolton Landing
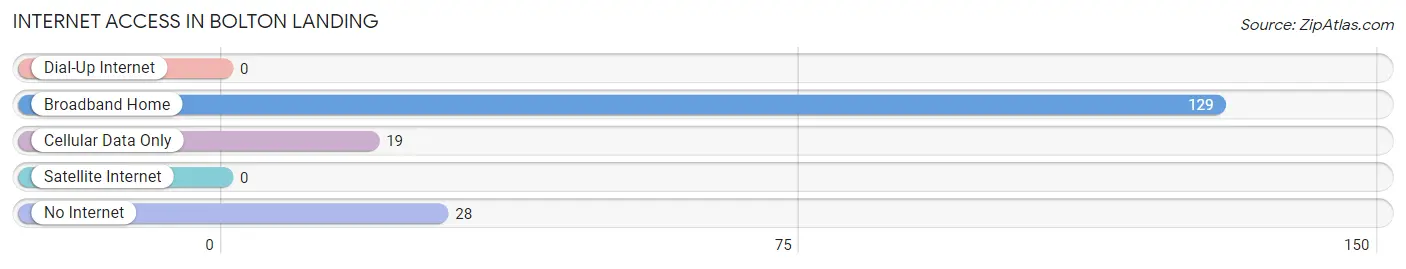
| Internet Type | # Households | % Households |
| Dial-Up Internet | 0 | 0.0% |
| Broadband Home | 129 | 73.3% |
| Cellular Data Only | 19 | 10.8% |
| Satellite Internet | 0 | 0.0% |
| No Internet | 28 | 15.9% |
| Total | 176 | 100.0% |
Bolton Landing Summary
Bolton Landing is a small town located in the Adirondack Mountains of upstate New York. It is situated on the eastern shore of Lake George, a 32-mile long lake that is part of the Hudson River watershed. The town is located in Warren County and has a population of approximately 1,000 people.
History
The area that is now Bolton Landing was originally inhabited by the Iroquois and Algonquin tribes. The first European settlers arrived in the area in the late 1700s, and the town was officially established in 1817. The town was named after Robert Bolton, a prominent landowner in the area.
In the early 1800s, Bolton Landing was a popular destination for tourists who wanted to experience the beauty of the Adirondack Mountains. The town was home to several resorts and hotels, and it was a popular spot for fishing and boating.
In the late 1800s, the town began to experience a decline in tourism due to the rise of the railroad. The town was also affected by the Great Depression, and many of the resorts and hotels closed.
In the 1950s, the town experienced a resurgence in tourism due to the popularity of the nearby Lake George. The town has since become a popular destination for vacationers, and it is home to several resorts, hotels, and restaurants.
Geography
Bolton Landing is located in the Adirondack Mountains of upstate New York. The town is situated on the eastern shore of Lake George, a 32-mile long lake that is part of the Hudson River watershed. The town is located in Warren County and has a population of approximately 1,000 people.
The town is surrounded by the Adirondack Park, a 6 million acre park that is the largest protected natural area in the United States. The park is home to a variety of wildlife, including black bears, moose, and bald eagles.
Economy
The economy of Bolton Landing is largely based on tourism. The town is home to several resorts, hotels, and restaurants, and it is a popular destination for vacationers. The town is also home to several marinas, which provide boat rentals and other services to visitors.
The town is also home to several small businesses, including shops, galleries, and restaurants. The town is also home to a number of artisans, who create handmade items such as jewelry, pottery, and woodworking.
Demographics
As of the 2010 census, the population of Bolton Landing was 1,053. The racial makeup of the town was 97.3% White, 0.7% African American, 0.3% Native American, 0.3% Asian, 0.1% Pacific Islander, 0.2% from other races, and 1.2% from two or more races. Hispanic or Latino of any race were 1.2% of the population.
The median household income in Bolton Landing was $45,938, and the median family income was $50,625. The per capita income for the town was $25,945. About 8.3% of families and 10.2% of the population were below the poverty line, including 14.3% of those under age 18 and 4.2% of those age 65 or over.
Common Questions
What is Per Capita Income in Bolton Landing?
Per Capita income in Bolton Landing is $55,386.
What is the Median Family Income in Bolton Landing?
Median Family Income in Bolton Landing is $103,487.
What is the Median Household income in Bolton Landing?
Median Household Income in Bolton Landing is $82,679.
What is Inequality or Gini Index in Bolton Landing?
Inequality or Gini Index in Bolton Landing is 0.47.
What is the Total Population of Bolton Landing?
Total Population of Bolton Landing is 325.
What is the Total Male Population of Bolton Landing?
Total Male Population of Bolton Landing is 174.
What is the Total Female Population of Bolton Landing?
Total Female Population of Bolton Landing is 151.
What is the Ratio of Males per 100 Females in Bolton Landing?
There are 115.23 Males per 100 Females in Bolton Landing.
What is the Ratio of Females per 100 Males in Bolton Landing?
There are 86.78 Females per 100 Males in Bolton Landing.
What is the Median Population Age in Bolton Landing?
Median Population Age in Bolton Landing is 64.7 Years.
What is the Average Family Size in Bolton Landing
Average Family Size in Bolton Landing is 2.4 People.
What is the Average Household Size in Bolton Landing
Average Household Size in Bolton Landing is 1.9 People.
How Large is the Labor Force in Bolton Landing?
There are 165 People in the Labor Forcein in Bolton Landing.
What is the Percentage of People in the Labor Force in Bolton Landing?
50.8% of People are in the Labor Force in Bolton Landing.
What is the Unemployment Rate in Bolton Landing?
Unemployment Rate in Bolton Landing is 5.5%.