Zip Codes with the Highest Percentage of Population Employed in Real Estate, Rental & Leasing in New York
RELATED REPORTS & OPTIONS
Real Estate, Rental & Leasing
New York
Compare Zip Codes
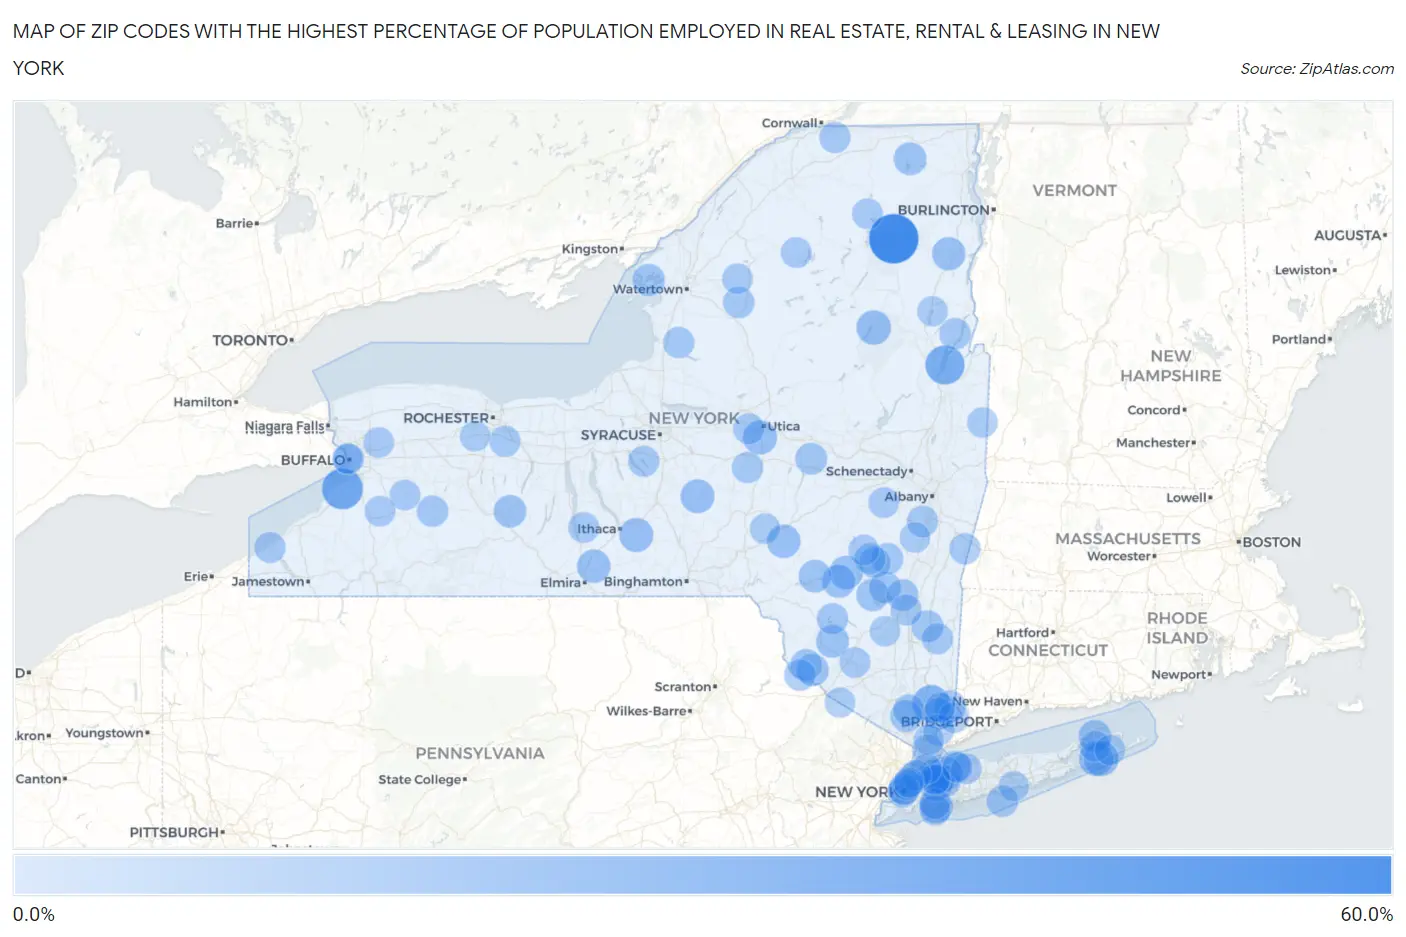
Map of Zip Codes with the Highest Percentage of Population Employed in Real Estate, Rental & Leasing in New York
0.0%
60.0%
Zip Codes with the Highest Percentage of Population Employed in Real Estate, Rental & Leasing in New York
| Zip Code | % Employed | vs State | vs National | |
| 1. | 12977 | 54.5% | 2.2%(+52.3)#1 | 1.9%(+52.7)#9 |
| 2. | 14112 | 31.7% | 2.2%(+29.5)#2 | 1.9%(+29.8)#39 |
| 3. | 12844 | 27.3% | 2.2%(+25.0)#3 | 1.9%(+25.4)#58 |
| 4. | 10501 | 23.1% | 2.2%(+20.8)#4 | 1.9%(+21.2)#84 |
| 5. | 11962 | 15.7% | 2.2%(+13.5)#5 | 1.9%(+13.9)#154 |
| 6. | 12842 | 15.2% | 2.2%(+12.9)#6 | 1.9%(+13.3)#167 |
| 7. | 11547 | 15.1% | 2.2%(+12.9)#7 | 1.9%(+13.2)#169 |
| 8. | 11932 | 15.0% | 2.2%(+12.7)#8 | 1.9%(+13.1)#173 |
| 9. | 13319 | 14.2% | 2.2%(+12.0)#9 | 1.9%(+12.3)#193 |
| 10. | 14881 | 14.1% | 2.2%(+11.8)#10 | 1.9%(+12.2)#196 |
| 11. | 13124 | 13.5% | 2.2%(+11.3)#11 | 1.9%(+11.6)#215 |
| 12. | 13846 | 13.0% | 2.2%(+10.8)#12 | 1.9%(+11.1)#226 |
| 13. | 11559 | 12.9% | 2.2%(+10.7)#13 | 1.9%(+11.0)#231 |
| 14. | 12441 | 12.8% | 2.2%(+10.6)#14 | 1.9%(+10.9)#233 |
| 15. | 14816 | 12.7% | 2.2%(+10.5)#15 | 1.9%(+10.8)#236 |
| 16. | 12932 | 12.3% | 2.2%(+10.0)#16 | 1.9%(+10.4)#254 |
| 17. | 12406 | 11.9% | 2.2%(+9.64)#17 | 1.9%(+9.97)#270 |
| 18. | 12779 | 11.3% | 2.2%(+9.05)#18 | 1.9%(+9.38)#295 |
| 19. | 11965 | 11.1% | 2.2%(+8.88)#19 | 1.9%(+9.22)#303 |
| 20. | 12955 | 10.9% | 2.2%(+8.69)#20 | 1.9%(+9.03)#314 |
| 21. | 13731 | 10.7% | 2.2%(+8.46)#21 | 1.9%(+8.79)#330 |
| 22. | 11005 | 10.6% | 2.2%(+8.36)#22 | 1.9%(+8.70)#337 |
| 23. | 14808 | 10.5% | 2.2%(+8.25)#23 | 1.9%(+8.59)#347 |
| 24. | 12412 | 10.1% | 2.2%(+7.91)#24 | 1.9%(+8.24)#371 |
| 25. | 12737 | 9.8% | 2.2%(+7.54)#25 | 1.9%(+7.87)#398 |
| 26. | 13693 | 9.5% | 2.2%(+7.30)#26 | 1.9%(+7.63)#420 |
| 27. | 12578 | 8.8% | 2.2%(+6.54)#27 | 1.9%(+6.88)#476 |
| 28. | 12409 | 8.7% | 2.2%(+6.48)#28 | 1.9%(+6.82)#480 |
| 29. | 13475 | 8.7% | 2.2%(+6.47)#29 | 1.9%(+6.80)#481 |
| 30. | 10993 | 8.7% | 2.2%(+6.45)#30 | 1.9%(+6.79)#483 |
| 31. | 12732 | 8.5% | 2.2%(+6.30)#31 | 1.9%(+6.64)#492 |
| 32. | 12475 | 8.4% | 2.2%(+6.18)#32 | 1.9%(+6.51)#505 |
| 33. | 10518 | 8.0% | 2.2%(+5.79)#33 | 1.9%(+6.13)#553 |
| 34. | 10596 | 7.9% | 2.2%(+5.69)#34 | 1.9%(+6.02)#568 |
| 35. | 11770 | 7.9% | 2.2%(+5.67)#35 | 1.9%(+6.00)#571 |
| 36. | 12424 | 7.8% | 2.2%(+5.60)#36 | 1.9%(+5.93)#581 |
| 37. | 11024 | 7.8% | 2.2%(+5.56)#37 | 1.9%(+5.90)#587 |
| 38. | 12719 | 7.7% | 2.2%(+5.50)#38 | 1.9%(+5.83)#603 |
| 39. | 10507 | 7.6% | 2.2%(+5.36)#39 | 1.9%(+5.69)#620 |
| 40. | 12874 | 7.5% | 2.2%(+5.32)#40 | 1.9%(+5.66)#627 |
| 41. | 14130 | 7.5% | 2.2%(+5.27)#41 | 1.9%(+5.61)#634 |
| 42. | 13620 | 7.5% | 2.2%(+5.23)#42 | 1.9%(+5.57)#643 |
| 43. | 11577 | 7.4% | 2.2%(+5.22)#43 | 1.9%(+5.55)#647 |
| 44. | 12765 | 7.4% | 2.2%(+5.21)#44 | 1.9%(+5.54)#650 |
| 45. | 12442 | 7.4% | 2.2%(+5.17)#45 | 1.9%(+5.50)#660 |
| 46. | 13083 | 7.3% | 2.2%(+5.10)#46 | 1.9%(+5.44)#673 |
| 47. | 12143 | 7.3% | 2.2%(+5.03)#47 | 1.9%(+5.36)#679 |
| 48. | 13418 | 7.2% | 2.2%(+5.00)#48 | 1.9%(+5.34)#685 |
| 49. | 12017 | 7.1% | 2.2%(+4.83)#49 | 1.9%(+5.17)#721 |
| 50. | 12585 | 7.0% | 2.2%(+4.73)#50 | 1.9%(+5.06)#737 |
| 51. | 12466 | 6.7% | 2.2%(+4.51)#51 | 1.9%(+4.84)#778 |
| 52. | 12914 | 6.7% | 2.2%(+4.50)#52 | 1.9%(+4.83)#781 |
| 53. | 12444 | 6.7% | 2.2%(+4.44)#53 | 1.9%(+4.77)#788 |
| 54. | 13110 | 6.7% | 2.2%(+4.43)#54 | 1.9%(+4.77)#795 |
| 55. | 10504 | 6.5% | 2.2%(+4.31)#55 | 1.9%(+4.65)#813 |
| 56. | 14506 | 6.5% | 2.2%(+4.28)#56 | 1.9%(+4.61)#821 |
| 57. | 13321 | 6.4% | 2.2%(+4.18)#57 | 1.9%(+4.52)#848 |
| 58. | 11963 | 6.4% | 2.2%(+4.13)#58 | 1.9%(+4.46)#870 |
| 59. | 14787 | 6.3% | 2.2%(+4.05)#59 | 1.9%(+4.38)#884 |
| 60. | 11765 | 6.3% | 2.2%(+4.04)#60 | 1.9%(+4.38)#885 |
| 61. | 11509 | 6.2% | 2.2%(+4.01)#61 | 1.9%(+4.34)#908 |
| 62. | 11030 | 6.2% | 2.2%(+3.98)#62 | 1.9%(+4.31)#919 |
| 63. | 14818 | 6.0% | 2.2%(+3.75)#63 | 1.9%(+4.08)#984 |
| 64. | 12970 | 6.0% | 2.2%(+3.73)#64 | 1.9%(+4.06)#994 |
| 65. | 13666 | 5.9% | 2.2%(+3.71)#65 | 1.9%(+4.05)#998 |
| 66. | 12407 | 5.9% | 2.2%(+3.66)#66 | 1.9%(+3.99)#1,017 |
| 67. | 11516 | 5.9% | 2.2%(+3.64)#67 | 1.9%(+3.98)#1,022 |
| 68. | 12721 | 5.9% | 2.2%(+3.64)#68 | 1.9%(+3.97)#1,028 |
| 69. | 10454 | 5.7% | 2.2%(+3.51)#69 | 1.9%(+3.84)#1,059 |
| 70. | 10014 | 5.7% | 2.2%(+3.49)#70 | 1.9%(+3.82)#1,066 |
| 71. | 14055 | 5.7% | 2.2%(+3.48)#71 | 1.9%(+3.81)#1,074 |
| 72. | 12023 | 5.7% | 2.2%(+3.46)#72 | 1.9%(+3.80)#1,078 |
| 73. | 11724 | 5.7% | 2.2%(+3.43)#73 | 1.9%(+3.77)#1,093 |
| 74. | 13665 | 5.6% | 2.2%(+3.36)#74 | 1.9%(+3.69)#1,121 |
| 75. | 14082 | 5.5% | 2.2%(+3.26)#75 | 1.9%(+3.60)#1,150 |
| 76. | 14031 | 5.5% | 2.2%(+3.25)#76 | 1.9%(+3.58)#1,159 |
| 77. | 14202 | 5.5% | 2.2%(+3.23)#77 | 1.9%(+3.57)#1,167 |
| 78. | 11023 | 5.4% | 2.2%(+3.21)#78 | 1.9%(+3.54)#1,182 |
| 79. | 11021 | 5.4% | 2.2%(+3.20)#79 | 1.9%(+3.53)#1,189 |
| 80. | 10280 | 5.4% | 2.2%(+3.13)#80 | 1.9%(+3.46)#1,214 |
| 81. | 10576 | 5.3% | 2.2%(+3.07)#81 | 1.9%(+3.41)#1,247 |
| 82. | 10583 | 5.3% | 2.2%(+3.06)#82 | 1.9%(+3.39)#1,257 |
| 83. | 12873 | 5.3% | 2.2%(+3.05)#83 | 1.9%(+3.38)#1,258 |
| 84. | 10464 | 5.2% | 2.2%(+2.97)#84 | 1.9%(+3.30)#1,288 |
| 85. | 13825 | 5.1% | 2.2%(+2.91)#85 | 1.9%(+3.24)#1,313 |
| 86. | 12042 | 5.1% | 2.2%(+2.90)#86 | 1.9%(+3.24)#1,319 |
| 87. | 10013 | 5.1% | 2.2%(+2.86)#87 | 1.9%(+3.19)#1,347 |
| 88. | 10603 | 5.1% | 2.2%(+2.85)#88 | 1.9%(+3.19)#1,348 |
| 89. | 11937 | 5.0% | 2.2%(+2.79)#89 | 1.9%(+3.12)#1,375 |
| 90. | 12440 | 5.0% | 2.2%(+2.77)#90 | 1.9%(+3.11)#1,382 |
| 91. | 14546 | 5.0% | 2.2%(+2.75)#91 | 1.9%(+3.09)#1,402 |
| 92. | 14201 | 5.0% | 2.2%(+2.74)#92 | 1.9%(+3.08)#1,408 |
| 93. | 11771 | 4.9% | 2.2%(+2.69)#93 | 1.9%(+3.03)#1,437 |
| 94. | 10459 | 4.9% | 2.2%(+2.69)#94 | 1.9%(+3.03)#1,439 |
| 95. | 10022 | 4.9% | 2.2%(+2.68)#95 | 1.9%(+3.02)#1,444 |
| 96. | 12870 | 4.8% | 2.2%(+2.61)#96 | 1.9%(+2.94)#1,483 |
| 97. | 10021 | 4.8% | 2.2%(+2.60)#97 | 1.9%(+2.93)#1,487 |
| 98. | 10536 | 4.8% | 2.2%(+2.58)#98 | 1.9%(+2.91)#1,507 |
| 99. | 10988 | 4.8% | 2.2%(+2.56)#99 | 1.9%(+2.90)#1,513 |
| 100. | 11715 | 4.8% | 2.2%(+2.54)#100 | 1.9%(+2.87)#1,524 |
Common Questions
What are the Top 10 Zip Codes with the Highest Percentage of Population Employed in Real Estate, Rental & Leasing in New York?
Top 10 Zip Codes with the Highest Percentage of Population Employed in Real Estate, Rental & Leasing in New York are:
What zip code has the Highest Percentage of Population Employed in Real Estate, Rental & Leasing in New York?
12977 has the Highest Percentage of Population Employed in Real Estate, Rental & Leasing in New York with 54.5%.
What is the Percentage of Population Employed in Real Estate, Rental & Leasing in the State of New York?
Percentage of Population Employed in Real Estate, Rental & Leasing in New York is 2.2%.
What is the Percentage of Population Employed in Real Estate, Rental & Leasing in the United States?
Percentage of Population Employed in Real Estate, Rental & Leasing in the United States is 1.9%.