Great Neck Plaza, NY Map & Demographics
Great Neck Plaza Map
Great Neck Plaza Overview
$72,754
PER CAPITA INCOME
$147,606
AVG FAMILY INCOME
$97,022
AVG HOUSEHOLD INCOME
33.8%
WAGE / INCOME GAP [ % ]
66.2¢/ $1
WAGE / INCOME GAP [ $ ]
0.47
INEQUALITY / GINI INDEX
7,443
TOTAL POPULATION
3,265
MALE POPULATION
4,178
FEMALE POPULATION
78.15
MALES / 100 FEMALES
127.96
FEMALES / 100 MALES
47.7
MEDIAN AGE
2.7
AVG FAMILY SIZE
1.9
AVG HOUSEHOLD SIZE
3,870
LABOR FORCE [ PEOPLE ]
59.6%
PERCENT IN LABOR FORCE
7.0%
UNEMPLOYMENT RATE
Great Neck Plaza Area Codes
Income in Great Neck Plaza
Income Overview in Great Neck Plaza
Per Capita Income in Great Neck Plaza is $72,754, while median incomes of families and households are $147,606 and $97,022 respectively.
| Characteristic | Number | Measure |
| Per Capita Income | 7,443 | $72,754 |
| Median Family Income | 1,798 | $147,606 |
| Mean Family Income | 1,798 | $166,253 |
| Median Household Income | 3,878 | $97,022 |
| Mean Household Income | 3,878 | $133,094 |
| Income Deficit | 1,798 | $0 |
| Wage / Income Gap (%) | 7,443 | 33.76% |
| Wage / Income Gap ($) | 7,443 | 66.24¢ per $1 |
| Gini / Inequality Index | 7,443 | 0.47 |
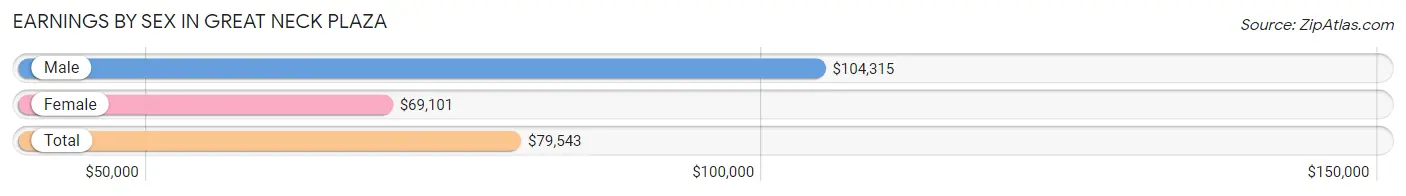
Earnings by Sex in Great Neck Plaza
Average Earnings in Great Neck Plaza are $79,543, $104,315 for men and $69,101 for women, a difference of 33.8%.
| Sex | Number | Average Earnings |
| Male | 1,801 (46.0%) | $104,315 |
| Female | 2,118 (54.0%) | $69,101 |
| Total | 3,919 (100.0%) | $79,543 |
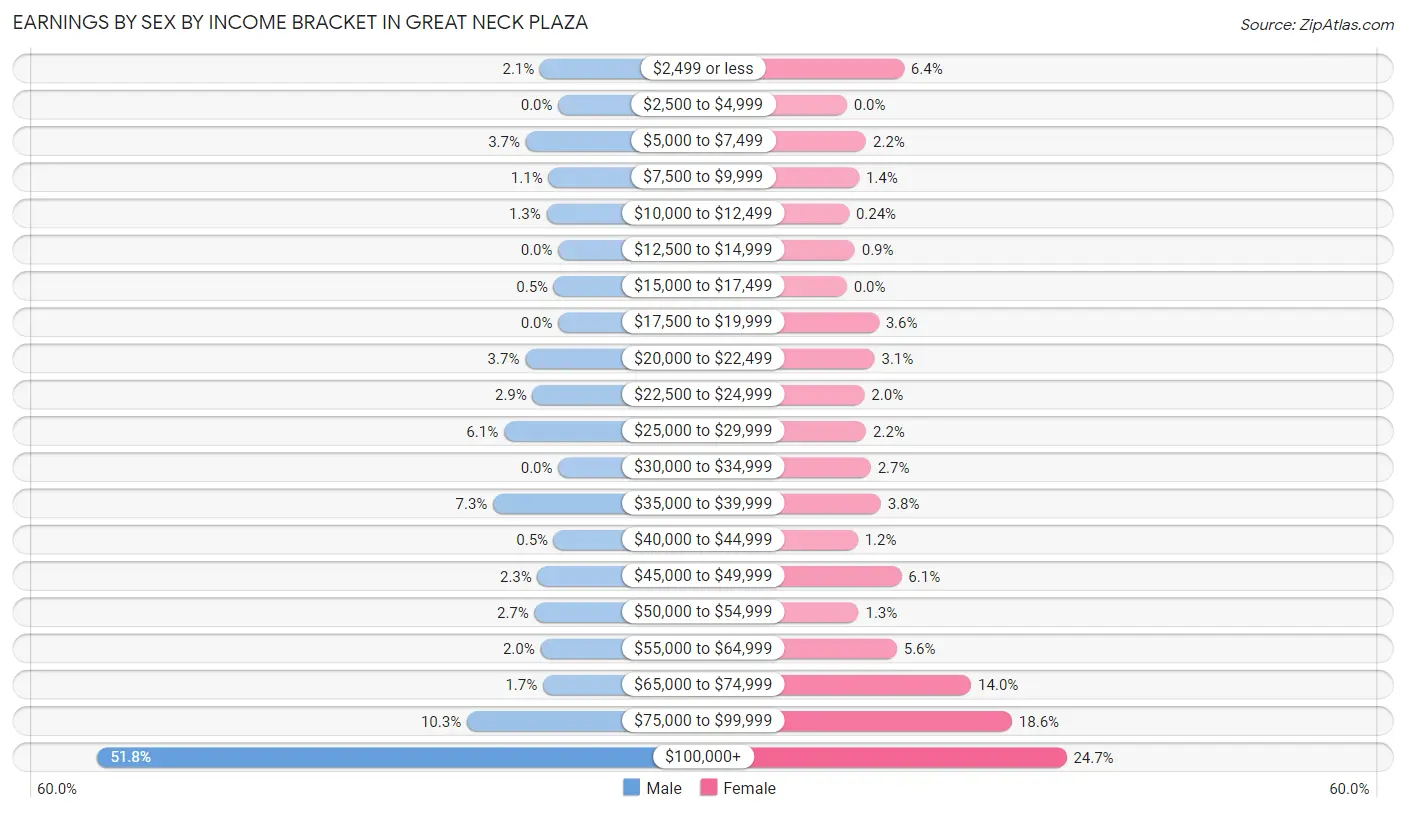
Earnings by Sex by Income Bracket in Great Neck Plaza
The most common earnings brackets in Great Neck Plaza are $100,000+ for men (933 | 51.8%) and $100,000+ for women (523 | 24.7%).
| Income | Male | Female |
| $2,499 or less | 37 (2.1%) | 136 (6.4%) |
| $2,500 to $4,999 | 0 (0.0%) | 0 (0.0%) |
| $5,000 to $7,499 | 66 (3.7%) | 46 (2.2%) |
| $7,500 to $9,999 | 20 (1.1%) | 29 (1.4%) |
| $10,000 to $12,499 | 24 (1.3%) | 5 (0.2%) |
| $12,500 to $14,999 | 0 (0.0%) | 19 (0.9%) |
| $15,000 to $17,499 | 9 (0.5%) | 0 (0.0%) |
| $17,500 to $19,999 | 0 (0.0%) | 76 (3.6%) |
| $20,000 to $22,499 | 67 (3.7%) | 66 (3.1%) |
| $22,500 to $24,999 | 52 (2.9%) | 42 (2.0%) |
| $25,000 to $29,999 | 110 (6.1%) | 46 (2.2%) |
| $30,000 to $34,999 | 0 (0.0%) | 57 (2.7%) |
| $35,000 to $39,999 | 132 (7.3%) | 81 (3.8%) |
| $40,000 to $44,999 | 9 (0.5%) | 26 (1.2%) |
| $45,000 to $49,999 | 42 (2.3%) | 130 (6.1%) |
| $50,000 to $54,999 | 48 (2.7%) | 28 (1.3%) |
| $55,000 to $64,999 | 36 (2.0%) | 119 (5.6%) |
| $65,000 to $74,999 | 31 (1.7%) | 296 (14.0%) |
| $75,000 to $99,999 | 185 (10.3%) | 393 (18.6%) |
| $100,000+ | 933 (51.8%) | 523 (24.7%) |
| Total | 1,801 (100.0%) | 2,118 (100.0%) |
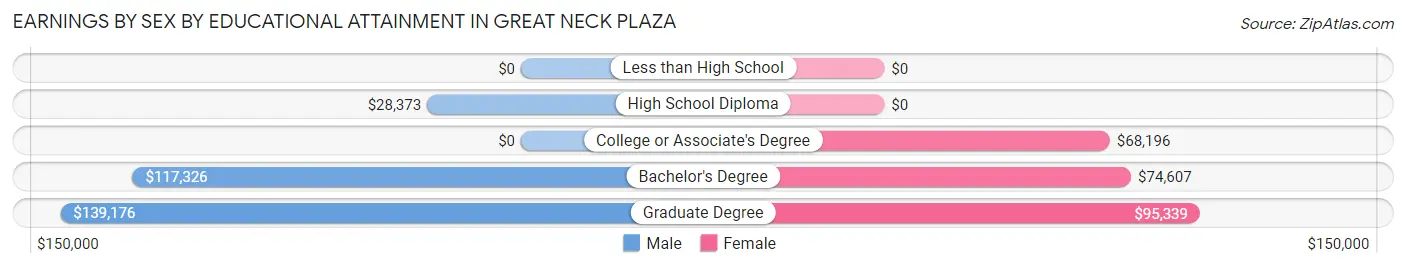
Earnings by Sex by Educational Attainment in Great Neck Plaza
Average earnings in Great Neck Plaza are $107,604 for men and $69,791 for women, a difference of 35.1%. Men with an educational attainment of graduate degree enjoy the highest average annual earnings of $139,176, while those with high school diploma education earn the least with $28,373. Women with an educational attainment of graduate degree earn the most with the average annual earnings of $95,339, while those with college or associate's degree education have the smallest earnings of $68,196.
| Educational Attainment | Male Income | Female Income |
| Less than High School | - | - |
| High School Diploma | $28,373 | $0 |
| College or Associate's Degree | - | - |
| Bachelor's Degree | $117,326 | $74,607 |
| Graduate Degree | $139,176 | $95,339 |
| Total | $107,604 | $69,791 |
Family Income in Great Neck Plaza
Family Income Brackets in Great Neck Plaza
According to the Great Neck Plaza family income data, there are 590 families falling into the $200,000+ income range, which is the most common income bracket and makes up 32.8% of all families.
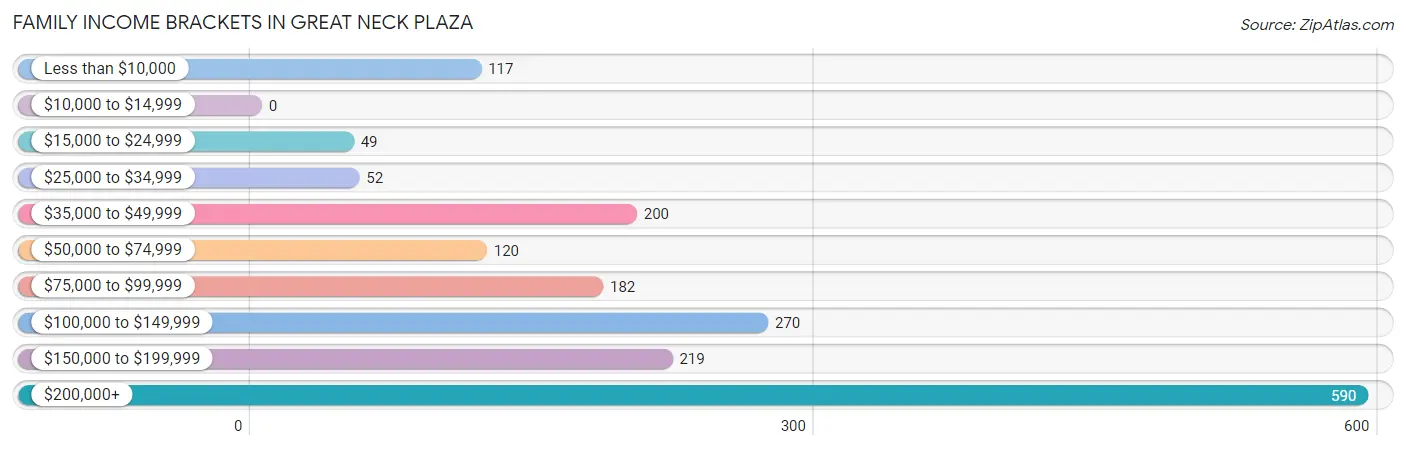
| Income Bracket | # Families | % Families |
| Less than $10,000 | 117 | 6.5% |
| $10,000 to $14,999 | 0 | 0.0% |
| $15,000 to $24,999 | 49 | 2.7% |
| $25,000 to $34,999 | 52 | 2.9% |
| $35,000 to $49,999 | 200 | 11.1% |
| $50,000 to $74,999 | 120 | 6.7% |
| $75,000 to $99,999 | 182 | 10.1% |
| $100,000 to $149,999 | 270 | 15.0% |
| $150,000 to $199,999 | 219 | 12.2% |
| $200,000+ | 590 | 32.8% |
Family Income by Famaliy Size in Great Neck Plaza
4-person families (287 | 16.0%) account for the highest median family income in Great Neck Plaza with $221,215 per family, while 4-person families (287 | 16.0%) have the highest median income of $55,304 per family member.
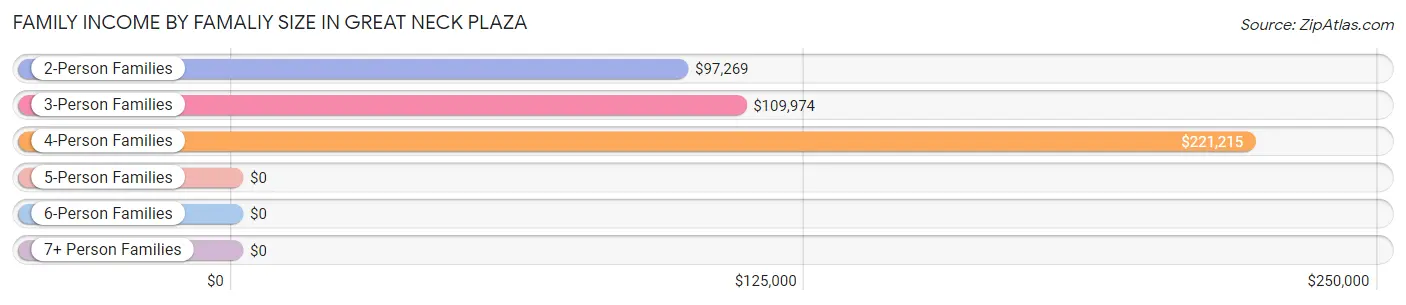
| Income Bracket | # Families | Median Income |
| 2-Person Families | 1,053 (58.6%) | $97,269 |
| 3-Person Families | 397 (22.1%) | $109,974 |
| 4-Person Families | 287 (16.0%) | $221,215 |
| 5-Person Families | 36 (2.0%) | $0 |
| 6-Person Families | 25 (1.4%) | $0 |
| 7+ Person Families | 0 (0.0%) | $0 |
| Total | 1,798 (100.0%) | $147,606 |
Family Income by Number of Earners in Great Neck Plaza
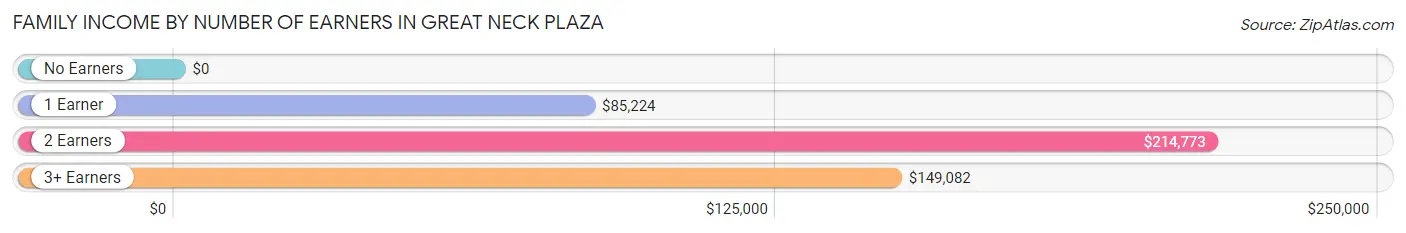
| Number of Earners | # Families | Median Income |
| No Earners | 362 (20.1%) | $0 |
| 1 Earner | 727 (40.4%) | $85,224 |
| 2 Earners | 590 (32.8%) | $214,773 |
| 3+ Earners | 119 (6.6%) | $149,082 |
| Total | 1,798 (100.0%) | $147,606 |
Household Income in Great Neck Plaza
Household Income Brackets in Great Neck Plaza
With 768 households falling in the category, the $200,000+ income range is the most frequent in Great Neck Plaza, accounting for 19.8% of all households. In contrast, only 8 households (0.2%) fall into the $10,000 to $14,999 income bracket, making it the least populous group.
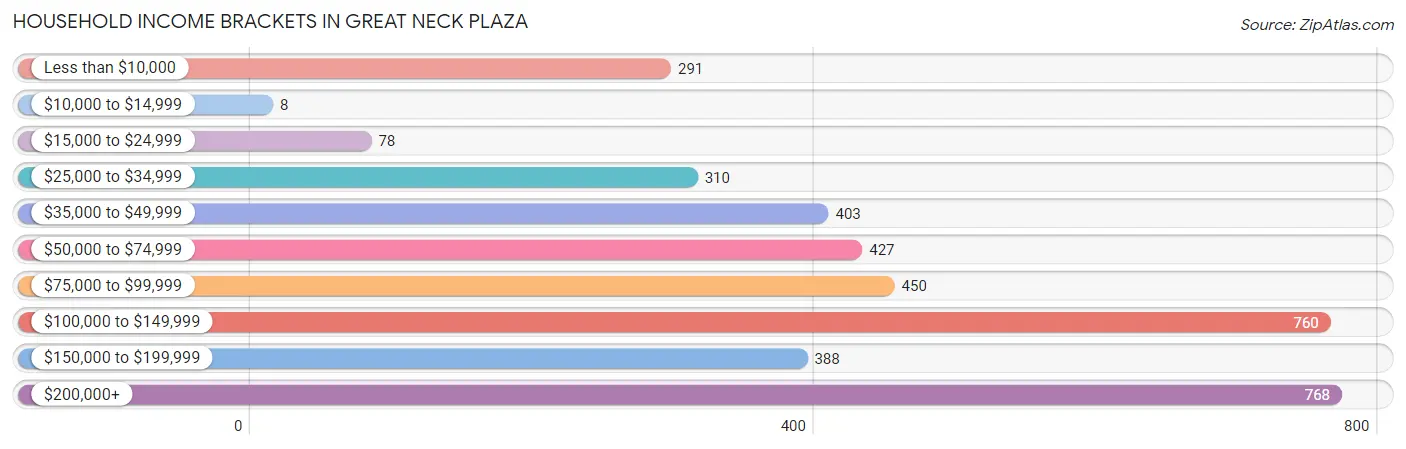
| Income Bracket | # Households | % Households |
| Less than $10,000 | 291 | 7.5% |
| $10,000 to $14,999 | 8 | 0.2% |
| $15,000 to $24,999 | 78 | 2.0% |
| $25,000 to $34,999 | 310 | 8.0% |
| $35,000 to $49,999 | 403 | 10.4% |
| $50,000 to $74,999 | 427 | 11.0% |
| $75,000 to $99,999 | 450 | 11.6% |
| $100,000 to $149,999 | 760 | 19.6% |
| $150,000 to $199,999 | 388 | 10.0% |
| $200,000+ | 768 | 19.8% |
Household Income by Householder Age in Great Neck Plaza
The median household income in Great Neck Plaza is $97,022, with the highest median household income of $117,358 found in the 25 to 44 years age bracket for the primary householder. A total of 1,078 households (27.8%) fall into this category. Meanwhile, the 65+ years age bracket for the primary householder has the lowest median household income of $72,045, with 1,248 households (32.2%) in this group.
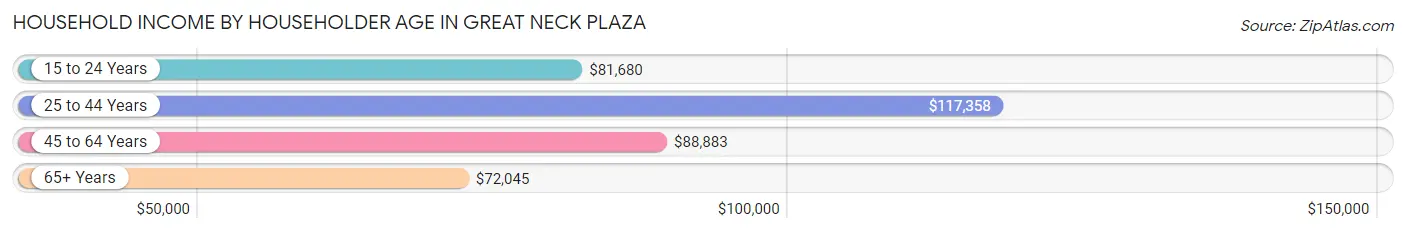
| Income Bracket | # Households | Median Income |
| 15 to 24 Years | 96 (2.5%) | $81,680 |
| 25 to 44 Years | 1,078 (27.8%) | $117,358 |
| 45 to 64 Years | 1,456 (37.6%) | $88,883 |
| 65+ Years | 1,248 (32.2%) | $72,045 |
| Total | 3,878 (100.0%) | $97,022 |
Poverty in Great Neck Plaza
Income Below Poverty by Sex and Age in Great Neck Plaza
With 5.2% poverty level for males and 7.7% for females among the residents of Great Neck Plaza, 75 year old and over males and 6 to 11 year old females are the most vulnerable to poverty, with 50 males (13.6%) and 56 females (47.5%) in their respective age groups living below the poverty level.
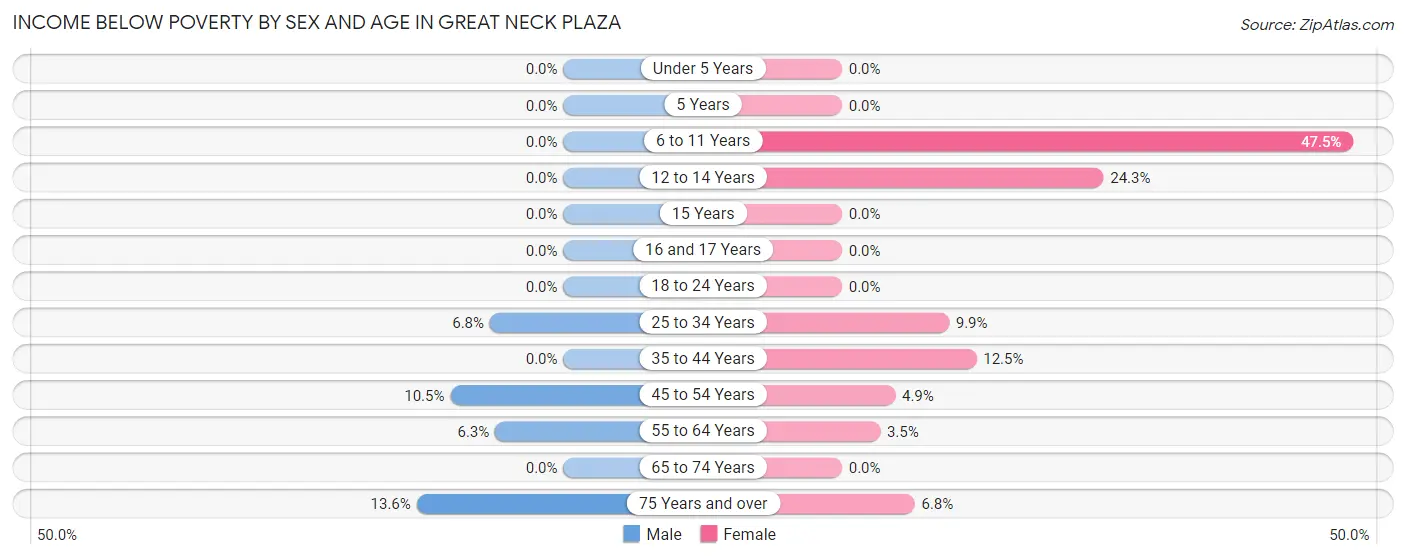
| Age Bracket | Male | Female |
| Under 5 Years | 0 (0.0%) | 0 (0.0%) |
| 5 Years | 0 (0.0%) | 0 (0.0%) |
| 6 to 11 Years | 0 (0.0%) | 56 (47.5%) |
| 12 to 14 Years | 0 (0.0%) | 25 (24.3%) |
| 15 Years | 0 (0.0%) | 0 (0.0%) |
| 16 and 17 Years | 0 (0.0%) | 0 (0.0%) |
| 18 to 24 Years | 0 (0.0%) | 0 (0.0%) |
| 25 to 34 Years | 30 (6.8%) | 54 (9.9%) |
| 35 to 44 Years | 0 (0.0%) | 92 (12.5%) |
| 45 to 54 Years | 51 (10.5%) | 25 (4.9%) |
| 55 to 64 Years | 36 (6.3%) | 19 (3.5%) |
| 65 to 74 Years | 0 (0.0%) | 0 (0.0%) |
| 75 Years and over | 50 (13.6%) | 44 (6.8%) |
| Total | 167 (5.2%) | 315 (7.7%) |
Income Above Poverty by Sex and Age in Great Neck Plaza
According to the poverty statistics in Great Neck Plaza, males aged under 5 years and females aged under 5 years are the age groups that are most secure financially, with 100.0% of males and 100.0% of females in these age groups living above the poverty line.
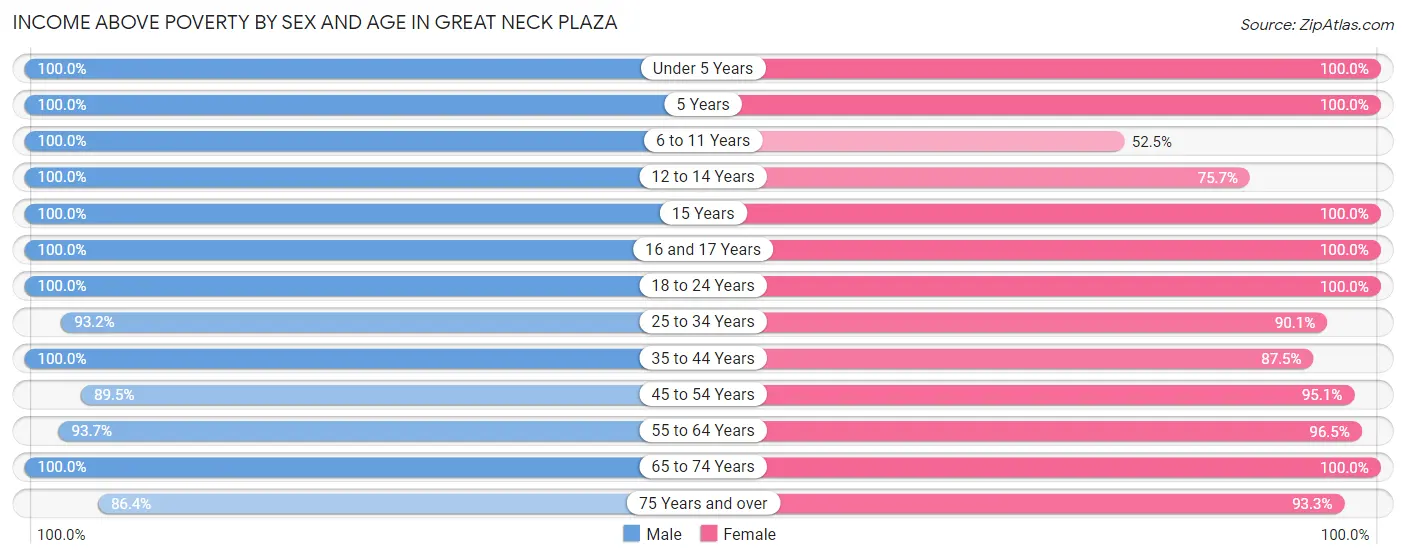
| Age Bracket | Male | Female |
| Under 5 Years | 237 (100.0%) | 120 (100.0%) |
| 5 Years | 16 (100.0%) | 110 (100.0%) |
| 6 to 11 Years | 76 (100.0%) | 62 (52.5%) |
| 12 to 14 Years | 119 (100.0%) | 78 (75.7%) |
| 15 Years | 14 (100.0%) | 37 (100.0%) |
| 16 and 17 Years | 39 (100.0%) | 123 (100.0%) |
| 18 to 24 Years | 177 (100.0%) | 159 (100.0%) |
| 25 to 34 Years | 410 (93.2%) | 490 (90.1%) |
| 35 to 44 Years | 314 (100.0%) | 645 (87.5%) |
| 45 to 54 Years | 435 (89.5%) | 481 (95.1%) |
| 55 to 64 Years | 533 (93.7%) | 517 (96.5%) |
| 65 to 74 Years | 338 (100.0%) | 352 (100.0%) |
| 75 Years and over | 317 (86.4%) | 608 (93.2%) |
| Total | 3,025 (94.8%) | 3,782 (92.3%) |
Income Below Poverty Among Married-Couple Families in Great Neck Plaza
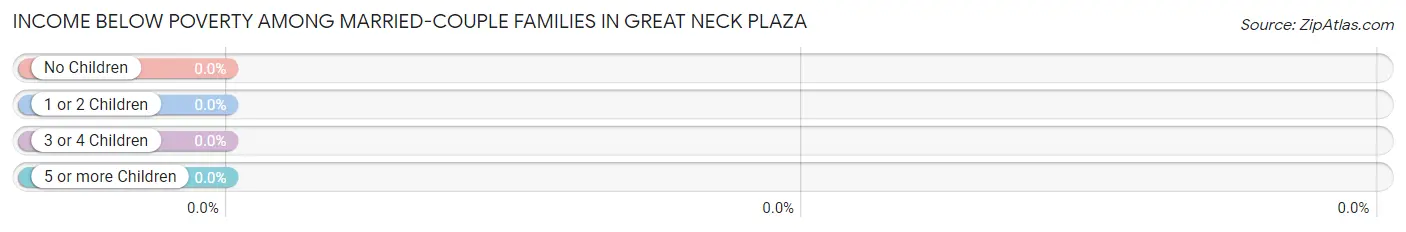
| Children | Above Poverty | Below Poverty |
| No Children | 755 (100.0%) | 0 (0.0%) |
| 1 or 2 Children | 454 (100.0%) | 0 (0.0%) |
| 3 or 4 Children | 46 (100.0%) | 0 (0.0%) |
| 5 or more Children | 0 (0.0%) | 0 (0.0%) |
| Total | 1,255 (100.0%) | 0 (0.0%) |
Income Below Poverty Among Single-Parent Households in Great Neck Plaza
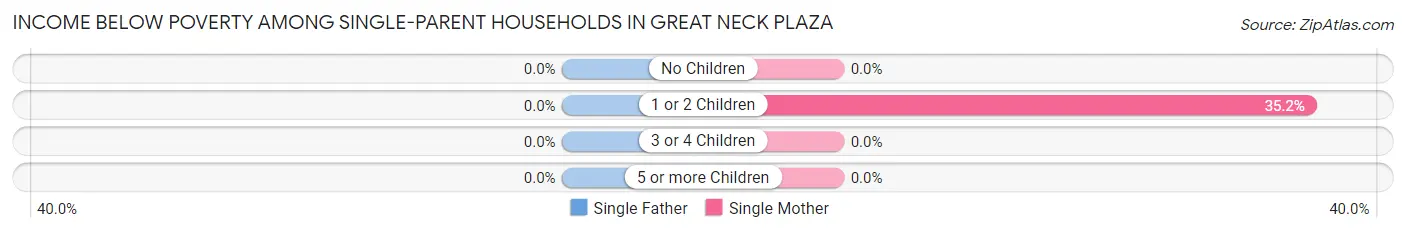
| Children | Single Father | Single Mother |
| No Children | 0 (0.0%) | 0 (0.0%) |
| 1 or 2 Children | 0 (0.0%) | 117 (35.2%) |
| 3 or 4 Children | 0 (0.0%) | 0 (0.0%) |
| 5 or more Children | 0 (0.0%) | 0 (0.0%) |
| Total | 0 (0.0%) | 117 (26.0%) |
Income Below Poverty Among Married-Couple vs Single-Parent Households in Great Neck Plaza
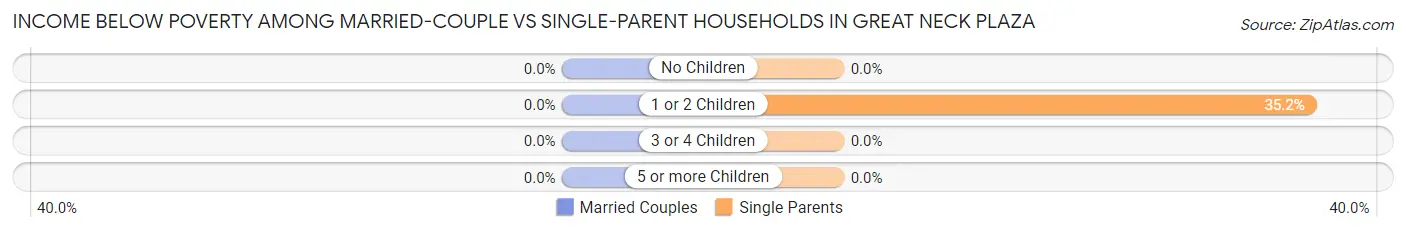
| Children | Married-Couple Families | Single-Parent Households |
| No Children | 0 (0.0%) | 0 (0.0%) |
| 1 or 2 Children | 0 (0.0%) | 117 (35.2%) |
| 3 or 4 Children | 0 (0.0%) | 0 (0.0%) |
| 5 or more Children | 0 (0.0%) | 0 (0.0%) |
| Total | 0 (0.0%) | 117 (21.5%) |
Race in Great Neck Plaza
The most populous races in Great Neck Plaza are White / Caucasian (5,131 | 68.9%), Asian (1,303 | 17.5%), and Hispanic or Latino (967 | 13.0%).
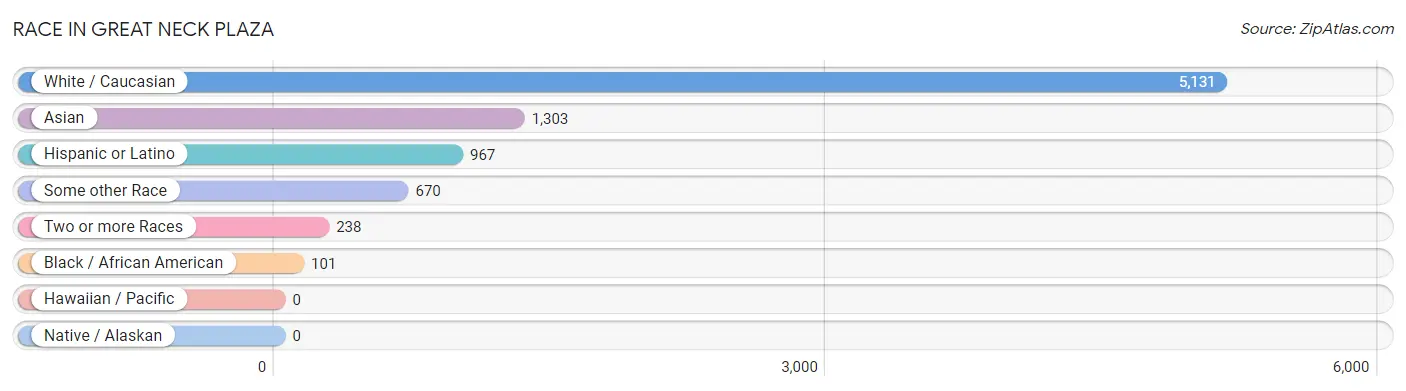
| Race | # Population | % Population |
| Asian | 1,303 | 17.5% |
| Black / African American | 101 | 1.4% |
| Hawaiian / Pacific | 0 | 0.0% |
| Hispanic or Latino | 967 | 13.0% |
| Native / Alaskan | 0 | 0.0% |
| White / Caucasian | 5,131 | 68.9% |
| Two or more Races | 238 | 3.2% |
| Some other Race | 670 | 9.0% |
| Total | 7,443 | 100.0% |
Ancestry in Great Neck Plaza
The most populous ancestries reported in Great Neck Plaza are German (679 | 9.1%), Iranian (626 | 8.4%), Indian (Asian) (607 | 8.2%), Irish (526 | 7.1%), and Central American (445 | 6.0%), together accounting for 38.7% of all Great Neck Plaza residents.
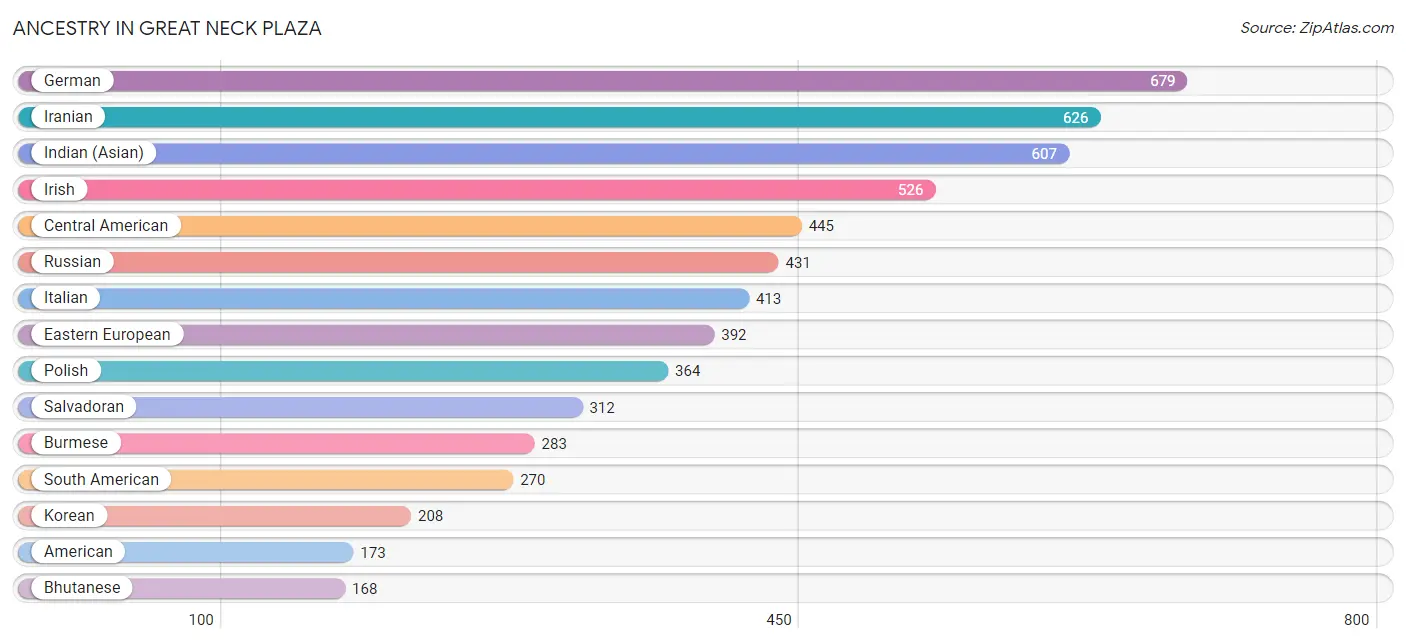
| Ancestry | # Population | % Population |
| Albanian | 28 | 0.4% |
| American | 173 | 2.3% |
| Arab | 50 | 0.7% |
| Australian | 53 | 0.7% |
| Austrian | 66 | 0.9% |
| Bhutanese | 168 | 2.3% |
| British | 43 | 0.6% |
| Burmese | 283 | 3.8% |
| Central American | 445 | 6.0% |
| Colombian | 93 | 1.3% |
| Cuban | 125 | 1.7% |
| Czech | 51 | 0.7% |
| Czechoslovakian | 39 | 0.5% |
| Dominican | 20 | 0.3% |
| Eastern European | 392 | 5.3% |
| English | 69 | 0.9% |
| European | 32 | 0.4% |
| Filipino | 5 | 0.1% |
| French | 30 | 0.4% |
| German | 679 | 9.1% |
| Greek | 73 | 1.0% |
| Guatemalan | 133 | 1.8% |
| Hungarian | 42 | 0.6% |
| Indian (Asian) | 607 | 8.2% |
| Iranian | 626 | 8.4% |
| Irish | 526 | 7.1% |
| Israeli | 134 | 1.8% |
| Italian | 413 | 5.6% |
| Korean | 208 | 2.8% |
| Mexican | 8 | 0.1% |
| Norwegian | 20 | 0.3% |
| Peruvian | 156 | 2.1% |
| Polish | 364 | 4.9% |
| Romanian | 92 | 1.2% |
| Russian | 431 | 5.8% |
| Salvadoran | 312 | 4.2% |
| Samoan | 15 | 0.2% |
| Scottish | 16 | 0.2% |
| Slovak | 10 | 0.1% |
| South American | 270 | 3.6% |
| Spaniard | 21 | 0.3% |
| Swedish | 19 | 0.3% |
| Swiss | 19 | 0.3% |
| Thai | 46 | 0.6% |
| Ukrainian | 36 | 0.5% |
| Venezuelan | 21 | 0.3% |
| Vietnamese | 50 | 0.7% | View All 47 Rows |
Immigrants in Great Neck Plaza
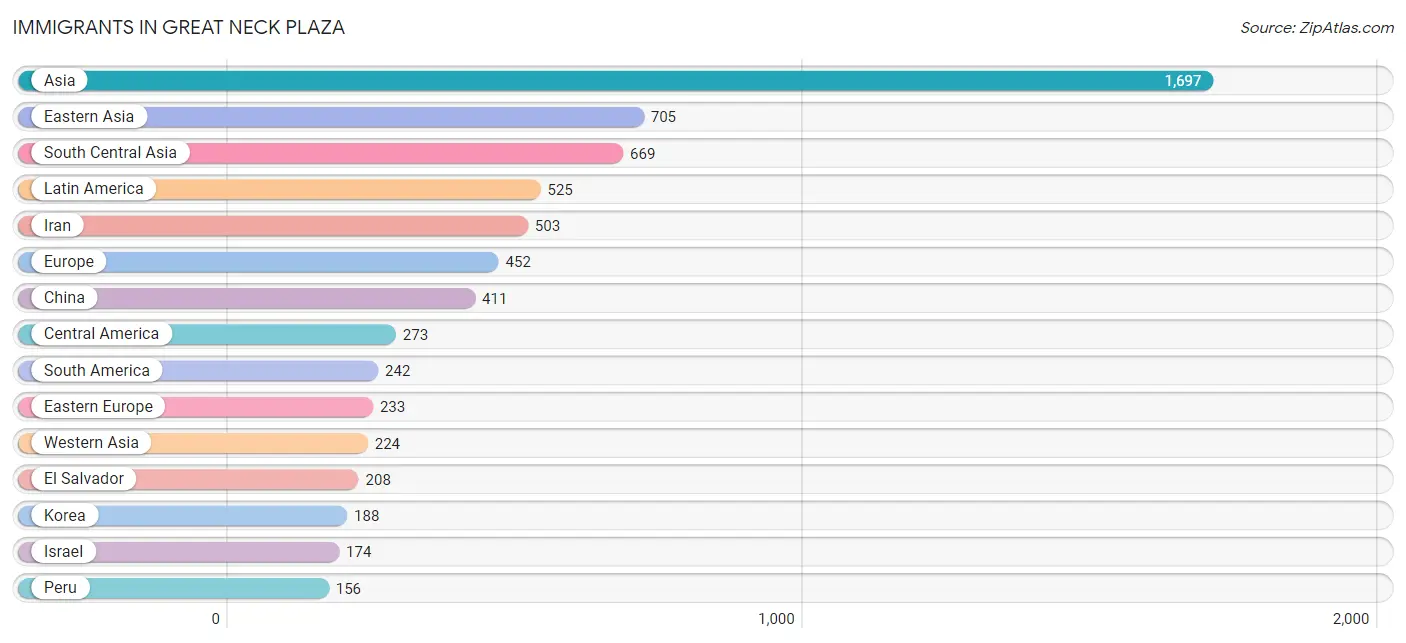
The most numerous immigrant groups reported in Great Neck Plaza came from Asia (1,697 | 22.8%), Eastern Asia (705 | 9.5%), South Central Asia (669 | 9.0%), Latin America (525 | 7.0%), and Iran (503 | 6.8%), together accounting for 55.1% of all Great Neck Plaza residents.
| Immigration Origin | # Population | % Population |
| Afghanistan | 92 | 1.2% |
| Asia | 1,697 | 22.8% |
| Australia | 53 | 0.7% |
| Bangladesh | 50 | 0.7% |
| Brazil | 19 | 0.3% |
| Caribbean | 10 | 0.1% |
| Central America | 273 | 3.7% |
| China | 411 | 5.5% |
| Colombia | 67 | 0.9% |
| Czechoslovakia | 10 | 0.1% |
| Dominican Republic | 10 | 0.1% |
| Eastern Asia | 705 | 9.5% |
| Eastern Europe | 233 | 3.1% |
| El Salvador | 208 | 2.8% |
| Europe | 452 | 6.1% |
| Germany | 43 | 0.6% |
| Greece | 55 | 0.7% |
| Guatemala | 65 | 0.9% |
| Hong Kong | 80 | 1.1% |
| India | 24 | 0.3% |
| Iran | 503 | 6.8% |
| Iraq | 50 | 0.7% |
| Ireland | 10 | 0.1% |
| Israel | 174 | 2.3% |
| Italy | 81 | 1.1% |
| Japan | 106 | 1.4% |
| Korea | 188 | 2.5% |
| Latin America | 525 | 7.0% |
| Northern Europe | 10 | 0.1% |
| Oceania | 53 | 0.7% |
| Peru | 156 | 2.1% |
| Philippines | 84 | 1.1% |
| Poland | 108 | 1.5% |
| Romania | 24 | 0.3% |
| Russia | 23 | 0.3% |
| South America | 242 | 3.3% |
| South Central Asia | 669 | 9.0% |
| South Eastern Asia | 99 | 1.3% |
| Southern Europe | 147 | 2.0% |
| Spain | 11 | 0.2% |
| Switzerland | 19 | 0.3% |
| Taiwan | 15 | 0.2% |
| Thailand | 15 | 0.2% |
| Ukraine | 52 | 0.7% |
| Western Asia | 224 | 3.0% |
| Western Europe | 62 | 0.8% | View All 46 Rows |
Sex and Age in Great Neck Plaza
Sex and Age in Great Neck Plaza
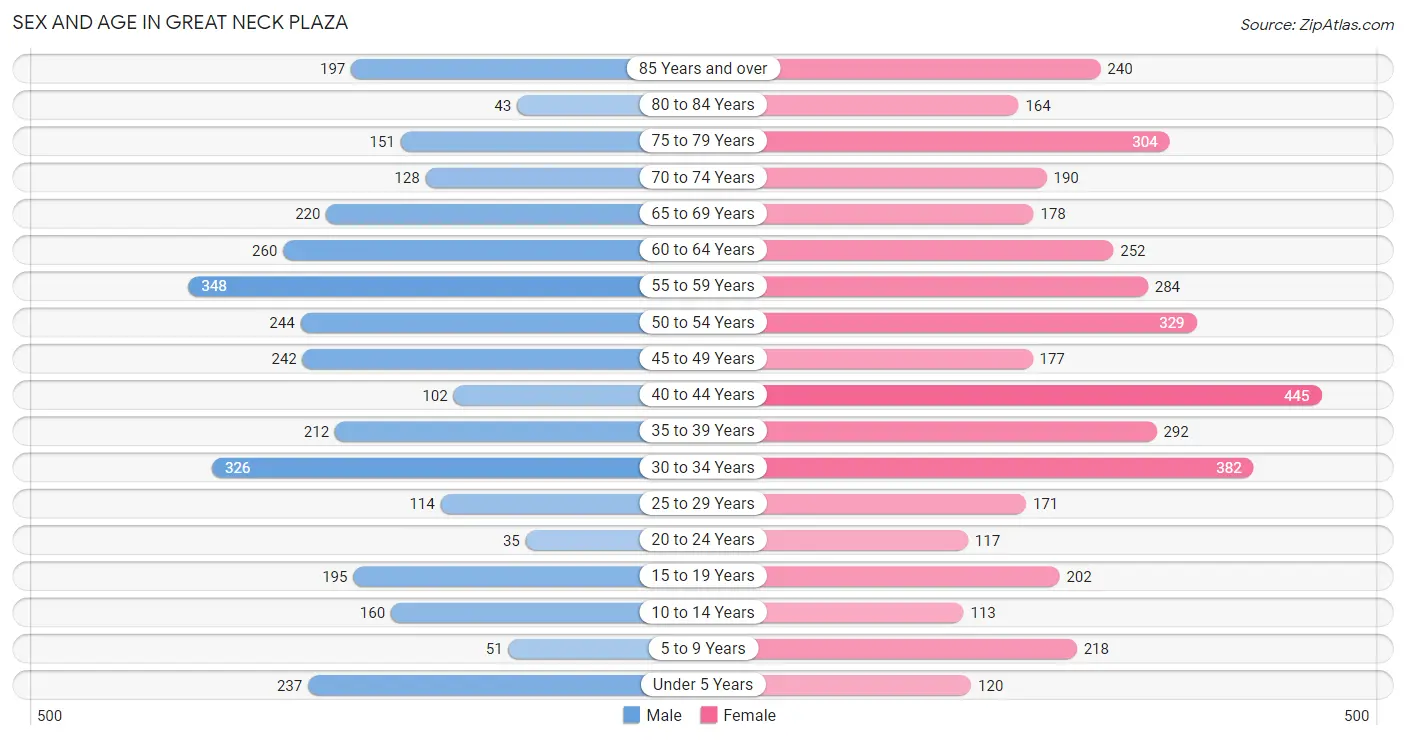
The most populous age groups in Great Neck Plaza are 55 to 59 Years (348 | 10.7%) for men and 40 to 44 Years (445 | 10.6%) for women.
| Age Bracket | Male | Female |
| Under 5 Years | 237 (7.3%) | 120 (2.9%) |
| 5 to 9 Years | 51 (1.6%) | 218 (5.2%) |
| 10 to 14 Years | 160 (4.9%) | 113 (2.7%) |
| 15 to 19 Years | 195 (6.0%) | 202 (4.8%) |
| 20 to 24 Years | 35 (1.1%) | 117 (2.8%) |
| 25 to 29 Years | 114 (3.5%) | 171 (4.1%) |
| 30 to 34 Years | 326 (10.0%) | 382 (9.1%) |
| 35 to 39 Years | 212 (6.5%) | 292 (7.0%) |
| 40 to 44 Years | 102 (3.1%) | 445 (10.6%) |
| 45 to 49 Years | 242 (7.4%) | 177 (4.2%) |
| 50 to 54 Years | 244 (7.5%) | 329 (7.9%) |
| 55 to 59 Years | 348 (10.7%) | 284 (6.8%) |
| 60 to 64 Years | 260 (8.0%) | 252 (6.0%) |
| 65 to 69 Years | 220 (6.7%) | 178 (4.3%) |
| 70 to 74 Years | 128 (3.9%) | 190 (4.5%) |
| 75 to 79 Years | 151 (4.6%) | 304 (7.3%) |
| 80 to 84 Years | 43 (1.3%) | 164 (3.9%) |
| 85 Years and over | 197 (6.0%) | 240 (5.7%) |
| Total | 3,265 (100.0%) | 4,178 (100.0%) |
Families and Households in Great Neck Plaza
Median Family Size in Great Neck Plaza
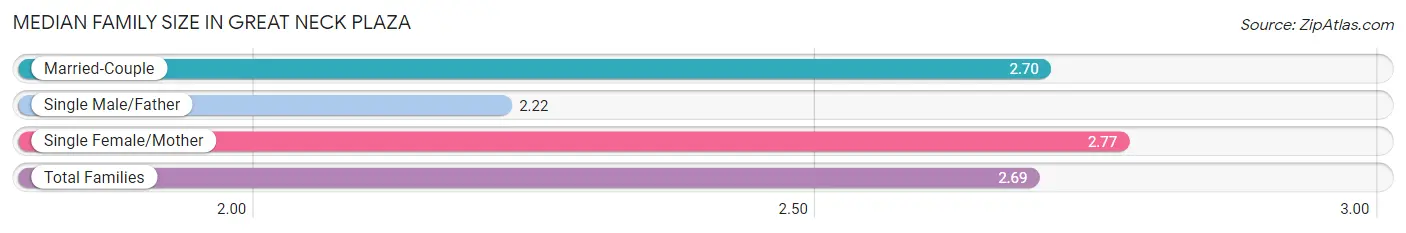
The median family size in Great Neck Plaza is 2.69 persons per family, with single female/mother families (450 | 25.0%) accounting for the largest median family size of 2.77 persons per family. On the other hand, single male/father families (93 | 5.2%) represent the smallest median family size with 2.22 persons per family.
| Family Type | # Families | Family Size |
| Married-Couple | 1,255 (69.8%) | 2.70 |
| Single Male/Father | 93 (5.2%) | 2.22 |
| Single Female/Mother | 450 (25.0%) | 2.77 |
| Total Families | 1,798 (100.0%) | 2.69 |
Median Household Size in Great Neck Plaza
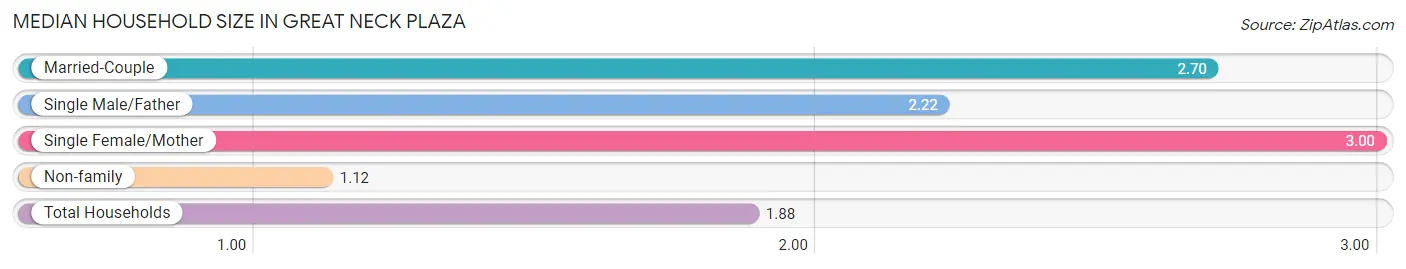
The median household size in Great Neck Plaza is 1.88 persons per household, with single female/mother households (450 | 11.6%) accounting for the largest median household size of 3 persons per household. non-family households (2,080 | 53.6%) represent the smallest median household size with 1.12 persons per household.
| Household Type | # Households | Household Size |
| Married-Couple | 1,255 (32.4%) | 2.70 |
| Single Male/Father | 93 (2.4%) | 2.22 |
| Single Female/Mother | 450 (11.6%) | 3.00 |
| Non-family | 2,080 (53.6%) | 1.12 |
| Total Households | 3,878 (100.0%) | 1.88 |
Household Size by Marriage Status in Great Neck Plaza
Out of a total of 3,878 households in Great Neck Plaza, 1,798 (46.4%) are family households, while 2,080 (53.6%) are nonfamily households. The most numerous type of family households are 2-person households, comprising 980, and the most common type of nonfamily households are 1-person households, comprising 1,843.
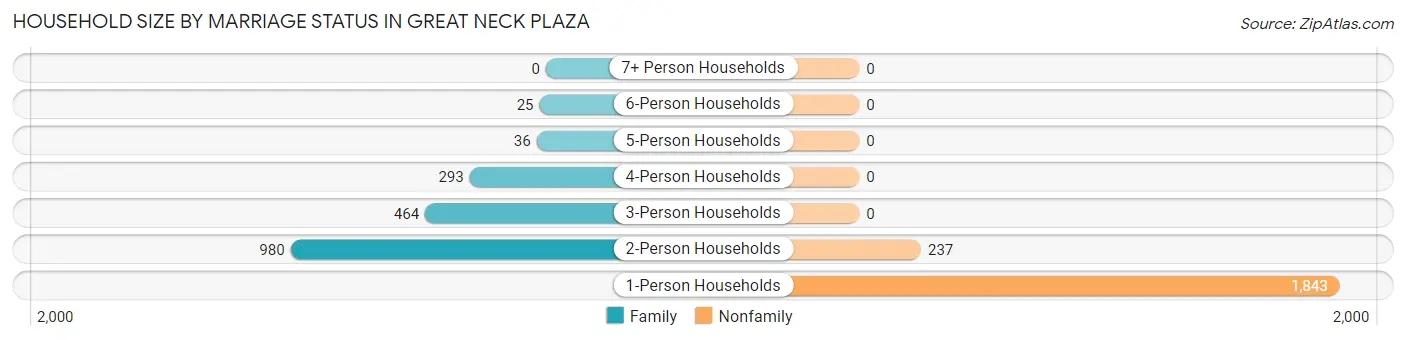
| Household Size | Family Households | Nonfamily Households |
| 1-Person Households | - | 1,843 (47.5%) |
| 2-Person Households | 980 (25.3%) | 237 (6.1%) |
| 3-Person Households | 464 (12.0%) | 0 (0.0%) |
| 4-Person Households | 293 (7.6%) | 0 (0.0%) |
| 5-Person Households | 36 (0.9%) | 0 (0.0%) |
| 6-Person Households | 25 (0.6%) | 0 (0.0%) |
| 7+ Person Households | 0 (0.0%) | 0 (0.0%) |
| Total | 1,798 (46.4%) | 2,080 (53.6%) |
Female Fertility in Great Neck Plaza
Fertility by Age in Great Neck Plaza
Average fertility rate in Great Neck Plaza is 85.0 births per 1,000 women. Women in the age bracket of 20 to 34 years have the highest fertility rate with 184.0 births per 1,000 women. Women in the age bracket of 20 to 34 years acount for 78.8% of all women with births.
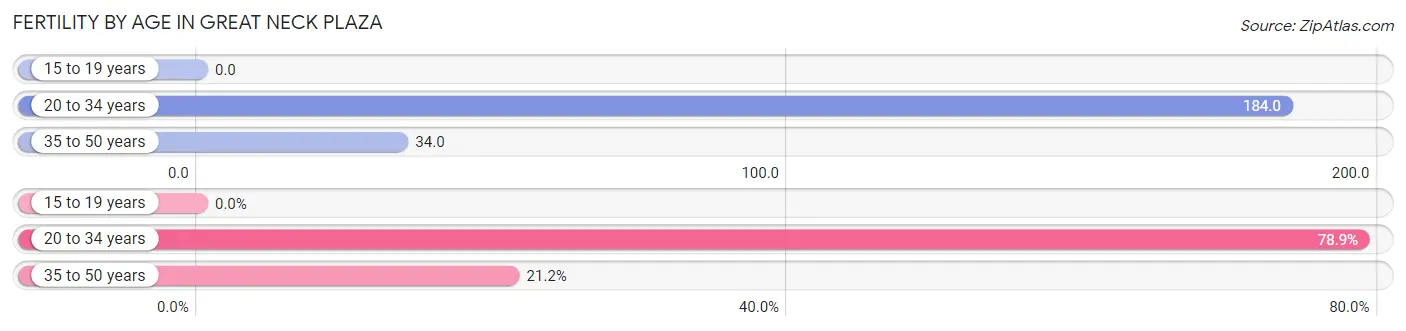
| Age Bracket | Women with Births | Births / 1,000 Women |
| 15 to 19 years | 0 (0.0%) | 0.0 |
| 20 to 34 years | 123 (78.8%) | 184.0 |
| 35 to 50 years | 33 (21.1%) | 34.0 |
| Total | 156 (100.0%) | 85.0 |
Fertility by Age by Marriage Status in Great Neck Plaza
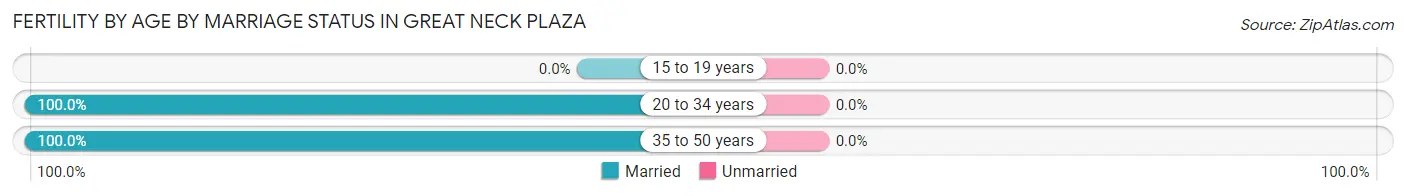
| Age Bracket | Married | Unmarried |
| 15 to 19 years | 0 (0.0%) | 0 (0.0%) |
| 20 to 34 years | 123 (100.0%) | 0 (0.0%) |
| 35 to 50 years | 33 (100.0%) | 0 (0.0%) |
| Total | 156 (100.0%) | 0 (0.0%) |
Fertility by Education in Great Neck Plaza
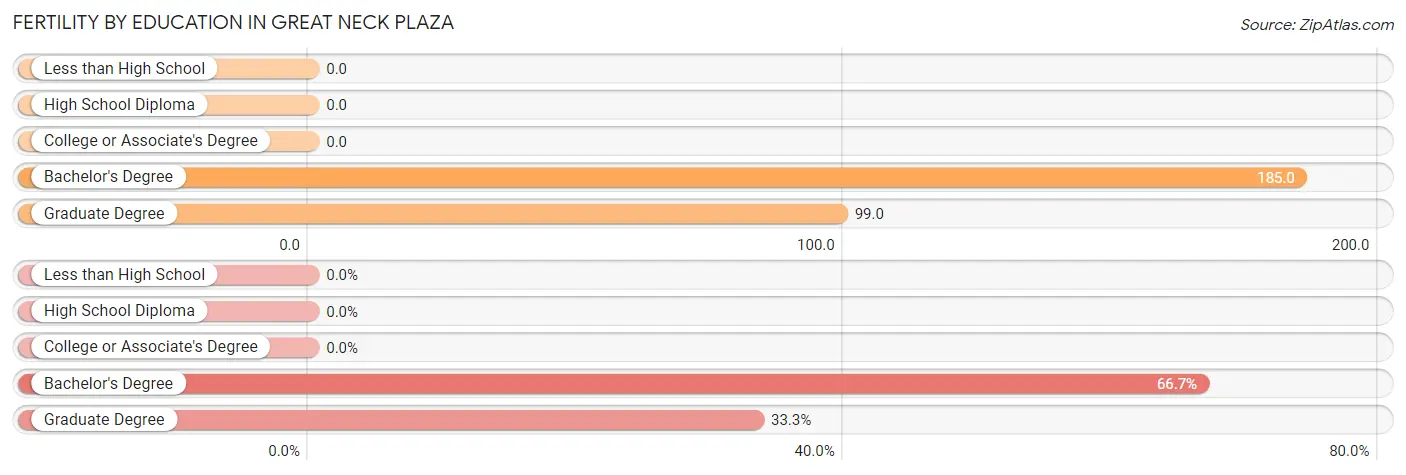
| Educational Attainment | Women with Births | Births / 1,000 Women |
| Less than High School | 0 (0.0%) | 0.0 |
| High School Diploma | 0 (0.0%) | 0.0 |
| College or Associate's Degree | 0 (0.0%) | 0.0 |
| Bachelor's Degree | 104 (66.7%) | 185.0 |
| Graduate Degree | 52 (33.3%) | 99.0 |
| Total | 156 (100.0%) | 85.0 |
Fertility by Education by Marriage Status in Great Neck Plaza
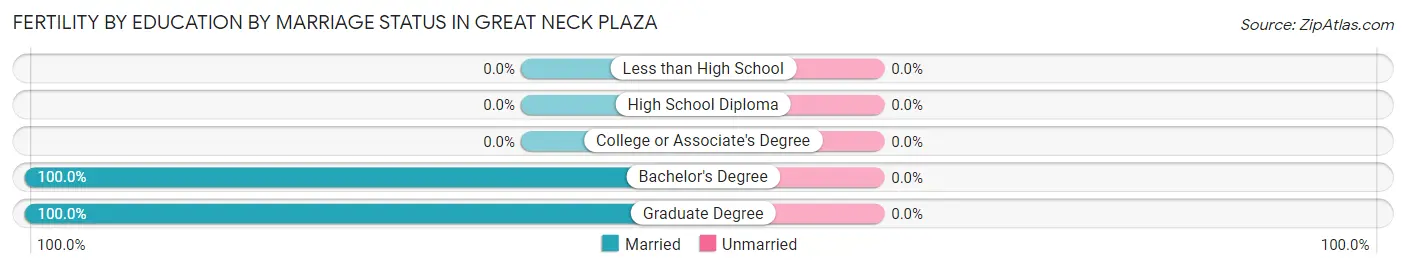
| Educational Attainment | Married | Unmarried |
| Less than High School | 0 (0.0%) | 0 (0.0%) |
| High School Diploma | 0 (0.0%) | 0 (0.0%) |
| College or Associate's Degree | 0 (0.0%) | 0 (0.0%) |
| Bachelor's Degree | 104 (100.0%) | 0 (0.0%) |
| Graduate Degree | 52 (100.0%) | 0 (0.0%) |
| Total | 156 (100.0%) | 0 (0.0%) |
Employment Characteristics in Great Neck Plaza
Employment by Class of Employer in Great Neck Plaza
Among the 3,508 employed individuals in Great Neck Plaza, private company employees (2,338 | 66.6%), self-employed (incorporated) (360 | 10.3%), and not-for-profit organizations (350 | 10.0%) make up the most common classes of employment.
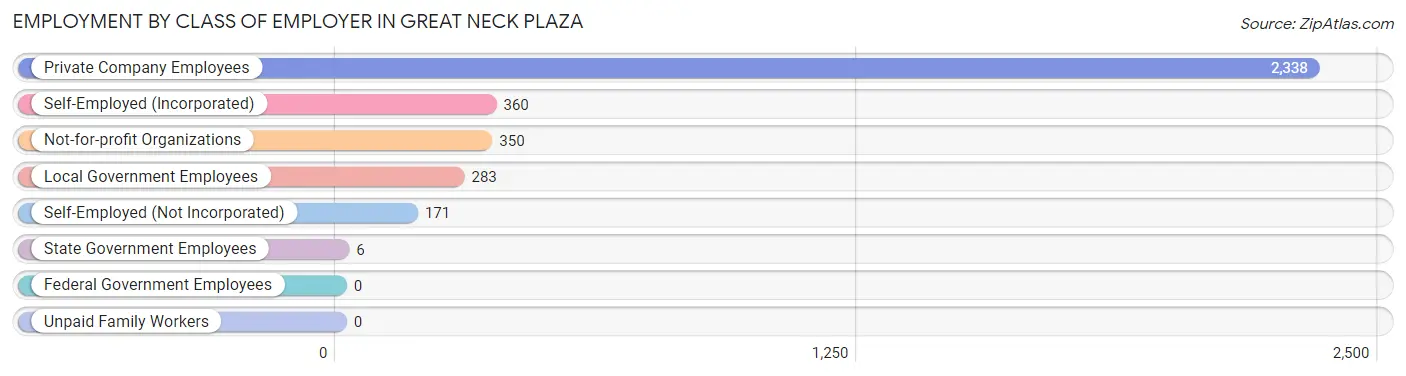
| Employer Class | # Employees | % Employees |
| Private Company Employees | 2,338 | 66.6% |
| Self-Employed (Incorporated) | 360 | 10.3% |
| Self-Employed (Not Incorporated) | 171 | 4.9% |
| Not-for-profit Organizations | 350 | 10.0% |
| Local Government Employees | 283 | 8.1% |
| State Government Employees | 6 | 0.2% |
| Federal Government Employees | 0 | 0.0% |
| Unpaid Family Workers | 0 | 0.0% |
| Total | 3,508 | 100.0% |
Employment Status by Age in Great Neck Plaza
According to the labor force statistics for Great Neck Plaza, out of the total population over 16 years of age (6,493), 59.6% or 3,870 individuals are in the labor force, with 7.0% or 271 of them unemployed. The age group with the highest labor force participation rate is 45 to 54 years, with 87.6% or 869 individuals in the labor force. Within the labor force, the 65 to 74 years age range has the highest percentage of unemployed individuals, with 24.1% or 79 of them being unemployed.
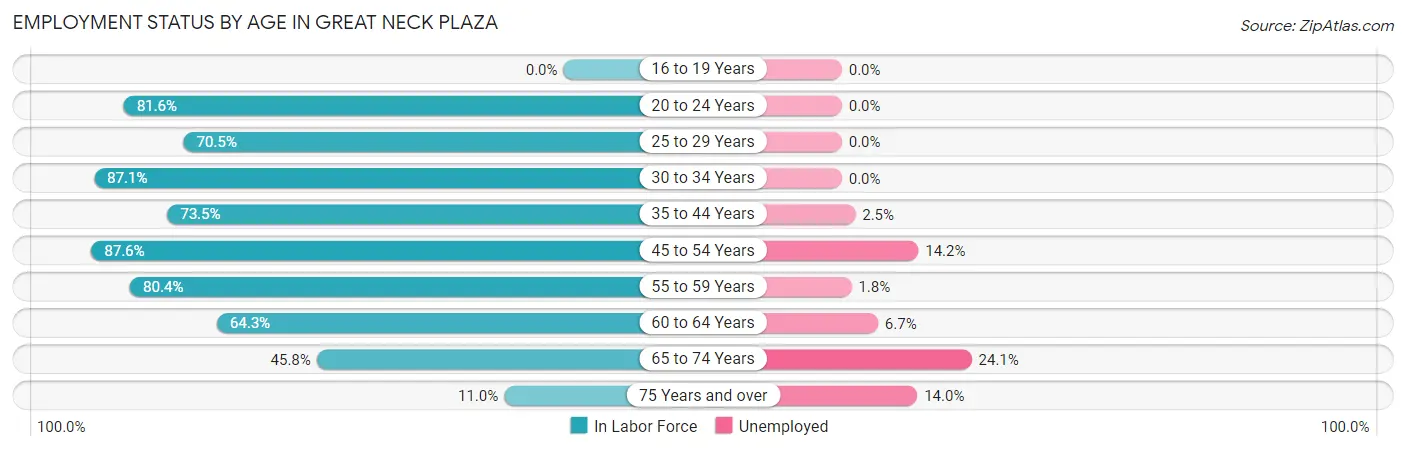
| Age Bracket | In Labor Force | Unemployed |
| 16 to 19 Years | 0 (0.0%) | 0 (0.0%) |
| 20 to 24 Years | 124 (81.6%) | 0 (0.0%) |
| 25 to 29 Years | 201 (70.5%) | 0 (0.0%) |
| 30 to 34 Years | 617 (87.1%) | 0 (0.0%) |
| 35 to 44 Years | 772 (73.5%) | 19 (2.5%) |
| 45 to 54 Years | 869 (87.6%) | 123 (14.2%) |
| 55 to 59 Years | 508 (80.4%) | 9 (1.8%) |
| 60 to 64 Years | 329 (64.3%) | 22 (6.7%) |
| 65 to 74 Years | 328 (45.8%) | 79 (24.1%) |
| 75 Years and over | 121 (11.0%) | 17 (14.0%) |
| Total | 3,870 (59.6%) | 271 (7.0%) |
Employment Status by Educational Attainment in Great Neck Plaza
According to labor force statistics for Great Neck Plaza, 78.9% of individuals (3,298) out of the total population between 25 and 64 years of age (4,180) are in the labor force, with 5.2% or 171 of them being unemployed. The group with the highest labor force participation rate are those with the educational attainment of college / associate degree, with 89.6% or 592 individuals in the labor force. Within the labor force, individuals with less than high school education have the highest percentage of unemployment, with 17.5% or 10 of them being unemployed.
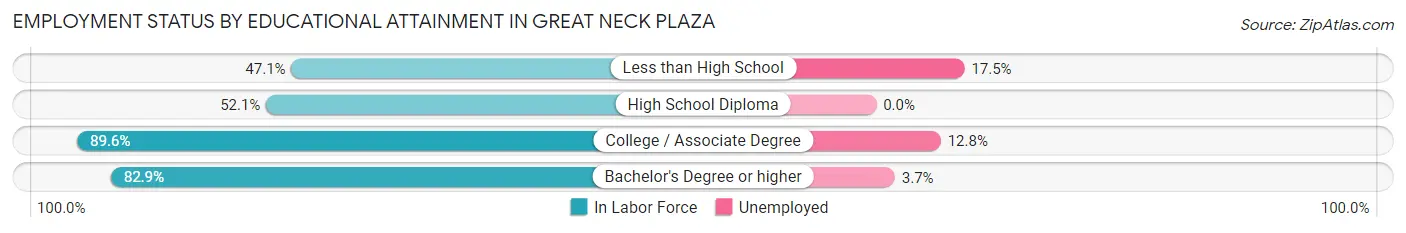
| Educational Attainment | In Labor Force | Unemployed |
| Less than High School | 57 (47.1%) | 21 (17.5%) |
| High School Diploma | 286 (52.1%) | 0 (0.0%) |
| College / Associate Degree | 592 (89.6%) | 85 (12.8%) |
| Bachelor's Degree or higher | 2,362 (82.9%) | 105 (3.7%) |
| Total | 3,298 (78.9%) | 217 (5.2%) |
Employment Occupations by Sex in Great Neck Plaza
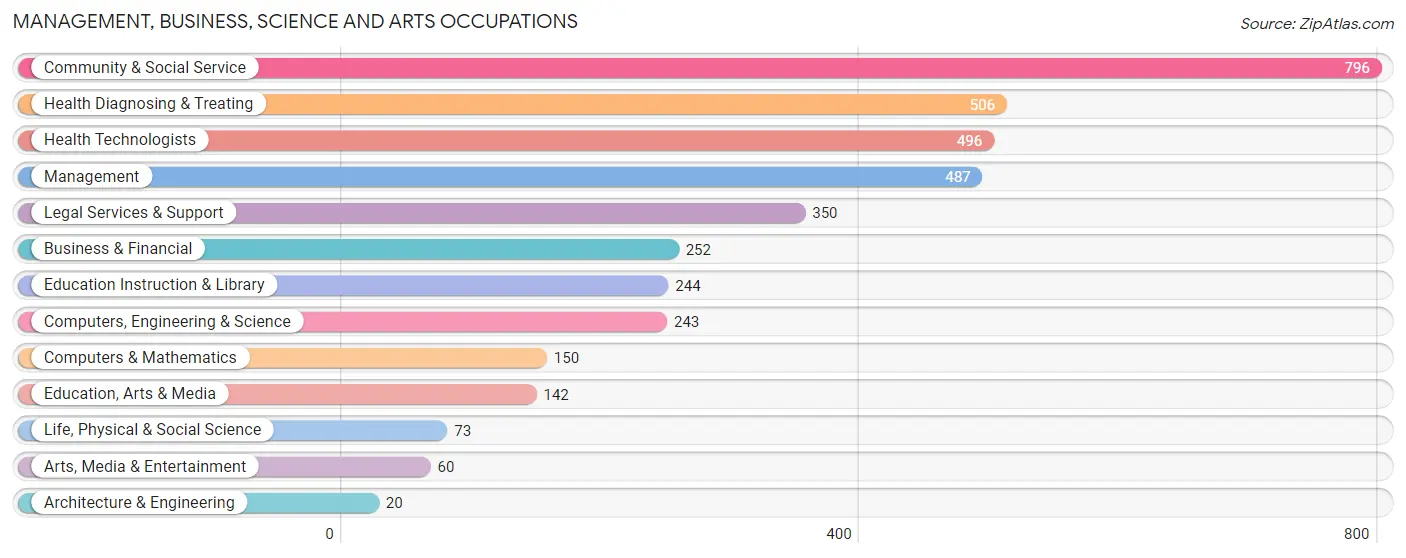
Management, Business, Science and Arts Occupations
The most common Management, Business, Science and Arts occupations in Great Neck Plaza are Community & Social Service (796 | 22.1%), Health Diagnosing & Treating (506 | 14.1%), Health Technologists (496 | 13.8%), Management (487 | 13.5%), and Legal Services & Support (350 | 9.7%).
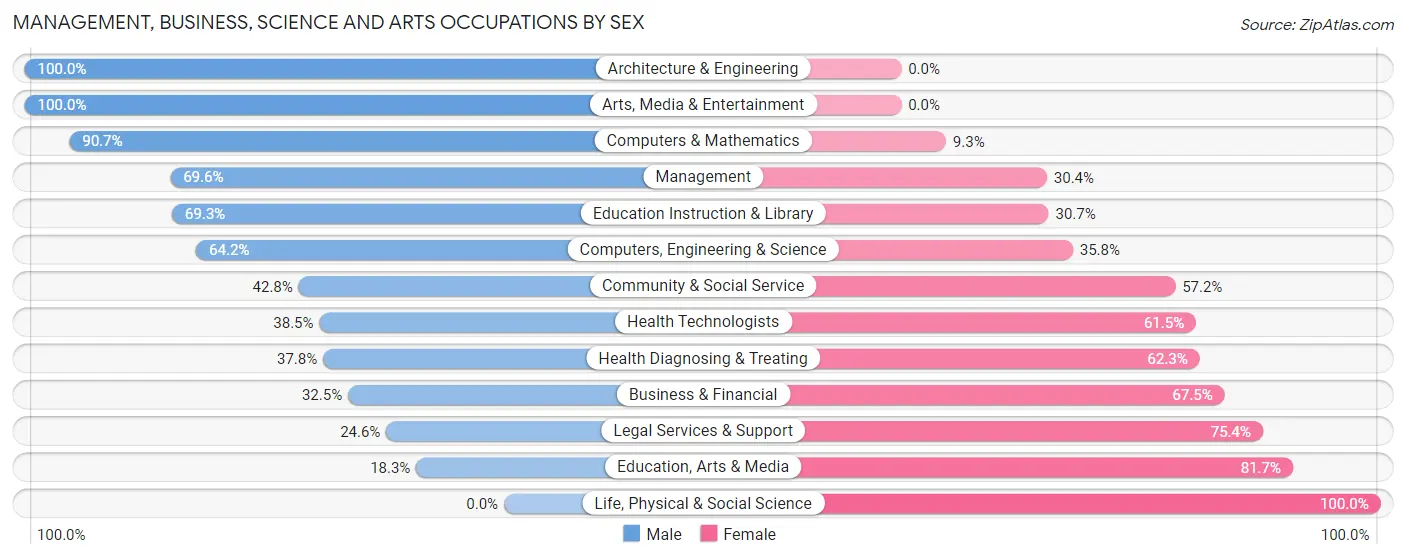
Management, Business, Science and Arts Occupations by Sex
Within the Management, Business, Science and Arts occupations in Great Neck Plaza, the most male-oriented occupations are Architecture & Engineering (100.0%), Arts, Media & Entertainment (100.0%), and Computers & Mathematics (90.7%), while the most female-oriented occupations are Life, Physical & Social Science (100.0%), Education, Arts & Media (81.7%), and Legal Services & Support (75.4%).
| Occupation | Male | Female |
| Management | 339 (69.6%) | 148 (30.4%) |
| Business & Financial | 82 (32.5%) | 170 (67.5%) |
| Computers, Engineering & Science | 156 (64.2%) | 87 (35.8%) |
| Computers & Mathematics | 136 (90.7%) | 14 (9.3%) |
| Architecture & Engineering | 20 (100.0%) | 0 (0.0%) |
| Life, Physical & Social Science | 0 (0.0%) | 73 (100.0%) |
| Community & Social Service | 341 (42.8%) | 455 (57.2%) |
| Education, Arts & Media | 26 (18.3%) | 116 (81.7%) |
| Legal Services & Support | 86 (24.6%) | 264 (75.4%) |
| Education Instruction & Library | 169 (69.3%) | 75 (30.7%) |
| Arts, Media & Entertainment | 60 (100.0%) | 0 (0.0%) |
| Health Diagnosing & Treating | 191 (37.8%) | 315 (62.3%) |
| Health Technologists | 191 (38.5%) | 305 (61.5%) |
| Total (Category) | 1,109 (48.6%) | 1,175 (51.4%) |
| Total (Overall) | 1,646 (45.7%) | 1,954 (54.3%) |
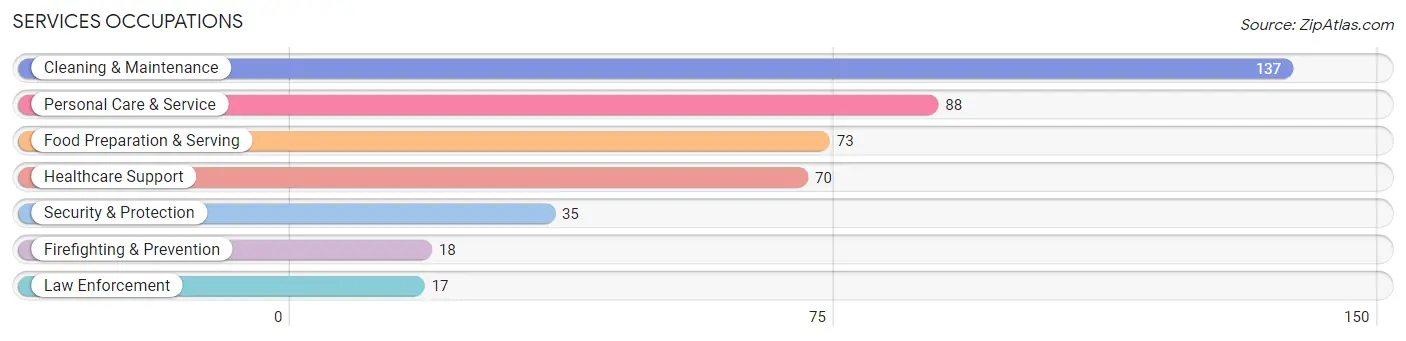
Services Occupations
The most common Services occupations in Great Neck Plaza are Cleaning & Maintenance (137 | 3.8%), Personal Care & Service (88 | 2.4%), Food Preparation & Serving (73 | 2.0%), Healthcare Support (70 | 1.9%), and Security & Protection (35 | 1.0%).
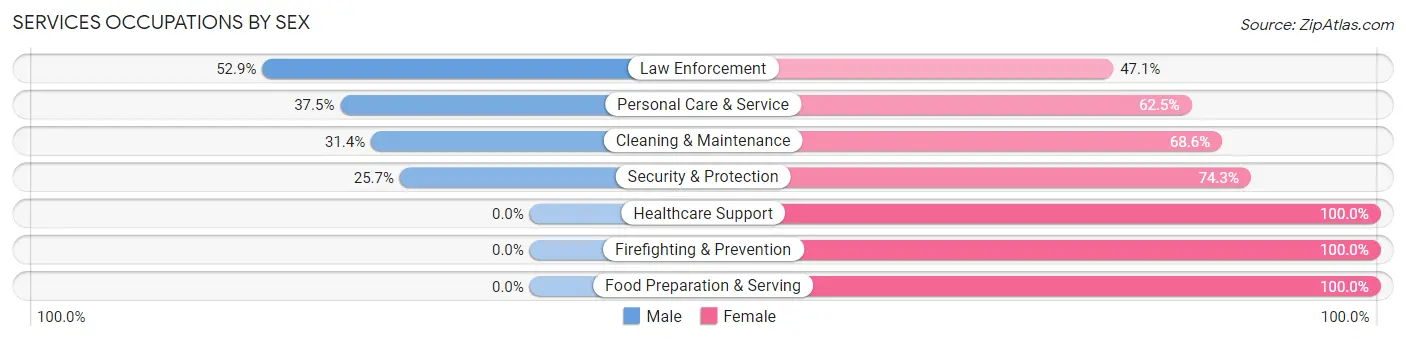
Services Occupations by Sex
Within the Services occupations in Great Neck Plaza, the most male-oriented occupations are Law Enforcement (52.9%), Personal Care & Service (37.5%), and Cleaning & Maintenance (31.4%), while the most female-oriented occupations are Healthcare Support (100.0%), Firefighting & Prevention (100.0%), and Food Preparation & Serving (100.0%).
| Occupation | Male | Female |
| Healthcare Support | 0 (0.0%) | 70 (100.0%) |
| Security & Protection | 9 (25.7%) | 26 (74.3%) |
| Firefighting & Prevention | 0 (0.0%) | 18 (100.0%) |
| Law Enforcement | 9 (52.9%) | 8 (47.1%) |
| Food Preparation & Serving | 0 (0.0%) | 73 (100.0%) |
| Cleaning & Maintenance | 43 (31.4%) | 94 (68.6%) |
| Personal Care & Service | 33 (37.5%) | 55 (62.5%) |
| Total (Category) | 85 (21.1%) | 318 (78.9%) |
| Total (Overall) | 1,646 (45.7%) | 1,954 (54.3%) |
Sales and Office Occupations
The most common Sales and Office occupations in Great Neck Plaza are Sales & Related (418 | 11.6%), and Office & Administration (335 | 9.3%).

Sales and Office Occupations by Sex

| Occupation | Male | Female |
| Sales & Related | 204 (48.8%) | 214 (51.2%) |
| Office & Administration | 107 (31.9%) | 228 (68.1%) |
| Total (Category) | 311 (41.3%) | 442 (58.7%) |
| Total (Overall) | 1,646 (45.7%) | 1,954 (54.3%) |
Natural Resources, Construction and Maintenance Occupations
The most common Natural Resources, Construction and Maintenance occupations in Great Neck Plaza are Installation, Maintenance & Repair (27 | 0.7%), and Construction & Extraction (19 | 0.5%).
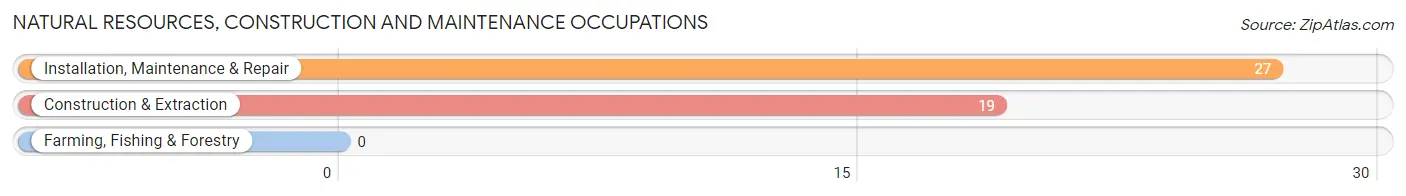
Natural Resources, Construction and Maintenance Occupations by Sex

| Occupation | Male | Female |
| Farming, Fishing & Forestry | 0 (0.0%) | 0 (0.0%) |
| Construction & Extraction | 19 (100.0%) | 0 (0.0%) |
| Installation, Maintenance & Repair | 27 (100.0%) | 0 (0.0%) |
| Total (Category) | 46 (100.0%) | 0 (0.0%) |
| Total (Overall) | 1,646 (45.7%) | 1,954 (54.3%) |
Production, Transportation and Moving Occupations
The most common Production, Transportation and Moving occupations in Great Neck Plaza are Transportation (73 | 2.0%), Production (25 | 0.7%), and Material Moving (16 | 0.4%).
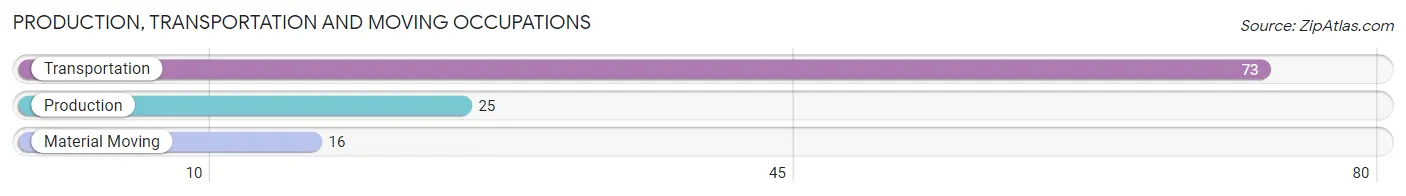
Production, Transportation and Moving Occupations by Sex
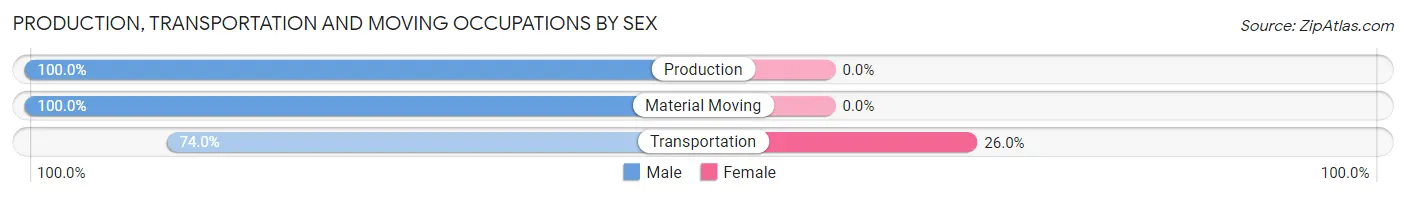
| Occupation | Male | Female |
| Production | 25 (100.0%) | 0 (0.0%) |
| Transportation | 54 (74.0%) | 19 (26.0%) |
| Material Moving | 16 (100.0%) | 0 (0.0%) |
| Total (Category) | 95 (83.3%) | 19 (16.7%) |
| Total (Overall) | 1,646 (45.7%) | 1,954 (54.3%) |
Employment Industries by Sex in Great Neck Plaza
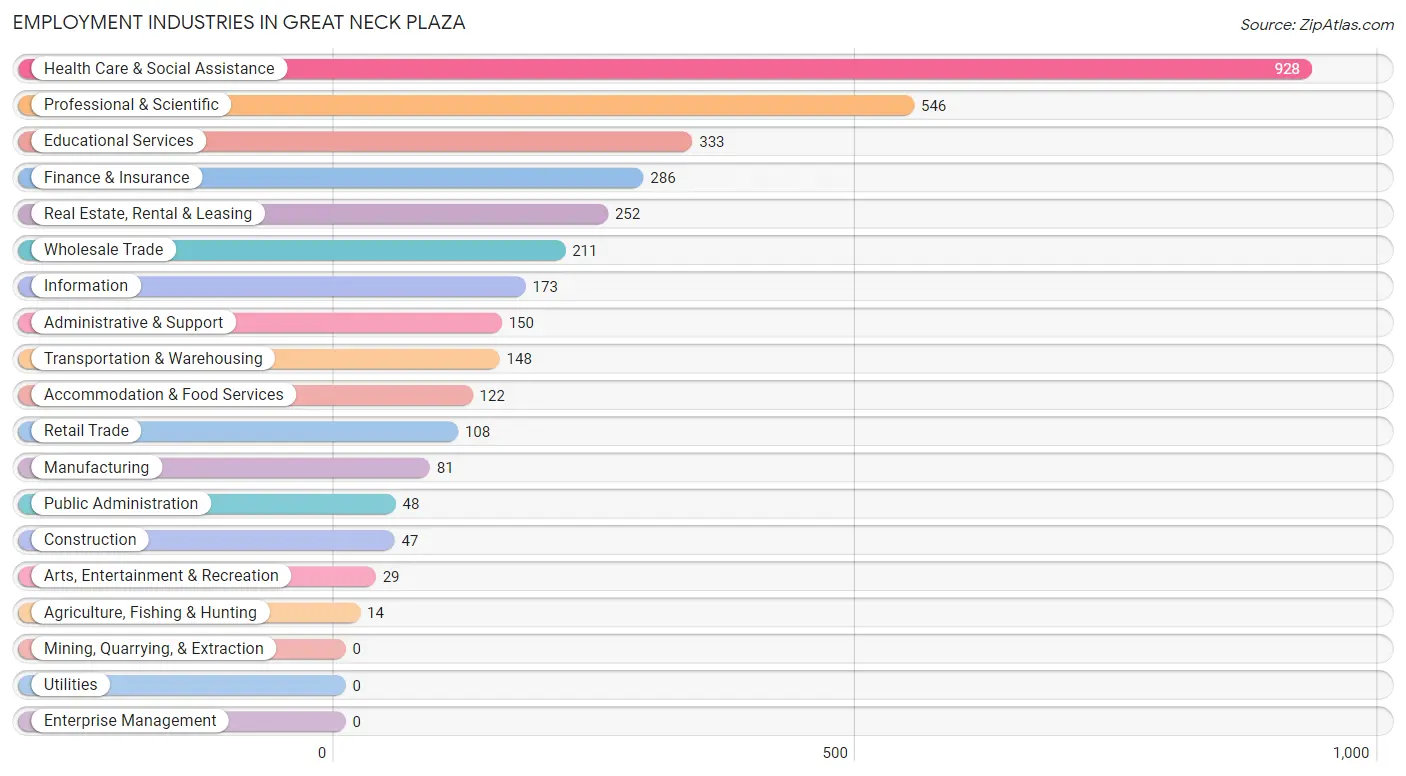
Employment Industries in Great Neck Plaza
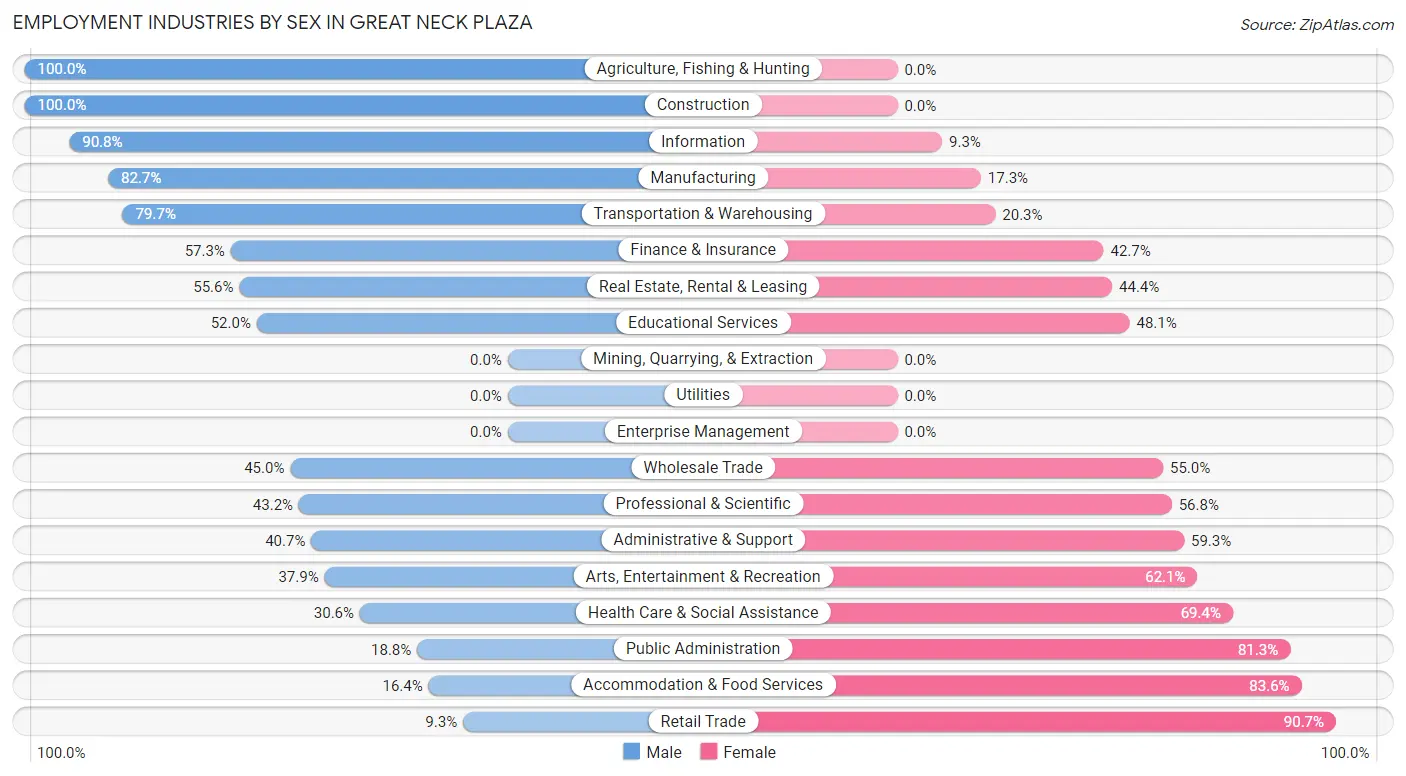
The major employment industries in Great Neck Plaza include Health Care & Social Assistance (928 | 25.8%), Professional & Scientific (546 | 15.2%), Educational Services (333 | 9.2%), Finance & Insurance (286 | 7.9%), and Real Estate, Rental & Leasing (252 | 7.0%).
Employment Industries by Sex in Great Neck Plaza
The Great Neck Plaza industries that see more men than women are Agriculture, Fishing & Hunting (100.0%), Construction (100.0%), and Information (90.7%), whereas the industries that tend to have a higher number of women are Retail Trade (90.7%), Accommodation & Food Services (83.6%), and Public Administration (81.2%).
| Industry | Male | Female |
| Agriculture, Fishing & Hunting | 14 (100.0%) | 0 (0.0%) |
| Mining, Quarrying, & Extraction | 0 (0.0%) | 0 (0.0%) |
| Construction | 47 (100.0%) | 0 (0.0%) |
| Manufacturing | 67 (82.7%) | 14 (17.3%) |
| Wholesale Trade | 95 (45.0%) | 116 (55.0%) |
| Retail Trade | 10 (9.3%) | 98 (90.7%) |
| Transportation & Warehousing | 118 (79.7%) | 30 (20.3%) |
| Utilities | 0 (0.0%) | 0 (0.0%) |
| Information | 157 (90.7%) | 16 (9.2%) |
| Finance & Insurance | 164 (57.3%) | 122 (42.7%) |
| Real Estate, Rental & Leasing | 140 (55.6%) | 112 (44.4%) |
| Professional & Scientific | 236 (43.2%) | 310 (56.8%) |
| Enterprise Management | 0 (0.0%) | 0 (0.0%) |
| Administrative & Support | 61 (40.7%) | 89 (59.3%) |
| Educational Services | 173 (51.9%) | 160 (48.0%) |
| Health Care & Social Assistance | 284 (30.6%) | 644 (69.4%) |
| Arts, Entertainment & Recreation | 11 (37.9%) | 18 (62.1%) |
| Accommodation & Food Services | 20 (16.4%) | 102 (83.6%) |
| Public Administration | 9 (18.8%) | 39 (81.2%) |
| Total | 1,646 (45.7%) | 1,954 (54.3%) |
Education in Great Neck Plaza
School Enrollment in Great Neck Plaza
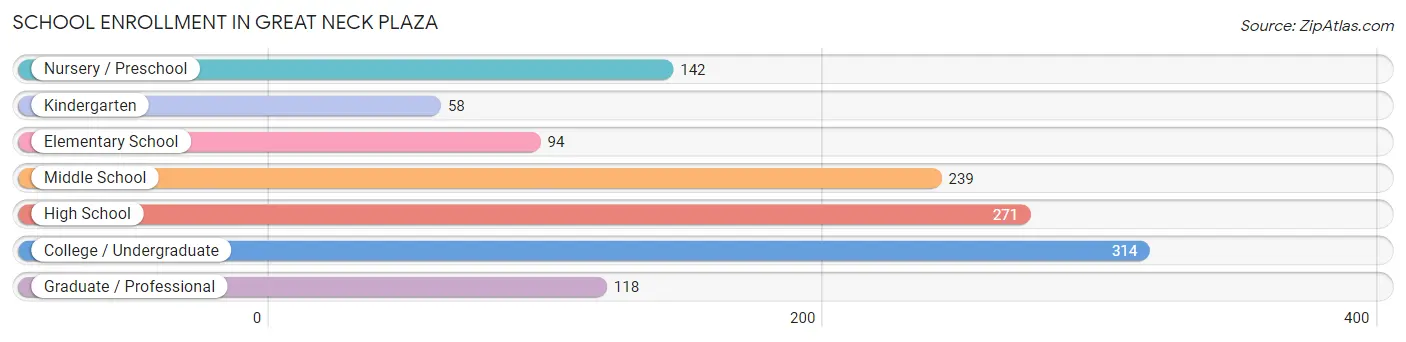
The most common levels of schooling among the 1,236 students in Great Neck Plaza are college / undergraduate (314 | 25.4%), high school (271 | 21.9%), and middle school (239 | 19.3%).
| School Level | # Students | % Students |
| Nursery / Preschool | 142 | 11.5% |
| Kindergarten | 58 | 4.7% |
| Elementary School | 94 | 7.6% |
| Middle School | 239 | 19.3% |
| High School | 271 | 21.9% |
| College / Undergraduate | 314 | 25.4% |
| Graduate / Professional | 118 | 9.6% |
| Total | 1,236 | 100.0% |
School Enrollment by Age by Funding Source in Great Neck Plaza
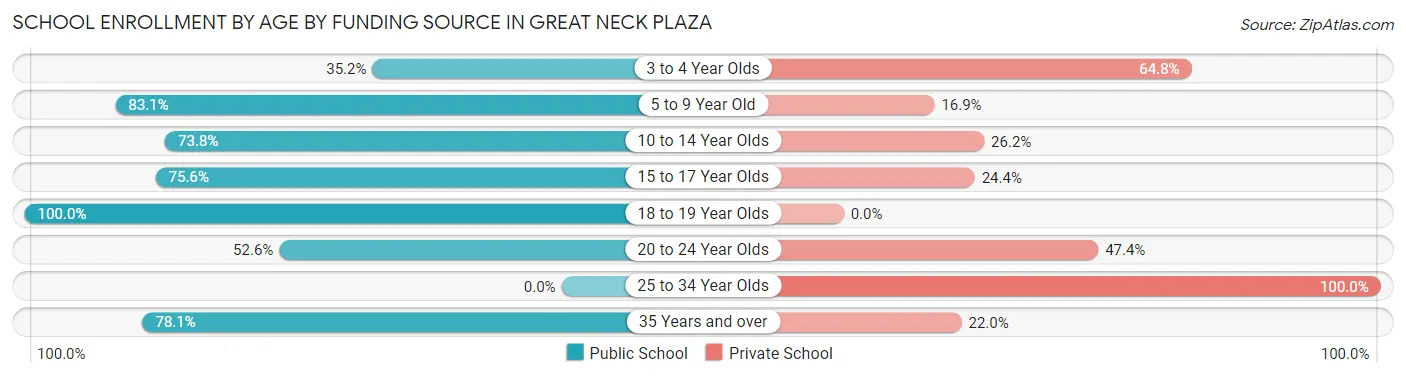
Out of a total of 1,236 students who are enrolled in schools in Great Neck Plaza, 368 (29.8%) attend a private institution, while the remaining 868 (70.2%) are enrolled in public schools. The age group of 25 to 34 year olds has the highest likelihood of being enrolled in private schools, with 73 (100.0% in the age bracket) enrolled. Conversely, the age group of 18 to 19 year olds has the lowest likelihood of being enrolled in a private school, with 184 (100.0% in the age bracket) attending a public institution.
| Age Bracket | Public School | Private School |
| 3 to 4 Year Olds | 37 (35.2%) | 68 (64.8%) |
| 5 to 9 Year Old | 172 (83.1%) | 35 (16.9%) |
| 10 to 14 Year Olds | 189 (73.8%) | 67 (26.2%) |
| 15 to 17 Year Olds | 161 (75.6%) | 52 (24.4%) |
| 18 to 19 Year Olds | 184 (100.0%) | 0 (0.0%) |
| 20 to 24 Year Olds | 61 (52.6%) | 55 (47.4%) |
| 25 to 34 Year Olds | 0 (0.0%) | 73 (100.0%) |
| 35 Years and over | 64 (78.0%) | 18 (22.0%) |
| Total | 868 (70.2%) | 368 (29.8%) |
Educational Attainment by Field of Study in Great Neck Plaza
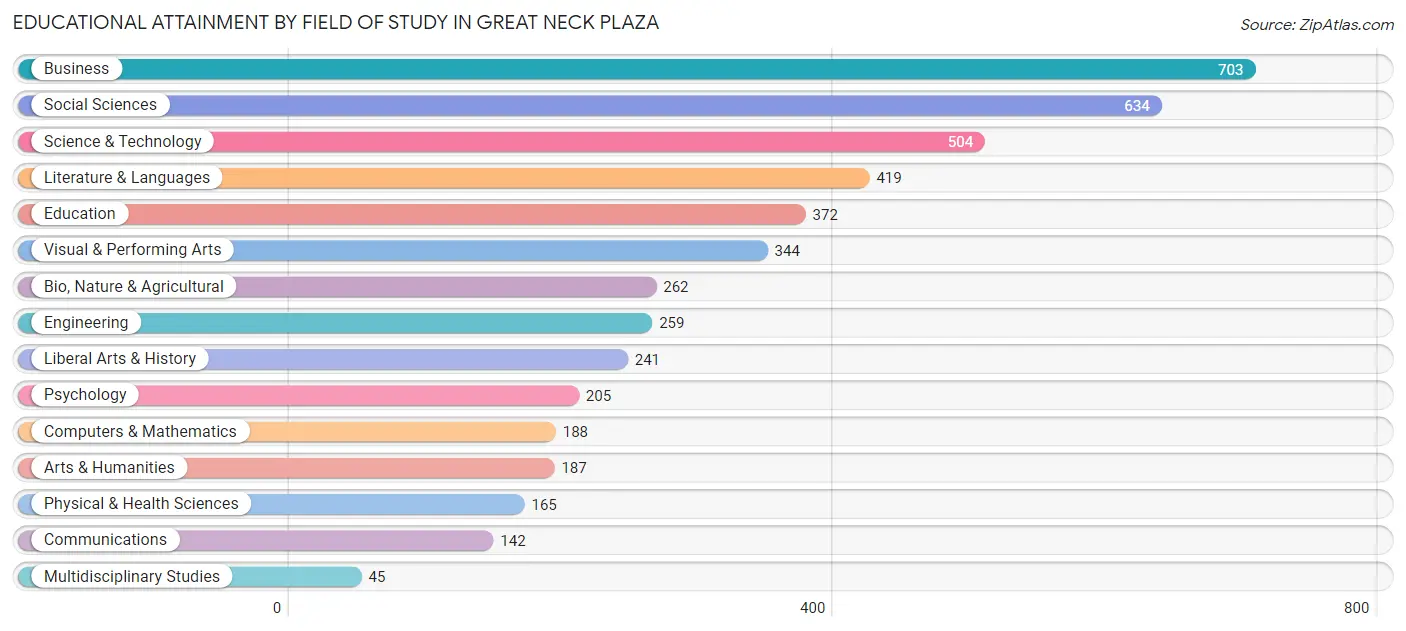
Business (703 | 15.0%), social sciences (634 | 13.6%), science & technology (504 | 10.8%), literature & languages (419 | 9.0%), and education (372 | 8.0%) are the most common fields of study among 4,670 individuals in Great Neck Plaza who have obtained a bachelor's degree or higher.
| Field of Study | # Graduates | % Graduates |
| Computers & Mathematics | 188 | 4.0% |
| Bio, Nature & Agricultural | 262 | 5.6% |
| Physical & Health Sciences | 165 | 3.5% |
| Psychology | 205 | 4.4% |
| Social Sciences | 634 | 13.6% |
| Engineering | 259 | 5.6% |
| Multidisciplinary Studies | 45 | 1.0% |
| Science & Technology | 504 | 10.8% |
| Business | 703 | 15.0% |
| Education | 372 | 8.0% |
| Literature & Languages | 419 | 9.0% |
| Liberal Arts & History | 241 | 5.2% |
| Visual & Performing Arts | 344 | 7.4% |
| Communications | 142 | 3.0% |
| Arts & Humanities | 187 | 4.0% |
| Total | 4,670 | 100.0% |
Transportation & Commute in Great Neck Plaza
Vehicle Availability by Sex in Great Neck Plaza
The most prevalent vehicle ownership categories in Great Neck Plaza are males with 1 vehicle (764, accounting for 47.0%) and females with 1 vehicle (928, making up 40.6%).
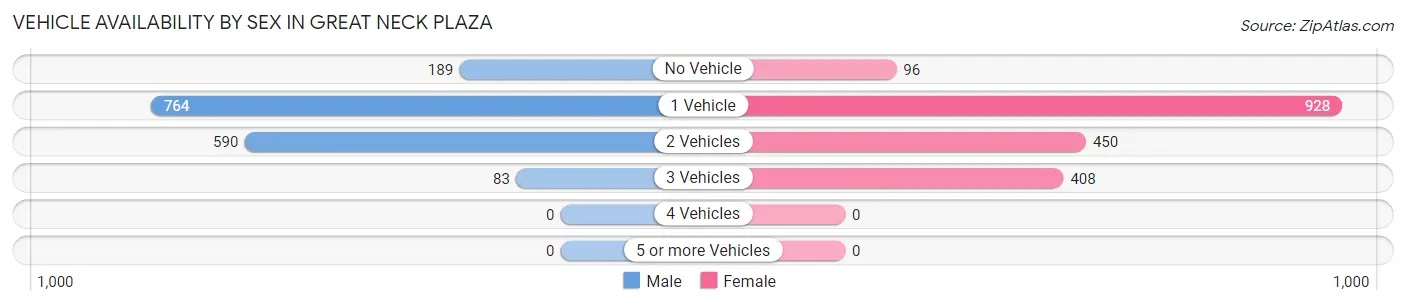
| Vehicles Available | Male | Female |
| No Vehicle | 189 (11.6%) | 96 (5.1%) |
| 1 Vehicle | 764 (47.0%) | 928 (49.3%) |
| 2 Vehicles | 590 (36.3%) | 450 (23.9%) |
| 3 Vehicles | 83 (5.1%) | 408 (21.7%) |
| 4 Vehicles | 0 (0.0%) | 0 (0.0%) |
| 5 or more Vehicles | 0 (0.0%) | 0 (0.0%) |
| Total | 1,626 (100.0%) | 1,882 (100.0%) |
Commute Time in Great Neck Plaza
The most frequently occuring commute durations in Great Neck Plaza are 60 to 89 minutes (600 commuters, 22.6%), 45 to 59 minutes (586 commuters, 22.1%), and 15 to 19 minutes (278 commuters, 10.5%).
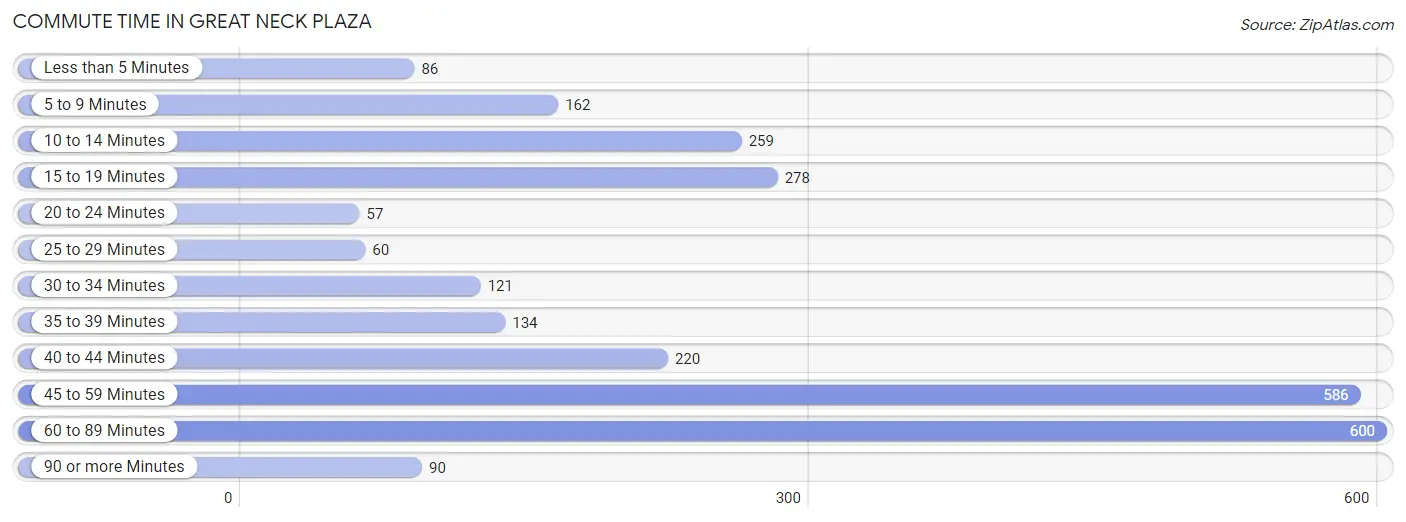
| Commute Time | # Commuters | % Commuters |
| Less than 5 Minutes | 86 | 3.2% |
| 5 to 9 Minutes | 162 | 6.1% |
| 10 to 14 Minutes | 259 | 9.8% |
| 15 to 19 Minutes | 278 | 10.5% |
| 20 to 24 Minutes | 57 | 2.1% |
| 25 to 29 Minutes | 60 | 2.3% |
| 30 to 34 Minutes | 121 | 4.6% |
| 35 to 39 Minutes | 134 | 5.1% |
| 40 to 44 Minutes | 220 | 8.3% |
| 45 to 59 Minutes | 586 | 22.1% |
| 60 to 89 Minutes | 600 | 22.6% |
| 90 or more Minutes | 90 | 3.4% |
Commute Time by Sex in Great Neck Plaza
The most common commute times in Great Neck Plaza are 45 to 59 minutes (450 commuters, 32.3%) for males and 60 to 89 minutes (383 commuters, 30.4%) for females.
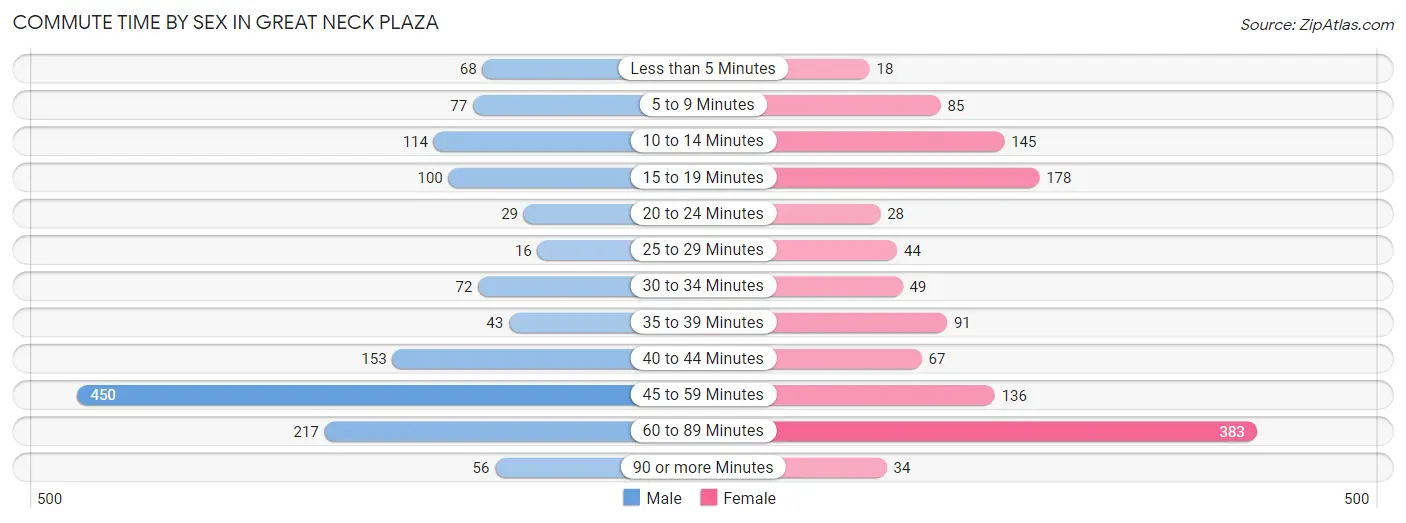
| Commute Time | Male | Female |
| Less than 5 Minutes | 68 (4.9%) | 18 (1.4%) |
| 5 to 9 Minutes | 77 (5.5%) | 85 (6.8%) |
| 10 to 14 Minutes | 114 (8.2%) | 145 (11.5%) |
| 15 to 19 Minutes | 100 (7.2%) | 178 (14.1%) |
| 20 to 24 Minutes | 29 (2.1%) | 28 (2.2%) |
| 25 to 29 Minutes | 16 (1.1%) | 44 (3.5%) |
| 30 to 34 Minutes | 72 (5.2%) | 49 (3.9%) |
| 35 to 39 Minutes | 43 (3.1%) | 91 (7.2%) |
| 40 to 44 Minutes | 153 (11.0%) | 67 (5.3%) |
| 45 to 59 Minutes | 450 (32.3%) | 136 (10.8%) |
| 60 to 89 Minutes | 217 (15.6%) | 383 (30.4%) |
| 90 or more Minutes | 56 (4.0%) | 34 (2.7%) |
Time of Departure to Work by Sex in Great Neck Plaza
The most frequent times of departure to work in Great Neck Plaza are 7:00 AM to 7:29 AM (221, 15.8%) for males and 9:00 AM to 9:59 AM (298, 23.7%) for females.
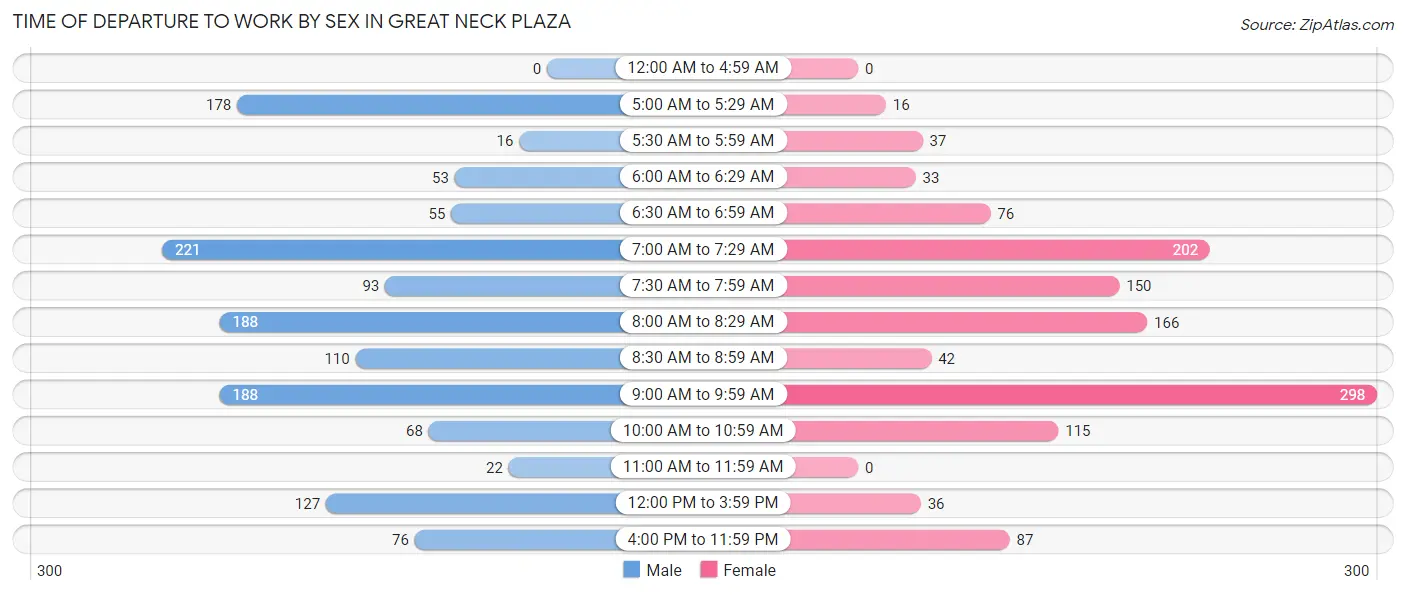
| Time of Departure | Male | Female |
| 12:00 AM to 4:59 AM | 0 (0.0%) | 0 (0.0%) |
| 5:00 AM to 5:29 AM | 178 (12.8%) | 16 (1.3%) |
| 5:30 AM to 5:59 AM | 16 (1.1%) | 37 (2.9%) |
| 6:00 AM to 6:29 AM | 53 (3.8%) | 33 (2.6%) |
| 6:30 AM to 6:59 AM | 55 (3.9%) | 76 (6.0%) |
| 7:00 AM to 7:29 AM | 221 (15.8%) | 202 (16.1%) |
| 7:30 AM to 7:59 AM | 93 (6.7%) | 150 (11.9%) |
| 8:00 AM to 8:29 AM | 188 (13.5%) | 166 (13.2%) |
| 8:30 AM to 8:59 AM | 110 (7.9%) | 42 (3.3%) |
| 9:00 AM to 9:59 AM | 188 (13.5%) | 298 (23.7%) |
| 10:00 AM to 10:59 AM | 68 (4.9%) | 115 (9.1%) |
| 11:00 AM to 11:59 AM | 22 (1.6%) | 0 (0.0%) |
| 12:00 PM to 3:59 PM | 127 (9.1%) | 36 (2.9%) |
| 4:00 PM to 11:59 PM | 76 (5.4%) | 87 (6.9%) |
| Total | 1,395 (100.0%) | 1,258 (100.0%) |
Housing Occupancy in Great Neck Plaza
Occupancy by Ownership in Great Neck Plaza
Of the total 3,878 dwellings in Great Neck Plaza, owner-occupied units account for 2,273 (58.6%), while renter-occupied units make up 1,605 (41.4%).
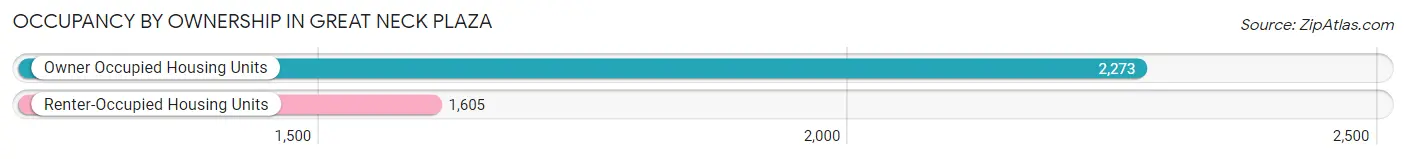
| Occupancy | # Housing Units | % Housing Units |
| Owner Occupied Housing Units | 2,273 | 58.6% |
| Renter-Occupied Housing Units | 1,605 | 41.4% |
| Total Occupied Housing Units | 3,878 | 100.0% |
Occupancy by Household Size in Great Neck Plaza
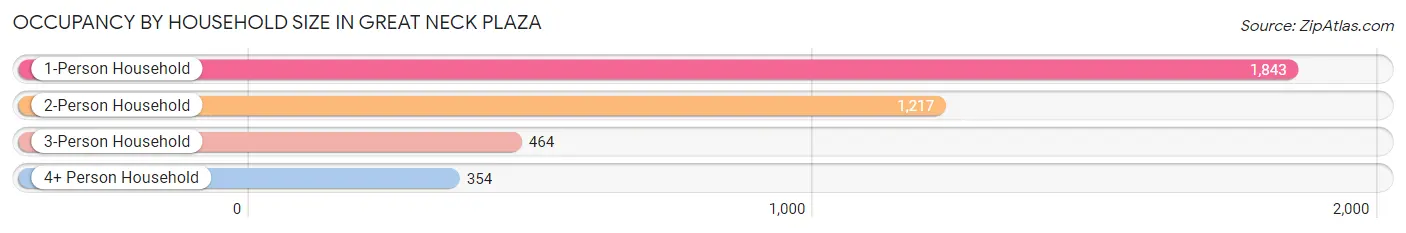
| Household Size | # Housing Units | % Housing Units |
| 1-Person Household | 1,843 | 47.5% |
| 2-Person Household | 1,217 | 31.4% |
| 3-Person Household | 464 | 12.0% |
| 4+ Person Household | 354 | 9.1% |
| Total Housing Units | 3,878 | 100.0% |
Occupancy by Ownership by Household Size in Great Neck Plaza
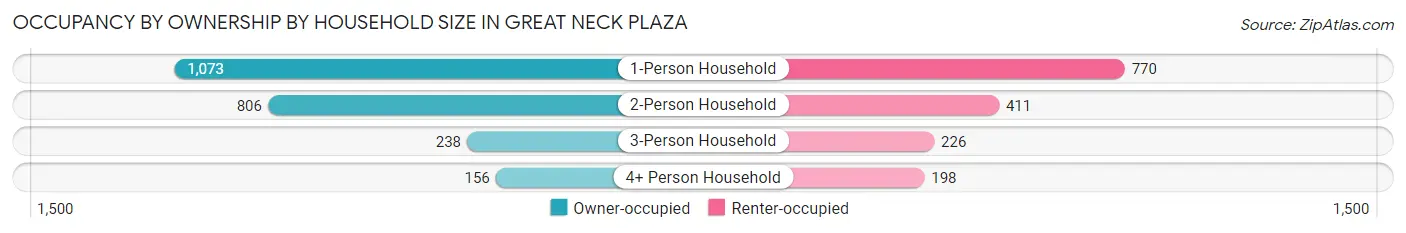
| Household Size | Owner-occupied | Renter-occupied |
| 1-Person Household | 1,073 (58.2%) | 770 (41.8%) |
| 2-Person Household | 806 (66.2%) | 411 (33.8%) |
| 3-Person Household | 238 (51.3%) | 226 (48.7%) |
| 4+ Person Household | 156 (44.1%) | 198 (55.9%) |
| Total Housing Units | 2,273 (58.6%) | 1,605 (41.4%) |
Occupancy by Educational Attainment in Great Neck Plaza
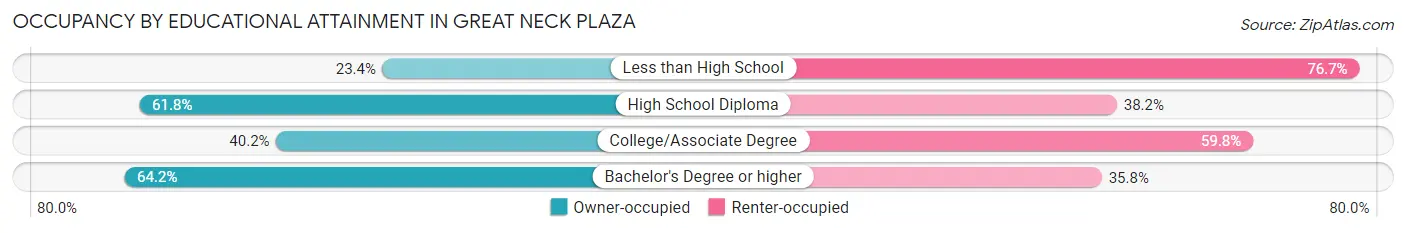
| Household Size | Owner-occupied | Renter-occupied |
| Less than High School | 46 (23.4%) | 151 (76.6%) |
| High School Diploma | 209 (61.8%) | 129 (38.2%) |
| College/Associate Degree | 216 (40.2%) | 321 (59.8%) |
| Bachelor's Degree or higher | 1,802 (64.2%) | 1,004 (35.8%) |
Occupancy by Age of Householder in Great Neck Plaza
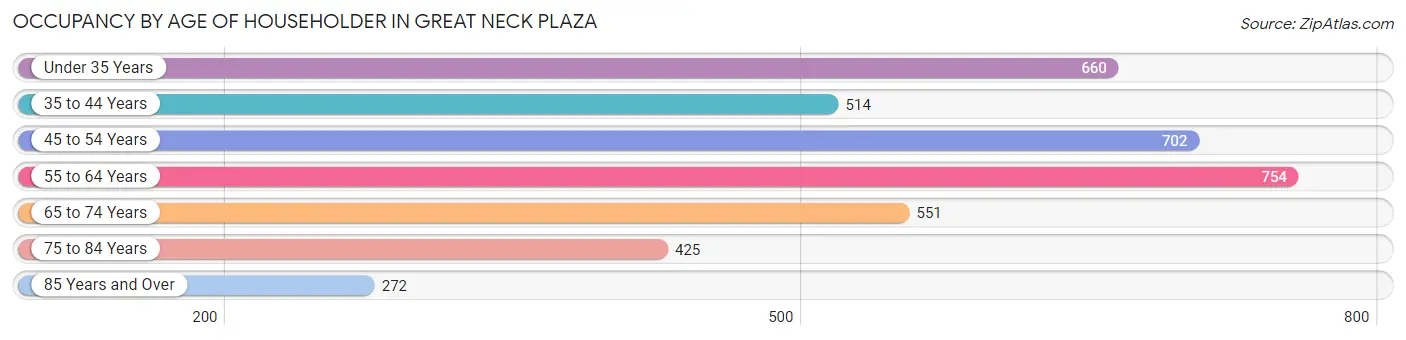
| Age Bracket | # Households | % Households |
| Under 35 Years | 660 | 17.0% |
| 35 to 44 Years | 514 | 13.3% |
| 45 to 54 Years | 702 | 18.1% |
| 55 to 64 Years | 754 | 19.4% |
| 65 to 74 Years | 551 | 14.2% |
| 75 to 84 Years | 425 | 11.0% |
| 85 Years and Over | 272 | 7.0% |
| Total | 3,878 | 100.0% |
Housing Finances in Great Neck Plaza
Median Income by Occupancy in Great Neck Plaza
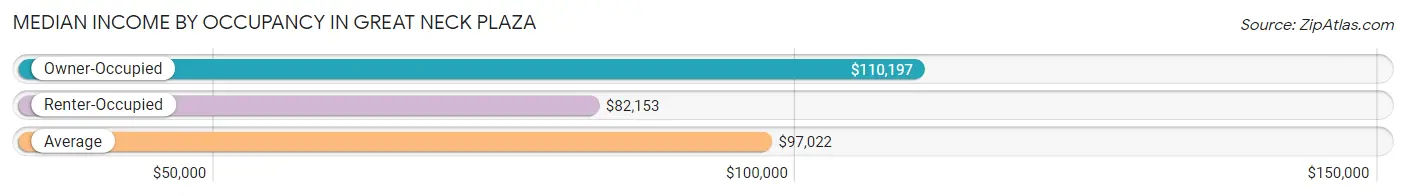
| Occupancy Type | # Households | Median Income |
| Owner-Occupied | 2,273 (58.6%) | $110,197 |
| Renter-Occupied | 1,605 (41.4%) | $82,153 |
| Average | 3,878 (100.0%) | $97,022 |
Occupancy by Householder Income Bracket in Great Neck Plaza
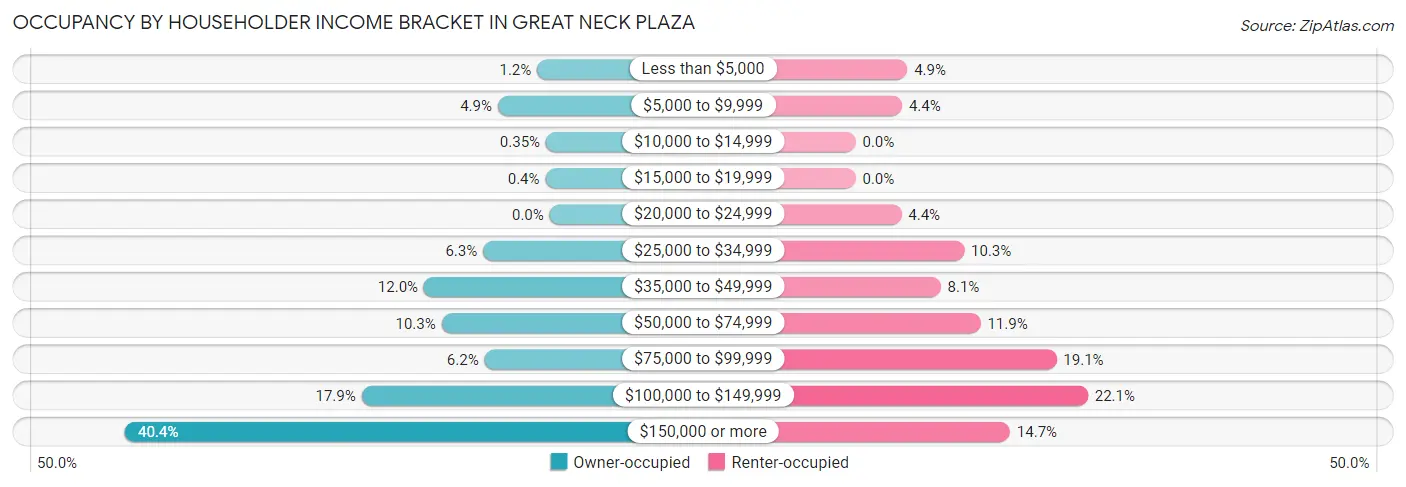
| Income Bracket | Owner-occupied | Renter-occupied |
| Less than $5,000 | 27 (1.2%) | 79 (4.9%) |
| $5,000 to $9,999 | 112 (4.9%) | 71 (4.4%) |
| $10,000 to $14,999 | 8 (0.4%) | 0 (0.0%) |
| $15,000 to $19,999 | 9 (0.4%) | 0 (0.0%) |
| $20,000 to $24,999 | 0 (0.0%) | 70 (4.4%) |
| $25,000 to $34,999 | 144 (6.3%) | 166 (10.3%) |
| $35,000 to $49,999 | 272 (12.0%) | 130 (8.1%) |
| $50,000 to $74,999 | 234 (10.3%) | 191 (11.9%) |
| $75,000 to $99,999 | 141 (6.2%) | 307 (19.1%) |
| $100,000 to $149,999 | 407 (17.9%) | 355 (22.1%) |
| $150,000 or more | 919 (40.4%) | 236 (14.7%) |
| Total | 2,273 (100.0%) | 1,605 (100.0%) |
Monthly Housing Cost Tiers in Great Neck Plaza
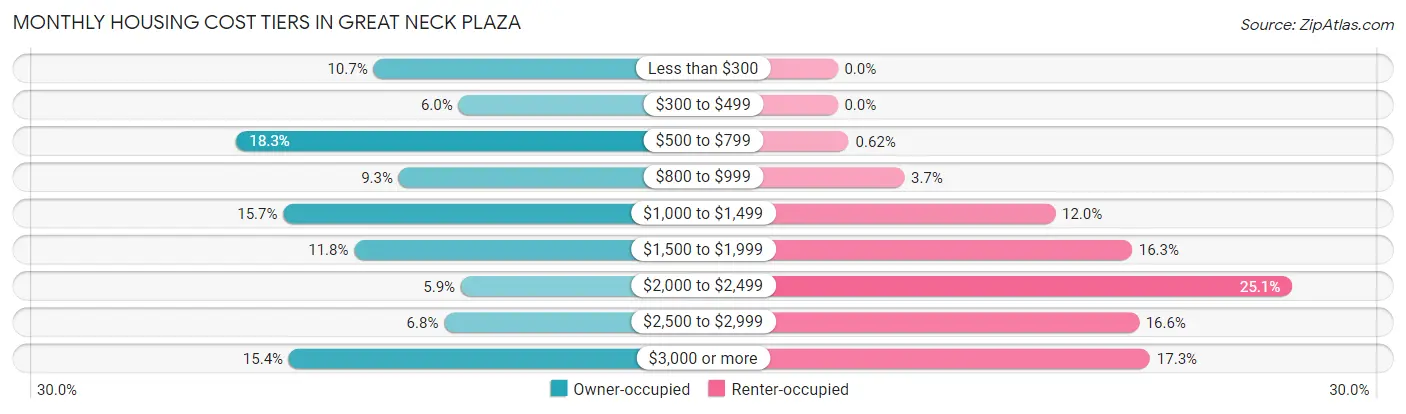
| Monthly Cost | Owner-occupied | Renter-occupied |
| Less than $300 | 244 (10.7%) | 0 (0.0%) |
| $300 to $499 | 137 (6.0%) | 0 (0.0%) |
| $500 to $799 | 416 (18.3%) | 10 (0.6%) |
| $800 to $999 | 212 (9.3%) | 59 (3.7%) |
| $1,000 to $1,499 | 357 (15.7%) | 193 (12.0%) |
| $1,500 to $1,999 | 268 (11.8%) | 261 (16.3%) |
| $2,000 to $2,499 | 134 (5.9%) | 403 (25.1%) |
| $2,500 to $2,999 | 155 (6.8%) | 267 (16.6%) |
| $3,000 or more | 350 (15.4%) | 277 (17.3%) |
| Total | 2,273 (100.0%) | 1,605 (100.0%) |
Physical Housing Characteristics in Great Neck Plaza
Housing Structures in Great Neck Plaza
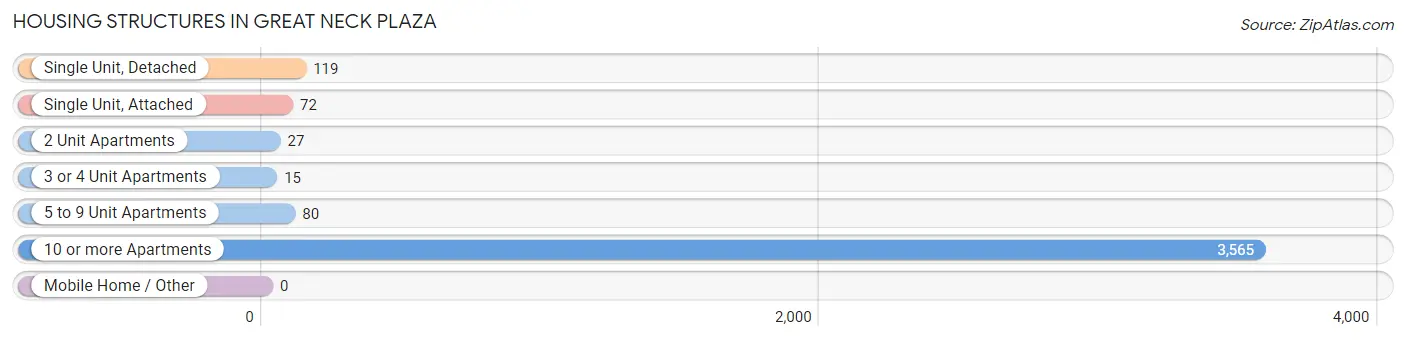
| Structure Type | # Housing Units | % Housing Units |
| Single Unit, Detached | 119 | 3.1% |
| Single Unit, Attached | 72 | 1.9% |
| 2 Unit Apartments | 27 | 0.7% |
| 3 or 4 Unit Apartments | 15 | 0.4% |
| 5 to 9 Unit Apartments | 80 | 2.1% |
| 10 or more Apartments | 3,565 | 91.9% |
| Mobile Home / Other | 0 | 0.0% |
| Total | 3,878 | 100.0% |
Housing Structures by Occupancy in Great Neck Plaza
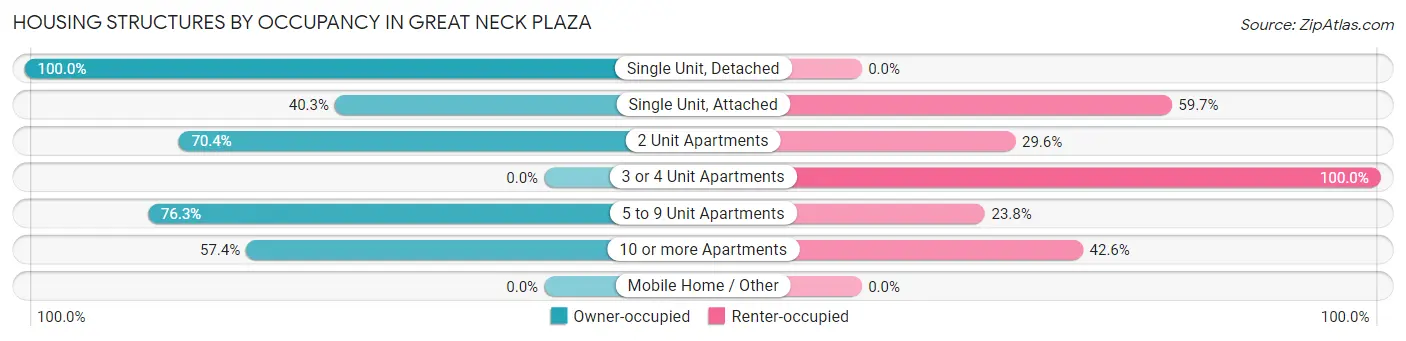
| Structure Type | Owner-occupied | Renter-occupied |
| Single Unit, Detached | 119 (100.0%) | 0 (0.0%) |
| Single Unit, Attached | 29 (40.3%) | 43 (59.7%) |
| 2 Unit Apartments | 19 (70.4%) | 8 (29.6%) |
| 3 or 4 Unit Apartments | 0 (0.0%) | 15 (100.0%) |
| 5 to 9 Unit Apartments | 61 (76.2%) | 19 (23.7%) |
| 10 or more Apartments | 2,045 (57.4%) | 1,520 (42.6%) |
| Mobile Home / Other | 0 (0.0%) | 0 (0.0%) |
| Total | 2,273 (58.6%) | 1,605 (41.4%) |
Housing Structures by Number of Rooms in Great Neck Plaza
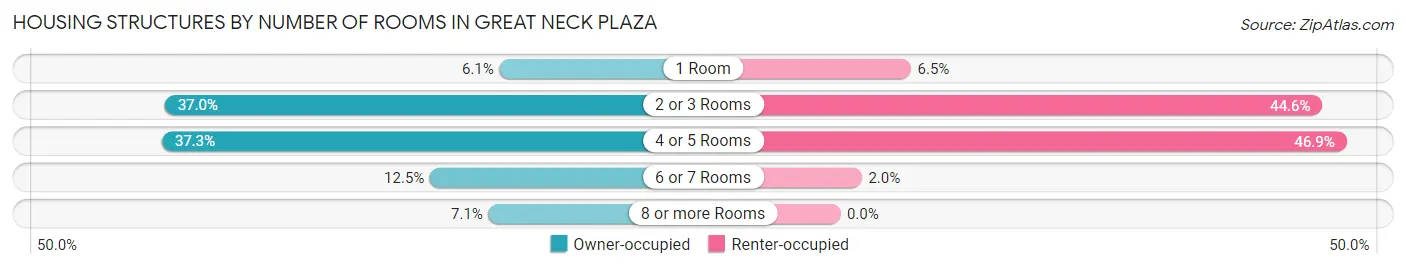
| Number of Rooms | Owner-occupied | Renter-occupied |
| 1 Room | 138 (6.1%) | 105 (6.5%) |
| 2 or 3 Rooms | 842 (37.0%) | 716 (44.6%) |
| 4 or 5 Rooms | 848 (37.3%) | 752 (46.9%) |
| 6 or 7 Rooms | 284 (12.5%) | 32 (2.0%) |
| 8 or more Rooms | 161 (7.1%) | 0 (0.0%) |
| Total | 2,273 (100.0%) | 1,605 (100.0%) |
Housing Structure by Heating Type in Great Neck Plaza
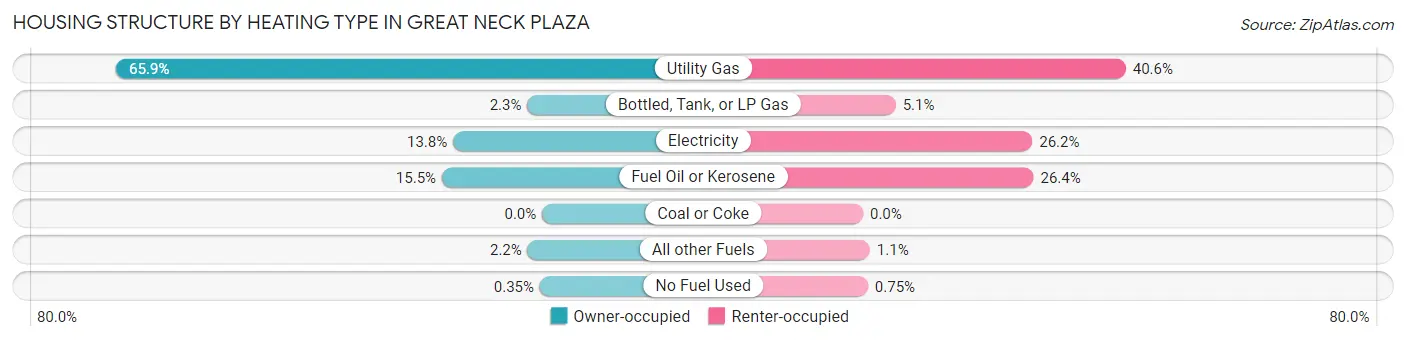
| Heating Type | Owner-occupied | Renter-occupied |
| Utility Gas | 1,497 (65.9%) | 652 (40.6%) |
| Bottled, Tank, or LP Gas | 52 (2.3%) | 81 (5.1%) |
| Electricity | 313 (13.8%) | 420 (26.2%) |
| Fuel Oil or Kerosene | 352 (15.5%) | 423 (26.4%) |
| Coal or Coke | 0 (0.0%) | 0 (0.0%) |
| All other Fuels | 51 (2.2%) | 17 (1.1%) |
| No Fuel Used | 8 (0.4%) | 12 (0.7%) |
| Total | 2,273 (100.0%) | 1,605 (100.0%) |
Household Vehicle Usage in Great Neck Plaza
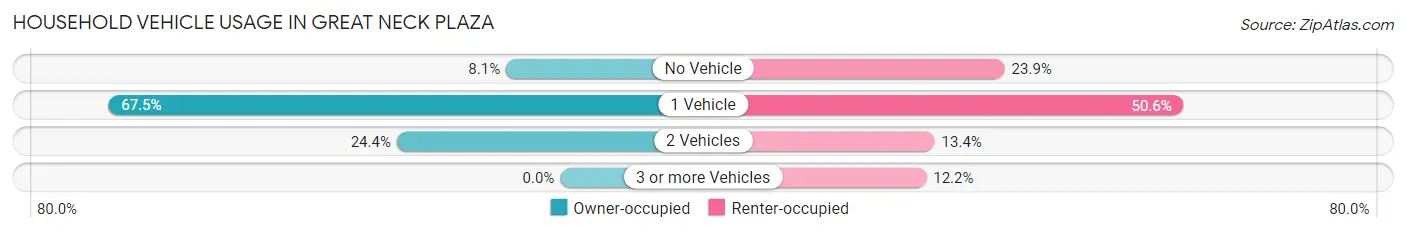
| Vehicles per Household | Owner-occupied | Renter-occupied |
| No Vehicle | 184 (8.1%) | 383 (23.9%) |
| 1 Vehicle | 1,534 (67.5%) | 812 (50.6%) |
| 2 Vehicles | 555 (24.4%) | 215 (13.4%) |
| 3 or more Vehicles | 0 (0.0%) | 195 (12.1%) |
| Total | 2,273 (100.0%) | 1,605 (100.0%) |
Real Estate & Mortgages in Great Neck Plaza
Real Estate and Mortgage Overview in Great Neck Plaza
| Characteristic | Without Mortgage | With Mortgage |
| Housing Units | 1,241 | 1,032 |
| Median Property Value | $401,400 | $367,700 |
| Median Household Income | $105,236 | $533 |
| Monthly Housing Costs | $728 | $264 |
| Real Estate Taxes | $6,915 | $232 |
Property Value by Mortgage Status in Great Neck Plaza
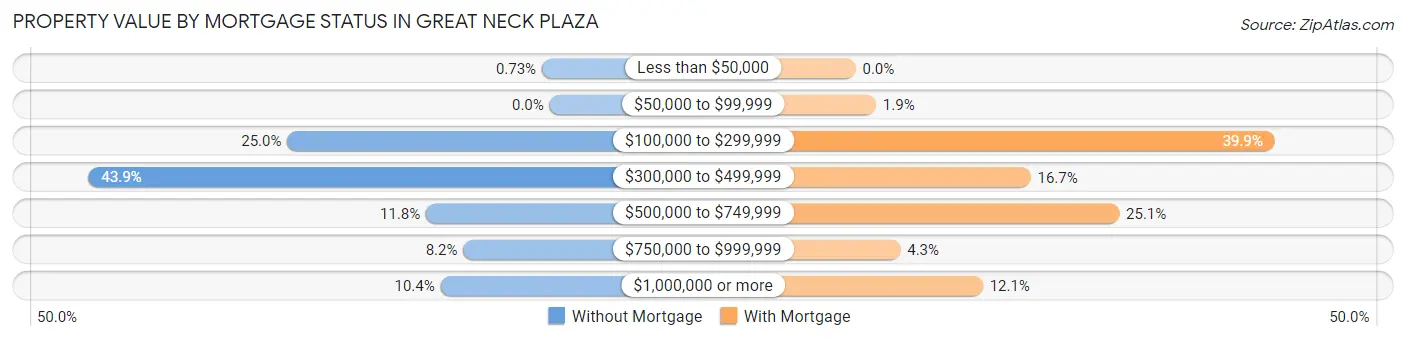
| Property Value | Without Mortgage | With Mortgage |
| Less than $50,000 | 9 (0.7%) | 0 (0.0%) |
| $50,000 to $99,999 | 0 (0.0%) | 20 (1.9%) |
| $100,000 to $299,999 | 310 (25.0%) | 412 (39.9%) |
| $300,000 to $499,999 | 545 (43.9%) | 172 (16.7%) |
| $500,000 to $749,999 | 146 (11.8%) | 259 (25.1%) |
| $750,000 to $999,999 | 102 (8.2%) | 44 (4.3%) |
| $1,000,000 or more | 129 (10.4%) | 125 (12.1%) |
| Total | 1,241 (100.0%) | 1,032 (100.0%) |
Household Income by Mortgage Status in Great Neck Plaza
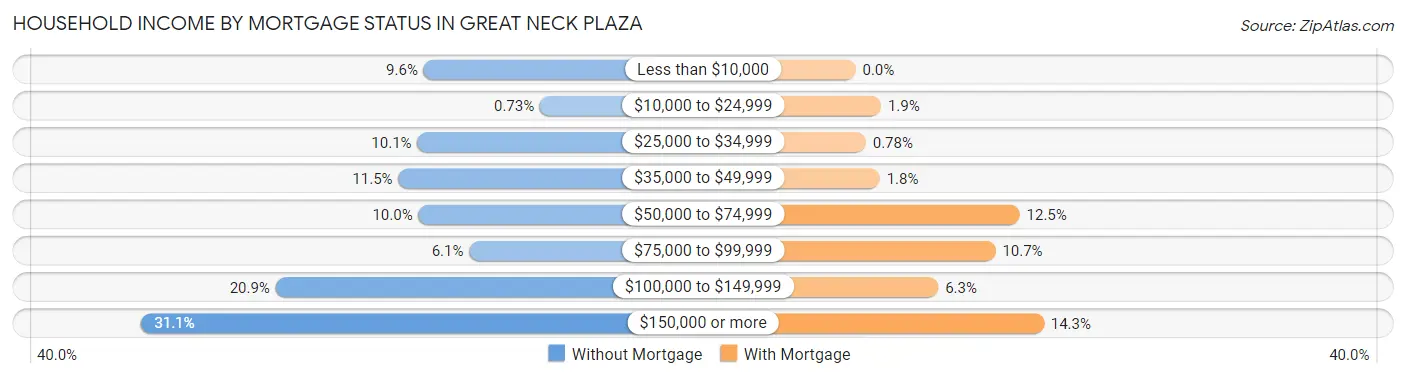
| Household Income | Without Mortgage | With Mortgage |
| Less than $10,000 | 119 (9.6%) | 0 (0.0%) |
| $10,000 to $24,999 | 9 (0.7%) | 20 (1.9%) |
| $25,000 to $34,999 | 125 (10.1%) | 8 (0.8%) |
| $35,000 to $49,999 | 143 (11.5%) | 19 (1.8%) |
| $50,000 to $74,999 | 124 (10.0%) | 129 (12.5%) |
| $75,000 to $99,999 | 76 (6.1%) | 110 (10.7%) |
| $100,000 to $149,999 | 259 (20.9%) | 65 (6.3%) |
| $150,000 or more | 386 (31.1%) | 148 (14.3%) |
| Total | 1,241 (100.0%) | 1,032 (100.0%) |
Property Value to Household Income Ratio in Great Neck Plaza
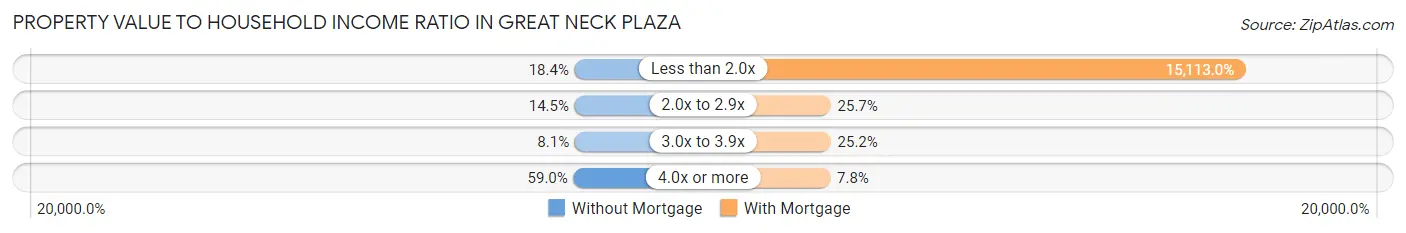
| Value-to-Income Ratio | Without Mortgage | With Mortgage |
| Less than 2.0x | 228 (18.4%) | 155,966 (15,113.0%) |
| 2.0x to 2.9x | 180 (14.5%) | 265 (25.7%) |
| 3.0x to 3.9x | 101 (8.1%) | 260 (25.2%) |
| 4.0x or more | 732 (59.0%) | 80 (7.7%) |
| Total | 1,241 (100.0%) | 1,032 (100.0%) |
Real Estate Taxes by Mortgage Status in Great Neck Plaza

| Property Taxes | Without Mortgage | With Mortgage |
| Less than $800 | 45 (3.6%) | 0 (0.0%) |
| $800 to $1,499 | 0 (0.0%) | 0 (0.0%) |
| $800 to $1,499 | 862 (69.5%) | 9 (0.9%) |
| Total | 1,241 (100.0%) | 1,032 (100.0%) |
Health & Disability in Great Neck Plaza
Health Insurance Coverage by Age in Great Neck Plaza
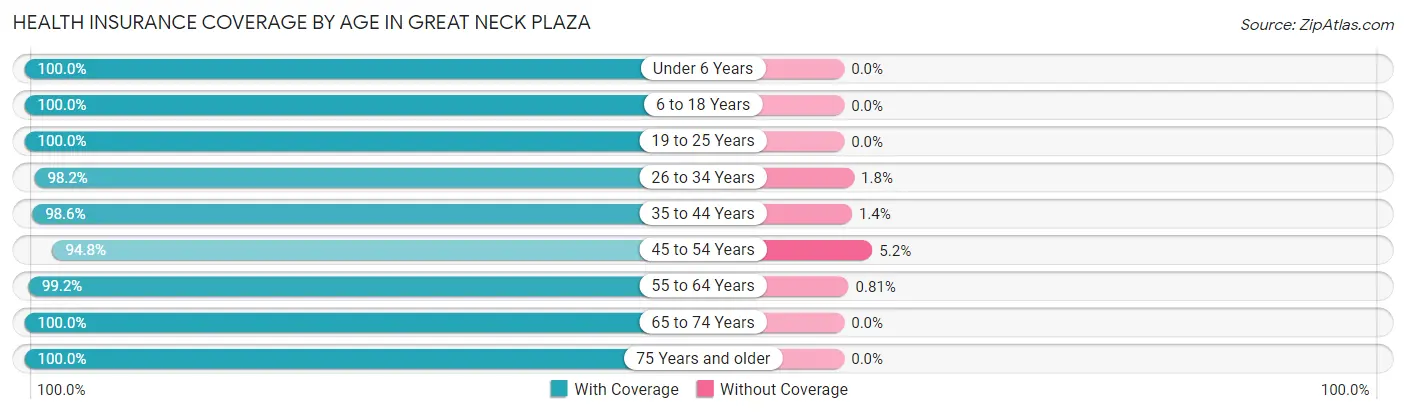
| Age Bracket | With Coverage | Without Coverage |
| Under 6 Years | 483 (100.0%) | 0 (0.0%) |
| 6 to 18 Years | 725 (100.0%) | 0 (0.0%) |
| 19 to 25 Years | 248 (100.0%) | 0 (0.0%) |
| 26 to 34 Years | 958 (98.2%) | 18 (1.8%) |
| 35 to 44 Years | 1,036 (98.6%) | 15 (1.4%) |
| 45 to 54 Years | 940 (94.8%) | 52 (5.2%) |
| 55 to 64 Years | 1,096 (99.2%) | 9 (0.8%) |
| 65 to 74 Years | 690 (100.0%) | 0 (0.0%) |
| 75 Years and older | 1,019 (100.0%) | 0 (0.0%) |
| Total | 7,195 (98.7%) | 94 (1.3%) |
Health Insurance Coverage by Citizenship Status in Great Neck Plaza

| Citizenship Status | With Coverage | Without Coverage |
| Native Born | 483 (100.0%) | 0 (0.0%) |
| Foreign Born, Citizen | 725 (100.0%) | 0 (0.0%) |
| Foreign Born, not a Citizen | 248 (100.0%) | 0 (0.0%) |
Health Insurance Coverage by Household Income in Great Neck Plaza
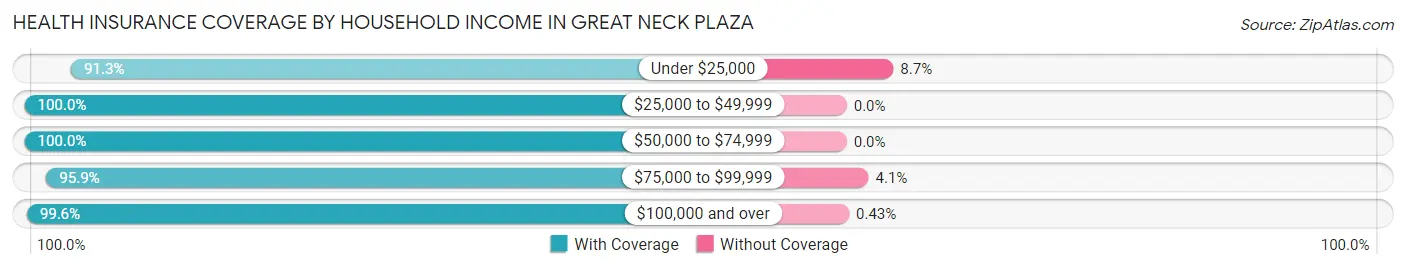
| Household Income | With Coverage | Without Coverage |
| Under $25,000 | 460 (91.3%) | 44 (8.7%) |
| $25,000 to $49,999 | 1,044 (100.0%) | 0 (0.0%) |
| $50,000 to $74,999 | 786 (100.0%) | 0 (0.0%) |
| $75,000 to $99,999 | 751 (95.9%) | 32 (4.1%) |
| $100,000 and over | 4,138 (99.6%) | 18 (0.4%) |
Public vs Private Health Insurance Coverage by Age in Great Neck Plaza
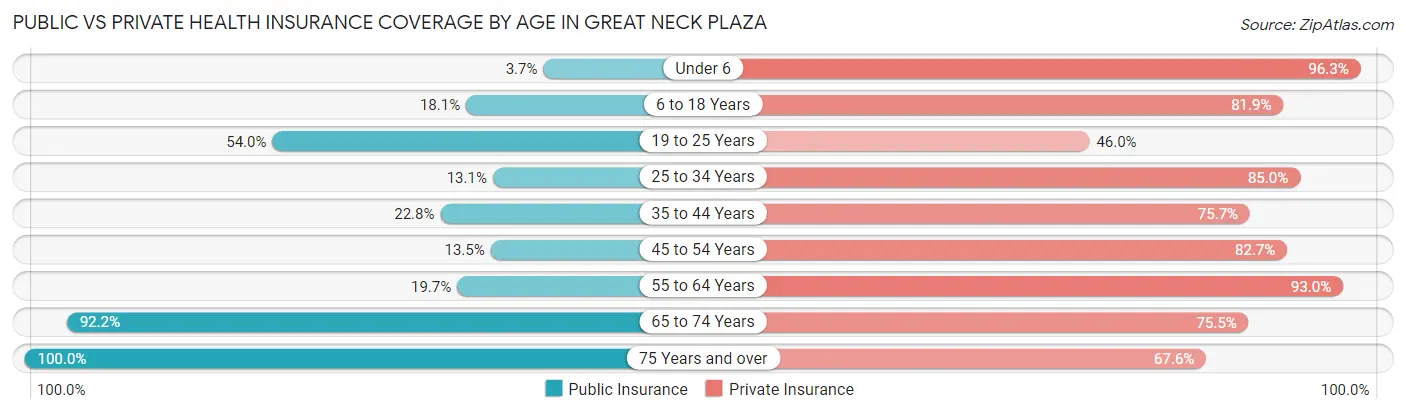
| Age Bracket | Public Insurance | Private Insurance |
| Under 6 | 18 (3.7%) | 465 (96.3%) |
| 6 to 18 Years | 131 (18.1%) | 594 (81.9%) |
| 19 to 25 Years | 134 (54.0%) | 114 (46.0%) |
| 25 to 34 Years | 128 (13.1%) | 830 (85.0%) |
| 35 to 44 Years | 240 (22.8%) | 796 (75.7%) |
| 45 to 54 Years | 134 (13.5%) | 820 (82.7%) |
| 55 to 64 Years | 218 (19.7%) | 1,028 (93.0%) |
| 65 to 74 Years | 636 (92.2%) | 521 (75.5%) |
| 75 Years and over | 1,019 (100.0%) | 689 (67.6%) |
| Total | 2,658 (36.5%) | 5,857 (80.3%) |
Disability Status by Sex by Age in Great Neck Plaza
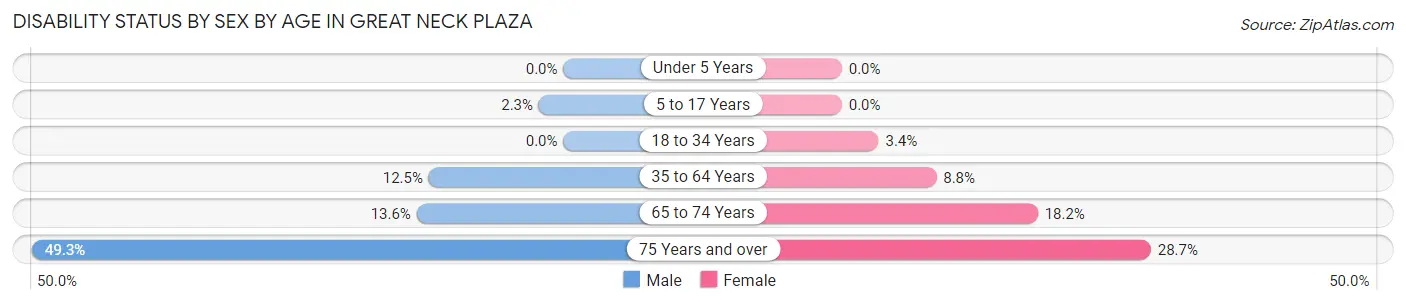
| Age Bracket | Male | Female |
| Under 5 Years | 0 (0.0%) | 0 (0.0%) |
| 5 to 17 Years | 6 (2.3%) | 0 (0.0%) |
| 18 to 34 Years | 0 (0.0%) | 24 (3.4%) |
| 35 to 64 Years | 171 (12.5%) | 156 (8.8%) |
| 65 to 74 Years | 46 (13.6%) | 64 (18.2%) |
| 75 Years and over | 181 (49.3%) | 187 (28.7%) |
Disability Class by Sex by Age in Great Neck Plaza
Disability Class: Hearing Difficulty
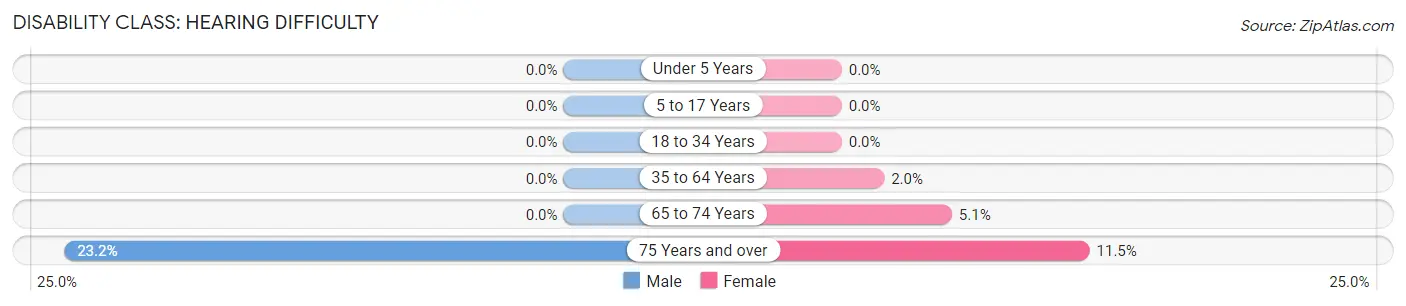
| Age Bracket | Male | Female |
| Under 5 Years | 0 (0.0%) | 0 (0.0%) |
| 5 to 17 Years | 0 (0.0%) | 0 (0.0%) |
| 18 to 34 Years | 0 (0.0%) | 0 (0.0%) |
| 35 to 64 Years | 0 (0.0%) | 35 (2.0%) |
| 65 to 74 Years | 0 (0.0%) | 18 (5.1%) |
| 75 Years and over | 85 (23.2%) | 75 (11.5%) |
Disability Class: Vision Difficulty
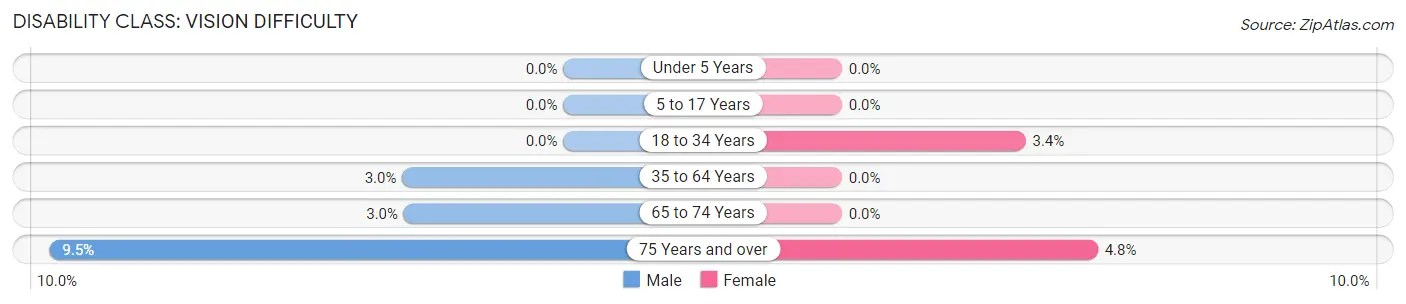
| Age Bracket | Male | Female |
| Under 5 Years | 0 (0.0%) | 0 (0.0%) |
| 5 to 17 Years | 0 (0.0%) | 0 (0.0%) |
| 18 to 34 Years | 0 (0.0%) | 24 (3.4%) |
| 35 to 64 Years | 41 (3.0%) | 0 (0.0%) |
| 65 to 74 Years | 10 (3.0%) | 0 (0.0%) |
| 75 Years and over | 35 (9.5%) | 31 (4.8%) |
Disability Class: Cognitive Difficulty
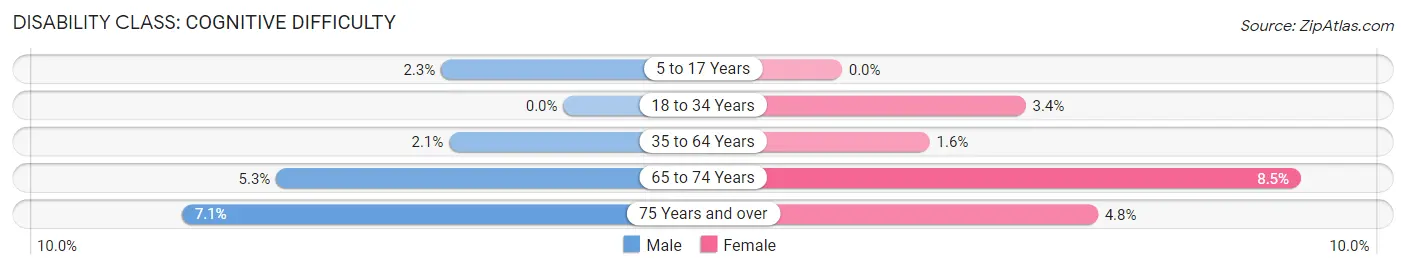
| Age Bracket | Male | Female |
| 5 to 17 Years | 6 (2.3%) | 0 (0.0%) |
| 18 to 34 Years | 0 (0.0%) | 24 (3.4%) |
| 35 to 64 Years | 29 (2.1%) | 29 (1.6%) |
| 65 to 74 Years | 18 (5.3%) | 30 (8.5%) |
| 75 Years and over | 26 (7.1%) | 31 (4.8%) |
Disability Class: Ambulatory Difficulty
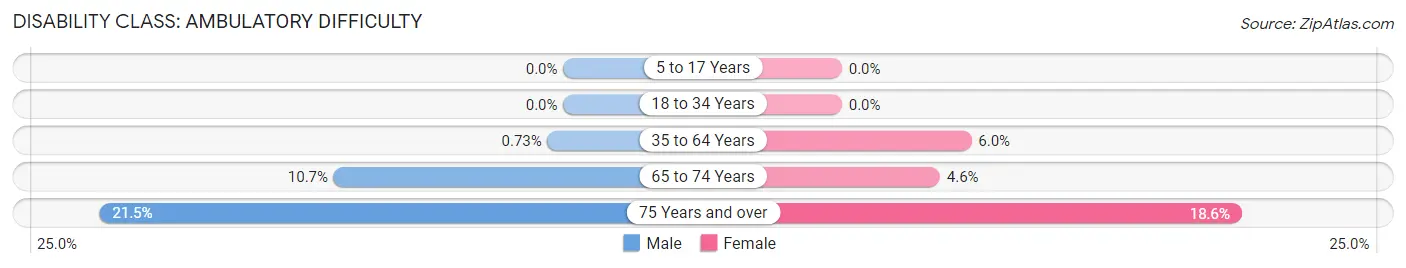
| Age Bracket | Male | Female |
| 5 to 17 Years | 0 (0.0%) | 0 (0.0%) |
| 18 to 34 Years | 0 (0.0%) | 0 (0.0%) |
| 35 to 64 Years | 10 (0.7%) | 107 (6.0%) |
| 65 to 74 Years | 36 (10.6%) | 16 (4.5%) |
| 75 Years and over | 79 (21.5%) | 121 (18.6%) |
Disability Class: Self-Care Difficulty
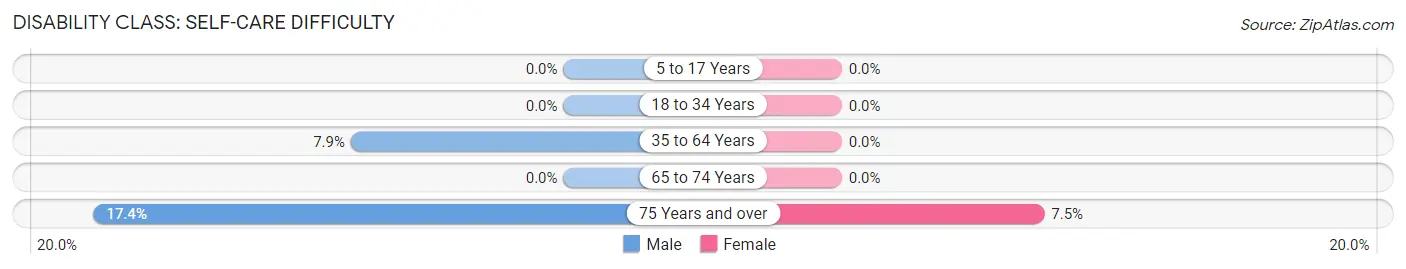
| Age Bracket | Male | Female |
| 5 to 17 Years | 0 (0.0%) | 0 (0.0%) |
| 18 to 34 Years | 0 (0.0%) | 0 (0.0%) |
| 35 to 64 Years | 108 (7.9%) | 0 (0.0%) |
| 65 to 74 Years | 0 (0.0%) | 0 (0.0%) |
| 75 Years and over | 64 (17.4%) | 49 (7.5%) |
Technology Access in Great Neck Plaza
Computing Device Access in Great Neck Plaza
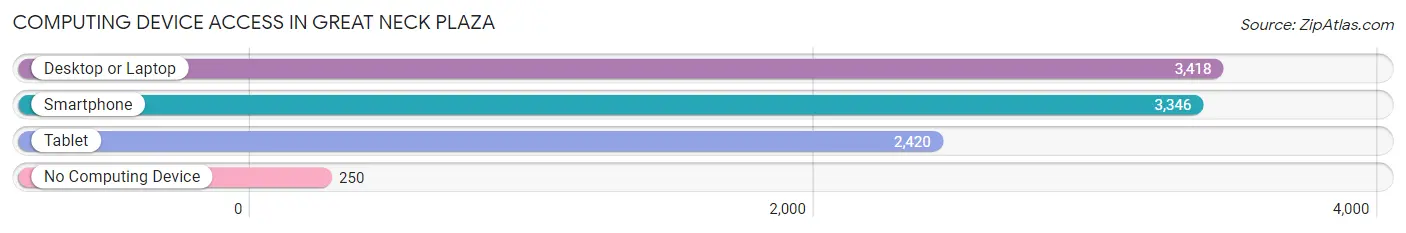
| Device Type | # Households | % Households |
| Desktop or Laptop | 3,418 | 88.1% |
| Smartphone | 3,346 | 86.3% |
| Tablet | 2,420 | 62.4% |
| No Computing Device | 250 | 6.5% |
| Total | 3,878 | 100.0% |
Internet Access in Great Neck Plaza
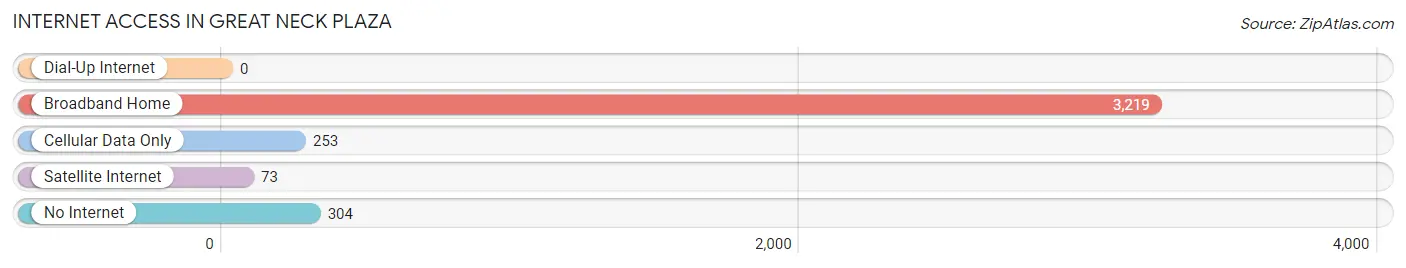
| Internet Type | # Households | % Households |
| Dial-Up Internet | 0 | 0.0% |
| Broadband Home | 3,219 | 83.0% |
| Cellular Data Only | 253 | 6.5% |
| Satellite Internet | 73 | 1.9% |
| No Internet | 304 | 7.8% |
| Total | 3,878 | 100.0% |
Great Neck Plaza Summary
Geography
Great Neck Plaza is a village located in Nassau County, New York, United States. It is part of the Greater New York City metropolitan area. The village is situated on the North Shore of Long Island, and is bordered by the villages of Great Neck, Kings Point, and Thomaston. It is located approximately 25 miles east of Manhattan.
The village has a total area of 0.6 square miles, all of which is land. The terrain is mostly flat, with some hills in the northern part of the village. The village is located on the Great Neck Peninsula, which is surrounded by Manhasset Bay and Hempstead Harbor.
History
The area that is now Great Neck Plaza was originally inhabited by the Matinecock Native American tribe. The first European settlers arrived in the area in the 1640s, and the area was part of the Town of North Hempstead.
In the late 19th century, the area began to develop as a residential community. The village was incorporated in 1931, and was named after the nearby Great Neck peninsula.
In the 1950s, the village began to experience rapid growth, as many people moved to the area from New York City. This growth continued into the 1960s and 1970s, and the village became a popular destination for commuters to New York City.
Economy
The economy of Great Neck Plaza is largely based on retail and services. The village is home to a variety of stores, restaurants, and other businesses. The village is also home to several corporate offices, including the headquarters of the North Shore-Long Island Jewish Health System.
The village is also home to a number of medical offices, including the Great Neck Medical Center. The village is also home to a number of financial institutions, including banks and investment firms.
Demographics
As of the 2010 census, the village had a population of 5,482. The population was 48.3% male and 51.7% female. The median age was 43.7 years.
The racial makeup of the village was 73.2% White, 8.2% Asian, 6.7% African American, 0.2% Native American, 0.1% Pacific Islander, and 11.7% from other races. Hispanic or Latino of any race were 20.2% of the population.
The median household income was $90,945, and the median family income was $106,945. The per capita income was $45,945. About 4.2% of families and 5.7% of the population were below the poverty line.
Conclusion
Great Neck Plaza is a village located in Nassau County, New York, United States. It is part of the Greater New York City metropolitan area, and is situated on the North Shore of Long Island. The village has a total area of 0.6 square miles, and is home to a variety of stores, restaurants, and other businesses. The population of the village was 5,482 as of the 2010 census, and the median household income was $90,945. The village is a popular destination for commuters to New York City, and is home to several corporate offices and medical offices.
Common Questions
What is Per Capita Income in Great Neck Plaza?
Per Capita income in Great Neck Plaza is $72,754.
What is the Median Family Income in Great Neck Plaza?
Median Family Income in Great Neck Plaza is $147,606.
What is the Median Household income in Great Neck Plaza?
Median Household Income in Great Neck Plaza is $97,022.
What is Income or Wage Gap in Great Neck Plaza?
Income or Wage Gap in Great Neck Plaza is 33.8%.
Women in Great Neck Plaza earn 66.2 cents for every dollar earned by a man.
What is Inequality or Gini Index in Great Neck Plaza?
Inequality or Gini Index in Great Neck Plaza is 0.47.
What is the Total Population of Great Neck Plaza?
Total Population of Great Neck Plaza is 7,443.
What is the Total Male Population of Great Neck Plaza?
Total Male Population of Great Neck Plaza is 3,265.
What is the Total Female Population of Great Neck Plaza?
Total Female Population of Great Neck Plaza is 4,178.
What is the Ratio of Males per 100 Females in Great Neck Plaza?
There are 78.15 Males per 100 Females in Great Neck Plaza.
What is the Ratio of Females per 100 Males in Great Neck Plaza?
There are 127.96 Females per 100 Males in Great Neck Plaza.
What is the Median Population Age in Great Neck Plaza?
Median Population Age in Great Neck Plaza is 47.7 Years.
What is the Average Family Size in Great Neck Plaza
Average Family Size in Great Neck Plaza is 2.7 People.
What is the Average Household Size in Great Neck Plaza
Average Household Size in Great Neck Plaza is 1.9 People.
How Large is the Labor Force in Great Neck Plaza?
There are 3,870 People in the Labor Forcein in Great Neck Plaza.
What is the Percentage of People in the Labor Force in Great Neck Plaza?
59.6% of People are in the Labor Force in Great Neck Plaza.
What is the Unemployment Rate in Great Neck Plaza?
Unemployment Rate in Great Neck Plaza is 7.0%.