Hewlett Neck, NY Map & Demographics
Hewlett Neck Map
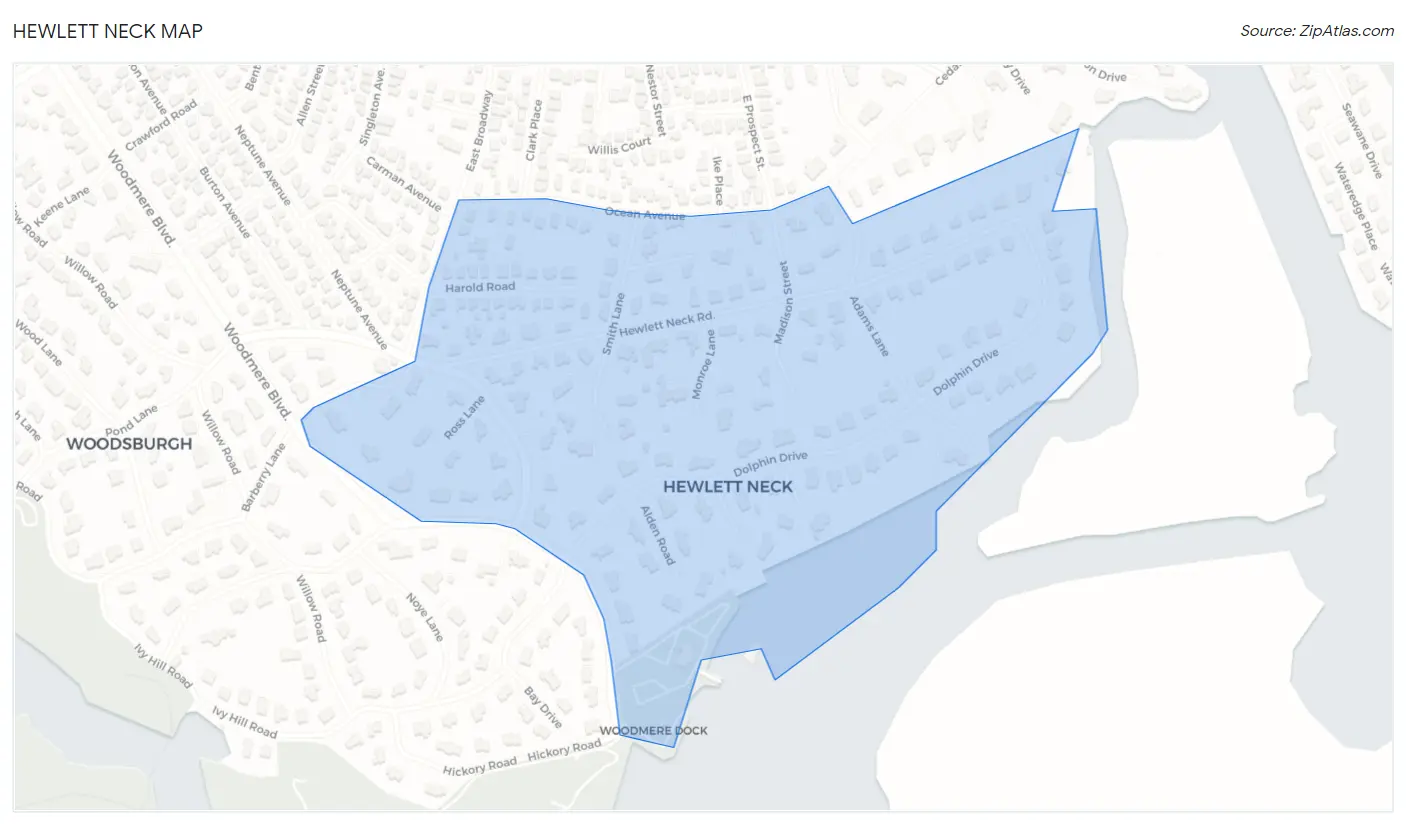
Hewlett Neck Overview
$91,085
PER CAPITA INCOME
$250,001
AVG FAMILY INCOME
$250,001
AVG HOUSEHOLD INCOME
79.9%
WAGE / INCOME GAP [ % ]
20.1¢/ $1
WAGE / INCOME GAP [ $ ]
0.41
INEQUALITY / GINI INDEX
641
TOTAL POPULATION
338
MALE POPULATION
303
FEMALE POPULATION
111.55
MALES / 100 FEMALES
89.64
FEMALES / 100 MALES
27.7
MEDIAN AGE
4.1
AVG FAMILY SIZE
4.0
AVG HOUSEHOLD SIZE
289
LABOR FORCE [ PEOPLE ]
65.5%
PERCENT IN LABOR FORCE
2.8%
UNEMPLOYMENT RATE
Income in Hewlett Neck
Income Overview in Hewlett Neck
Per Capita Income in Hewlett Neck is $91,085, while median incomes of families and households are $250,001 and $250,001 respectively.
| Characteristic | Number | Measure |
| Per Capita Income | 641 | $91,085 |
| Median Family Income | 153 | $250,001 |
| Mean Family Income | 153 | $369,707 |
| Median Household Income | 159 | $250,001 |
| Mean Household Income | 159 | $360,933 |
| Income Deficit | 153 | $0 |
| Wage / Income Gap (%) | 641 | 79.90% |
| Wage / Income Gap ($) | 641 | 20.10¢ per $1 |
| Gini / Inequality Index | 641 | 0.41 |
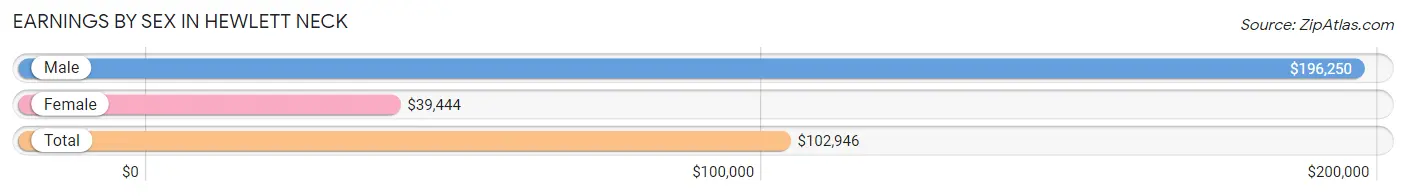
Earnings by Sex in Hewlett Neck
Average Earnings in Hewlett Neck are $102,946, $196,250 for men and $39,444 for women, a difference of 79.9%.
| Sex | Number | Average Earnings |
| Male | 167 (55.1%) | $196,250 |
| Female | 136 (44.9%) | $39,444 |
| Total | 303 (100.0%) | $102,946 |
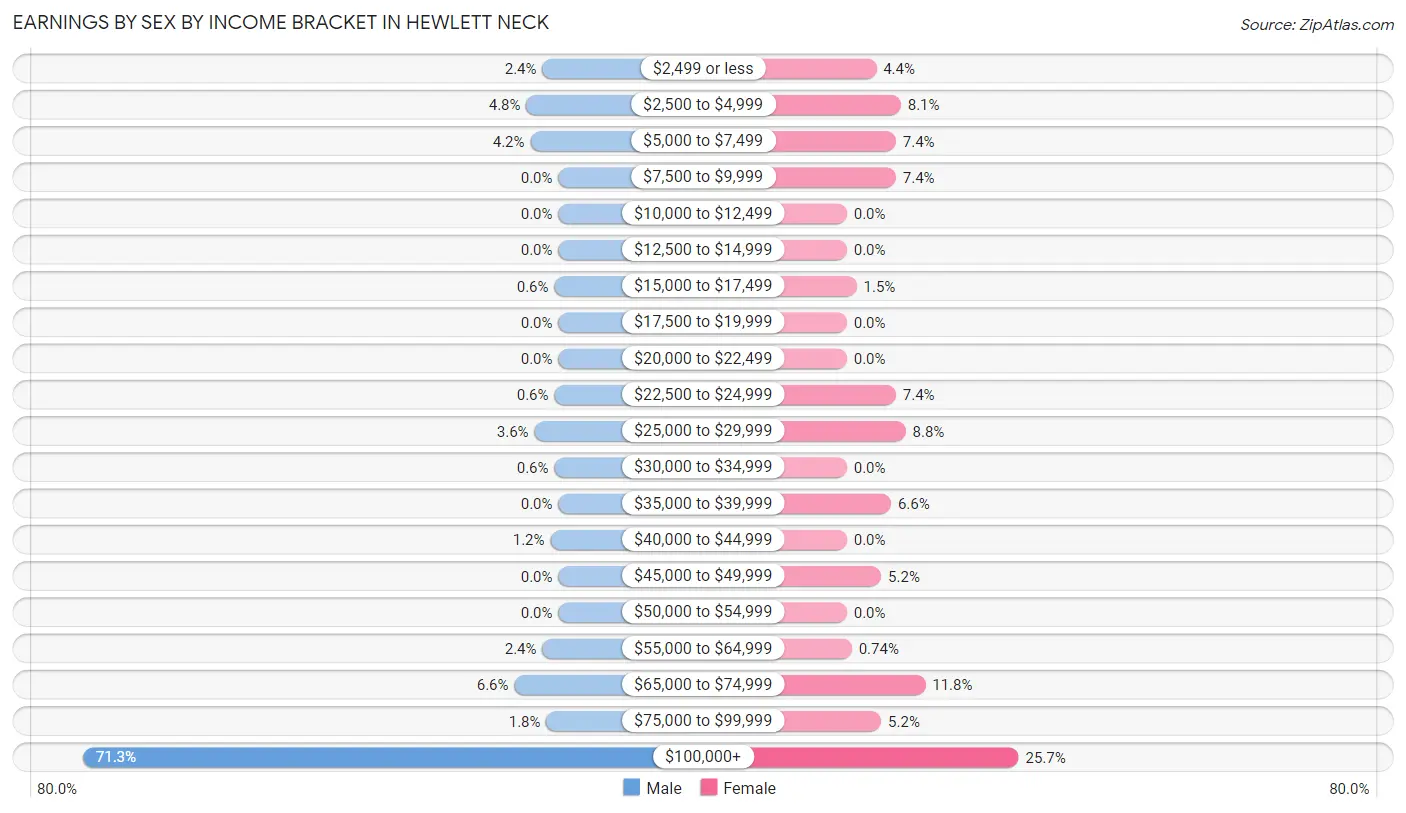
Earnings by Sex by Income Bracket in Hewlett Neck
The most common earnings brackets in Hewlett Neck are $100,000+ for men (119 | 71.3%) and $100,000+ for women (35 | 25.7%).
| Income | Male | Female |
| $2,499 or less | 4 (2.4%) | 6 (4.4%) |
| $2,500 to $4,999 | 8 (4.8%) | 11 (8.1%) |
| $5,000 to $7,499 | 7 (4.2%) | 10 (7.3%) |
| $7,500 to $9,999 | 0 (0.0%) | 10 (7.3%) |
| $10,000 to $12,499 | 0 (0.0%) | 0 (0.0%) |
| $12,500 to $14,999 | 0 (0.0%) | 0 (0.0%) |
| $15,000 to $17,499 | 1 (0.6%) | 2 (1.5%) |
| $17,500 to $19,999 | 0 (0.0%) | 0 (0.0%) |
| $20,000 to $22,499 | 0 (0.0%) | 0 (0.0%) |
| $22,500 to $24,999 | 1 (0.6%) | 10 (7.3%) |
| $25,000 to $29,999 | 6 (3.6%) | 12 (8.8%) |
| $30,000 to $34,999 | 1 (0.6%) | 0 (0.0%) |
| $35,000 to $39,999 | 0 (0.0%) | 9 (6.6%) |
| $40,000 to $44,999 | 2 (1.2%) | 0 (0.0%) |
| $45,000 to $49,999 | 0 (0.0%) | 7 (5.1%) |
| $50,000 to $54,999 | 0 (0.0%) | 0 (0.0%) |
| $55,000 to $64,999 | 4 (2.4%) | 1 (0.7%) |
| $65,000 to $74,999 | 11 (6.6%) | 16 (11.8%) |
| $75,000 to $99,999 | 3 (1.8%) | 7 (5.1%) |
| $100,000+ | 119 (71.3%) | 35 (25.7%) |
| Total | 167 (100.0%) | 136 (100.0%) |
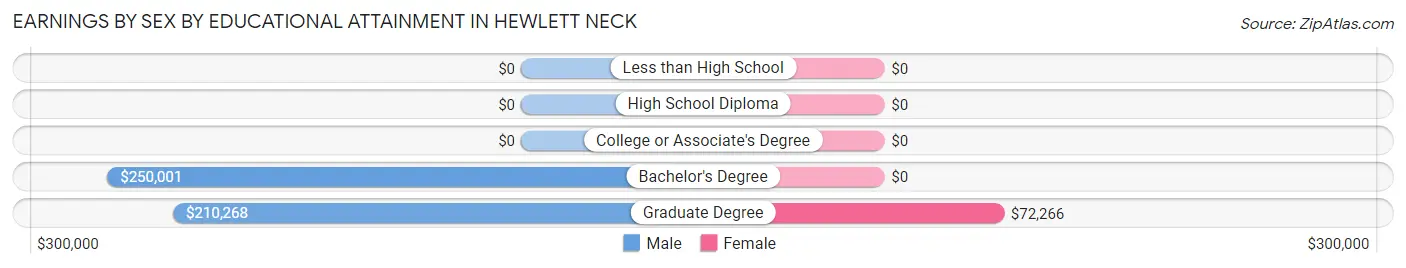
Earnings by Sex by Educational Attainment in Hewlett Neck
Average earnings in Hewlett Neck are $211,786 for men and $70,781 for women, a difference of 66.6%. Men with an educational attainment of bachelor's degree enjoy the highest average annual earnings of $250,001, while those with graduate degree education earn the least with $210,268. Women with an educational attainment of graduate degree earn the most with the average annual earnings of $72,266, while those with graduate degree education have the smallest earnings of $72,266.
| Educational Attainment | Male Income | Female Income |
| Less than High School | - | - |
| High School Diploma | - | - |
| College or Associate's Degree | - | - |
| Bachelor's Degree | $250,001 | $0 |
| Graduate Degree | $210,268 | $72,266 |
| Total | $211,786 | $70,781 |
Family Income in Hewlett Neck
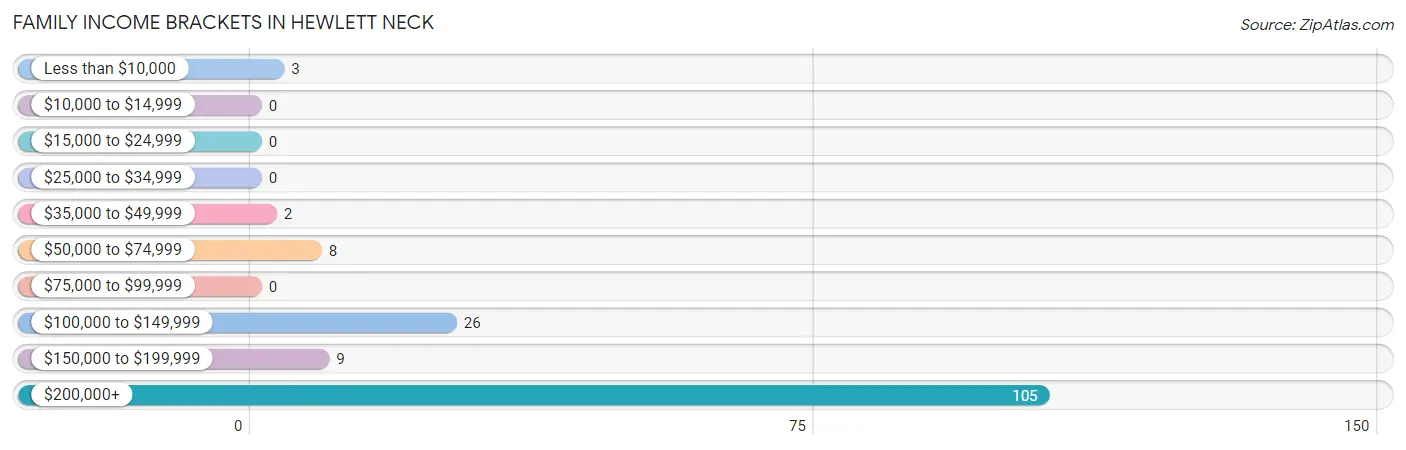
Family Income Brackets in Hewlett Neck
According to the Hewlett Neck family income data, there are 105 families falling into the $200,000+ income range, which is the most common income bracket and makes up 68.6% of all families.
| Income Bracket | # Families | % Families |
| Less than $10,000 | 3 | 2.0% |
| $10,000 to $14,999 | 0 | 0.0% |
| $15,000 to $24,999 | 0 | 0.0% |
| $25,000 to $34,999 | 0 | 0.0% |
| $35,000 to $49,999 | 2 | 1.3% |
| $50,000 to $74,999 | 8 | 5.2% |
| $75,000 to $99,999 | 0 | 0.0% |
| $100,000 to $149,999 | 26 | 17.0% |
| $150,000 to $199,999 | 9 | 5.9% |
| $200,000+ | 105 | 68.6% |
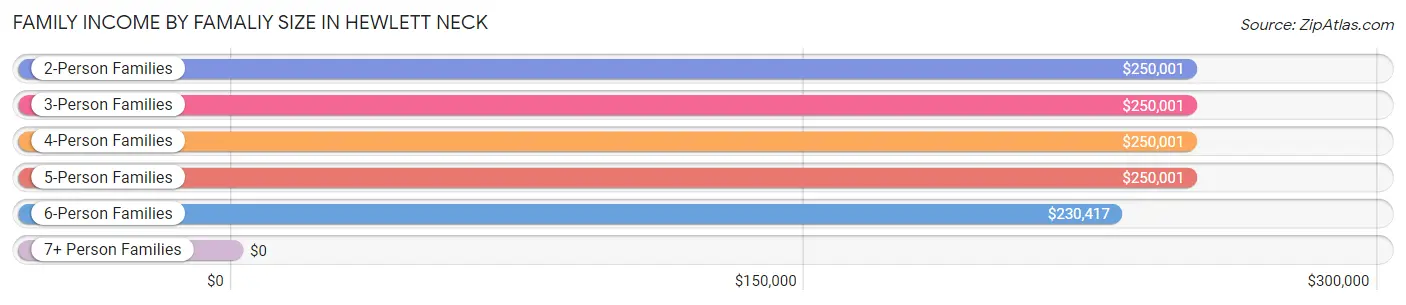
Family Income by Famaliy Size in Hewlett Neck
2-person families (29 | 19.0%) account for the highest median family income in Hewlett Neck with $250,001 per family, while 2-person families (29 | 19.0%) have the highest median income of $125,000 per family member.
| Income Bracket | # Families | Median Income |
| 2-Person Families | 29 (19.0%) | $250,001 |
| 3-Person Families | 26 (17.0%) | $250,001 |
| 4-Person Families | 41 (26.8%) | $250,001 |
| 5-Person Families | 35 (22.9%) | $250,001 |
| 6-Person Families | 21 (13.7%) | $230,417 |
| 7+ Person Families | 1 (0.6%) | $0 |
| Total | 153 (100.0%) | $250,001 |
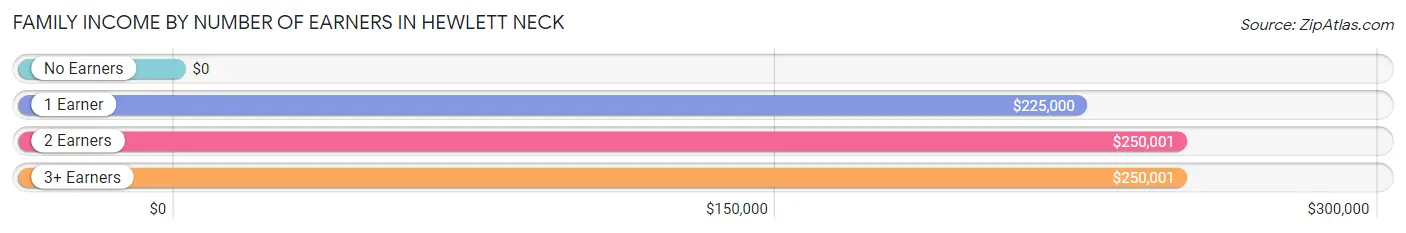
Family Income by Number of Earners in Hewlett Neck
| Number of Earners | # Families | Median Income |
| No Earners | 5 (3.3%) | $0 |
| 1 Earner | 38 (24.8%) | $225,000 |
| 2 Earners | 90 (58.8%) | $250,001 |
| 3+ Earners | 20 (13.1%) | $250,001 |
| Total | 153 (100.0%) | $250,001 |
Household Income in Hewlett Neck
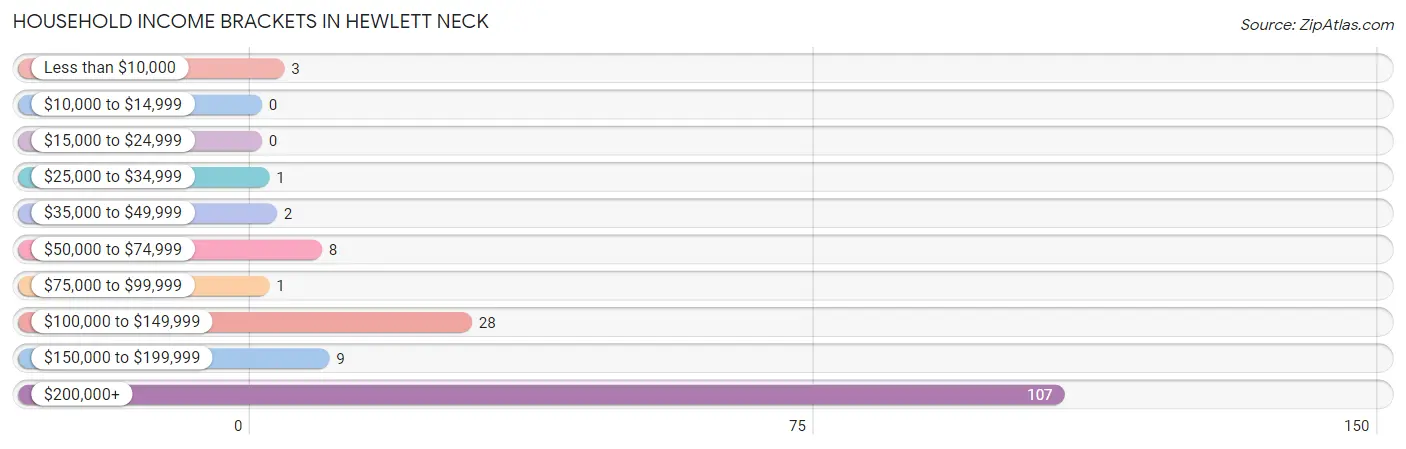
Household Income Brackets in Hewlett Neck
With 107 households falling in the category, the $200,000+ income range is the most frequent in Hewlett Neck, accounting for 67.3% of all households.
| Income Bracket | # Households | % Households |
| Less than $10,000 | 3 | 1.9% |
| $10,000 to $14,999 | 0 | 0.0% |
| $15,000 to $24,999 | 0 | 0.0% |
| $25,000 to $34,999 | 1 | 0.6% |
| $35,000 to $49,999 | 2 | 1.3% |
| $50,000 to $74,999 | 8 | 5.0% |
| $75,000 to $99,999 | 1 | 0.6% |
| $100,000 to $149,999 | 28 | 17.6% |
| $150,000 to $199,999 | 9 | 5.7% |
| $200,000+ | 107 | 67.3% |
Household Income by Householder Age in Hewlett Neck
The median household income in Hewlett Neck is $250,001, with the highest median household income of $250,001 found in the 25 to 44 years age bracket for the primary householder. A total of 50 households (31.5%) fall into this category.
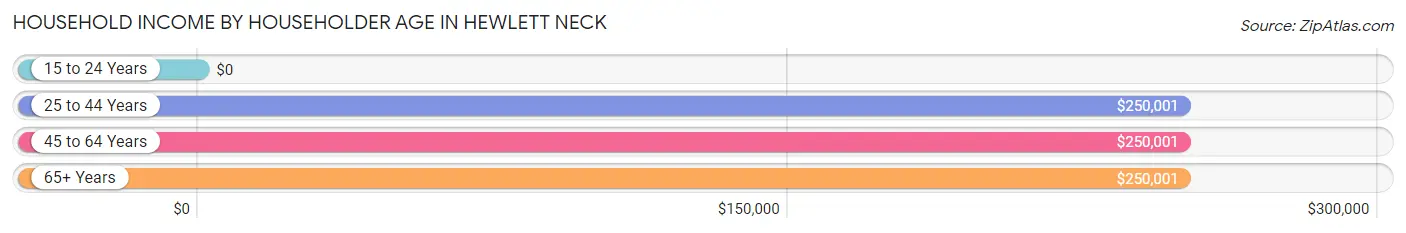
| Income Bracket | # Households | Median Income |
| 15 to 24 Years | 0 (0.0%) | $0 |
| 25 to 44 Years | 50 (31.5%) | $250,001 |
| 45 to 64 Years | 91 (57.2%) | $250,001 |
| 65+ Years | 18 (11.3%) | $250,001 |
| Total | 159 (100.0%) | $250,001 |
Poverty in Hewlett Neck
Income Below Poverty by Sex and Age in Hewlett Neck
With 1.2% poverty level for males and 3.0% for females among the residents of Hewlett Neck, 65 to 74 year old males and 75 year old and over females are the most vulnerable to poverty, with 4 males (26.7%) and 2 females (15.4%) in their respective age groups living below the poverty level.
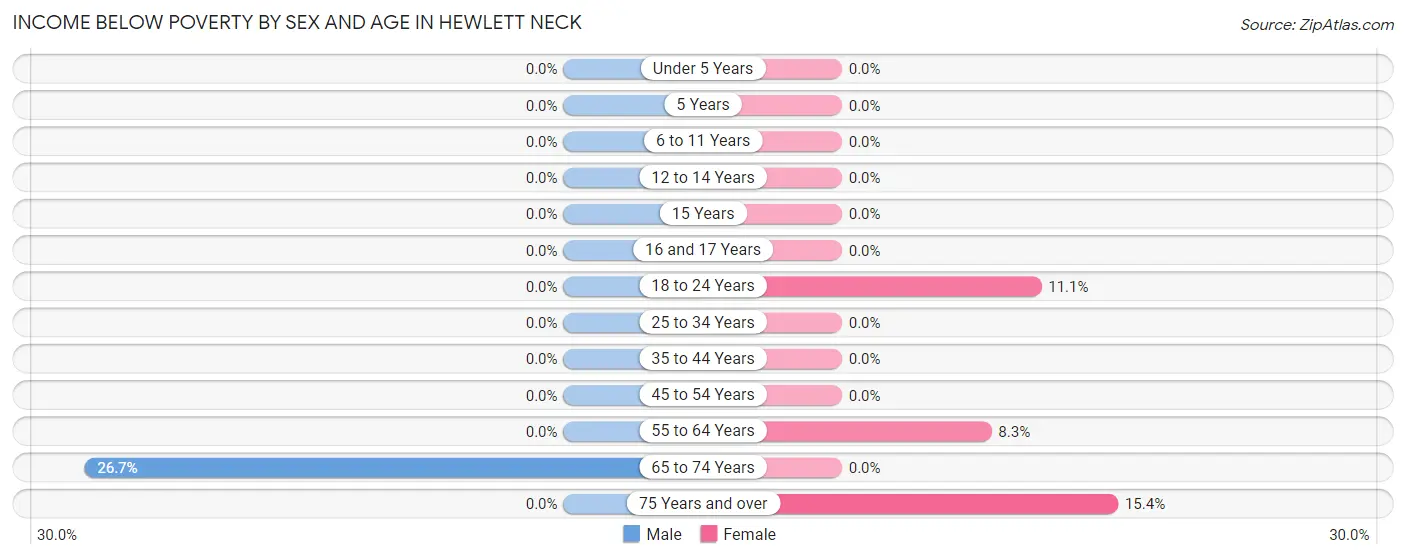
| Age Bracket | Male | Female |
| Under 5 Years | 0 (0.0%) | 0 (0.0%) |
| 5 Years | 0 (0.0%) | 0 (0.0%) |
| 6 to 11 Years | 0 (0.0%) | 0 (0.0%) |
| 12 to 14 Years | 0 (0.0%) | 0 (0.0%) |
| 15 Years | 0 (0.0%) | 0 (0.0%) |
| 16 and 17 Years | 0 (0.0%) | 0 (0.0%) |
| 18 to 24 Years | 0 (0.0%) | 4 (11.1%) |
| 25 to 34 Years | 0 (0.0%) | 0 (0.0%) |
| 35 to 44 Years | 0 (0.0%) | 0 (0.0%) |
| 45 to 54 Years | 0 (0.0%) | 0 (0.0%) |
| 55 to 64 Years | 0 (0.0%) | 3 (8.3%) |
| 65 to 74 Years | 4 (26.7%) | 0 (0.0%) |
| 75 Years and over | 0 (0.0%) | 2 (15.4%) |
| Total | 4 (1.2%) | 9 (3.0%) |
Income Above Poverty by Sex and Age in Hewlett Neck
According to the poverty statistics in Hewlett Neck, males aged under 5 years and females aged under 5 years are the age groups that are most secure financially, with 100.0% of males and 100.0% of females in these age groups living above the poverty line.
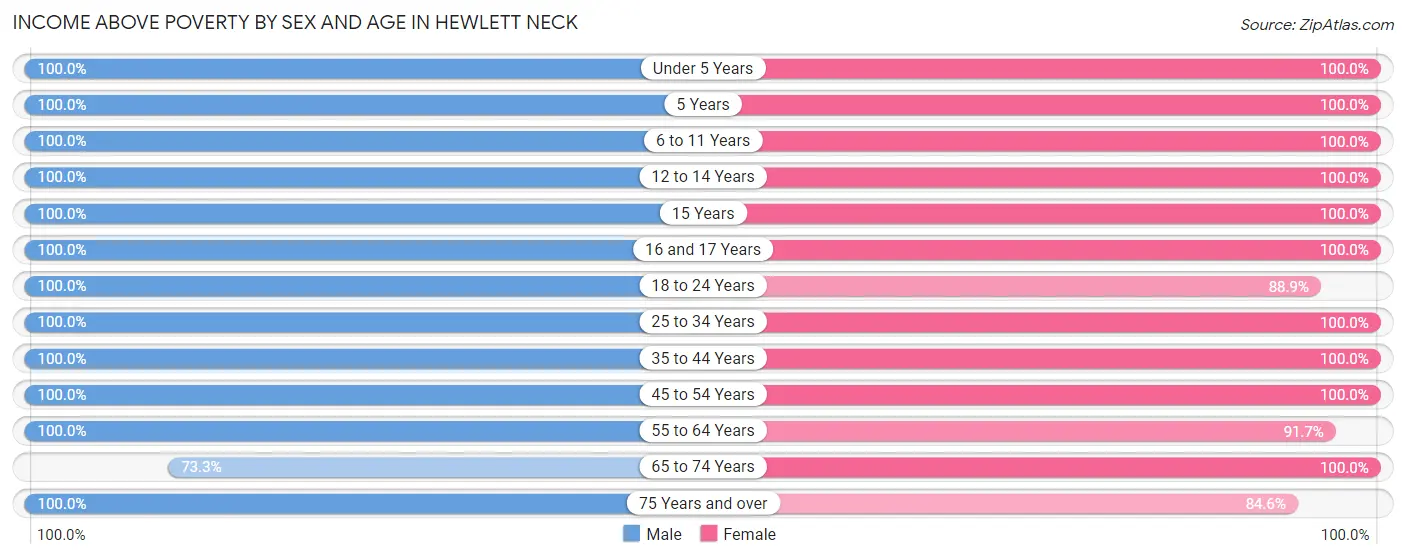
| Age Bracket | Male | Female |
| Under 5 Years | 36 (100.0%) | 30 (100.0%) |
| 5 Years | 4 (100.0%) | 1 (100.0%) |
| 6 to 11 Years | 37 (100.0%) | 34 (100.0%) |
| 12 to 14 Years | 24 (100.0%) | 14 (100.0%) |
| 15 Years | 9 (100.0%) | 11 (100.0%) |
| 16 and 17 Years | 17 (100.0%) | 12 (100.0%) |
| 18 to 24 Years | 43 (100.0%) | 32 (88.9%) |
| 25 to 34 Years | 43 (100.0%) | 21 (100.0%) |
| 35 to 44 Years | 28 (100.0%) | 46 (100.0%) |
| 45 to 54 Years | 54 (100.0%) | 40 (100.0%) |
| 55 to 64 Years | 22 (100.0%) | 33 (91.7%) |
| 65 to 74 Years | 11 (73.3%) | 9 (100.0%) |
| 75 Years and over | 6 (100.0%) | 11 (84.6%) |
| Total | 334 (98.8%) | 294 (97.0%) |
Income Below Poverty Among Married-Couple Families in Hewlett Neck
The poverty statistics for married-couple families in Hewlett Neck show that 2.3% or 3 of the total 133 families live below the poverty line. Families with no children have the highest poverty rate of 7.1%, comprising of 3 families. On the other hand, families with 1 or 2 children have the lowest poverty rate of 0.0%, which includes 0 families.
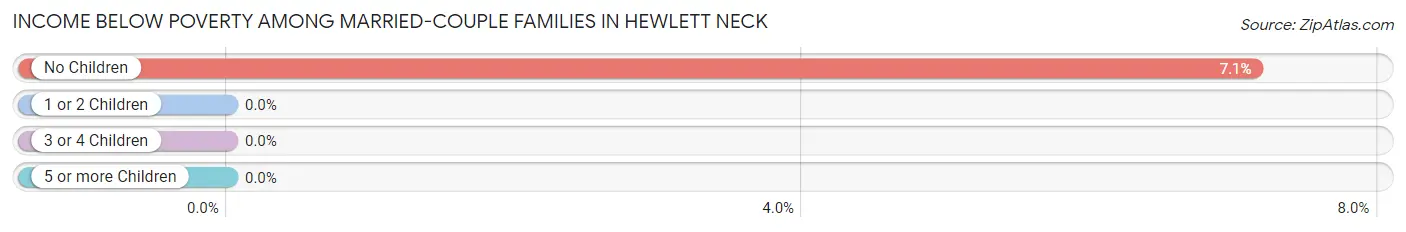
| Children | Above Poverty | Below Poverty |
| No Children | 39 (92.9%) | 3 (7.1%) |
| 1 or 2 Children | 62 (100.0%) | 0 (0.0%) |
| 3 or 4 Children | 28 (100.0%) | 0 (0.0%) |
| 5 or more Children | 1 (100.0%) | 0 (0.0%) |
| Total | 130 (97.7%) | 3 (2.3%) |
Income Below Poverty Among Single-Parent Households in Hewlett Neck
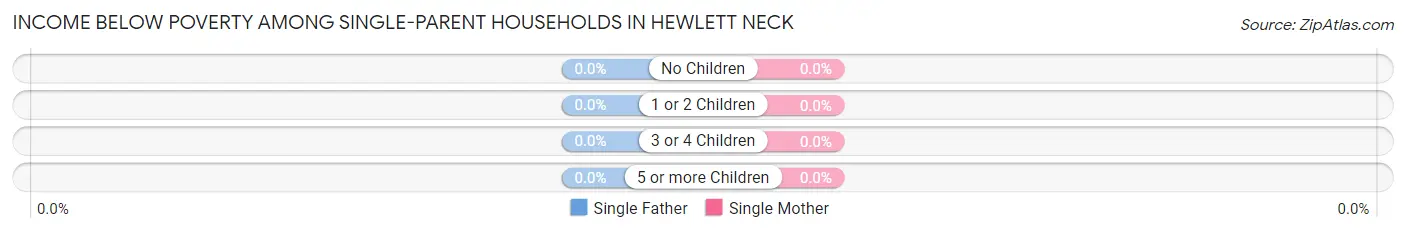
| Children | Single Father | Single Mother |
| No Children | 0 (0.0%) | 0 (0.0%) |
| 1 or 2 Children | 0 (0.0%) | 0 (0.0%) |
| 3 or 4 Children | 0 (0.0%) | 0 (0.0%) |
| 5 or more Children | 0 (0.0%) | 0 (0.0%) |
| Total | 0 (0.0%) | 0 (0.0%) |
Income Below Poverty Among Married-Couple vs Single-Parent Households in Hewlett Neck
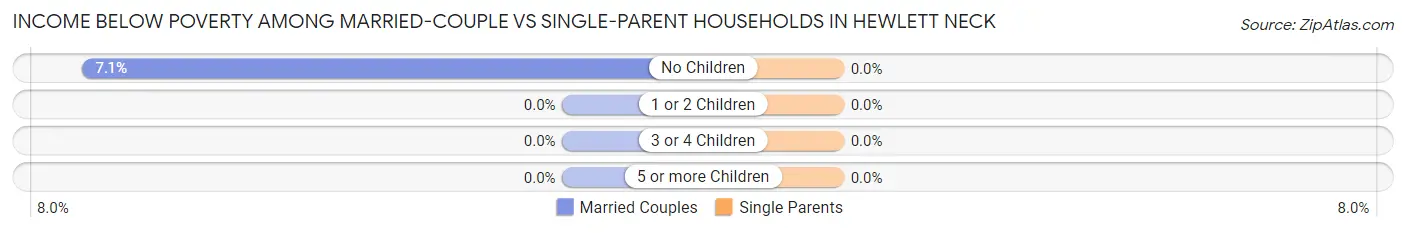
| Children | Married-Couple Families | Single-Parent Households |
| No Children | 3 (7.1%) | 0 (0.0%) |
| 1 or 2 Children | 0 (0.0%) | 0 (0.0%) |
| 3 or 4 Children | 0 (0.0%) | 0 (0.0%) |
| 5 or more Children | 0 (0.0%) | 0 (0.0%) |
| Total | 3 (2.3%) | 0 (0.0%) |
Race in Hewlett Neck
The most populous races in Hewlett Neck are White / Caucasian (569 | 88.8%), Asian (61 | 9.5%), and Hispanic or Latino (19 | 3.0%).
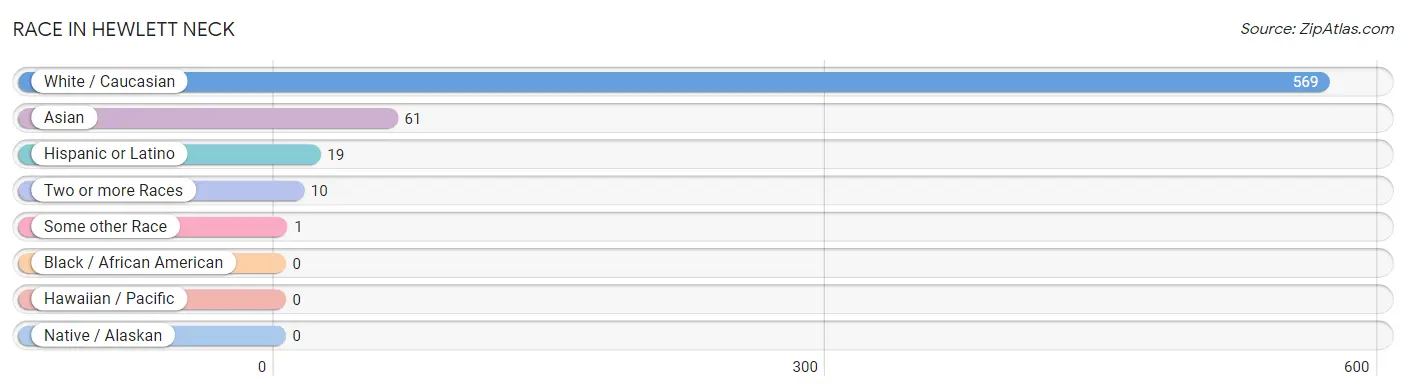
| Race | # Population | % Population |
| Asian | 61 | 9.5% |
| Black / African American | 0 | 0.0% |
| Hawaiian / Pacific | 0 | 0.0% |
| Hispanic or Latino | 19 | 3.0% |
| Native / Alaskan | 0 | 0.0% |
| White / Caucasian | 569 | 88.8% |
| Two or more Races | 10 | 1.6% |
| Some other Race | 1 | 0.2% |
| Total | 641 | 100.0% |
Ancestry in Hewlett Neck
The most populous ancestries reported in Hewlett Neck are Thai (52 | 8.1%), Eastern European (48 | 7.5%), Polish (42 | 6.6%), Hungarian (41 | 6.4%), and Russian (38 | 5.9%), together accounting for 34.5% of all Hewlett Neck residents.
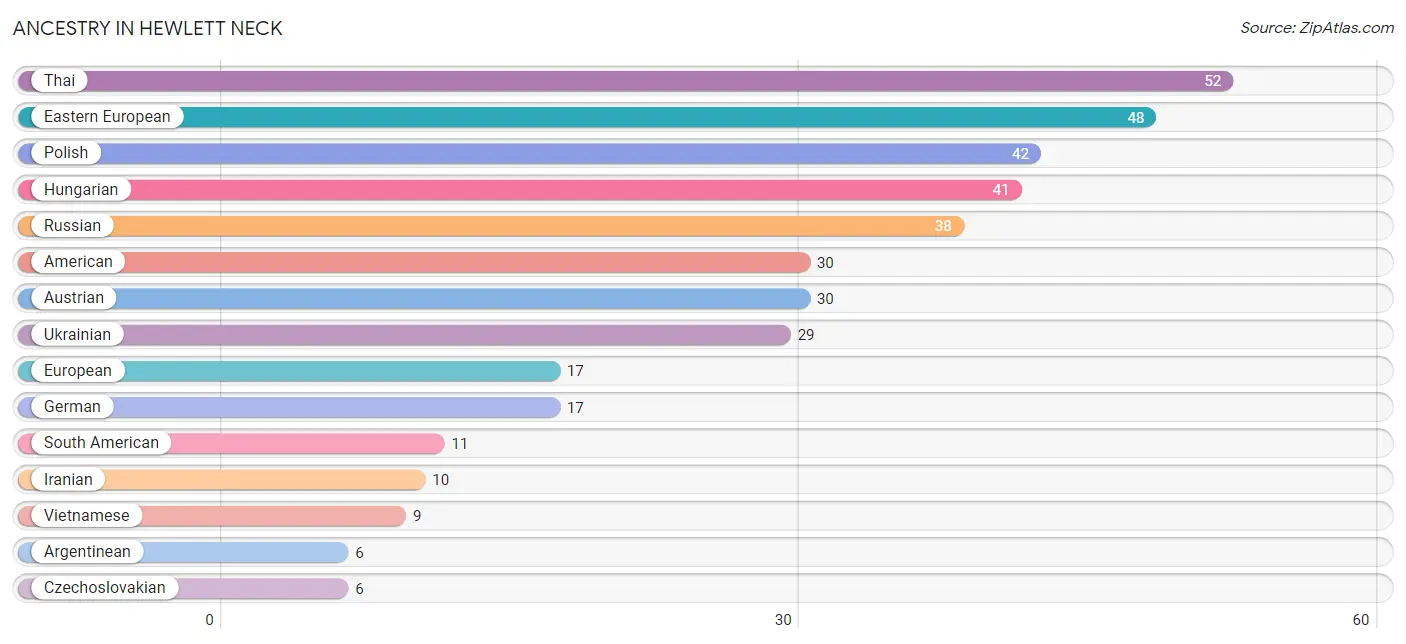
| Ancestry | # Population | % Population |
| American | 30 | 4.7% |
| Arab | 1 | 0.2% |
| Argentinean | 6 | 0.9% |
| Austrian | 30 | 4.7% |
| Chilean | 2 | 0.3% |
| Colombian | 1 | 0.2% |
| Czech | 5 | 0.8% |
| Czechoslovakian | 6 | 0.9% |
| Dominican | 5 | 0.8% |
| Eastern European | 48 | 7.5% |
| Ecuadorian | 2 | 0.3% |
| European | 17 | 2.6% |
| German | 17 | 2.6% |
| Hungarian | 41 | 6.4% |
| Iranian | 10 | 1.6% |
| Irish | 1 | 0.2% |
| Italian | 2 | 0.3% |
| Latvian | 4 | 0.6% |
| Polish | 42 | 6.6% |
| Portuguese | 6 | 0.9% |
| Romanian | 1 | 0.2% |
| Russian | 38 | 5.9% |
| South American | 11 | 1.7% |
| Spaniard | 3 | 0.5% |
| Swedish | 3 | 0.5% |
| Thai | 52 | 8.1% |
| Ukrainian | 29 | 4.5% |
| Vietnamese | 9 | 1.4% | View All 28 Rows |
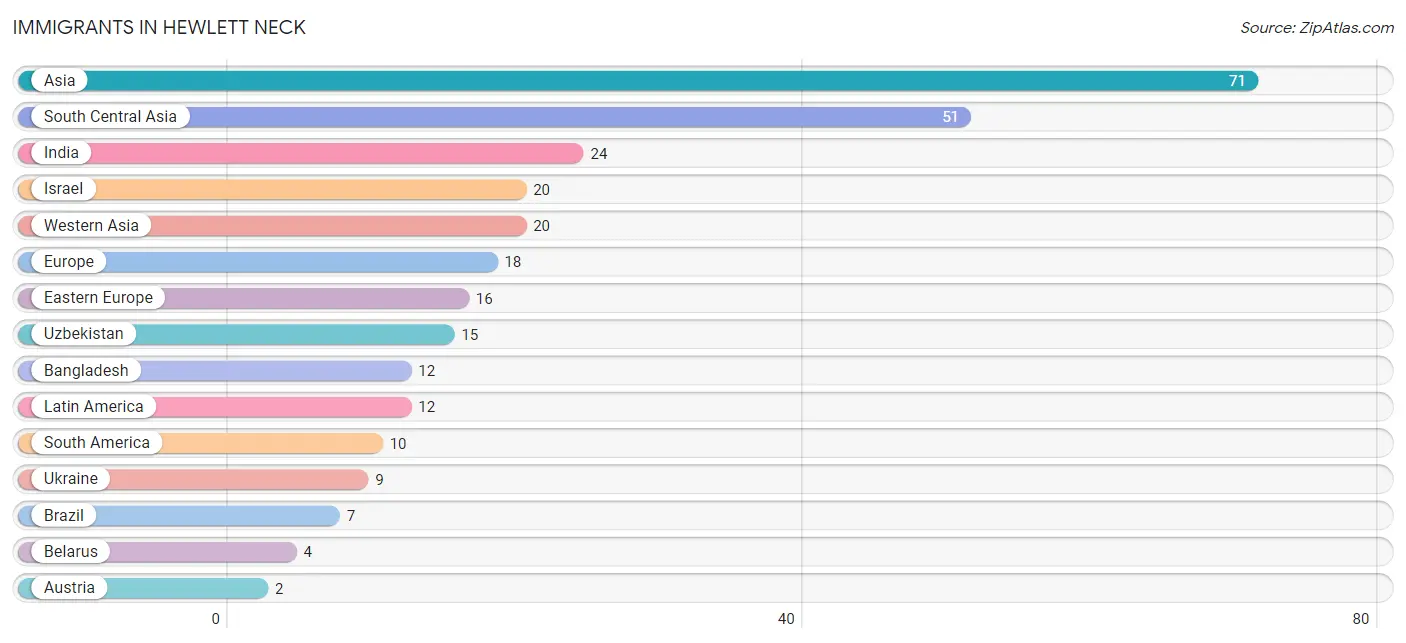
Immigrants in Hewlett Neck
The most numerous immigrant groups reported in Hewlett Neck came from Asia (71 | 11.1%), South Central Asia (51 | 8.0%), India (24 | 3.7%), Israel (20 | 3.1%), and Western Asia (20 | 3.1%), together accounting for 29.0% of all Hewlett Neck residents.
| Immigration Origin | # Population | % Population |
| Asia | 71 | 11.1% |
| Austria | 2 | 0.3% |
| Bangladesh | 12 | 1.9% |
| Belarus | 4 | 0.6% |
| Brazil | 7 | 1.1% |
| Canada | 1 | 0.2% |
| Caribbean | 2 | 0.3% |
| Colombia | 1 | 0.2% |
| Dominican Republic | 2 | 0.3% |
| Eastern Europe | 16 | 2.5% |
| Ecuador | 2 | 0.3% |
| Europe | 18 | 2.8% |
| India | 24 | 3.7% |
| Israel | 20 | 3.1% |
| Latin America | 12 | 1.9% |
| Moldova | 2 | 0.3% |
| Russia | 1 | 0.2% |
| South America | 10 | 1.6% |
| South Central Asia | 51 | 8.0% |
| Ukraine | 9 | 1.4% |
| Uzbekistan | 15 | 2.3% |
| Western Asia | 20 | 3.1% |
| Western Europe | 2 | 0.3% | View All 23 Rows |
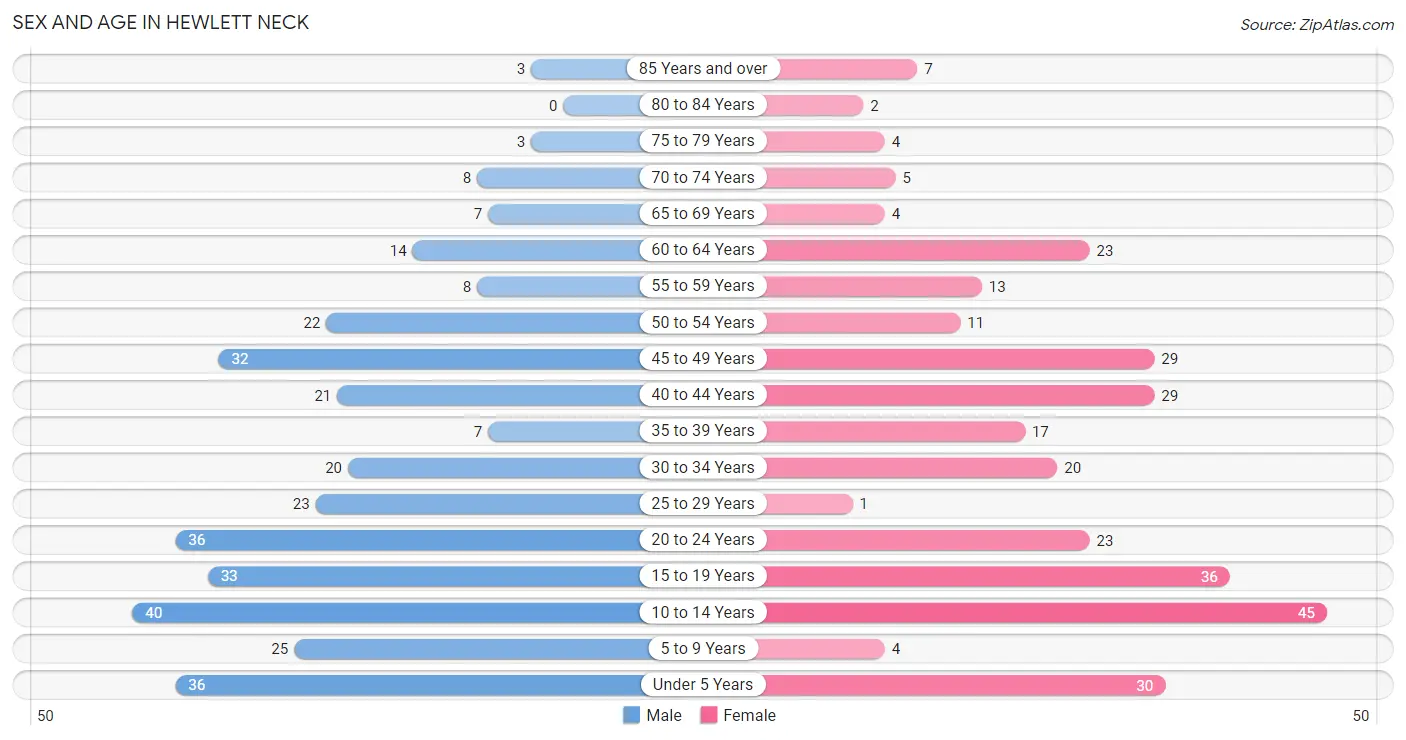
Sex and Age in Hewlett Neck
Sex and Age in Hewlett Neck
The most populous age groups in Hewlett Neck are 10 to 14 Years (40 | 11.8%) for men and 10 to 14 Years (45 | 14.8%) for women.
| Age Bracket | Male | Female |
| Under 5 Years | 36 (10.6%) | 30 (9.9%) |
| 5 to 9 Years | 25 (7.4%) | 4 (1.3%) |
| 10 to 14 Years | 40 (11.8%) | 45 (14.8%) |
| 15 to 19 Years | 33 (9.8%) | 36 (11.9%) |
| 20 to 24 Years | 36 (10.6%) | 23 (7.6%) |
| 25 to 29 Years | 23 (6.8%) | 1 (0.3%) |
| 30 to 34 Years | 20 (5.9%) | 20 (6.6%) |
| 35 to 39 Years | 7 (2.1%) | 17 (5.6%) |
| 40 to 44 Years | 21 (6.2%) | 29 (9.6%) |
| 45 to 49 Years | 32 (9.5%) | 29 (9.6%) |
| 50 to 54 Years | 22 (6.5%) | 11 (3.6%) |
| 55 to 59 Years | 8 (2.4%) | 13 (4.3%) |
| 60 to 64 Years | 14 (4.1%) | 23 (7.6%) |
| 65 to 69 Years | 7 (2.1%) | 4 (1.3%) |
| 70 to 74 Years | 8 (2.4%) | 5 (1.7%) |
| 75 to 79 Years | 3 (0.9%) | 4 (1.3%) |
| 80 to 84 Years | 0 (0.0%) | 2 (0.7%) |
| 85 Years and over | 3 (0.9%) | 7 (2.3%) |
| Total | 338 (100.0%) | 303 (100.0%) |
Families and Households in Hewlett Neck
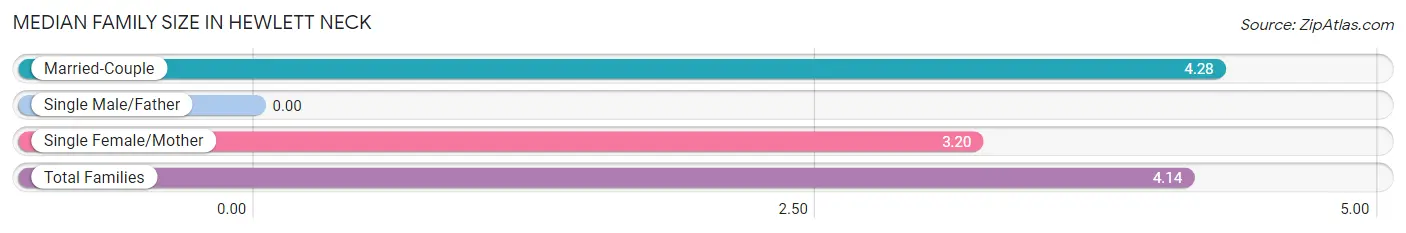
Median Family Size in Hewlett Neck
| Family Type | # Families | Family Size |
| Married-Couple | 133 (86.9%) | 4.28 |
| Single Male/Father | 0 (0.0%) | - |
| Single Female/Mother | 20 (13.1%) | 3.20 |
| Total Families | 153 (100.0%) | 4.14 |
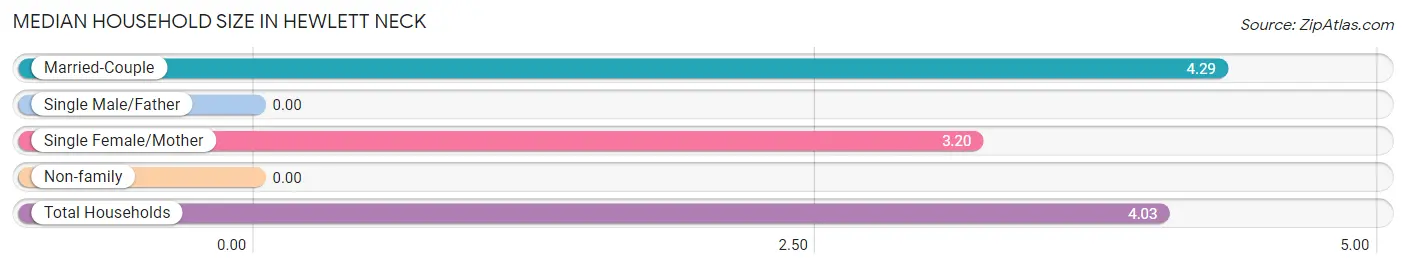
Median Household Size in Hewlett Neck
| Household Type | # Households | Household Size |
| Married-Couple | 133 (83.7%) | 4.29 |
| Single Male/Father | 0 (0.0%) | - |
| Single Female/Mother | 20 (12.6%) | 3.20 |
| Non-family | 6 (3.8%) | - |
| Total Households | 159 (100.0%) | 4.03 |
Household Size by Marriage Status in Hewlett Neck
Out of a total of 159 households in Hewlett Neck, 153 (96.2%) are family households, while 6 (3.8%) are nonfamily households. The most numerous type of family households are 4-person households, comprising 41, and the most common type of nonfamily households are 1-person households, comprising 6.
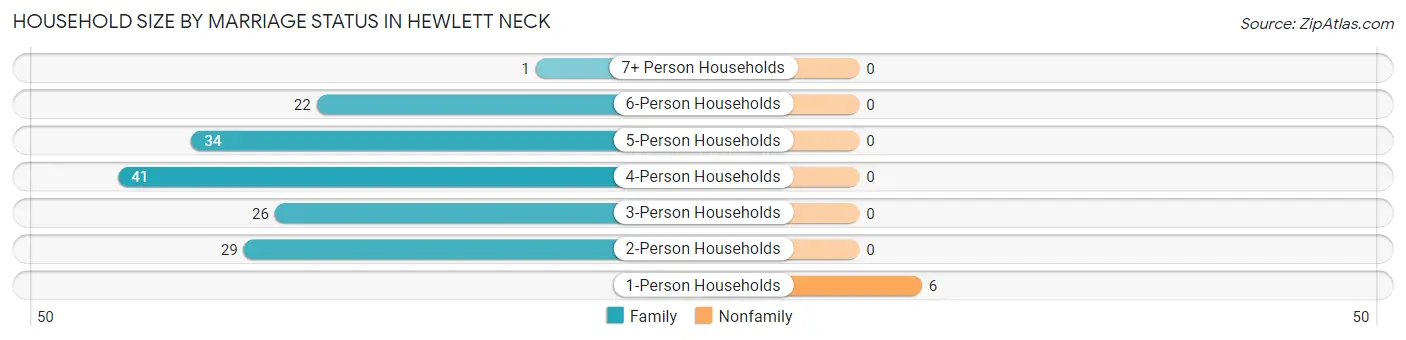
| Household Size | Family Households | Nonfamily Households |
| 1-Person Households | - | 6 (3.8%) |
| 2-Person Households | 29 (18.2%) | 0 (0.0%) |
| 3-Person Households | 26 (16.4%) | 0 (0.0%) |
| 4-Person Households | 41 (25.8%) | 0 (0.0%) |
| 5-Person Households | 34 (21.4%) | 0 (0.0%) |
| 6-Person Households | 22 (13.8%) | 0 (0.0%) |
| 7+ Person Households | 1 (0.6%) | 0 (0.0%) |
| Total | 153 (96.2%) | 6 (3.8%) |
Female Fertility in Hewlett Neck
Fertility by Age in Hewlett Neck
Average fertility rate in Hewlett Neck is 13.0 births per 1,000 women. Women in the age bracket of 20 to 34 years have the highest fertility rate with 23.0 births per 1,000 women. Women in the age bracket of 20 to 34 years acount for 50.0% of all women with births.
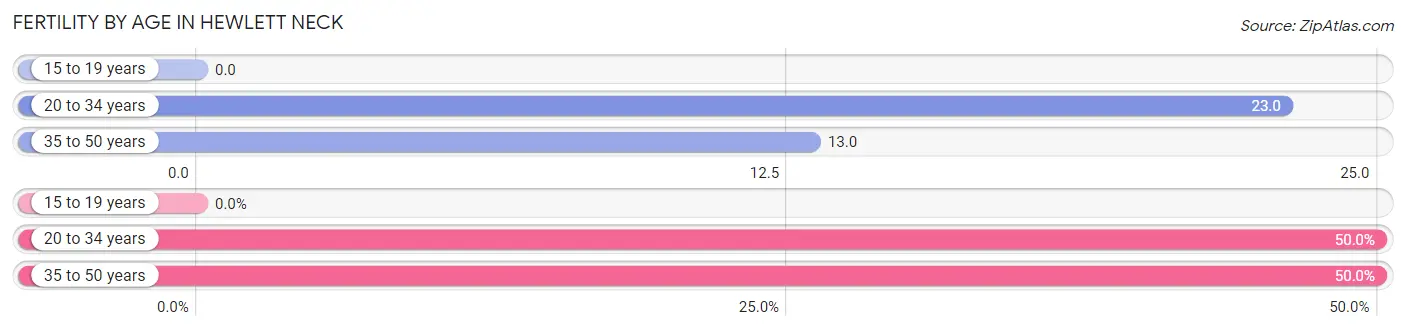
| Age Bracket | Women with Births | Births / 1,000 Women |
| 15 to 19 years | 0 (0.0%) | 0.0 |
| 20 to 34 years | 1 (50.0%) | 23.0 |
| 35 to 50 years | 1 (50.0%) | 13.0 |
| Total | 2 (100.0%) | 13.0 |
Fertility by Age by Marriage Status in Hewlett Neck
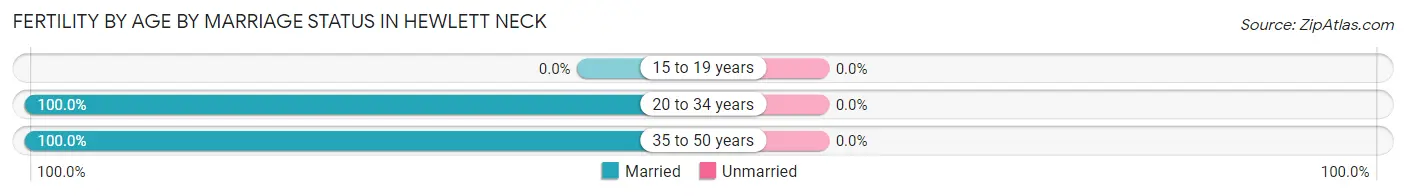
| Age Bracket | Married | Unmarried |
| 15 to 19 years | 0 (0.0%) | 0 (0.0%) |
| 20 to 34 years | 1 (100.0%) | 0 (0.0%) |
| 35 to 50 years | 1 (100.0%) | 0 (0.0%) |
| Total | 2 (100.0%) | 0 (0.0%) |
Fertility by Education in Hewlett Neck
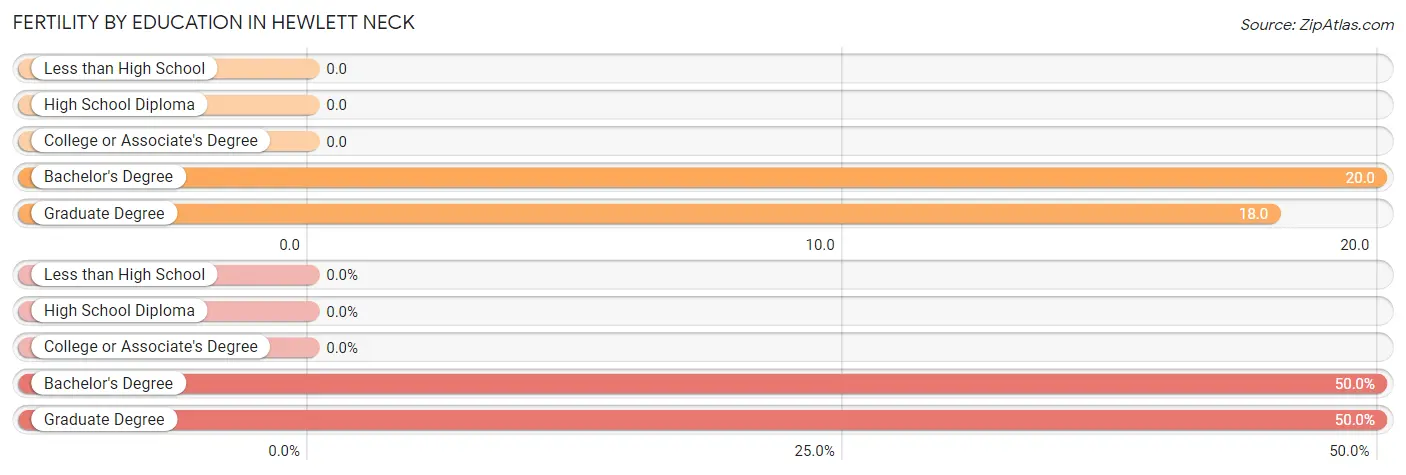
| Educational Attainment | Women with Births | Births / 1,000 Women |
| Less than High School | 0 (0.0%) | 0.0 |
| High School Diploma | 0 (0.0%) | 0.0 |
| College or Associate's Degree | 0 (0.0%) | 0.0 |
| Bachelor's Degree | 1 (50.0%) | 20.0 |
| Graduate Degree | 1 (50.0%) | 18.0 |
| Total | 2 (100.0%) | 13.0 |
Fertility by Education by Marriage Status in Hewlett Neck
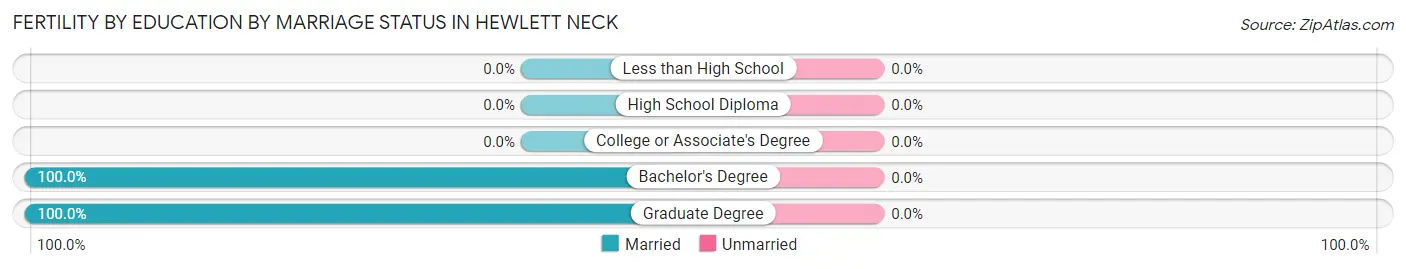
| Educational Attainment | Married | Unmarried |
| Less than High School | 0 (0.0%) | 0 (0.0%) |
| High School Diploma | 0 (0.0%) | 0 (0.0%) |
| College or Associate's Degree | 0 (0.0%) | 0 (0.0%) |
| Bachelor's Degree | 1 (100.0%) | 0 (0.0%) |
| Graduate Degree | 1 (100.0%) | 0 (0.0%) |
| Total | 2 (100.0%) | 0 (0.0%) |
Employment Characteristics in Hewlett Neck
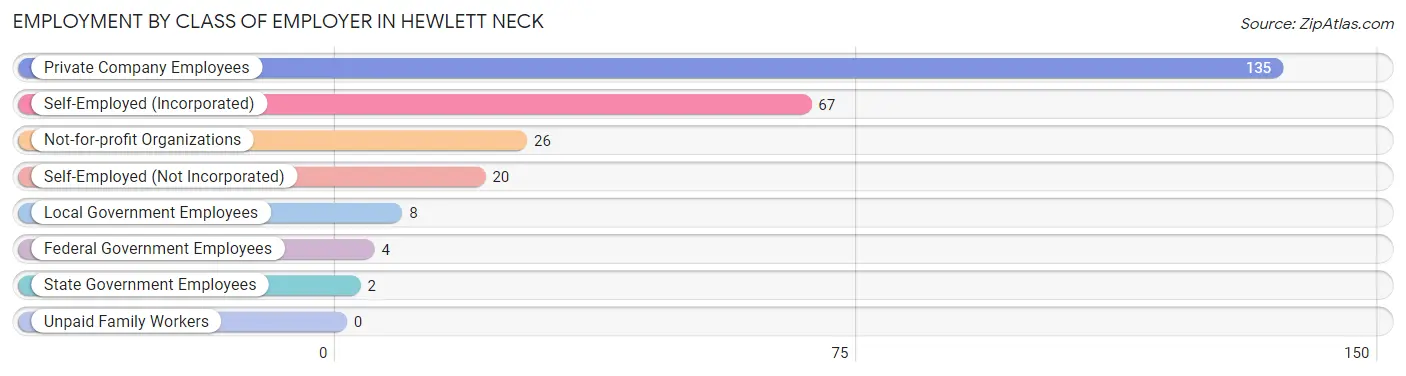
Employment by Class of Employer in Hewlett Neck
Among the 262 employed individuals in Hewlett Neck, private company employees (135 | 51.5%), self-employed (incorporated) (67 | 25.6%), and not-for-profit organizations (26 | 9.9%) make up the most common classes of employment.
| Employer Class | # Employees | % Employees |
| Private Company Employees | 135 | 51.5% |
| Self-Employed (Incorporated) | 67 | 25.6% |
| Self-Employed (Not Incorporated) | 20 | 7.6% |
| Not-for-profit Organizations | 26 | 9.9% |
| Local Government Employees | 8 | 3.0% |
| State Government Employees | 2 | 0.8% |
| Federal Government Employees | 4 | 1.5% |
| Unpaid Family Workers | 0 | 0.0% |
| Total | 262 | 100.0% |
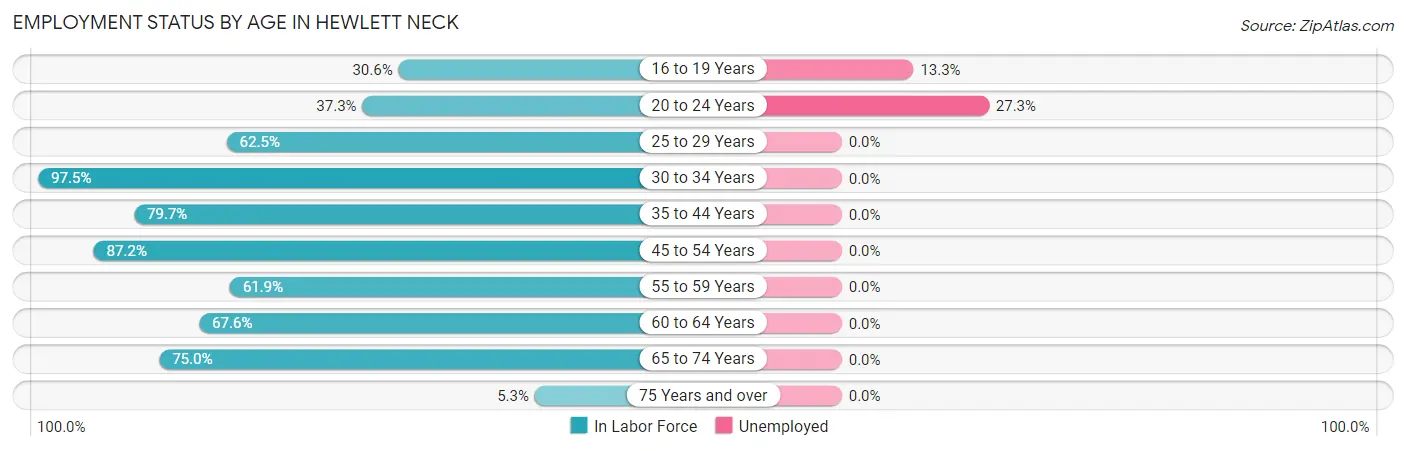
Employment Status by Age in Hewlett Neck
According to the labor force statistics for Hewlett Neck, out of the total population over 16 years of age (441), 65.5% or 289 individuals are in the labor force, with 2.8% or 8 of them unemployed. The age group with the highest labor force participation rate is 30 to 34 years, with 97.5% or 39 individuals in the labor force. Within the labor force, the 20 to 24 years age range has the highest percentage of unemployed individuals, with 27.3% or 6 of them being unemployed.
| Age Bracket | In Labor Force | Unemployed |
| 16 to 19 Years | 15 (30.6%) | 2 (13.3%) |
| 20 to 24 Years | 22 (37.3%) | 6 (27.3%) |
| 25 to 29 Years | 15 (62.5%) | 0 (0.0%) |
| 30 to 34 Years | 39 (97.5%) | 0 (0.0%) |
| 35 to 44 Years | 59 (79.7%) | 0 (0.0%) |
| 45 to 54 Years | 82 (87.2%) | 0 (0.0%) |
| 55 to 59 Years | 13 (61.9%) | 0 (0.0%) |
| 60 to 64 Years | 25 (67.6%) | 0 (0.0%) |
| 65 to 74 Years | 18 (75.0%) | 0 (0.0%) |
| 75 Years and over | 1 (5.3%) | 0 (0.0%) |
| Total | 289 (65.5%) | 8 (2.8%) |
Employment Status by Educational Attainment in Hewlett Neck
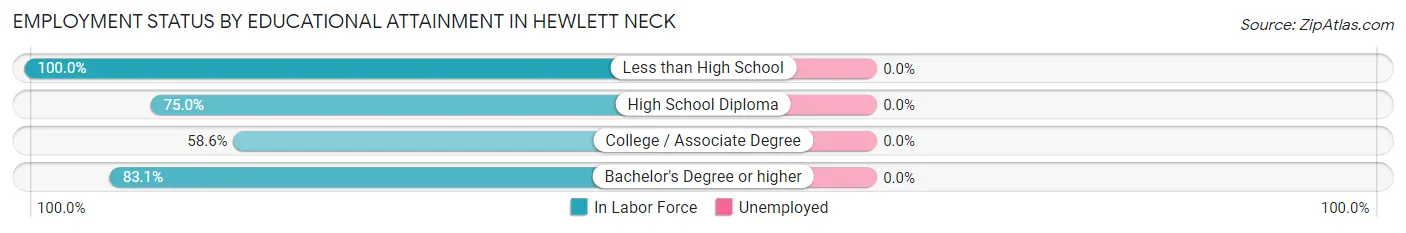
| Educational Attainment | In Labor Force | Unemployed |
| Less than High School | 3 (100.0%) | 0 (0.0%) |
| High School Diploma | 12 (75.0%) | 0 (0.0%) |
| College / Associate Degree | 17 (58.6%) | 0 (0.0%) |
| Bachelor's Degree or higher | 201 (83.1%) | 0 (0.0%) |
| Total | 233 (80.3%) | 0 (0.0%) |
Employment Occupations by Sex in Hewlett Neck
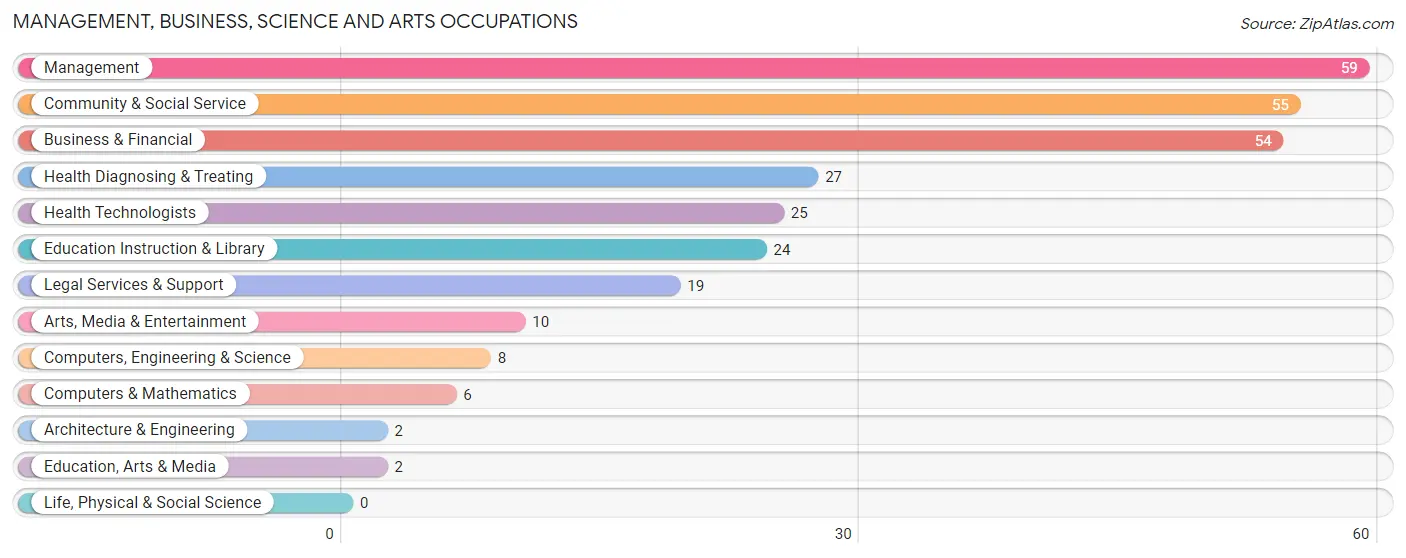
Management, Business, Science and Arts Occupations
The most common Management, Business, Science and Arts occupations in Hewlett Neck are Management (59 | 21.0%), Community & Social Service (55 | 19.6%), Business & Financial (54 | 19.2%), Health Diagnosing & Treating (27 | 9.6%), and Health Technologists (25 | 8.9%).
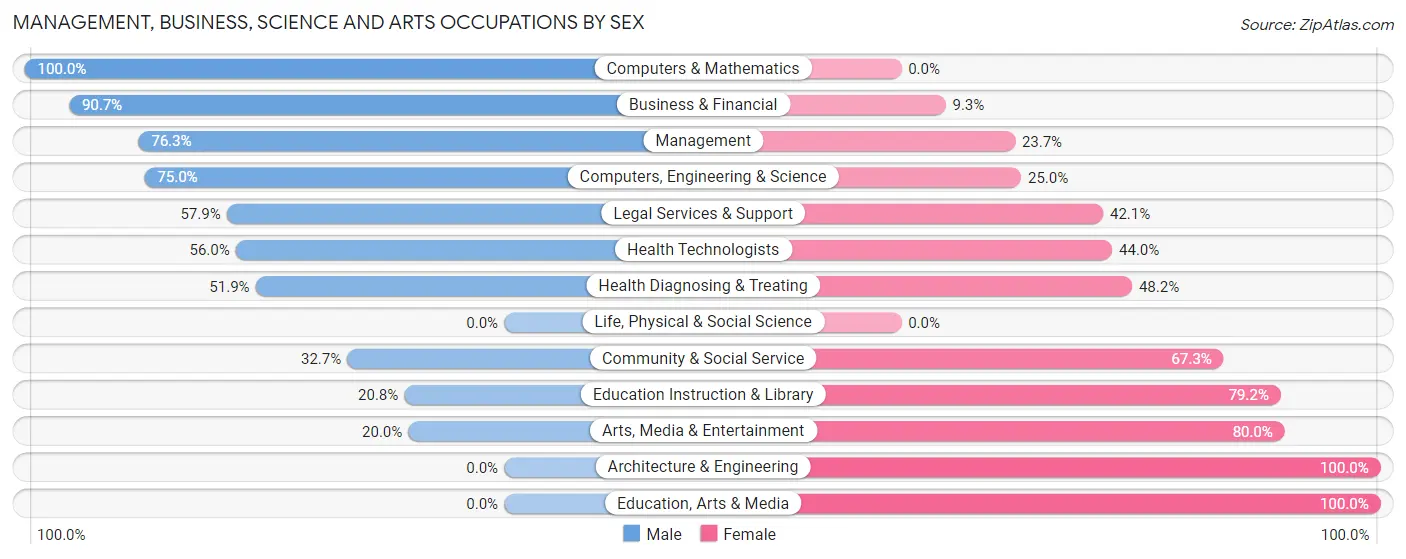
Management, Business, Science and Arts Occupations by Sex
Within the Management, Business, Science and Arts occupations in Hewlett Neck, the most male-oriented occupations are Computers & Mathematics (100.0%), Business & Financial (90.7%), and Management (76.3%), while the most female-oriented occupations are Architecture & Engineering (100.0%), Education, Arts & Media (100.0%), and Arts, Media & Entertainment (80.0%).
| Occupation | Male | Female |
| Management | 45 (76.3%) | 14 (23.7%) |
| Business & Financial | 49 (90.7%) | 5 (9.3%) |
| Computers, Engineering & Science | 6 (75.0%) | 2 (25.0%) |
| Computers & Mathematics | 6 (100.0%) | 0 (0.0%) |
| Architecture & Engineering | 0 (0.0%) | 2 (100.0%) |
| Life, Physical & Social Science | 0 (0.0%) | 0 (0.0%) |
| Community & Social Service | 18 (32.7%) | 37 (67.3%) |
| Education, Arts & Media | 0 (0.0%) | 2 (100.0%) |
| Legal Services & Support | 11 (57.9%) | 8 (42.1%) |
| Education Instruction & Library | 5 (20.8%) | 19 (79.2%) |
| Arts, Media & Entertainment | 2 (20.0%) | 8 (80.0%) |
| Health Diagnosing & Treating | 14 (51.8%) | 13 (48.1%) |
| Health Technologists | 14 (56.0%) | 11 (44.0%) |
| Total (Category) | 132 (65.0%) | 71 (35.0%) |
| Total (Overall) | 164 (58.4%) | 117 (41.6%) |
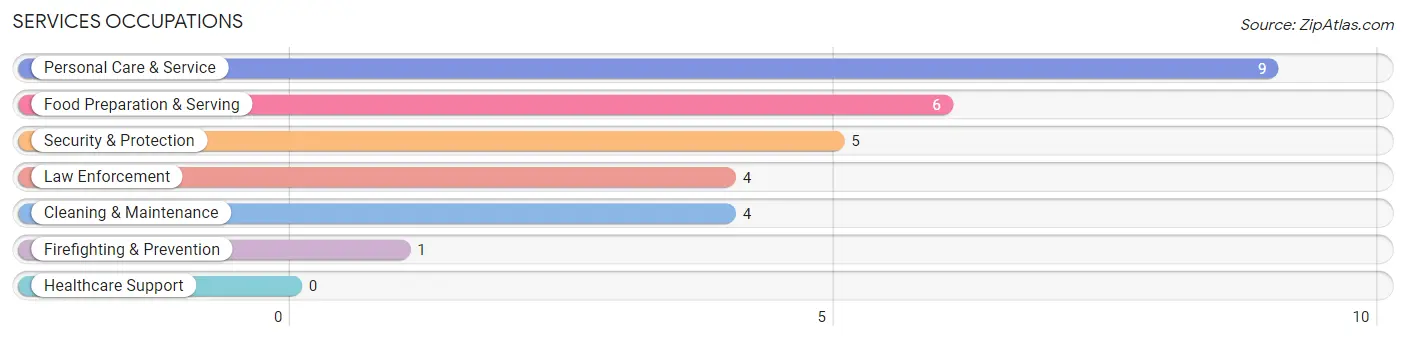
Services Occupations
The most common Services occupations in Hewlett Neck are Personal Care & Service (9 | 3.2%), Food Preparation & Serving (6 | 2.1%), Security & Protection (5 | 1.8%), Law Enforcement (4 | 1.4%), and Cleaning & Maintenance (4 | 1.4%).
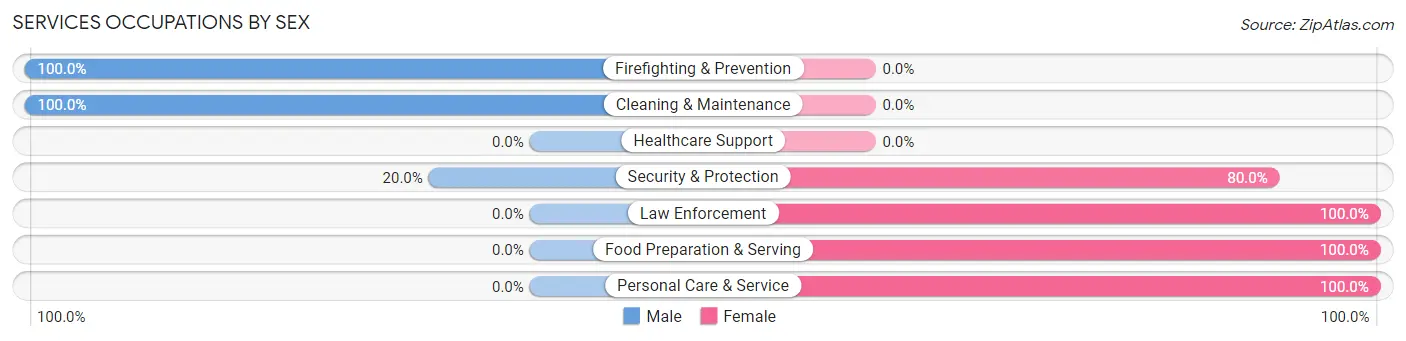
Services Occupations by Sex
Within the Services occupations in Hewlett Neck, the most male-oriented occupations are Firefighting & Prevention (100.0%), Cleaning & Maintenance (100.0%), and Security & Protection (20.0%), while the most female-oriented occupations are Law Enforcement (100.0%), Food Preparation & Serving (100.0%), and Personal Care & Service (100.0%).
| Occupation | Male | Female |
| Healthcare Support | 0 (0.0%) | 0 (0.0%) |
| Security & Protection | 1 (20.0%) | 4 (80.0%) |
| Firefighting & Prevention | 1 (100.0%) | 0 (0.0%) |
| Law Enforcement | 0 (0.0%) | 4 (100.0%) |
| Food Preparation & Serving | 0 (0.0%) | 6 (100.0%) |
| Cleaning & Maintenance | 4 (100.0%) | 0 (0.0%) |
| Personal Care & Service | 0 (0.0%) | 9 (100.0%) |
| Total (Category) | 5 (20.8%) | 19 (79.2%) |
| Total (Overall) | 164 (58.4%) | 117 (41.6%) |
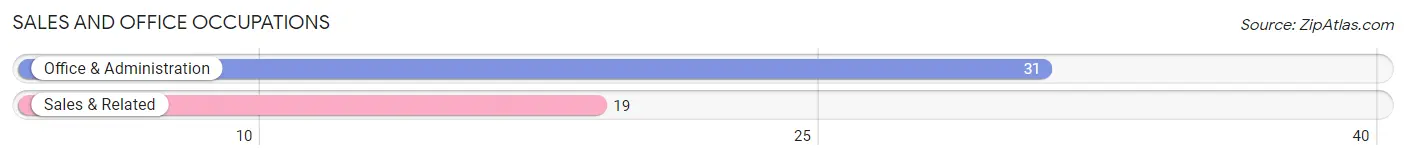
Sales and Office Occupations
The most common Sales and Office occupations in Hewlett Neck are Office & Administration (31 | 11.0%), and Sales & Related (19 | 6.8%).
Sales and Office Occupations by Sex
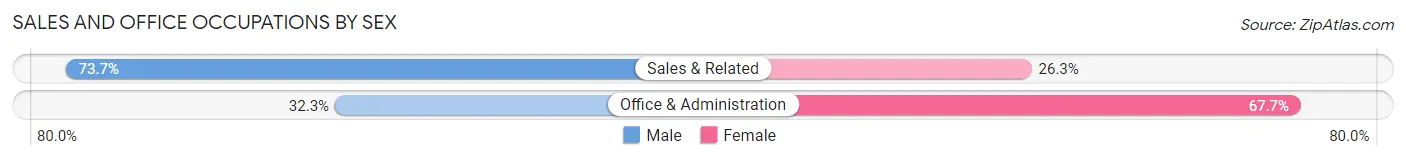
| Occupation | Male | Female |
| Sales & Related | 14 (73.7%) | 5 (26.3%) |
| Office & Administration | 10 (32.3%) | 21 (67.7%) |
| Total (Category) | 24 (48.0%) | 26 (52.0%) |
| Total (Overall) | 164 (58.4%) | 117 (41.6%) |
Natural Resources, Construction and Maintenance Occupations
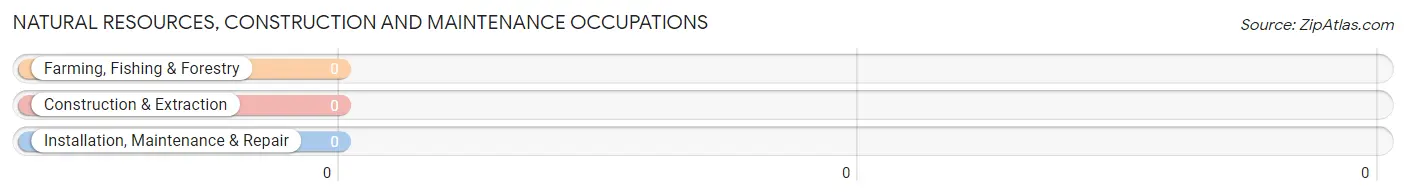
Natural Resources, Construction and Maintenance Occupations by Sex
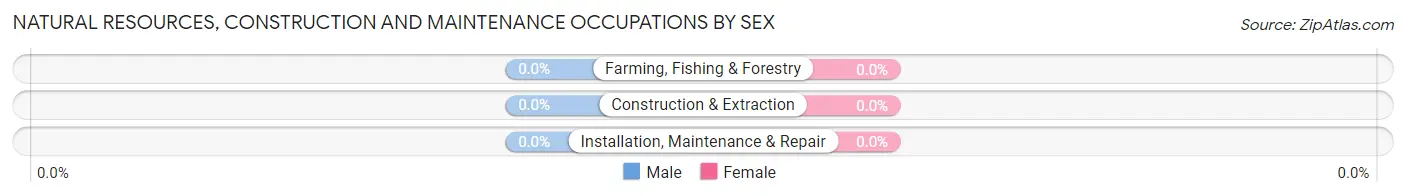
| Occupation | Male | Female |
| Farming, Fishing & Forestry | 0 (0.0%) | 0 (0.0%) |
| Construction & Extraction | 0 (0.0%) | 0 (0.0%) |
| Installation, Maintenance & Repair | 0 (0.0%) | 0 (0.0%) |
| Total (Category) | 0 (0.0%) | 0 (0.0%) |
| Total (Overall) | 164 (58.4%) | 117 (41.6%) |
Production, Transportation and Moving Occupations
The most common Production, Transportation and Moving occupations in Hewlett Neck are , and Material Moving (4 | 1.4%).
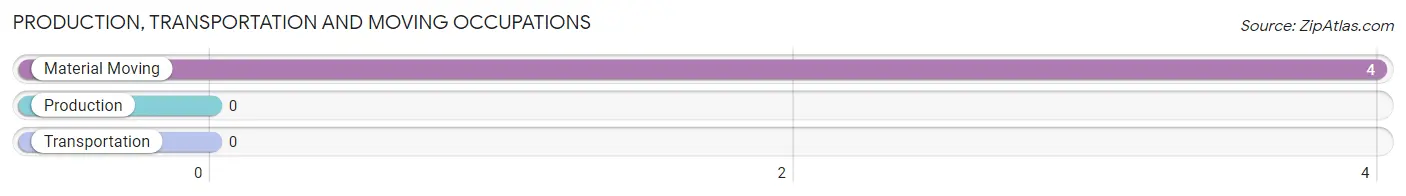
Production, Transportation and Moving Occupations by Sex
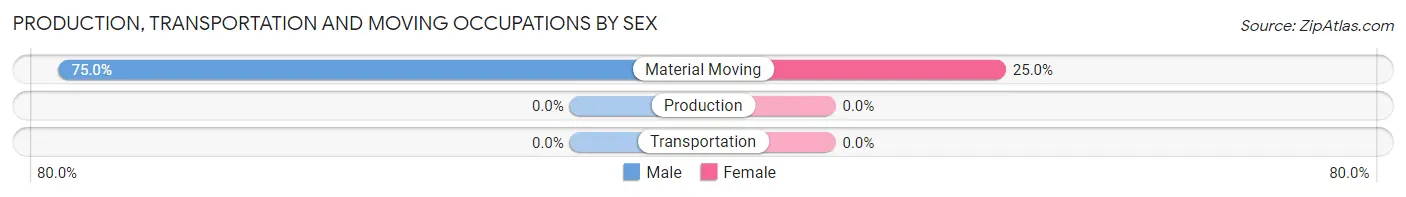
| Occupation | Male | Female |
| Production | 0 (0.0%) | 0 (0.0%) |
| Transportation | 0 (0.0%) | 0 (0.0%) |
| Material Moving | 3 (75.0%) | 1 (25.0%) |
| Total (Category) | 3 (75.0%) | 1 (25.0%) |
| Total (Overall) | 164 (58.4%) | 117 (41.6%) |
Employment Industries by Sex in Hewlett Neck
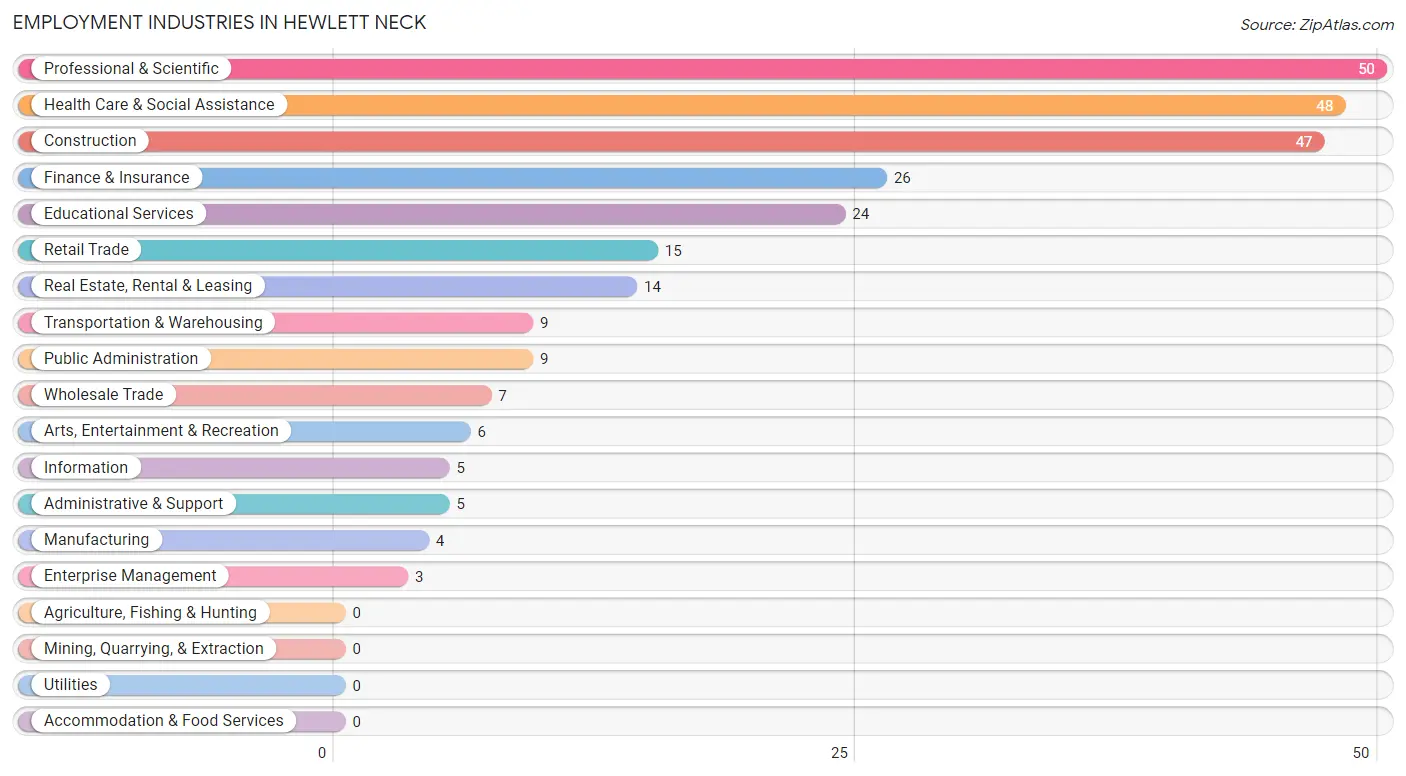
Employment Industries in Hewlett Neck
The major employment industries in Hewlett Neck include Professional & Scientific (50 | 17.8%), Health Care & Social Assistance (48 | 17.1%), Construction (47 | 16.7%), Finance & Insurance (26 | 9.2%), and Educational Services (24 | 8.5%).
Employment Industries by Sex in Hewlett Neck
The Hewlett Neck industries that see more men than women are Information (100.0%), Finance & Insurance (100.0%), and Enterprise Management (100.0%), whereas the industries that tend to have a higher number of women are Transportation & Warehousing (100.0%), Public Administration (100.0%), and Educational Services (79.2%).
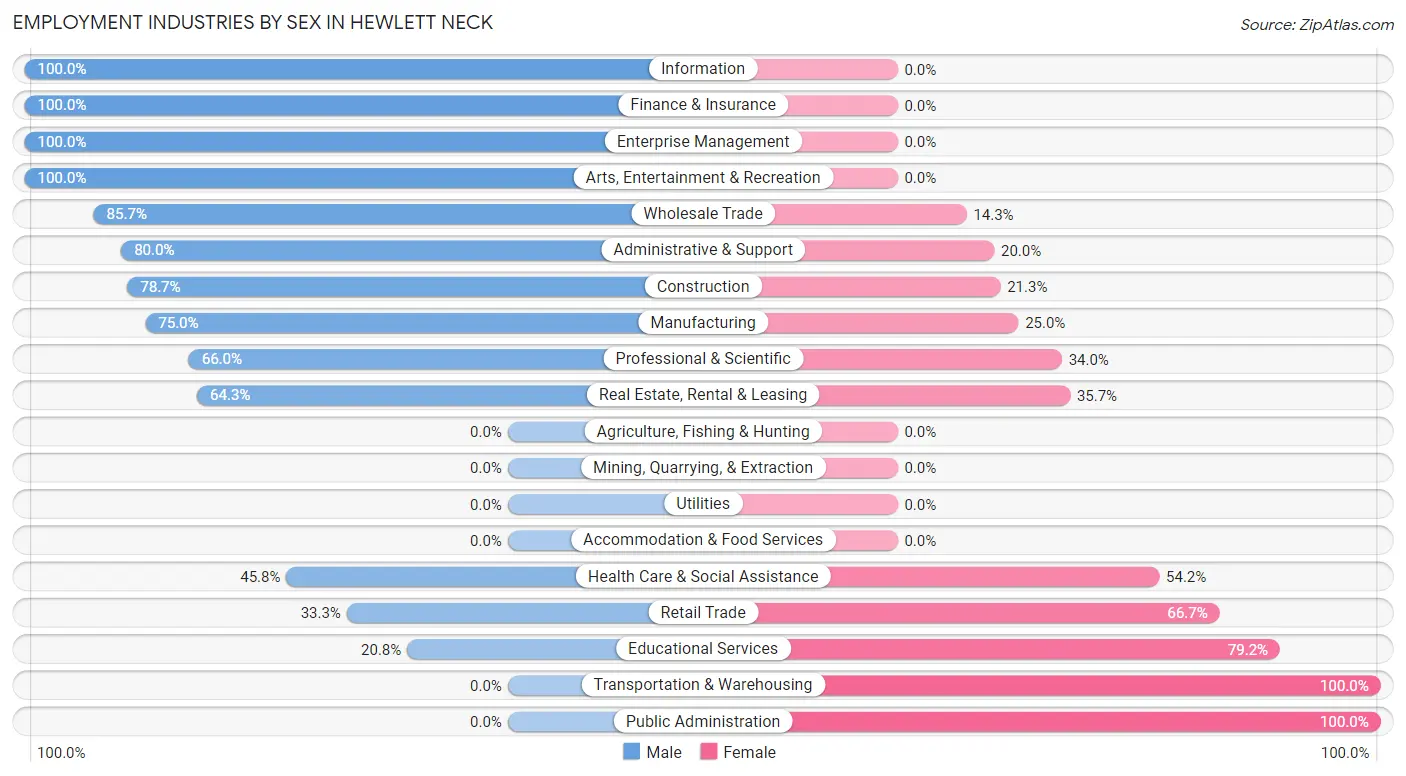
| Industry | Male | Female |
| Agriculture, Fishing & Hunting | 0 (0.0%) | 0 (0.0%) |
| Mining, Quarrying, & Extraction | 0 (0.0%) | 0 (0.0%) |
| Construction | 37 (78.7%) | 10 (21.3%) |
| Manufacturing | 3 (75.0%) | 1 (25.0%) |
| Wholesale Trade | 6 (85.7%) | 1 (14.3%) |
| Retail Trade | 5 (33.3%) | 10 (66.7%) |
| Transportation & Warehousing | 0 (0.0%) | 9 (100.0%) |
| Utilities | 0 (0.0%) | 0 (0.0%) |
| Information | 5 (100.0%) | 0 (0.0%) |
| Finance & Insurance | 26 (100.0%) | 0 (0.0%) |
| Real Estate, Rental & Leasing | 9 (64.3%) | 5 (35.7%) |
| Professional & Scientific | 33 (66.0%) | 17 (34.0%) |
| Enterprise Management | 3 (100.0%) | 0 (0.0%) |
| Administrative & Support | 4 (80.0%) | 1 (20.0%) |
| Educational Services | 5 (20.8%) | 19 (79.2%) |
| Health Care & Social Assistance | 22 (45.8%) | 26 (54.2%) |
| Arts, Entertainment & Recreation | 6 (100.0%) | 0 (0.0%) |
| Accommodation & Food Services | 0 (0.0%) | 0 (0.0%) |
| Public Administration | 0 (0.0%) | 9 (100.0%) |
| Total | 164 (58.4%) | 117 (41.6%) |
Education in Hewlett Neck
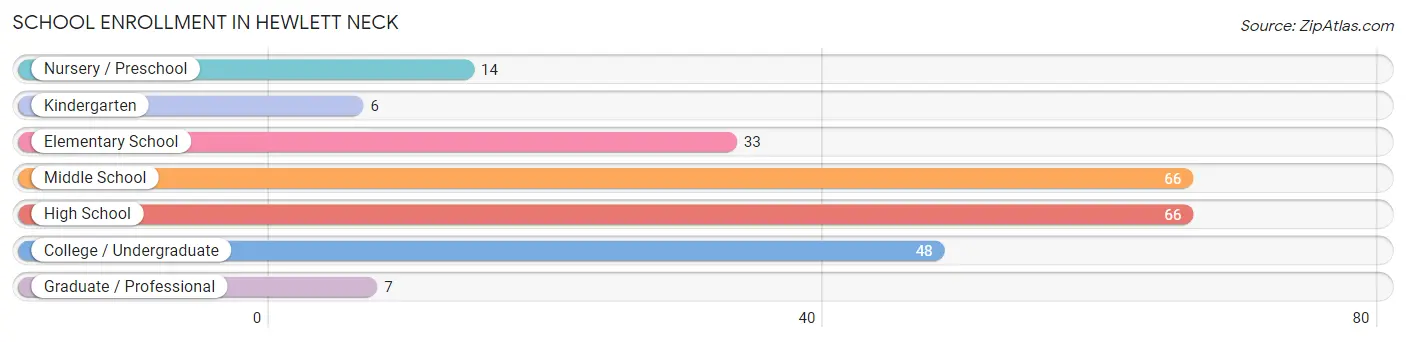
School Enrollment in Hewlett Neck
The most common levels of schooling among the 240 students in Hewlett Neck are middle school (66 | 27.5%), high school (66 | 27.5%), and college / undergraduate (48 | 20.0%).
| School Level | # Students | % Students |
| Nursery / Preschool | 14 | 5.8% |
| Kindergarten | 6 | 2.5% |
| Elementary School | 33 | 13.8% |
| Middle School | 66 | 27.5% |
| High School | 66 | 27.5% |
| College / Undergraduate | 48 | 20.0% |
| Graduate / Professional | 7 | 2.9% |
| Total | 240 | 100.0% |
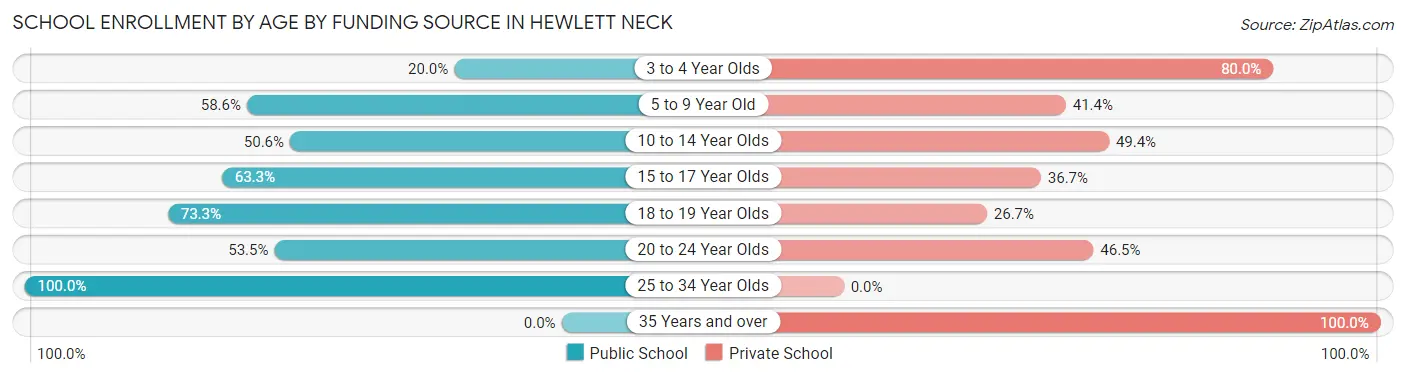
School Enrollment by Age by Funding Source in Hewlett Neck
Out of a total of 240 students who are enrolled in schools in Hewlett Neck, 111 (46.3%) attend a private institution, while the remaining 129 (53.7%) are enrolled in public schools. The age group of 35 years and over has the highest likelihood of being enrolled in private schools, with 3 (100.0% in the age bracket) enrolled. Conversely, the age group of 25 to 34 year olds has the lowest likelihood of being enrolled in a private school, with 1 (100.0% in the age bracket) attending a public institution.
| Age Bracket | Public School | Private School |
| 3 to 4 Year Olds | 3 (20.0%) | 12 (80.0%) |
| 5 to 9 Year Old | 17 (58.6%) | 12 (41.4%) |
| 10 to 14 Year Olds | 43 (50.6%) | 42 (49.4%) |
| 15 to 17 Year Olds | 31 (63.3%) | 18 (36.7%) |
| 18 to 19 Year Olds | 11 (73.3%) | 4 (26.7%) |
| 20 to 24 Year Olds | 23 (53.5%) | 20 (46.5%) |
| 25 to 34 Year Olds | 1 (100.0%) | 0 (0.0%) |
| 35 Years and over | 0 (0.0%) | 3 (100.0%) |
| Total | 129 (53.8%) | 111 (46.3%) |
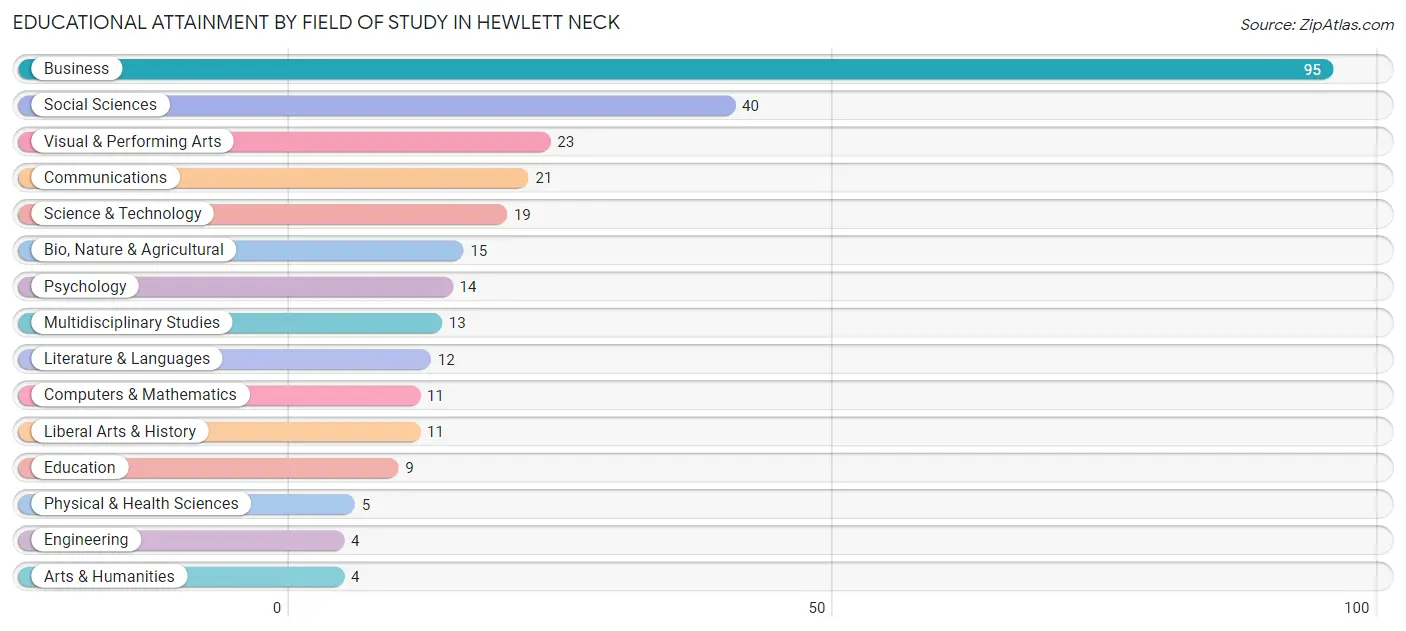
Educational Attainment by Field of Study in Hewlett Neck
Business (95 | 32.1%), social sciences (40 | 13.5%), visual & performing arts (23 | 7.8%), communications (21 | 7.1%), and science & technology (19 | 6.4%) are the most common fields of study among 296 individuals in Hewlett Neck who have obtained a bachelor's degree or higher.
| Field of Study | # Graduates | % Graduates |
| Computers & Mathematics | 11 | 3.7% |
| Bio, Nature & Agricultural | 15 | 5.1% |
| Physical & Health Sciences | 5 | 1.7% |
| Psychology | 14 | 4.7% |
| Social Sciences | 40 | 13.5% |
| Engineering | 4 | 1.3% |
| Multidisciplinary Studies | 13 | 4.4% |
| Science & Technology | 19 | 6.4% |
| Business | 95 | 32.1% |
| Education | 9 | 3.0% |
| Literature & Languages | 12 | 4.1% |
| Liberal Arts & History | 11 | 3.7% |
| Visual & Performing Arts | 23 | 7.8% |
| Communications | 21 | 7.1% |
| Arts & Humanities | 4 | 1.3% |
| Total | 296 | 100.0% |
Transportation & Commute in Hewlett Neck
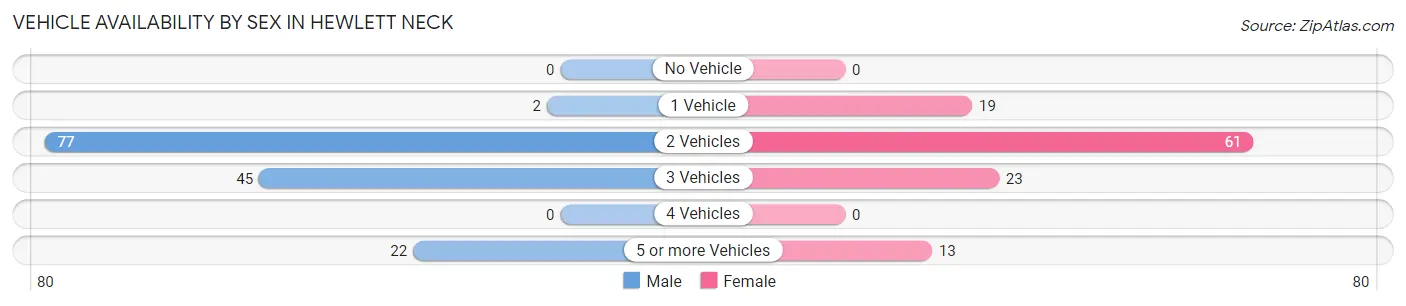
Vehicle Availability by Sex in Hewlett Neck
The most prevalent vehicle ownership categories in Hewlett Neck are males with 2 vehicles (77, accounting for 52.7%) and females with 2 vehicles (61, making up 66.4%).
| Vehicles Available | Male | Female |
| No Vehicle | 0 (0.0%) | 0 (0.0%) |
| 1 Vehicle | 2 (1.4%) | 19 (16.4%) |
| 2 Vehicles | 77 (52.7%) | 61 (52.6%) |
| 3 Vehicles | 45 (30.8%) | 23 (19.8%) |
| 4 Vehicles | 0 (0.0%) | 0 (0.0%) |
| 5 or more Vehicles | 22 (15.1%) | 13 (11.2%) |
| Total | 146 (100.0%) | 116 (100.0%) |
Commute Time in Hewlett Neck
The most frequently occuring commute durations in Hewlett Neck are 60 to 89 minutes (52 commuters, 25.7%), 10 to 14 minutes (40 commuters, 19.8%), and 45 to 59 minutes (31 commuters, 15.3%).
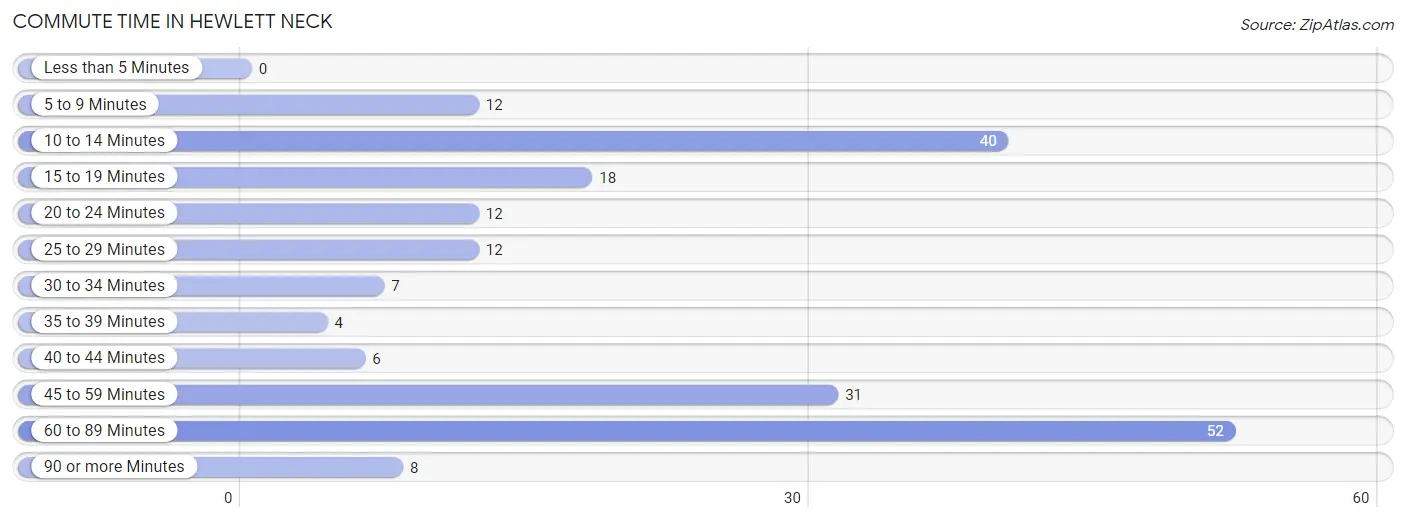
| Commute Time | # Commuters | % Commuters |
| Less than 5 Minutes | 0 | 0.0% |
| 5 to 9 Minutes | 12 | 5.9% |
| 10 to 14 Minutes | 40 | 19.8% |
| 15 to 19 Minutes | 18 | 8.9% |
| 20 to 24 Minutes | 12 | 5.9% |
| 25 to 29 Minutes | 12 | 5.9% |
| 30 to 34 Minutes | 7 | 3.5% |
| 35 to 39 Minutes | 4 | 2.0% |
| 40 to 44 Minutes | 6 | 3.0% |
| 45 to 59 Minutes | 31 | 15.3% |
| 60 to 89 Minutes | 52 | 25.7% |
| 90 or more Minutes | 8 | 4.0% |
Commute Time by Sex in Hewlett Neck
The most common commute times in Hewlett Neck are 60 to 89 minutes (42 commuters, 33.1%) for males and 10 to 14 minutes (22 commuters, 29.3%) for females.
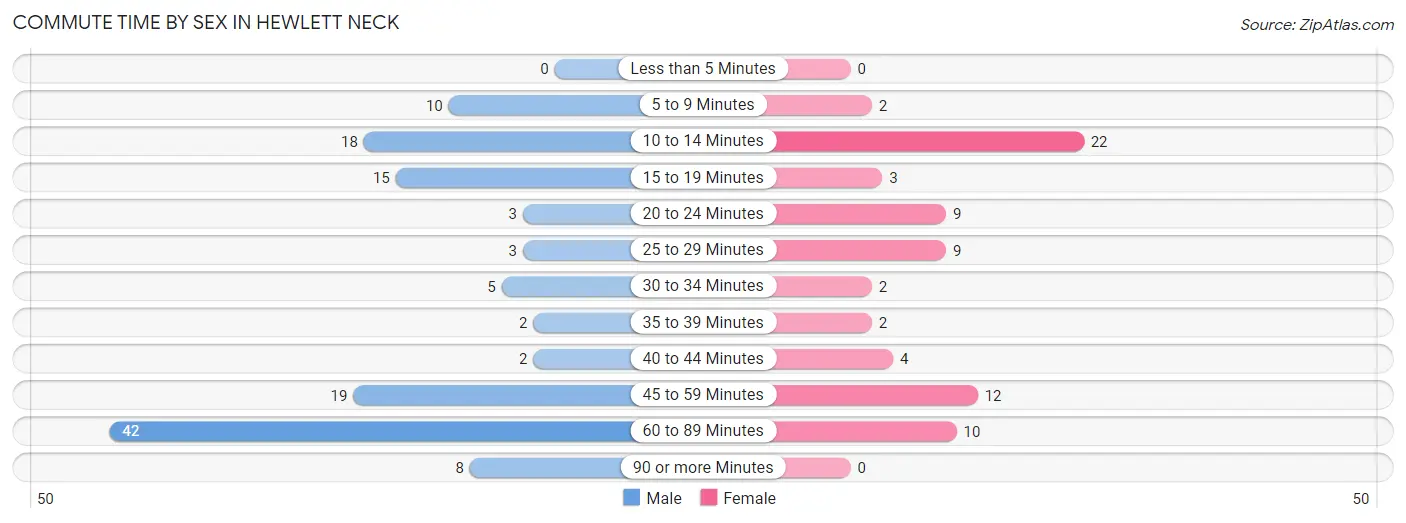
| Commute Time | Male | Female |
| Less than 5 Minutes | 0 (0.0%) | 0 (0.0%) |
| 5 to 9 Minutes | 10 (7.9%) | 2 (2.7%) |
| 10 to 14 Minutes | 18 (14.2%) | 22 (29.3%) |
| 15 to 19 Minutes | 15 (11.8%) | 3 (4.0%) |
| 20 to 24 Minutes | 3 (2.4%) | 9 (12.0%) |
| 25 to 29 Minutes | 3 (2.4%) | 9 (12.0%) |
| 30 to 34 Minutes | 5 (3.9%) | 2 (2.7%) |
| 35 to 39 Minutes | 2 (1.6%) | 2 (2.7%) |
| 40 to 44 Minutes | 2 (1.6%) | 4 (5.3%) |
| 45 to 59 Minutes | 19 (15.0%) | 12 (16.0%) |
| 60 to 89 Minutes | 42 (33.1%) | 10 (13.3%) |
| 90 or more Minutes | 8 (6.3%) | 0 (0.0%) |
Time of Departure to Work by Sex in Hewlett Neck
The most frequent times of departure to work in Hewlett Neck are 8:00 AM to 8:29 AM (34, 26.8%) for males and 8:30 AM to 8:59 AM (26, 34.7%) for females.
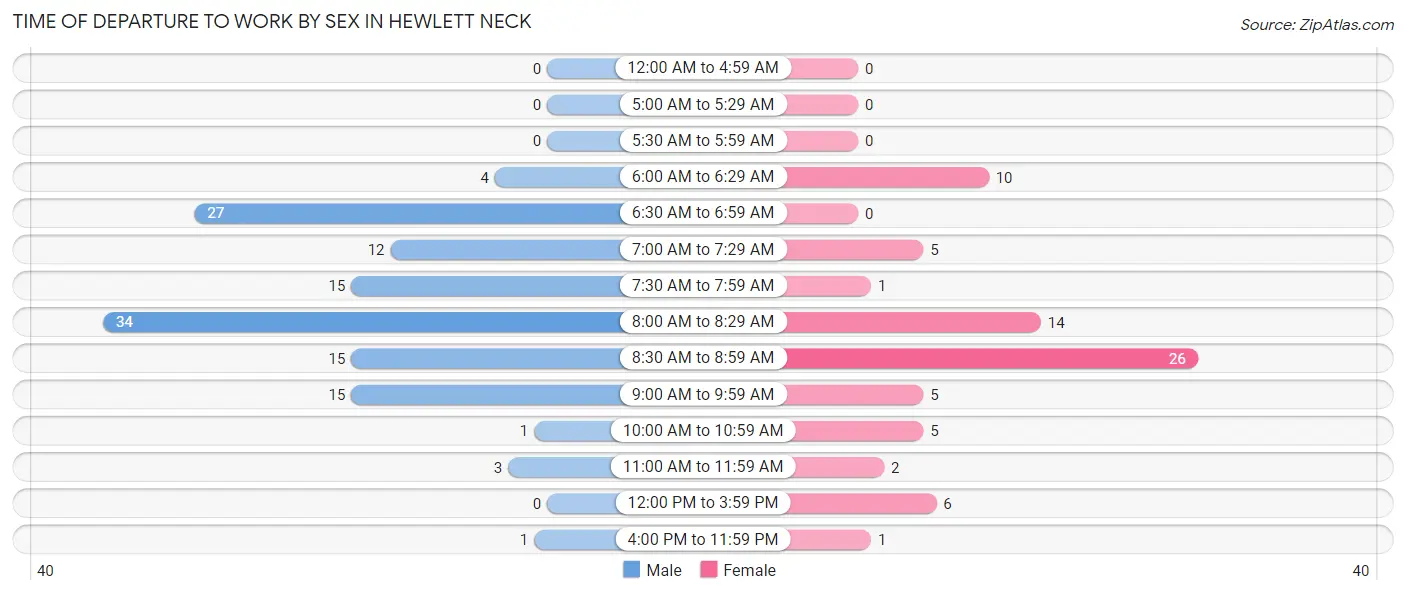
| Time of Departure | Male | Female |
| 12:00 AM to 4:59 AM | 0 (0.0%) | 0 (0.0%) |
| 5:00 AM to 5:29 AM | 0 (0.0%) | 0 (0.0%) |
| 5:30 AM to 5:59 AM | 0 (0.0%) | 0 (0.0%) |
| 6:00 AM to 6:29 AM | 4 (3.2%) | 10 (13.3%) |
| 6:30 AM to 6:59 AM | 27 (21.3%) | 0 (0.0%) |
| 7:00 AM to 7:29 AM | 12 (9.5%) | 5 (6.7%) |
| 7:30 AM to 7:59 AM | 15 (11.8%) | 1 (1.3%) |
| 8:00 AM to 8:29 AM | 34 (26.8%) | 14 (18.7%) |
| 8:30 AM to 8:59 AM | 15 (11.8%) | 26 (34.7%) |
| 9:00 AM to 9:59 AM | 15 (11.8%) | 5 (6.7%) |
| 10:00 AM to 10:59 AM | 1 (0.8%) | 5 (6.7%) |
| 11:00 AM to 11:59 AM | 3 (2.4%) | 2 (2.7%) |
| 12:00 PM to 3:59 PM | 0 (0.0%) | 6 (8.0%) |
| 4:00 PM to 11:59 PM | 1 (0.8%) | 1 (1.3%) |
| Total | 127 (100.0%) | 75 (100.0%) |
Housing Occupancy in Hewlett Neck
Occupancy by Ownership in Hewlett Neck
Of the total 159 dwellings in Hewlett Neck, owner-occupied units account for 151 (95.0%), while renter-occupied units make up 8 (5.0%).
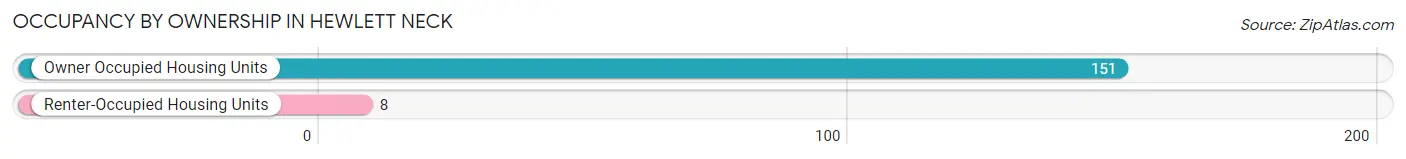
| Occupancy | # Housing Units | % Housing Units |
| Owner Occupied Housing Units | 151 | 95.0% |
| Renter-Occupied Housing Units | 8 | 5.0% |
| Total Occupied Housing Units | 159 | 100.0% |
Occupancy by Household Size in Hewlett Neck
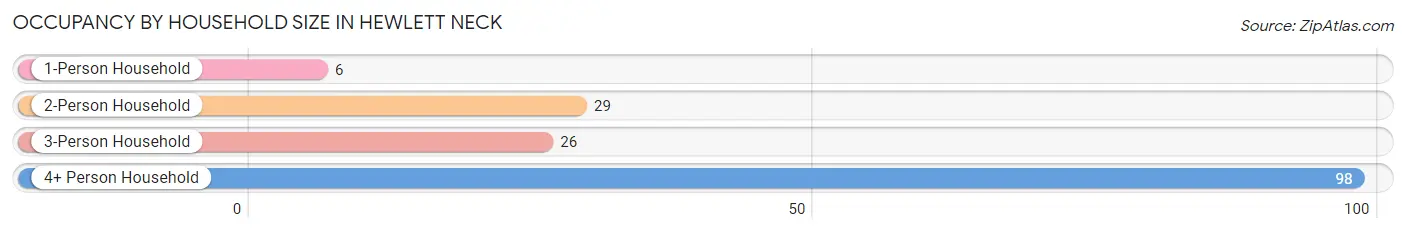
| Household Size | # Housing Units | % Housing Units |
| 1-Person Household | 6 | 3.8% |
| 2-Person Household | 29 | 18.2% |
| 3-Person Household | 26 | 16.4% |
| 4+ Person Household | 98 | 61.6% |
| Total Housing Units | 159 | 100.0% |
Occupancy by Ownership by Household Size in Hewlett Neck
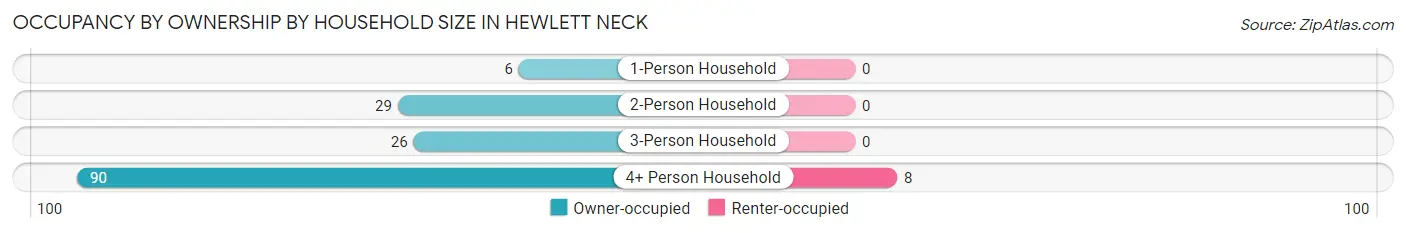
| Household Size | Owner-occupied | Renter-occupied |
| 1-Person Household | 6 (100.0%) | 0 (0.0%) |
| 2-Person Household | 29 (100.0%) | 0 (0.0%) |
| 3-Person Household | 26 (100.0%) | 0 (0.0%) |
| 4+ Person Household | 90 (91.8%) | 8 (8.2%) |
| Total Housing Units | 151 (95.0%) | 8 (5.0%) |
Occupancy by Educational Attainment in Hewlett Neck
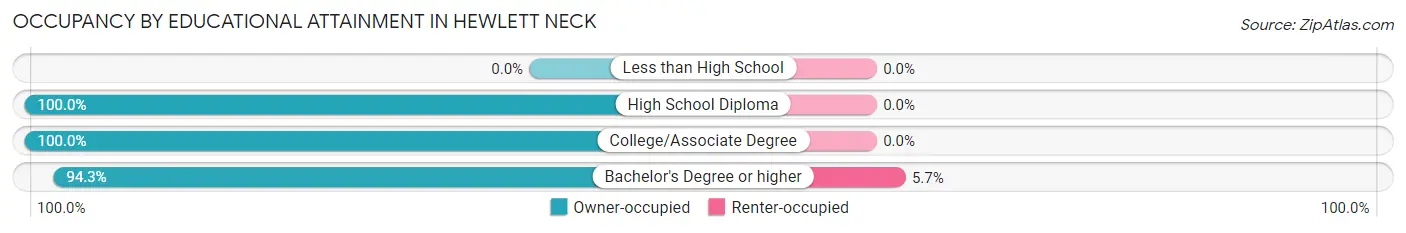
| Household Size | Owner-occupied | Renter-occupied |
| Less than High School | 0 (0.0%) | 0 (0.0%) |
| High School Diploma | 4 (100.0%) | 0 (0.0%) |
| College/Associate Degree | 15 (100.0%) | 0 (0.0%) |
| Bachelor's Degree or higher | 132 (94.3%) | 8 (5.7%) |
Occupancy by Age of Householder in Hewlett Neck
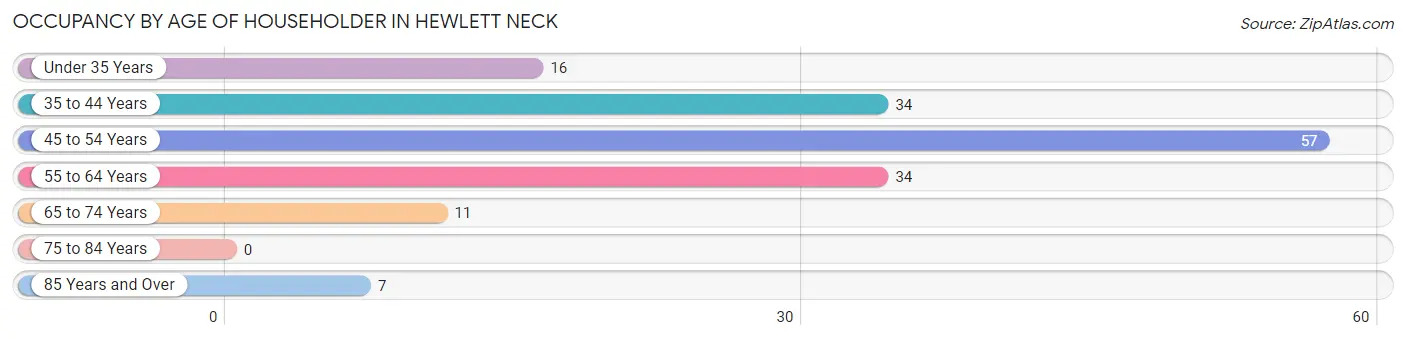
| Age Bracket | # Households | % Households |
| Under 35 Years | 16 | 10.1% |
| 35 to 44 Years | 34 | 21.4% |
| 45 to 54 Years | 57 | 35.8% |
| 55 to 64 Years | 34 | 21.4% |
| 65 to 74 Years | 11 | 6.9% |
| 75 to 84 Years | 0 | 0.0% |
| 85 Years and Over | 7 | 4.4% |
| Total | 159 | 100.0% |
Housing Finances in Hewlett Neck
Median Income by Occupancy in Hewlett Neck
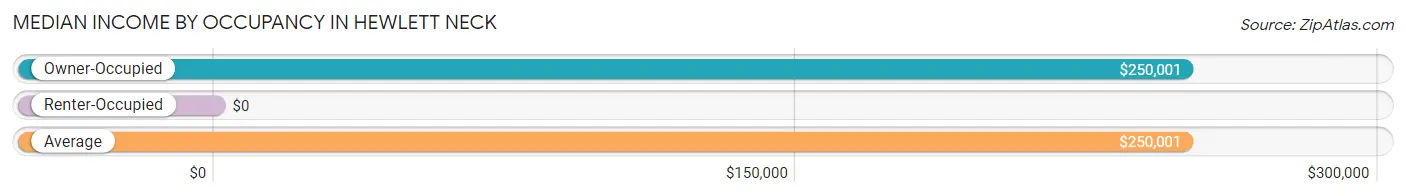
| Occupancy Type | # Households | Median Income |
| Owner-Occupied | 151 (95.0%) | $250,001 |
| Renter-Occupied | 8 (5.0%) | $0 |
| Average | 159 (100.0%) | $250,001 |
Occupancy by Householder Income Bracket in Hewlett Neck
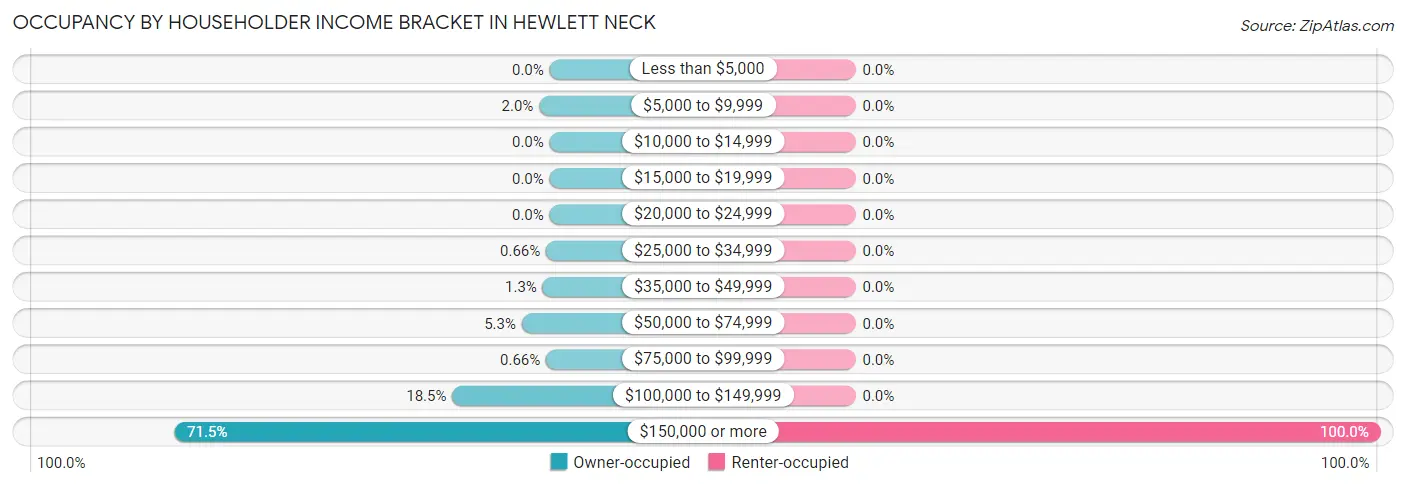
| Income Bracket | Owner-occupied | Renter-occupied |
| Less than $5,000 | 0 (0.0%) | 0 (0.0%) |
| $5,000 to $9,999 | 3 (2.0%) | 0 (0.0%) |
| $10,000 to $14,999 | 0 (0.0%) | 0 (0.0%) |
| $15,000 to $19,999 | 0 (0.0%) | 0 (0.0%) |
| $20,000 to $24,999 | 0 (0.0%) | 0 (0.0%) |
| $25,000 to $34,999 | 1 (0.7%) | 0 (0.0%) |
| $35,000 to $49,999 | 2 (1.3%) | 0 (0.0%) |
| $50,000 to $74,999 | 8 (5.3%) | 0 (0.0%) |
| $75,000 to $99,999 | 1 (0.7%) | 0 (0.0%) |
| $100,000 to $149,999 | 28 (18.5%) | 0 (0.0%) |
| $150,000 or more | 108 (71.5%) | 8 (100.0%) |
| Total | 151 (100.0%) | 8 (100.0%) |
Monthly Housing Cost Tiers in Hewlett Neck
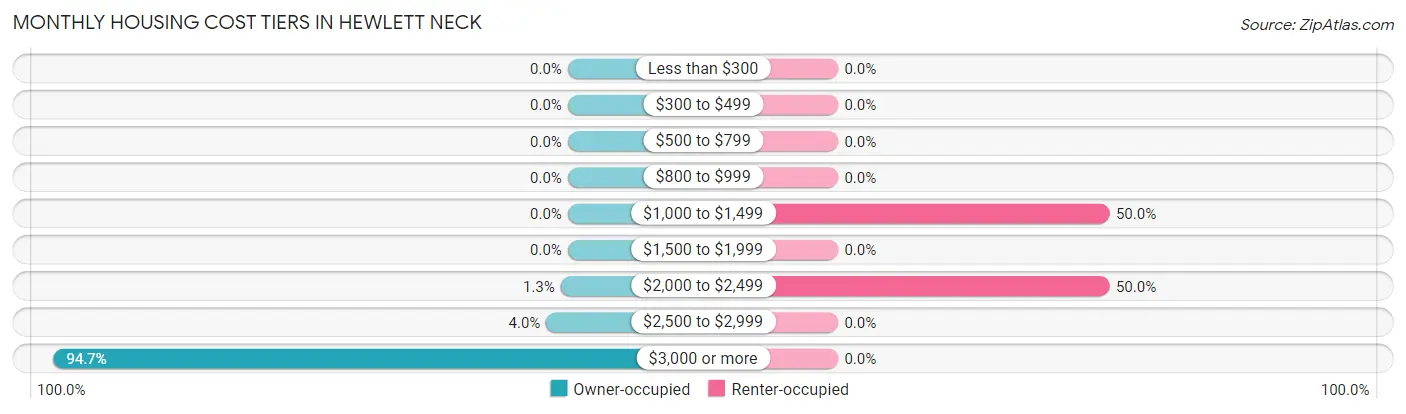
| Monthly Cost | Owner-occupied | Renter-occupied |
| Less than $300 | 0 (0.0%) | 0 (0.0%) |
| $300 to $499 | 0 (0.0%) | 0 (0.0%) |
| $500 to $799 | 0 (0.0%) | 0 (0.0%) |
| $800 to $999 | 0 (0.0%) | 0 (0.0%) |
| $1,000 to $1,499 | 0 (0.0%) | 4 (50.0%) |
| $1,500 to $1,999 | 0 (0.0%) | 0 (0.0%) |
| $2,000 to $2,499 | 2 (1.3%) | 4 (50.0%) |
| $2,500 to $2,999 | 6 (4.0%) | 0 (0.0%) |
| $3,000 or more | 143 (94.7%) | 0 (0.0%) |
| Total | 151 (100.0%) | 8 (100.0%) |
Physical Housing Characteristics in Hewlett Neck
Housing Structures in Hewlett Neck
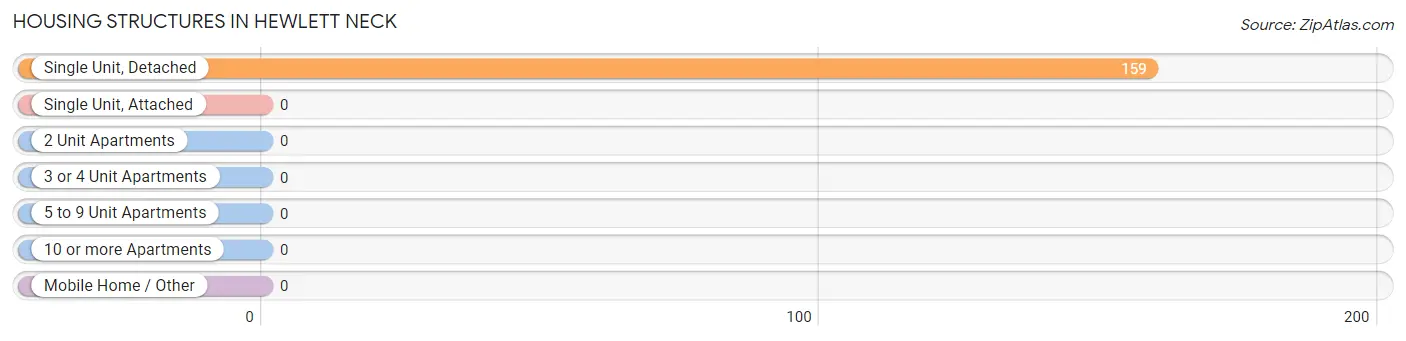
| Structure Type | # Housing Units | % Housing Units |
| Single Unit, Detached | 159 | 100.0% |
| Single Unit, Attached | 0 | 0.0% |
| 2 Unit Apartments | 0 | 0.0% |
| 3 or 4 Unit Apartments | 0 | 0.0% |
| 5 to 9 Unit Apartments | 0 | 0.0% |
| 10 or more Apartments | 0 | 0.0% |
| Mobile Home / Other | 0 | 0.0% |
| Total | 159 | 100.0% |
Housing Structures by Occupancy in Hewlett Neck
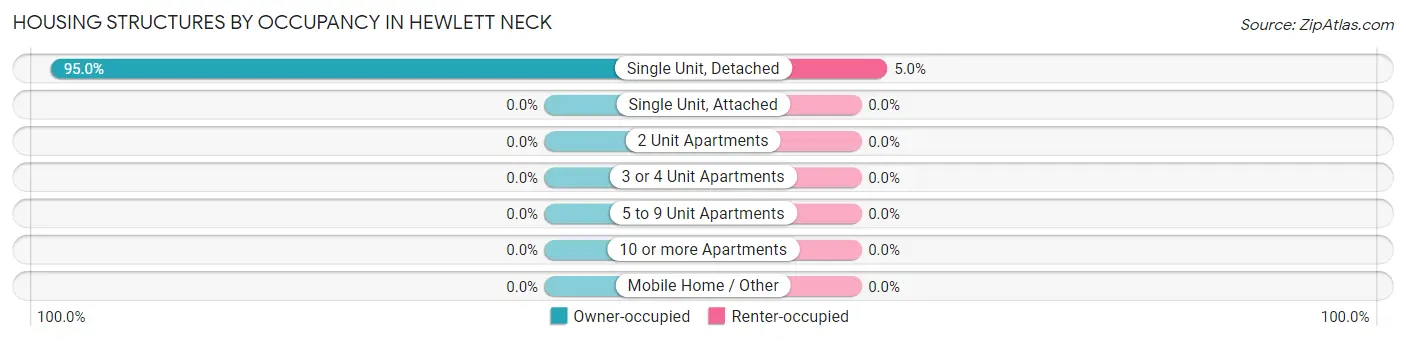
| Structure Type | Owner-occupied | Renter-occupied |
| Single Unit, Detached | 151 (95.0%) | 8 (5.0%) |
| Single Unit, Attached | 0 (0.0%) | 0 (0.0%) |
| 2 Unit Apartments | 0 (0.0%) | 0 (0.0%) |
| 3 or 4 Unit Apartments | 0 (0.0%) | 0 (0.0%) |
| 5 to 9 Unit Apartments | 0 (0.0%) | 0 (0.0%) |
| 10 or more Apartments | 0 (0.0%) | 0 (0.0%) |
| Mobile Home / Other | 0 (0.0%) | 0 (0.0%) |
| Total | 151 (95.0%) | 8 (5.0%) |
Housing Structures by Number of Rooms in Hewlett Neck
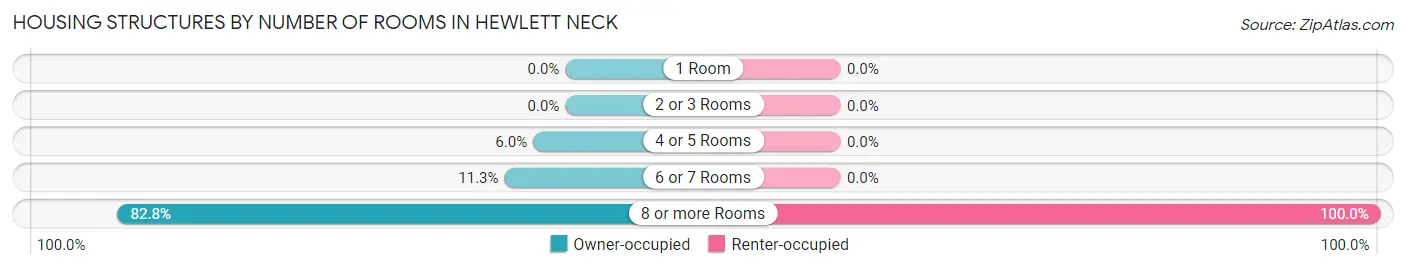
| Number of Rooms | Owner-occupied | Renter-occupied |
| 1 Room | 0 (0.0%) | 0 (0.0%) |
| 2 or 3 Rooms | 0 (0.0%) | 0 (0.0%) |
| 4 or 5 Rooms | 9 (6.0%) | 0 (0.0%) |
| 6 or 7 Rooms | 17 (11.3%) | 0 (0.0%) |
| 8 or more Rooms | 125 (82.8%) | 8 (100.0%) |
| Total | 151 (100.0%) | 8 (100.0%) |
Housing Structure by Heating Type in Hewlett Neck
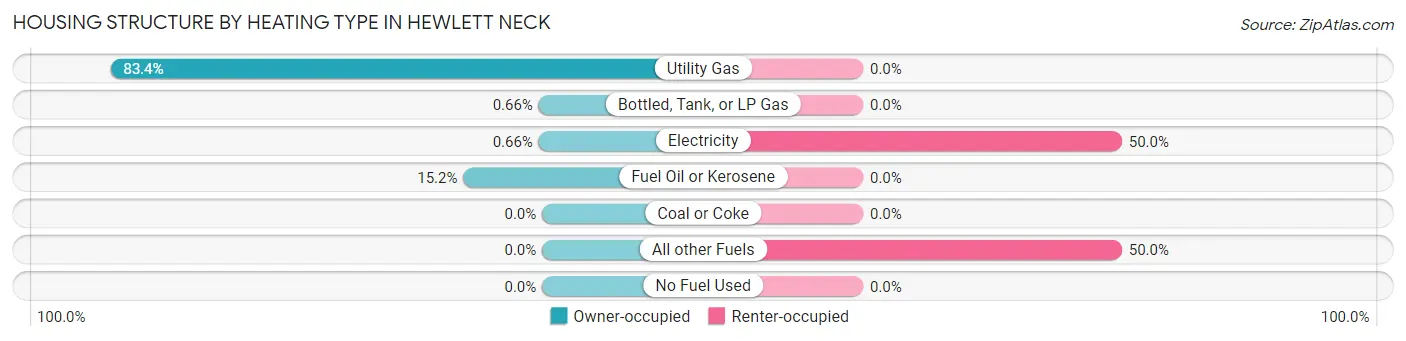
| Heating Type | Owner-occupied | Renter-occupied |
| Utility Gas | 126 (83.4%) | 0 (0.0%) |
| Bottled, Tank, or LP Gas | 1 (0.7%) | 0 (0.0%) |
| Electricity | 1 (0.7%) | 4 (50.0%) |
| Fuel Oil or Kerosene | 23 (15.2%) | 0 (0.0%) |
| Coal or Coke | 0 (0.0%) | 0 (0.0%) |
| All other Fuels | 0 (0.0%) | 4 (50.0%) |
| No Fuel Used | 0 (0.0%) | 0 (0.0%) |
| Total | 151 (100.0%) | 8 (100.0%) |
Household Vehicle Usage in Hewlett Neck
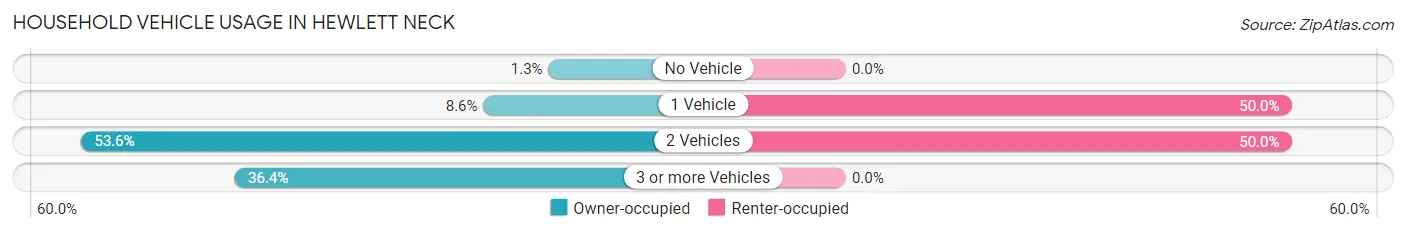
| Vehicles per Household | Owner-occupied | Renter-occupied |
| No Vehicle | 2 (1.3%) | 0 (0.0%) |
| 1 Vehicle | 13 (8.6%) | 4 (50.0%) |
| 2 Vehicles | 81 (53.6%) | 4 (50.0%) |
| 3 or more Vehicles | 55 (36.4%) | 0 (0.0%) |
| Total | 151 (100.0%) | 8 (100.0%) |
Real Estate & Mortgages in Hewlett Neck
Real Estate and Mortgage Overview in Hewlett Neck
| Characteristic | Without Mortgage | With Mortgage |
| Housing Units | 46 | 105 |
| Median Property Value | $1,397,100 | $1,312,500 |
| Median Household Income | $213,750 | $74 |
| Monthly Housing Costs | $1,501 | $105 |
| Real Estate Taxes | $10,001 | $0 |
Property Value by Mortgage Status in Hewlett Neck
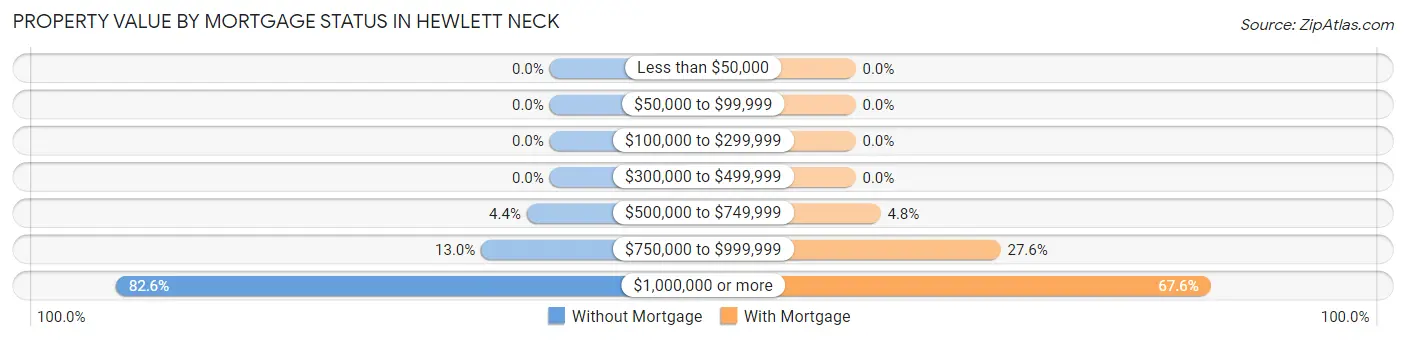
| Property Value | Without Mortgage | With Mortgage |
| Less than $50,000 | 0 (0.0%) | 0 (0.0%) |
| $50,000 to $99,999 | 0 (0.0%) | 0 (0.0%) |
| $100,000 to $299,999 | 0 (0.0%) | 0 (0.0%) |
| $300,000 to $499,999 | 0 (0.0%) | 0 (0.0%) |
| $500,000 to $749,999 | 2 (4.3%) | 5 (4.8%) |
| $750,000 to $999,999 | 6 (13.0%) | 29 (27.6%) |
| $1,000,000 or more | 38 (82.6%) | 71 (67.6%) |
| Total | 46 (100.0%) | 105 (100.0%) |
Household Income by Mortgage Status in Hewlett Neck
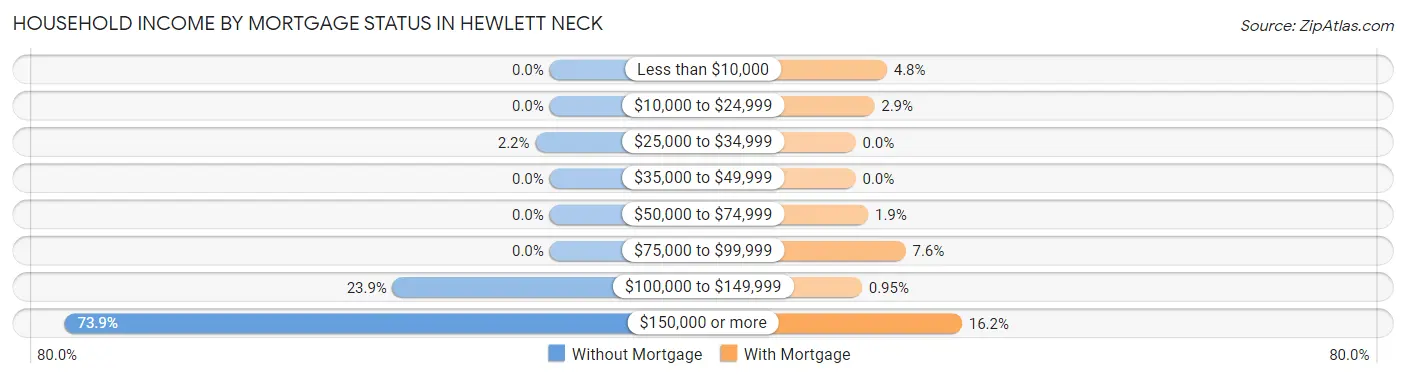
| Household Income | Without Mortgage | With Mortgage |
| Less than $10,000 | 0 (0.0%) | 5 (4.8%) |
| $10,000 to $24,999 | 0 (0.0%) | 3 (2.9%) |
| $25,000 to $34,999 | 1 (2.2%) | 0 (0.0%) |
| $35,000 to $49,999 | 0 (0.0%) | 0 (0.0%) |
| $50,000 to $74,999 | 0 (0.0%) | 2 (1.9%) |
| $75,000 to $99,999 | 0 (0.0%) | 8 (7.6%) |
| $100,000 to $149,999 | 11 (23.9%) | 1 (0.9%) |
| $150,000 or more | 34 (73.9%) | 17 (16.2%) |
| Total | 46 (100.0%) | 105 (100.0%) |
Property Value to Household Income Ratio in Hewlett Neck
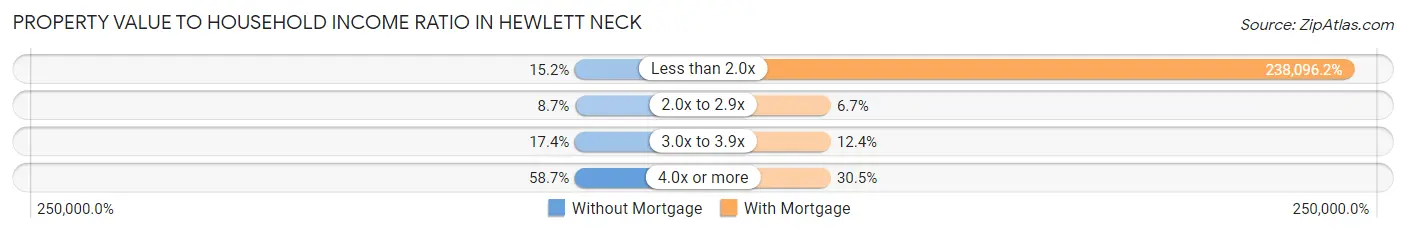
| Value-to-Income Ratio | Without Mortgage | With Mortgage |
| Less than 2.0x | 7 (15.2%) | 250,001 (238,096.2%) |
| 2.0x to 2.9x | 4 (8.7%) | 7 (6.7%) |
| 3.0x to 3.9x | 8 (17.4%) | 13 (12.4%) |
| 4.0x or more | 27 (58.7%) | 32 (30.5%) |
| Total | 46 (100.0%) | 105 (100.0%) |
Real Estate Taxes by Mortgage Status in Hewlett Neck
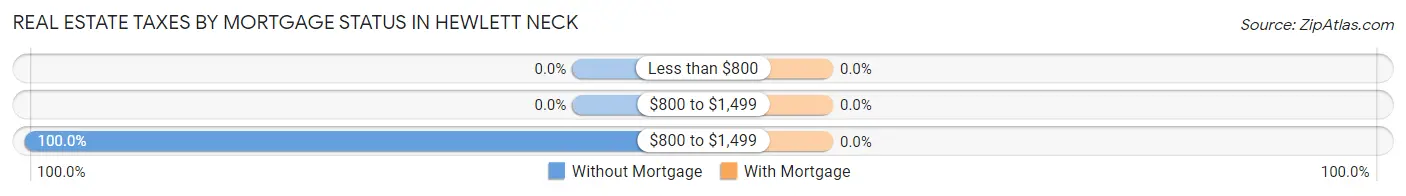
| Property Taxes | Without Mortgage | With Mortgage |
| Less than $800 | 0 (0.0%) | 0 (0.0%) |
| $800 to $1,499 | 0 (0.0%) | 0 (0.0%) |
| $800 to $1,499 | 46 (100.0%) | 0 (0.0%) |
| Total | 46 (100.0%) | 105 (100.0%) |
Health & Disability in Hewlett Neck
Health Insurance Coverage by Age in Hewlett Neck
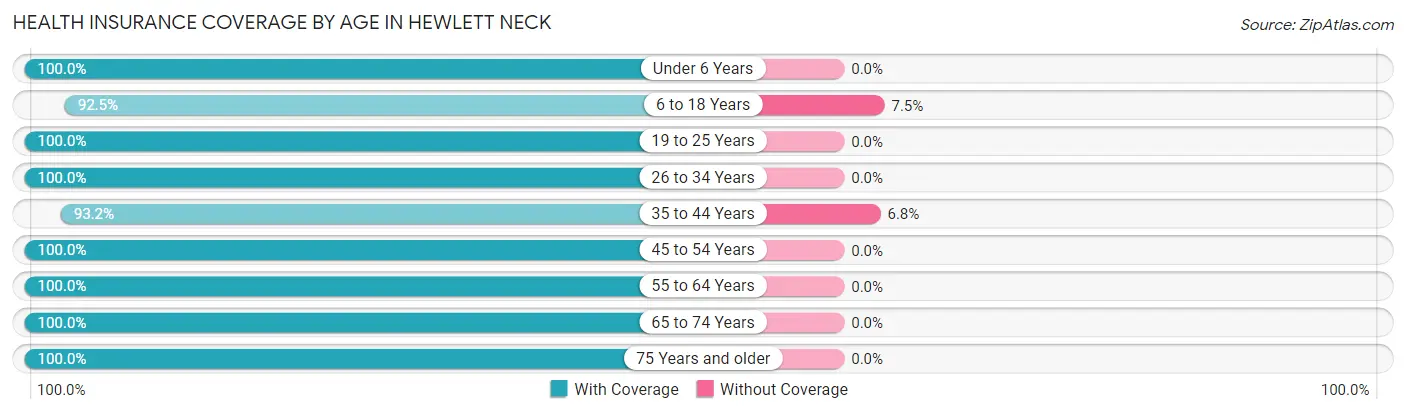
| Age Bracket | With Coverage | Without Coverage |
| Under 6 Years | 71 (100.0%) | 0 (0.0%) |
| 6 to 18 Years | 160 (92.5%) | 13 (7.5%) |
| 19 to 25 Years | 68 (100.0%) | 0 (0.0%) |
| 26 to 34 Years | 60 (100.0%) | 0 (0.0%) |
| 35 to 44 Years | 69 (93.2%) | 5 (6.8%) |
| 45 to 54 Years | 94 (100.0%) | 0 (0.0%) |
| 55 to 64 Years | 58 (100.0%) | 0 (0.0%) |
| 65 to 74 Years | 24 (100.0%) | 0 (0.0%) |
| 75 Years and older | 19 (100.0%) | 0 (0.0%) |
| Total | 623 (97.2%) | 18 (2.8%) |
Health Insurance Coverage by Citizenship Status in Hewlett Neck
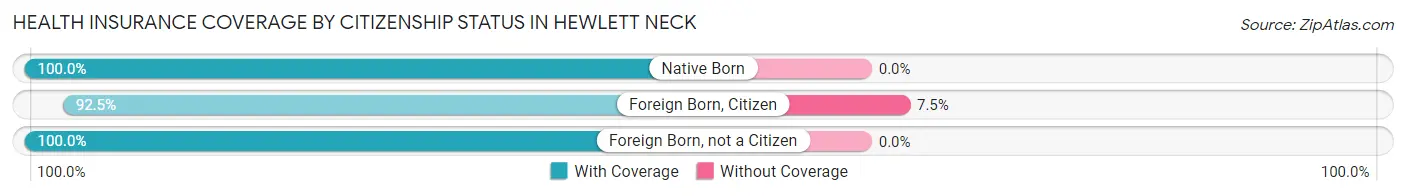
| Citizenship Status | With Coverage | Without Coverage |
| Native Born | 71 (100.0%) | 0 (0.0%) |
| Foreign Born, Citizen | 160 (92.5%) | 13 (7.5%) |
| Foreign Born, not a Citizen | 68 (100.0%) | 0 (0.0%) |
Health Insurance Coverage by Household Income in Hewlett Neck
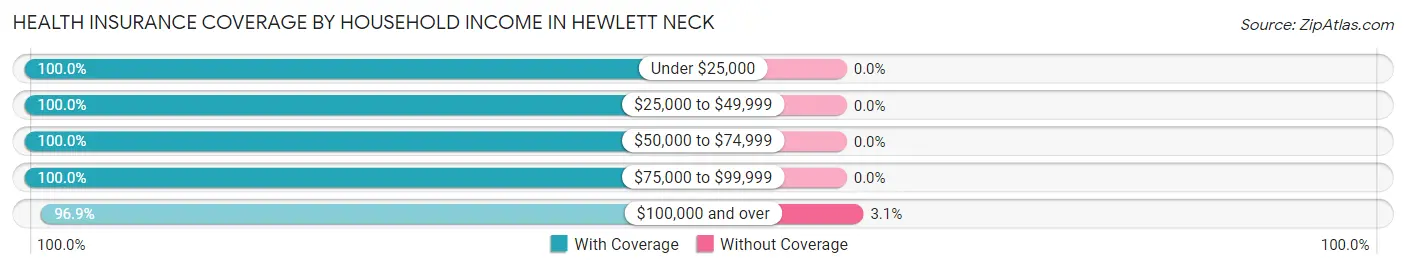
| Household Income | With Coverage | Without Coverage |
| Under $25,000 | 11 (100.0%) | 0 (0.0%) |
| $25,000 to $49,999 | 9 (100.0%) | 0 (0.0%) |
| $50,000 to $74,999 | 44 (100.0%) | 0 (0.0%) |
| $75,000 to $99,999 | 1 (100.0%) | 0 (0.0%) |
| $100,000 and over | 558 (96.9%) | 18 (3.1%) |
Public vs Private Health Insurance Coverage by Age in Hewlett Neck
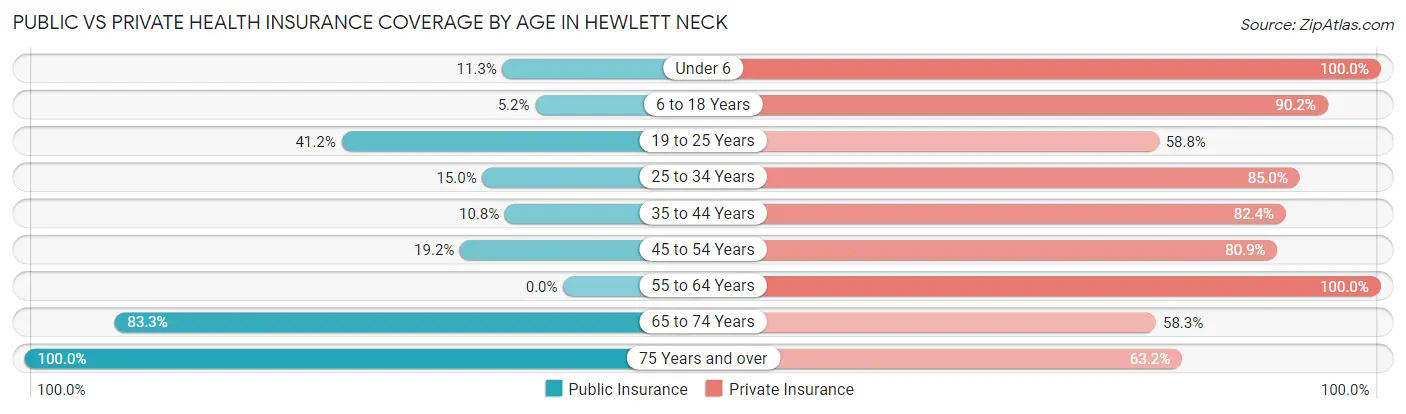
| Age Bracket | Public Insurance | Private Insurance |
| Under 6 | 8 (11.3%) | 71 (100.0%) |
| 6 to 18 Years | 9 (5.2%) | 156 (90.2%) |
| 19 to 25 Years | 28 (41.2%) | 40 (58.8%) |
| 25 to 34 Years | 9 (15.0%) | 51 (85.0%) |
| 35 to 44 Years | 8 (10.8%) | 61 (82.4%) |
| 45 to 54 Years | 18 (19.2%) | 76 (80.8%) |
| 55 to 64 Years | 0 (0.0%) | 58 (100.0%) |
| 65 to 74 Years | 20 (83.3%) | 14 (58.3%) |
| 75 Years and over | 19 (100.0%) | 12 (63.2%) |
| Total | 119 (18.6%) | 539 (84.1%) |
Disability Status by Sex by Age in Hewlett Neck
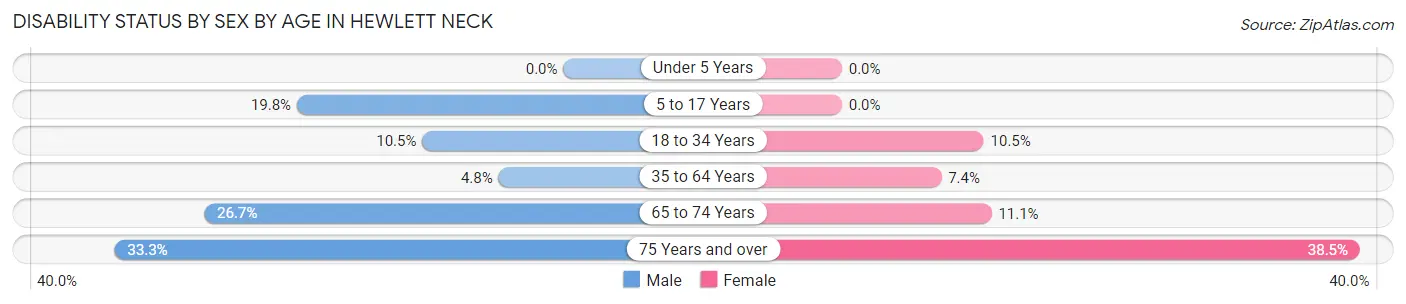
| Age Bracket | Male | Female |
| Under 5 Years | 0 (0.0%) | 0 (0.0%) |
| 5 to 17 Years | 18 (19.8%) | 0 (0.0%) |
| 18 to 34 Years | 9 (10.5%) | 6 (10.5%) |
| 35 to 64 Years | 5 (4.8%) | 9 (7.4%) |
| 65 to 74 Years | 4 (26.7%) | 1 (11.1%) |
| 75 Years and over | 2 (33.3%) | 5 (38.5%) |
Disability Class by Sex by Age in Hewlett Neck
Disability Class: Hearing Difficulty
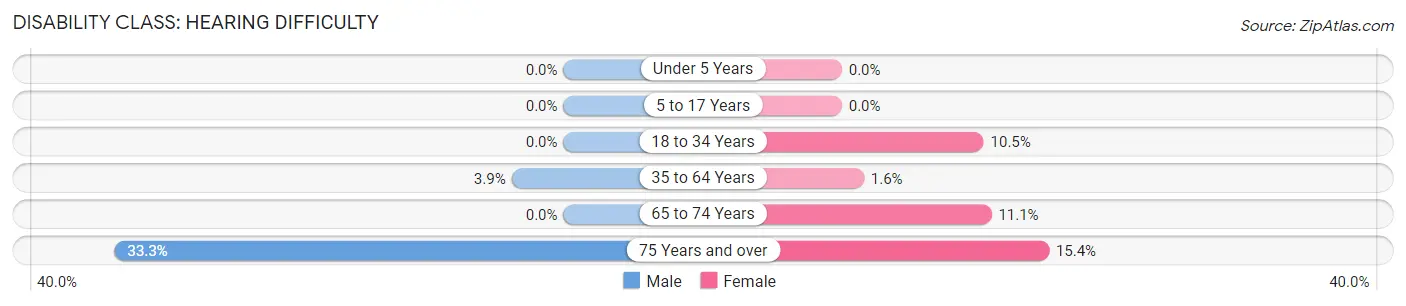
| Age Bracket | Male | Female |
| Under 5 Years | 0 (0.0%) | 0 (0.0%) |
| 5 to 17 Years | 0 (0.0%) | 0 (0.0%) |
| 18 to 34 Years | 0 (0.0%) | 6 (10.5%) |
| 35 to 64 Years | 4 (3.8%) | 2 (1.6%) |
| 65 to 74 Years | 0 (0.0%) | 1 (11.1%) |
| 75 Years and over | 2 (33.3%) | 2 (15.4%) |
Disability Class: Vision Difficulty
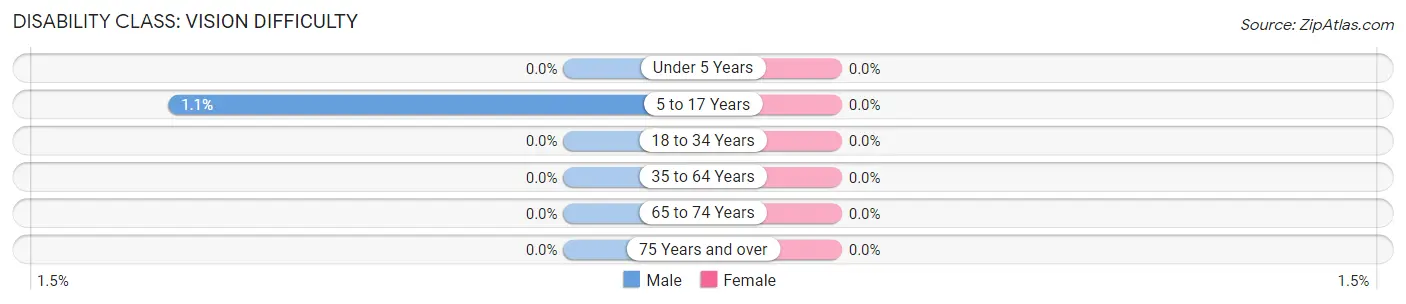
| Age Bracket | Male | Female |
| Under 5 Years | 0 (0.0%) | 0 (0.0%) |
| 5 to 17 Years | 1 (1.1%) | 0 (0.0%) |
| 18 to 34 Years | 0 (0.0%) | 0 (0.0%) |
| 35 to 64 Years | 0 (0.0%) | 0 (0.0%) |
| 65 to 74 Years | 0 (0.0%) | 0 (0.0%) |
| 75 Years and over | 0 (0.0%) | 0 (0.0%) |
Disability Class: Cognitive Difficulty
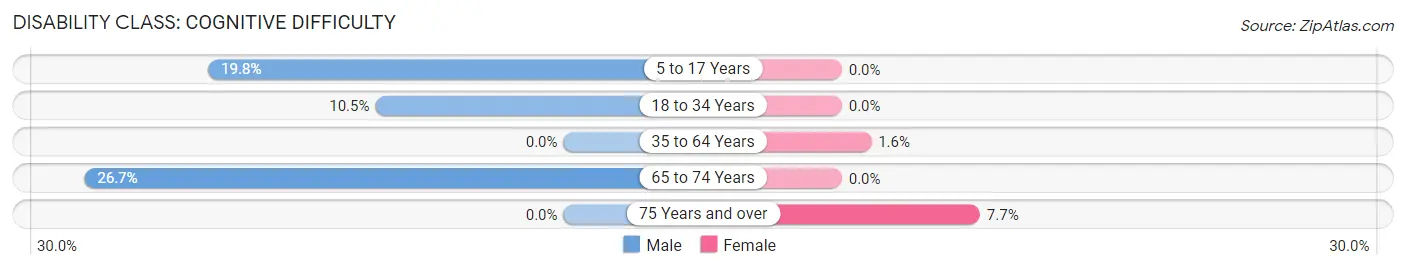
| Age Bracket | Male | Female |
| 5 to 17 Years | 18 (19.8%) | 0 (0.0%) |
| 18 to 34 Years | 9 (10.5%) | 0 (0.0%) |
| 35 to 64 Years | 0 (0.0%) | 2 (1.6%) |
| 65 to 74 Years | 4 (26.7%) | 0 (0.0%) |
| 75 Years and over | 0 (0.0%) | 1 (7.7%) |
Disability Class: Ambulatory Difficulty
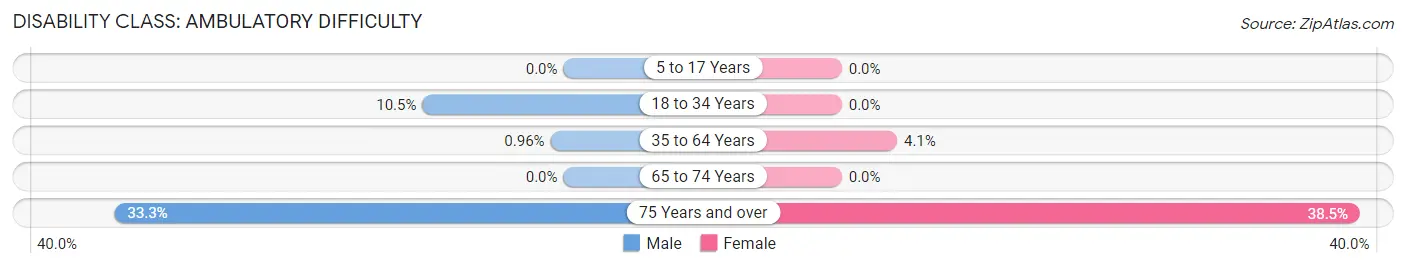
| Age Bracket | Male | Female |
| 5 to 17 Years | 0 (0.0%) | 0 (0.0%) |
| 18 to 34 Years | 9 (10.5%) | 0 (0.0%) |
| 35 to 64 Years | 1 (1.0%) | 5 (4.1%) |
| 65 to 74 Years | 0 (0.0%) | 0 (0.0%) |
| 75 Years and over | 2 (33.3%) | 5 (38.5%) |
Disability Class: Self-Care Difficulty
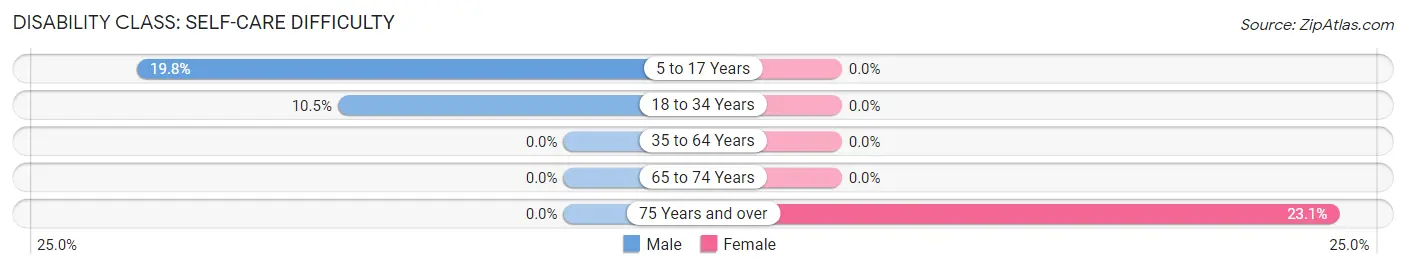
| Age Bracket | Male | Female |
| 5 to 17 Years | 18 (19.8%) | 0 (0.0%) |
| 18 to 34 Years | 9 (10.5%) | 0 (0.0%) |
| 35 to 64 Years | 0 (0.0%) | 0 (0.0%) |
| 65 to 74 Years | 0 (0.0%) | 0 (0.0%) |
| 75 Years and over | 0 (0.0%) | 3 (23.1%) |
Technology Access in Hewlett Neck
Computing Device Access in Hewlett Neck
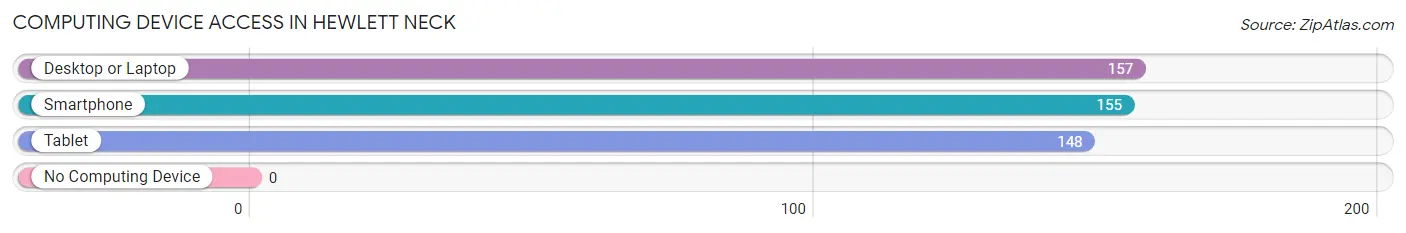
| Device Type | # Households | % Households |
| Desktop or Laptop | 157 | 98.7% |
| Smartphone | 155 | 97.5% |
| Tablet | 148 | 93.1% |
| No Computing Device | 0 | 0.0% |
| Total | 159 | 100.0% |
Internet Access in Hewlett Neck
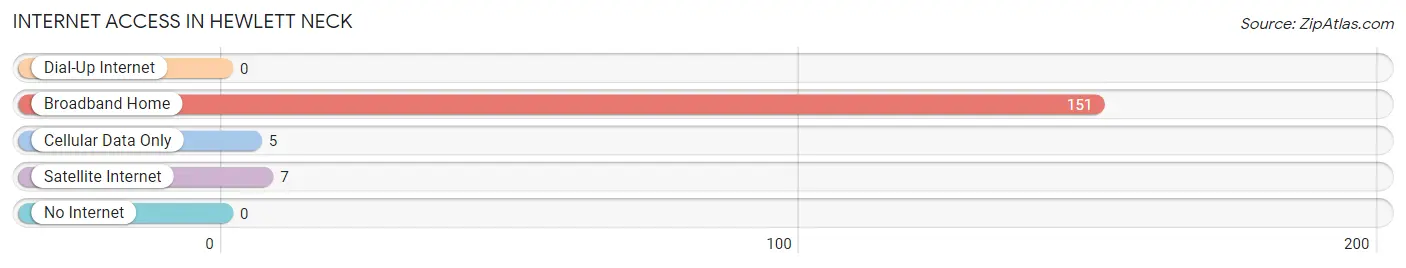
| Internet Type | # Households | % Households |
| Dial-Up Internet | 0 | 0.0% |
| Broadband Home | 151 | 95.0% |
| Cellular Data Only | 5 | 3.1% |
| Satellite Internet | 7 | 4.4% |
| No Internet | 0 | 0.0% |
| Total | 159 | 100.0% |
Hewlett Neck Summary
Hewlett Neck is a hamlet located in the Town of Hempstead in Nassau County, New York. It is situated on the south shore of Long Island, approximately 25 miles east of Manhattan. The hamlet is bordered by the villages of Hewlett Bay Park to the east, Hewlett Harbor to the south, and Woodsburgh to the west.
History
Hewlett Neck was originally inhabited by the Matinecock Native American tribe. The area was first settled by Europeans in the mid-17th century. The hamlet was named after the Hewlett family, who were among the first settlers in the area. The Hewletts were Quakers who had emigrated from England in 1643.
In the late 19th century, Hewlett Neck became a popular summer resort destination for wealthy New Yorkers. The area was known for its beautiful beaches and luxurious hotels. In the early 20th century, the hamlet became a popular destination for wealthy Jewish families from New York City.
Geography
Hewlett Neck is located on the south shore of Long Island, approximately 25 miles east of Manhattan. The hamlet is bordered by the villages of Hewlett Bay Park to the east, Hewlett Harbor to the south, and Woodsburgh to the west. The hamlet is situated on a peninsula, with Hewlett Bay to the north and Reynolds Channel to the south.
The area is mostly flat, with some low hills. The highest point in the hamlet is approximately 50 feet above sea level. The climate is temperate, with hot summers and mild winters.
Economy
Hewlett Neck is primarily a residential community, with no major industries or businesses. The hamlet is home to several small businesses, including restaurants, retail stores, and professional services. The hamlet is also home to several marinas, which provide services to boaters and fishermen.
Demographics
As of the 2010 census, the population of Hewlett Neck was 2,845. The racial makeup of the hamlet was 79.3% White, 8.2% African American, 0.2% Native American, 8.2% Asian, and 4.1% from other races. The median household income was $107,917, and the median family income was $125,917.
The majority of the population is Jewish, with a large Orthodox Jewish community. The hamlet is also home to a small Catholic population. The majority of the population is of European descent, with a small percentage of African American and Asian residents.
Common Questions
What is Per Capita Income in Hewlett Neck?
Per Capita income in Hewlett Neck is $91,085.
What is the Median Family Income in Hewlett Neck?
Median Family Income in Hewlett Neck is $250,001.
What is the Median Household income in Hewlett Neck?
Median Household Income in Hewlett Neck is $250,001.
What is Income or Wage Gap in Hewlett Neck?
Income or Wage Gap in Hewlett Neck is 79.9%.
Women in Hewlett Neck earn 20.1 cents for every dollar earned by a man.
What is Inequality or Gini Index in Hewlett Neck?
Inequality or Gini Index in Hewlett Neck is 0.41.
What is the Total Population of Hewlett Neck?
Total Population of Hewlett Neck is 641.
What is the Total Male Population of Hewlett Neck?
Total Male Population of Hewlett Neck is 338.
What is the Total Female Population of Hewlett Neck?
Total Female Population of Hewlett Neck is 303.
What is the Ratio of Males per 100 Females in Hewlett Neck?
There are 111.55 Males per 100 Females in Hewlett Neck.
What is the Ratio of Females per 100 Males in Hewlett Neck?
There are 89.64 Females per 100 Males in Hewlett Neck.
What is the Median Population Age in Hewlett Neck?
Median Population Age in Hewlett Neck is 27.7 Years.
What is the Average Family Size in Hewlett Neck
Average Family Size in Hewlett Neck is 4.1 People.
What is the Average Household Size in Hewlett Neck
Average Household Size in Hewlett Neck is 4.0 People.
How Large is the Labor Force in Hewlett Neck?
There are 289 People in the Labor Forcein in Hewlett Neck.
What is the Percentage of People in the Labor Force in Hewlett Neck?
65.5% of People are in the Labor Force in Hewlett Neck.
What is the Unemployment Rate in Hewlett Neck?
Unemployment Rate in Hewlett Neck is 2.8%.