East Hampton, NY Map & Demographics
East Hampton Map
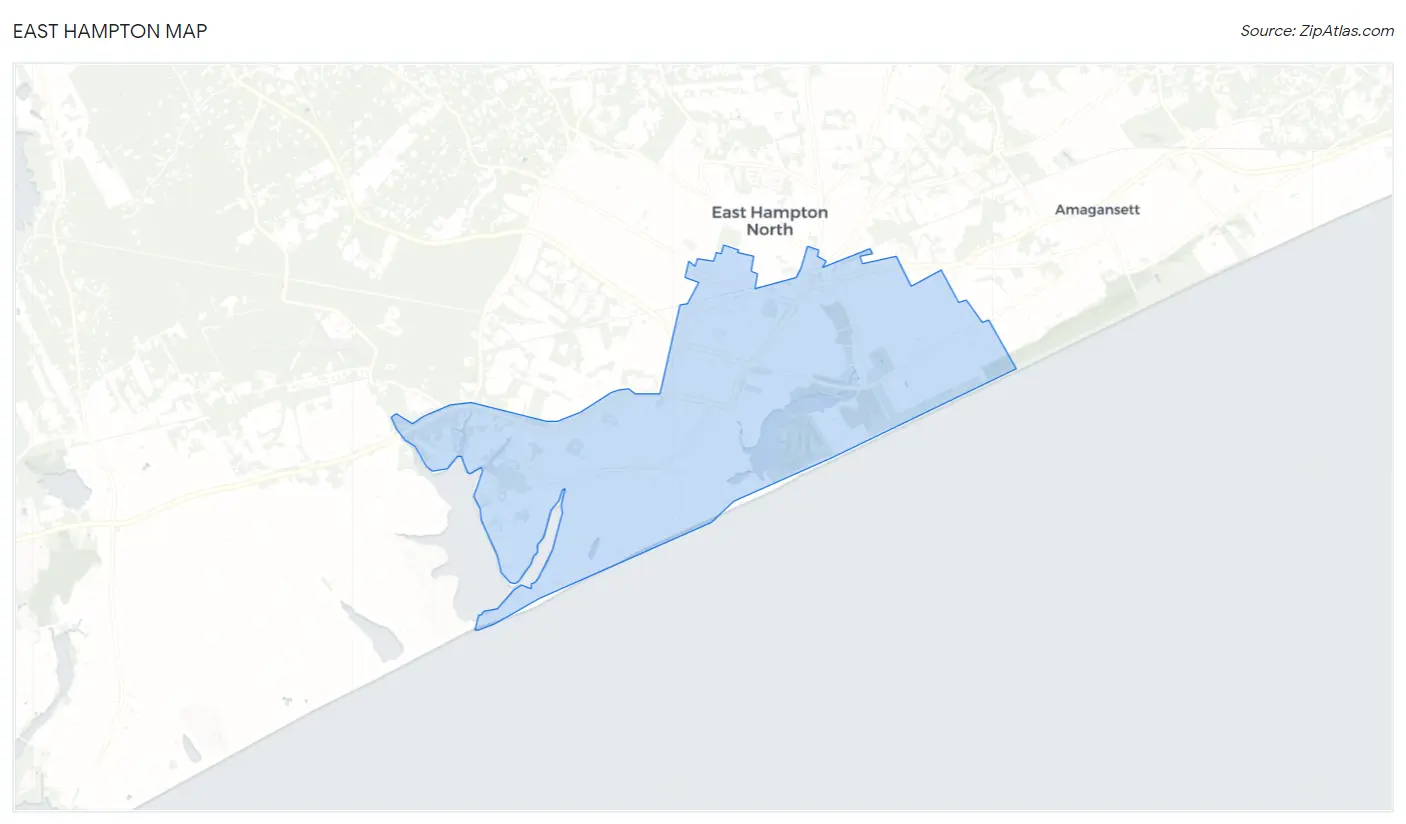
East Hampton Overview
$115,428
PER CAPITA INCOME
$136,625
AVG FAMILY INCOME
$94,375
AVG HOUSEHOLD INCOME
14.4%
WAGE / INCOME GAP [ % ]
85.6¢/ $1
WAGE / INCOME GAP [ $ ]
0.63
INEQUALITY / GINI INDEX
1,270
TOTAL POPULATION
636
MALE POPULATION
634
FEMALE POPULATION
100.32
MALES / 100 FEMALES
99.69
FEMALES / 100 MALES
57.4
MEDIAN AGE
2.5
AVG FAMILY SIZE
2.0
AVG HOUSEHOLD SIZE
560
LABOR FORCE [ PEOPLE ]
48.8%
PERCENT IN LABOR FORCE
1.1%
UNEMPLOYMENT RATE
East Hampton Zip Codes
East Hampton Area Codes
Income in East Hampton
Income Overview in East Hampton
Per Capita Income in East Hampton is $115,428, while median incomes of families and households are $136,625 and $94,375 respectively.
| Characteristic | Number | Measure |
| Per Capita Income | 1,270 | $115,428 |
| Median Family Income | 387 | $136,625 |
| Mean Family Income | 387 | $286,487 |
| Median Household Income | 646 | $94,375 |
| Mean Household Income | 646 | $226,809 |
| Income Deficit | 387 | $0 |
| Wage / Income Gap (%) | 1,270 | 14.40% |
| Wage / Income Gap ($) | 1,270 | 85.60¢ per $1 |
| Gini / Inequality Index | 1,270 | 0.63 |
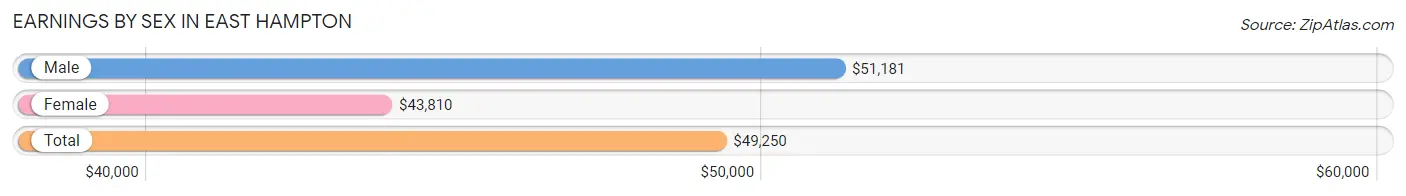
Earnings by Sex in East Hampton
Average Earnings in East Hampton are $49,250, $51,181 for men and $43,810 for women, a difference of 14.4%.
| Sex | Number | Average Earnings |
| Male | 377 (63.6%) | $51,181 |
| Female | 216 (36.4%) | $43,810 |
| Total | 593 (100.0%) | $49,250 |
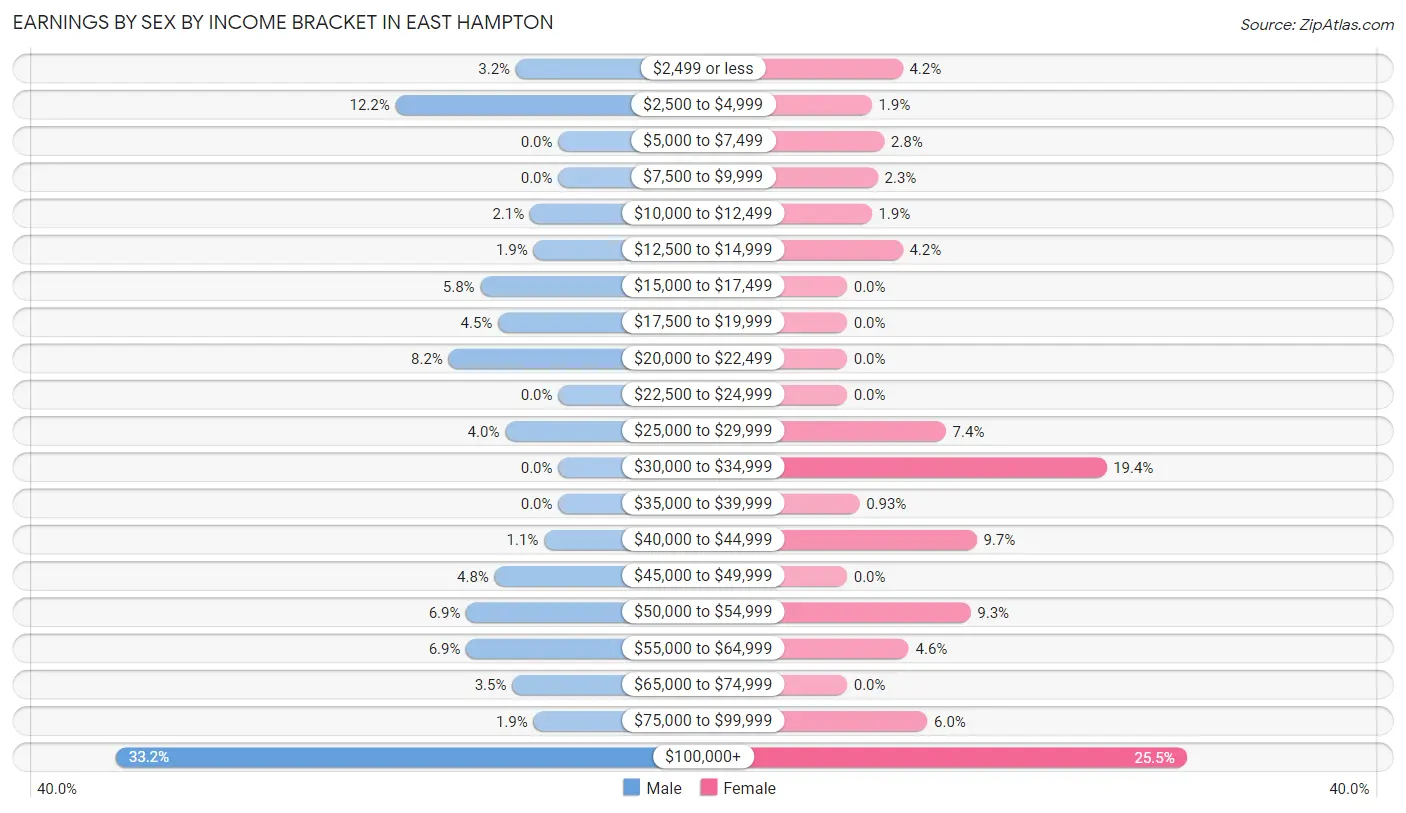
Earnings by Sex by Income Bracket in East Hampton
The most common earnings brackets in East Hampton are $100,000+ for men (125 | 33.2%) and $100,000+ for women (55 | 25.5%).
| Income | Male | Female |
| $2,499 or less | 12 (3.2%) | 9 (4.2%) |
| $2,500 to $4,999 | 46 (12.2%) | 4 (1.8%) |
| $5,000 to $7,499 | 0 (0.0%) | 6 (2.8%) |
| $7,500 to $9,999 | 0 (0.0%) | 5 (2.3%) |
| $10,000 to $12,499 | 8 (2.1%) | 4 (1.8%) |
| $12,500 to $14,999 | 7 (1.9%) | 9 (4.2%) |
| $15,000 to $17,499 | 22 (5.8%) | 0 (0.0%) |
| $17,500 to $19,999 | 17 (4.5%) | 0 (0.0%) |
| $20,000 to $22,499 | 31 (8.2%) | 0 (0.0%) |
| $22,500 to $24,999 | 0 (0.0%) | 0 (0.0%) |
| $25,000 to $29,999 | 15 (4.0%) | 16 (7.4%) |
| $30,000 to $34,999 | 0 (0.0%) | 42 (19.4%) |
| $35,000 to $39,999 | 0 (0.0%) | 2 (0.9%) |
| $40,000 to $44,999 | 4 (1.1%) | 21 (9.7%) |
| $45,000 to $49,999 | 18 (4.8%) | 0 (0.0%) |
| $50,000 to $54,999 | 26 (6.9%) | 20 (9.3%) |
| $55,000 to $64,999 | 26 (6.9%) | 10 (4.6%) |
| $65,000 to $74,999 | 13 (3.5%) | 0 (0.0%) |
| $75,000 to $99,999 | 7 (1.9%) | 13 (6.0%) |
| $100,000+ | 125 (33.2%) | 55 (25.5%) |
| Total | 377 (100.0%) | 216 (100.0%) |
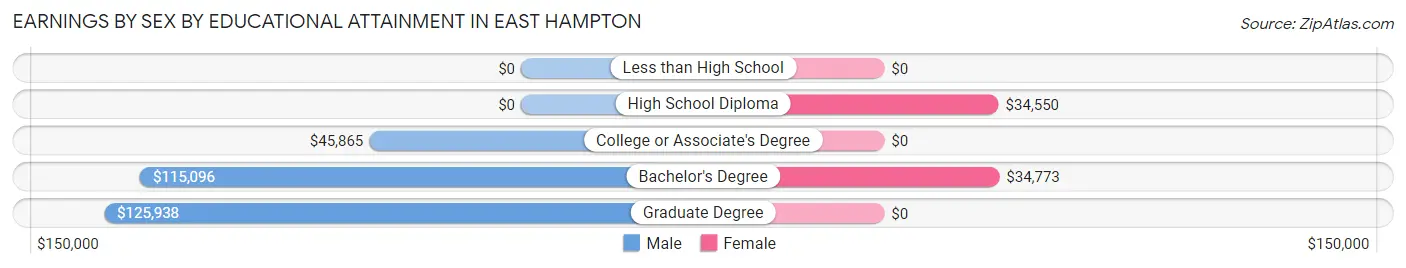
Earnings by Sex by Educational Attainment in East Hampton
Average earnings in East Hampton are $64,706 for men and $44,226 for women, a difference of 31.7%. Men with an educational attainment of graduate degree enjoy the highest average annual earnings of $125,938, while those with college or associate's degree education earn the least with $45,865. Women with an educational attainment of bachelor's degree earn the most with the average annual earnings of $34,773, while those with high school diploma education have the smallest earnings of $34,550.
| Educational Attainment | Male Income | Female Income |
| Less than High School | - | - |
| High School Diploma | - | - |
| College or Associate's Degree | $45,865 | $0 |
| Bachelor's Degree | $115,096 | $34,773 |
| Graduate Degree | $125,938 | $0 |
| Total | $64,706 | $44,226 |
Family Income in East Hampton
Family Income Brackets in East Hampton
According to the East Hampton family income data, there are 111 families falling into the $200,000+ income range, which is the most common income bracket and makes up 28.7% of all families.
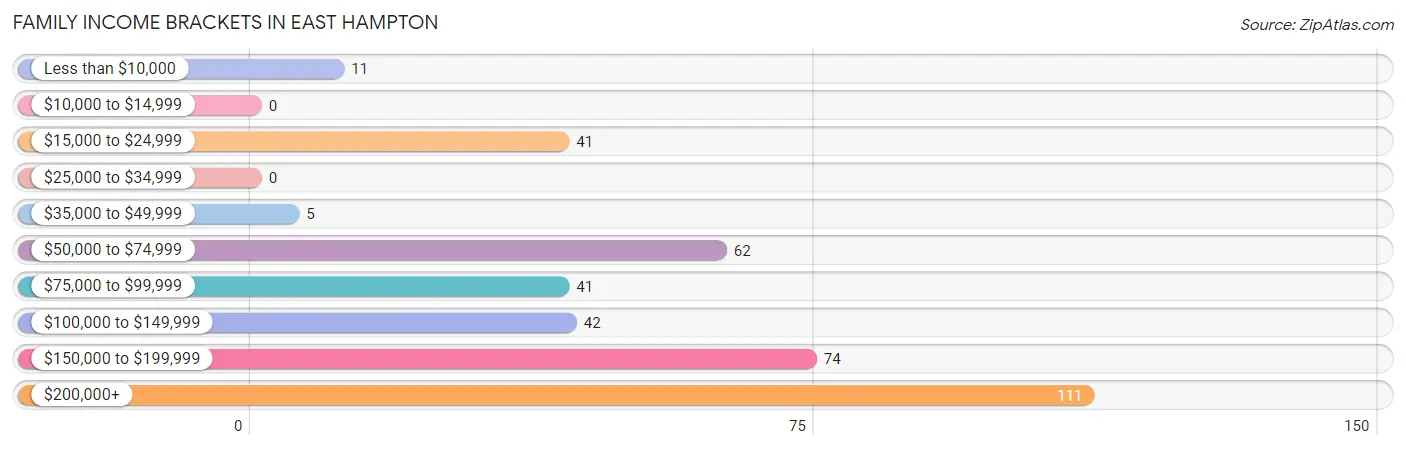
| Income Bracket | # Families | % Families |
| Less than $10,000 | 11 | 2.8% |
| $10,000 to $14,999 | 0 | 0.0% |
| $15,000 to $24,999 | 41 | 10.6% |
| $25,000 to $34,999 | 0 | 0.0% |
| $35,000 to $49,999 | 5 | 1.3% |
| $50,000 to $74,999 | 62 | 16.0% |
| $75,000 to $99,999 | 41 | 10.6% |
| $100,000 to $149,999 | 42 | 10.9% |
| $150,000 to $199,999 | 74 | 19.1% |
| $200,000+ | 111 | 28.7% |
Family Income by Famaliy Size in East Hampton
2-person families (265 | 68.5%) account for the highest median family income in East Hampton with $165,938 per family, while 2-person families (265 | 68.5%) have the highest median income of $82,969 per family member.
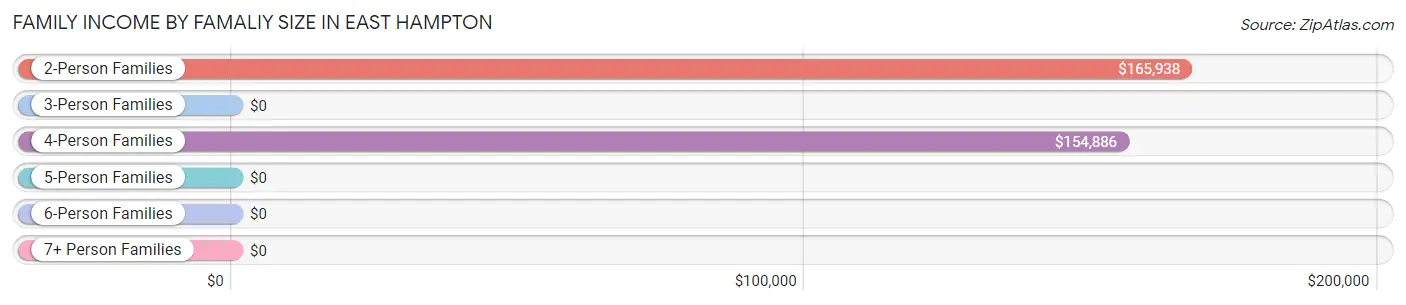
| Income Bracket | # Families | Median Income |
| 2-Person Families | 265 (68.5%) | $165,938 |
| 3-Person Families | 75 (19.4%) | $0 |
| 4-Person Families | 29 (7.5%) | $154,886 |
| 5-Person Families | 18 (4.6%) | $0 |
| 6-Person Families | 0 (0.0%) | $0 |
| 7+ Person Families | 0 (0.0%) | $0 |
| Total | 387 (100.0%) | $136,625 |
Family Income by Number of Earners in East Hampton
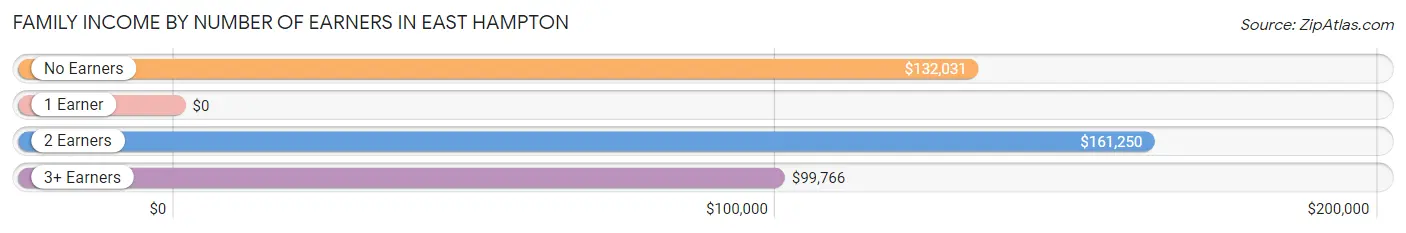
| Number of Earners | # Families | Median Income |
| No Earners | 101 (26.1%) | $132,031 |
| 1 Earner | 147 (38.0%) | $0 |
| 2 Earners | 106 (27.4%) | $161,250 |
| 3+ Earners | 33 (8.5%) | $99,766 |
| Total | 387 (100.0%) | $136,625 |
Household Income in East Hampton
Household Income Brackets in East Hampton
With 136 households falling in the category, the $200,000+ income range is the most frequent in East Hampton, accounting for 21.0% of all households.
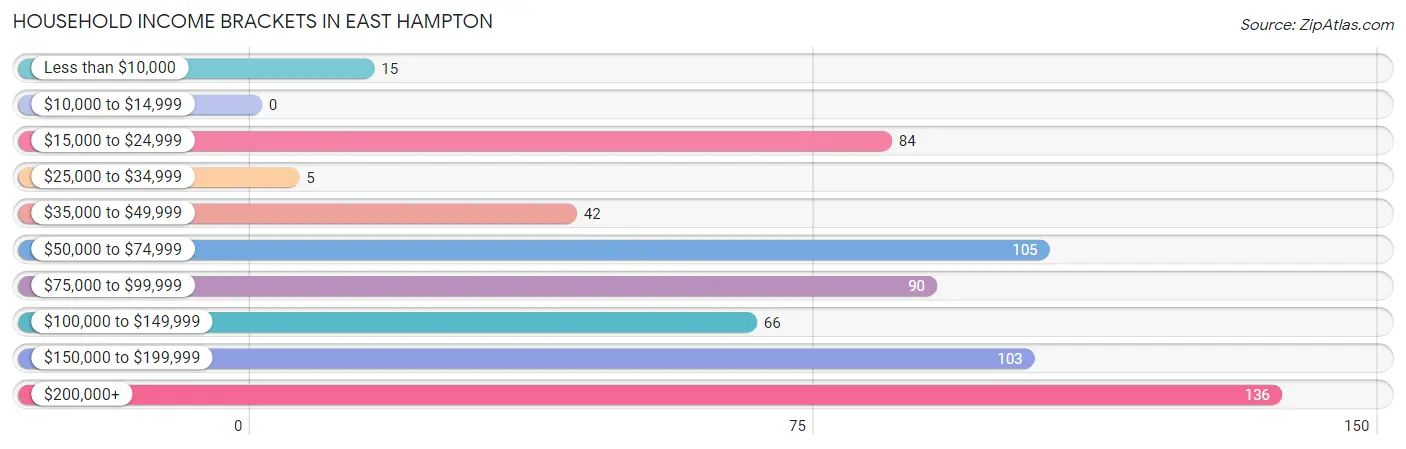
| Income Bracket | # Households | % Households |
| Less than $10,000 | 15 | 2.3% |
| $10,000 to $14,999 | 0 | 0.0% |
| $15,000 to $24,999 | 84 | 13.0% |
| $25,000 to $34,999 | 5 | 0.8% |
| $35,000 to $49,999 | 42 | 6.5% |
| $50,000 to $74,999 | 105 | 16.3% |
| $75,000 to $99,999 | 90 | 13.9% |
| $100,000 to $149,999 | 66 | 10.2% |
| $150,000 to $199,999 | 103 | 15.9% |
| $200,000+ | 136 | 21.1% |
Household Income by Householder Age in East Hampton
The median household income in East Hampton is $94,375, with the highest median household income of $243,000 found in the 25 to 44 years age bracket for the primary householder. A total of 40 households (6.2%) fall into this category.
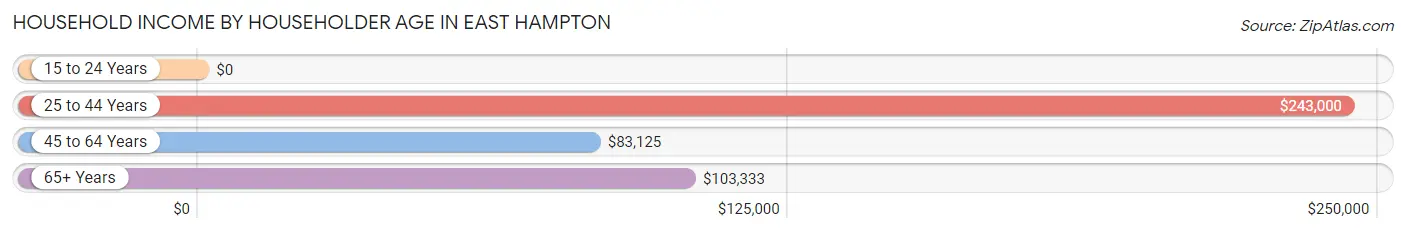
| Income Bracket | # Households | Median Income |
| 15 to 24 Years | 0 (0.0%) | $0 |
| 25 to 44 Years | 40 (6.2%) | $243,000 |
| 45 to 64 Years | 290 (44.9%) | $83,125 |
| 65+ Years | 316 (48.9%) | $103,333 |
| Total | 646 (100.0%) | $94,375 |
Poverty in East Hampton
Income Below Poverty by Sex and Age in East Hampton
With 13.2% poverty level for males and 9.4% for females among the residents of East Hampton, 18 to 24 year old males and 35 to 44 year old females are the most vulnerable to poverty, with 42 males (79.2%) and 9 females (39.1%) in their respective age groups living below the poverty level.
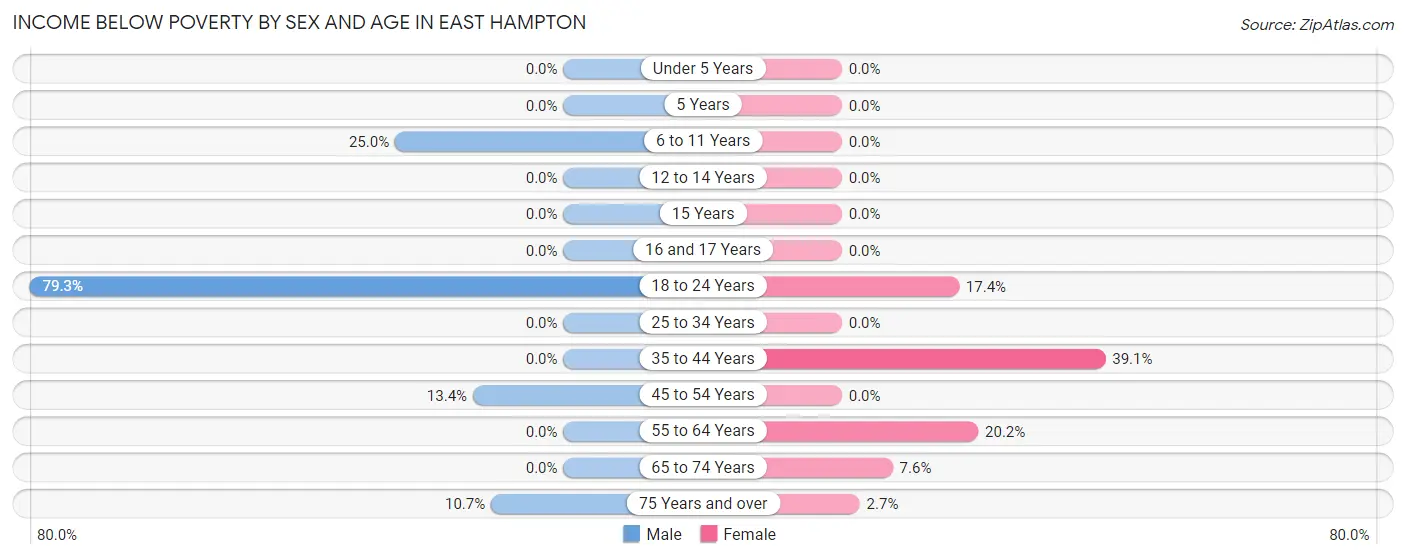
| Age Bracket | Male | Female |
| Under 5 Years | 0 (0.0%) | 0 (0.0%) |
| 5 Years | 0 (0.0%) | 0 (0.0%) |
| 6 to 11 Years | 11 (25.0%) | 0 (0.0%) |
| 12 to 14 Years | 0 (0.0%) | 0 (0.0%) |
| 15 Years | 0 (0.0%) | 0 (0.0%) |
| 16 and 17 Years | 0 (0.0%) | 0 (0.0%) |
| 18 to 24 Years | 42 (79.2%) | 4 (17.4%) |
| 25 to 34 Years | 0 (0.0%) | 0 (0.0%) |
| 35 to 44 Years | 0 (0.0%) | 9 (39.1%) |
| 45 to 54 Years | 18 (13.4%) | 0 (0.0%) |
| 55 to 64 Years | 0 (0.0%) | 34 (20.2%) |
| 65 to 74 Years | 0 (0.0%) | 8 (7.5%) |
| 75 Years and over | 13 (10.7%) | 4 (2.6%) |
| Total | 84 (13.2%) | 59 (9.4%) |
Income Above Poverty by Sex and Age in East Hampton
According to the poverty statistics in East Hampton, males aged under 5 years and females aged 6 to 11 years are the age groups that are most secure financially, with 100.0% of males and 100.0% of females in these age groups living above the poverty line.
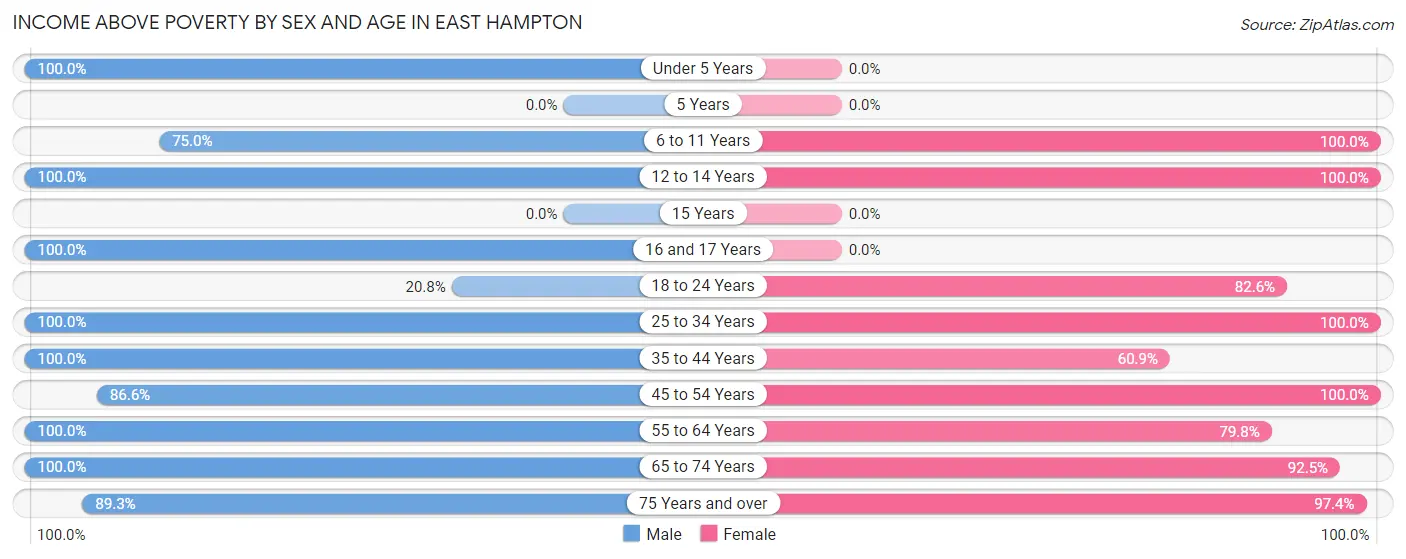
| Age Bracket | Male | Female |
| Under 5 Years | 3 (100.0%) | 0 (0.0%) |
| 5 Years | 0 (0.0%) | 0 (0.0%) |
| 6 to 11 Years | 33 (75.0%) | 4 (100.0%) |
| 12 to 14 Years | 23 (100.0%) | 45 (100.0%) |
| 15 Years | 0 (0.0%) | 0 (0.0%) |
| 16 and 17 Years | 55 (100.0%) | 0 (0.0%) |
| 18 to 24 Years | 11 (20.7%) | 19 (82.6%) |
| 25 to 34 Years | 17 (100.0%) | 27 (100.0%) |
| 35 to 44 Years | 34 (100.0%) | 14 (60.9%) |
| 45 to 54 Years | 116 (86.6%) | 83 (100.0%) |
| 55 to 64 Years | 74 (100.0%) | 134 (79.8%) |
| 65 to 74 Years | 78 (100.0%) | 98 (92.4%) |
| 75 Years and over | 108 (89.3%) | 147 (97.4%) |
| Total | 552 (86.8%) | 571 (90.6%) |
Income Below Poverty Among Married-Couple Families in East Hampton
The poverty statistics for married-couple families in East Hampton show that 6.1% or 18 of the total 296 families live below the poverty line. Families with 1 or 2 children have the highest poverty rate of 18.2%, comprising of 10 families. On the other hand, families with 3 or 4 children have the lowest poverty rate of 0.0%, which includes 0 families.
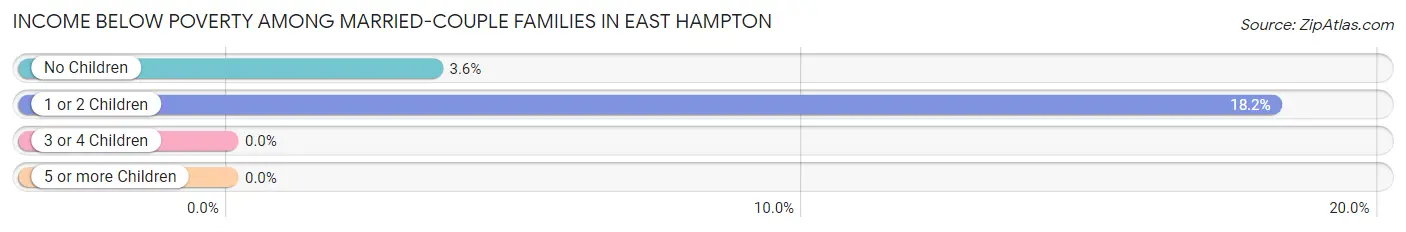
| Children | Above Poverty | Below Poverty |
| No Children | 217 (96.4%) | 8 (3.6%) |
| 1 or 2 Children | 45 (81.8%) | 10 (18.2%) |
| 3 or 4 Children | 16 (100.0%) | 0 (0.0%) |
| 5 or more Children | 0 (0.0%) | 0 (0.0%) |
| Total | 278 (93.9%) | 18 (6.1%) |
Income Below Poverty Among Single-Parent Households in East Hampton
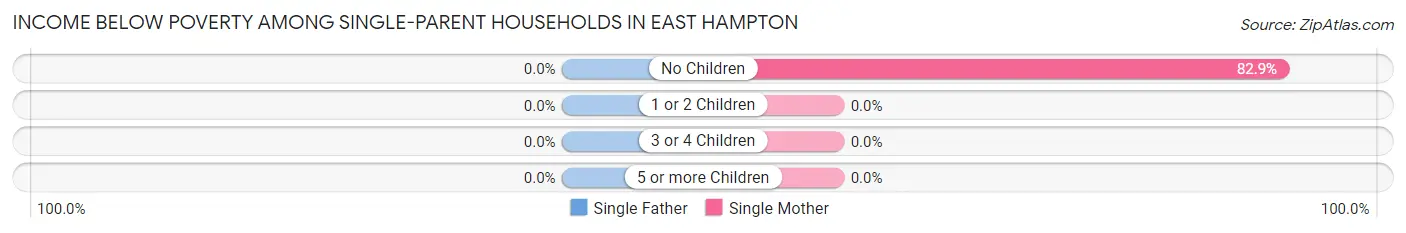
| Children | Single Father | Single Mother |
| No Children | 0 (0.0%) | 34 (82.9%) |
| 1 or 2 Children | 0 (0.0%) | 0 (0.0%) |
| 3 or 4 Children | 0 (0.0%) | 0 (0.0%) |
| 5 or more Children | 0 (0.0%) | 0 (0.0%) |
| Total | 0 (0.0%) | 34 (53.1%) |
Income Below Poverty Among Married-Couple vs Single-Parent Households in East Hampton
The poverty data for East Hampton shows that 18 of the married-couple family households (6.1%) and 34 of the single-parent households (37.4%) are living below the poverty level. Within the married-couple family households, those with 1 or 2 children have the highest poverty rate, with 10 households (18.2%) falling below the poverty line. Among the single-parent households, those with no children have the highest poverty rate, with 34 household (68.0%) living below poverty.
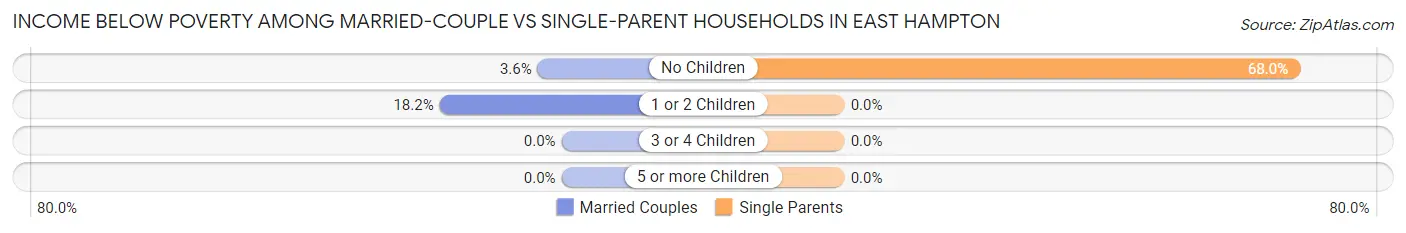
| Children | Married-Couple Families | Single-Parent Households |
| No Children | 8 (3.6%) | 34 (68.0%) |
| 1 or 2 Children | 10 (18.2%) | 0 (0.0%) |
| 3 or 4 Children | 0 (0.0%) | 0 (0.0%) |
| 5 or more Children | 0 (0.0%) | 0 (0.0%) |
| Total | 18 (6.1%) | 34 (37.4%) |
Race in East Hampton
The most populous races in East Hampton are White / Caucasian (1,094 | 86.1%), Hispanic or Latino (172 | 13.5%), and Two or more Races (122 | 9.6%).
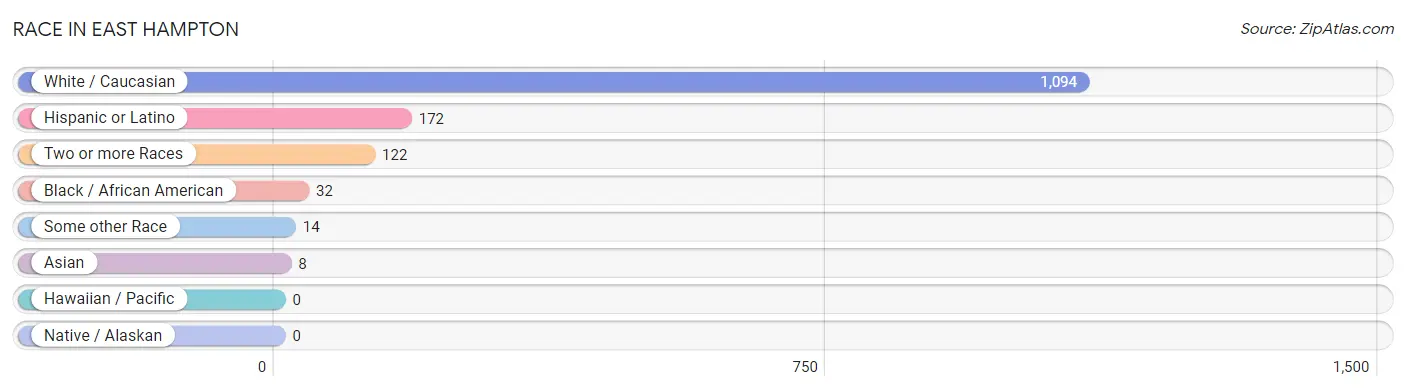
| Race | # Population | % Population |
| Asian | 8 | 0.6% |
| Black / African American | 32 | 2.5% |
| Hawaiian / Pacific | 0 | 0.0% |
| Hispanic or Latino | 172 | 13.5% |
| Native / Alaskan | 0 | 0.0% |
| White / Caucasian | 1,094 | 86.1% |
| Two or more Races | 122 | 9.6% |
| Some other Race | 14 | 1.1% |
| Total | 1,270 | 100.0% |
Ancestry in East Hampton
The most populous ancestries reported in East Hampton are English (187 | 14.7%), German (159 | 12.5%), Irish (134 | 10.5%), Russian (123 | 9.7%), and South American (81 | 6.4%), together accounting for 53.9% of all East Hampton residents.
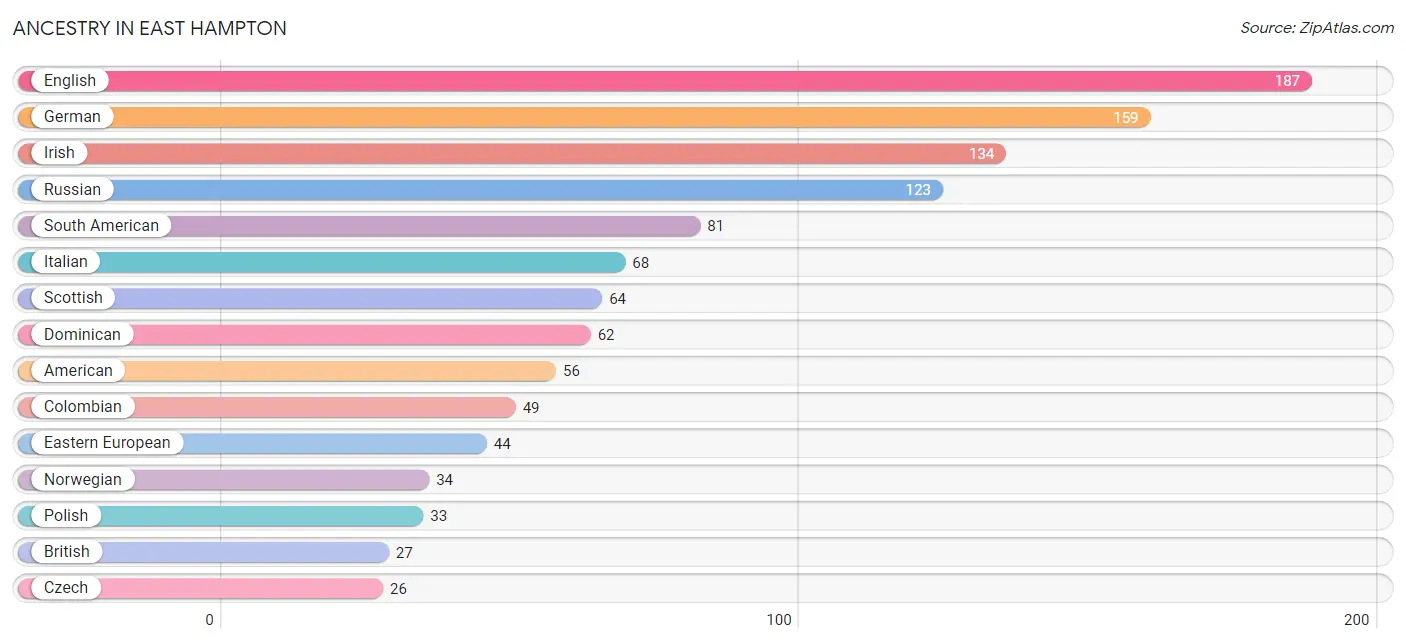
| Ancestry | # Population | % Population |
| American | 56 | 4.4% |
| Argentinean | 16 | 1.3% |
| Austrian | 4 | 0.3% |
| Belgian | 4 | 0.3% |
| Bhutanese | 4 | 0.3% |
| British | 27 | 2.1% |
| Chickasaw | 7 | 0.5% |
| Colombian | 49 | 3.9% |
| Cuban | 5 | 0.4% |
| Czech | 26 | 2.1% |
| Czechoslovakian | 13 | 1.0% |
| Danish | 20 | 1.6% |
| Dominican | 62 | 4.9% |
| Dutch | 17 | 1.3% |
| Eastern European | 44 | 3.5% |
| English | 187 | 14.7% |
| Ethiopian | 12 | 0.9% |
| European | 11 | 0.9% |
| Filipino | 4 | 0.3% |
| French | 19 | 1.5% |
| French Canadian | 4 | 0.3% |
| German | 159 | 12.5% |
| Greek | 4 | 0.3% |
| Hungarian | 7 | 0.5% |
| Irish | 134 | 10.5% |
| Italian | 68 | 5.3% |
| Latvian | 4 | 0.3% |
| Lithuanian | 2 | 0.2% |
| Macedonian | 13 | 1.0% |
| Northern European | 1 | 0.1% |
| Norwegian | 34 | 2.7% |
| Polish | 33 | 2.6% |
| Romanian | 4 | 0.3% |
| Russian | 123 | 9.7% |
| Scottish | 64 | 5.0% |
| Senegalese | 9 | 0.7% |
| South American | 81 | 6.4% |
| Spanish | 4 | 0.3% |
| Subsaharan African | 21 | 1.7% |
| Swedish | 4 | 0.3% |
| Turkish | 4 | 0.3% |
| Ukrainian | 15 | 1.2% |
| Uruguayan | 4 | 0.3% |
| Venezuelan | 12 | 0.9% |
| Yugoslavian | 4 | 0.3% | View All 45 Rows |
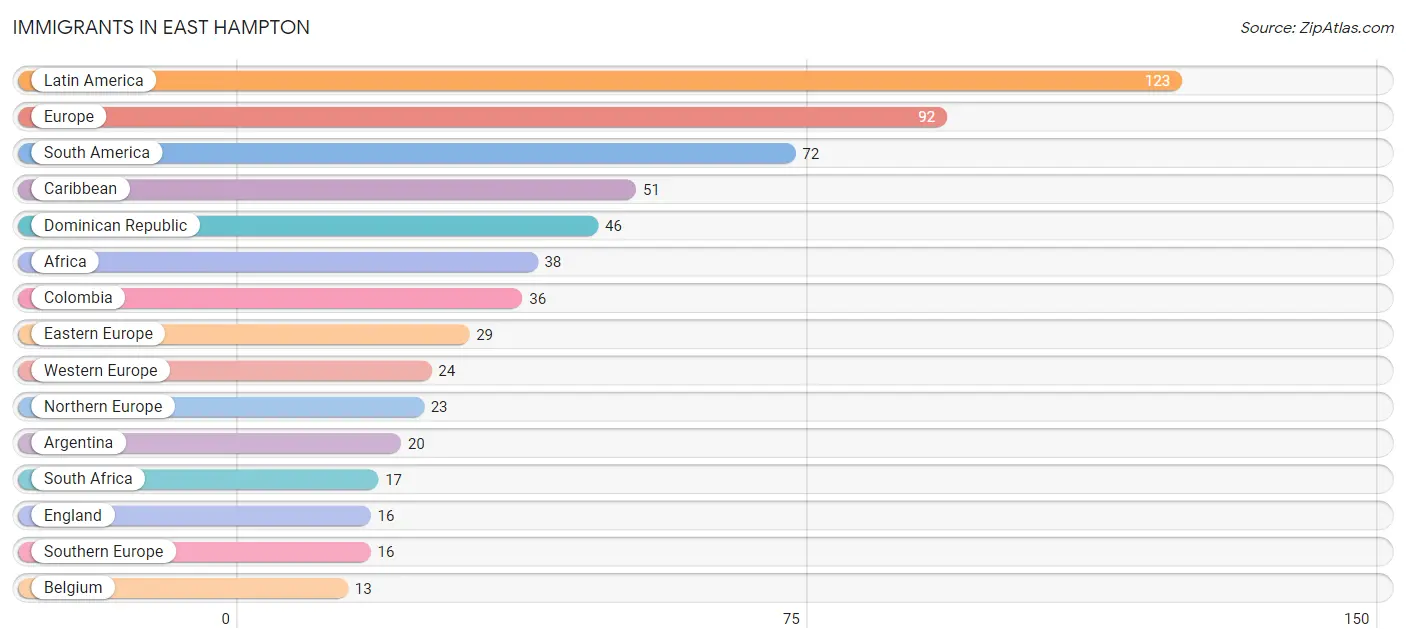
Immigrants in East Hampton
The most numerous immigrant groups reported in East Hampton came from Latin America (123 | 9.7%), Europe (92 | 7.2%), South America (72 | 5.7%), Caribbean (51 | 4.0%), and Dominican Republic (46 | 3.6%), together accounting for 30.2% of all East Hampton residents.
| Immigration Origin | # Population | % Population |
| Africa | 38 | 3.0% |
| Argentina | 20 | 1.6% |
| Asia | 8 | 0.6% |
| Belgium | 13 | 1.0% |
| Caribbean | 51 | 4.0% |
| China | 4 | 0.3% |
| Colombia | 36 | 2.8% |
| Cuba | 5 | 0.4% |
| Czechoslovakia | 8 | 0.6% |
| Dominican Republic | 46 | 3.6% |
| Eastern Africa | 12 | 0.9% |
| Eastern Asia | 4 | 0.3% |
| Eastern Europe | 29 | 2.3% |
| England | 16 | 1.3% |
| Ethiopia | 12 | 0.9% |
| Europe | 92 | 7.2% |
| France | 4 | 0.3% |
| Germany | 2 | 0.2% |
| Greece | 4 | 0.3% |
| Latin America | 123 | 9.7% |
| Netherlands | 5 | 0.4% |
| Northern Europe | 23 | 1.8% |
| Poland | 8 | 0.6% |
| Portugal | 12 | 0.9% |
| Senegal | 9 | 0.7% |
| South Africa | 17 | 1.3% |
| South America | 72 | 5.7% |
| Southern Europe | 16 | 1.3% |
| Taiwan | 4 | 0.3% |
| Turkey | 4 | 0.3% |
| Uruguay | 4 | 0.3% |
| Venezuela | 12 | 0.9% |
| Western Africa | 9 | 0.7% |
| Western Asia | 4 | 0.3% |
| Western Europe | 24 | 1.9% | View All 35 Rows |
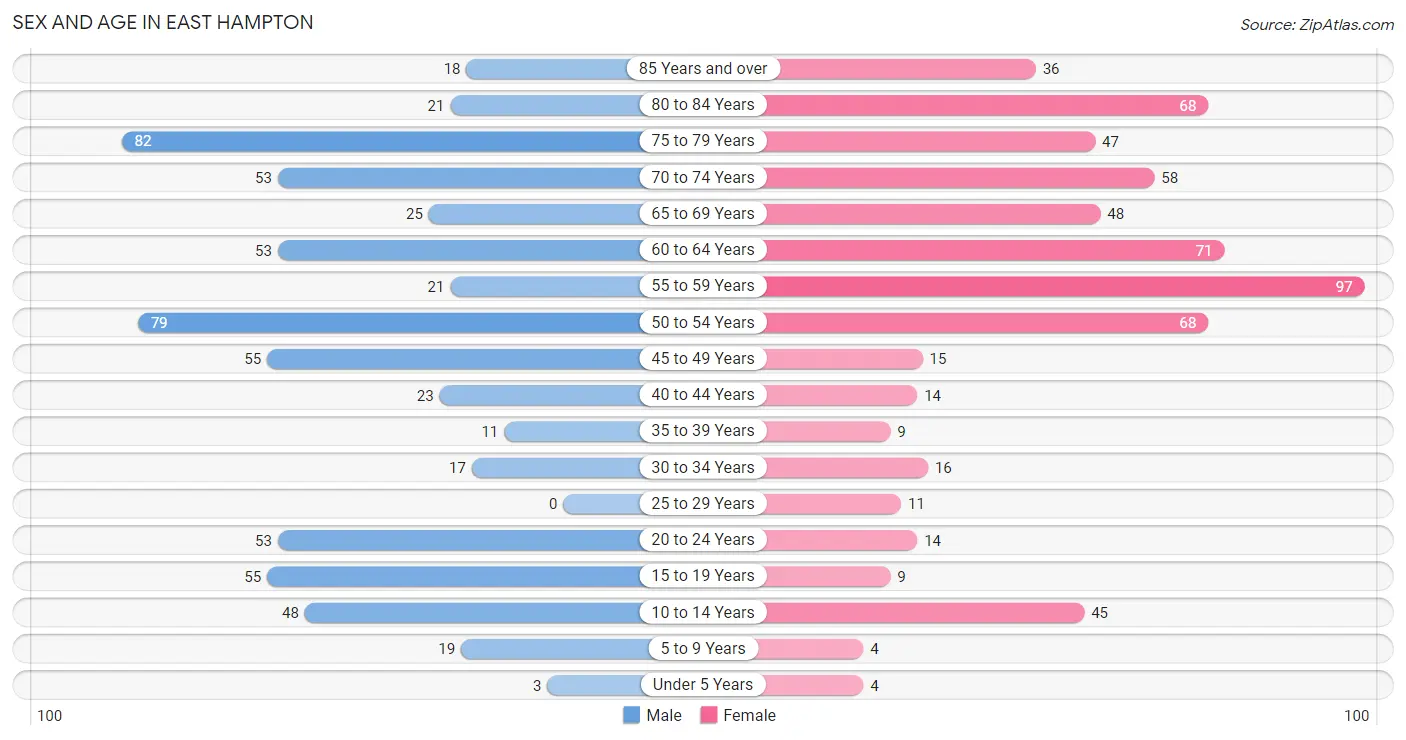
Sex and Age in East Hampton
Sex and Age in East Hampton
The most populous age groups in East Hampton are 75 to 79 Years (82 | 12.9%) for men and 55 to 59 Years (97 | 15.3%) for women.
| Age Bracket | Male | Female |
| Under 5 Years | 3 (0.5%) | 4 (0.6%) |
| 5 to 9 Years | 19 (3.0%) | 4 (0.6%) |
| 10 to 14 Years | 48 (7.5%) | 45 (7.1%) |
| 15 to 19 Years | 55 (8.6%) | 9 (1.4%) |
| 20 to 24 Years | 53 (8.3%) | 14 (2.2%) |
| 25 to 29 Years | 0 (0.0%) | 11 (1.7%) |
| 30 to 34 Years | 17 (2.7%) | 16 (2.5%) |
| 35 to 39 Years | 11 (1.7%) | 9 (1.4%) |
| 40 to 44 Years | 23 (3.6%) | 14 (2.2%) |
| 45 to 49 Years | 55 (8.6%) | 15 (2.4%) |
| 50 to 54 Years | 79 (12.4%) | 68 (10.7%) |
| 55 to 59 Years | 21 (3.3%) | 97 (15.3%) |
| 60 to 64 Years | 53 (8.3%) | 71 (11.2%) |
| 65 to 69 Years | 25 (3.9%) | 48 (7.6%) |
| 70 to 74 Years | 53 (8.3%) | 58 (9.1%) |
| 75 to 79 Years | 82 (12.9%) | 47 (7.4%) |
| 80 to 84 Years | 21 (3.3%) | 68 (10.7%) |
| 85 Years and over | 18 (2.8%) | 36 (5.7%) |
| Total | 636 (100.0%) | 634 (100.0%) |
Families and Households in East Hampton
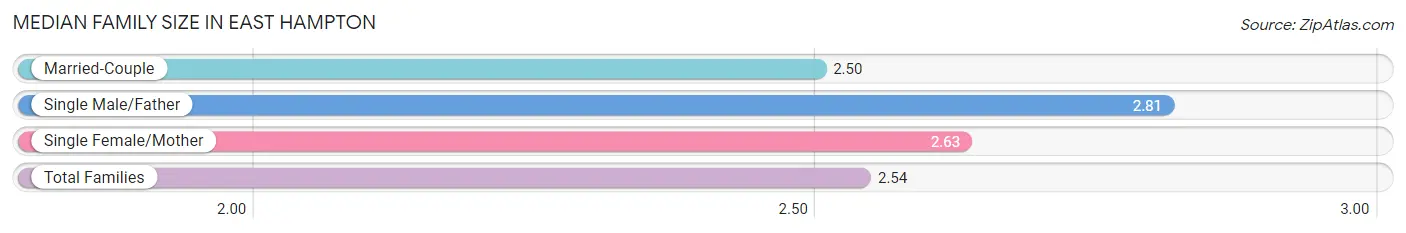
Median Family Size in East Hampton
The median family size in East Hampton is 2.54 persons per family, with single male/father families (27 | 7.0%) accounting for the largest median family size of 2.81 persons per family. On the other hand, married-couple families (296 | 76.5%) represent the smallest median family size with 2.50 persons per family.
| Family Type | # Families | Family Size |
| Married-Couple | 296 (76.5%) | 2.50 |
| Single Male/Father | 27 (7.0%) | 2.81 |
| Single Female/Mother | 64 (16.5%) | 2.63 |
| Total Families | 387 (100.0%) | 2.54 |
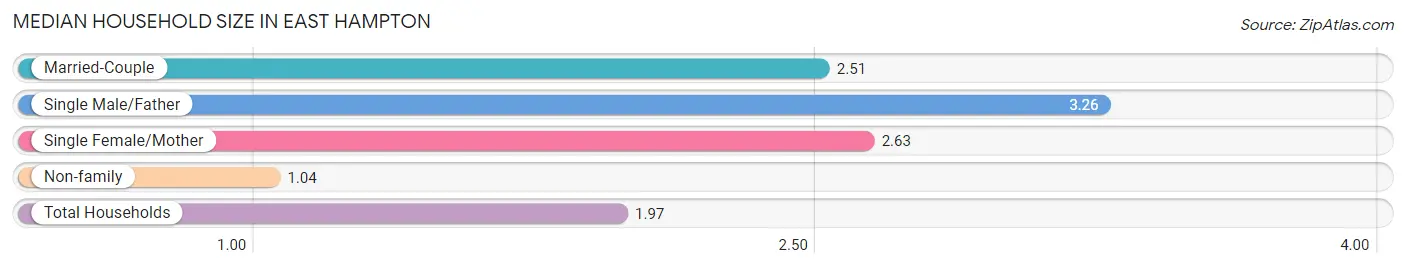
Median Household Size in East Hampton
The median household size in East Hampton is 1.97 persons per household, with single male/father households (27 | 4.2%) accounting for the largest median household size of 3.26 persons per household. non-family households (259 | 40.1%) represent the smallest median household size with 1.04 persons per household.
| Household Type | # Households | Household Size |
| Married-Couple | 296 (45.8%) | 2.51 |
| Single Male/Father | 27 (4.2%) | 3.26 |
| Single Female/Mother | 64 (9.9%) | 2.63 |
| Non-family | 259 (40.1%) | 1.04 |
| Total Households | 646 (100.0%) | 1.97 |
Household Size by Marriage Status in East Hampton
Out of a total of 646 households in East Hampton, 387 (59.9%) are family households, while 259 (40.1%) are nonfamily households. The most numerous type of family households are 2-person households, comprising 252, and the most common type of nonfamily households are 1-person households, comprising 246.
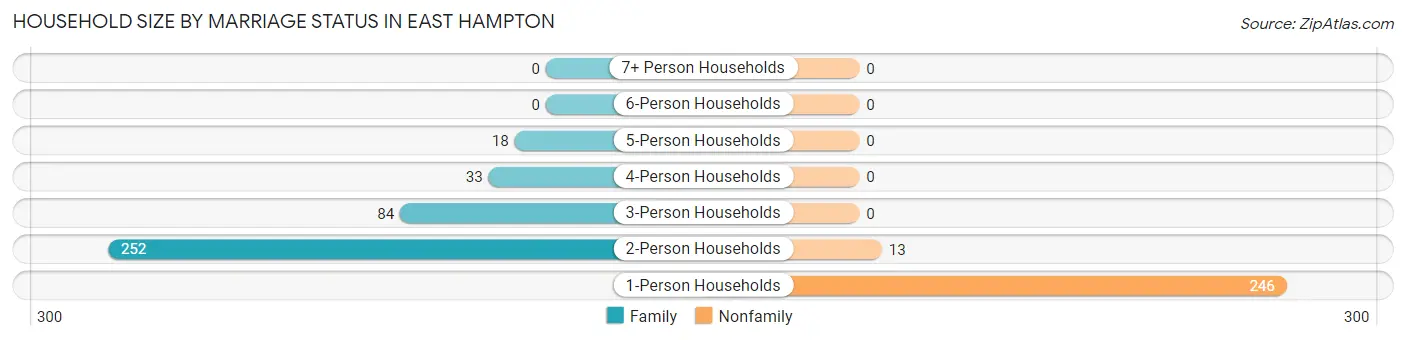
| Household Size | Family Households | Nonfamily Households |
| 1-Person Households | - | 246 (38.1%) |
| 2-Person Households | 252 (39.0%) | 13 (2.0%) |
| 3-Person Households | 84 (13.0%) | 0 (0.0%) |
| 4-Person Households | 33 (5.1%) | 0 (0.0%) |
| 5-Person Households | 18 (2.8%) | 0 (0.0%) |
| 6-Person Households | 0 (0.0%) | 0 (0.0%) |
| 7+ Person Households | 0 (0.0%) | 0 (0.0%) |
| Total | 387 (59.9%) | 259 (40.1%) |
Female Fertility in East Hampton
Fertility by Age in East Hampton
Average fertility rate in East Hampton is 36.0 births per 1,000 women. Women in the age bracket of 20 to 34 years have the highest fertility rate with 98.0 births per 1,000 women. Women in the age bracket of 20 to 34 years acount for 100.0% of all women with births.
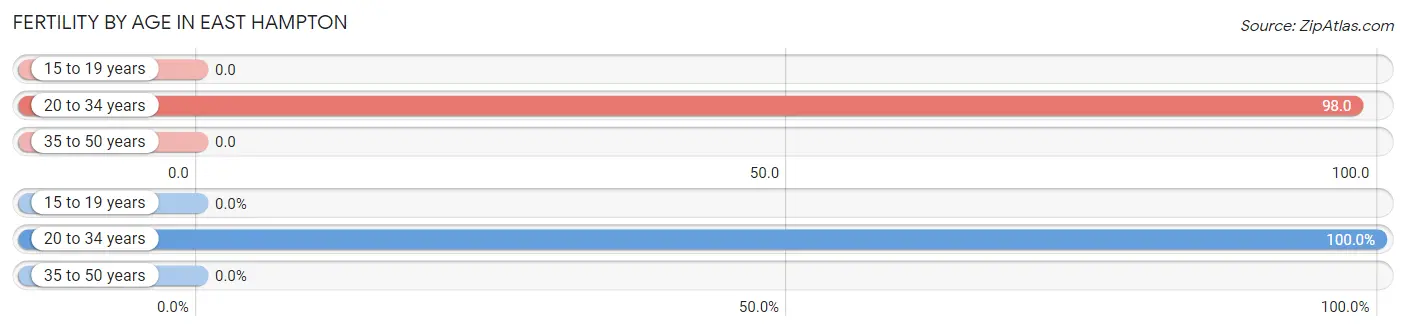
| Age Bracket | Women with Births | Births / 1,000 Women |
| 15 to 19 years | 0 (0.0%) | 0.0 |
| 20 to 34 years | 4 (100.0%) | 98.0 |
| 35 to 50 years | 0 (0.0%) | 0.0 |
| Total | 4 (100.0%) | 36.0 |
Fertility by Age by Marriage Status in East Hampton
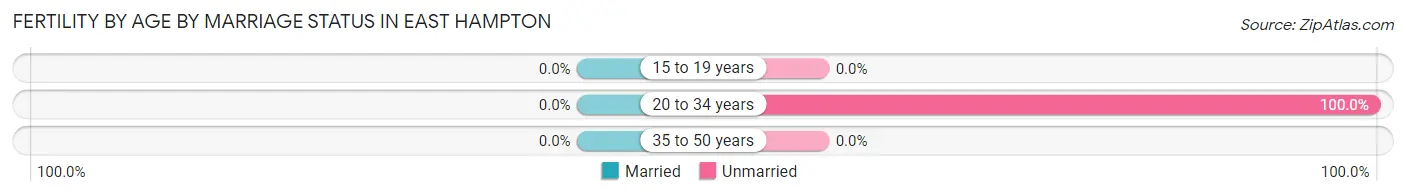
| Age Bracket | Married | Unmarried |
| 15 to 19 years | 0 (0.0%) | 0 (0.0%) |
| 20 to 34 years | 0 (0.0%) | 4 (100.0%) |
| 35 to 50 years | 0 (0.0%) | 0 (0.0%) |
| Total | 0 (0.0%) | 4 (100.0%) |
Fertility by Education in East Hampton
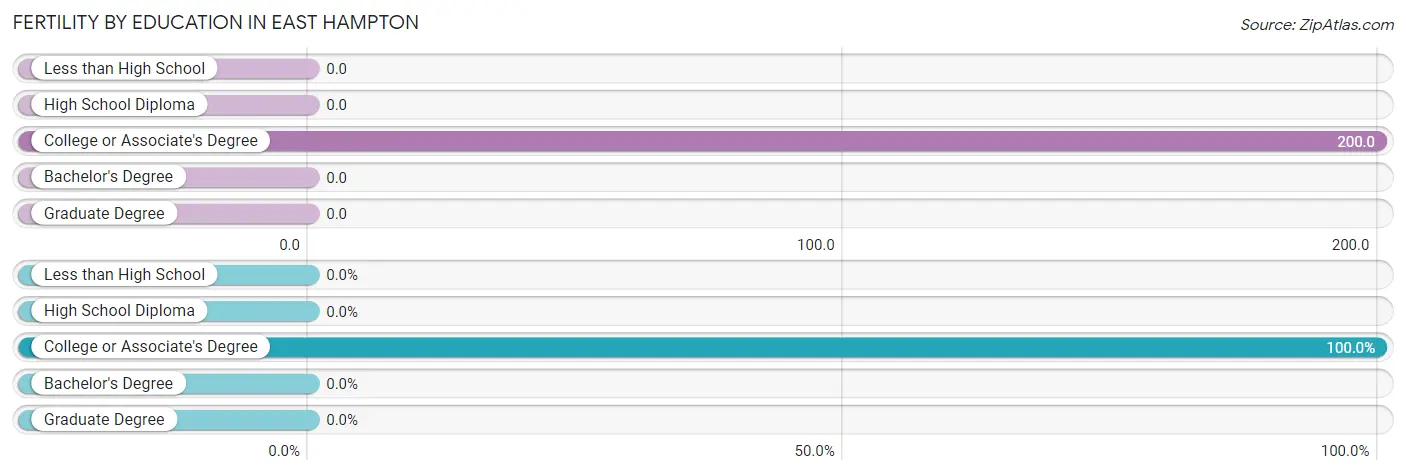
| Educational Attainment | Women with Births | Births / 1,000 Women |
| Less than High School | 0 (0.0%) | 0.0 |
| High School Diploma | 0 (0.0%) | 0.0 |
| College or Associate's Degree | 4 (100.0%) | 200.0 |
| Bachelor's Degree | 0 (0.0%) | 0.0 |
| Graduate Degree | 0 (0.0%) | 0.0 |
| Total | 4 (100.0%) | 36.0 |
Fertility by Education by Marriage Status in East Hampton
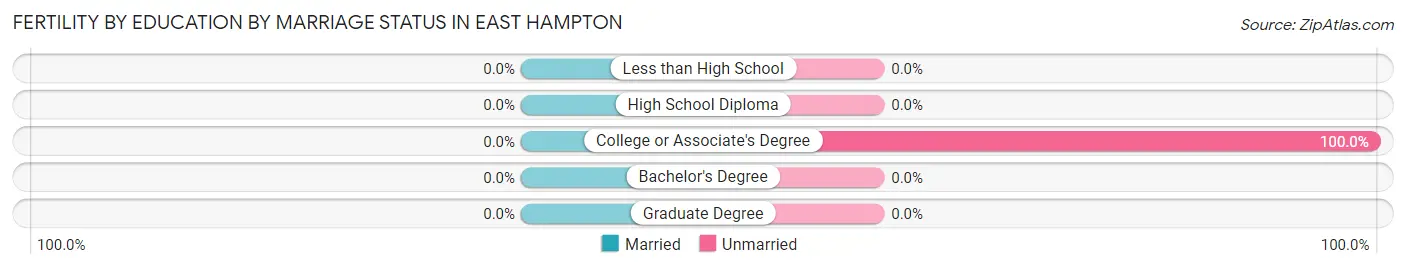
| Educational Attainment | Married | Unmarried |
| Less than High School | 0 (0.0%) | 0 (0.0%) |
| High School Diploma | 0 (0.0%) | 0 (0.0%) |
| College or Associate's Degree | 0 (0.0%) | 4 (100.0%) |
| Bachelor's Degree | 0 (0.0%) | 0 (0.0%) |
| Graduate Degree | 0 (0.0%) | 0 (0.0%) |
| Total | 0 (0.0%) | 4 (100.0%) |
Employment Characteristics in East Hampton
Employment by Class of Employer in East Hampton
Among the 554 employed individuals in East Hampton, private company employees (312 | 56.3%), self-employed (not incorporated) (92 | 16.6%), and local government employees (53 | 9.6%) make up the most common classes of employment.
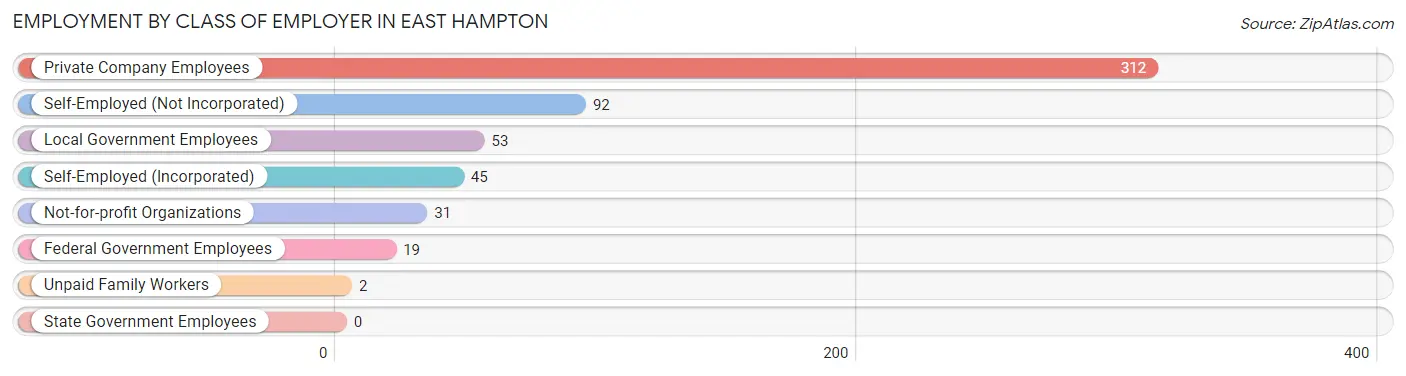
| Employer Class | # Employees | % Employees |
| Private Company Employees | 312 | 56.3% |
| Self-Employed (Incorporated) | 45 | 8.1% |
| Self-Employed (Not Incorporated) | 92 | 16.6% |
| Not-for-profit Organizations | 31 | 5.6% |
| Local Government Employees | 53 | 9.6% |
| State Government Employees | 0 | 0.0% |
| Federal Government Employees | 19 | 3.4% |
| Unpaid Family Workers | 2 | 0.4% |
| Total | 554 | 100.0% |
Employment Status by Age in East Hampton
According to the labor force statistics for East Hampton, out of the total population over 16 years of age (1,147), 48.8% or 560 individuals are in the labor force, with 1.1% or 6 of them unemployed. The age group with the highest labor force participation rate is 20 to 24 years, with 100.0% or 67 individuals in the labor force. Within the labor force, the 65 to 74 years age range has the highest percentage of unemployed individuals, with 7.1% or 4 of them being unemployed.
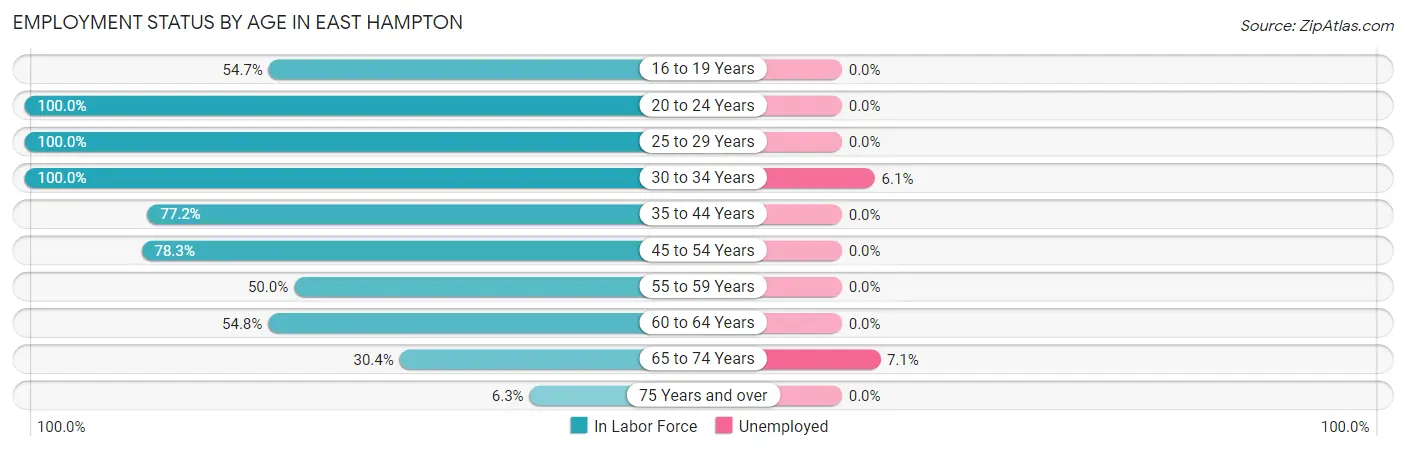
| Age Bracket | In Labor Force | Unemployed |
| 16 to 19 Years | 35 (54.7%) | 0 (0.0%) |
| 20 to 24 Years | 67 (100.0%) | 0 (0.0%) |
| 25 to 29 Years | 11 (100.0%) | 0 (0.0%) |
| 30 to 34 Years | 33 (100.0%) | 2 (6.1%) |
| 35 to 44 Years | 44 (77.2%) | 0 (0.0%) |
| 45 to 54 Years | 170 (78.3%) | 0 (0.0%) |
| 55 to 59 Years | 59 (50.0%) | 0 (0.0%) |
| 60 to 64 Years | 68 (54.8%) | 0 (0.0%) |
| 65 to 74 Years | 56 (30.4%) | 4 (7.1%) |
| 75 Years and over | 17 (6.3%) | 0 (0.0%) |
| Total | 560 (48.8%) | 6 (1.1%) |
Employment Status by Educational Attainment in East Hampton
According to labor force statistics for East Hampton, 68.8% of individuals (385) out of the total population between 25 and 64 years of age (560) are in the labor force, with 0.5% or 2 of them being unemployed. The group with the highest labor force participation rate are those with the educational attainment of bachelor's degree or higher, with 73.4% or 245 individuals in the labor force. Within the labor force, individuals with bachelor's degree or higher education have the highest percentage of unemployment, with 0.8% or 2 of them being unemployed.
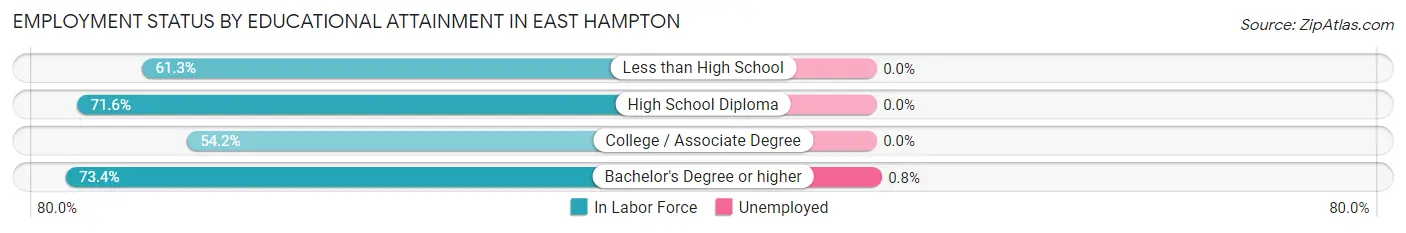
| Educational Attainment | In Labor Force | Unemployed |
| Less than High School | 19 (61.3%) | 0 (0.0%) |
| High School Diploma | 63 (71.6%) | 0 (0.0%) |
| College / Associate Degree | 58 (54.2%) | 0 (0.0%) |
| Bachelor's Degree or higher | 245 (73.4%) | 3 (0.8%) |
| Total | 385 (68.8%) | 3 (0.5%) |
Employment Occupations by Sex in East Hampton
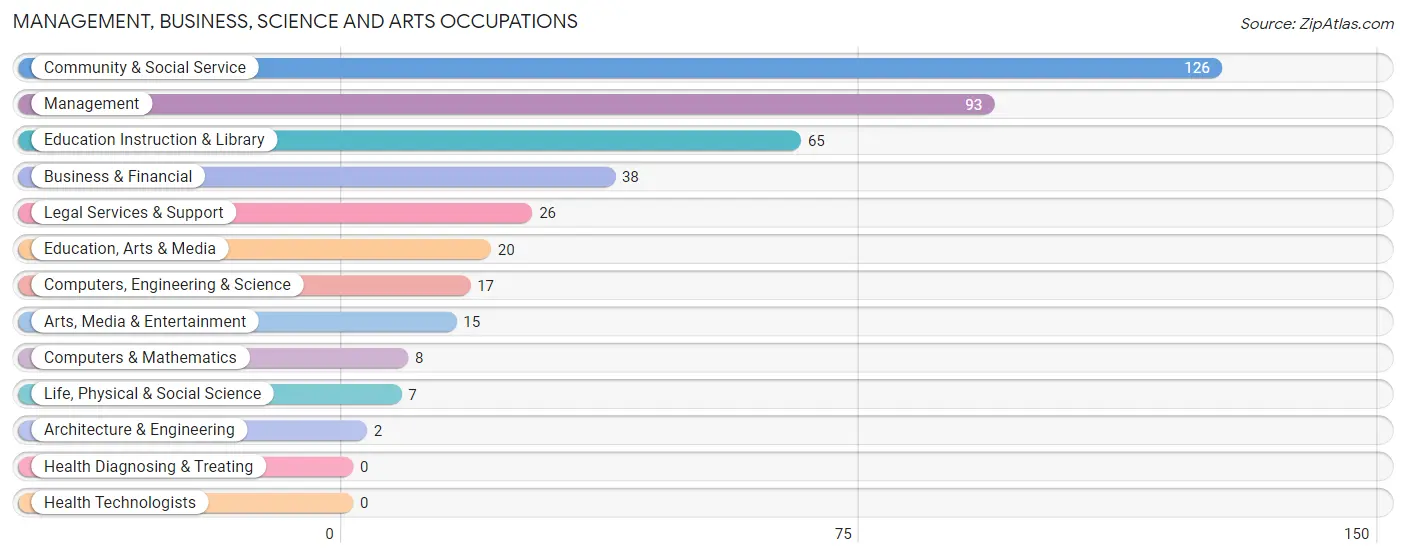
Management, Business, Science and Arts Occupations
The most common Management, Business, Science and Arts occupations in East Hampton are Community & Social Service (126 | 22.7%), Management (93 | 16.8%), Education Instruction & Library (65 | 11.7%), Business & Financial (38 | 6.9%), and Legal Services & Support (26 | 4.7%).
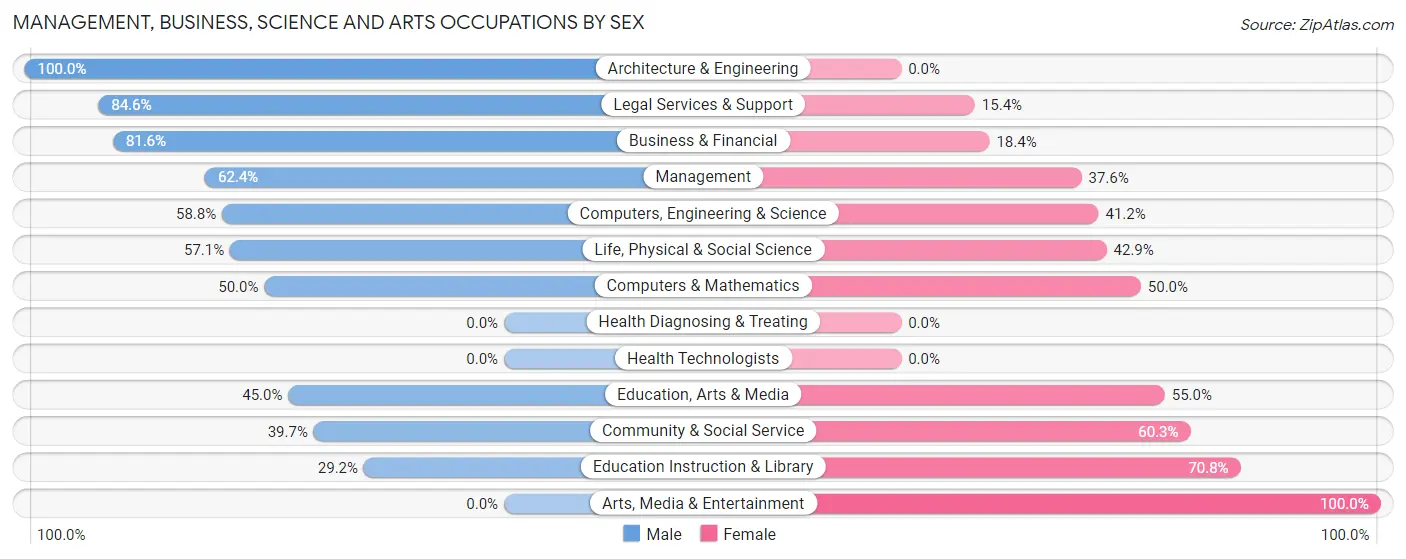
Management, Business, Science and Arts Occupations by Sex
Within the Management, Business, Science and Arts occupations in East Hampton, the most male-oriented occupations are Architecture & Engineering (100.0%), Legal Services & Support (84.6%), and Business & Financial (81.6%), while the most female-oriented occupations are Arts, Media & Entertainment (100.0%), Education Instruction & Library (70.8%), and Community & Social Service (60.3%).
| Occupation | Male | Female |
| Management | 58 (62.4%) | 35 (37.6%) |
| Business & Financial | 31 (81.6%) | 7 (18.4%) |
| Computers, Engineering & Science | 10 (58.8%) | 7 (41.2%) |
| Computers & Mathematics | 4 (50.0%) | 4 (50.0%) |
| Architecture & Engineering | 2 (100.0%) | 0 (0.0%) |
| Life, Physical & Social Science | 4 (57.1%) | 3 (42.9%) |
| Community & Social Service | 50 (39.7%) | 76 (60.3%) |
| Education, Arts & Media | 9 (45.0%) | 11 (55.0%) |
| Legal Services & Support | 22 (84.6%) | 4 (15.4%) |
| Education Instruction & Library | 19 (29.2%) | 46 (70.8%) |
| Arts, Media & Entertainment | 0 (0.0%) | 15 (100.0%) |
| Health Diagnosing & Treating | 0 (0.0%) | 0 (0.0%) |
| Health Technologists | 0 (0.0%) | 0 (0.0%) |
| Total (Category) | 149 (54.4%) | 125 (45.6%) |
| Total (Overall) | 352 (63.5%) | 202 (36.5%) |
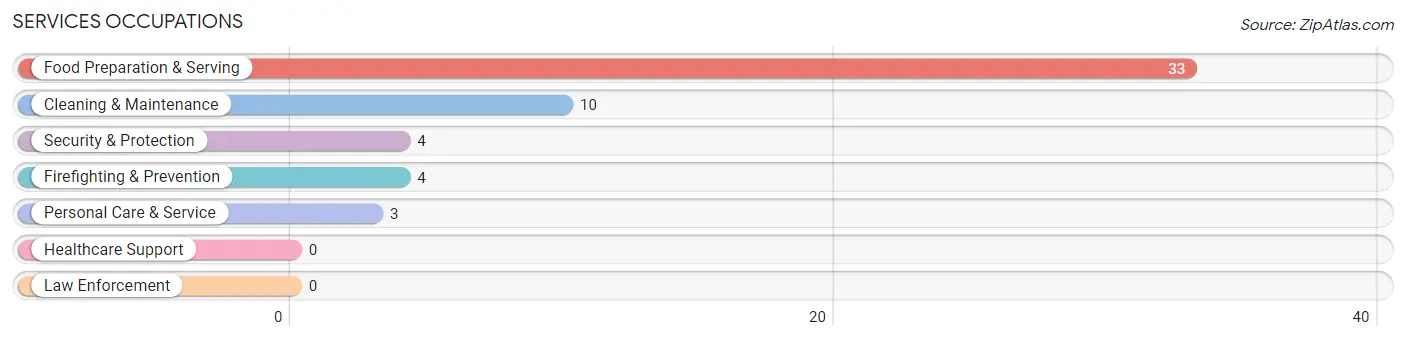
Services Occupations
The most common Services occupations in East Hampton are Food Preparation & Serving (33 | 6.0%), Cleaning & Maintenance (10 | 1.8%), Security & Protection (4 | 0.7%), Firefighting & Prevention (4 | 0.7%), and Personal Care & Service (3 | 0.5%).
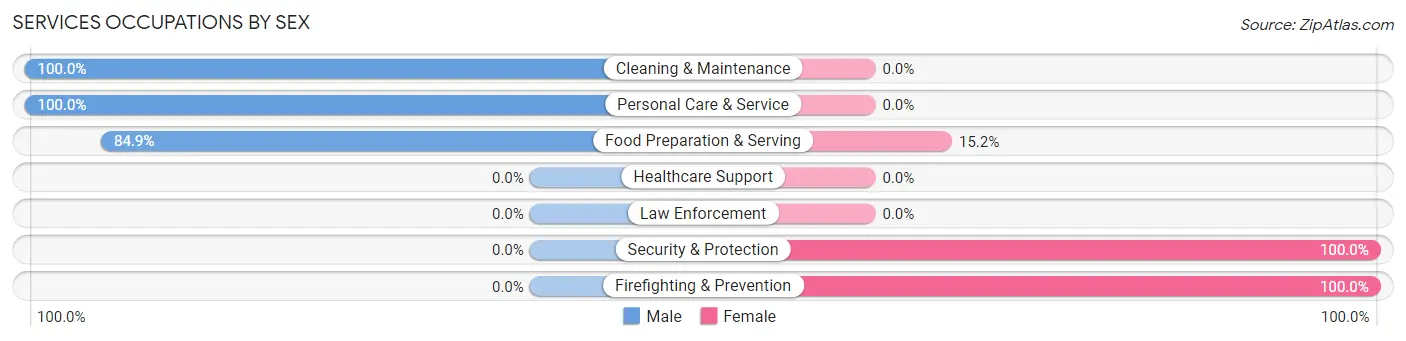
Services Occupations by Sex
Within the Services occupations in East Hampton, the most male-oriented occupations are Cleaning & Maintenance (100.0%), Personal Care & Service (100.0%), and Food Preparation & Serving (84.9%), while the most female-oriented occupations are Security & Protection (100.0%), Firefighting & Prevention (100.0%), and Food Preparation & Serving (15.1%).
| Occupation | Male | Female |
| Healthcare Support | 0 (0.0%) | 0 (0.0%) |
| Security & Protection | 0 (0.0%) | 4 (100.0%) |
| Firefighting & Prevention | 0 (0.0%) | 4 (100.0%) |
| Law Enforcement | 0 (0.0%) | 0 (0.0%) |
| Food Preparation & Serving | 28 (84.9%) | 5 (15.1%) |
| Cleaning & Maintenance | 10 (100.0%) | 0 (0.0%) |
| Personal Care & Service | 3 (100.0%) | 0 (0.0%) |
| Total (Category) | 41 (82.0%) | 9 (18.0%) |
| Total (Overall) | 352 (63.5%) | 202 (36.5%) |
Sales and Office Occupations
The most common Sales and Office occupations in East Hampton are Sales & Related (62 | 11.2%), and Office & Administration (44 | 7.9%).
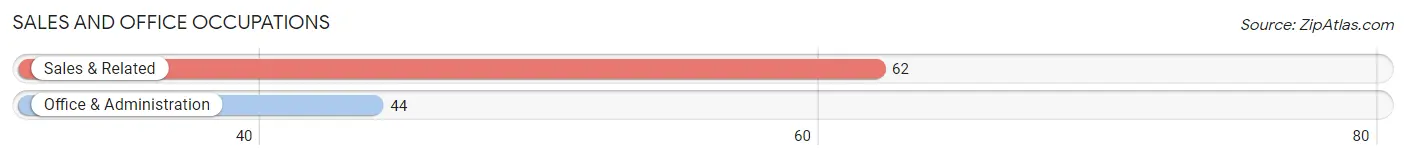
Sales and Office Occupations by Sex
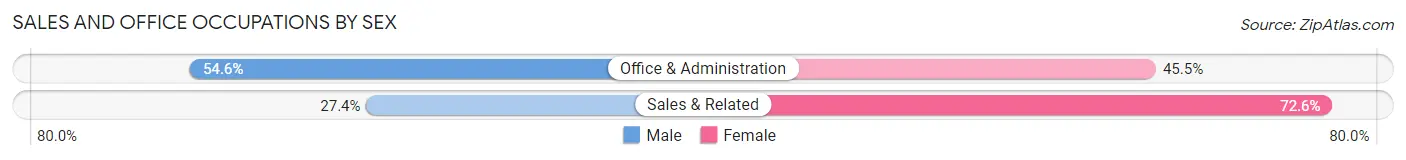
| Occupation | Male | Female |
| Sales & Related | 17 (27.4%) | 45 (72.6%) |
| Office & Administration | 24 (54.5%) | 20 (45.5%) |
| Total (Category) | 41 (38.7%) | 65 (61.3%) |
| Total (Overall) | 352 (63.5%) | 202 (36.5%) |
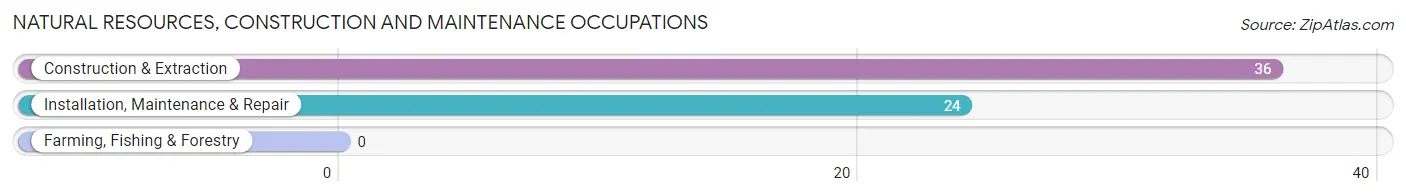
Natural Resources, Construction and Maintenance Occupations
The most common Natural Resources, Construction and Maintenance occupations in East Hampton are Construction & Extraction (36 | 6.5%), and Installation, Maintenance & Repair (24 | 4.3%).
Natural Resources, Construction and Maintenance Occupations by Sex
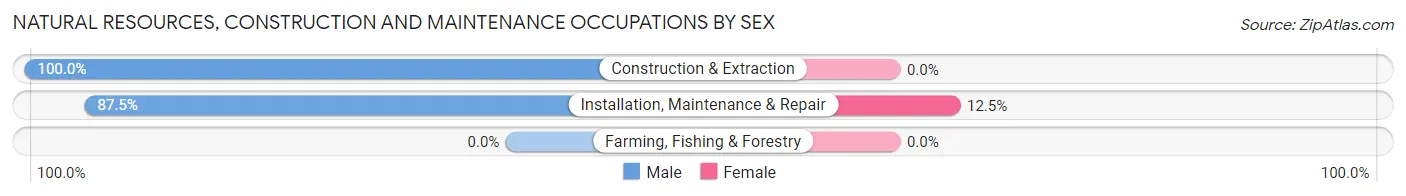
| Occupation | Male | Female |
| Farming, Fishing & Forestry | 0 (0.0%) | 0 (0.0%) |
| Construction & Extraction | 36 (100.0%) | 0 (0.0%) |
| Installation, Maintenance & Repair | 21 (87.5%) | 3 (12.5%) |
| Total (Category) | 57 (95.0%) | 3 (5.0%) |
| Total (Overall) | 352 (63.5%) | 202 (36.5%) |
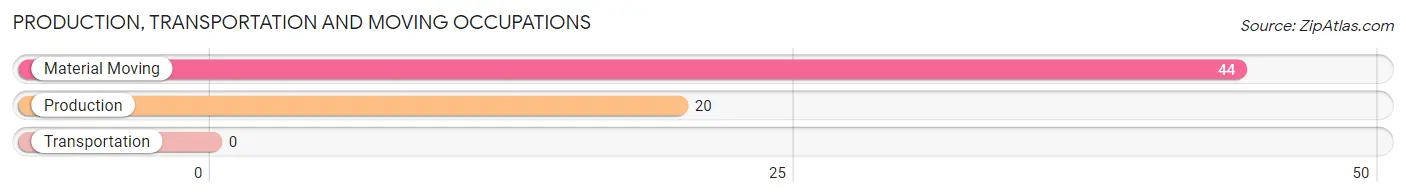
Production, Transportation and Moving Occupations
The most common Production, Transportation and Moving occupations in East Hampton are Material Moving (44 | 7.9%), and Production (20 | 3.6%).
Production, Transportation and Moving Occupations by Sex
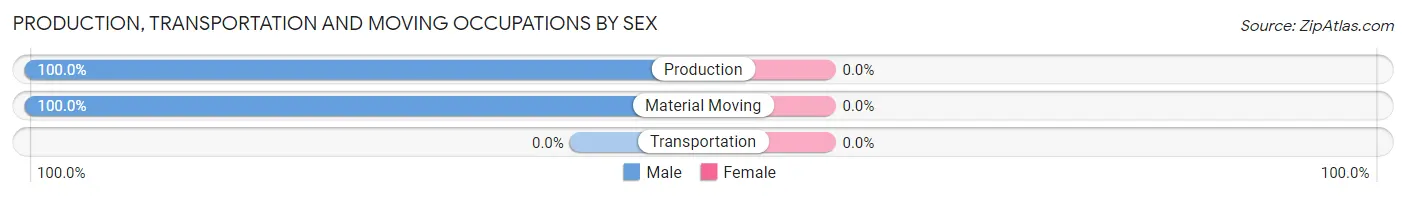
| Occupation | Male | Female |
| Production | 20 (100.0%) | 0 (0.0%) |
| Transportation | 0 (0.0%) | 0 (0.0%) |
| Material Moving | 44 (100.0%) | 0 (0.0%) |
| Total (Category) | 64 (100.0%) | 0 (0.0%) |
| Total (Overall) | 352 (63.5%) | 202 (36.5%) |
Employment Industries by Sex in East Hampton
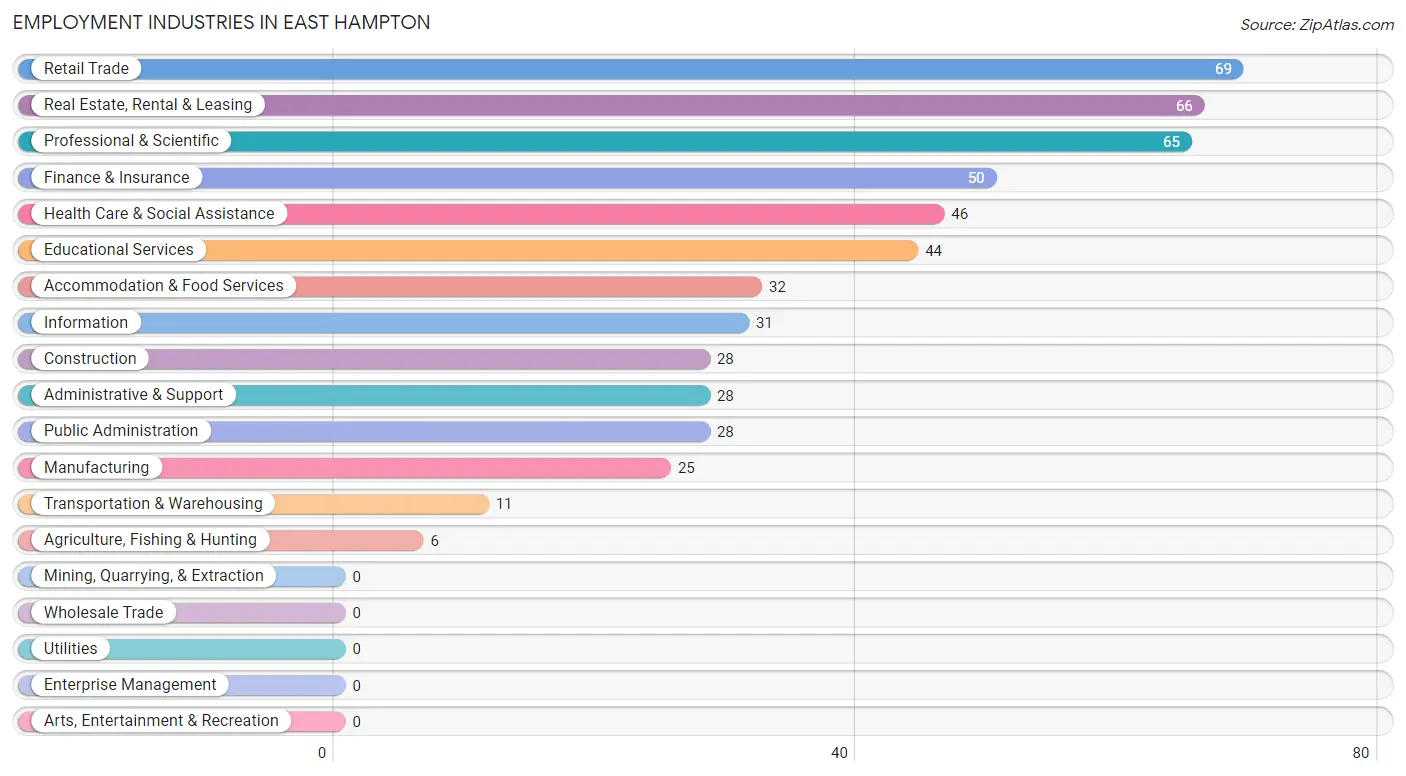
Employment Industries in East Hampton
The major employment industries in East Hampton include Retail Trade (69 | 12.4%), Real Estate, Rental & Leasing (66 | 11.9%), Professional & Scientific (65 | 11.7%), Finance & Insurance (50 | 9.0%), and Health Care & Social Assistance (46 | 8.3%).
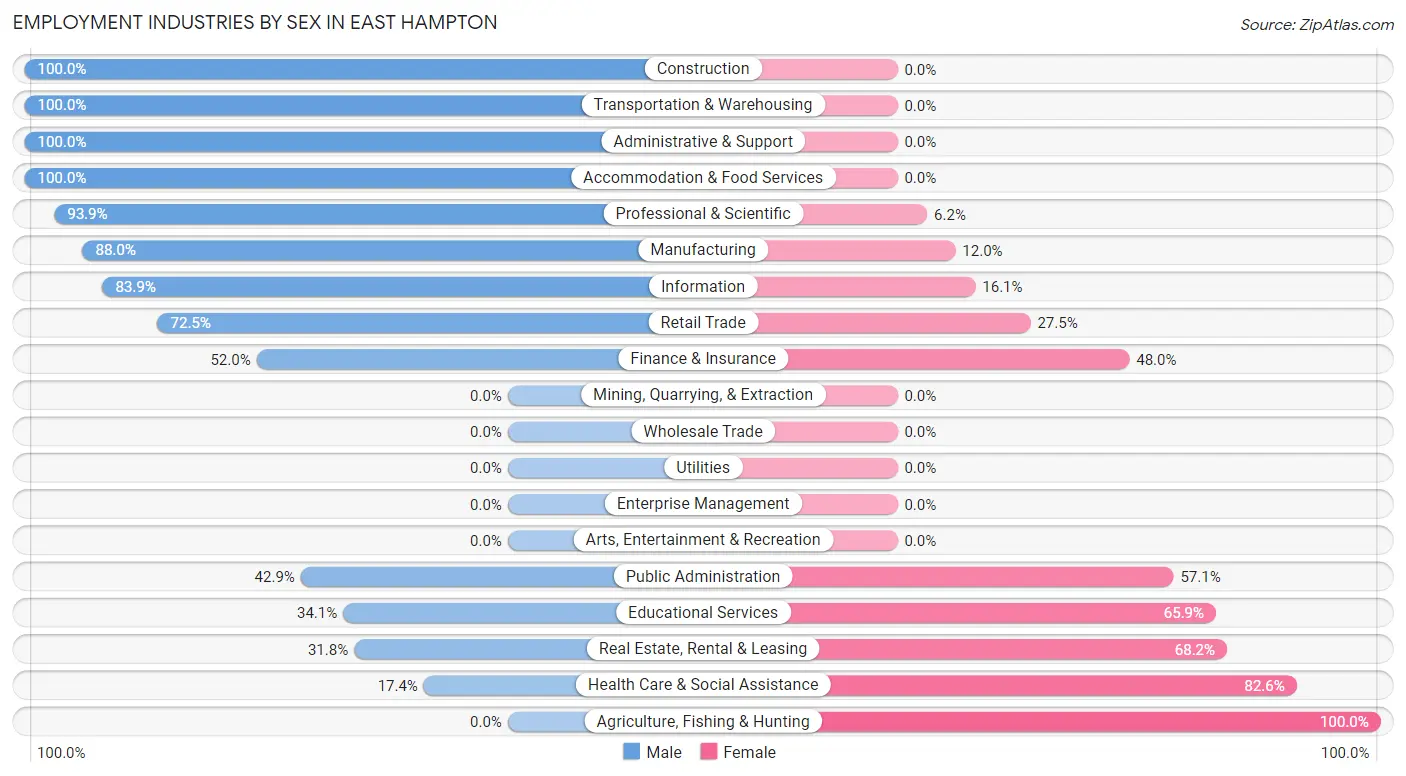
Employment Industries by Sex in East Hampton
The East Hampton industries that see more men than women are Construction (100.0%), Transportation & Warehousing (100.0%), and Administrative & Support (100.0%), whereas the industries that tend to have a higher number of women are Agriculture, Fishing & Hunting (100.0%), Health Care & Social Assistance (82.6%), and Real Estate, Rental & Leasing (68.2%).
| Industry | Male | Female |
| Agriculture, Fishing & Hunting | 0 (0.0%) | 6 (100.0%) |
| Mining, Quarrying, & Extraction | 0 (0.0%) | 0 (0.0%) |
| Construction | 28 (100.0%) | 0 (0.0%) |
| Manufacturing | 22 (88.0%) | 3 (12.0%) |
| Wholesale Trade | 0 (0.0%) | 0 (0.0%) |
| Retail Trade | 50 (72.5%) | 19 (27.5%) |
| Transportation & Warehousing | 11 (100.0%) | 0 (0.0%) |
| Utilities | 0 (0.0%) | 0 (0.0%) |
| Information | 26 (83.9%) | 5 (16.1%) |
| Finance & Insurance | 26 (52.0%) | 24 (48.0%) |
| Real Estate, Rental & Leasing | 21 (31.8%) | 45 (68.2%) |
| Professional & Scientific | 61 (93.9%) | 4 (6.1%) |
| Enterprise Management | 0 (0.0%) | 0 (0.0%) |
| Administrative & Support | 28 (100.0%) | 0 (0.0%) |
| Educational Services | 15 (34.1%) | 29 (65.9%) |
| Health Care & Social Assistance | 8 (17.4%) | 38 (82.6%) |
| Arts, Entertainment & Recreation | 0 (0.0%) | 0 (0.0%) |
| Accommodation & Food Services | 32 (100.0%) | 0 (0.0%) |
| Public Administration | 12 (42.9%) | 16 (57.1%) |
| Total | 352 (63.5%) | 202 (36.5%) |
Education in East Hampton
School Enrollment in East Hampton
The most common levels of schooling among the 196 students in East Hampton are high school (79 | 40.3%), middle school (59 | 30.1%), and elementary school (29 | 14.8%).
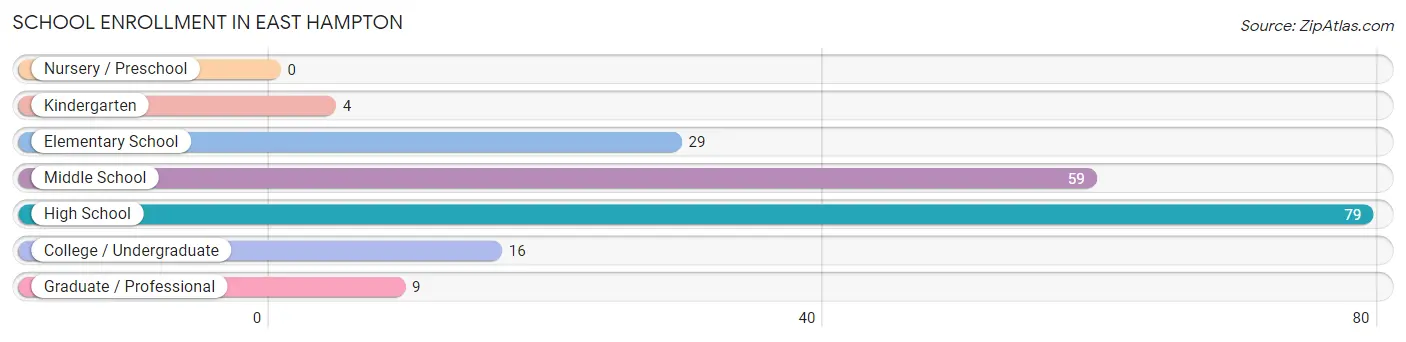
| School Level | # Students | % Students |
| Nursery / Preschool | 0 | 0.0% |
| Kindergarten | 4 | 2.0% |
| Elementary School | 29 | 14.8% |
| Middle School | 59 | 30.1% |
| High School | 79 | 40.3% |
| College / Undergraduate | 16 | 8.2% |
| Graduate / Professional | 9 | 4.6% |
| Total | 196 | 100.0% |
School Enrollment by Age by Funding Source in East Hampton
Out of a total of 196 students who are enrolled in schools in East Hampton, 85 (43.4%) attend a private institution, while the remaining 111 (56.6%) are enrolled in public schools. The age group of 35 years and over has the highest likelihood of being enrolled in private schools, with 11 (68.8% in the age bracket) enrolled. Conversely, the age group of 20 to 24 year olds has the lowest likelihood of being enrolled in a private school, with 4 (100.0% in the age bracket) attending a public institution.
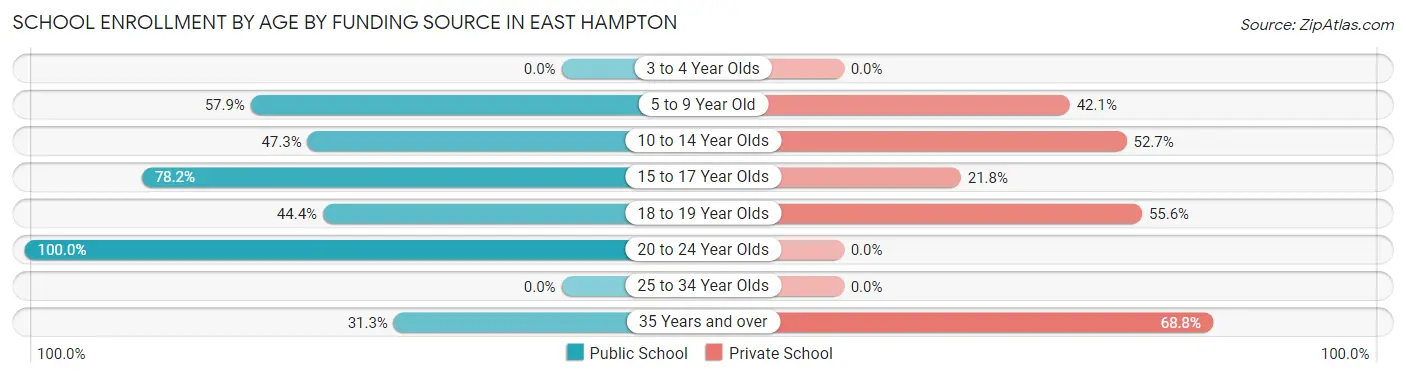
| Age Bracket | Public School | Private School |
| 3 to 4 Year Olds | 0 (0.0%) | 0 (0.0%) |
| 5 to 9 Year Old | 11 (57.9%) | 8 (42.1%) |
| 10 to 14 Year Olds | 44 (47.3%) | 49 (52.7%) |
| 15 to 17 Year Olds | 43 (78.2%) | 12 (21.8%) |
| 18 to 19 Year Olds | 4 (44.4%) | 5 (55.6%) |
| 20 to 24 Year Olds | 4 (100.0%) | 0 (0.0%) |
| 25 to 34 Year Olds | 0 (0.0%) | 0 (0.0%) |
| 35 Years and over | 5 (31.2%) | 11 (68.8%) |
| Total | 111 (56.6%) | 85 (43.4%) |
Educational Attainment by Field of Study in East Hampton
Business (146 | 19.4%), social sciences (114 | 15.2%), visual & performing arts (107 | 14.2%), education (91 | 12.1%), and psychology (70 | 9.3%) are the most common fields of study among 752 individuals in East Hampton who have obtained a bachelor's degree or higher.
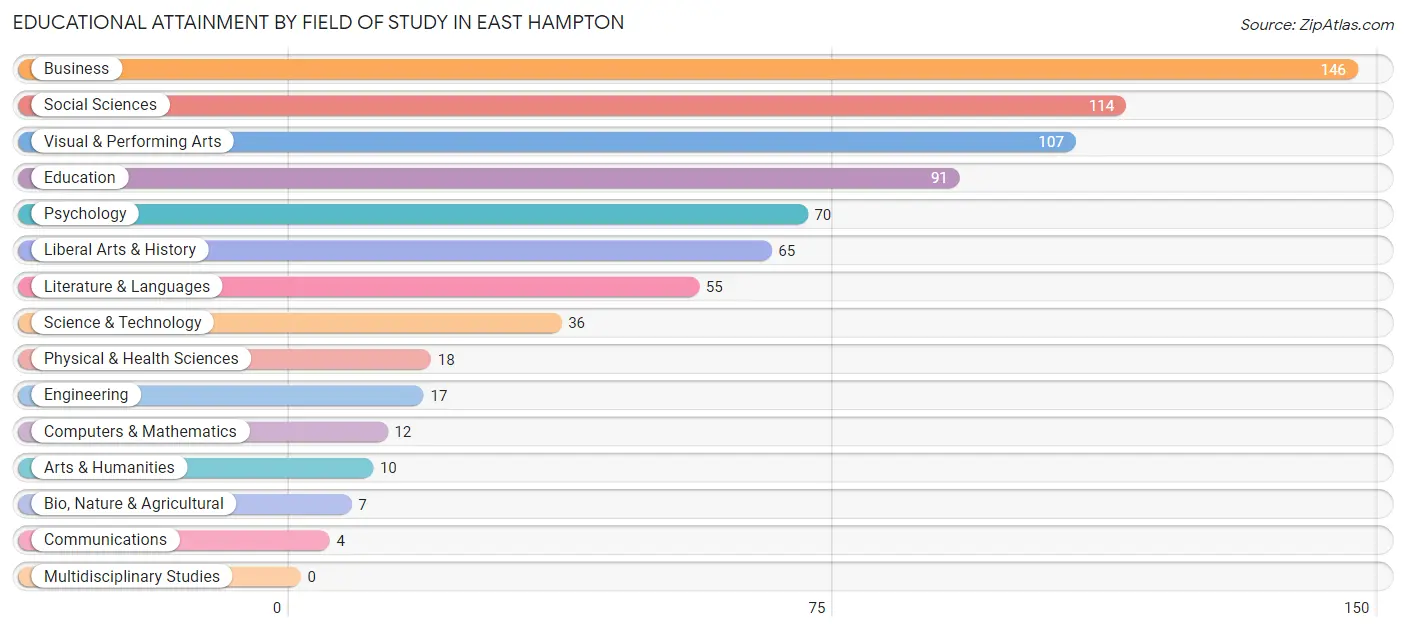
| Field of Study | # Graduates | % Graduates |
| Computers & Mathematics | 12 | 1.6% |
| Bio, Nature & Agricultural | 7 | 0.9% |
| Physical & Health Sciences | 18 | 2.4% |
| Psychology | 70 | 9.3% |
| Social Sciences | 114 | 15.2% |
| Engineering | 17 | 2.3% |
| Multidisciplinary Studies | 0 | 0.0% |
| Science & Technology | 36 | 4.8% |
| Business | 146 | 19.4% |
| Education | 91 | 12.1% |
| Literature & Languages | 55 | 7.3% |
| Liberal Arts & History | 65 | 8.6% |
| Visual & Performing Arts | 107 | 14.2% |
| Communications | 4 | 0.5% |
| Arts & Humanities | 10 | 1.3% |
| Total | 752 | 100.0% |
Transportation & Commute in East Hampton
Vehicle Availability by Sex in East Hampton
The most prevalent vehicle ownership categories in East Hampton are males with 2 vehicles (168, accounting for 47.7%) and females with 2 vehicles (96, making up 83.2%).
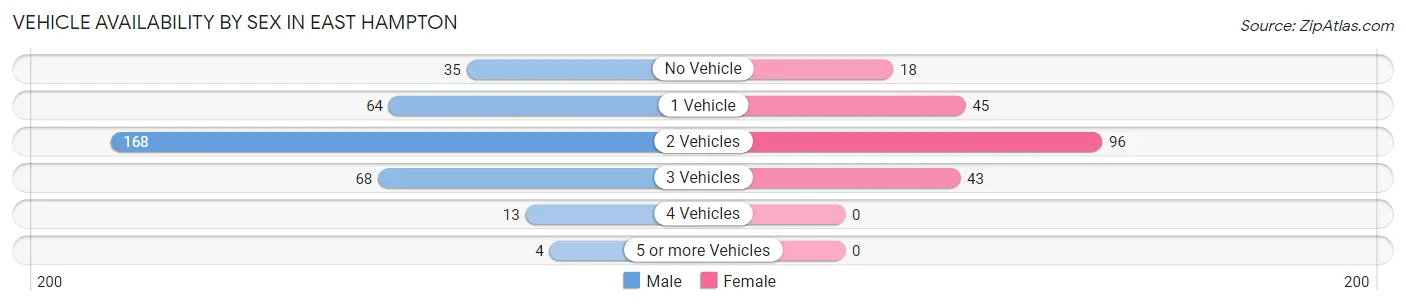
| Vehicles Available | Male | Female |
| No Vehicle | 35 (9.9%) | 18 (8.9%) |
| 1 Vehicle | 64 (18.2%) | 45 (22.3%) |
| 2 Vehicles | 168 (47.7%) | 96 (47.5%) |
| 3 Vehicles | 68 (19.3%) | 43 (21.3%) |
| 4 Vehicles | 13 (3.7%) | 0 (0.0%) |
| 5 or more Vehicles | 4 (1.1%) | 0 (0.0%) |
| Total | 352 (100.0%) | 202 (100.0%) |
Commute Time in East Hampton
The most frequently occuring commute durations in East Hampton are 15 to 19 minutes (86 commuters, 18.9%), less than 5 minutes (77 commuters, 16.9%), and 5 to 9 minutes (71 commuters, 15.6%).
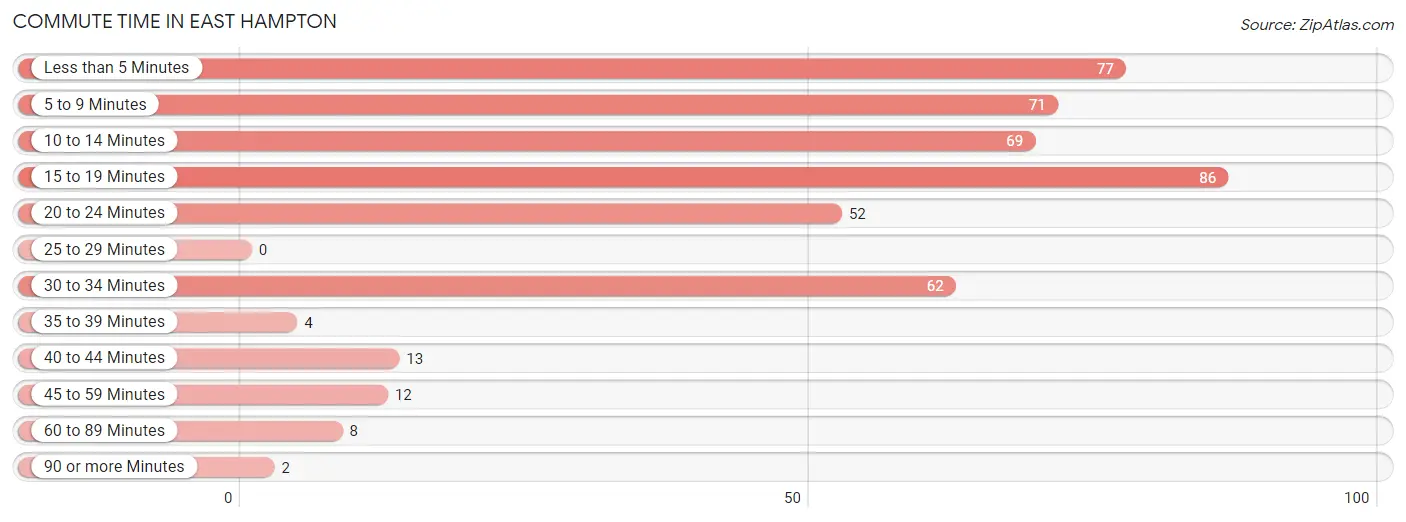
| Commute Time | # Commuters | % Commuters |
| Less than 5 Minutes | 77 | 16.9% |
| 5 to 9 Minutes | 71 | 15.6% |
| 10 to 14 Minutes | 69 | 15.1% |
| 15 to 19 Minutes | 86 | 18.9% |
| 20 to 24 Minutes | 52 | 11.4% |
| 25 to 29 Minutes | 0 | 0.0% |
| 30 to 34 Minutes | 62 | 13.6% |
| 35 to 39 Minutes | 4 | 0.9% |
| 40 to 44 Minutes | 13 | 2.9% |
| 45 to 59 Minutes | 12 | 2.6% |
| 60 to 89 Minutes | 8 | 1.8% |
| 90 or more Minutes | 2 | 0.4% |
Commute Time by Sex in East Hampton
The most common commute times in East Hampton are 15 to 19 minutes (70 commuters, 25.1%) for males and less than 5 minutes (52 commuters, 29.4%) for females.
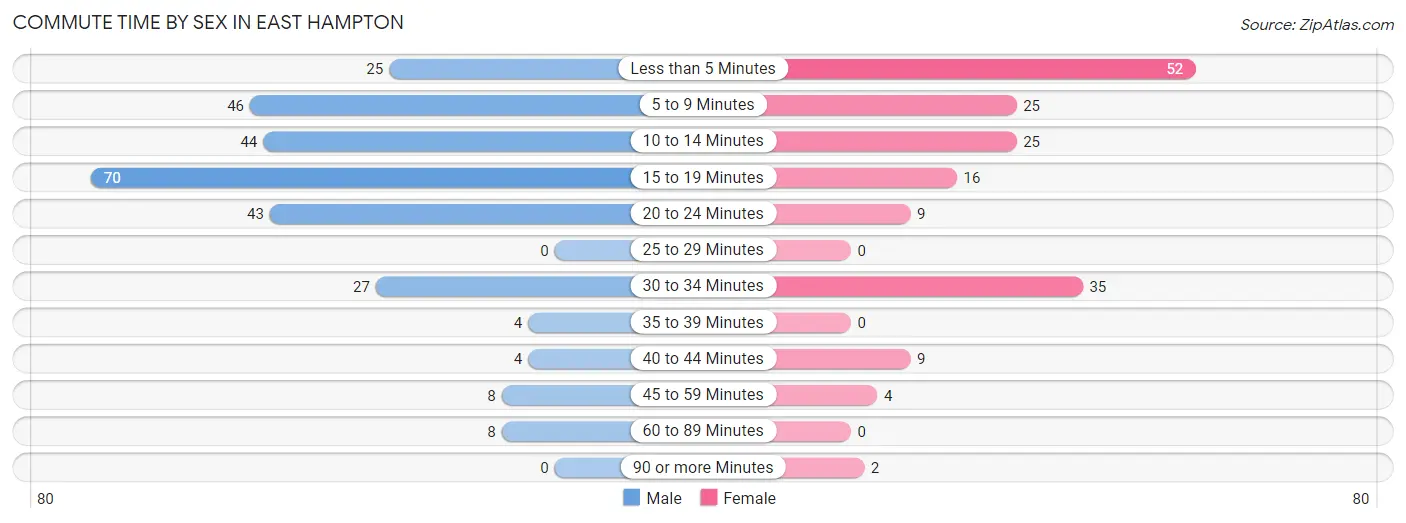
| Commute Time | Male | Female |
| Less than 5 Minutes | 25 (9.0%) | 52 (29.4%) |
| 5 to 9 Minutes | 46 (16.5%) | 25 (14.1%) |
| 10 to 14 Minutes | 44 (15.8%) | 25 (14.1%) |
| 15 to 19 Minutes | 70 (25.1%) | 16 (9.0%) |
| 20 to 24 Minutes | 43 (15.4%) | 9 (5.1%) |
| 25 to 29 Minutes | 0 (0.0%) | 0 (0.0%) |
| 30 to 34 Minutes | 27 (9.7%) | 35 (19.8%) |
| 35 to 39 Minutes | 4 (1.4%) | 0 (0.0%) |
| 40 to 44 Minutes | 4 (1.4%) | 9 (5.1%) |
| 45 to 59 Minutes | 8 (2.9%) | 4 (2.3%) |
| 60 to 89 Minutes | 8 (2.9%) | 0 (0.0%) |
| 90 or more Minutes | 0 (0.0%) | 2 (1.1%) |
Time of Departure to Work by Sex in East Hampton
The most frequent times of departure to work in East Hampton are 9:00 AM to 9:59 AM (61, 21.9%) for males and 8:30 AM to 8:59 AM (49, 27.7%) for females.
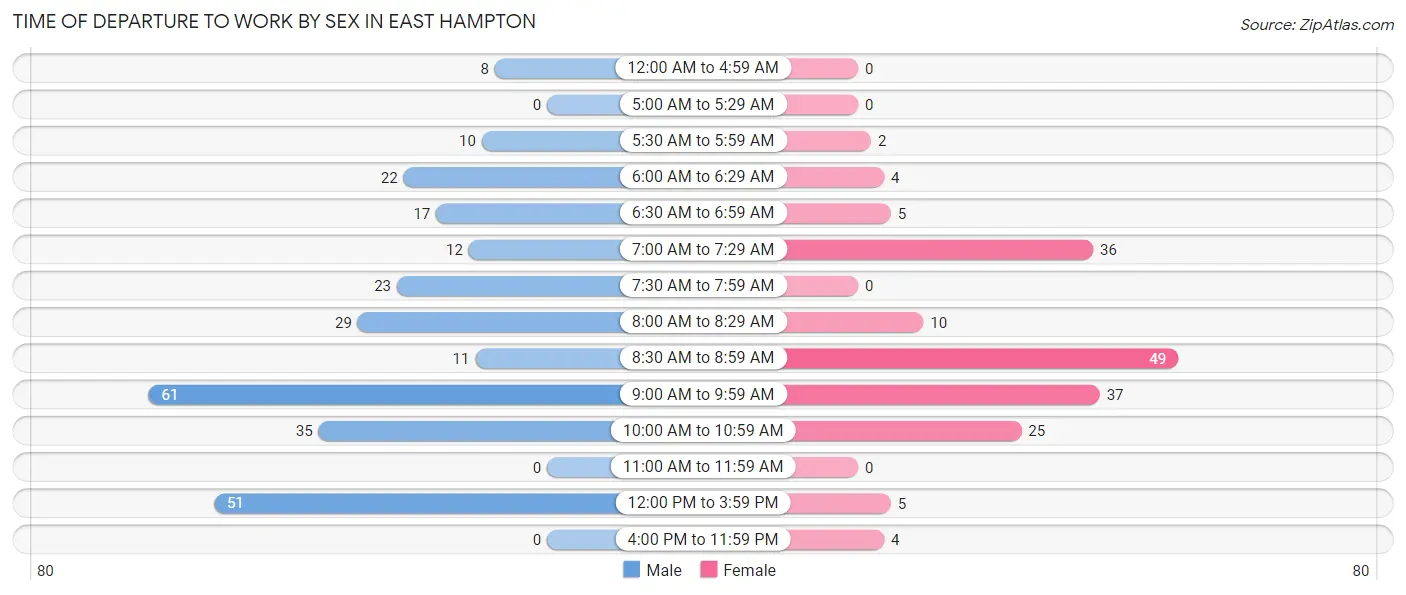
| Time of Departure | Male | Female |
| 12:00 AM to 4:59 AM | 8 (2.9%) | 0 (0.0%) |
| 5:00 AM to 5:29 AM | 0 (0.0%) | 0 (0.0%) |
| 5:30 AM to 5:59 AM | 10 (3.6%) | 2 (1.1%) |
| 6:00 AM to 6:29 AM | 22 (7.9%) | 4 (2.3%) |
| 6:30 AM to 6:59 AM | 17 (6.1%) | 5 (2.8%) |
| 7:00 AM to 7:29 AM | 12 (4.3%) | 36 (20.3%) |
| 7:30 AM to 7:59 AM | 23 (8.2%) | 0 (0.0%) |
| 8:00 AM to 8:29 AM | 29 (10.4%) | 10 (5.7%) |
| 8:30 AM to 8:59 AM | 11 (3.9%) | 49 (27.7%) |
| 9:00 AM to 9:59 AM | 61 (21.9%) | 37 (20.9%) |
| 10:00 AM to 10:59 AM | 35 (12.5%) | 25 (14.1%) |
| 11:00 AM to 11:59 AM | 0 (0.0%) | 0 (0.0%) |
| 12:00 PM to 3:59 PM | 51 (18.3%) | 5 (2.8%) |
| 4:00 PM to 11:59 PM | 0 (0.0%) | 4 (2.3%) |
| Total | 279 (100.0%) | 177 (100.0%) |
Housing Occupancy in East Hampton
Occupancy by Ownership in East Hampton
Of the total 646 dwellings in East Hampton, owner-occupied units account for 505 (78.2%), while renter-occupied units make up 141 (21.8%).
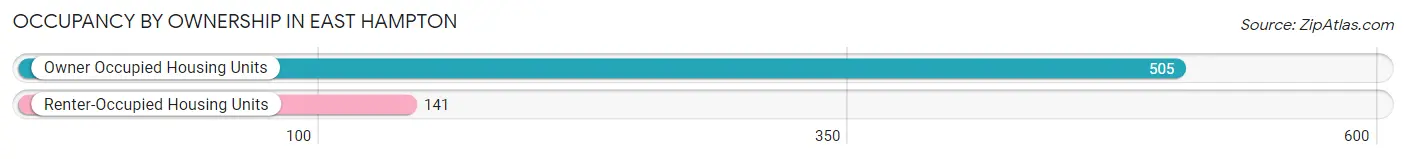
| Occupancy | # Housing Units | % Housing Units |
| Owner Occupied Housing Units | 505 | 78.2% |
| Renter-Occupied Housing Units | 141 | 21.8% |
| Total Occupied Housing Units | 646 | 100.0% |
Occupancy by Household Size in East Hampton
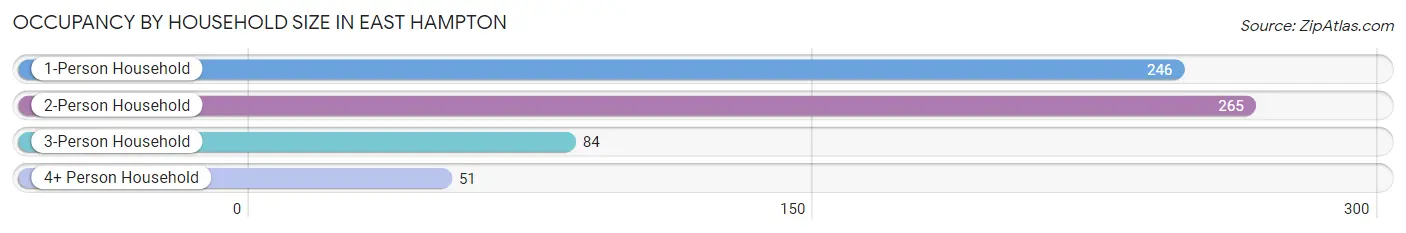
| Household Size | # Housing Units | % Housing Units |
| 1-Person Household | 246 | 38.1% |
| 2-Person Household | 265 | 41.0% |
| 3-Person Household | 84 | 13.0% |
| 4+ Person Household | 51 | 7.9% |
| Total Housing Units | 646 | 100.0% |
Occupancy by Ownership by Household Size in East Hampton
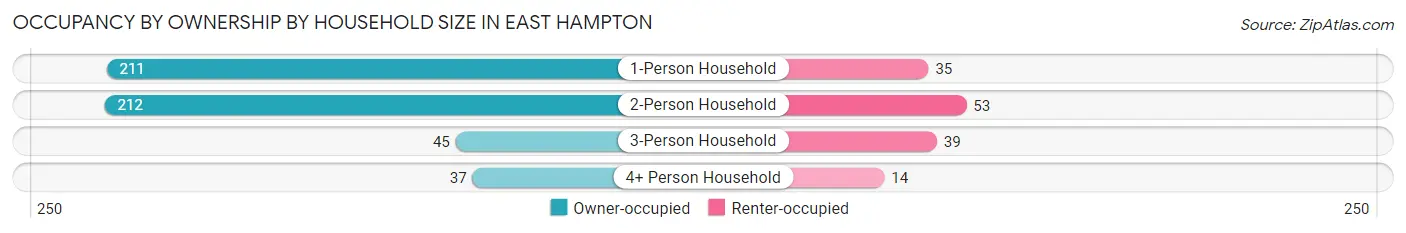
| Household Size | Owner-occupied | Renter-occupied |
| 1-Person Household | 211 (85.8%) | 35 (14.2%) |
| 2-Person Household | 212 (80.0%) | 53 (20.0%) |
| 3-Person Household | 45 (53.6%) | 39 (46.4%) |
| 4+ Person Household | 37 (72.6%) | 14 (27.5%) |
| Total Housing Units | 505 (78.2%) | 141 (21.8%) |
Occupancy by Educational Attainment in East Hampton
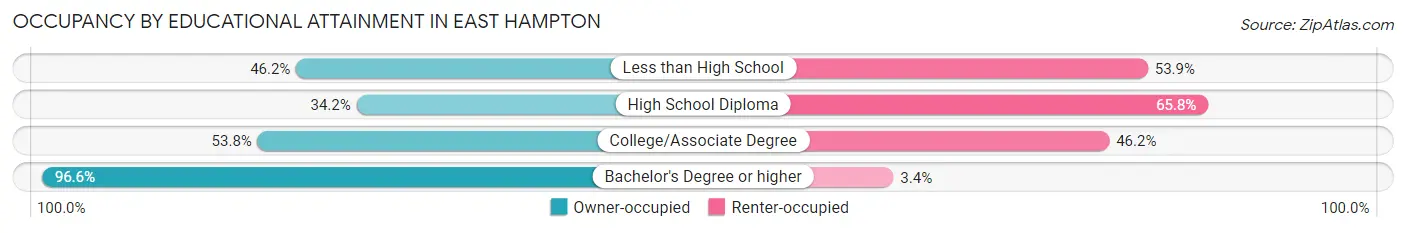
| Household Size | Owner-occupied | Renter-occupied |
| Less than High School | 12 (46.2%) | 14 (53.8%) |
| High School Diploma | 27 (34.2%) | 52 (65.8%) |
| College/Associate Degree | 71 (53.8%) | 61 (46.2%) |
| Bachelor's Degree or higher | 395 (96.6%) | 14 (3.4%) |
Occupancy by Age of Householder in East Hampton
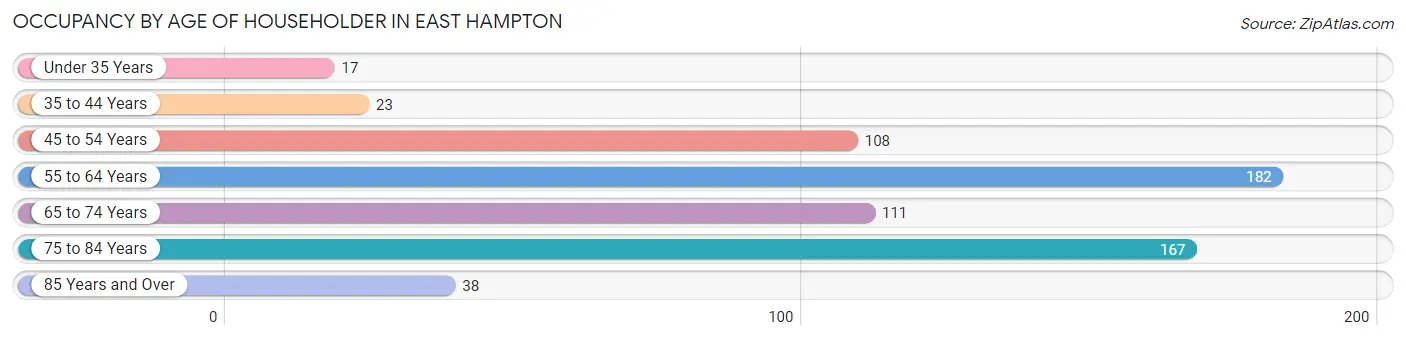
| Age Bracket | # Households | % Households |
| Under 35 Years | 17 | 2.6% |
| 35 to 44 Years | 23 | 3.6% |
| 45 to 54 Years | 108 | 16.7% |
| 55 to 64 Years | 182 | 28.2% |
| 65 to 74 Years | 111 | 17.2% |
| 75 to 84 Years | 167 | 25.9% |
| 85 Years and Over | 38 | 5.9% |
| Total | 646 | 100.0% |
Housing Finances in East Hampton
Median Income by Occupancy in East Hampton
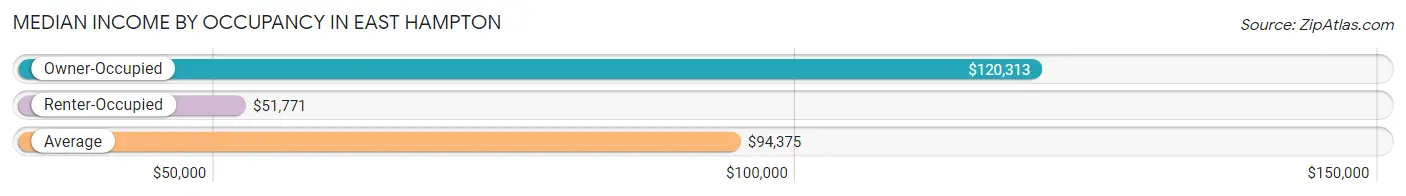
| Occupancy Type | # Households | Median Income |
| Owner-Occupied | 505 (78.2%) | $120,313 |
| Renter-Occupied | 141 (21.8%) | $51,771 |
| Average | 646 (100.0%) | $94,375 |
Occupancy by Householder Income Bracket in East Hampton
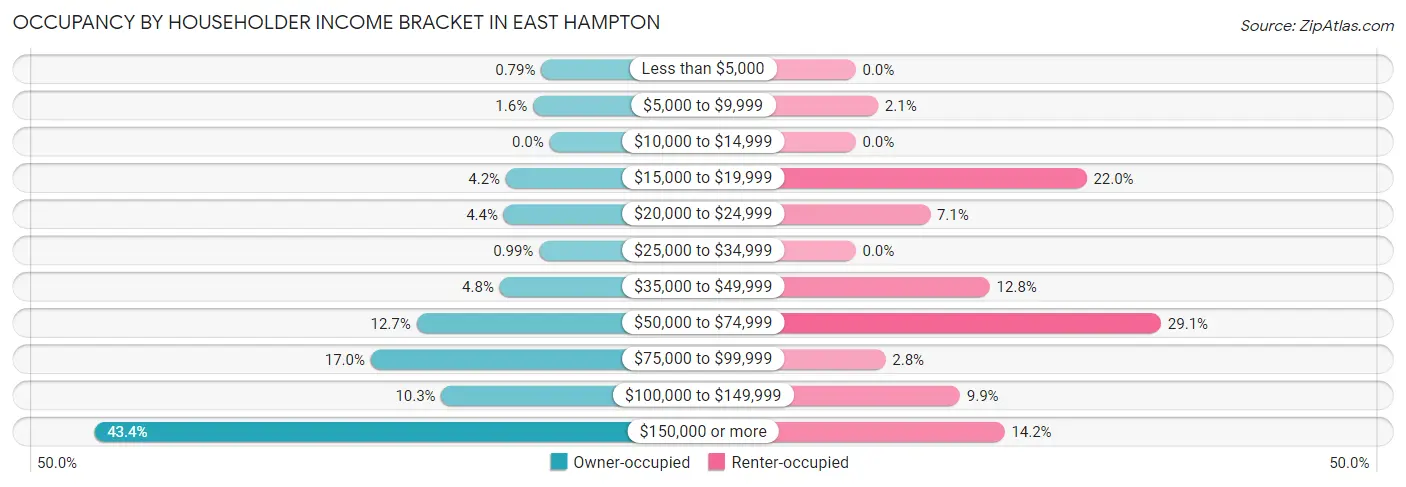
| Income Bracket | Owner-occupied | Renter-occupied |
| Less than $5,000 | 4 (0.8%) | 0 (0.0%) |
| $5,000 to $9,999 | 8 (1.6%) | 3 (2.1%) |
| $10,000 to $14,999 | 0 (0.0%) | 0 (0.0%) |
| $15,000 to $19,999 | 21 (4.2%) | 31 (22.0%) |
| $20,000 to $24,999 | 22 (4.4%) | 10 (7.1%) |
| $25,000 to $34,999 | 5 (1.0%) | 0 (0.0%) |
| $35,000 to $49,999 | 24 (4.8%) | 18 (12.8%) |
| $50,000 to $74,999 | 64 (12.7%) | 41 (29.1%) |
| $75,000 to $99,999 | 86 (17.0%) | 4 (2.8%) |
| $100,000 to $149,999 | 52 (10.3%) | 14 (9.9%) |
| $150,000 or more | 219 (43.4%) | 20 (14.2%) |
| Total | 505 (100.0%) | 141 (100.0%) |
Monthly Housing Cost Tiers in East Hampton
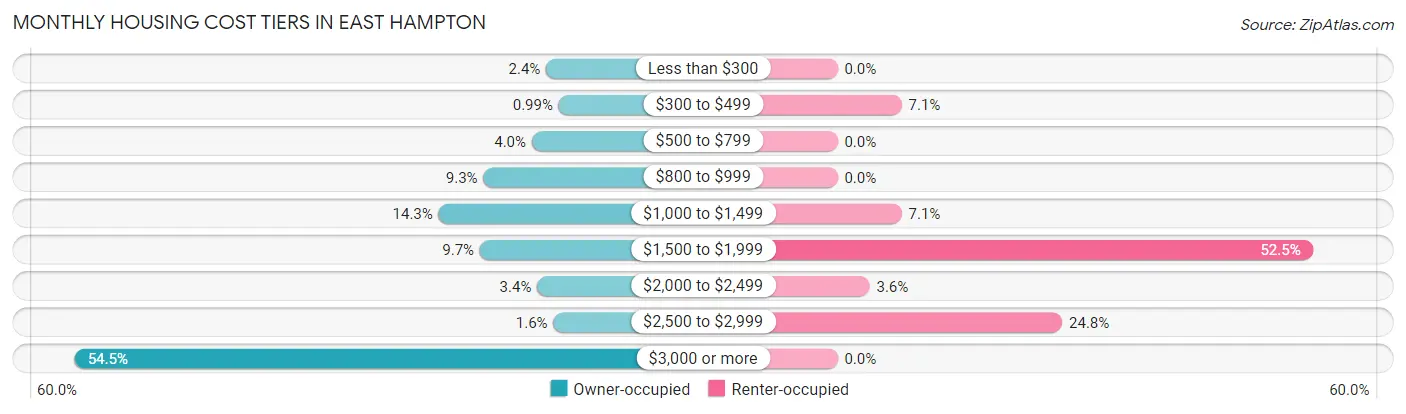
| Monthly Cost | Owner-occupied | Renter-occupied |
| Less than $300 | 12 (2.4%) | 0 (0.0%) |
| $300 to $499 | 5 (1.0%) | 10 (7.1%) |
| $500 to $799 | 20 (4.0%) | 0 (0.0%) |
| $800 to $999 | 47 (9.3%) | 0 (0.0%) |
| $1,000 to $1,499 | 72 (14.3%) | 10 (7.1%) |
| $1,500 to $1,999 | 49 (9.7%) | 74 (52.5%) |
| $2,000 to $2,499 | 17 (3.4%) | 5 (3.5%) |
| $2,500 to $2,999 | 8 (1.6%) | 35 (24.8%) |
| $3,000 or more | 275 (54.5%) | 0 (0.0%) |
| Total | 505 (100.0%) | 141 (100.0%) |
Physical Housing Characteristics in East Hampton
Housing Structures in East Hampton
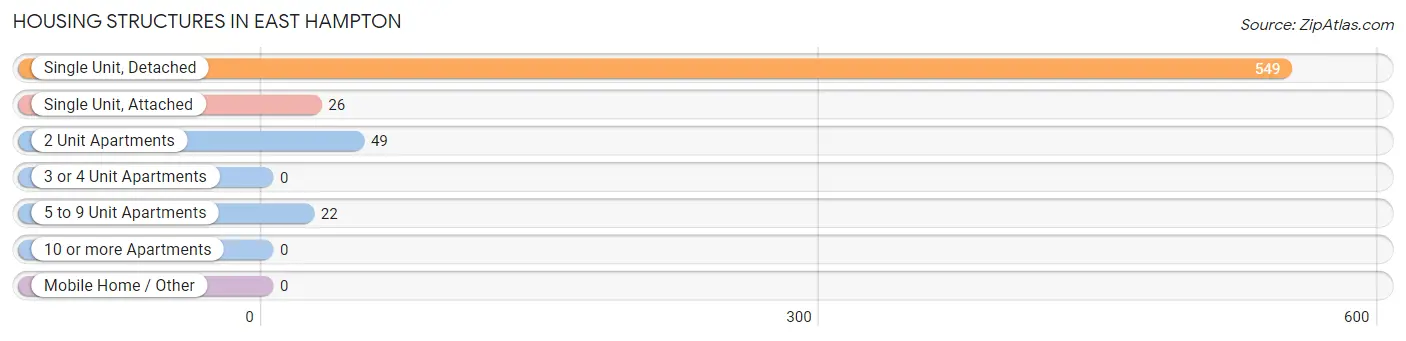
| Structure Type | # Housing Units | % Housing Units |
| Single Unit, Detached | 549 | 85.0% |
| Single Unit, Attached | 26 | 4.0% |
| 2 Unit Apartments | 49 | 7.6% |
| 3 or 4 Unit Apartments | 0 | 0.0% |
| 5 to 9 Unit Apartments | 22 | 3.4% |
| 10 or more Apartments | 0 | 0.0% |
| Mobile Home / Other | 0 | 0.0% |
| Total | 646 | 100.0% |
Housing Structures by Occupancy in East Hampton
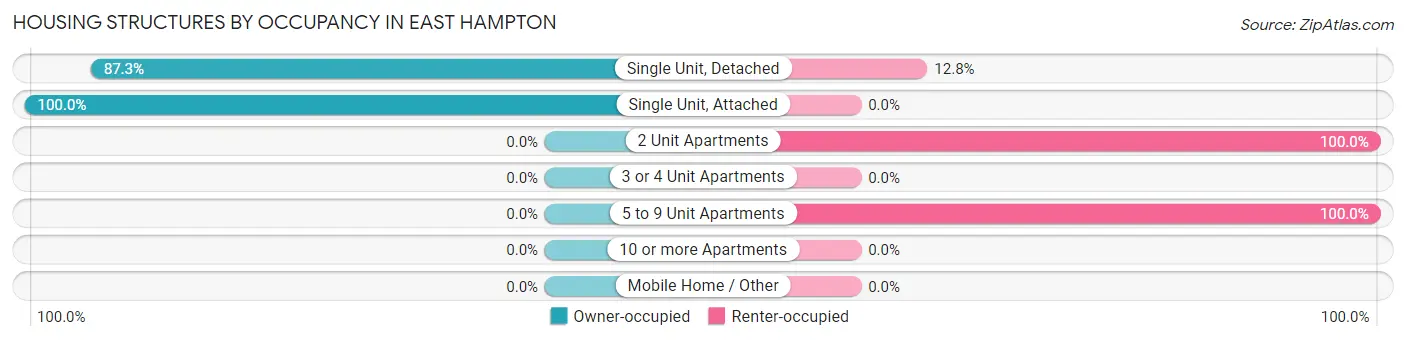
| Structure Type | Owner-occupied | Renter-occupied |
| Single Unit, Detached | 479 (87.3%) | 70 (12.8%) |
| Single Unit, Attached | 26 (100.0%) | 0 (0.0%) |
| 2 Unit Apartments | 0 (0.0%) | 49 (100.0%) |
| 3 or 4 Unit Apartments | 0 (0.0%) | 0 (0.0%) |
| 5 to 9 Unit Apartments | 0 (0.0%) | 22 (100.0%) |
| 10 or more Apartments | 0 (0.0%) | 0 (0.0%) |
| Mobile Home / Other | 0 (0.0%) | 0 (0.0%) |
| Total | 505 (78.2%) | 141 (21.8%) |
Housing Structures by Number of Rooms in East Hampton
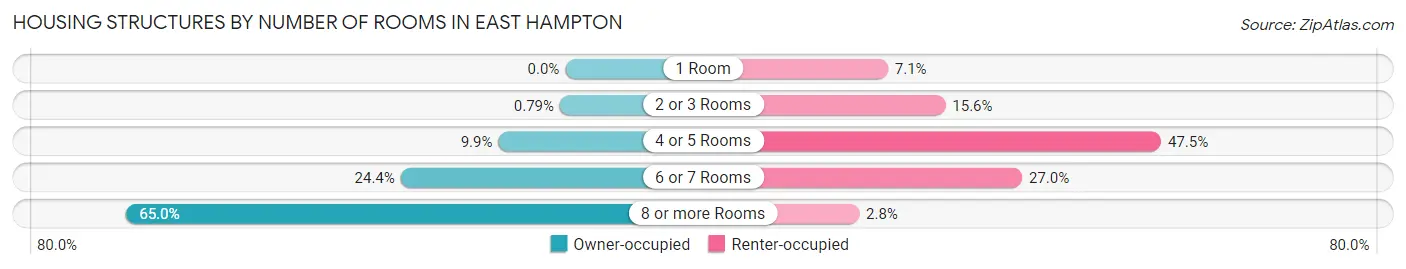
| Number of Rooms | Owner-occupied | Renter-occupied |
| 1 Room | 0 (0.0%) | 10 (7.1%) |
| 2 or 3 Rooms | 4 (0.8%) | 22 (15.6%) |
| 4 or 5 Rooms | 50 (9.9%) | 67 (47.5%) |
| 6 or 7 Rooms | 123 (24.4%) | 38 (27.0%) |
| 8 or more Rooms | 328 (64.9%) | 4 (2.8%) |
| Total | 505 (100.0%) | 141 (100.0%) |
Housing Structure by Heating Type in East Hampton
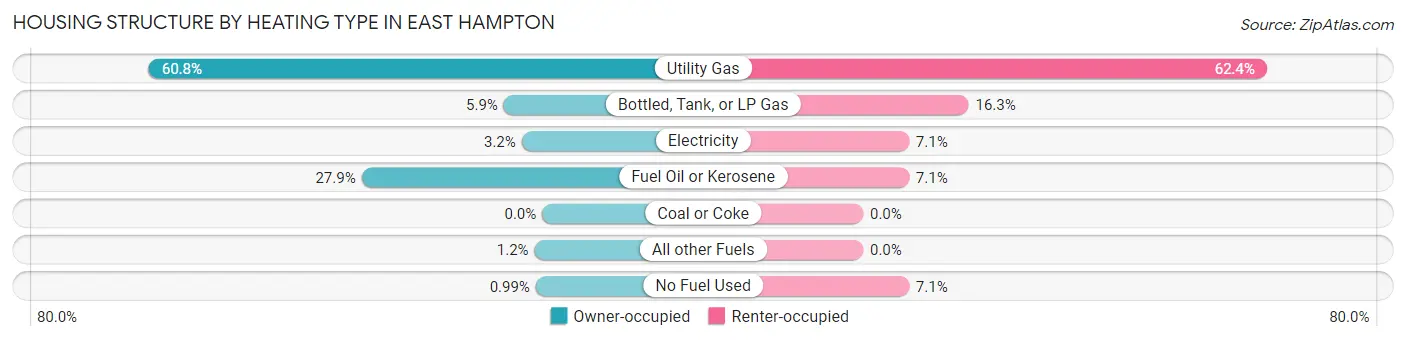
| Heating Type | Owner-occupied | Renter-occupied |
| Utility Gas | 307 (60.8%) | 88 (62.4%) |
| Bottled, Tank, or LP Gas | 30 (5.9%) | 23 (16.3%) |
| Electricity | 16 (3.2%) | 10 (7.1%) |
| Fuel Oil or Kerosene | 141 (27.9%) | 10 (7.1%) |
| Coal or Coke | 0 (0.0%) | 0 (0.0%) |
| All other Fuels | 6 (1.2%) | 0 (0.0%) |
| No Fuel Used | 5 (1.0%) | 10 (7.1%) |
| Total | 505 (100.0%) | 141 (100.0%) |
Household Vehicle Usage in East Hampton
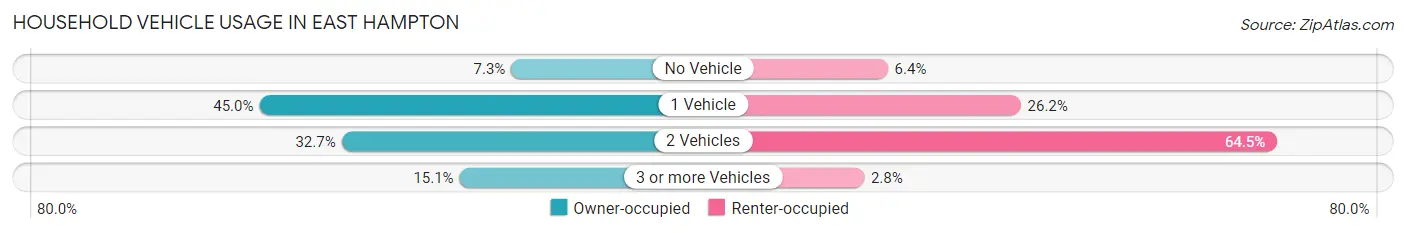
| Vehicles per Household | Owner-occupied | Renter-occupied |
| No Vehicle | 37 (7.3%) | 9 (6.4%) |
| 1 Vehicle | 227 (45.0%) | 37 (26.2%) |
| 2 Vehicles | 165 (32.7%) | 91 (64.5%) |
| 3 or more Vehicles | 76 (15.0%) | 4 (2.8%) |
| Total | 505 (100.0%) | 141 (100.0%) |
Real Estate & Mortgages in East Hampton
Real Estate and Mortgage Overview in East Hampton
| Characteristic | Without Mortgage | With Mortgage |
| Housing Units | 281 | 224 |
| Median Property Value | $2,000,001 | $2,000,001 |
| Median Household Income | $117,083 | $108 |
| Monthly Housing Costs | $1,398 | $203 |
| Real Estate Taxes | $8,170 | $0 |
Property Value by Mortgage Status in East Hampton
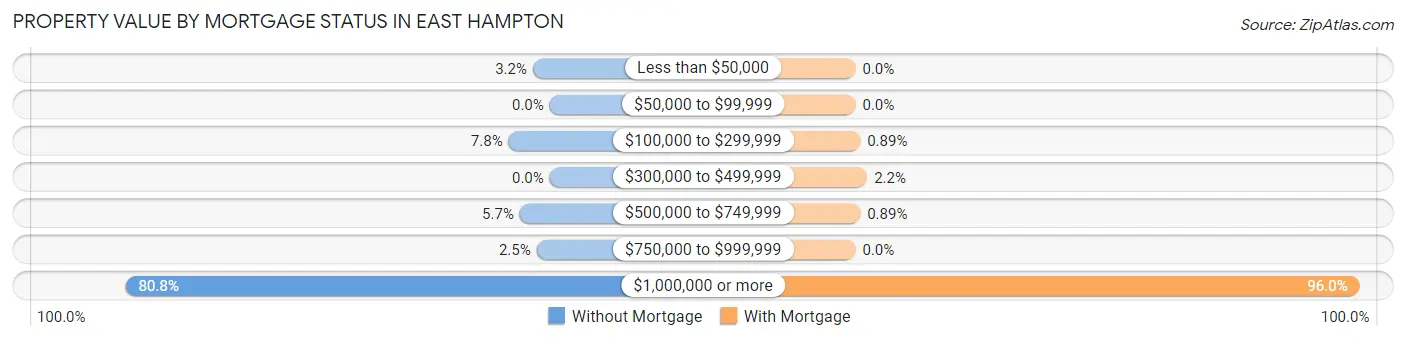
| Property Value | Without Mortgage | With Mortgage |
| Less than $50,000 | 9 (3.2%) | 0 (0.0%) |
| $50,000 to $99,999 | 0 (0.0%) | 0 (0.0%) |
| $100,000 to $299,999 | 22 (7.8%) | 2 (0.9%) |
| $300,000 to $499,999 | 0 (0.0%) | 5 (2.2%) |
| $500,000 to $749,999 | 16 (5.7%) | 2 (0.9%) |
| $750,000 to $999,999 | 7 (2.5%) | 0 (0.0%) |
| $1,000,000 or more | 227 (80.8%) | 215 (96.0%) |
| Total | 281 (100.0%) | 224 (100.0%) |
Household Income by Mortgage Status in East Hampton
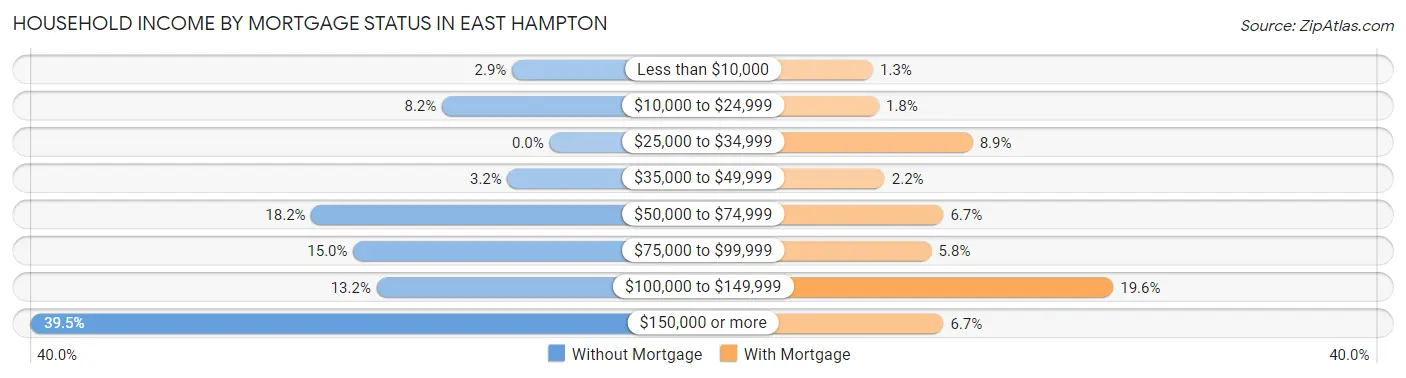
| Household Income | Without Mortgage | With Mortgage |
| Less than $10,000 | 8 (2.9%) | 3 (1.3%) |
| $10,000 to $24,999 | 23 (8.2%) | 4 (1.8%) |
| $25,000 to $34,999 | 0 (0.0%) | 20 (8.9%) |
| $35,000 to $49,999 | 9 (3.2%) | 5 (2.2%) |
| $50,000 to $74,999 | 51 (18.1%) | 15 (6.7%) |
| $75,000 to $99,999 | 42 (14.9%) | 13 (5.8%) |
| $100,000 to $149,999 | 37 (13.2%) | 44 (19.6%) |
| $150,000 or more | 111 (39.5%) | 15 (6.7%) |
| Total | 281 (100.0%) | 224 (100.0%) |
Property Value to Household Income Ratio in East Hampton
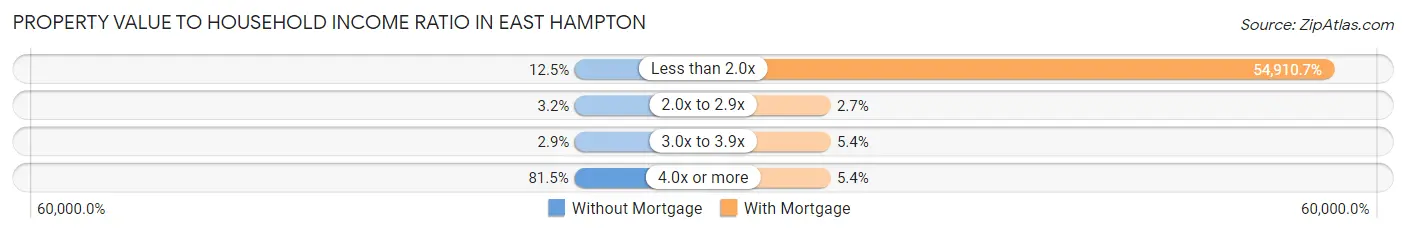
| Value-to-Income Ratio | Without Mortgage | With Mortgage |
| Less than 2.0x | 35 (12.5%) | 123,000 (54,910.7%) |
| 2.0x to 2.9x | 9 (3.2%) | 6 (2.7%) |
| 3.0x to 3.9x | 8 (2.9%) | 12 (5.4%) |
| 4.0x or more | 229 (81.5%) | 12 (5.4%) |
| Total | 281 (100.0%) | 224 (100.0%) |
Real Estate Taxes by Mortgage Status in East Hampton
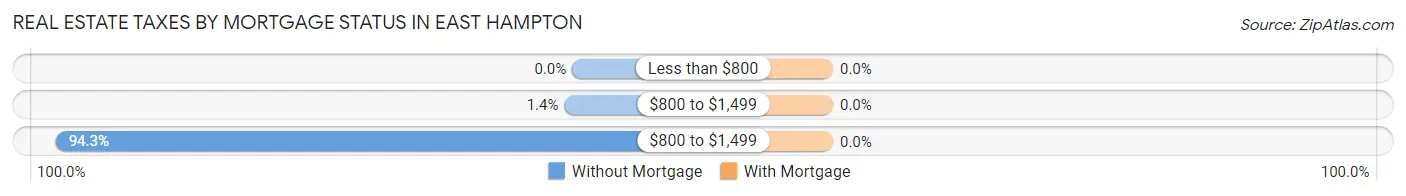
| Property Taxes | Without Mortgage | With Mortgage |
| Less than $800 | 0 (0.0%) | 0 (0.0%) |
| $800 to $1,499 | 4 (1.4%) | 0 (0.0%) |
| $800 to $1,499 | 265 (94.3%) | 0 (0.0%) |
| Total | 281 (100.0%) | 224 (100.0%) |
Health & Disability in East Hampton
Health Insurance Coverage by Age in East Hampton
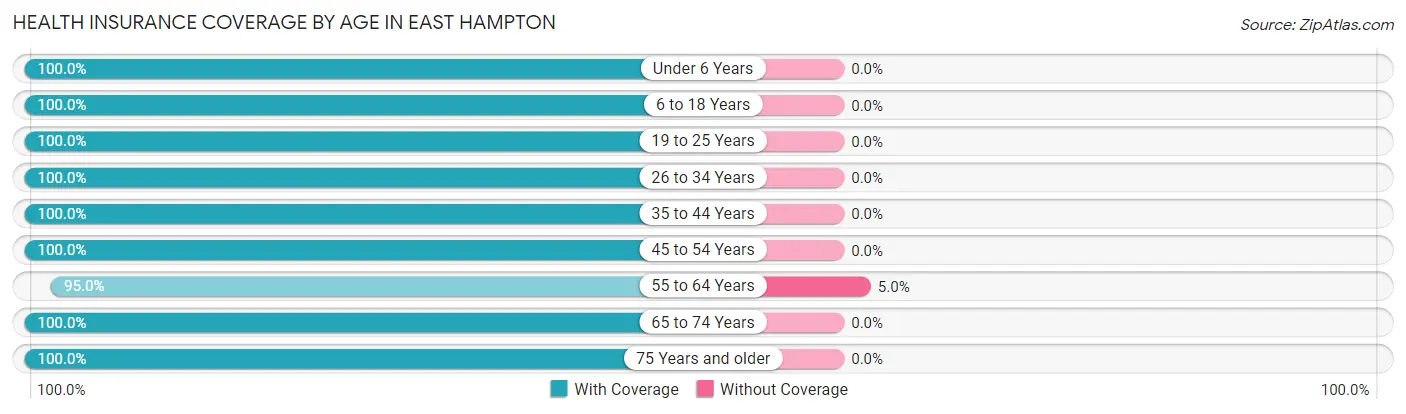
| Age Bracket | With Coverage | Without Coverage |
| Under 6 Years | 7 (100.0%) | 0 (0.0%) |
| 6 to 18 Years | 180 (100.0%) | 0 (0.0%) |
| 19 to 25 Years | 72 (100.0%) | 0 (0.0%) |
| 26 to 34 Years | 39 (100.0%) | 0 (0.0%) |
| 35 to 44 Years | 57 (100.0%) | 0 (0.0%) |
| 45 to 54 Years | 217 (100.0%) | 0 (0.0%) |
| 55 to 64 Years | 230 (95.0%) | 12 (5.0%) |
| 65 to 74 Years | 184 (100.0%) | 0 (0.0%) |
| 75 Years and older | 272 (100.0%) | 0 (0.0%) |
| Total | 1,258 (99.1%) | 12 (0.9%) |
Health Insurance Coverage by Citizenship Status in East Hampton
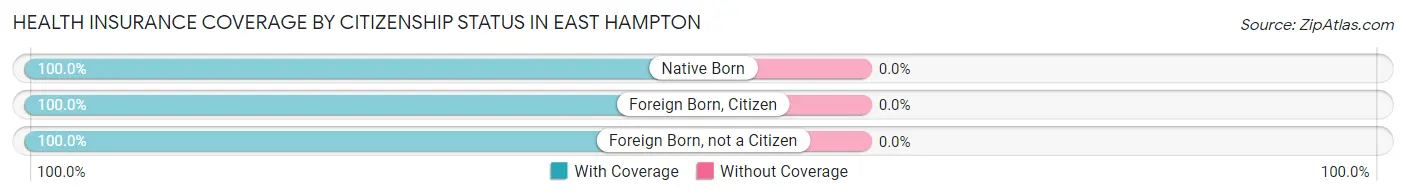
| Citizenship Status | With Coverage | Without Coverage |
| Native Born | 7 (100.0%) | 0 (0.0%) |
| Foreign Born, Citizen | 180 (100.0%) | 0 (0.0%) |
| Foreign Born, not a Citizen | 72 (100.0%) | 0 (0.0%) |
Health Insurance Coverage by Household Income in East Hampton
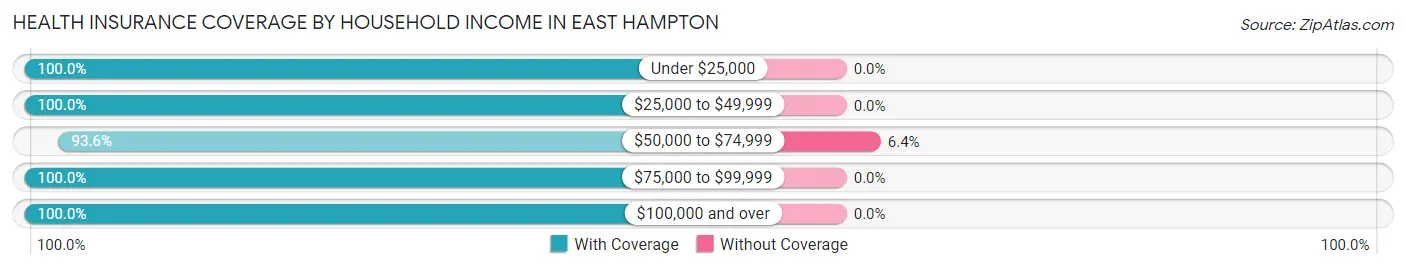
| Household Income | With Coverage | Without Coverage |
| Under $25,000 | 173 (100.0%) | 0 (0.0%) |
| $25,000 to $49,999 | 59 (100.0%) | 0 (0.0%) |
| $50,000 to $74,999 | 176 (93.6%) | 12 (6.4%) |
| $75,000 to $99,999 | 214 (100.0%) | 0 (0.0%) |
| $100,000 and over | 636 (100.0%) | 0 (0.0%) |
Public vs Private Health Insurance Coverage by Age in East Hampton
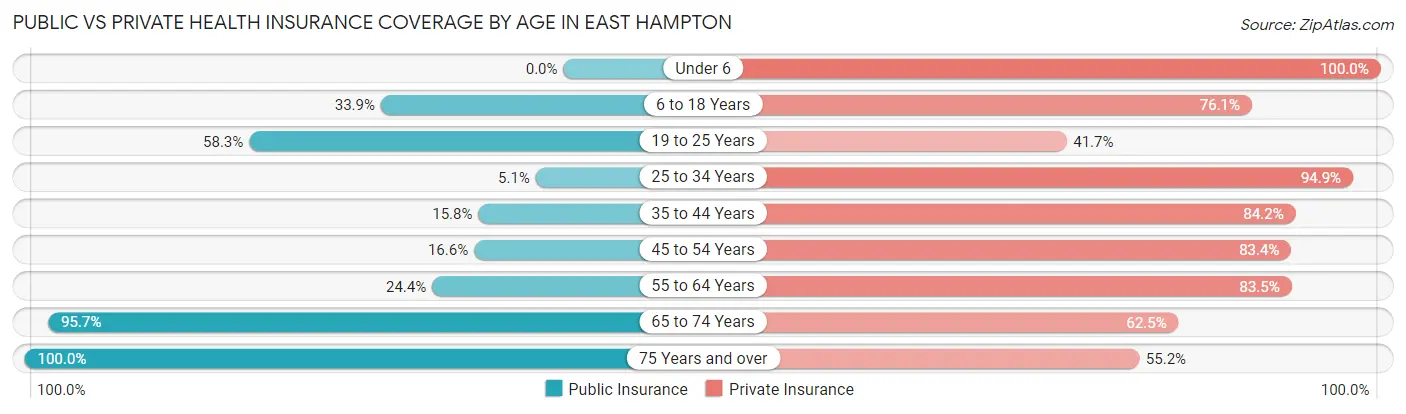
| Age Bracket | Public Insurance | Private Insurance |
| Under 6 | 0 (0.0%) | 7 (100.0%) |
| 6 to 18 Years | 61 (33.9%) | 137 (76.1%) |
| 19 to 25 Years | 42 (58.3%) | 30 (41.7%) |
| 25 to 34 Years | 2 (5.1%) | 37 (94.9%) |
| 35 to 44 Years | 9 (15.8%) | 48 (84.2%) |
| 45 to 54 Years | 36 (16.6%) | 181 (83.4%) |
| 55 to 64 Years | 59 (24.4%) | 202 (83.5%) |
| 65 to 74 Years | 176 (95.7%) | 115 (62.5%) |
| 75 Years and over | 272 (100.0%) | 150 (55.1%) |
| Total | 657 (51.7%) | 907 (71.4%) |
Disability Status by Sex by Age in East Hampton
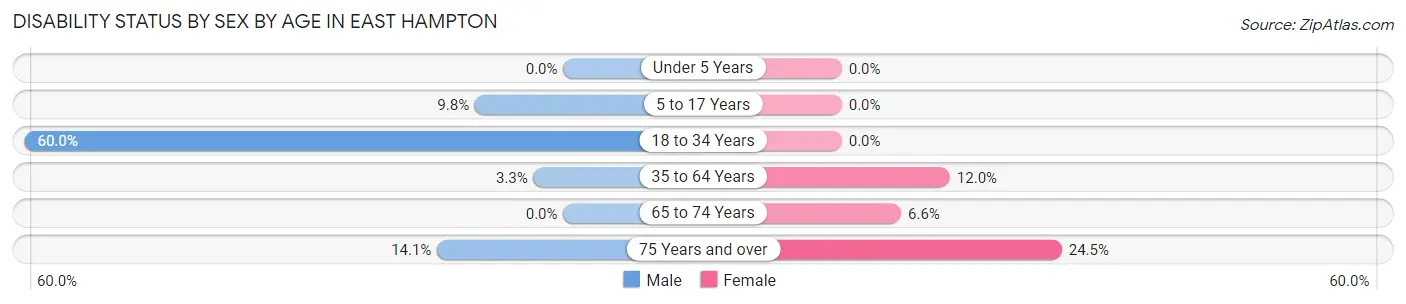
| Age Bracket | Male | Female |
| Under 5 Years | 0 (0.0%) | 0 (0.0%) |
| 5 to 17 Years | 12 (9.8%) | 0 (0.0%) |
| 18 to 34 Years | 42 (60.0%) | 0 (0.0%) |
| 35 to 64 Years | 8 (3.3%) | 33 (12.0%) |
| 65 to 74 Years | 0 (0.0%) | 7 (6.6%) |
| 75 Years and over | 17 (14.1%) | 37 (24.5%) |
Disability Class by Sex by Age in East Hampton
Disability Class: Hearing Difficulty
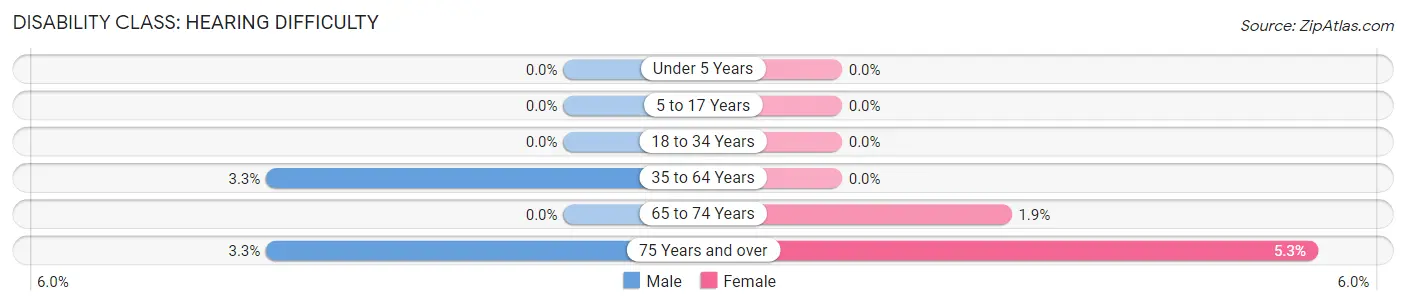
| Age Bracket | Male | Female |
| Under 5 Years | 0 (0.0%) | 0 (0.0%) |
| 5 to 17 Years | 0 (0.0%) | 0 (0.0%) |
| 18 to 34 Years | 0 (0.0%) | 0 (0.0%) |
| 35 to 64 Years | 8 (3.3%) | 0 (0.0%) |
| 65 to 74 Years | 0 (0.0%) | 2 (1.9%) |
| 75 Years and over | 4 (3.3%) | 8 (5.3%) |
Disability Class: Vision Difficulty
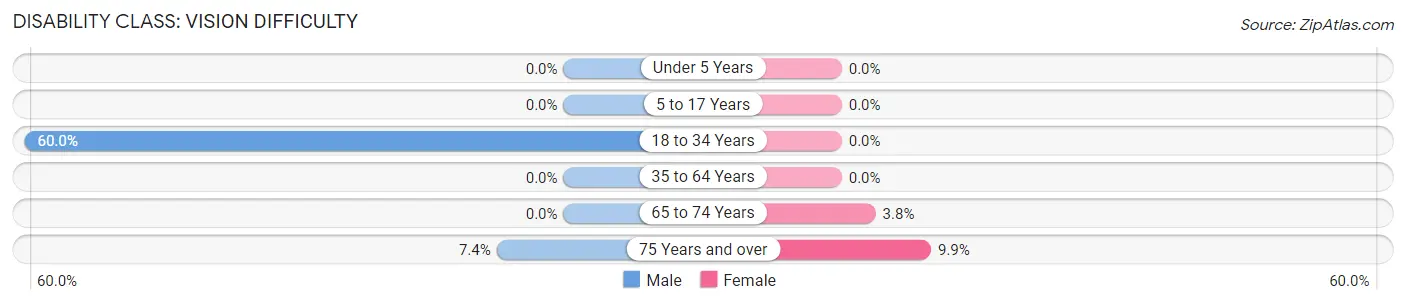
| Age Bracket | Male | Female |
| Under 5 Years | 0 (0.0%) | 0 (0.0%) |
| 5 to 17 Years | 0 (0.0%) | 0 (0.0%) |
| 18 to 34 Years | 42 (60.0%) | 0 (0.0%) |
| 35 to 64 Years | 0 (0.0%) | 0 (0.0%) |
| 65 to 74 Years | 0 (0.0%) | 4 (3.8%) |
| 75 Years and over | 9 (7.4%) | 15 (9.9%) |
Disability Class: Cognitive Difficulty
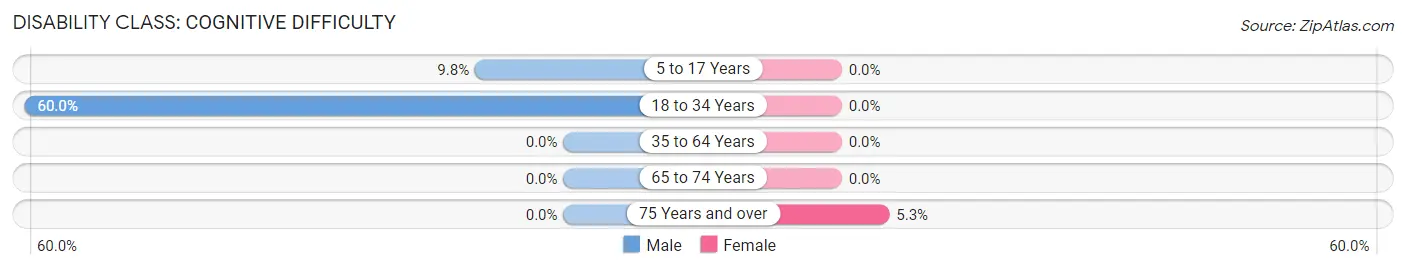
| Age Bracket | Male | Female |
| 5 to 17 Years | 12 (9.8%) | 0 (0.0%) |
| 18 to 34 Years | 42 (60.0%) | 0 (0.0%) |
| 35 to 64 Years | 0 (0.0%) | 0 (0.0%) |
| 65 to 74 Years | 0 (0.0%) | 0 (0.0%) |
| 75 Years and over | 0 (0.0%) | 8 (5.3%) |
Disability Class: Ambulatory Difficulty
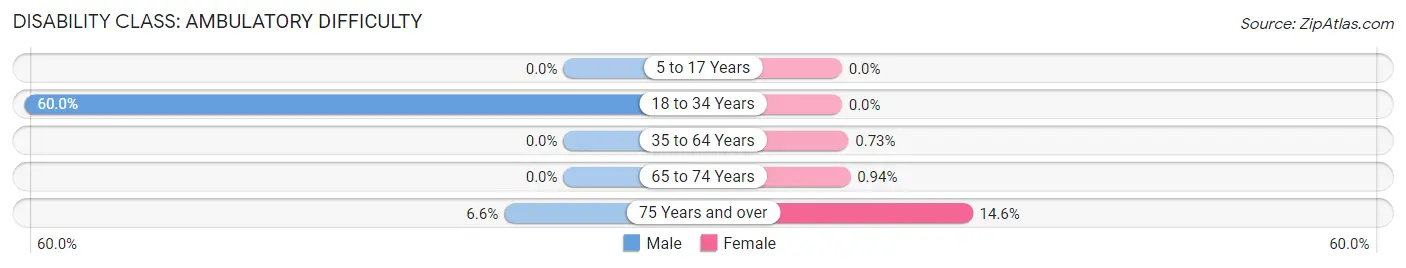
| Age Bracket | Male | Female |
| 5 to 17 Years | 0 (0.0%) | 0 (0.0%) |
| 18 to 34 Years | 42 (60.0%) | 0 (0.0%) |
| 35 to 64 Years | 0 (0.0%) | 2 (0.7%) |
| 65 to 74 Years | 0 (0.0%) | 1 (0.9%) |
| 75 Years and over | 8 (6.6%) | 22 (14.6%) |
Disability Class: Self-Care Difficulty
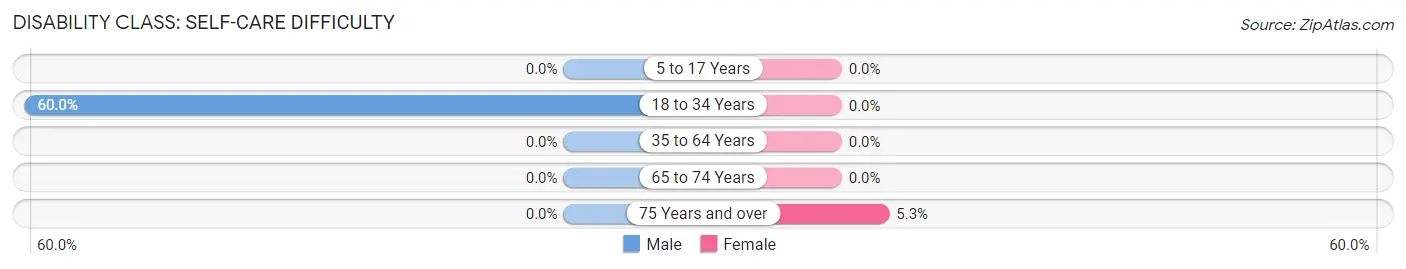
| Age Bracket | Male | Female |
| 5 to 17 Years | 0 (0.0%) | 0 (0.0%) |
| 18 to 34 Years | 42 (60.0%) | 0 (0.0%) |
| 35 to 64 Years | 0 (0.0%) | 0 (0.0%) |
| 65 to 74 Years | 0 (0.0%) | 0 (0.0%) |
| 75 Years and over | 0 (0.0%) | 8 (5.3%) |
Technology Access in East Hampton
Computing Device Access in East Hampton
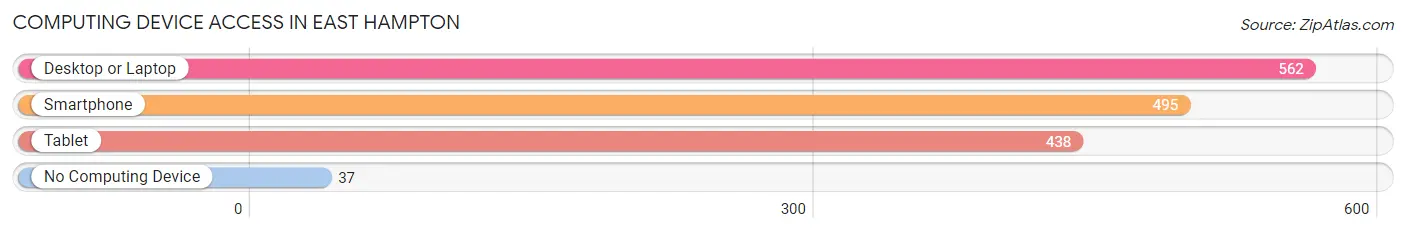
| Device Type | # Households | % Households |
| Desktop or Laptop | 562 | 87.0% |
| Smartphone | 495 | 76.6% |
| Tablet | 438 | 67.8% |
| No Computing Device | 37 | 5.7% |
| Total | 646 | 100.0% |
Internet Access in East Hampton
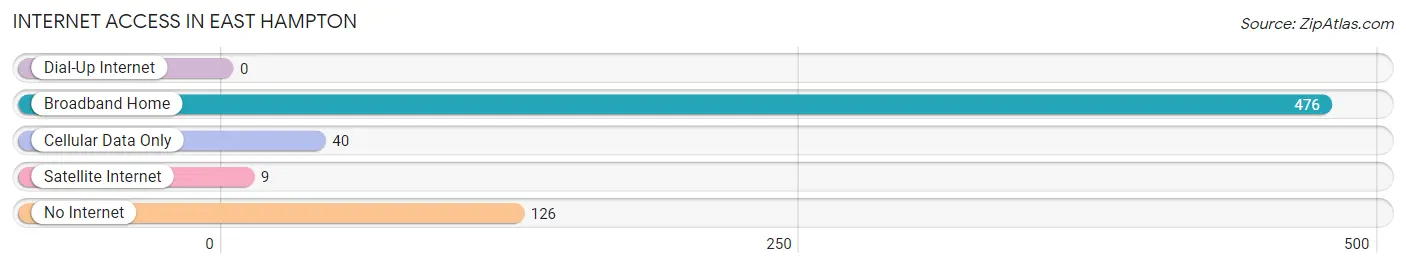
| Internet Type | # Households | % Households |
| Dial-Up Internet | 0 | 0.0% |
| Broadband Home | 476 | 73.7% |
| Cellular Data Only | 40 | 6.2% |
| Satellite Internet | 9 | 1.4% |
| No Internet | 126 | 19.5% |
| Total | 646 | 100.0% |
East Hampton Summary
East Hampton is a town located in Suffolk County, New York, United States. It is located on the South Fork of Long Island and is part of the East End of Long Island. As of the 2010 census, the town had a total population of 21,457.
History
The area now known as East Hampton was originally inhabited by the Montaukett Native American tribe. The first European settlers arrived in 1648, and the area was officially settled in 1649. The town was originally known as Maidstone, after the English town of Maidstone. The town was renamed East Hampton in 1673.
In the late 17th century, East Hampton became a popular destination for wealthy New Yorkers looking to escape the hustle and bustle of the city. The town was home to many prominent families, including the Gardiners, the Hedges, and the Lauders.
In the 19th century, East Hampton became a popular summer destination for the wealthy. The town was home to many grand estates, including the Gardiner's Island estate, which was owned by the Gardiner family for over 300 years.
Geography
East Hampton is located on the South Fork of Long Island, approximately 90 miles east of New York City. The town is bordered by the Atlantic Ocean to the south, the Town of Southampton to the west, and the Town of Southold to the east.
The town has a total area of 97.2 square miles, of which 95.2 square miles is land and 2.0 square miles is water. The town is home to several bodies of water, including Gardiner's Bay, Napeague Bay, and Accabonac Harbor.
Economy
The economy of East Hampton is largely based on tourism and agriculture. The town is home to many popular beaches, including Main Beach, Wiborg Beach, and Two Mile Hollow Beach. The town is also home to many wineries, farms, and other agricultural businesses.
The town is also home to many art galleries, antique shops, and other retail businesses. The town is also home to many restaurants, bars, and other entertainment venues.
Demographics
As of the 2010 census, there were 21,457 people, 8,845 households, and 5,945 families residing in the town. The population density was 224.3 people per square mile. The racial makeup of the town was 87.2% White, 5.2% African American, 0.3% Native American, 2.2% Asian, 0.1% Pacific Islander, 2.2% from other races, and 2.9% from two or more races. Hispanic or Latino of any race were 8.3% of the population.
The median income for a household in the town was $76,843, and the median income for a family was $93,817. The per capita income for the town was $45,945. About 4.2% of families and 6.7% of the population were below the poverty line, including 8.2% of those under age 18 and 4.2% of those age 65 or over.
Common Questions
What is Per Capita Income in East Hampton?
Per Capita income in East Hampton is $115,428.
What is the Median Family Income in East Hampton?
Median Family Income in East Hampton is $136,625.
What is the Median Household income in East Hampton?
Median Household Income in East Hampton is $94,375.
What is Income or Wage Gap in East Hampton?
Income or Wage Gap in East Hampton is 14.4%.
Women in East Hampton earn 85.6 cents for every dollar earned by a man.
What is Inequality or Gini Index in East Hampton?
Inequality or Gini Index in East Hampton is 0.63.
What is the Total Population of East Hampton?
Total Population of East Hampton is 1,270.
What is the Total Male Population of East Hampton?
Total Male Population of East Hampton is 636.
What is the Total Female Population of East Hampton?
Total Female Population of East Hampton is 634.
What is the Ratio of Males per 100 Females in East Hampton?
There are 100.32 Males per 100 Females in East Hampton.
What is the Ratio of Females per 100 Males in East Hampton?
There are 99.69 Females per 100 Males in East Hampton.
What is the Median Population Age in East Hampton?
Median Population Age in East Hampton is 57.4 Years.
What is the Average Family Size in East Hampton
Average Family Size in East Hampton is 2.5 People.
What is the Average Household Size in East Hampton
Average Household Size in East Hampton is 2.0 People.
How Large is the Labor Force in East Hampton?
There are 560 People in the Labor Forcein in East Hampton.
What is the Percentage of People in the Labor Force in East Hampton?
48.8% of People are in the Labor Force in East Hampton.
What is the Unemployment Rate in East Hampton?
Unemployment Rate in East Hampton is 1.1%.