Merritt Park, NY Map & Demographics
Merritt Park Map
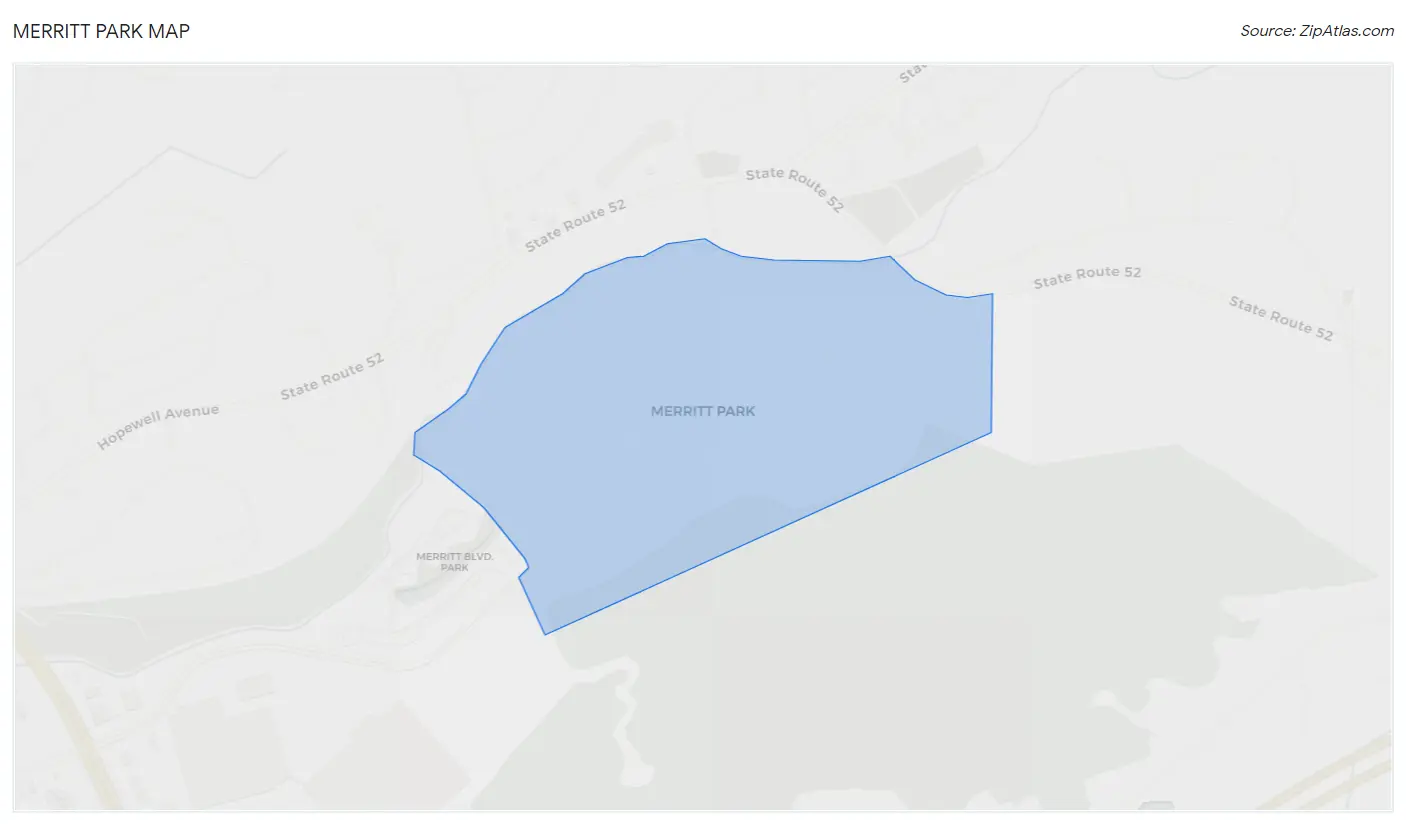
Merritt Park Overview
$60,622
PER CAPITA INCOME
$151,818
AVG FAMILY INCOME
$120,972
AVG HOUSEHOLD INCOME
45.0%
WAGE / INCOME GAP [ % ]
55.0¢/ $1
WAGE / INCOME GAP [ $ ]
0.42
INEQUALITY / GINI INDEX
1,879
TOTAL POPULATION
953
MALE POPULATION
926
FEMALE POPULATION
102.92
MALES / 100 FEMALES
97.17
FEMALES / 100 MALES
47.3
MEDIAN AGE
2.8
AVG FAMILY SIZE
2.5
AVG HOUSEHOLD SIZE
1,015
LABOR FORCE [ PEOPLE ]
68.0%
PERCENT IN LABOR FORCE
2.0%
UNEMPLOYMENT RATE
Income in Merritt Park
Income Overview in Merritt Park
Per Capita Income in Merritt Park is $60,622, while median incomes of families and households are $151,818 and $120,972 respectively.
| Characteristic | Number | Measure |
| Per Capita Income | 1,879 | $60,622 |
| Median Family Income | 558 | $151,818 |
| Mean Family Income | 558 | $164,928 |
| Median Household Income | 747 | $120,972 |
| Mean Household Income | 747 | $151,596 |
| Income Deficit | 558 | $0 |
| Wage / Income Gap (%) | 1,879 | 45.01% |
| Wage / Income Gap ($) | 1,879 | 54.99¢ per $1 |
| Gini / Inequality Index | 1,879 | 0.42 |
Earnings by Sex in Merritt Park
Average Earnings in Merritt Park are $61,250, $93,333 for men and $51,327 for women, a difference of 45.0%.
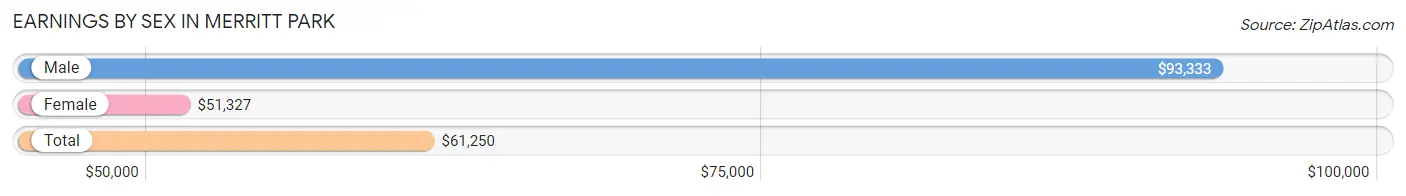
| Sex | Number | Average Earnings |
| Male | 614 (58.6%) | $93,333 |
| Female | 434 (41.4%) | $51,327 |
| Total | 1,048 (100.0%) | $61,250 |
Earnings by Sex by Income Bracket in Merritt Park
The most common earnings brackets in Merritt Park are $100,000+ for men (286 | 46.6%) and $75,000 to $99,999 for women (110 | 25.4%).
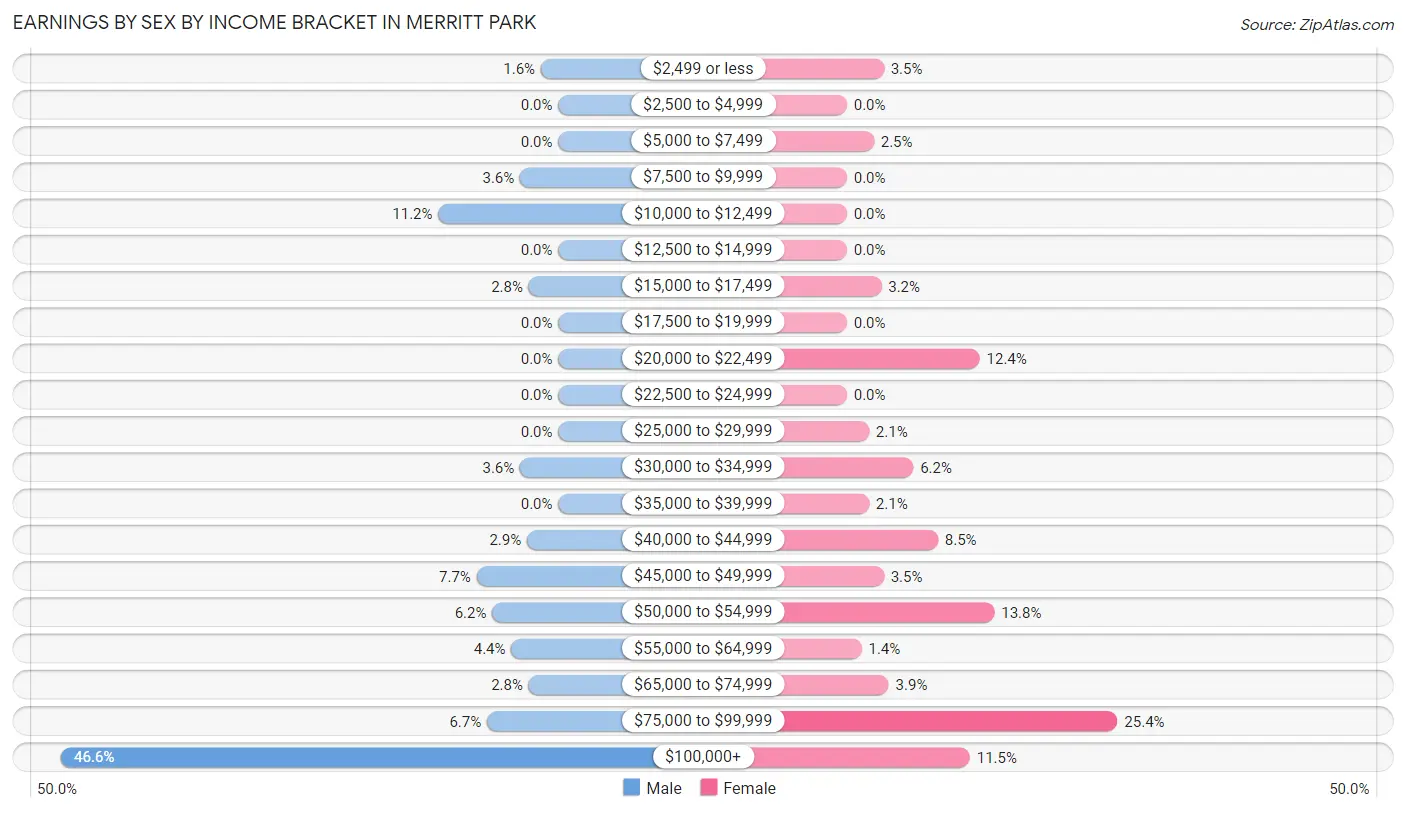
| Income | Male | Female |
| $2,499 or less | 10 (1.6%) | 15 (3.5%) |
| $2,500 to $4,999 | 0 (0.0%) | 0 (0.0%) |
| $5,000 to $7,499 | 0 (0.0%) | 11 (2.5%) |
| $7,500 to $9,999 | 22 (3.6%) | 0 (0.0%) |
| $10,000 to $12,499 | 69 (11.2%) | 0 (0.0%) |
| $12,500 to $14,999 | 0 (0.0%) | 0 (0.0%) |
| $15,000 to $17,499 | 17 (2.8%) | 14 (3.2%) |
| $17,500 to $19,999 | 0 (0.0%) | 0 (0.0%) |
| $20,000 to $22,499 | 0 (0.0%) | 54 (12.4%) |
| $22,500 to $24,999 | 0 (0.0%) | 0 (0.0%) |
| $25,000 to $29,999 | 0 (0.0%) | 9 (2.1%) |
| $30,000 to $34,999 | 22 (3.6%) | 27 (6.2%) |
| $35,000 to $39,999 | 0 (0.0%) | 9 (2.1%) |
| $40,000 to $44,999 | 18 (2.9%) | 37 (8.5%) |
| $45,000 to $49,999 | 47 (7.6%) | 15 (3.5%) |
| $50,000 to $54,999 | 38 (6.2%) | 60 (13.8%) |
| $55,000 to $64,999 | 27 (4.4%) | 6 (1.4%) |
| $65,000 to $74,999 | 17 (2.8%) | 17 (3.9%) |
| $75,000 to $99,999 | 41 (6.7%) | 110 (25.4%) |
| $100,000+ | 286 (46.6%) | 50 (11.5%) |
| Total | 614 (100.0%) | 434 (100.0%) |
Earnings by Sex by Educational Attainment in Merritt Park
Average earnings in Merritt Park are $99,632 for men and $51,403 for women, a difference of 48.4%. Men with an educational attainment of bachelor's degree enjoy the highest average annual earnings of $110,742, while those with high school diploma education earn the least with $46,436. Women with an educational attainment of graduate degree earn the most with the average annual earnings of $88,571, while those with high school diploma education have the smallest earnings of $41,827.
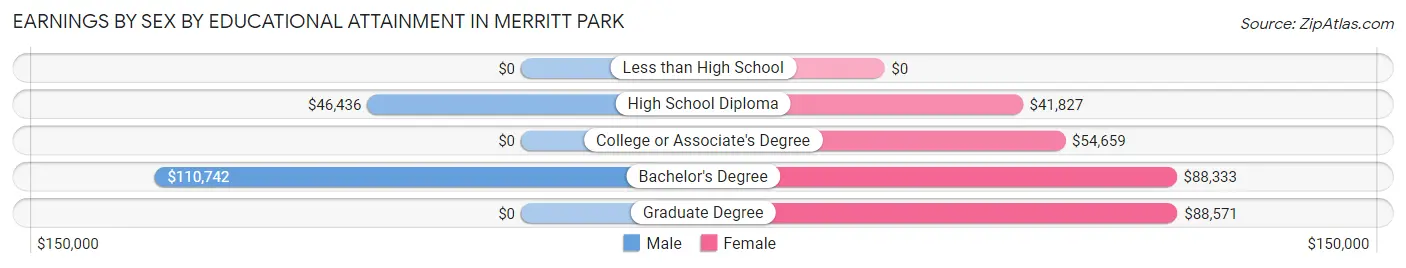
| Educational Attainment | Male Income | Female Income |
| Less than High School | - | - |
| High School Diploma | $46,436 | $41,827 |
| College or Associate's Degree | - | - |
| Bachelor's Degree | $110,742 | $88,333 |
| Graduate Degree | - | - |
| Total | $99,632 | $51,403 |
Family Income in Merritt Park
Family Income Brackets in Merritt Park
According to the Merritt Park family income data, there are 186 families falling into the $200,000+ income range, which is the most common income bracket and makes up 33.3% of all families.
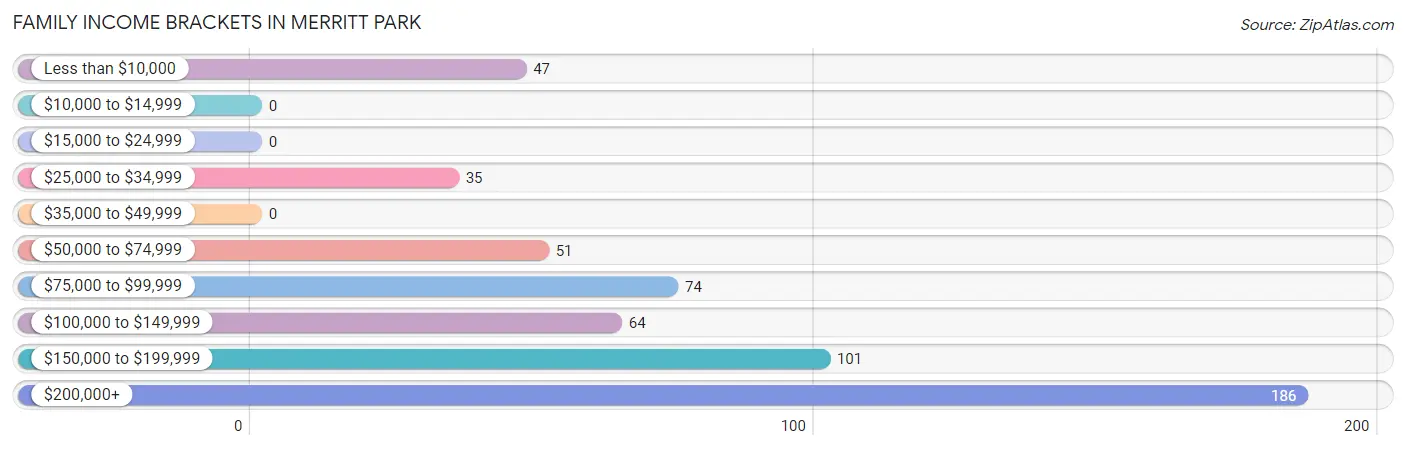
| Income Bracket | # Families | % Families |
| Less than $10,000 | 47 | 8.4% |
| $10,000 to $14,999 | 0 | 0.0% |
| $15,000 to $24,999 | 0 | 0.0% |
| $25,000 to $34,999 | 35 | 6.3% |
| $35,000 to $49,999 | 0 | 0.0% |
| $50,000 to $74,999 | 51 | 9.1% |
| $75,000 to $99,999 | 74 | 13.3% |
| $100,000 to $149,999 | 64 | 11.5% |
| $150,000 to $199,999 | 101 | 18.1% |
| $200,000+ | 186 | 33.3% |
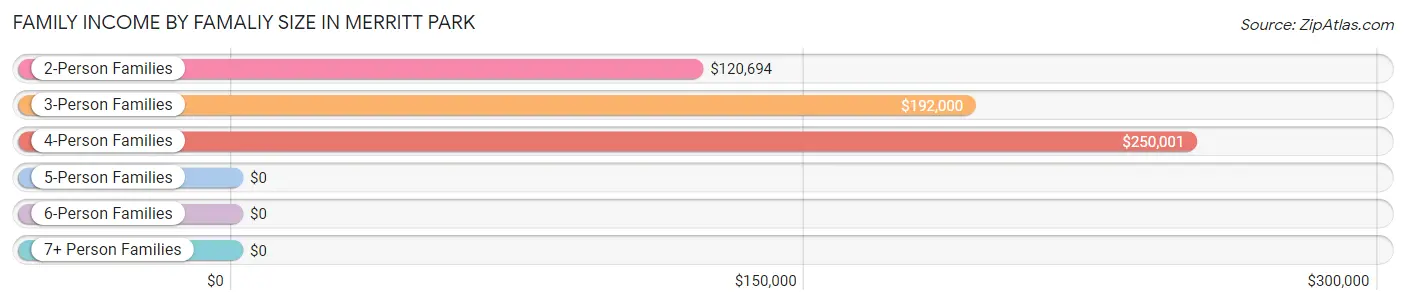
Family Income by Famaliy Size in Merritt Park
4-person families (94 | 16.9%) account for the highest median family income in Merritt Park with $250,001 per family, while 3-person families (150 | 26.9%) have the highest median income of $64,000 per family member.
| Income Bracket | # Families | Median Income |
| 2-Person Families | 263 (47.1%) | $120,694 |
| 3-Person Families | 150 (26.9%) | $192,000 |
| 4-Person Families | 94 (16.9%) | $250,001 |
| 5-Person Families | 43 (7.7%) | $0 |
| 6-Person Families | 8 (1.4%) | $0 |
| 7+ Person Families | 0 (0.0%) | $0 |
| Total | 558 (100.0%) | $151,818 |
Family Income by Number of Earners in Merritt Park
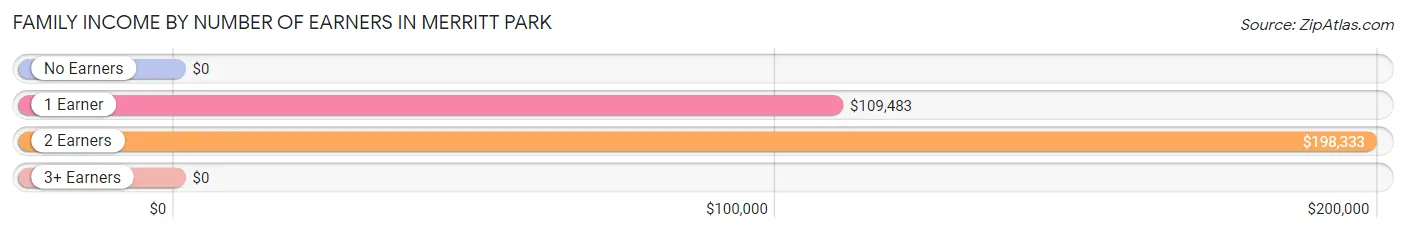
| Number of Earners | # Families | Median Income |
| No Earners | 119 (21.3%) | $0 |
| 1 Earner | 158 (28.3%) | $109,483 |
| 2 Earners | 228 (40.9%) | $198,333 |
| 3+ Earners | 53 (9.5%) | $0 |
| Total | 558 (100.0%) | $151,818 |
Household Income in Merritt Park
Household Income Brackets in Merritt Park
With 231 households falling in the category, the $200,000+ income range is the most frequent in Merritt Park, accounting for 30.9% of all households. In contrast, only 14 households (1.9%) fall into the $10,000 to $14,999 income bracket, making it the least populous group.
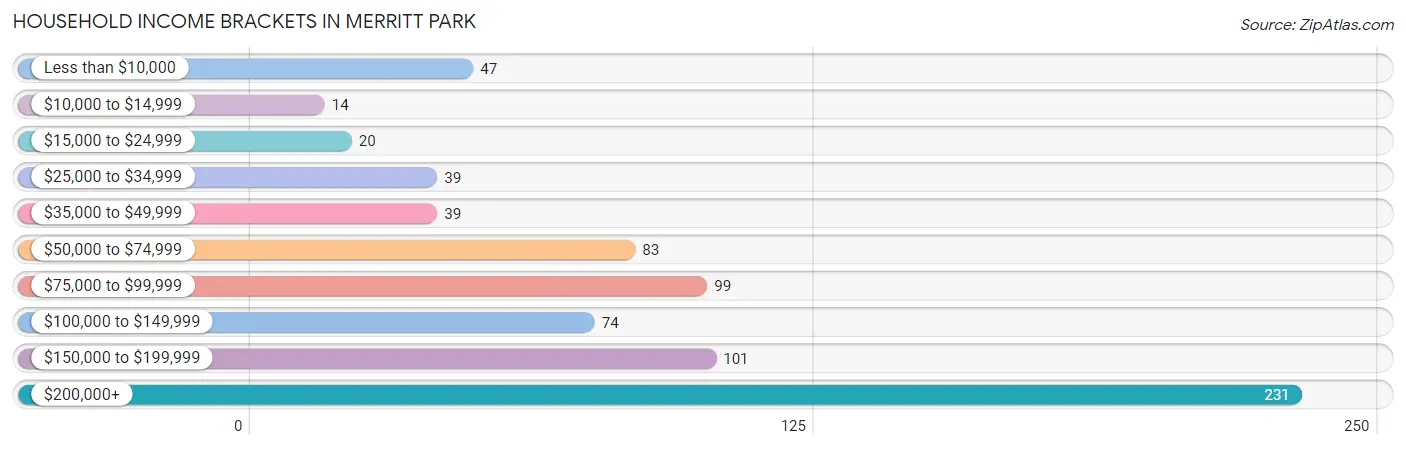
| Income Bracket | # Households | % Households |
| Less than $10,000 | 47 | 6.3% |
| $10,000 to $14,999 | 14 | 1.9% |
| $15,000 to $24,999 | 20 | 2.7% |
| $25,000 to $34,999 | 39 | 5.2% |
| $35,000 to $49,999 | 39 | 5.2% |
| $50,000 to $74,999 | 83 | 11.1% |
| $75,000 to $99,999 | 99 | 13.3% |
| $100,000 to $149,999 | 74 | 9.9% |
| $150,000 to $199,999 | 101 | 13.5% |
| $200,000+ | 231 | 30.9% |
Household Income by Householder Age in Merritt Park
The median household income in Merritt Park is $120,972, with the highest median household income of $176,146 found in the 45 to 64 years age bracket for the primary householder. A total of 369 households (49.4%) fall into this category.
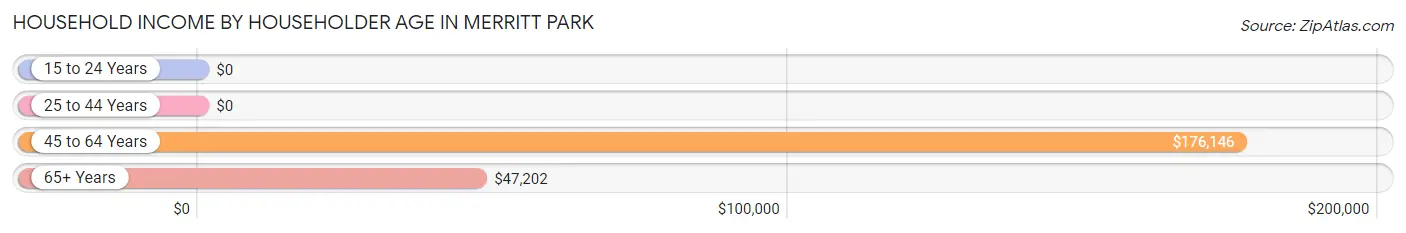
| Income Bracket | # Households | Median Income |
| 15 to 24 Years | 0 (0.0%) | $0 |
| 25 to 44 Years | 169 (22.6%) | $0 |
| 45 to 64 Years | 369 (49.4%) | $176,146 |
| 65+ Years | 209 (28.0%) | $47,202 |
| Total | 747 (100.0%) | $120,972 |
Poverty in Merritt Park
Income Below Poverty by Sex and Age in Merritt Park
With 6.3% poverty level for males and 2.8% for females among the residents of Merritt Park, 75 year old and over males and 65 to 74 year old females are the most vulnerable to poverty, with 36 males (72.0%) and 15 females (10.0%) in their respective age groups living below the poverty level.
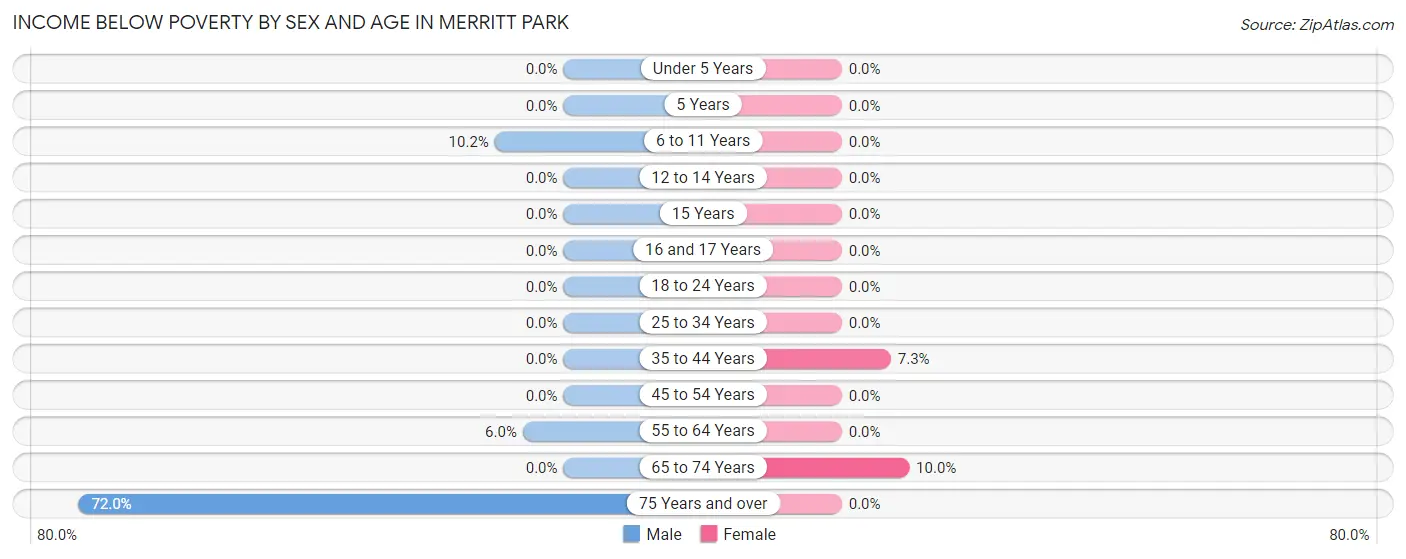
| Age Bracket | Male | Female |
| Under 5 Years | 0 (0.0%) | 0 (0.0%) |
| 5 Years | 0 (0.0%) | 0 (0.0%) |
| 6 to 11 Years | 10 (10.2%) | 0 (0.0%) |
| 12 to 14 Years | 0 (0.0%) | 0 (0.0%) |
| 15 Years | 0 (0.0%) | 0 (0.0%) |
| 16 and 17 Years | 0 (0.0%) | 0 (0.0%) |
| 18 to 24 Years | 0 (0.0%) | 0 (0.0%) |
| 25 to 34 Years | 0 (0.0%) | 0 (0.0%) |
| 35 to 44 Years | 0 (0.0%) | 11 (7.3%) |
| 45 to 54 Years | 0 (0.0%) | 0 (0.0%) |
| 55 to 64 Years | 14 (6.0%) | 0 (0.0%) |
| 65 to 74 Years | 0 (0.0%) | 15 (10.0%) |
| 75 Years and over | 36 (72.0%) | 0 (0.0%) |
| Total | 60 (6.3%) | 26 (2.8%) |
Income Above Poverty by Sex and Age in Merritt Park
According to the poverty statistics in Merritt Park, males aged under 5 years and females aged under 5 years are the age groups that are most secure financially, with 100.0% of males and 100.0% of females in these age groups living above the poverty line.
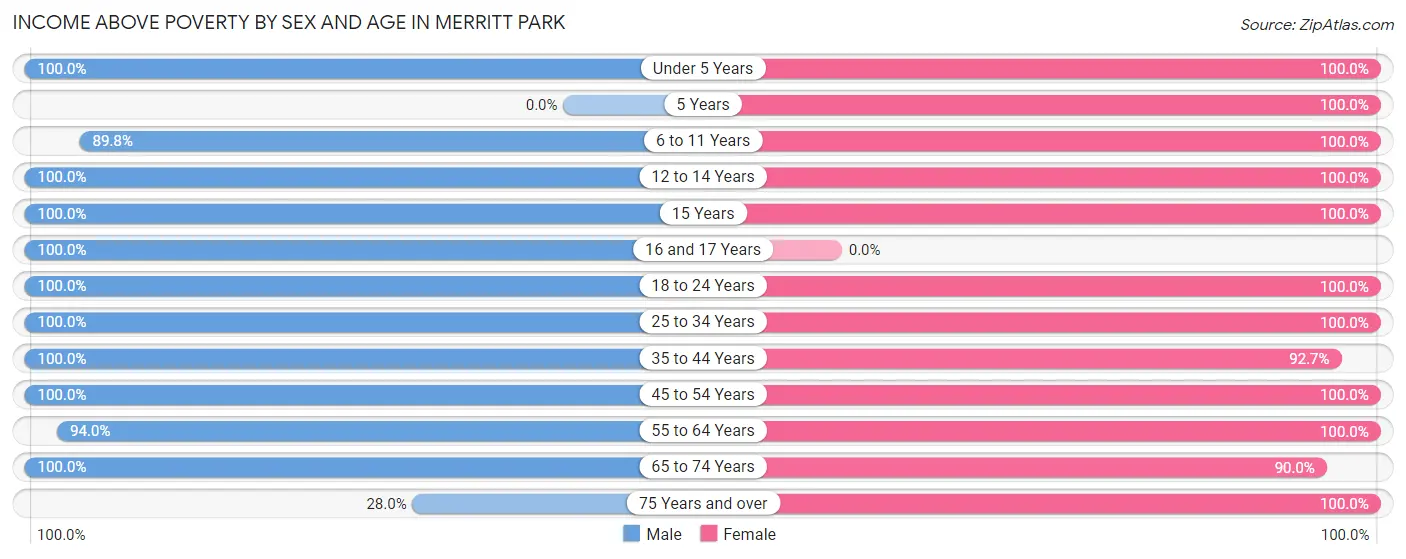
| Age Bracket | Male | Female |
| Under 5 Years | 28 (100.0%) | 51 (100.0%) |
| 5 Years | 0 (0.0%) | 11 (100.0%) |
| 6 to 11 Years | 88 (89.8%) | 86 (100.0%) |
| 12 to 14 Years | 52 (100.0%) | 42 (100.0%) |
| 15 Years | 13 (100.0%) | 6 (100.0%) |
| 16 and 17 Years | 10 (100.0%) | 0 (0.0%) |
| 18 to 24 Years | 27 (100.0%) | 47 (100.0%) |
| 25 to 34 Years | 73 (100.0%) | 42 (100.0%) |
| 35 to 44 Years | 112 (100.0%) | 140 (92.7%) |
| 45 to 54 Years | 173 (100.0%) | 115 (100.0%) |
| 55 to 64 Years | 218 (94.0%) | 135 (100.0%) |
| 65 to 74 Years | 85 (100.0%) | 135 (90.0%) |
| 75 Years and over | 14 (28.0%) | 90 (100.0%) |
| Total | 893 (93.7%) | 900 (97.2%) |
Income Below Poverty Among Married-Couple Families in Merritt Park
The poverty statistics for married-couple families in Merritt Park show that 7.6% or 36 of the total 473 families live below the poverty line. Families with no children have the highest poverty rate of 13.0%, comprising of 36 families. On the other hand, families with 1 or 2 children have the lowest poverty rate of 0.0%, which includes 0 families.
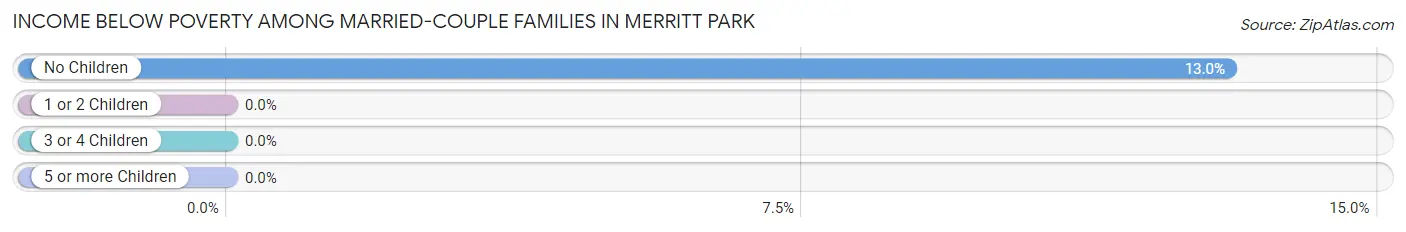
| Children | Above Poverty | Below Poverty |
| No Children | 240 (87.0%) | 36 (13.0%) |
| 1 or 2 Children | 184 (100.0%) | 0 (0.0%) |
| 3 or 4 Children | 13 (100.0%) | 0 (0.0%) |
| 5 or more Children | 0 (0.0%) | 0 (0.0%) |
| Total | 437 (92.4%) | 36 (7.6%) |
Income Below Poverty Among Single-Parent Households in Merritt Park
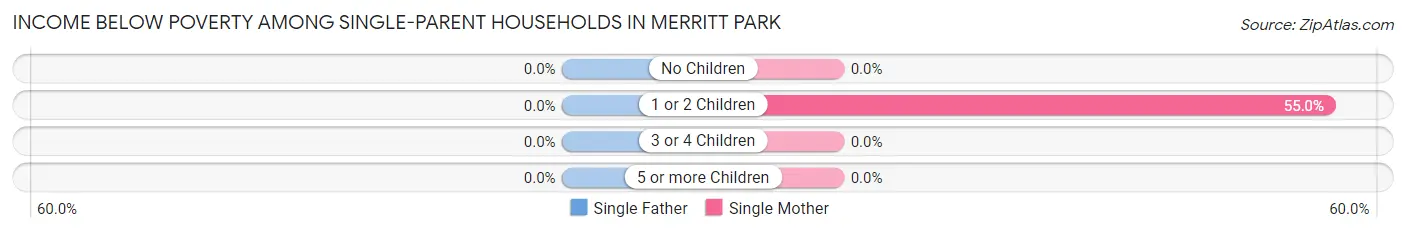
| Children | Single Father | Single Mother |
| No Children | 0 (0.0%) | 0 (0.0%) |
| 1 or 2 Children | 0 (0.0%) | 11 (55.0%) |
| 3 or 4 Children | 0 (0.0%) | 0 (0.0%) |
| 5 or more Children | 0 (0.0%) | 0 (0.0%) |
| Total | 0 (0.0%) | 11 (19.6%) |
Income Below Poverty Among Married-Couple vs Single-Parent Households in Merritt Park
The poverty data for Merritt Park shows that 36 of the married-couple family households (7.6%) and 11 of the single-parent households (12.9%) are living below the poverty level. Within the married-couple family households, those with no children have the highest poverty rate, with 36 households (13.0%) falling below the poverty line. Among the single-parent households, those with 1 or 2 children have the highest poverty rate, with 11 household (22.5%) living below poverty.
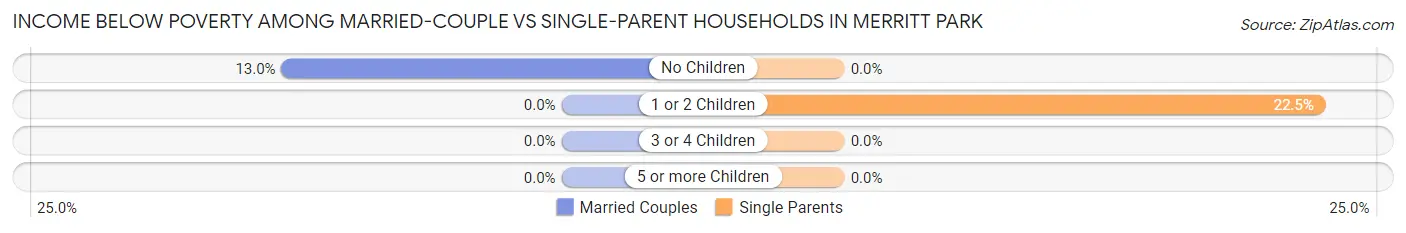
| Children | Married-Couple Families | Single-Parent Households |
| No Children | 36 (13.0%) | 0 (0.0%) |
| 1 or 2 Children | 0 (0.0%) | 11 (22.5%) |
| 3 or 4 Children | 0 (0.0%) | 0 (0.0%) |
| 5 or more Children | 0 (0.0%) | 0 (0.0%) |
| Total | 36 (7.6%) | 11 (12.9%) |
Race in Merritt Park
The most populous races in Merritt Park are White / Caucasian (1,315 | 70.0%), Asian (359 | 19.1%), and Hispanic or Latino (128 | 6.8%).
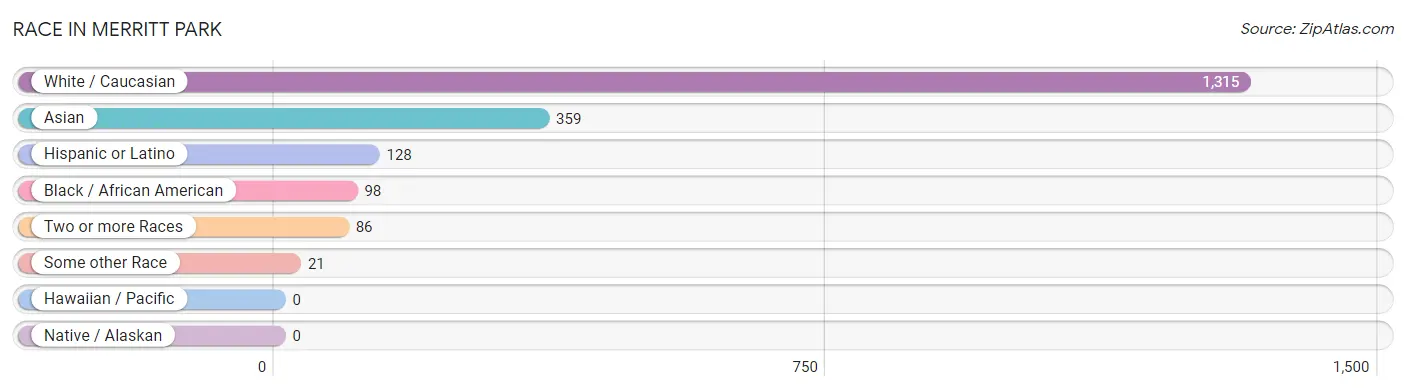
| Race | # Population | % Population |
| Asian | 359 | 19.1% |
| Black / African American | 98 | 5.2% |
| Hawaiian / Pacific | 0 | 0.0% |
| Hispanic or Latino | 128 | 6.8% |
| Native / Alaskan | 0 | 0.0% |
| White / Caucasian | 1,315 | 70.0% |
| Two or more Races | 86 | 4.6% |
| Some other Race | 21 | 1.1% |
| Total | 1,879 | 100.0% |
Ancestry in Merritt Park
The most populous ancestries reported in Merritt Park are Irish (489 | 26.0%), Italian (467 | 24.8%), Burmese (180 | 9.6%), German (152 | 8.1%), and Polish (120 | 6.4%), together accounting for 74.9% of all Merritt Park residents.
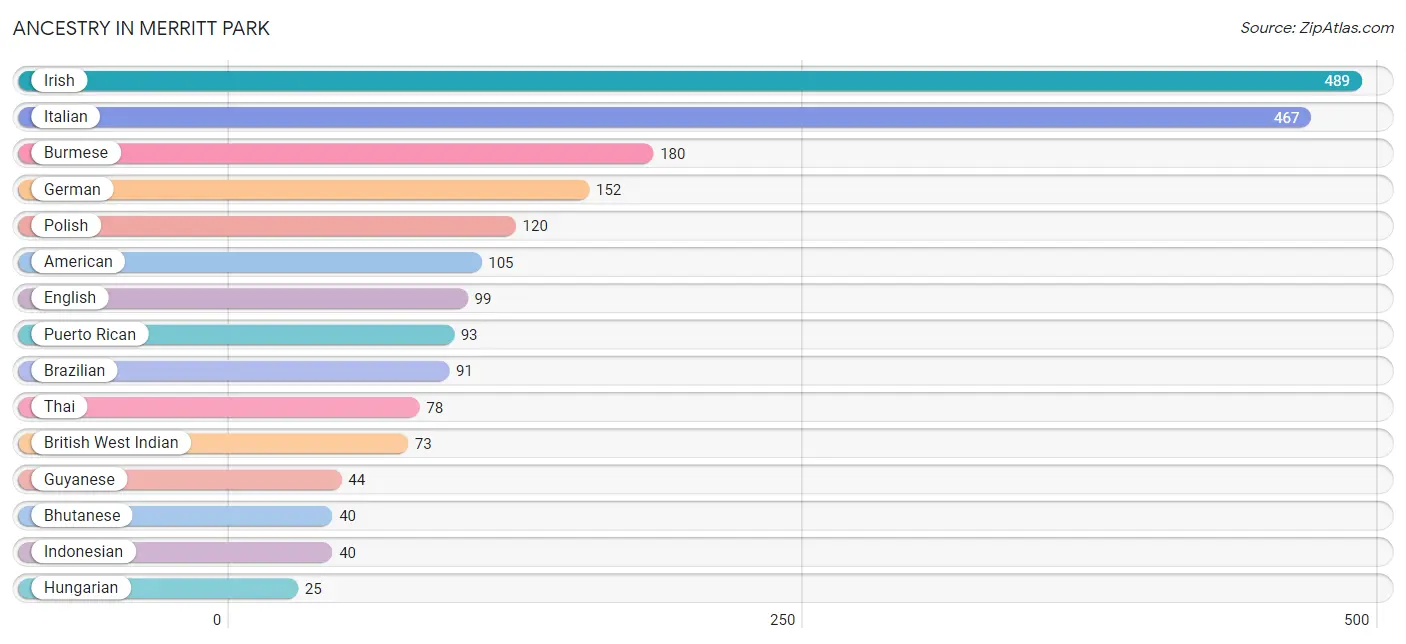
| Ancestry | # Population | % Population |
| American | 105 | 5.6% |
| Austrian | 7 | 0.4% |
| Bhutanese | 40 | 2.1% |
| Brazilian | 91 | 4.8% |
| British | 14 | 0.7% |
| British West Indian | 73 | 3.9% |
| Burmese | 180 | 9.6% |
| Czech | 15 | 0.8% |
| Dominican | 17 | 0.9% |
| Dutch | 6 | 0.3% |
| Eastern European | 15 | 0.8% |
| English | 99 | 5.3% |
| European | 21 | 1.1% |
| French | 9 | 0.5% |
| French Canadian | 6 | 0.3% |
| German | 152 | 8.1% |
| Guyanese | 44 | 2.3% |
| Hungarian | 25 | 1.3% |
| Indian (Asian) | 21 | 1.1% |
| Indonesian | 40 | 2.1% |
| Irish | 489 | 26.0% |
| Italian | 467 | 24.8% |
| Mexican | 18 | 1.0% |
| Norwegian | 9 | 0.5% |
| Polish | 120 | 6.4% |
| Puerto Rican | 93 | 5.0% |
| Russian | 18 | 1.0% |
| Slavic | 9 | 0.5% |
| Swedish | 5 | 0.3% |
| Thai | 78 | 4.2% | View All 30 Rows |
Immigrants in Merritt Park
The most numerous immigrant groups reported in Merritt Park came from Asia (244 | 13.0%), Eastern Asia (166 | 8.8%), Latin America (135 | 7.2%), Korea (119 | 6.3%), and Caribbean (69 | 3.7%), together accounting for 39.0% of all Merritt Park residents.
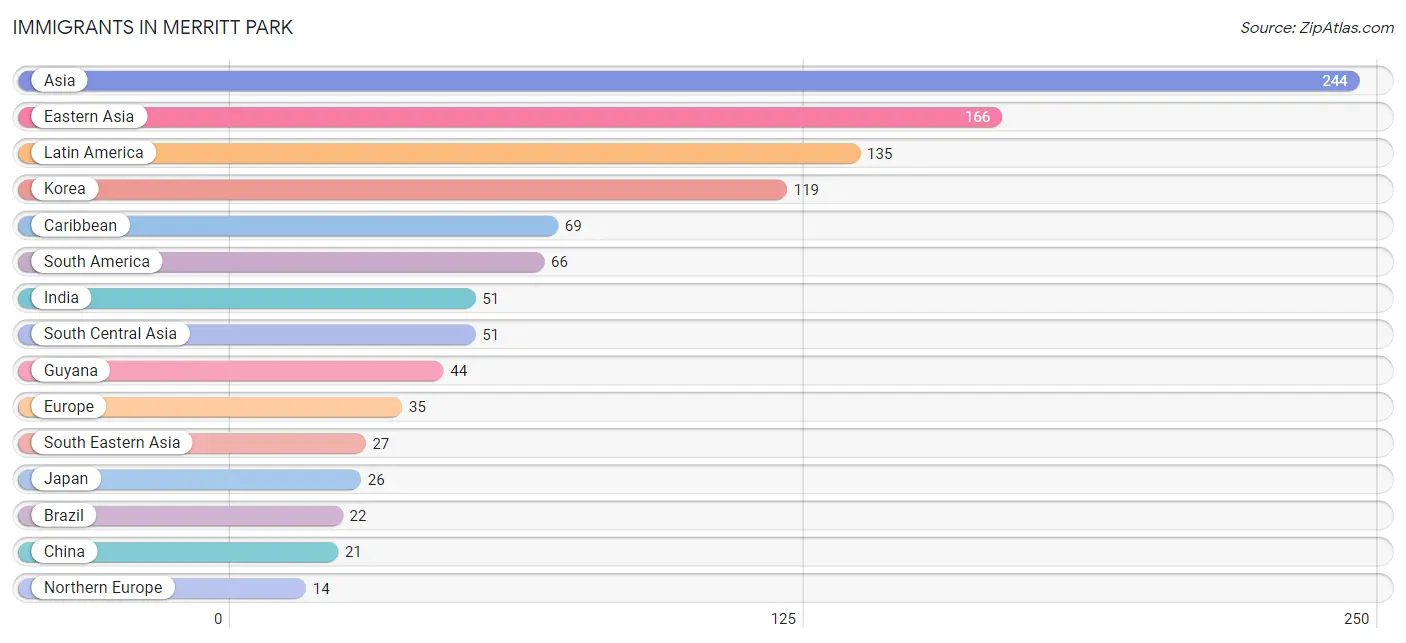
| Immigration Origin | # Population | % Population |
| Asia | 244 | 13.0% |
| Brazil | 22 | 1.2% |
| Canada | 6 | 0.3% |
| Caribbean | 69 | 3.7% |
| China | 21 | 1.1% |
| Eastern Asia | 166 | 8.8% |
| Eastern Europe | 12 | 0.6% |
| England | 6 | 0.3% |
| Europe | 35 | 1.9% |
| Guyana | 44 | 2.3% |
| India | 51 | 2.7% |
| Italy | 9 | 0.5% |
| Japan | 26 | 1.4% |
| Korea | 119 | 6.3% |
| Latin America | 135 | 7.2% |
| Northern Europe | 14 | 0.7% |
| Poland | 12 | 0.6% |
| South America | 66 | 3.5% |
| South Central Asia | 51 | 2.7% |
| South Eastern Asia | 27 | 1.4% |
| Southern Europe | 9 | 0.5% | View All 21 Rows |
Sex and Age in Merritt Park
Sex and Age in Merritt Park
The most populous age groups in Merritt Park are 45 to 49 Years (129 | 13.5%) for men and 40 to 44 Years (113 | 12.2%) for women.
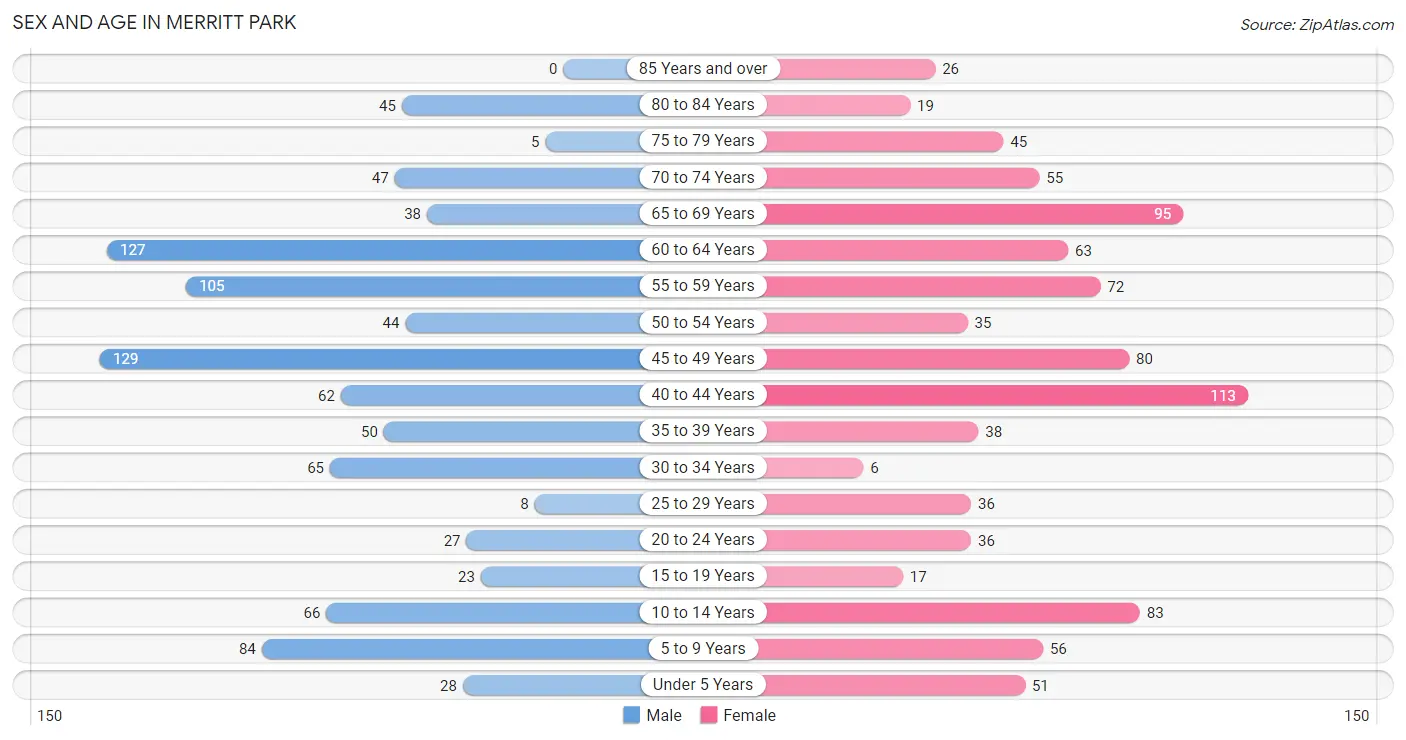
| Age Bracket | Male | Female |
| Under 5 Years | 28 (2.9%) | 51 (5.5%) |
| 5 to 9 Years | 84 (8.8%) | 56 (6.0%) |
| 10 to 14 Years | 66 (6.9%) | 83 (9.0%) |
| 15 to 19 Years | 23 (2.4%) | 17 (1.8%) |
| 20 to 24 Years | 27 (2.8%) | 36 (3.9%) |
| 25 to 29 Years | 8 (0.8%) | 36 (3.9%) |
| 30 to 34 Years | 65 (6.8%) | 6 (0.6%) |
| 35 to 39 Years | 50 (5.2%) | 38 (4.1%) |
| 40 to 44 Years | 62 (6.5%) | 113 (12.2%) |
| 45 to 49 Years | 129 (13.5%) | 80 (8.6%) |
| 50 to 54 Years | 44 (4.6%) | 35 (3.8%) |
| 55 to 59 Years | 105 (11.0%) | 72 (7.8%) |
| 60 to 64 Years | 127 (13.3%) | 63 (6.8%) |
| 65 to 69 Years | 38 (4.0%) | 95 (10.3%) |
| 70 to 74 Years | 47 (4.9%) | 55 (5.9%) |
| 75 to 79 Years | 5 (0.5%) | 45 (4.9%) |
| 80 to 84 Years | 45 (4.7%) | 19 (2.1%) |
| 85 Years and over | 0 (0.0%) | 26 (2.8%) |
| Total | 953 (100.0%) | 926 (100.0%) |
Families and Households in Merritt Park
Median Family Size in Merritt Park
The median family size in Merritt Park is 2.75 persons per family, with single male/father families (29 | 5.2%) accounting for the largest median family size of 2.86 persons per family. On the other hand, single female/mother families (56 | 10.0%) represent the smallest median family size with 2.05 persons per family.
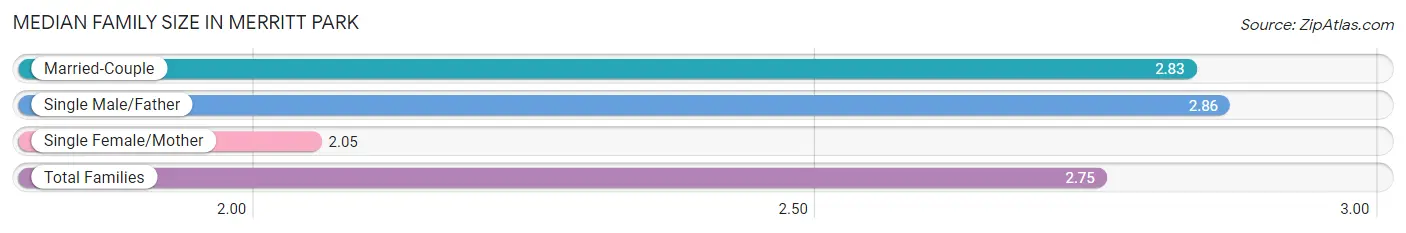
| Family Type | # Families | Family Size |
| Married-Couple | 473 (84.8%) | 2.83 |
| Single Male/Father | 29 (5.2%) | 2.86 |
| Single Female/Mother | 56 (10.0%) | 2.05 |
| Total Families | 558 (100.0%) | 2.75 |
Median Household Size in Merritt Park
The median household size in Merritt Park is 2.52 persons per household, with single male/father households (29 | 3.9%) accounting for the largest median household size of 2.86 persons per household. non-family households (189 | 25.3%) represent the smallest median household size with 1.82 persons per household.
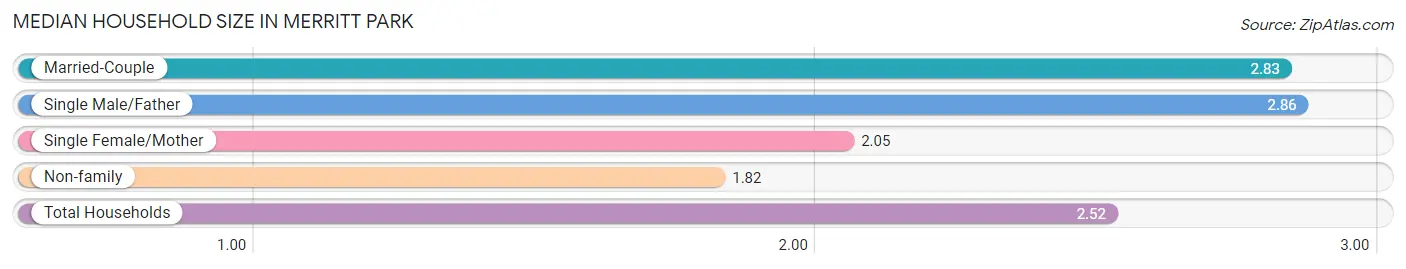
| Household Type | # Households | Household Size |
| Married-Couple | 473 (63.3%) | 2.83 |
| Single Male/Father | 29 (3.9%) | 2.86 |
| Single Female/Mother | 56 (7.5%) | 2.05 |
| Non-family | 189 (25.3%) | 1.82 |
| Total Households | 747 (100.0%) | 2.52 |
Household Size by Marriage Status in Merritt Park
Out of a total of 747 households in Merritt Park, 558 (74.7%) are family households, while 189 (25.3%) are nonfamily households. The most numerous type of family households are 2-person households, comprising 263, and the most common type of nonfamily households are 1-person households, comprising 88.
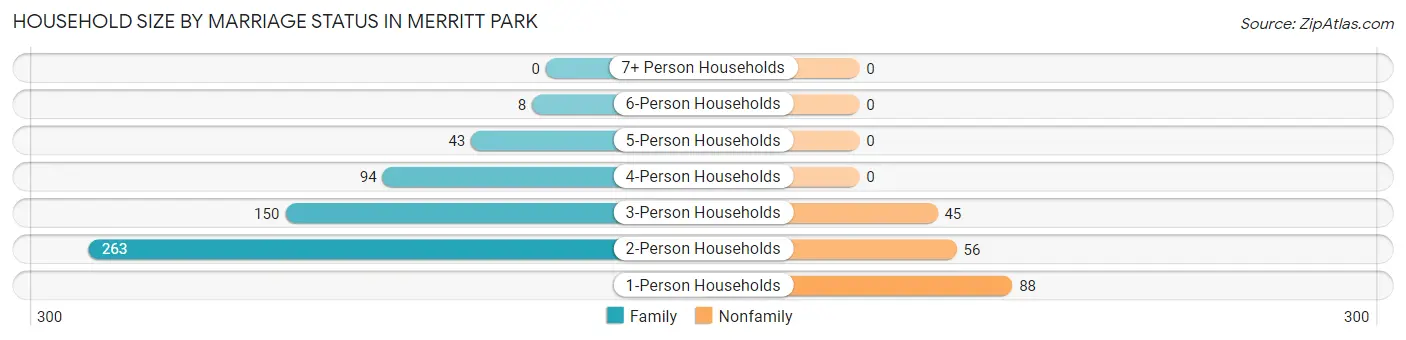
| Household Size | Family Households | Nonfamily Households |
| 1-Person Households | - | 88 (11.8%) |
| 2-Person Households | 263 (35.2%) | 56 (7.5%) |
| 3-Person Households | 150 (20.1%) | 45 (6.0%) |
| 4-Person Households | 94 (12.6%) | 0 (0.0%) |
| 5-Person Households | 43 (5.8%) | 0 (0.0%) |
| 6-Person Households | 8 (1.1%) | 0 (0.0%) |
| 7+ Person Households | 0 (0.0%) | 0 (0.0%) |
| Total | 558 (74.7%) | 189 (25.3%) |
Female Fertility in Merritt Park
Fertility by Age in Merritt Park
Average fertility rate in Merritt Park is 31.0 births per 1,000 women. Women in the age bracket of 35 to 50 years have the highest fertility rate with 43.0 births per 1,000 women. Women in the age bracket of 35 to 50 years acount for 100.0% of all women with births.
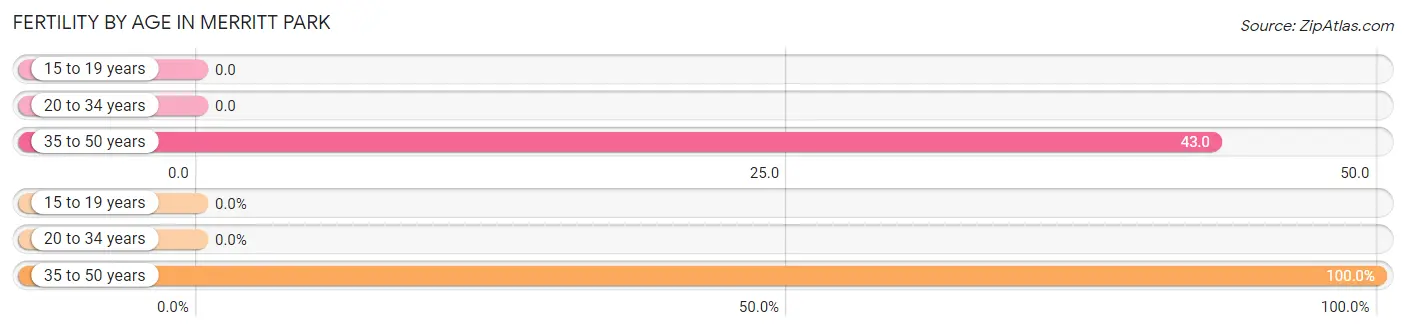
| Age Bracket | Women with Births | Births / 1,000 Women |
| 15 to 19 years | 0 (0.0%) | 0.0 |
| 20 to 34 years | 0 (0.0%) | 0.0 |
| 35 to 50 years | 10 (100.0%) | 43.0 |
| Total | 10 (100.0%) | 31.0 |
Fertility by Age by Marriage Status in Merritt Park
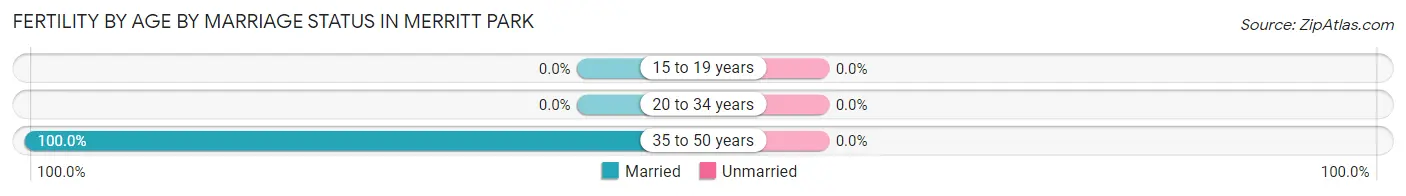
| Age Bracket | Married | Unmarried |
| 15 to 19 years | 0 (0.0%) | 0 (0.0%) |
| 20 to 34 years | 0 (0.0%) | 0 (0.0%) |
| 35 to 50 years | 10 (100.0%) | 0 (0.0%) |
| Total | 10 (100.0%) | 0 (0.0%) |
Fertility by Education in Merritt Park
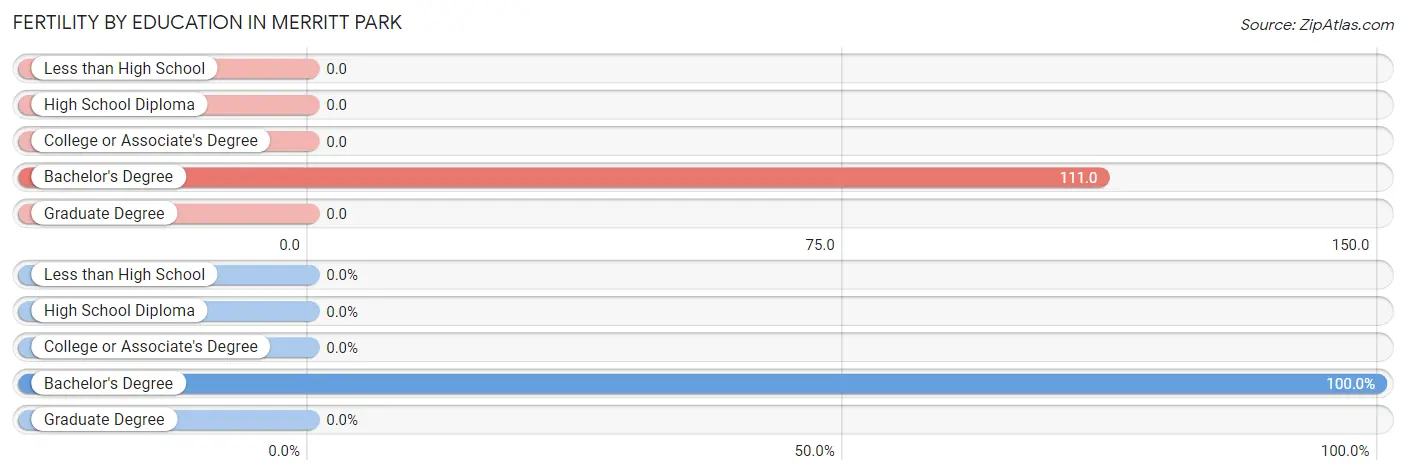
| Educational Attainment | Women with Births | Births / 1,000 Women |
| Less than High School | 0 (0.0%) | 0.0 |
| High School Diploma | 0 (0.0%) | 0.0 |
| College or Associate's Degree | 0 (0.0%) | 0.0 |
| Bachelor's Degree | 10 (100.0%) | 111.0 |
| Graduate Degree | 0 (0.0%) | 0.0 |
| Total | 10 (100.0%) | 31.0 |
Fertility by Education by Marriage Status in Merritt Park
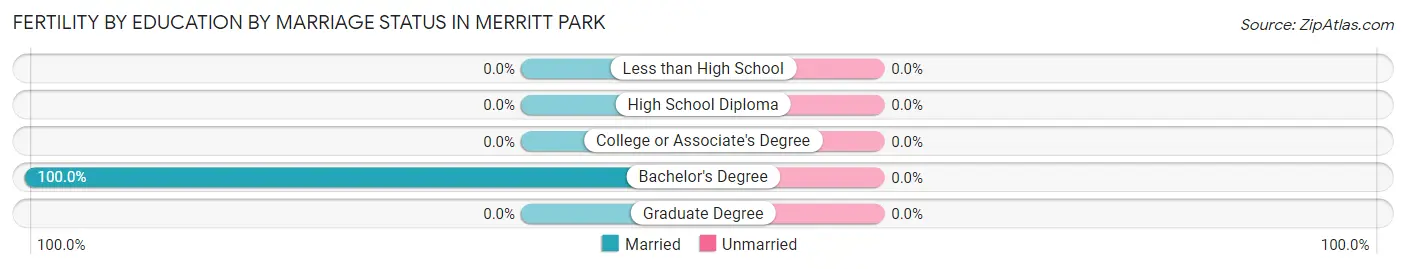
| Educational Attainment | Married | Unmarried |
| Less than High School | 0 (0.0%) | 0 (0.0%) |
| High School Diploma | 0 (0.0%) | 0 (0.0%) |
| College or Associate's Degree | 0 (0.0%) | 0 (0.0%) |
| Bachelor's Degree | 10 (100.0%) | 0 (0.0%) |
| Graduate Degree | 0 (0.0%) | 0 (0.0%) |
| Total | 10 (100.0%) | 0 (0.0%) |
Employment Characteristics in Merritt Park
Employment by Class of Employer in Merritt Park
Among the 994 employed individuals in Merritt Park, private company employees (560 | 56.3%), local government employees (175 | 17.6%), and not-for-profit organizations (126 | 12.7%) make up the most common classes of employment.
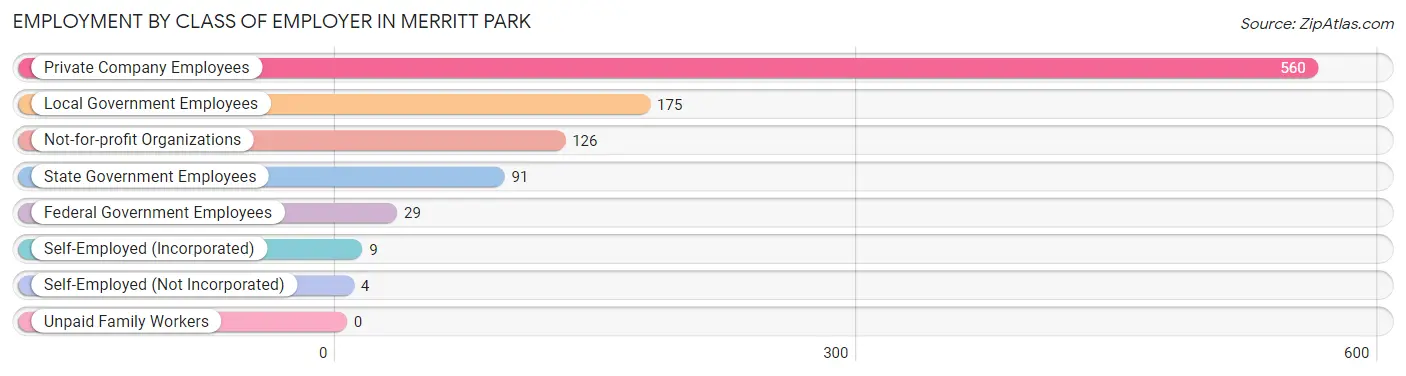
| Employer Class | # Employees | % Employees |
| Private Company Employees | 560 | 56.3% |
| Self-Employed (Incorporated) | 9 | 0.9% |
| Self-Employed (Not Incorporated) | 4 | 0.4% |
| Not-for-profit Organizations | 126 | 12.7% |
| Local Government Employees | 175 | 17.6% |
| State Government Employees | 91 | 9.1% |
| Federal Government Employees | 29 | 2.9% |
| Unpaid Family Workers | 0 | 0.0% |
| Total | 994 | 100.0% |
Employment Status by Age in Merritt Park
According to the labor force statistics for Merritt Park, out of the total population over 16 years of age (1,492), 68.0% or 1,015 individuals are in the labor force, with 2.0% or 20 of them unemployed. The age group with the highest labor force participation rate is 25 to 29 years, with 100.0% or 44 individuals in the labor force. Within the labor force, the 35 to 44 years age range has the highest percentage of unemployed individuals, with 9.5% or 23 of them being unemployed.
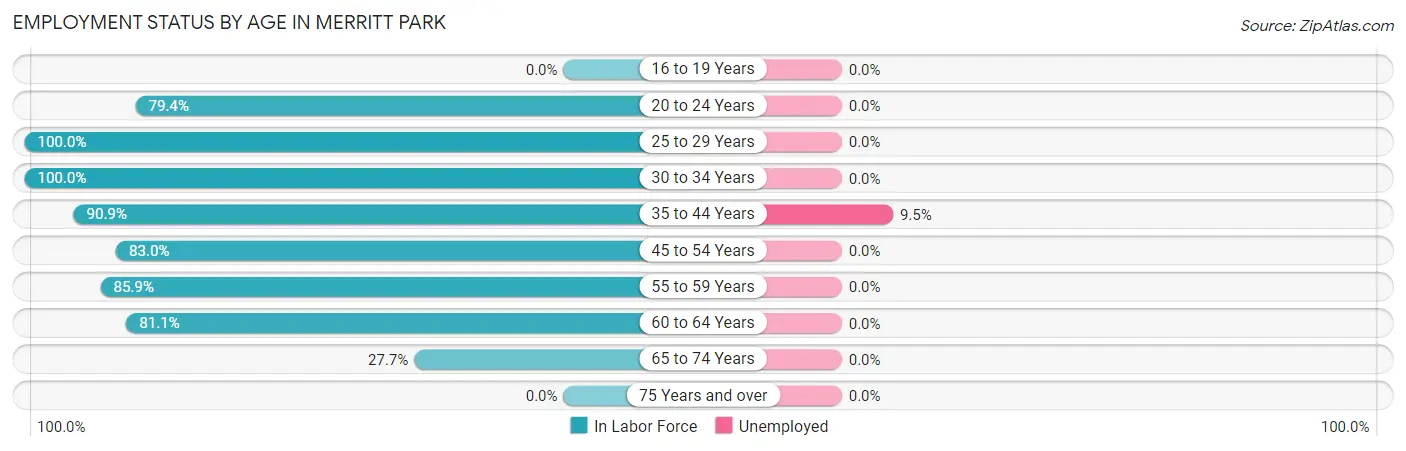
| Age Bracket | In Labor Force | Unemployed |
| 16 to 19 Years | 0 (0.0%) | 0 (0.0%) |
| 20 to 24 Years | 50 (79.4%) | 0 (0.0%) |
| 25 to 29 Years | 44 (100.0%) | 0 (0.0%) |
| 30 to 34 Years | 71 (100.0%) | 0 (0.0%) |
| 35 to 44 Years | 239 (90.9%) | 23 (9.5%) |
| 45 to 54 Years | 239 (83.0%) | 0 (0.0%) |
| 55 to 59 Years | 152 (85.9%) | 0 (0.0%) |
| 60 to 64 Years | 154 (81.1%) | 0 (0.0%) |
| 65 to 74 Years | 65 (27.7%) | 0 (0.0%) |
| 75 Years and over | 0 (0.0%) | 0 (0.0%) |
| Total | 1,015 (68.0%) | 20 (2.0%) |
Employment Status by Educational Attainment in Merritt Park
According to labor force statistics for Merritt Park, 87.0% of individuals (899) out of the total population between 25 and 64 years of age (1,033) are in the labor force, with 2.3% or 21 of them being unemployed. The group with the highest labor force participation rate are those with the educational attainment of less than high school, with 100.0% or 6 individuals in the labor force. Within the labor force, individuals with college / associate degree education have the highest percentage of unemployment, with 9.5% or 20 of them being unemployed.
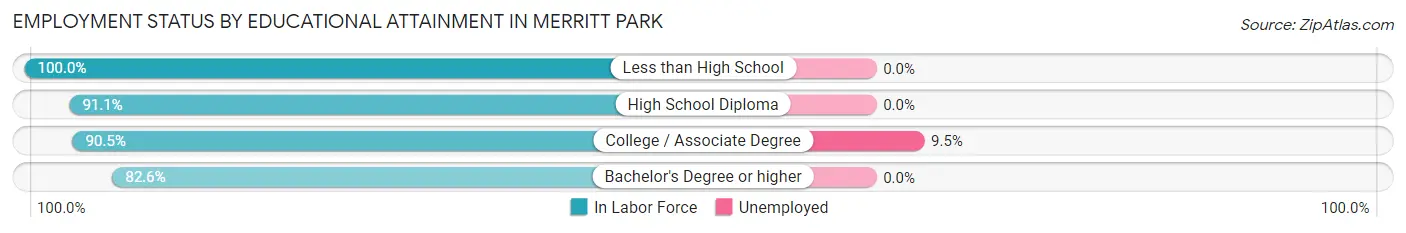
| Educational Attainment | In Labor Force | Unemployed |
| Less than High School | 6 (100.0%) | 0 (0.0%) |
| High School Diploma | 285 (91.1%) | 0 (0.0%) |
| College / Associate Degree | 210 (90.5%) | 22 (9.5%) |
| Bachelor's Degree or higher | 398 (82.6%) | 0 (0.0%) |
| Total | 899 (87.0%) | 24 (2.3%) |
Employment Occupations by Sex in Merritt Park
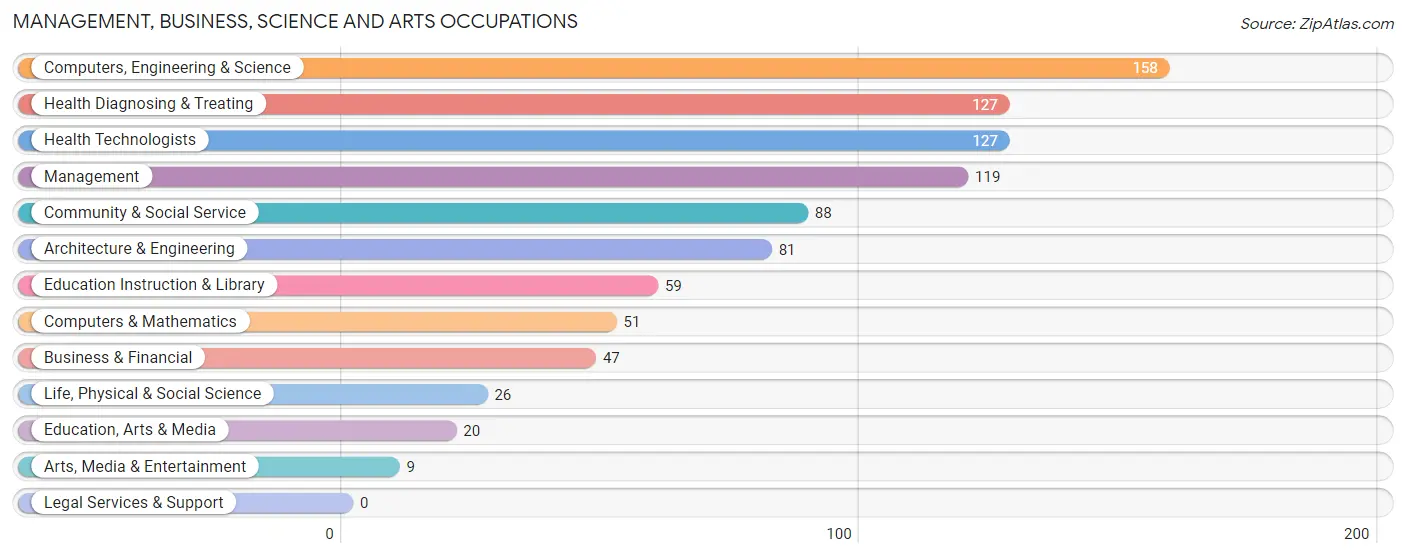
Management, Business, Science and Arts Occupations
The most common Management, Business, Science and Arts occupations in Merritt Park are Computers, Engineering & Science (158 | 16.4%), Health Diagnosing & Treating (127 | 13.2%), Health Technologists (127 | 13.2%), Management (119 | 12.3%), and Community & Social Service (88 | 9.1%).
Management, Business, Science and Arts Occupations by Sex
Within the Management, Business, Science and Arts occupations in Merritt Park, the most male-oriented occupations are Computers & Mathematics (100.0%), Life, Physical & Social Science (100.0%), and Arts, Media & Entertainment (100.0%), while the most female-oriented occupations are Education, Arts & Media (100.0%), Education Instruction & Library (100.0%), and Health Diagnosing & Treating (100.0%).
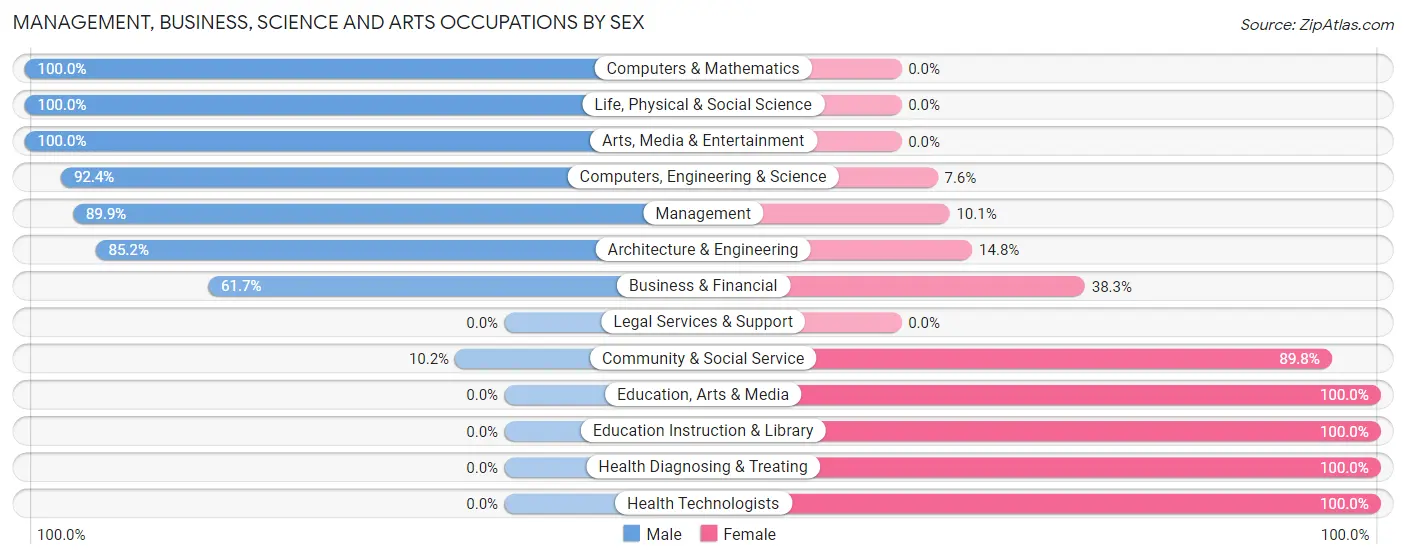
| Occupation | Male | Female |
| Management | 107 (89.9%) | 12 (10.1%) |
| Business & Financial | 29 (61.7%) | 18 (38.3%) |
| Computers, Engineering & Science | 146 (92.4%) | 12 (7.6%) |
| Computers & Mathematics | 51 (100.0%) | 0 (0.0%) |
| Architecture & Engineering | 69 (85.2%) | 12 (14.8%) |
| Life, Physical & Social Science | 26 (100.0%) | 0 (0.0%) |
| Community & Social Service | 9 (10.2%) | 79 (89.8%) |
| Education, Arts & Media | 0 (0.0%) | 20 (100.0%) |
| Legal Services & Support | 0 (0.0%) | 0 (0.0%) |
| Education Instruction & Library | 0 (0.0%) | 59 (100.0%) |
| Arts, Media & Entertainment | 9 (100.0%) | 0 (0.0%) |
| Health Diagnosing & Treating | 0 (0.0%) | 127 (100.0%) |
| Health Technologists | 0 (0.0%) | 127 (100.0%) |
| Total (Category) | 291 (54.0%) | 248 (46.0%) |
| Total (Overall) | 557 (57.7%) | 408 (42.3%) |
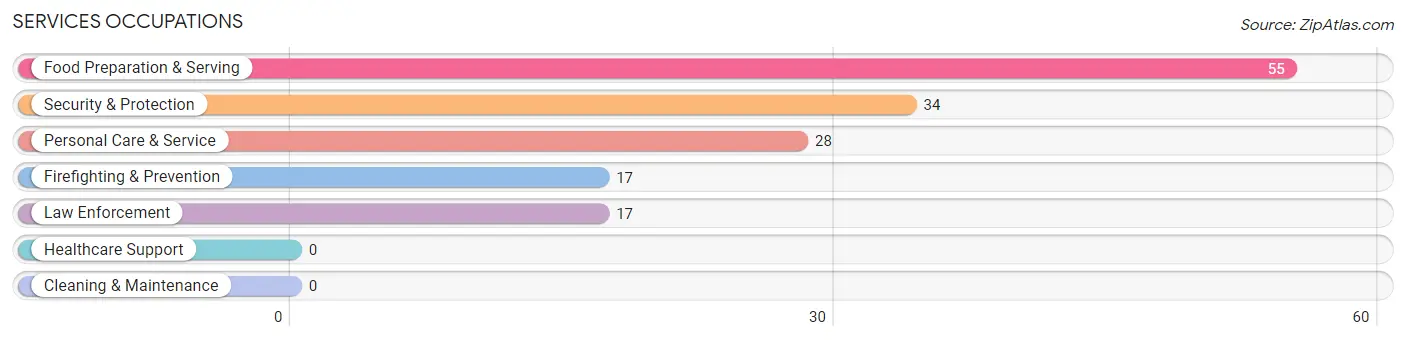
Services Occupations
The most common Services occupations in Merritt Park are Food Preparation & Serving (55 | 5.7%), Security & Protection (34 | 3.5%), Personal Care & Service (28 | 2.9%), Firefighting & Prevention (17 | 1.8%), and Law Enforcement (17 | 1.8%).
Services Occupations by Sex
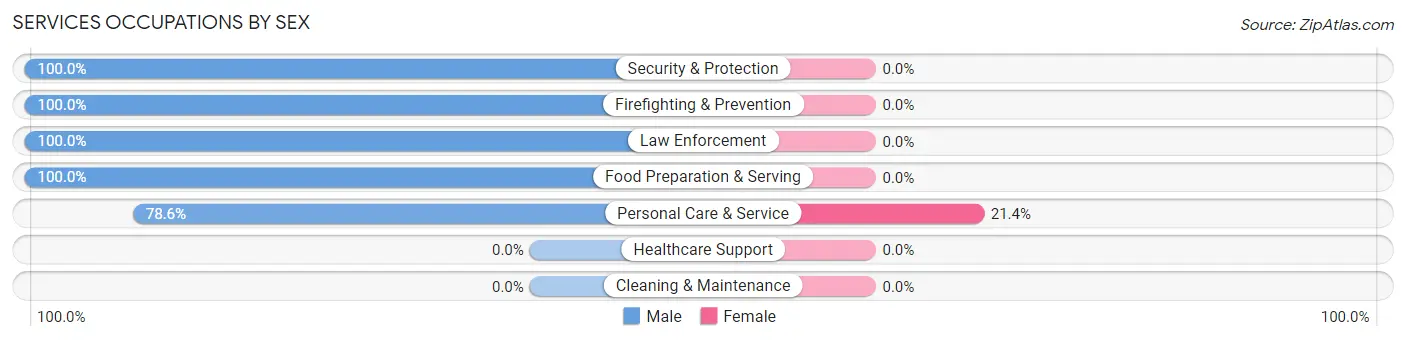
| Occupation | Male | Female |
| Healthcare Support | 0 (0.0%) | 0 (0.0%) |
| Security & Protection | 34 (100.0%) | 0 (0.0%) |
| Firefighting & Prevention | 17 (100.0%) | 0 (0.0%) |
| Law Enforcement | 17 (100.0%) | 0 (0.0%) |
| Food Preparation & Serving | 55 (100.0%) | 0 (0.0%) |
| Cleaning & Maintenance | 0 (0.0%) | 0 (0.0%) |
| Personal Care & Service | 22 (78.6%) | 6 (21.4%) |
| Total (Category) | 111 (94.9%) | 6 (5.1%) |
| Total (Overall) | 557 (57.7%) | 408 (42.3%) |
Sales and Office Occupations
The most common Sales and Office occupations in Merritt Park are Office & Administration (152 | 15.8%), and Sales & Related (28 | 2.9%).
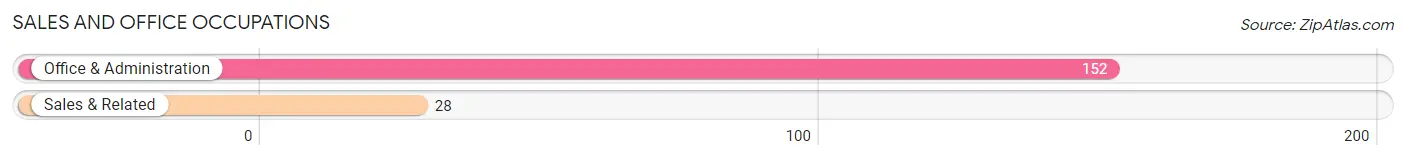
Sales and Office Occupations by Sex
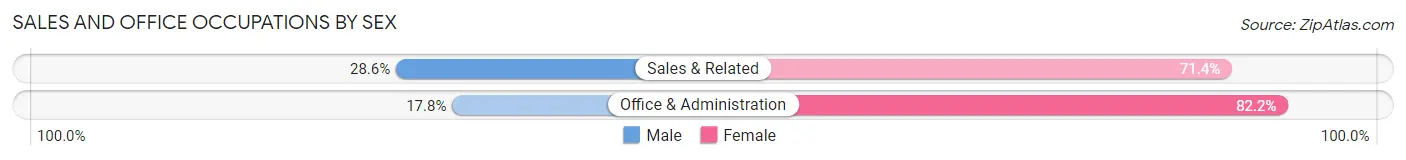
| Occupation | Male | Female |
| Sales & Related | 8 (28.6%) | 20 (71.4%) |
| Office & Administration | 27 (17.8%) | 125 (82.2%) |
| Total (Category) | 35 (19.4%) | 145 (80.6%) |
| Total (Overall) | 557 (57.7%) | 408 (42.3%) |
Natural Resources, Construction and Maintenance Occupations
The most common Natural Resources, Construction and Maintenance occupations in Merritt Park are Construction & Extraction (29 | 3.0%), and Installation, Maintenance & Repair (7 | 0.7%).
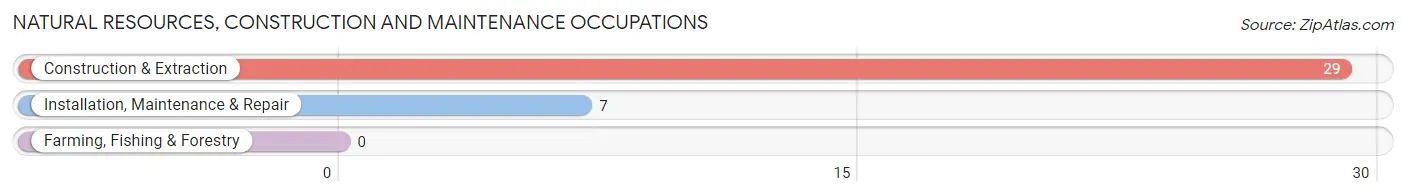
Natural Resources, Construction and Maintenance Occupations by Sex
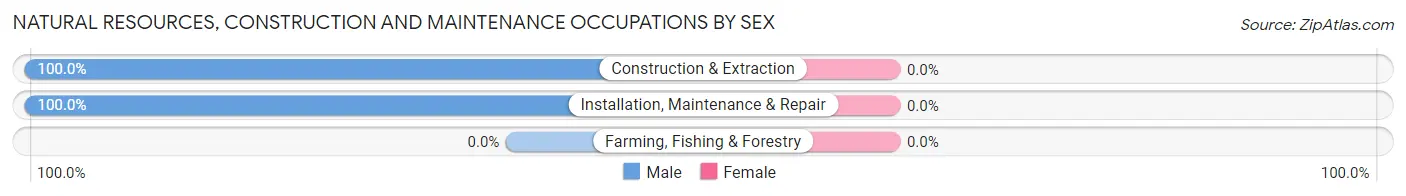
| Occupation | Male | Female |
| Farming, Fishing & Forestry | 0 (0.0%) | 0 (0.0%) |
| Construction & Extraction | 29 (100.0%) | 0 (0.0%) |
| Installation, Maintenance & Repair | 7 (100.0%) | 0 (0.0%) |
| Total (Category) | 36 (100.0%) | 0 (0.0%) |
| Total (Overall) | 557 (57.7%) | 408 (42.3%) |
Production, Transportation and Moving Occupations
The most common Production, Transportation and Moving occupations in Merritt Park are Transportation (48 | 5.0%), and Material Moving (45 | 4.7%).
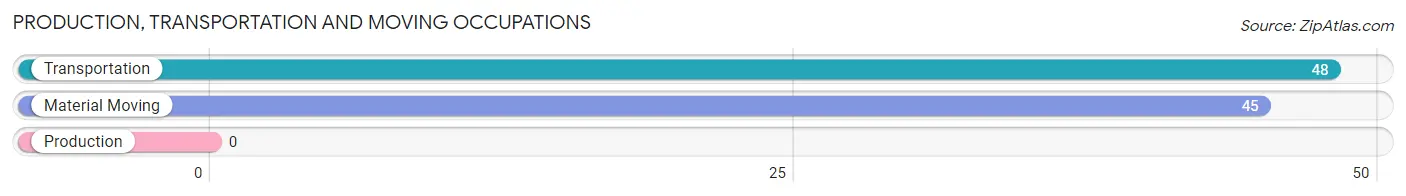
Production, Transportation and Moving Occupations by Sex
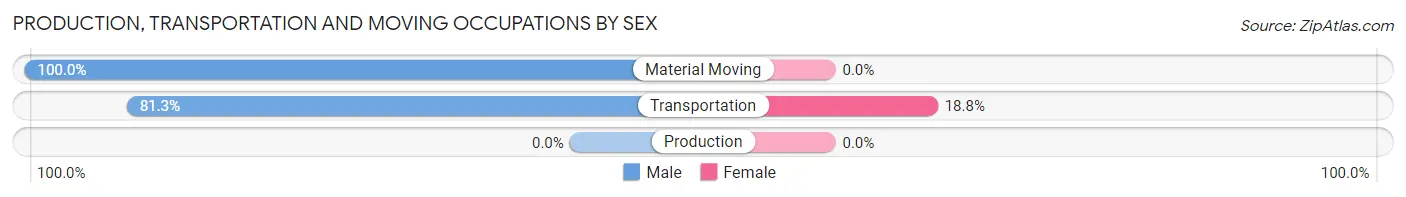
| Occupation | Male | Female |
| Production | 0 (0.0%) | 0 (0.0%) |
| Transportation | 39 (81.2%) | 9 (18.8%) |
| Material Moving | 45 (100.0%) | 0 (0.0%) |
| Total (Category) | 84 (90.3%) | 9 (9.7%) |
| Total (Overall) | 557 (57.7%) | 408 (42.3%) |
Employment Industries by Sex in Merritt Park
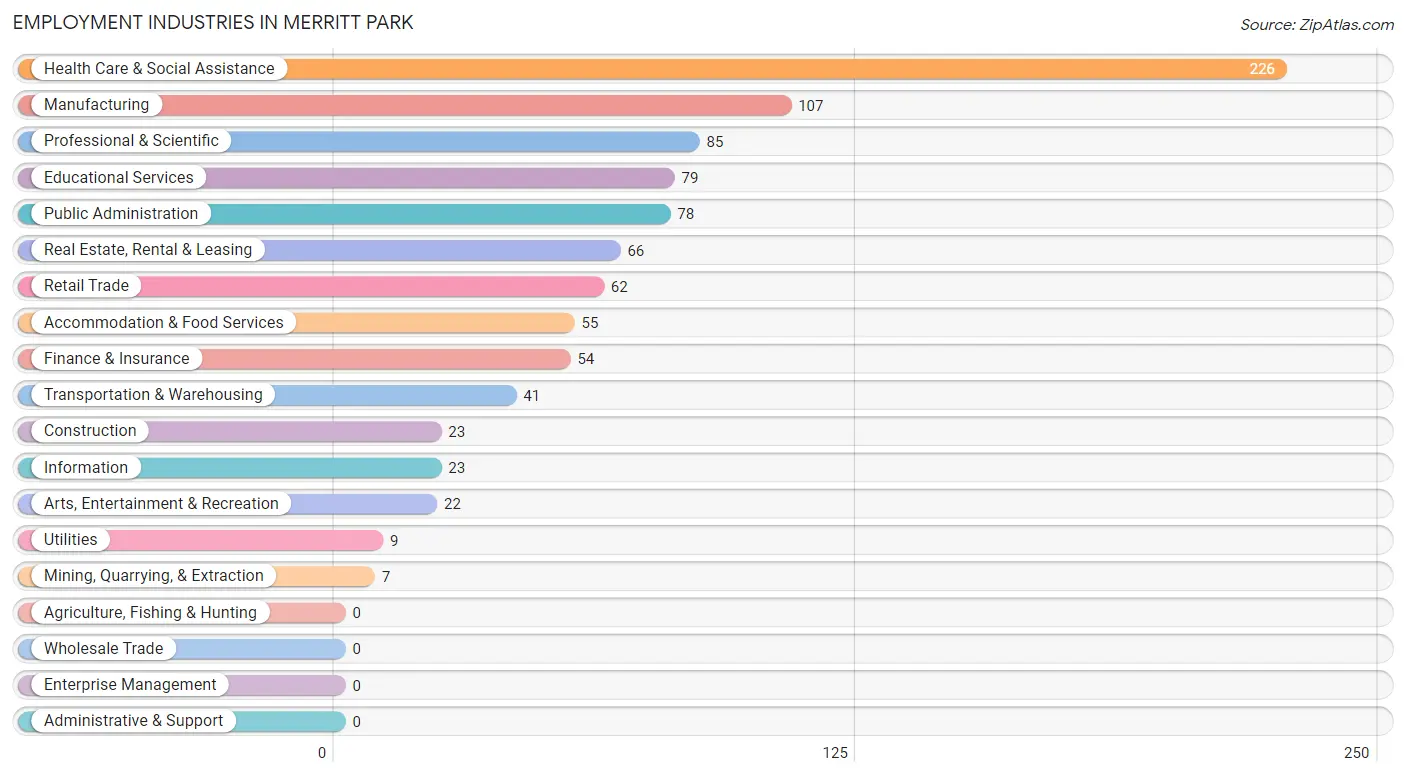
Employment Industries in Merritt Park
The major employment industries in Merritt Park include Health Care & Social Assistance (226 | 23.4%), Manufacturing (107 | 11.1%), Professional & Scientific (85 | 8.8%), Educational Services (79 | 8.2%), and Public Administration (78 | 8.1%).
Employment Industries by Sex in Merritt Park
The Merritt Park industries that see more men than women are Mining, Quarrying, & Extraction (100.0%), Construction (100.0%), and Utilities (100.0%), whereas the industries that tend to have a higher number of women are Health Care & Social Assistance (80.1%), Educational Services (79.7%), and Public Administration (70.5%).
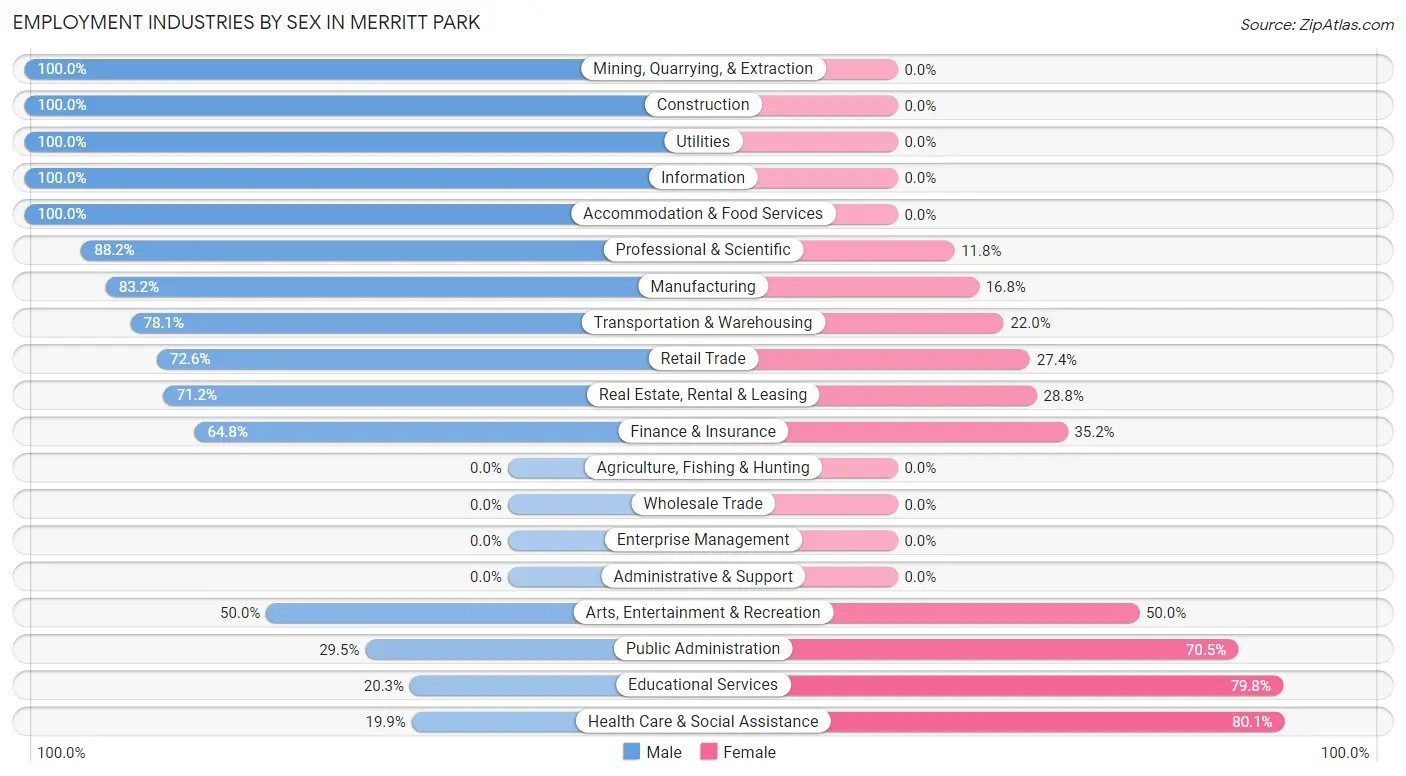
| Industry | Male | Female |
| Agriculture, Fishing & Hunting | 0 (0.0%) | 0 (0.0%) |
| Mining, Quarrying, & Extraction | 7 (100.0%) | 0 (0.0%) |
| Construction | 23 (100.0%) | 0 (0.0%) |
| Manufacturing | 89 (83.2%) | 18 (16.8%) |
| Wholesale Trade | 0 (0.0%) | 0 (0.0%) |
| Retail Trade | 45 (72.6%) | 17 (27.4%) |
| Transportation & Warehousing | 32 (78.0%) | 9 (22.0%) |
| Utilities | 9 (100.0%) | 0 (0.0%) |
| Information | 23 (100.0%) | 0 (0.0%) |
| Finance & Insurance | 35 (64.8%) | 19 (35.2%) |
| Real Estate, Rental & Leasing | 47 (71.2%) | 19 (28.8%) |
| Professional & Scientific | 75 (88.2%) | 10 (11.8%) |
| Enterprise Management | 0 (0.0%) | 0 (0.0%) |
| Administrative & Support | 0 (0.0%) | 0 (0.0%) |
| Educational Services | 16 (20.3%) | 63 (79.7%) |
| Health Care & Social Assistance | 45 (19.9%) | 181 (80.1%) |
| Arts, Entertainment & Recreation | 11 (50.0%) | 11 (50.0%) |
| Accommodation & Food Services | 55 (100.0%) | 0 (0.0%) |
| Public Administration | 23 (29.5%) | 55 (70.5%) |
| Total | 557 (57.7%) | 408 (42.3%) |
Education in Merritt Park
School Enrollment in Merritt Park
The most common levels of schooling among the 375 students in Merritt Park are middle school (149 | 39.7%), elementary school (119 | 31.7%), and high school (38 | 10.1%).
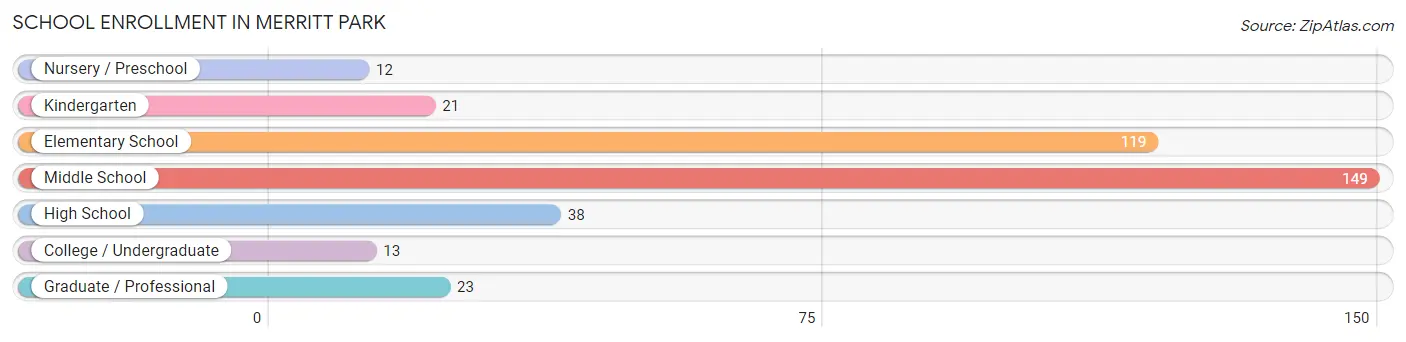
| School Level | # Students | % Students |
| Nursery / Preschool | 12 | 3.2% |
| Kindergarten | 21 | 5.6% |
| Elementary School | 119 | 31.7% |
| Middle School | 149 | 39.7% |
| High School | 38 | 10.1% |
| College / Undergraduate | 13 | 3.5% |
| Graduate / Professional | 23 | 6.1% |
| Total | 375 | 100.0% |
School Enrollment by Age by Funding Source in Merritt Park
Out of a total of 375 students who are enrolled in schools in Merritt Park, 39 (10.4%) attend a private institution, while the remaining 336 (89.6%) are enrolled in public schools. The age group of 35 years and over has the highest likelihood of being enrolled in private schools, with 11 (55.0% in the age bracket) enrolled. Conversely, the age group of 5 to 9 year old has the lowest likelihood of being enrolled in a private school, with 140 (100.0% in the age bracket) attending a public institution.
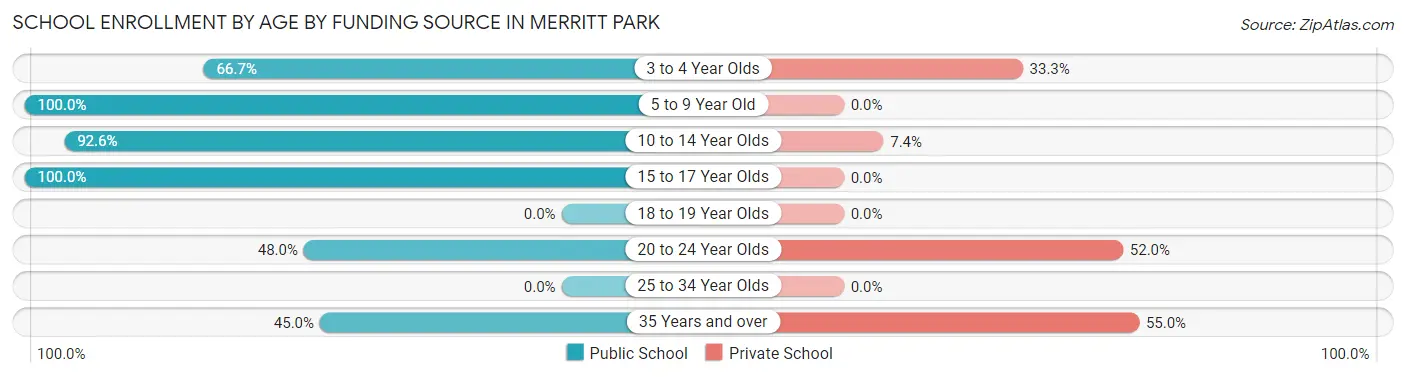
| Age Bracket | Public School | Private School |
| 3 to 4 Year Olds | 8 (66.7%) | 4 (33.3%) |
| 5 to 9 Year Old | 140 (100.0%) | 0 (0.0%) |
| 10 to 14 Year Olds | 138 (92.6%) | 11 (7.4%) |
| 15 to 17 Year Olds | 29 (100.0%) | 0 (0.0%) |
| 18 to 19 Year Olds | 0 (0.0%) | 0 (0.0%) |
| 20 to 24 Year Olds | 12 (48.0%) | 13 (52.0%) |
| 25 to 34 Year Olds | 0 (0.0%) | 0 (0.0%) |
| 35 Years and over | 9 (45.0%) | 11 (55.0%) |
| Total | 336 (89.6%) | 39 (10.4%) |
Educational Attainment by Field of Study in Merritt Park
Science & technology (108 | 16.3%), engineering (107 | 16.2%), business (83 | 12.5%), physical & health sciences (72 | 10.9%), and bio, nature & agricultural (71 | 10.7%) are the most common fields of study among 662 individuals in Merritt Park who have obtained a bachelor's degree or higher.
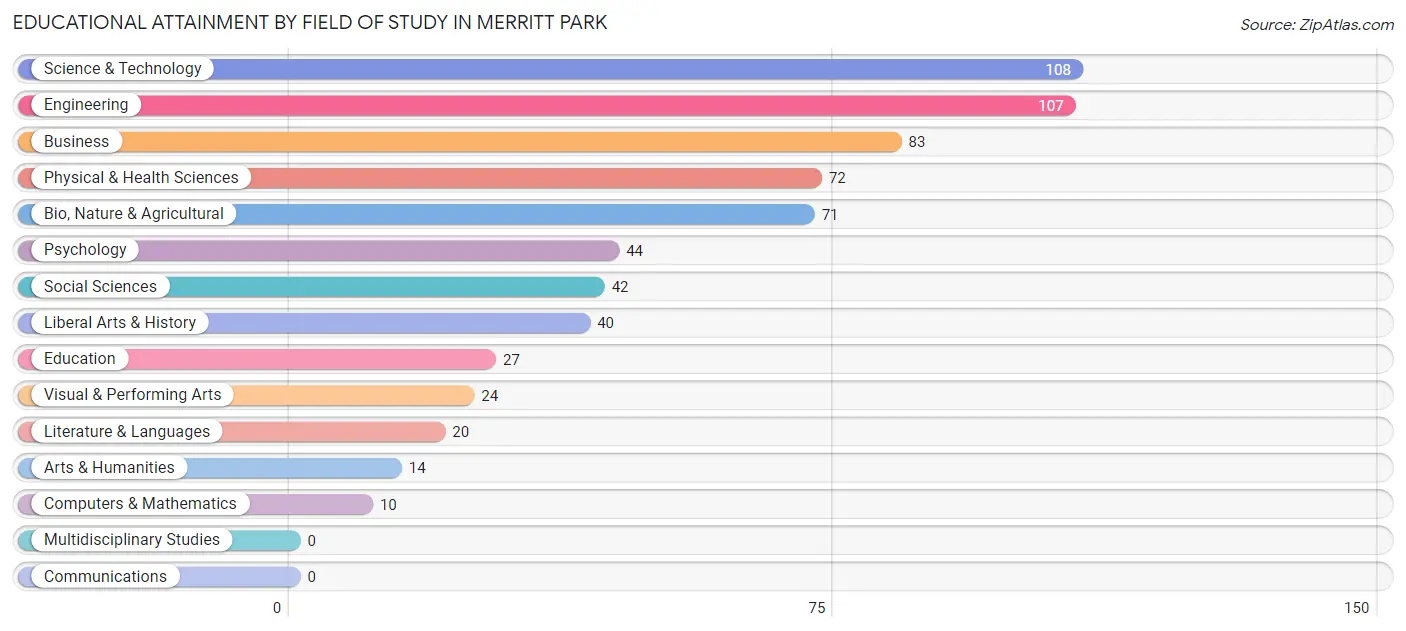
| Field of Study | # Graduates | % Graduates |
| Computers & Mathematics | 10 | 1.5% |
| Bio, Nature & Agricultural | 71 | 10.7% |
| Physical & Health Sciences | 72 | 10.9% |
| Psychology | 44 | 6.7% |
| Social Sciences | 42 | 6.3% |
| Engineering | 107 | 16.2% |
| Multidisciplinary Studies | 0 | 0.0% |
| Science & Technology | 108 | 16.3% |
| Business | 83 | 12.5% |
| Education | 27 | 4.1% |
| Literature & Languages | 20 | 3.0% |
| Liberal Arts & History | 40 | 6.0% |
| Visual & Performing Arts | 24 | 3.6% |
| Communications | 0 | 0.0% |
| Arts & Humanities | 14 | 2.1% |
| Total | 662 | 100.0% |
Transportation & Commute in Merritt Park
Vehicle Availability by Sex in Merritt Park
The most prevalent vehicle ownership categories in Merritt Park are males with 2 vehicles (271, accounting for 46.3%) and females with 2 vehicles (184, making up 66.4%).
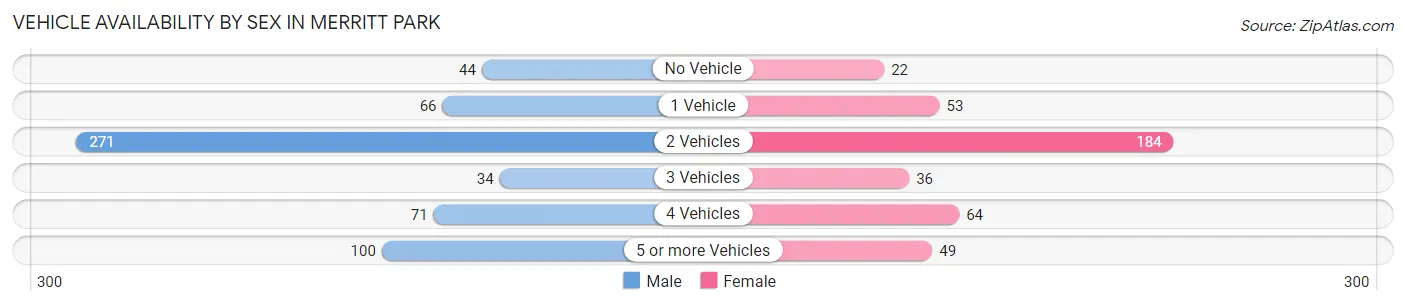
| Vehicles Available | Male | Female |
| No Vehicle | 44 (7.5%) | 22 (5.4%) |
| 1 Vehicle | 66 (11.3%) | 53 (13.0%) |
| 2 Vehicles | 271 (46.3%) | 184 (45.1%) |
| 3 Vehicles | 34 (5.8%) | 36 (8.8%) |
| 4 Vehicles | 71 (12.1%) | 64 (15.7%) |
| 5 or more Vehicles | 100 (17.1%) | 49 (12.0%) |
| Total | 586 (100.0%) | 408 (100.0%) |
Commute Time in Merritt Park
The most frequently occuring commute durations in Merritt Park are 90 or more minutes (166 commuters, 18.2%), 45 to 59 minutes (144 commuters, 15.8%), and 10 to 14 minutes (106 commuters, 11.6%).
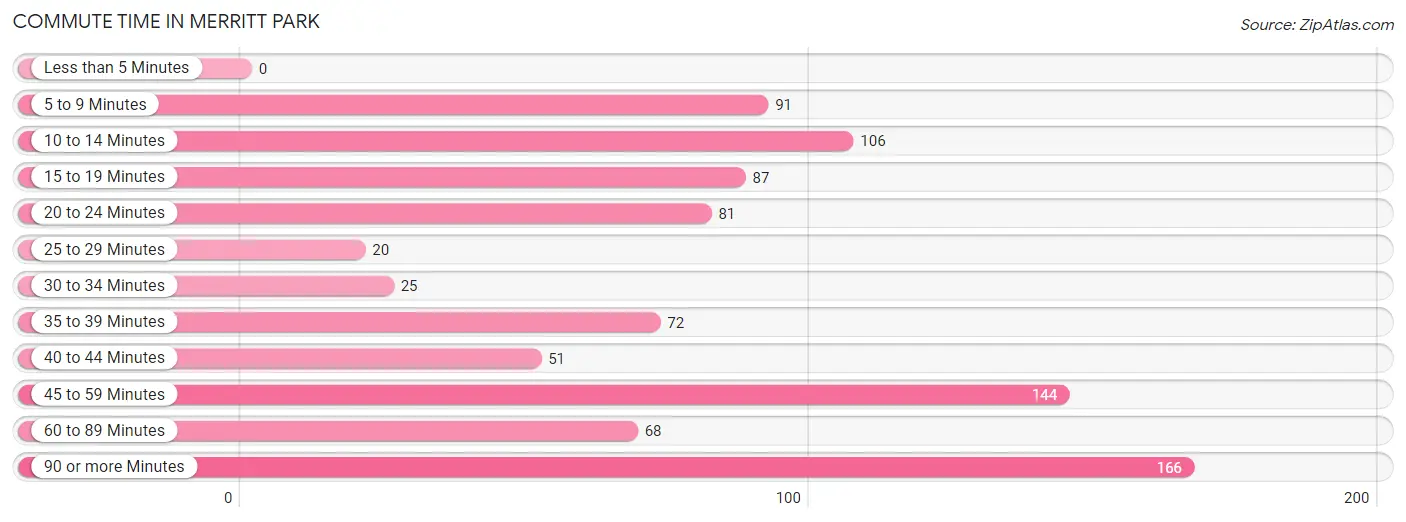
| Commute Time | # Commuters | % Commuters |
| Less than 5 Minutes | 0 | 0.0% |
| 5 to 9 Minutes | 91 | 10.0% |
| 10 to 14 Minutes | 106 | 11.6% |
| 15 to 19 Minutes | 87 | 9.6% |
| 20 to 24 Minutes | 81 | 8.9% |
| 25 to 29 Minutes | 20 | 2.2% |
| 30 to 34 Minutes | 25 | 2.7% |
| 35 to 39 Minutes | 72 | 7.9% |
| 40 to 44 Minutes | 51 | 5.6% |
| 45 to 59 Minutes | 144 | 15.8% |
| 60 to 89 Minutes | 68 | 7.5% |
| 90 or more Minutes | 166 | 18.2% |
Commute Time by Sex in Merritt Park
The most common commute times in Merritt Park are 90 or more minutes (134 commuters, 25.4%) for males and 45 to 59 minutes (80 commuters, 20.9%) for females.
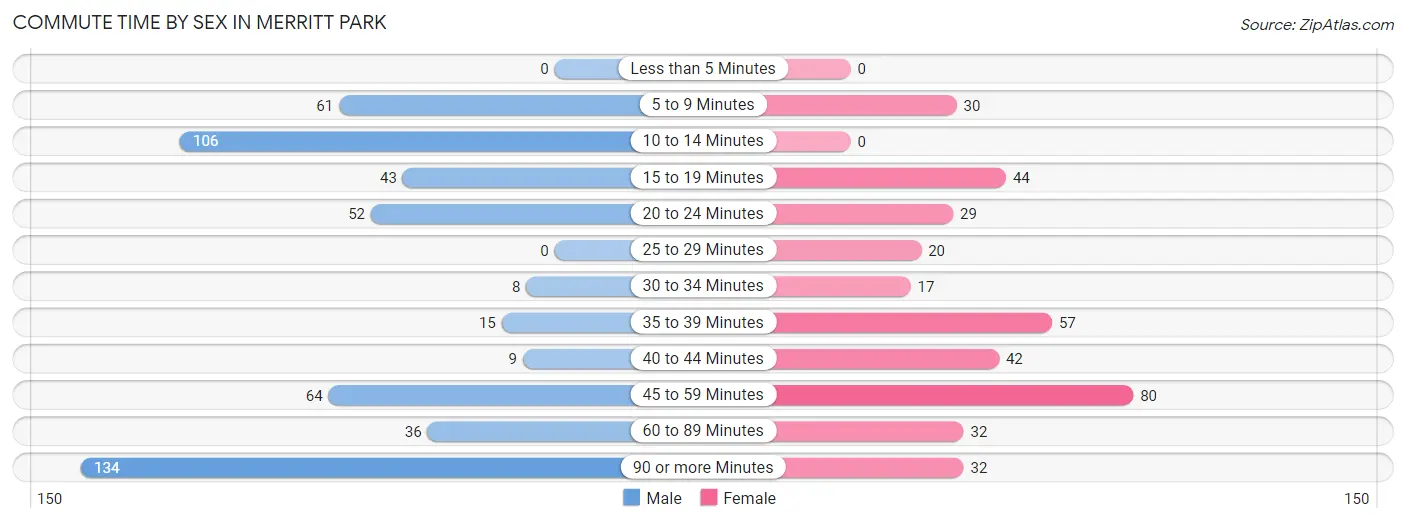
| Commute Time | Male | Female |
| Less than 5 Minutes | 0 (0.0%) | 0 (0.0%) |
| 5 to 9 Minutes | 61 (11.6%) | 30 (7.8%) |
| 10 to 14 Minutes | 106 (20.1%) | 0 (0.0%) |
| 15 to 19 Minutes | 43 (8.1%) | 44 (11.5%) |
| 20 to 24 Minutes | 52 (9.9%) | 29 (7.6%) |
| 25 to 29 Minutes | 0 (0.0%) | 20 (5.2%) |
| 30 to 34 Minutes | 8 (1.5%) | 17 (4.4%) |
| 35 to 39 Minutes | 15 (2.8%) | 57 (14.9%) |
| 40 to 44 Minutes | 9 (1.7%) | 42 (11.0%) |
| 45 to 59 Minutes | 64 (12.1%) | 80 (20.9%) |
| 60 to 89 Minutes | 36 (6.8%) | 32 (8.4%) |
| 90 or more Minutes | 134 (25.4%) | 32 (8.4%) |
Time of Departure to Work by Sex in Merritt Park
The most frequent times of departure to work in Merritt Park are 6:00 AM to 6:29 AM (107, 20.3%) for males and 8:00 AM to 8:29 AM (79, 20.6%) for females.
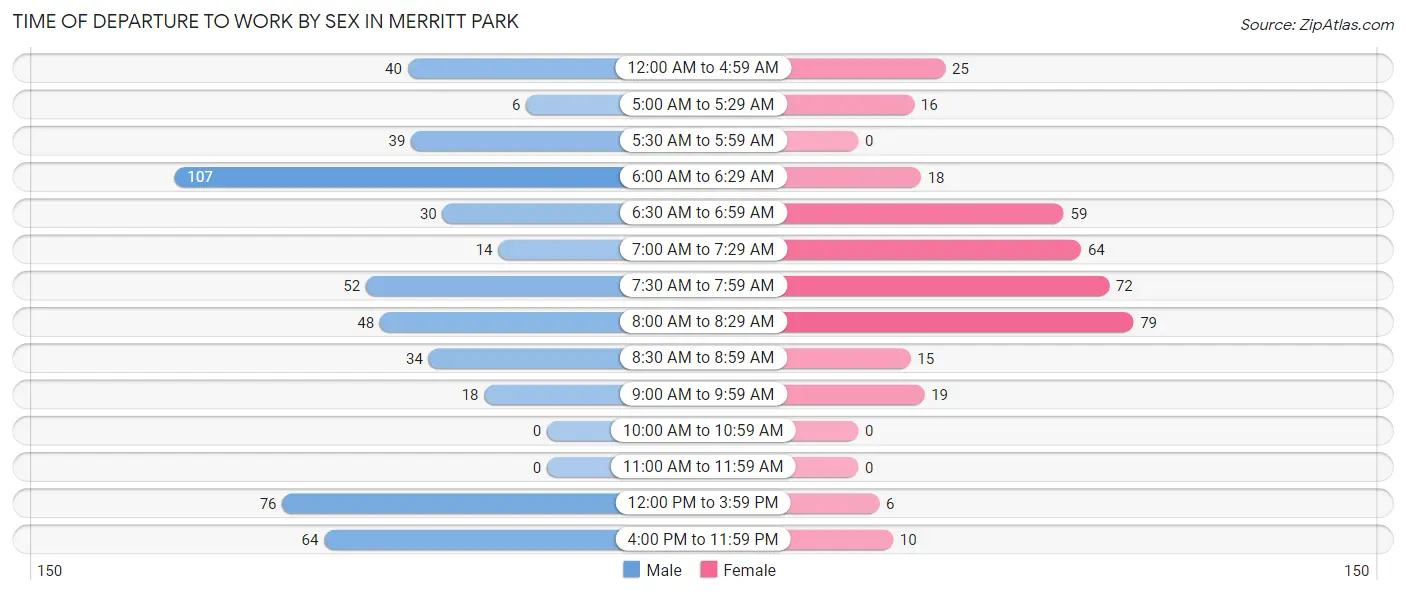
| Time of Departure | Male | Female |
| 12:00 AM to 4:59 AM | 40 (7.6%) | 25 (6.5%) |
| 5:00 AM to 5:29 AM | 6 (1.1%) | 16 (4.2%) |
| 5:30 AM to 5:59 AM | 39 (7.4%) | 0 (0.0%) |
| 6:00 AM to 6:29 AM | 107 (20.3%) | 18 (4.7%) |
| 6:30 AM to 6:59 AM | 30 (5.7%) | 59 (15.4%) |
| 7:00 AM to 7:29 AM | 14 (2.6%) | 64 (16.7%) |
| 7:30 AM to 7:59 AM | 52 (9.9%) | 72 (18.8%) |
| 8:00 AM to 8:29 AM | 48 (9.1%) | 79 (20.6%) |
| 8:30 AM to 8:59 AM | 34 (6.4%) | 15 (3.9%) |
| 9:00 AM to 9:59 AM | 18 (3.4%) | 19 (5.0%) |
| 10:00 AM to 10:59 AM | 0 (0.0%) | 0 (0.0%) |
| 11:00 AM to 11:59 AM | 0 (0.0%) | 0 (0.0%) |
| 12:00 PM to 3:59 PM | 76 (14.4%) | 6 (1.6%) |
| 4:00 PM to 11:59 PM | 64 (12.1%) | 10 (2.6%) |
| Total | 528 (100.0%) | 383 (100.0%) |
Housing Occupancy in Merritt Park
Occupancy by Ownership in Merritt Park
Of the total 747 dwellings in Merritt Park, owner-occupied units account for 605 (81.0%), while renter-occupied units make up 142 (19.0%).
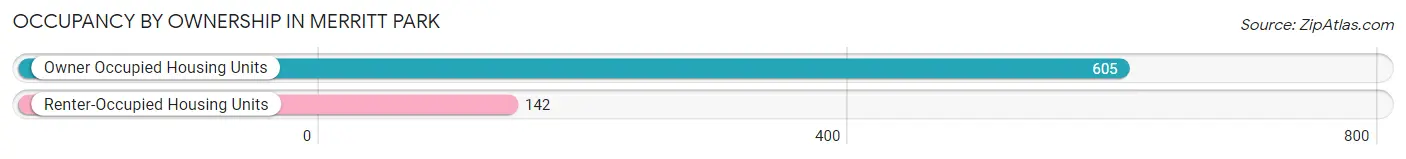
| Occupancy | # Housing Units | % Housing Units |
| Owner Occupied Housing Units | 605 | 81.0% |
| Renter-Occupied Housing Units | 142 | 19.0% |
| Total Occupied Housing Units | 747 | 100.0% |
Occupancy by Household Size in Merritt Park
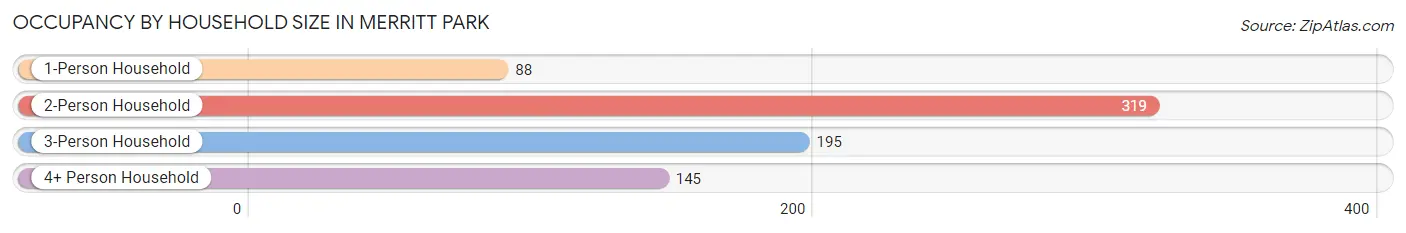
| Household Size | # Housing Units | % Housing Units |
| 1-Person Household | 88 | 11.8% |
| 2-Person Household | 319 | 42.7% |
| 3-Person Household | 195 | 26.1% |
| 4+ Person Household | 145 | 19.4% |
| Total Housing Units | 747 | 100.0% |
Occupancy by Ownership by Household Size in Merritt Park
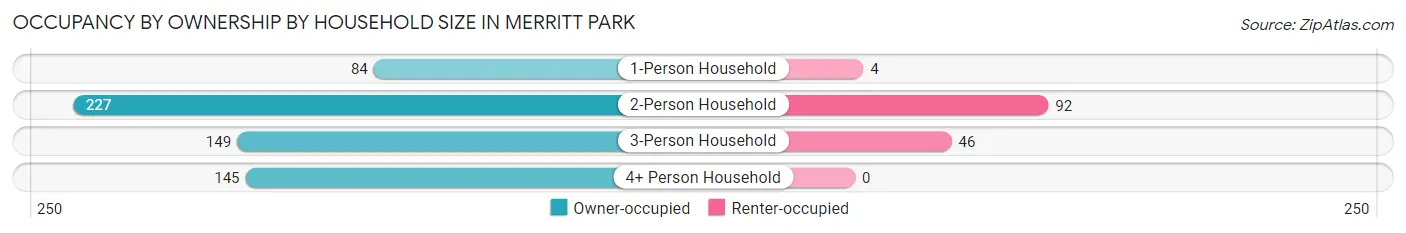
| Household Size | Owner-occupied | Renter-occupied |
| 1-Person Household | 84 (95.5%) | 4 (4.5%) |
| 2-Person Household | 227 (71.2%) | 92 (28.8%) |
| 3-Person Household | 149 (76.4%) | 46 (23.6%) |
| 4+ Person Household | 145 (100.0%) | 0 (0.0%) |
| Total Housing Units | 605 (81.0%) | 142 (19.0%) |
Occupancy by Educational Attainment in Merritt Park
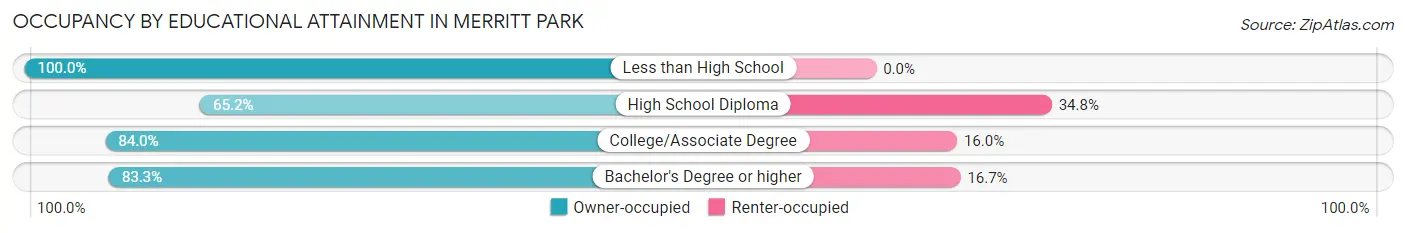
| Household Size | Owner-occupied | Renter-occupied |
| Less than High School | 35 (100.0%) | 0 (0.0%) |
| High School Diploma | 88 (65.2%) | 47 (34.8%) |
| College/Associate Degree | 173 (84.0%) | 33 (16.0%) |
| Bachelor's Degree or higher | 309 (83.3%) | 62 (16.7%) |
Occupancy by Age of Householder in Merritt Park
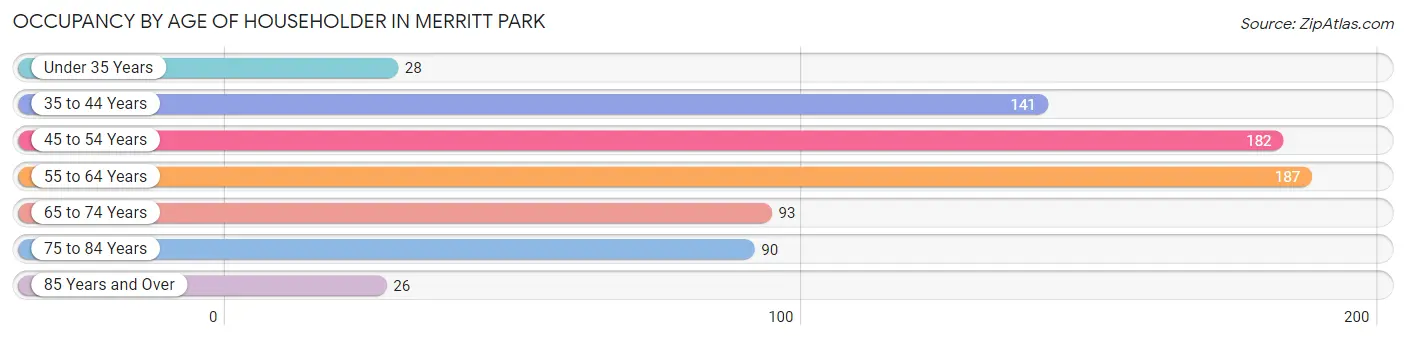
| Age Bracket | # Households | % Households |
| Under 35 Years | 28 | 3.7% |
| 35 to 44 Years | 141 | 18.9% |
| 45 to 54 Years | 182 | 24.4% |
| 55 to 64 Years | 187 | 25.0% |
| 65 to 74 Years | 93 | 12.4% |
| 75 to 84 Years | 90 | 12.0% |
| 85 Years and Over | 26 | 3.5% |
| Total | 747 | 100.0% |
Housing Finances in Merritt Park
Median Income by Occupancy in Merritt Park
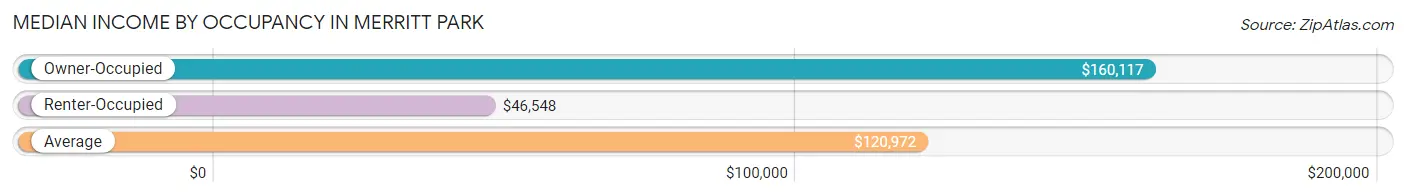
| Occupancy Type | # Households | Median Income |
| Owner-Occupied | 605 (81.0%) | $160,117 |
| Renter-Occupied | 142 (19.0%) | $46,548 |
| Average | 747 (100.0%) | $120,972 |
Occupancy by Householder Income Bracket in Merritt Park
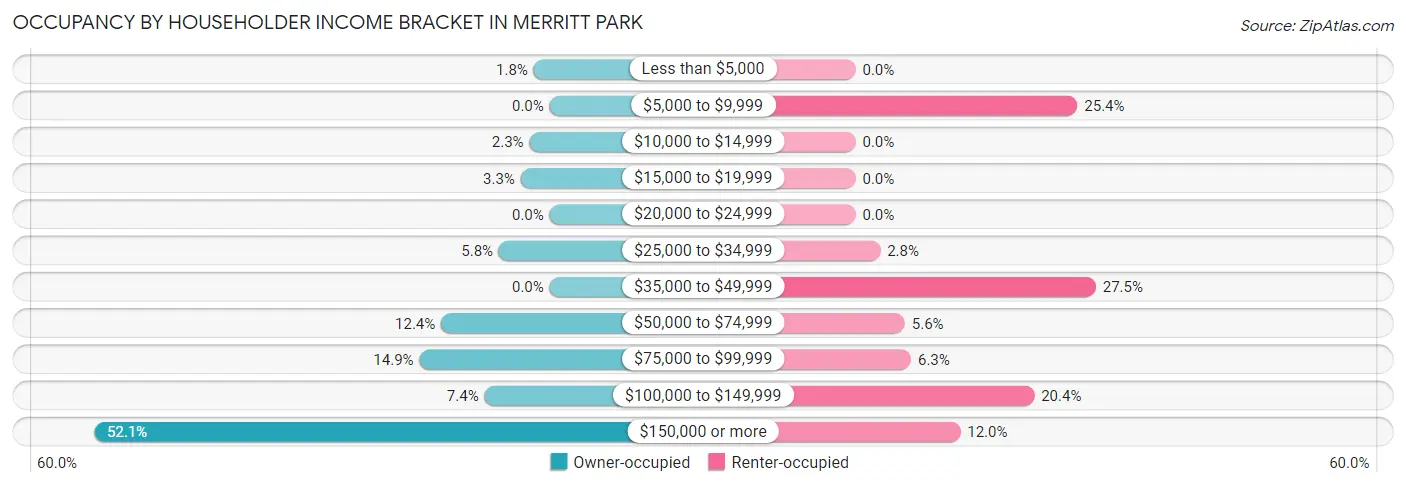
| Income Bracket | Owner-occupied | Renter-occupied |
| Less than $5,000 | 11 (1.8%) | 0 (0.0%) |
| $5,000 to $9,999 | 0 (0.0%) | 36 (25.4%) |
| $10,000 to $14,999 | 14 (2.3%) | 0 (0.0%) |
| $15,000 to $19,999 | 20 (3.3%) | 0 (0.0%) |
| $20,000 to $24,999 | 0 (0.0%) | 0 (0.0%) |
| $25,000 to $34,999 | 35 (5.8%) | 4 (2.8%) |
| $35,000 to $49,999 | 0 (0.0%) | 39 (27.5%) |
| $50,000 to $74,999 | 75 (12.4%) | 8 (5.6%) |
| $75,000 to $99,999 | 90 (14.9%) | 9 (6.3%) |
| $100,000 to $149,999 | 45 (7.4%) | 29 (20.4%) |
| $150,000 or more | 315 (52.1%) | 17 (12.0%) |
| Total | 605 (100.0%) | 142 (100.0%) |
Monthly Housing Cost Tiers in Merritt Park
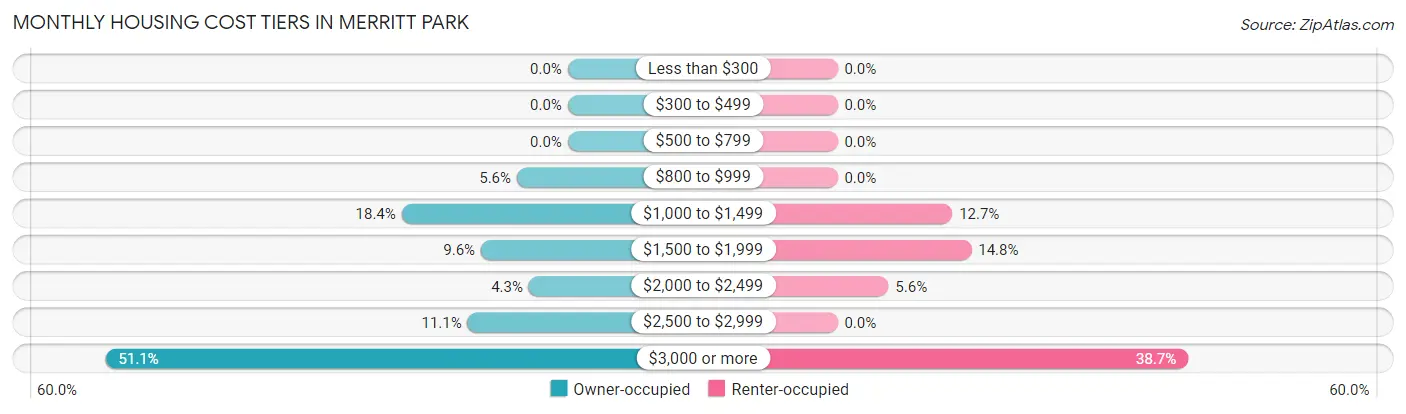
| Monthly Cost | Owner-occupied | Renter-occupied |
| Less than $300 | 0 (0.0%) | 0 (0.0%) |
| $300 to $499 | 0 (0.0%) | 0 (0.0%) |
| $500 to $799 | 0 (0.0%) | 0 (0.0%) |
| $800 to $999 | 34 (5.6%) | 0 (0.0%) |
| $1,000 to $1,499 | 111 (18.3%) | 18 (12.7%) |
| $1,500 to $1,999 | 58 (9.6%) | 21 (14.8%) |
| $2,000 to $2,499 | 26 (4.3%) | 8 (5.6%) |
| $2,500 to $2,999 | 67 (11.1%) | 0 (0.0%) |
| $3,000 or more | 309 (51.1%) | 55 (38.7%) |
| Total | 605 (100.0%) | 142 (100.0%) |
Physical Housing Characteristics in Merritt Park
Housing Structures in Merritt Park
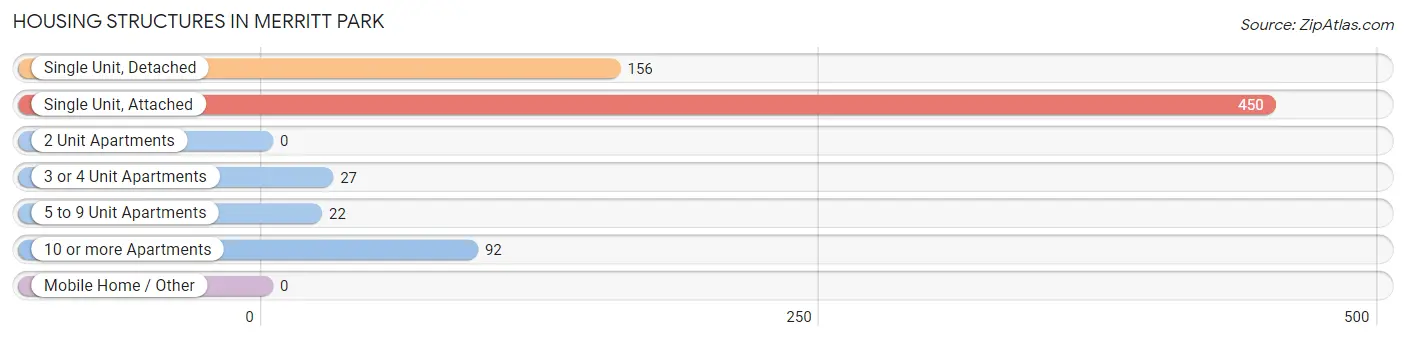
| Structure Type | # Housing Units | % Housing Units |
| Single Unit, Detached | 156 | 20.9% |
| Single Unit, Attached | 450 | 60.2% |
| 2 Unit Apartments | 0 | 0.0% |
| 3 or 4 Unit Apartments | 27 | 3.6% |
| 5 to 9 Unit Apartments | 22 | 2.9% |
| 10 or more Apartments | 92 | 12.3% |
| Mobile Home / Other | 0 | 0.0% |
| Total | 747 | 100.0% |
Housing Structures by Occupancy in Merritt Park
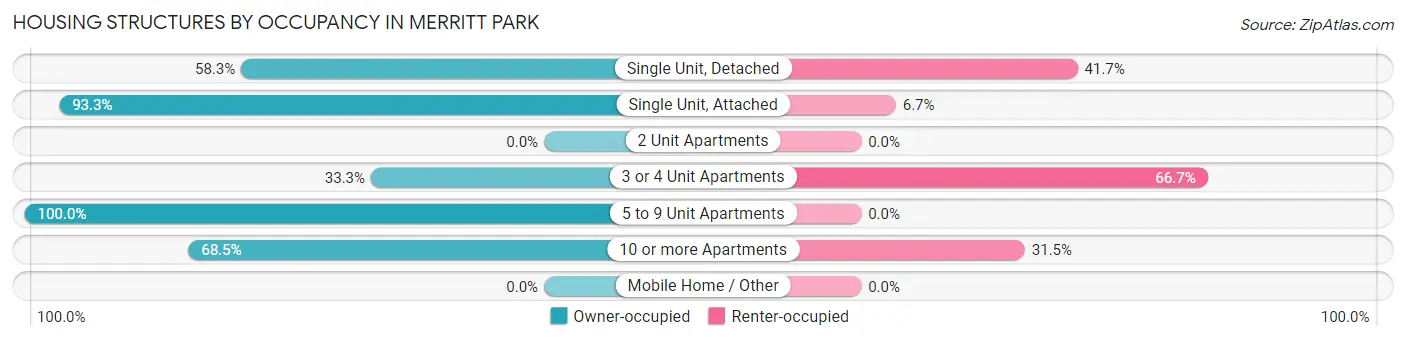
| Structure Type | Owner-occupied | Renter-occupied |
| Single Unit, Detached | 91 (58.3%) | 65 (41.7%) |
| Single Unit, Attached | 420 (93.3%) | 30 (6.7%) |
| 2 Unit Apartments | 0 (0.0%) | 0 (0.0%) |
| 3 or 4 Unit Apartments | 9 (33.3%) | 18 (66.7%) |
| 5 to 9 Unit Apartments | 22 (100.0%) | 0 (0.0%) |
| 10 or more Apartments | 63 (68.5%) | 29 (31.5%) |
| Mobile Home / Other | 0 (0.0%) | 0 (0.0%) |
| Total | 605 (81.0%) | 142 (19.0%) |
Housing Structures by Number of Rooms in Merritt Park
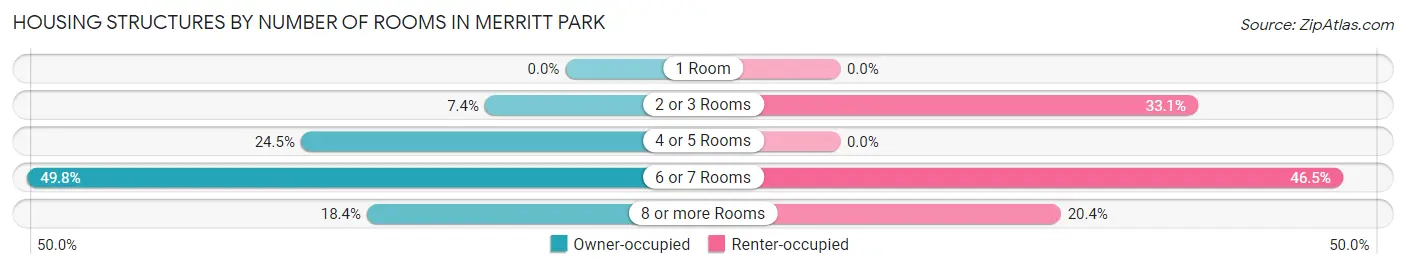
| Number of Rooms | Owner-occupied | Renter-occupied |
| 1 Room | 0 (0.0%) | 0 (0.0%) |
| 2 or 3 Rooms | 45 (7.4%) | 47 (33.1%) |
| 4 or 5 Rooms | 148 (24.5%) | 0 (0.0%) |
| 6 or 7 Rooms | 301 (49.7%) | 66 (46.5%) |
| 8 or more Rooms | 111 (18.3%) | 29 (20.4%) |
| Total | 605 (100.0%) | 142 (100.0%) |
Housing Structure by Heating Type in Merritt Park
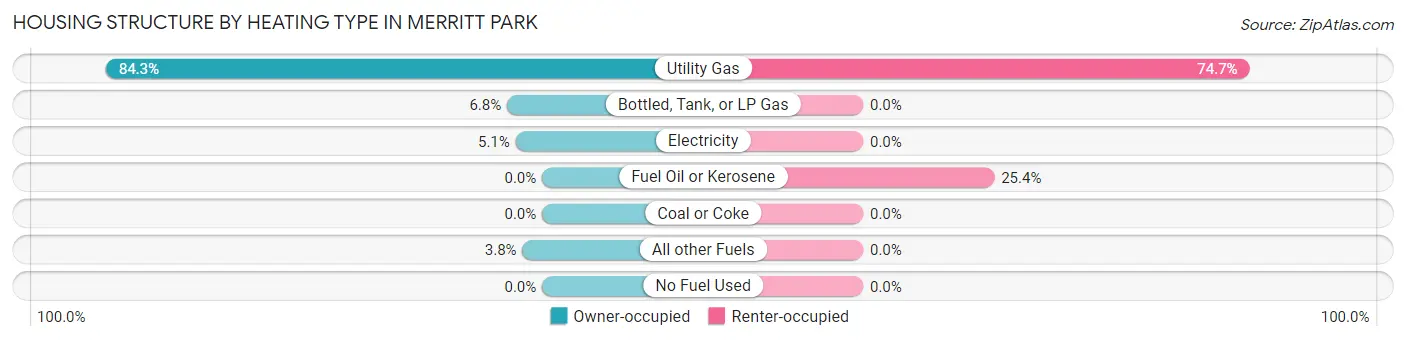
| Heating Type | Owner-occupied | Renter-occupied |
| Utility Gas | 510 (84.3%) | 106 (74.7%) |
| Bottled, Tank, or LP Gas | 41 (6.8%) | 0 (0.0%) |
| Electricity | 31 (5.1%) | 0 (0.0%) |
| Fuel Oil or Kerosene | 0 (0.0%) | 36 (25.4%) |
| Coal or Coke | 0 (0.0%) | 0 (0.0%) |
| All other Fuels | 23 (3.8%) | 0 (0.0%) |
| No Fuel Used | 0 (0.0%) | 0 (0.0%) |
| Total | 605 (100.0%) | 142 (100.0%) |
Household Vehicle Usage in Merritt Park
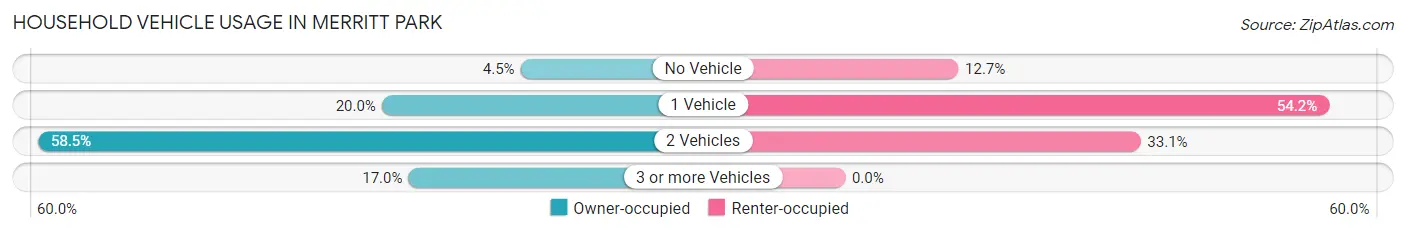
| Vehicles per Household | Owner-occupied | Renter-occupied |
| No Vehicle | 27 (4.5%) | 18 (12.7%) |
| 1 Vehicle | 121 (20.0%) | 77 (54.2%) |
| 2 Vehicles | 354 (58.5%) | 47 (33.1%) |
| 3 or more Vehicles | 103 (17.0%) | 0 (0.0%) |
| Total | 605 (100.0%) | 142 (100.0%) |
Real Estate & Mortgages in Merritt Park
Real Estate and Mortgage Overview in Merritt Park
| Characteristic | Without Mortgage | With Mortgage |
| Housing Units | 175 | 430 |
| Median Property Value | $416,000 | $448,200 |
| Median Household Income | $89,125 | $251 |
| Monthly Housing Costs | $1,383 | $309 |
| Real Estate Taxes | $7,822 | $9 |
Property Value by Mortgage Status in Merritt Park
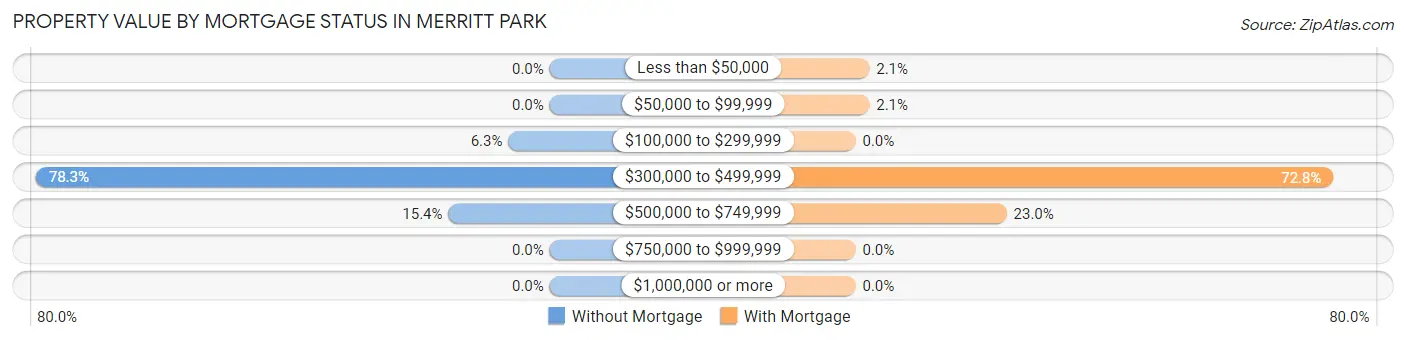
| Property Value | Without Mortgage | With Mortgage |
| Less than $50,000 | 0 (0.0%) | 9 (2.1%) |
| $50,000 to $99,999 | 0 (0.0%) | 9 (2.1%) |
| $100,000 to $299,999 | 11 (6.3%) | 0 (0.0%) |
| $300,000 to $499,999 | 137 (78.3%) | 313 (72.8%) |
| $500,000 to $749,999 | 27 (15.4%) | 99 (23.0%) |
| $750,000 to $999,999 | 0 (0.0%) | 0 (0.0%) |
| $1,000,000 or more | 0 (0.0%) | 0 (0.0%) |
| Total | 175 (100.0%) | 430 (100.0%) |
Household Income by Mortgage Status in Merritt Park
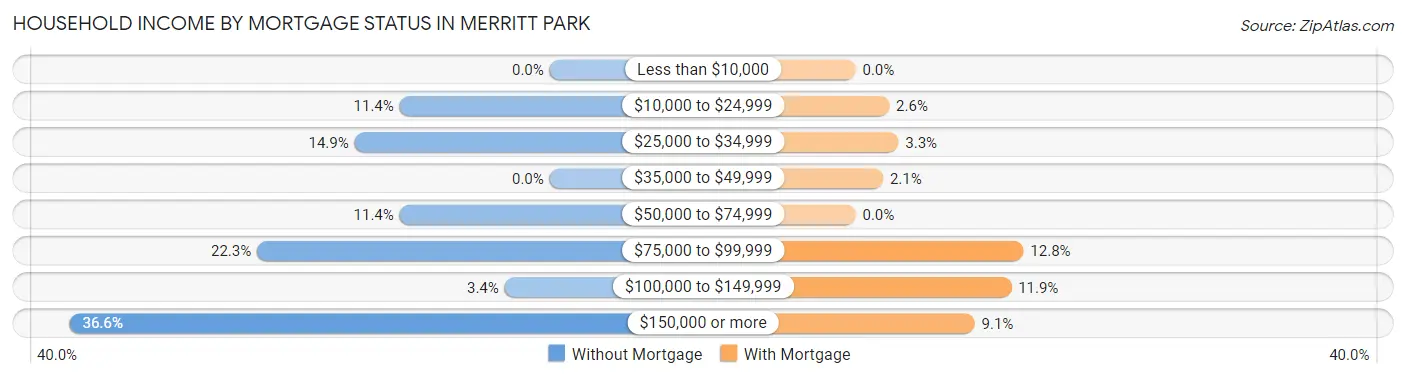
| Household Income | Without Mortgage | With Mortgage |
| Less than $10,000 | 0 (0.0%) | 0 (0.0%) |
| $10,000 to $24,999 | 20 (11.4%) | 11 (2.6%) |
| $25,000 to $34,999 | 26 (14.9%) | 14 (3.3%) |
| $35,000 to $49,999 | 0 (0.0%) | 9 (2.1%) |
| $50,000 to $74,999 | 20 (11.4%) | 0 (0.0%) |
| $75,000 to $99,999 | 39 (22.3%) | 55 (12.8%) |
| $100,000 to $149,999 | 6 (3.4%) | 51 (11.9%) |
| $150,000 or more | 64 (36.6%) | 39 (9.1%) |
| Total | 175 (100.0%) | 430 (100.0%) |
Property Value to Household Income Ratio in Merritt Park
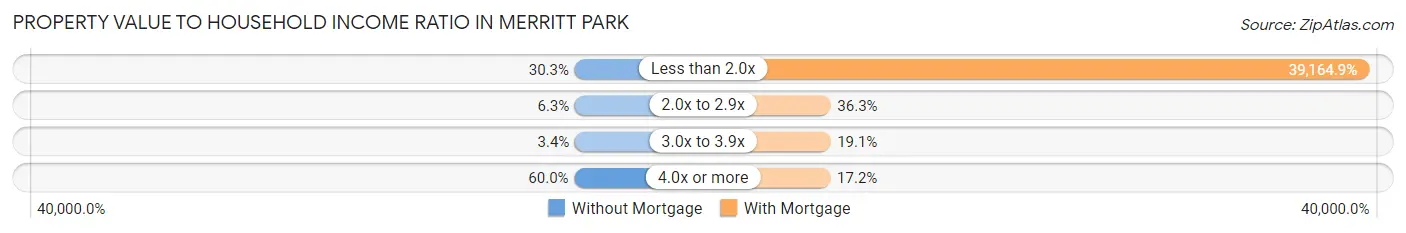
| Value-to-Income Ratio | Without Mortgage | With Mortgage |
| Less than 2.0x | 53 (30.3%) | 168,409 (39,164.9%) |
| 2.0x to 2.9x | 11 (6.3%) | 156 (36.3%) |
| 3.0x to 3.9x | 6 (3.4%) | 82 (19.1%) |
| 4.0x or more | 105 (60.0%) | 74 (17.2%) |
| Total | 175 (100.0%) | 430 (100.0%) |
Real Estate Taxes by Mortgage Status in Merritt Park
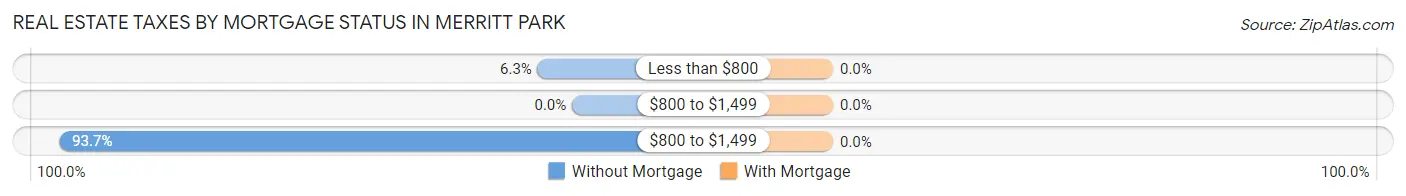
| Property Taxes | Without Mortgage | With Mortgage |
| Less than $800 | 11 (6.3%) | 0 (0.0%) |
| $800 to $1,499 | 0 (0.0%) | 0 (0.0%) |
| $800 to $1,499 | 164 (93.7%) | 0 (0.0%) |
| Total | 175 (100.0%) | 430 (100.0%) |
Health & Disability in Merritt Park
Health Insurance Coverage by Age in Merritt Park
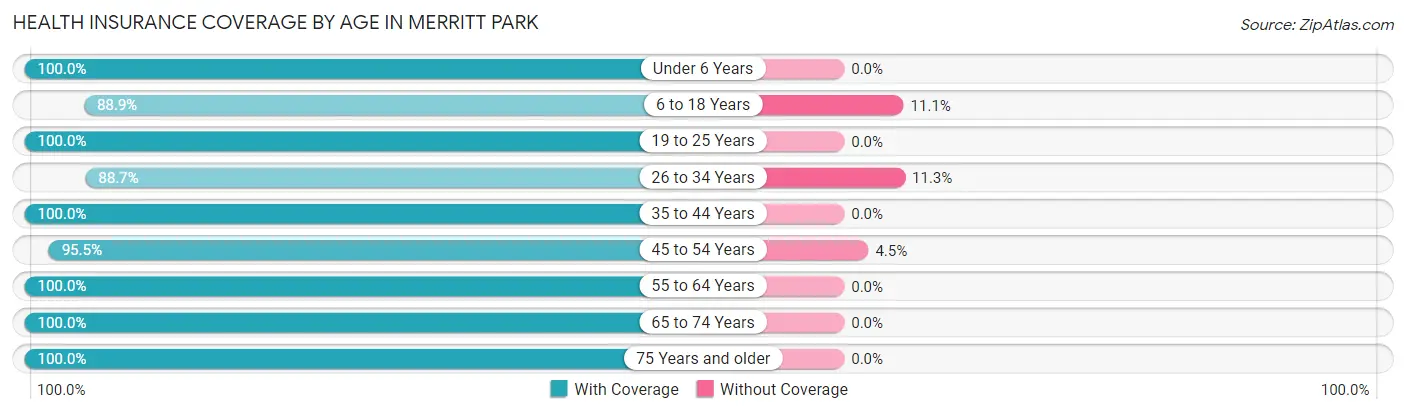
| Age Bracket | With Coverage | Without Coverage |
| Under 6 Years | 90 (100.0%) | 0 (0.0%) |
| 6 to 18 Years | 273 (88.9%) | 34 (11.1%) |
| 19 to 25 Years | 92 (100.0%) | 0 (0.0%) |
| 26 to 34 Years | 86 (88.7%) | 11 (11.3%) |
| 35 to 44 Years | 234 (100.0%) | 0 (0.0%) |
| 45 to 54 Years | 275 (95.5%) | 13 (4.5%) |
| 55 to 64 Years | 367 (100.0%) | 0 (0.0%) |
| 65 to 74 Years | 235 (100.0%) | 0 (0.0%) |
| 75 Years and older | 140 (100.0%) | 0 (0.0%) |
| Total | 1,792 (96.9%) | 58 (3.1%) |
Health Insurance Coverage by Citizenship Status in Merritt Park
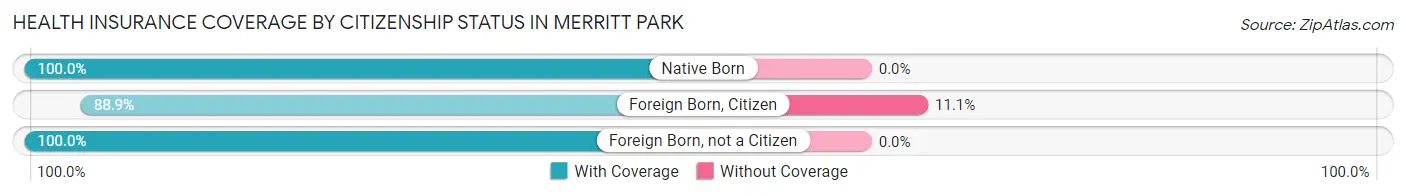
| Citizenship Status | With Coverage | Without Coverage |
| Native Born | 90 (100.0%) | 0 (0.0%) |
| Foreign Born, Citizen | 273 (88.9%) | 34 (11.1%) |
| Foreign Born, not a Citizen | 92 (100.0%) | 0 (0.0%) |
Health Insurance Coverage by Household Income in Merritt Park
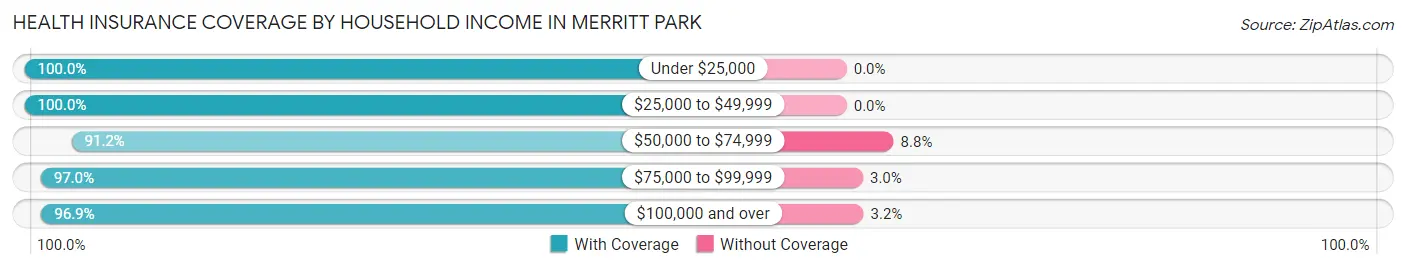
| Household Income | With Coverage | Without Coverage |
| Under $25,000 | 106 (100.0%) | 0 (0.0%) |
| $25,000 to $49,999 | 156 (100.0%) | 0 (0.0%) |
| $50,000 to $74,999 | 135 (91.2%) | 13 (8.8%) |
| $75,000 to $99,999 | 319 (97.0%) | 10 (3.0%) |
| $100,000 and over | 1,076 (96.9%) | 35 (3.2%) |
Public vs Private Health Insurance Coverage by Age in Merritt Park
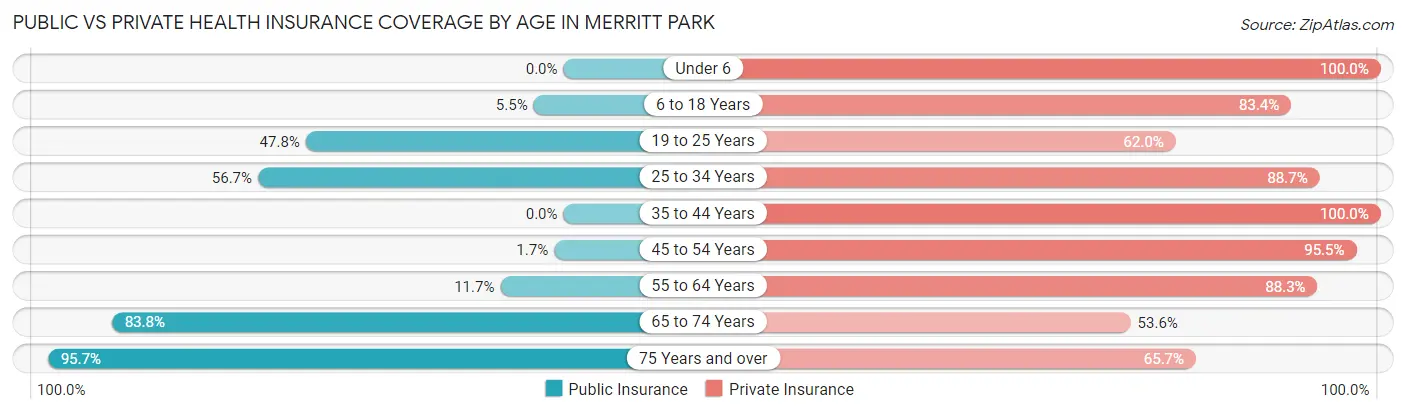
| Age Bracket | Public Insurance | Private Insurance |
| Under 6 | 0 (0.0%) | 90 (100.0%) |
| 6 to 18 Years | 17 (5.5%) | 256 (83.4%) |
| 19 to 25 Years | 44 (47.8%) | 57 (62.0%) |
| 25 to 34 Years | 55 (56.7%) | 86 (88.7%) |
| 35 to 44 Years | 0 (0.0%) | 234 (100.0%) |
| 45 to 54 Years | 5 (1.7%) | 275 (95.5%) |
| 55 to 64 Years | 43 (11.7%) | 324 (88.3%) |
| 65 to 74 Years | 197 (83.8%) | 126 (53.6%) |
| 75 Years and over | 134 (95.7%) | 92 (65.7%) |
| Total | 495 (26.8%) | 1,540 (83.2%) |
Disability Status by Sex by Age in Merritt Park
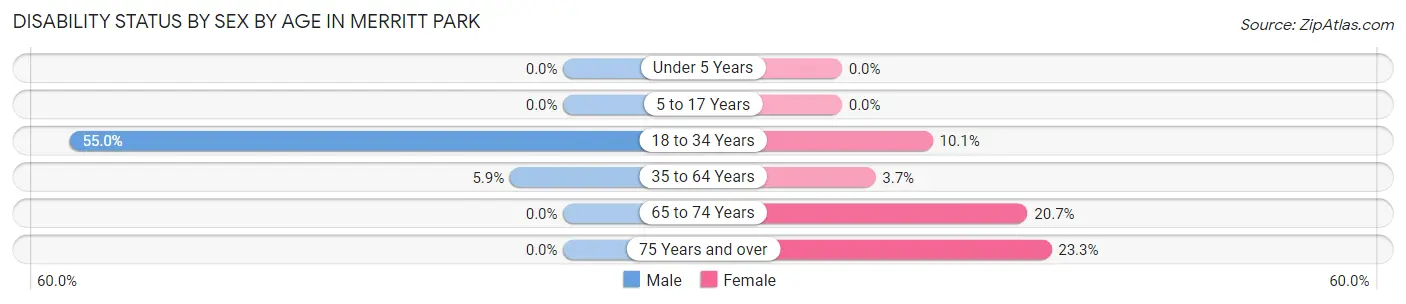
| Age Bracket | Male | Female |
| Under 5 Years | 0 (0.0%) | 0 (0.0%) |
| 5 to 17 Years | 0 (0.0%) | 0 (0.0%) |
| 18 to 34 Years | 55 (55.0%) | 9 (10.1%) |
| 35 to 64 Years | 29 (5.9%) | 15 (3.7%) |
| 65 to 74 Years | 0 (0.0%) | 31 (20.7%) |
| 75 Years and over | 0 (0.0%) | 21 (23.3%) |
Disability Class by Sex by Age in Merritt Park
Disability Class: Hearing Difficulty
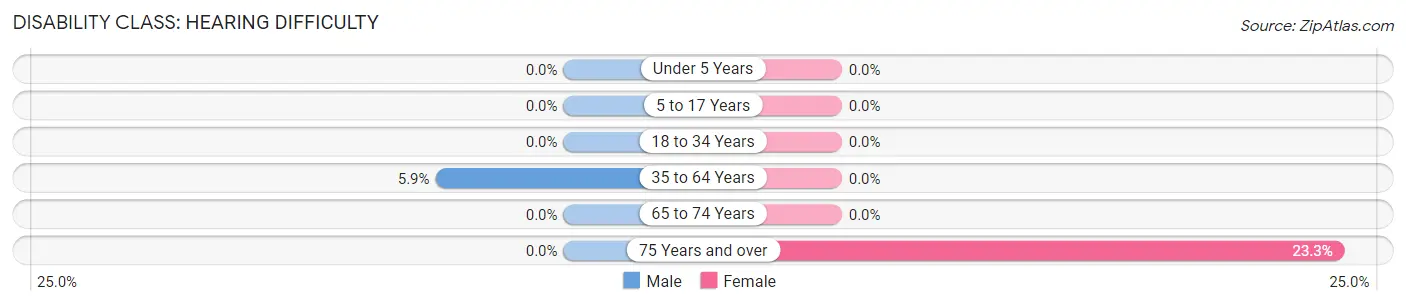
| Age Bracket | Male | Female |
| Under 5 Years | 0 (0.0%) | 0 (0.0%) |
| 5 to 17 Years | 0 (0.0%) | 0 (0.0%) |
| 18 to 34 Years | 0 (0.0%) | 0 (0.0%) |
| 35 to 64 Years | 29 (5.9%) | 0 (0.0%) |
| 65 to 74 Years | 0 (0.0%) | 0 (0.0%) |
| 75 Years and over | 0 (0.0%) | 21 (23.3%) |
Disability Class: Vision Difficulty
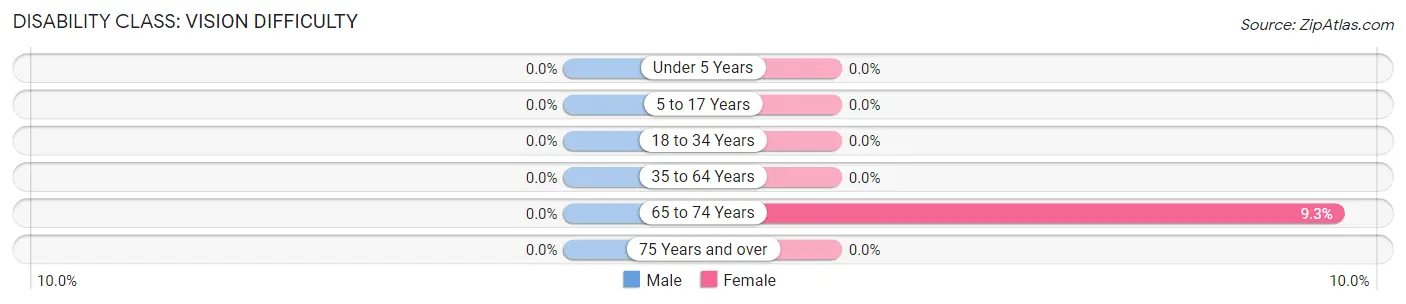
| Age Bracket | Male | Female |
| Under 5 Years | 0 (0.0%) | 0 (0.0%) |
| 5 to 17 Years | 0 (0.0%) | 0 (0.0%) |
| 18 to 34 Years | 0 (0.0%) | 0 (0.0%) |
| 35 to 64 Years | 0 (0.0%) | 0 (0.0%) |
| 65 to 74 Years | 0 (0.0%) | 14 (9.3%) |
| 75 Years and over | 0 (0.0%) | 0 (0.0%) |
Disability Class: Cognitive Difficulty
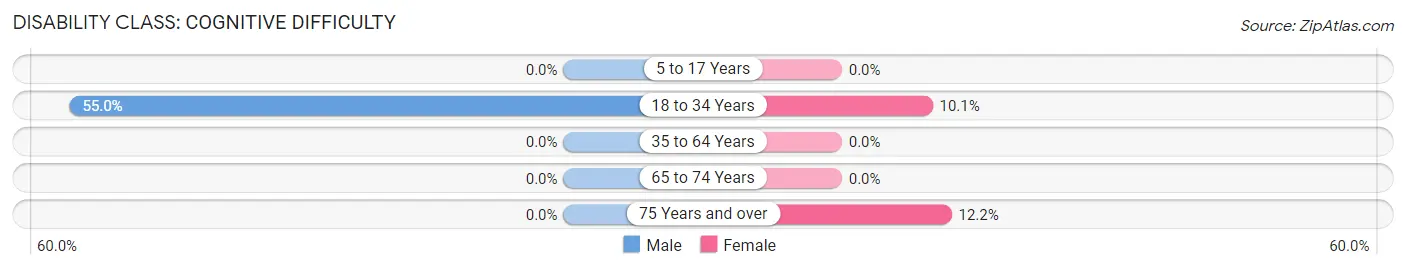
| Age Bracket | Male | Female |
| 5 to 17 Years | 0 (0.0%) | 0 (0.0%) |
| 18 to 34 Years | 55 (55.0%) | 9 (10.1%) |
| 35 to 64 Years | 0 (0.0%) | 0 (0.0%) |
| 65 to 74 Years | 0 (0.0%) | 0 (0.0%) |
| 75 Years and over | 0 (0.0%) | 11 (12.2%) |
Disability Class: Ambulatory Difficulty
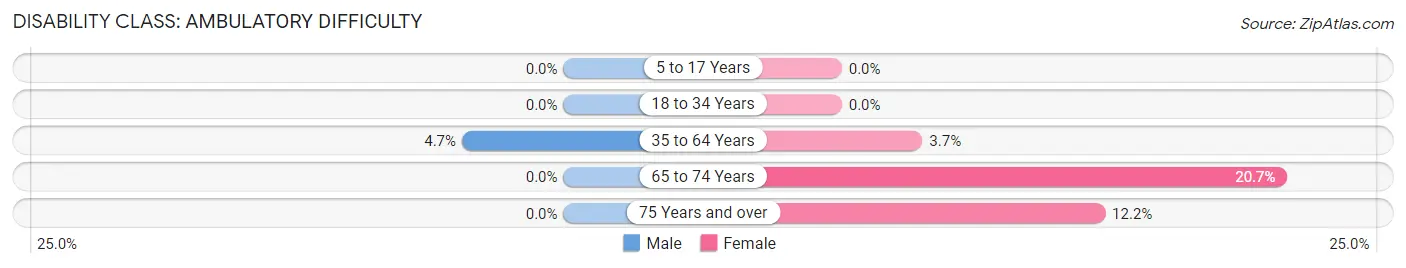
| Age Bracket | Male | Female |
| 5 to 17 Years | 0 (0.0%) | 0 (0.0%) |
| 18 to 34 Years | 0 (0.0%) | 0 (0.0%) |
| 35 to 64 Years | 23 (4.7%) | 15 (3.7%) |
| 65 to 74 Years | 0 (0.0%) | 31 (20.7%) |
| 75 Years and over | 0 (0.0%) | 11 (12.2%) |
Disability Class: Self-Care Difficulty
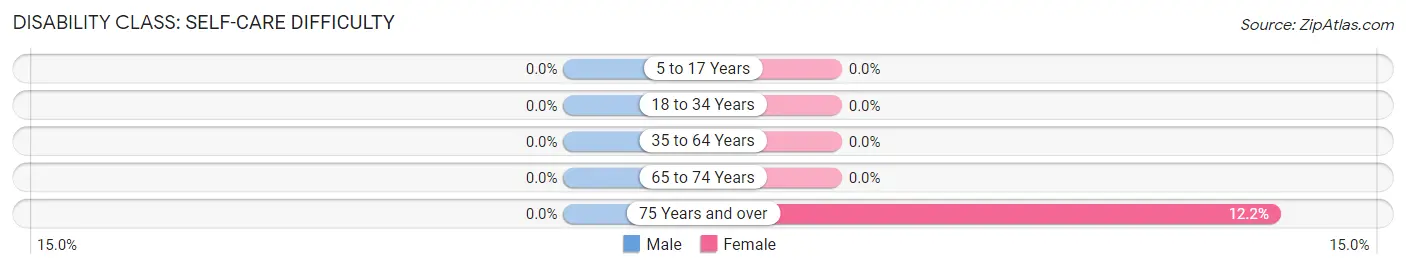
| Age Bracket | Male | Female |
| 5 to 17 Years | 0 (0.0%) | 0 (0.0%) |
| 18 to 34 Years | 0 (0.0%) | 0 (0.0%) |
| 35 to 64 Years | 0 (0.0%) | 0 (0.0%) |
| 65 to 74 Years | 0 (0.0%) | 0 (0.0%) |
| 75 Years and over | 0 (0.0%) | 11 (12.2%) |
Technology Access in Merritt Park
Computing Device Access in Merritt Park
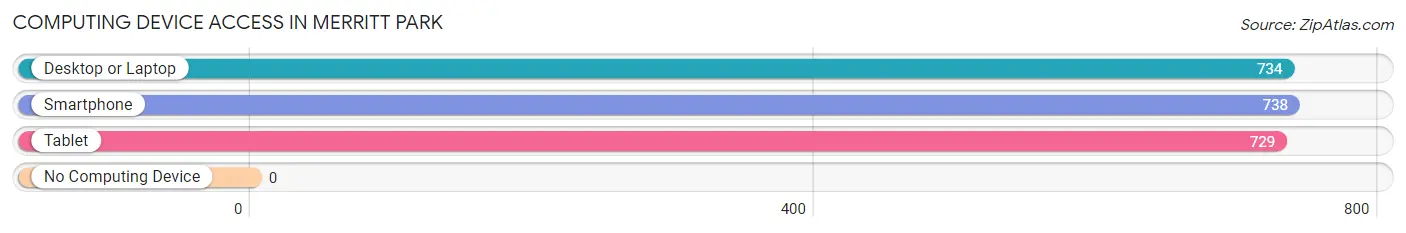
| Device Type | # Households | % Households |
| Desktop or Laptop | 734 | 98.3% |
| Smartphone | 738 | 98.8% |
| Tablet | 729 | 97.6% |
| No Computing Device | 0 | 0.0% |
| Total | 747 | 100.0% |
Internet Access in Merritt Park
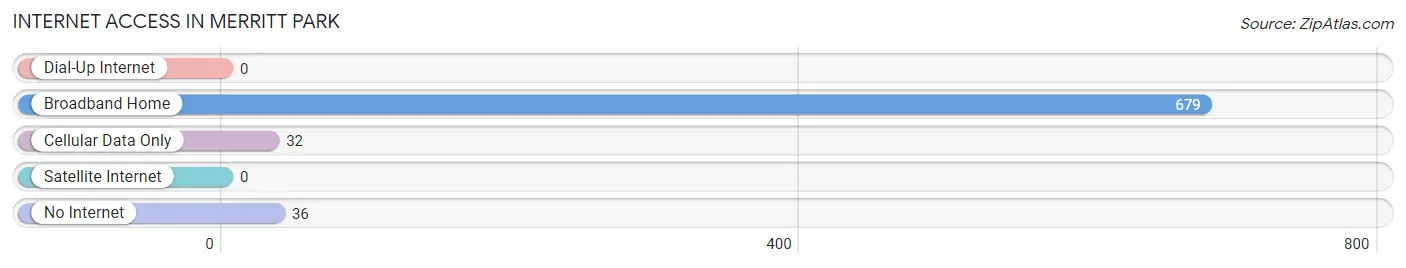
| Internet Type | # Households | % Households |
| Dial-Up Internet | 0 | 0.0% |
| Broadband Home | 679 | 90.9% |
| Cellular Data Only | 32 | 4.3% |
| Satellite Internet | 0 | 0.0% |
| No Internet | 36 | 4.8% |
| Total | 747 | 100.0% |
Merritt Park Summary
Merritt Park is a small hamlet located in the town of North Hempstead in Nassau County, New York. It is situated on the north shore of Long Island, approximately 25 miles east of New York City. The hamlet is bordered by the villages of Great Neck and Manhasset, and is part of the Great Neck School District.
History
Merritt Park was originally part of the Matinecock Native American tribe’s land. The area was first settled by Europeans in the mid-17th century, when the Dutch West India Company purchased the land from the Matinecock. The area was then divided into several large farms, which were owned by prominent families such as the Merritts, the Sands, and the Thompsons.
In the late 19th century, the area began to develop as a residential community. The Merritt family donated land for the construction of a school, which was completed in 1891. The school was named Merritt Park School, and it served as the community’s primary educational institution until it was closed in the 1950s.
In the early 20th century, the area began to experience rapid growth. The Long Island Rail Road opened a station in Merritt Park in 1910, and the hamlet was incorporated into the town of North Hempstead in 1917. The population of Merritt Park continued to grow throughout the 20th century, and by the 2000 census, the population was 4,845.
Geography
Merritt Park is located on the north shore of Long Island, approximately 25 miles east of New York City. The hamlet is bordered by the villages of Great Neck and Manhasset, and is part of the Great Neck School District. The hamlet is situated on a peninsula, with the Long Island Sound to the north and Hempstead Harbor to the south.
The terrain of Merritt Park is mostly flat, with some rolling hills. The area is mostly residential, with some commercial and industrial areas. The hamlet is home to several parks, including Merritt Park, which is located on the waterfront.
Economy
Merritt Park is primarily a residential community, and the majority of its residents are employed in the nearby cities of New York and Long Island. The hamlet is home to several small businesses, including restaurants, retail stores, and professional services.
The hamlet is also home to several large employers, including North Shore-LIJ Health System, which is the largest employer in the area. Other major employers include Northwell Health, North Shore University Hospital, and the North Shore-LIJ Medical Group.
Demographics
As of the 2010 census, the population of Merritt Park was 4,845. The population is predominantly white (83.3%), with small percentages of African American (7.2%), Asian (4.7%), and Hispanic (3.7%) residents. The median household income is $107,917, and the median home value is $845,000.
Merritt Park is a small, affluent community with a high quality of life. The hamlet is home to several parks, schools, and other amenities, and is a popular destination for those looking for a quiet, suburban lifestyle.
Common Questions
What is Per Capita Income in Merritt Park?
Per Capita income in Merritt Park is $60,622.
What is the Median Family Income in Merritt Park?
Median Family Income in Merritt Park is $151,818.
What is the Median Household income in Merritt Park?
Median Household Income in Merritt Park is $120,972.
What is Income or Wage Gap in Merritt Park?
Income or Wage Gap in Merritt Park is 45.0%.
Women in Merritt Park earn 55.0 cents for every dollar earned by a man.
What is Inequality or Gini Index in Merritt Park?
Inequality or Gini Index in Merritt Park is 0.42.
What is the Total Population of Merritt Park?
Total Population of Merritt Park is 1,879.
What is the Total Male Population of Merritt Park?
Total Male Population of Merritt Park is 953.
What is the Total Female Population of Merritt Park?
Total Female Population of Merritt Park is 926.
What is the Ratio of Males per 100 Females in Merritt Park?
There are 102.92 Males per 100 Females in Merritt Park.
What is the Ratio of Females per 100 Males in Merritt Park?
There are 97.17 Females per 100 Males in Merritt Park.
What is the Median Population Age in Merritt Park?
Median Population Age in Merritt Park is 47.3 Years.
What is the Average Family Size in Merritt Park
Average Family Size in Merritt Park is 2.8 People.
What is the Average Household Size in Merritt Park
Average Household Size in Merritt Park is 2.5 People.
How Large is the Labor Force in Merritt Park?
There are 1,015 People in the Labor Forcein in Merritt Park.
What is the Percentage of People in the Labor Force in Merritt Park?
68.0% of People are in the Labor Force in Merritt Park.
What is the Unemployment Rate in Merritt Park?
Unemployment Rate in Merritt Park is 2.0%.