Kings Point, NY Map & Demographics
Kings Point Map
Kings Point Overview
$68,570
PER CAPITA INCOME
$189,125
AVG FAMILY INCOME
$172,402
AVG HOUSEHOLD INCOME
9.6%
WAGE / INCOME GAP [ % ]
90.4¢/ $1
WAGE / INCOME GAP [ $ ]
0.46
INEQUALITY / GINI INDEX
5,593
TOTAL POPULATION
3,272
MALE POPULATION
2,321
FEMALE POPULATION
140.97
MALES / 100 FEMALES
70.94
FEMALES / 100 MALES
29.4
MEDIAN AGE
3.8
AVG FAMILY SIZE
3.7
AVG HOUSEHOLD SIZE
2,265
LABOR FORCE [ PEOPLE ]
54.1%
PERCENT IN LABOR FORCE
2.2%
UNEMPLOYMENT RATE
Kings Point Area Codes
Income in Kings Point
Income Overview in Kings Point
Per Capita Income in Kings Point is $68,570, while median incomes of families and households are $189,125 and $172,402 respectively.
| Characteristic | Number | Measure |
| Per Capita Income | 5,593 | $68,570 |
| Median Family Income | 1,178 | $189,125 |
| Mean Family Income | 1,178 | $277,161 |
| Median Household Income | 1,348 | $172,402 |
| Mean Household Income | 1,348 | $279,690 |
| Income Deficit | 1,178 | $0 |
| Wage / Income Gap (%) | 5,593 | 9.62% |
| Wage / Income Gap ($) | 5,593 | 90.38¢ per $1 |
| Gini / Inequality Index | 5,593 | 0.46 |
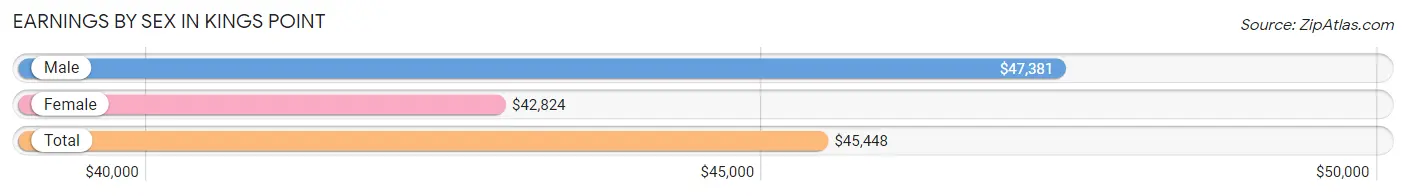
Earnings by Sex in Kings Point
Average Earnings in Kings Point are $45,448, $47,381 for men and $42,824 for women, a difference of 9.6%.
| Sex | Number | Average Earnings |
| Male | 1,716 (64.5%) | $47,381 |
| Female | 945 (35.5%) | $42,824 |
| Total | 2,661 (100.0%) | $45,448 |
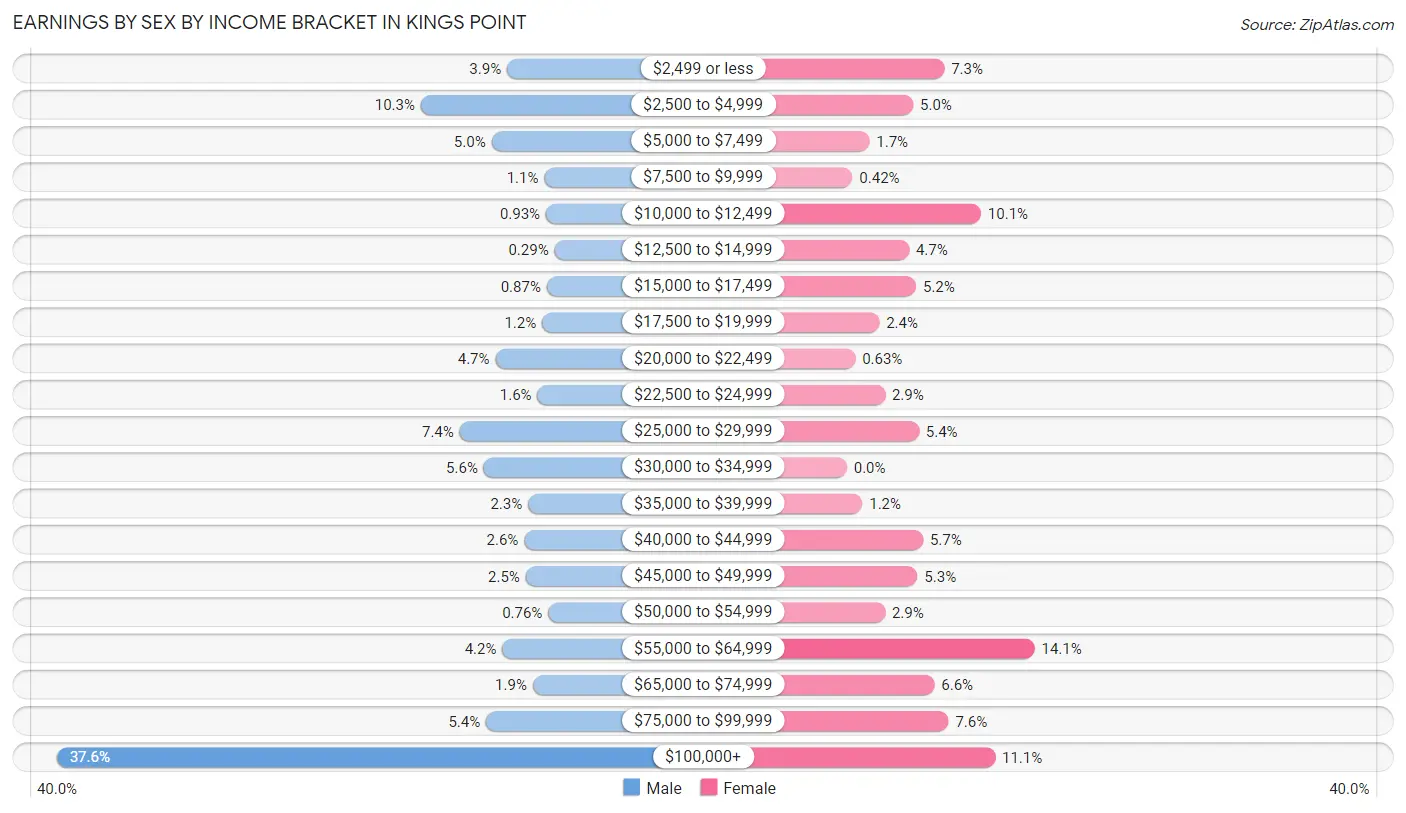
Earnings by Sex by Income Bracket in Kings Point
The most common earnings brackets in Kings Point are $100,000+ for men (645 | 37.6%) and $55,000 to $64,999 for women (133 | 14.1%).
| Income | Male | Female |
| $2,499 or less | 66 (3.8%) | 69 (7.3%) |
| $2,500 to $4,999 | 177 (10.3%) | 47 (5.0%) |
| $5,000 to $7,499 | 86 (5.0%) | 16 (1.7%) |
| $7,500 to $9,999 | 18 (1.1%) | 4 (0.4%) |
| $10,000 to $12,499 | 16 (0.9%) | 95 (10.1%) |
| $12,500 to $14,999 | 5 (0.3%) | 44 (4.7%) |
| $15,000 to $17,499 | 15 (0.9%) | 49 (5.2%) |
| $17,500 to $19,999 | 21 (1.2%) | 23 (2.4%) |
| $20,000 to $22,499 | 81 (4.7%) | 6 (0.6%) |
| $22,500 to $24,999 | 27 (1.6%) | 27 (2.9%) |
| $25,000 to $29,999 | 127 (7.4%) | 51 (5.4%) |
| $30,000 to $34,999 | 96 (5.6%) | 0 (0.0%) |
| $35,000 to $39,999 | 39 (2.3%) | 11 (1.2%) |
| $40,000 to $44,999 | 44 (2.6%) | 54 (5.7%) |
| $45,000 to $49,999 | 42 (2.5%) | 50 (5.3%) |
| $50,000 to $54,999 | 13 (0.8%) | 27 (2.9%) |
| $55,000 to $64,999 | 72 (4.2%) | 133 (14.1%) |
| $65,000 to $74,999 | 33 (1.9%) | 62 (6.6%) |
| $75,000 to $99,999 | 93 (5.4%) | 72 (7.6%) |
| $100,000+ | 645 (37.6%) | 105 (11.1%) |
| Total | 1,716 (100.0%) | 945 (100.0%) |
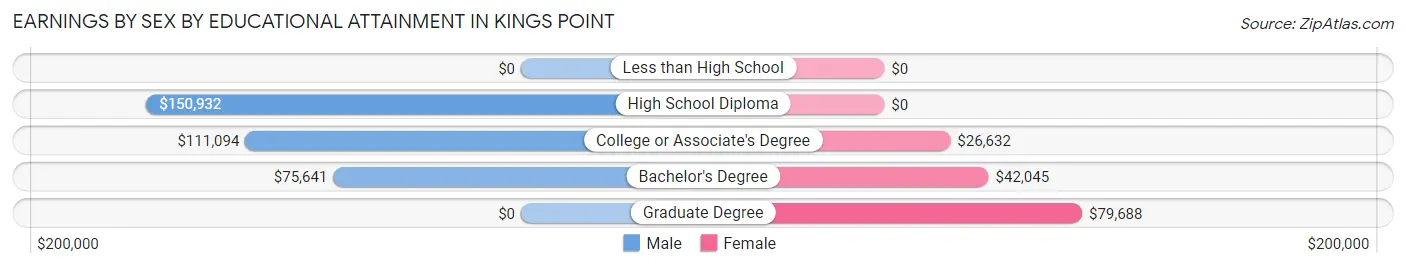
Earnings by Sex by Educational Attainment in Kings Point
Average earnings in Kings Point are $114,643 for men and $46,500 for women, a difference of 59.4%. Men with an educational attainment of high school diploma enjoy the highest average annual earnings of $150,932, while those with bachelor's degree education earn the least with $75,641. Women with an educational attainment of graduate degree earn the most with the average annual earnings of $79,688, while those with college or associate's degree education have the smallest earnings of $26,632.
| Educational Attainment | Male Income | Female Income |
| Less than High School | - | - |
| High School Diploma | $150,932 | $0 |
| College or Associate's Degree | $111,094 | $26,632 |
| Bachelor's Degree | $75,641 | $42,045 |
| Graduate Degree | - | - |
| Total | $114,643 | $46,500 |
Family Income in Kings Point
Family Income Brackets in Kings Point
According to the Kings Point family income data, there are 501 families falling into the $200,000+ income range, which is the most common income bracket and makes up 42.5% of all families.
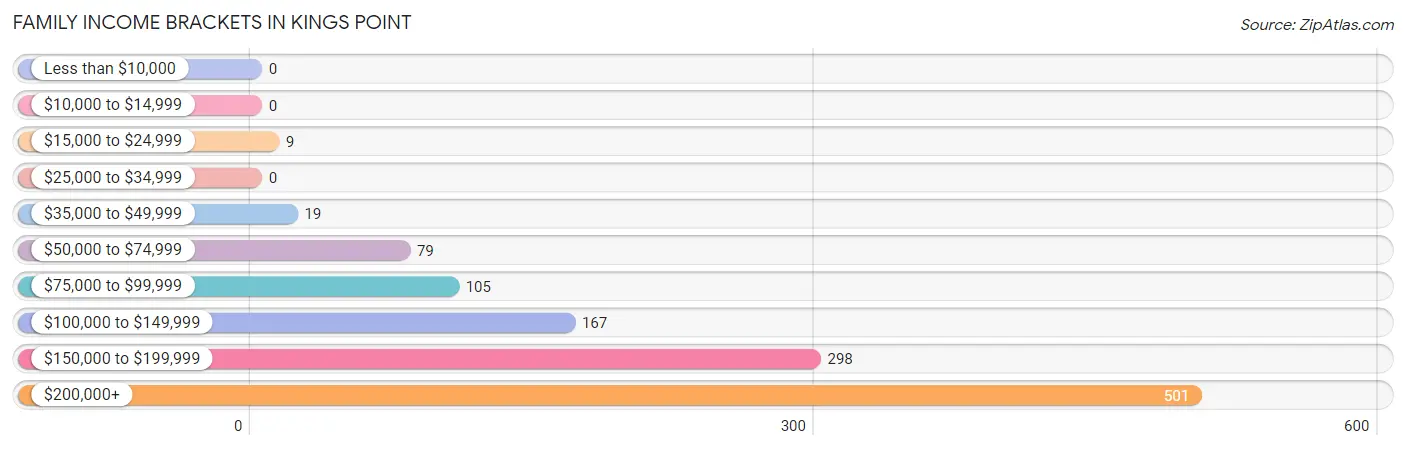
| Income Bracket | # Families | % Families |
| Less than $10,000 | 0 | 0.0% |
| $10,000 to $14,999 | 0 | 0.0% |
| $15,000 to $24,999 | 9 | 0.8% |
| $25,000 to $34,999 | 0 | 0.0% |
| $35,000 to $49,999 | 19 | 1.6% |
| $50,000 to $74,999 | 79 | 6.7% |
| $75,000 to $99,999 | 105 | 8.9% |
| $100,000 to $149,999 | 167 | 14.2% |
| $150,000 to $199,999 | 298 | 25.3% |
| $200,000+ | 501 | 42.5% |
Family Income by Famaliy Size in Kings Point
2-person families (327 | 27.8%) account for the highest median family income in Kings Point with $250,001 per family, while 2-person families (327 | 27.8%) have the highest median income of $125,000 per family member.
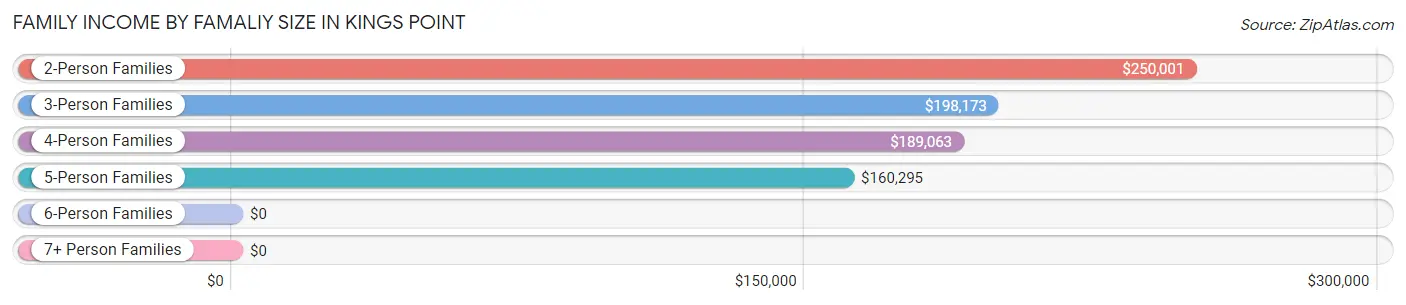
| Income Bracket | # Families | Median Income |
| 2-Person Families | 327 (27.8%) | $250,001 |
| 3-Person Families | 251 (21.3%) | $198,173 |
| 4-Person Families | 285 (24.2%) | $189,063 |
| 5-Person Families | 257 (21.8%) | $160,295 |
| 6-Person Families | 29 (2.5%) | $0 |
| 7+ Person Families | 29 (2.5%) | $0 |
| Total | 1,178 (100.0%) | $189,125 |
Family Income by Number of Earners in Kings Point
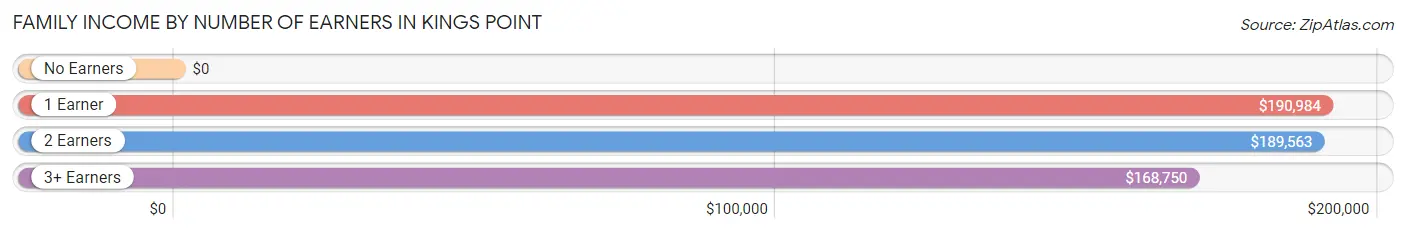
| Number of Earners | # Families | Median Income |
| No Earners | 89 (7.6%) | $0 |
| 1 Earner | 336 (28.5%) | $190,984 |
| 2 Earners | 617 (52.4%) | $189,563 |
| 3+ Earners | 136 (11.5%) | $168,750 |
| Total | 1,178 (100.0%) | $189,125 |
Household Income in Kings Point
Household Income Brackets in Kings Point
With 528 households falling in the category, the $200,000+ income range is the most frequent in Kings Point, accounting for 39.2% of all households.
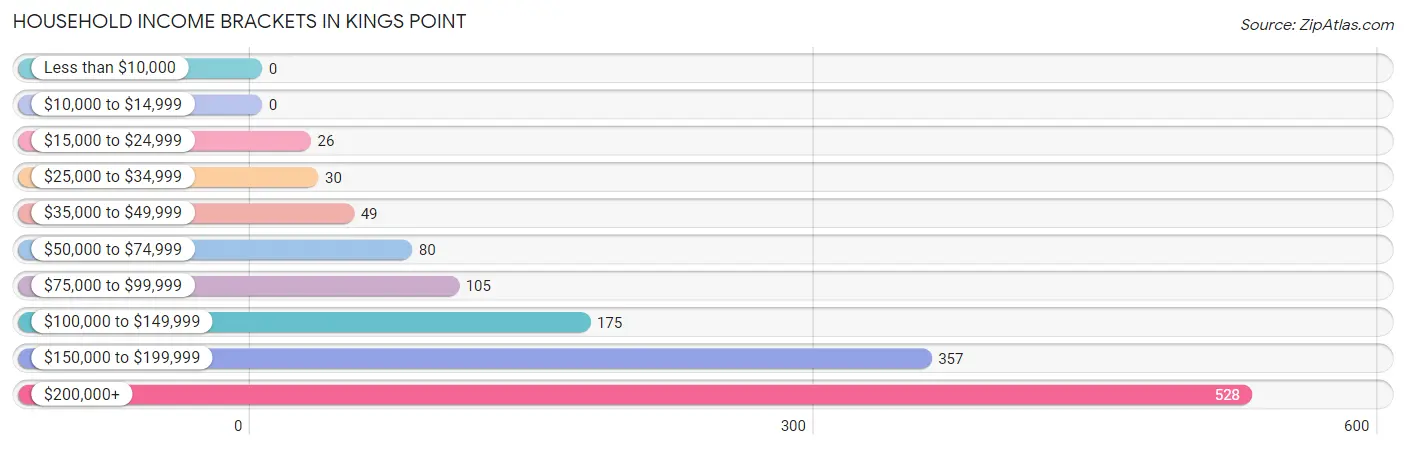
| Income Bracket | # Households | % Households |
| Less than $10,000 | 0 | 0.0% |
| $10,000 to $14,999 | 0 | 0.0% |
| $15,000 to $24,999 | 26 | 1.9% |
| $25,000 to $34,999 | 30 | 2.2% |
| $35,000 to $49,999 | 49 | 3.6% |
| $50,000 to $74,999 | 80 | 5.9% |
| $75,000 to $99,999 | 105 | 7.8% |
| $100,000 to $149,999 | 175 | 13.0% |
| $150,000 to $199,999 | 357 | 26.5% |
| $200,000+ | 528 | 39.2% |
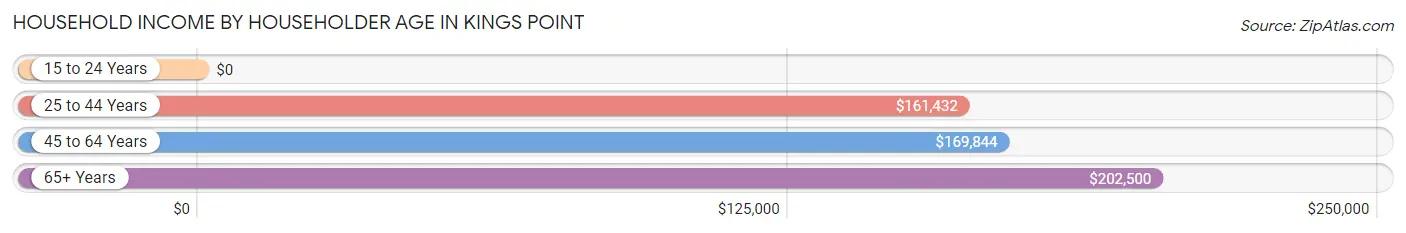
Household Income by Householder Age in Kings Point
The median household income in Kings Point is $172,402, with the highest median household income of $202,500 found in the 65+ years age bracket for the primary householder. A total of 544 households (40.4%) fall into this category.
| Income Bracket | # Households | Median Income |
| 15 to 24 Years | 0 (0.0%) | $0 |
| 25 to 44 Years | 343 (25.5%) | $161,432 |
| 45 to 64 Years | 461 (34.2%) | $169,844 |
| 65+ Years | 544 (40.4%) | $202,500 |
| Total | 1,348 (100.0%) | $172,402 |
Poverty in Kings Point
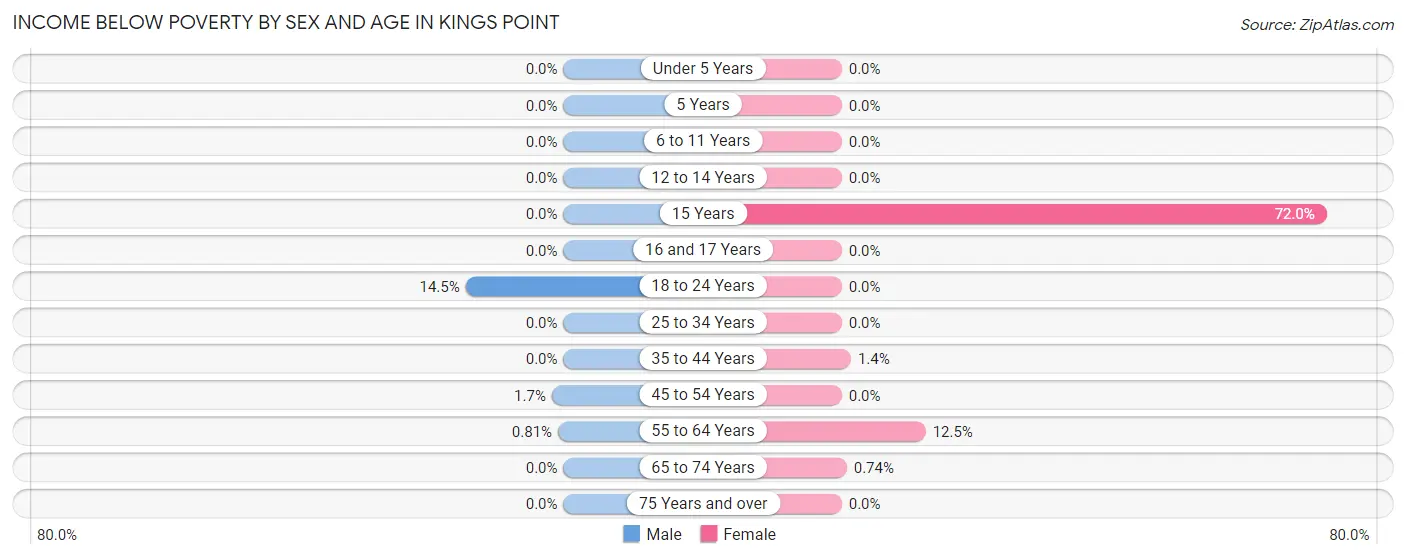
Income Below Poverty by Sex and Age in Kings Point
With 1.8% poverty level for males and 3.6% for females among the residents of Kings Point, 18 to 24 year old males and 15 year old females are the most vulnerable to poverty, with 44 males (14.5%) and 36 females (72.0%) in their respective age groups living below the poverty level.
| Age Bracket | Male | Female |
| Under 5 Years | 0 (0.0%) | 0 (0.0%) |
| 5 Years | 0 (0.0%) | 0 (0.0%) |
| 6 to 11 Years | 0 (0.0%) | 0 (0.0%) |
| 12 to 14 Years | 0 (0.0%) | 0 (0.0%) |
| 15 Years | 0 (0.0%) | 36 (72.0%) |
| 16 and 17 Years | 0 (0.0%) | 0 (0.0%) |
| 18 to 24 Years | 44 (14.5%) | 0 (0.0%) |
| 25 to 34 Years | 0 (0.0%) | 0 (0.0%) |
| 35 to 44 Years | 0 (0.0%) | 3 (1.4%) |
| 45 to 54 Years | 3 (1.7%) | 0 (0.0%) |
| 55 to 64 Years | 2 (0.8%) | 37 (12.5%) |
| 65 to 74 Years | 0 (0.0%) | 2 (0.7%) |
| 75 Years and over | 0 (0.0%) | 0 (0.0%) |
| Total | 49 (1.8%) | 78 (3.6%) |
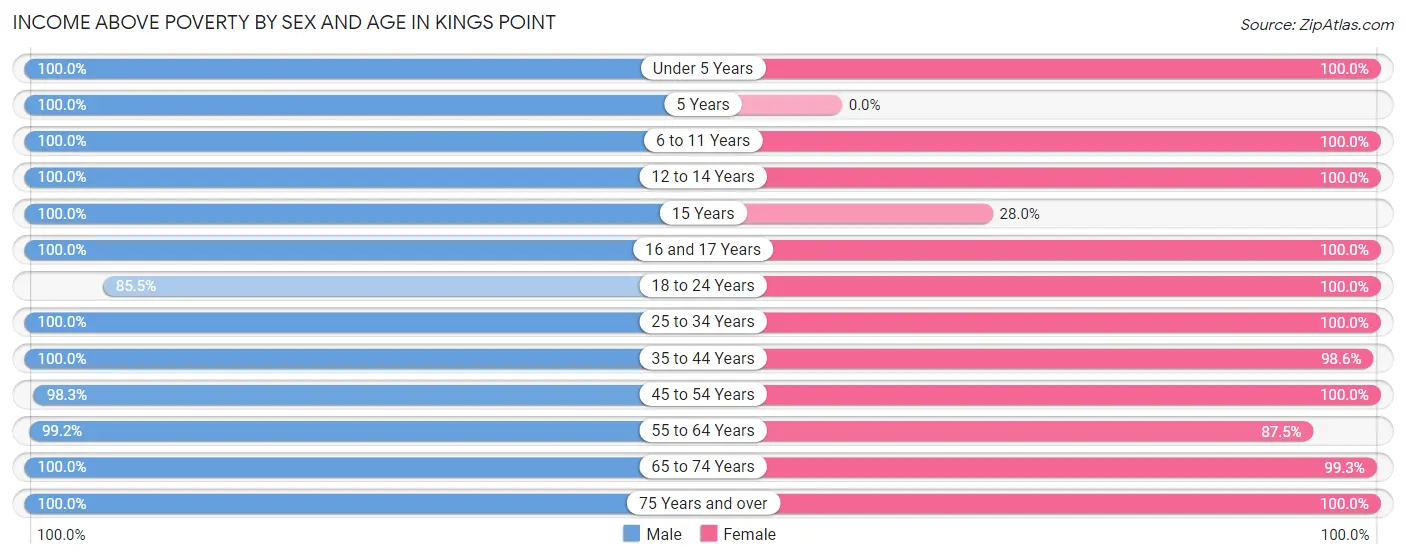
Income Above Poverty by Sex and Age in Kings Point
According to the poverty statistics in Kings Point, males aged under 5 years and females aged under 5 years are the age groups that are most secure financially, with 100.0% of males and 100.0% of females in these age groups living above the poverty line.
| Age Bracket | Male | Female |
| Under 5 Years | 68 (100.0%) | 139 (100.0%) |
| 5 Years | 16 (100.0%) | 0 (0.0%) |
| 6 to 11 Years | 223 (100.0%) | 198 (100.0%) |
| 12 to 14 Years | 349 (100.0%) | 32 (100.0%) |
| 15 Years | 235 (100.0%) | 14 (28.0%) |
| 16 and 17 Years | 79 (100.0%) | 35 (100.0%) |
| 18 to 24 Years | 259 (85.5%) | 132 (100.0%) |
| 25 to 34 Years | 335 (100.0%) | 337 (100.0%) |
| 35 to 44 Years | 222 (100.0%) | 218 (98.6%) |
| 45 to 54 Years | 171 (98.3%) | 257 (100.0%) |
| 55 to 64 Years | 245 (99.2%) | 260 (87.5%) |
| 65 to 74 Years | 218 (100.0%) | 268 (99.3%) |
| 75 Years and over | 240 (100.0%) | 212 (100.0%) |
| Total | 2,660 (98.2%) | 2,102 (96.4%) |
Income Below Poverty Among Married-Couple Families in Kings Point

| Children | Above Poverty | Below Poverty |
| No Children | 491 (100.0%) | 0 (0.0%) |
| 1 or 2 Children | 295 (100.0%) | 0 (0.0%) |
| 3 or 4 Children | 145 (100.0%) | 0 (0.0%) |
| 5 or more Children | 29 (100.0%) | 0 (0.0%) |
| Total | 960 (100.0%) | 0 (0.0%) |
Income Below Poverty Among Single-Parent Households in Kings Point
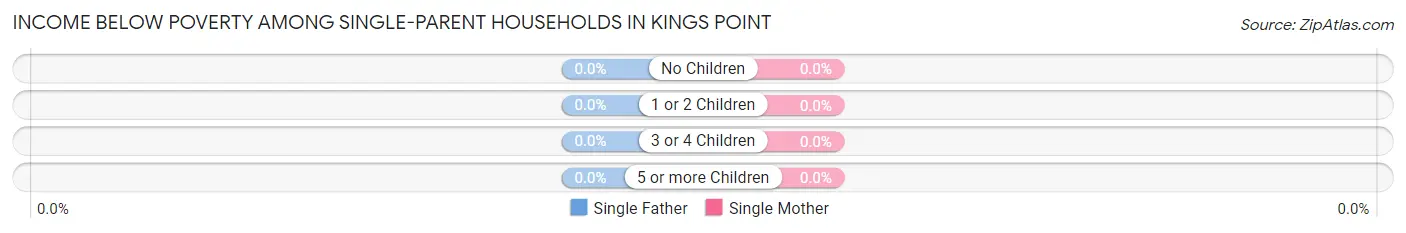
| Children | Single Father | Single Mother |
| No Children | 0 (0.0%) | 0 (0.0%) |
| 1 or 2 Children | 0 (0.0%) | 0 (0.0%) |
| 3 or 4 Children | 0 (0.0%) | 0 (0.0%) |
| 5 or more Children | 0 (0.0%) | 0 (0.0%) |
| Total | 0 (0.0%) | 0 (0.0%) |
Income Below Poverty Among Married-Couple vs Single-Parent Households in Kings Point
| Children | Married-Couple Families | Single-Parent Households |
| No Children | 0 (0.0%) | 0 (0.0%) |
| 1 or 2 Children | 0 (0.0%) | 0 (0.0%) |
| 3 or 4 Children | 0 (0.0%) | 0 (0.0%) |
| 5 or more Children | 0 (0.0%) | 0 (0.0%) |
| Total | 0 (0.0%) | 0 (0.0%) |
Race in Kings Point
The most populous races in Kings Point are White / Caucasian (4,932 | 88.2%), Hispanic or Latino (328 | 5.9%), and Some other Race (273 | 4.9%).
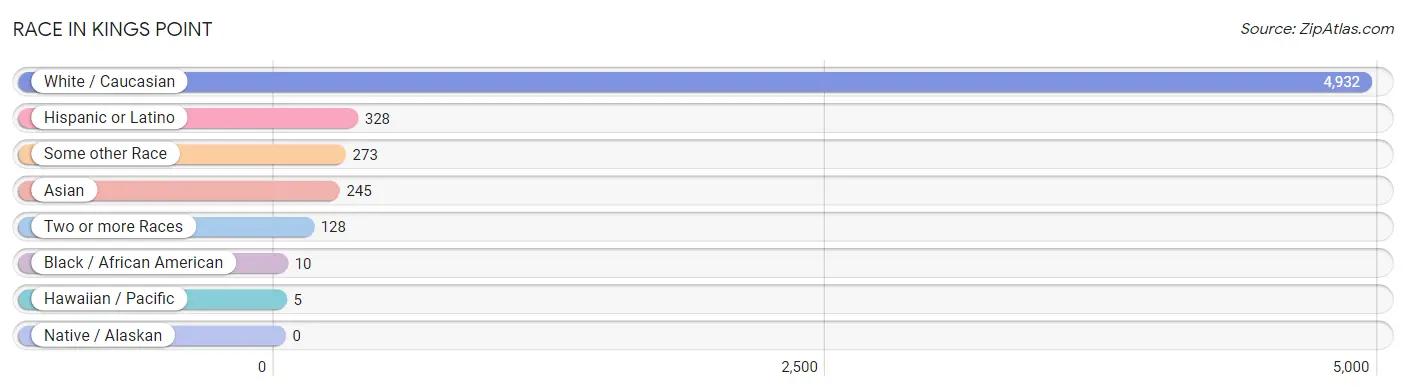
| Race | # Population | % Population |
| Asian | 245 | 4.4% |
| Black / African American | 10 | 0.2% |
| Hawaiian / Pacific | 5 | 0.1% |
| Hispanic or Latino | 328 | 5.9% |
| Native / Alaskan | 0 | 0.0% |
| White / Caucasian | 4,932 | 88.2% |
| Two or more Races | 128 | 2.3% |
| Some other Race | 273 | 4.9% |
| Total | 5,593 | 100.0% |
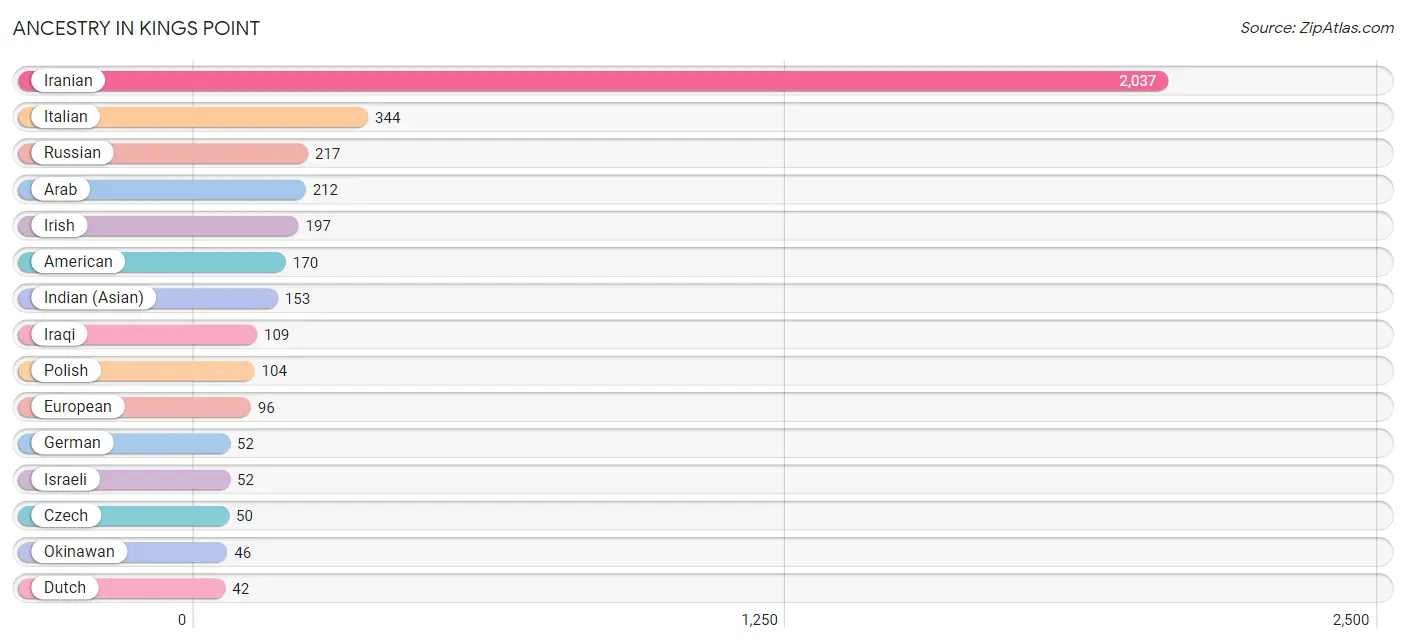
Ancestry in Kings Point
The most populous ancestries reported in Kings Point are Iranian (2,037 | 36.4%), Italian (344 | 6.1%), Russian (217 | 3.9%), Arab (212 | 3.8%), and Irish (197 | 3.5%), together accounting for 53.8% of all Kings Point residents.
| Ancestry | # Population | % Population |
| American | 170 | 3.0% |
| Arab | 212 | 3.8% |
| Argentinean | 6 | 0.1% |
| Austrian | 12 | 0.2% |
| Bhutanese | 4 | 0.1% |
| Bolivian | 11 | 0.2% |
| British | 4 | 0.1% |
| Burmese | 24 | 0.4% |
| Cajun | 4 | 0.1% |
| Central American | 6 | 0.1% |
| Cherokee | 8 | 0.1% |
| Cuban | 8 | 0.1% |
| Czech | 50 | 0.9% |
| Danish | 4 | 0.1% |
| Dutch | 42 | 0.7% |
| Eastern European | 39 | 0.7% |
| English | 37 | 0.7% |
| European | 96 | 1.7% |
| French | 13 | 0.2% |
| German | 52 | 0.9% |
| Hungarian | 4 | 0.1% |
| Indian (Asian) | 153 | 2.7% |
| Iranian | 2,037 | 36.4% |
| Iraqi | 109 | 1.9% |
| Irish | 197 | 3.5% |
| Israeli | 52 | 0.9% |
| Italian | 344 | 6.1% |
| Lithuanian | 17 | 0.3% |
| Mexican | 20 | 0.4% |
| Mongolian | 14 | 0.3% |
| Okinawan | 46 | 0.8% |
| Polish | 104 | 1.9% |
| Puerto Rican | 6 | 0.1% |
| Romanian | 22 | 0.4% |
| Russian | 217 | 3.9% |
| Salvadoran | 6 | 0.1% |
| Scotch-Irish | 13 | 0.2% |
| Scottish | 9 | 0.2% |
| South American | 17 | 0.3% |
| Swedish | 16 | 0.3% |
| Thai | 8 | 0.1% | View All 41 Rows |
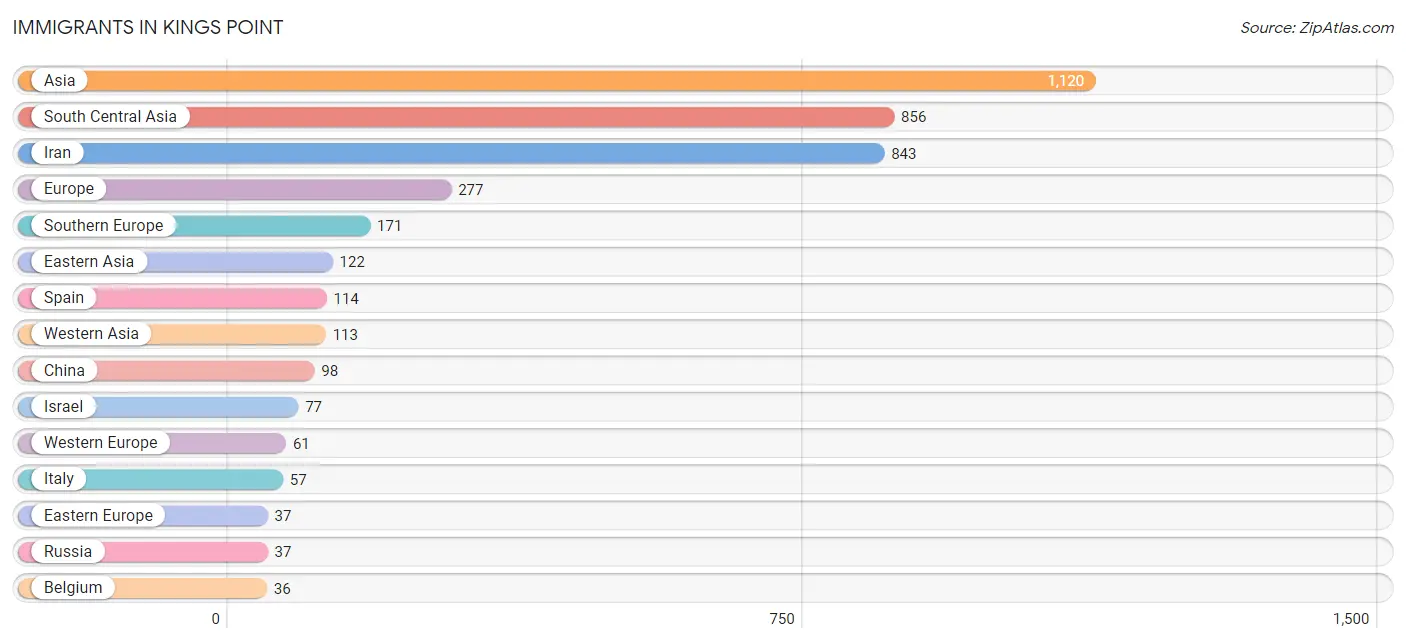
Immigrants in Kings Point
The most numerous immigrant groups reported in Kings Point came from Asia (1,120 | 20.0%), South Central Asia (856 | 15.3%), Iran (843 | 15.1%), Europe (277 | 5.0%), and Southern Europe (171 | 3.1%), together accounting for 58.4% of all Kings Point residents.
| Immigration Origin | # Population | % Population |
| Argentina | 6 | 0.1% |
| Asia | 1,120 | 20.0% |
| Austria | 25 | 0.4% |
| Belgium | 36 | 0.6% |
| China | 98 | 1.8% |
| Eastern Asia | 122 | 2.2% |
| Eastern Europe | 37 | 0.7% |
| Europe | 277 | 5.0% |
| Hong Kong | 24 | 0.4% |
| India | 13 | 0.2% |
| Iran | 843 | 15.1% |
| Israel | 77 | 1.4% |
| Italy | 57 | 1.0% |
| Korea | 24 | 0.4% |
| Latin America | 6 | 0.1% |
| Malaysia | 14 | 0.3% |
| Northern Europe | 8 | 0.1% |
| Russia | 37 | 0.7% |
| Singapore | 15 | 0.3% |
| South America | 6 | 0.1% |
| South Central Asia | 856 | 15.3% |
| South Eastern Asia | 29 | 0.5% |
| Southern Europe | 171 | 3.1% |
| Spain | 114 | 2.0% |
| Sweden | 8 | 0.1% |
| Syria | 15 | 0.3% |
| Turkey | 15 | 0.3% |
| Western Asia | 113 | 2.0% |
| Western Europe | 61 | 1.1% |
| Yemen | 6 | 0.1% | View All 30 Rows |
Sex and Age in Kings Point
Sex and Age in Kings Point
The most populous age groups in Kings Point are 15 to 19 Years (647 | 19.8%) for men and 15 to 19 Years (265 | 11.4%) for women.
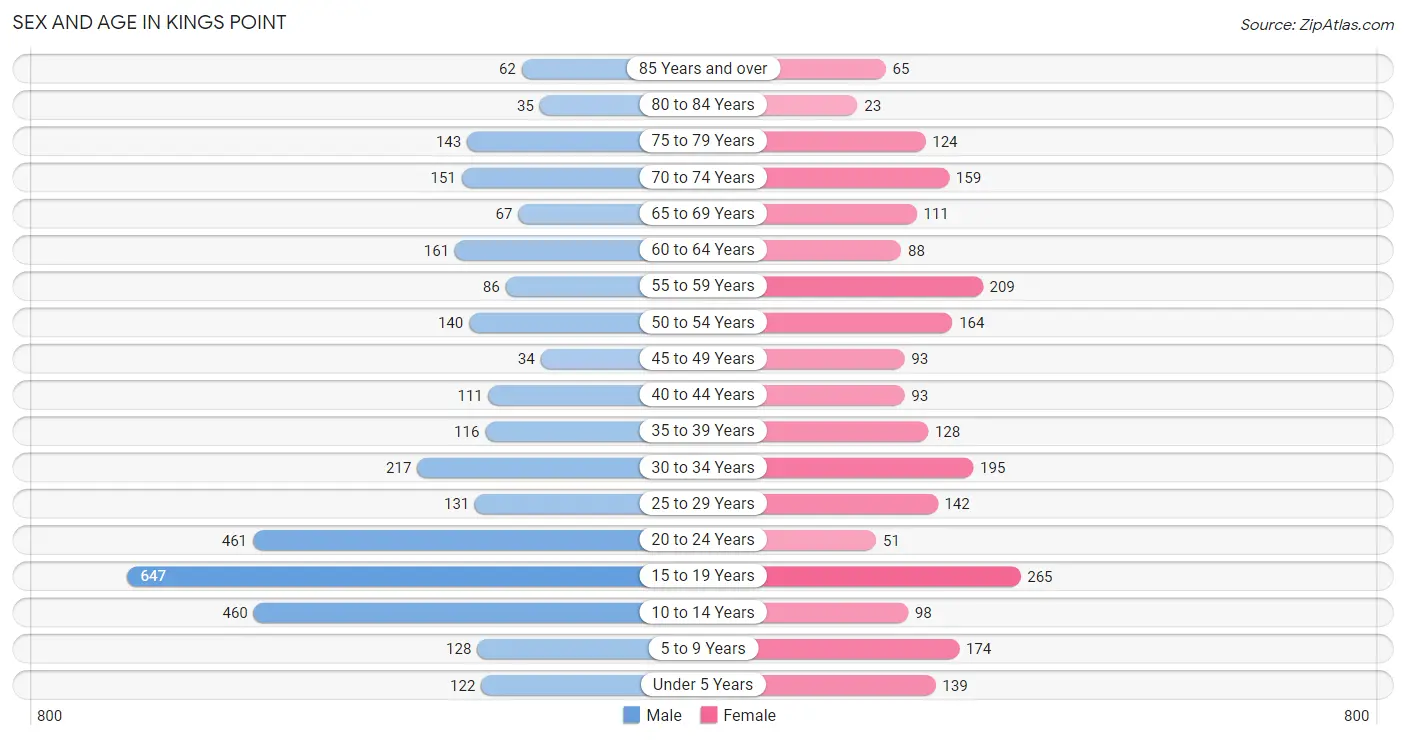
| Age Bracket | Male | Female |
| Under 5 Years | 122 (3.7%) | 139 (6.0%) |
| 5 to 9 Years | 128 (3.9%) | 174 (7.5%) |
| 10 to 14 Years | 460 (14.1%) | 98 (4.2%) |
| 15 to 19 Years | 647 (19.8%) | 265 (11.4%) |
| 20 to 24 Years | 461 (14.1%) | 51 (2.2%) |
| 25 to 29 Years | 131 (4.0%) | 142 (6.1%) |
| 30 to 34 Years | 217 (6.6%) | 195 (8.4%) |
| 35 to 39 Years | 116 (3.5%) | 128 (5.5%) |
| 40 to 44 Years | 111 (3.4%) | 93 (4.0%) |
| 45 to 49 Years | 34 (1.0%) | 93 (4.0%) |
| 50 to 54 Years | 140 (4.3%) | 164 (7.1%) |
| 55 to 59 Years | 86 (2.6%) | 209 (9.0%) |
| 60 to 64 Years | 161 (4.9%) | 88 (3.8%) |
| 65 to 69 Years | 67 (2.1%) | 111 (4.8%) |
| 70 to 74 Years | 151 (4.6%) | 159 (6.9%) |
| 75 to 79 Years | 143 (4.4%) | 124 (5.3%) |
| 80 to 84 Years | 35 (1.1%) | 23 (1.0%) |
| 85 Years and over | 62 (1.9%) | 65 (2.8%) |
| Total | 3,272 (100.0%) | 2,321 (100.0%) |
Families and Households in Kings Point
Median Family Size in Kings Point
The median family size in Kings Point is 3.77 persons per family, with single female/mother families (210 | 17.8%) accounting for the largest median family size of 4.34 persons per family. On the other hand, single male/father families (8 | 0.7%) represent the smallest median family size with 3.63 persons per family.
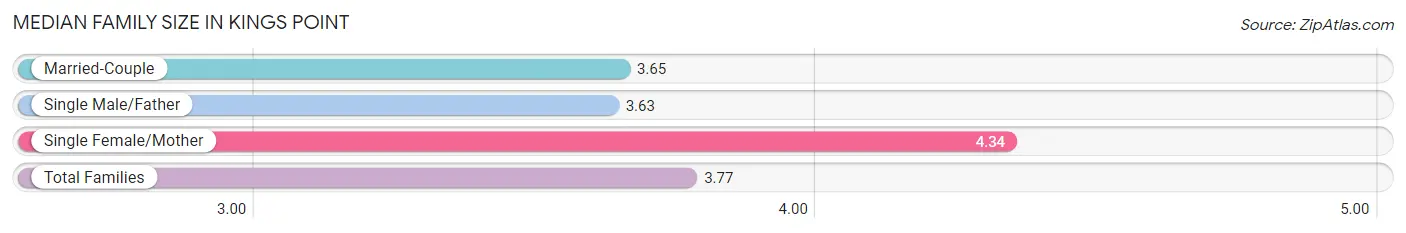
| Family Type | # Families | Family Size |
| Married-Couple | 960 (81.5%) | 3.65 |
| Single Male/Father | 8 (0.7%) | 3.63 |
| Single Female/Mother | 210 (17.8%) | 4.34 |
| Total Families | 1,178 (100.0%) | 3.77 |
Median Household Size in Kings Point
The median household size in Kings Point is 3.69 persons per household, with single female/mother households (210 | 15.6%) accounting for the largest median household size of 4.34 persons per household. non-family households (170 | 12.6%) represent the smallest median household size with 2.92 persons per household.
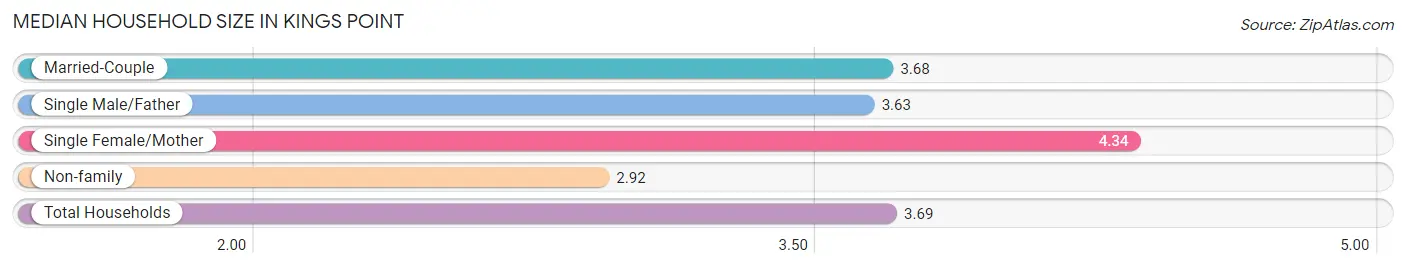
| Household Type | # Households | Household Size |
| Married-Couple | 960 (71.2%) | 3.68 |
| Single Male/Father | 8 (0.6%) | 3.63 |
| Single Female/Mother | 210 (15.6%) | 4.34 |
| Non-family | 170 (12.6%) | 2.92 |
| Total Households | 1,348 (100.0%) | 3.69 |
Household Size by Marriage Status in Kings Point
Out of a total of 1,348 households in Kings Point, 1,178 (87.4%) are family households, while 170 (12.6%) are nonfamily households. The most numerous type of family households are 2-person households, comprising 327, and the most common type of nonfamily households are 1-person households, comprising 102.
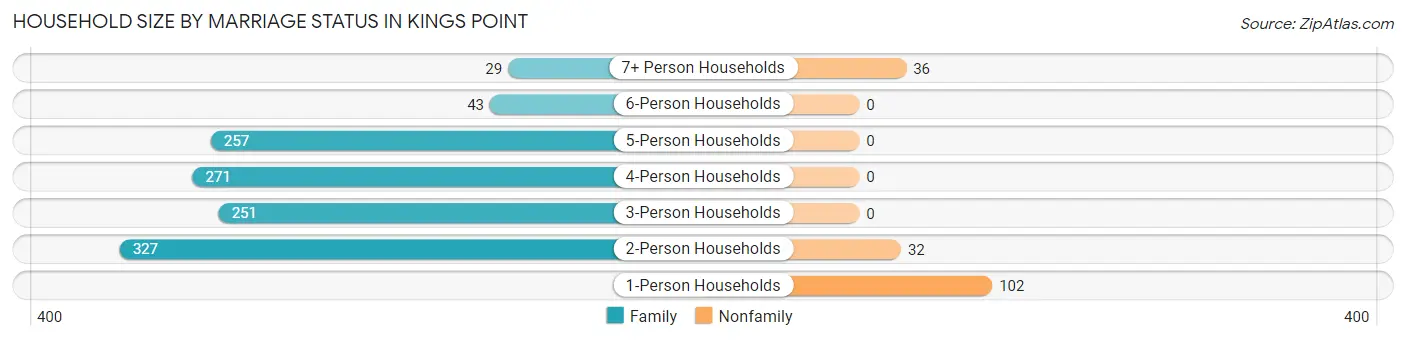
| Household Size | Family Households | Nonfamily Households |
| 1-Person Households | - | 102 (7.6%) |
| 2-Person Households | 327 (24.3%) | 32 (2.4%) |
| 3-Person Households | 251 (18.6%) | 0 (0.0%) |
| 4-Person Households | 271 (20.1%) | 0 (0.0%) |
| 5-Person Households | 257 (19.1%) | 0 (0.0%) |
| 6-Person Households | 43 (3.2%) | 0 (0.0%) |
| 7+ Person Households | 29 (2.1%) | 36 (2.7%) |
| Total | 1,178 (87.4%) | 170 (12.6%) |
Female Fertility in Kings Point
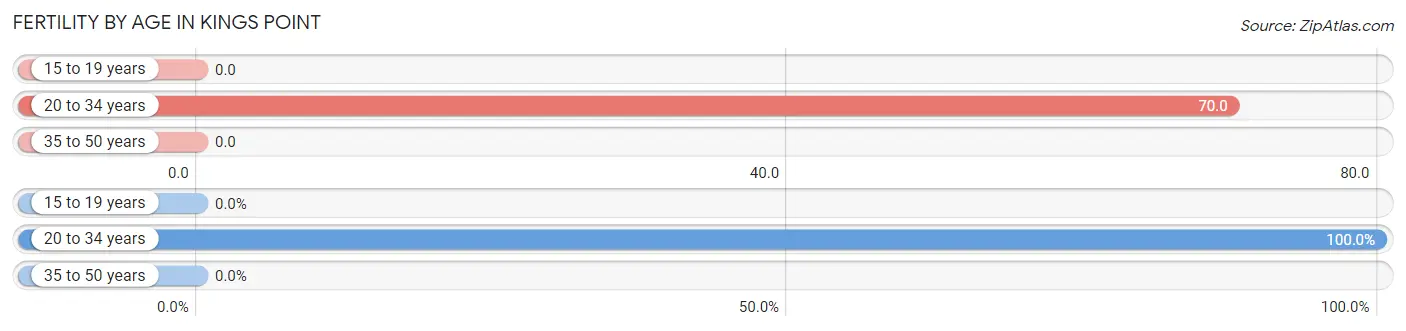
Fertility by Age in Kings Point
Average fertility rate in Kings Point is 27.0 births per 1,000 women. Women in the age bracket of 20 to 34 years have the highest fertility rate with 70.0 births per 1,000 women. Women in the age bracket of 20 to 34 years acount for 100.0% of all women with births.
| Age Bracket | Women with Births | Births / 1,000 Women |
| 15 to 19 years | 0 (0.0%) | 0.0 |
| 20 to 34 years | 27 (100.0%) | 70.0 |
| 35 to 50 years | 0 (0.0%) | 0.0 |
| Total | 27 (100.0%) | 27.0 |
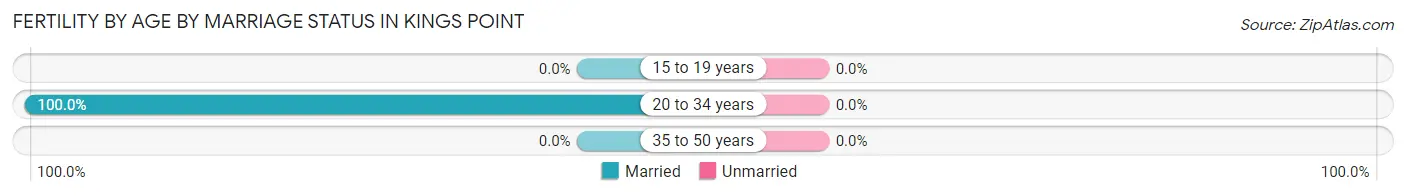
Fertility by Age by Marriage Status in Kings Point
| Age Bracket | Married | Unmarried |
| 15 to 19 years | 0 (0.0%) | 0 (0.0%) |
| 20 to 34 years | 27 (100.0%) | 0 (0.0%) |
| 35 to 50 years | 0 (0.0%) | 0 (0.0%) |
| Total | 27 (100.0%) | 0 (0.0%) |
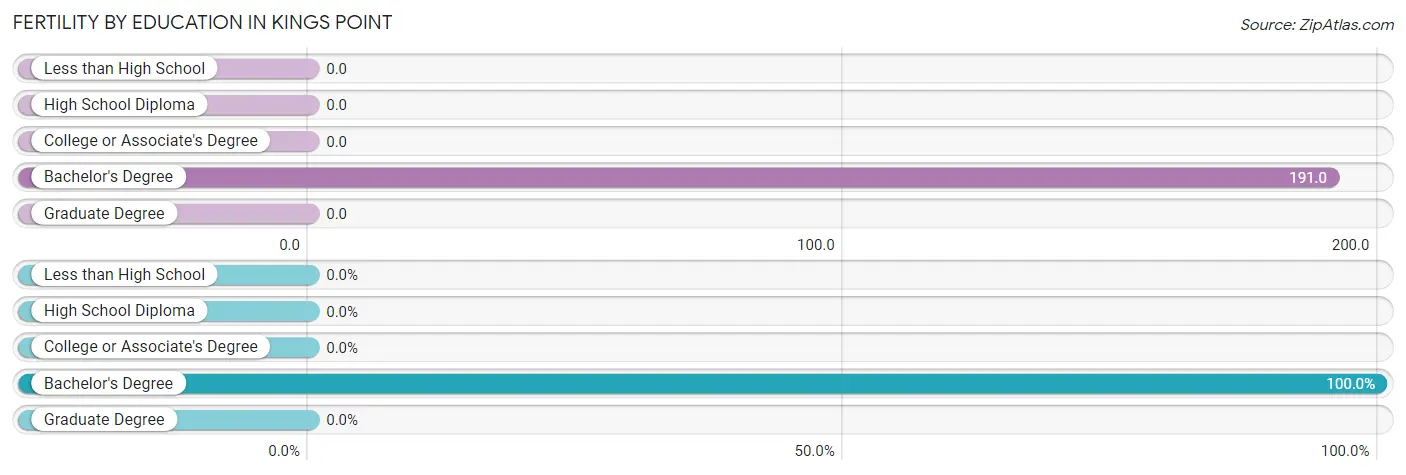
Fertility by Education in Kings Point
| Educational Attainment | Women with Births | Births / 1,000 Women |
| Less than High School | 0 (0.0%) | 0.0 |
| High School Diploma | 0 (0.0%) | 0.0 |
| College or Associate's Degree | 0 (0.0%) | 0.0 |
| Bachelor's Degree | 27 (100.0%) | 191.0 |
| Graduate Degree | 0 (0.0%) | 0.0 |
| Total | 27 (100.0%) | 27.0 |
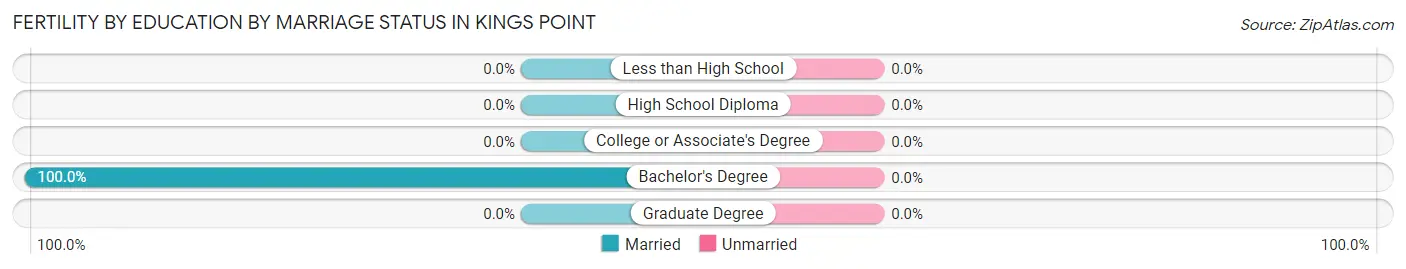
Fertility by Education by Marriage Status in Kings Point
| Educational Attainment | Married | Unmarried |
| Less than High School | 0 (0.0%) | 0 (0.0%) |
| High School Diploma | 0 (0.0%) | 0 (0.0%) |
| College or Associate's Degree | 0 (0.0%) | 0 (0.0%) |
| Bachelor's Degree | 27 (100.0%) | 0 (0.0%) |
| Graduate Degree | 0 (0.0%) | 0 (0.0%) |
| Total | 27 (100.0%) | 0 (0.0%) |
Employment Characteristics in Kings Point
Employment by Class of Employer in Kings Point
Among the 2,202 employed individuals in Kings Point, private company employees (1,346 | 61.1%), self-employed (incorporated) (268 | 12.2%), and self-employed (not incorporated) (200 | 9.1%) make up the most common classes of employment.
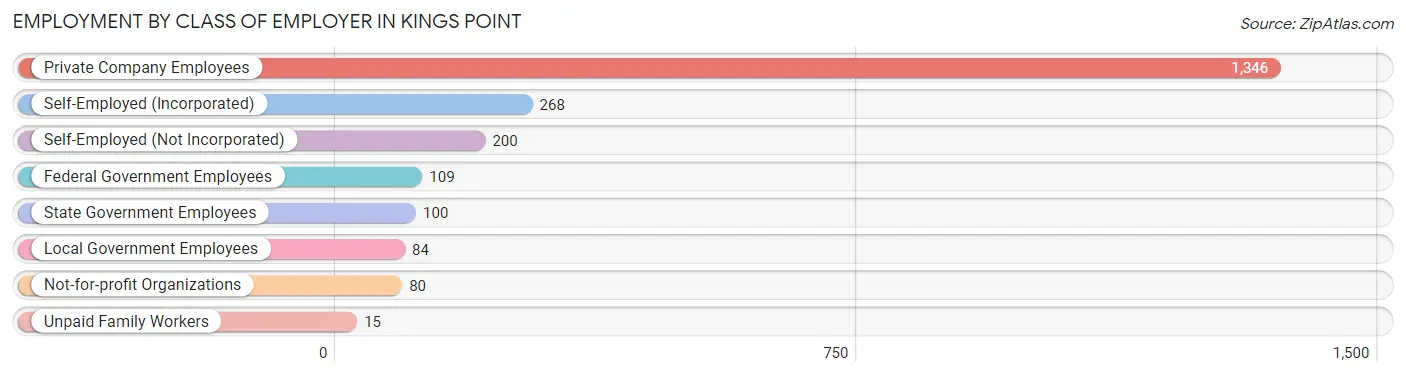
| Employer Class | # Employees | % Employees |
| Private Company Employees | 1,346 | 61.1% |
| Self-Employed (Incorporated) | 268 | 12.2% |
| Self-Employed (Not Incorporated) | 200 | 9.1% |
| Not-for-profit Organizations | 80 | 3.6% |
| Local Government Employees | 84 | 3.8% |
| State Government Employees | 100 | 4.5% |
| Federal Government Employees | 109 | 5.0% |
| Unpaid Family Workers | 15 | 0.7% |
| Total | 2,202 | 100.0% |
Employment Status by Age in Kings Point
According to the labor force statistics for Kings Point, out of the total population over 16 years of age (4,187), 54.1% or 2,265 individuals are in the labor force, with 2.2% or 50 of them unemployed. The age group with the highest labor force participation rate is 60 to 64 years, with 95.2% or 237 individuals in the labor force. Within the labor force, the 20 to 24 years age range has the highest percentage of unemployed individuals, with 12.1% or 36 of them being unemployed.
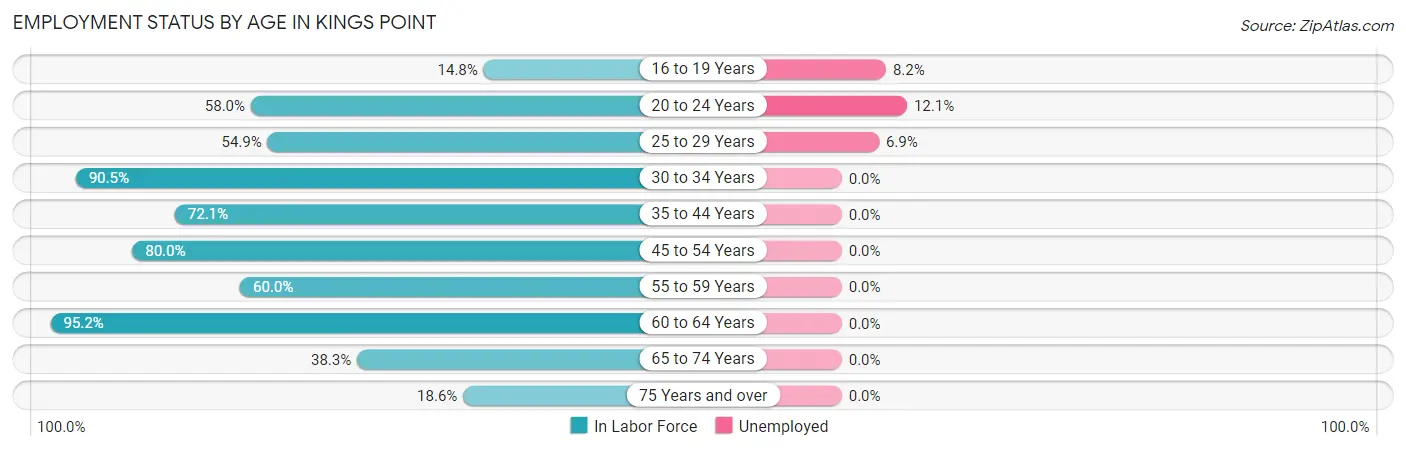
| Age Bracket | In Labor Force | Unemployed |
| 16 to 19 Years | 93 (14.8%) | 8 (8.2%) |
| 20 to 24 Years | 297 (58.0%) | 36 (12.1%) |
| 25 to 29 Years | 150 (54.9%) | 10 (6.9%) |
| 30 to 34 Years | 373 (90.5%) | 0 (0.0%) |
| 35 to 44 Years | 323 (72.1%) | 0 (0.0%) |
| 45 to 54 Years | 345 (80.0%) | 0 (0.0%) |
| 55 to 59 Years | 177 (60.0%) | 0 (0.0%) |
| 60 to 64 Years | 237 (95.2%) | 0 (0.0%) |
| 65 to 74 Years | 187 (38.3%) | 0 (0.0%) |
| 75 Years and over | 84 (18.6%) | 0 (0.0%) |
| Total | 2,265 (54.1%) | 50 (2.2%) |
Employment Status by Educational Attainment in Kings Point
According to labor force statistics for Kings Point, 76.1% of individuals (1,604) out of the total population between 25 and 64 years of age (2,108) are in the labor force, with 0.6% or 10 of them being unemployed. The group with the highest labor force participation rate are those with the educational attainment of less than high school, with 88.1% or 59 individuals in the labor force. Within the labor force, individuals with bachelor's degree or higher education have the highest percentage of unemployment, with 1.1% or 10 of them being unemployed.
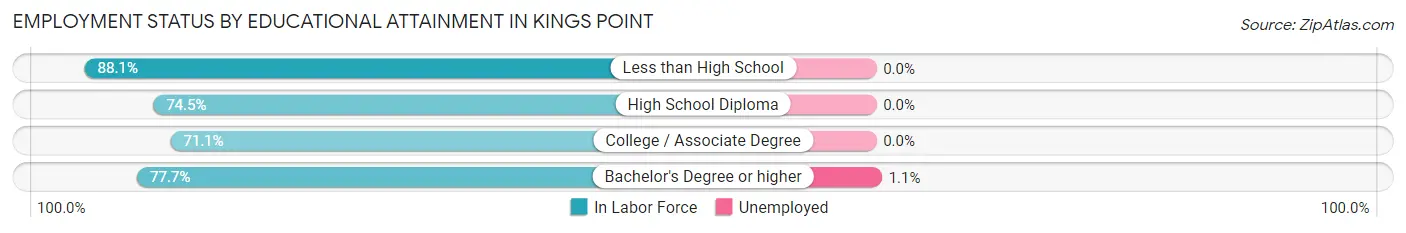
| Educational Attainment | In Labor Force | Unemployed |
| Less than High School | 59 (88.1%) | 0 (0.0%) |
| High School Diploma | 401 (74.5%) | 0 (0.0%) |
| College / Associate Degree | 249 (71.1%) | 0 (0.0%) |
| Bachelor's Degree or higher | 896 (77.7%) | 13 (1.1%) |
| Total | 1,604 (76.1%) | 13 (0.6%) |
Employment Occupations by Sex in Kings Point
Management, Business, Science and Arts Occupations
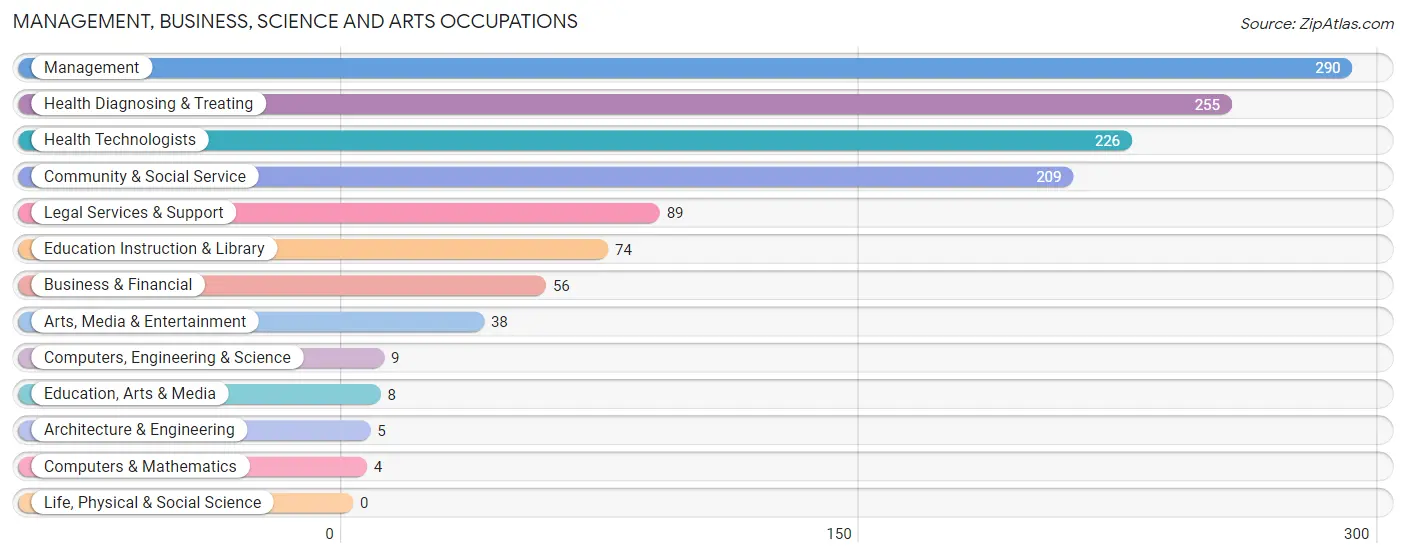
The most common Management, Business, Science and Arts occupations in Kings Point are Management (290 | 13.4%), Health Diagnosing & Treating (255 | 11.8%), Health Technologists (226 | 10.5%), Community & Social Service (209 | 9.7%), and Legal Services & Support (89 | 4.1%).
Management, Business, Science and Arts Occupations by Sex
Within the Management, Business, Science and Arts occupations in Kings Point, the most male-oriented occupations are Architecture & Engineering (100.0%), Management (80.3%), and Health Technologists (69.9%), while the most female-oriented occupations are Computers & Mathematics (100.0%), Education, Arts & Media (100.0%), and Education Instruction & Library (75.7%).
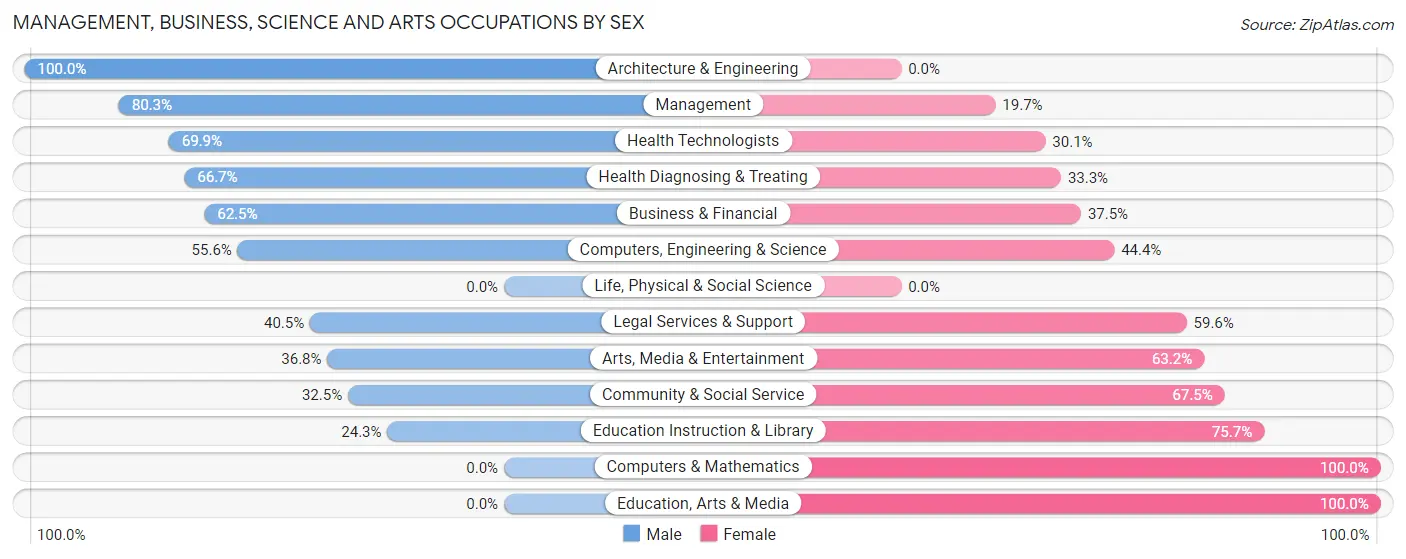
| Occupation | Male | Female |
| Management | 233 (80.3%) | 57 (19.7%) |
| Business & Financial | 35 (62.5%) | 21 (37.5%) |
| Computers, Engineering & Science | 5 (55.6%) | 4 (44.4%) |
| Computers & Mathematics | 0 (0.0%) | 4 (100.0%) |
| Architecture & Engineering | 5 (100.0%) | 0 (0.0%) |
| Life, Physical & Social Science | 0 (0.0%) | 0 (0.0%) |
| Community & Social Service | 68 (32.5%) | 141 (67.5%) |
| Education, Arts & Media | 0 (0.0%) | 8 (100.0%) |
| Legal Services & Support | 36 (40.5%) | 53 (59.6%) |
| Education Instruction & Library | 18 (24.3%) | 56 (75.7%) |
| Arts, Media & Entertainment | 14 (36.8%) | 24 (63.2%) |
| Health Diagnosing & Treating | 170 (66.7%) | 85 (33.3%) |
| Health Technologists | 158 (69.9%) | 68 (30.1%) |
| Total (Category) | 511 (62.4%) | 308 (37.6%) |
| Total (Overall) | 1,341 (62.1%) | 819 (37.9%) |
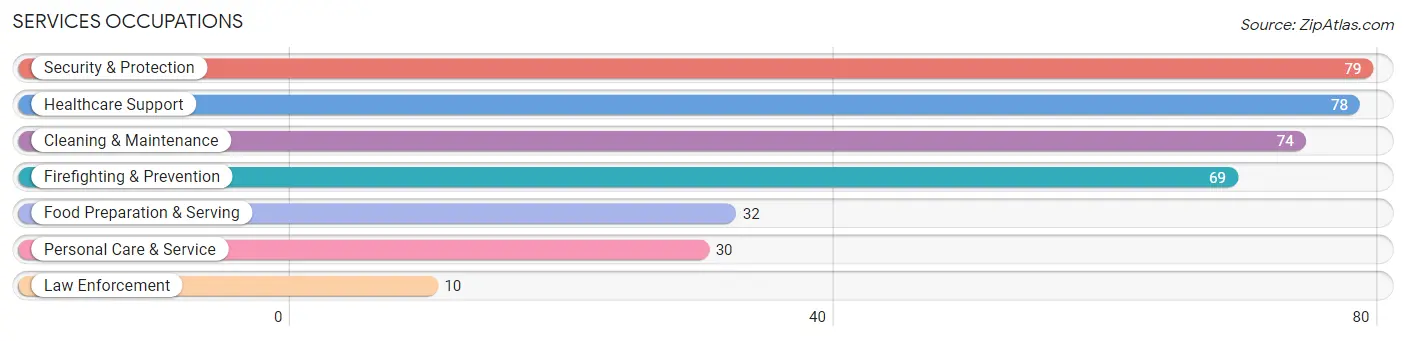
Services Occupations
The most common Services occupations in Kings Point are Security & Protection (79 | 3.7%), Healthcare Support (78 | 3.6%), Cleaning & Maintenance (74 | 3.4%), Firefighting & Prevention (69 | 3.2%), and Food Preparation & Serving (32 | 1.5%).
Services Occupations by Sex
Within the Services occupations in Kings Point, the most male-oriented occupations are Law Enforcement (100.0%), Food Preparation & Serving (100.0%), and Security & Protection (96.2%), while the most female-oriented occupations are Personal Care & Service (83.3%), Cleaning & Maintenance (74.3%), and Healthcare Support (70.5%).
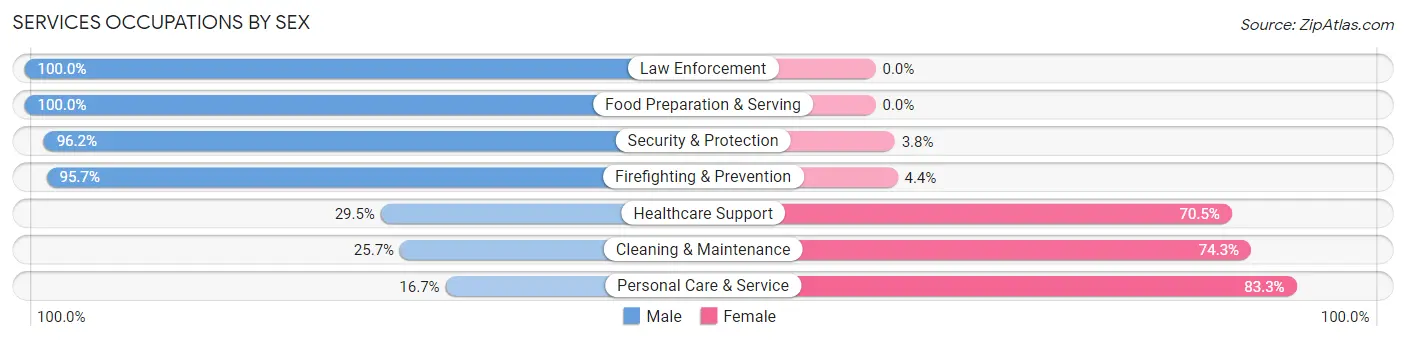
| Occupation | Male | Female |
| Healthcare Support | 23 (29.5%) | 55 (70.5%) |
| Security & Protection | 76 (96.2%) | 3 (3.8%) |
| Firefighting & Prevention | 66 (95.7%) | 3 (4.3%) |
| Law Enforcement | 10 (100.0%) | 0 (0.0%) |
| Food Preparation & Serving | 32 (100.0%) | 0 (0.0%) |
| Cleaning & Maintenance | 19 (25.7%) | 55 (74.3%) |
| Personal Care & Service | 5 (16.7%) | 25 (83.3%) |
| Total (Category) | 155 (52.9%) | 138 (47.1%) |
| Total (Overall) | 1,341 (62.1%) | 819 (37.9%) |
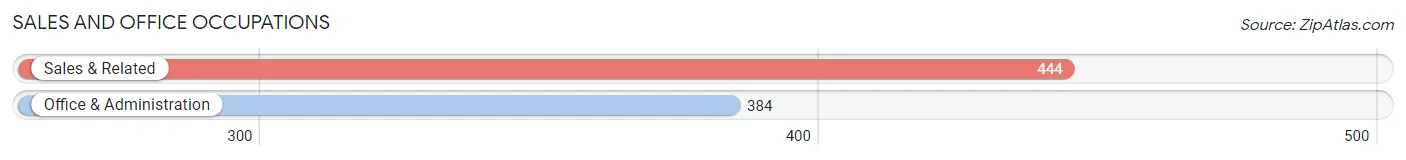
Sales and Office Occupations
The most common Sales and Office occupations in Kings Point are Sales & Related (444 | 20.6%), and Office & Administration (384 | 17.8%).
Sales and Office Occupations by Sex
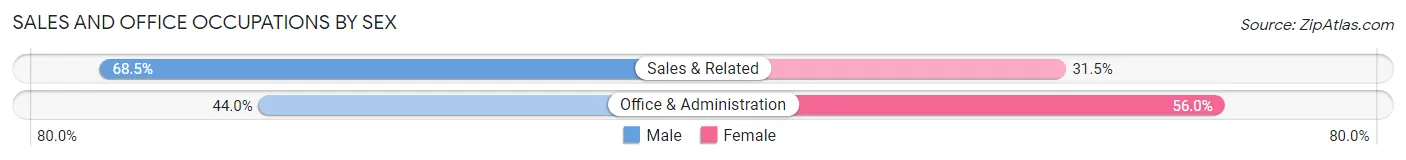
| Occupation | Male | Female |
| Sales & Related | 304 (68.5%) | 140 (31.5%) |
| Office & Administration | 169 (44.0%) | 215 (56.0%) |
| Total (Category) | 473 (57.1%) | 355 (42.9%) |
| Total (Overall) | 1,341 (62.1%) | 819 (37.9%) |
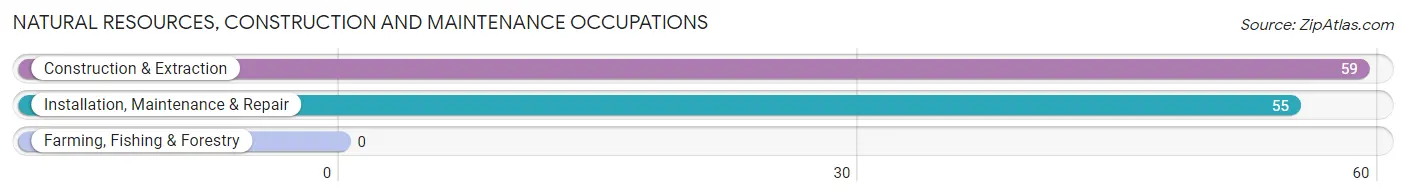
Natural Resources, Construction and Maintenance Occupations
The most common Natural Resources, Construction and Maintenance occupations in Kings Point are Construction & Extraction (59 | 2.7%), and Installation, Maintenance & Repair (55 | 2.5%).
Natural Resources, Construction and Maintenance Occupations by Sex
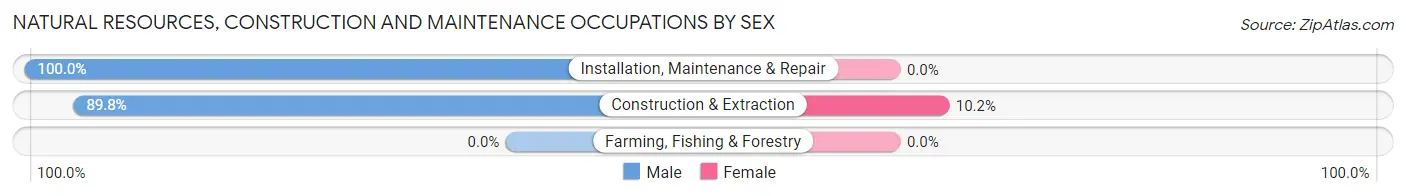
| Occupation | Male | Female |
| Farming, Fishing & Forestry | 0 (0.0%) | 0 (0.0%) |
| Construction & Extraction | 53 (89.8%) | 6 (10.2%) |
| Installation, Maintenance & Repair | 55 (100.0%) | 0 (0.0%) |
| Total (Category) | 108 (94.7%) | 6 (5.3%) |
| Total (Overall) | 1,341 (62.1%) | 819 (37.9%) |
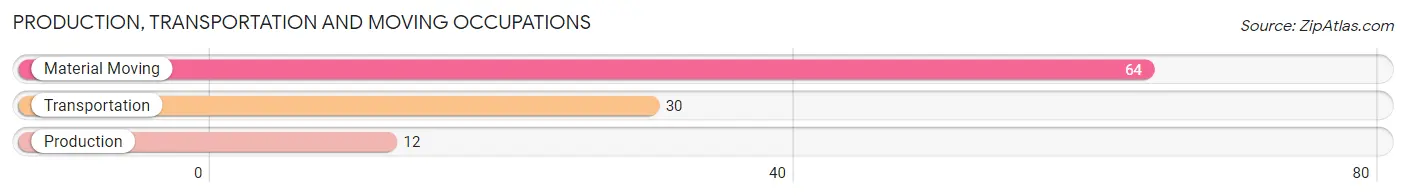
Production, Transportation and Moving Occupations
The most common Production, Transportation and Moving occupations in Kings Point are Material Moving (64 | 3.0%), Transportation (30 | 1.4%), and Production (12 | 0.6%).
Production, Transportation and Moving Occupations by Sex
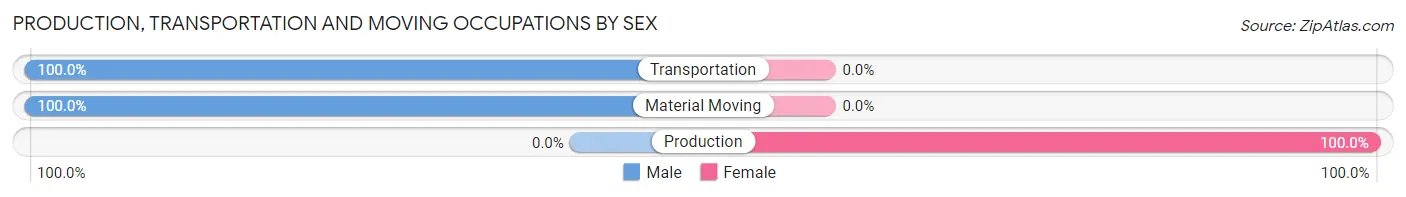
| Occupation | Male | Female |
| Production | 0 (0.0%) | 12 (100.0%) |
| Transportation | 30 (100.0%) | 0 (0.0%) |
| Material Moving | 64 (100.0%) | 0 (0.0%) |
| Total (Category) | 94 (88.7%) | 12 (11.3%) |
| Total (Overall) | 1,341 (62.1%) | 819 (37.9%) |
Employment Industries by Sex in Kings Point
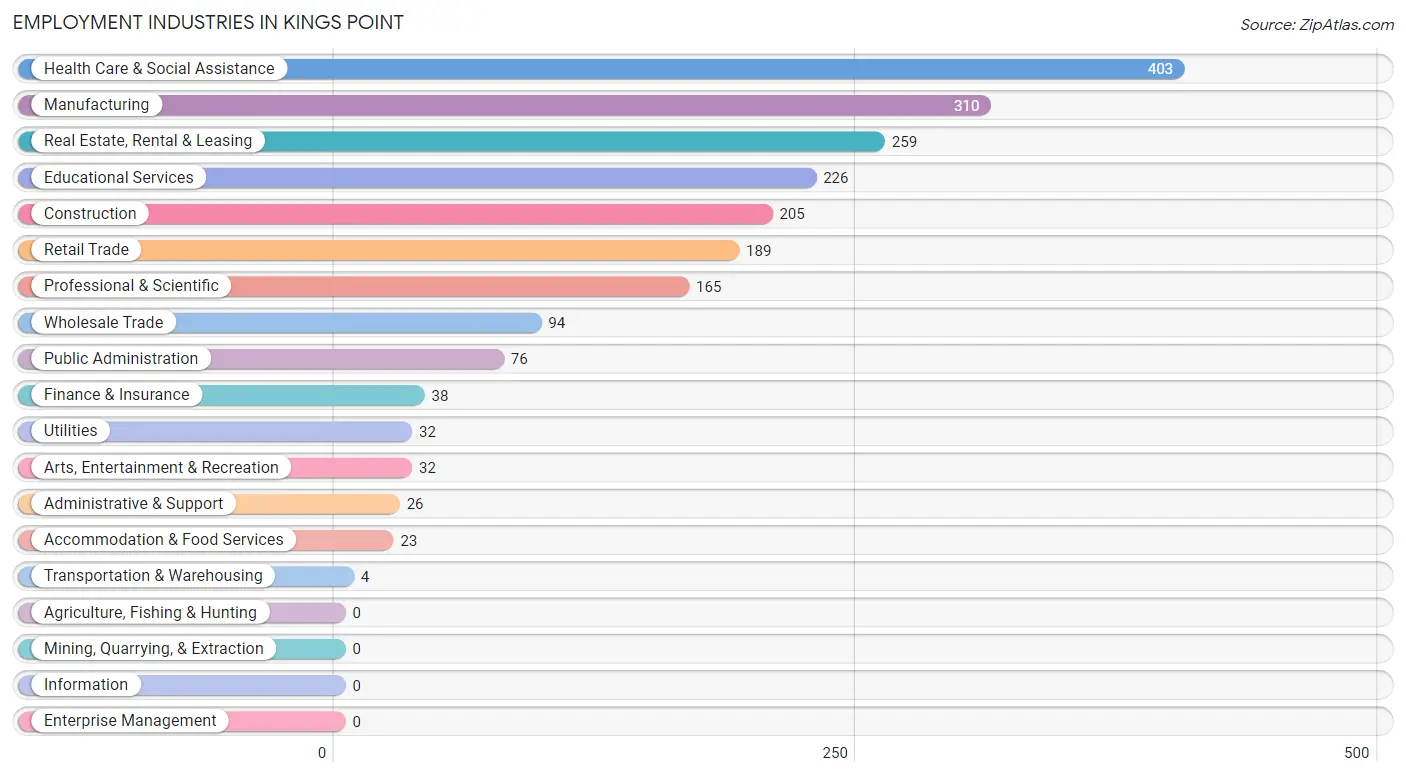
Employment Industries in Kings Point
The major employment industries in Kings Point include Health Care & Social Assistance (403 | 18.7%), Manufacturing (310 | 14.3%), Real Estate, Rental & Leasing (259 | 12.0%), Educational Services (226 | 10.5%), and Construction (205 | 9.5%).
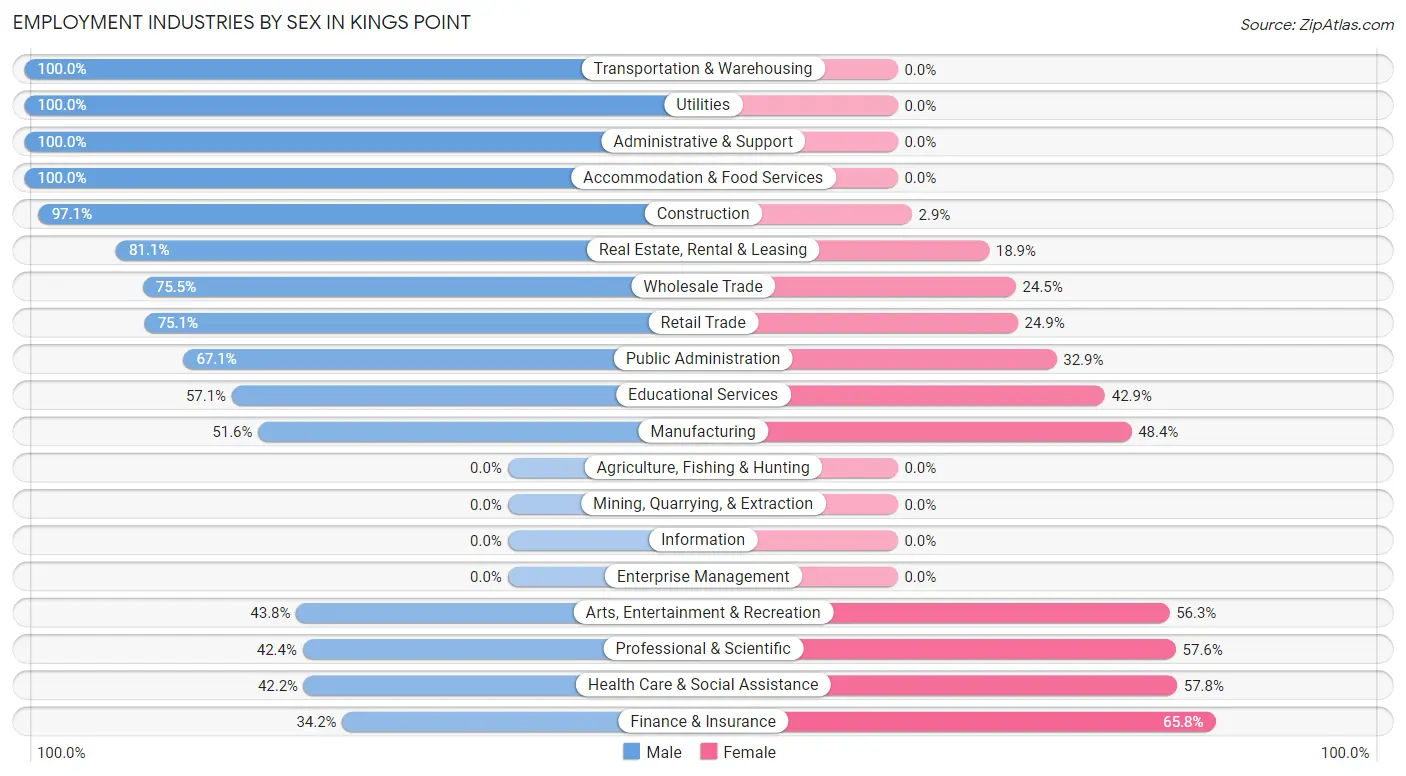
Employment Industries by Sex in Kings Point
The Kings Point industries that see more men than women are Transportation & Warehousing (100.0%), Utilities (100.0%), and Administrative & Support (100.0%), whereas the industries that tend to have a higher number of women are Finance & Insurance (65.8%), Health Care & Social Assistance (57.8%), and Professional & Scientific (57.6%).
| Industry | Male | Female |
| Agriculture, Fishing & Hunting | 0 (0.0%) | 0 (0.0%) |
| Mining, Quarrying, & Extraction | 0 (0.0%) | 0 (0.0%) |
| Construction | 199 (97.1%) | 6 (2.9%) |
| Manufacturing | 160 (51.6%) | 150 (48.4%) |
| Wholesale Trade | 71 (75.5%) | 23 (24.5%) |
| Retail Trade | 142 (75.1%) | 47 (24.9%) |
| Transportation & Warehousing | 4 (100.0%) | 0 (0.0%) |
| Utilities | 32 (100.0%) | 0 (0.0%) |
| Information | 0 (0.0%) | 0 (0.0%) |
| Finance & Insurance | 13 (34.2%) | 25 (65.8%) |
| Real Estate, Rental & Leasing | 210 (81.1%) | 49 (18.9%) |
| Professional & Scientific | 70 (42.4%) | 95 (57.6%) |
| Enterprise Management | 0 (0.0%) | 0 (0.0%) |
| Administrative & Support | 26 (100.0%) | 0 (0.0%) |
| Educational Services | 129 (57.1%) | 97 (42.9%) |
| Health Care & Social Assistance | 170 (42.2%) | 233 (57.8%) |
| Arts, Entertainment & Recreation | 14 (43.8%) | 18 (56.2%) |
| Accommodation & Food Services | 23 (100.0%) | 0 (0.0%) |
| Public Administration | 51 (67.1%) | 25 (32.9%) |
| Total | 1,341 (62.1%) | 819 (37.9%) |
Education in Kings Point
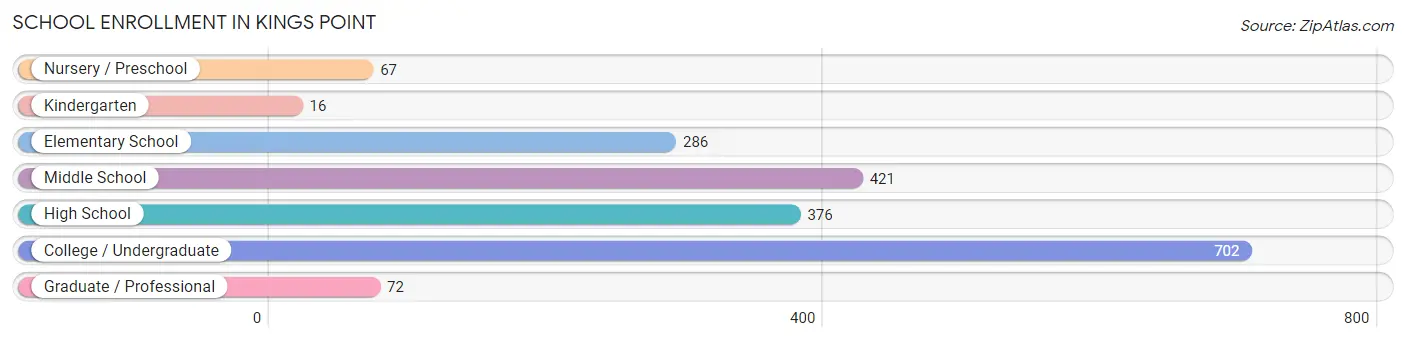
School Enrollment in Kings Point
The most common levels of schooling among the 1,940 students in Kings Point are college / undergraduate (702 | 36.2%), middle school (421 | 21.7%), and high school (376 | 19.4%).
| School Level | # Students | % Students |
| Nursery / Preschool | 67 | 3.5% |
| Kindergarten | 16 | 0.8% |
| Elementary School | 286 | 14.7% |
| Middle School | 421 | 21.7% |
| High School | 376 | 19.4% |
| College / Undergraduate | 702 | 36.2% |
| Graduate / Professional | 72 | 3.7% |
| Total | 1,940 | 100.0% |
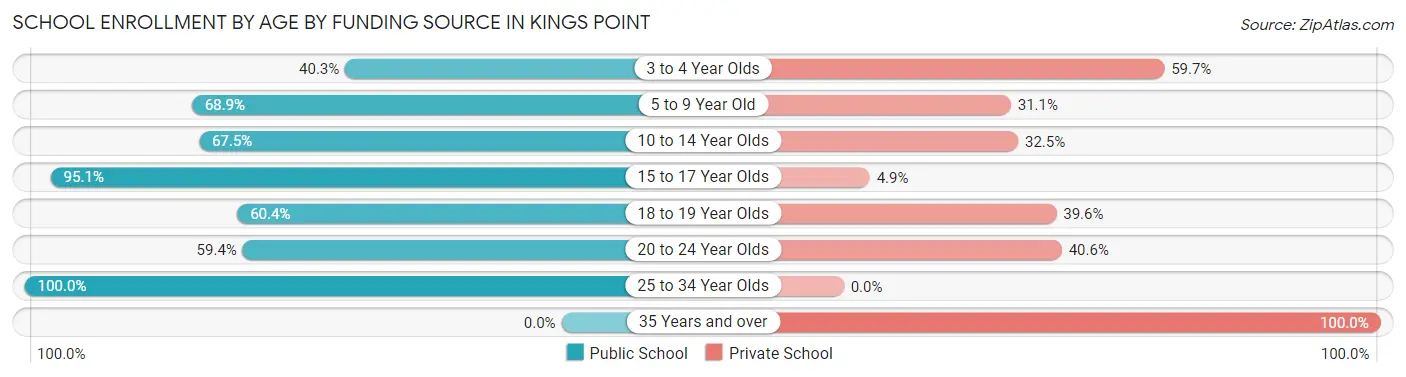
School Enrollment by Age by Funding Source in Kings Point
Out of a total of 1,940 students who are enrolled in schools in Kings Point, 617 (31.8%) attend a private institution, while the remaining 1,323 (68.2%) are enrolled in public schools. The age group of 35 years and over has the highest likelihood of being enrolled in private schools, with 5 (100.0% in the age bracket) enrolled. Conversely, the age group of 25 to 34 year olds has the lowest likelihood of being enrolled in a private school, with 33 (100.0% in the age bracket) attending a public institution.
| Age Bracket | Public School | Private School |
| 3 to 4 Year Olds | 27 (40.3%) | 40 (59.7%) |
| 5 to 9 Year Old | 208 (68.9%) | 94 (31.1%) |
| 10 to 14 Year Olds | 316 (67.5%) | 152 (32.5%) |
| 15 to 17 Year Olds | 274 (95.1%) | 14 (4.9%) |
| 18 to 19 Year Olds | 218 (60.4%) | 143 (39.6%) |
| 20 to 24 Year Olds | 247 (59.4%) | 169 (40.6%) |
| 25 to 34 Year Olds | 33 (100.0%) | 0 (0.0%) |
| 35 Years and over | 0 (0.0%) | 5 (100.0%) |
| Total | 1,323 (68.2%) | 617 (31.8%) |
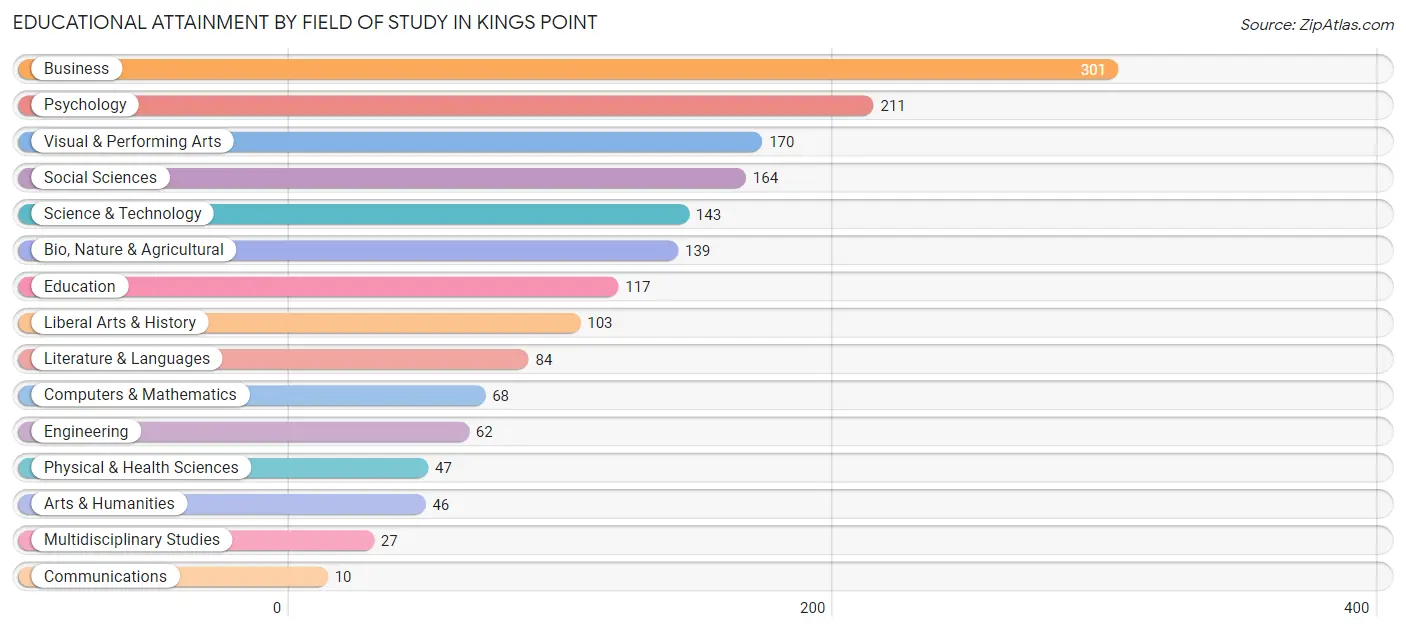
Educational Attainment by Field of Study in Kings Point
Business (301 | 17.8%), psychology (211 | 12.5%), visual & performing arts (170 | 10.1%), social sciences (164 | 9.7%), and science & technology (143 | 8.5%) are the most common fields of study among 1,692 individuals in Kings Point who have obtained a bachelor's degree or higher.
| Field of Study | # Graduates | % Graduates |
| Computers & Mathematics | 68 | 4.0% |
| Bio, Nature & Agricultural | 139 | 8.2% |
| Physical & Health Sciences | 47 | 2.8% |
| Psychology | 211 | 12.5% |
| Social Sciences | 164 | 9.7% |
| Engineering | 62 | 3.7% |
| Multidisciplinary Studies | 27 | 1.6% |
| Science & Technology | 143 | 8.5% |
| Business | 301 | 17.8% |
| Education | 117 | 6.9% |
| Literature & Languages | 84 | 5.0% |
| Liberal Arts & History | 103 | 6.1% |
| Visual & Performing Arts | 170 | 10.1% |
| Communications | 10 | 0.6% |
| Arts & Humanities | 46 | 2.7% |
| Total | 1,692 | 100.0% |
Transportation & Commute in Kings Point
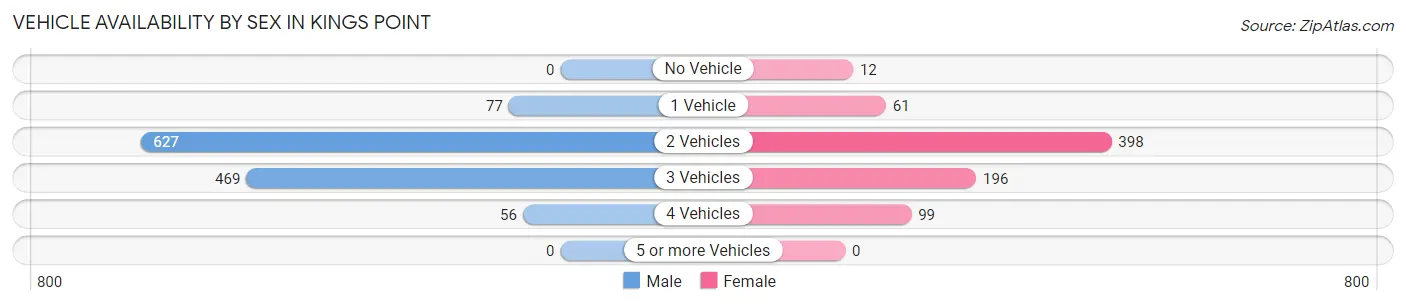
Vehicle Availability by Sex in Kings Point
The most prevalent vehicle ownership categories in Kings Point are males with 2 vehicles (627, accounting for 51.0%) and females with 2 vehicles (398, making up 81.9%).
| Vehicles Available | Male | Female |
| No Vehicle | 0 (0.0%) | 12 (1.6%) |
| 1 Vehicle | 77 (6.3%) | 61 (8.0%) |
| 2 Vehicles | 627 (51.0%) | 398 (52.0%) |
| 3 Vehicles | 469 (38.2%) | 196 (25.6%) |
| 4 Vehicles | 56 (4.6%) | 99 (12.9%) |
| 5 or more Vehicles | 0 (0.0%) | 0 (0.0%) |
| Total | 1,229 (100.0%) | 766 (100.0%) |
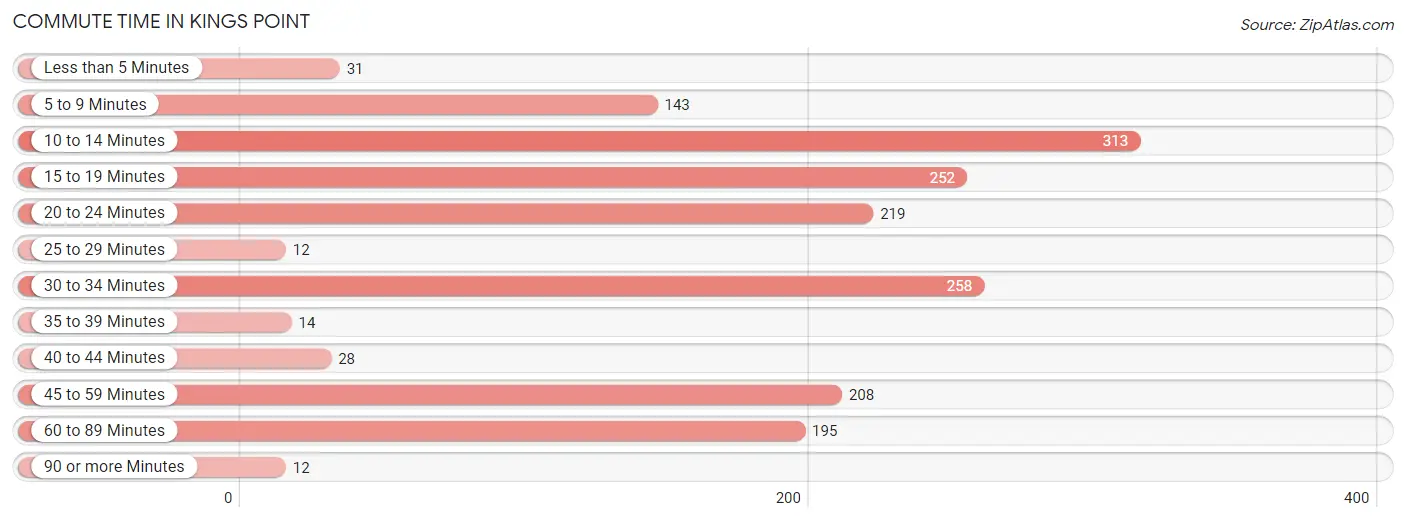
Commute Time in Kings Point
The most frequently occuring commute durations in Kings Point are 10 to 14 minutes (313 commuters, 18.6%), 30 to 34 minutes (258 commuters, 15.3%), and 15 to 19 minutes (252 commuters, 15.0%).
| Commute Time | # Commuters | % Commuters |
| Less than 5 Minutes | 31 | 1.8% |
| 5 to 9 Minutes | 143 | 8.5% |
| 10 to 14 Minutes | 313 | 18.6% |
| 15 to 19 Minutes | 252 | 15.0% |
| 20 to 24 Minutes | 219 | 13.0% |
| 25 to 29 Minutes | 12 | 0.7% |
| 30 to 34 Minutes | 258 | 15.3% |
| 35 to 39 Minutes | 14 | 0.8% |
| 40 to 44 Minutes | 28 | 1.7% |
| 45 to 59 Minutes | 208 | 12.3% |
| 60 to 89 Minutes | 195 | 11.6% |
| 90 or more Minutes | 12 | 0.7% |
Commute Time by Sex in Kings Point
The most common commute times in Kings Point are 10 to 14 minutes (230 commuters, 21.5%) for males and 20 to 24 minutes (136 commuters, 22.2%) for females.
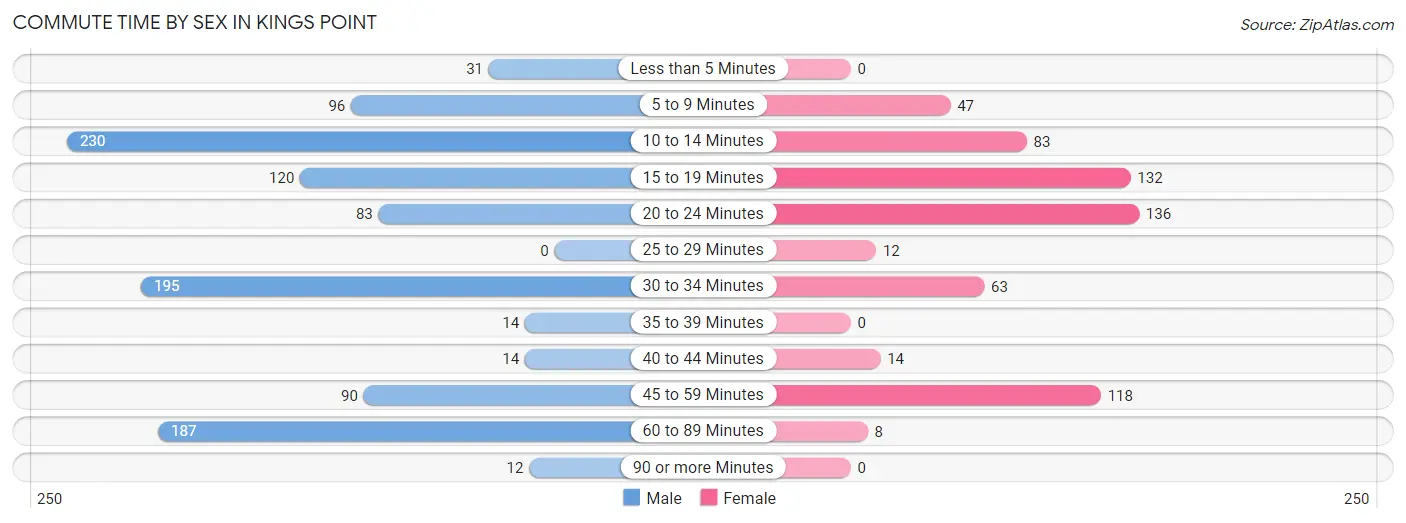
| Commute Time | Male | Female |
| Less than 5 Minutes | 31 (2.9%) | 0 (0.0%) |
| 5 to 9 Minutes | 96 (9.0%) | 47 (7.7%) |
| 10 to 14 Minutes | 230 (21.5%) | 83 (13.5%) |
| 15 to 19 Minutes | 120 (11.2%) | 132 (21.5%) |
| 20 to 24 Minutes | 83 (7.7%) | 136 (22.2%) |
| 25 to 29 Minutes | 0 (0.0%) | 12 (2.0%) |
| 30 to 34 Minutes | 195 (18.2%) | 63 (10.3%) |
| 35 to 39 Minutes | 14 (1.3%) | 0 (0.0%) |
| 40 to 44 Minutes | 14 (1.3%) | 14 (2.3%) |
| 45 to 59 Minutes | 90 (8.4%) | 118 (19.3%) |
| 60 to 89 Minutes | 187 (17.4%) | 8 (1.3%) |
| 90 or more Minutes | 12 (1.1%) | 0 (0.0%) |
Time of Departure to Work by Sex in Kings Point
The most frequent times of departure to work in Kings Point are 9:00 AM to 9:59 AM (323, 30.1%) for males and 9:00 AM to 9:59 AM (189, 30.8%) for females.
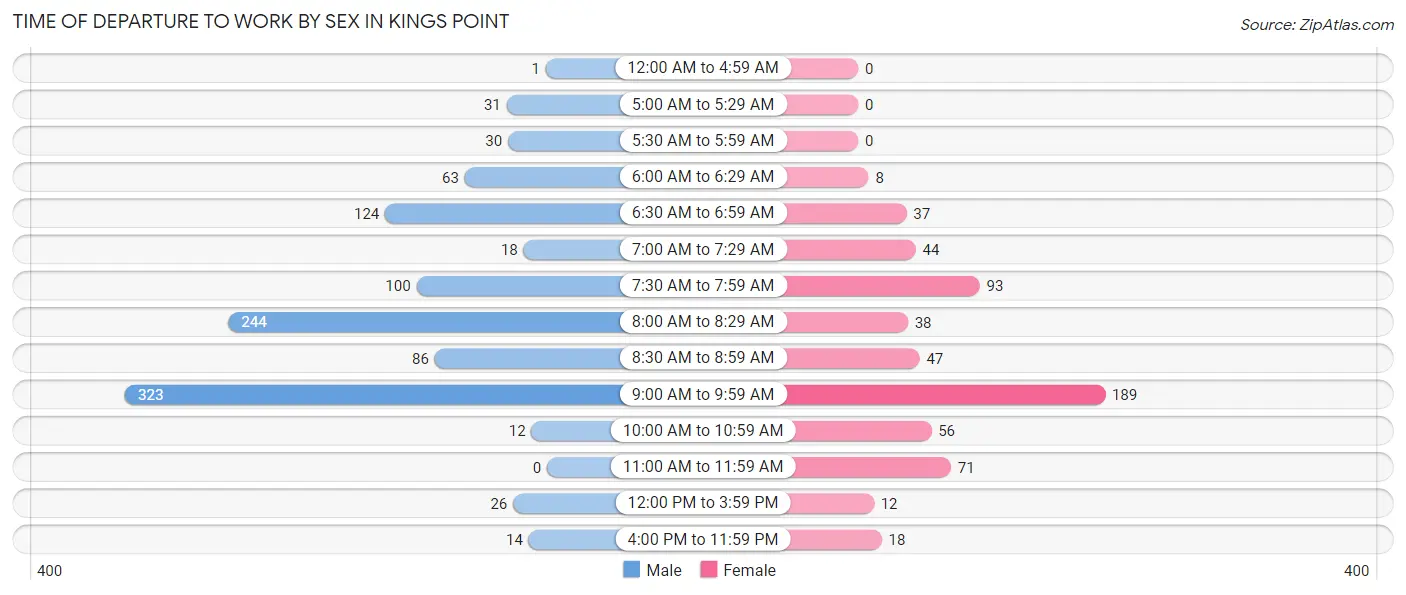
| Time of Departure | Male | Female |
| 12:00 AM to 4:59 AM | 1 (0.1%) | 0 (0.0%) |
| 5:00 AM to 5:29 AM | 31 (2.9%) | 0 (0.0%) |
| 5:30 AM to 5:59 AM | 30 (2.8%) | 0 (0.0%) |
| 6:00 AM to 6:29 AM | 63 (5.9%) | 8 (1.3%) |
| 6:30 AM to 6:59 AM | 124 (11.6%) | 37 (6.0%) |
| 7:00 AM to 7:29 AM | 18 (1.7%) | 44 (7.2%) |
| 7:30 AM to 7:59 AM | 100 (9.3%) | 93 (15.2%) |
| 8:00 AM to 8:29 AM | 244 (22.8%) | 38 (6.2%) |
| 8:30 AM to 8:59 AM | 86 (8.0%) | 47 (7.7%) |
| 9:00 AM to 9:59 AM | 323 (30.1%) | 189 (30.8%) |
| 10:00 AM to 10:59 AM | 12 (1.1%) | 56 (9.1%) |
| 11:00 AM to 11:59 AM | 0 (0.0%) | 71 (11.6%) |
| 12:00 PM to 3:59 PM | 26 (2.4%) | 12 (2.0%) |
| 4:00 PM to 11:59 PM | 14 (1.3%) | 18 (2.9%) |
| Total | 1,072 (100.0%) | 613 (100.0%) |
Housing Occupancy in Kings Point
Occupancy by Ownership in Kings Point
Of the total 1,348 dwellings in Kings Point, owner-occupied units account for 1,290 (95.7%), while renter-occupied units make up 58 (4.3%).
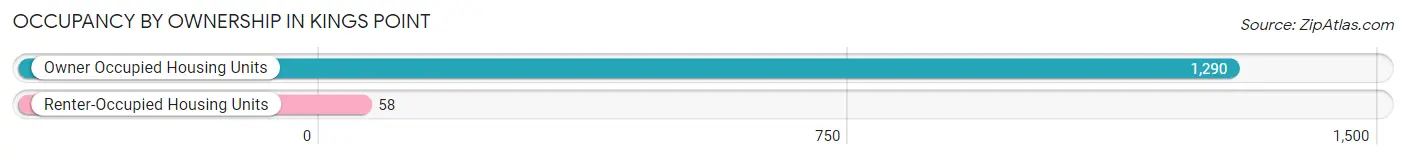
| Occupancy | # Housing Units | % Housing Units |
| Owner Occupied Housing Units | 1,290 | 95.7% |
| Renter-Occupied Housing Units | 58 | 4.3% |
| Total Occupied Housing Units | 1,348 | 100.0% |
Occupancy by Household Size in Kings Point
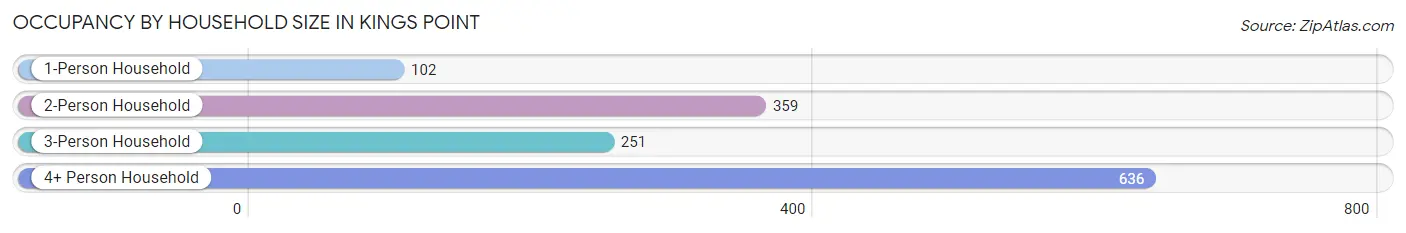
| Household Size | # Housing Units | % Housing Units |
| 1-Person Household | 102 | 7.6% |
| 2-Person Household | 359 | 26.6% |
| 3-Person Household | 251 | 18.6% |
| 4+ Person Household | 636 | 47.2% |
| Total Housing Units | 1,348 | 100.0% |
Occupancy by Ownership by Household Size in Kings Point
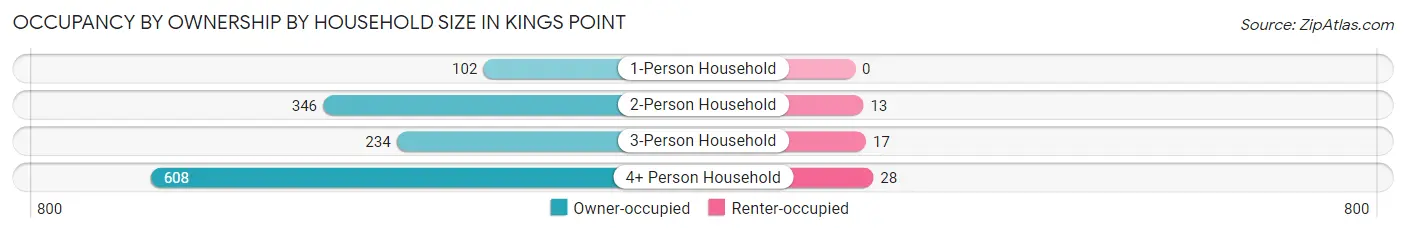
| Household Size | Owner-occupied | Renter-occupied |
| 1-Person Household | 102 (100.0%) | 0 (0.0%) |
| 2-Person Household | 346 (96.4%) | 13 (3.6%) |
| 3-Person Household | 234 (93.2%) | 17 (6.8%) |
| 4+ Person Household | 608 (95.6%) | 28 (4.4%) |
| Total Housing Units | 1,290 (95.7%) | 58 (4.3%) |
Occupancy by Educational Attainment in Kings Point
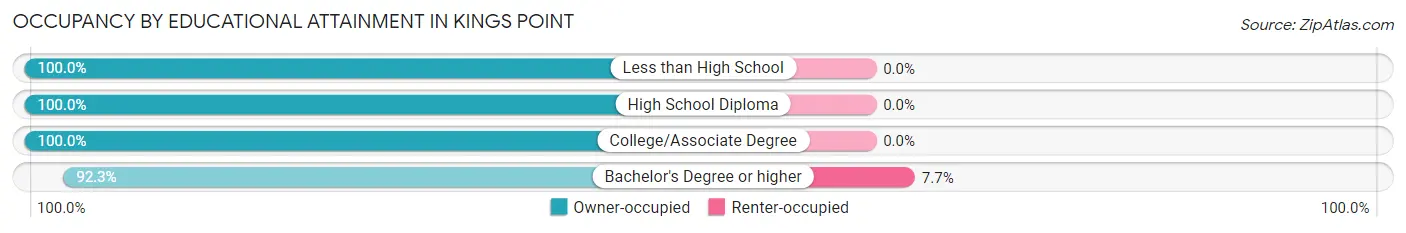
| Household Size | Owner-occupied | Renter-occupied |
| Less than High School | 17 (100.0%) | 0 (0.0%) |
| High School Diploma | 372 (100.0%) | 0 (0.0%) |
| College/Associate Degree | 204 (100.0%) | 0 (0.0%) |
| Bachelor's Degree or higher | 697 (92.3%) | 58 (7.7%) |
Occupancy by Age of Householder in Kings Point
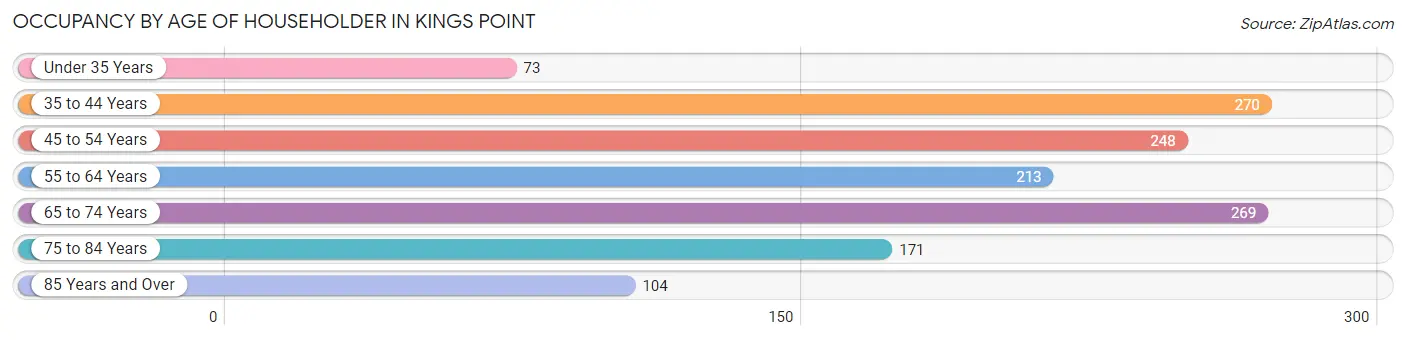
| Age Bracket | # Households | % Households |
| Under 35 Years | 73 | 5.4% |
| 35 to 44 Years | 270 | 20.0% |
| 45 to 54 Years | 248 | 18.4% |
| 55 to 64 Years | 213 | 15.8% |
| 65 to 74 Years | 269 | 20.0% |
| 75 to 84 Years | 171 | 12.7% |
| 85 Years and Over | 104 | 7.7% |
| Total | 1,348 | 100.0% |
Housing Finances in Kings Point
Median Income by Occupancy in Kings Point
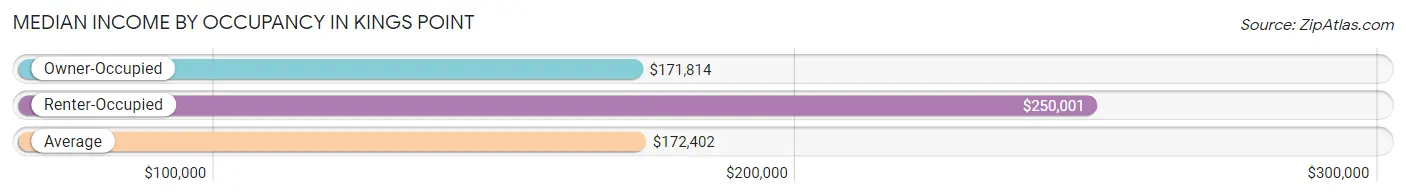
| Occupancy Type | # Households | Median Income |
| Owner-Occupied | 1,290 (95.7%) | $171,814 |
| Renter-Occupied | 58 (4.3%) | $250,001 |
| Average | 1,348 (100.0%) | $172,402 |
Occupancy by Householder Income Bracket in Kings Point
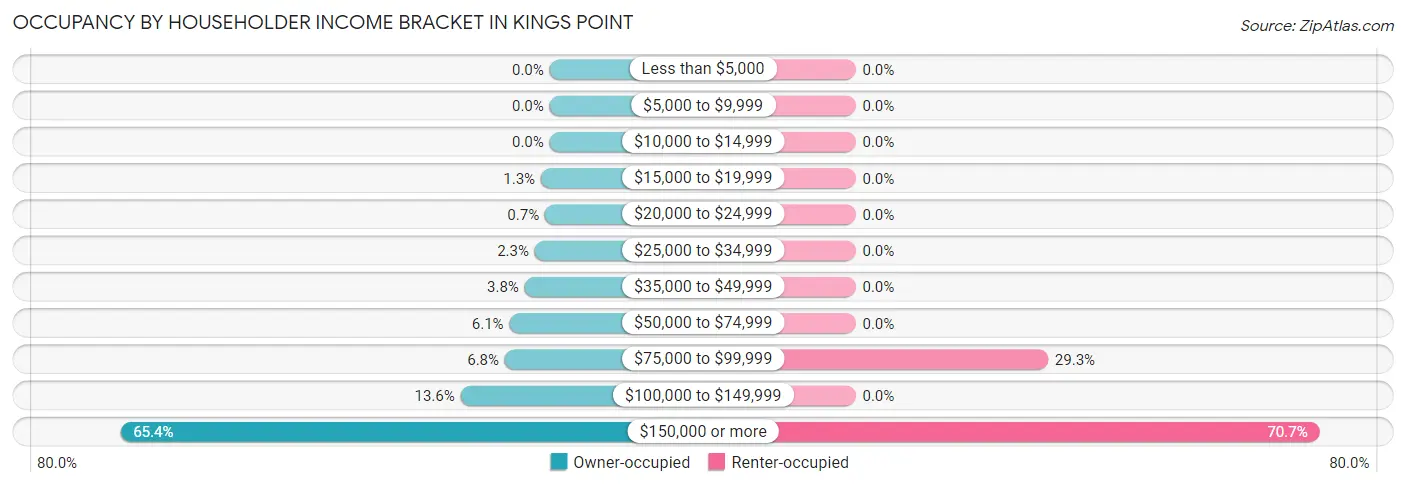
| Income Bracket | Owner-occupied | Renter-occupied |
| Less than $5,000 | 0 (0.0%) | 0 (0.0%) |
| $5,000 to $9,999 | 0 (0.0%) | 0 (0.0%) |
| $10,000 to $14,999 | 0 (0.0%) | 0 (0.0%) |
| $15,000 to $19,999 | 17 (1.3%) | 0 (0.0%) |
| $20,000 to $24,999 | 9 (0.7%) | 0 (0.0%) |
| $25,000 to $34,999 | 29 (2.2%) | 0 (0.0%) |
| $35,000 to $49,999 | 49 (3.8%) | 0 (0.0%) |
| $50,000 to $74,999 | 79 (6.1%) | 0 (0.0%) |
| $75,000 to $99,999 | 88 (6.8%) | 17 (29.3%) |
| $100,000 to $149,999 | 175 (13.6%) | 0 (0.0%) |
| $150,000 or more | 844 (65.4%) | 41 (70.7%) |
| Total | 1,290 (100.0%) | 58 (100.0%) |
Monthly Housing Cost Tiers in Kings Point
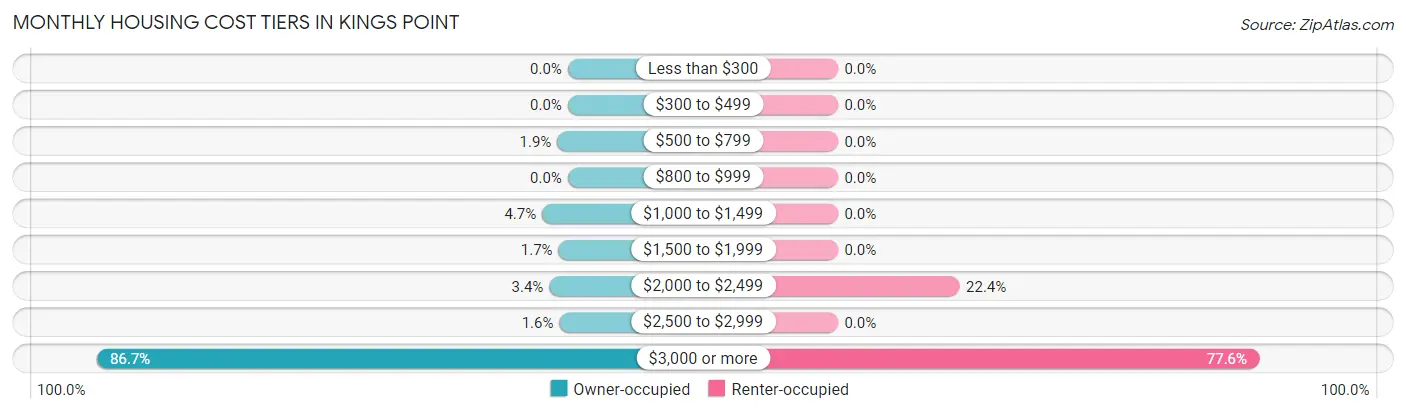
| Monthly Cost | Owner-occupied | Renter-occupied |
| Less than $300 | 0 (0.0%) | 0 (0.0%) |
| $300 to $499 | 0 (0.0%) | 0 (0.0%) |
| $500 to $799 | 25 (1.9%) | 0 (0.0%) |
| $800 to $999 | 0 (0.0%) | 0 (0.0%) |
| $1,000 to $1,499 | 61 (4.7%) | 0 (0.0%) |
| $1,500 to $1,999 | 22 (1.7%) | 0 (0.0%) |
| $2,000 to $2,499 | 44 (3.4%) | 13 (22.4%) |
| $2,500 to $2,999 | 20 (1.5%) | 0 (0.0%) |
| $3,000 or more | 1,118 (86.7%) | 45 (77.6%) |
| Total | 1,290 (100.0%) | 58 (100.0%) |
Physical Housing Characteristics in Kings Point
Housing Structures in Kings Point
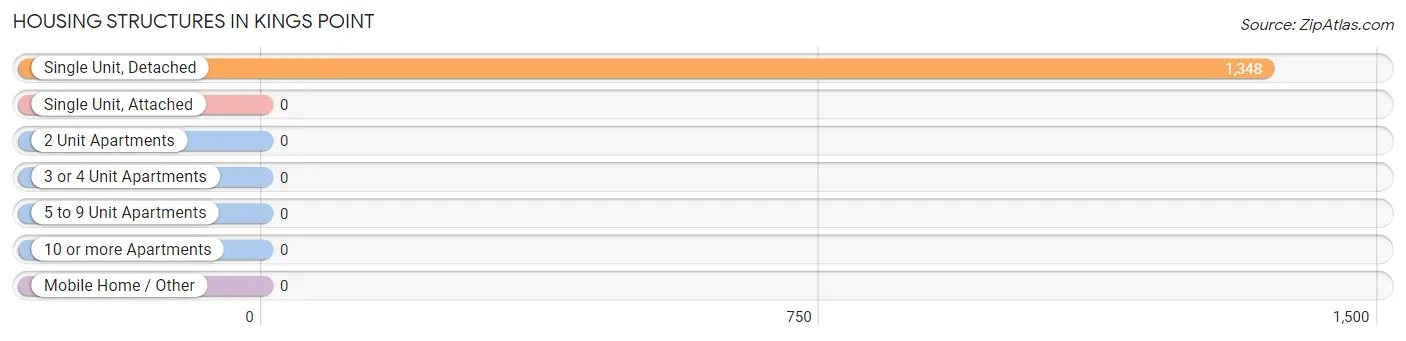
| Structure Type | # Housing Units | % Housing Units |
| Single Unit, Detached | 1,348 | 100.0% |
| Single Unit, Attached | 0 | 0.0% |
| 2 Unit Apartments | 0 | 0.0% |
| 3 or 4 Unit Apartments | 0 | 0.0% |
| 5 to 9 Unit Apartments | 0 | 0.0% |
| 10 or more Apartments | 0 | 0.0% |
| Mobile Home / Other | 0 | 0.0% |
| Total | 1,348 | 100.0% |
Housing Structures by Occupancy in Kings Point
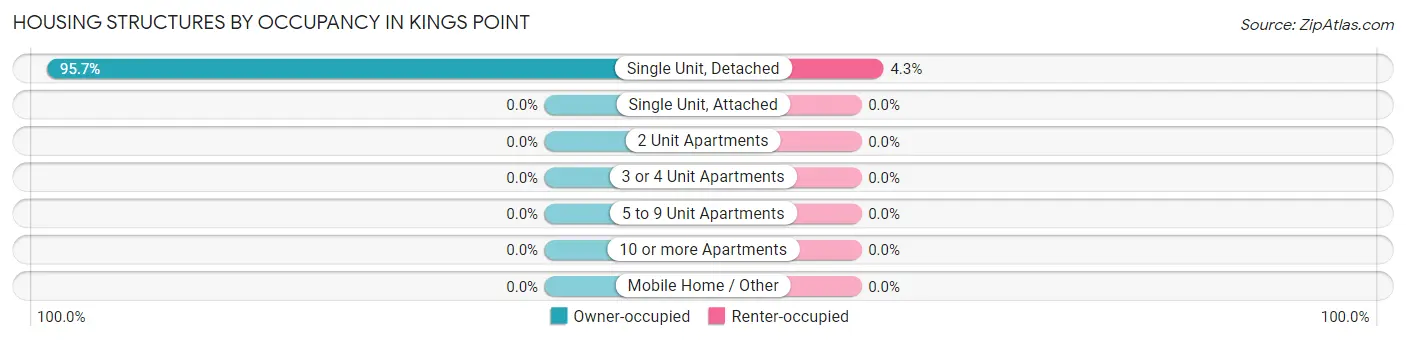
| Structure Type | Owner-occupied | Renter-occupied |
| Single Unit, Detached | 1,290 (95.7%) | 58 (4.3%) |
| Single Unit, Attached | 0 (0.0%) | 0 (0.0%) |
| 2 Unit Apartments | 0 (0.0%) | 0 (0.0%) |
| 3 or 4 Unit Apartments | 0 (0.0%) | 0 (0.0%) |
| 5 to 9 Unit Apartments | 0 (0.0%) | 0 (0.0%) |
| 10 or more Apartments | 0 (0.0%) | 0 (0.0%) |
| Mobile Home / Other | 0 (0.0%) | 0 (0.0%) |
| Total | 1,290 (95.7%) | 58 (4.3%) |
Housing Structures by Number of Rooms in Kings Point
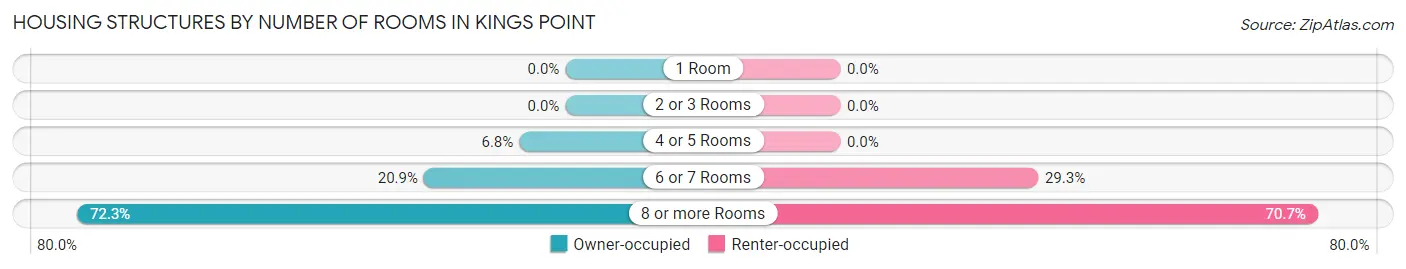
| Number of Rooms | Owner-occupied | Renter-occupied |
| 1 Room | 0 (0.0%) | 0 (0.0%) |
| 2 or 3 Rooms | 0 (0.0%) | 0 (0.0%) |
| 4 or 5 Rooms | 88 (6.8%) | 0 (0.0%) |
| 6 or 7 Rooms | 270 (20.9%) | 17 (29.3%) |
| 8 or more Rooms | 932 (72.3%) | 41 (70.7%) |
| Total | 1,290 (100.0%) | 58 (100.0%) |
Housing Structure by Heating Type in Kings Point
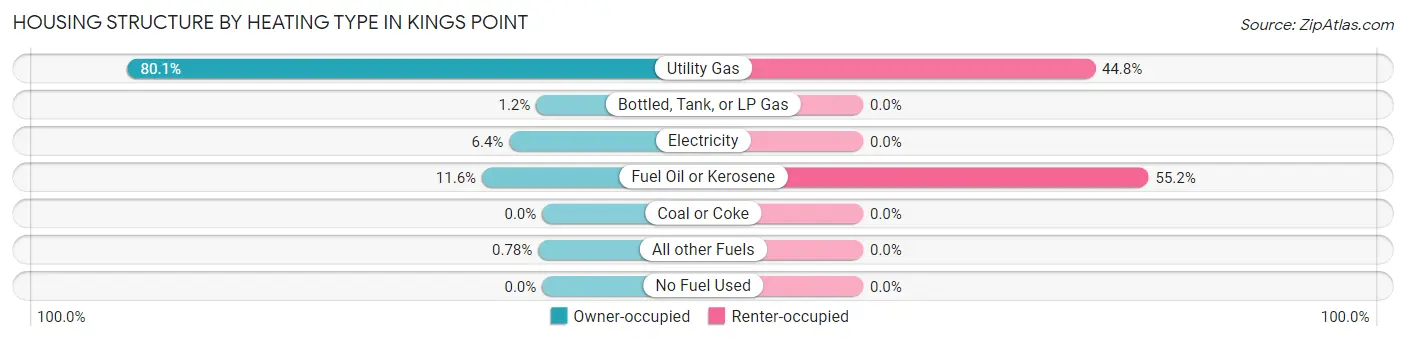
| Heating Type | Owner-occupied | Renter-occupied |
| Utility Gas | 1,033 (80.1%) | 26 (44.8%) |
| Bottled, Tank, or LP Gas | 15 (1.2%) | 0 (0.0%) |
| Electricity | 82 (6.4%) | 0 (0.0%) |
| Fuel Oil or Kerosene | 150 (11.6%) | 32 (55.2%) |
| Coal or Coke | 0 (0.0%) | 0 (0.0%) |
| All other Fuels | 10 (0.8%) | 0 (0.0%) |
| No Fuel Used | 0 (0.0%) | 0 (0.0%) |
| Total | 1,290 (100.0%) | 58 (100.0%) |
Household Vehicle Usage in Kings Point
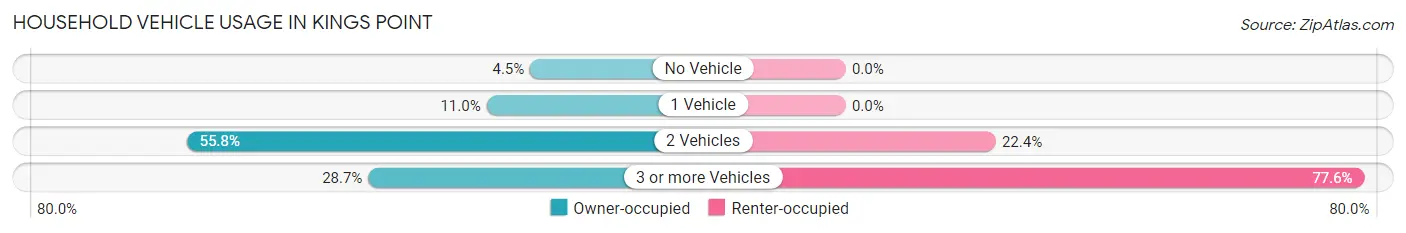
| Vehicles per Household | Owner-occupied | Renter-occupied |
| No Vehicle | 58 (4.5%) | 0 (0.0%) |
| 1 Vehicle | 142 (11.0%) | 0 (0.0%) |
| 2 Vehicles | 720 (55.8%) | 13 (22.4%) |
| 3 or more Vehicles | 370 (28.7%) | 45 (77.6%) |
| Total | 1,290 (100.0%) | 58 (100.0%) |
Real Estate & Mortgages in Kings Point
Real Estate and Mortgage Overview in Kings Point
| Characteristic | Without Mortgage | With Mortgage |
| Housing Units | 633 | 657 |
| Median Property Value | $2,000,001 | $1,944,300 |
| Median Household Income | $164,321 | $454 |
| Monthly Housing Costs | $1,501 | $635 |
| Real Estate Taxes | $10,001 | $0 |
Property Value by Mortgage Status in Kings Point
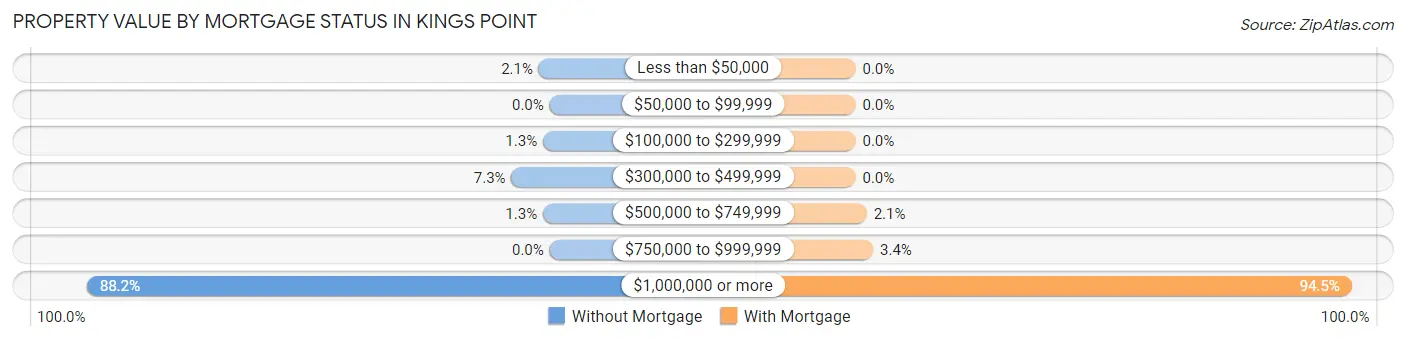
| Property Value | Without Mortgage | With Mortgage |
| Less than $50,000 | 13 (2.1%) | 0 (0.0%) |
| $50,000 to $99,999 | 0 (0.0%) | 0 (0.0%) |
| $100,000 to $299,999 | 8 (1.3%) | 0 (0.0%) |
| $300,000 to $499,999 | 46 (7.3%) | 0 (0.0%) |
| $500,000 to $749,999 | 8 (1.3%) | 14 (2.1%) |
| $750,000 to $999,999 | 0 (0.0%) | 22 (3.4%) |
| $1,000,000 or more | 558 (88.1%) | 621 (94.5%) |
| Total | 633 (100.0%) | 657 (100.0%) |
Household Income by Mortgage Status in Kings Point
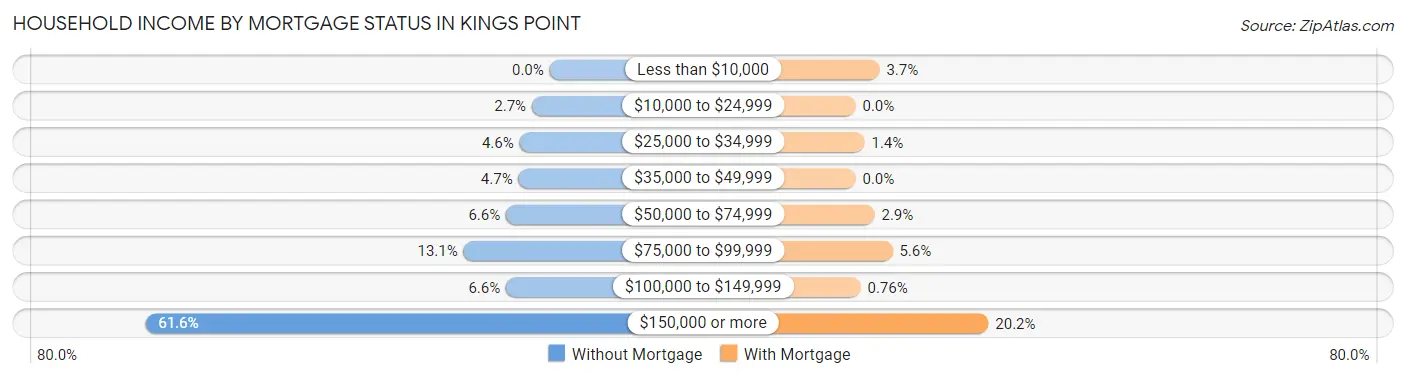
| Household Income | Without Mortgage | With Mortgage |
| Less than $10,000 | 0 (0.0%) | 24 (3.6%) |
| $10,000 to $24,999 | 17 (2.7%) | 0 (0.0%) |
| $25,000 to $34,999 | 29 (4.6%) | 9 (1.4%) |
| $35,000 to $49,999 | 30 (4.7%) | 0 (0.0%) |
| $50,000 to $74,999 | 42 (6.6%) | 19 (2.9%) |
| $75,000 to $99,999 | 83 (13.1%) | 37 (5.6%) |
| $100,000 to $149,999 | 42 (6.6%) | 5 (0.8%) |
| $150,000 or more | 390 (61.6%) | 133 (20.2%) |
| Total | 633 (100.0%) | 657 (100.0%) |
Property Value to Household Income Ratio in Kings Point
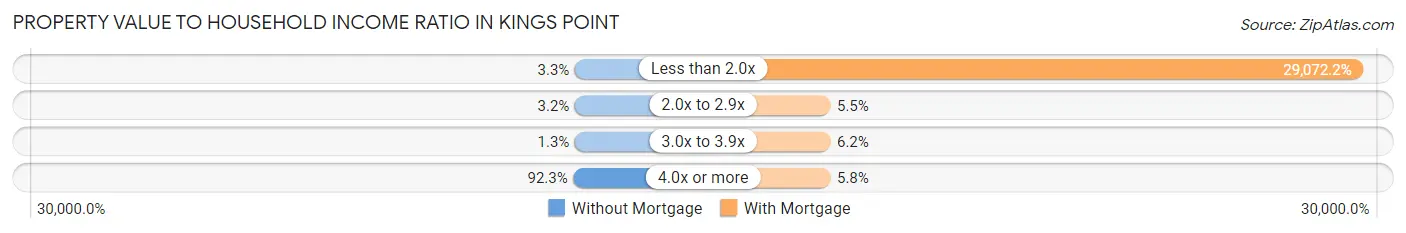
| Value-to-Income Ratio | Without Mortgage | With Mortgage |
| Less than 2.0x | 21 (3.3%) | 191,004 (29,072.1%) |
| 2.0x to 2.9x | 20 (3.2%) | 36 (5.5%) |
| 3.0x to 3.9x | 8 (1.3%) | 41 (6.2%) |
| 4.0x or more | 584 (92.3%) | 38 (5.8%) |
| Total | 633 (100.0%) | 657 (100.0%) |
Real Estate Taxes by Mortgage Status in Kings Point
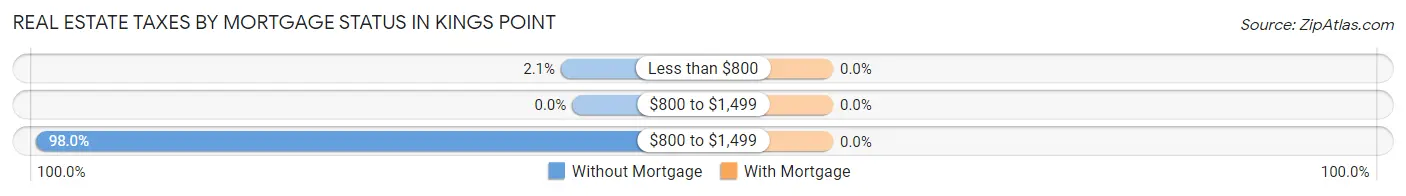
| Property Taxes | Without Mortgage | With Mortgage |
| Less than $800 | 13 (2.1%) | 0 (0.0%) |
| $800 to $1,499 | 0 (0.0%) | 0 (0.0%) |
| $800 to $1,499 | 620 (98.0%) | 0 (0.0%) |
| Total | 633 (100.0%) | 657 (100.0%) |
Health & Disability in Kings Point
Health Insurance Coverage by Age in Kings Point
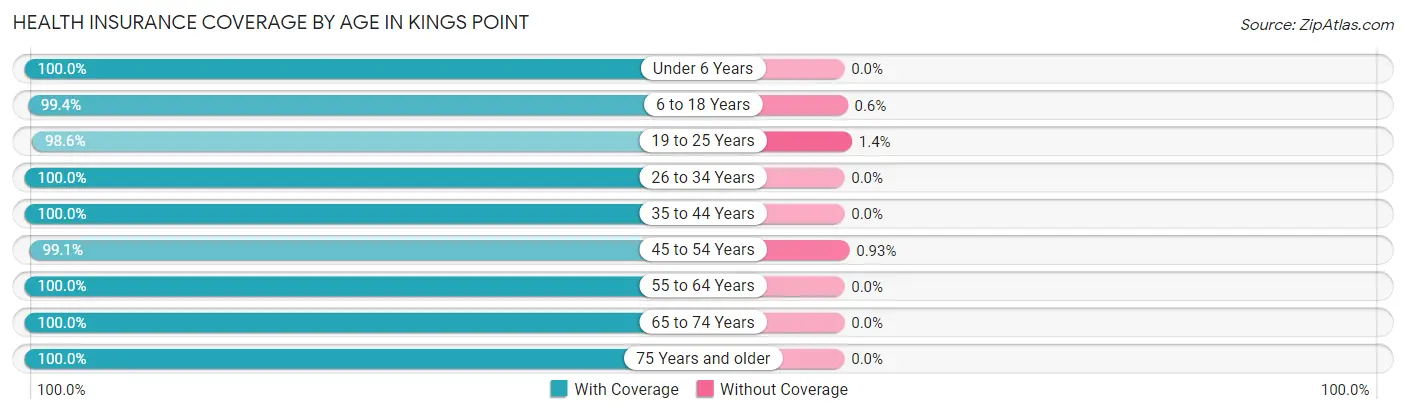
| Age Bracket | With Coverage | Without Coverage |
| Under 6 Years | 277 (100.0%) | 0 (0.0%) |
| 6 to 18 Years | 1,480 (99.4%) | 9 (0.6%) |
| 19 to 25 Years | 559 (98.6%) | 8 (1.4%) |
| 26 to 34 Years | 600 (100.0%) | 0 (0.0%) |
| 35 to 44 Years | 443 (100.0%) | 0 (0.0%) |
| 45 to 54 Years | 427 (99.1%) | 4 (0.9%) |
| 55 to 64 Years | 544 (100.0%) | 0 (0.0%) |
| 65 to 74 Years | 488 (100.0%) | 0 (0.0%) |
| 75 Years and older | 452 (100.0%) | 0 (0.0%) |
| Total | 5,270 (99.6%) | 21 (0.4%) |
Health Insurance Coverage by Citizenship Status in Kings Point
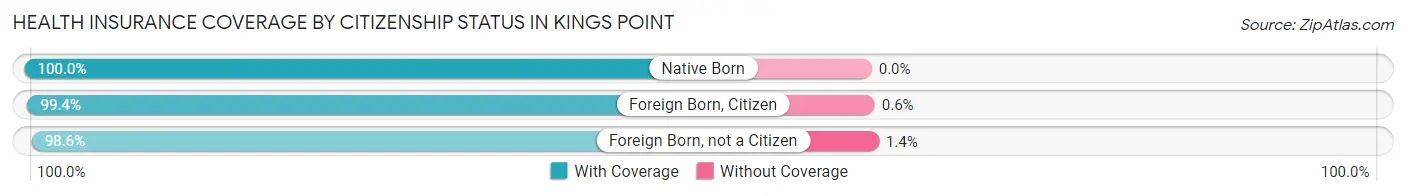
| Citizenship Status | With Coverage | Without Coverage |
| Native Born | 277 (100.0%) | 0 (0.0%) |
| Foreign Born, Citizen | 1,480 (99.4%) | 9 (0.6%) |
| Foreign Born, not a Citizen | 559 (98.6%) | 8 (1.4%) |
Health Insurance Coverage by Household Income in Kings Point
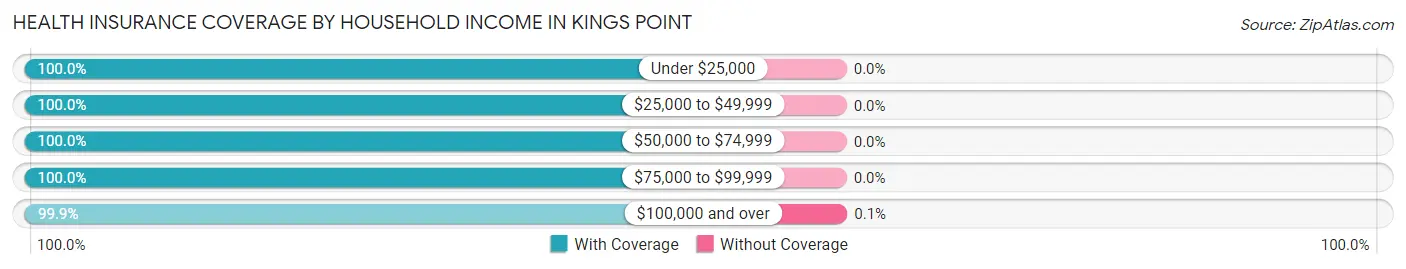
| Household Income | With Coverage | Without Coverage |
| Under $25,000 | 35 (100.0%) | 0 (0.0%) |
| $25,000 to $49,999 | 117 (100.0%) | 0 (0.0%) |
| $50,000 to $74,999 | 236 (100.0%) | 0 (0.0%) |
| $75,000 to $99,999 | 532 (100.0%) | 0 (0.0%) |
| $100,000 and over | 4,046 (99.9%) | 4 (0.1%) |
Public vs Private Health Insurance Coverage by Age in Kings Point
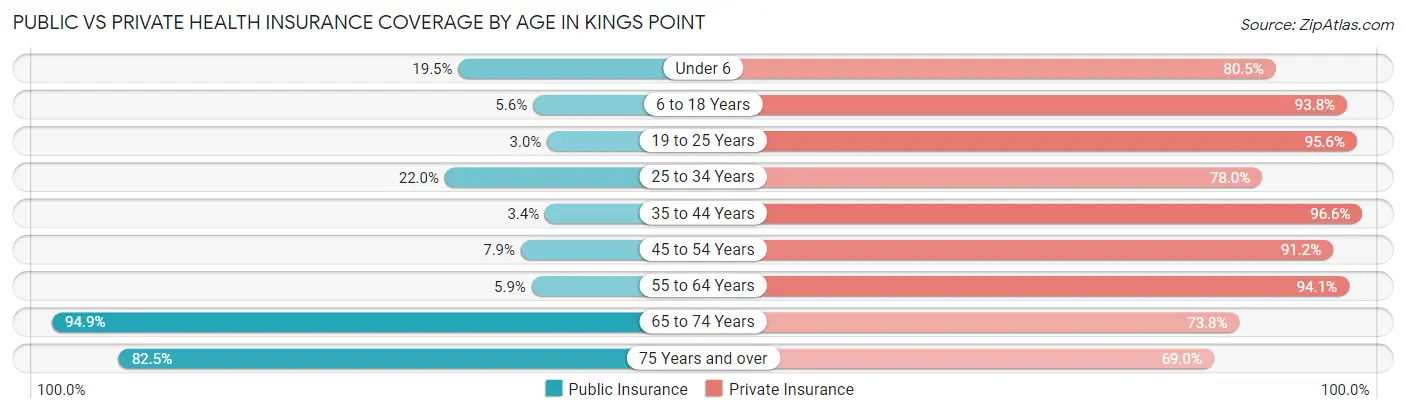
| Age Bracket | Public Insurance | Private Insurance |
| Under 6 | 54 (19.5%) | 223 (80.5%) |
| 6 to 18 Years | 84 (5.6%) | 1,396 (93.8%) |
| 19 to 25 Years | 17 (3.0%) | 542 (95.6%) |
| 25 to 34 Years | 132 (22.0%) | 468 (78.0%) |
| 35 to 44 Years | 15 (3.4%) | 428 (96.6%) |
| 45 to 54 Years | 34 (7.9%) | 393 (91.2%) |
| 55 to 64 Years | 32 (5.9%) | 512 (94.1%) |
| 65 to 74 Years | 463 (94.9%) | 360 (73.8%) |
| 75 Years and over | 373 (82.5%) | 312 (69.0%) |
| Total | 1,204 (22.8%) | 4,634 (87.6%) |
Disability Status by Sex by Age in Kings Point
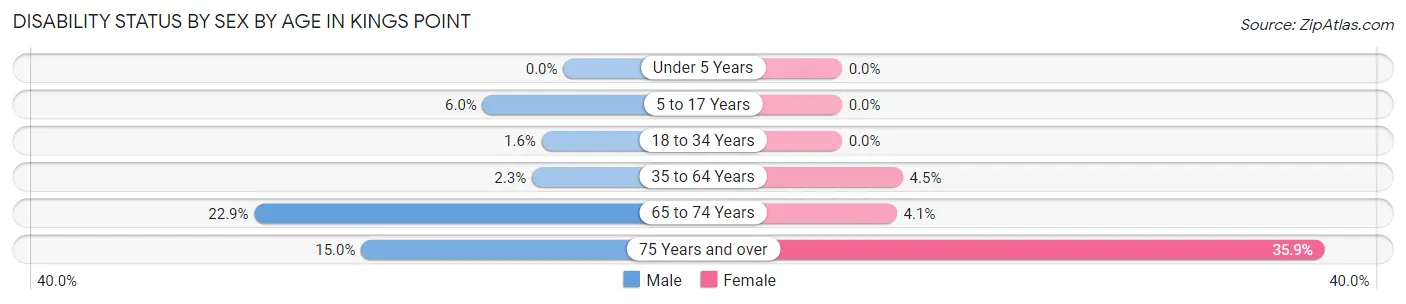
| Age Bracket | Male | Female |
| Under 5 Years | 0 (0.0%) | 0 (0.0%) |
| 5 to 17 Years | 54 (6.0%) | 0 (0.0%) |
| 18 to 34 Years | 14 (1.6%) | 0 (0.0%) |
| 35 to 64 Years | 15 (2.3%) | 35 (4.5%) |
| 65 to 74 Years | 50 (22.9%) | 11 (4.1%) |
| 75 Years and over | 36 (15.0%) | 76 (35.8%) |
Disability Class by Sex by Age in Kings Point
Disability Class: Hearing Difficulty
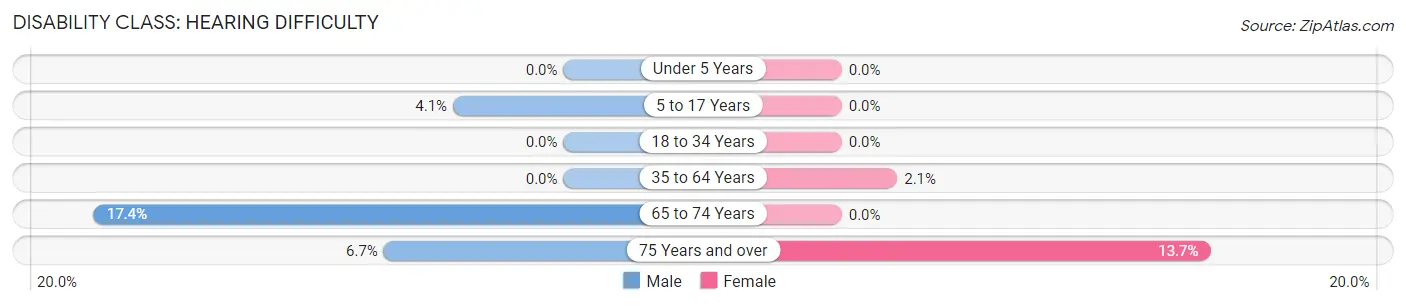
| Age Bracket | Male | Female |
| Under 5 Years | 0 (0.0%) | 0 (0.0%) |
| 5 to 17 Years | 37 (4.1%) | 0 (0.0%) |
| 18 to 34 Years | 0 (0.0%) | 0 (0.0%) |
| 35 to 64 Years | 0 (0.0%) | 16 (2.1%) |
| 65 to 74 Years | 38 (17.4%) | 0 (0.0%) |
| 75 Years and over | 16 (6.7%) | 29 (13.7%) |
Disability Class: Vision Difficulty
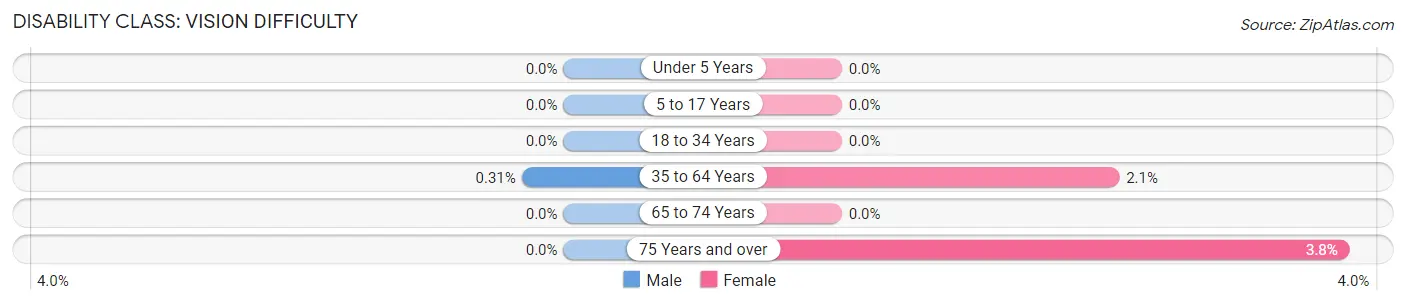
| Age Bracket | Male | Female |
| Under 5 Years | 0 (0.0%) | 0 (0.0%) |
| 5 to 17 Years | 0 (0.0%) | 0 (0.0%) |
| 18 to 34 Years | 0 (0.0%) | 0 (0.0%) |
| 35 to 64 Years | 2 (0.3%) | 16 (2.1%) |
| 65 to 74 Years | 0 (0.0%) | 0 (0.0%) |
| 75 Years and over | 0 (0.0%) | 8 (3.8%) |
Disability Class: Cognitive Difficulty
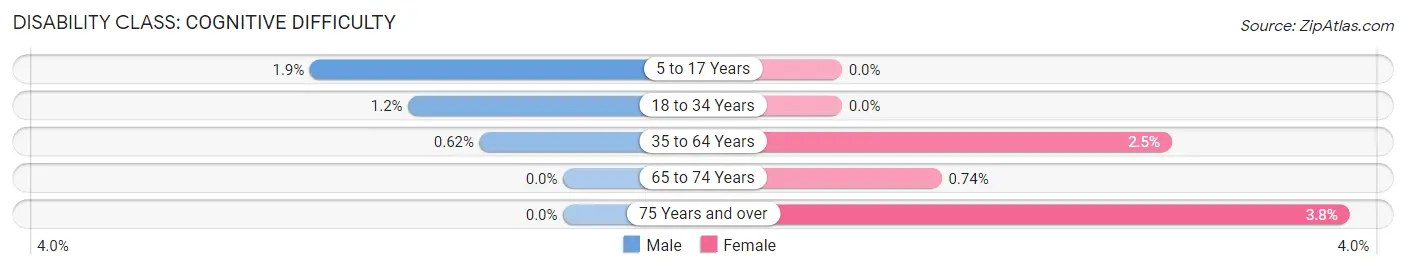
| Age Bracket | Male | Female |
| 5 to 17 Years | 17 (1.9%) | 0 (0.0%) |
| 18 to 34 Years | 10 (1.1%) | 0 (0.0%) |
| 35 to 64 Years | 4 (0.6%) | 19 (2.5%) |
| 65 to 74 Years | 0 (0.0%) | 2 (0.7%) |
| 75 Years and over | 0 (0.0%) | 8 (3.8%) |
Disability Class: Ambulatory Difficulty
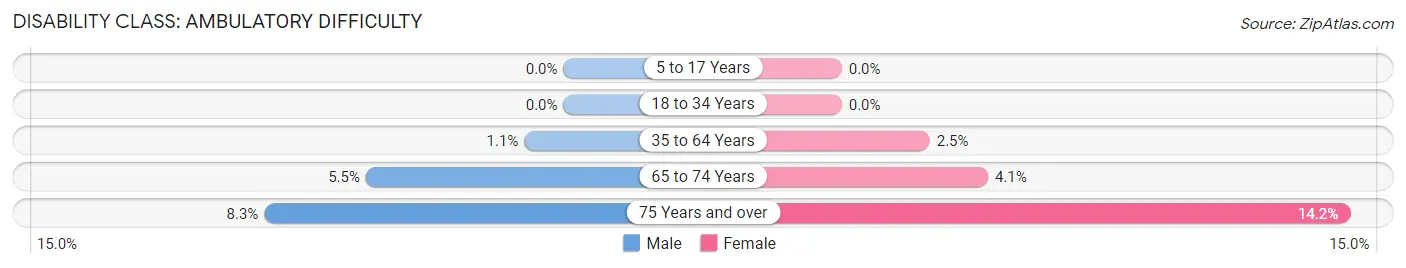
| Age Bracket | Male | Female |
| 5 to 17 Years | 0 (0.0%) | 0 (0.0%) |
| 18 to 34 Years | 0 (0.0%) | 0 (0.0%) |
| 35 to 64 Years | 7 (1.1%) | 19 (2.5%) |
| 65 to 74 Years | 12 (5.5%) | 11 (4.1%) |
| 75 Years and over | 20 (8.3%) | 30 (14.1%) |
Disability Class: Self-Care Difficulty
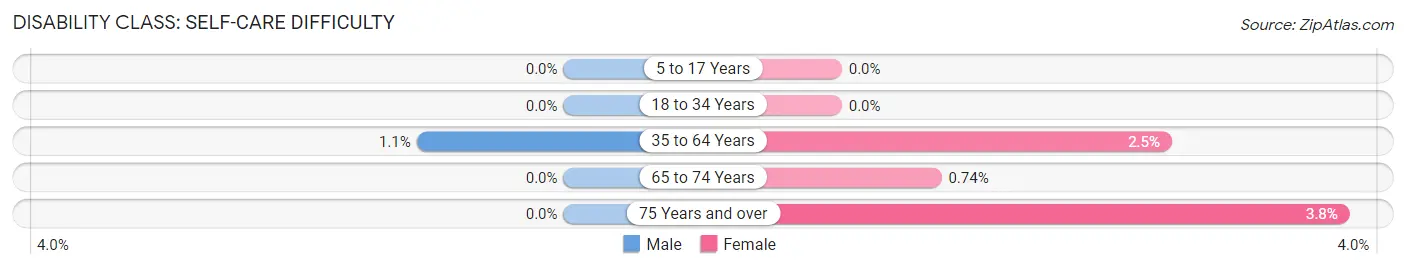
| Age Bracket | Male | Female |
| 5 to 17 Years | 0 (0.0%) | 0 (0.0%) |
| 18 to 34 Years | 0 (0.0%) | 0 (0.0%) |
| 35 to 64 Years | 7 (1.1%) | 19 (2.5%) |
| 65 to 74 Years | 0 (0.0%) | 2 (0.7%) |
| 75 Years and over | 0 (0.0%) | 8 (3.8%) |
Technology Access in Kings Point
Computing Device Access in Kings Point
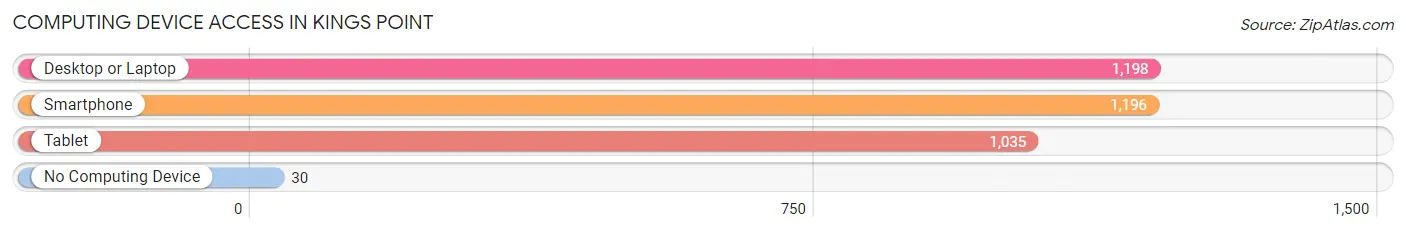
| Device Type | # Households | % Households |
| Desktop or Laptop | 1,198 | 88.9% |
| Smartphone | 1,196 | 88.7% |
| Tablet | 1,035 | 76.8% |
| No Computing Device | 30 | 2.2% |
| Total | 1,348 | 100.0% |
Internet Access in Kings Point
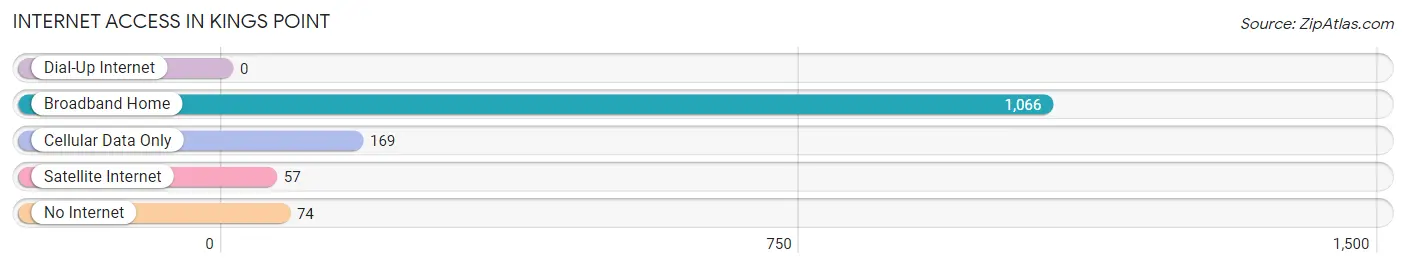
| Internet Type | # Households | % Households |
| Dial-Up Internet | 0 | 0.0% |
| Broadband Home | 1,066 | 79.1% |
| Cellular Data Only | 169 | 12.5% |
| Satellite Internet | 57 | 4.2% |
| No Internet | 74 | 5.5% |
| Total | 1,348 | 100.0% |
Kings Point Summary
History
Kings Point, New York is a small village located in the Town of North Hempstead in Nassau County, New York. It is situated on the north shore of Long Island, approximately 25 miles east of Manhattan. The village was incorporated in 1910 and is home to the United States Merchant Marine Academy, which was established in 1943.
The area that is now Kings Point was originally inhabited by the Matinecock Native American tribe. The first European settlers arrived in the area in the 1640s, and the area was known as "Cow Neck" due to the abundance of cattle in the area. In the late 1700s, the area was renamed "Great Neck" and the village of Kings Point was established in 1843.
The village of Kings Point was originally a farming community, but it began to develop into a residential community in the late 19th century. The village was incorporated in 1910 and the population grew steadily throughout the 20th century.
Geography
Kings Point is located on the north shore of Long Island, approximately 25 miles east of Manhattan. The village is bordered by the villages of Great Neck and Great Neck Estates to the west, and the village of Sands Point to the east. The village is situated on a peninsula that juts out into the Long Island Sound.
The village has a total area of 1.2 square miles, all of which is land. The terrain is mostly flat, with some hills in the northern part of the village. The highest point in the village is located at an elevation of approximately 100 feet.
Economy
The economy of Kings Point is largely driven by the United States Merchant Marine Academy, which is located in the village. The academy is a federal service academy that educates and trains students to become officers in the United States Merchant Marine. The academy employs a large number of faculty and staff, and it also provides a number of services to the local community.
In addition to the academy, the village is home to a number of small businesses, including restaurants, retail stores, and professional services. The village also has a number of marinas, which provide services to recreational boaters.
Demographics
As of the 2010 census, the village of Kings Point had a population of 5,005. The population is predominantly white (94.3%), with small percentages of African American (2.2%), Asian (1.7%), and Hispanic or Latino (1.3%) residents. The median household income is $125,000, and the median home value is $1,000,000.
The village is home to a large number of retired residents, as well as a number of students from the United States Merchant Marine Academy. The village also has a large number of commuters, as it is located close to New York City.
Common Questions
What is Per Capita Income in Kings Point?
Per Capita income in Kings Point is $68,570.
What is the Median Family Income in Kings Point?
Median Family Income in Kings Point is $189,125.
What is the Median Household income in Kings Point?
Median Household Income in Kings Point is $172,402.
What is Income or Wage Gap in Kings Point?
Income or Wage Gap in Kings Point is 9.6%.
Women in Kings Point earn 90.4 cents for every dollar earned by a man.
What is Inequality or Gini Index in Kings Point?
Inequality or Gini Index in Kings Point is 0.46.
What is the Total Population of Kings Point?
Total Population of Kings Point is 5,593.
What is the Total Male Population of Kings Point?
Total Male Population of Kings Point is 3,272.
What is the Total Female Population of Kings Point?
Total Female Population of Kings Point is 2,321.
What is the Ratio of Males per 100 Females in Kings Point?
There are 140.97 Males per 100 Females in Kings Point.
What is the Ratio of Females per 100 Males in Kings Point?
There are 70.94 Females per 100 Males in Kings Point.
What is the Median Population Age in Kings Point?
Median Population Age in Kings Point is 29.4 Years.
What is the Average Family Size in Kings Point
Average Family Size in Kings Point is 3.8 People.
What is the Average Household Size in Kings Point
Average Household Size in Kings Point is 3.7 People.
How Large is the Labor Force in Kings Point?
There are 2,265 People in the Labor Forcein in Kings Point.
What is the Percentage of People in the Labor Force in Kings Point?
54.1% of People are in the Labor Force in Kings Point.
What is the Unemployment Rate in Kings Point?
Unemployment Rate in Kings Point is 2.2%.