Upper Brookville, NY Map & Demographics
Upper Brookville Map
Upper Brookville Overview
$111,325
PER CAPITA INCOME
$229,271
AVG FAMILY INCOME
$229,375
AVG HOUSEHOLD INCOME
25.4%
WAGE / INCOME GAP [ % ]
74.6¢/ $1
WAGE / INCOME GAP [ $ ]
$8,425
FAMILY INCOME DEFICIT
0.45
INEQUALITY / GINI INDEX
1,880
TOTAL POPULATION
881
MALE POPULATION
999
FEMALE POPULATION
88.19
MALES / 100 FEMALES
113.39
FEMALES / 100 MALES
52.0
MEDIAN AGE
3.2
AVG FAMILY SIZE
3.0
AVG HOUSEHOLD SIZE
1,013
LABOR FORCE [ PEOPLE ]
63.1%
PERCENT IN LABOR FORCE
4.7%
UNEMPLOYMENT RATE
Income in Upper Brookville
Income Overview in Upper Brookville
Per Capita Income in Upper Brookville is $111,325, while median incomes of families and households are $229,271 and $229,375 respectively.
| Characteristic | Number | Measure |
| Per Capita Income | 1,880 | $111,325 |
| Median Family Income | 568 | $229,271 |
| Mean Family Income | 568 | $328,036 |
| Median Household Income | 616 | $229,375 |
| Mean Household Income | 616 | $329,790 |
| Income Deficit | 568 | $8,425 |
| Wage / Income Gap (%) | 1,880 | 25.43% |
| Wage / Income Gap ($) | 1,880 | 74.57¢ per $1 |
| Gini / Inequality Index | 1,880 | 0.45 |
Earnings by Sex in Upper Brookville
Average Earnings in Upper Brookville are $108,393, $113,561 for men and $84,688 for women, a difference of 25.4%.
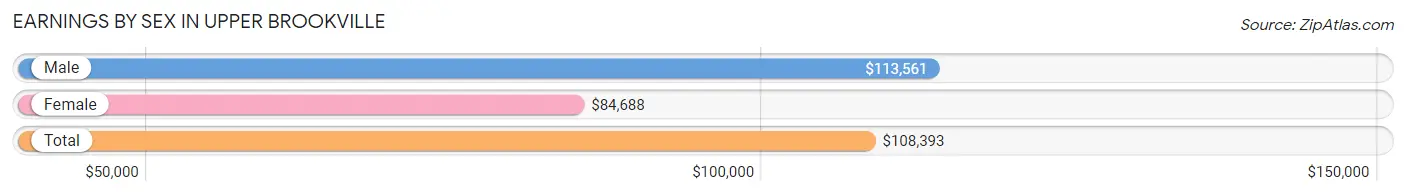
| Sex | Number | Average Earnings |
| Male | 572 (55.8%) | $113,561 |
| Female | 453 (44.2%) | $84,688 |
| Total | 1,025 (100.0%) | $108,393 |
Earnings by Sex by Income Bracket in Upper Brookville
The most common earnings brackets in Upper Brookville are $100,000+ for men (392 | 68.5%) and $100,000+ for women (216 | 47.7%).
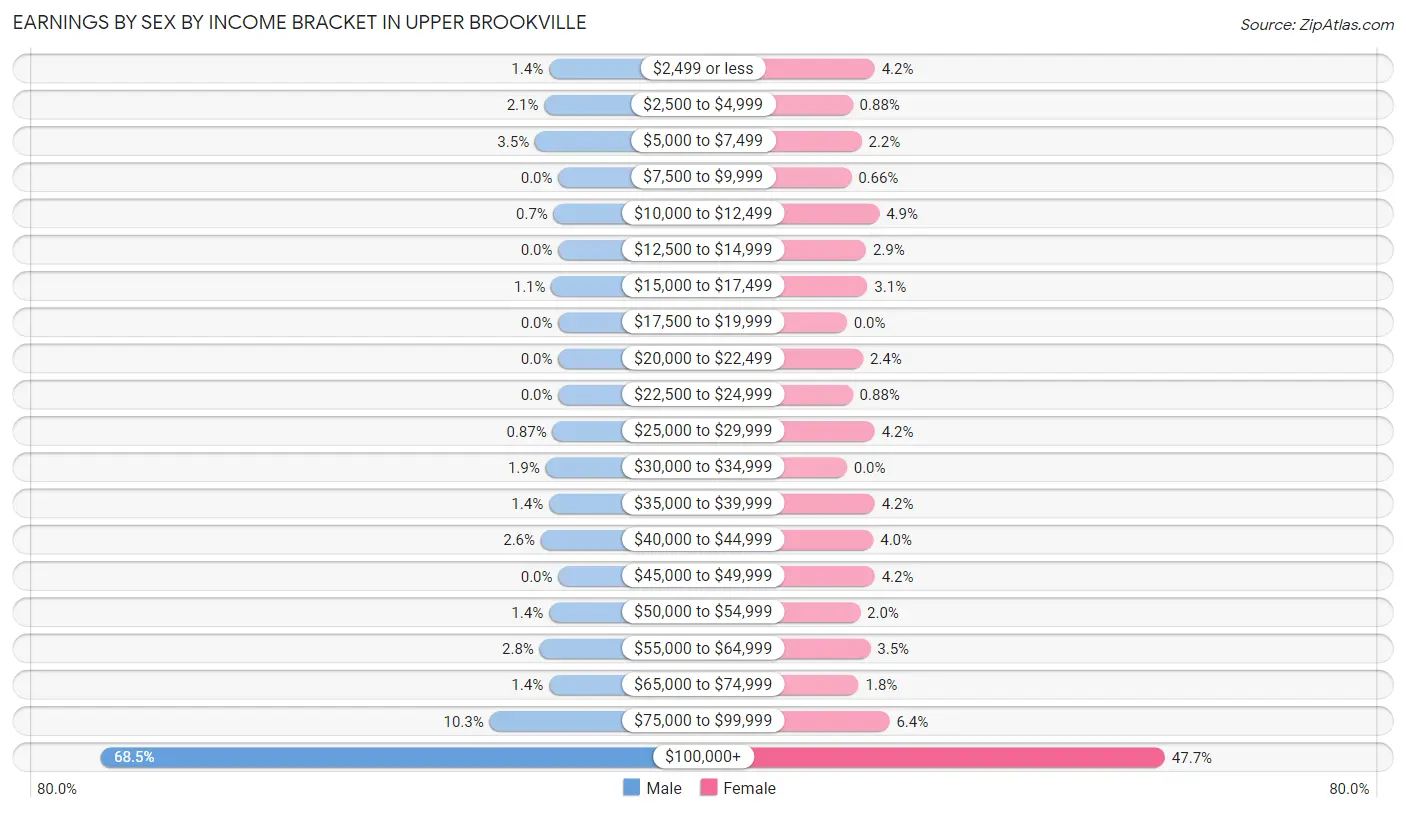
| Income | Male | Female |
| $2,499 or less | 8 (1.4%) | 19 (4.2%) |
| $2,500 to $4,999 | 12 (2.1%) | 4 (0.9%) |
| $5,000 to $7,499 | 20 (3.5%) | 10 (2.2%) |
| $7,500 to $9,999 | 0 (0.0%) | 3 (0.7%) |
| $10,000 to $12,499 | 4 (0.7%) | 22 (4.9%) |
| $12,500 to $14,999 | 0 (0.0%) | 13 (2.9%) |
| $15,000 to $17,499 | 6 (1.1%) | 14 (3.1%) |
| $17,500 to $19,999 | 0 (0.0%) | 0 (0.0%) |
| $20,000 to $22,499 | 0 (0.0%) | 11 (2.4%) |
| $22,500 to $24,999 | 0 (0.0%) | 4 (0.9%) |
| $25,000 to $29,999 | 5 (0.9%) | 19 (4.2%) |
| $30,000 to $34,999 | 11 (1.9%) | 0 (0.0%) |
| $35,000 to $39,999 | 8 (1.4%) | 19 (4.2%) |
| $40,000 to $44,999 | 15 (2.6%) | 18 (4.0%) |
| $45,000 to $49,999 | 0 (0.0%) | 19 (4.2%) |
| $50,000 to $54,999 | 8 (1.4%) | 9 (2.0%) |
| $55,000 to $64,999 | 16 (2.8%) | 16 (3.5%) |
| $65,000 to $74,999 | 8 (1.4%) | 8 (1.8%) |
| $75,000 to $99,999 | 59 (10.3%) | 29 (6.4%) |
| $100,000+ | 392 (68.5%) | 216 (47.7%) |
| Total | 572 (100.0%) | 453 (100.0%) |
Earnings by Sex by Educational Attainment in Upper Brookville
Average earnings in Upper Brookville are $114,508 for men and $116,000 for women, a difference of 1.3%. Men with an educational attainment of graduate degree enjoy the highest average annual earnings of $154,405, while those with college or associate's degree education earn the least with $104,071. Women with an educational attainment of bachelor's degree earn the most with the average annual earnings of $125,208, while those with high school diploma education have the smallest earnings of $16,875.
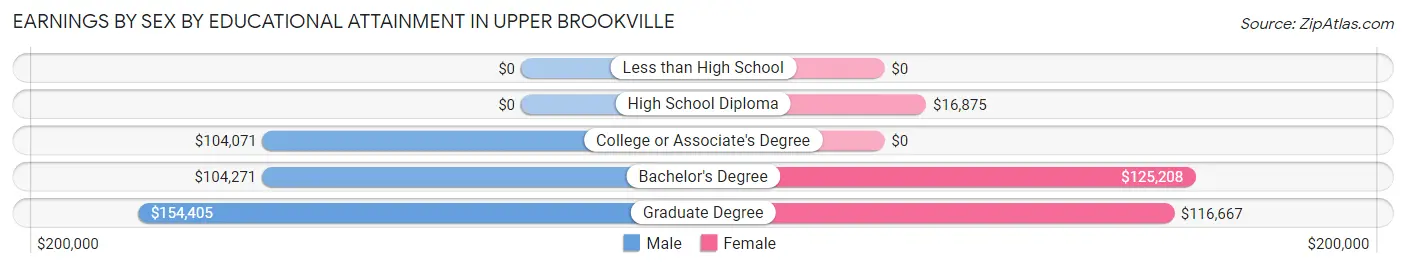
| Educational Attainment | Male Income | Female Income |
| Less than High School | - | - |
| High School Diploma | - | - |
| College or Associate's Degree | $104,071 | $0 |
| Bachelor's Degree | $104,271 | $125,208 |
| Graduate Degree | $154,405 | $116,667 |
| Total | $114,508 | $116,000 |
Family Income in Upper Brookville
Family Income Brackets in Upper Brookville
According to the Upper Brookville family income data, there are 343 families falling into the $200,000+ income range, which is the most common income bracket and makes up 60.4% of all families.
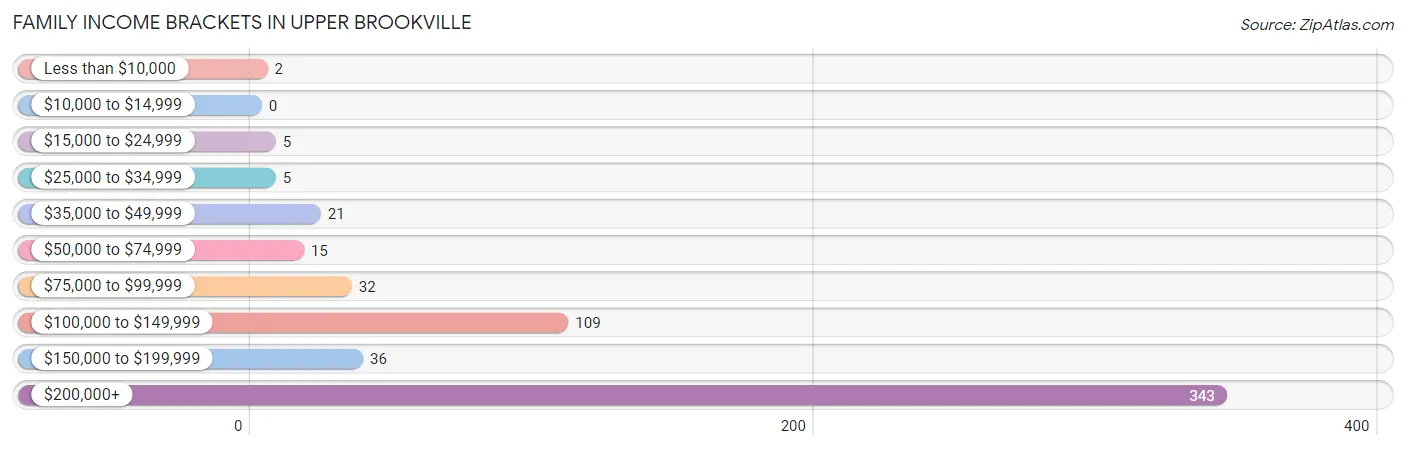
| Income Bracket | # Families | % Families |
| Less than $10,000 | 2 | 0.4% |
| $10,000 to $14,999 | 0 | 0.0% |
| $15,000 to $24,999 | 5 | 0.9% |
| $25,000 to $34,999 | 5 | 0.9% |
| $35,000 to $49,999 | 21 | 3.7% |
| $50,000 to $74,999 | 15 | 2.6% |
| $75,000 to $99,999 | 32 | 5.6% |
| $100,000 to $149,999 | 109 | 19.2% |
| $150,000 to $199,999 | 36 | 6.3% |
| $200,000+ | 343 | 60.4% |
Family Income by Famaliy Size in Upper Brookville
3-person families (136 | 23.9%) account for the highest median family income in Upper Brookville with $250,001 per family, while 2-person families (242 | 42.6%) have the highest median income of $90,416 per family member.
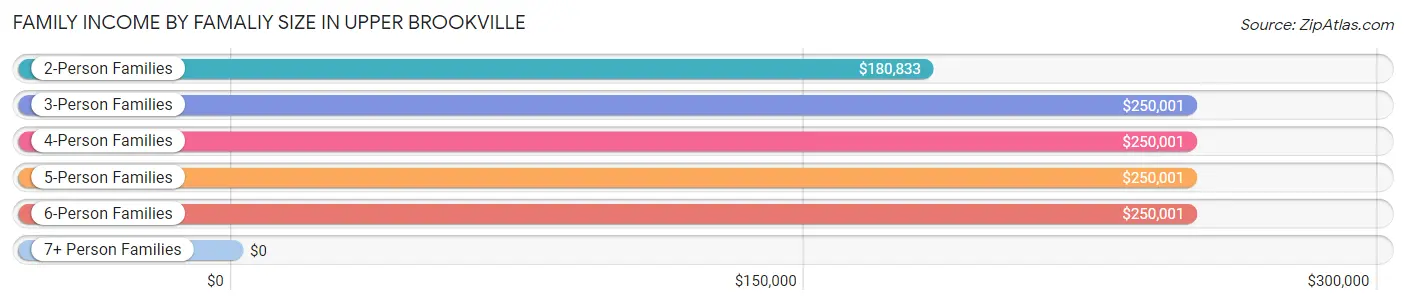
| Income Bracket | # Families | Median Income |
| 2-Person Families | 242 (42.6%) | $180,833 |
| 3-Person Families | 136 (23.9%) | $250,001 |
| 4-Person Families | 108 (19.0%) | $250,001 |
| 5-Person Families | 53 (9.3%) | $250,001 |
| 6-Person Families | 24 (4.2%) | $250,001 |
| 7+ Person Families | 5 (0.9%) | $0 |
| Total | 568 (100.0%) | $229,271 |
Family Income by Number of Earners in Upper Brookville
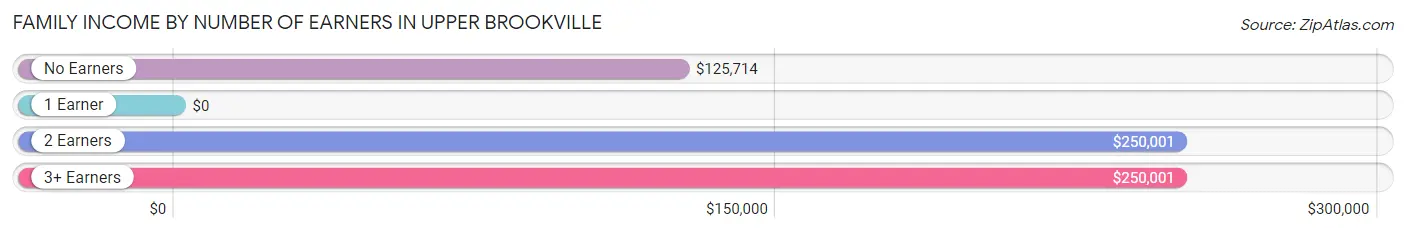
| Number of Earners | # Families | Median Income |
| No Earners | 46 (8.1%) | $125,714 |
| 1 Earner | 216 (38.0%) | $0 |
| 2 Earners | 237 (41.7%) | $250,001 |
| 3+ Earners | 69 (12.1%) | $250,001 |
| Total | 568 (100.0%) | $229,271 |
Household Income in Upper Brookville
Household Income Brackets in Upper Brookville
With 370 households falling in the category, the $200,000+ income range is the most frequent in Upper Brookville, accounting for 60.1% of all households.
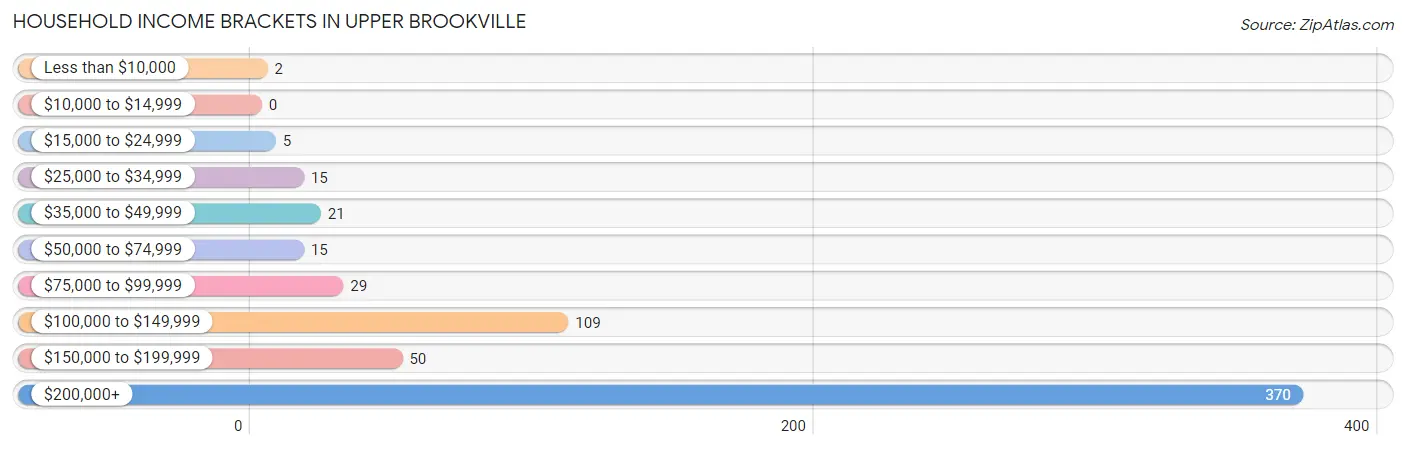
| Income Bracket | # Households | % Households |
| Less than $10,000 | 2 | 0.3% |
| $10,000 to $14,999 | 0 | 0.0% |
| $15,000 to $24,999 | 5 | 0.8% |
| $25,000 to $34,999 | 15 | 2.4% |
| $35,000 to $49,999 | 21 | 3.4% |
| $50,000 to $74,999 | 15 | 2.4% |
| $75,000 to $99,999 | 29 | 4.7% |
| $100,000 to $149,999 | 109 | 17.7% |
| $150,000 to $199,999 | 50 | 8.1% |
| $200,000+ | 370 | 60.1% |
Household Income by Householder Age in Upper Brookville
The median household income in Upper Brookville is $229,375, with the highest median household income of $240,625 found in the 45 to 64 years age bracket for the primary householder. A total of 427 households (69.3%) fall into this category.
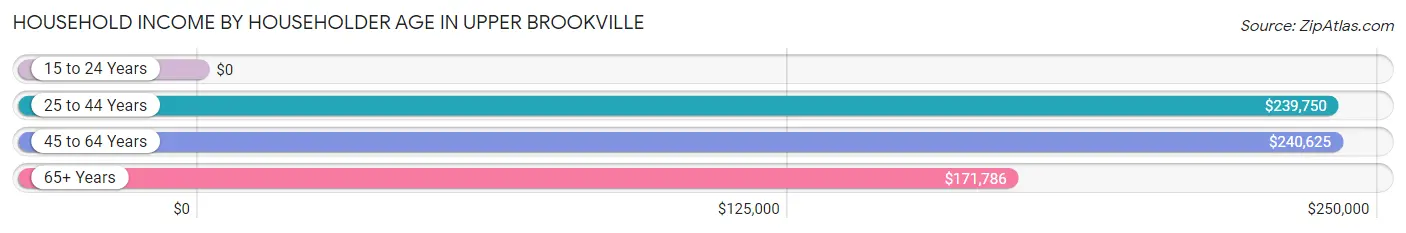
| Income Bracket | # Households | Median Income |
| 15 to 24 Years | 0 (0.0%) | $0 |
| 25 to 44 Years | 33 (5.4%) | $239,750 |
| 45 to 64 Years | 427 (69.3%) | $240,625 |
| 65+ Years | 156 (25.3%) | $171,786 |
| Total | 616 (100.0%) | $229,375 |
Poverty in Upper Brookville
Income Below Poverty by Sex and Age in Upper Brookville
With 2.7% poverty level for males and 3.9% for females among the residents of Upper Brookville, 6 to 11 year old males and under 5 year old females are the most vulnerable to poverty, with 5 males (10.6%) and 8 females (61.5%) in their respective age groups living below the poverty level.
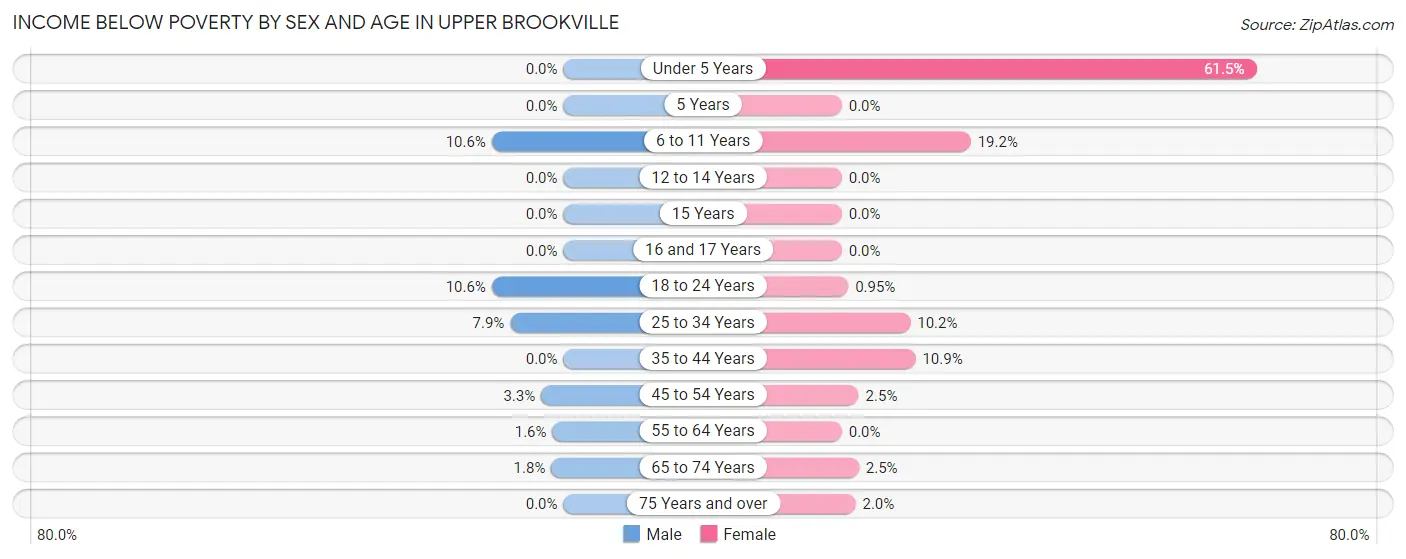
| Age Bracket | Male | Female |
| Under 5 Years | 0 (0.0%) | 8 (61.5%) |
| 5 Years | 0 (0.0%) | 0 (0.0%) |
| 6 to 11 Years | 5 (10.6%) | 9 (19.2%) |
| 12 to 14 Years | 0 (0.0%) | 0 (0.0%) |
| 15 Years | 0 (0.0%) | 0 (0.0%) |
| 16 and 17 Years | 0 (0.0%) | 0 (0.0%) |
| 18 to 24 Years | 5 (10.6%) | 1 (0.9%) |
| 25 to 34 Years | 3 (7.9%) | 6 (10.2%) |
| 35 to 44 Years | 0 (0.0%) | 7 (10.9%) |
| 45 to 54 Years | 5 (3.3%) | 5 (2.5%) |
| 55 to 64 Years | 4 (1.6%) | 0 (0.0%) |
| 65 to 74 Years | 2 (1.8%) | 2 (2.5%) |
| 75 Years and over | 0 (0.0%) | 1 (2.0%) |
| Total | 24 (2.7%) | 39 (3.9%) |
Income Above Poverty by Sex and Age in Upper Brookville
According to the poverty statistics in Upper Brookville, males aged under 5 years and females aged 5 years are the age groups that are most secure financially, with 100.0% of males and 100.0% of females in these age groups living above the poverty line.
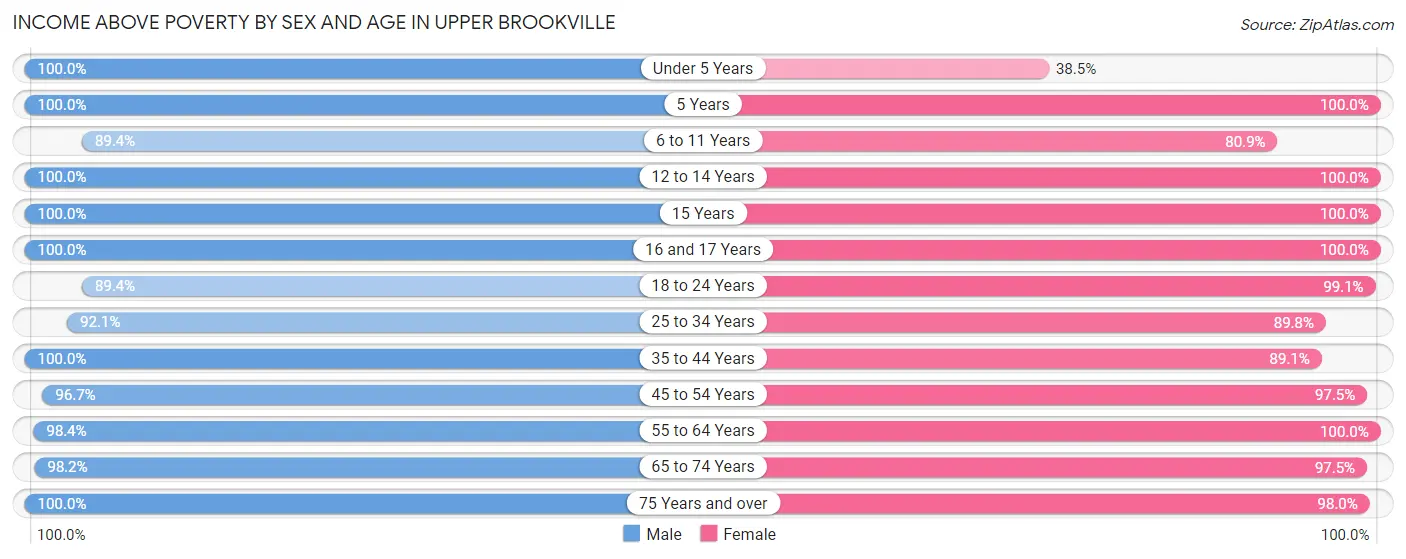
| Age Bracket | Male | Female |
| Under 5 Years | 10 (100.0%) | 5 (38.5%) |
| 5 Years | 4 (100.0%) | 4 (100.0%) |
| 6 to 11 Years | 42 (89.4%) | 38 (80.8%) |
| 12 to 14 Years | 46 (100.0%) | 52 (100.0%) |
| 15 Years | 29 (100.0%) | 23 (100.0%) |
| 16 and 17 Years | 59 (100.0%) | 46 (100.0%) |
| 18 to 24 Years | 42 (89.4%) | 104 (99.1%) |
| 25 to 34 Years | 35 (92.1%) | 53 (89.8%) |
| 35 to 44 Years | 36 (100.0%) | 57 (89.1%) |
| 45 to 54 Years | 146 (96.7%) | 195 (97.5%) |
| 55 to 64 Years | 242 (98.4%) | 258 (100.0%) |
| 65 to 74 Years | 109 (98.2%) | 77 (97.5%) |
| 75 Years and over | 57 (100.0%) | 48 (98.0%) |
| Total | 857 (97.3%) | 960 (96.1%) |
Income Below Poverty Among Married-Couple Families in Upper Brookville
The poverty statistics for married-couple families in Upper Brookville show that 2.3% or 12 of the total 532 families live below the poverty line. Families with 3 or 4 children have the highest poverty rate of 21.7%, comprising of 5 families. On the other hand, families with no children have the lowest poverty rate of 0.7%, which includes 2 families.
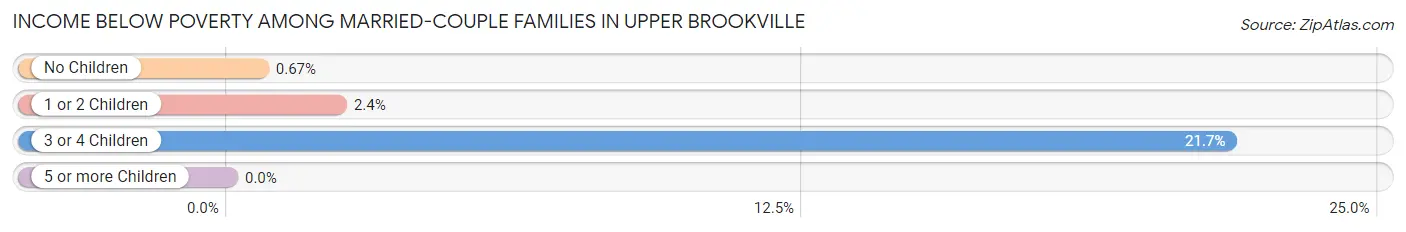
| Children | Above Poverty | Below Poverty |
| No Children | 296 (99.3%) | 2 (0.7%) |
| 1 or 2 Children | 206 (97.6%) | 5 (2.4%) |
| 3 or 4 Children | 18 (78.3%) | 5 (21.7%) |
| 5 or more Children | 0 (0.0%) | 0 (0.0%) |
| Total | 520 (97.7%) | 12 (2.3%) |
Income Below Poverty Among Single-Parent Households in Upper Brookville
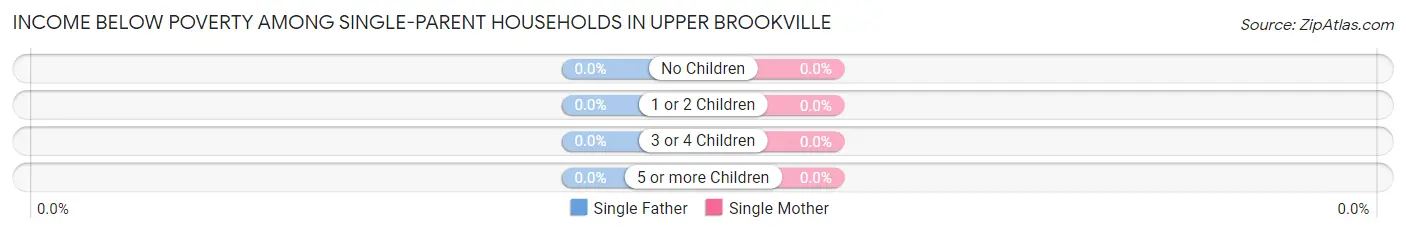
| Children | Single Father | Single Mother |
| No Children | 0 (0.0%) | 0 (0.0%) |
| 1 or 2 Children | 0 (0.0%) | 0 (0.0%) |
| 3 or 4 Children | 0 (0.0%) | 0 (0.0%) |
| 5 or more Children | 0 (0.0%) | 0 (0.0%) |
| Total | 0 (0.0%) | 0 (0.0%) |
Income Below Poverty Among Married-Couple vs Single-Parent Households in Upper Brookville
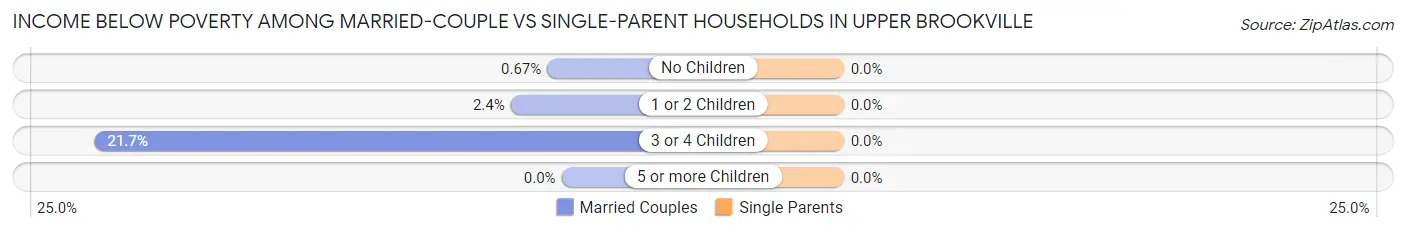
| Children | Married-Couple Families | Single-Parent Households |
| No Children | 2 (0.7%) | 0 (0.0%) |
| 1 or 2 Children | 5 (2.4%) | 0 (0.0%) |
| 3 or 4 Children | 5 (21.7%) | 0 (0.0%) |
| 5 or more Children | 0 (0.0%) | 0 (0.0%) |
| Total | 12 (2.3%) | 0 (0.0%) |
Race in Upper Brookville
The most populous races in Upper Brookville are White / Caucasian (1,471 | 78.2%), Asian (311 | 16.5%), and Two or more Races (77 | 4.1%).
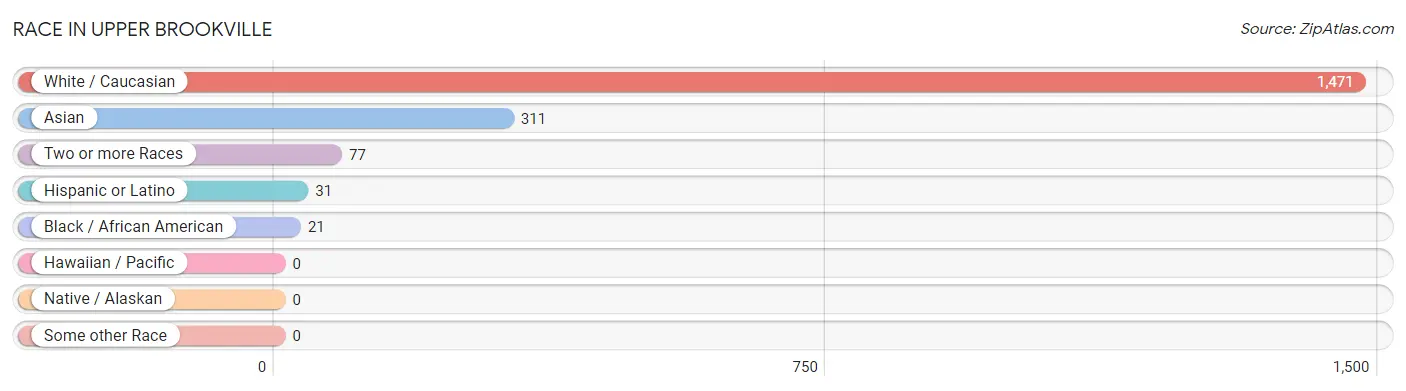
| Race | # Population | % Population |
| Asian | 311 | 16.5% |
| Black / African American | 21 | 1.1% |
| Hawaiian / Pacific | 0 | 0.0% |
| Hispanic or Latino | 31 | 1.7% |
| Native / Alaskan | 0 | 0.0% |
| White / Caucasian | 1,471 | 78.2% |
| Two or more Races | 77 | 4.1% |
| Some other Race | 0 | 0.0% |
| Total | 1,880 | 100.0% |
Ancestry in Upper Brookville
The most populous ancestries reported in Upper Brookville are Italian (379 | 20.2%), Indian (Asian) (156 | 8.3%), Greek (134 | 7.1%), Thai (117 | 6.2%), and German (115 | 6.1%), together accounting for 47.9% of all Upper Brookville residents.
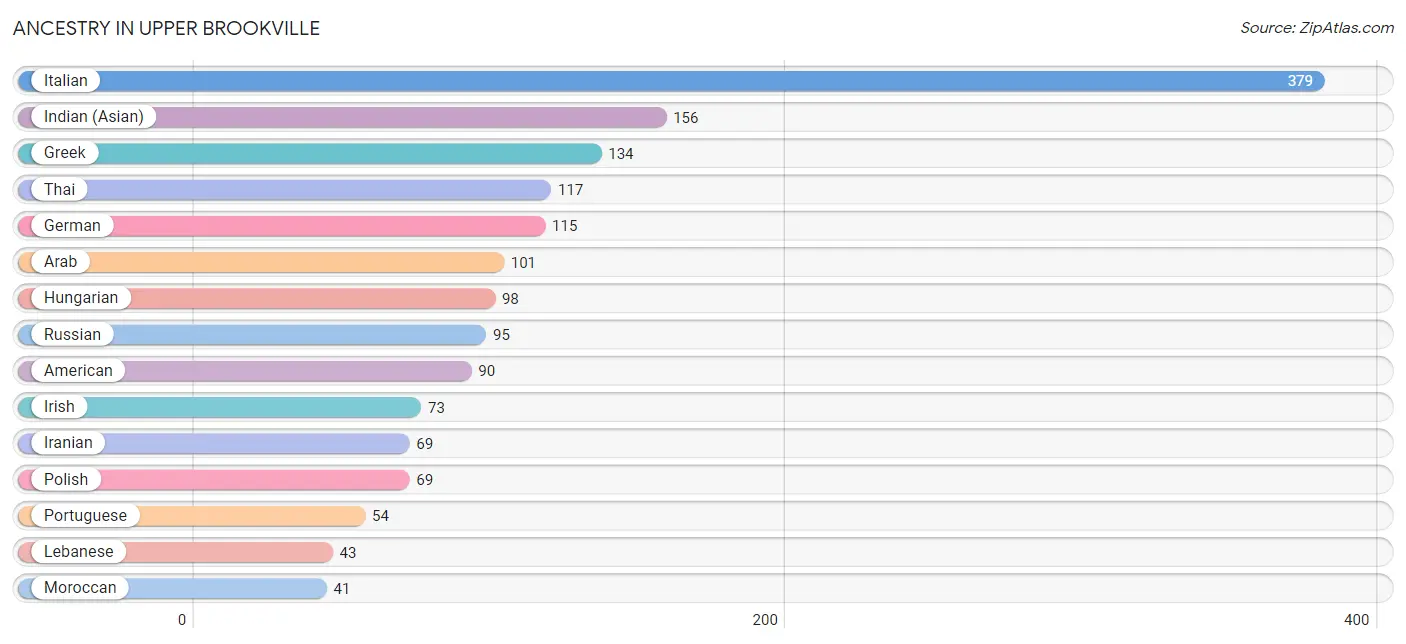
| Ancestry | # Population | % Population |
| Afghan | 16 | 0.9% |
| Alsatian | 3 | 0.2% |
| American | 90 | 4.8% |
| Arab | 101 | 5.4% |
| Armenian | 18 | 1.0% |
| Austrian | 32 | 1.7% |
| Belgian | 13 | 0.7% |
| Bhutanese | 1 | 0.1% |
| Brazilian | 14 | 0.7% |
| British | 30 | 1.6% |
| Burmese | 27 | 1.4% |
| Colombian | 15 | 0.8% |
| Cypriot | 7 | 0.4% |
| Danish | 4 | 0.2% |
| Dutch | 11 | 0.6% |
| Eastern European | 9 | 0.5% |
| Ecuadorian | 4 | 0.2% |
| Egyptian | 17 | 0.9% |
| English | 35 | 1.9% |
| Ethiopian | 14 | 0.7% |
| European | 7 | 0.4% |
| Filipino | 13 | 0.7% |
| Finnish | 4 | 0.2% |
| French | 22 | 1.2% |
| German | 115 | 6.1% |
| Greek | 134 | 7.1% |
| Hungarian | 98 | 5.2% |
| Indian (Asian) | 156 | 8.3% |
| Iranian | 69 | 3.7% |
| Irish | 73 | 3.9% |
| Italian | 379 | 20.2% |
| Lebanese | 43 | 2.3% |
| Lithuanian | 4 | 0.2% |
| Maltese | 12 | 0.6% |
| Moroccan | 41 | 2.2% |
| Norwegian | 15 | 0.8% |
| Polish | 69 | 3.7% |
| Portuguese | 54 | 2.9% |
| Romanian | 7 | 0.4% |
| Russian | 95 | 5.1% |
| Scandinavian | 21 | 1.1% |
| Slavic | 12 | 0.6% |
| Slovak | 25 | 1.3% |
| South American | 19 | 1.0% |
| Spanish | 12 | 0.6% |
| Subsaharan African | 14 | 0.7% |
| Swiss | 3 | 0.2% |
| Thai | 117 | 6.2% |
| Ukrainian | 3 | 0.2% |
| Vietnamese | 25 | 1.3% | View All 50 Rows |
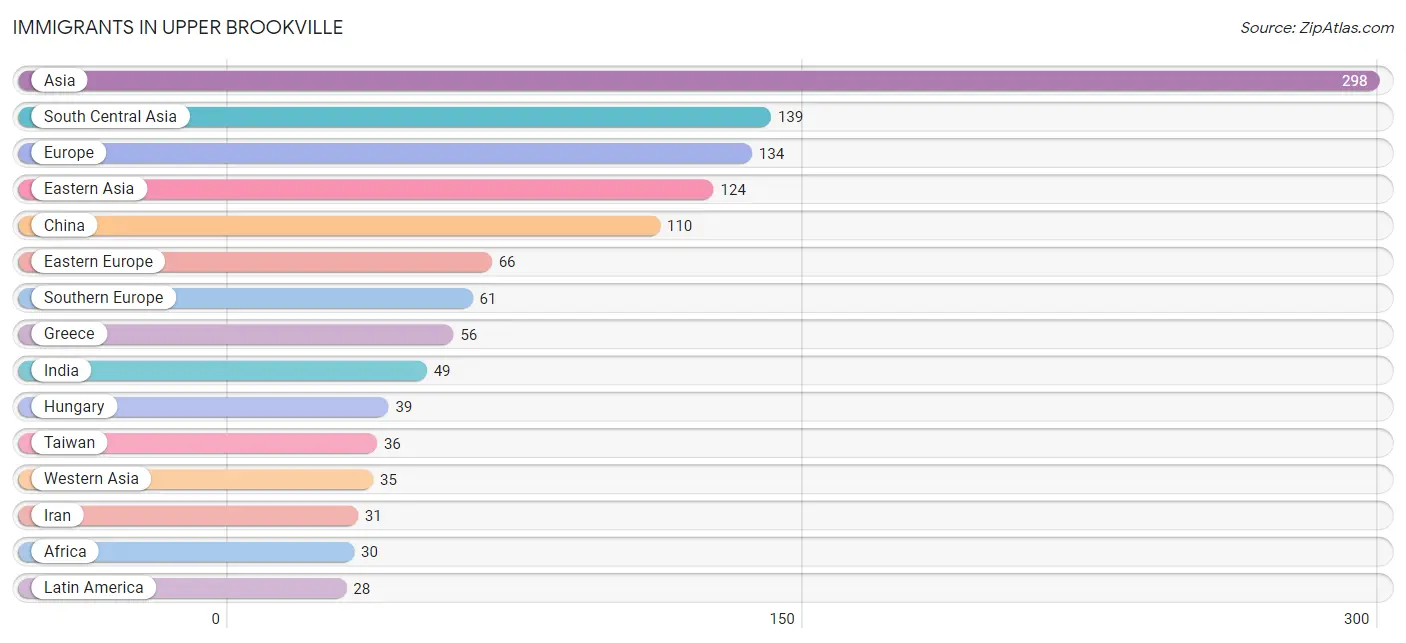
Immigrants in Upper Brookville
The most numerous immigrant groups reported in Upper Brookville came from Asia (298 | 15.9%), South Central Asia (139 | 7.4%), Europe (134 | 7.1%), Eastern Asia (124 | 6.6%), and China (110 | 5.9%), together accounting for 42.8% of all Upper Brookville residents.
| Immigration Origin | # Population | % Population |
| Afghanistan | 16 | 0.9% |
| Africa | 30 | 1.6% |
| Asia | 298 | 15.9% |
| Bangladesh | 14 | 0.7% |
| Brazil | 21 | 1.1% |
| Canada | 7 | 0.4% |
| China | 110 | 5.9% |
| Colombia | 7 | 0.4% |
| Czechoslovakia | 20 | 1.1% |
| Eastern Africa | 8 | 0.4% |
| Eastern Asia | 124 | 6.6% |
| Eastern Europe | 66 | 3.5% |
| Egypt | 17 | 0.9% |
| Eritrea | 4 | 0.2% |
| Ethiopia | 4 | 0.2% |
| Europe | 134 | 7.1% |
| Greece | 56 | 3.0% |
| Hong Kong | 12 | 0.6% |
| Hungary | 39 | 2.1% |
| India | 49 | 2.6% |
| Iran | 31 | 1.7% |
| Ireland | 7 | 0.4% |
| Israel | 3 | 0.2% |
| Italy | 5 | 0.3% |
| Korea | 14 | 0.7% |
| Kuwait | 5 | 0.3% |
| Latin America | 28 | 1.5% |
| Lebanon | 7 | 0.4% |
| Northern Africa | 17 | 0.9% |
| Northern Europe | 7 | 0.4% |
| Pakistan | 15 | 0.8% |
| Romania | 4 | 0.2% |
| Russia | 3 | 0.2% |
| Sierra Leone | 4 | 0.2% |
| South Africa | 1 | 0.1% |
| South America | 28 | 1.5% |
| South Central Asia | 139 | 7.4% |
| Southern Europe | 61 | 3.2% |
| Sri Lanka | 14 | 0.7% |
| Syria | 13 | 0.7% |
| Taiwan | 36 | 1.9% |
| Western Africa | 4 | 0.2% |
| Western Asia | 35 | 1.9% | View All 43 Rows |
Sex and Age in Upper Brookville
Sex and Age in Upper Brookville
The most populous age groups in Upper Brookville are 55 to 59 Years (129 | 14.6%) for men and 55 to 59 Years (141 | 14.1%) for women.
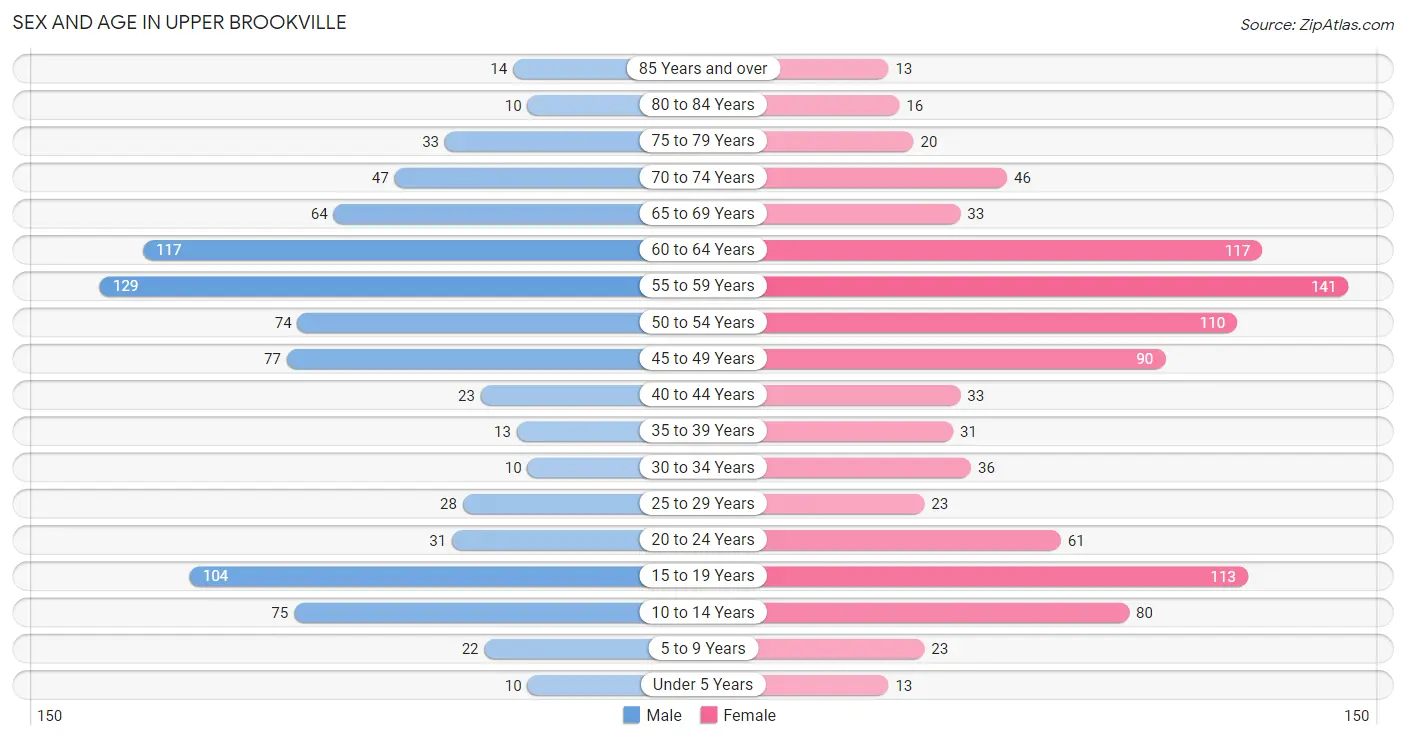
| Age Bracket | Male | Female |
| Under 5 Years | 10 (1.1%) | 13 (1.3%) |
| 5 to 9 Years | 22 (2.5%) | 23 (2.3%) |
| 10 to 14 Years | 75 (8.5%) | 80 (8.0%) |
| 15 to 19 Years | 104 (11.8%) | 113 (11.3%) |
| 20 to 24 Years | 31 (3.5%) | 61 (6.1%) |
| 25 to 29 Years | 28 (3.2%) | 23 (2.3%) |
| 30 to 34 Years | 10 (1.1%) | 36 (3.6%) |
| 35 to 39 Years | 13 (1.5%) | 31 (3.1%) |
| 40 to 44 Years | 23 (2.6%) | 33 (3.3%) |
| 45 to 49 Years | 77 (8.7%) | 90 (9.0%) |
| 50 to 54 Years | 74 (8.4%) | 110 (11.0%) |
| 55 to 59 Years | 129 (14.6%) | 141 (14.1%) |
| 60 to 64 Years | 117 (13.3%) | 117 (11.7%) |
| 65 to 69 Years | 64 (7.3%) | 33 (3.3%) |
| 70 to 74 Years | 47 (5.3%) | 46 (4.6%) |
| 75 to 79 Years | 33 (3.7%) | 20 (2.0%) |
| 80 to 84 Years | 10 (1.1%) | 16 (1.6%) |
| 85 Years and over | 14 (1.6%) | 13 (1.3%) |
| Total | 881 (100.0%) | 999 (100.0%) |
Families and Households in Upper Brookville
Median Family Size in Upper Brookville
The median family size in Upper Brookville is 3.16 persons per family, with married-couple families (532 | 93.7%) accounting for the largest median family size of 3.21 persons per family. On the other hand, single male/father families (3 | 0.5%) represent the smallest median family size with 2.33 persons per family.
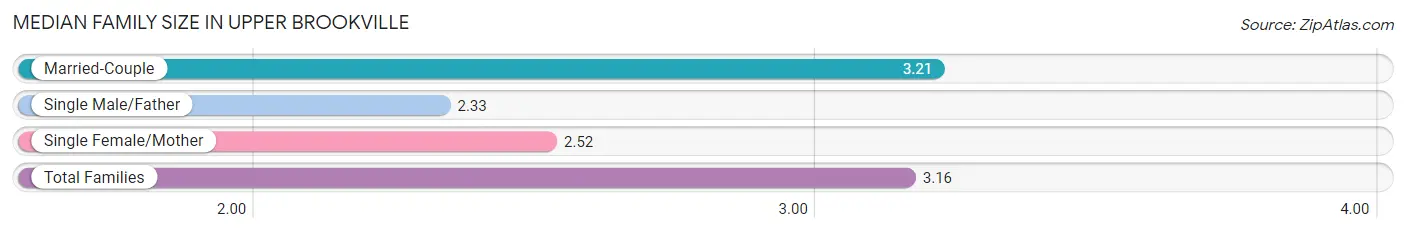
| Family Type | # Families | Family Size |
| Married-Couple | 532 (93.7%) | 3.21 |
| Single Male/Father | 3 (0.5%) | 2.33 |
| Single Female/Mother | 33 (5.8%) | 2.52 |
| Total Families | 568 (100.0%) | 3.16 |
Median Household Size in Upper Brookville
The median household size in Upper Brookville is 3.04 persons per household, with married-couple households (532 | 86.4%) accounting for the largest median household size of 3.23 persons per household. non-family households (48 | 7.8%) represent the smallest median household size with 1.17 persons per household.
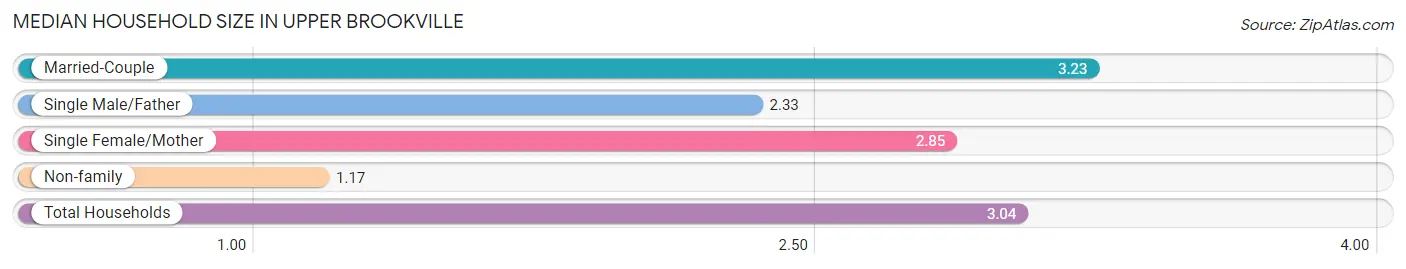
| Household Type | # Households | Household Size |
| Married-Couple | 532 (86.4%) | 3.23 |
| Single Male/Father | 3 (0.5%) | 2.33 |
| Single Female/Mother | 33 (5.4%) | 2.85 |
| Non-family | 48 (7.8%) | 1.17 |
| Total Households | 616 (100.0%) | 3.04 |
Household Size by Marriage Status in Upper Brookville
Out of a total of 616 households in Upper Brookville, 568 (92.2%) are family households, while 48 (7.8%) are nonfamily households. The most numerous type of family households are 2-person households, comprising 226, and the most common type of nonfamily households are 1-person households, comprising 41.
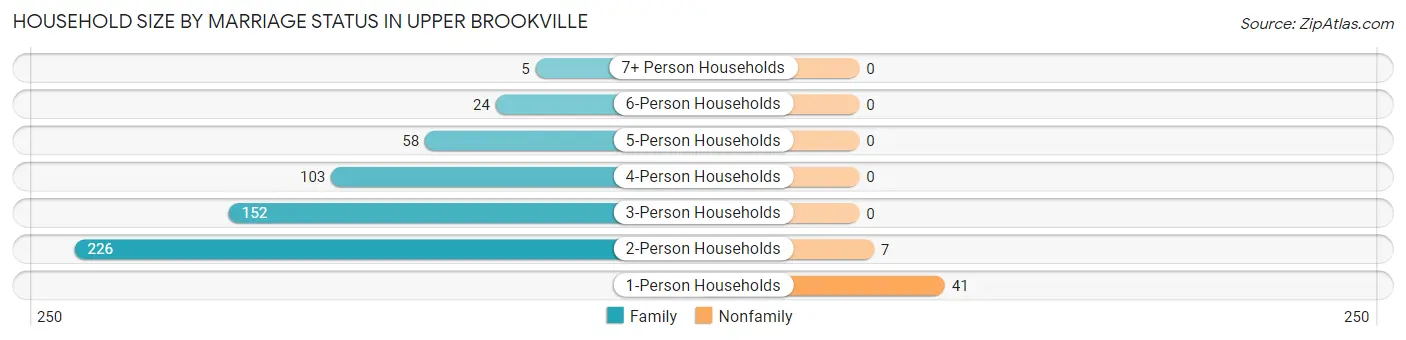
| Household Size | Family Households | Nonfamily Households |
| 1-Person Households | - | 41 (6.7%) |
| 2-Person Households | 226 (36.7%) | 7 (1.1%) |
| 3-Person Households | 152 (24.7%) | 0 (0.0%) |
| 4-Person Households | 103 (16.7%) | 0 (0.0%) |
| 5-Person Households | 58 (9.4%) | 0 (0.0%) |
| 6-Person Households | 24 (3.9%) | 0 (0.0%) |
| 7+ Person Households | 5 (0.8%) | 0 (0.0%) |
| Total | 568 (92.2%) | 48 (7.8%) |
Female Fertility in Upper Brookville
Fertility by Age in Upper Brookville
| Age Bracket | Women with Births | Births / 1,000 Women |
| 15 to 19 years | 0 (0.0%) | 0.0 |
| 20 to 34 years | 0 (0.0%) | 0.0 |
| 35 to 50 years | 0 (0.0%) | 0.0 |
| Total | 0 (0.0%) | 0.0 |
Fertility by Age by Marriage Status in Upper Brookville
| Age Bracket | Married | Unmarried |
| 15 to 19 years | 0 (0.0%) | 0 (0.0%) |
| 20 to 34 years | 0 (0.0%) | 0 (0.0%) |
| 35 to 50 years | 0 (0.0%) | 0 (0.0%) |
| Total | 0 (0.0%) | 0 (0.0%) |
Fertility by Education in Upper Brookville
| Educational Attainment | Women with Births | Births / 1,000 Women |
| Less than High School | 0 (0.0%) | 0.0 |
| High School Diploma | 0 (0.0%) | 0.0 |
| College or Associate's Degree | 0 (0.0%) | 0.0 |
| Bachelor's Degree | 0 (0.0%) | 0.0 |
| Graduate Degree | 0 (0.0%) | 0.0 |
| Total | 0 (0.0%) | 0.0 |
Fertility by Education by Marriage Status in Upper Brookville
| Educational Attainment | Married | Unmarried |
| Less than High School | 0 (0.0%) | 0 (0.0%) |
| High School Diploma | 0 (0.0%) | 0 (0.0%) |
| College or Associate's Degree | 0 (0.0%) | 0 (0.0%) |
| Bachelor's Degree | 0 (0.0%) | 0 (0.0%) |
| Graduate Degree | 0 (0.0%) | 0 (0.0%) |
| Total | 0 (0.0%) | 0 (0.0%) |
Employment Characteristics in Upper Brookville
Employment by Class of Employer in Upper Brookville
Among the 965 employed individuals in Upper Brookville, private company employees (589 | 61.0%), self-employed (incorporated) (216 | 22.4%), and self-employed (not incorporated) (49 | 5.1%) make up the most common classes of employment.
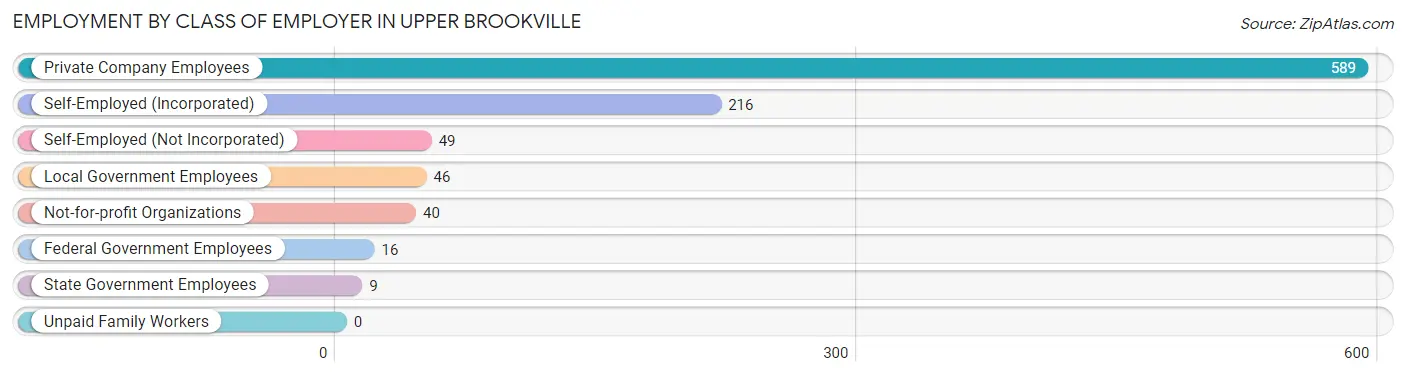
| Employer Class | # Employees | % Employees |
| Private Company Employees | 589 | 61.0% |
| Self-Employed (Incorporated) | 216 | 22.4% |
| Self-Employed (Not Incorporated) | 49 | 5.1% |
| Not-for-profit Organizations | 40 | 4.2% |
| Local Government Employees | 46 | 4.8% |
| State Government Employees | 9 | 0.9% |
| Federal Government Employees | 16 | 1.7% |
| Unpaid Family Workers | 0 | 0.0% |
| Total | 965 | 100.0% |
Employment Status by Age in Upper Brookville
According to the labor force statistics for Upper Brookville, out of the total population over 16 years of age (1,605), 63.1% or 1,013 individuals are in the labor force, with 4.7% or 48 of them unemployed. The age group with the highest labor force participation rate is 55 to 59 years, with 85.6% or 231 individuals in the labor force. Within the labor force, the 35 to 44 years age range has the highest percentage of unemployed individuals, with 18.8% or 12 of them being unemployed.
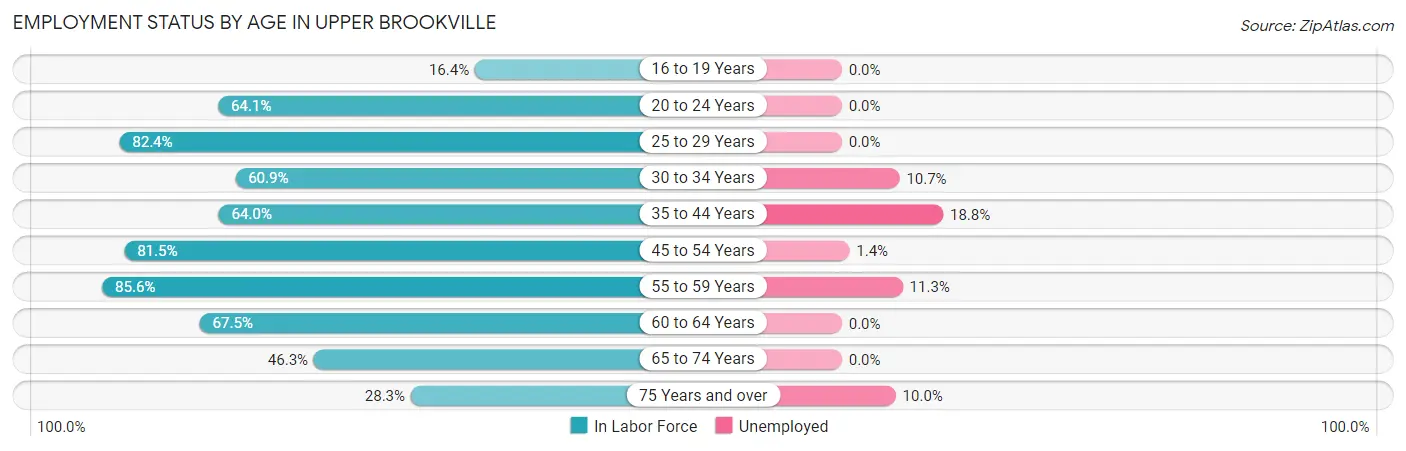
| Age Bracket | In Labor Force | Unemployed |
| 16 to 19 Years | 27 (16.4%) | 0 (0.0%) |
| 20 to 24 Years | 59 (64.1%) | 0 (0.0%) |
| 25 to 29 Years | 42 (82.4%) | 0 (0.0%) |
| 30 to 34 Years | 28 (60.9%) | 3 (10.7%) |
| 35 to 44 Years | 64 (64.0%) | 12 (18.8%) |
| 45 to 54 Years | 286 (81.5%) | 4 (1.4%) |
| 55 to 59 Years | 231 (85.6%) | 26 (11.3%) |
| 60 to 64 Years | 158 (67.5%) | 0 (0.0%) |
| 65 to 74 Years | 88 (46.3%) | 0 (0.0%) |
| 75 Years and over | 30 (28.3%) | 3 (10.0%) |
| Total | 1,013 (63.1%) | 48 (4.7%) |
Employment Status by Educational Attainment in Upper Brookville
According to labor force statistics for Upper Brookville, 76.9% of individuals (809) out of the total population between 25 and 64 years of age (1,052) are in the labor force, with 5.6% or 45 of them being unemployed. The group with the highest labor force participation rate are those with the educational attainment of bachelor's degree or higher, with 80.4% or 677 individuals in the labor force. Within the labor force, individuals with college / associate degree education have the highest percentage of unemployment, with 18.2% or 18 of them being unemployed.
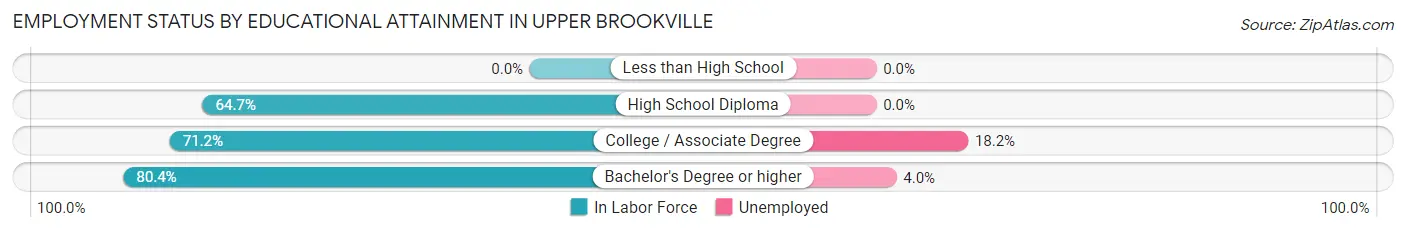
| Educational Attainment | In Labor Force | Unemployed |
| Less than High School | 0 (0.0%) | 0 (0.0%) |
| High School Diploma | 33 (64.7%) | 0 (0.0%) |
| College / Associate Degree | 99 (71.2%) | 25 (18.2%) |
| Bachelor's Degree or higher | 677 (80.4%) | 34 (4.0%) |
| Total | 809 (76.9%) | 59 (5.6%) |
Employment Occupations by Sex in Upper Brookville
Management, Business, Science and Arts Occupations
The most common Management, Business, Science and Arts occupations in Upper Brookville are Management (210 | 21.8%), Community & Social Service (161 | 16.7%), Health Diagnosing & Treating (108 | 11.2%), Health Technologists (98 | 10.2%), and Business & Financial (77 | 8.0%).
Management, Business, Science and Arts Occupations by Sex
Within the Management, Business, Science and Arts occupations in Upper Brookville, the most male-oriented occupations are Architecture & Engineering (100.0%), Computers, Engineering & Science (87.0%), and Management (68.6%), while the most female-oriented occupations are Life, Physical & Social Science (100.0%), Education, Arts & Media (100.0%), and Education Instruction & Library (94.2%).
| Occupation | Male | Female |
| Management | 144 (68.6%) | 66 (31.4%) |
| Business & Financial | 38 (49.3%) | 39 (50.6%) |
| Computers, Engineering & Science | 60 (87.0%) | 9 (13.0%) |
| Computers & Mathematics | 6 (54.5%) | 5 (45.5%) |
| Architecture & Engineering | 54 (100.0%) | 0 (0.0%) |
| Life, Physical & Social Science | 0 (0.0%) | 4 (100.0%) |
| Community & Social Service | 53 (32.9%) | 108 (67.1%) |
| Education, Arts & Media | 0 (0.0%) | 4 (100.0%) |
| Legal Services & Support | 46 (66.7%) | 23 (33.3%) |
| Education Instruction & Library | 3 (5.8%) | 49 (94.2%) |
| Arts, Media & Entertainment | 4 (11.1%) | 32 (88.9%) |
| Health Diagnosing & Treating | 62 (57.4%) | 46 (42.6%) |
| Health Technologists | 57 (58.2%) | 41 (41.8%) |
| Total (Category) | 357 (57.1%) | 268 (42.9%) |
| Total (Overall) | 533 (55.2%) | 432 (44.8%) |
Services Occupations
The most common Services occupations in Upper Brookville are Food Preparation & Serving (10 | 1.0%), Security & Protection (9 | 0.9%), Firefighting & Prevention (9 | 0.9%), Personal Care & Service (6 | 0.6%), and Healthcare Support (4 | 0.4%).
Services Occupations by Sex
Within the Services occupations in Upper Brookville, the most male-oriented occupations are Security & Protection (55.6%), and Firefighting & Prevention (55.6%), while the most female-oriented occupations are Healthcare Support (100.0%), Food Preparation & Serving (100.0%), and Cleaning & Maintenance (100.0%).
| Occupation | Male | Female |
| Healthcare Support | 0 (0.0%) | 4 (100.0%) |
| Security & Protection | 5 (55.6%) | 4 (44.4%) |
| Firefighting & Prevention | 5 (55.6%) | 4 (44.4%) |
| Law Enforcement | 0 (0.0%) | 0 (0.0%) |
| Food Preparation & Serving | 0 (0.0%) | 10 (100.0%) |
| Cleaning & Maintenance | 0 (0.0%) | 3 (100.0%) |
| Personal Care & Service | 0 (0.0%) | 6 (100.0%) |
| Total (Category) | 5 (15.6%) | 27 (84.4%) |
| Total (Overall) | 533 (55.2%) | 432 (44.8%) |
Sales and Office Occupations
The most common Sales and Office occupations in Upper Brookville are Office & Administration (171 | 17.7%), and Sales & Related (88 | 9.1%).

Sales and Office Occupations by Sex
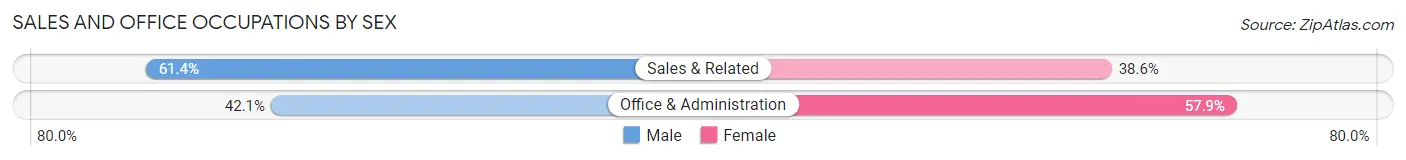
| Occupation | Male | Female |
| Sales & Related | 54 (61.4%) | 34 (38.6%) |
| Office & Administration | 72 (42.1%) | 99 (57.9%) |
| Total (Category) | 126 (48.6%) | 133 (51.3%) |
| Total (Overall) | 533 (55.2%) | 432 (44.8%) |
Natural Resources, Construction and Maintenance Occupations
The most common Natural Resources, Construction and Maintenance occupations in Upper Brookville are Construction & Extraction (16 | 1.7%), and Installation, Maintenance & Repair (4 | 0.4%).

Natural Resources, Construction and Maintenance Occupations by Sex
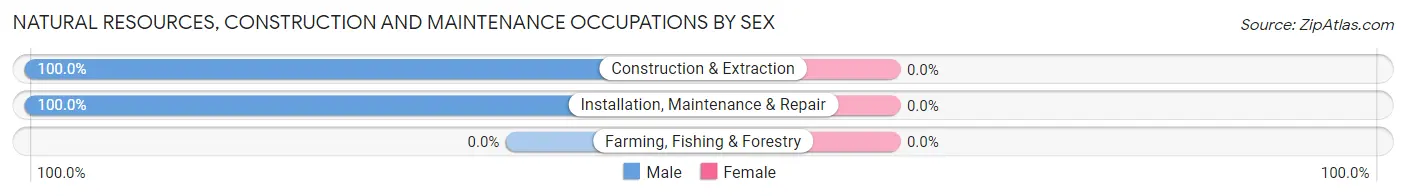
| Occupation | Male | Female |
| Farming, Fishing & Forestry | 0 (0.0%) | 0 (0.0%) |
| Construction & Extraction | 16 (100.0%) | 0 (0.0%) |
| Installation, Maintenance & Repair | 4 (100.0%) | 0 (0.0%) |
| Total (Category) | 20 (100.0%) | 0 (0.0%) |
| Total (Overall) | 533 (55.2%) | 432 (44.8%) |
Production, Transportation and Moving Occupations
The most common Production, Transportation and Moving occupations in Upper Brookville are Transportation (24 | 2.5%), and Production (5 | 0.5%).
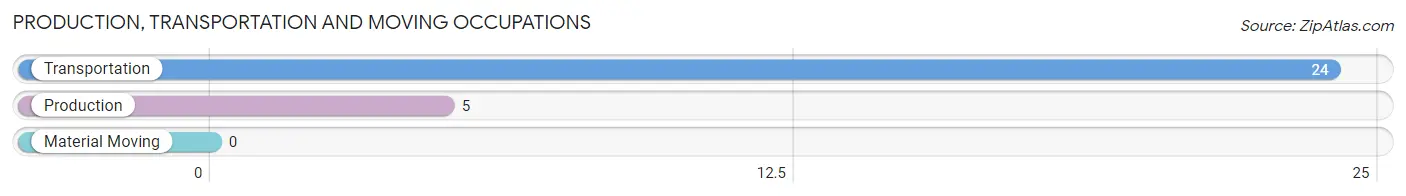
Production, Transportation and Moving Occupations by Sex
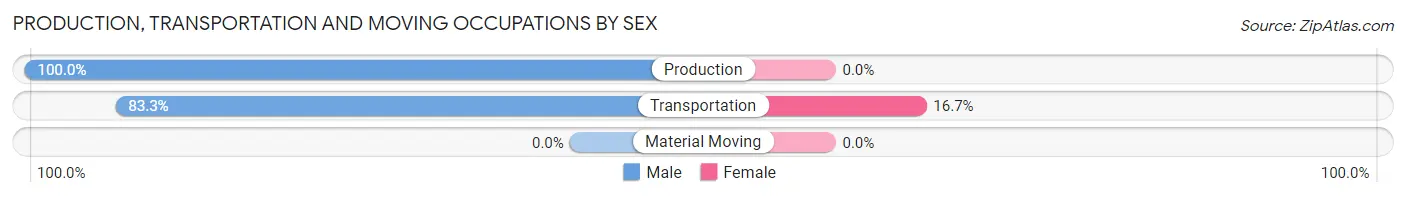
| Occupation | Male | Female |
| Production | 5 (100.0%) | 0 (0.0%) |
| Transportation | 20 (83.3%) | 4 (16.7%) |
| Material Moving | 0 (0.0%) | 0 (0.0%) |
| Total (Category) | 25 (86.2%) | 4 (13.8%) |
| Total (Overall) | 533 (55.2%) | 432 (44.8%) |
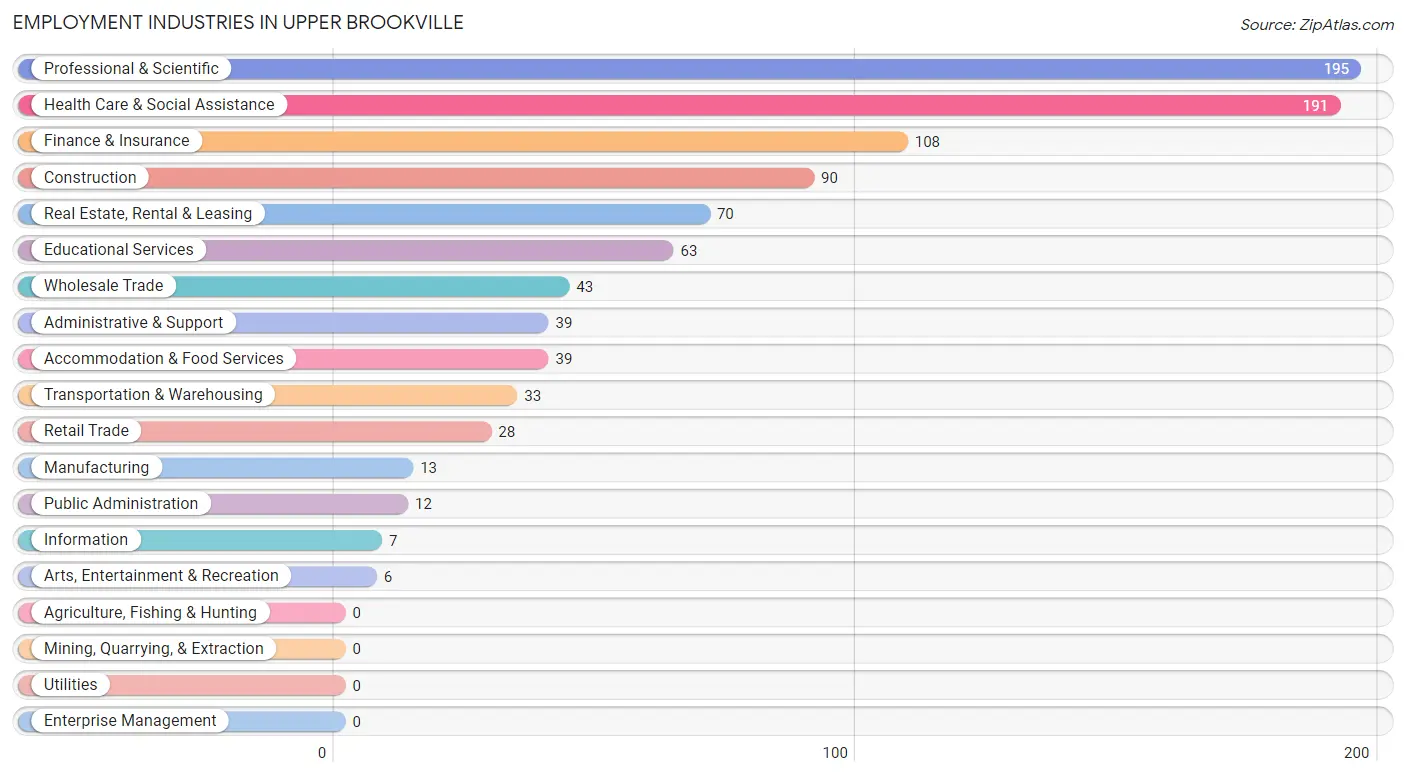
Employment Industries by Sex in Upper Brookville
Employment Industries in Upper Brookville
The major employment industries in Upper Brookville include Professional & Scientific (195 | 20.2%), Health Care & Social Assistance (191 | 19.8%), Finance & Insurance (108 | 11.2%), Construction (90 | 9.3%), and Real Estate, Rental & Leasing (70 | 7.2%).
Employment Industries by Sex in Upper Brookville
The Upper Brookville industries that see more men than women are Administrative & Support (100.0%), Arts, Entertainment & Recreation (100.0%), and Public Administration (100.0%), whereas the industries that tend to have a higher number of women are Manufacturing (100.0%), Information (100.0%), and Educational Services (80.9%).
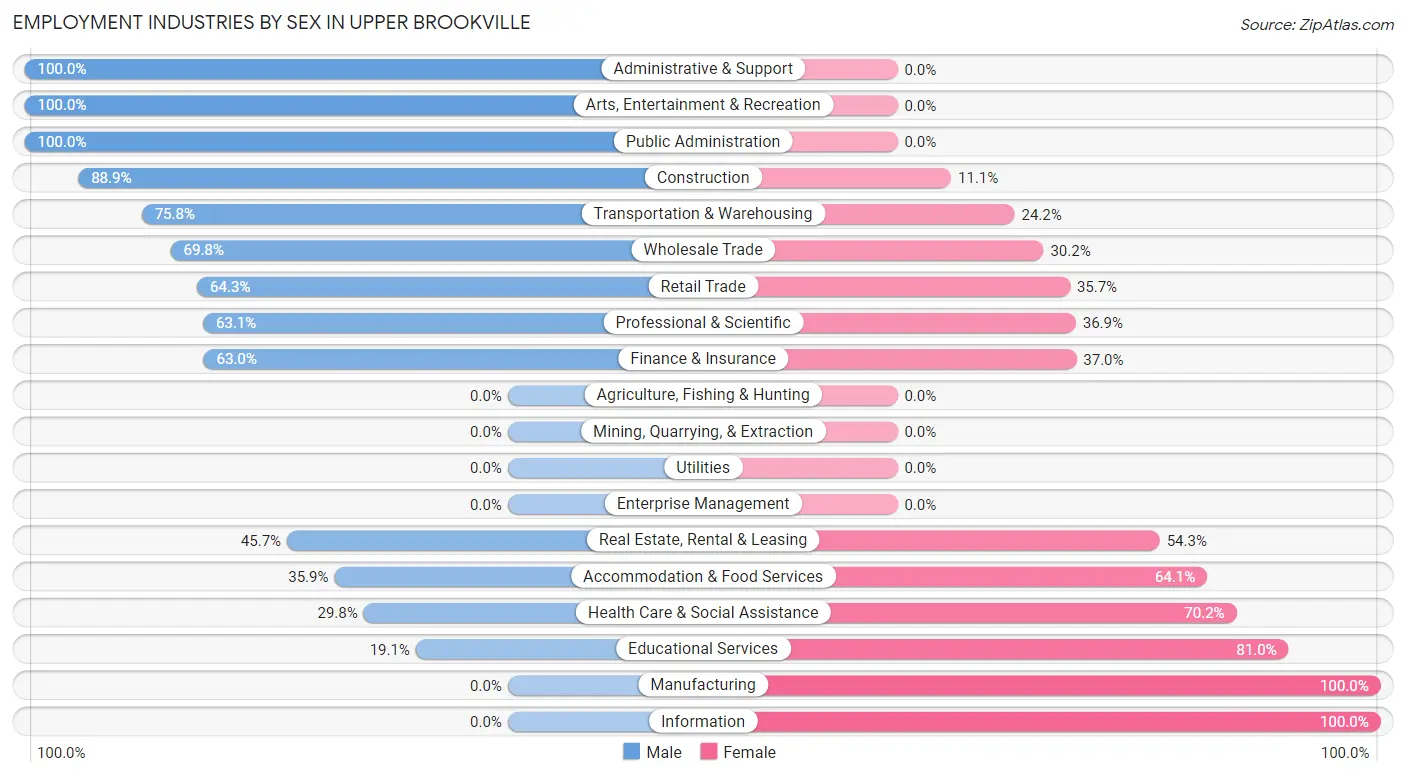
| Industry | Male | Female |
| Agriculture, Fishing & Hunting | 0 (0.0%) | 0 (0.0%) |
| Mining, Quarrying, & Extraction | 0 (0.0%) | 0 (0.0%) |
| Construction | 80 (88.9%) | 10 (11.1%) |
| Manufacturing | 0 (0.0%) | 13 (100.0%) |
| Wholesale Trade | 30 (69.8%) | 13 (30.2%) |
| Retail Trade | 18 (64.3%) | 10 (35.7%) |
| Transportation & Warehousing | 25 (75.8%) | 8 (24.2%) |
| Utilities | 0 (0.0%) | 0 (0.0%) |
| Information | 0 (0.0%) | 7 (100.0%) |
| Finance & Insurance | 68 (63.0%) | 40 (37.0%) |
| Real Estate, Rental & Leasing | 32 (45.7%) | 38 (54.3%) |
| Professional & Scientific | 123 (63.1%) | 72 (36.9%) |
| Enterprise Management | 0 (0.0%) | 0 (0.0%) |
| Administrative & Support | 39 (100.0%) | 0 (0.0%) |
| Educational Services | 12 (19.1%) | 51 (80.9%) |
| Health Care & Social Assistance | 57 (29.8%) | 134 (70.2%) |
| Arts, Entertainment & Recreation | 6 (100.0%) | 0 (0.0%) |
| Accommodation & Food Services | 14 (35.9%) | 25 (64.1%) |
| Public Administration | 12 (100.0%) | 0 (0.0%) |
| Total | 533 (55.2%) | 432 (44.8%) |
Education in Upper Brookville
School Enrollment in Upper Brookville
The most common levels of schooling among the 506 students in Upper Brookville are high school (207 | 40.9%), middle school (138 | 27.3%), and college / undergraduate (72 | 14.2%).
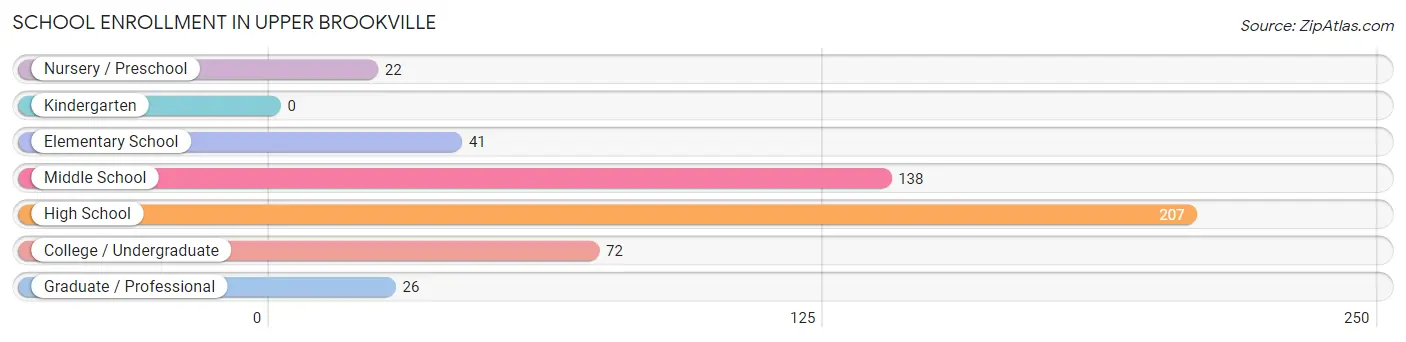
| School Level | # Students | % Students |
| Nursery / Preschool | 22 | 4.3% |
| Kindergarten | 0 | 0.0% |
| Elementary School | 41 | 8.1% |
| Middle School | 138 | 27.3% |
| High School | 207 | 40.9% |
| College / Undergraduate | 72 | 14.2% |
| Graduate / Professional | 26 | 5.1% |
| Total | 506 | 100.0% |
School Enrollment by Age by Funding Source in Upper Brookville
Out of a total of 506 students who are enrolled in schools in Upper Brookville, 166 (32.8%) attend a private institution, while the remaining 340 (67.2%) are enrolled in public schools. The age group of 25 to 34 year olds has the highest likelihood of being enrolled in private schools, with 15 (100.0% in the age bracket) enrolled. Conversely, the age group of 35 years and over has the lowest likelihood of being enrolled in a private school, with 9 (100.0% in the age bracket) attending a public institution.
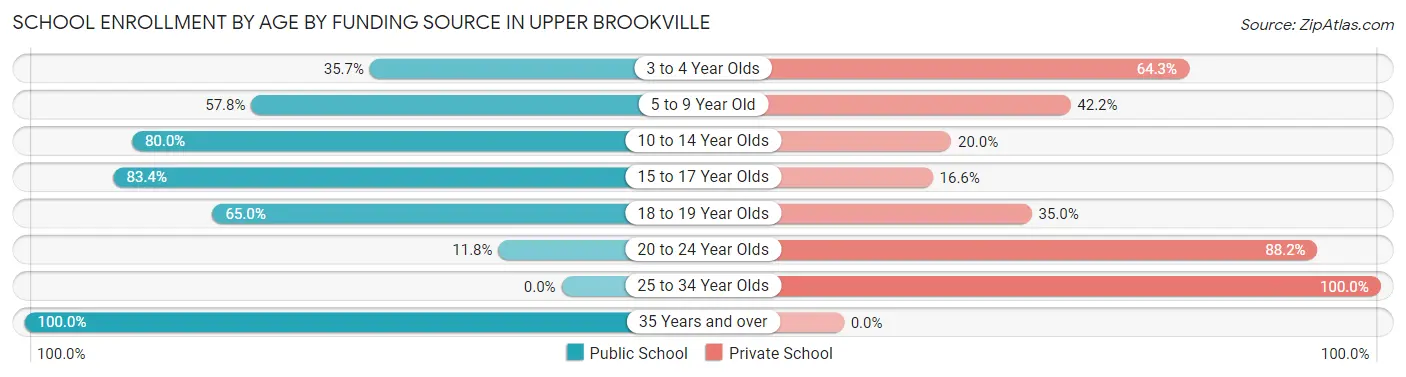
| Age Bracket | Public School | Private School |
| 3 to 4 Year Olds | 5 (35.7%) | 9 (64.3%) |
| 5 to 9 Year Old | 26 (57.8%) | 19 (42.2%) |
| 10 to 14 Year Olds | 124 (80.0%) | 31 (20.0%) |
| 15 to 17 Year Olds | 131 (83.4%) | 26 (16.6%) |
| 18 to 19 Year Olds | 39 (65.0%) | 21 (35.0%) |
| 20 to 24 Year Olds | 6 (11.8%) | 45 (88.2%) |
| 25 to 34 Year Olds | 0 (0.0%) | 15 (100.0%) |
| 35 Years and over | 9 (100.0%) | 0 (0.0%) |
| Total | 340 (67.2%) | 166 (32.8%) |
Educational Attainment by Field of Study in Upper Brookville
Social sciences (184 | 16.6%), science & technology (183 | 16.5%), business (170 | 15.3%), education (99 | 8.9%), and bio, nature & agricultural (79 | 7.1%) are the most common fields of study among 1,112 individuals in Upper Brookville who have obtained a bachelor's degree or higher.
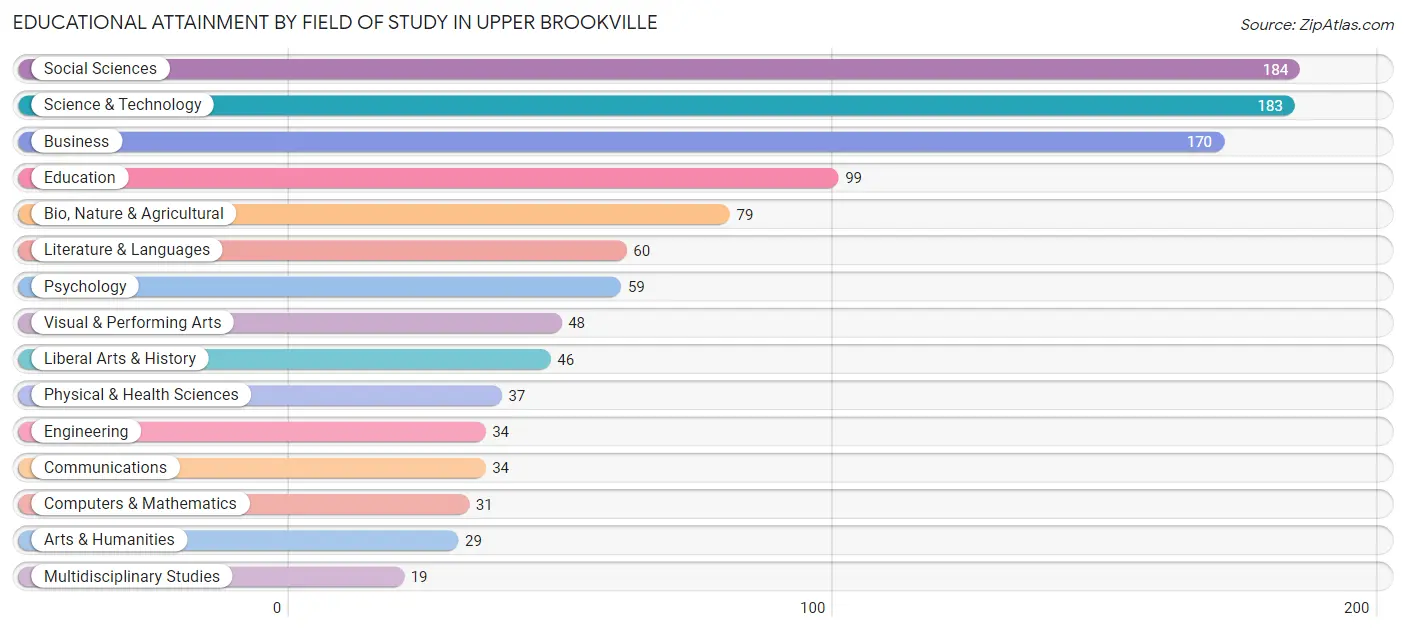
| Field of Study | # Graduates | % Graduates |
| Computers & Mathematics | 31 | 2.8% |
| Bio, Nature & Agricultural | 79 | 7.1% |
| Physical & Health Sciences | 37 | 3.3% |
| Psychology | 59 | 5.3% |
| Social Sciences | 184 | 16.6% |
| Engineering | 34 | 3.1% |
| Multidisciplinary Studies | 19 | 1.7% |
| Science & Technology | 183 | 16.5% |
| Business | 170 | 15.3% |
| Education | 99 | 8.9% |
| Literature & Languages | 60 | 5.4% |
| Liberal Arts & History | 46 | 4.1% |
| Visual & Performing Arts | 48 | 4.3% |
| Communications | 34 | 3.1% |
| Arts & Humanities | 29 | 2.6% |
| Total | 1,112 | 100.0% |
Transportation & Commute in Upper Brookville
Vehicle Availability by Sex in Upper Brookville
The most prevalent vehicle ownership categories in Upper Brookville are males with 2 vehicles (234, accounting for 43.9%) and females with 2 vehicles (99, making up 54.3%).
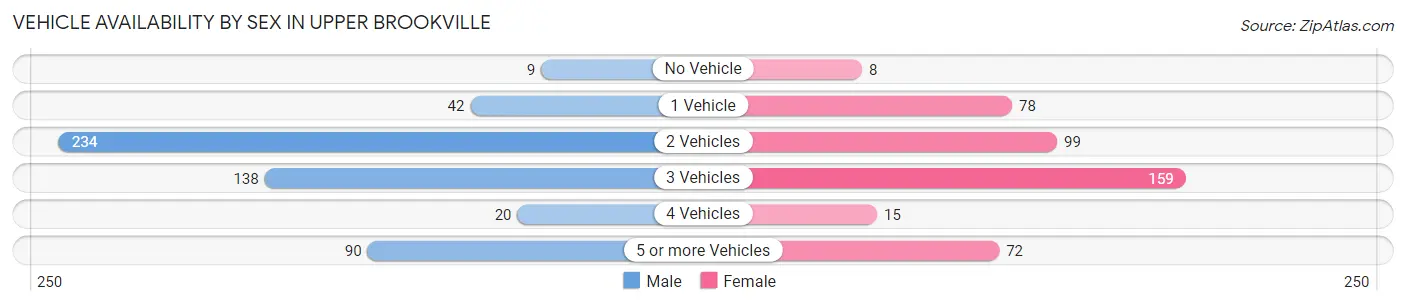
| Vehicles Available | Male | Female |
| No Vehicle | 9 (1.7%) | 8 (1.9%) |
| 1 Vehicle | 42 (7.9%) | 78 (18.1%) |
| 2 Vehicles | 234 (43.9%) | 99 (23.0%) |
| 3 Vehicles | 138 (25.9%) | 159 (36.9%) |
| 4 Vehicles | 20 (3.7%) | 15 (3.5%) |
| 5 or more Vehicles | 90 (16.9%) | 72 (16.7%) |
| Total | 533 (100.0%) | 431 (100.0%) |
Commute Time in Upper Brookville
The most frequently occuring commute durations in Upper Brookville are 60 to 89 minutes (153 commuters, 19.7%), 30 to 34 minutes (149 commuters, 19.2%), and 15 to 19 minutes (125 commuters, 16.1%).
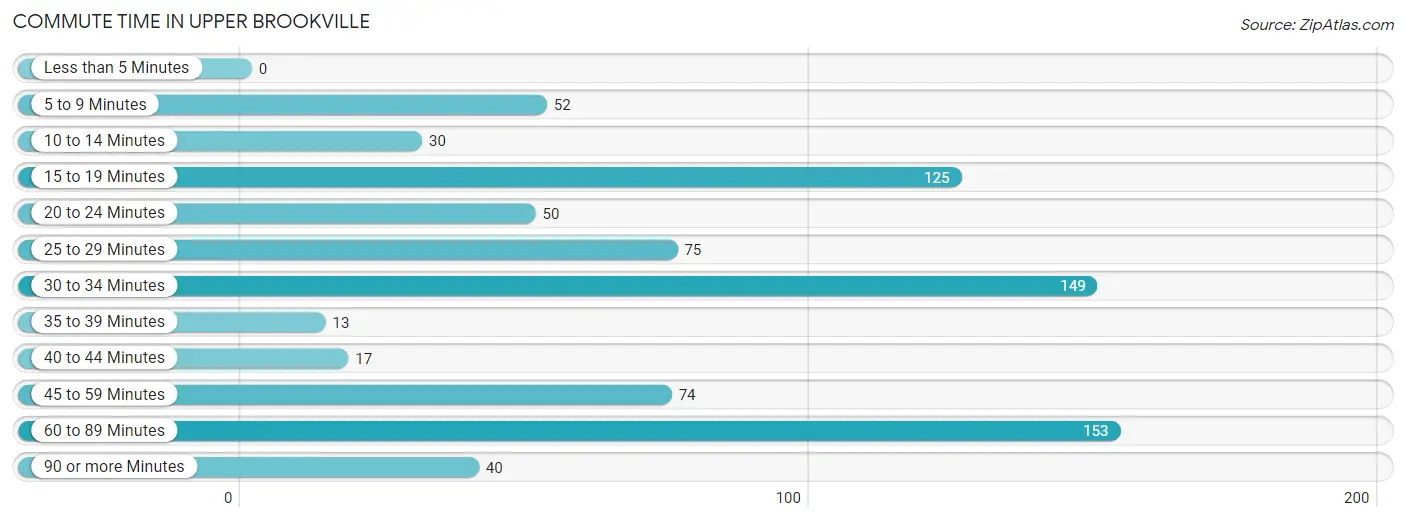
| Commute Time | # Commuters | % Commuters |
| Less than 5 Minutes | 0 | 0.0% |
| 5 to 9 Minutes | 52 | 6.7% |
| 10 to 14 Minutes | 30 | 3.9% |
| 15 to 19 Minutes | 125 | 16.1% |
| 20 to 24 Minutes | 50 | 6.4% |
| 25 to 29 Minutes | 75 | 9.6% |
| 30 to 34 Minutes | 149 | 19.2% |
| 35 to 39 Minutes | 13 | 1.7% |
| 40 to 44 Minutes | 17 | 2.2% |
| 45 to 59 Minutes | 74 | 9.5% |
| 60 to 89 Minutes | 153 | 19.7% |
| 90 or more Minutes | 40 | 5.1% |
Commute Time by Sex in Upper Brookville
The most common commute times in Upper Brookville are 60 to 89 minutes (102 commuters, 25.1%) for males and 15 to 19 minutes (88 commuters, 23.7%) for females.
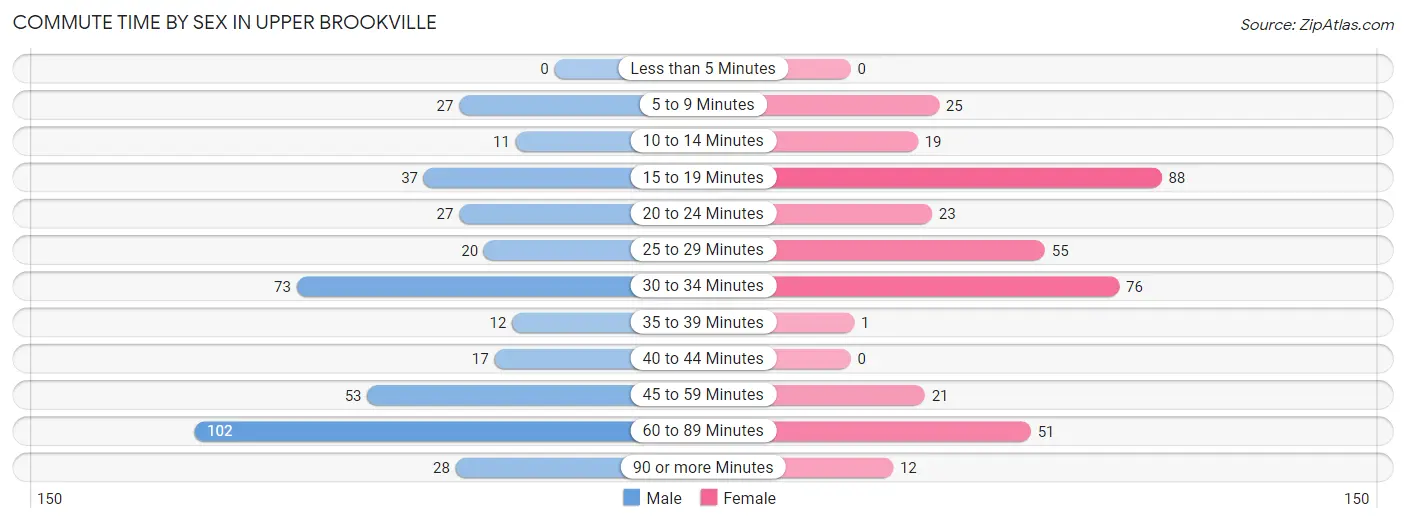
| Commute Time | Male | Female |
| Less than 5 Minutes | 0 (0.0%) | 0 (0.0%) |
| 5 to 9 Minutes | 27 (6.6%) | 25 (6.7%) |
| 10 to 14 Minutes | 11 (2.7%) | 19 (5.1%) |
| 15 to 19 Minutes | 37 (9.1%) | 88 (23.7%) |
| 20 to 24 Minutes | 27 (6.6%) | 23 (6.2%) |
| 25 to 29 Minutes | 20 (4.9%) | 55 (14.8%) |
| 30 to 34 Minutes | 73 (17.9%) | 76 (20.5%) |
| 35 to 39 Minutes | 12 (2.9%) | 1 (0.3%) |
| 40 to 44 Minutes | 17 (4.2%) | 0 (0.0%) |
| 45 to 59 Minutes | 53 (13.0%) | 21 (5.7%) |
| 60 to 89 Minutes | 102 (25.1%) | 51 (13.8%) |
| 90 or more Minutes | 28 (6.9%) | 12 (3.2%) |
Time of Departure to Work by Sex in Upper Brookville
The most frequent times of departure to work in Upper Brookville are 9:00 AM to 9:59 AM (76, 18.7%) for males and 9:00 AM to 9:59 AM (65, 17.5%) for females.
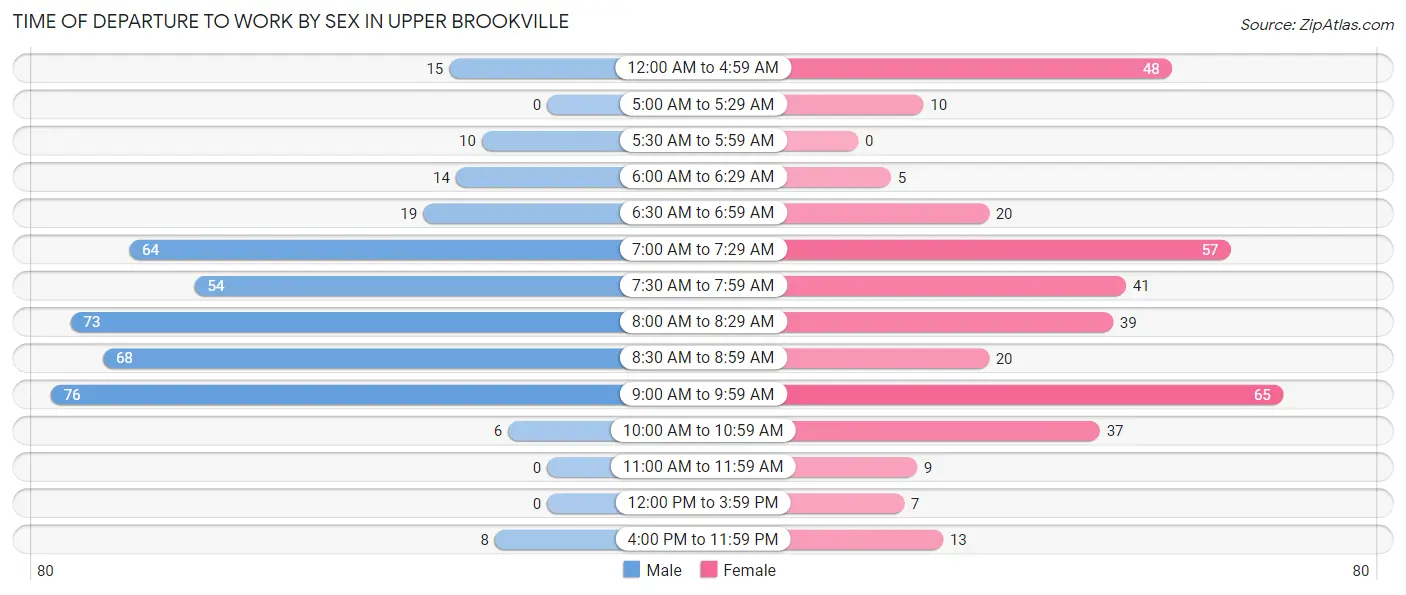
| Time of Departure | Male | Female |
| 12:00 AM to 4:59 AM | 15 (3.7%) | 48 (12.9%) |
| 5:00 AM to 5:29 AM | 0 (0.0%) | 10 (2.7%) |
| 5:30 AM to 5:59 AM | 10 (2.5%) | 0 (0.0%) |
| 6:00 AM to 6:29 AM | 14 (3.4%) | 5 (1.3%) |
| 6:30 AM to 6:59 AM | 19 (4.7%) | 20 (5.4%) |
| 7:00 AM to 7:29 AM | 64 (15.7%) | 57 (15.4%) |
| 7:30 AM to 7:59 AM | 54 (13.3%) | 41 (11.1%) |
| 8:00 AM to 8:29 AM | 73 (17.9%) | 39 (10.5%) |
| 8:30 AM to 8:59 AM | 68 (16.7%) | 20 (5.4%) |
| 9:00 AM to 9:59 AM | 76 (18.7%) | 65 (17.5%) |
| 10:00 AM to 10:59 AM | 6 (1.5%) | 37 (10.0%) |
| 11:00 AM to 11:59 AM | 0 (0.0%) | 9 (2.4%) |
| 12:00 PM to 3:59 PM | 0 (0.0%) | 7 (1.9%) |
| 4:00 PM to 11:59 PM | 8 (2.0%) | 13 (3.5%) |
| Total | 407 (100.0%) | 371 (100.0%) |
Housing Occupancy in Upper Brookville
Occupancy by Ownership in Upper Brookville
Of the total 616 dwellings in Upper Brookville, owner-occupied units account for 555 (90.1%), while renter-occupied units make up 61 (9.9%).
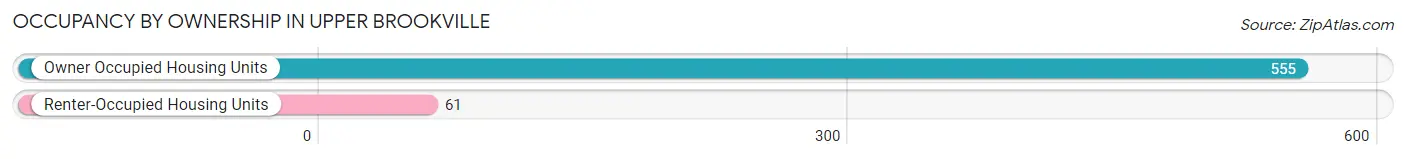
| Occupancy | # Housing Units | % Housing Units |
| Owner Occupied Housing Units | 555 | 90.1% |
| Renter-Occupied Housing Units | 61 | 9.9% |
| Total Occupied Housing Units | 616 | 100.0% |
Occupancy by Household Size in Upper Brookville
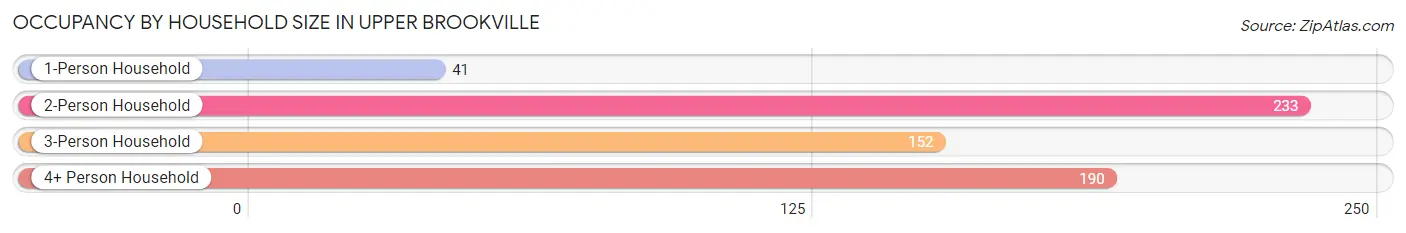
| Household Size | # Housing Units | % Housing Units |
| 1-Person Household | 41 | 6.7% |
| 2-Person Household | 233 | 37.8% |
| 3-Person Household | 152 | 24.7% |
| 4+ Person Household | 190 | 30.8% |
| Total Housing Units | 616 | 100.0% |
Occupancy by Ownership by Household Size in Upper Brookville
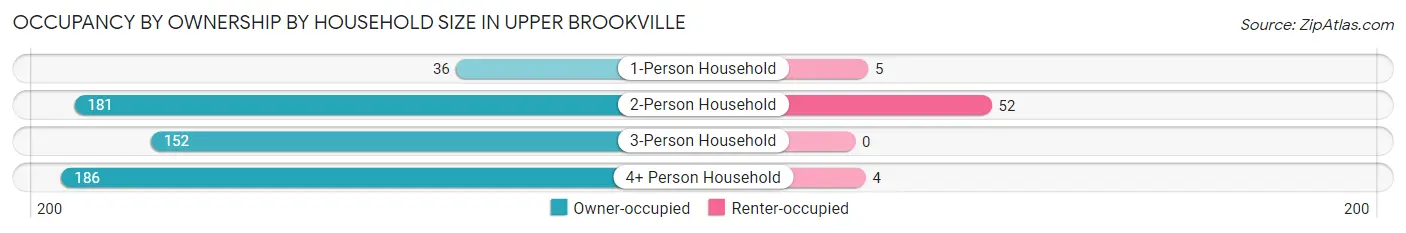
| Household Size | Owner-occupied | Renter-occupied |
| 1-Person Household | 36 (87.8%) | 5 (12.2%) |
| 2-Person Household | 181 (77.7%) | 52 (22.3%) |
| 3-Person Household | 152 (100.0%) | 0 (0.0%) |
| 4+ Person Household | 186 (97.9%) | 4 (2.1%) |
| Total Housing Units | 555 (90.1%) | 61 (9.9%) |
Occupancy by Educational Attainment in Upper Brookville
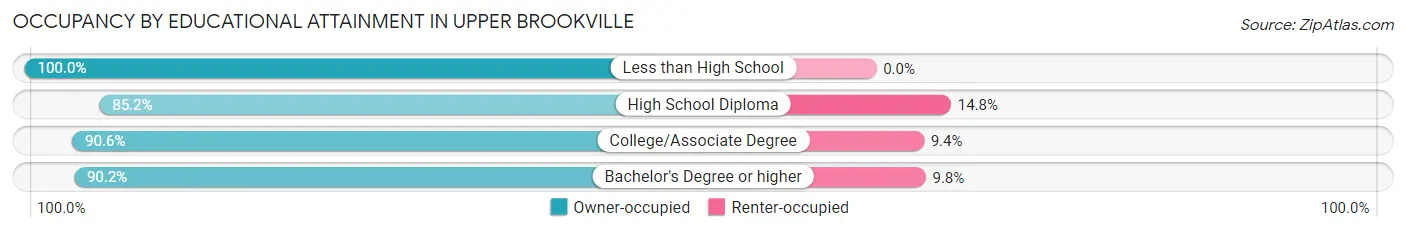
| Household Size | Owner-occupied | Renter-occupied |
| Less than High School | 5 (100.0%) | 0 (0.0%) |
| High School Diploma | 23 (85.2%) | 4 (14.8%) |
| College/Associate Degree | 48 (90.6%) | 5 (9.4%) |
| Bachelor's Degree or higher | 479 (90.2%) | 52 (9.8%) |
Occupancy by Age of Householder in Upper Brookville
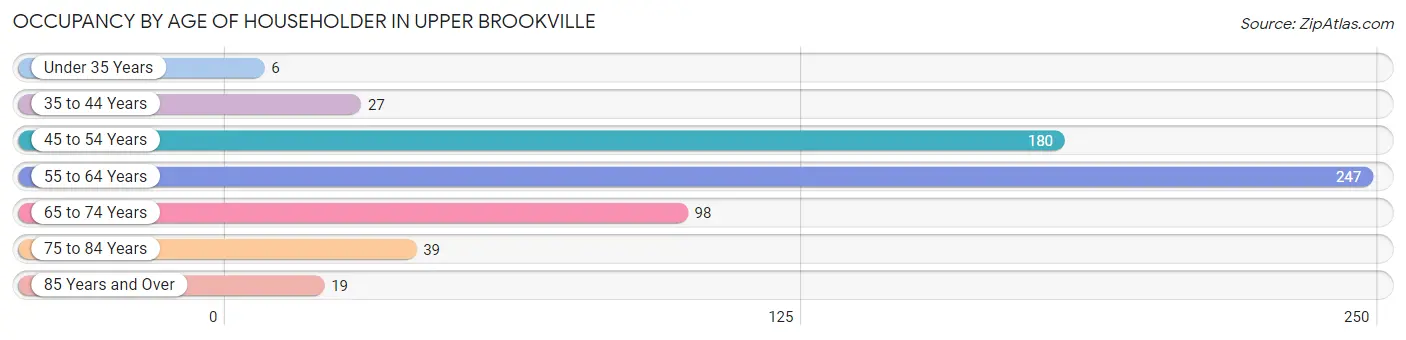
| Age Bracket | # Households | % Households |
| Under 35 Years | 6 | 1.0% |
| 35 to 44 Years | 27 | 4.4% |
| 45 to 54 Years | 180 | 29.2% |
| 55 to 64 Years | 247 | 40.1% |
| 65 to 74 Years | 98 | 15.9% |
| 75 to 84 Years | 39 | 6.3% |
| 85 Years and Over | 19 | 3.1% |
| Total | 616 | 100.0% |
Housing Finances in Upper Brookville
Median Income by Occupancy in Upper Brookville
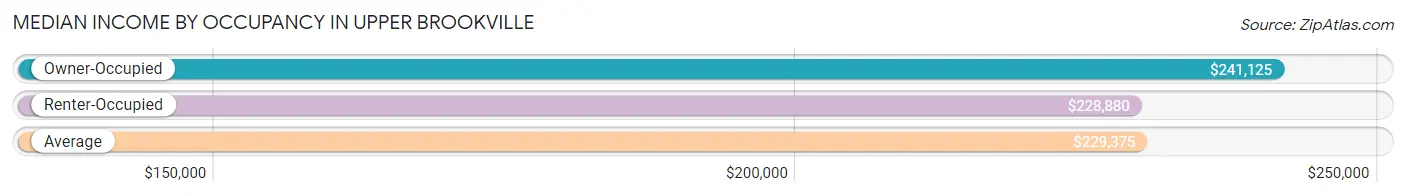
| Occupancy Type | # Households | Median Income |
| Owner-Occupied | 555 (90.1%) | $241,125 |
| Renter-Occupied | 61 (9.9%) | $228,880 |
| Average | 616 (100.0%) | $229,375 |
Occupancy by Householder Income Bracket in Upper Brookville
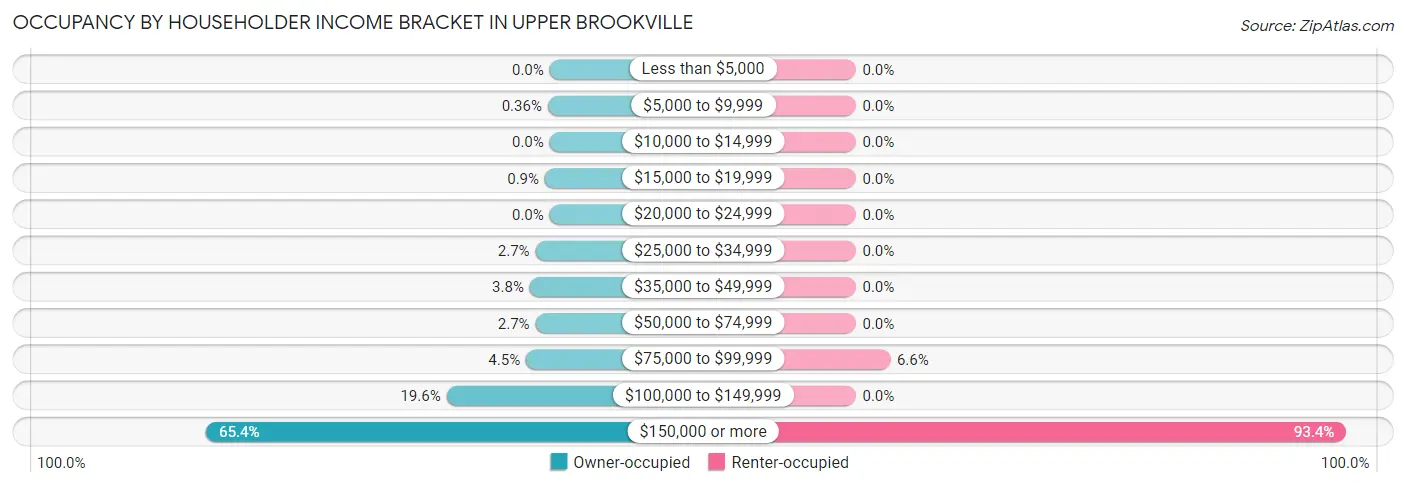
| Income Bracket | Owner-occupied | Renter-occupied |
| Less than $5,000 | 0 (0.0%) | 0 (0.0%) |
| $5,000 to $9,999 | 2 (0.4%) | 0 (0.0%) |
| $10,000 to $14,999 | 0 (0.0%) | 0 (0.0%) |
| $15,000 to $19,999 | 5 (0.9%) | 0 (0.0%) |
| $20,000 to $24,999 | 0 (0.0%) | 0 (0.0%) |
| $25,000 to $34,999 | 15 (2.7%) | 0 (0.0%) |
| $35,000 to $49,999 | 21 (3.8%) | 0 (0.0%) |
| $50,000 to $74,999 | 15 (2.7%) | 0 (0.0%) |
| $75,000 to $99,999 | 25 (4.5%) | 4 (6.6%) |
| $100,000 to $149,999 | 109 (19.6%) | 0 (0.0%) |
| $150,000 or more | 363 (65.4%) | 57 (93.4%) |
| Total | 555 (100.0%) | 61 (100.0%) |
Monthly Housing Cost Tiers in Upper Brookville
| Monthly Cost | Owner-occupied | Renter-occupied |
| Less than $300 | 0 (0.0%) | 0 (0.0%) |
| $300 to $499 | 3 (0.5%) | 0 (0.0%) |
| $500 to $799 | 0 (0.0%) | 0 (0.0%) |
| $800 to $999 | 0 (0.0%) | 0 (0.0%) |
| $1,000 to $1,499 | 16 (2.9%) | 0 (0.0%) |
| $1,500 to $1,999 | 6 (1.1%) | 48 (78.7%) |
| $2,000 to $2,499 | 10 (1.8%) | 4 (6.6%) |
| $2,500 to $2,999 | 41 (7.4%) | 5 (8.2%) |
| $3,000 or more | 479 (86.3%) | 4 (6.6%) |
| Total | 555 (100.0%) | 61 (100.0%) |
Physical Housing Characteristics in Upper Brookville
Housing Structures in Upper Brookville
| Structure Type | # Housing Units | % Housing Units |
| Single Unit, Detached | 555 | 90.1% |
| Single Unit, Attached | 54 | 8.8% |
| 2 Unit Apartments | 0 | 0.0% |
| 3 or 4 Unit Apartments | 4 | 0.6% |
| 5 to 9 Unit Apartments | 3 | 0.5% |
| 10 or more Apartments | 0 | 0.0% |
| Mobile Home / Other | 0 | 0.0% |
| Total | 616 | 100.0% |
Housing Structures by Occupancy in Upper Brookville
| Structure Type | Owner-occupied | Renter-occupied |
| Single Unit, Detached | 546 (98.4%) | 9 (1.6%) |
| Single Unit, Attached | 6 (11.1%) | 48 (88.9%) |
| 2 Unit Apartments | 0 (0.0%) | 0 (0.0%) |
| 3 or 4 Unit Apartments | 0 (0.0%) | 4 (100.0%) |
| 5 to 9 Unit Apartments | 3 (100.0%) | 0 (0.0%) |
| 10 or more Apartments | 0 (0.0%) | 0 (0.0%) |
| Mobile Home / Other | 0 (0.0%) | 0 (0.0%) |
| Total | 555 (90.1%) | 61 (9.9%) |
Housing Structures by Number of Rooms in Upper Brookville
| Number of Rooms | Owner-occupied | Renter-occupied |
| 1 Room | 0 (0.0%) | 0 (0.0%) |
| 2 or 3 Rooms | 0 (0.0%) | 0 (0.0%) |
| 4 or 5 Rooms | 14 (2.5%) | 4 (6.6%) |
| 6 or 7 Rooms | 148 (26.7%) | 48 (78.7%) |
| 8 or more Rooms | 393 (70.8%) | 9 (14.7%) |
| Total | 555 (100.0%) | 61 (100.0%) |
Housing Structure by Heating Type in Upper Brookville
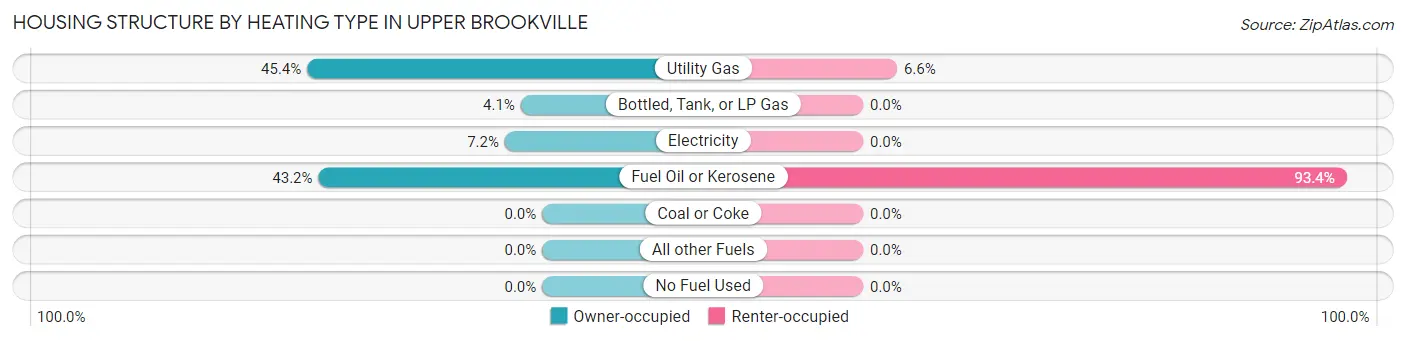
| Heating Type | Owner-occupied | Renter-occupied |
| Utility Gas | 252 (45.4%) | 4 (6.6%) |
| Bottled, Tank, or LP Gas | 23 (4.1%) | 0 (0.0%) |
| Electricity | 40 (7.2%) | 0 (0.0%) |
| Fuel Oil or Kerosene | 240 (43.2%) | 57 (93.4%) |
| Coal or Coke | 0 (0.0%) | 0 (0.0%) |
| All other Fuels | 0 (0.0%) | 0 (0.0%) |
| No Fuel Used | 0 (0.0%) | 0 (0.0%) |
| Total | 555 (100.0%) | 61 (100.0%) |
Household Vehicle Usage in Upper Brookville
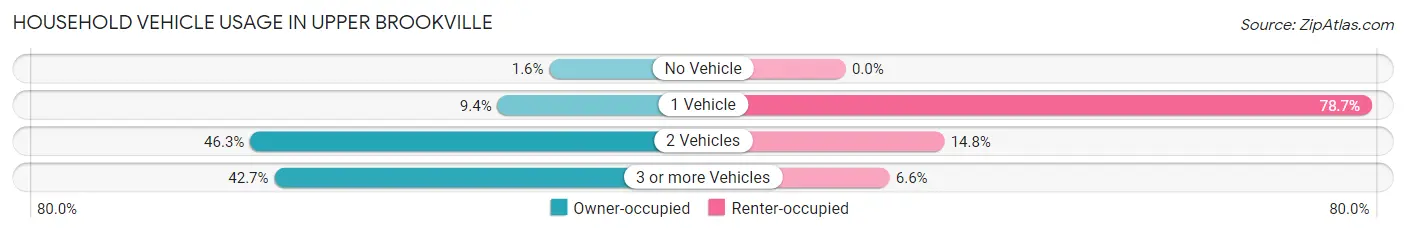
| Vehicles per Household | Owner-occupied | Renter-occupied |
| No Vehicle | 9 (1.6%) | 0 (0.0%) |
| 1 Vehicle | 52 (9.4%) | 48 (78.7%) |
| 2 Vehicles | 257 (46.3%) | 9 (14.7%) |
| 3 or more Vehicles | 237 (42.7%) | 4 (6.6%) |
| Total | 555 (100.0%) | 61 (100.0%) |
Real Estate & Mortgages in Upper Brookville
Real Estate and Mortgage Overview in Upper Brookville
| Characteristic | Without Mortgage | With Mortgage |
| Housing Units | 219 | 336 |
| Median Property Value | $1,875,000 | $1,750,000 |
| Median Household Income | $250,001 | $228 |
| Monthly Housing Costs | $1,501 | $329 |
| Real Estate Taxes | $10,001 | $3 |
Property Value by Mortgage Status in Upper Brookville
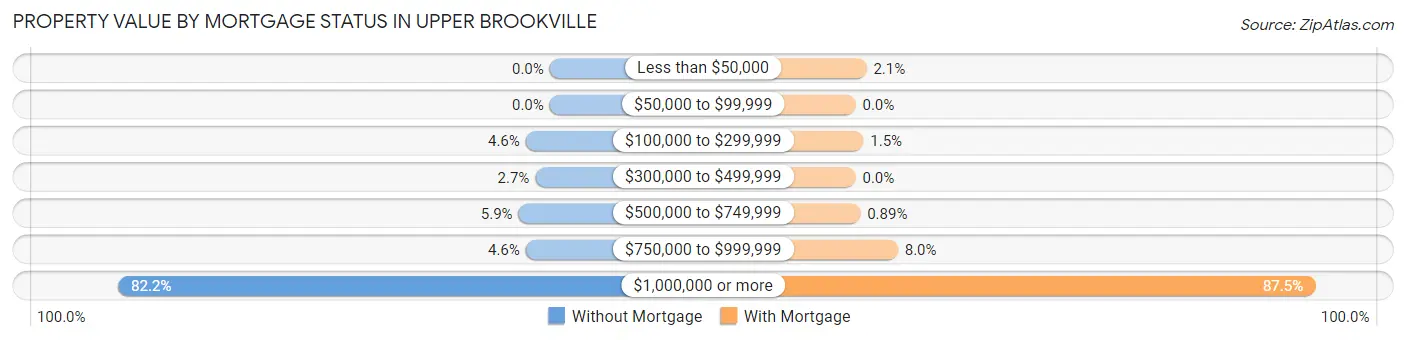
| Property Value | Without Mortgage | With Mortgage |
| Less than $50,000 | 0 (0.0%) | 7 (2.1%) |
| $50,000 to $99,999 | 0 (0.0%) | 0 (0.0%) |
| $100,000 to $299,999 | 10 (4.6%) | 5 (1.5%) |
| $300,000 to $499,999 | 6 (2.7%) | 0 (0.0%) |
| $500,000 to $749,999 | 13 (5.9%) | 3 (0.9%) |
| $750,000 to $999,999 | 10 (4.6%) | 27 (8.0%) |
| $1,000,000 or more | 180 (82.2%) | 294 (87.5%) |
| Total | 219 (100.0%) | 336 (100.0%) |
Household Income by Mortgage Status in Upper Brookville
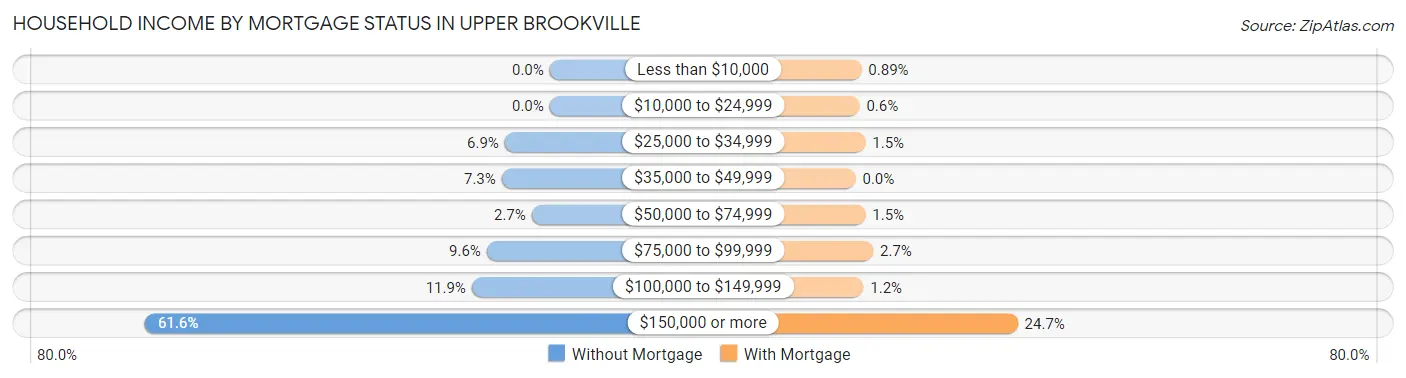
| Household Income | Without Mortgage | With Mortgage |
| Less than $10,000 | 0 (0.0%) | 3 (0.9%) |
| $10,000 to $24,999 | 0 (0.0%) | 2 (0.6%) |
| $25,000 to $34,999 | 15 (6.9%) | 5 (1.5%) |
| $35,000 to $49,999 | 16 (7.3%) | 0 (0.0%) |
| $50,000 to $74,999 | 6 (2.7%) | 5 (1.5%) |
| $75,000 to $99,999 | 21 (9.6%) | 9 (2.7%) |
| $100,000 to $149,999 | 26 (11.9%) | 4 (1.2%) |
| $150,000 or more | 135 (61.6%) | 83 (24.7%) |
| Total | 219 (100.0%) | 336 (100.0%) |
Property Value to Household Income Ratio in Upper Brookville
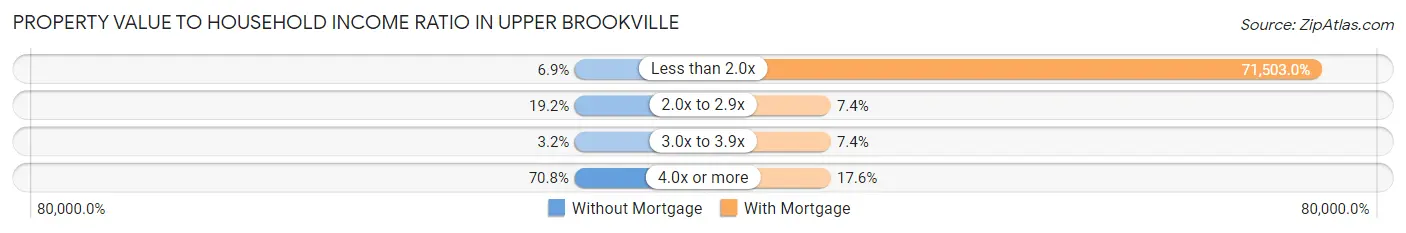
| Value-to-Income Ratio | Without Mortgage | With Mortgage |
| Less than 2.0x | 15 (6.9%) | 240,250 (71,503.0%) |
| 2.0x to 2.9x | 42 (19.2%) | 25 (7.4%) |
| 3.0x to 3.9x | 7 (3.2%) | 25 (7.4%) |
| 4.0x or more | 155 (70.8%) | 59 (17.6%) |
| Total | 219 (100.0%) | 336 (100.0%) |
Real Estate Taxes by Mortgage Status in Upper Brookville
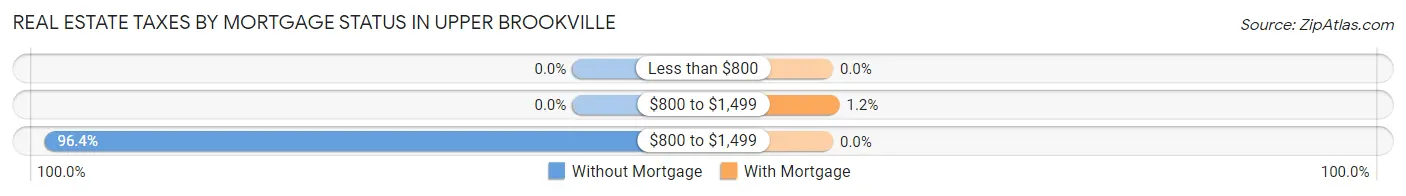
| Property Taxes | Without Mortgage | With Mortgage |
| Less than $800 | 0 (0.0%) | 0 (0.0%) |
| $800 to $1,499 | 0 (0.0%) | 4 (1.2%) |
| $800 to $1,499 | 211 (96.4%) | 0 (0.0%) |
| Total | 219 (100.0%) | 336 (100.0%) |
Health & Disability in Upper Brookville
Health Insurance Coverage by Age in Upper Brookville
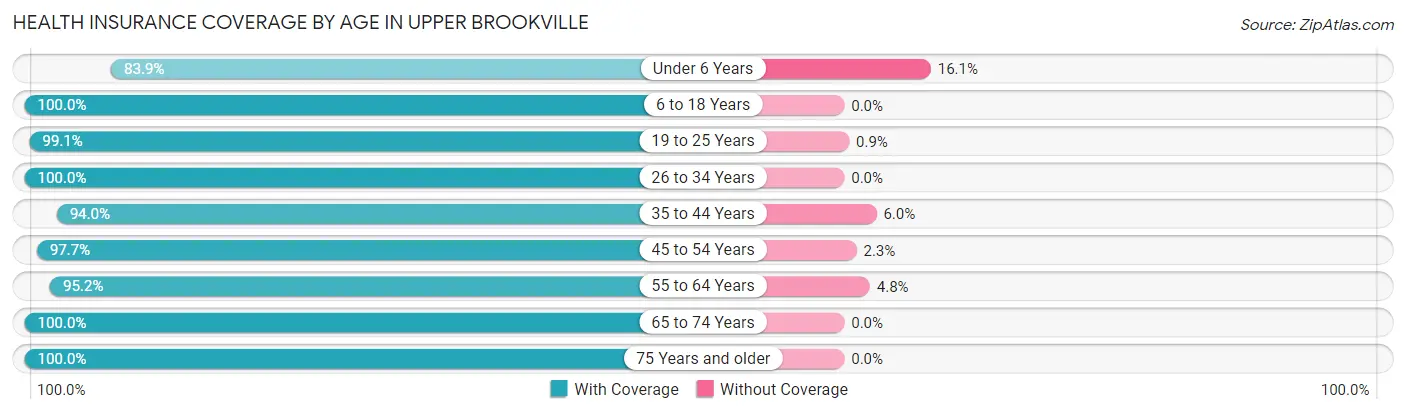
| Age Bracket | With Coverage | Without Coverage |
| Under 6 Years | 26 (83.9%) | 5 (16.1%) |
| 6 to 18 Years | 393 (100.0%) | 0 (0.0%) |
| 19 to 25 Years | 110 (99.1%) | 1 (0.9%) |
| 26 to 34 Years | 94 (100.0%) | 0 (0.0%) |
| 35 to 44 Years | 94 (94.0%) | 6 (6.0%) |
| 45 to 54 Years | 343 (97.7%) | 8 (2.3%) |
| 55 to 64 Years | 480 (95.2%) | 24 (4.8%) |
| 65 to 74 Years | 190 (100.0%) | 0 (0.0%) |
| 75 Years and older | 106 (100.0%) | 0 (0.0%) |
| Total | 1,836 (97.7%) | 44 (2.3%) |
Health Insurance Coverage by Citizenship Status in Upper Brookville
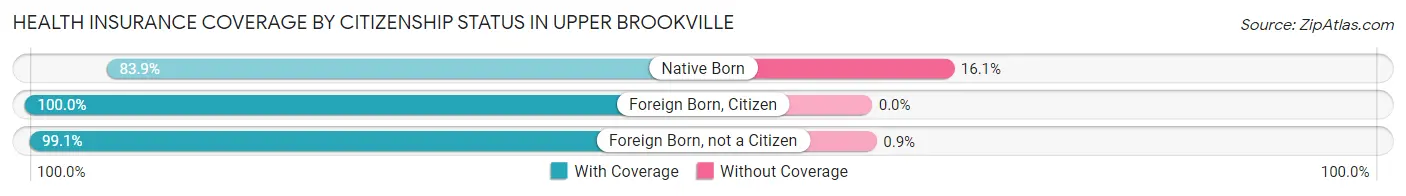
| Citizenship Status | With Coverage | Without Coverage |
| Native Born | 26 (83.9%) | 5 (16.1%) |
| Foreign Born, Citizen | 393 (100.0%) | 0 (0.0%) |
| Foreign Born, not a Citizen | 110 (99.1%) | 1 (0.9%) |
Health Insurance Coverage by Household Income in Upper Brookville
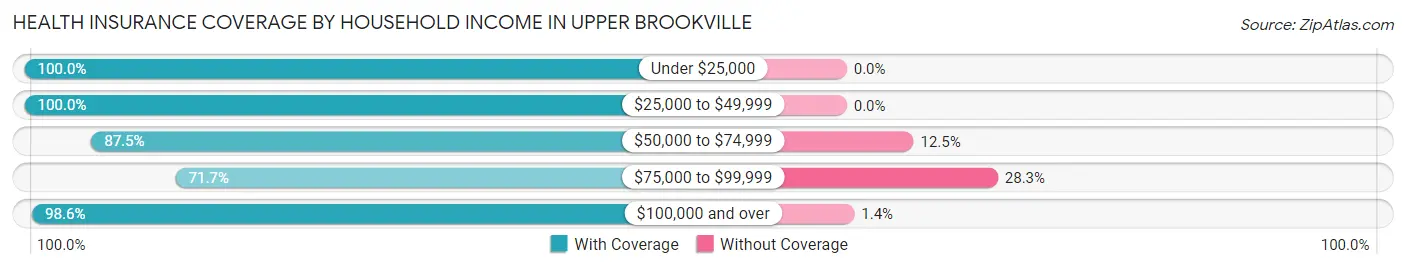
| Household Income | With Coverage | Without Coverage |
| Under $25,000 | 21 (100.0%) | 0 (0.0%) |
| $25,000 to $49,999 | 82 (100.0%) | 0 (0.0%) |
| $50,000 to $74,999 | 28 (87.5%) | 4 (12.5%) |
| $75,000 to $99,999 | 38 (71.7%) | 15 (28.3%) |
| $100,000 and over | 1,663 (98.6%) | 24 (1.4%) |
Public vs Private Health Insurance Coverage by Age in Upper Brookville
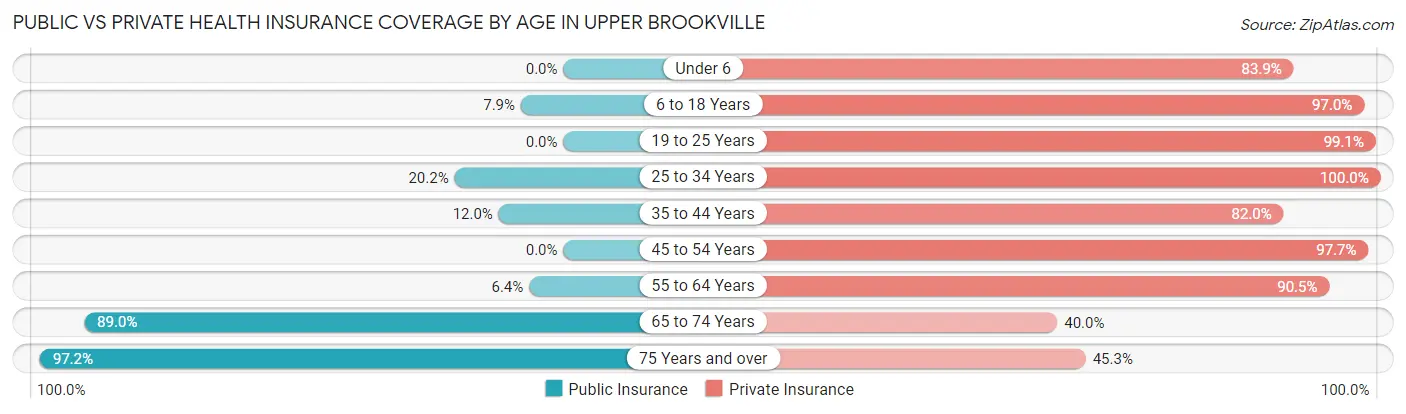
| Age Bracket | Public Insurance | Private Insurance |
| Under 6 | 0 (0.0%) | 26 (83.9%) |
| 6 to 18 Years | 31 (7.9%) | 381 (97.0%) |
| 19 to 25 Years | 0 (0.0%) | 110 (99.1%) |
| 25 to 34 Years | 19 (20.2%) | 94 (100.0%) |
| 35 to 44 Years | 12 (12.0%) | 82 (82.0%) |
| 45 to 54 Years | 0 (0.0%) | 343 (97.7%) |
| 55 to 64 Years | 32 (6.4%) | 456 (90.5%) |
| 65 to 74 Years | 169 (88.9%) | 76 (40.0%) |
| 75 Years and over | 103 (97.2%) | 48 (45.3%) |
| Total | 366 (19.5%) | 1,616 (86.0%) |
Disability Status by Sex by Age in Upper Brookville
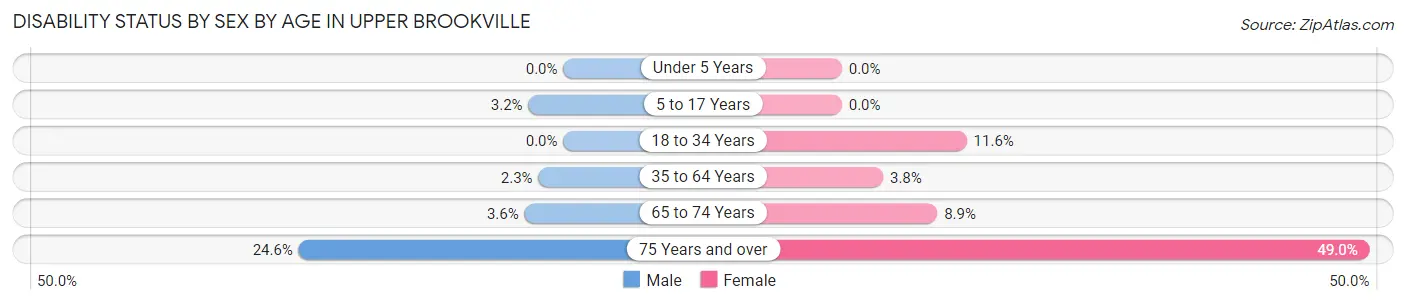
| Age Bracket | Male | Female |
| Under 5 Years | 0 (0.0%) | 0 (0.0%) |
| 5 to 17 Years | 6 (3.2%) | 0 (0.0%) |
| 18 to 34 Years | 0 (0.0%) | 19 (11.6%) |
| 35 to 64 Years | 10 (2.3%) | 20 (3.8%) |
| 65 to 74 Years | 4 (3.6%) | 7 (8.9%) |
| 75 Years and over | 14 (24.6%) | 24 (49.0%) |
Disability Class by Sex by Age in Upper Brookville
Disability Class: Hearing Difficulty
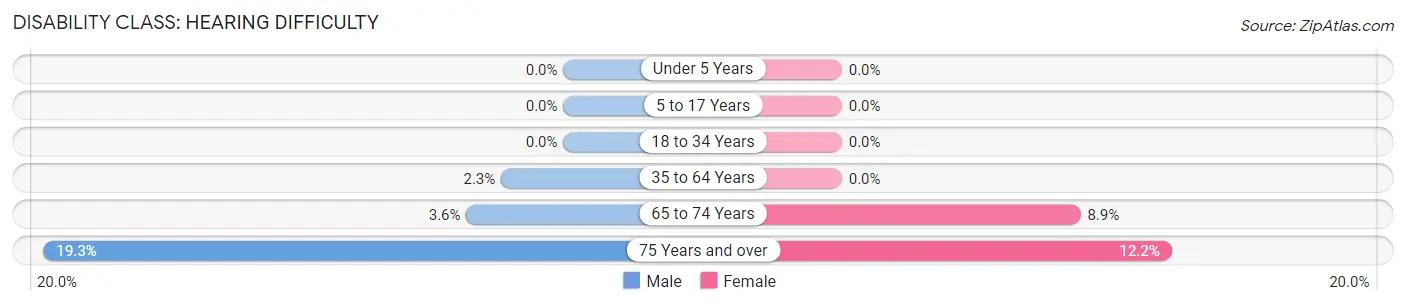
| Age Bracket | Male | Female |
| Under 5 Years | 0 (0.0%) | 0 (0.0%) |
| 5 to 17 Years | 0 (0.0%) | 0 (0.0%) |
| 18 to 34 Years | 0 (0.0%) | 0 (0.0%) |
| 35 to 64 Years | 10 (2.3%) | 0 (0.0%) |
| 65 to 74 Years | 4 (3.6%) | 7 (8.9%) |
| 75 Years and over | 11 (19.3%) | 6 (12.2%) |
Disability Class: Vision Difficulty
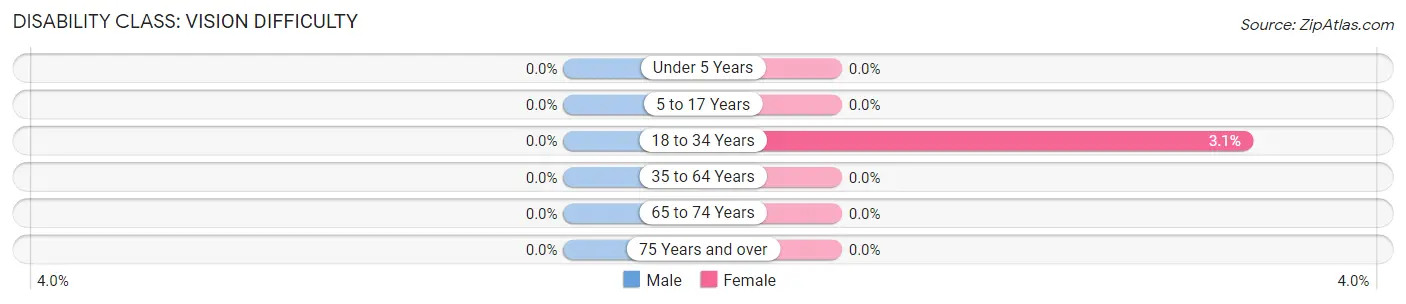
| Age Bracket | Male | Female |
| Under 5 Years | 0 (0.0%) | 0 (0.0%) |
| 5 to 17 Years | 0 (0.0%) | 0 (0.0%) |
| 18 to 34 Years | 0 (0.0%) | 5 (3.0%) |
| 35 to 64 Years | 0 (0.0%) | 0 (0.0%) |
| 65 to 74 Years | 0 (0.0%) | 0 (0.0%) |
| 75 Years and over | 0 (0.0%) | 0 (0.0%) |
Disability Class: Cognitive Difficulty
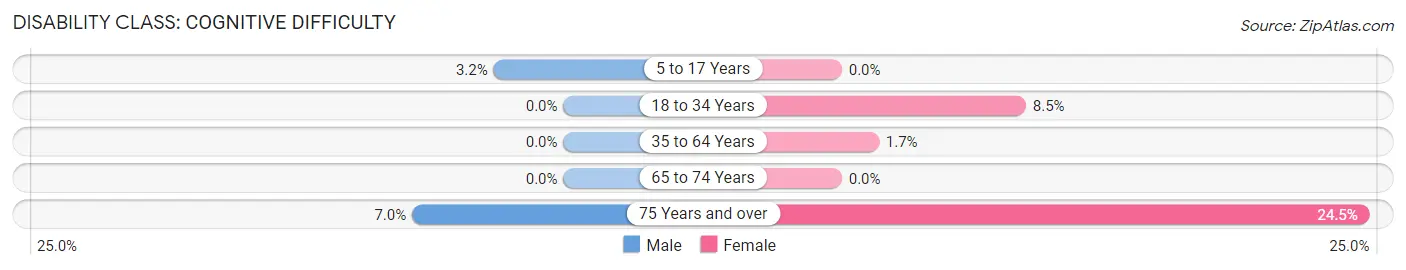
| Age Bracket | Male | Female |
| 5 to 17 Years | 6 (3.2%) | 0 (0.0%) |
| 18 to 34 Years | 0 (0.0%) | 14 (8.5%) |
| 35 to 64 Years | 0 (0.0%) | 9 (1.7%) |
| 65 to 74 Years | 0 (0.0%) | 0 (0.0%) |
| 75 Years and over | 4 (7.0%) | 12 (24.5%) |
Disability Class: Ambulatory Difficulty
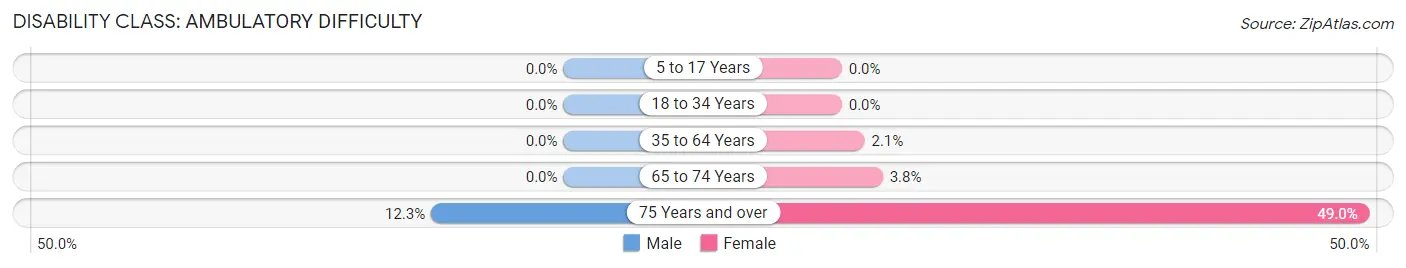
| Age Bracket | Male | Female |
| 5 to 17 Years | 0 (0.0%) | 0 (0.0%) |
| 18 to 34 Years | 0 (0.0%) | 0 (0.0%) |
| 35 to 64 Years | 0 (0.0%) | 11 (2.1%) |
| 65 to 74 Years | 0 (0.0%) | 3 (3.8%) |
| 75 Years and over | 7 (12.3%) | 24 (49.0%) |
Disability Class: Self-Care Difficulty
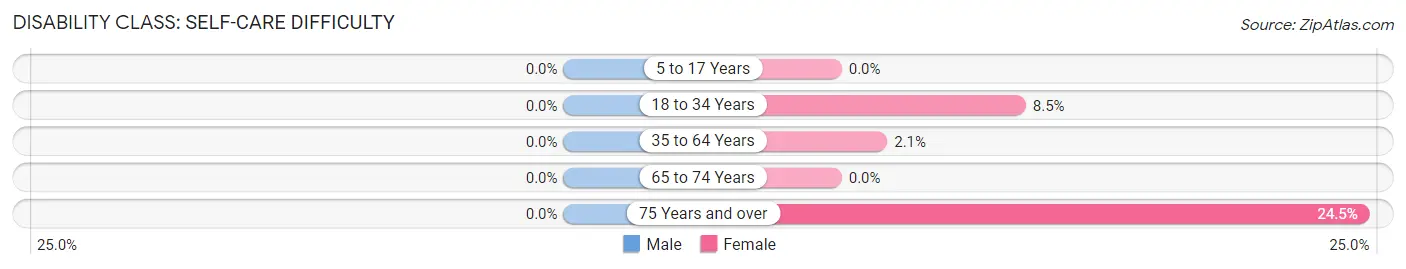
| Age Bracket | Male | Female |
| 5 to 17 Years | 0 (0.0%) | 0 (0.0%) |
| 18 to 34 Years | 0 (0.0%) | 14 (8.5%) |
| 35 to 64 Years | 0 (0.0%) | 11 (2.1%) |
| 65 to 74 Years | 0 (0.0%) | 0 (0.0%) |
| 75 Years and over | 0 (0.0%) | 12 (24.5%) |
Technology Access in Upper Brookville
Computing Device Access in Upper Brookville
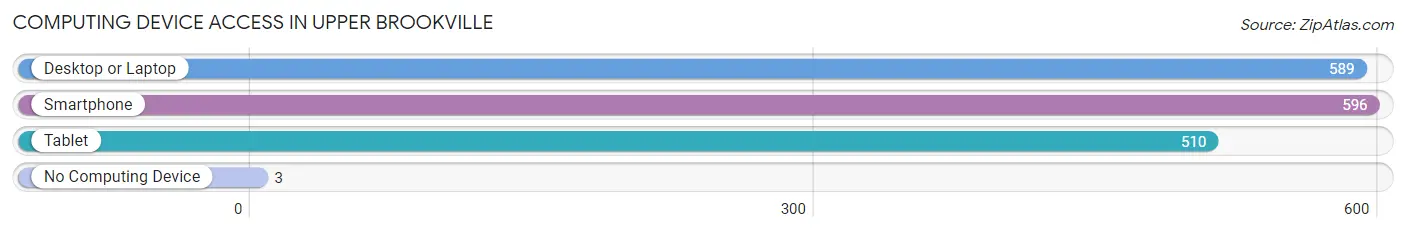
| Device Type | # Households | % Households |
| Desktop or Laptop | 589 | 95.6% |
| Smartphone | 596 | 96.8% |
| Tablet | 510 | 82.8% |
| No Computing Device | 3 | 0.5% |
| Total | 616 | 100.0% |
Internet Access in Upper Brookville
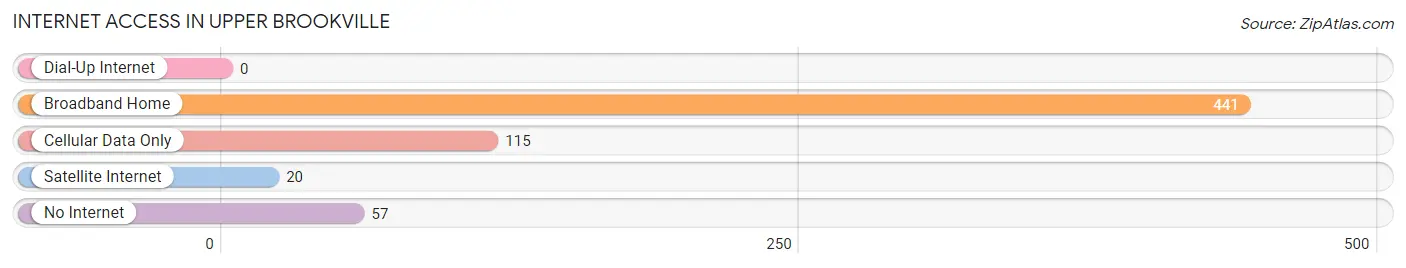
| Internet Type | # Households | % Households |
| Dial-Up Internet | 0 | 0.0% |
| Broadband Home | 441 | 71.6% |
| Cellular Data Only | 115 | 18.7% |
| Satellite Internet | 20 | 3.3% |
| No Internet | 57 | 9.2% |
| Total | 616 | 100.0% |
Upper Brookville Summary
Upper Brookville is a hamlet located in the Town of Oyster Bay in Nassau County, New York. It is situated on the north shore of Long Island, approximately 25 miles east of Manhattan. The hamlet is known for its rural atmosphere and its large estates, many of which are owned by prominent families.
History
Upper Brookville was originally inhabited by the Matinecock Native American tribe. The first European settlers arrived in the area in the late 1600s. The hamlet was originally known as “Upper Matinecock” and was part of the Town of Oyster Bay. In the late 1700s, the hamlet was renamed “Upper Brookville” after the brook that ran through the area.
In the late 1800s, the hamlet began to attract wealthy families from New York City who were looking for a rural retreat. Many of these families built large estates in the area, which still exist today. The hamlet was officially incorporated in 1931.
Geography
Upper Brookville is located in the Town of Oyster Bay in Nassau County, New York. It is situated on the north shore of Long Island, approximately 25 miles east of Manhattan. The hamlet is bordered by the hamlets of Muttontown to the east, Old Brookville to the south, and Brookville to the west.
The hamlet is mostly rural, with large estates and wooded areas. The main roads in the hamlet are Northern Boulevard, Oyster Bay Road, and Jericho Turnpike. The hamlet is served by the Oyster Bay-East Norwich School District.
Economy
Upper Brookville is a primarily residential community, with most of its residents employed in nearby towns and cities. The hamlet is home to several small businesses, including a few restaurants, a grocery store, and a few retail stores.
The hamlet is also home to several large estates, many of which are owned by prominent families. These estates are often used for weddings, corporate events, and other special occasions.
Demographics
As of the 2010 census, the population of Upper Brookville was 2,936. The median household income was $164,000, and the median home value was $1,072,000. The population is primarily white (94.3%), with a small percentage of Asian (2.2%) and Hispanic (1.7%) residents.
Conclusion
Upper Brookville is a hamlet located in the Town of Oyster Bay in Nassau County, New York. It is situated on the north shore of Long Island, approximately 25 miles east of Manhattan. The hamlet is known for its rural atmosphere and its large estates, many of which are owned by prominent families. The hamlet is mostly residential, with most of its residents employed in nearby towns and cities. The population is primarily white, with a small percentage of Asian and Hispanic residents.
Common Questions
What is Per Capita Income in Upper Brookville?
Per Capita income in Upper Brookville is $111,325.
What is the Median Family Income in Upper Brookville?
Median Family Income in Upper Brookville is $229,271.
What is the Median Household income in Upper Brookville?
Median Household Income in Upper Brookville is $229,375.
What is Income or Wage Gap in Upper Brookville?
Income or Wage Gap in Upper Brookville is 25.4%.
Women in Upper Brookville earn 74.6 cents for every dollar earned by a man.
What is Family Income Deficit in Upper Brookville?
Family Income Deficit in Upper Brookville is $8,425.
Families that are below poverty line in Upper Brookville earn $8,425 less on average than the poverty threshold level.
What is Inequality or Gini Index in Upper Brookville?
Inequality or Gini Index in Upper Brookville is 0.45.
What is the Total Population of Upper Brookville?
Total Population of Upper Brookville is 1,880.
What is the Total Male Population of Upper Brookville?
Total Male Population of Upper Brookville is 881.
What is the Total Female Population of Upper Brookville?
Total Female Population of Upper Brookville is 999.
What is the Ratio of Males per 100 Females in Upper Brookville?
There are 88.19 Males per 100 Females in Upper Brookville.
What is the Ratio of Females per 100 Males in Upper Brookville?
There are 113.39 Females per 100 Males in Upper Brookville.
What is the Median Population Age in Upper Brookville?
Median Population Age in Upper Brookville is 52.0 Years.
What is the Average Family Size in Upper Brookville
Average Family Size in Upper Brookville is 3.2 People.
What is the Average Household Size in Upper Brookville
Average Household Size in Upper Brookville is 3.0 People.
How Large is the Labor Force in Upper Brookville?
There are 1,013 People in the Labor Forcein in Upper Brookville.
What is the Percentage of People in the Labor Force in Upper Brookville?
63.1% of People are in the Labor Force in Upper Brookville.
What is the Unemployment Rate in Upper Brookville?
Unemployment Rate in Upper Brookville is 4.7%.