East Atlantic Beach, NY Map & Demographics
East Atlantic Beach Map
East Atlantic Beach Overview
$74,408
PER CAPITA INCOME
$151,250
AVG FAMILY INCOME
$142,757
AVG HOUSEHOLD INCOME
69.5%
WAGE / INCOME GAP [ % ]
30.5¢/ $1
WAGE / INCOME GAP [ $ ]
0.40
INEQUALITY / GINI INDEX
1,767
TOTAL POPULATION
862
MALE POPULATION
905
FEMALE POPULATION
95.25
MALES / 100 FEMALES
104.99
FEMALES / 100 MALES
48.9
MEDIAN AGE
2.6
AVG FAMILY SIZE
2.3
AVG HOUSEHOLD SIZE
1,135
LABOR FORCE [ PEOPLE ]
74.8%
PERCENT IN LABOR FORCE
9.8%
UNEMPLOYMENT RATE
East Atlantic Beach Area Codes
Income in East Atlantic Beach
Income Overview in East Atlantic Beach
Per Capita Income in East Atlantic Beach is $74,408, while median incomes of families and households are $151,250 and $142,757 respectively.
| Characteristic | Number | Measure |
| Per Capita Income | 1,767 | $74,408 |
| Median Family Income | 568 | $151,250 |
| Mean Family Income | 568 | $186,583 |
| Median Household Income | 765 | $142,757 |
| Mean Household Income | 765 | $170,298 |
| Income Deficit | 568 | $0 |
| Wage / Income Gap (%) | 1,767 | 69.45% |
| Wage / Income Gap ($) | 1,767 | 30.55¢ per $1 |
| Gini / Inequality Index | 1,767 | 0.40 |
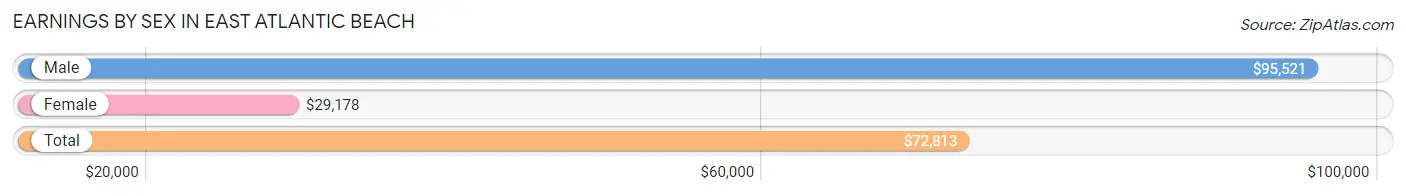
Earnings by Sex in East Atlantic Beach
Average Earnings in East Atlantic Beach are $72,813, $95,521 for men and $29,178 for women, a difference of 69.5%.
| Sex | Number | Average Earnings |
| Male | 645 (55.3%) | $95,521 |
| Female | 522 (44.7%) | $29,178 |
| Total | 1,167 (100.0%) | $72,813 |
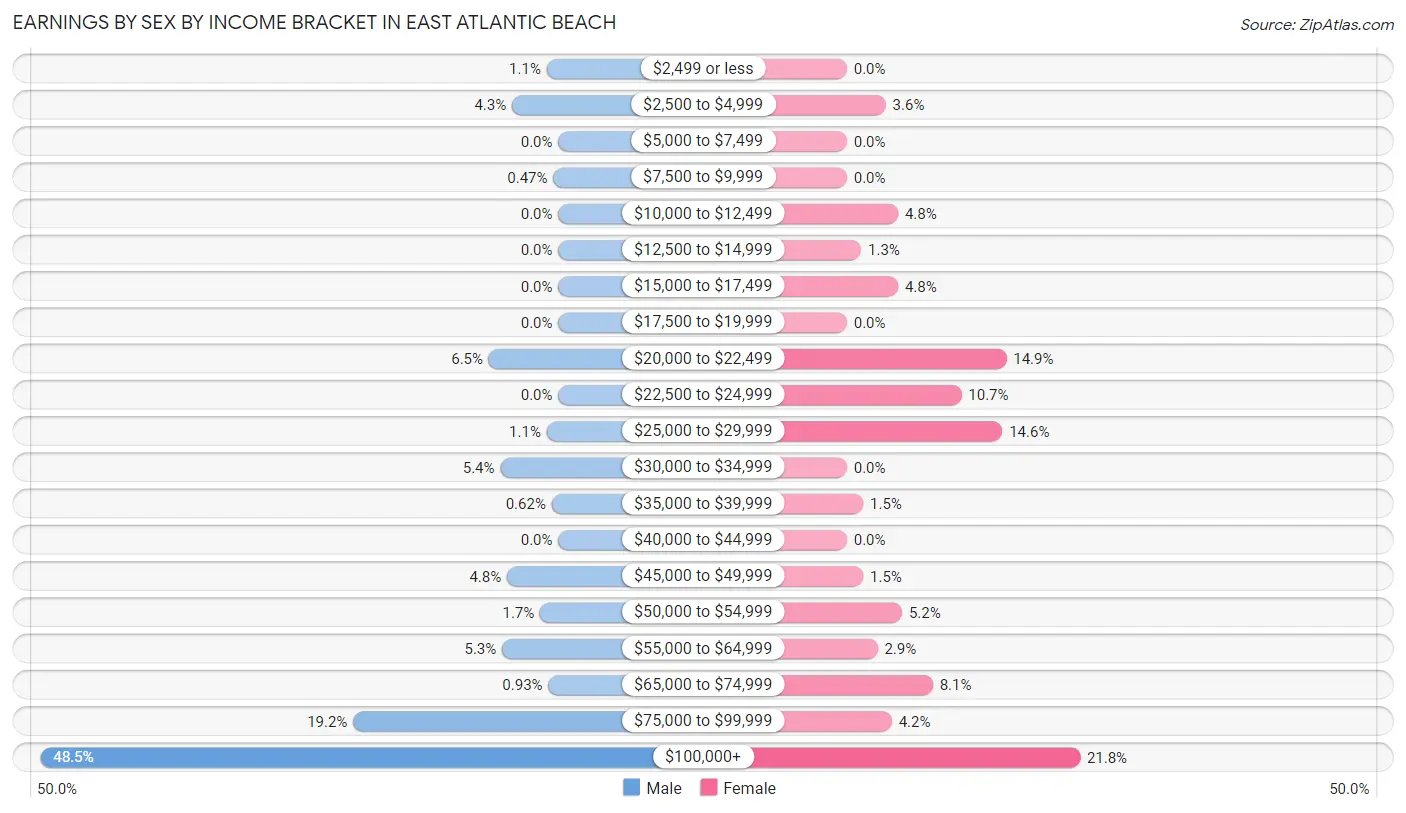
Earnings by Sex by Income Bracket in East Atlantic Beach
The most common earnings brackets in East Atlantic Beach are $100,000+ for men (313 | 48.5%) and $100,000+ for women (114 | 21.8%).
| Income | Male | Female |
| $2,499 or less | 7 (1.1%) | 0 (0.0%) |
| $2,500 to $4,999 | 28 (4.3%) | 19 (3.6%) |
| $5,000 to $7,499 | 0 (0.0%) | 0 (0.0%) |
| $7,500 to $9,999 | 3 (0.5%) | 0 (0.0%) |
| $10,000 to $12,499 | 0 (0.0%) | 25 (4.8%) |
| $12,500 to $14,999 | 0 (0.0%) | 7 (1.3%) |
| $15,000 to $17,499 | 0 (0.0%) | 25 (4.8%) |
| $17,500 to $19,999 | 0 (0.0%) | 0 (0.0%) |
| $20,000 to $22,499 | 42 (6.5%) | 78 (14.9%) |
| $22,500 to $24,999 | 0 (0.0%) | 56 (10.7%) |
| $25,000 to $29,999 | 7 (1.1%) | 76 (14.6%) |
| $30,000 to $34,999 | 35 (5.4%) | 0 (0.0%) |
| $35,000 to $39,999 | 4 (0.6%) | 8 (1.5%) |
| $40,000 to $44,999 | 0 (0.0%) | 0 (0.0%) |
| $45,000 to $49,999 | 31 (4.8%) | 8 (1.5%) |
| $50,000 to $54,999 | 11 (1.7%) | 27 (5.2%) |
| $55,000 to $64,999 | 34 (5.3%) | 15 (2.9%) |
| $65,000 to $74,999 | 6 (0.9%) | 42 (8.1%) |
| $75,000 to $99,999 | 124 (19.2%) | 22 (4.2%) |
| $100,000+ | 313 (48.5%) | 114 (21.8%) |
| Total | 645 (100.0%) | 522 (100.0%) |
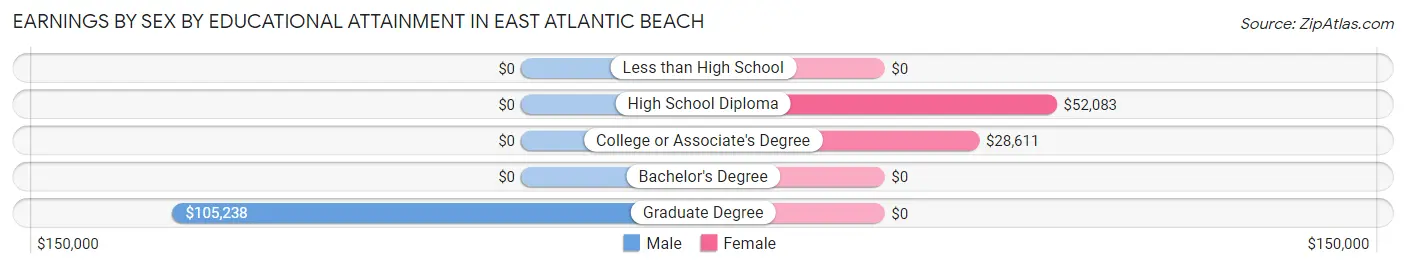
Earnings by Sex by Educational Attainment in East Atlantic Beach
Average earnings in East Atlantic Beach are $96,458 for men and $51,944 for women, a difference of 46.2%. Men with an educational attainment of graduate degree enjoy the highest average annual earnings of $105,238, while those with graduate degree education earn the least with $105,238. Women with an educational attainment of high school diploma earn the most with the average annual earnings of $52,083, while those with college or associate's degree education have the smallest earnings of $28,611.
| Educational Attainment | Male Income | Female Income |
| Less than High School | - | - |
| High School Diploma | - | - |
| College or Associate's Degree | - | - |
| Bachelor's Degree | - | - |
| Graduate Degree | $105,238 | $0 |
| Total | $96,458 | $51,944 |
Family Income in East Atlantic Beach
Family Income Brackets in East Atlantic Beach
According to the East Atlantic Beach family income data, there are 184 families falling into the $200,000+ income range, which is the most common income bracket and makes up 32.4% of all families.
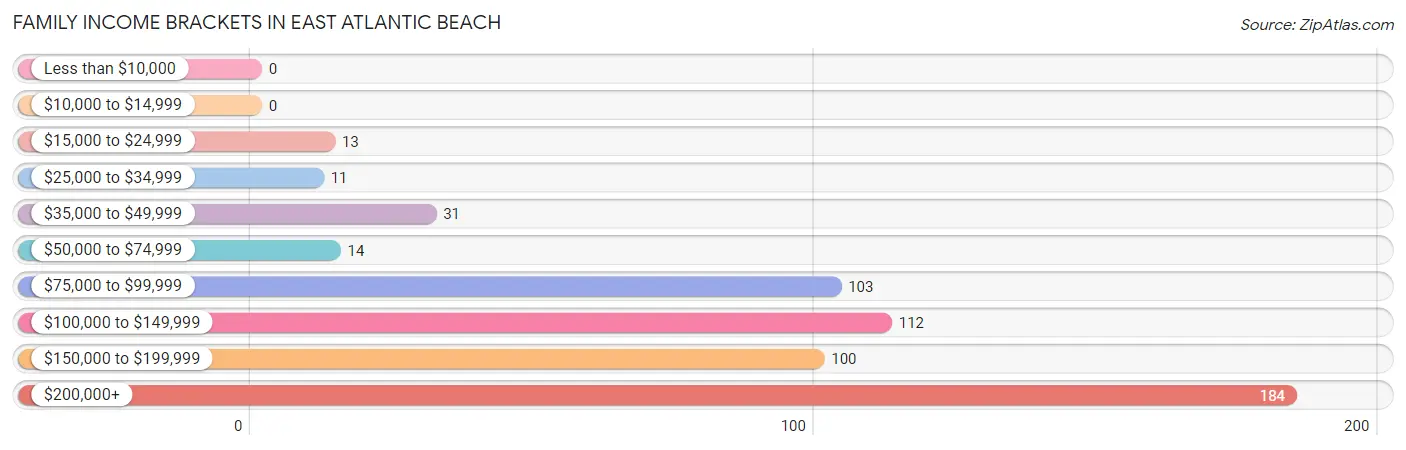
| Income Bracket | # Families | % Families |
| Less than $10,000 | 0 | 0.0% |
| $10,000 to $14,999 | 0 | 0.0% |
| $15,000 to $24,999 | 13 | 2.3% |
| $25,000 to $34,999 | 11 | 1.9% |
| $35,000 to $49,999 | 31 | 5.5% |
| $50,000 to $74,999 | 14 | 2.5% |
| $75,000 to $99,999 | 103 | 18.1% |
| $100,000 to $149,999 | 112 | 19.7% |
| $150,000 to $199,999 | 100 | 17.6% |
| $200,000+ | 184 | 32.4% |
Family Income by Famaliy Size in East Atlantic Beach
3-person families (114 | 20.1%) account for the highest median family income in East Atlantic Beach with $173,421 per family, while 2-person families (360 | 63.4%) have the highest median income of $77,537 per family member.
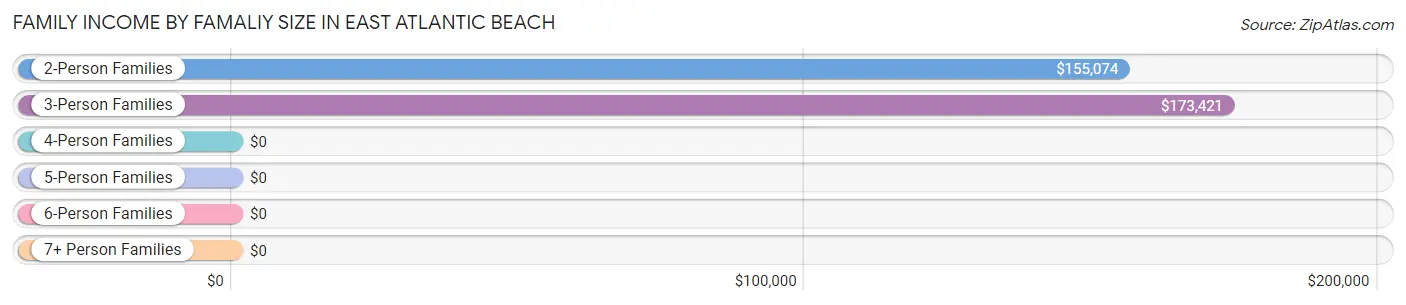
| Income Bracket | # Families | Median Income |
| 2-Person Families | 360 (63.4%) | $155,074 |
| 3-Person Families | 114 (20.1%) | $173,421 |
| 4-Person Families | 81 (14.3%) | $0 |
| 5-Person Families | 13 (2.3%) | $0 |
| 6-Person Families | 0 (0.0%) | $0 |
| 7+ Person Families | 0 (0.0%) | $0 |
| Total | 568 (100.0%) | $151,250 |
Family Income by Number of Earners in East Atlantic Beach
The median family income in East Atlantic Beach is $151,250, with families comprising 2 earners (359) having the highest median family income of $191,406, while families with 1 earner (146) have the lowest median family income of $84,268, accounting for 63.2% and 25.7% of families, respectively.
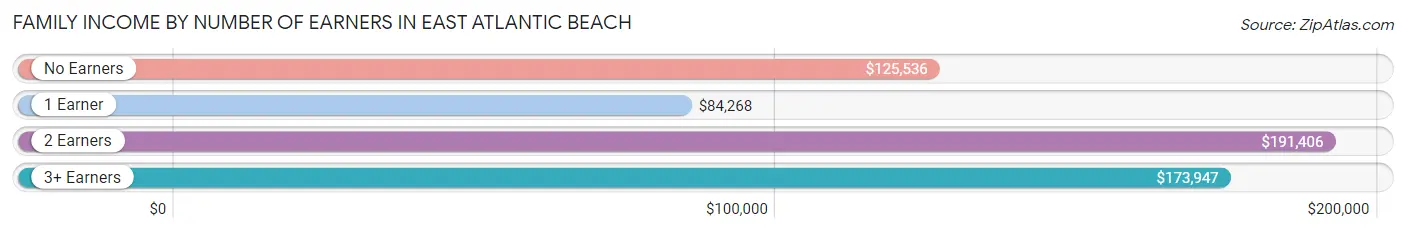
| Number of Earners | # Families | Median Income |
| No Earners | 27 (4.8%) | $125,536 |
| 1 Earner | 146 (25.7%) | $84,268 |
| 2 Earners | 359 (63.2%) | $191,406 |
| 3+ Earners | 36 (6.3%) | $173,947 |
| Total | 568 (100.0%) | $151,250 |
Household Income in East Atlantic Beach
Household Income Brackets in East Atlantic Beach
With 233 households falling in the category, the $200,000+ income range is the most frequent in East Atlantic Beach, accounting for 30.5% of all households.
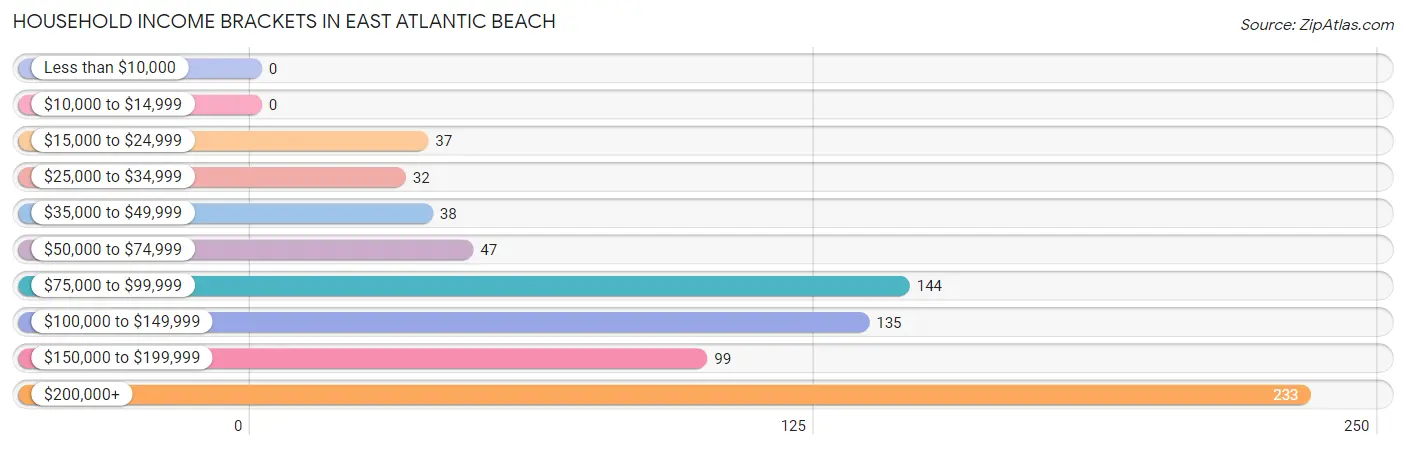
| Income Bracket | # Households | % Households |
| Less than $10,000 | 0 | 0.0% |
| $10,000 to $14,999 | 0 | 0.0% |
| $15,000 to $24,999 | 37 | 4.8% |
| $25,000 to $34,999 | 32 | 4.2% |
| $35,000 to $49,999 | 38 | 5.0% |
| $50,000 to $74,999 | 47 | 6.1% |
| $75,000 to $99,999 | 144 | 18.8% |
| $100,000 to $149,999 | 135 | 17.6% |
| $150,000 to $199,999 | 99 | 12.9% |
| $200,000+ | 233 | 30.5% |
Household Income by Householder Age in East Atlantic Beach
The median household income in East Atlantic Beach is $142,757, with the highest median household income of $172,500 found in the 25 to 44 years age bracket for the primary householder. A total of 150 households (19.6%) fall into this category.
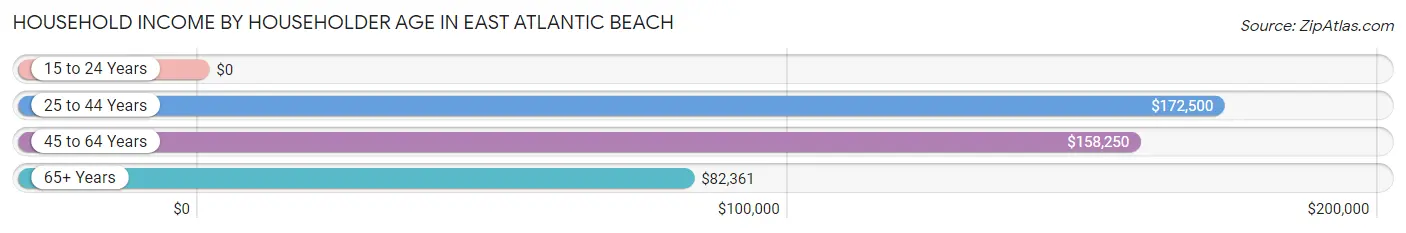
| Income Bracket | # Households | Median Income |
| 15 to 24 Years | 0 (0.0%) | $0 |
| 25 to 44 Years | 150 (19.6%) | $172,500 |
| 45 to 64 Years | 370 (48.4%) | $158,250 |
| 65+ Years | 245 (32.0%) | $82,361 |
| Total | 765 (100.0%) | $142,757 |
Poverty in East Atlantic Beach
Income Below Poverty by Sex and Age in East Atlantic Beach
With 7.8% poverty level for males and 5.4% for females among the residents of East Atlantic Beach, 6 to 11 year old males and 12 to 14 year old females are the most vulnerable to poverty, with 14 males (100.0%) and 14 females (100.0%) in their respective age groups living below the poverty level.
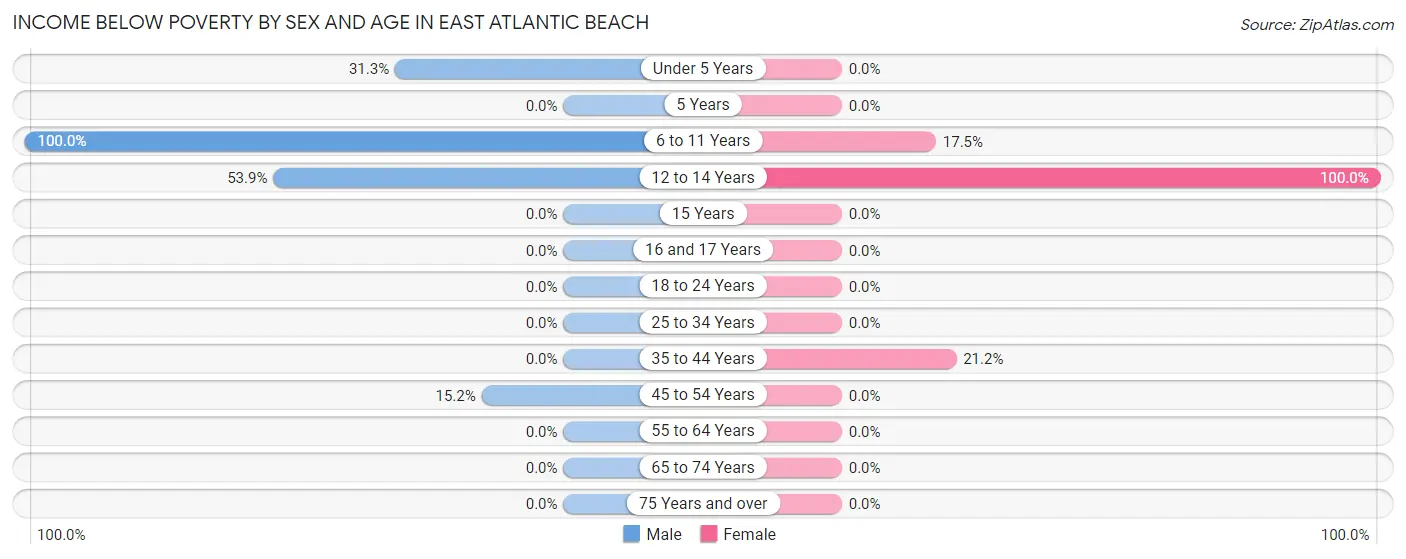
| Age Bracket | Male | Female |
| Under 5 Years | 10 (31.2%) | 0 (0.0%) |
| 5 Years | 0 (0.0%) | 0 (0.0%) |
| 6 to 11 Years | 14 (100.0%) | 11 (17.5%) |
| 12 to 14 Years | 14 (53.8%) | 14 (100.0%) |
| 15 Years | 0 (0.0%) | 0 (0.0%) |
| 16 and 17 Years | 0 (0.0%) | 0 (0.0%) |
| 18 to 24 Years | 0 (0.0%) | 0 (0.0%) |
| 25 to 34 Years | 0 (0.0%) | 0 (0.0%) |
| 35 to 44 Years | 0 (0.0%) | 24 (21.2%) |
| 45 to 54 Years | 29 (15.2%) | 0 (0.0%) |
| 55 to 64 Years | 0 (0.0%) | 0 (0.0%) |
| 65 to 74 Years | 0 (0.0%) | 0 (0.0%) |
| 75 Years and over | 0 (0.0%) | 0 (0.0%) |
| Total | 67 (7.8%) | 49 (5.4%) |
Income Above Poverty by Sex and Age in East Atlantic Beach
According to the poverty statistics in East Atlantic Beach, males aged 5 years and females aged under 5 years are the age groups that are most secure financially, with 100.0% of males and 100.0% of females in these age groups living above the poverty line.
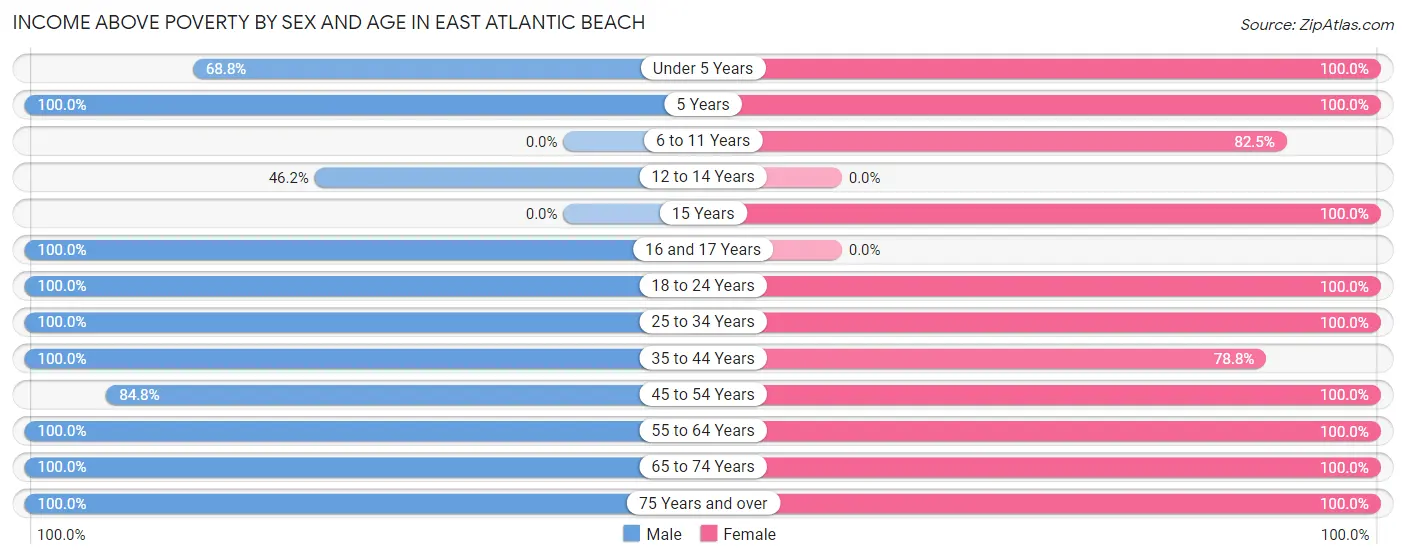
| Age Bracket | Male | Female |
| Under 5 Years | 22 (68.8%) | 38 (100.0%) |
| 5 Years | 8 (100.0%) | 24 (100.0%) |
| 6 to 11 Years | 0 (0.0%) | 52 (82.5%) |
| 12 to 14 Years | 12 (46.2%) | 0 (0.0%) |
| 15 Years | 0 (0.0%) | 30 (100.0%) |
| 16 and 17 Years | 13 (100.0%) | 0 (0.0%) |
| 18 to 24 Years | 9 (100.0%) | 131 (100.0%) |
| 25 to 34 Years | 115 (100.0%) | 47 (100.0%) |
| 35 to 44 Years | 83 (100.0%) | 89 (78.8%) |
| 45 to 54 Years | 162 (84.8%) | 111 (100.0%) |
| 55 to 64 Years | 206 (100.0%) | 164 (100.0%) |
| 65 to 74 Years | 151 (100.0%) | 101 (100.0%) |
| 75 Years and over | 14 (100.0%) | 69 (100.0%) |
| Total | 795 (92.2%) | 856 (94.6%) |
Income Below Poverty Among Married-Couple Families in East Atlantic Beach
The poverty statistics for married-couple families in East Atlantic Beach show that 5.1% or 24 of the total 467 families live below the poverty line. Families with 3 or 4 children have the highest poverty rate of 100.0%, comprising of 13 families. On the other hand, families with no children have the lowest poverty rate of 0.0%, which includes 0 families.
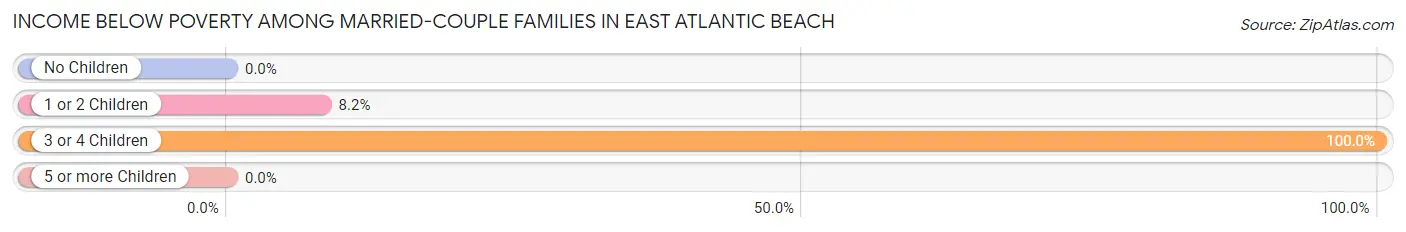
| Children | Above Poverty | Below Poverty |
| No Children | 319 (100.0%) | 0 (0.0%) |
| 1 or 2 Children | 124 (91.8%) | 11 (8.2%) |
| 3 or 4 Children | 0 (0.0%) | 13 (100.0%) |
| 5 or more Children | 0 (0.0%) | 0 (0.0%) |
| Total | 443 (94.9%) | 24 (5.1%) |
Income Below Poverty Among Single-Parent Households in East Atlantic Beach
| Children | Single Father | Single Mother |
| No Children | 0 (0.0%) | 0 (0.0%) |
| 1 or 2 Children | 0 (0.0%) | 0 (0.0%) |
| 3 or 4 Children | 0 (0.0%) | 0 (0.0%) |
| 5 or more Children | 0 (0.0%) | 0 (0.0%) |
| Total | 0 (0.0%) | 0 (0.0%) |
Income Below Poverty Among Married-Couple vs Single-Parent Households in East Atlantic Beach
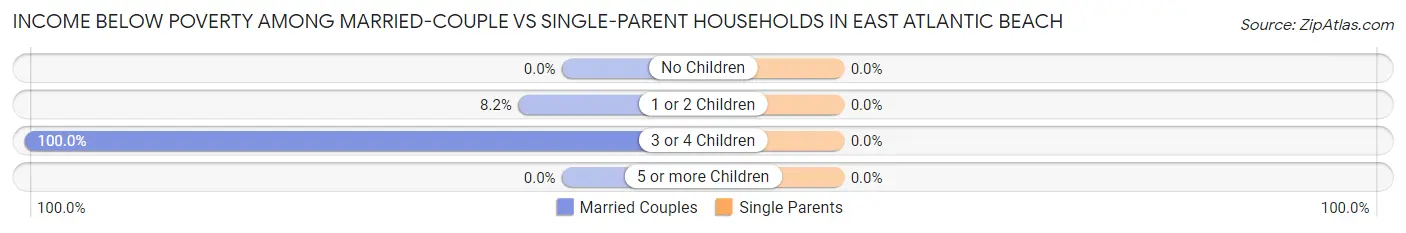
| Children | Married-Couple Families | Single-Parent Households |
| No Children | 0 (0.0%) | 0 (0.0%) |
| 1 or 2 Children | 11 (8.2%) | 0 (0.0%) |
| 3 or 4 Children | 13 (100.0%) | 0 (0.0%) |
| 5 or more Children | 0 (0.0%) | 0 (0.0%) |
| Total | 24 (5.1%) | 0 (0.0%) |
Race in East Atlantic Beach
The most populous races in East Atlantic Beach are White / Caucasian (1,590 | 90.0%), Hispanic or Latino (105 | 5.9%), and Two or more Races (83 | 4.7%).
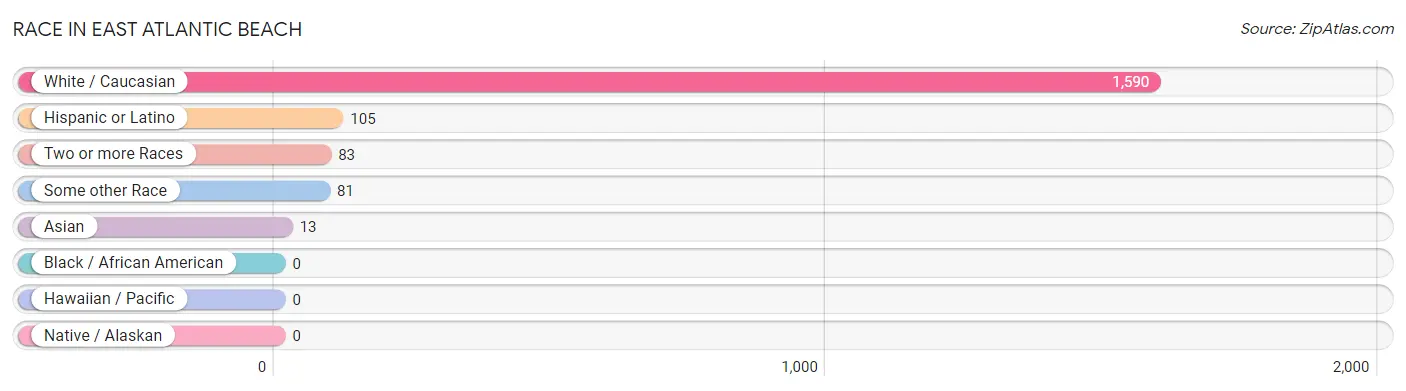
| Race | # Population | % Population |
| Asian | 13 | 0.7% |
| Black / African American | 0 | 0.0% |
| Hawaiian / Pacific | 0 | 0.0% |
| Hispanic or Latino | 105 | 5.9% |
| Native / Alaskan | 0 | 0.0% |
| White / Caucasian | 1,590 | 90.0% |
| Two or more Races | 83 | 4.7% |
| Some other Race | 81 | 4.6% |
| Total | 1,767 | 100.0% |
Ancestry in East Atlantic Beach
The most populous ancestries reported in East Atlantic Beach are Irish (656 | 37.1%), Italian (385 | 21.8%), German (179 | 10.1%), Greek (171 | 9.7%), and Russian (82 | 4.6%), together accounting for 83.4% of all East Atlantic Beach residents.
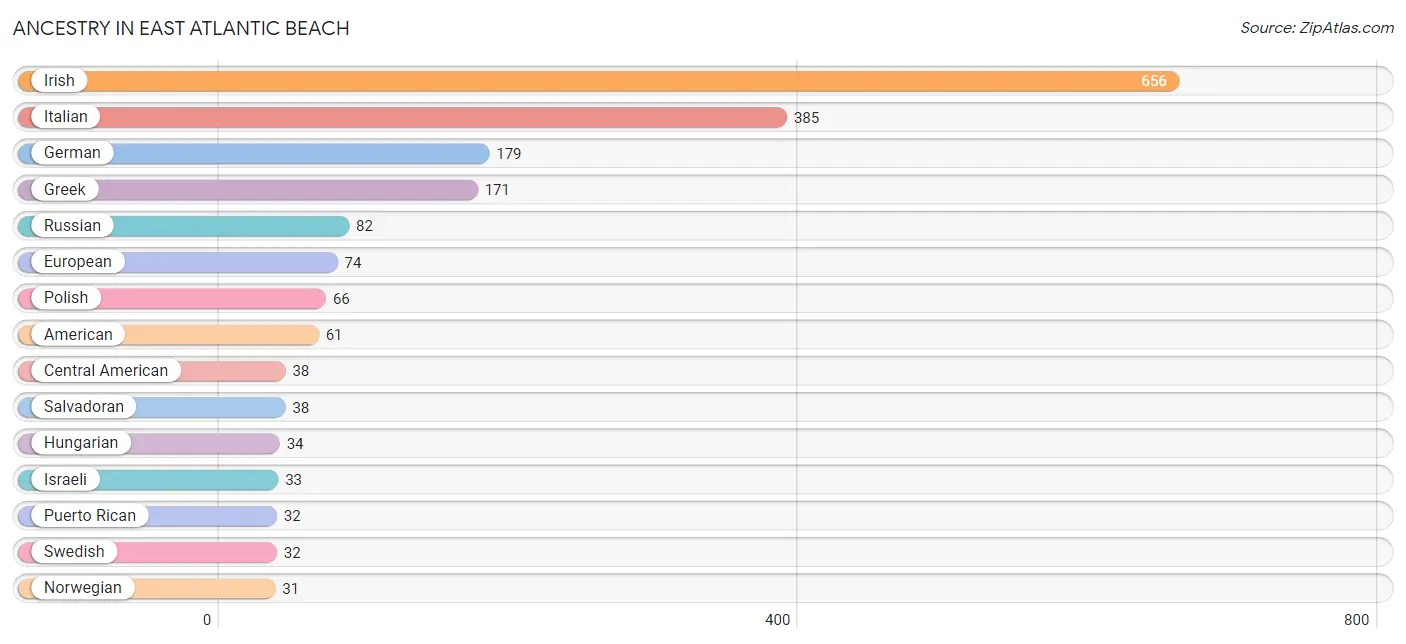
| Ancestry | # Population | % Population |
| American | 61 | 3.5% |
| Austrian | 26 | 1.5% |
| Central American | 38 | 2.1% |
| Colombian | 5 | 0.3% |
| Cuban | 19 | 1.1% |
| Eastern European | 24 | 1.4% |
| English | 6 | 0.3% |
| European | 74 | 4.2% |
| French | 12 | 0.7% |
| German | 179 | 10.1% |
| Greek | 171 | 9.7% |
| Hungarian | 34 | 1.9% |
| Irish | 656 | 37.1% |
| Israeli | 33 | 1.9% |
| Italian | 385 | 21.8% |
| Lithuanian | 28 | 1.6% |
| Norwegian | 31 | 1.8% |
| Polish | 66 | 3.7% |
| Puerto Rican | 32 | 1.8% |
| Russian | 82 | 4.6% |
| Salvadoran | 38 | 2.1% |
| Scotch-Irish | 19 | 1.1% |
| Scottish | 8 | 0.4% |
| South American | 5 | 0.3% |
| Swedish | 32 | 1.8% |
| Thai | 13 | 0.7% |
| Turkish | 12 | 0.7% | View All 27 Rows |
Immigrants in East Atlantic Beach
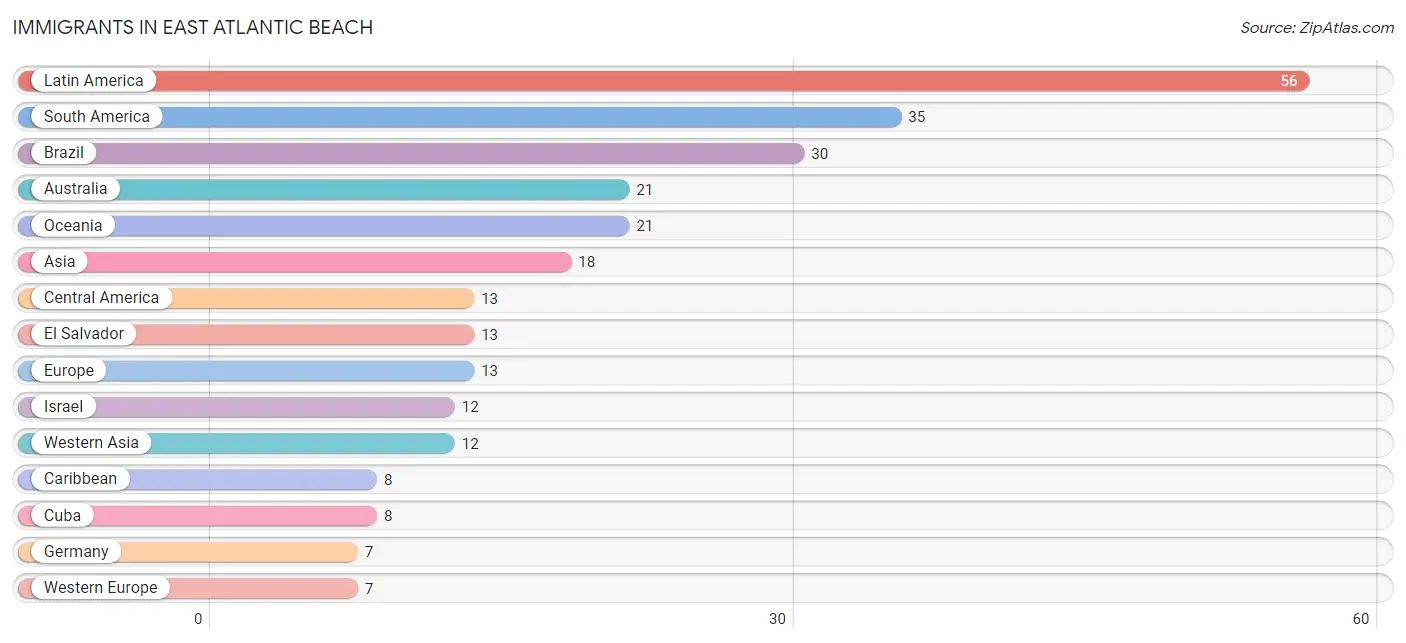
The most numerous immigrant groups reported in East Atlantic Beach came from Latin America (56 | 3.2%), South America (35 | 2.0%), Brazil (30 | 1.7%), Australia (21 | 1.2%), and Oceania (21 | 1.2%), together accounting for 9.2% of all East Atlantic Beach residents.
| Immigration Origin | # Population | % Population |
| Asia | 18 | 1.0% |
| Australia | 21 | 1.2% |
| Brazil | 30 | 1.7% |
| Caribbean | 8 | 0.4% |
| Central America | 13 | 0.7% |
| Colombia | 5 | 0.3% |
| Cuba | 8 | 0.4% |
| El Salvador | 13 | 0.7% |
| Europe | 13 | 0.7% |
| Germany | 7 | 0.4% |
| India | 6 | 0.3% |
| Ireland | 6 | 0.3% |
| Israel | 12 | 0.7% |
| Latin America | 56 | 3.2% |
| Northern Europe | 6 | 0.3% |
| Oceania | 21 | 1.2% |
| South America | 35 | 2.0% |
| South Central Asia | 6 | 0.3% |
| Western Asia | 12 | 0.7% |
| Western Europe | 7 | 0.4% | View All 20 Rows |
Sex and Age in East Atlantic Beach
Sex and Age in East Atlantic Beach
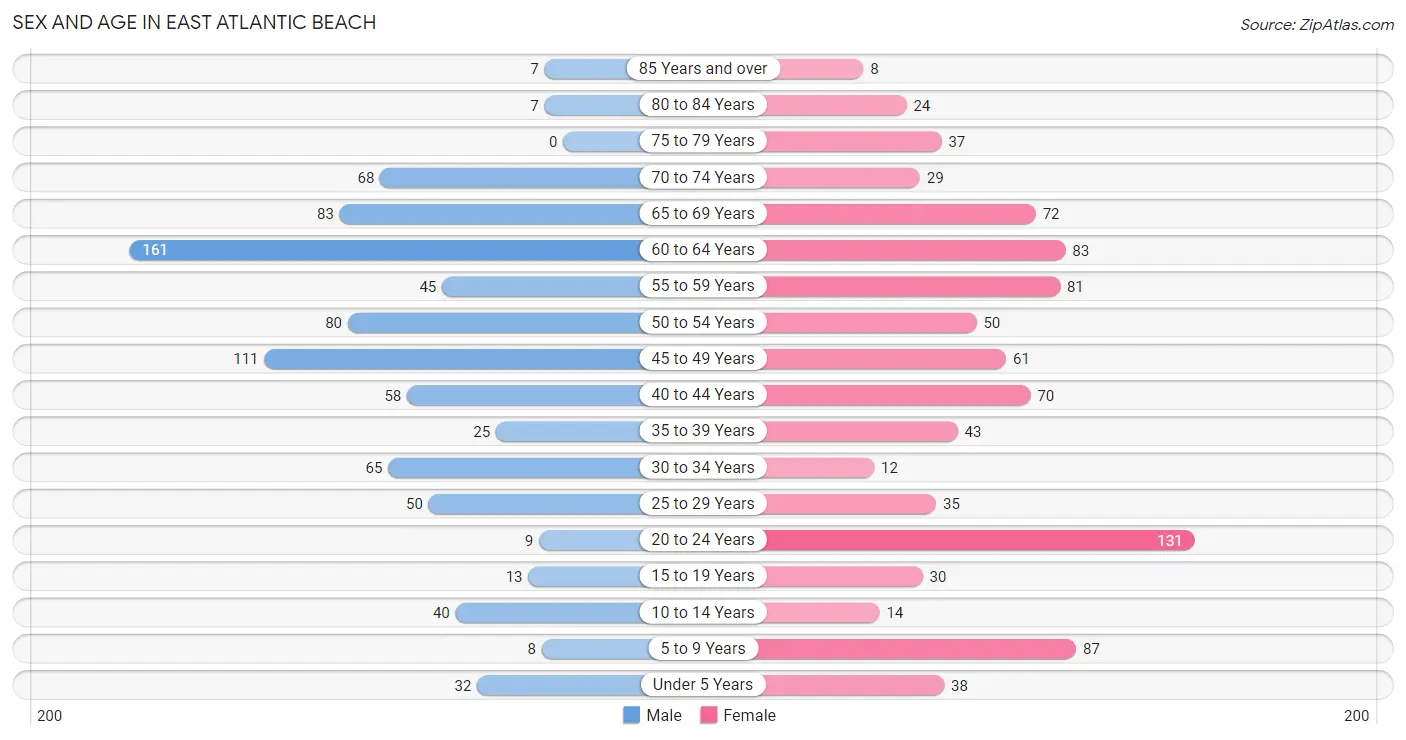
The most populous age groups in East Atlantic Beach are 60 to 64 Years (161 | 18.7%) for men and 20 to 24 Years (131 | 14.5%) for women.
| Age Bracket | Male | Female |
| Under 5 Years | 32 (3.7%) | 38 (4.2%) |
| 5 to 9 Years | 8 (0.9%) | 87 (9.6%) |
| 10 to 14 Years | 40 (4.6%) | 14 (1.5%) |
| 15 to 19 Years | 13 (1.5%) | 30 (3.3%) |
| 20 to 24 Years | 9 (1.0%) | 131 (14.5%) |
| 25 to 29 Years | 50 (5.8%) | 35 (3.9%) |
| 30 to 34 Years | 65 (7.5%) | 12 (1.3%) |
| 35 to 39 Years | 25 (2.9%) | 43 (4.8%) |
| 40 to 44 Years | 58 (6.7%) | 70 (7.7%) |
| 45 to 49 Years | 111 (12.9%) | 61 (6.7%) |
| 50 to 54 Years | 80 (9.3%) | 50 (5.5%) |
| 55 to 59 Years | 45 (5.2%) | 81 (8.9%) |
| 60 to 64 Years | 161 (18.7%) | 83 (9.2%) |
| 65 to 69 Years | 83 (9.6%) | 72 (8.0%) |
| 70 to 74 Years | 68 (7.9%) | 29 (3.2%) |
| 75 to 79 Years | 0 (0.0%) | 37 (4.1%) |
| 80 to 84 Years | 7 (0.8%) | 24 (2.6%) |
| 85 Years and over | 7 (0.8%) | 8 (0.9%) |
| Total | 862 (100.0%) | 905 (100.0%) |
Families and Households in East Atlantic Beach
Median Family Size in East Atlantic Beach
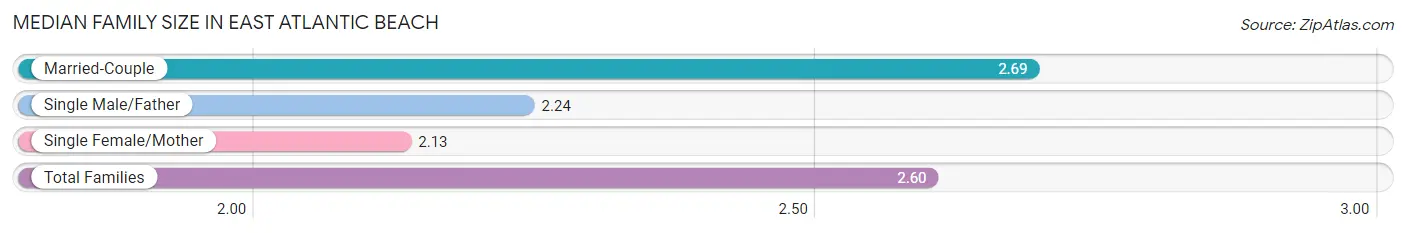
The median family size in East Atlantic Beach is 2.60 persons per family, with married-couple families (467 | 82.2%) accounting for the largest median family size of 2.69 persons per family. On the other hand, single female/mother families (8 | 1.4%) represent the smallest median family size with 2.13 persons per family.
| Family Type | # Families | Family Size |
| Married-Couple | 467 (82.2%) | 2.69 |
| Single Male/Father | 93 (16.4%) | 2.24 |
| Single Female/Mother | 8 (1.4%) | 2.13 |
| Total Families | 568 (100.0%) | 2.60 |
Median Household Size in East Atlantic Beach
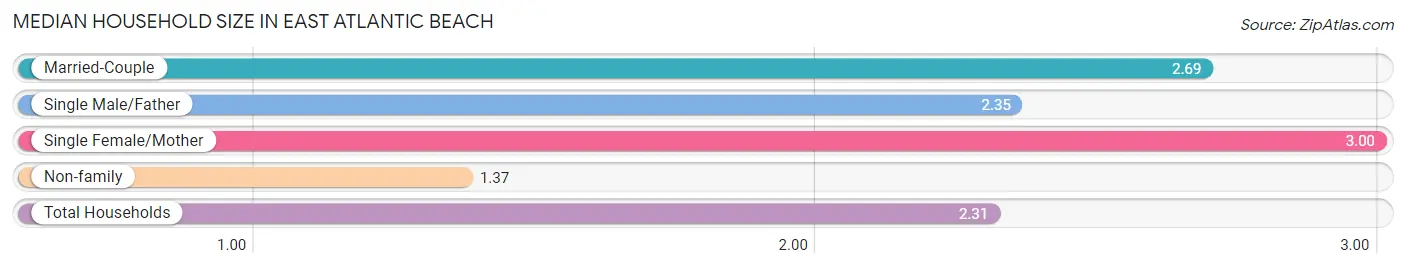
The median household size in East Atlantic Beach is 2.31 persons per household, with single female/mother households (8 | 1.1%) accounting for the largest median household size of 3 persons per household. non-family households (197 | 25.8%) represent the smallest median household size with 1.37 persons per household.
| Household Type | # Households | Household Size |
| Married-Couple | 467 (61.1%) | 2.69 |
| Single Male/Father | 93 (12.2%) | 2.35 |
| Single Female/Mother | 8 (1.1%) | 3.00 |
| Non-family | 197 (25.8%) | 1.37 |
| Total Households | 765 (100.0%) | 2.31 |
Household Size by Marriage Status in East Atlantic Beach
Out of a total of 765 households in East Atlantic Beach, 568 (74.3%) are family households, while 197 (25.8%) are nonfamily households. The most numerous type of family households are 2-person households, comprising 352, and the most common type of nonfamily households are 1-person households, comprising 147.
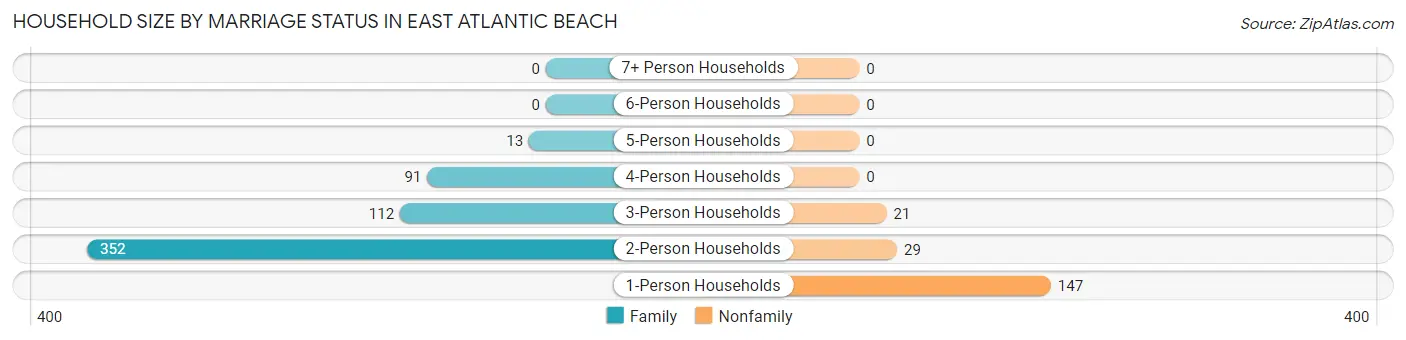
| Household Size | Family Households | Nonfamily Households |
| 1-Person Households | - | 147 (19.2%) |
| 2-Person Households | 352 (46.0%) | 29 (3.8%) |
| 3-Person Households | 112 (14.6%) | 21 (2.8%) |
| 4-Person Households | 91 (11.9%) | 0 (0.0%) |
| 5-Person Households | 13 (1.7%) | 0 (0.0%) |
| 6-Person Households | 0 (0.0%) | 0 (0.0%) |
| 7+ Person Households | 0 (0.0%) | 0 (0.0%) |
| Total | 568 (74.3%) | 197 (25.8%) |
Female Fertility in East Atlantic Beach
Fertility by Age in East Atlantic Beach
Average fertility rate in East Atlantic Beach is 29.0 births per 1,000 women. Women in the age bracket of 35 to 50 years have the highest fertility rate with 63.0 births per 1,000 women. Women in the age bracket of 35 to 50 years acount for 100.0% of all women with births.
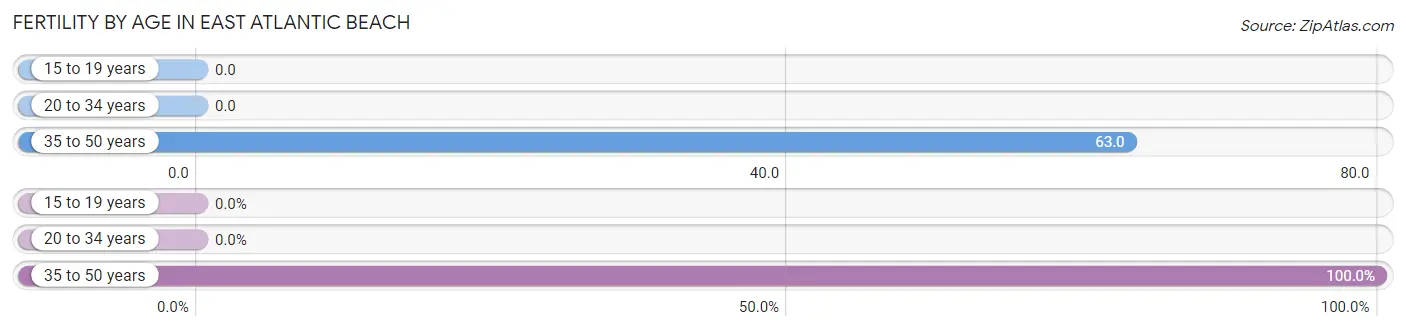
| Age Bracket | Women with Births | Births / 1,000 Women |
| 15 to 19 years | 0 (0.0%) | 0.0 |
| 20 to 34 years | 0 (0.0%) | 0.0 |
| 35 to 50 years | 11 (100.0%) | 63.0 |
| Total | 11 (100.0%) | 29.0 |
Fertility by Age by Marriage Status in East Atlantic Beach
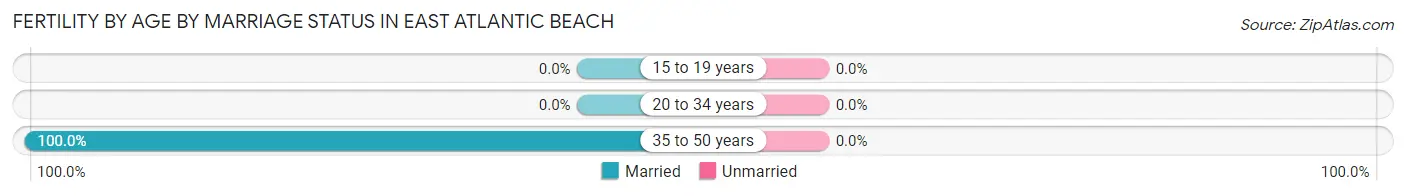
| Age Bracket | Married | Unmarried |
| 15 to 19 years | 0 (0.0%) | 0 (0.0%) |
| 20 to 34 years | 0 (0.0%) | 0 (0.0%) |
| 35 to 50 years | 11 (100.0%) | 0 (0.0%) |
| Total | 11 (100.0%) | 0 (0.0%) |
Fertility by Education in East Atlantic Beach
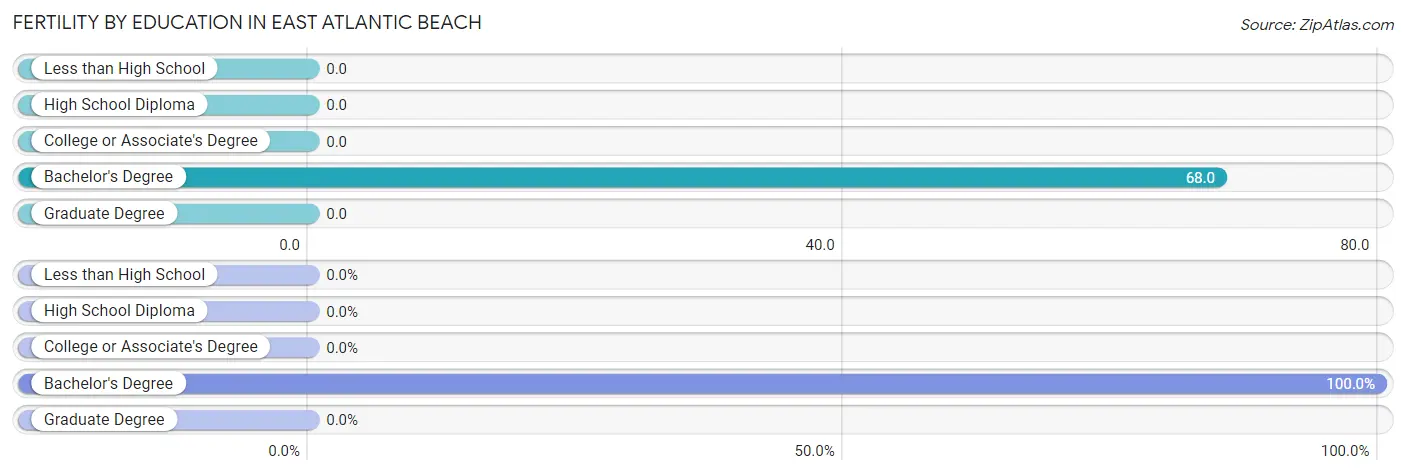
| Educational Attainment | Women with Births | Births / 1,000 Women |
| Less than High School | 0 (0.0%) | 0.0 |
| High School Diploma | 0 (0.0%) | 0.0 |
| College or Associate's Degree | 0 (0.0%) | 0.0 |
| Bachelor's Degree | 11 (100.0%) | 68.0 |
| Graduate Degree | 0 (0.0%) | 0.0 |
| Total | 11 (100.0%) | 29.0 |
Fertility by Education by Marriage Status in East Atlantic Beach
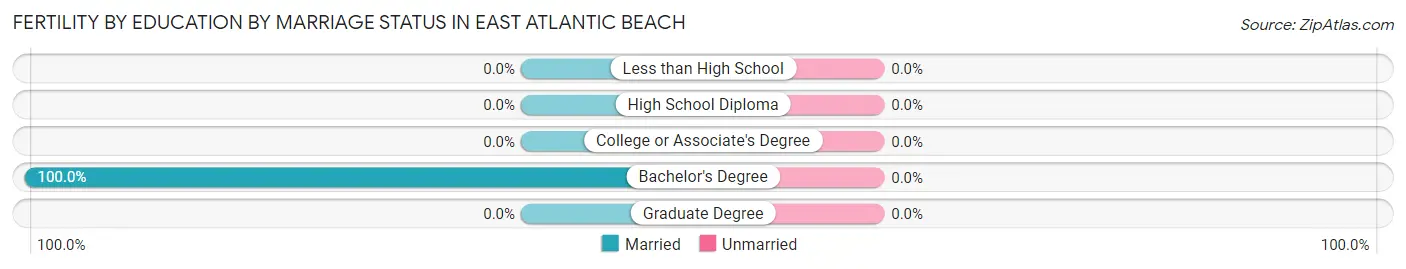
| Educational Attainment | Married | Unmarried |
| Less than High School | 0 (0.0%) | 0 (0.0%) |
| High School Diploma | 0 (0.0%) | 0 (0.0%) |
| College or Associate's Degree | 0 (0.0%) | 0 (0.0%) |
| Bachelor's Degree | 11 (100.0%) | 0 (0.0%) |
| Graduate Degree | 0 (0.0%) | 0 (0.0%) |
| Total | 11 (100.0%) | 0 (0.0%) |
Employment Characteristics in East Atlantic Beach
Employment by Class of Employer in East Atlantic Beach
Among the 1,005 employed individuals in East Atlantic Beach, private company employees (524 | 52.1%), self-employed (incorporated) (174 | 17.3%), and local government employees (123 | 12.2%) make up the most common classes of employment.
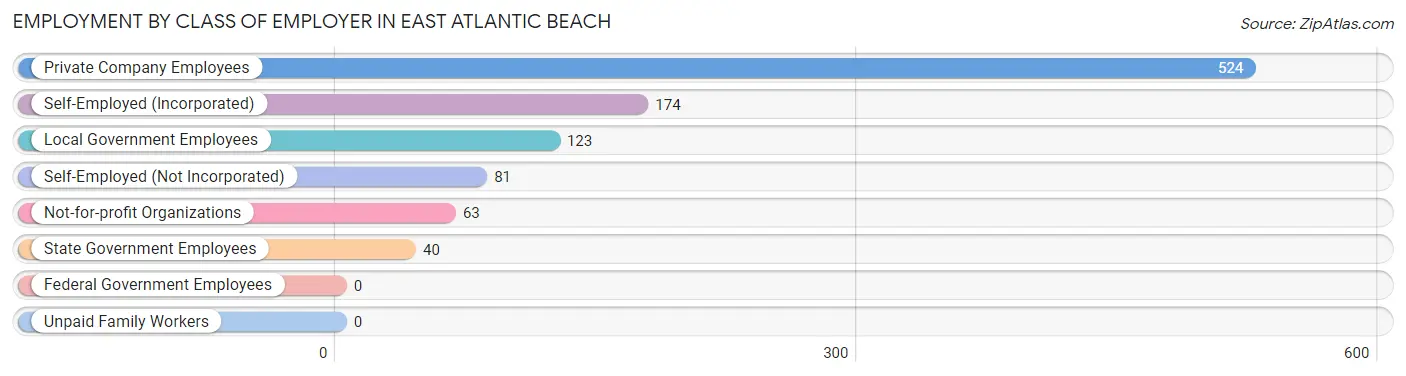
| Employer Class | # Employees | % Employees |
| Private Company Employees | 524 | 52.1% |
| Self-Employed (Incorporated) | 174 | 17.3% |
| Self-Employed (Not Incorporated) | 81 | 8.1% |
| Not-for-profit Organizations | 63 | 6.3% |
| Local Government Employees | 123 | 12.2% |
| State Government Employees | 40 | 4.0% |
| Federal Government Employees | 0 | 0.0% |
| Unpaid Family Workers | 0 | 0.0% |
| Total | 1,005 | 100.0% |
Employment Status by Age in East Atlantic Beach
According to the labor force statistics for East Atlantic Beach, out of the total population over 16 years of age (1,518), 74.8% or 1,135 individuals are in the labor force, with 9.8% or 111 of them unemployed. The age group with the highest labor force participation rate is 30 to 34 years, with 100.0% or 77 individuals in the labor force. Within the labor force, the 20 to 24 years age range has the highest percentage of unemployed individuals, with 73.9% or 85 of them being unemployed.
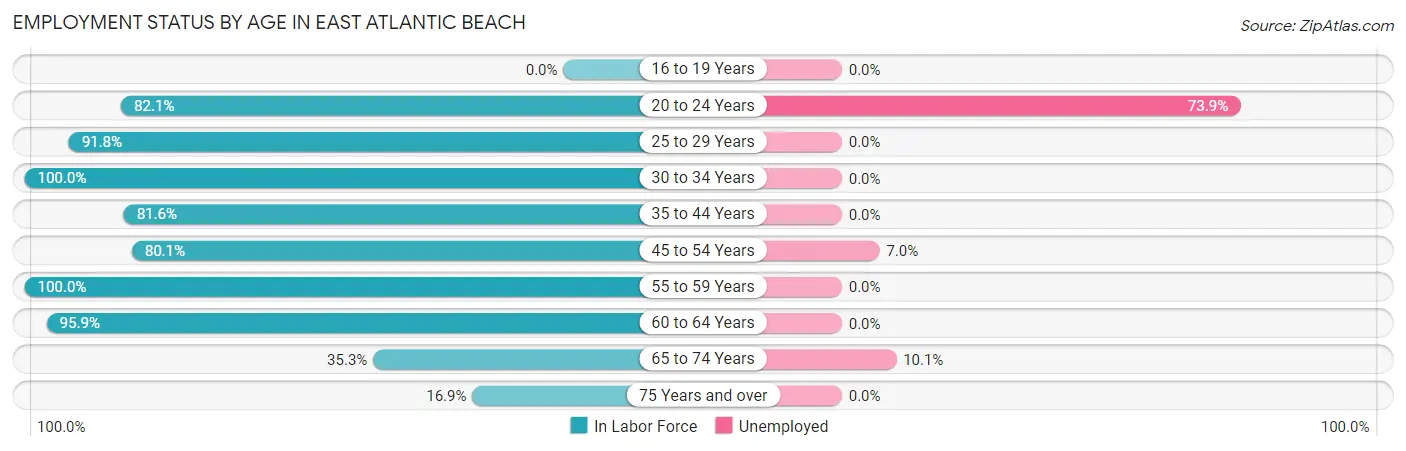
| Age Bracket | In Labor Force | Unemployed |
| 16 to 19 Years | 0 (0.0%) | 0 (0.0%) |
| 20 to 24 Years | 115 (82.1%) | 85 (73.9%) |
| 25 to 29 Years | 78 (91.8%) | 0 (0.0%) |
| 30 to 34 Years | 77 (100.0%) | 0 (0.0%) |
| 35 to 44 Years | 160 (81.6%) | 0 (0.0%) |
| 45 to 54 Years | 242 (80.1%) | 17 (7.0%) |
| 55 to 59 Years | 126 (100.0%) | 0 (0.0%) |
| 60 to 64 Years | 234 (95.9%) | 0 (0.0%) |
| 65 to 74 Years | 89 (35.3%) | 9 (10.1%) |
| 75 Years and over | 14 (16.9%) | 0 (0.0%) |
| Total | 1,135 (74.8%) | 111 (9.8%) |
Employment Status by Educational Attainment in East Atlantic Beach
According to labor force statistics for East Atlantic Beach, 89.0% of individuals (917) out of the total population between 25 and 64 years of age (1,030) are in the labor force, with 1.9% or 17 of them being unemployed. The group with the highest labor force participation rate are those with the educational attainment of college / associate degree, with 97.0% or 224 individuals in the labor force. Within the labor force, individuals with college / associate degree education have the highest percentage of unemployment, with 7.6% or 17 of them being unemployed.
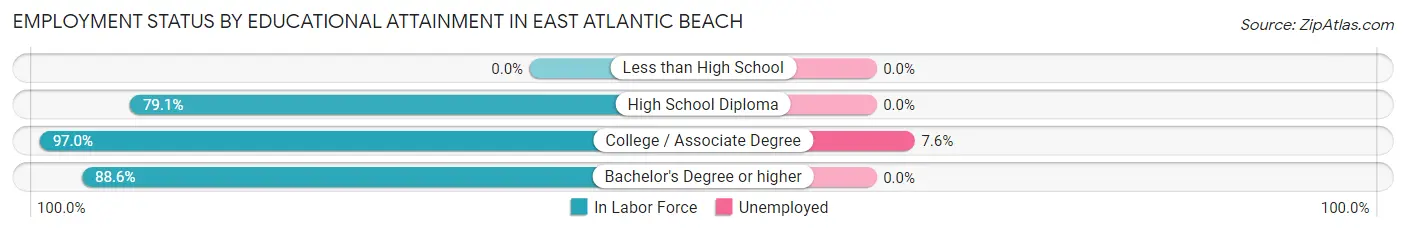
| Educational Attainment | In Labor Force | Unemployed |
| Less than High School | 0 (0.0%) | 0 (0.0%) |
| High School Diploma | 72 (79.1%) | 0 (0.0%) |
| College / Associate Degree | 224 (97.0%) | 18 (7.6%) |
| Bachelor's Degree or higher | 621 (88.6%) | 0 (0.0%) |
| Total | 917 (89.0%) | 20 (1.9%) |
Employment Occupations by Sex in East Atlantic Beach
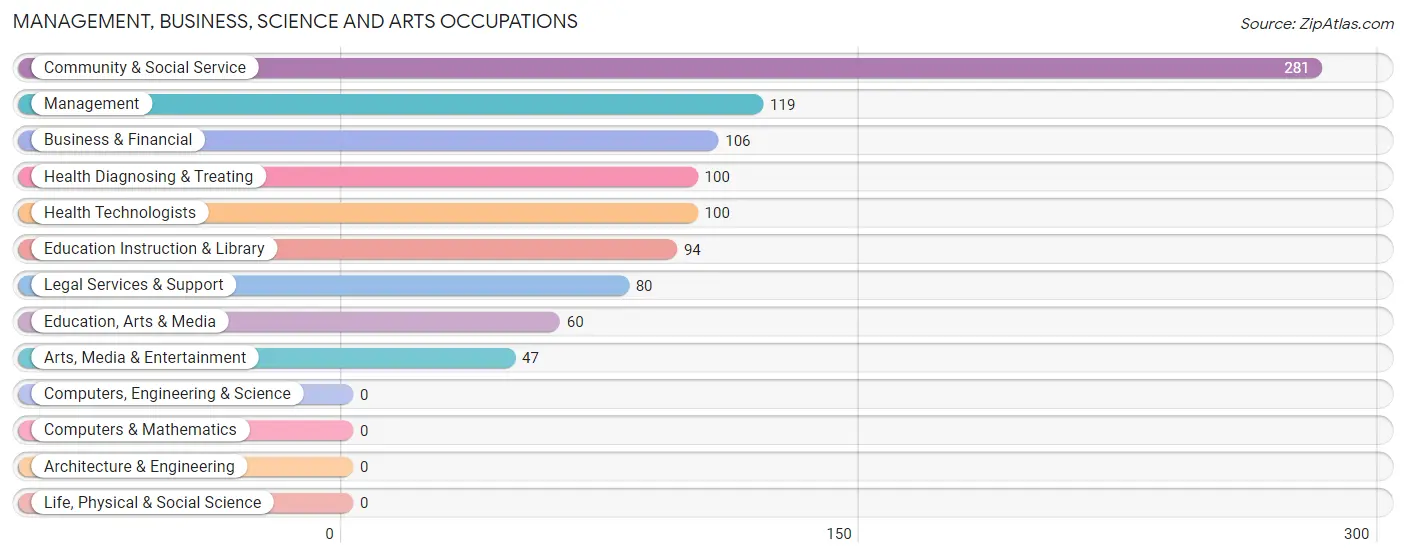
Management, Business, Science and Arts Occupations
The most common Management, Business, Science and Arts occupations in East Atlantic Beach are Community & Social Service (281 | 27.4%), Management (119 | 11.6%), Business & Financial (106 | 10.3%), Health Diagnosing & Treating (100 | 9.8%), and Health Technologists (100 | 9.8%).
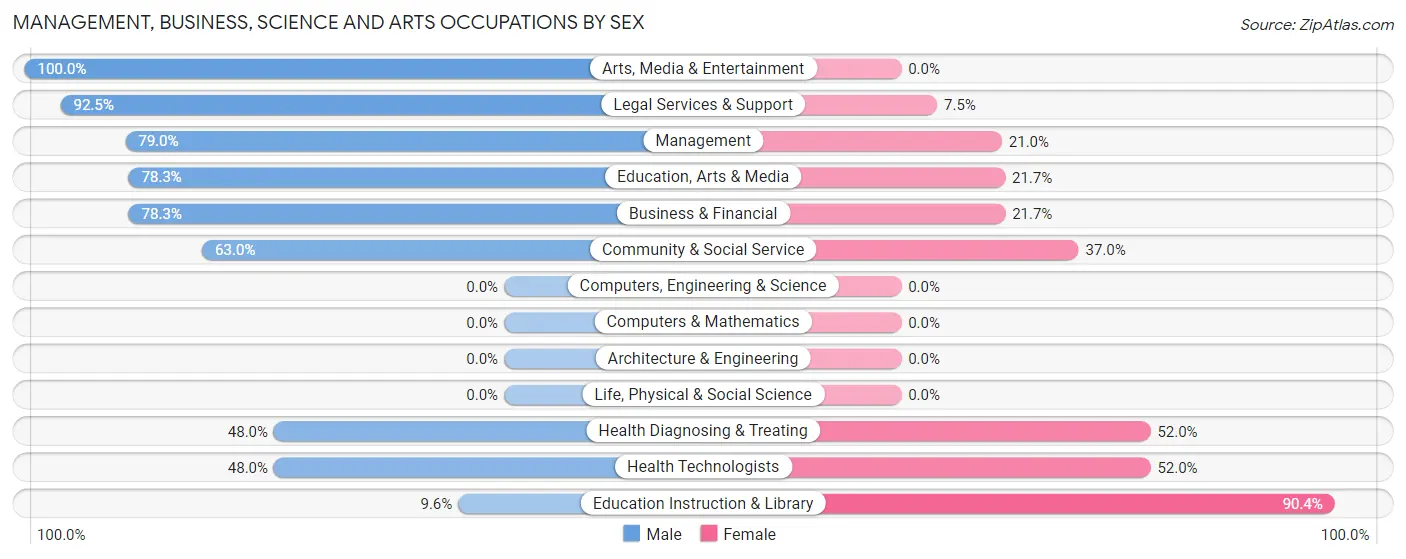
Management, Business, Science and Arts Occupations by Sex
Within the Management, Business, Science and Arts occupations in East Atlantic Beach, the most male-oriented occupations are Arts, Media & Entertainment (100.0%), Legal Services & Support (92.5%), and Management (79.0%), while the most female-oriented occupations are Education Instruction & Library (90.4%), Health Diagnosing & Treating (52.0%), and Health Technologists (52.0%).
| Occupation | Male | Female |
| Management | 94 (79.0%) | 25 (21.0%) |
| Business & Financial | 83 (78.3%) | 23 (21.7%) |
| Computers, Engineering & Science | 0 (0.0%) | 0 (0.0%) |
| Computers & Mathematics | 0 (0.0%) | 0 (0.0%) |
| Architecture & Engineering | 0 (0.0%) | 0 (0.0%) |
| Life, Physical & Social Science | 0 (0.0%) | 0 (0.0%) |
| Community & Social Service | 177 (63.0%) | 104 (37.0%) |
| Education, Arts & Media | 47 (78.3%) | 13 (21.7%) |
| Legal Services & Support | 74 (92.5%) | 6 (7.5%) |
| Education Instruction & Library | 9 (9.6%) | 85 (90.4%) |
| Arts, Media & Entertainment | 47 (100.0%) | 0 (0.0%) |
| Health Diagnosing & Treating | 48 (48.0%) | 52 (52.0%) |
| Health Technologists | 48 (48.0%) | 52 (52.0%) |
| Total (Category) | 402 (66.3%) | 204 (33.7%) |
| Total (Overall) | 608 (59.4%) | 416 (40.6%) |
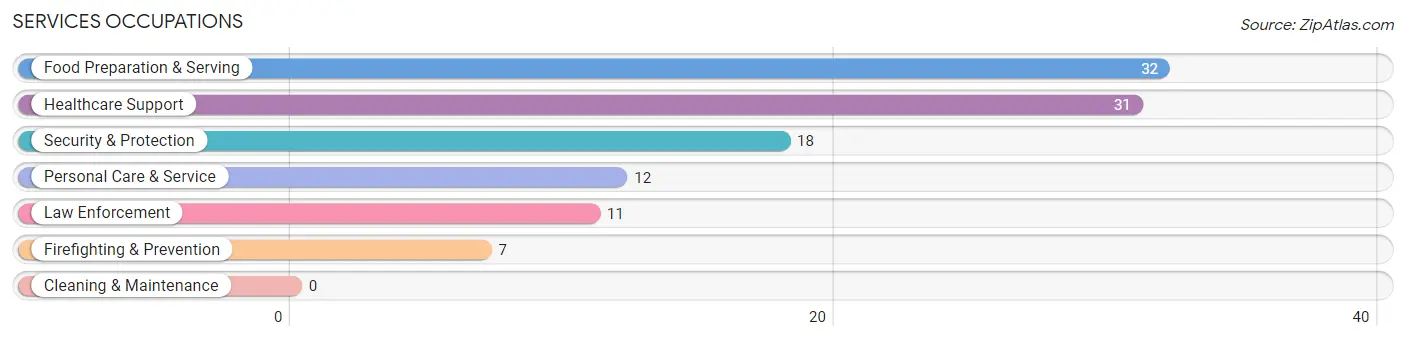
Services Occupations
The most common Services occupations in East Atlantic Beach are Food Preparation & Serving (32 | 3.1%), Healthcare Support (31 | 3.0%), Security & Protection (18 | 1.8%), Personal Care & Service (12 | 1.2%), and Law Enforcement (11 | 1.1%).
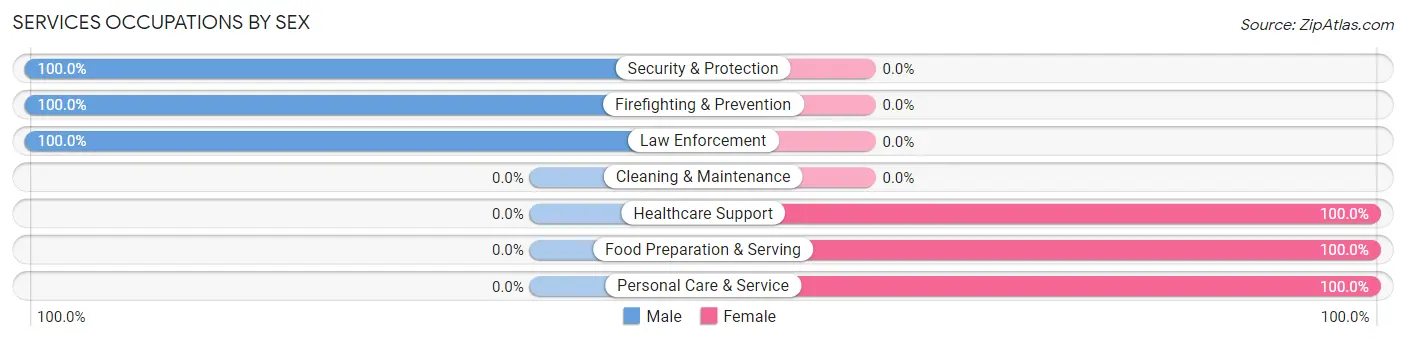
Services Occupations by Sex
Within the Services occupations in East Atlantic Beach, the most male-oriented occupations are Security & Protection (100.0%), Firefighting & Prevention (100.0%), and Law Enforcement (100.0%), while the most female-oriented occupations are Healthcare Support (100.0%), Food Preparation & Serving (100.0%), and Personal Care & Service (100.0%).
| Occupation | Male | Female |
| Healthcare Support | 0 (0.0%) | 31 (100.0%) |
| Security & Protection | 18 (100.0%) | 0 (0.0%) |
| Firefighting & Prevention | 7 (100.0%) | 0 (0.0%) |
| Law Enforcement | 11 (100.0%) | 0 (0.0%) |
| Food Preparation & Serving | 0 (0.0%) | 32 (100.0%) |
| Cleaning & Maintenance | 0 (0.0%) | 0 (0.0%) |
| Personal Care & Service | 0 (0.0%) | 12 (100.0%) |
| Total (Category) | 18 (19.4%) | 75 (80.6%) |
| Total (Overall) | 608 (59.4%) | 416 (40.6%) |
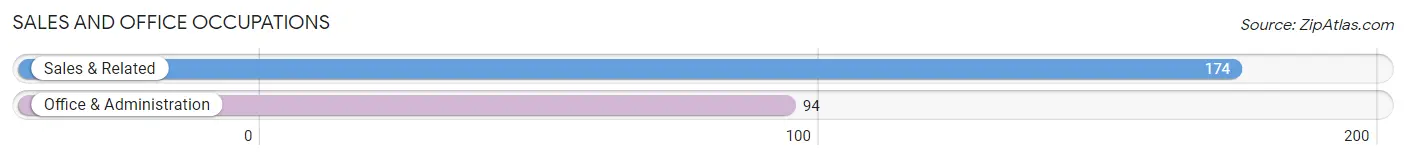
Sales and Office Occupations
The most common Sales and Office occupations in East Atlantic Beach are Sales & Related (174 | 17.0%), and Office & Administration (94 | 9.2%).
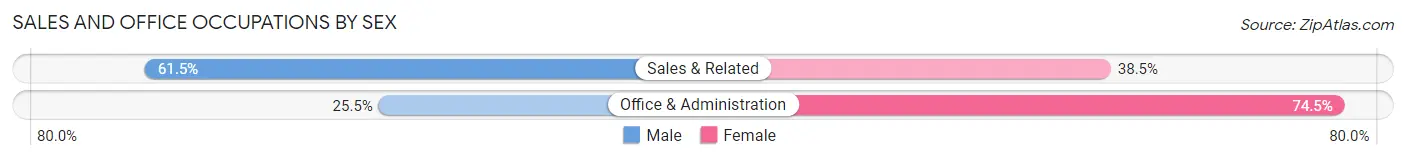
Sales and Office Occupations by Sex
| Occupation | Male | Female |
| Sales & Related | 107 (61.5%) | 67 (38.5%) |
| Office & Administration | 24 (25.5%) | 70 (74.5%) |
| Total (Category) | 131 (48.9%) | 137 (51.1%) |
| Total (Overall) | 608 (59.4%) | 416 (40.6%) |
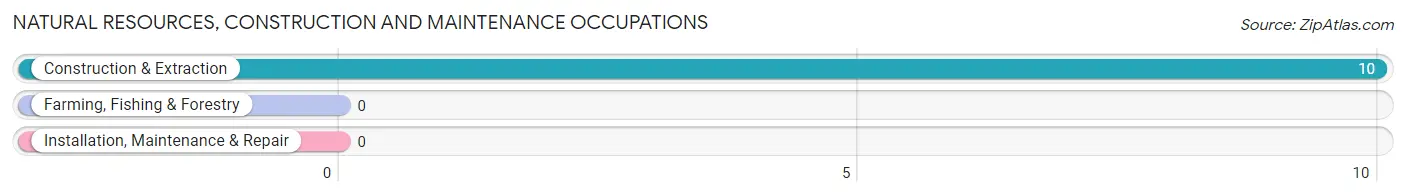
Natural Resources, Construction and Maintenance Occupations
The most common Natural Resources, Construction and Maintenance occupations in East Atlantic Beach are , and Construction & Extraction (10 | 1.0%).
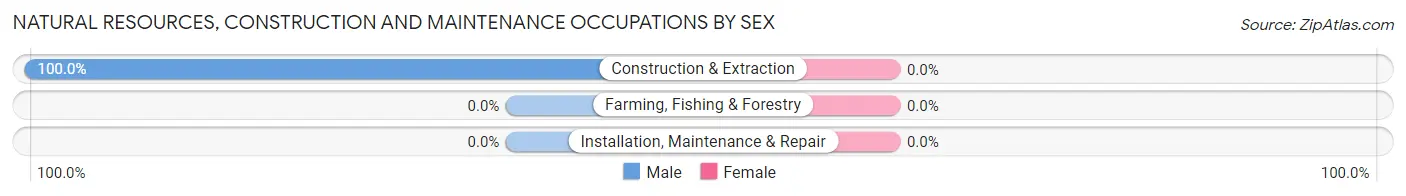
Natural Resources, Construction and Maintenance Occupations by Sex
| Occupation | Male | Female |
| Farming, Fishing & Forestry | 0 (0.0%) | 0 (0.0%) |
| Construction & Extraction | 10 (100.0%) | 0 (0.0%) |
| Installation, Maintenance & Repair | 0 (0.0%) | 0 (0.0%) |
| Total (Category) | 10 (100.0%) | 0 (0.0%) |
| Total (Overall) | 608 (59.4%) | 416 (40.6%) |
Production, Transportation and Moving Occupations
The most common Production, Transportation and Moving occupations in East Atlantic Beach are , and Transportation (47 | 4.6%).
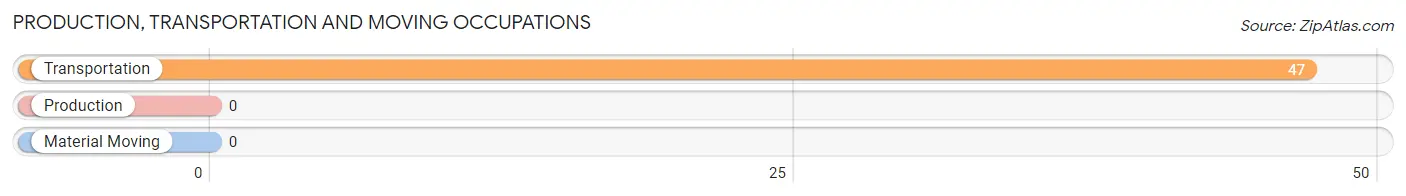
Production, Transportation and Moving Occupations by Sex
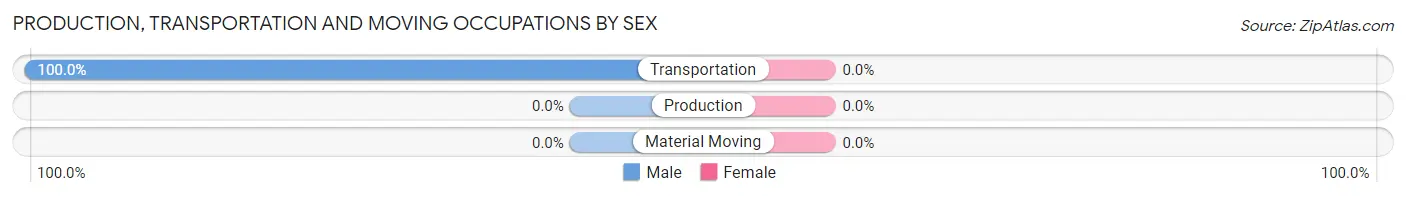
| Occupation | Male | Female |
| Production | 0 (0.0%) | 0 (0.0%) |
| Transportation | 47 (100.0%) | 0 (0.0%) |
| Material Moving | 0 (0.0%) | 0 (0.0%) |
| Total (Category) | 47 (100.0%) | 0 (0.0%) |
| Total (Overall) | 608 (59.4%) | 416 (40.6%) |
Employment Industries by Sex in East Atlantic Beach
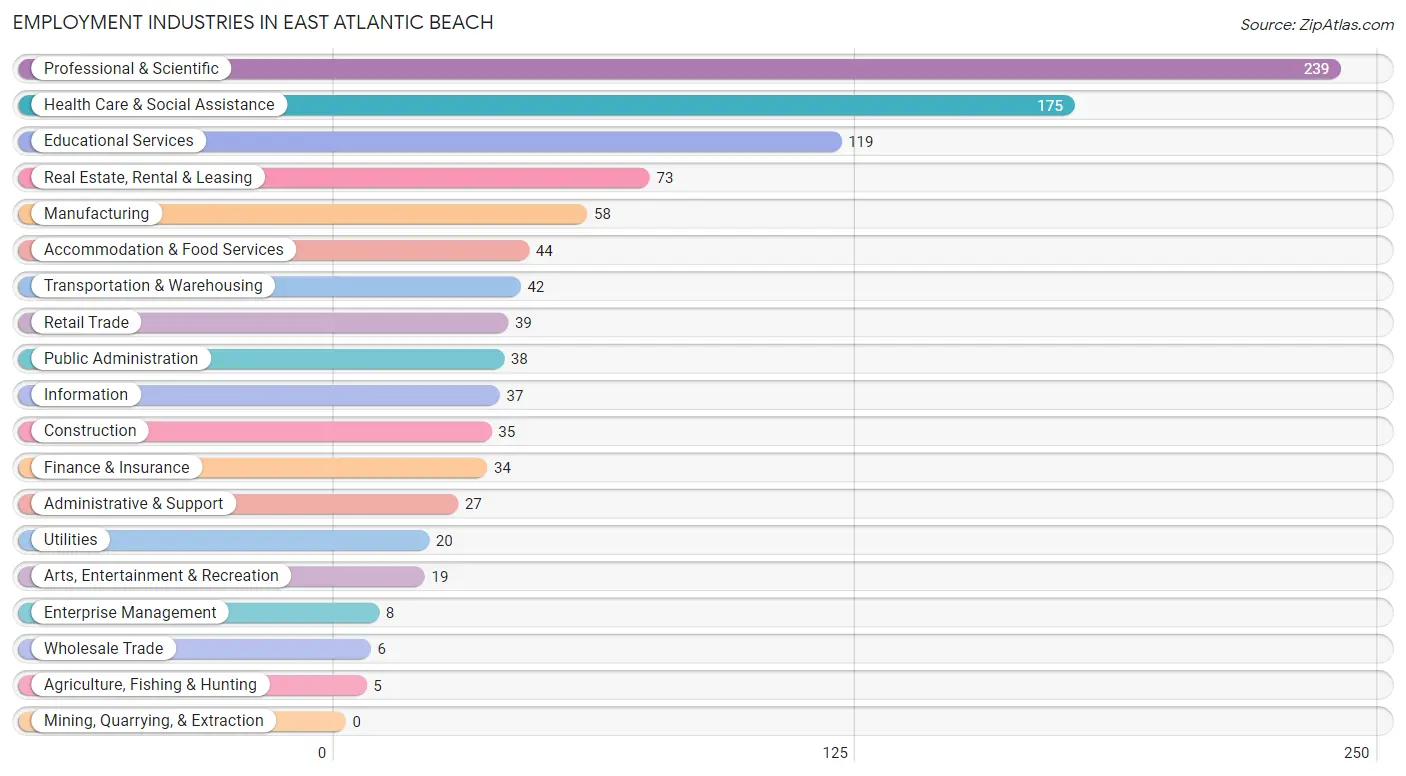
Employment Industries in East Atlantic Beach
The major employment industries in East Atlantic Beach include Professional & Scientific (239 | 23.3%), Health Care & Social Assistance (175 | 17.1%), Educational Services (119 | 11.6%), Real Estate, Rental & Leasing (73 | 7.1%), and Manufacturing (58 | 5.7%).
Employment Industries by Sex in East Atlantic Beach
The East Atlantic Beach industries that see more men than women are Agriculture, Fishing & Hunting (100.0%), Transportation & Warehousing (100.0%), and Utilities (100.0%), whereas the industries that tend to have a higher number of women are Wholesale Trade (100.0%), Enterprise Management (100.0%), and Accommodation & Food Services (100.0%).
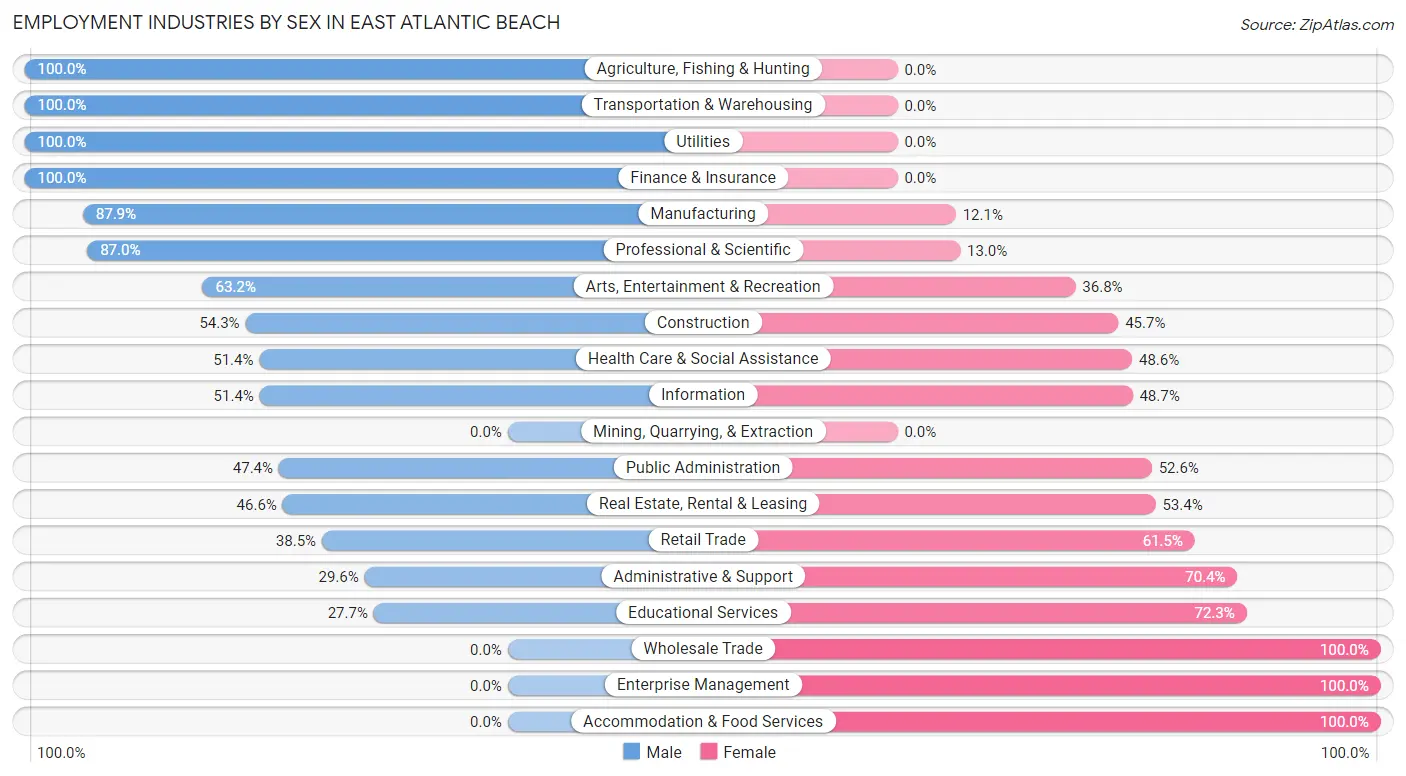
| Industry | Male | Female |
| Agriculture, Fishing & Hunting | 5 (100.0%) | 0 (0.0%) |
| Mining, Quarrying, & Extraction | 0 (0.0%) | 0 (0.0%) |
| Construction | 19 (54.3%) | 16 (45.7%) |
| Manufacturing | 51 (87.9%) | 7 (12.1%) |
| Wholesale Trade | 0 (0.0%) | 6 (100.0%) |
| Retail Trade | 15 (38.5%) | 24 (61.5%) |
| Transportation & Warehousing | 42 (100.0%) | 0 (0.0%) |
| Utilities | 20 (100.0%) | 0 (0.0%) |
| Information | 19 (51.3%) | 18 (48.6%) |
| Finance & Insurance | 34 (100.0%) | 0 (0.0%) |
| Real Estate, Rental & Leasing | 34 (46.6%) | 39 (53.4%) |
| Professional & Scientific | 208 (87.0%) | 31 (13.0%) |
| Enterprise Management | 0 (0.0%) | 8 (100.0%) |
| Administrative & Support | 8 (29.6%) | 19 (70.4%) |
| Educational Services | 33 (27.7%) | 86 (72.3%) |
| Health Care & Social Assistance | 90 (51.4%) | 85 (48.6%) |
| Arts, Entertainment & Recreation | 12 (63.2%) | 7 (36.8%) |
| Accommodation & Food Services | 0 (0.0%) | 44 (100.0%) |
| Public Administration | 18 (47.4%) | 20 (52.6%) |
| Total | 608 (59.4%) | 416 (40.6%) |
Education in East Atlantic Beach
School Enrollment in East Atlantic Beach
The most common levels of schooling among the 327 students in East Atlantic Beach are elementary school (77 | 23.5%), graduate / professional (58 | 17.7%), and college / undergraduate (50 | 15.3%).
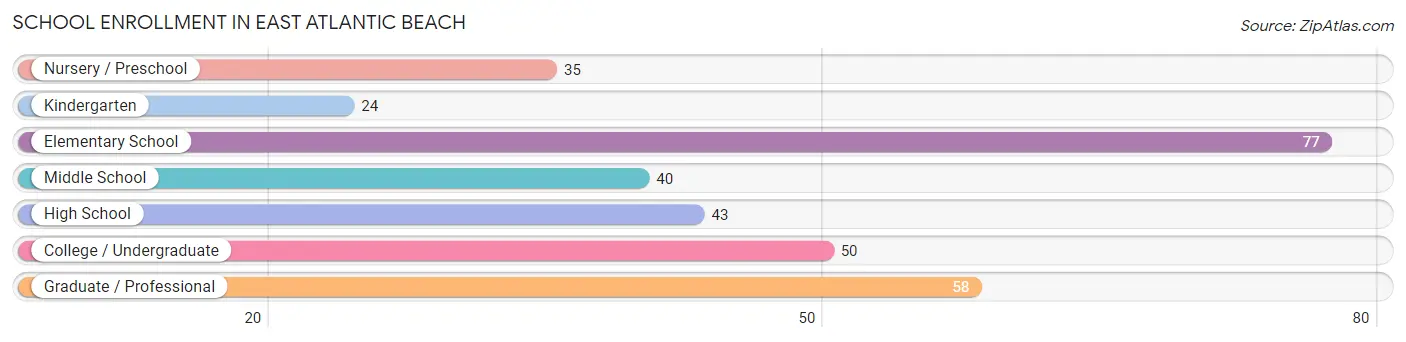
| School Level | # Students | % Students |
| Nursery / Preschool | 35 | 10.7% |
| Kindergarten | 24 | 7.3% |
| Elementary School | 77 | 23.5% |
| Middle School | 40 | 12.2% |
| High School | 43 | 13.2% |
| College / Undergraduate | 50 | 15.3% |
| Graduate / Professional | 58 | 17.7% |
| Total | 327 | 100.0% |
School Enrollment by Age by Funding Source in East Atlantic Beach
Out of a total of 327 students who are enrolled in schools in East Atlantic Beach, 149 (45.6%) attend a private institution, while the remaining 178 (54.4%) are enrolled in public schools. The age group of 3 to 4 year olds has the highest likelihood of being enrolled in private schools, with 27 (100.0% in the age bracket) enrolled. Conversely, the age group of 10 to 14 year olds has the lowest likelihood of being enrolled in a private school, with 54 (100.0% in the age bracket) attending a public institution.
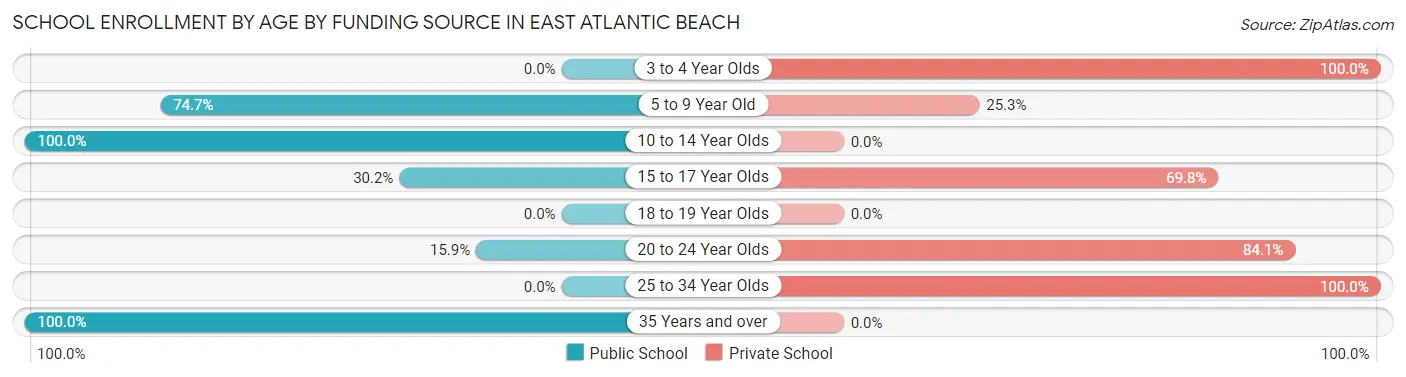
| Age Bracket | Public School | Private School |
| 3 to 4 Year Olds | 0 (0.0%) | 27 (100.0%) |
| 5 to 9 Year Old | 71 (74.7%) | 24 (25.3%) |
| 10 to 14 Year Olds | 54 (100.0%) | 0 (0.0%) |
| 15 to 17 Year Olds | 13 (30.2%) | 30 (69.8%) |
| 18 to 19 Year Olds | 0 (0.0%) | 0 (0.0%) |
| 20 to 24 Year Olds | 7 (15.9%) | 37 (84.1%) |
| 25 to 34 Year Olds | 0 (0.0%) | 31 (100.0%) |
| 35 Years and over | 33 (100.0%) | 0 (0.0%) |
| Total | 178 (54.4%) | 149 (45.6%) |
Educational Attainment by Field of Study in East Atlantic Beach
Business (244 | 26.8%), education (146 | 16.0%), arts & humanities (96 | 10.5%), science & technology (93 | 10.2%), and social sciences (80 | 8.8%) are the most common fields of study among 912 individuals in East Atlantic Beach who have obtained a bachelor's degree or higher.
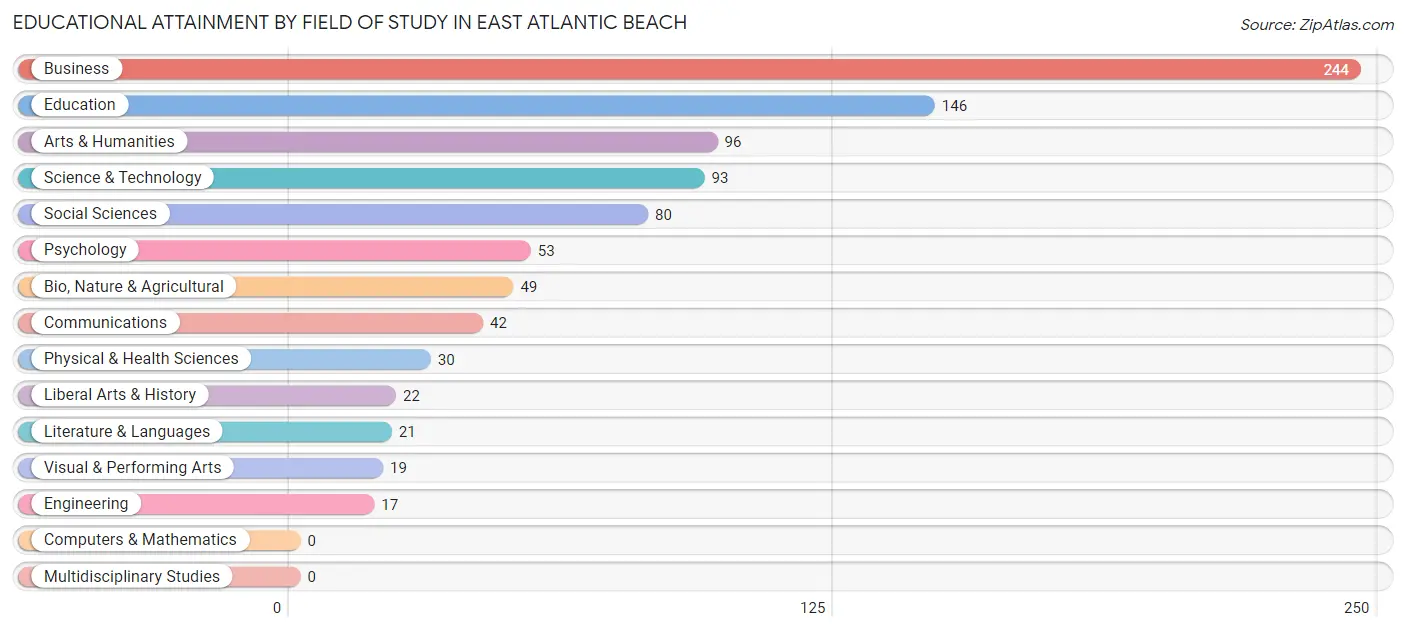
| Field of Study | # Graduates | % Graduates |
| Computers & Mathematics | 0 | 0.0% |
| Bio, Nature & Agricultural | 49 | 5.4% |
| Physical & Health Sciences | 30 | 3.3% |
| Psychology | 53 | 5.8% |
| Social Sciences | 80 | 8.8% |
| Engineering | 17 | 1.9% |
| Multidisciplinary Studies | 0 | 0.0% |
| Science & Technology | 93 | 10.2% |
| Business | 244 | 26.8% |
| Education | 146 | 16.0% |
| Literature & Languages | 21 | 2.3% |
| Liberal Arts & History | 22 | 2.4% |
| Visual & Performing Arts | 19 | 2.1% |
| Communications | 42 | 4.6% |
| Arts & Humanities | 96 | 10.5% |
| Total | 912 | 100.0% |
Transportation & Commute in East Atlantic Beach
Vehicle Availability by Sex in East Atlantic Beach
The most prevalent vehicle ownership categories in East Atlantic Beach are males with 2 vehicles (327, accounting for 53.8%) and females with 2 vehicles (267, making up 82.4%).
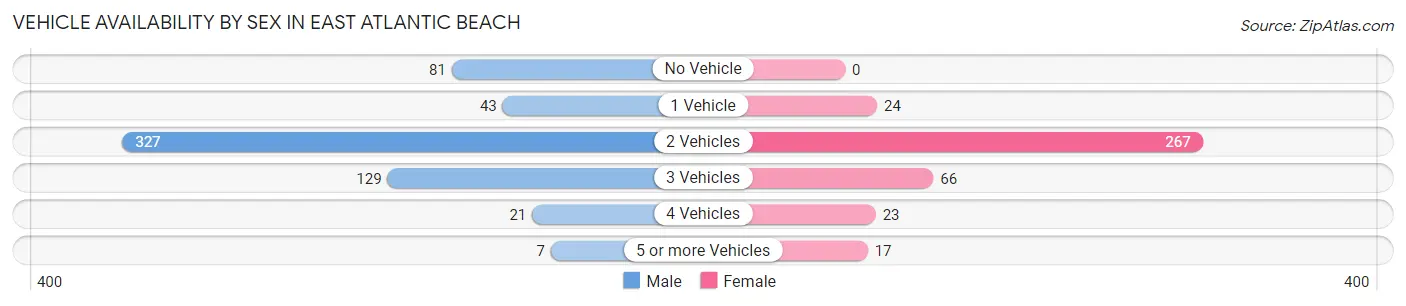
| Vehicles Available | Male | Female |
| No Vehicle | 81 (13.3%) | 0 (0.0%) |
| 1 Vehicle | 43 (7.1%) | 24 (6.0%) |
| 2 Vehicles | 327 (53.8%) | 267 (67.2%) |
| 3 Vehicles | 129 (21.2%) | 66 (16.6%) |
| 4 Vehicles | 21 (3.5%) | 23 (5.8%) |
| 5 or more Vehicles | 7 (1.1%) | 17 (4.3%) |
| Total | 608 (100.0%) | 397 (100.0%) |
Commute Time in East Atlantic Beach
The most frequently occuring commute durations in East Atlantic Beach are 25 to 29 minutes (143 commuters, 17.6%), 45 to 59 minutes (137 commuters, 16.8%), and 30 to 34 minutes (120 commuters, 14.7%).
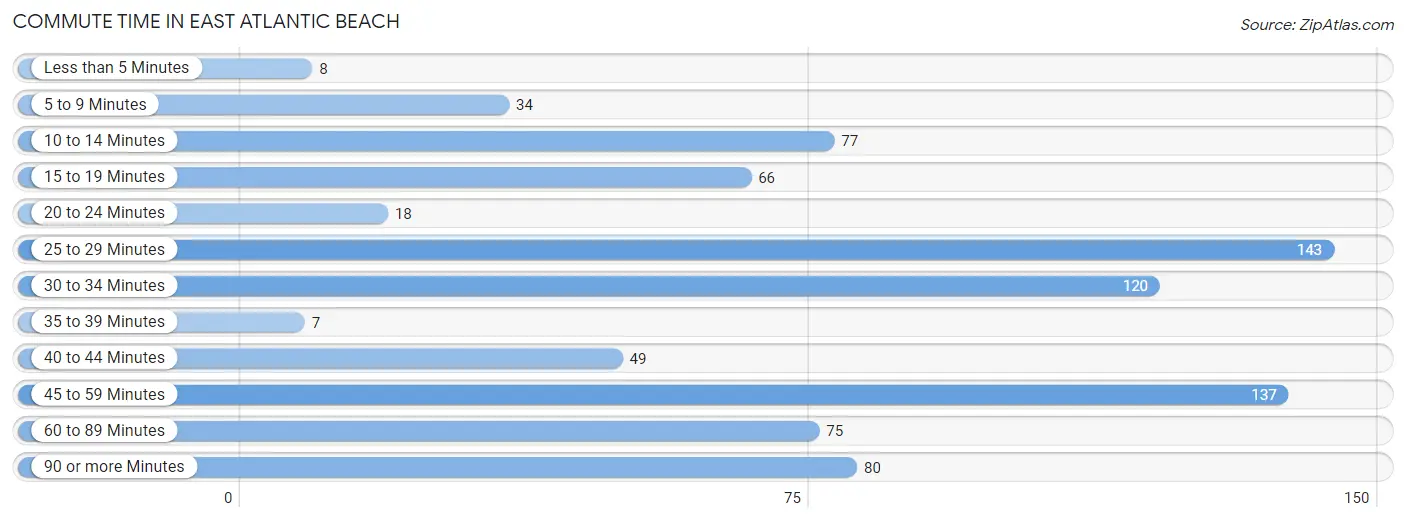
| Commute Time | # Commuters | % Commuters |
| Less than 5 Minutes | 8 | 1.0% |
| 5 to 9 Minutes | 34 | 4.2% |
| 10 to 14 Minutes | 77 | 9.5% |
| 15 to 19 Minutes | 66 | 8.1% |
| 20 to 24 Minutes | 18 | 2.2% |
| 25 to 29 Minutes | 143 | 17.6% |
| 30 to 34 Minutes | 120 | 14.7% |
| 35 to 39 Minutes | 7 | 0.9% |
| 40 to 44 Minutes | 49 | 6.0% |
| 45 to 59 Minutes | 137 | 16.8% |
| 60 to 89 Minutes | 75 | 9.2% |
| 90 or more Minutes | 80 | 9.8% |
Commute Time by Sex in East Atlantic Beach
The most common commute times in East Atlantic Beach are 25 to 29 minutes (108 commuters, 22.9%) for males and 45 to 59 minutes (74 commuters, 21.6%) for females.
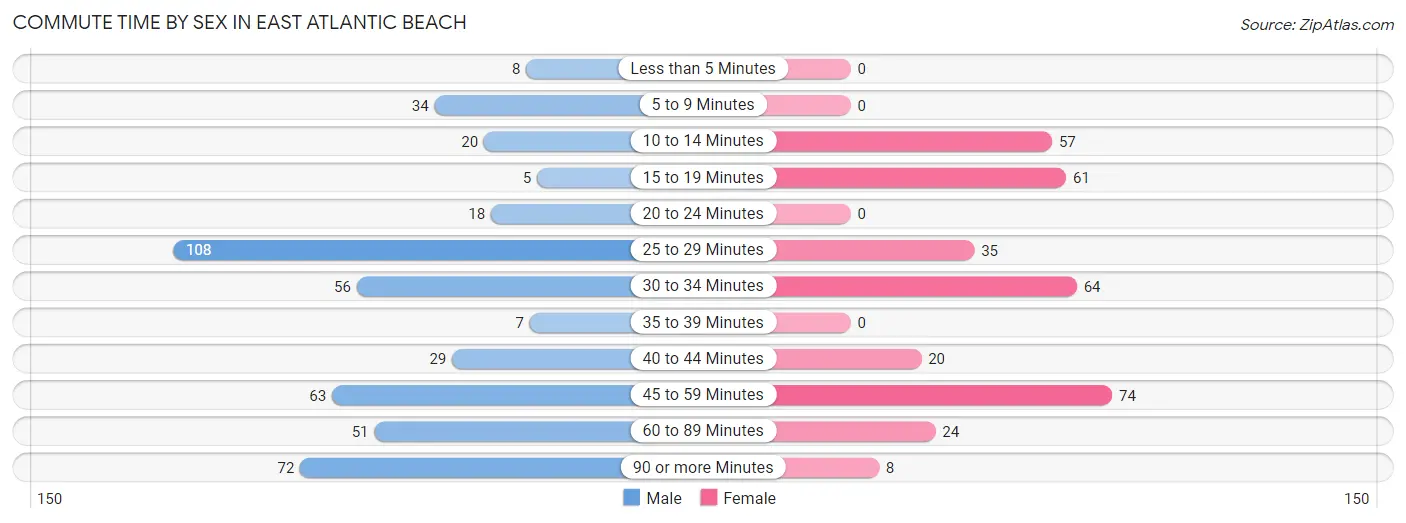
| Commute Time | Male | Female |
| Less than 5 Minutes | 8 (1.7%) | 0 (0.0%) |
| 5 to 9 Minutes | 34 (7.2%) | 0 (0.0%) |
| 10 to 14 Minutes | 20 (4.3%) | 57 (16.6%) |
| 15 to 19 Minutes | 5 (1.1%) | 61 (17.8%) |
| 20 to 24 Minutes | 18 (3.8%) | 0 (0.0%) |
| 25 to 29 Minutes | 108 (22.9%) | 35 (10.2%) |
| 30 to 34 Minutes | 56 (11.9%) | 64 (18.7%) |
| 35 to 39 Minutes | 7 (1.5%) | 0 (0.0%) |
| 40 to 44 Minutes | 29 (6.2%) | 20 (5.8%) |
| 45 to 59 Minutes | 63 (13.4%) | 74 (21.6%) |
| 60 to 89 Minutes | 51 (10.8%) | 24 (7.0%) |
| 90 or more Minutes | 72 (15.3%) | 8 (2.3%) |
Time of Departure to Work by Sex in East Atlantic Beach
The most frequent times of departure to work in East Atlantic Beach are 7:00 AM to 7:29 AM (93, 19.8%) for males and 8:30 AM to 8:59 AM (82, 23.9%) for females.
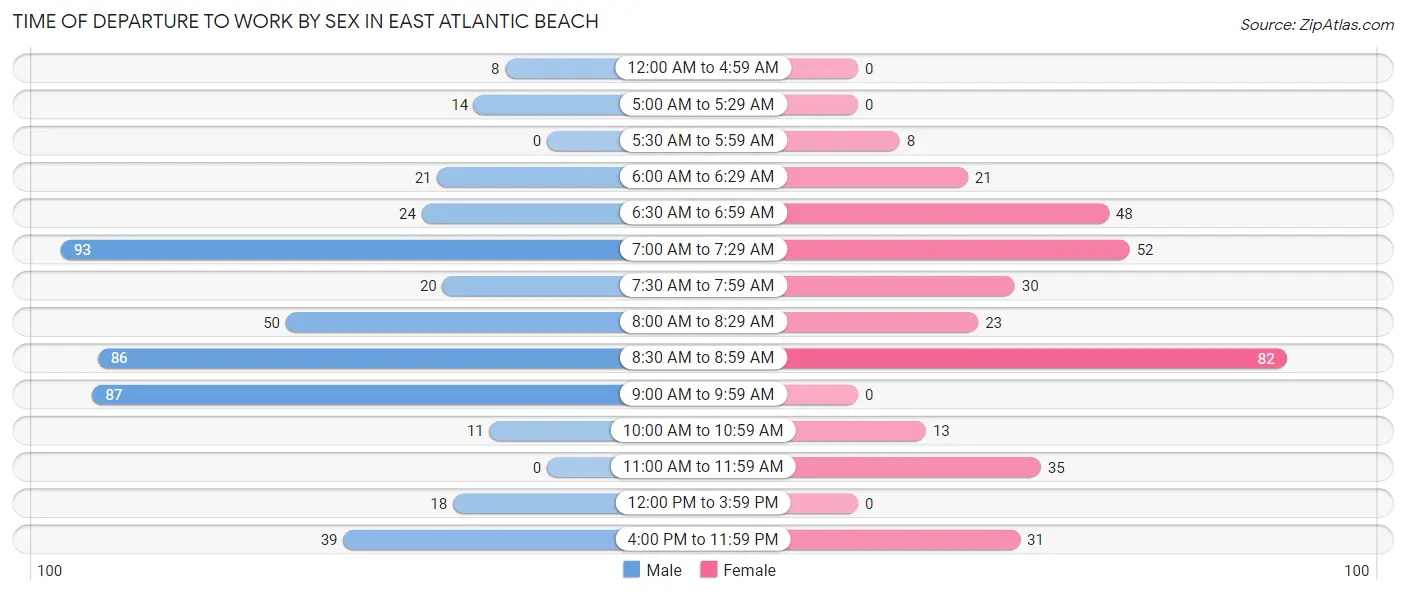
| Time of Departure | Male | Female |
| 12:00 AM to 4:59 AM | 8 (1.7%) | 0 (0.0%) |
| 5:00 AM to 5:29 AM | 14 (3.0%) | 0 (0.0%) |
| 5:30 AM to 5:59 AM | 0 (0.0%) | 8 (2.3%) |
| 6:00 AM to 6:29 AM | 21 (4.5%) | 21 (6.1%) |
| 6:30 AM to 6:59 AM | 24 (5.1%) | 48 (14.0%) |
| 7:00 AM to 7:29 AM | 93 (19.8%) | 52 (15.2%) |
| 7:30 AM to 7:59 AM | 20 (4.3%) | 30 (8.7%) |
| 8:00 AM to 8:29 AM | 50 (10.6%) | 23 (6.7%) |
| 8:30 AM to 8:59 AM | 86 (18.3%) | 82 (23.9%) |
| 9:00 AM to 9:59 AM | 87 (18.5%) | 0 (0.0%) |
| 10:00 AM to 10:59 AM | 11 (2.3%) | 13 (3.8%) |
| 11:00 AM to 11:59 AM | 0 (0.0%) | 35 (10.2%) |
| 12:00 PM to 3:59 PM | 18 (3.8%) | 0 (0.0%) |
| 4:00 PM to 11:59 PM | 39 (8.3%) | 31 (9.0%) |
| Total | 471 (100.0%) | 343 (100.0%) |
Housing Occupancy in East Atlantic Beach
Occupancy by Ownership in East Atlantic Beach
Of the total 765 dwellings in East Atlantic Beach, owner-occupied units account for 589 (77.0%), while renter-occupied units make up 176 (23.0%).
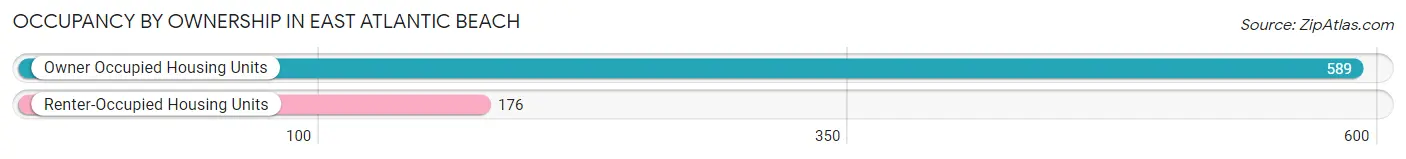
| Occupancy | # Housing Units | % Housing Units |
| Owner Occupied Housing Units | 589 | 77.0% |
| Renter-Occupied Housing Units | 176 | 23.0% |
| Total Occupied Housing Units | 765 | 100.0% |
Occupancy by Household Size in East Atlantic Beach
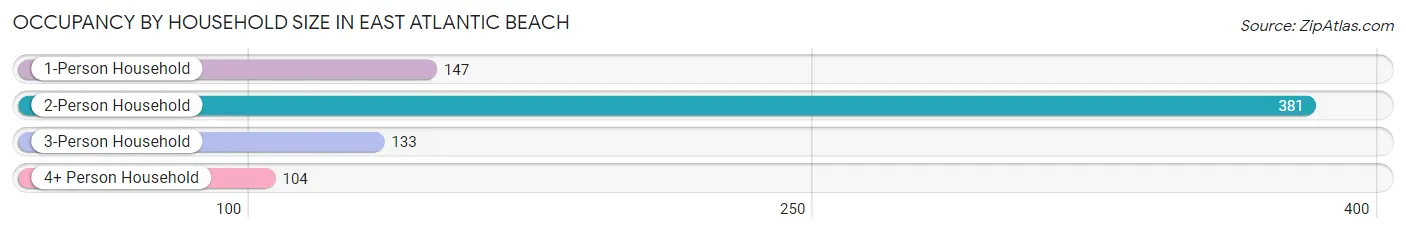
| Household Size | # Housing Units | % Housing Units |
| 1-Person Household | 147 | 19.2% |
| 2-Person Household | 381 | 49.8% |
| 3-Person Household | 133 | 17.4% |
| 4+ Person Household | 104 | 13.6% |
| Total Housing Units | 765 | 100.0% |
Occupancy by Ownership by Household Size in East Atlantic Beach
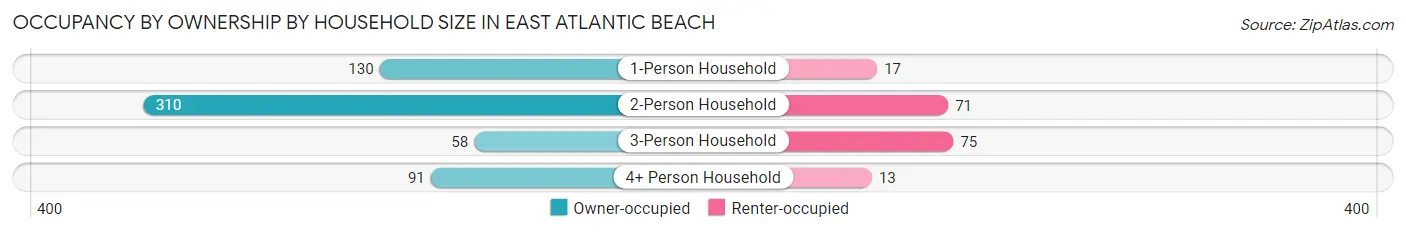
| Household Size | Owner-occupied | Renter-occupied |
| 1-Person Household | 130 (88.4%) | 17 (11.6%) |
| 2-Person Household | 310 (81.4%) | 71 (18.6%) |
| 3-Person Household | 58 (43.6%) | 75 (56.4%) |
| 4+ Person Household | 91 (87.5%) | 13 (12.5%) |
| Total Housing Units | 589 (77.0%) | 176 (23.0%) |
Occupancy by Educational Attainment in East Atlantic Beach
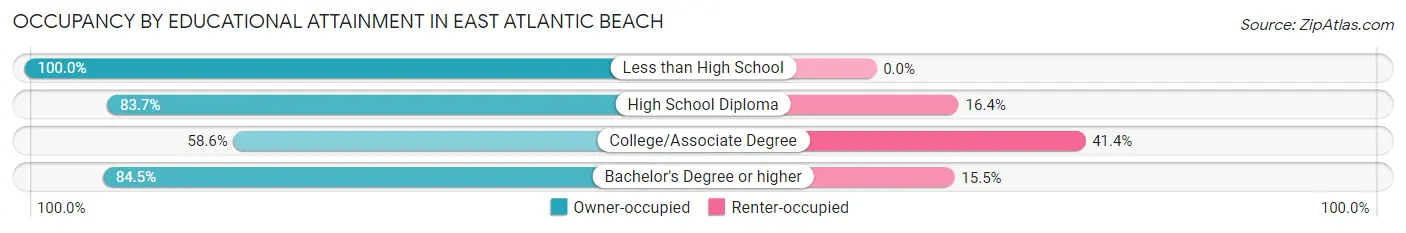
| Household Size | Owner-occupied | Renter-occupied |
| Less than High School | 7 (100.0%) | 0 (0.0%) |
| High School Diploma | 87 (83.7%) | 17 (16.4%) |
| College/Associate Degree | 130 (58.6%) | 92 (41.4%) |
| Bachelor's Degree or higher | 365 (84.5%) | 67 (15.5%) |
Occupancy by Age of Householder in East Atlantic Beach
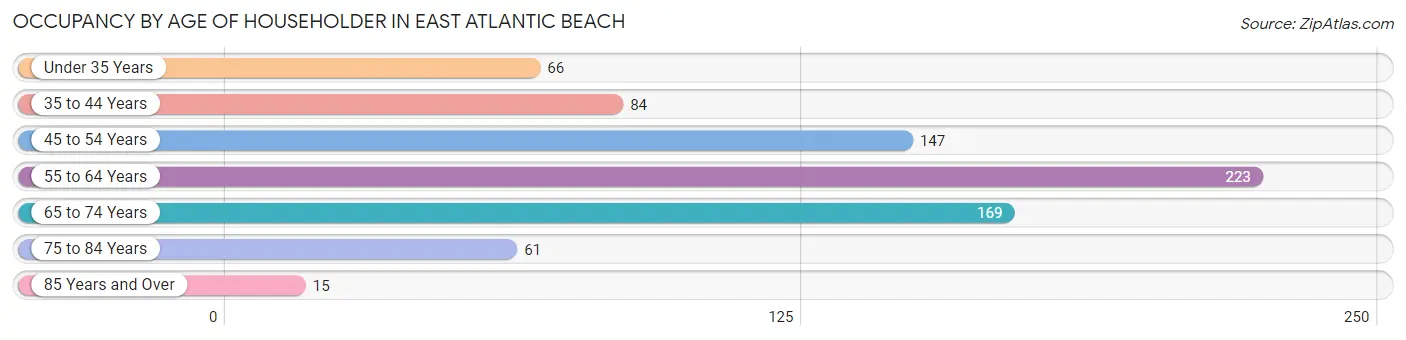
| Age Bracket | # Households | % Households |
| Under 35 Years | 66 | 8.6% |
| 35 to 44 Years | 84 | 11.0% |
| 45 to 54 Years | 147 | 19.2% |
| 55 to 64 Years | 223 | 29.1% |
| 65 to 74 Years | 169 | 22.1% |
| 75 to 84 Years | 61 | 8.0% |
| 85 Years and Over | 15 | 2.0% |
| Total | 765 | 100.0% |
Housing Finances in East Atlantic Beach
Median Income by Occupancy in East Atlantic Beach
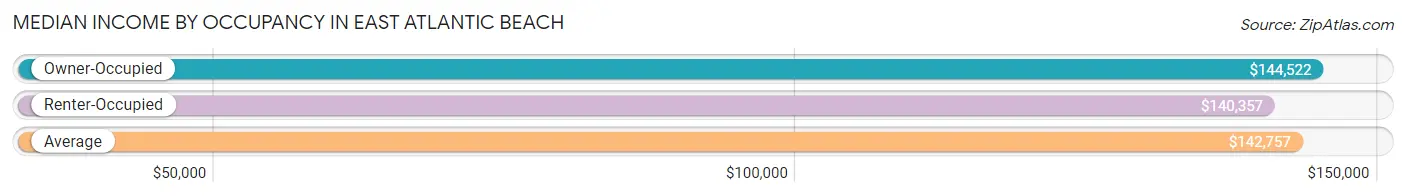
| Occupancy Type | # Households | Median Income |
| Owner-Occupied | 589 (77.0%) | $144,522 |
| Renter-Occupied | 176 (23.0%) | $140,357 |
| Average | 765 (100.0%) | $142,757 |
Occupancy by Householder Income Bracket in East Atlantic Beach
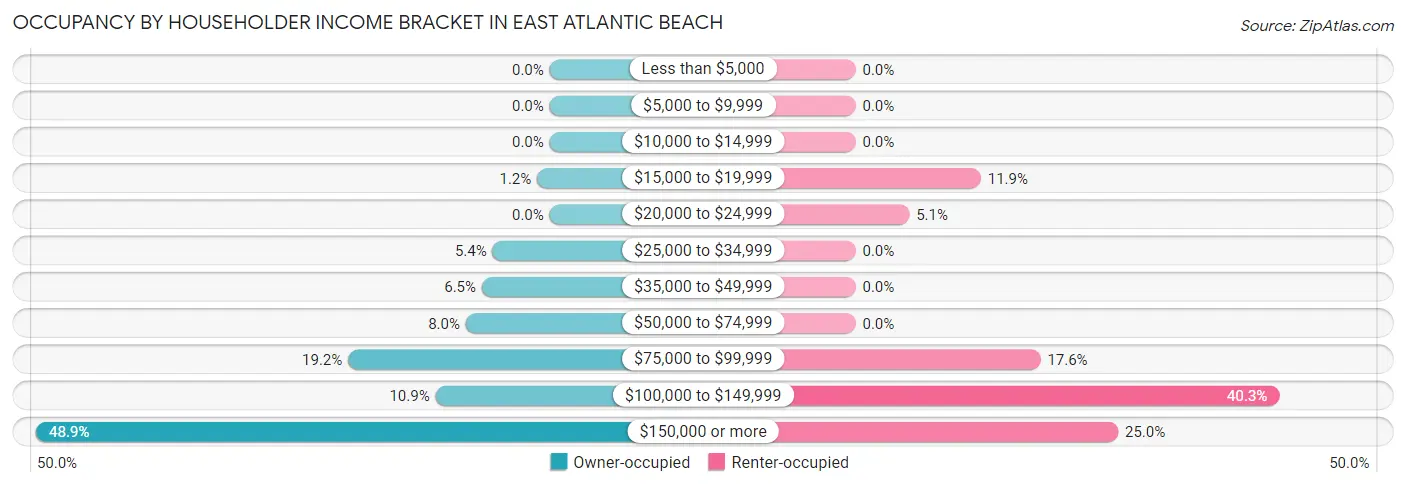
| Income Bracket | Owner-occupied | Renter-occupied |
| Less than $5,000 | 0 (0.0%) | 0 (0.0%) |
| $5,000 to $9,999 | 0 (0.0%) | 0 (0.0%) |
| $10,000 to $14,999 | 0 (0.0%) | 0 (0.0%) |
| $15,000 to $19,999 | 7 (1.2%) | 21 (11.9%) |
| $20,000 to $24,999 | 0 (0.0%) | 9 (5.1%) |
| $25,000 to $34,999 | 32 (5.4%) | 0 (0.0%) |
| $35,000 to $49,999 | 38 (6.5%) | 0 (0.0%) |
| $50,000 to $74,999 | 47 (8.0%) | 0 (0.0%) |
| $75,000 to $99,999 | 113 (19.2%) | 31 (17.6%) |
| $100,000 to $149,999 | 64 (10.9%) | 71 (40.3%) |
| $150,000 or more | 288 (48.9%) | 44 (25.0%) |
| Total | 589 (100.0%) | 176 (100.0%) |
Monthly Housing Cost Tiers in East Atlantic Beach
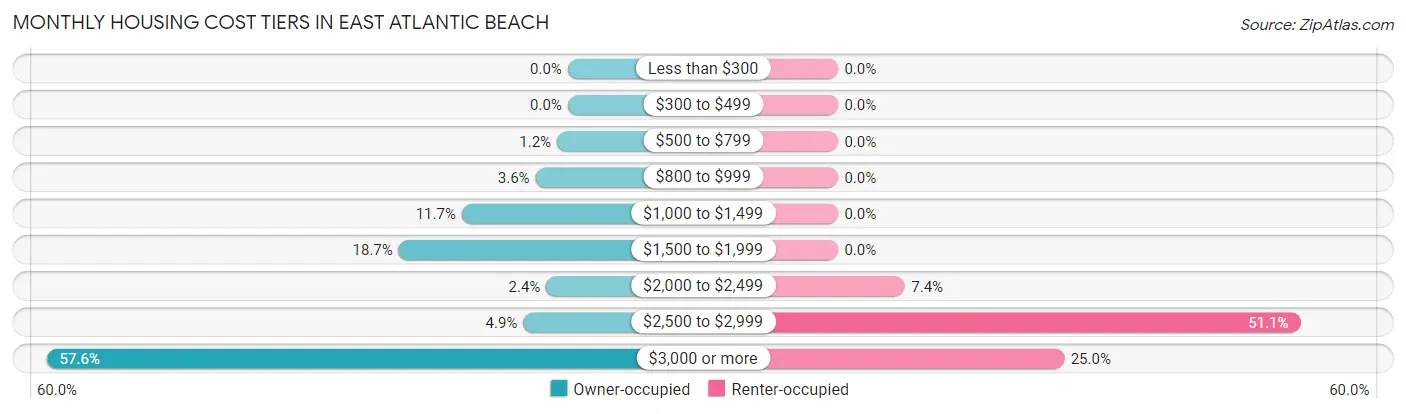
| Monthly Cost | Owner-occupied | Renter-occupied |
| Less than $300 | 0 (0.0%) | 0 (0.0%) |
| $300 to $499 | 0 (0.0%) | 0 (0.0%) |
| $500 to $799 | 7 (1.2%) | 0 (0.0%) |
| $800 to $999 | 21 (3.6%) | 0 (0.0%) |
| $1,000 to $1,499 | 69 (11.7%) | 0 (0.0%) |
| $1,500 to $1,999 | 110 (18.7%) | 0 (0.0%) |
| $2,000 to $2,499 | 14 (2.4%) | 13 (7.4%) |
| $2,500 to $2,999 | 29 (4.9%) | 90 (51.1%) |
| $3,000 or more | 339 (57.6%) | 44 (25.0%) |
| Total | 589 (100.0%) | 176 (100.0%) |
Physical Housing Characteristics in East Atlantic Beach
Housing Structures in East Atlantic Beach
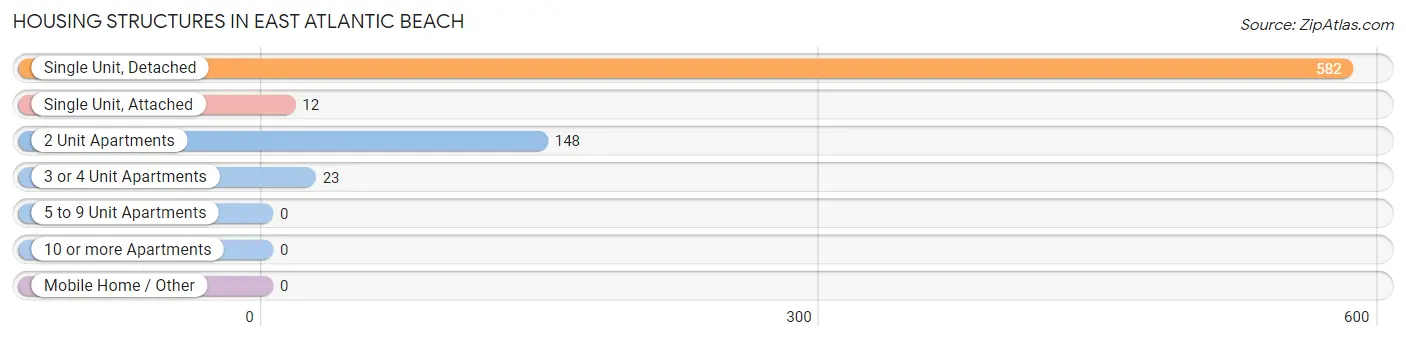
| Structure Type | # Housing Units | % Housing Units |
| Single Unit, Detached | 582 | 76.1% |
| Single Unit, Attached | 12 | 1.6% |
| 2 Unit Apartments | 148 | 19.4% |
| 3 or 4 Unit Apartments | 23 | 3.0% |
| 5 to 9 Unit Apartments | 0 | 0.0% |
| 10 or more Apartments | 0 | 0.0% |
| Mobile Home / Other | 0 | 0.0% |
| Total | 765 | 100.0% |
Housing Structures by Occupancy in East Atlantic Beach
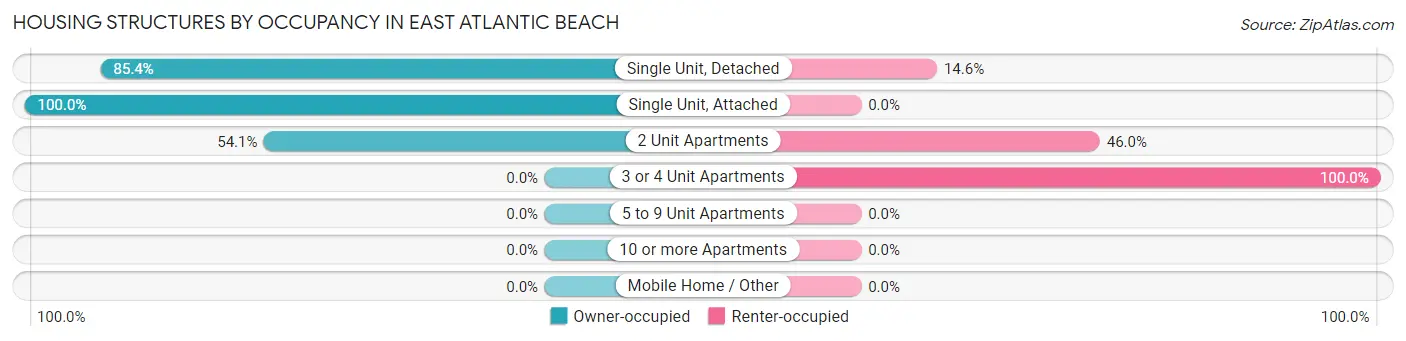
| Structure Type | Owner-occupied | Renter-occupied |
| Single Unit, Detached | 497 (85.4%) | 85 (14.6%) |
| Single Unit, Attached | 12 (100.0%) | 0 (0.0%) |
| 2 Unit Apartments | 80 (54.0%) | 68 (46.0%) |
| 3 or 4 Unit Apartments | 0 (0.0%) | 23 (100.0%) |
| 5 to 9 Unit Apartments | 0 (0.0%) | 0 (0.0%) |
| 10 or more Apartments | 0 (0.0%) | 0 (0.0%) |
| Mobile Home / Other | 0 (0.0%) | 0 (0.0%) |
| Total | 589 (77.0%) | 176 (23.0%) |
Housing Structures by Number of Rooms in East Atlantic Beach
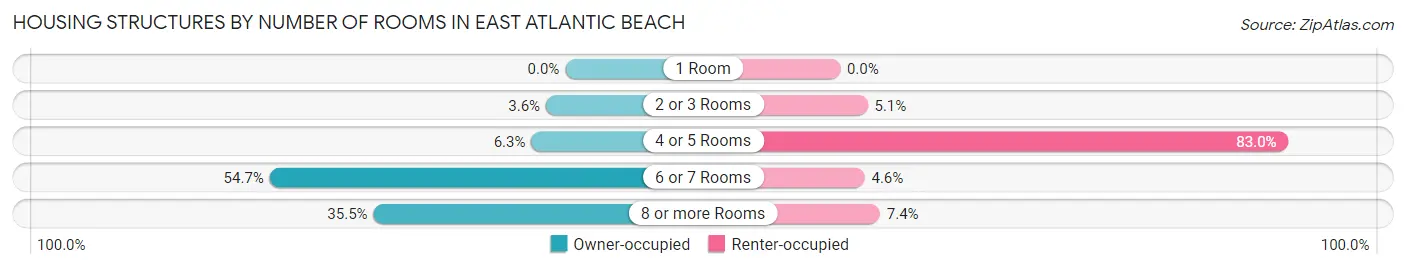
| Number of Rooms | Owner-occupied | Renter-occupied |
| 1 Room | 0 (0.0%) | 0 (0.0%) |
| 2 or 3 Rooms | 21 (3.6%) | 9 (5.1%) |
| 4 or 5 Rooms | 37 (6.3%) | 146 (83.0%) |
| 6 or 7 Rooms | 322 (54.7%) | 8 (4.5%) |
| 8 or more Rooms | 209 (35.5%) | 13 (7.4%) |
| Total | 589 (100.0%) | 176 (100.0%) |
Housing Structure by Heating Type in East Atlantic Beach
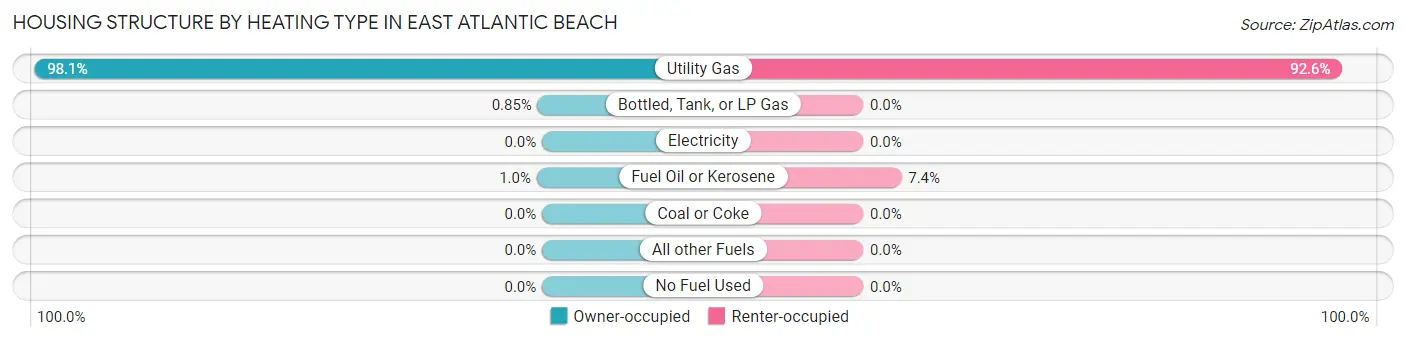
| Heating Type | Owner-occupied | Renter-occupied |
| Utility Gas | 578 (98.1%) | 163 (92.6%) |
| Bottled, Tank, or LP Gas | 5 (0.9%) | 0 (0.0%) |
| Electricity | 0 (0.0%) | 0 (0.0%) |
| Fuel Oil or Kerosene | 6 (1.0%) | 13 (7.4%) |
| Coal or Coke | 0 (0.0%) | 0 (0.0%) |
| All other Fuels | 0 (0.0%) | 0 (0.0%) |
| No Fuel Used | 0 (0.0%) | 0 (0.0%) |
| Total | 589 (100.0%) | 176 (100.0%) |
Household Vehicle Usage in East Atlantic Beach
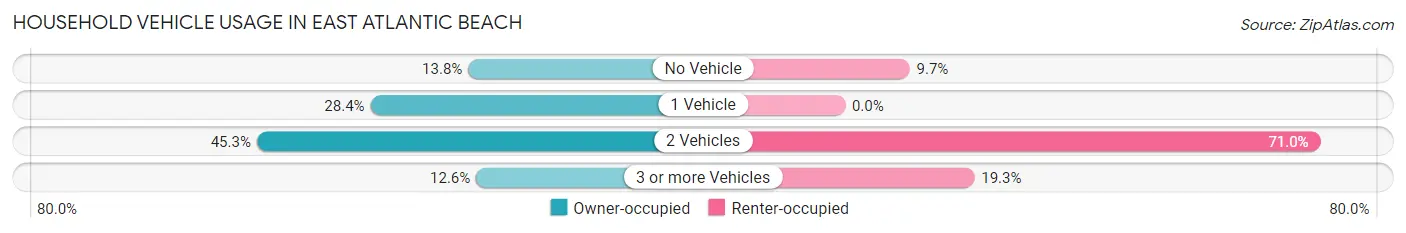
| Vehicles per Household | Owner-occupied | Renter-occupied |
| No Vehicle | 81 (13.8%) | 17 (9.7%) |
| 1 Vehicle | 167 (28.3%) | 0 (0.0%) |
| 2 Vehicles | 267 (45.3%) | 125 (71.0%) |
| 3 or more Vehicles | 74 (12.6%) | 34 (19.3%) |
| Total | 589 (100.0%) | 176 (100.0%) |
Real Estate & Mortgages in East Atlantic Beach
Real Estate and Mortgage Overview in East Atlantic Beach
| Characteristic | Without Mortgage | With Mortgage |
| Housing Units | 246 | 343 |
| Median Property Value | $681,800 | $891,600 |
| Median Household Income | $84,756 | $188 |
| Monthly Housing Costs | $1,501 | $304 |
| Real Estate Taxes | $10,001 | $0 |
Property Value by Mortgage Status in East Atlantic Beach
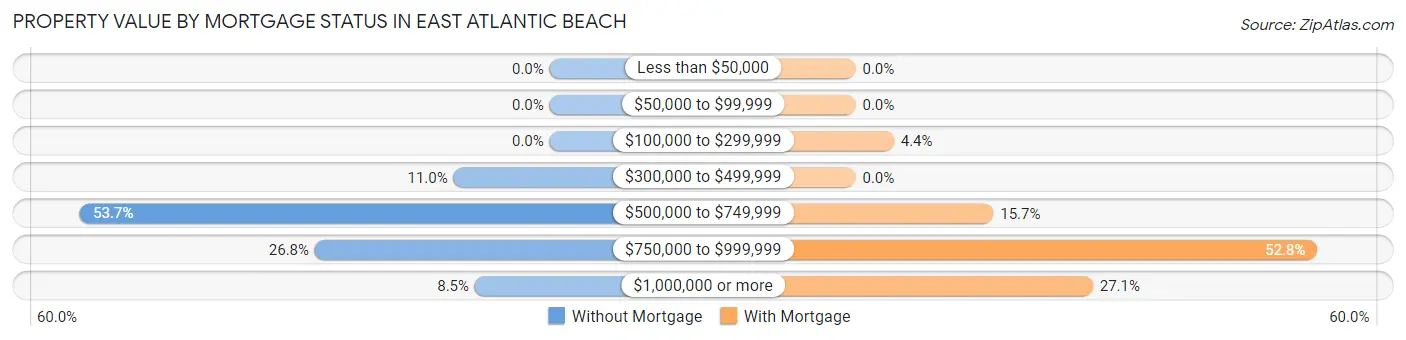
| Property Value | Without Mortgage | With Mortgage |
| Less than $50,000 | 0 (0.0%) | 0 (0.0%) |
| $50,000 to $99,999 | 0 (0.0%) | 0 (0.0%) |
| $100,000 to $299,999 | 0 (0.0%) | 15 (4.4%) |
| $300,000 to $499,999 | 27 (11.0%) | 0 (0.0%) |
| $500,000 to $749,999 | 132 (53.7%) | 54 (15.7%) |
| $750,000 to $999,999 | 66 (26.8%) | 181 (52.8%) |
| $1,000,000 or more | 21 (8.5%) | 93 (27.1%) |
| Total | 246 (100.0%) | 343 (100.0%) |
Household Income by Mortgage Status in East Atlantic Beach
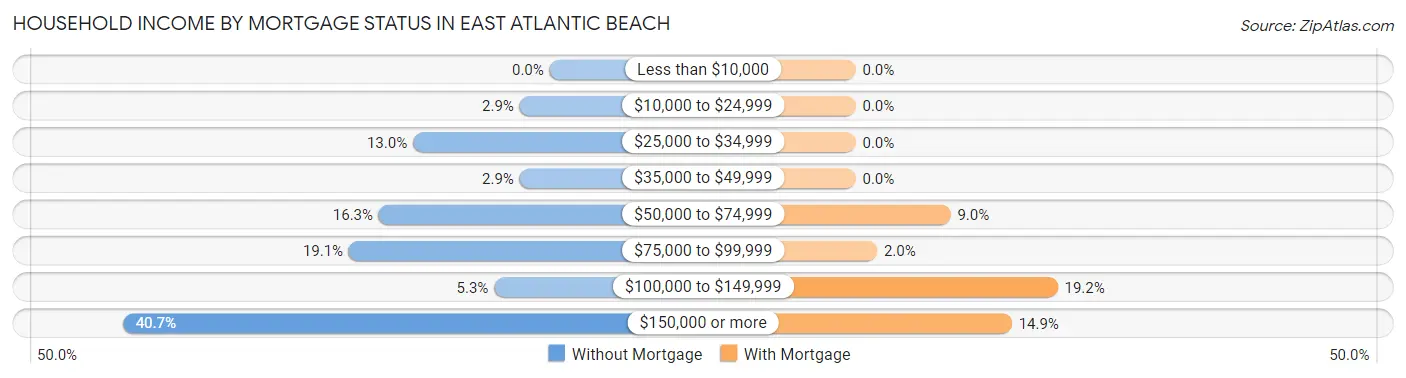
| Household Income | Without Mortgage | With Mortgage |
| Less than $10,000 | 0 (0.0%) | 0 (0.0%) |
| $10,000 to $24,999 | 7 (2.9%) | 0 (0.0%) |
| $25,000 to $34,999 | 32 (13.0%) | 0 (0.0%) |
| $35,000 to $49,999 | 7 (2.9%) | 0 (0.0%) |
| $50,000 to $74,999 | 40 (16.3%) | 31 (9.0%) |
| $75,000 to $99,999 | 47 (19.1%) | 7 (2.0%) |
| $100,000 to $149,999 | 13 (5.3%) | 66 (19.2%) |
| $150,000 or more | 100 (40.6%) | 51 (14.9%) |
| Total | 246 (100.0%) | 343 (100.0%) |
Property Value to Household Income Ratio in East Atlantic Beach
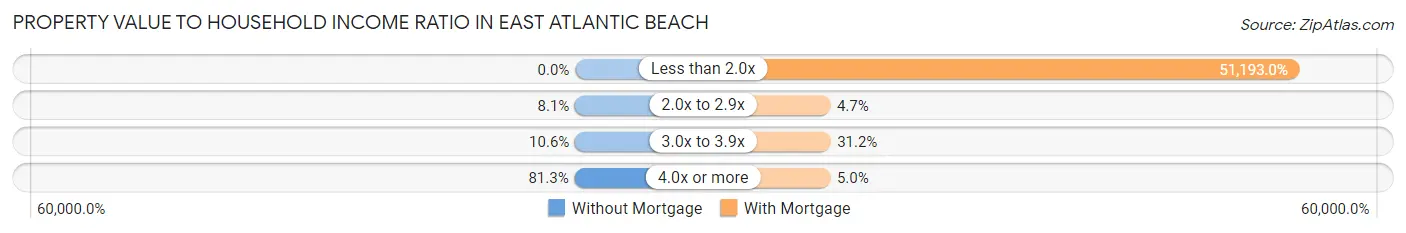
| Value-to-Income Ratio | Without Mortgage | With Mortgage |
| Less than 2.0x | 0 (0.0%) | 175,592 (51,193.0%) |
| 2.0x to 2.9x | 20 (8.1%) | 16 (4.7%) |
| 3.0x to 3.9x | 26 (10.6%) | 107 (31.2%) |
| 4.0x or more | 200 (81.3%) | 17 (5.0%) |
| Total | 246 (100.0%) | 343 (100.0%) |
Real Estate Taxes by Mortgage Status in East Atlantic Beach
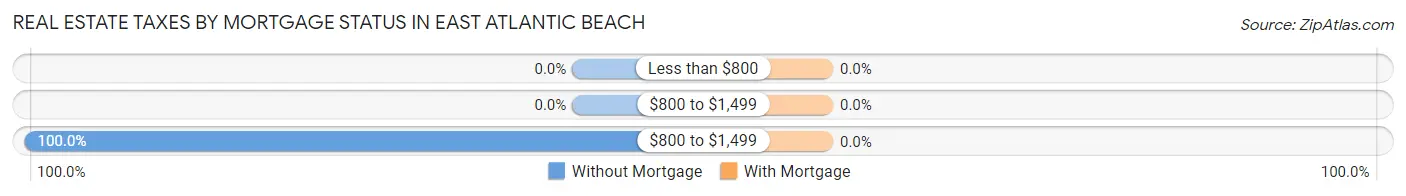
| Property Taxes | Without Mortgage | With Mortgage |
| Less than $800 | 0 (0.0%) | 0 (0.0%) |
| $800 to $1,499 | 0 (0.0%) | 0 (0.0%) |
| $800 to $1,499 | 246 (100.0%) | 0 (0.0%) |
| Total | 246 (100.0%) | 343 (100.0%) |
Health & Disability in East Atlantic Beach
Health Insurance Coverage by Age in East Atlantic Beach
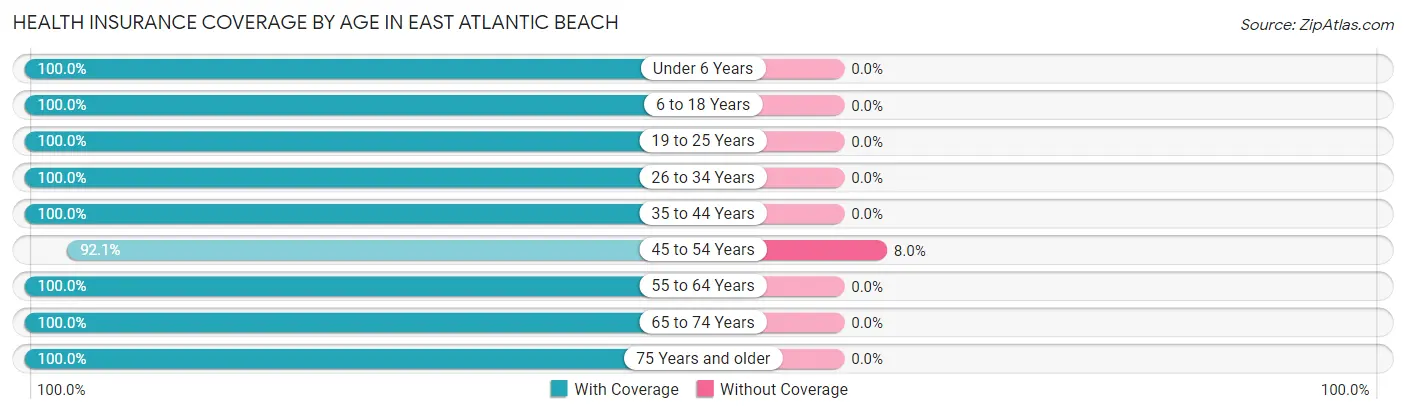
| Age Bracket | With Coverage | Without Coverage |
| Under 6 Years | 102 (100.0%) | 0 (0.0%) |
| 6 to 18 Years | 160 (100.0%) | 0 (0.0%) |
| 19 to 25 Years | 147 (100.0%) | 0 (0.0%) |
| 26 to 34 Years | 155 (100.0%) | 0 (0.0%) |
| 35 to 44 Years | 196 (100.0%) | 0 (0.0%) |
| 45 to 54 Years | 278 (92.0%) | 24 (8.0%) |
| 55 to 64 Years | 370 (100.0%) | 0 (0.0%) |
| 65 to 74 Years | 252 (100.0%) | 0 (0.0%) |
| 75 Years and older | 83 (100.0%) | 0 (0.0%) |
| Total | 1,743 (98.6%) | 24 (1.4%) |
Health Insurance Coverage by Citizenship Status in East Atlantic Beach
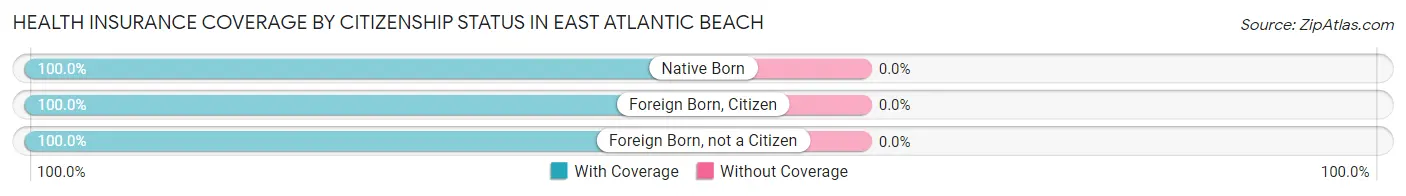
| Citizenship Status | With Coverage | Without Coverage |
| Native Born | 102 (100.0%) | 0 (0.0%) |
| Foreign Born, Citizen | 160 (100.0%) | 0 (0.0%) |
| Foreign Born, not a Citizen | 147 (100.0%) | 0 (0.0%) |
Health Insurance Coverage by Household Income in East Atlantic Beach
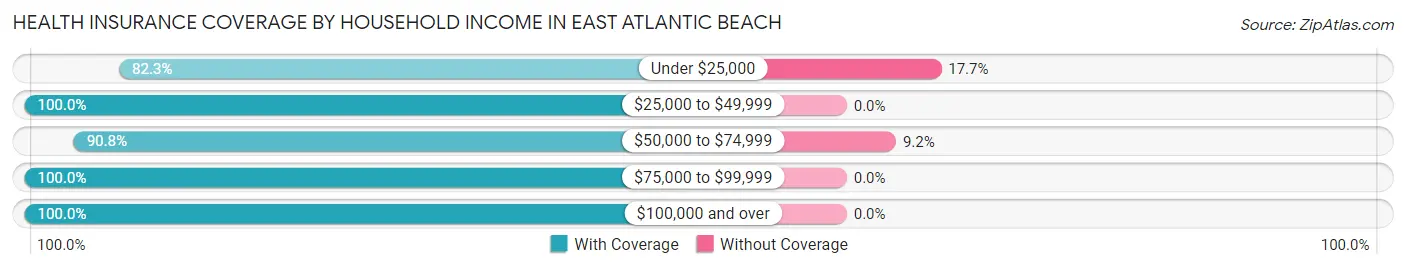
| Household Income | With Coverage | Without Coverage |
| Under $25,000 | 79 (82.3%) | 17 (17.7%) |
| $25,000 to $49,999 | 188 (100.0%) | 0 (0.0%) |
| $50,000 to $74,999 | 69 (90.8%) | 7 (9.2%) |
| $75,000 to $99,999 | 285 (100.0%) | 0 (0.0%) |
| $100,000 and over | 1,122 (100.0%) | 0 (0.0%) |
Public vs Private Health Insurance Coverage by Age in East Atlantic Beach
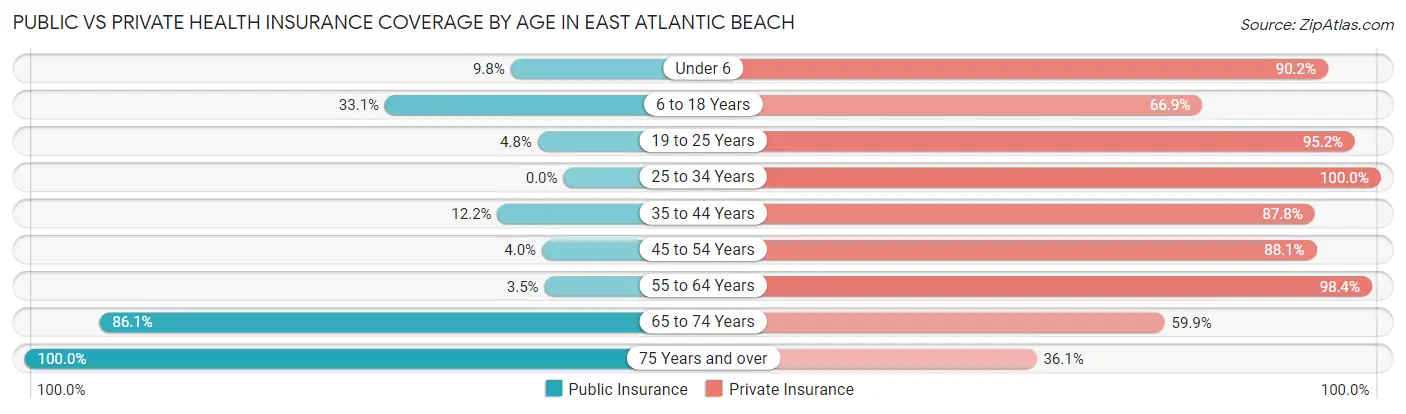
| Age Bracket | Public Insurance | Private Insurance |
| Under 6 | 10 (9.8%) | 92 (90.2%) |
| 6 to 18 Years | 53 (33.1%) | 107 (66.9%) |
| 19 to 25 Years | 7 (4.8%) | 140 (95.2%) |
| 25 to 34 Years | 0 (0.0%) | 155 (100.0%) |
| 35 to 44 Years | 24 (12.2%) | 172 (87.8%) |
| 45 to 54 Years | 12 (4.0%) | 266 (88.1%) |
| 55 to 64 Years | 13 (3.5%) | 364 (98.4%) |
| 65 to 74 Years | 217 (86.1%) | 151 (59.9%) |
| 75 Years and over | 83 (100.0%) | 30 (36.1%) |
| Total | 419 (23.7%) | 1,477 (83.6%) |
Disability Status by Sex by Age in East Atlantic Beach
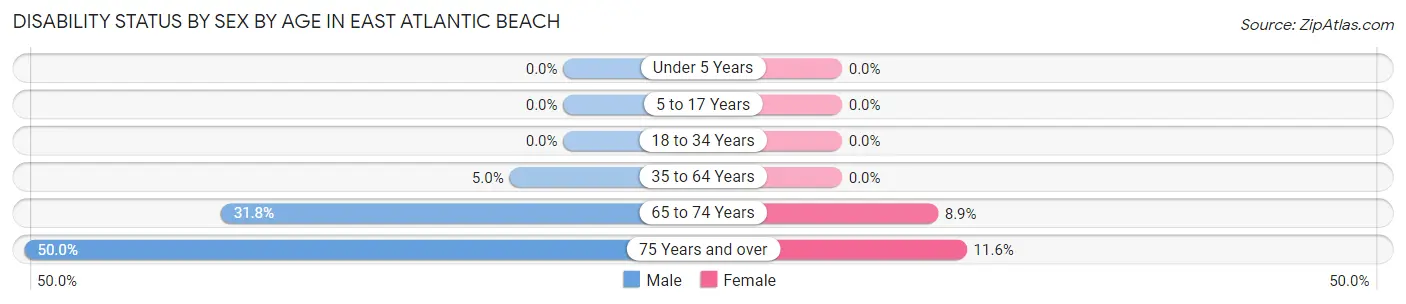
| Age Bracket | Male | Female |
| Under 5 Years | 0 (0.0%) | 0 (0.0%) |
| 5 to 17 Years | 0 (0.0%) | 0 (0.0%) |
| 18 to 34 Years | 0 (0.0%) | 0 (0.0%) |
| 35 to 64 Years | 24 (5.0%) | 0 (0.0%) |
| 65 to 74 Years | 48 (31.8%) | 9 (8.9%) |
| 75 Years and over | 7 (50.0%) | 8 (11.6%) |
Disability Class by Sex by Age in East Atlantic Beach
Disability Class: Hearing Difficulty
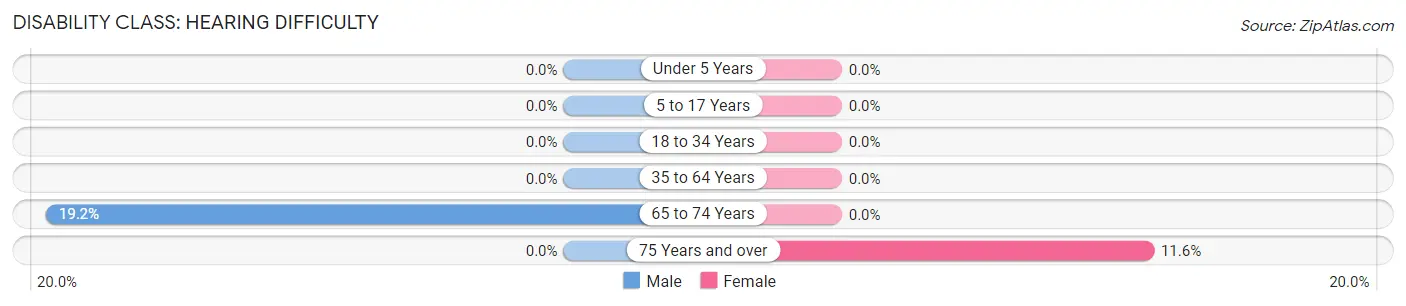
| Age Bracket | Male | Female |
| Under 5 Years | 0 (0.0%) | 0 (0.0%) |
| 5 to 17 Years | 0 (0.0%) | 0 (0.0%) |
| 18 to 34 Years | 0 (0.0%) | 0 (0.0%) |
| 35 to 64 Years | 0 (0.0%) | 0 (0.0%) |
| 65 to 74 Years | 29 (19.2%) | 0 (0.0%) |
| 75 Years and over | 0 (0.0%) | 8 (11.6%) |
Disability Class: Vision Difficulty
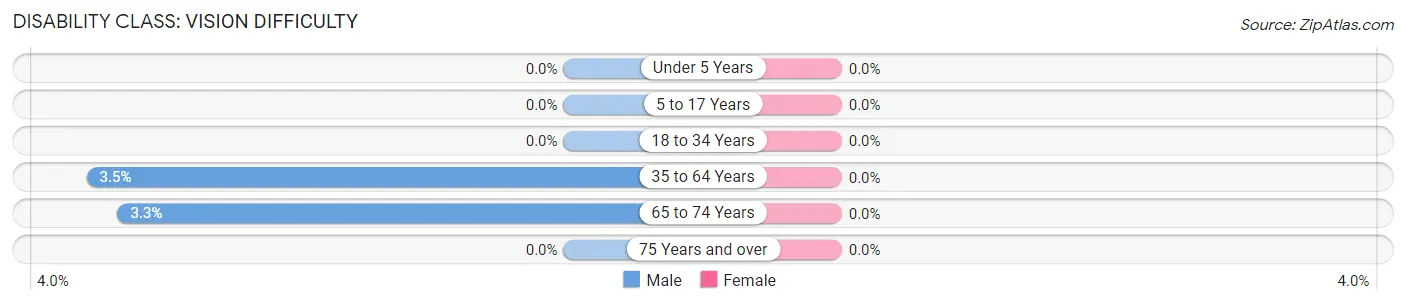
| Age Bracket | Male | Female |
| Under 5 Years | 0 (0.0%) | 0 (0.0%) |
| 5 to 17 Years | 0 (0.0%) | 0 (0.0%) |
| 18 to 34 Years | 0 (0.0%) | 0 (0.0%) |
| 35 to 64 Years | 17 (3.5%) | 0 (0.0%) |
| 65 to 74 Years | 5 (3.3%) | 0 (0.0%) |
| 75 Years and over | 0 (0.0%) | 0 (0.0%) |
Disability Class: Cognitive Difficulty
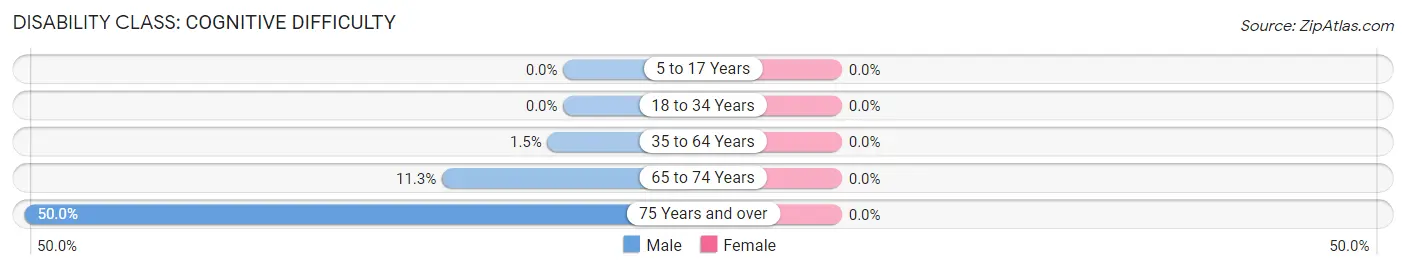
| Age Bracket | Male | Female |
| 5 to 17 Years | 0 (0.0%) | 0 (0.0%) |
| 18 to 34 Years | 0 (0.0%) | 0 (0.0%) |
| 35 to 64 Years | 7 (1.5%) | 0 (0.0%) |
| 65 to 74 Years | 17 (11.3%) | 0 (0.0%) |
| 75 Years and over | 7 (50.0%) | 0 (0.0%) |
Disability Class: Ambulatory Difficulty
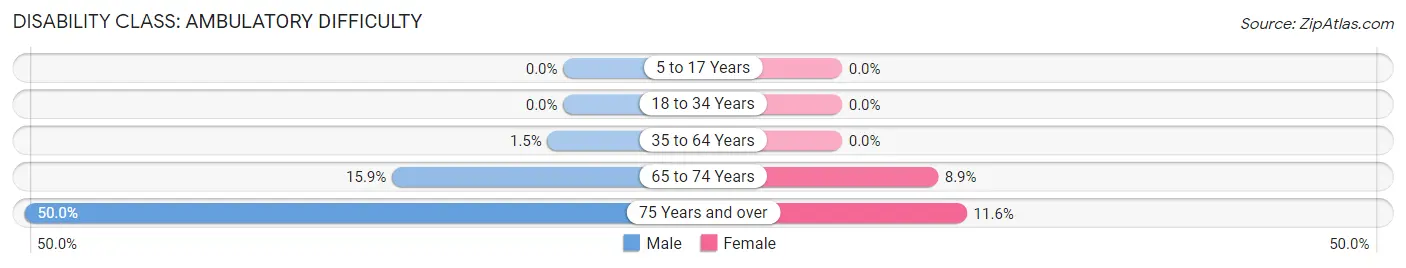
| Age Bracket | Male | Female |
| 5 to 17 Years | 0 (0.0%) | 0 (0.0%) |
| 18 to 34 Years | 0 (0.0%) | 0 (0.0%) |
| 35 to 64 Years | 7 (1.5%) | 0 (0.0%) |
| 65 to 74 Years | 24 (15.9%) | 9 (8.9%) |
| 75 Years and over | 7 (50.0%) | 8 (11.6%) |
Disability Class: Self-Care Difficulty
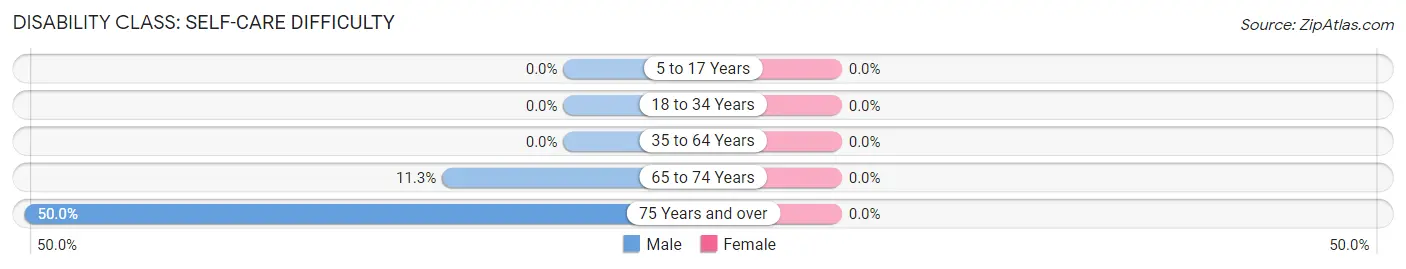
| Age Bracket | Male | Female |
| 5 to 17 Years | 0 (0.0%) | 0 (0.0%) |
| 18 to 34 Years | 0 (0.0%) | 0 (0.0%) |
| 35 to 64 Years | 0 (0.0%) | 0 (0.0%) |
| 65 to 74 Years | 17 (11.3%) | 0 (0.0%) |
| 75 Years and over | 7 (50.0%) | 0 (0.0%) |
Technology Access in East Atlantic Beach
Computing Device Access in East Atlantic Beach
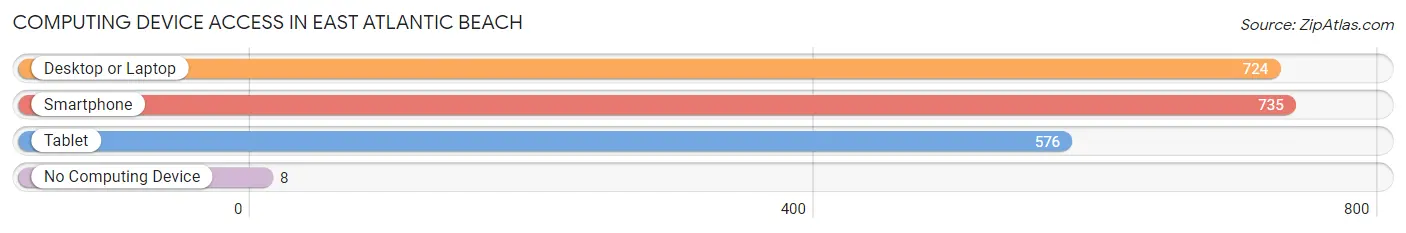
| Device Type | # Households | % Households |
| Desktop or Laptop | 724 | 94.6% |
| Smartphone | 735 | 96.1% |
| Tablet | 576 | 75.3% |
| No Computing Device | 8 | 1.1% |
| Total | 765 | 100.0% |
Internet Access in East Atlantic Beach
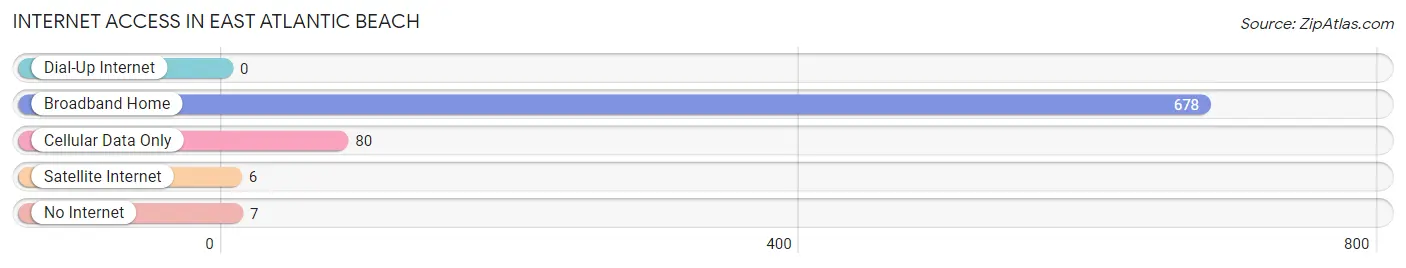
| Internet Type | # Households | % Households |
| Dial-Up Internet | 0 | 0.0% |
| Broadband Home | 678 | 88.6% |
| Cellular Data Only | 80 | 10.5% |
| Satellite Internet | 6 | 0.8% |
| No Internet | 7 | 0.9% |
| Total | 765 | 100.0% |
East Atlantic Beach Summary
Atlantic Beach is a village located in Nassau County, New York, United States. The population was 1,892 at the 2010 census. It is located in the Town of Hempstead.
History
Atlantic Beach was founded in the late 19th century as a summer resort community. It was originally known as the “Playground of the East” and was a popular destination for wealthy New Yorkers. The village was incorporated in 1922 and was named after the Atlantic Ocean, which borders the village to the south.
Geography
Atlantic Beach is located at 40°35′17″N 73°37′17″W (40.588, -73.621). According to the United States Census Bureau, the village has a total area of 0.6 square miles (1.6 km2), all of it land.
Economy
The economy of Atlantic Beach is largely based on tourism. The village is home to several hotels, restaurants, and other businesses that cater to visitors. The village also has a marina and a yacht club.
Demographics
As of the census of 2000, there were 1,890 people, 745 households, and 517 families residing in the village. The population density was 3,093.3 people per square mile (1,192.2/km2). There were 790 housing units at an average density of 1,286.3 per square mile (496.2/km2). The racial makeup of the village was 94.2% White, 1.3% African American, 0.3% Native American, 1.7% Asian, 0.1% Pacific Islander, 1.2% from other races, and 1.4% from two or more races. Hispanic or Latino of any race were 4.2% of the population.
There were 745 households, out of which 28.2% had children under the age of 18 living with them, 54.2% were married couples living together, 9.7% had a female householder with no husband present, and 32.3% were non-families. 26.2% of all households were made up of individuals, and 11.2% had someone living alone who was 65 years of age or older. The average household size was 2.53 and the average family size was 3.09.
In the village, the population was spread out, with 22.7% under the age of 18, 5.3% from 18 to 24, 28.2% from 25 to 44, 25.2% from 45 to 64, and 18.6% who were 65 years of age or older. The median age was 41 years. For every 100 females, there were 94.2 males. For every 100 females age 18 and over, there were 91.2 males.
The median income for a household in the village was $76,944, and the median income for a family was $90,000. Males had a median income of $51,250 versus $41,250 for females. The per capita income for the village was $37,945. About 2.2% of families and 3.7% of the population were below the poverty line, including 4.2% of those under age 18 and 4.2% of those age 65 or over.
Common Questions
What is Per Capita Income in East Atlantic Beach?
Per Capita income in East Atlantic Beach is $74,408.
What is the Median Family Income in East Atlantic Beach?
Median Family Income in East Atlantic Beach is $151,250.
What is the Median Household income in East Atlantic Beach?
Median Household Income in East Atlantic Beach is $142,757.
What is Income or Wage Gap in East Atlantic Beach?
Income or Wage Gap in East Atlantic Beach is 69.5%.
Women in East Atlantic Beach earn 30.5 cents for every dollar earned by a man.
What is Inequality or Gini Index in East Atlantic Beach?
Inequality or Gini Index in East Atlantic Beach is 0.40.
What is the Total Population of East Atlantic Beach?
Total Population of East Atlantic Beach is 1,767.
What is the Total Male Population of East Atlantic Beach?
Total Male Population of East Atlantic Beach is 862.
What is the Total Female Population of East Atlantic Beach?
Total Female Population of East Atlantic Beach is 905.
What is the Ratio of Males per 100 Females in East Atlantic Beach?
There are 95.25 Males per 100 Females in East Atlantic Beach.
What is the Ratio of Females per 100 Males in East Atlantic Beach?
There are 104.99 Females per 100 Males in East Atlantic Beach.
What is the Median Population Age in East Atlantic Beach?
Median Population Age in East Atlantic Beach is 48.9 Years.
What is the Average Family Size in East Atlantic Beach
Average Family Size in East Atlantic Beach is 2.6 People.
What is the Average Household Size in East Atlantic Beach
Average Household Size in East Atlantic Beach is 2.3 People.
How Large is the Labor Force in East Atlantic Beach?
There are 1,135 People in the Labor Forcein in East Atlantic Beach.
What is the Percentage of People in the Labor Force in East Atlantic Beach?
74.8% of People are in the Labor Force in East Atlantic Beach.
What is the Unemployment Rate in East Atlantic Beach?
Unemployment Rate in East Atlantic Beach is 9.8%.