Chappaqua, NY Map & Demographics
Chappaqua Map
Chappaqua Overview
$102,223
PER CAPITA INCOME
$181,711
AVG FAMILY INCOME
$185,464
AVG HOUSEHOLD INCOME
48.1%
WAGE / INCOME GAP [ % ]
51.9¢/ $1
WAGE / INCOME GAP [ $ ]
0.41
INEQUALITY / GINI INDEX
2,812
TOTAL POPULATION
1,381
MALE POPULATION
1,431
FEMALE POPULATION
96.51
MALES / 100 FEMALES
103.62
FEMALES / 100 MALES
46.2
MEDIAN AGE
2.9
AVG FAMILY SIZE
2.5
AVG HOUSEHOLD SIZE
1,556
LABOR FORCE [ PEOPLE ]
65.0%
PERCENT IN LABOR FORCE
6.6%
UNEMPLOYMENT RATE
Chappaqua Zip Codes
Chappaqua Area Codes
Income in Chappaqua
Income Overview in Chappaqua
Per Capita Income in Chappaqua is $102,223, while median incomes of families and households are $181,711 and $185,464 respectively.
| Characteristic | Number | Measure |
| Per Capita Income | 2,812 | $102,223 |
| Median Family Income | 844 | $181,711 |
| Mean Family Income | 844 | $263,167 |
| Median Household Income | 1,101 | $185,464 |
| Mean Household Income | 1,101 | $248,329 |
| Income Deficit | 844 | $0 |
| Wage / Income Gap (%) | 2,812 | 48.14% |
| Wage / Income Gap ($) | 2,812 | 51.86¢ per $1 |
| Gini / Inequality Index | 2,812 | 0.41 |
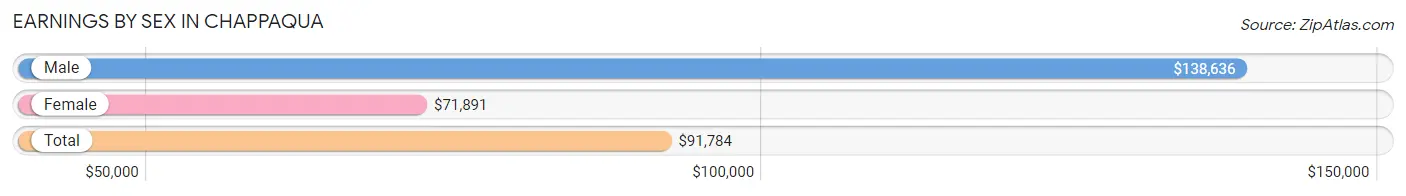
Earnings by Sex in Chappaqua
Average Earnings in Chappaqua are $91,784, $138,636 for men and $71,891 for women, a difference of 48.1%.
| Sex | Number | Average Earnings |
| Male | 838 (50.7%) | $138,636 |
| Female | 815 (49.3%) | $71,891 |
| Total | 1,653 (100.0%) | $91,784 |
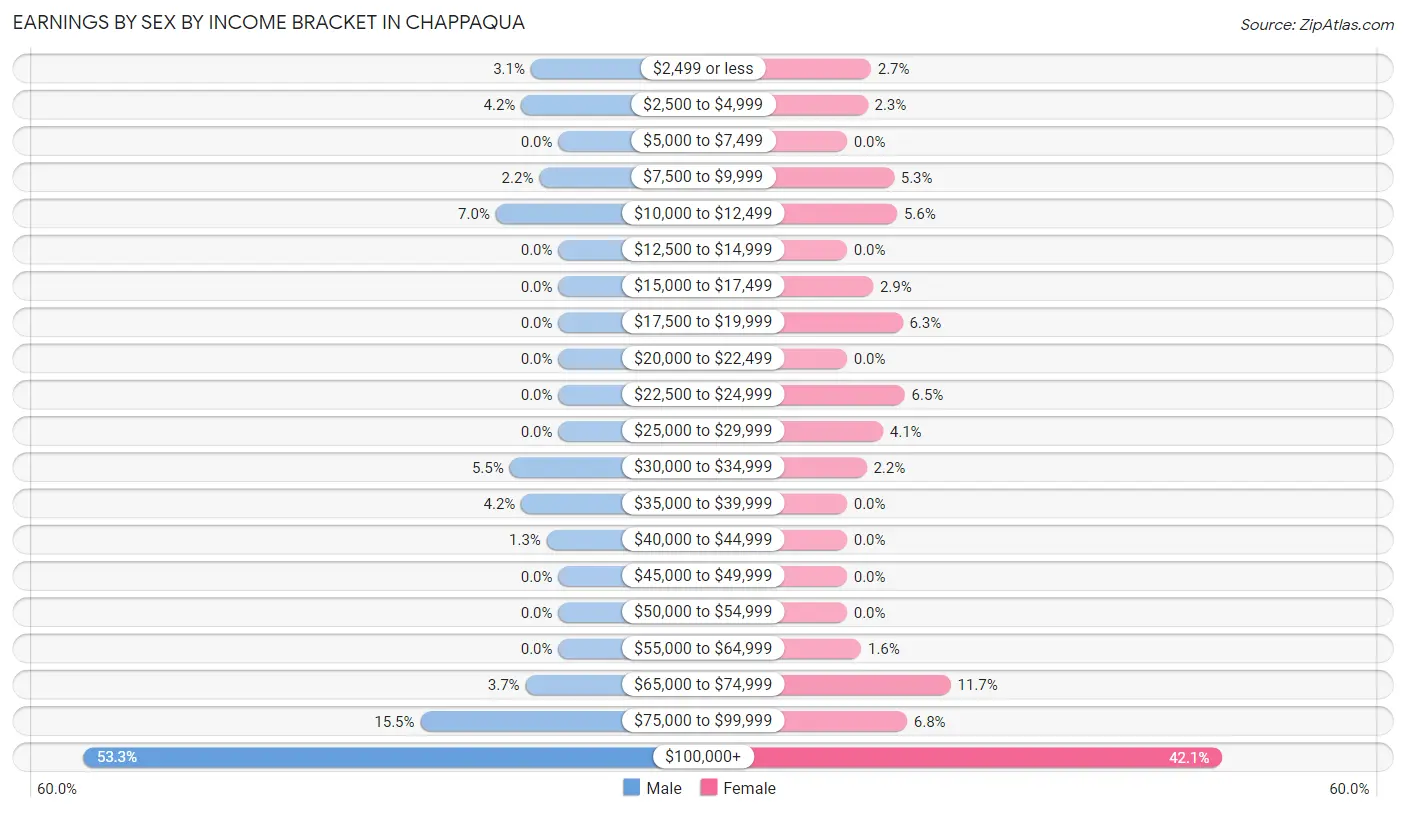
Earnings by Sex by Income Bracket in Chappaqua
The most common earnings brackets in Chappaqua are $100,000+ for men (447 | 53.3%) and $100,000+ for women (343 | 42.1%).
| Income | Male | Female |
| $2,499 or less | 26 (3.1%) | 22 (2.7%) |
| $2,500 to $4,999 | 35 (4.2%) | 19 (2.3%) |
| $5,000 to $7,499 | 0 (0.0%) | 0 (0.0%) |
| $7,500 to $9,999 | 18 (2.1%) | 43 (5.3%) |
| $10,000 to $12,499 | 59 (7.0%) | 46 (5.6%) |
| $12,500 to $14,999 | 0 (0.0%) | 0 (0.0%) |
| $15,000 to $17,499 | 0 (0.0%) | 24 (2.9%) |
| $17,500 to $19,999 | 0 (0.0%) | 51 (6.3%) |
| $20,000 to $22,499 | 0 (0.0%) | 0 (0.0%) |
| $22,500 to $24,999 | 0 (0.0%) | 53 (6.5%) |
| $25,000 to $29,999 | 0 (0.0%) | 33 (4.1%) |
| $30,000 to $34,999 | 46 (5.5%) | 18 (2.2%) |
| $35,000 to $39,999 | 35 (4.2%) | 0 (0.0%) |
| $40,000 to $44,999 | 11 (1.3%) | 0 (0.0%) |
| $45,000 to $49,999 | 0 (0.0%) | 0 (0.0%) |
| $50,000 to $54,999 | 0 (0.0%) | 0 (0.0%) |
| $55,000 to $64,999 | 0 (0.0%) | 13 (1.6%) |
| $65,000 to $74,999 | 31 (3.7%) | 95 (11.7%) |
| $75,000 to $99,999 | 130 (15.5%) | 55 (6.8%) |
| $100,000+ | 447 (53.3%) | 343 (42.1%) |
| Total | 838 (100.0%) | 815 (100.0%) |
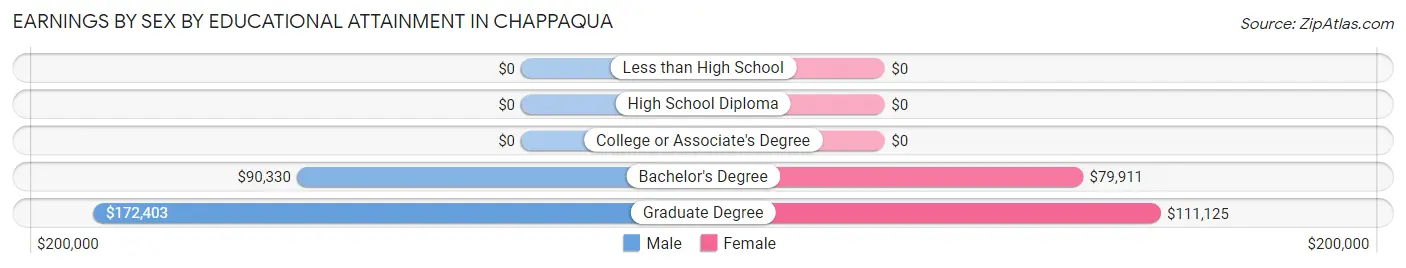
Earnings by Sex by Educational Attainment in Chappaqua
Average earnings in Chappaqua are $168,932 for men and $90,962 for women, a difference of 46.2%. Men with an educational attainment of graduate degree enjoy the highest average annual earnings of $172,403, while those with bachelor's degree education earn the least with $90,330. Women with an educational attainment of graduate degree earn the most with the average annual earnings of $111,125, while those with bachelor's degree education have the smallest earnings of $79,911.
| Educational Attainment | Male Income | Female Income |
| Less than High School | - | - |
| High School Diploma | - | - |
| College or Associate's Degree | - | - |
| Bachelor's Degree | $90,330 | $79,911 |
| Graduate Degree | $172,403 | $111,125 |
| Total | $168,932 | $90,962 |
Family Income in Chappaqua
Family Income Brackets in Chappaqua
According to the Chappaqua family income data, there are 387 families falling into the $200,000+ income range, which is the most common income bracket and makes up 45.9% of all families.
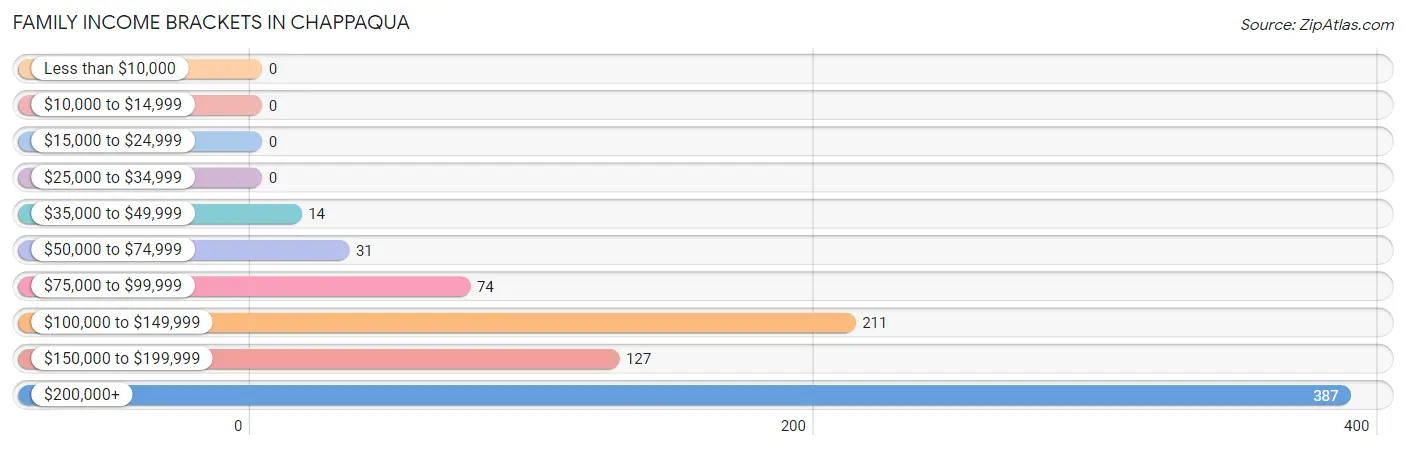
| Income Bracket | # Families | % Families |
| Less than $10,000 | 0 | 0.0% |
| $10,000 to $14,999 | 0 | 0.0% |
| $15,000 to $24,999 | 0 | 0.0% |
| $25,000 to $34,999 | 0 | 0.0% |
| $35,000 to $49,999 | 14 | 1.7% |
| $50,000 to $74,999 | 31 | 3.7% |
| $75,000 to $99,999 | 74 | 8.8% |
| $100,000 to $149,999 | 211 | 25.0% |
| $150,000 to $199,999 | 127 | 15.0% |
| $200,000+ | 387 | 45.9% |
Family Income by Famaliy Size in Chappaqua
4-person families (109 | 12.9%) account for the highest median family income in Chappaqua with $250,001 per family, while 3-person families (300 | 35.5%) have the highest median income of $74,877 per family member.
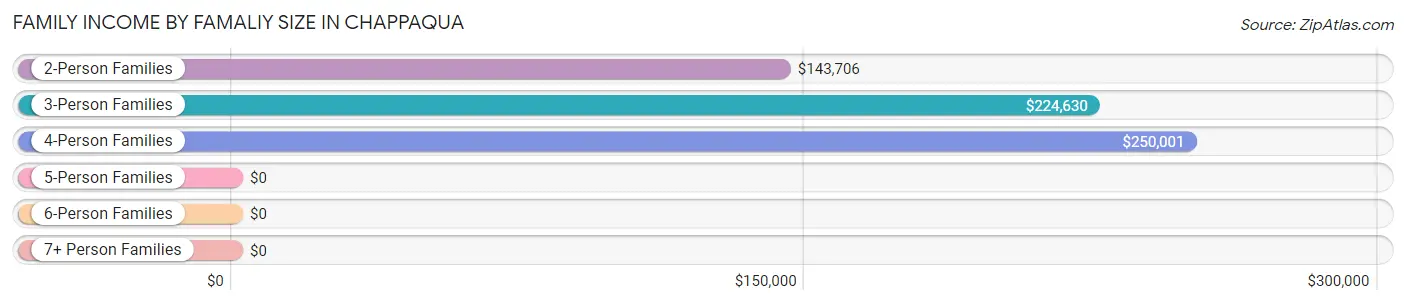
| Income Bracket | # Families | Median Income |
| 2-Person Families | 404 (47.9%) | $143,706 |
| 3-Person Families | 300 (35.5%) | $224,630 |
| 4-Person Families | 109 (12.9%) | $250,001 |
| 5-Person Families | 31 (3.7%) | $0 |
| 6-Person Families | 0 (0.0%) | $0 |
| 7+ Person Families | 0 (0.0%) | $0 |
| Total | 844 (100.0%) | $181,711 |
Family Income by Number of Earners in Chappaqua
The median family income in Chappaqua is $181,711, with families comprising 3+ earners (84) having the highest median family income of $250,001, while families with no earners (193) have the lowest median family income of $144,243, accounting for 10.0% and 22.9% of families, respectively.
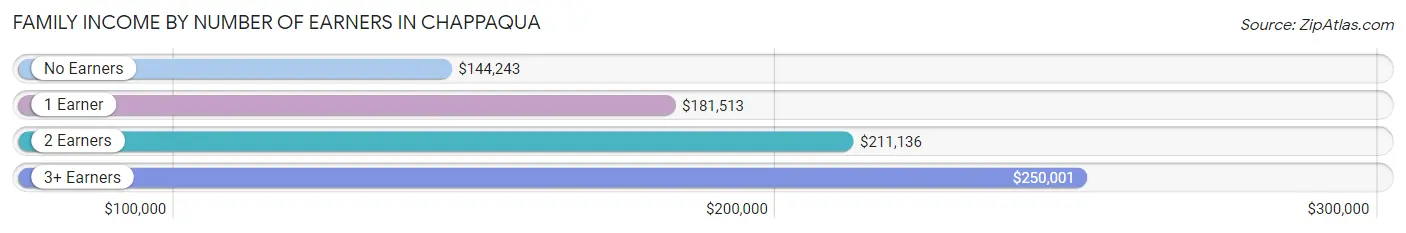
| Number of Earners | # Families | Median Income |
| No Earners | 193 (22.9%) | $144,243 |
| 1 Earner | 175 (20.7%) | $181,513 |
| 2 Earners | 392 (46.5%) | $211,136 |
| 3+ Earners | 84 (10.0%) | $250,001 |
| Total | 844 (100.0%) | $181,711 |
Household Income in Chappaqua
Household Income Brackets in Chappaqua
With 493 households falling in the category, the $200,000+ income range is the most frequent in Chappaqua, accounting for 44.8% of all households.
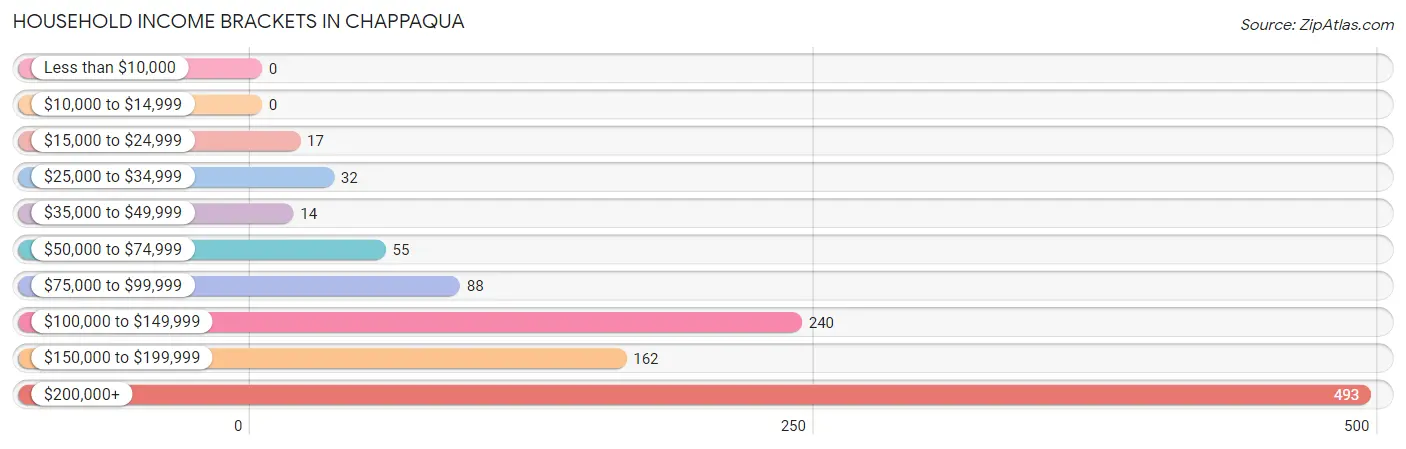
| Income Bracket | # Households | % Households |
| Less than $10,000 | 0 | 0.0% |
| $10,000 to $14,999 | 0 | 0.0% |
| $15,000 to $24,999 | 17 | 1.5% |
| $25,000 to $34,999 | 32 | 2.9% |
| $35,000 to $49,999 | 14 | 1.3% |
| $50,000 to $74,999 | 55 | 5.0% |
| $75,000 to $99,999 | 88 | 8.0% |
| $100,000 to $149,999 | 240 | 21.8% |
| $150,000 to $199,999 | 162 | 14.7% |
| $200,000+ | 493 | 44.8% |
Household Income by Householder Age in Chappaqua
The median household income in Chappaqua is $185,464, with the highest median household income of $250,001 found in the 45 to 64 years age bracket for the primary householder. A total of 422 households (38.3%) fall into this category.
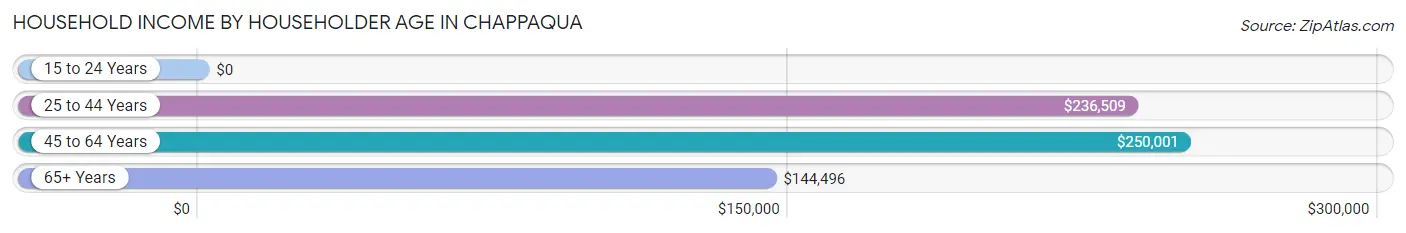
| Income Bracket | # Households | Median Income |
| 15 to 24 Years | 0 (0.0%) | $0 |
| 25 to 44 Years | 273 (24.8%) | $236,509 |
| 45 to 64 Years | 422 (38.3%) | $250,001 |
| 65+ Years | 406 (36.9%) | $144,496 |
| Total | 1,101 (100.0%) | $185,464 |
Poverty in Chappaqua
Income Below Poverty by Sex and Age in Chappaqua
With 0.5% poverty level for males and 2.6% for females among the residents of Chappaqua, 35 to 44 year old males and 25 to 34 year old females are the most vulnerable to poverty, with 4 males (2.4%) and 20 females (10.4%) in their respective age groups living below the poverty level.
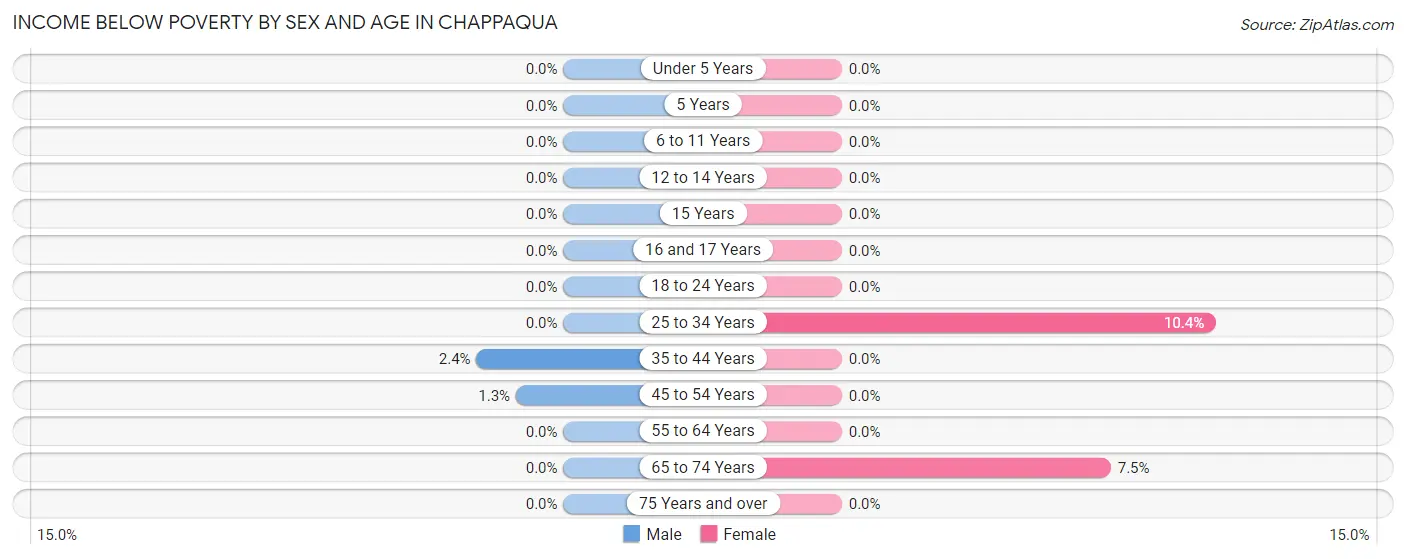
| Age Bracket | Male | Female |
| Under 5 Years | 0 (0.0%) | 0 (0.0%) |
| 5 Years | 0 (0.0%) | 0 (0.0%) |
| 6 to 11 Years | 0 (0.0%) | 0 (0.0%) |
| 12 to 14 Years | 0 (0.0%) | 0 (0.0%) |
| 15 Years | 0 (0.0%) | 0 (0.0%) |
| 16 and 17 Years | 0 (0.0%) | 0 (0.0%) |
| 18 to 24 Years | 0 (0.0%) | 0 (0.0%) |
| 25 to 34 Years | 0 (0.0%) | 20 (10.4%) |
| 35 to 44 Years | 4 (2.4%) | 0 (0.0%) |
| 45 to 54 Years | 3 (1.3%) | 0 (0.0%) |
| 55 to 64 Years | 0 (0.0%) | 0 (0.0%) |
| 65 to 74 Years | 0 (0.0%) | 17 (7.5%) |
| 75 Years and over | 0 (0.0%) | 0 (0.0%) |
| Total | 7 (0.5%) | 37 (2.6%) |
Income Above Poverty by Sex and Age in Chappaqua
According to the poverty statistics in Chappaqua, males aged 6 to 11 years and females aged under 5 years are the age groups that are most secure financially, with 100.0% of males and 100.0% of females in these age groups living above the poverty line.
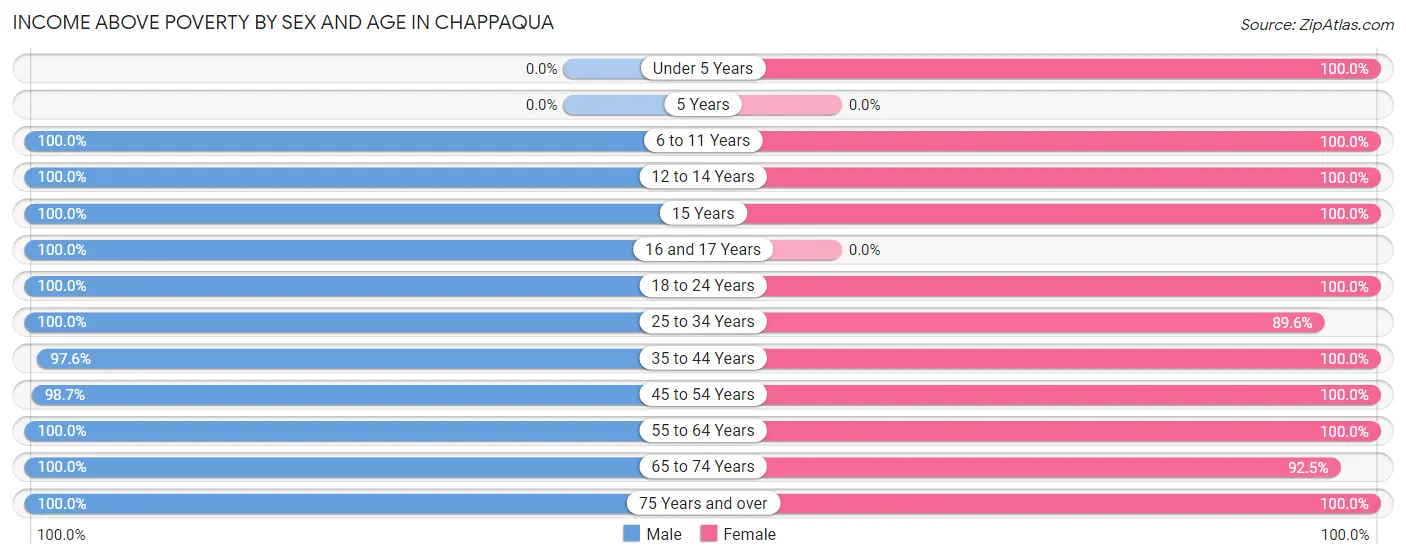
| Age Bracket | Male | Female |
| Under 5 Years | 0 (0.0%) | 63 (100.0%) |
| 5 Years | 0 (0.0%) | 0 (0.0%) |
| 6 to 11 Years | 136 (100.0%) | 107 (100.0%) |
| 12 to 14 Years | 13 (100.0%) | 12 (100.0%) |
| 15 Years | 50 (100.0%) | 37 (100.0%) |
| 16 and 17 Years | 19 (100.0%) | 0 (0.0%) |
| 18 to 24 Years | 103 (100.0%) | 87 (100.0%) |
| 25 to 34 Years | 191 (100.0%) | 172 (89.6%) |
| 35 to 44 Years | 161 (97.6%) | 163 (100.0%) |
| 45 to 54 Years | 225 (98.7%) | 257 (100.0%) |
| 55 to 64 Years | 199 (100.0%) | 155 (100.0%) |
| 65 to 74 Years | 183 (100.0%) | 210 (92.5%) |
| 75 Years and over | 94 (100.0%) | 131 (100.0%) |
| Total | 1,374 (99.5%) | 1,394 (97.4%) |
Income Below Poverty Among Married-Couple Families in Chappaqua
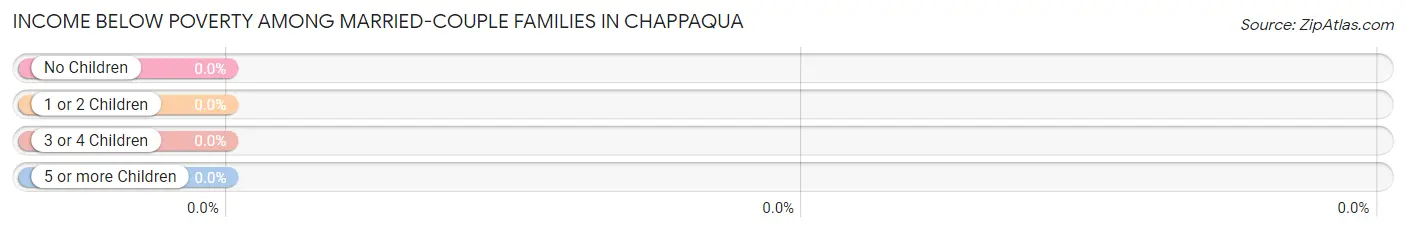
| Children | Above Poverty | Below Poverty |
| No Children | 468 (100.0%) | 0 (0.0%) |
| 1 or 2 Children | 238 (100.0%) | 0 (0.0%) |
| 3 or 4 Children | 31 (100.0%) | 0 (0.0%) |
| 5 or more Children | 0 (0.0%) | 0 (0.0%) |
| Total | 737 (100.0%) | 0 (0.0%) |
Income Below Poverty Among Single-Parent Households in Chappaqua
| Children | Single Father | Single Mother |
| No Children | 0 (0.0%) | 0 (0.0%) |
| 1 or 2 Children | 0 (0.0%) | 0 (0.0%) |
| 3 or 4 Children | 0 (0.0%) | 0 (0.0%) |
| 5 or more Children | 0 (0.0%) | 0 (0.0%) |
| Total | 0 (0.0%) | 0 (0.0%) |
Income Below Poverty Among Married-Couple vs Single-Parent Households in Chappaqua
| Children | Married-Couple Families | Single-Parent Households |
| No Children | 0 (0.0%) | 0 (0.0%) |
| 1 or 2 Children | 0 (0.0%) | 0 (0.0%) |
| 3 or 4 Children | 0 (0.0%) | 0 (0.0%) |
| 5 or more Children | 0 (0.0%) | 0 (0.0%) |
| Total | 0 (0.0%) | 0 (0.0%) |
Race in Chappaqua
The most populous races in Chappaqua are White / Caucasian (2,061 | 73.3%), Asian (427 | 15.2%), and Hispanic or Latino (247 | 8.8%).
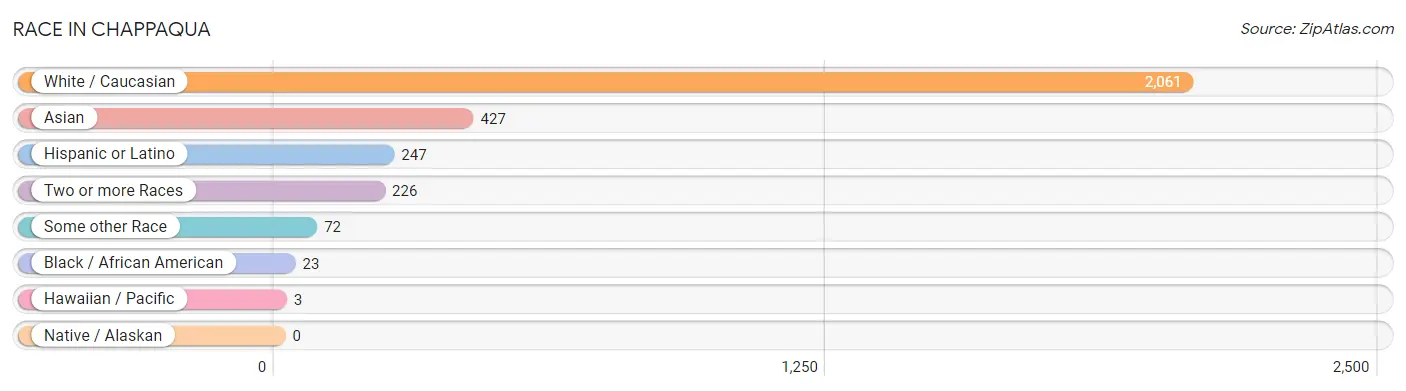
| Race | # Population | % Population |
| Asian | 427 | 15.2% |
| Black / African American | 23 | 0.8% |
| Hawaiian / Pacific | 3 | 0.1% |
| Hispanic or Latino | 247 | 8.8% |
| Native / Alaskan | 0 | 0.0% |
| White / Caucasian | 2,061 | 73.3% |
| Two or more Races | 226 | 8.0% |
| Some other Race | 72 | 2.6% |
| Total | 2,812 | 100.0% |
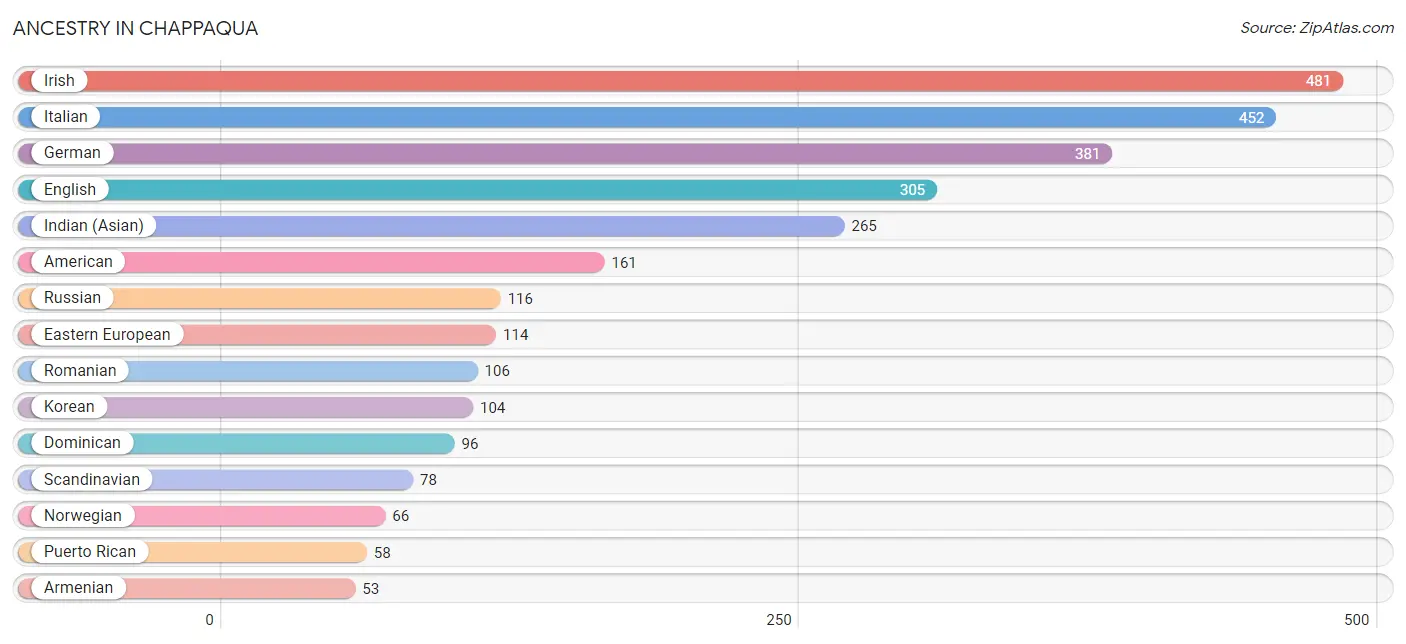
Ancestry in Chappaqua
The most populous ancestries reported in Chappaqua are Irish (481 | 17.1%), Italian (452 | 16.1%), German (381 | 13.6%), English (305 | 10.8%), and Indian (Asian) (265 | 9.4%), together accounting for 67.0% of all Chappaqua residents.
| Ancestry | # Population | % Population |
| American | 161 | 5.7% |
| Arab | 13 | 0.5% |
| Argentinean | 10 | 0.4% |
| Armenian | 53 | 1.9% |
| Austrian | 19 | 0.7% |
| Brazilian | 20 | 0.7% |
| Burmese | 20 | 0.7% |
| Dominican | 96 | 3.4% |
| Dutch | 10 | 0.4% |
| Eastern European | 114 | 4.1% |
| English | 305 | 10.8% |
| European | 26 | 0.9% |
| French | 19 | 0.7% |
| French Canadian | 16 | 0.6% |
| German | 381 | 13.6% |
| Indian (Asian) | 265 | 9.4% |
| Irish | 481 | 17.1% |
| Italian | 452 | 16.1% |
| Korean | 104 | 3.7% |
| Lithuanian | 19 | 0.7% |
| Mexican | 16 | 0.6% |
| Native Hawaiian | 3 | 0.1% |
| Norwegian | 66 | 2.4% |
| Peruvian | 29 | 1.0% |
| Polish | 47 | 1.7% |
| Puerto Rican | 58 | 2.1% |
| Romanian | 106 | 3.8% |
| Russian | 116 | 4.1% |
| Scandinavian | 78 | 2.8% |
| Scottish | 17 | 0.6% |
| South American | 39 | 1.4% |
| Spanish | 38 | 1.3% |
| Swedish | 20 | 0.7% |
| Thai | 24 | 0.9% | View All 34 Rows |
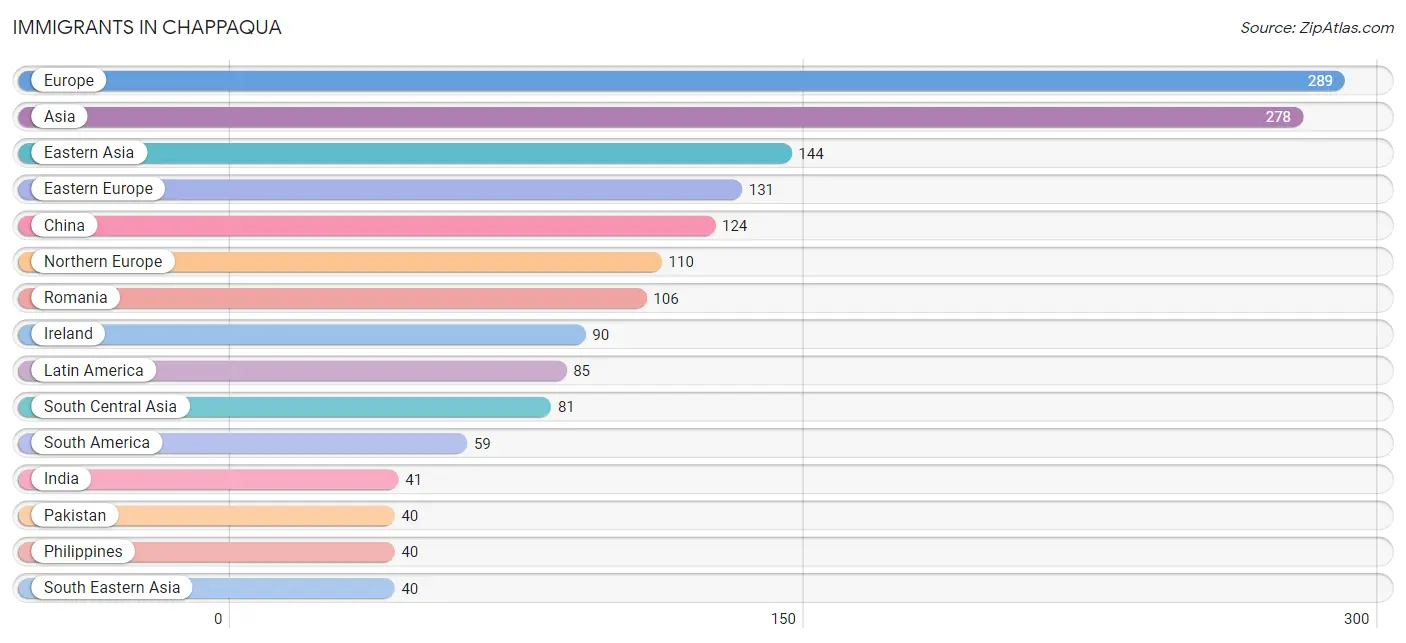
Immigrants in Chappaqua
The most numerous immigrant groups reported in Chappaqua came from Europe (289 | 10.3%), Asia (278 | 9.9%), Eastern Asia (144 | 5.1%), Eastern Europe (131 | 4.7%), and China (124 | 4.4%), together accounting for 34.4% of all Chappaqua residents.
| Immigration Origin | # Population | % Population |
| Argentina | 10 | 0.4% |
| Asia | 278 | 9.9% |
| Brazil | 20 | 0.7% |
| Caribbean | 26 | 0.9% |
| China | 124 | 4.4% |
| Dominican Republic | 26 | 0.9% |
| Eastern Asia | 144 | 5.1% |
| Eastern Europe | 131 | 4.7% |
| Europe | 289 | 10.3% |
| Germany | 16 | 0.6% |
| India | 41 | 1.5% |
| Ireland | 90 | 3.2% |
| Italy | 32 | 1.1% |
| Jordan | 13 | 0.5% |
| Korea | 20 | 0.7% |
| Latin America | 85 | 3.0% |
| Northern Europe | 110 | 3.9% |
| Pakistan | 40 | 1.4% |
| Peru | 29 | 1.0% |
| Philippines | 40 | 1.4% |
| Romania | 106 | 3.8% |
| Russia | 25 | 0.9% |
| South America | 59 | 2.1% |
| South Central Asia | 81 | 2.9% |
| South Eastern Asia | 40 | 1.4% |
| Southern Europe | 32 | 1.1% |
| Sweden | 20 | 0.7% |
| Western Asia | 13 | 0.5% |
| Western Europe | 16 | 0.6% | View All 29 Rows |
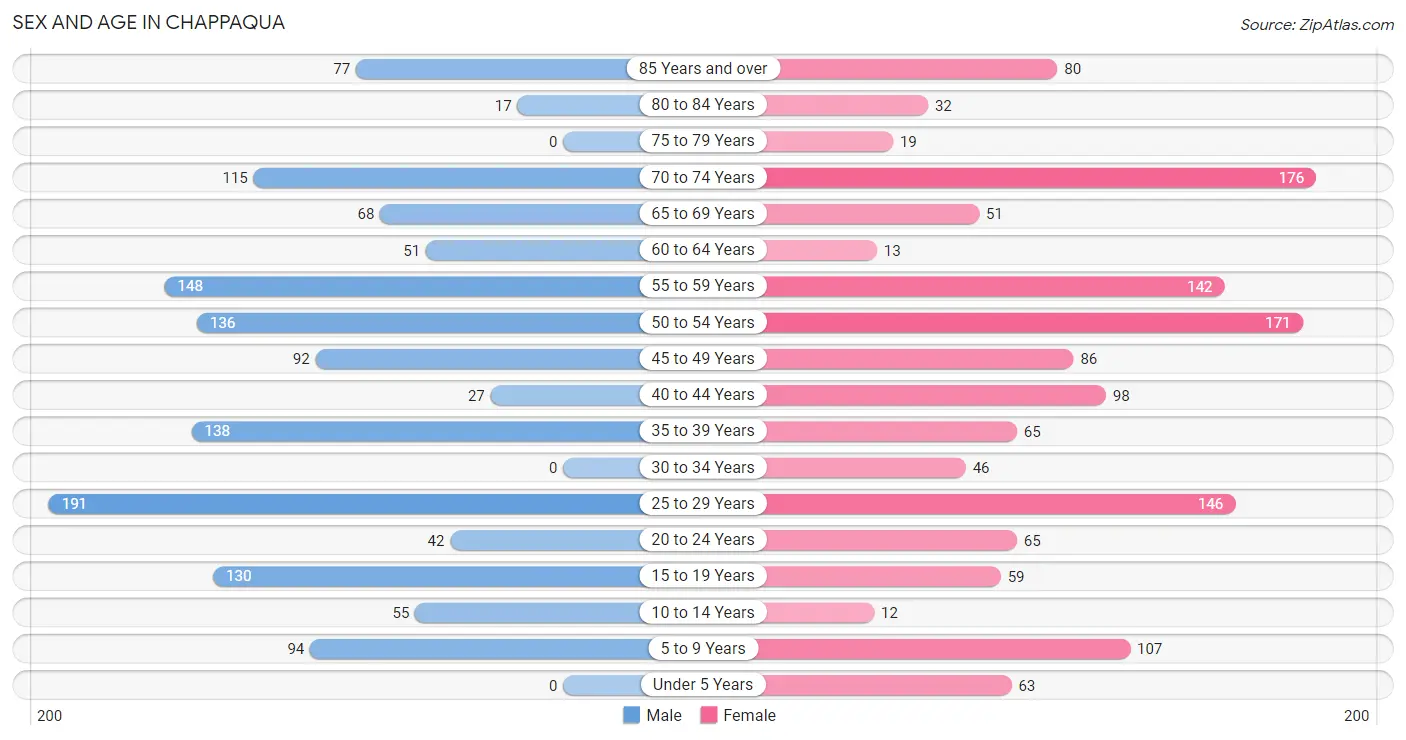
Sex and Age in Chappaqua
Sex and Age in Chappaqua
The most populous age groups in Chappaqua are 25 to 29 Years (191 | 13.8%) for men and 70 to 74 Years (176 | 12.3%) for women.
| Age Bracket | Male | Female |
| Under 5 Years | 0 (0.0%) | 63 (4.4%) |
| 5 to 9 Years | 94 (6.8%) | 107 (7.5%) |
| 10 to 14 Years | 55 (4.0%) | 12 (0.8%) |
| 15 to 19 Years | 130 (9.4%) | 59 (4.1%) |
| 20 to 24 Years | 42 (3.0%) | 65 (4.5%) |
| 25 to 29 Years | 191 (13.8%) | 146 (10.2%) |
| 30 to 34 Years | 0 (0.0%) | 46 (3.2%) |
| 35 to 39 Years | 138 (10.0%) | 65 (4.5%) |
| 40 to 44 Years | 27 (2.0%) | 98 (6.9%) |
| 45 to 49 Years | 92 (6.7%) | 86 (6.0%) |
| 50 to 54 Years | 136 (9.9%) | 171 (11.9%) |
| 55 to 59 Years | 148 (10.7%) | 142 (9.9%) |
| 60 to 64 Years | 51 (3.7%) | 13 (0.9%) |
| 65 to 69 Years | 68 (4.9%) | 51 (3.6%) |
| 70 to 74 Years | 115 (8.3%) | 176 (12.3%) |
| 75 to 79 Years | 0 (0.0%) | 19 (1.3%) |
| 80 to 84 Years | 17 (1.2%) | 32 (2.2%) |
| 85 Years and over | 77 (5.6%) | 80 (5.6%) |
| Total | 1,381 (100.0%) | 1,431 (100.0%) |
Families and Households in Chappaqua
Median Family Size in Chappaqua
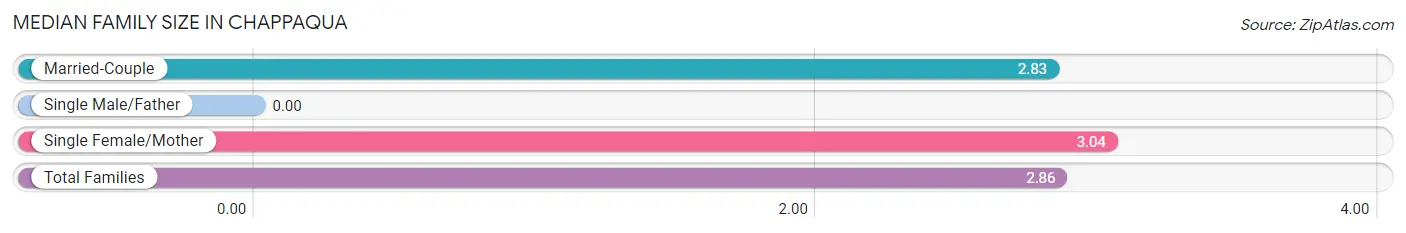
| Family Type | # Families | Family Size |
| Married-Couple | 737 (87.3%) | 2.83 |
| Single Male/Father | 0 (0.0%) | - |
| Single Female/Mother | 107 (12.7%) | 3.04 |
| Total Families | 844 (100.0%) | 2.86 |
Median Household Size in Chappaqua
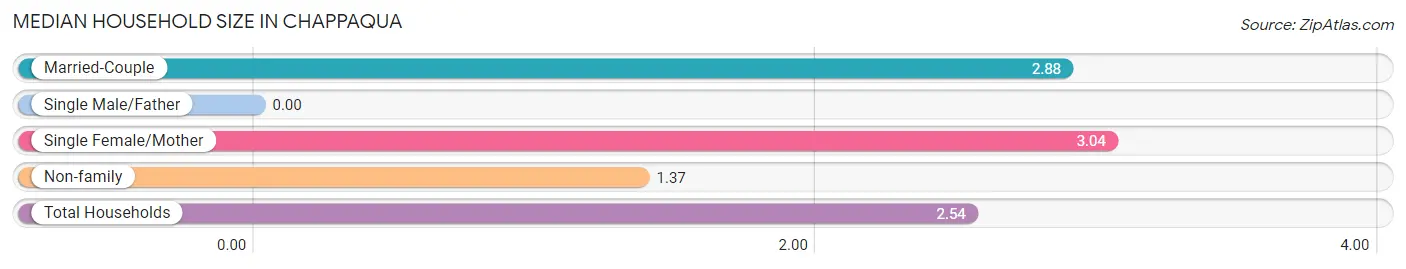
| Household Type | # Households | Household Size |
| Married-Couple | 737 (66.9%) | 2.88 |
| Single Male/Father | 0 (0.0%) | - |
| Single Female/Mother | 107 (9.7%) | 3.04 |
| Non-family | 257 (23.3%) | 1.37 |
| Total Households | 1,101 (100.0%) | 2.54 |
Household Size by Marriage Status in Chappaqua
Out of a total of 1,101 households in Chappaqua, 844 (76.7%) are family households, while 257 (23.3%) are nonfamily households. The most numerous type of family households are 2-person households, comprising 387, and the most common type of nonfamily households are 1-person households, comprising 151.
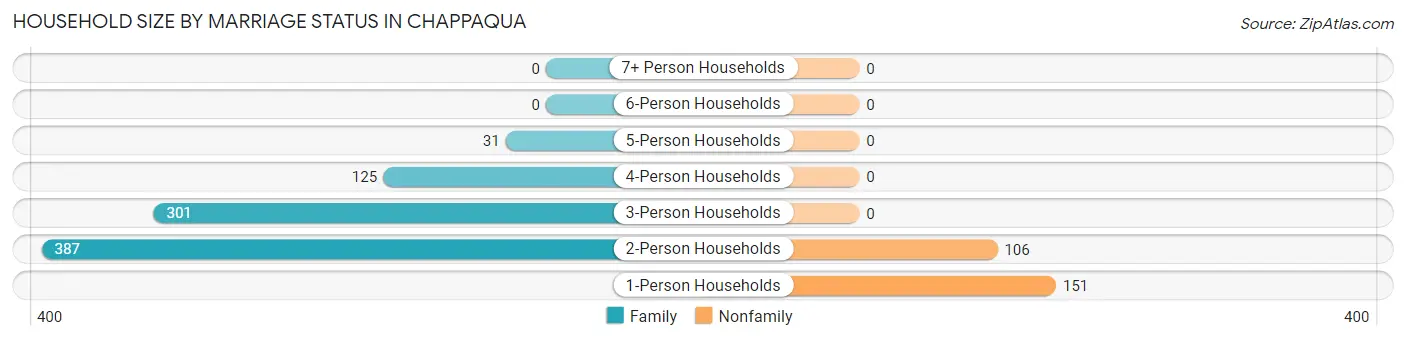
| Household Size | Family Households | Nonfamily Households |
| 1-Person Households | - | 151 (13.7%) |
| 2-Person Households | 387 (35.1%) | 106 (9.6%) |
| 3-Person Households | 301 (27.3%) | 0 (0.0%) |
| 4-Person Households | 125 (11.4%) | 0 (0.0%) |
| 5-Person Households | 31 (2.8%) | 0 (0.0%) |
| 6-Person Households | 0 (0.0%) | 0 (0.0%) |
| 7+ Person Households | 0 (0.0%) | 0 (0.0%) |
| Total | 844 (76.7%) | 257 (23.3%) |
Female Fertility in Chappaqua
Fertility by Age in Chappaqua
| Age Bracket | Women with Births | Births / 1,000 Women |
| 15 to 19 years | 0 (0.0%) | 0.0 |
| 20 to 34 years | 0 (0.0%) | 0.0 |
| 35 to 50 years | 0 (0.0%) | 0.0 |
| Total | 0 (0.0%) | 0.0 |
Fertility by Age by Marriage Status in Chappaqua
| Age Bracket | Married | Unmarried |
| 15 to 19 years | 0 (0.0%) | 0 (0.0%) |
| 20 to 34 years | 0 (0.0%) | 0 (0.0%) |
| 35 to 50 years | 0 (0.0%) | 0 (0.0%) |
| Total | 0 (0.0%) | 0 (0.0%) |
Fertility by Education in Chappaqua
| Educational Attainment | Women with Births | Births / 1,000 Women |
| Less than High School | 0 (0.0%) | 0.0 |
| High School Diploma | 0 (0.0%) | 0.0 |
| College or Associate's Degree | 0 (0.0%) | 0.0 |
| Bachelor's Degree | 0 (0.0%) | 0.0 |
| Graduate Degree | 0 (0.0%) | 0.0 |
| Total | 0 (0.0%) | 0.0 |
Fertility by Education by Marriage Status in Chappaqua
| Educational Attainment | Married | Unmarried |
| Less than High School | 0 (0.0%) | 0 (0.0%) |
| High School Diploma | 0 (0.0%) | 0 (0.0%) |
| College or Associate's Degree | 0 (0.0%) | 0 (0.0%) |
| Bachelor's Degree | 0 (0.0%) | 0 (0.0%) |
| Graduate Degree | 0 (0.0%) | 0 (0.0%) |
| Total | 0 (0.0%) | 0 (0.0%) |
Employment Characteristics in Chappaqua
Employment by Class of Employer in Chappaqua
Among the 1,453 employed individuals in Chappaqua, private company employees (974 | 67.0%), self-employed (incorporated) (168 | 11.6%), and self-employed (not incorporated) (123 | 8.5%) make up the most common classes of employment.
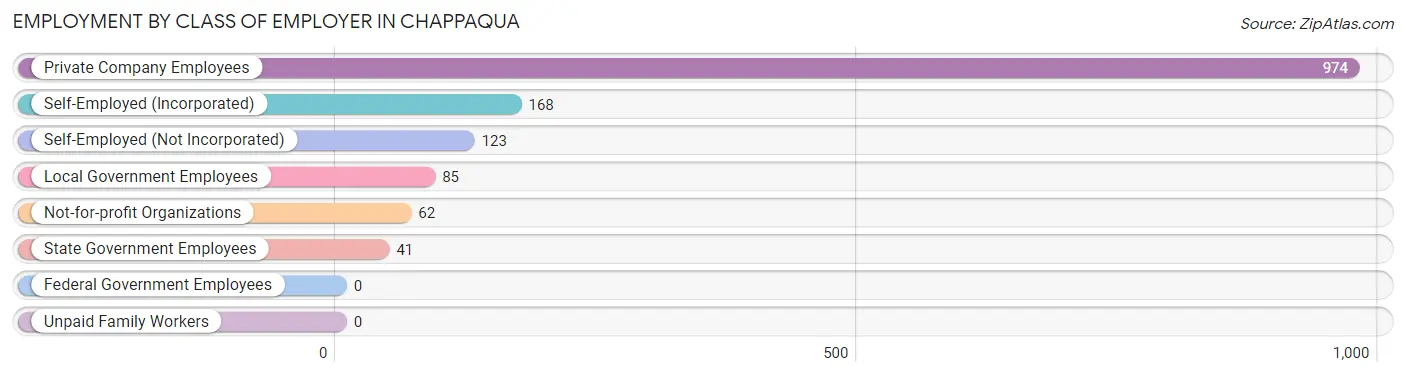
| Employer Class | # Employees | % Employees |
| Private Company Employees | 974 | 67.0% |
| Self-Employed (Incorporated) | 168 | 11.6% |
| Self-Employed (Not Incorporated) | 123 | 8.5% |
| Not-for-profit Organizations | 62 | 4.3% |
| Local Government Employees | 85 | 5.9% |
| State Government Employees | 41 | 2.8% |
| Federal Government Employees | 0 | 0.0% |
| Unpaid Family Workers | 0 | 0.0% |
| Total | 1,453 | 100.0% |
Employment Status by Age in Chappaqua
According to the labor force statistics for Chappaqua, out of the total population over 16 years of age (2,394), 65.0% or 1,556 individuals are in the labor force, with 6.6% or 103 of them unemployed. The age group with the highest labor force participation rate is 25 to 29 years, with 100.0% or 337 individuals in the labor force. Within the labor force, the 60 to 64 years age range has the highest percentage of unemployed individuals, with 31.9% or 15 of them being unemployed.
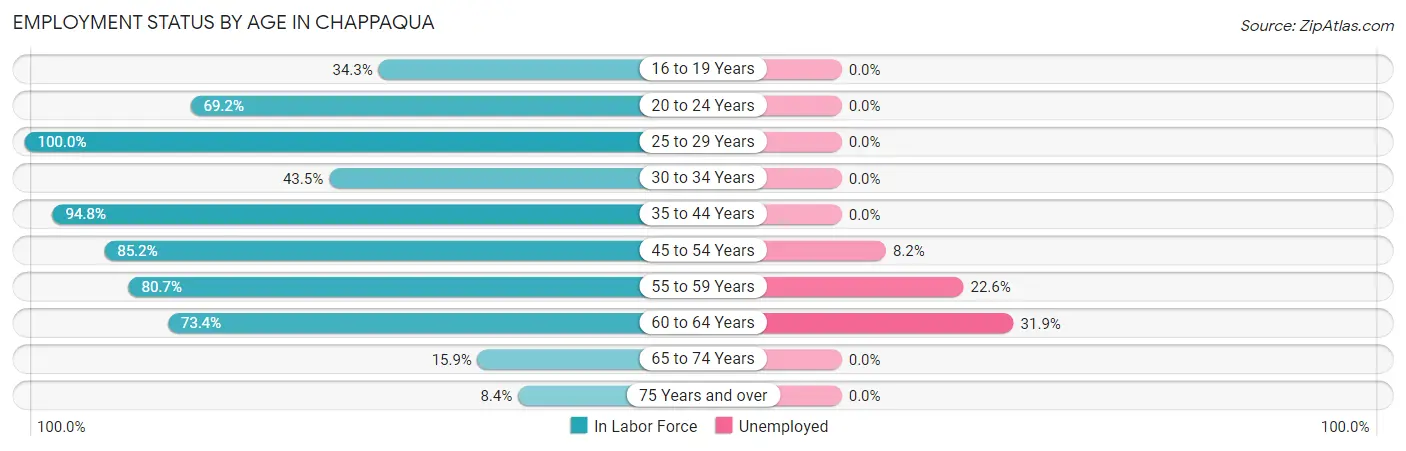
| Age Bracket | In Labor Force | Unemployed |
| 16 to 19 Years | 35 (34.3%) | 0 (0.0%) |
| 20 to 24 Years | 74 (69.2%) | 0 (0.0%) |
| 25 to 29 Years | 337 (100.0%) | 0 (0.0%) |
| 30 to 34 Years | 20 (43.5%) | 0 (0.0%) |
| 35 to 44 Years | 311 (94.8%) | 0 (0.0%) |
| 45 to 54 Years | 413 (85.2%) | 34 (8.2%) |
| 55 to 59 Years | 234 (80.7%) | 53 (22.6%) |
| 60 to 64 Years | 47 (73.4%) | 15 (31.9%) |
| 65 to 74 Years | 65 (15.9%) | 0 (0.0%) |
| 75 Years and over | 19 (8.4%) | 0 (0.0%) |
| Total | 1,556 (65.0%) | 103 (6.6%) |
Employment Status by Educational Attainment in Chappaqua
According to labor force statistics for Chappaqua, 87.9% of individuals (1,362) out of the total population between 25 and 64 years of age (1,550) are in the labor force, with 7.5% or 102 of them being unemployed. The group with the highest labor force participation rate are those with the educational attainment of college / associate degree, with 100.0% or 77 individuals in the labor force. Within the labor force, individuals with bachelor's degree or higher education have the highest percentage of unemployment, with 8.0% or 102 of them being unemployed.
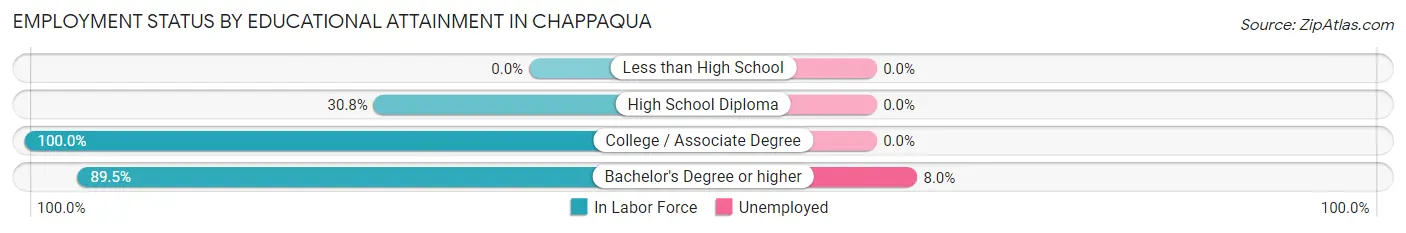
| Educational Attainment | In Labor Force | Unemployed |
| Less than High School | 0 (0.0%) | 0 (0.0%) |
| High School Diploma | 16 (30.8%) | 0 (0.0%) |
| College / Associate Degree | 77 (100.0%) | 0 (0.0%) |
| Bachelor's Degree or higher | 1,269 (89.5%) | 113 (8.0%) |
| Total | 1,362 (87.9%) | 116 (7.5%) |
Employment Occupations by Sex in Chappaqua
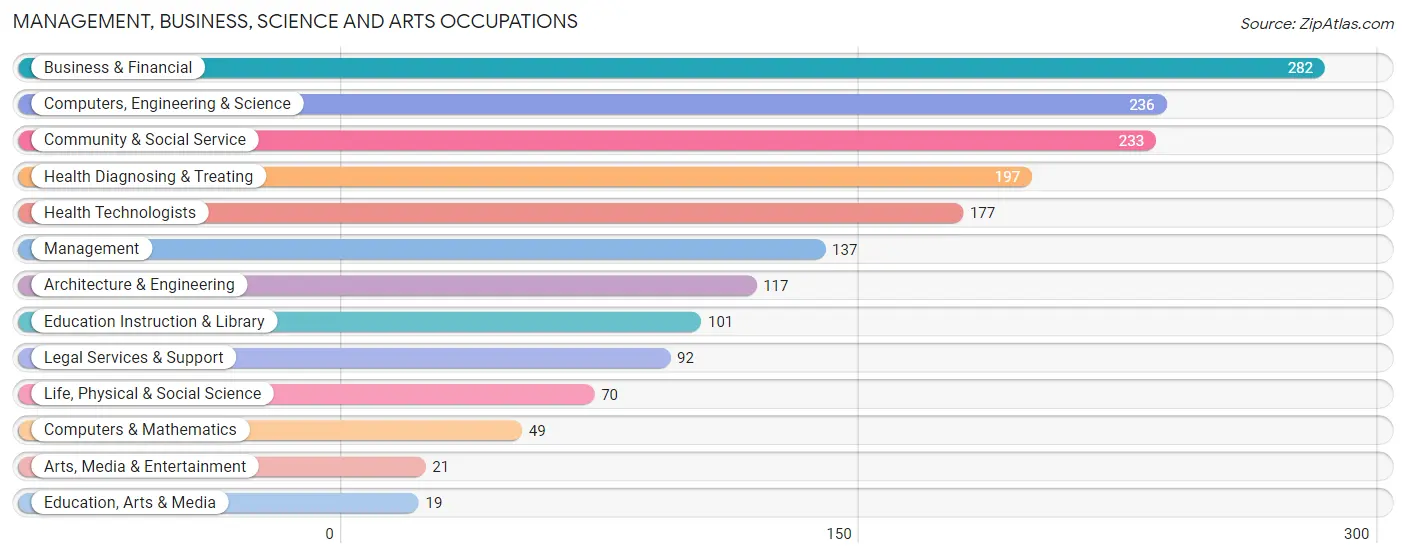
Management, Business, Science and Arts Occupations
The most common Management, Business, Science and Arts occupations in Chappaqua are Business & Financial (282 | 19.4%), Computers, Engineering & Science (236 | 16.2%), Community & Social Service (233 | 16.0%), Health Diagnosing & Treating (197 | 13.6%), and Health Technologists (177 | 12.2%).
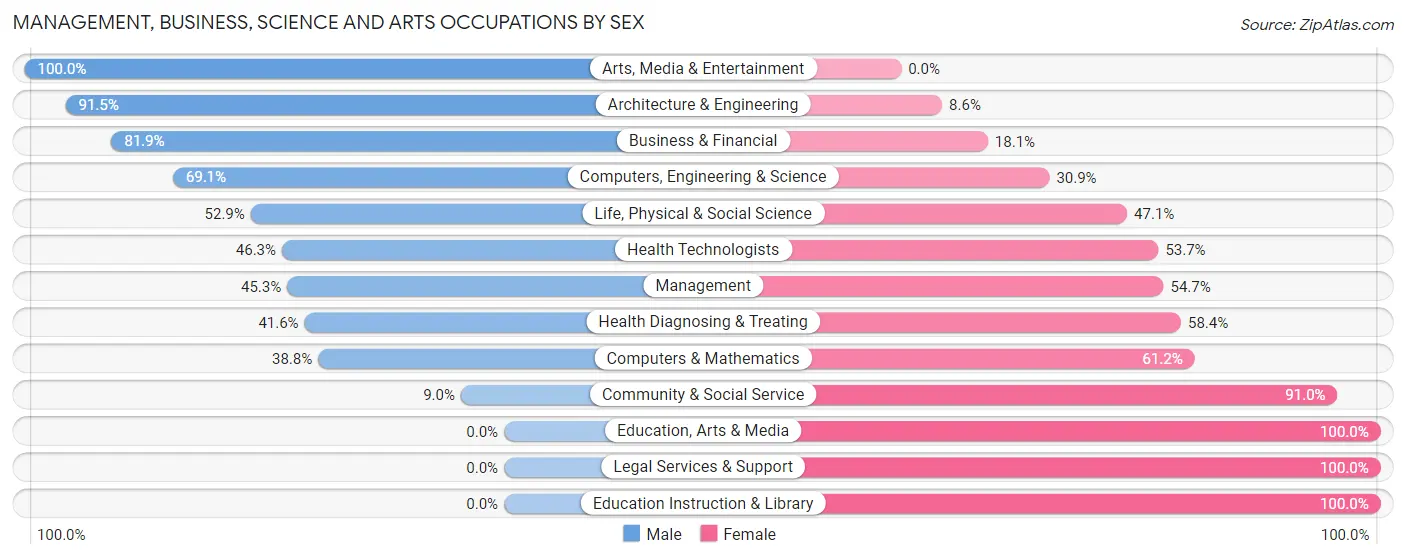
Management, Business, Science and Arts Occupations by Sex
Within the Management, Business, Science and Arts occupations in Chappaqua, the most male-oriented occupations are Arts, Media & Entertainment (100.0%), Architecture & Engineering (91.4%), and Business & Financial (81.9%), while the most female-oriented occupations are Education, Arts & Media (100.0%), Legal Services & Support (100.0%), and Education Instruction & Library (100.0%).
| Occupation | Male | Female |
| Management | 62 (45.3%) | 75 (54.7%) |
| Business & Financial | 231 (81.9%) | 51 (18.1%) |
| Computers, Engineering & Science | 163 (69.1%) | 73 (30.9%) |
| Computers & Mathematics | 19 (38.8%) | 30 (61.2%) |
| Architecture & Engineering | 107 (91.4%) | 10 (8.6%) |
| Life, Physical & Social Science | 37 (52.9%) | 33 (47.1%) |
| Community & Social Service | 21 (9.0%) | 212 (91.0%) |
| Education, Arts & Media | 0 (0.0%) | 19 (100.0%) |
| Legal Services & Support | 0 (0.0%) | 92 (100.0%) |
| Education Instruction & Library | 0 (0.0%) | 101 (100.0%) |
| Arts, Media & Entertainment | 21 (100.0%) | 0 (0.0%) |
| Health Diagnosing & Treating | 82 (41.6%) | 115 (58.4%) |
| Health Technologists | 82 (46.3%) | 95 (53.7%) |
| Total (Category) | 559 (51.5%) | 526 (48.5%) |
| Total (Overall) | 812 (55.9%) | 641 (44.1%) |
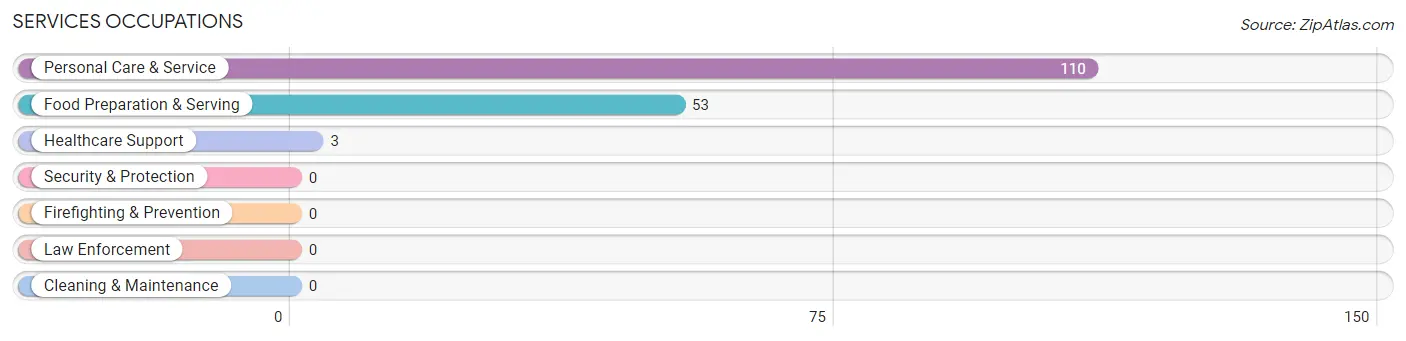
Services Occupations
The most common Services occupations in Chappaqua are Personal Care & Service (110 | 7.6%), Food Preparation & Serving (53 | 3.6%), and Healthcare Support (3 | 0.2%).
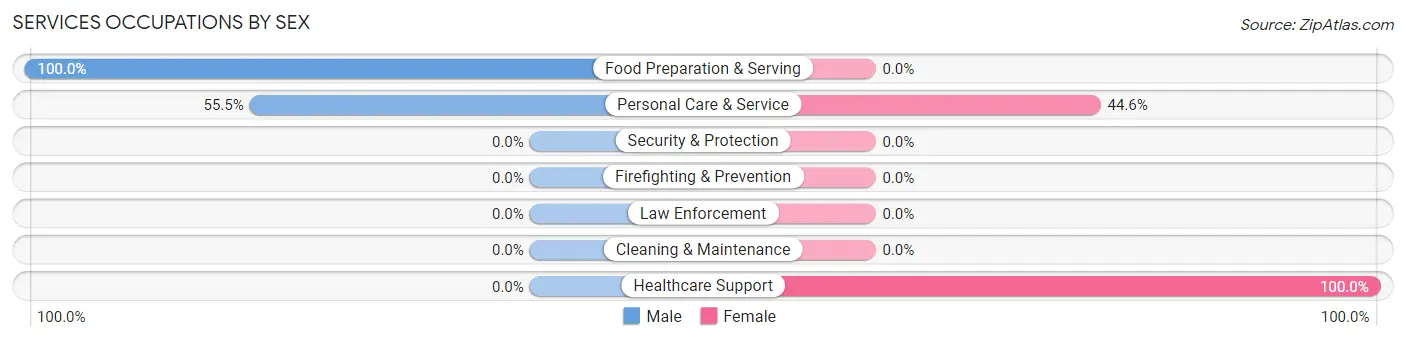
Services Occupations by Sex
Within the Services occupations in Chappaqua, the most male-oriented occupations are Food Preparation & Serving (100.0%), and Personal Care & Service (55.4%), while the most female-oriented occupations are Healthcare Support (100.0%), and Personal Care & Service (44.6%).
| Occupation | Male | Female |
| Healthcare Support | 0 (0.0%) | 3 (100.0%) |
| Security & Protection | 0 (0.0%) | 0 (0.0%) |
| Firefighting & Prevention | 0 (0.0%) | 0 (0.0%) |
| Law Enforcement | 0 (0.0%) | 0 (0.0%) |
| Food Preparation & Serving | 53 (100.0%) | 0 (0.0%) |
| Cleaning & Maintenance | 0 (0.0%) | 0 (0.0%) |
| Personal Care & Service | 61 (55.4%) | 49 (44.6%) |
| Total (Category) | 114 (68.7%) | 52 (31.3%) |
| Total (Overall) | 812 (55.9%) | 641 (44.1%) |
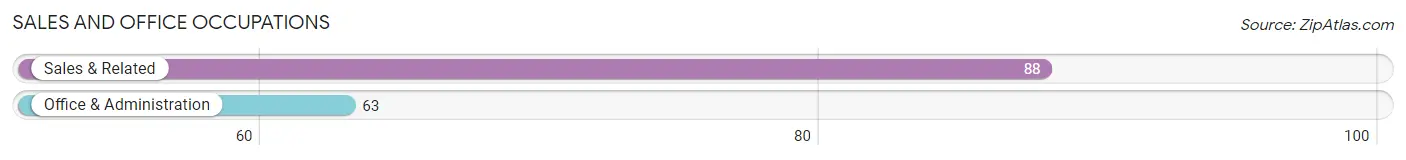
Sales and Office Occupations
The most common Sales and Office occupations in Chappaqua are Sales & Related (88 | 6.1%), and Office & Administration (63 | 4.3%).
Sales and Office Occupations by Sex
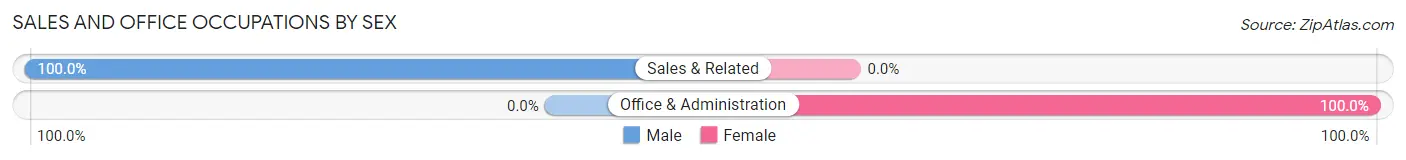
| Occupation | Male | Female |
| Sales & Related | 88 (100.0%) | 0 (0.0%) |
| Office & Administration | 0 (0.0%) | 63 (100.0%) |
| Total (Category) | 88 (58.3%) | 63 (41.7%) |
| Total (Overall) | 812 (55.9%) | 641 (44.1%) |
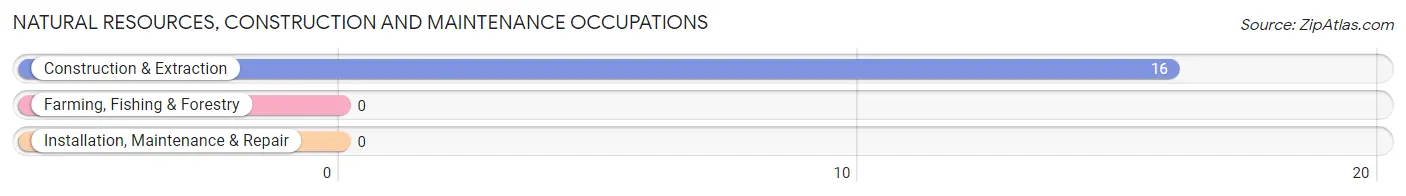
Natural Resources, Construction and Maintenance Occupations
The most common Natural Resources, Construction and Maintenance occupations in Chappaqua are , and Construction & Extraction (16 | 1.1%).
Natural Resources, Construction and Maintenance Occupations by Sex
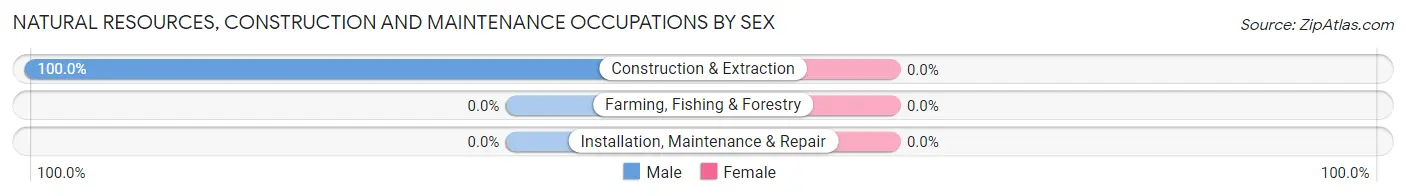
| Occupation | Male | Female |
| Farming, Fishing & Forestry | 0 (0.0%) | 0 (0.0%) |
| Construction & Extraction | 16 (100.0%) | 0 (0.0%) |
| Installation, Maintenance & Repair | 0 (0.0%) | 0 (0.0%) |
| Total (Category) | 16 (100.0%) | 0 (0.0%) |
| Total (Overall) | 812 (55.9%) | 641 (44.1%) |
Production, Transportation and Moving Occupations
The most common Production, Transportation and Moving occupations in Chappaqua are , and Material Moving (35 | 2.4%).
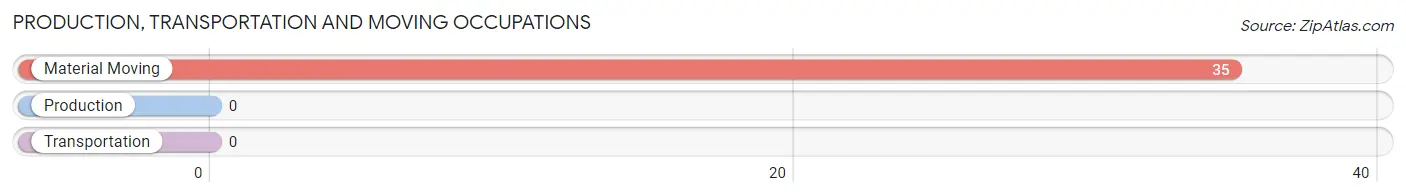
Production, Transportation and Moving Occupations by Sex
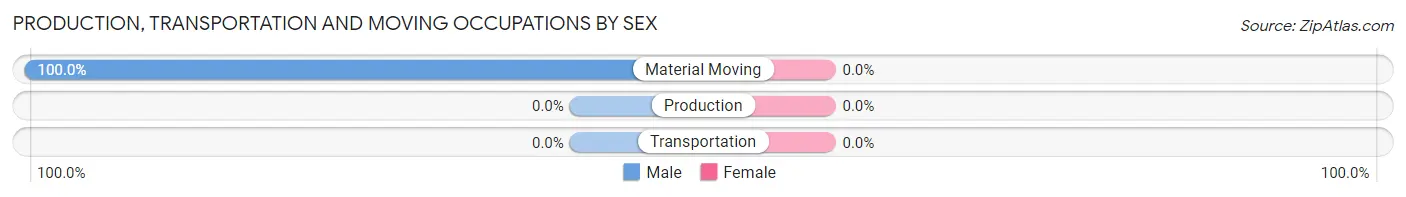
| Occupation | Male | Female |
| Production | 0 (0.0%) | 0 (0.0%) |
| Transportation | 0 (0.0%) | 0 (0.0%) |
| Material Moving | 35 (100.0%) | 0 (0.0%) |
| Total (Category) | 35 (100.0%) | 0 (0.0%) |
| Total (Overall) | 812 (55.9%) | 641 (44.1%) |
Employment Industries by Sex in Chappaqua
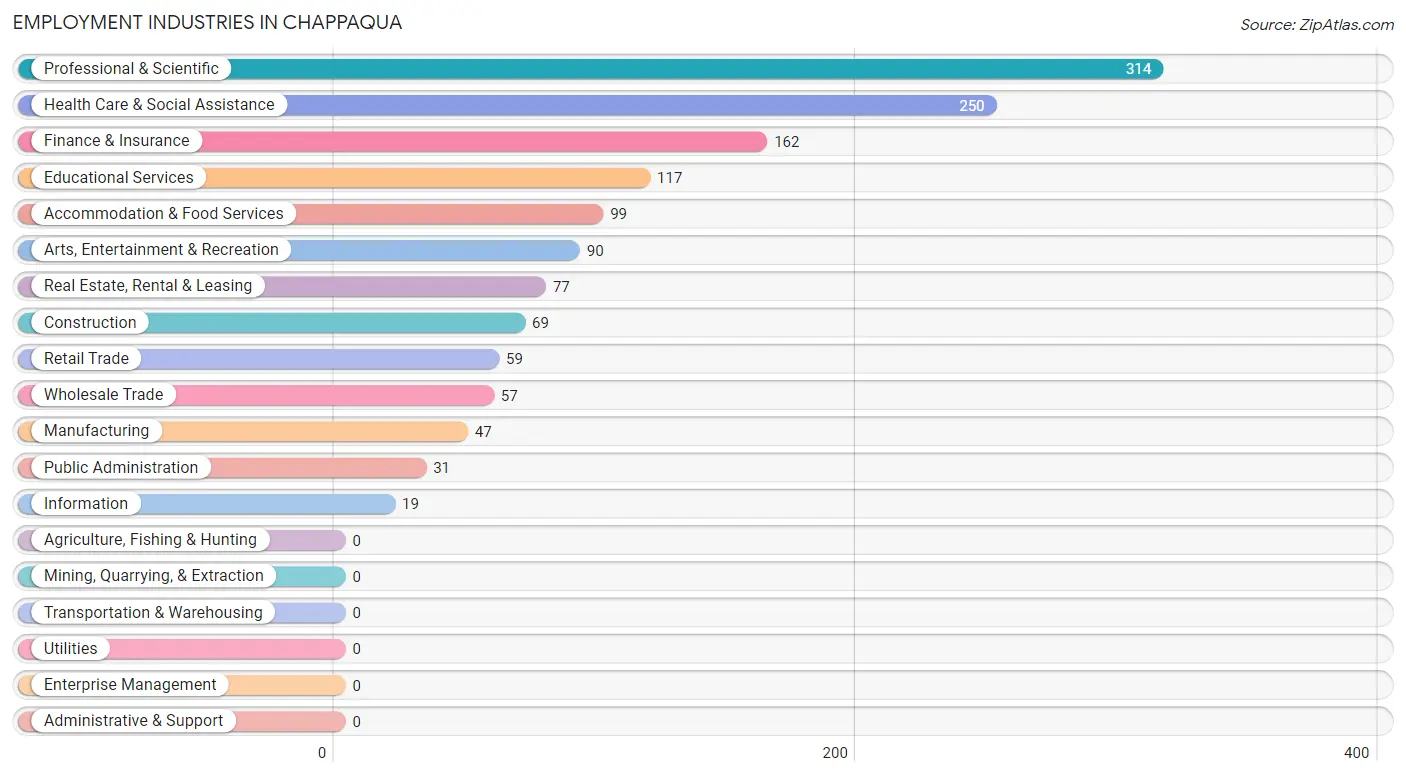
Employment Industries in Chappaqua
The major employment industries in Chappaqua include Professional & Scientific (314 | 21.6%), Health Care & Social Assistance (250 | 17.2%), Finance & Insurance (162 | 11.2%), Educational Services (117 | 8.1%), and Accommodation & Food Services (99 | 6.8%).
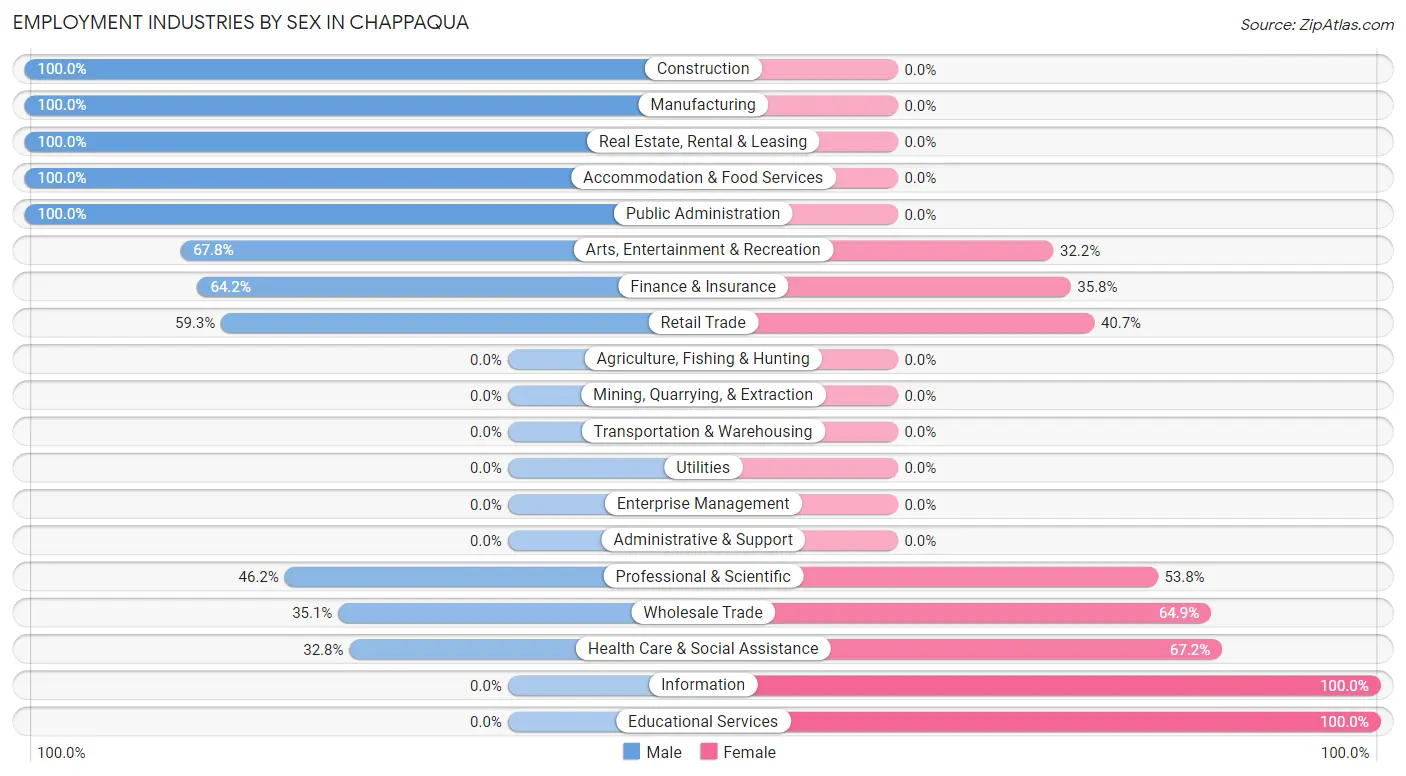
Employment Industries by Sex in Chappaqua
The Chappaqua industries that see more men than women are Construction (100.0%), Manufacturing (100.0%), and Real Estate, Rental & Leasing (100.0%), whereas the industries that tend to have a higher number of women are Information (100.0%), Educational Services (100.0%), and Health Care & Social Assistance (67.2%).
| Industry | Male | Female |
| Agriculture, Fishing & Hunting | 0 (0.0%) | 0 (0.0%) |
| Mining, Quarrying, & Extraction | 0 (0.0%) | 0 (0.0%) |
| Construction | 69 (100.0%) | 0 (0.0%) |
| Manufacturing | 47 (100.0%) | 0 (0.0%) |
| Wholesale Trade | 20 (35.1%) | 37 (64.9%) |
| Retail Trade | 35 (59.3%) | 24 (40.7%) |
| Transportation & Warehousing | 0 (0.0%) | 0 (0.0%) |
| Utilities | 0 (0.0%) | 0 (0.0%) |
| Information | 0 (0.0%) | 19 (100.0%) |
| Finance & Insurance | 104 (64.2%) | 58 (35.8%) |
| Real Estate, Rental & Leasing | 77 (100.0%) | 0 (0.0%) |
| Professional & Scientific | 145 (46.2%) | 169 (53.8%) |
| Enterprise Management | 0 (0.0%) | 0 (0.0%) |
| Administrative & Support | 0 (0.0%) | 0 (0.0%) |
| Educational Services | 0 (0.0%) | 117 (100.0%) |
| Health Care & Social Assistance | 82 (32.8%) | 168 (67.2%) |
| Arts, Entertainment & Recreation | 61 (67.8%) | 29 (32.2%) |
| Accommodation & Food Services | 99 (100.0%) | 0 (0.0%) |
| Public Administration | 31 (100.0%) | 0 (0.0%) |
| Total | 812 (55.9%) | 641 (44.1%) |
Education in Chappaqua
School Enrollment in Chappaqua
The most common levels of schooling among the 581 students in Chappaqua are elementary school (182 | 31.3%), college / undergraduate (137 | 23.6%), and high school (136 | 23.4%).
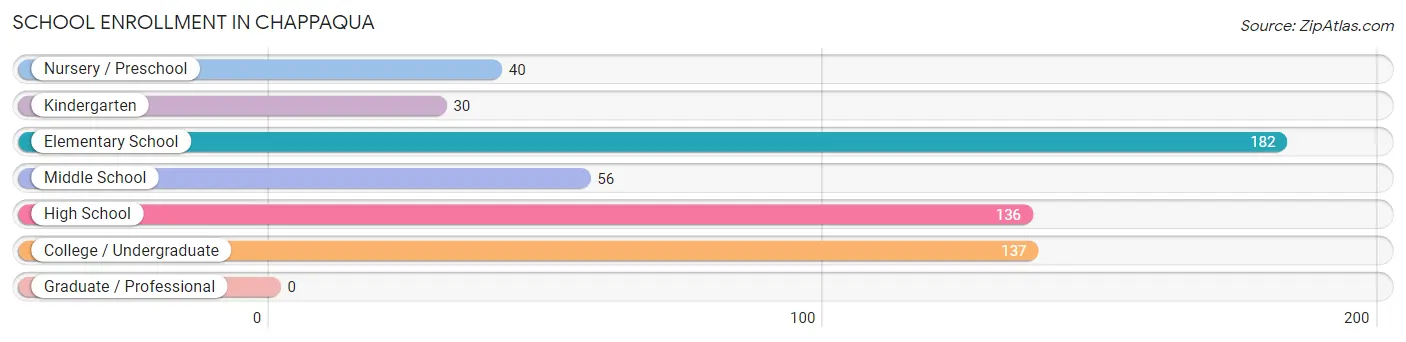
| School Level | # Students | % Students |
| Nursery / Preschool | 40 | 6.9% |
| Kindergarten | 30 | 5.2% |
| Elementary School | 182 | 31.3% |
| Middle School | 56 | 9.6% |
| High School | 136 | 23.4% |
| College / Undergraduate | 137 | 23.6% |
| Graduate / Professional | 0 | 0.0% |
| Total | 581 | 100.0% |
School Enrollment by Age by Funding Source in Chappaqua
Out of a total of 581 students who are enrolled in schools in Chappaqua, 99 (17.0%) attend a private institution, while the remaining 482 (83.0%) are enrolled in public schools. The age group of 3 to 4 year olds has the highest likelihood of being enrolled in private schools, with 40 (100.0% in the age bracket) enrolled. Conversely, the age group of 15 to 17 year olds has the lowest likelihood of being enrolled in a private school, with 88 (100.0% in the age bracket) attending a public institution.
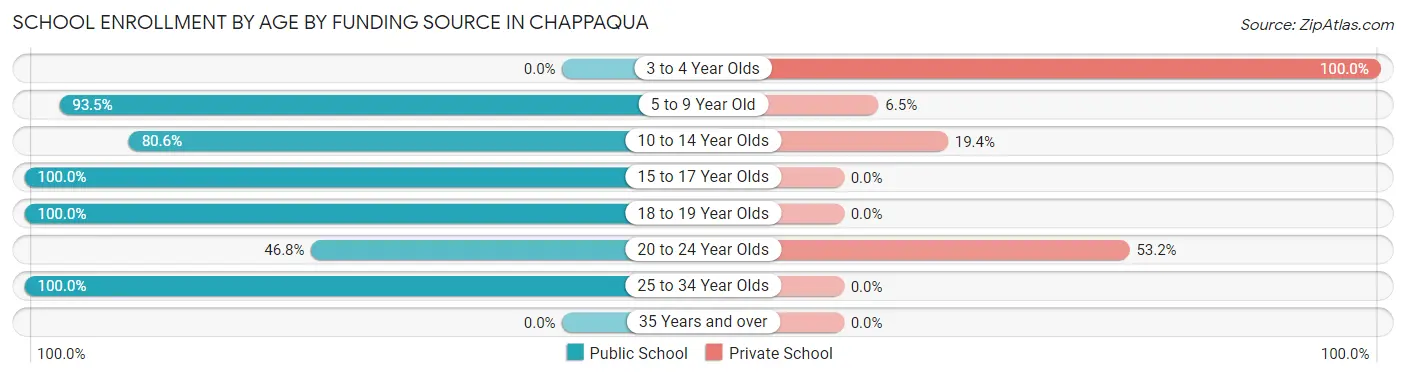
| Age Bracket | Public School | Private School |
| 3 to 4 Year Olds | 0 (0.0%) | 40 (100.0%) |
| 5 to 9 Year Old | 188 (93.5%) | 13 (6.5%) |
| 10 to 14 Year Olds | 54 (80.6%) | 13 (19.4%) |
| 15 to 17 Year Olds | 88 (100.0%) | 0 (0.0%) |
| 18 to 19 Year Olds | 83 (100.0%) | 0 (0.0%) |
| 20 to 24 Year Olds | 29 (46.8%) | 33 (53.2%) |
| 25 to 34 Year Olds | 40 (100.0%) | 0 (0.0%) |
| 35 Years and over | 0 (0.0%) | 0 (0.0%) |
| Total | 482 (83.0%) | 99 (17.0%) |
Educational Attainment by Field of Study in Chappaqua
Business (552 | 29.8%), science & technology (245 | 13.2%), education (152 | 8.2%), computers & mathematics (139 | 7.5%), and bio, nature & agricultural (138 | 7.5%) are the most common fields of study among 1,850 individuals in Chappaqua who have obtained a bachelor's degree or higher.
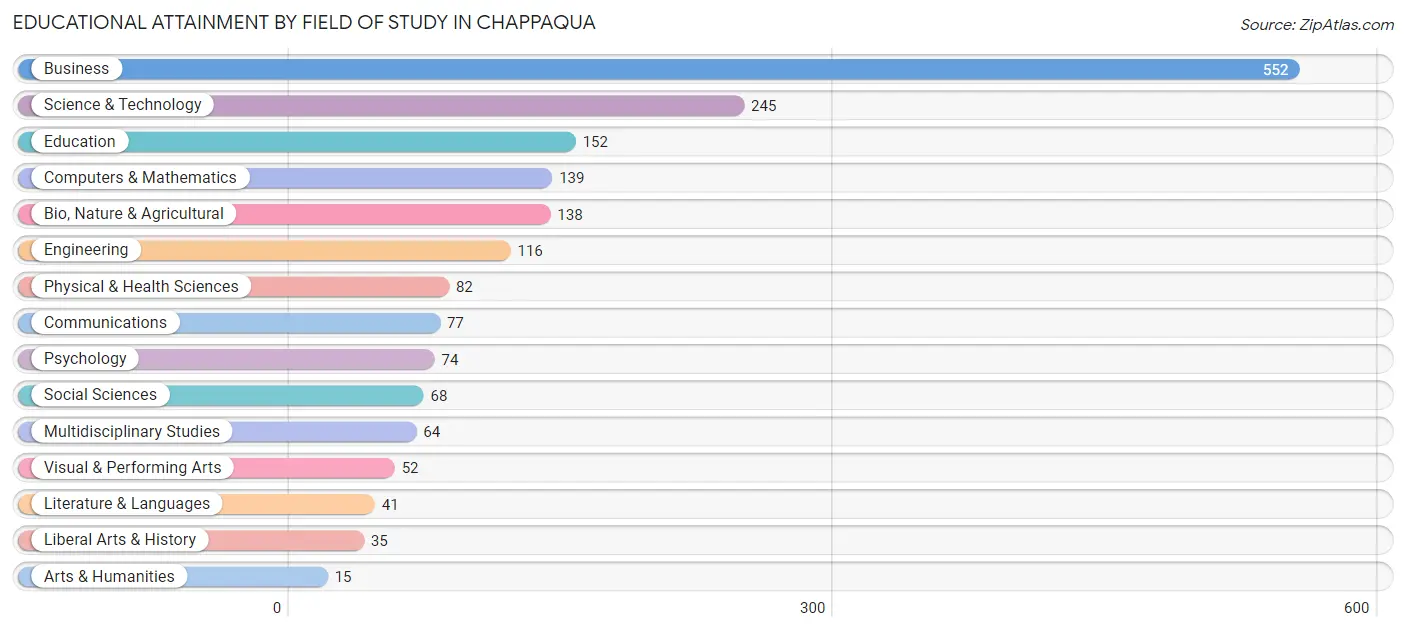
| Field of Study | # Graduates | % Graduates |
| Computers & Mathematics | 139 | 7.5% |
| Bio, Nature & Agricultural | 138 | 7.5% |
| Physical & Health Sciences | 82 | 4.4% |
| Psychology | 74 | 4.0% |
| Social Sciences | 68 | 3.7% |
| Engineering | 116 | 6.3% |
| Multidisciplinary Studies | 64 | 3.5% |
| Science & Technology | 245 | 13.2% |
| Business | 552 | 29.8% |
| Education | 152 | 8.2% |
| Literature & Languages | 41 | 2.2% |
| Liberal Arts & History | 35 | 1.9% |
| Visual & Performing Arts | 52 | 2.8% |
| Communications | 77 | 4.2% |
| Arts & Humanities | 15 | 0.8% |
| Total | 1,850 | 100.0% |
Transportation & Commute in Chappaqua
Vehicle Availability by Sex in Chappaqua
The most prevalent vehicle ownership categories in Chappaqua are males with 2 vehicles (439, accounting for 54.1%) and females with 2 vehicles (289, making up 68.8%).
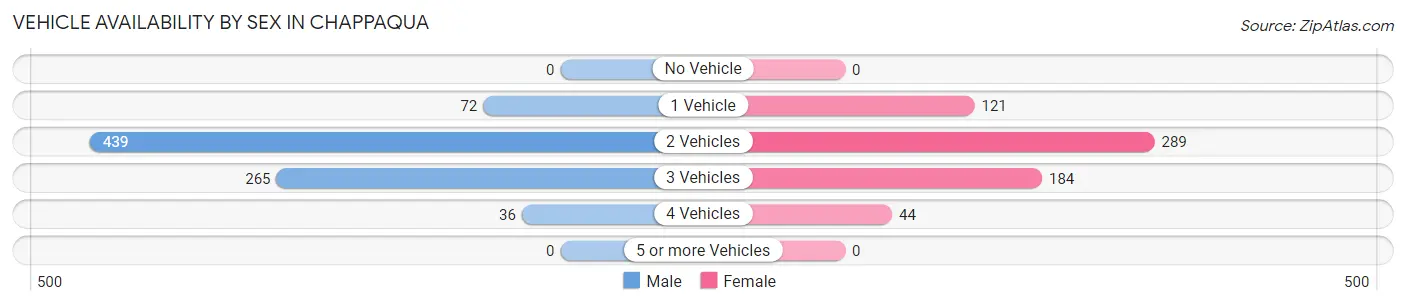
| Vehicles Available | Male | Female |
| No Vehicle | 0 (0.0%) | 0 (0.0%) |
| 1 Vehicle | 72 (8.9%) | 121 (19.0%) |
| 2 Vehicles | 439 (54.1%) | 289 (45.3%) |
| 3 Vehicles | 265 (32.6%) | 184 (28.8%) |
| 4 Vehicles | 36 (4.4%) | 44 (6.9%) |
| 5 or more Vehicles | 0 (0.0%) | 0 (0.0%) |
| Total | 812 (100.0%) | 638 (100.0%) |
Commute Time in Chappaqua
The most frequently occuring commute durations in Chappaqua are 30 to 34 minutes (182 commuters, 15.5%), 60 to 89 minutes (145 commuters, 12.4%), and 10 to 14 minutes (141 commuters, 12.0%).
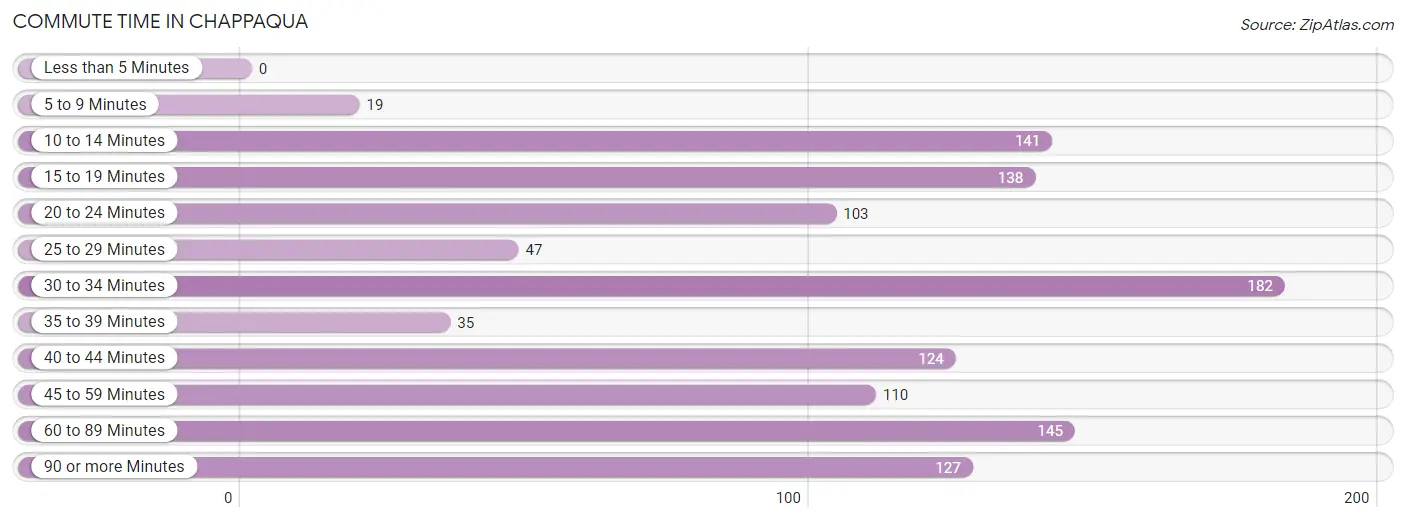
| Commute Time | # Commuters | % Commuters |
| Less than 5 Minutes | 0 | 0.0% |
| 5 to 9 Minutes | 19 | 1.6% |
| 10 to 14 Minutes | 141 | 12.0% |
| 15 to 19 Minutes | 138 | 11.8% |
| 20 to 24 Minutes | 103 | 8.8% |
| 25 to 29 Minutes | 47 | 4.0% |
| 30 to 34 Minutes | 182 | 15.5% |
| 35 to 39 Minutes | 35 | 3.0% |
| 40 to 44 Minutes | 124 | 10.6% |
| 45 to 59 Minutes | 110 | 9.4% |
| 60 to 89 Minutes | 145 | 12.4% |
| 90 or more Minutes | 127 | 10.8% |
Commute Time by Sex in Chappaqua
The most common commute times in Chappaqua are 40 to 44 minutes (112 commuters, 15.9%) for males and 30 to 34 minutes (92 commuters, 19.7%) for females.
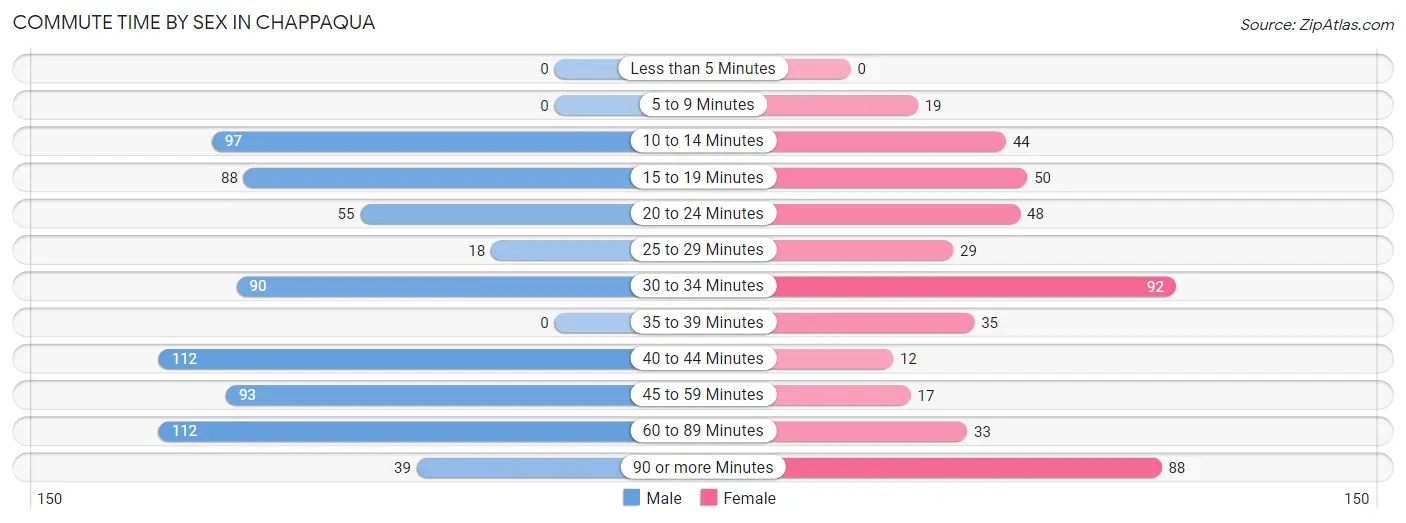
| Commute Time | Male | Female |
| Less than 5 Minutes | 0 (0.0%) | 0 (0.0%) |
| 5 to 9 Minutes | 0 (0.0%) | 19 (4.1%) |
| 10 to 14 Minutes | 97 (13.8%) | 44 (9.4%) |
| 15 to 19 Minutes | 88 (12.5%) | 50 (10.7%) |
| 20 to 24 Minutes | 55 (7.8%) | 48 (10.3%) |
| 25 to 29 Minutes | 18 (2.6%) | 29 (6.2%) |
| 30 to 34 Minutes | 90 (12.8%) | 92 (19.7%) |
| 35 to 39 Minutes | 0 (0.0%) | 35 (7.5%) |
| 40 to 44 Minutes | 112 (15.9%) | 12 (2.6%) |
| 45 to 59 Minutes | 93 (13.2%) | 17 (3.6%) |
| 60 to 89 Minutes | 112 (15.9%) | 33 (7.1%) |
| 90 or more Minutes | 39 (5.5%) | 88 (18.8%) |
Time of Departure to Work by Sex in Chappaqua
The most frequent times of departure to work in Chappaqua are 7:30 AM to 7:59 AM (270, 38.4%) for males and 6:30 AM to 6:59 AM (106, 22.7%) for females.
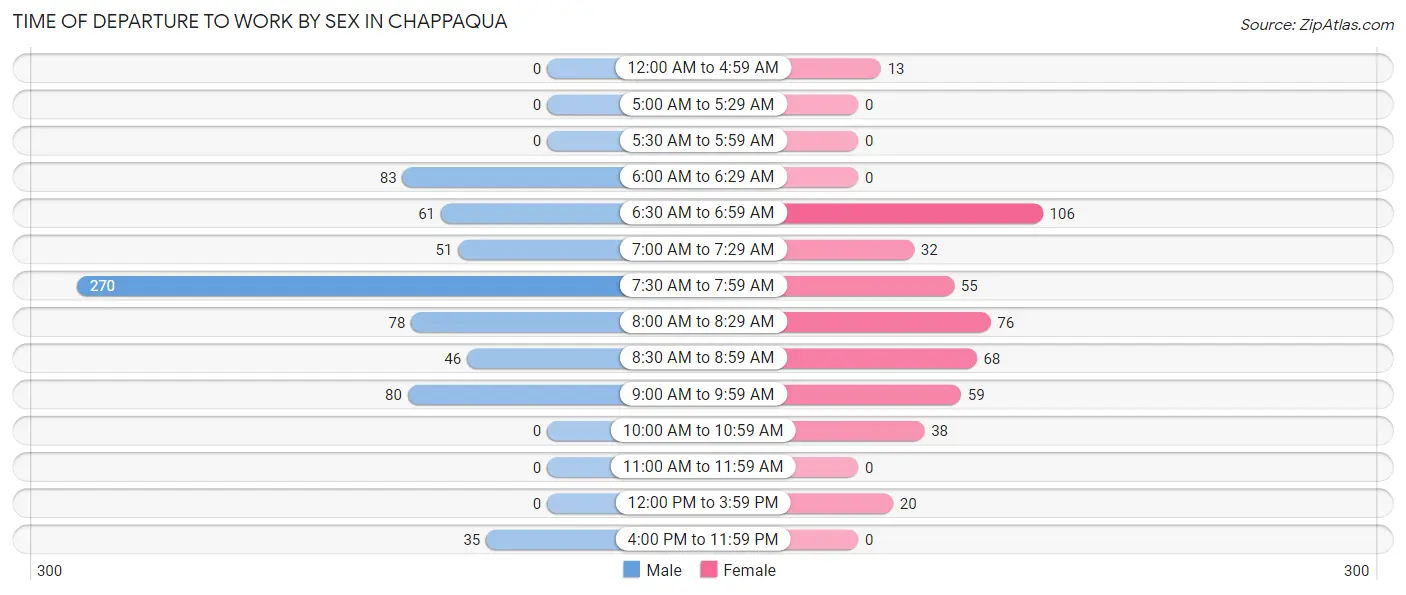
| Time of Departure | Male | Female |
| 12:00 AM to 4:59 AM | 0 (0.0%) | 13 (2.8%) |
| 5:00 AM to 5:29 AM | 0 (0.0%) | 0 (0.0%) |
| 5:30 AM to 5:59 AM | 0 (0.0%) | 0 (0.0%) |
| 6:00 AM to 6:29 AM | 83 (11.8%) | 0 (0.0%) |
| 6:30 AM to 6:59 AM | 61 (8.7%) | 106 (22.7%) |
| 7:00 AM to 7:29 AM | 51 (7.2%) | 32 (6.9%) |
| 7:30 AM to 7:59 AM | 270 (38.4%) | 55 (11.8%) |
| 8:00 AM to 8:29 AM | 78 (11.1%) | 76 (16.3%) |
| 8:30 AM to 8:59 AM | 46 (6.5%) | 68 (14.6%) |
| 9:00 AM to 9:59 AM | 80 (11.4%) | 59 (12.6%) |
| 10:00 AM to 10:59 AM | 0 (0.0%) | 38 (8.1%) |
| 11:00 AM to 11:59 AM | 0 (0.0%) | 0 (0.0%) |
| 12:00 PM to 3:59 PM | 0 (0.0%) | 20 (4.3%) |
| 4:00 PM to 11:59 PM | 35 (5.0%) | 0 (0.0%) |
| Total | 704 (100.0%) | 467 (100.0%) |
Housing Occupancy in Chappaqua
Occupancy by Ownership in Chappaqua
Of the total 1,101 dwellings in Chappaqua, owner-occupied units account for 963 (87.5%), while renter-occupied units make up 138 (12.5%).
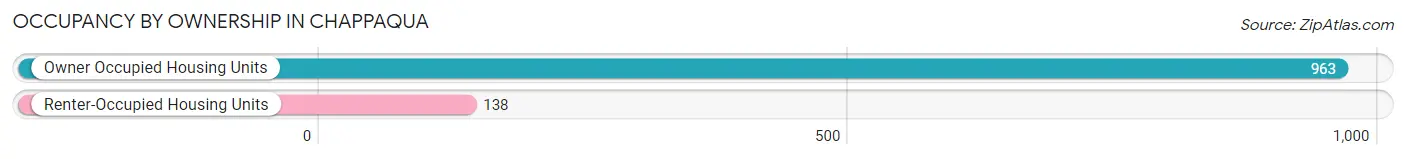
| Occupancy | # Housing Units | % Housing Units |
| Owner Occupied Housing Units | 963 | 87.5% |
| Renter-Occupied Housing Units | 138 | 12.5% |
| Total Occupied Housing Units | 1,101 | 100.0% |
Occupancy by Household Size in Chappaqua
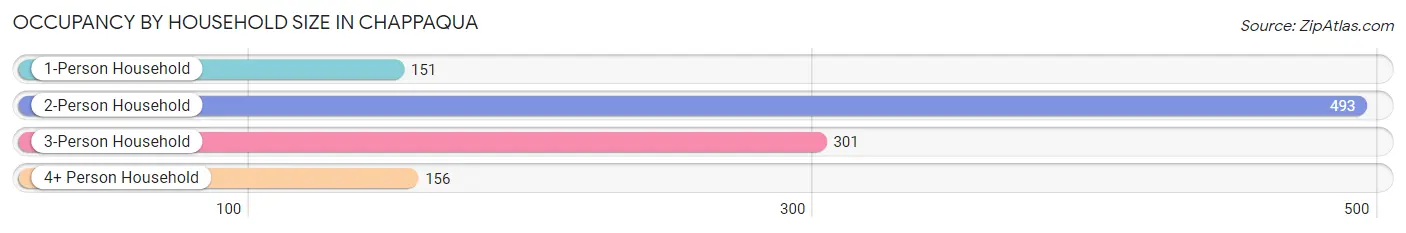
| Household Size | # Housing Units | % Housing Units |
| 1-Person Household | 151 | 13.7% |
| 2-Person Household | 493 | 44.8% |
| 3-Person Household | 301 | 27.3% |
| 4+ Person Household | 156 | 14.2% |
| Total Housing Units | 1,101 | 100.0% |
Occupancy by Ownership by Household Size in Chappaqua
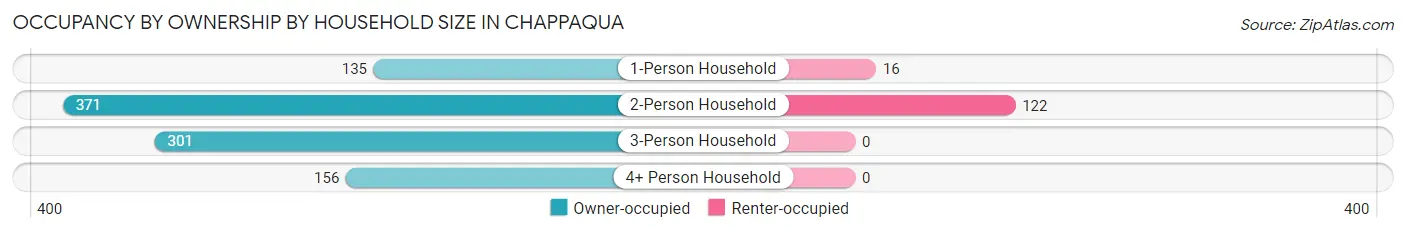
| Household Size | Owner-occupied | Renter-occupied |
| 1-Person Household | 135 (89.4%) | 16 (10.6%) |
| 2-Person Household | 371 (75.2%) | 122 (24.7%) |
| 3-Person Household | 301 (100.0%) | 0 (0.0%) |
| 4+ Person Household | 156 (100.0%) | 0 (0.0%) |
| Total Housing Units | 963 (87.5%) | 138 (12.5%) |
Occupancy by Educational Attainment in Chappaqua
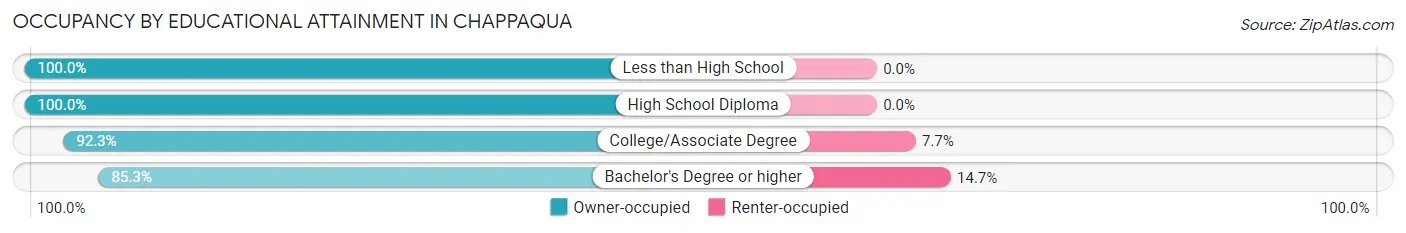
| Household Size | Owner-occupied | Renter-occupied |
| Less than High School | 32 (100.0%) | 0 (0.0%) |
| High School Diploma | 29 (100.0%) | 0 (0.0%) |
| College/Associate Degree | 192 (92.3%) | 16 (7.7%) |
| Bachelor's Degree or higher | 710 (85.3%) | 122 (14.7%) |
Occupancy by Age of Householder in Chappaqua
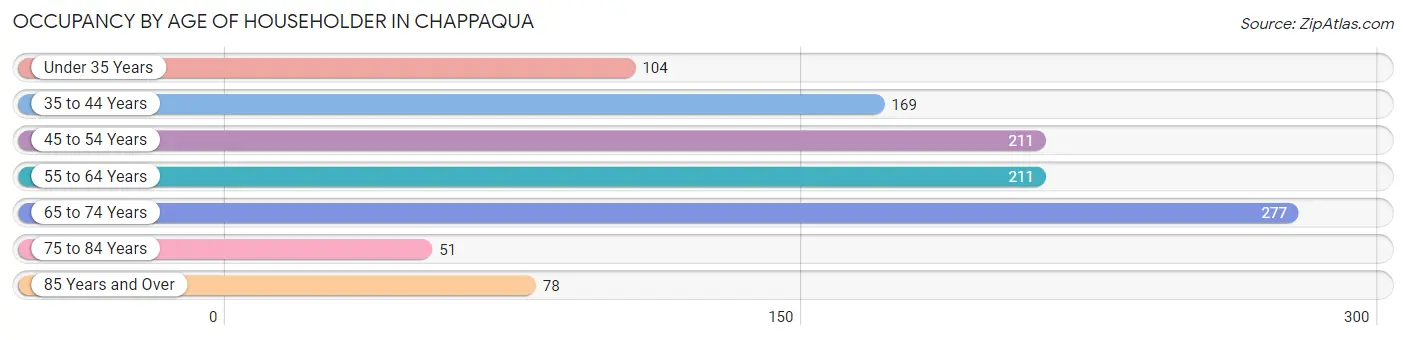
| Age Bracket | # Households | % Households |
| Under 35 Years | 104 | 9.5% |
| 35 to 44 Years | 169 | 15.3% |
| 45 to 54 Years | 211 | 19.2% |
| 55 to 64 Years | 211 | 19.2% |
| 65 to 74 Years | 277 | 25.2% |
| 75 to 84 Years | 51 | 4.6% |
| 85 Years and Over | 78 | 7.1% |
| Total | 1,101 | 100.0% |
Housing Finances in Chappaqua
Median Income by Occupancy in Chappaqua
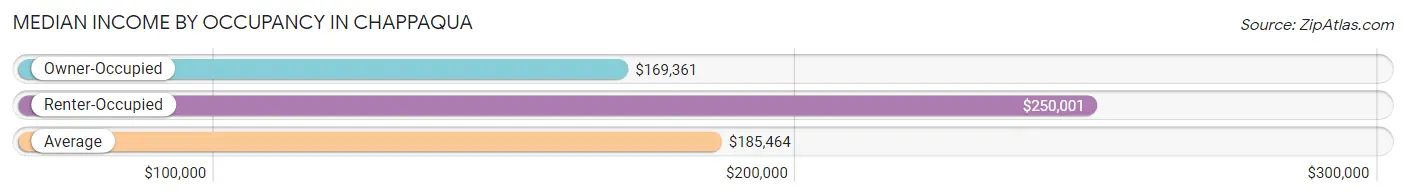
| Occupancy Type | # Households | Median Income |
| Owner-Occupied | 963 (87.5%) | $169,361 |
| Renter-Occupied | 138 (12.5%) | $250,001 |
| Average | 1,101 (100.0%) | $185,464 |
Occupancy by Householder Income Bracket in Chappaqua
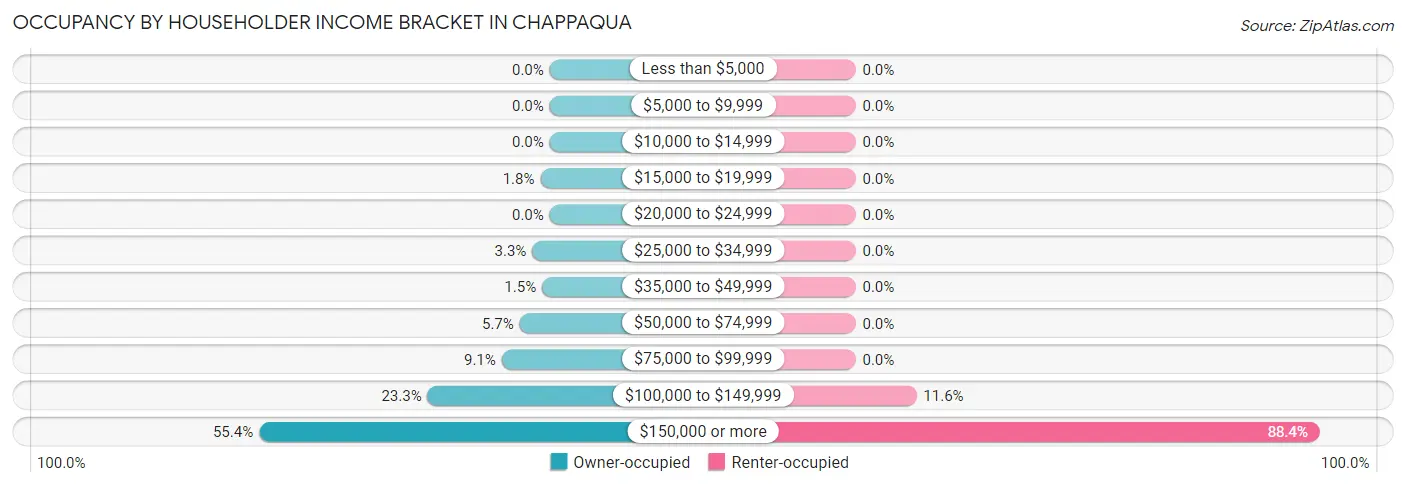
| Income Bracket | Owner-occupied | Renter-occupied |
| Less than $5,000 | 0 (0.0%) | 0 (0.0%) |
| $5,000 to $9,999 | 0 (0.0%) | 0 (0.0%) |
| $10,000 to $14,999 | 0 (0.0%) | 0 (0.0%) |
| $15,000 to $19,999 | 17 (1.8%) | 0 (0.0%) |
| $20,000 to $24,999 | 0 (0.0%) | 0 (0.0%) |
| $25,000 to $34,999 | 32 (3.3%) | 0 (0.0%) |
| $35,000 to $49,999 | 14 (1.5%) | 0 (0.0%) |
| $50,000 to $74,999 | 55 (5.7%) | 0 (0.0%) |
| $75,000 to $99,999 | 88 (9.1%) | 0 (0.0%) |
| $100,000 to $149,999 | 224 (23.3%) | 16 (11.6%) |
| $150,000 or more | 533 (55.3%) | 122 (88.4%) |
| Total | 963 (100.0%) | 138 (100.0%) |
Monthly Housing Cost Tiers in Chappaqua
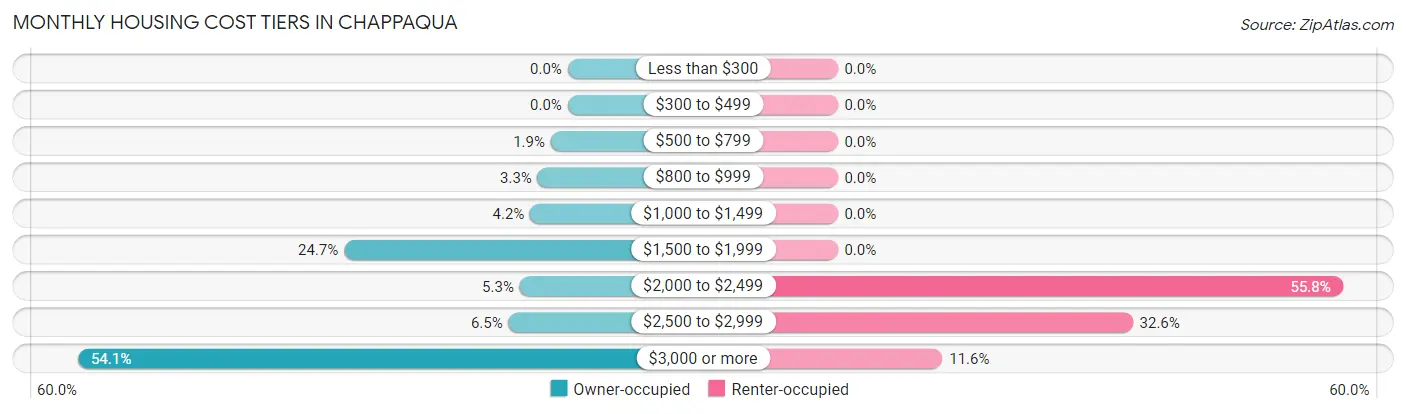
| Monthly Cost | Owner-occupied | Renter-occupied |
| Less than $300 | 0 (0.0%) | 0 (0.0%) |
| $300 to $499 | 0 (0.0%) | 0 (0.0%) |
| $500 to $799 | 18 (1.9%) | 0 (0.0%) |
| $800 to $999 | 32 (3.3%) | 0 (0.0%) |
| $1,000 to $1,499 | 40 (4.2%) | 0 (0.0%) |
| $1,500 to $1,999 | 238 (24.7%) | 0 (0.0%) |
| $2,000 to $2,499 | 51 (5.3%) | 77 (55.8%) |
| $2,500 to $2,999 | 63 (6.5%) | 45 (32.6%) |
| $3,000 or more | 521 (54.1%) | 16 (11.6%) |
| Total | 963 (100.0%) | 138 (100.0%) |
Physical Housing Characteristics in Chappaqua
Housing Structures in Chappaqua
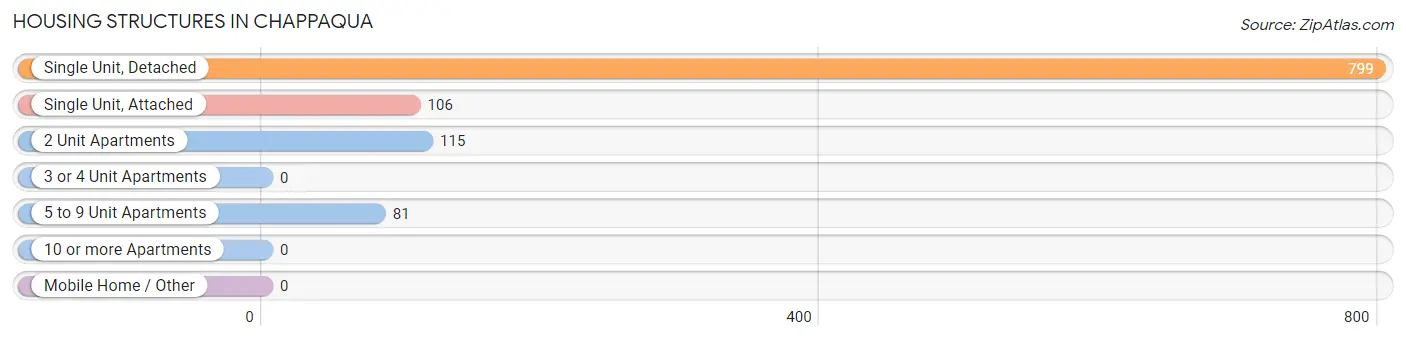
| Structure Type | # Housing Units | % Housing Units |
| Single Unit, Detached | 799 | 72.6% |
| Single Unit, Attached | 106 | 9.6% |
| 2 Unit Apartments | 115 | 10.4% |
| 3 or 4 Unit Apartments | 0 | 0.0% |
| 5 to 9 Unit Apartments | 81 | 7.4% |
| 10 or more Apartments | 0 | 0.0% |
| Mobile Home / Other | 0 | 0.0% |
| Total | 1,101 | 100.0% |
Housing Structures by Occupancy in Chappaqua
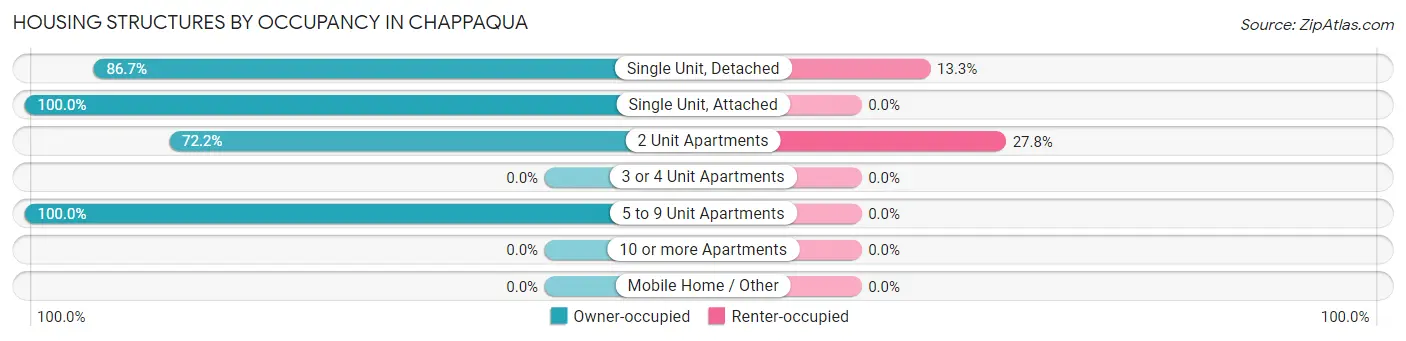
| Structure Type | Owner-occupied | Renter-occupied |
| Single Unit, Detached | 693 (86.7%) | 106 (13.3%) |
| Single Unit, Attached | 106 (100.0%) | 0 (0.0%) |
| 2 Unit Apartments | 83 (72.2%) | 32 (27.8%) |
| 3 or 4 Unit Apartments | 0 (0.0%) | 0 (0.0%) |
| 5 to 9 Unit Apartments | 81 (100.0%) | 0 (0.0%) |
| 10 or more Apartments | 0 (0.0%) | 0 (0.0%) |
| Mobile Home / Other | 0 (0.0%) | 0 (0.0%) |
| Total | 963 (87.5%) | 138 (12.5%) |
Housing Structures by Number of Rooms in Chappaqua
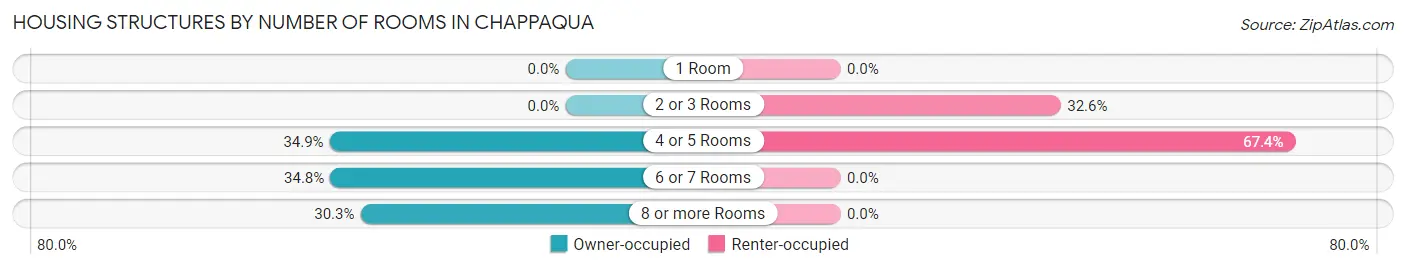
| Number of Rooms | Owner-occupied | Renter-occupied |
| 1 Room | 0 (0.0%) | 0 (0.0%) |
| 2 or 3 Rooms | 0 (0.0%) | 45 (32.6%) |
| 4 or 5 Rooms | 336 (34.9%) | 93 (67.4%) |
| 6 or 7 Rooms | 335 (34.8%) | 0 (0.0%) |
| 8 or more Rooms | 292 (30.3%) | 0 (0.0%) |
| Total | 963 (100.0%) | 138 (100.0%) |
Housing Structure by Heating Type in Chappaqua
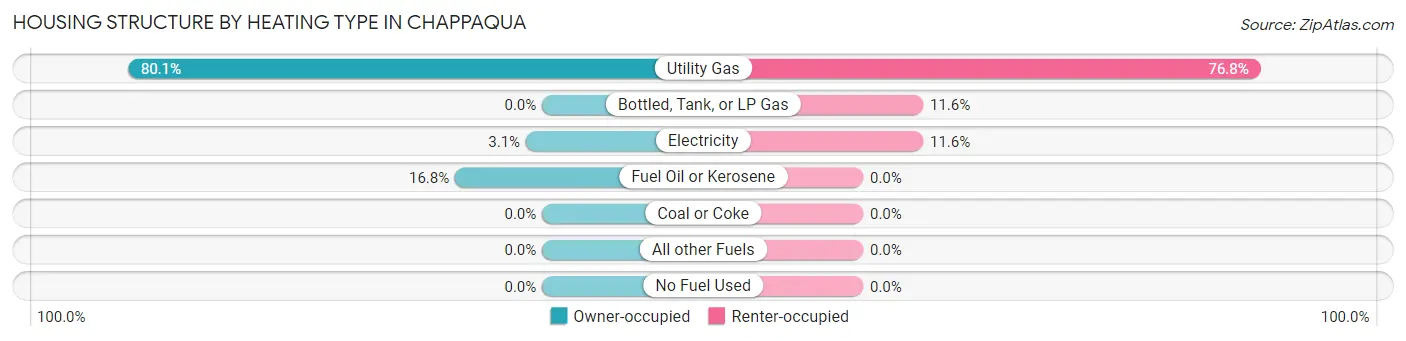
| Heating Type | Owner-occupied | Renter-occupied |
| Utility Gas | 771 (80.1%) | 106 (76.8%) |
| Bottled, Tank, or LP Gas | 0 (0.0%) | 16 (11.6%) |
| Electricity | 30 (3.1%) | 16 (11.6%) |
| Fuel Oil or Kerosene | 162 (16.8%) | 0 (0.0%) |
| Coal or Coke | 0 (0.0%) | 0 (0.0%) |
| All other Fuels | 0 (0.0%) | 0 (0.0%) |
| No Fuel Used | 0 (0.0%) | 0 (0.0%) |
| Total | 963 (100.0%) | 138 (100.0%) |
Household Vehicle Usage in Chappaqua
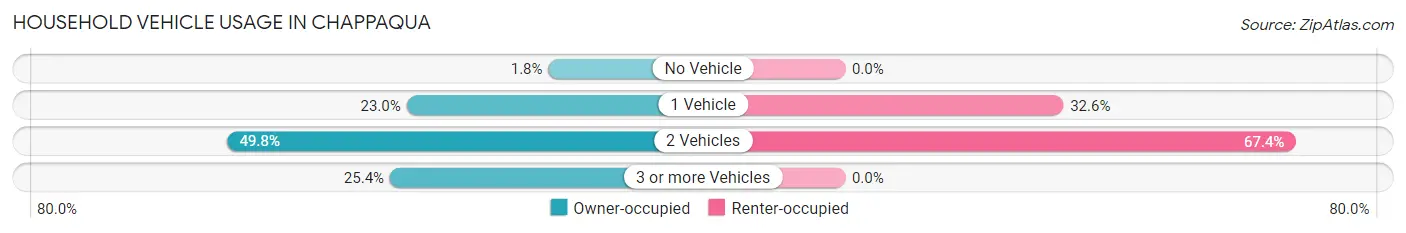
| Vehicles per Household | Owner-occupied | Renter-occupied |
| No Vehicle | 17 (1.8%) | 0 (0.0%) |
| 1 Vehicle | 221 (23.0%) | 45 (32.6%) |
| 2 Vehicles | 480 (49.8%) | 93 (67.4%) |
| 3 or more Vehicles | 245 (25.4%) | 0 (0.0%) |
| Total | 963 (100.0%) | 138 (100.0%) |
Real Estate & Mortgages in Chappaqua
Real Estate and Mortgage Overview in Chappaqua
| Characteristic | Without Mortgage | With Mortgage |
| Housing Units | 436 | 527 |
| Median Property Value | $638,200 | $797,500 |
| Median Household Income | $144,035 | $359 |
| Monthly Housing Costs | $1,501 | $508 |
| Real Estate Taxes | $10,001 | $19 |
Property Value by Mortgage Status in Chappaqua
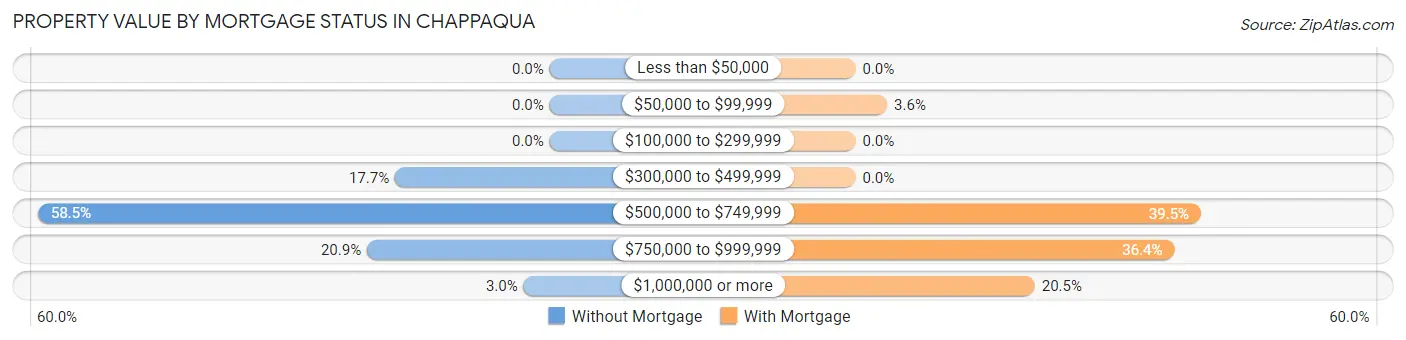
| Property Value | Without Mortgage | With Mortgage |
| Less than $50,000 | 0 (0.0%) | 0 (0.0%) |
| $50,000 to $99,999 | 0 (0.0%) | 19 (3.6%) |
| $100,000 to $299,999 | 0 (0.0%) | 0 (0.0%) |
| $300,000 to $499,999 | 77 (17.7%) | 0 (0.0%) |
| $500,000 to $749,999 | 255 (58.5%) | 208 (39.5%) |
| $750,000 to $999,999 | 91 (20.9%) | 192 (36.4%) |
| $1,000,000 or more | 13 (3.0%) | 108 (20.5%) |
| Total | 436 (100.0%) | 527 (100.0%) |
Household Income by Mortgage Status in Chappaqua
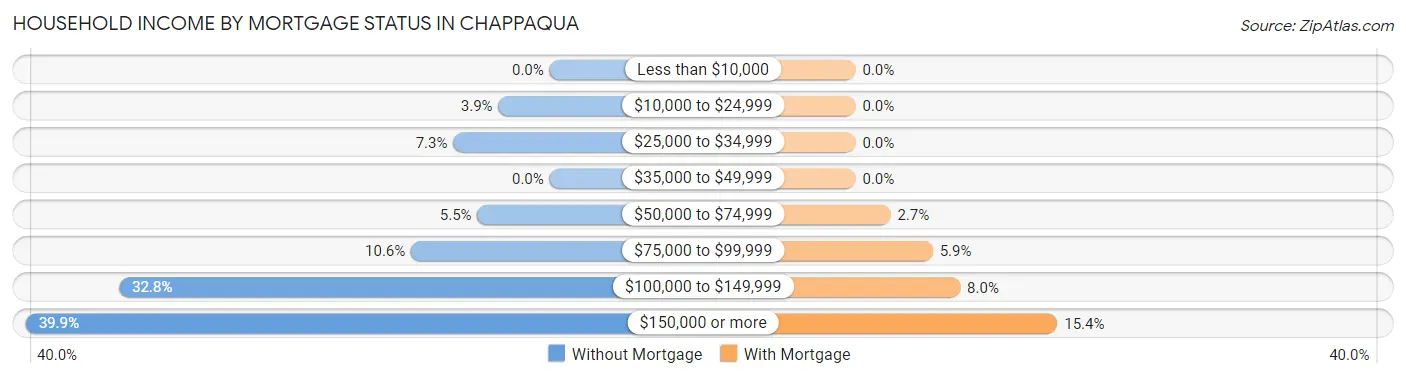
| Household Income | Without Mortgage | With Mortgage |
| Less than $10,000 | 0 (0.0%) | 0 (0.0%) |
| $10,000 to $24,999 | 17 (3.9%) | 0 (0.0%) |
| $25,000 to $34,999 | 32 (7.3%) | 0 (0.0%) |
| $35,000 to $49,999 | 0 (0.0%) | 0 (0.0%) |
| $50,000 to $74,999 | 24 (5.5%) | 14 (2.7%) |
| $75,000 to $99,999 | 46 (10.5%) | 31 (5.9%) |
| $100,000 to $149,999 | 143 (32.8%) | 42 (8.0%) |
| $150,000 or more | 174 (39.9%) | 81 (15.4%) |
| Total | 436 (100.0%) | 527 (100.0%) |
Property Value to Household Income Ratio in Chappaqua
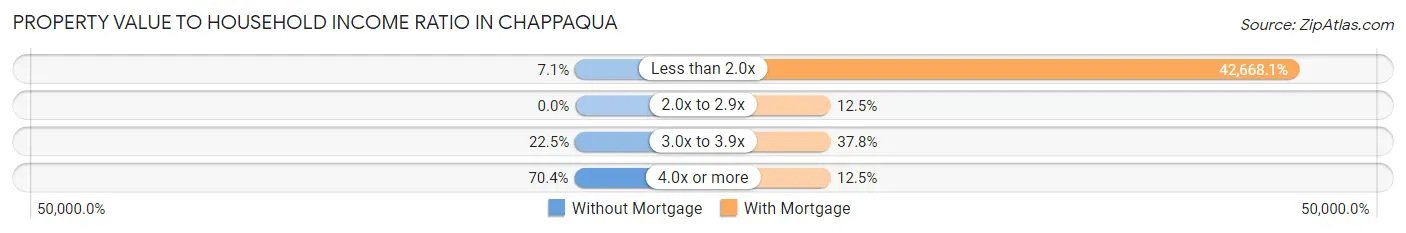
| Value-to-Income Ratio | Without Mortgage | With Mortgage |
| Less than 2.0x | 31 (7.1%) | 224,861 (42,668.1%) |
| 2.0x to 2.9x | 0 (0.0%) | 66 (12.5%) |
| 3.0x to 3.9x | 98 (22.5%) | 199 (37.8%) |
| 4.0x or more | 307 (70.4%) | 66 (12.5%) |
| Total | 436 (100.0%) | 527 (100.0%) |
Real Estate Taxes by Mortgage Status in Chappaqua
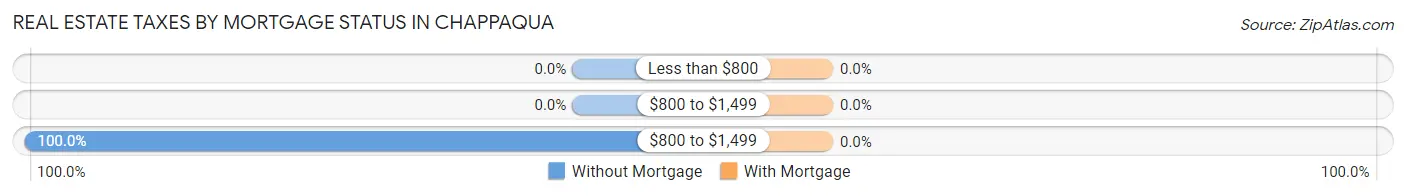
| Property Taxes | Without Mortgage | With Mortgage |
| Less than $800 | 0 (0.0%) | 0 (0.0%) |
| $800 to $1,499 | 0 (0.0%) | 0 (0.0%) |
| $800 to $1,499 | 436 (100.0%) | 0 (0.0%) |
| Total | 436 (100.0%) | 527 (100.0%) |
Health & Disability in Chappaqua
Health Insurance Coverage by Age in Chappaqua
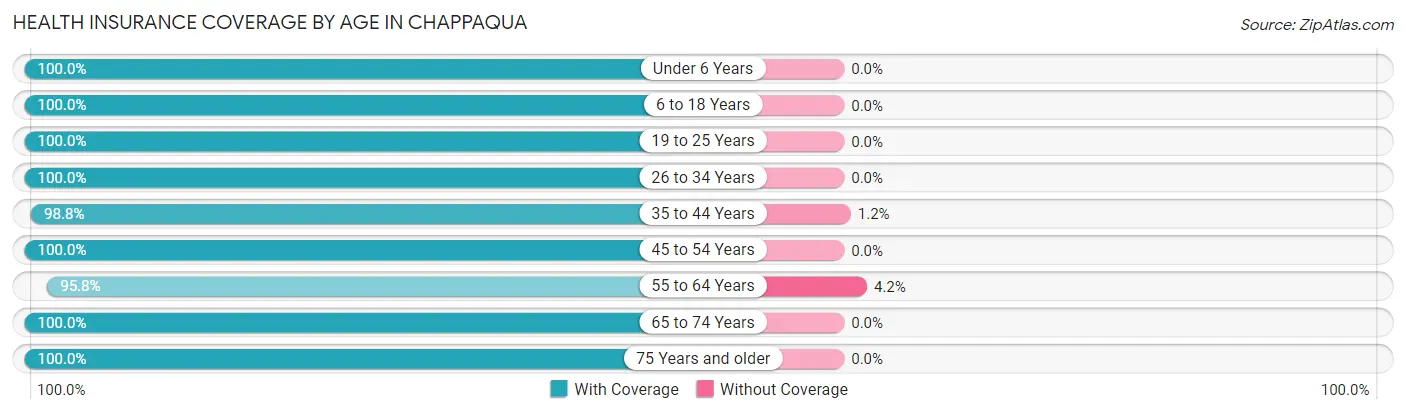
| Age Bracket | With Coverage | Without Coverage |
| Under 6 Years | 63 (100.0%) | 0 (0.0%) |
| 6 to 18 Years | 422 (100.0%) | 0 (0.0%) |
| 19 to 25 Years | 294 (100.0%) | 0 (0.0%) |
| 26 to 34 Years | 231 (100.0%) | 0 (0.0%) |
| 35 to 44 Years | 324 (98.8%) | 4 (1.2%) |
| 45 to 54 Years | 485 (100.0%) | 0 (0.0%) |
| 55 to 64 Years | 339 (95.8%) | 15 (4.2%) |
| 65 to 74 Years | 410 (100.0%) | 0 (0.0%) |
| 75 Years and older | 225 (100.0%) | 0 (0.0%) |
| Total | 2,793 (99.3%) | 19 (0.7%) |
Health Insurance Coverage by Citizenship Status in Chappaqua
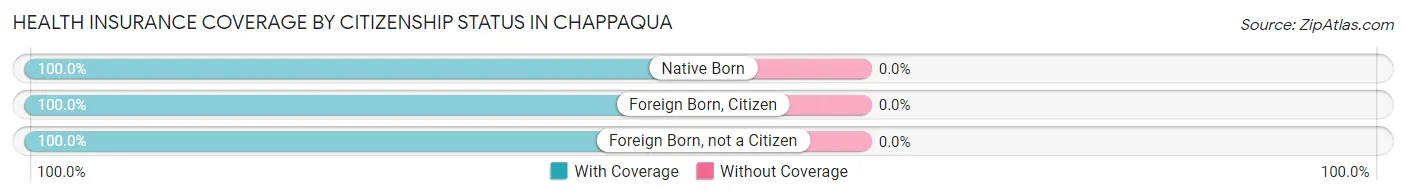
| Citizenship Status | With Coverage | Without Coverage |
| Native Born | 63 (100.0%) | 0 (0.0%) |
| Foreign Born, Citizen | 422 (100.0%) | 0 (0.0%) |
| Foreign Born, not a Citizen | 294 (100.0%) | 0 (0.0%) |
Health Insurance Coverage by Household Income in Chappaqua
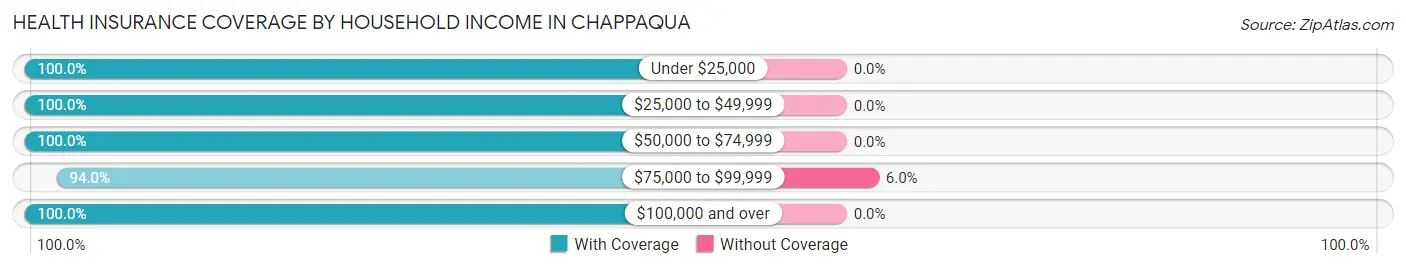
| Household Income | With Coverage | Without Coverage |
| Under $25,000 | 17 (100.0%) | 0 (0.0%) |
| $25,000 to $49,999 | 65 (100.0%) | 0 (0.0%) |
| $50,000 to $74,999 | 82 (100.0%) | 0 (0.0%) |
| $75,000 to $99,999 | 235 (94.0%) | 15 (6.0%) |
| $100,000 and over | 2,385 (100.0%) | 0 (0.0%) |
Public vs Private Health Insurance Coverage by Age in Chappaqua
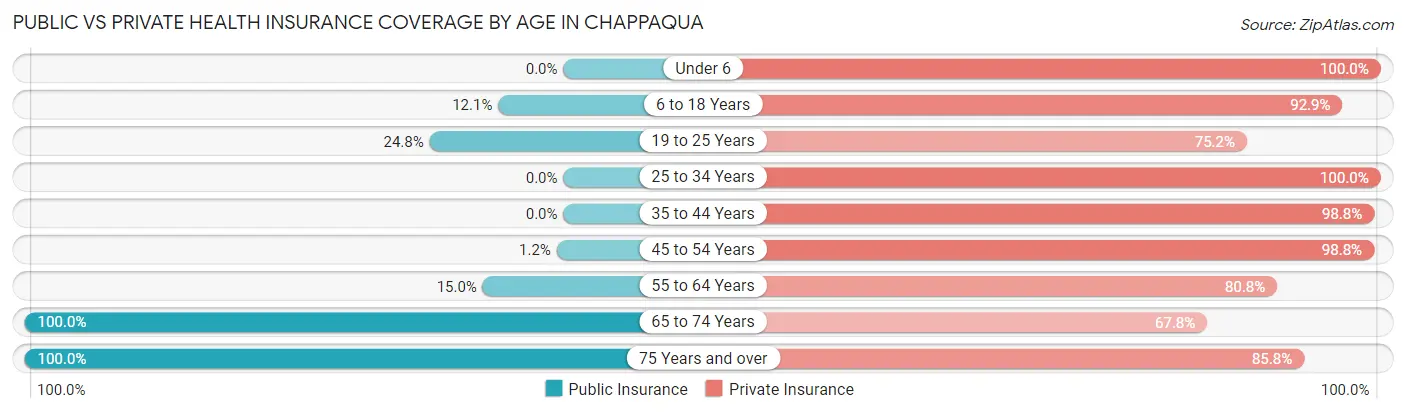
| Age Bracket | Public Insurance | Private Insurance |
| Under 6 | 0 (0.0%) | 63 (100.0%) |
| 6 to 18 Years | 51 (12.1%) | 392 (92.9%) |
| 19 to 25 Years | 73 (24.8%) | 221 (75.2%) |
| 25 to 34 Years | 0 (0.0%) | 231 (100.0%) |
| 35 to 44 Years | 0 (0.0%) | 324 (98.8%) |
| 45 to 54 Years | 6 (1.2%) | 479 (98.8%) |
| 55 to 64 Years | 53 (15.0%) | 286 (80.8%) |
| 65 to 74 Years | 410 (100.0%) | 278 (67.8%) |
| 75 Years and over | 225 (100.0%) | 193 (85.8%) |
| Total | 818 (29.1%) | 2,467 (87.7%) |
Disability Status by Sex by Age in Chappaqua
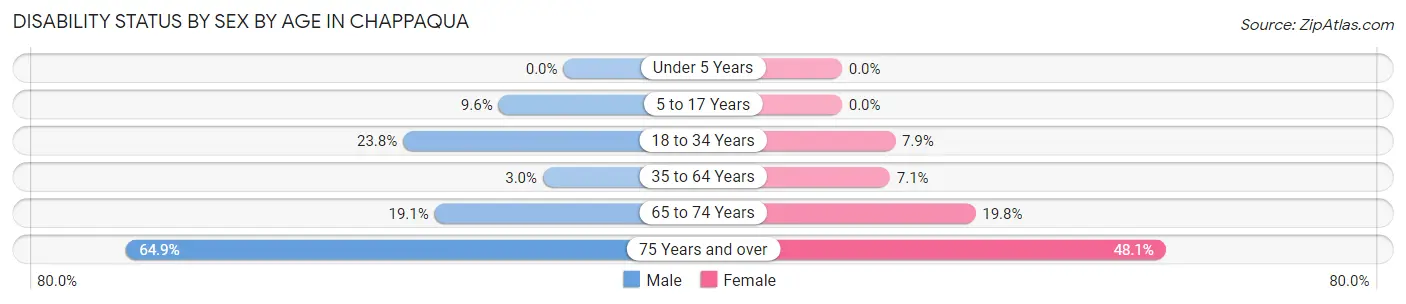
| Age Bracket | Male | Female |
| Under 5 Years | 0 (0.0%) | 0 (0.0%) |
| 5 to 17 Years | 21 (9.6%) | 0 (0.0%) |
| 18 to 34 Years | 70 (23.8%) | 22 (7.9%) |
| 35 to 64 Years | 18 (3.0%) | 41 (7.1%) |
| 65 to 74 Years | 35 (19.1%) | 45 (19.8%) |
| 75 Years and over | 61 (64.9%) | 63 (48.1%) |
Disability Class by Sex by Age in Chappaqua
Disability Class: Hearing Difficulty
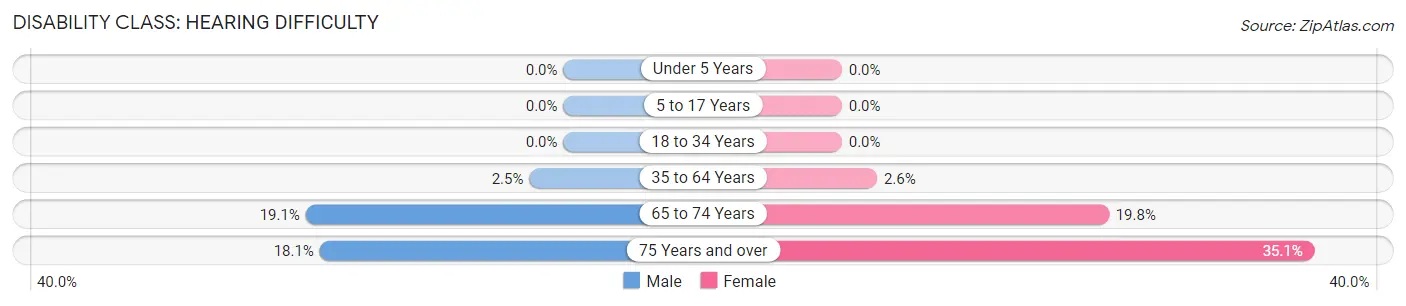
| Age Bracket | Male | Female |
| Under 5 Years | 0 (0.0%) | 0 (0.0%) |
| 5 to 17 Years | 0 (0.0%) | 0 (0.0%) |
| 18 to 34 Years | 0 (0.0%) | 0 (0.0%) |
| 35 to 64 Years | 15 (2.5%) | 15 (2.6%) |
| 65 to 74 Years | 35 (19.1%) | 45 (19.8%) |
| 75 Years and over | 17 (18.1%) | 46 (35.1%) |
Disability Class: Vision Difficulty
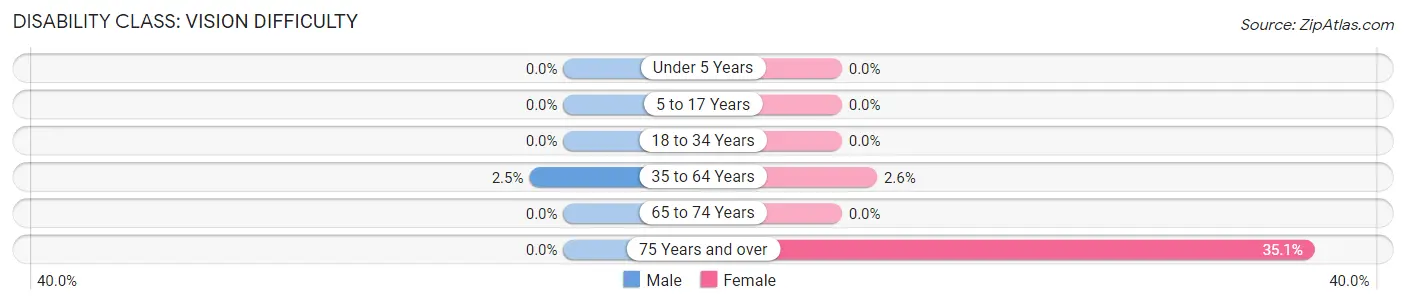
| Age Bracket | Male | Female |
| Under 5 Years | 0 (0.0%) | 0 (0.0%) |
| 5 to 17 Years | 0 (0.0%) | 0 (0.0%) |
| 18 to 34 Years | 0 (0.0%) | 0 (0.0%) |
| 35 to 64 Years | 15 (2.5%) | 15 (2.6%) |
| 65 to 74 Years | 0 (0.0%) | 0 (0.0%) |
| 75 Years and over | 0 (0.0%) | 46 (35.1%) |
Disability Class: Cognitive Difficulty
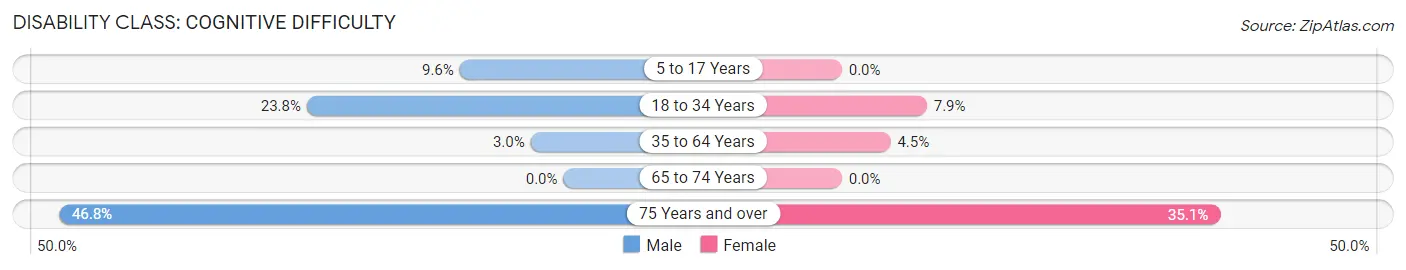
| Age Bracket | Male | Female |
| 5 to 17 Years | 21 (9.6%) | 0 (0.0%) |
| 18 to 34 Years | 70 (23.8%) | 22 (7.9%) |
| 35 to 64 Years | 18 (3.0%) | 26 (4.5%) |
| 65 to 74 Years | 0 (0.0%) | 0 (0.0%) |
| 75 Years and over | 44 (46.8%) | 46 (35.1%) |
Disability Class: Ambulatory Difficulty
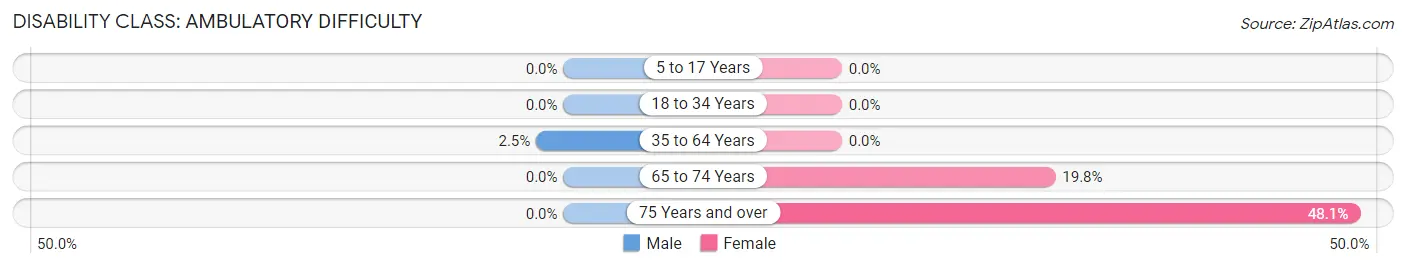
| Age Bracket | Male | Female |
| 5 to 17 Years | 0 (0.0%) | 0 (0.0%) |
| 18 to 34 Years | 0 (0.0%) | 0 (0.0%) |
| 35 to 64 Years | 15 (2.5%) | 0 (0.0%) |
| 65 to 74 Years | 0 (0.0%) | 45 (19.8%) |
| 75 Years and over | 0 (0.0%) | 63 (48.1%) |
Disability Class: Self-Care Difficulty
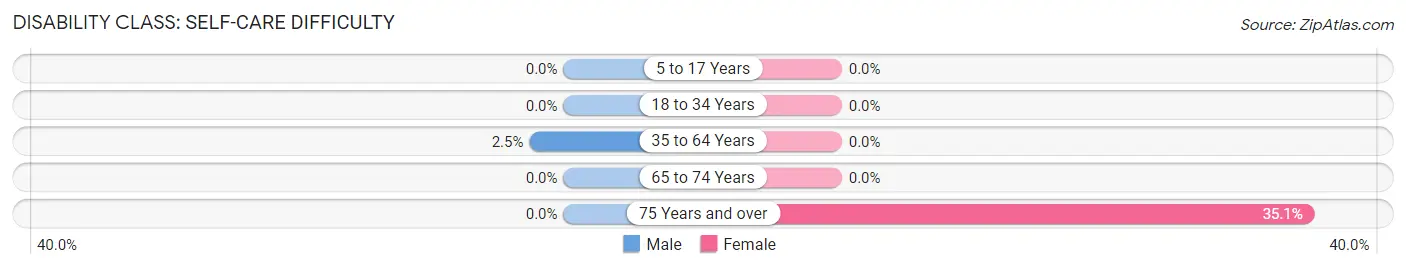
| Age Bracket | Male | Female |
| 5 to 17 Years | 0 (0.0%) | 0 (0.0%) |
| 18 to 34 Years | 0 (0.0%) | 0 (0.0%) |
| 35 to 64 Years | 15 (2.5%) | 0 (0.0%) |
| 65 to 74 Years | 0 (0.0%) | 0 (0.0%) |
| 75 Years and over | 0 (0.0%) | 46 (35.1%) |
Technology Access in Chappaqua
Computing Device Access in Chappaqua
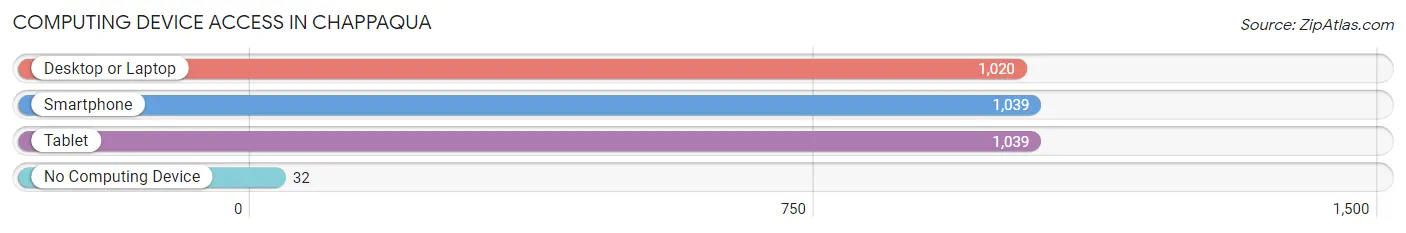
| Device Type | # Households | % Households |
| Desktop or Laptop | 1,020 | 92.6% |
| Smartphone | 1,039 | 94.4% |
| Tablet | 1,039 | 94.4% |
| No Computing Device | 32 | 2.9% |
| Total | 1,101 | 100.0% |
Internet Access in Chappaqua
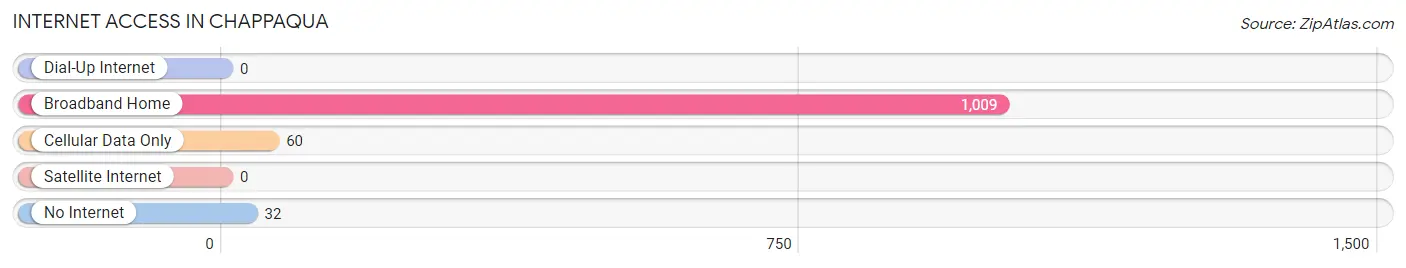
| Internet Type | # Households | % Households |
| Dial-Up Internet | 0 | 0.0% |
| Broadband Home | 1,009 | 91.6% |
| Cellular Data Only | 60 | 5.4% |
| Satellite Internet | 0 | 0.0% |
| No Internet | 32 | 2.9% |
| Total | 1,101 | 100.0% |
Chappaqua Summary
Chappaqua, NY is a hamlet located in the town of New Castle in Westchester County, New York. It is located about 30 miles north of New York City and is part of the New York metropolitan area. The hamlet is home to about 5,000 people and is known for its rural charm and proximity to the city.
History
The area that is now Chappaqua was originally inhabited by the Mohegan Indians. The first European settlers arrived in the area in 1730 and the hamlet was officially established in 1753. The name Chappaqua is derived from the Mohegan word for “birch-bark country”.
In the 19th century, the hamlet became a popular summer resort for wealthy New Yorkers. The area was also home to several large estates, including the estate of Horace Greeley, the founder of the New York Tribune.
In the late 19th century, the hamlet began to develop into a residential community. The hamlet was incorporated in 1864 and the first public school was built in 1866.
Geography
Chappaqua is located in the town of New Castle in Westchester County, New York. It is located about 30 miles north of New York City and is part of the New York metropolitan area. The hamlet is situated on the east bank of the Croton River and is bordered by the towns of Mount Kisco to the north, Bedford to the east, and Ossining to the south.
The hamlet has a total area of 4.2 square miles, of which 4.1 square miles is land and 0.1 square miles is water. The terrain is mostly hilly and the highest point is the summit of Bald Hill, which has an elevation of 590 feet.
Economy
The economy of Chappaqua is largely based on the service industry. The hamlet is home to several small businesses, including restaurants, retail stores, and professional services. The hamlet is also home to several corporate headquarters, including Reader’s Digest and PepsiCo.
The hamlet is also home to several large employers, including the Chappaqua Central School District, Northern Westchester Hospital, and the Westchester Medical Center.
Demographics
As of the 2010 census, the population of Chappaqua was 5,104. The racial makeup of the hamlet was 87.3% White, 5.2% Asian, 4.2% African American, and 2.3% Hispanic or Latino.
The median household income in Chappaqua was $150,000 in 2010, which is significantly higher than the national median of $50,000. The median home value in Chappaqua was $1,000,000 in 2010, which is also significantly higher than the national median of $200,000.
Conclusion
Chappaqua, NY is a hamlet located in the town of New Castle in Westchester County, New York. It is located about 30 miles north of New York City and is part of the New York metropolitan area. The hamlet is home to about 5,000 people and is known for its rural charm and proximity to the city. The economy of Chappaqua is largely based on the service industry and the hamlet is home to several corporate headquarters and large employers. The population of Chappaqua is predominantly white and the median household income and home value are significantly higher than the national median.
Common Questions
What is Per Capita Income in Chappaqua?
Per Capita income in Chappaqua is $102,223.
What is the Median Family Income in Chappaqua?
Median Family Income in Chappaqua is $181,711.
What is the Median Household income in Chappaqua?
Median Household Income in Chappaqua is $185,464.
What is Income or Wage Gap in Chappaqua?
Income or Wage Gap in Chappaqua is 48.1%.
Women in Chappaqua earn 51.9 cents for every dollar earned by a man.
What is Inequality or Gini Index in Chappaqua?
Inequality or Gini Index in Chappaqua is 0.41.
What is the Total Population of Chappaqua?
Total Population of Chappaqua is 2,812.
What is the Total Male Population of Chappaqua?
Total Male Population of Chappaqua is 1,381.
What is the Total Female Population of Chappaqua?
Total Female Population of Chappaqua is 1,431.
What is the Ratio of Males per 100 Females in Chappaqua?
There are 96.51 Males per 100 Females in Chappaqua.
What is the Ratio of Females per 100 Males in Chappaqua?
There are 103.62 Females per 100 Males in Chappaqua.
What is the Median Population Age in Chappaqua?
Median Population Age in Chappaqua is 46.2 Years.
What is the Average Family Size in Chappaqua
Average Family Size in Chappaqua is 2.9 People.
What is the Average Household Size in Chappaqua
Average Household Size in Chappaqua is 2.5 People.
How Large is the Labor Force in Chappaqua?
There are 1,556 People in the Labor Forcein in Chappaqua.
What is the Percentage of People in the Labor Force in Chappaqua?
65.0% of People are in the Labor Force in Chappaqua.
What is the Unemployment Rate in Chappaqua?
Unemployment Rate in Chappaqua is 6.6%.