Village Green, NY Map & Demographics
Village Green Map
Village Green Overview
$35,538
PER CAPITA INCOME
$71,563
AVG FAMILY INCOME
$60,089
AVG HOUSEHOLD INCOME
41.7%
WAGE / INCOME GAP [ % ]
58.3¢/ $1
WAGE / INCOME GAP [ $ ]
0.37
INEQUALITY / GINI INDEX
3,747
TOTAL POPULATION
1,784
MALE POPULATION
1,963
FEMALE POPULATION
90.88
MALES / 100 FEMALES
110.03
FEMALES / 100 MALES
35.9
MEDIAN AGE
2.9
AVG FAMILY SIZE
2.1
AVG HOUSEHOLD SIZE
2,086
LABOR FORCE [ PEOPLE ]
68.3%
PERCENT IN LABOR FORCE
5.8%
UNEMPLOYMENT RATE
Income in Village Green
Income Overview in Village Green
Per Capita Income in Village Green is $35,538, while median incomes of families and households are $71,563 and $60,089 respectively.
| Characteristic | Number | Measure |
| Per Capita Income | 3,747 | $35,538 |
| Median Family Income | 814 | $71,563 |
| Mean Family Income | 814 | $83,395 |
| Median Household Income | 1,816 | $60,089 |
| Mean Household Income | 1,816 | $72,430 |
| Income Deficit | 814 | $0 |
| Wage / Income Gap (%) | 3,747 | 41.70% |
| Wage / Income Gap ($) | 3,747 | 58.30¢ per $1 |
| Gini / Inequality Index | 3,747 | 0.37 |
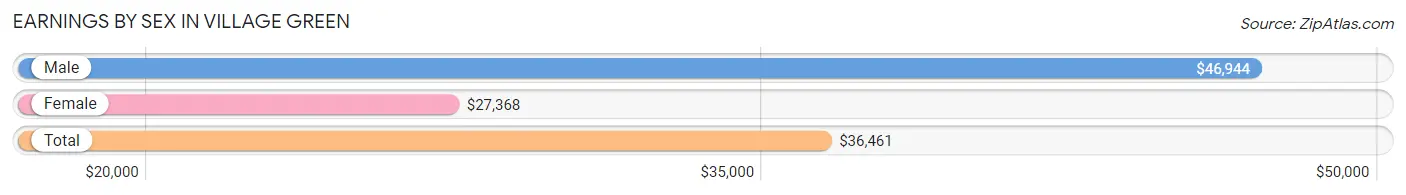
Earnings by Sex in Village Green
Average Earnings in Village Green are $36,461, $46,944 for men and $27,368 for women, a difference of 41.7%.
| Sex | Number | Average Earnings |
| Male | 1,146 (51.9%) | $46,944 |
| Female | 1,060 (48.0%) | $27,368 |
| Total | 2,206 (100.0%) | $36,461 |
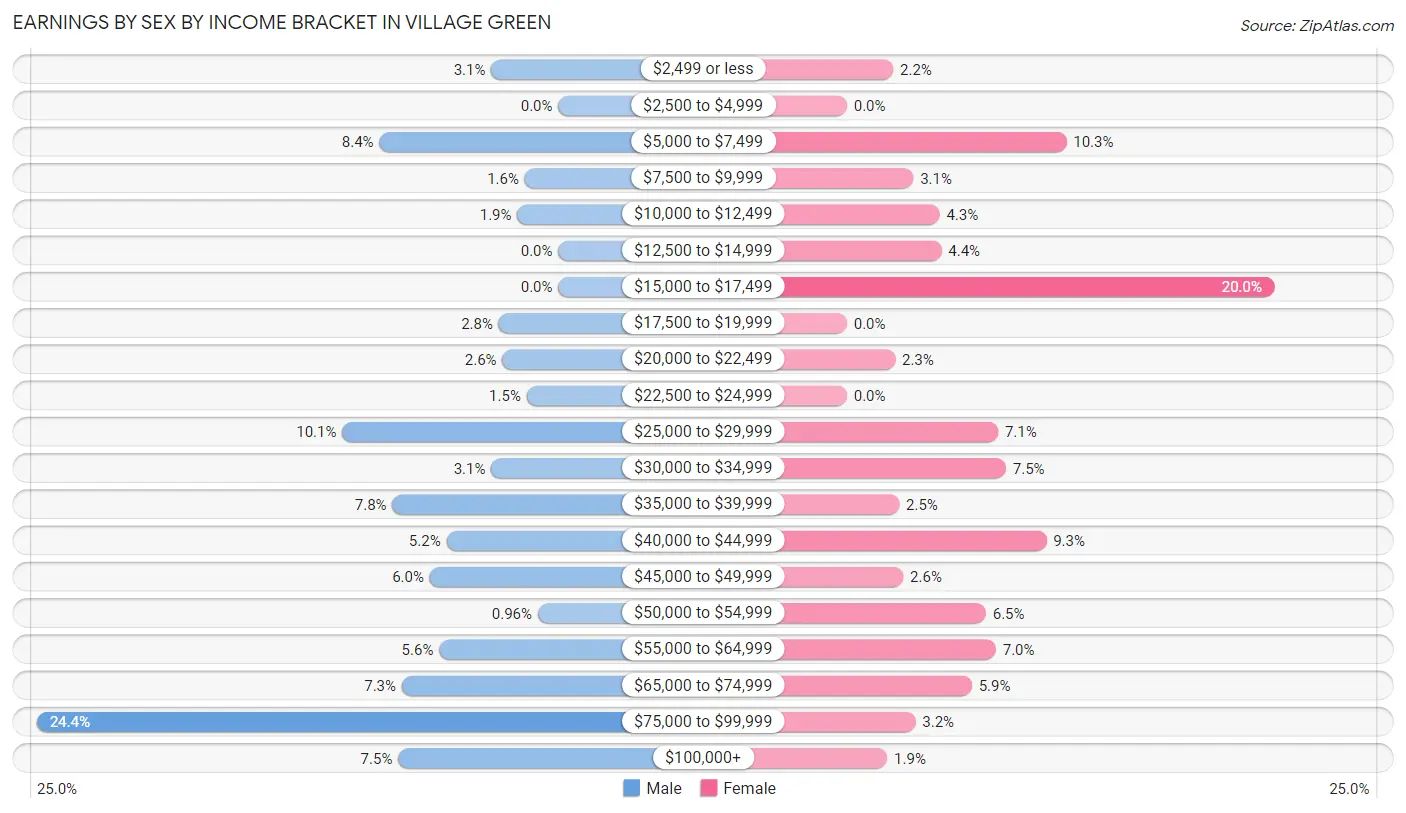
Earnings by Sex by Income Bracket in Village Green
The most common earnings brackets in Village Green are $75,000 to $99,999 for men (280 | 24.4%) and $15,000 to $17,499 for women (212 | 20.0%).
| Income | Male | Female |
| $2,499 or less | 36 (3.1%) | 23 (2.2%) |
| $2,500 to $4,999 | 0 (0.0%) | 0 (0.0%) |
| $5,000 to $7,499 | 96 (8.4%) | 109 (10.3%) |
| $7,500 to $9,999 | 18 (1.6%) | 33 (3.1%) |
| $10,000 to $12,499 | 22 (1.9%) | 46 (4.3%) |
| $12,500 to $14,999 | 0 (0.0%) | 47 (4.4%) |
| $15,000 to $17,499 | 0 (0.0%) | 212 (20.0%) |
| $17,500 to $19,999 | 32 (2.8%) | 0 (0.0%) |
| $20,000 to $22,499 | 30 (2.6%) | 24 (2.3%) |
| $22,500 to $24,999 | 17 (1.5%) | 0 (0.0%) |
| $25,000 to $29,999 | 116 (10.1%) | 75 (7.1%) |
| $30,000 to $34,999 | 36 (3.1%) | 79 (7.4%) |
| $35,000 to $39,999 | 89 (7.8%) | 26 (2.5%) |
| $40,000 to $44,999 | 60 (5.2%) | 99 (9.3%) |
| $45,000 to $49,999 | 69 (6.0%) | 28 (2.6%) |
| $50,000 to $54,999 | 11 (1.0%) | 69 (6.5%) |
| $55,000 to $64,999 | 64 (5.6%) | 74 (7.0%) |
| $65,000 to $74,999 | 84 (7.3%) | 62 (5.9%) |
| $75,000 to $99,999 | 280 (24.4%) | 34 (3.2%) |
| $100,000+ | 86 (7.5%) | 20 (1.9%) |
| Total | 1,146 (100.0%) | 1,060 (100.0%) |
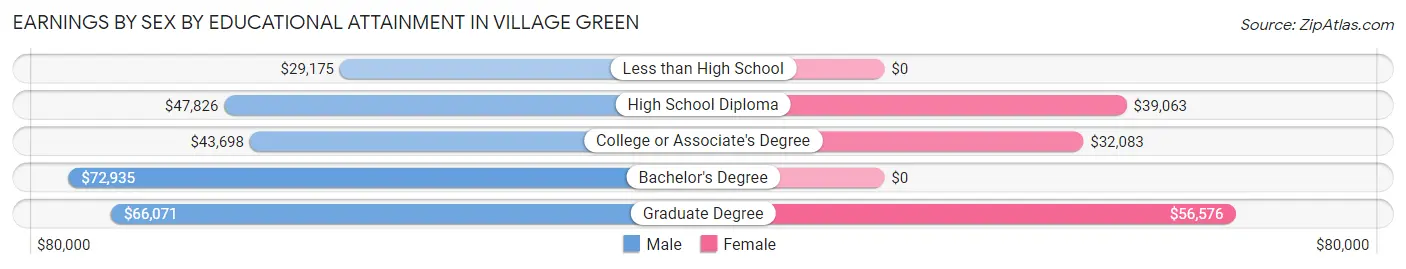
Earnings by Sex by Educational Attainment in Village Green
Average earnings in Village Green are $49,643 for men and $33,606 for women, a difference of 32.3%. Men with an educational attainment of bachelor's degree enjoy the highest average annual earnings of $72,935, while those with less than high school education earn the least with $29,175. Women with an educational attainment of graduate degree earn the most with the average annual earnings of $56,576, while those with college or associate's degree education have the smallest earnings of $32,083.
| Educational Attainment | Male Income | Female Income |
| Less than High School | $29,175 | $0 |
| High School Diploma | $47,826 | $39,063 |
| College or Associate's Degree | $43,698 | $32,083 |
| Bachelor's Degree | $72,935 | $0 |
| Graduate Degree | $66,071 | $56,576 |
| Total | $49,643 | $33,606 |
Family Income in Village Green
Family Income Brackets in Village Green
According to the Village Green family income data, there are 169 families falling into the $50,000 to $74,999 income range, which is the most common income bracket and makes up 20.8% of all families.
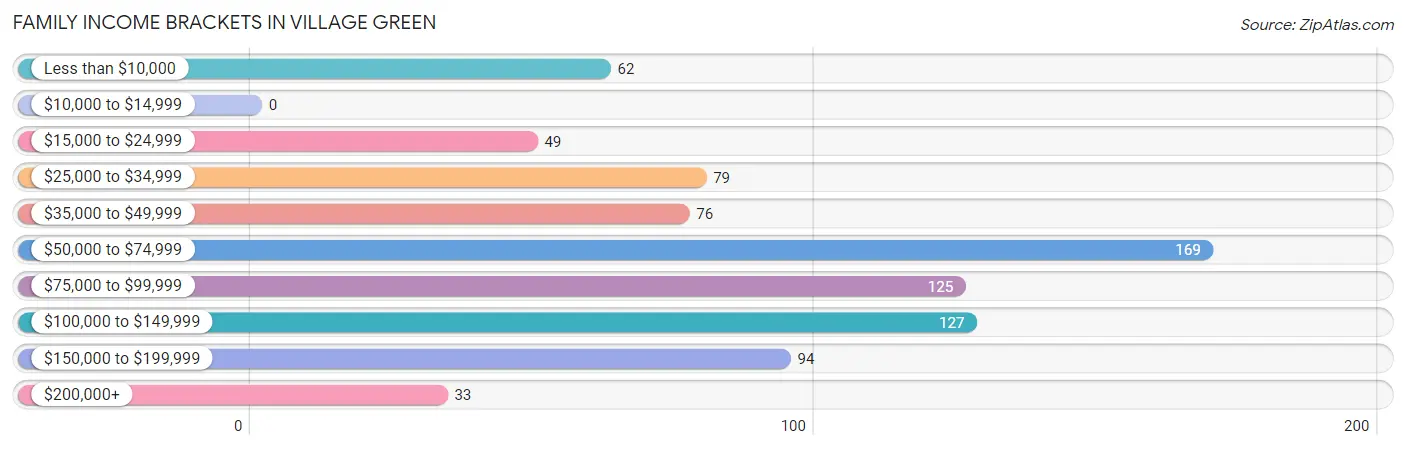
| Income Bracket | # Families | % Families |
| Less than $10,000 | 62 | 7.6% |
| $10,000 to $14,999 | 0 | 0.0% |
| $15,000 to $24,999 | 49 | 6.0% |
| $25,000 to $34,999 | 79 | 9.7% |
| $35,000 to $49,999 | 76 | 9.3% |
| $50,000 to $74,999 | 169 | 20.8% |
| $75,000 to $99,999 | 125 | 15.4% |
| $100,000 to $149,999 | 127 | 15.6% |
| $150,000 to $199,999 | 94 | 11.5% |
| $200,000+ | 33 | 4.1% |
Family Income by Famaliy Size in Village Green
4-person families (208 | 25.6%) account for the highest median family income in Village Green with $73,750 per family, while 2-person families (464 | 57.0%) have the highest median income of $33,409 per family member.
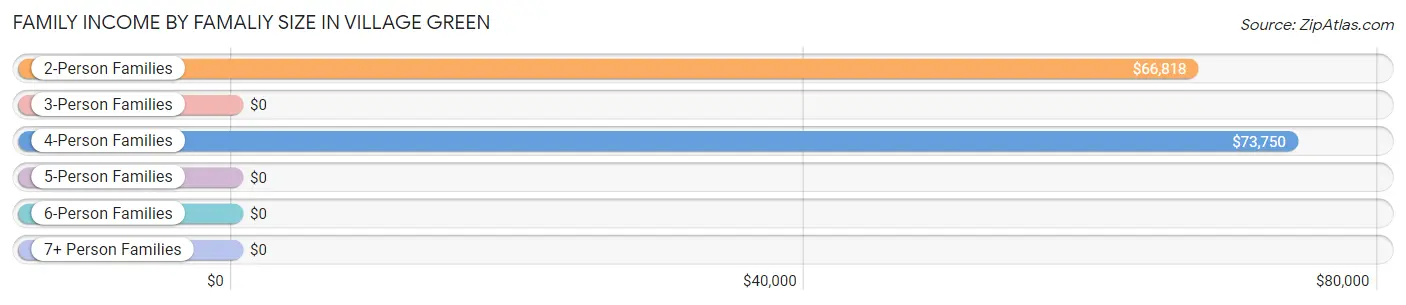
| Income Bracket | # Families | Median Income |
| 2-Person Families | 464 (57.0%) | $66,818 |
| 3-Person Families | 108 (13.3%) | $0 |
| 4-Person Families | 208 (25.6%) | $73,750 |
| 5-Person Families | 34 (4.2%) | $0 |
| 6-Person Families | 0 (0.0%) | $0 |
| 7+ Person Families | 0 (0.0%) | $0 |
| Total | 814 (100.0%) | $71,563 |
Family Income by Number of Earners in Village Green
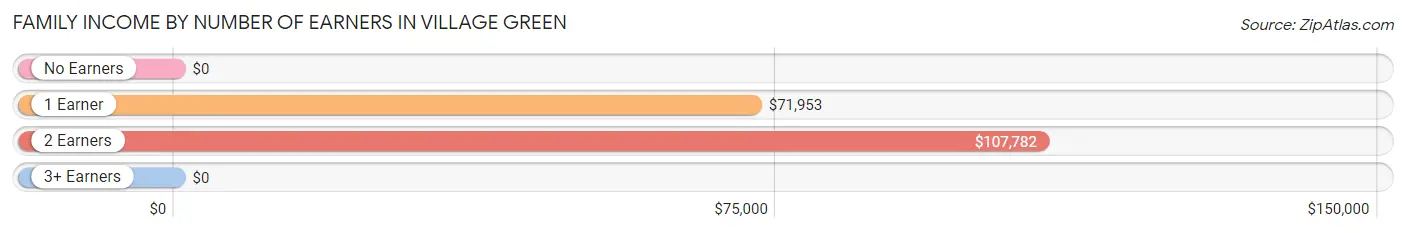
| Number of Earners | # Families | Median Income |
| No Earners | 167 (20.5%) | $0 |
| 1 Earner | 247 (30.3%) | $71,953 |
| 2 Earners | 359 (44.1%) | $107,782 |
| 3+ Earners | 41 (5.0%) | $0 |
| Total | 814 (100.0%) | $71,563 |
Household Income in Village Green
Household Income Brackets in Village Green
With 367 households falling in the category, the $50,000 to $74,999 income range is the most frequent in Village Green, accounting for 20.2% of all households.
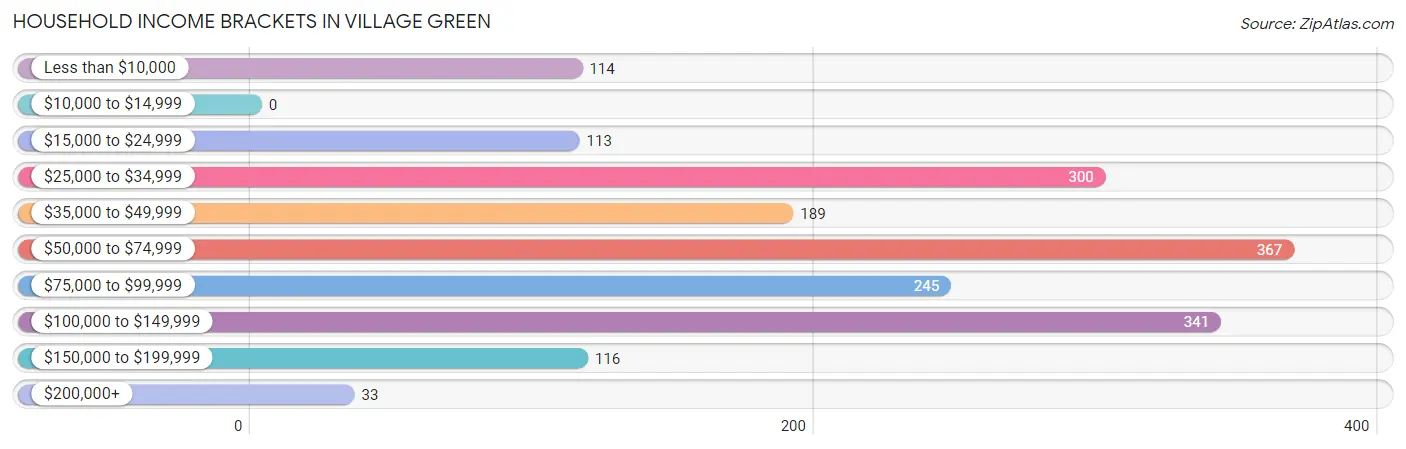
| Income Bracket | # Households | % Households |
| Less than $10,000 | 114 | 6.3% |
| $10,000 to $14,999 | 0 | 0.0% |
| $15,000 to $24,999 | 113 | 6.2% |
| $25,000 to $34,999 | 300 | 16.5% |
| $35,000 to $49,999 | 189 | 10.4% |
| $50,000 to $74,999 | 367 | 20.2% |
| $75,000 to $99,999 | 245 | 13.5% |
| $100,000 to $149,999 | 341 | 18.8% |
| $150,000 to $199,999 | 116 | 6.4% |
| $200,000+ | 33 | 1.8% |
Household Income by Householder Age in Village Green
The median household income in Village Green is $60,089, with the highest median household income of $82,561 found in the 65+ years age bracket for the primary householder. A total of 588 households (32.4%) fall into this category. Meanwhile, the 15 to 24 years age bracket for the primary householder has the lowest median household income of $0, with 96 households (5.3%) in this group.
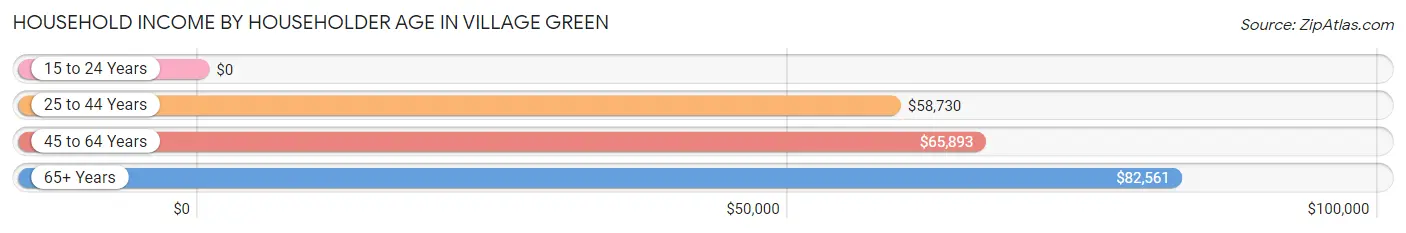
| Income Bracket | # Households | Median Income |
| 15 to 24 Years | 96 (5.3%) | $0 |
| 25 to 44 Years | 725 (39.9%) | $58,730 |
| 45 to 64 Years | 407 (22.4%) | $65,893 |
| 65+ Years | 588 (32.4%) | $82,561 |
| Total | 1,816 (100.0%) | $60,089 |
Poverty in Village Green
Income Below Poverty by Sex and Age in Village Green
With 5.8% poverty level for males and 15.5% for females among the residents of Village Green, under 5 year old males and 16 and 17 year old females are the most vulnerable to poverty, with 36 males (33.0%) and 22 females (100.0%) in their respective age groups living below the poverty level.
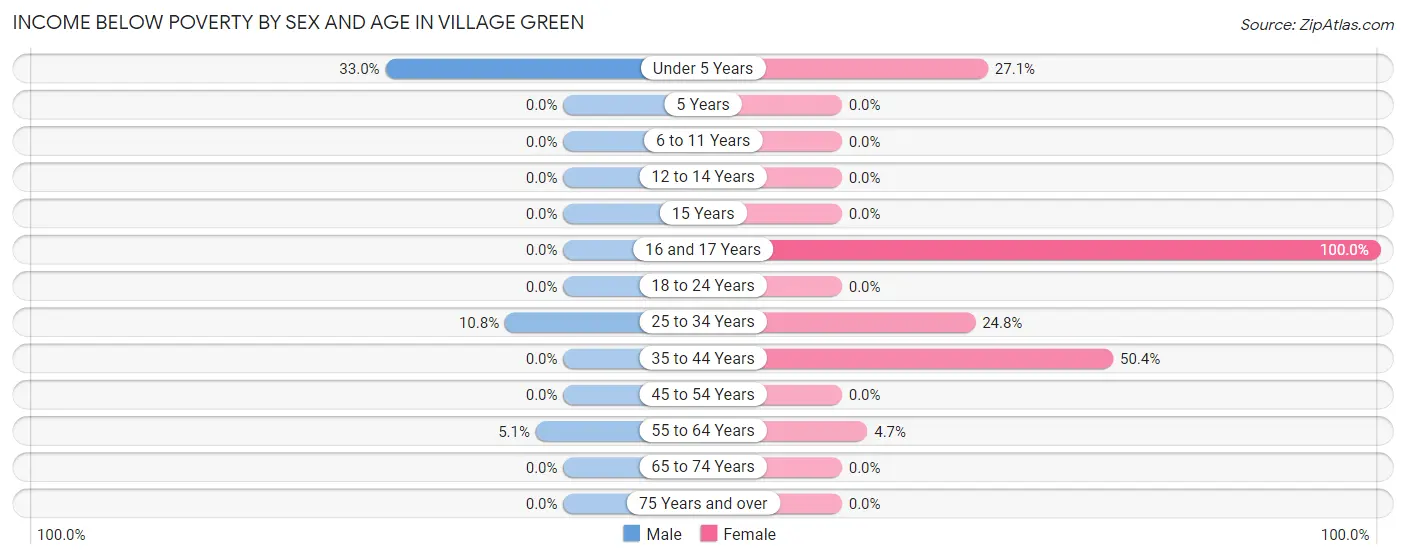
| Age Bracket | Male | Female |
| Under 5 Years | 36 (33.0%) | 48 (27.1%) |
| 5 Years | 0 (0.0%) | 0 (0.0%) |
| 6 to 11 Years | 0 (0.0%) | 0 (0.0%) |
| 12 to 14 Years | 0 (0.0%) | 0 (0.0%) |
| 15 Years | 0 (0.0%) | 0 (0.0%) |
| 16 and 17 Years | 0 (0.0%) | 22 (100.0%) |
| 18 to 24 Years | 0 (0.0%) | 0 (0.0%) |
| 25 to 34 Years | 55 (10.8%) | 77 (24.8%) |
| 35 to 44 Years | 0 (0.0%) | 144 (50.3%) |
| 45 to 54 Years | 0 (0.0%) | 0 (0.0%) |
| 55 to 64 Years | 13 (5.1%) | 13 (4.7%) |
| 65 to 74 Years | 0 (0.0%) | 0 (0.0%) |
| 75 Years and over | 0 (0.0%) | 0 (0.0%) |
| Total | 104 (5.8%) | 304 (15.5%) |
Income Above Poverty by Sex and Age in Village Green
According to the poverty statistics in Village Green, males aged 5 years and females aged 5 years are the age groups that are most secure financially, with 100.0% of males and 100.0% of females in these age groups living above the poverty line.
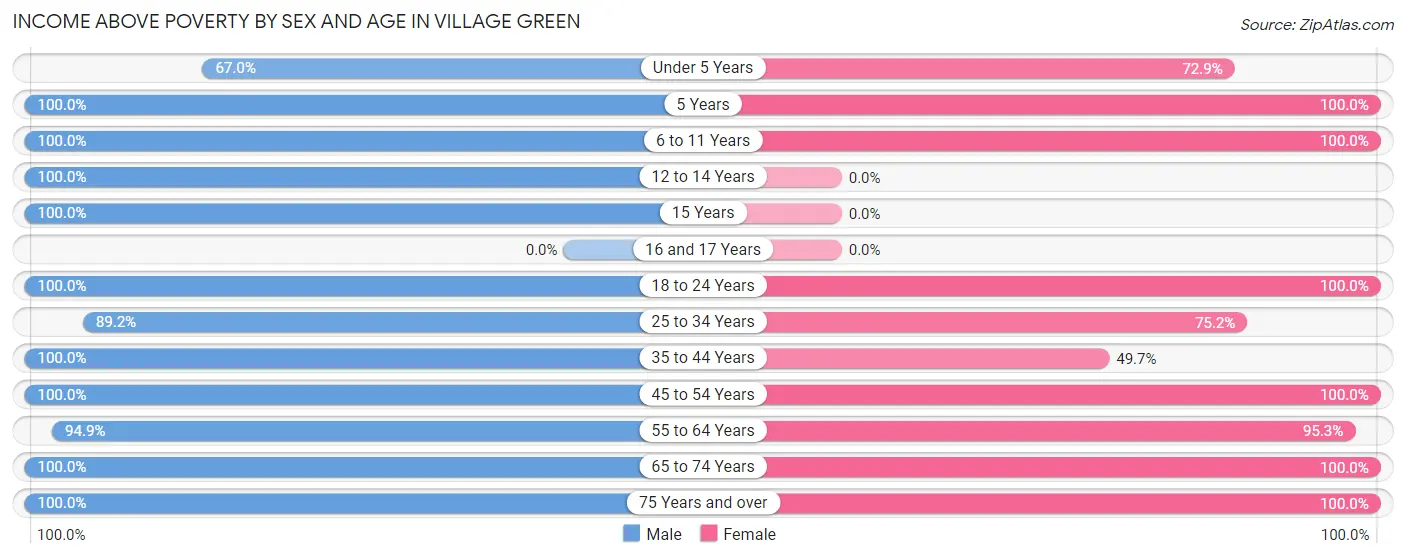
| Age Bracket | Male | Female |
| Under 5 Years | 73 (67.0%) | 129 (72.9%) |
| 5 Years | 21 (100.0%) | 21 (100.0%) |
| 6 to 11 Years | 129 (100.0%) | 149 (100.0%) |
| 12 to 14 Years | 72 (100.0%) | 0 (0.0%) |
| 15 Years | 15 (100.0%) | 0 (0.0%) |
| 16 and 17 Years | 0 (0.0%) | 0 (0.0%) |
| 18 to 24 Years | 110 (100.0%) | 188 (100.0%) |
| 25 to 34 Years | 453 (89.2%) | 234 (75.2%) |
| 35 to 44 Years | 118 (100.0%) | 142 (49.6%) |
| 45 to 54 Years | 149 (100.0%) | 130 (100.0%) |
| 55 to 64 Years | 241 (94.9%) | 262 (95.3%) |
| 65 to 74 Years | 236 (100.0%) | 182 (100.0%) |
| 75 Years and over | 63 (100.0%) | 222 (100.0%) |
| Total | 1,680 (94.2%) | 1,659 (84.5%) |
Income Below Poverty Among Married-Couple Families in Village Green
The poverty statistics for married-couple families in Village Green show that 2.7% or 13 of the total 487 families live below the poverty line. Families with no children have the highest poverty rate of 4.3%, comprising of 13 families. On the other hand, families with 1 or 2 children have the lowest poverty rate of 0.0%, which includes 0 families.
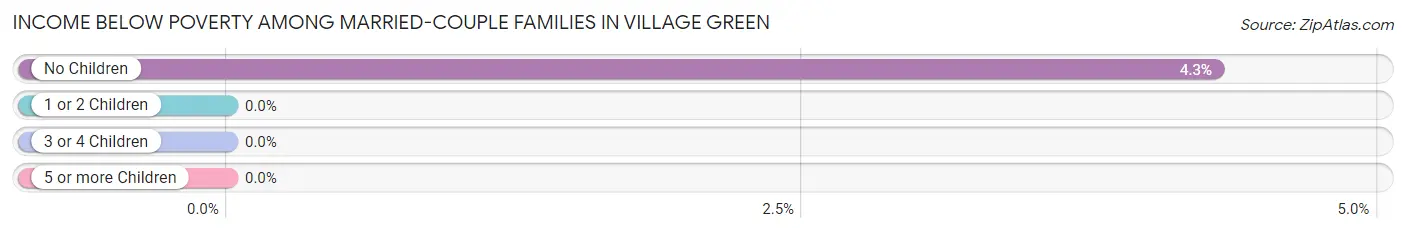
| Children | Above Poverty | Below Poverty |
| No Children | 290 (95.7%) | 13 (4.3%) |
| 1 or 2 Children | 171 (100.0%) | 0 (0.0%) |
| 3 or 4 Children | 13 (100.0%) | 0 (0.0%) |
| 5 or more Children | 0 (0.0%) | 0 (0.0%) |
| Total | 474 (97.3%) | 13 (2.7%) |
Income Below Poverty Among Single-Parent Households in Village Green
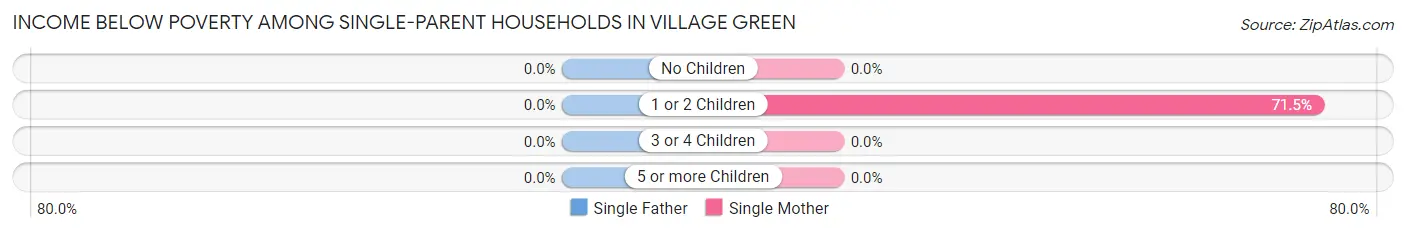
| Children | Single Father | Single Mother |
| No Children | 0 (0.0%) | 0 (0.0%) |
| 1 or 2 Children | 0 (0.0%) | 98 (71.5%) |
| 3 or 4 Children | 0 (0.0%) | 0 (0.0%) |
| 5 or more Children | 0 (0.0%) | 0 (0.0%) |
| Total | 0 (0.0%) | 98 (37.4%) |
Income Below Poverty Among Married-Couple vs Single-Parent Households in Village Green
The poverty data for Village Green shows that 13 of the married-couple family households (2.7%) and 98 of the single-parent households (30.0%) are living below the poverty level. Within the married-couple family households, those with no children have the highest poverty rate, with 13 households (4.3%) falling below the poverty line. Among the single-parent households, those with 1 or 2 children have the highest poverty rate, with 98 household (62.0%) living below poverty.
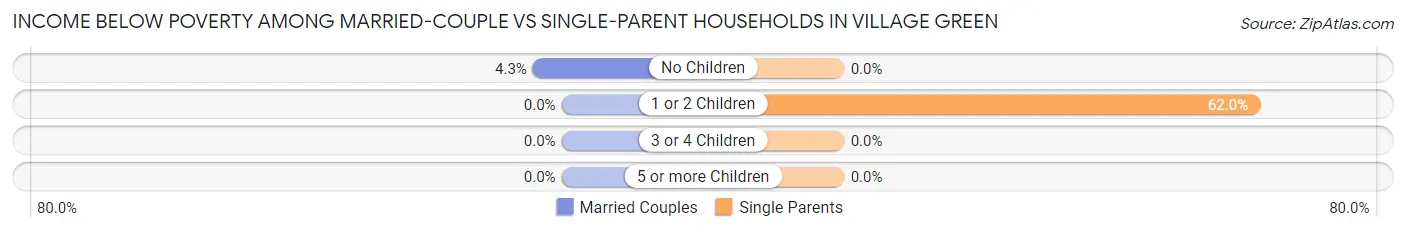
| Children | Married-Couple Families | Single-Parent Households |
| No Children | 13 (4.3%) | 0 (0.0%) |
| 1 or 2 Children | 0 (0.0%) | 98 (62.0%) |
| 3 or 4 Children | 0 (0.0%) | 0 (0.0%) |
| 5 or more Children | 0 (0.0%) | 0 (0.0%) |
| Total | 13 (2.7%) | 98 (30.0%) |
Race in Village Green
The most populous races in Village Green are White / Caucasian (3,261 | 87.0%), Hispanic or Latino (305 | 8.1%), and Native / Alaskan (188 | 5.0%).
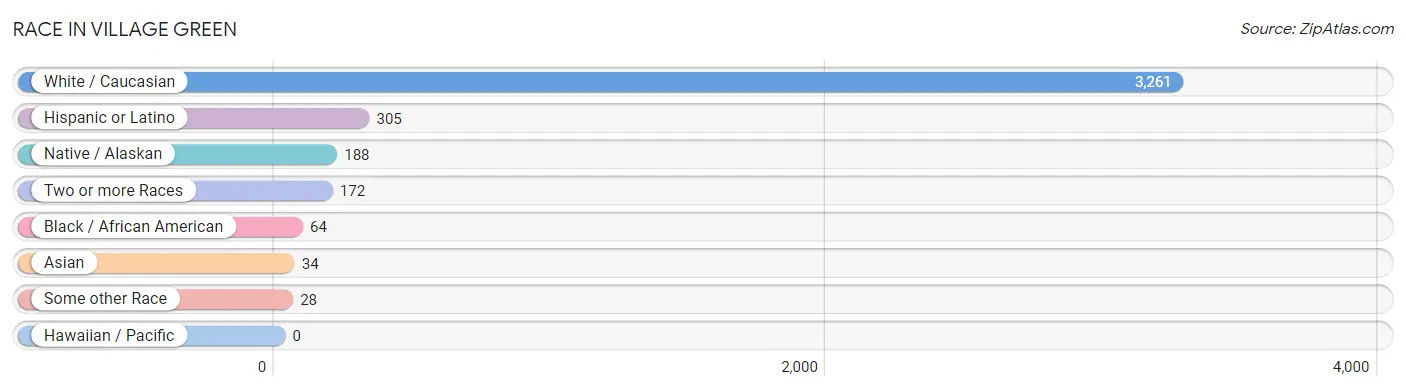
| Race | # Population | % Population |
| Asian | 34 | 0.9% |
| Black / African American | 64 | 1.7% |
| Hawaiian / Pacific | 0 | 0.0% |
| Hispanic or Latino | 305 | 8.1% |
| Native / Alaskan | 188 | 5.0% |
| White / Caucasian | 3,261 | 87.0% |
| Two or more Races | 172 | 4.6% |
| Some other Race | 28 | 0.7% |
| Total | 3,747 | 100.0% |
Ancestry in Village Green
The most populous ancestries reported in Village Green are Irish (1,049 | 28.0%), Italian (641 | 17.1%), German (503 | 13.4%), English (428 | 11.4%), and French (301 | 8.0%), together accounting for 78.0% of all Village Green residents.
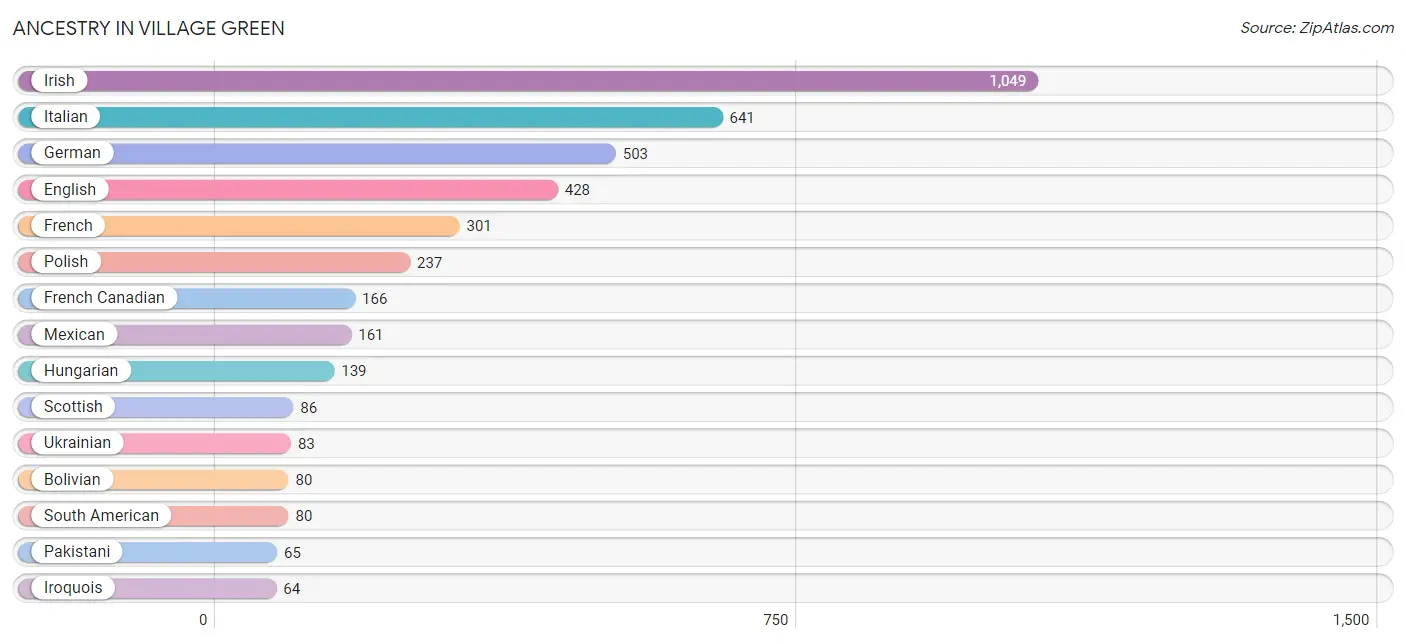
| Ancestry | # Population | % Population |
| American | 39 | 1.0% |
| Arab | 18 | 0.5% |
| Bangladeshi | 61 | 1.6% |
| Bolivian | 80 | 2.1% |
| British | 33 | 0.9% |
| Czech | 15 | 0.4% |
| English | 428 | 11.4% |
| European | 45 | 1.2% |
| Filipino | 11 | 0.3% |
| French | 301 | 8.0% |
| French Canadian | 166 | 4.4% |
| German | 503 | 13.4% |
| Hungarian | 139 | 3.7% |
| Irish | 1,049 | 28.0% |
| Iroquois | 64 | 1.7% |
| Italian | 641 | 17.1% |
| Lebanese | 18 | 0.5% |
| Lithuanian | 21 | 0.6% |
| Mexican | 161 | 4.3% |
| Pakistani | 65 | 1.7% |
| Pennsylvania German | 33 | 0.9% |
| Polish | 237 | 6.3% |
| Puerto Rican | 64 | 1.7% |
| Scotch-Irish | 35 | 0.9% |
| Scottish | 86 | 2.3% |
| South American | 80 | 2.1% |
| Swedish | 34 | 0.9% |
| Swiss | 25 | 0.7% |
| Ukrainian | 83 | 2.2% |
| Welsh | 55 | 1.5% | View All 30 Rows |
Immigrants in Village Green
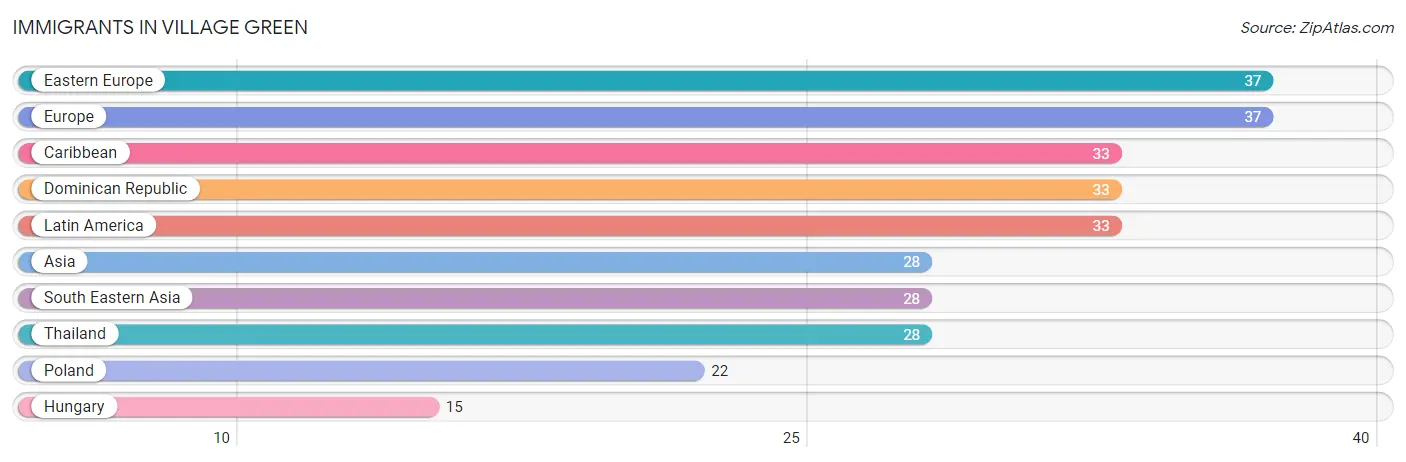
The most numerous immigrant groups reported in Village Green came from Eastern Europe (37 | 1.0%), Europe (37 | 1.0%), Caribbean (33 | 0.9%), Dominican Republic (33 | 0.9%), and Latin America (33 | 0.9%), together accounting for 4.6% of all Village Green residents.
| Immigration Origin | # Population | % Population |
| Asia | 28 | 0.7% |
| Caribbean | 33 | 0.9% |
| Dominican Republic | 33 | 0.9% |
| Eastern Europe | 37 | 1.0% |
| Europe | 37 | 1.0% |
| Hungary | 15 | 0.4% |
| Latin America | 33 | 0.9% |
| Poland | 22 | 0.6% |
| South Eastern Asia | 28 | 0.7% |
| Thailand | 28 | 0.7% | View All 10 Rows |
Sex and Age in Village Green
Sex and Age in Village Green
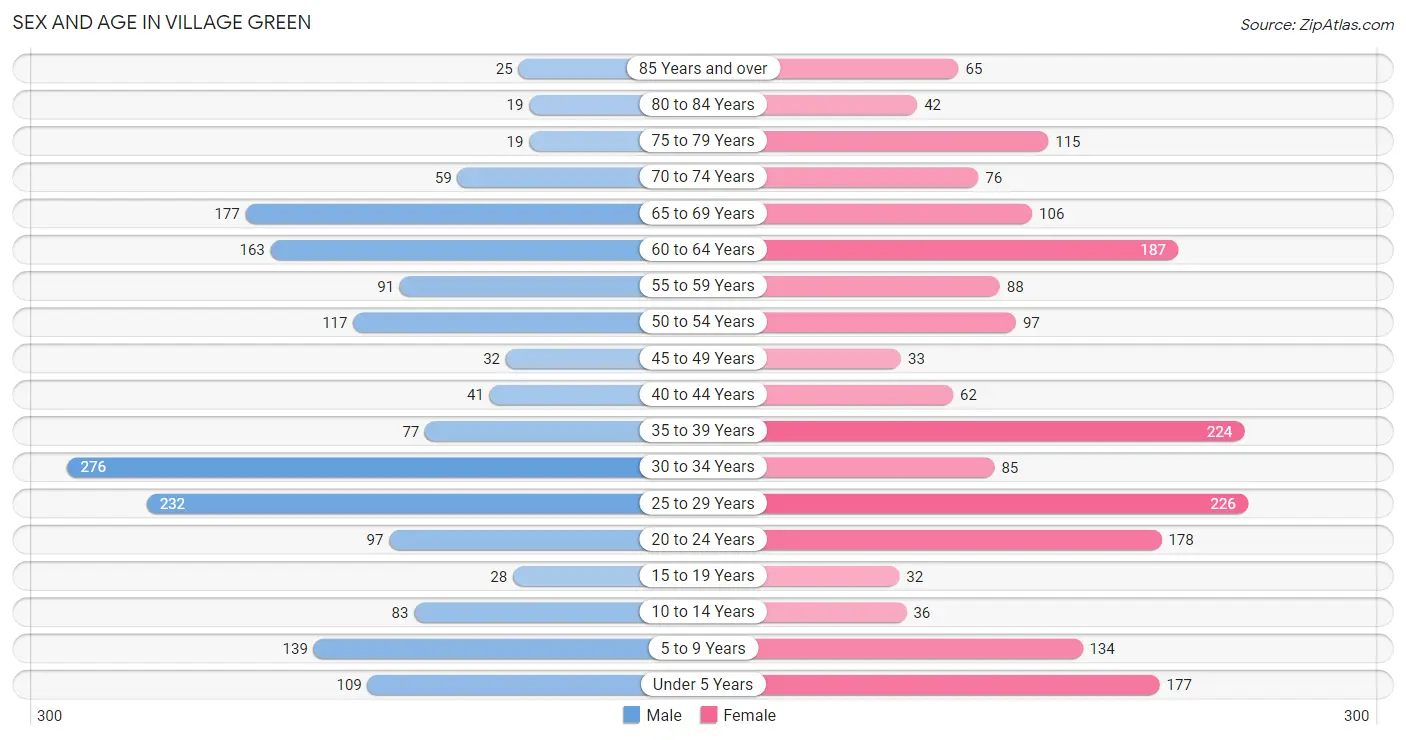
The most populous age groups in Village Green are 30 to 34 Years (276 | 15.5%) for men and 25 to 29 Years (226 | 11.5%) for women.
| Age Bracket | Male | Female |
| Under 5 Years | 109 (6.1%) | 177 (9.0%) |
| 5 to 9 Years | 139 (7.8%) | 134 (6.8%) |
| 10 to 14 Years | 83 (4.6%) | 36 (1.8%) |
| 15 to 19 Years | 28 (1.6%) | 32 (1.6%) |
| 20 to 24 Years | 97 (5.4%) | 178 (9.1%) |
| 25 to 29 Years | 232 (13.0%) | 226 (11.5%) |
| 30 to 34 Years | 276 (15.5%) | 85 (4.3%) |
| 35 to 39 Years | 77 (4.3%) | 224 (11.4%) |
| 40 to 44 Years | 41 (2.3%) | 62 (3.2%) |
| 45 to 49 Years | 32 (1.8%) | 33 (1.7%) |
| 50 to 54 Years | 117 (6.6%) | 97 (4.9%) |
| 55 to 59 Years | 91 (5.1%) | 88 (4.5%) |
| 60 to 64 Years | 163 (9.1%) | 187 (9.5%) |
| 65 to 69 Years | 177 (9.9%) | 106 (5.4%) |
| 70 to 74 Years | 59 (3.3%) | 76 (3.9%) |
| 75 to 79 Years | 19 (1.1%) | 115 (5.9%) |
| 80 to 84 Years | 19 (1.1%) | 42 (2.1%) |
| 85 Years and over | 25 (1.4%) | 65 (3.3%) |
| Total | 1,784 (100.0%) | 1,963 (100.0%) |
Families and Households in Village Green
Median Family Size in Village Green
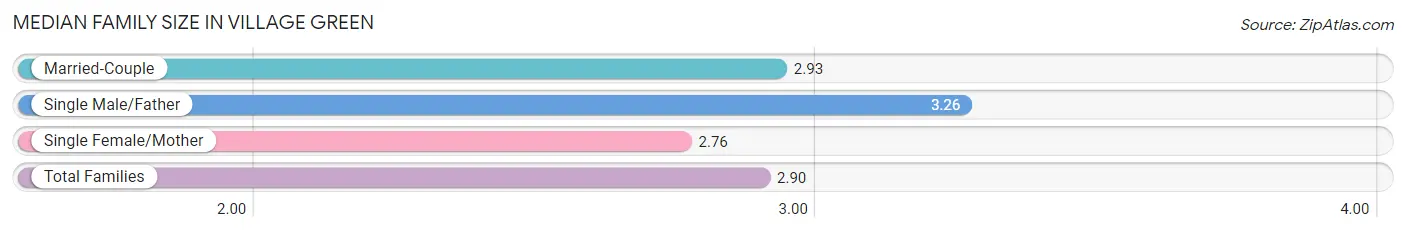
The median family size in Village Green is 2.90 persons per family, with single male/father families (65 | 8.0%) accounting for the largest median family size of 3.26 persons per family. On the other hand, single female/mother families (262 | 32.2%) represent the smallest median family size with 2.76 persons per family.
| Family Type | # Families | Family Size |
| Married-Couple | 487 (59.8%) | 2.93 |
| Single Male/Father | 65 (8.0%) | 3.26 |
| Single Female/Mother | 262 (32.2%) | 2.76 |
| Total Families | 814 (100.0%) | 2.90 |
Median Household Size in Village Green
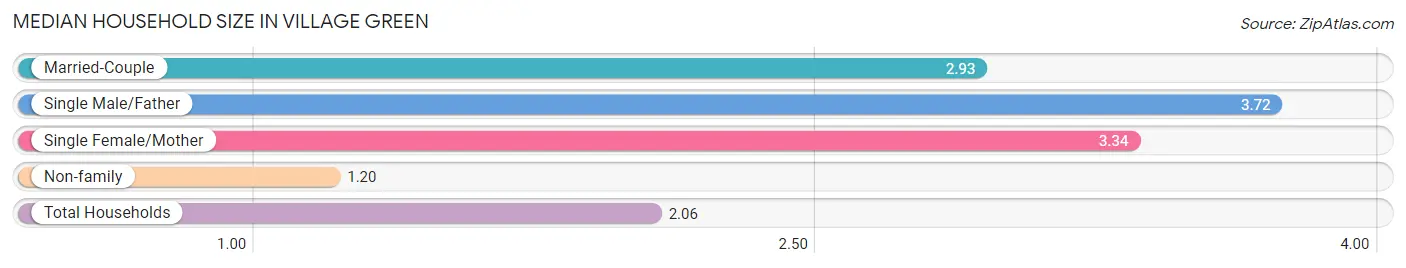
The median household size in Village Green is 2.06 persons per household, with single male/father households (65 | 3.6%) accounting for the largest median household size of 3.72 persons per household. non-family households (1,002 | 55.2%) represent the smallest median household size with 1.20 persons per household.
| Household Type | # Households | Household Size |
| Married-Couple | 487 (26.8%) | 2.93 |
| Single Male/Father | 65 (3.6%) | 3.72 |
| Single Female/Mother | 262 (14.4%) | 3.34 |
| Non-family | 1,002 (55.2%) | 1.20 |
| Total Households | 1,816 (100.0%) | 2.06 |
Household Size by Marriage Status in Village Green
Out of a total of 1,816 households in Village Green, 814 (44.8%) are family households, while 1,002 (55.2%) are nonfamily households. The most numerous type of family households are 2-person households, comprising 387, and the most common type of nonfamily households are 1-person households, comprising 819.
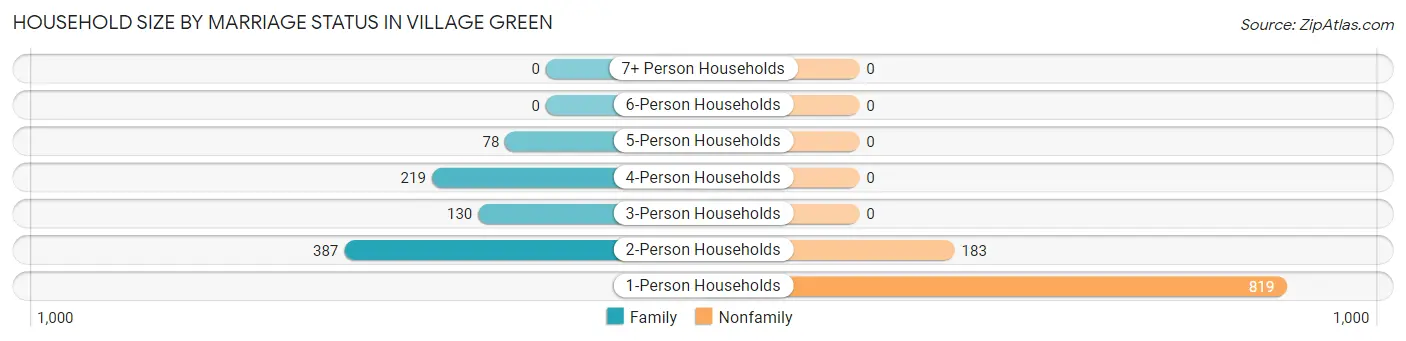
| Household Size | Family Households | Nonfamily Households |
| 1-Person Households | - | 819 (45.1%) |
| 2-Person Households | 387 (21.3%) | 183 (10.1%) |
| 3-Person Households | 130 (7.2%) | 0 (0.0%) |
| 4-Person Households | 219 (12.1%) | 0 (0.0%) |
| 5-Person Households | 78 (4.3%) | 0 (0.0%) |
| 6-Person Households | 0 (0.0%) | 0 (0.0%) |
| 7+ Person Households | 0 (0.0%) | 0 (0.0%) |
| Total | 814 (44.8%) | 1,002 (55.2%) |
Female Fertility in Village Green
Fertility by Age in Village Green
Average fertility rate in Village Green is 21.0 births per 1,000 women. Women in the age bracket of 35 to 50 years have the highest fertility rate with 51.0 births per 1,000 women. Women in the age bracket of 35 to 50 years acount for 100.0% of all women with births.
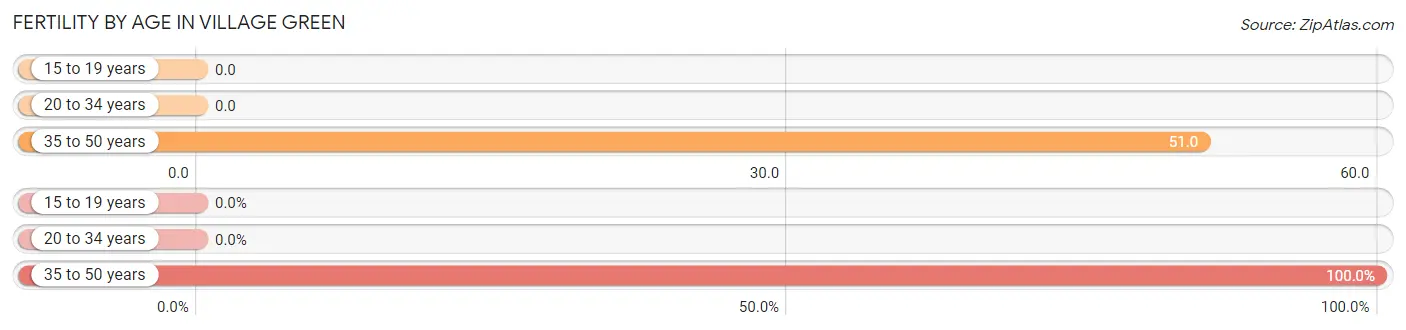
| Age Bracket | Women with Births | Births / 1,000 Women |
| 15 to 19 years | 0 (0.0%) | 0.0 |
| 20 to 34 years | 0 (0.0%) | 0.0 |
| 35 to 50 years | 18 (100.0%) | 51.0 |
| Total | 18 (100.0%) | 21.0 |
Fertility by Age by Marriage Status in Village Green

| Age Bracket | Married | Unmarried |
| 15 to 19 years | 0 (0.0%) | 0 (0.0%) |
| 20 to 34 years | 0 (0.0%) | 0 (0.0%) |
| 35 to 50 years | 18 (100.0%) | 0 (0.0%) |
| Total | 18 (100.0%) | 0 (0.0%) |
Fertility by Education in Village Green
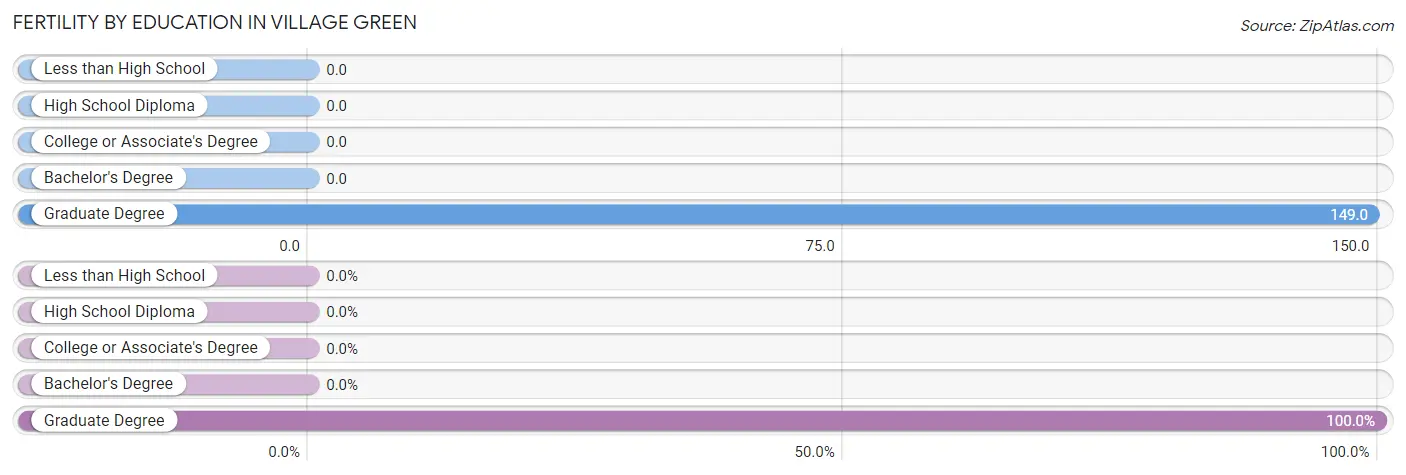
| Educational Attainment | Women with Births | Births / 1,000 Women |
| Less than High School | 0 (0.0%) | 0.0 |
| High School Diploma | 0 (0.0%) | 0.0 |
| College or Associate's Degree | 0 (0.0%) | 0.0 |
| Bachelor's Degree | 0 (0.0%) | 0.0 |
| Graduate Degree | 18 (100.0%) | 149.0 |
| Total | 18 (100.0%) | 21.0 |
Fertility by Education by Marriage Status in Village Green
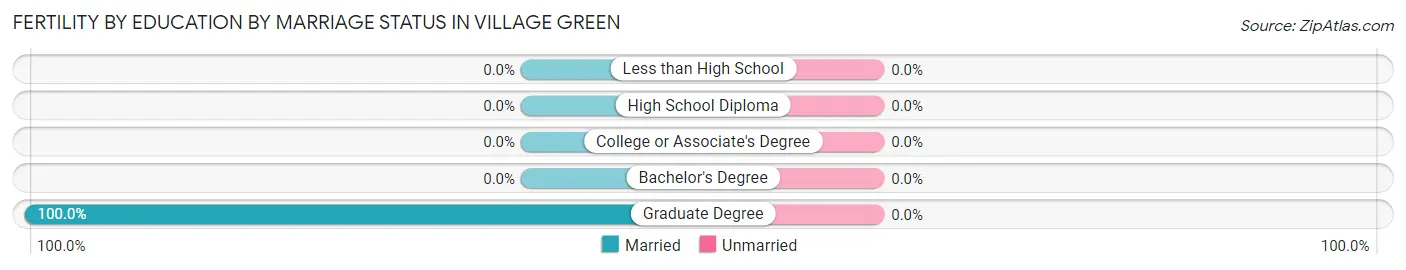
| Educational Attainment | Married | Unmarried |
| Less than High School | 0 (0.0%) | 0 (0.0%) |
| High School Diploma | 0 (0.0%) | 0 (0.0%) |
| College or Associate's Degree | 0 (0.0%) | 0 (0.0%) |
| Bachelor's Degree | 0 (0.0%) | 0 (0.0%) |
| Graduate Degree | 18 (100.0%) | 0 (0.0%) |
| Total | 18 (100.0%) | 0 (0.0%) |
Employment Characteristics in Village Green
Employment by Class of Employer in Village Green
Among the 1,888 employed individuals in Village Green, private company employees (1,425 | 75.5%), not-for-profit organizations (154 | 8.2%), and local government employees (126 | 6.7%) make up the most common classes of employment.
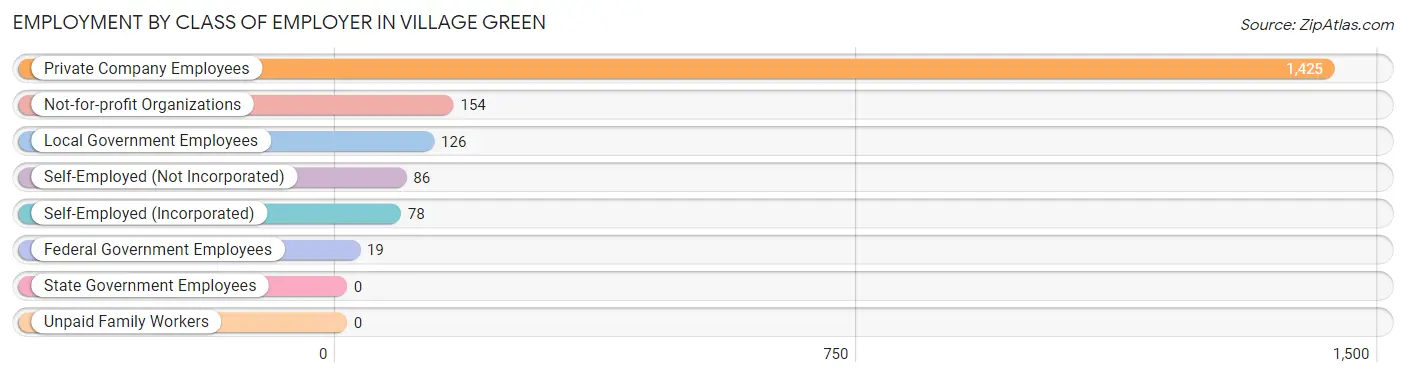
| Employer Class | # Employees | % Employees |
| Private Company Employees | 1,425 | 75.5% |
| Self-Employed (Incorporated) | 78 | 4.1% |
| Self-Employed (Not Incorporated) | 86 | 4.6% |
| Not-for-profit Organizations | 154 | 8.2% |
| Local Government Employees | 126 | 6.7% |
| State Government Employees | 0 | 0.0% |
| Federal Government Employees | 19 | 1.0% |
| Unpaid Family Workers | 0 | 0.0% |
| Total | 1,888 | 100.0% |
Employment Status by Age in Village Green
According to the labor force statistics for Village Green, out of the total population over 16 years of age (3,054), 68.3% or 2,086 individuals are in the labor force, with 5.8% or 121 of them unemployed. The age group with the highest labor force participation rate is 20 to 24 years, with 90.5% or 249 individuals in the labor force. Within the labor force, the 55 to 59 years age range has the highest percentage of unemployed individuals, with 23.3% or 28 of them being unemployed.
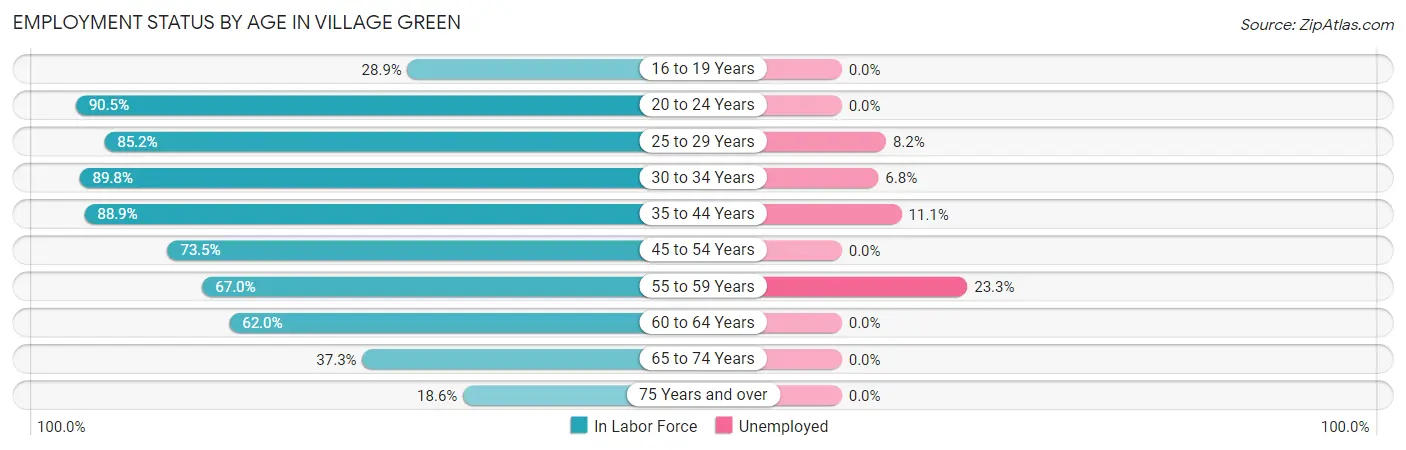
| Age Bracket | In Labor Force | Unemployed |
| 16 to 19 Years | 13 (28.9%) | 0 (0.0%) |
| 20 to 24 Years | 249 (90.5%) | 0 (0.0%) |
| 25 to 29 Years | 390 (85.2%) | 32 (8.2%) |
| 30 to 34 Years | 324 (89.8%) | 22 (6.8%) |
| 35 to 44 Years | 359 (88.9%) | 40 (11.1%) |
| 45 to 54 Years | 205 (73.5%) | 0 (0.0%) |
| 55 to 59 Years | 120 (67.0%) | 28 (23.3%) |
| 60 to 64 Years | 217 (62.0%) | 0 (0.0%) |
| 65 to 74 Years | 156 (37.3%) | 0 (0.0%) |
| 75 Years and over | 53 (18.6%) | 0 (0.0%) |
| Total | 2,086 (68.3%) | 121 (5.8%) |
Employment Status by Educational Attainment in Village Green
According to labor force statistics for Village Green, 79.5% of individuals (1,615) out of the total population between 25 and 64 years of age (2,031) are in the labor force, with 7.6% or 123 of them being unemployed. The group with the highest labor force participation rate are those with the educational attainment of bachelor's degree or higher, with 88.6% or 553 individuals in the labor force. Within the labor force, individuals with college / associate degree education have the highest percentage of unemployment, with 10.9% or 54 of them being unemployed.
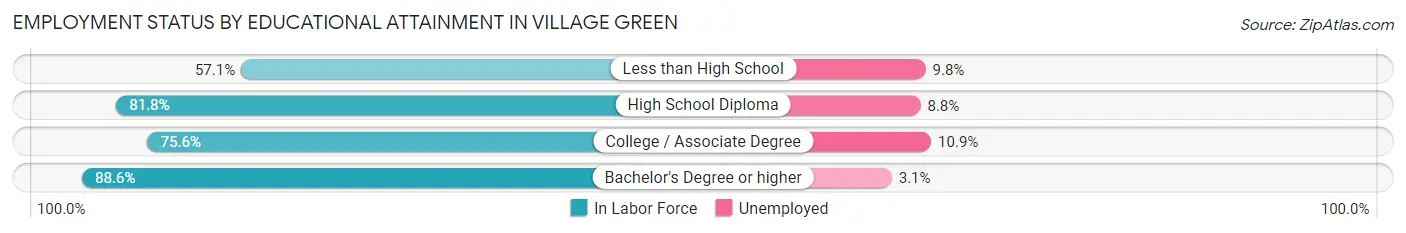
| Educational Attainment | In Labor Force | Unemployed |
| Less than High School | 112 (57.1%) | 19 (9.8%) |
| High School Diploma | 454 (81.8%) | 49 (8.8%) |
| College / Associate Degree | 496 (75.6%) | 72 (10.9%) |
| Bachelor's Degree or higher | 553 (88.6%) | 19 (3.1%) |
| Total | 1,615 (79.5%) | 154 (7.6%) |
Employment Occupations by Sex in Village Green
Management, Business, Science and Arts Occupations
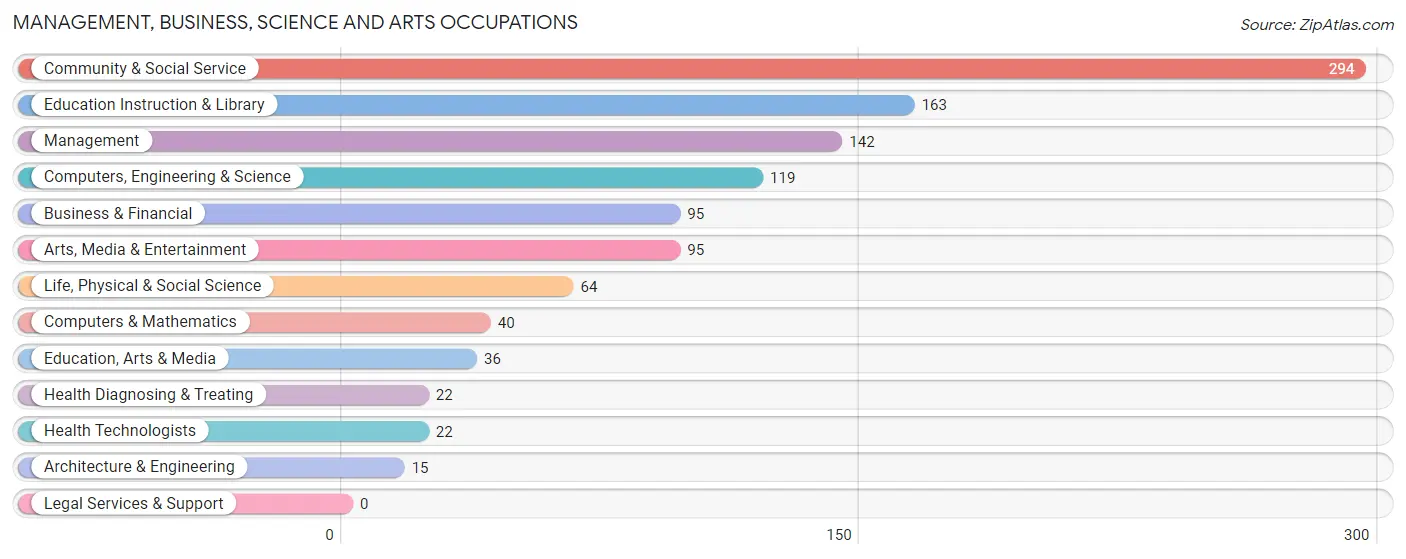
The most common Management, Business, Science and Arts occupations in Village Green are Community & Social Service (294 | 15.0%), Education Instruction & Library (163 | 8.3%), Management (142 | 7.2%), Computers, Engineering & Science (119 | 6.1%), and Business & Financial (95 | 4.8%).
Management, Business, Science and Arts Occupations by Sex
Within the Management, Business, Science and Arts occupations in Village Green, the most male-oriented occupations are Computers, Engineering & Science (100.0%), Computers & Mathematics (100.0%), and Architecture & Engineering (100.0%), while the most female-oriented occupations are Education, Arts & Media (100.0%), Arts, Media & Entertainment (100.0%), and Health Diagnosing & Treating (100.0%).
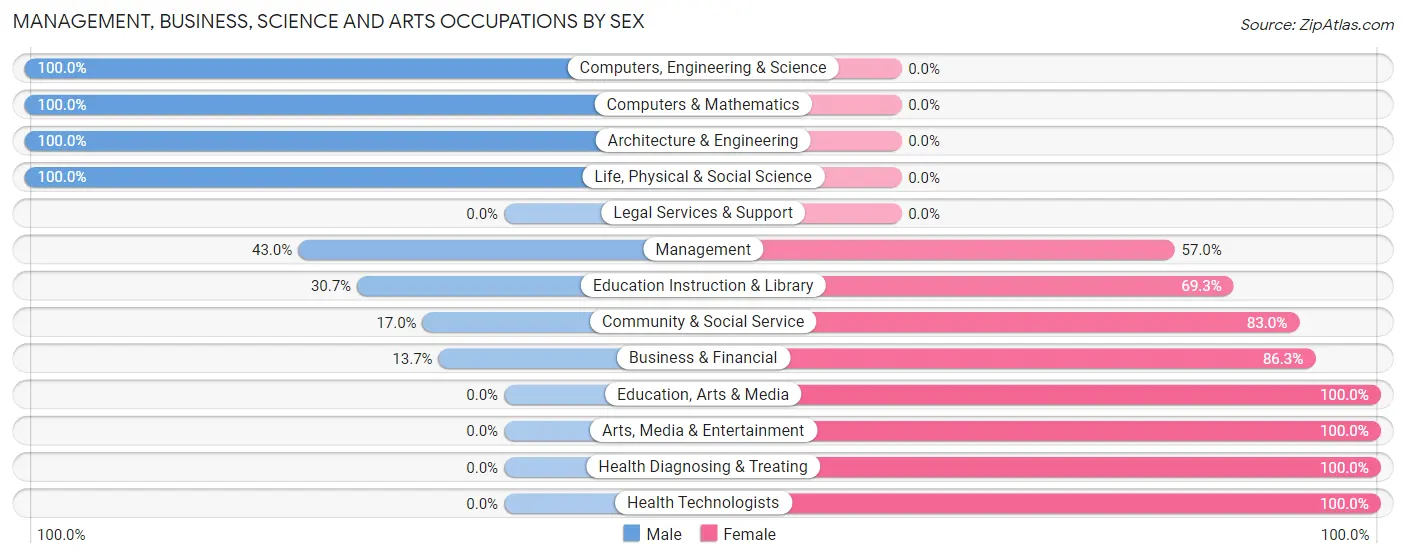
| Occupation | Male | Female |
| Management | 61 (43.0%) | 81 (57.0%) |
| Business & Financial | 13 (13.7%) | 82 (86.3%) |
| Computers, Engineering & Science | 119 (100.0%) | 0 (0.0%) |
| Computers & Mathematics | 40 (100.0%) | 0 (0.0%) |
| Architecture & Engineering | 15 (100.0%) | 0 (0.0%) |
| Life, Physical & Social Science | 64 (100.0%) | 0 (0.0%) |
| Community & Social Service | 50 (17.0%) | 244 (83.0%) |
| Education, Arts & Media | 0 (0.0%) | 36 (100.0%) |
| Legal Services & Support | 0 (0.0%) | 0 (0.0%) |
| Education Instruction & Library | 50 (30.7%) | 113 (69.3%) |
| Arts, Media & Entertainment | 0 (0.0%) | 95 (100.0%) |
| Health Diagnosing & Treating | 0 (0.0%) | 22 (100.0%) |
| Health Technologists | 0 (0.0%) | 22 (100.0%) |
| Total (Category) | 243 (36.2%) | 429 (63.8%) |
| Total (Overall) | 967 (49.2%) | 997 (50.8%) |
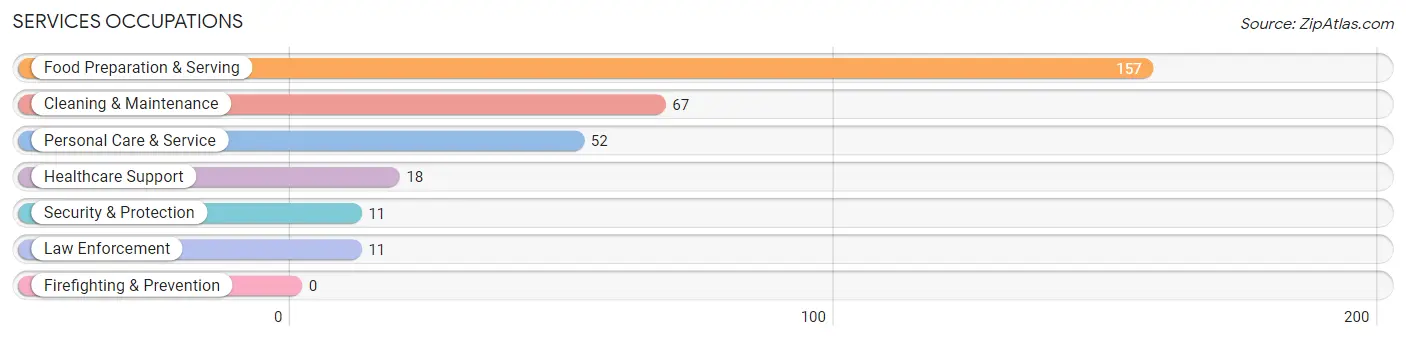
Services Occupations
The most common Services occupations in Village Green are Food Preparation & Serving (157 | 8.0%), Cleaning & Maintenance (67 | 3.4%), Personal Care & Service (52 | 2.6%), Healthcare Support (18 | 0.9%), and Security & Protection (11 | 0.6%).
Services Occupations by Sex
Within the Services occupations in Village Green, the most male-oriented occupations are Security & Protection (100.0%), Law Enforcement (100.0%), and Cleaning & Maintenance (50.7%), while the most female-oriented occupations are Healthcare Support (100.0%), Food Preparation & Serving (56.7%), and Personal Care & Service (53.8%).
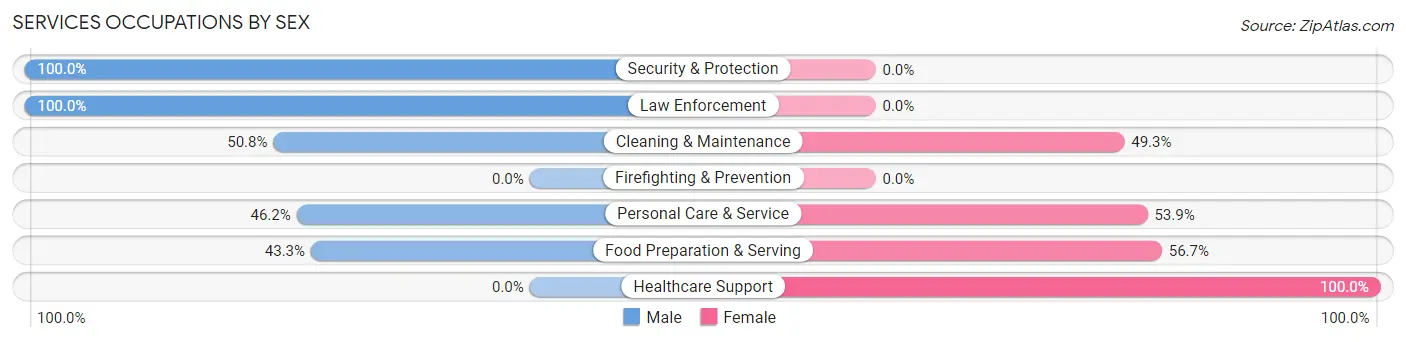
| Occupation | Male | Female |
| Healthcare Support | 0 (0.0%) | 18 (100.0%) |
| Security & Protection | 11 (100.0%) | 0 (0.0%) |
| Firefighting & Prevention | 0 (0.0%) | 0 (0.0%) |
| Law Enforcement | 11 (100.0%) | 0 (0.0%) |
| Food Preparation & Serving | 68 (43.3%) | 89 (56.7%) |
| Cleaning & Maintenance | 34 (50.7%) | 33 (49.2%) |
| Personal Care & Service | 24 (46.2%) | 28 (53.8%) |
| Total (Category) | 137 (44.9%) | 168 (55.1%) |
| Total (Overall) | 967 (49.2%) | 997 (50.8%) |
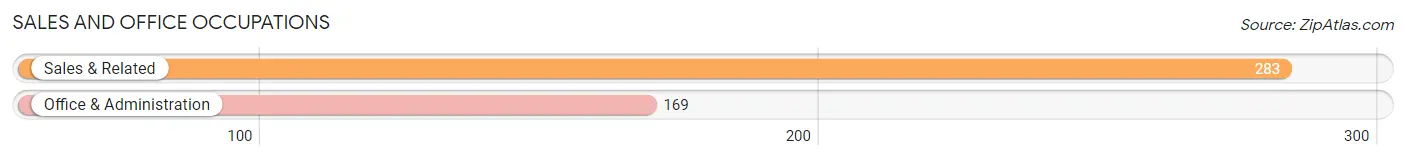
Sales and Office Occupations
The most common Sales and Office occupations in Village Green are Sales & Related (283 | 14.4%), and Office & Administration (169 | 8.6%).
Sales and Office Occupations by Sex

| Occupation | Male | Female |
| Sales & Related | 37 (13.1%) | 246 (86.9%) |
| Office & Administration | 101 (59.8%) | 68 (40.2%) |
| Total (Category) | 138 (30.5%) | 314 (69.5%) |
| Total (Overall) | 967 (49.2%) | 997 (50.8%) |
Natural Resources, Construction and Maintenance Occupations
The most common Natural Resources, Construction and Maintenance occupations in Village Green are Installation, Maintenance & Repair (202 | 10.3%), and Construction & Extraction (21 | 1.1%).

Natural Resources, Construction and Maintenance Occupations by Sex
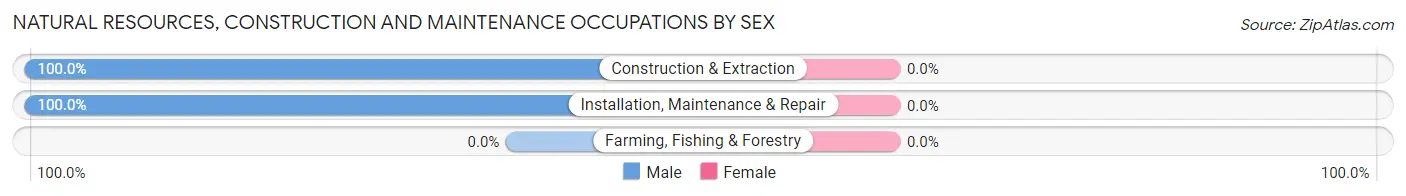
| Occupation | Male | Female |
| Farming, Fishing & Forestry | 0 (0.0%) | 0 (0.0%) |
| Construction & Extraction | 21 (100.0%) | 0 (0.0%) |
| Installation, Maintenance & Repair | 202 (100.0%) | 0 (0.0%) |
| Total (Category) | 223 (100.0%) | 0 (0.0%) |
| Total (Overall) | 967 (49.2%) | 997 (50.8%) |
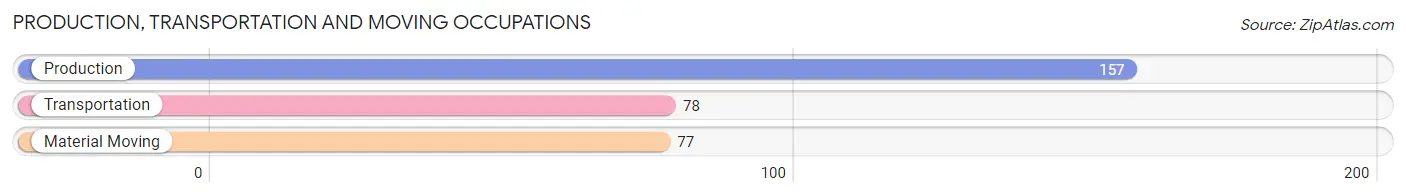
Production, Transportation and Moving Occupations
The most common Production, Transportation and Moving occupations in Village Green are Production (157 | 8.0%), Transportation (78 | 4.0%), and Material Moving (77 | 3.9%).
Production, Transportation and Moving Occupations by Sex
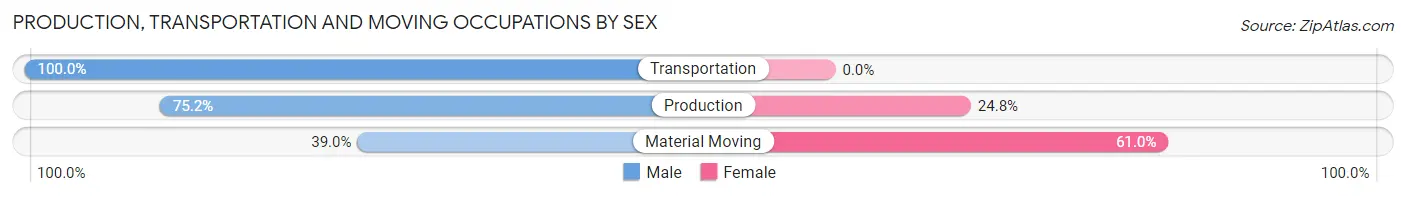
| Occupation | Male | Female |
| Production | 118 (75.2%) | 39 (24.8%) |
| Transportation | 78 (100.0%) | 0 (0.0%) |
| Material Moving | 30 (39.0%) | 47 (61.0%) |
| Total (Category) | 226 (72.4%) | 86 (27.6%) |
| Total (Overall) | 967 (49.2%) | 997 (50.8%) |
Employment Industries by Sex in Village Green
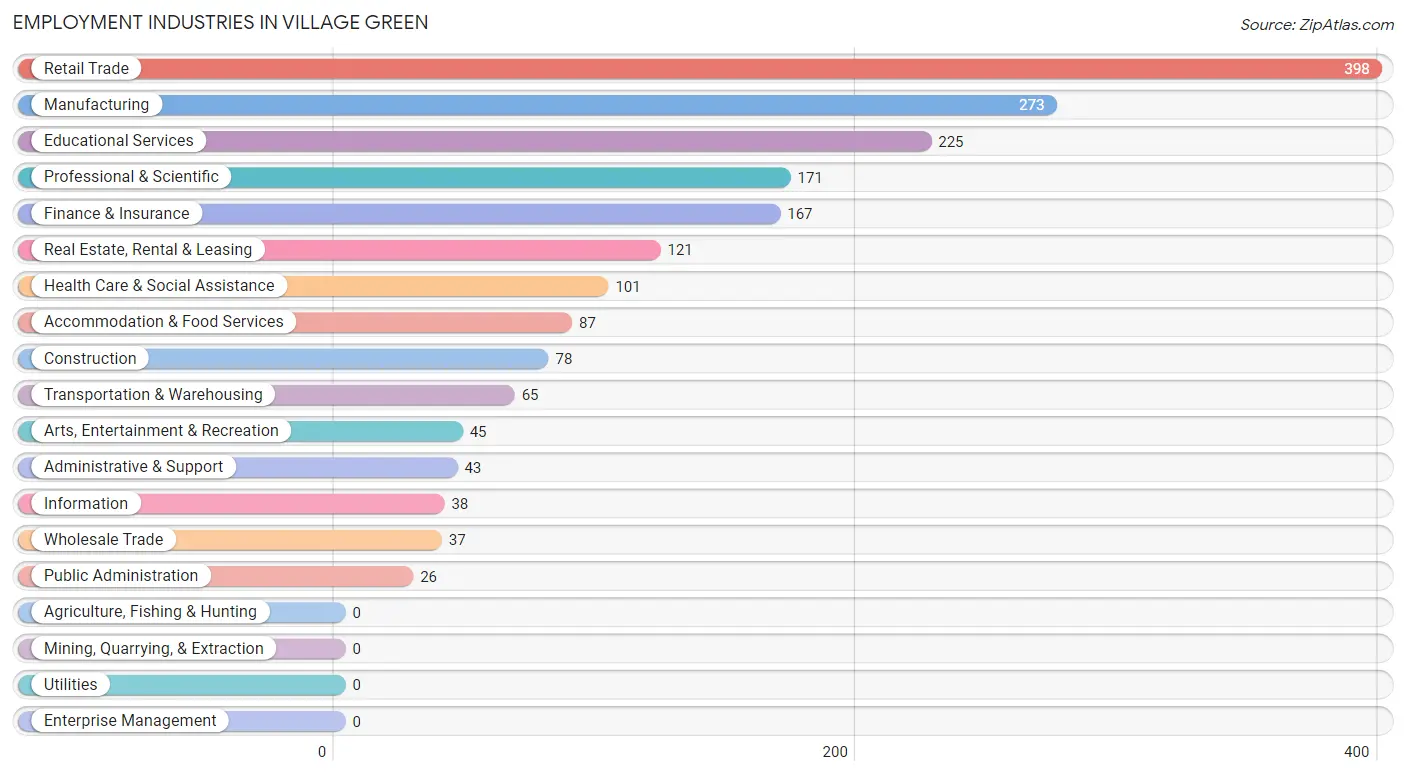
Employment Industries in Village Green
The major employment industries in Village Green include Retail Trade (398 | 20.3%), Manufacturing (273 | 13.9%), Educational Services (225 | 11.5%), Professional & Scientific (171 | 8.7%), and Finance & Insurance (167 | 8.5%).
Employment Industries by Sex in Village Green
The Village Green industries that see more men than women are Construction (100.0%), Wholesale Trade (100.0%), and Transportation & Warehousing (100.0%), whereas the industries that tend to have a higher number of women are Health Care & Social Assistance (100.0%), Professional & Scientific (78.4%), and Retail Trade (75.4%).
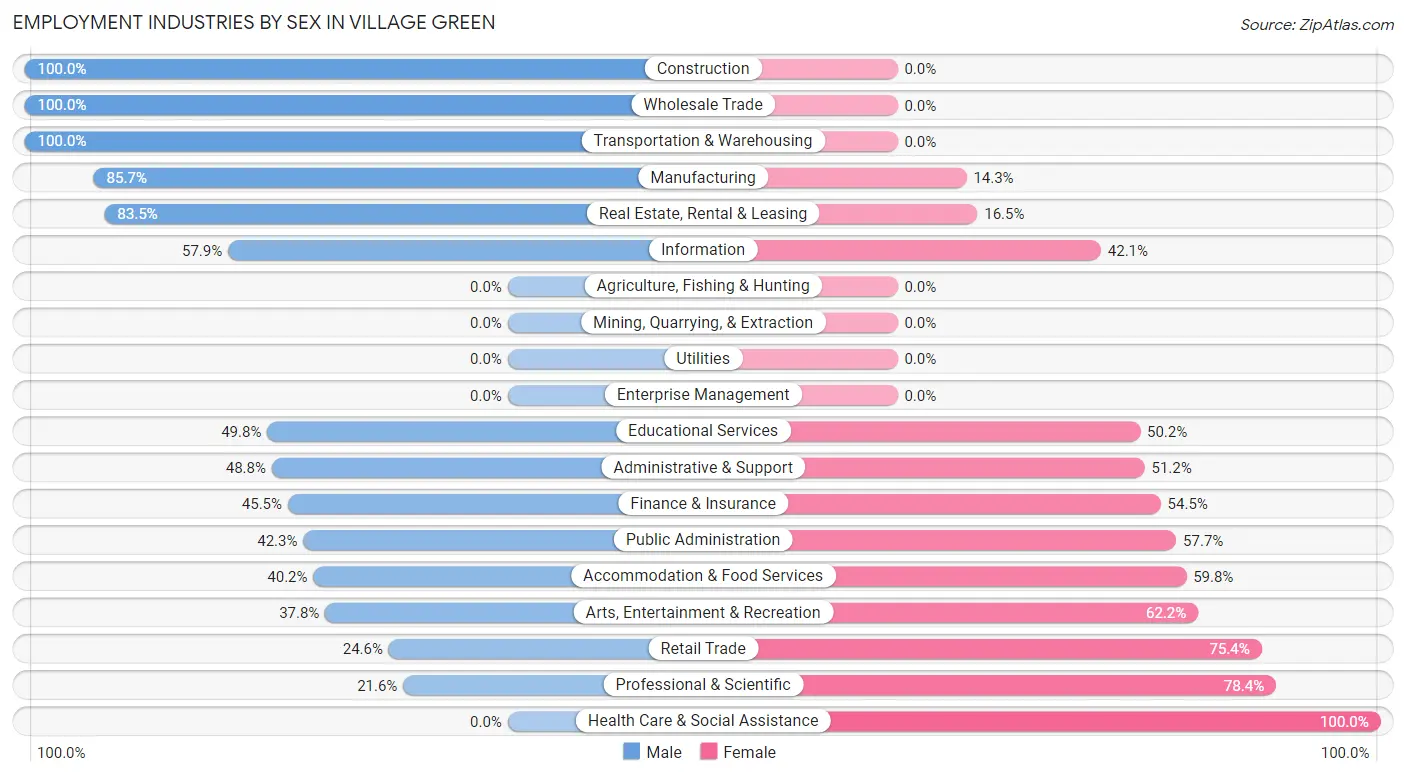
| Industry | Male | Female |
| Agriculture, Fishing & Hunting | 0 (0.0%) | 0 (0.0%) |
| Mining, Quarrying, & Extraction | 0 (0.0%) | 0 (0.0%) |
| Construction | 78 (100.0%) | 0 (0.0%) |
| Manufacturing | 234 (85.7%) | 39 (14.3%) |
| Wholesale Trade | 37 (100.0%) | 0 (0.0%) |
| Retail Trade | 98 (24.6%) | 300 (75.4%) |
| Transportation & Warehousing | 65 (100.0%) | 0 (0.0%) |
| Utilities | 0 (0.0%) | 0 (0.0%) |
| Information | 22 (57.9%) | 16 (42.1%) |
| Finance & Insurance | 76 (45.5%) | 91 (54.5%) |
| Real Estate, Rental & Leasing | 101 (83.5%) | 20 (16.5%) |
| Professional & Scientific | 37 (21.6%) | 134 (78.4%) |
| Enterprise Management | 0 (0.0%) | 0 (0.0%) |
| Administrative & Support | 21 (48.8%) | 22 (51.2%) |
| Educational Services | 112 (49.8%) | 113 (50.2%) |
| Health Care & Social Assistance | 0 (0.0%) | 101 (100.0%) |
| Arts, Entertainment & Recreation | 17 (37.8%) | 28 (62.2%) |
| Accommodation & Food Services | 35 (40.2%) | 52 (59.8%) |
| Public Administration | 11 (42.3%) | 15 (57.7%) |
| Total | 967 (49.2%) | 997 (50.8%) |
Education in Village Green
School Enrollment in Village Green
The most common levels of schooling among the 530 students in Village Green are elementary school (218 | 41.1%), middle school (119 | 22.5%), and nursery / preschool (60 | 11.3%).
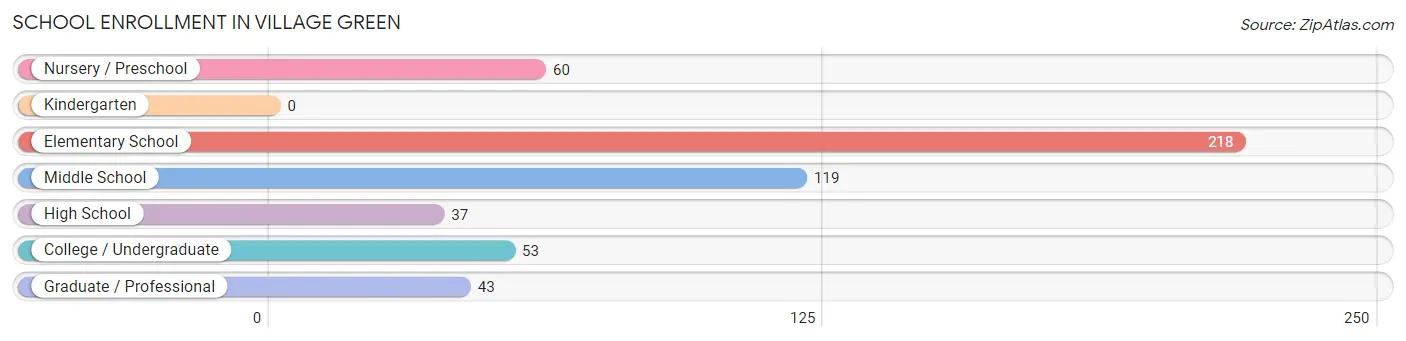
| School Level | # Students | % Students |
| Nursery / Preschool | 60 | 11.3% |
| Kindergarten | 0 | 0.0% |
| Elementary School | 218 | 41.1% |
| Middle School | 119 | 22.5% |
| High School | 37 | 7.0% |
| College / Undergraduate | 53 | 10.0% |
| Graduate / Professional | 43 | 8.1% |
| Total | 530 | 100.0% |
School Enrollment by Age by Funding Source in Village Green
Out of a total of 530 students who are enrolled in schools in Village Green, 37 (7.0%) attend a private institution, while the remaining 493 (93.0%) are enrolled in public schools. The age group of 25 to 34 year olds has the highest likelihood of being enrolled in private schools, with 20 (30.3% in the age bracket) enrolled. Conversely, the age group of 3 to 4 year olds has the lowest likelihood of being enrolled in a private school, with 39 (100.0% in the age bracket) attending a public institution.
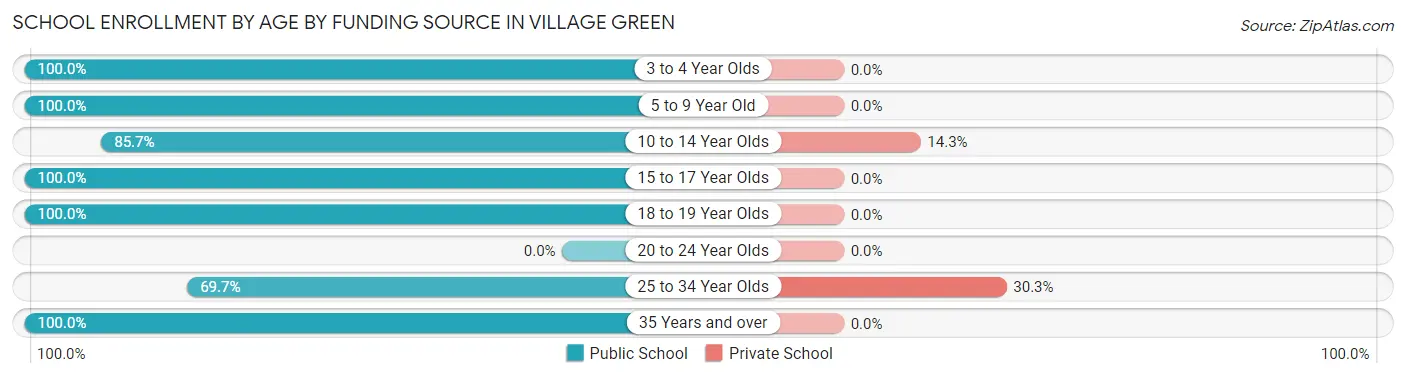
| Age Bracket | Public School | Private School |
| 3 to 4 Year Olds | 39 (100.0%) | 0 (0.0%) |
| 5 to 9 Year Old | 239 (100.0%) | 0 (0.0%) |
| 10 to 14 Year Olds | 102 (85.7%) | 17 (14.3%) |
| 15 to 17 Year Olds | 37 (100.0%) | 0 (0.0%) |
| 18 to 19 Year Olds | 13 (100.0%) | 0 (0.0%) |
| 20 to 24 Year Olds | 0 (0.0%) | 0 (0.0%) |
| 25 to 34 Year Olds | 46 (69.7%) | 20 (30.3%) |
| 35 Years and over | 17 (100.0%) | 0 (0.0%) |
| Total | 493 (93.0%) | 37 (7.0%) |
Educational Attainment by Field of Study in Village Green
Education (187 | 20.9%), literature & languages (153 | 17.1%), business (93 | 10.4%), bio, nature & agricultural (77 | 8.6%), and communications (73 | 8.2%) are the most common fields of study among 896 individuals in Village Green who have obtained a bachelor's degree or higher.
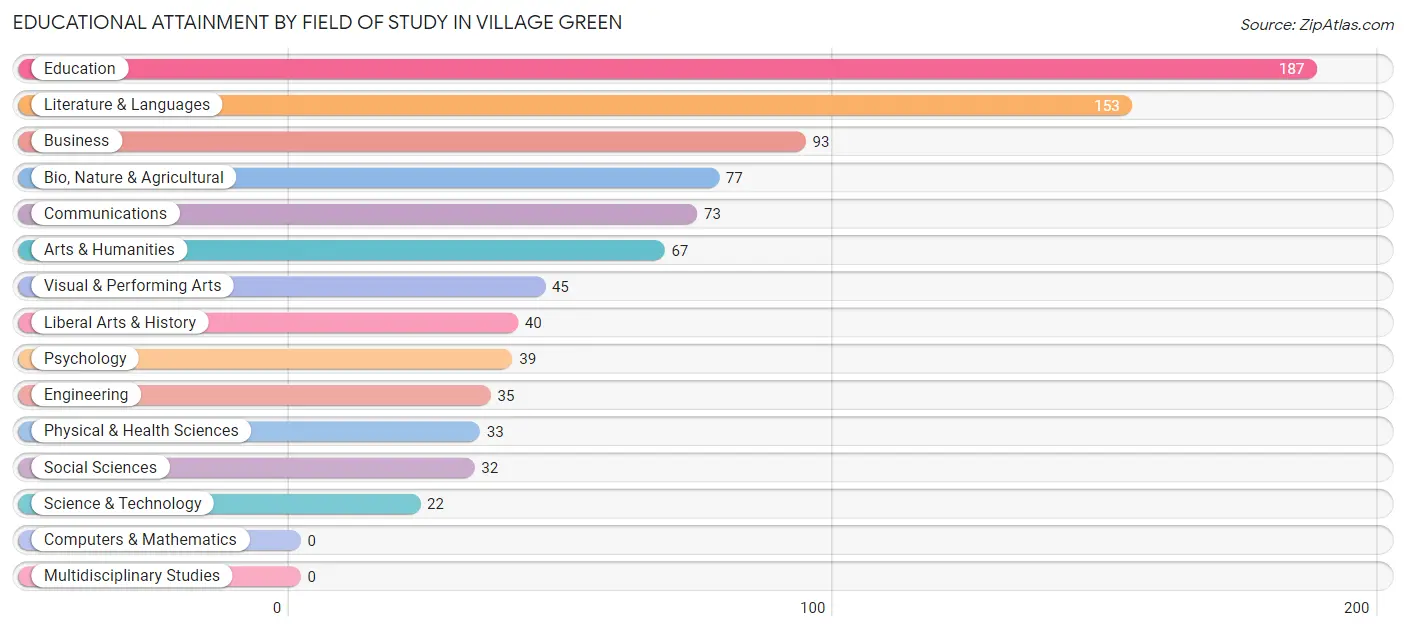
| Field of Study | # Graduates | % Graduates |
| Computers & Mathematics | 0 | 0.0% |
| Bio, Nature & Agricultural | 77 | 8.6% |
| Physical & Health Sciences | 33 | 3.7% |
| Psychology | 39 | 4.3% |
| Social Sciences | 32 | 3.6% |
| Engineering | 35 | 3.9% |
| Multidisciplinary Studies | 0 | 0.0% |
| Science & Technology | 22 | 2.5% |
| Business | 93 | 10.4% |
| Education | 187 | 20.9% |
| Literature & Languages | 153 | 17.1% |
| Liberal Arts & History | 40 | 4.5% |
| Visual & Performing Arts | 45 | 5.0% |
| Communications | 73 | 8.2% |
| Arts & Humanities | 67 | 7.5% |
| Total | 896 | 100.0% |
Transportation & Commute in Village Green
Vehicle Availability by Sex in Village Green
The most prevalent vehicle ownership categories in Village Green are males with 2 vehicles (492, accounting for 51.5%) and females with 2 vehicles (430, making up 52.8%).
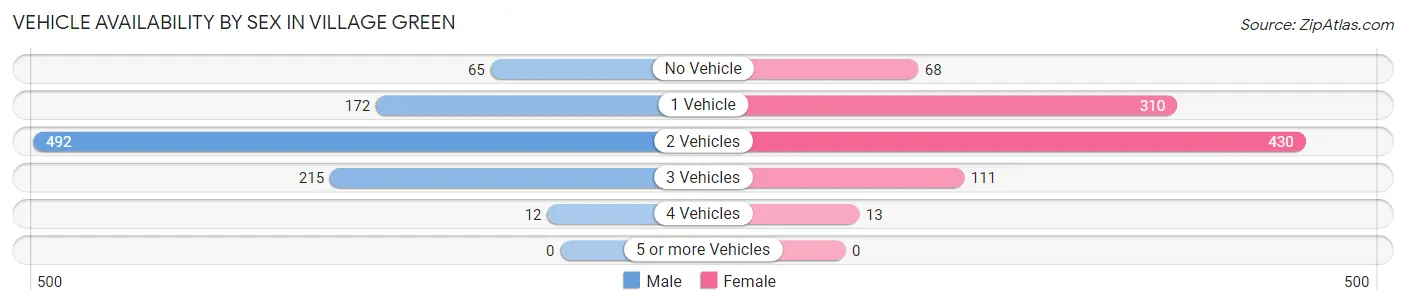
| Vehicles Available | Male | Female |
| No Vehicle | 65 (6.8%) | 68 (7.3%) |
| 1 Vehicle | 172 (18.0%) | 310 (33.3%) |
| 2 Vehicles | 492 (51.5%) | 430 (46.1%) |
| 3 Vehicles | 215 (22.5%) | 111 (11.9%) |
| 4 Vehicles | 12 (1.3%) | 13 (1.4%) |
| 5 or more Vehicles | 0 (0.0%) | 0 (0.0%) |
| Total | 956 (100.0%) | 932 (100.0%) |
Commute Time in Village Green
The most frequently occuring commute durations in Village Green are 15 to 19 minutes (472 commuters, 28.1%), 20 to 24 minutes (395 commuters, 23.5%), and 10 to 14 minutes (237 commuters, 14.1%).
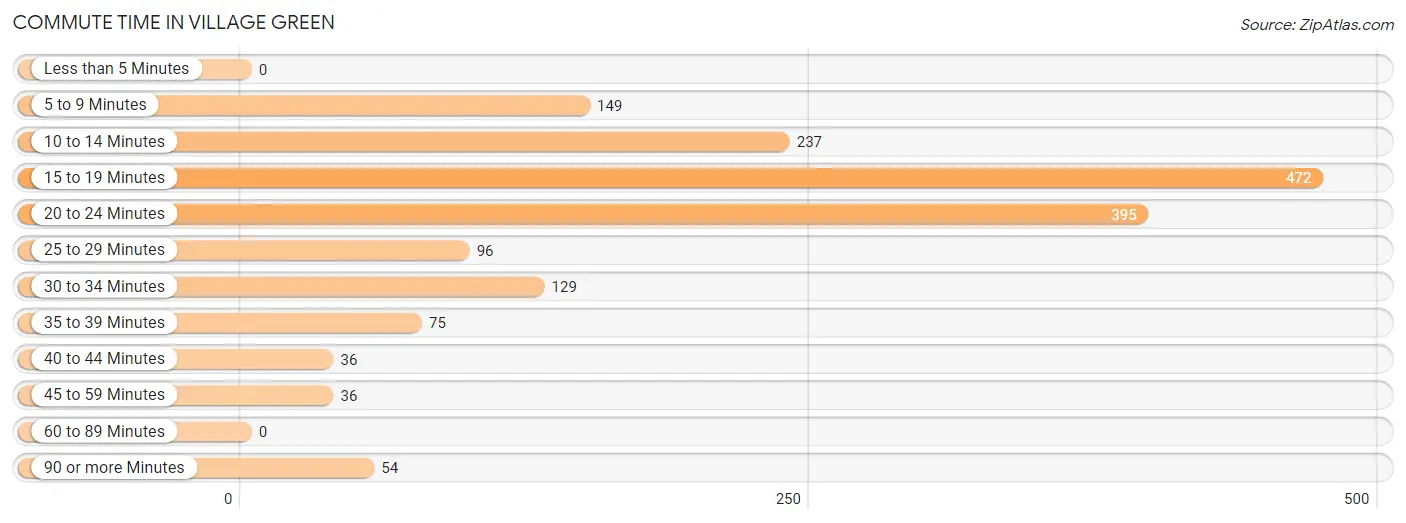
| Commute Time | # Commuters | % Commuters |
| Less than 5 Minutes | 0 | 0.0% |
| 5 to 9 Minutes | 149 | 8.9% |
| 10 to 14 Minutes | 237 | 14.1% |
| 15 to 19 Minutes | 472 | 28.1% |
| 20 to 24 Minutes | 395 | 23.5% |
| 25 to 29 Minutes | 96 | 5.7% |
| 30 to 34 Minutes | 129 | 7.7% |
| 35 to 39 Minutes | 75 | 4.5% |
| 40 to 44 Minutes | 36 | 2.1% |
| 45 to 59 Minutes | 36 | 2.1% |
| 60 to 89 Minutes | 0 | 0.0% |
| 90 or more Minutes | 54 | 3.2% |
Commute Time by Sex in Village Green
The most common commute times in Village Green are 20 to 24 minutes (217 commuters, 24.5%) for males and 15 to 19 minutes (272 commuters, 34.3%) for females.
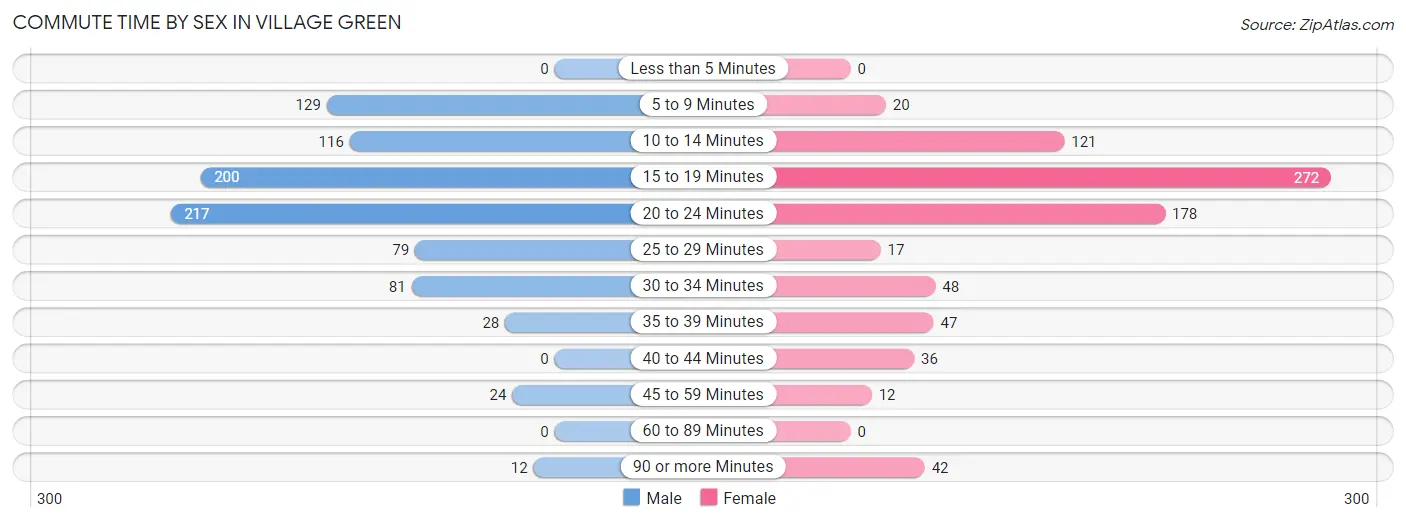
| Commute Time | Male | Female |
| Less than 5 Minutes | 0 (0.0%) | 0 (0.0%) |
| 5 to 9 Minutes | 129 (14.6%) | 20 (2.5%) |
| 10 to 14 Minutes | 116 (13.1%) | 121 (15.3%) |
| 15 to 19 Minutes | 200 (22.6%) | 272 (34.3%) |
| 20 to 24 Minutes | 217 (24.5%) | 178 (22.5%) |
| 25 to 29 Minutes | 79 (8.9%) | 17 (2.1%) |
| 30 to 34 Minutes | 81 (9.1%) | 48 (6.0%) |
| 35 to 39 Minutes | 28 (3.2%) | 47 (5.9%) |
| 40 to 44 Minutes | 0 (0.0%) | 36 (4.5%) |
| 45 to 59 Minutes | 24 (2.7%) | 12 (1.5%) |
| 60 to 89 Minutes | 0 (0.0%) | 0 (0.0%) |
| 90 or more Minutes | 12 (1.3%) | 42 (5.3%) |
Time of Departure to Work by Sex in Village Green
The most frequent times of departure to work in Village Green are 7:30 AM to 7:59 AM (138, 15.6%) for males and 8:30 AM to 8:59 AM (191, 24.1%) for females.
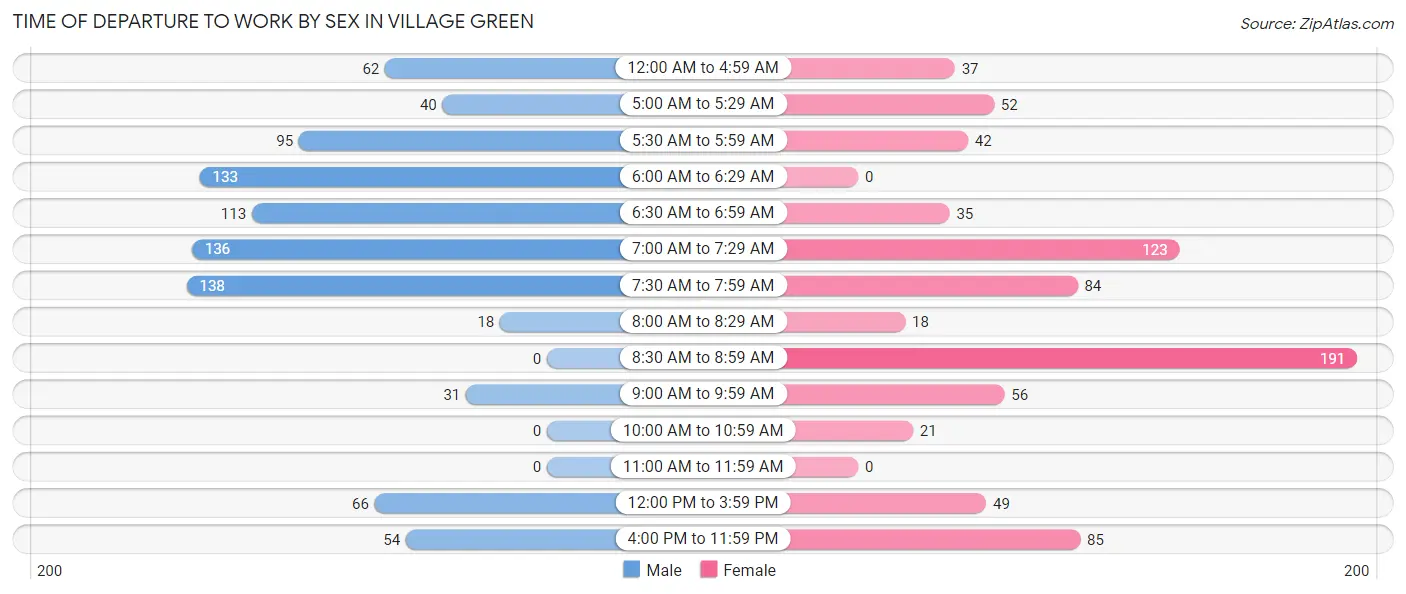
| Time of Departure | Male | Female |
| 12:00 AM to 4:59 AM | 62 (7.0%) | 37 (4.7%) |
| 5:00 AM to 5:29 AM | 40 (4.5%) | 52 (6.6%) |
| 5:30 AM to 5:59 AM | 95 (10.7%) | 42 (5.3%) |
| 6:00 AM to 6:29 AM | 133 (15.0%) | 0 (0.0%) |
| 6:30 AM to 6:59 AM | 113 (12.8%) | 35 (4.4%) |
| 7:00 AM to 7:29 AM | 136 (15.3%) | 123 (15.5%) |
| 7:30 AM to 7:59 AM | 138 (15.6%) | 84 (10.6%) |
| 8:00 AM to 8:29 AM | 18 (2.0%) | 18 (2.3%) |
| 8:30 AM to 8:59 AM | 0 (0.0%) | 191 (24.1%) |
| 9:00 AM to 9:59 AM | 31 (3.5%) | 56 (7.1%) |
| 10:00 AM to 10:59 AM | 0 (0.0%) | 21 (2.6%) |
| 11:00 AM to 11:59 AM | 0 (0.0%) | 0 (0.0%) |
| 12:00 PM to 3:59 PM | 66 (7.4%) | 49 (6.2%) |
| 4:00 PM to 11:59 PM | 54 (6.1%) | 85 (10.7%) |
| Total | 886 (100.0%) | 793 (100.0%) |
Housing Occupancy in Village Green
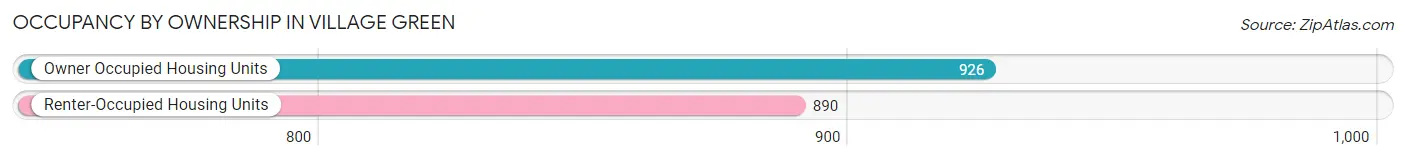
Occupancy by Ownership in Village Green
Of the total 1,816 dwellings in Village Green, owner-occupied units account for 926 (51.0%), while renter-occupied units make up 890 (49.0%).
| Occupancy | # Housing Units | % Housing Units |
| Owner Occupied Housing Units | 926 | 51.0% |
| Renter-Occupied Housing Units | 890 | 49.0% |
| Total Occupied Housing Units | 1,816 | 100.0% |
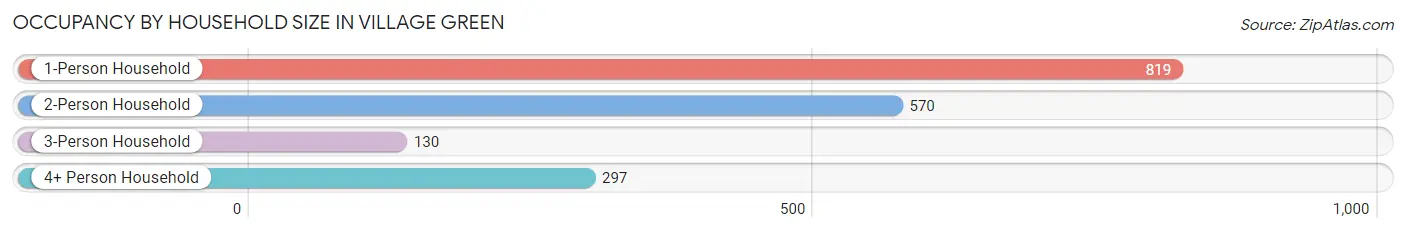
Occupancy by Household Size in Village Green
| Household Size | # Housing Units | % Housing Units |
| 1-Person Household | 819 | 45.1% |
| 2-Person Household | 570 | 31.4% |
| 3-Person Household | 130 | 7.2% |
| 4+ Person Household | 297 | 16.4% |
| Total Housing Units | 1,816 | 100.0% |
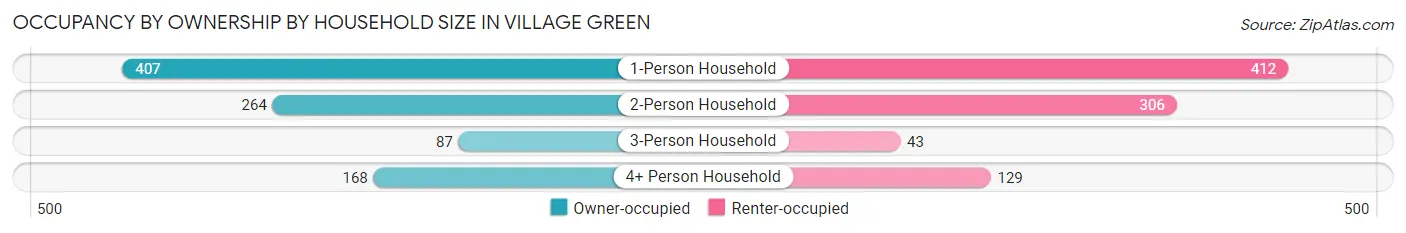
Occupancy by Ownership by Household Size in Village Green
| Household Size | Owner-occupied | Renter-occupied |
| 1-Person Household | 407 (49.7%) | 412 (50.3%) |
| 2-Person Household | 264 (46.3%) | 306 (53.7%) |
| 3-Person Household | 87 (66.9%) | 43 (33.1%) |
| 4+ Person Household | 168 (56.6%) | 129 (43.4%) |
| Total Housing Units | 926 (51.0%) | 890 (49.0%) |
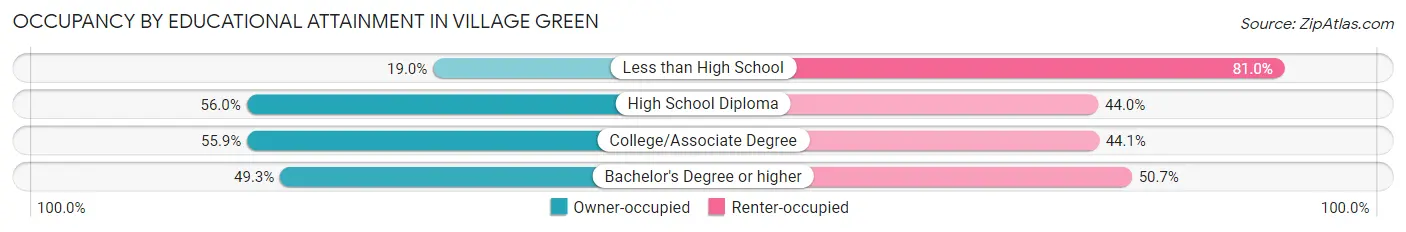
Occupancy by Educational Attainment in Village Green
| Household Size | Owner-occupied | Renter-occupied |
| Less than High School | 23 (19.0%) | 98 (81.0%) |
| High School Diploma | 224 (56.0%) | 176 (44.0%) |
| College/Associate Degree | 342 (55.9%) | 270 (44.1%) |
| Bachelor's Degree or higher | 337 (49.3%) | 346 (50.7%) |
Occupancy by Age of Householder in Village Green
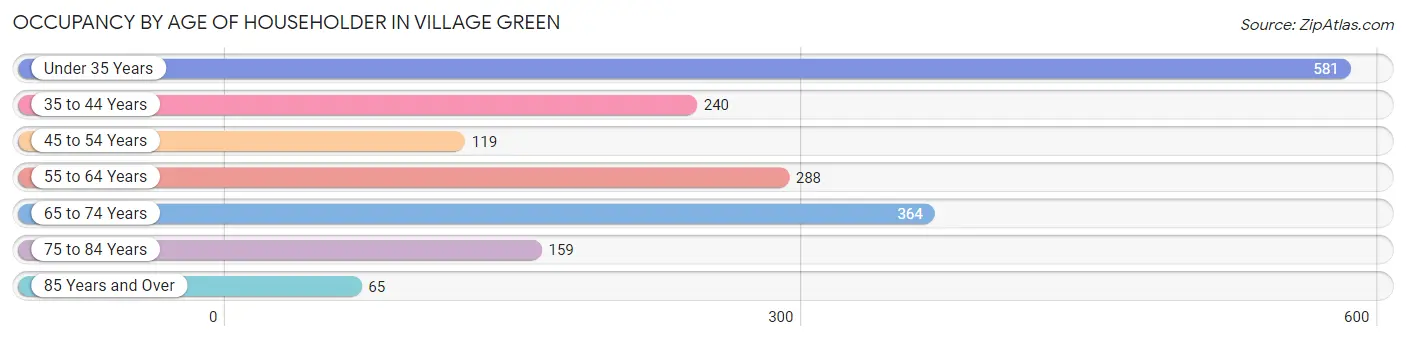
| Age Bracket | # Households | % Households |
| Under 35 Years | 581 | 32.0% |
| 35 to 44 Years | 240 | 13.2% |
| 45 to 54 Years | 119 | 6.6% |
| 55 to 64 Years | 288 | 15.9% |
| 65 to 74 Years | 364 | 20.0% |
| 75 to 84 Years | 159 | 8.8% |
| 85 Years and Over | 65 | 3.6% |
| Total | 1,816 | 100.0% |
Housing Finances in Village Green
Median Income by Occupancy in Village Green
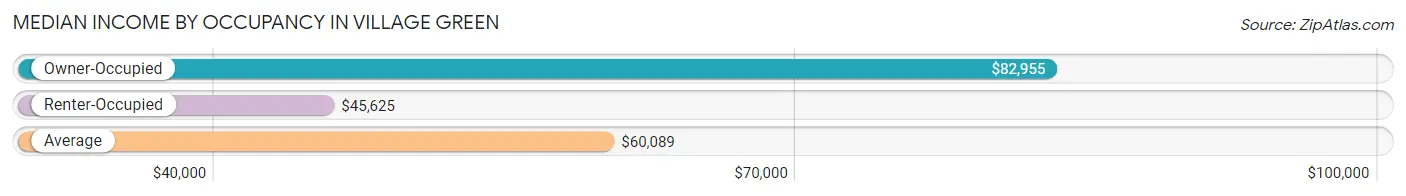
| Occupancy Type | # Households | Median Income |
| Owner-Occupied | 926 (51.0%) | $82,955 |
| Renter-Occupied | 890 (49.0%) | $45,625 |
| Average | 1,816 (100.0%) | $60,089 |
Occupancy by Householder Income Bracket in Village Green
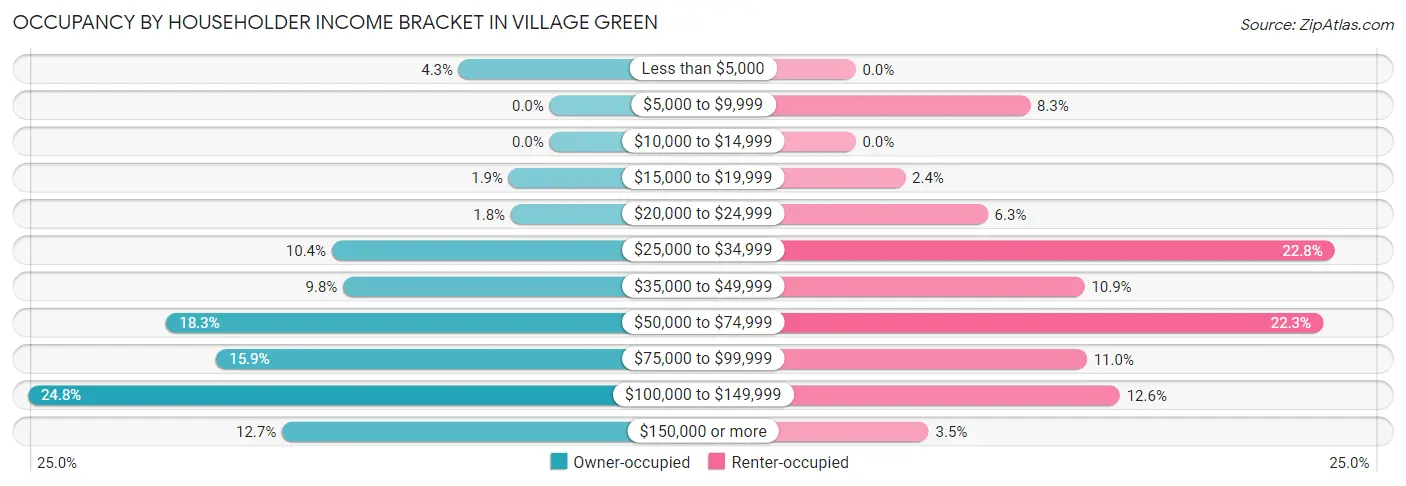
| Income Bracket | Owner-occupied | Renter-occupied |
| Less than $5,000 | 40 (4.3%) | 0 (0.0%) |
| $5,000 to $9,999 | 0 (0.0%) | 74 (8.3%) |
| $10,000 to $14,999 | 0 (0.0%) | 0 (0.0%) |
| $15,000 to $19,999 | 18 (1.9%) | 21 (2.4%) |
| $20,000 to $24,999 | 17 (1.8%) | 56 (6.3%) |
| $25,000 to $34,999 | 96 (10.4%) | 203 (22.8%) |
| $35,000 to $49,999 | 91 (9.8%) | 97 (10.9%) |
| $50,000 to $74,999 | 169 (18.2%) | 198 (22.3%) |
| $75,000 to $99,999 | 147 (15.9%) | 98 (11.0%) |
| $100,000 to $149,999 | 230 (24.8%) | 112 (12.6%) |
| $150,000 or more | 118 (12.7%) | 31 (3.5%) |
| Total | 926 (100.0%) | 890 (100.0%) |
Monthly Housing Cost Tiers in Village Green
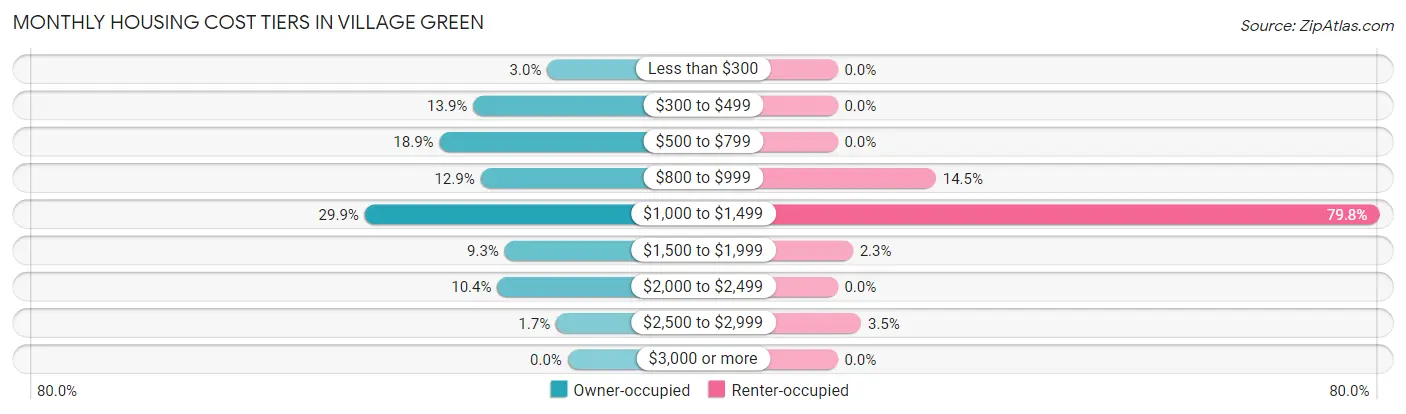
| Monthly Cost | Owner-occupied | Renter-occupied |
| Less than $300 | 28 (3.0%) | 0 (0.0%) |
| $300 to $499 | 129 (13.9%) | 0 (0.0%) |
| $500 to $799 | 175 (18.9%) | 0 (0.0%) |
| $800 to $999 | 119 (12.9%) | 129 (14.5%) |
| $1,000 to $1,499 | 277 (29.9%) | 710 (79.8%) |
| $1,500 to $1,999 | 86 (9.3%) | 20 (2.2%) |
| $2,000 to $2,499 | 96 (10.4%) | 0 (0.0%) |
| $2,500 to $2,999 | 16 (1.7%) | 31 (3.5%) |
| $3,000 or more | 0 (0.0%) | 0 (0.0%) |
| Total | 926 (100.0%) | 890 (100.0%) |
Physical Housing Characteristics in Village Green
Housing Structures in Village Green
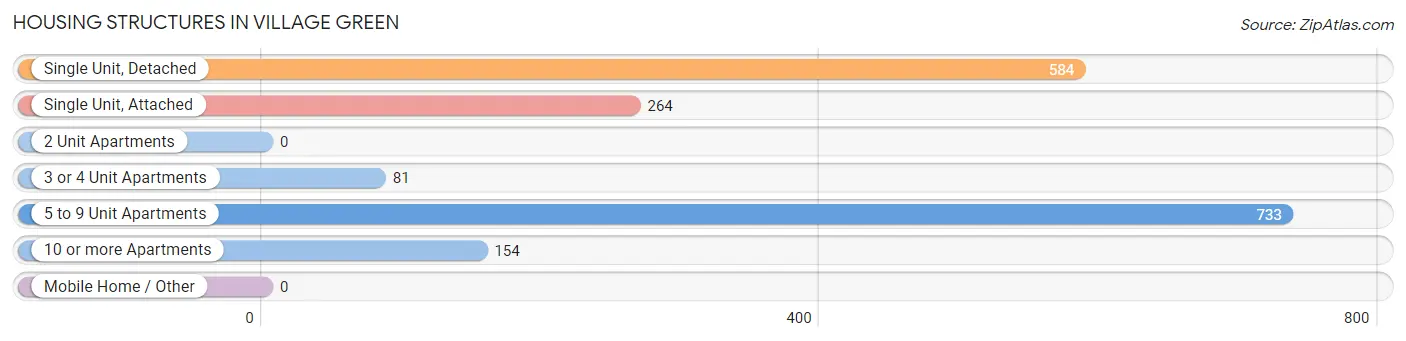
| Structure Type | # Housing Units | % Housing Units |
| Single Unit, Detached | 584 | 32.2% |
| Single Unit, Attached | 264 | 14.5% |
| 2 Unit Apartments | 0 | 0.0% |
| 3 or 4 Unit Apartments | 81 | 4.5% |
| 5 to 9 Unit Apartments | 733 | 40.4% |
| 10 or more Apartments | 154 | 8.5% |
| Mobile Home / Other | 0 | 0.0% |
| Total | 1,816 | 100.0% |
Housing Structures by Occupancy in Village Green
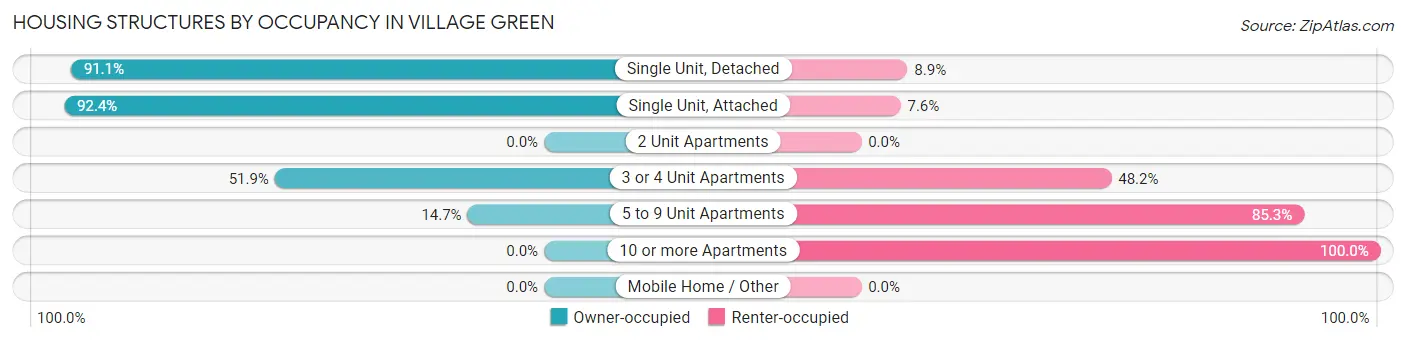
| Structure Type | Owner-occupied | Renter-occupied |
| Single Unit, Detached | 532 (91.1%) | 52 (8.9%) |
| Single Unit, Attached | 244 (92.4%) | 20 (7.6%) |
| 2 Unit Apartments | 0 (0.0%) | 0 (0.0%) |
| 3 or 4 Unit Apartments | 42 (51.8%) | 39 (48.1%) |
| 5 to 9 Unit Apartments | 108 (14.7%) | 625 (85.3%) |
| 10 or more Apartments | 0 (0.0%) | 154 (100.0%) |
| Mobile Home / Other | 0 (0.0%) | 0 (0.0%) |
| Total | 926 (51.0%) | 890 (49.0%) |
Housing Structures by Number of Rooms in Village Green
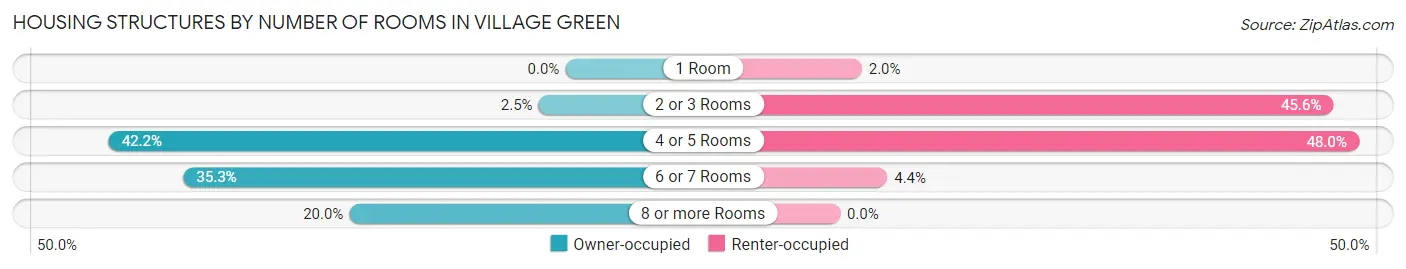
| Number of Rooms | Owner-occupied | Renter-occupied |
| 1 Room | 0 (0.0%) | 18 (2.0%) |
| 2 or 3 Rooms | 23 (2.5%) | 406 (45.6%) |
| 4 or 5 Rooms | 391 (42.2%) | 427 (48.0%) |
| 6 or 7 Rooms | 327 (35.3%) | 39 (4.4%) |
| 8 or more Rooms | 185 (20.0%) | 0 (0.0%) |
| Total | 926 (100.0%) | 890 (100.0%) |
Housing Structure by Heating Type in Village Green
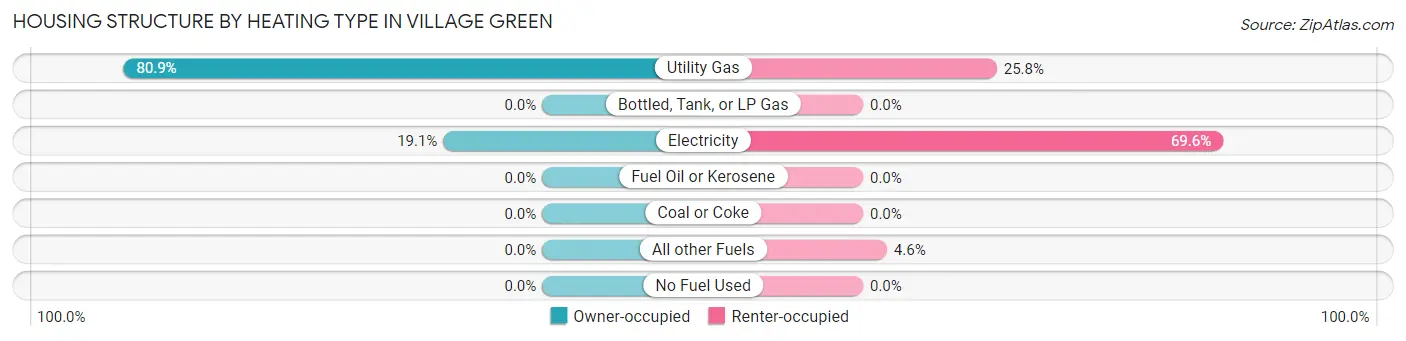
| Heating Type | Owner-occupied | Renter-occupied |
| Utility Gas | 749 (80.9%) | 230 (25.8%) |
| Bottled, Tank, or LP Gas | 0 (0.0%) | 0 (0.0%) |
| Electricity | 177 (19.1%) | 619 (69.6%) |
| Fuel Oil or Kerosene | 0 (0.0%) | 0 (0.0%) |
| Coal or Coke | 0 (0.0%) | 0 (0.0%) |
| All other Fuels | 0 (0.0%) | 41 (4.6%) |
| No Fuel Used | 0 (0.0%) | 0 (0.0%) |
| Total | 926 (100.0%) | 890 (100.0%) |
Household Vehicle Usage in Village Green
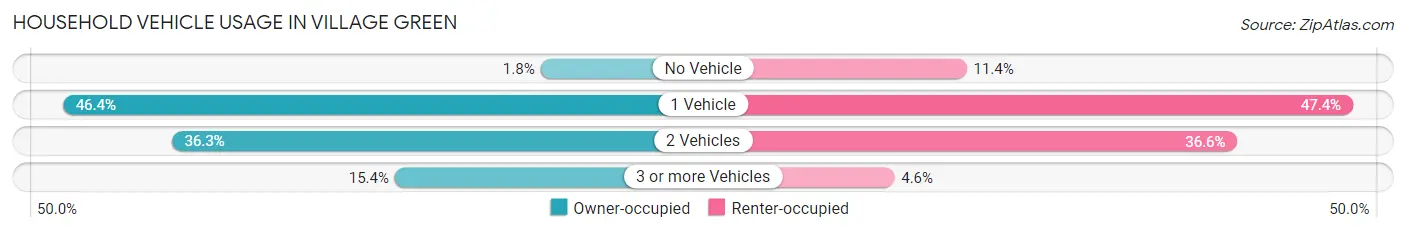
| Vehicles per Household | Owner-occupied | Renter-occupied |
| No Vehicle | 17 (1.8%) | 101 (11.4%) |
| 1 Vehicle | 430 (46.4%) | 422 (47.4%) |
| 2 Vehicles | 336 (36.3%) | 326 (36.6%) |
| 3 or more Vehicles | 143 (15.4%) | 41 (4.6%) |
| Total | 926 (100.0%) | 890 (100.0%) |
Real Estate & Mortgages in Village Green
Real Estate and Mortgage Overview in Village Green
| Characteristic | Without Mortgage | With Mortgage |
| Housing Units | 312 | 614 |
| Median Property Value | $110,500 | $137,700 |
| Median Household Income | $60,536 | $88 |
| Monthly Housing Costs | $531 | $0 |
| Real Estate Taxes | $1,886 | $20 |
Property Value by Mortgage Status in Village Green
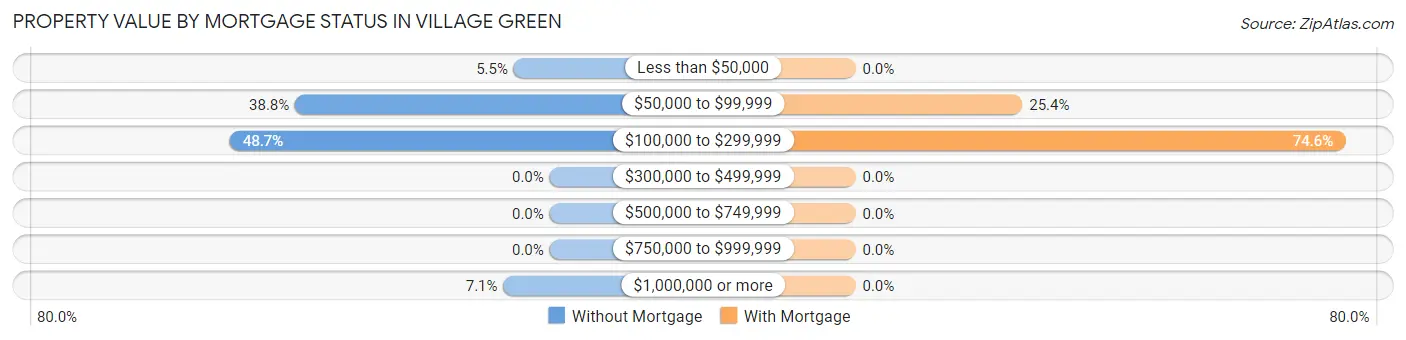
| Property Value | Without Mortgage | With Mortgage |
| Less than $50,000 | 17 (5.4%) | 0 (0.0%) |
| $50,000 to $99,999 | 121 (38.8%) | 156 (25.4%) |
| $100,000 to $299,999 | 152 (48.7%) | 458 (74.6%) |
| $300,000 to $499,999 | 0 (0.0%) | 0 (0.0%) |
| $500,000 to $749,999 | 0 (0.0%) | 0 (0.0%) |
| $750,000 to $999,999 | 0 (0.0%) | 0 (0.0%) |
| $1,000,000 or more | 22 (7.0%) | 0 (0.0%) |
| Total | 312 (100.0%) | 614 (100.0%) |
Household Income by Mortgage Status in Village Green
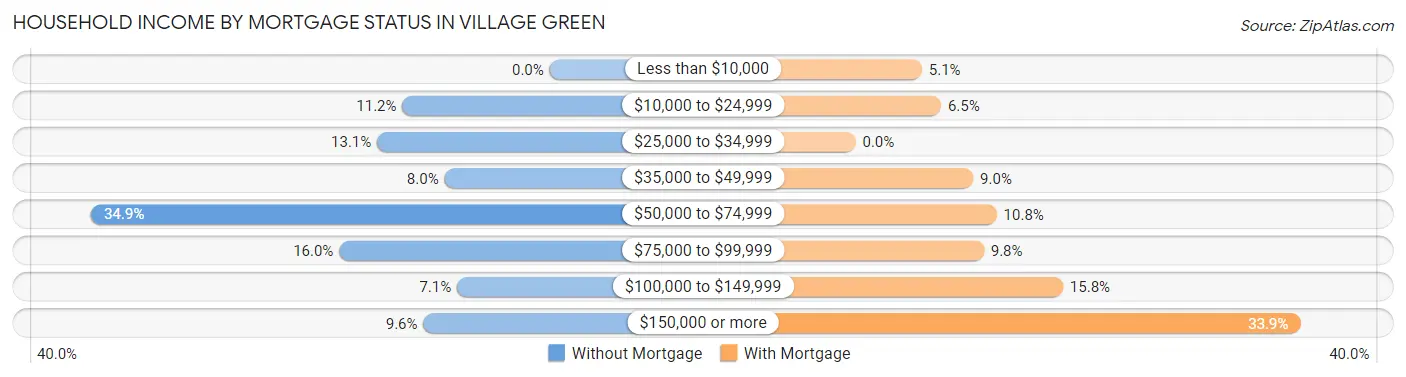
| Household Income | Without Mortgage | With Mortgage |
| Less than $10,000 | 0 (0.0%) | 31 (5.1%) |
| $10,000 to $24,999 | 35 (11.2%) | 40 (6.5%) |
| $25,000 to $34,999 | 41 (13.1%) | 0 (0.0%) |
| $35,000 to $49,999 | 25 (8.0%) | 55 (9.0%) |
| $50,000 to $74,999 | 109 (34.9%) | 66 (10.7%) |
| $75,000 to $99,999 | 50 (16.0%) | 60 (9.8%) |
| $100,000 to $149,999 | 22 (7.0%) | 97 (15.8%) |
| $150,000 or more | 30 (9.6%) | 208 (33.9%) |
| Total | 312 (100.0%) | 614 (100.0%) |
Property Value to Household Income Ratio in Village Green
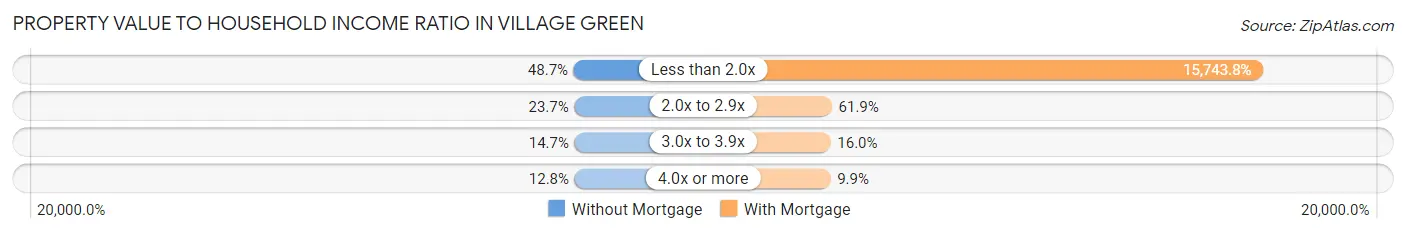
| Value-to-Income Ratio | Without Mortgage | With Mortgage |
| Less than 2.0x | 152 (48.7%) | 96,667 (15,743.8%) |
| 2.0x to 2.9x | 74 (23.7%) | 380 (61.9%) |
| 3.0x to 3.9x | 46 (14.7%) | 98 (16.0%) |
| 4.0x or more | 40 (12.8%) | 61 (9.9%) |
| Total | 312 (100.0%) | 614 (100.0%) |
Real Estate Taxes by Mortgage Status in Village Green
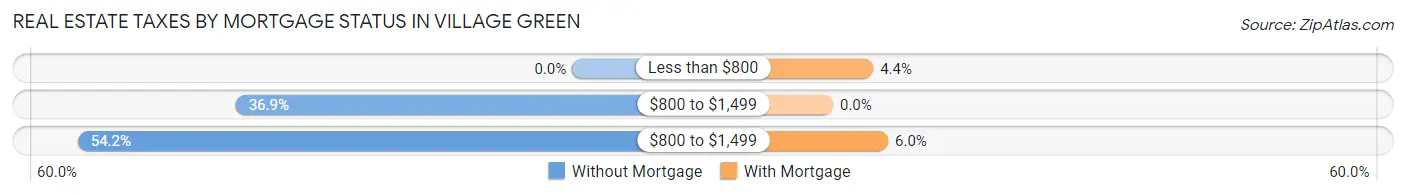
| Property Taxes | Without Mortgage | With Mortgage |
| Less than $800 | 0 (0.0%) | 27 (4.4%) |
| $800 to $1,499 | 115 (36.9%) | 0 (0.0%) |
| $800 to $1,499 | 169 (54.2%) | 37 (6.0%) |
| Total | 312 (100.0%) | 614 (100.0%) |
Health & Disability in Village Green
Health Insurance Coverage by Age in Village Green
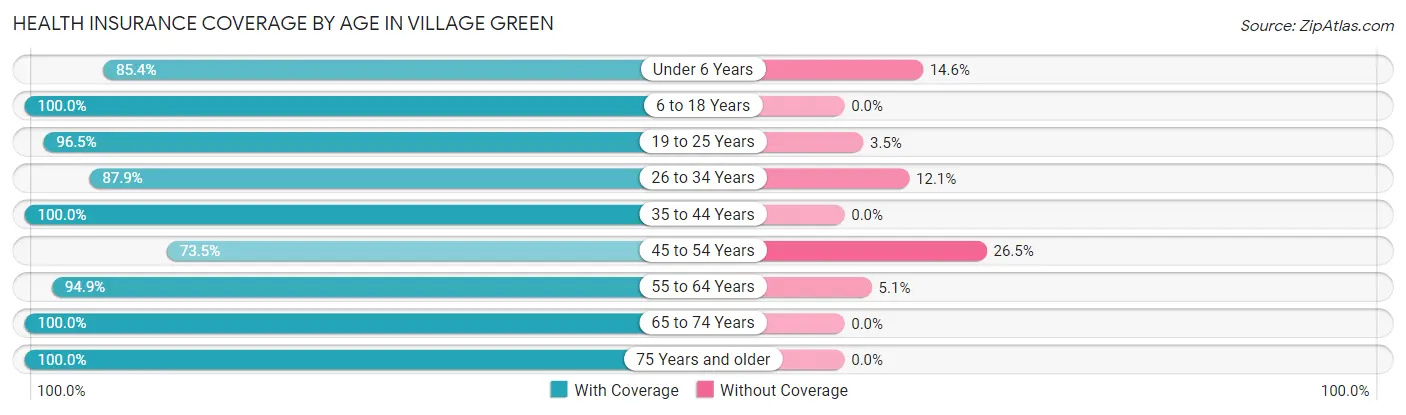
| Age Bracket | With Coverage | Without Coverage |
| Under 6 Years | 280 (85.4%) | 48 (14.6%) |
| 6 to 18 Years | 400 (100.0%) | 0 (0.0%) |
| 19 to 25 Years | 275 (96.5%) | 10 (3.5%) |
| 26 to 34 Years | 720 (87.9%) | 99 (12.1%) |
| 35 to 44 Years | 404 (100.0%) | 0 (0.0%) |
| 45 to 54 Years | 205 (73.5%) | 74 (26.5%) |
| 55 to 64 Years | 502 (94.9%) | 27 (5.1%) |
| 65 to 74 Years | 418 (100.0%) | 0 (0.0%) |
| 75 Years and older | 285 (100.0%) | 0 (0.0%) |
| Total | 3,489 (93.1%) | 258 (6.9%) |
Health Insurance Coverage by Citizenship Status in Village Green
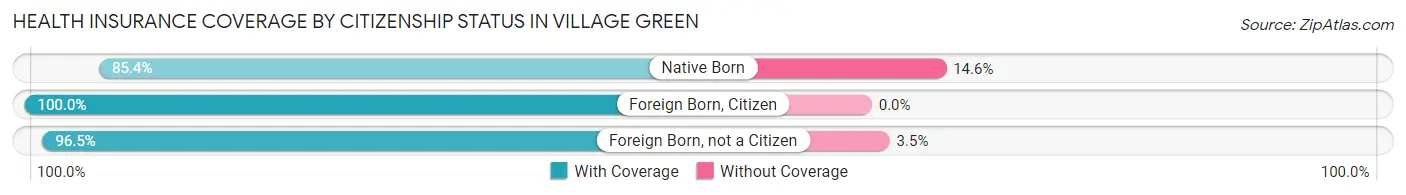
| Citizenship Status | With Coverage | Without Coverage |
| Native Born | 280 (85.4%) | 48 (14.6%) |
| Foreign Born, Citizen | 400 (100.0%) | 0 (0.0%) |
| Foreign Born, not a Citizen | 275 (96.5%) | 10 (3.5%) |
Health Insurance Coverage by Household Income in Village Green
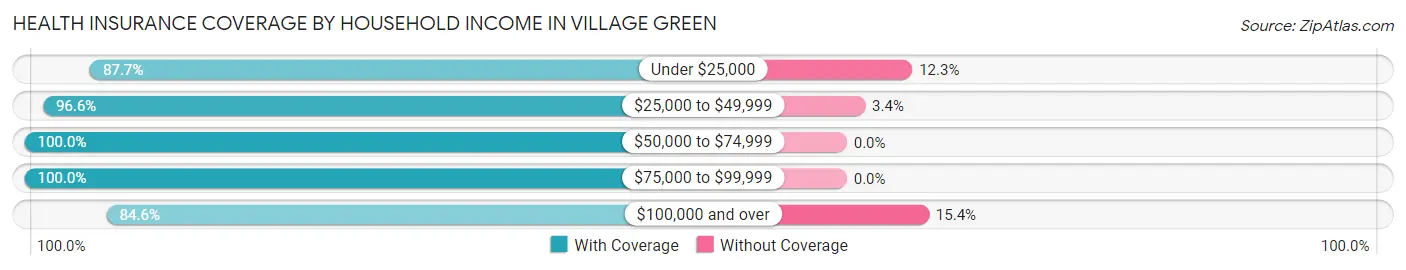
| Household Income | With Coverage | Without Coverage |
| Under $25,000 | 229 (87.7%) | 32 (12.3%) |
| $25,000 to $49,999 | 899 (96.6%) | 32 (3.4%) |
| $50,000 to $74,999 | 798 (100.0%) | 0 (0.0%) |
| $75,000 to $99,999 | 495 (100.0%) | 0 (0.0%) |
| $100,000 and over | 1,067 (84.6%) | 194 (15.4%) |
Public vs Private Health Insurance Coverage by Age in Village Green
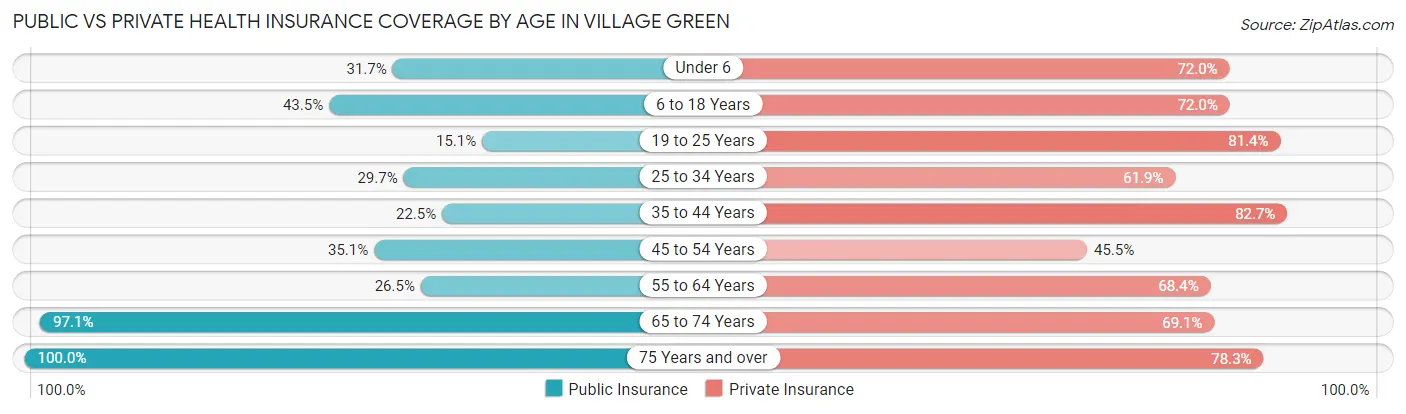
| Age Bracket | Public Insurance | Private Insurance |
| Under 6 | 104 (31.7%) | 236 (72.0%) |
| 6 to 18 Years | 174 (43.5%) | 288 (72.0%) |
| 19 to 25 Years | 43 (15.1%) | 232 (81.4%) |
| 25 to 34 Years | 243 (29.7%) | 507 (61.9%) |
| 35 to 44 Years | 91 (22.5%) | 334 (82.7%) |
| 45 to 54 Years | 98 (35.1%) | 127 (45.5%) |
| 55 to 64 Years | 140 (26.5%) | 362 (68.4%) |
| 65 to 74 Years | 406 (97.1%) | 289 (69.1%) |
| 75 Years and over | 285 (100.0%) | 223 (78.2%) |
| Total | 1,584 (42.3%) | 2,598 (69.3%) |
Disability Status by Sex by Age in Village Green
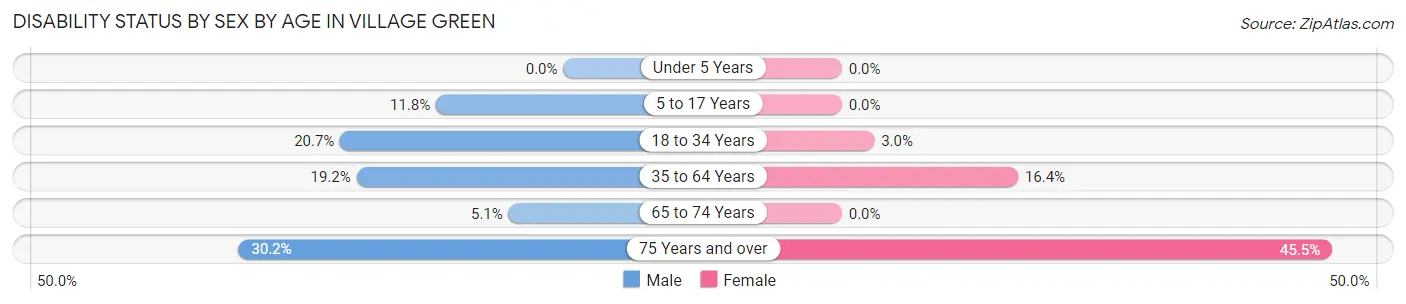
| Age Bracket | Male | Female |
| Under 5 Years | 0 (0.0%) | 0 (0.0%) |
| 5 to 17 Years | 28 (11.8%) | 0 (0.0%) |
| 18 to 34 Years | 128 (20.7%) | 15 (3.0%) |
| 35 to 64 Years | 100 (19.2%) | 113 (16.4%) |
| 65 to 74 Years | 12 (5.1%) | 0 (0.0%) |
| 75 Years and over | 19 (30.2%) | 101 (45.5%) |
Disability Class by Sex by Age in Village Green
Disability Class: Hearing Difficulty
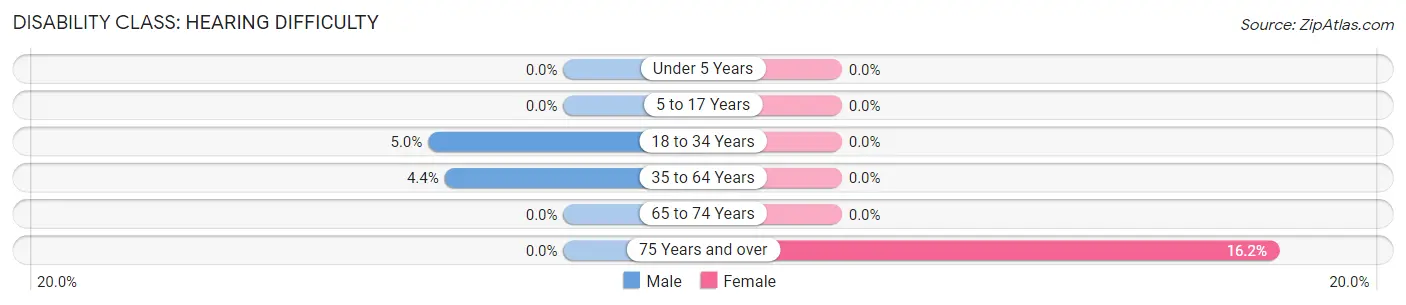
| Age Bracket | Male | Female |
| Under 5 Years | 0 (0.0%) | 0 (0.0%) |
| 5 to 17 Years | 0 (0.0%) | 0 (0.0%) |
| 18 to 34 Years | 31 (5.0%) | 0 (0.0%) |
| 35 to 64 Years | 23 (4.4%) | 0 (0.0%) |
| 65 to 74 Years | 0 (0.0%) | 0 (0.0%) |
| 75 Years and over | 0 (0.0%) | 36 (16.2%) |
Disability Class: Vision Difficulty
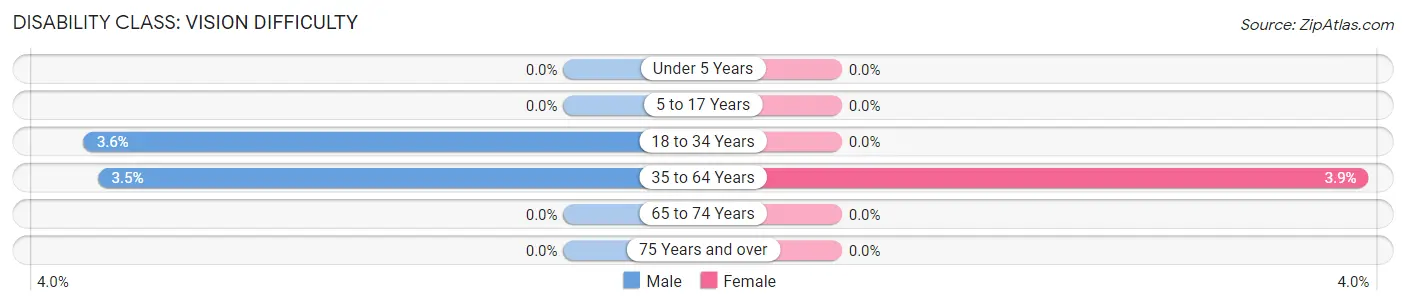
| Age Bracket | Male | Female |
| Under 5 Years | 0 (0.0%) | 0 (0.0%) |
| 5 to 17 Years | 0 (0.0%) | 0 (0.0%) |
| 18 to 34 Years | 22 (3.6%) | 0 (0.0%) |
| 35 to 64 Years | 18 (3.5%) | 27 (3.9%) |
| 65 to 74 Years | 0 (0.0%) | 0 (0.0%) |
| 75 Years and over | 0 (0.0%) | 0 (0.0%) |
Disability Class: Cognitive Difficulty
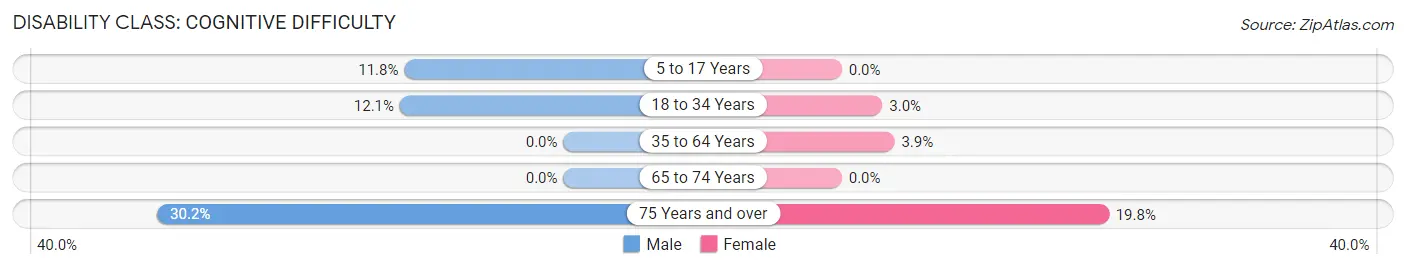
| Age Bracket | Male | Female |
| 5 to 17 Years | 28 (11.8%) | 0 (0.0%) |
| 18 to 34 Years | 75 (12.1%) | 15 (3.0%) |
| 35 to 64 Years | 0 (0.0%) | 27 (3.9%) |
| 65 to 74 Years | 0 (0.0%) | 0 (0.0%) |
| 75 Years and over | 19 (30.2%) | 44 (19.8%) |
Disability Class: Ambulatory Difficulty
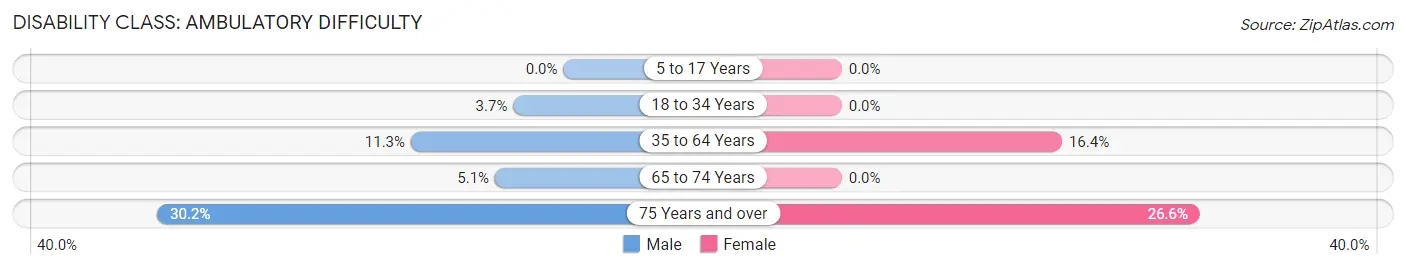
| Age Bracket | Male | Female |
| 5 to 17 Years | 0 (0.0%) | 0 (0.0%) |
| 18 to 34 Years | 23 (3.7%) | 0 (0.0%) |
| 35 to 64 Years | 59 (11.3%) | 113 (16.4%) |
| 65 to 74 Years | 12 (5.1%) | 0 (0.0%) |
| 75 Years and over | 19 (30.2%) | 59 (26.6%) |
Disability Class: Self-Care Difficulty
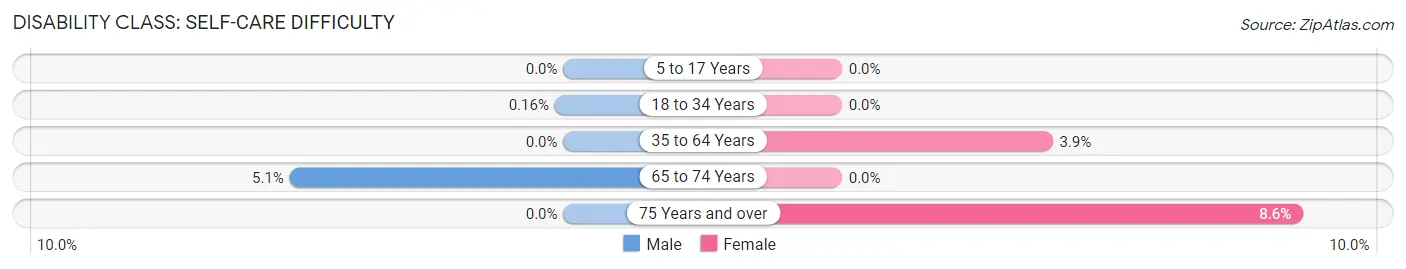
| Age Bracket | Male | Female |
| 5 to 17 Years | 0 (0.0%) | 0 (0.0%) |
| 18 to 34 Years | 1 (0.2%) | 0 (0.0%) |
| 35 to 64 Years | 0 (0.0%) | 27 (3.9%) |
| 65 to 74 Years | 12 (5.1%) | 0 (0.0%) |
| 75 Years and over | 0 (0.0%) | 19 (8.6%) |
Technology Access in Village Green
Computing Device Access in Village Green
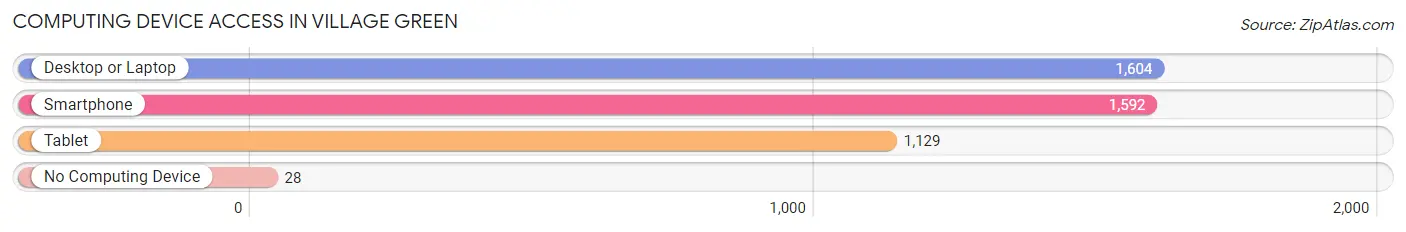
| Device Type | # Households | % Households |
| Desktop or Laptop | 1,604 | 88.3% |
| Smartphone | 1,592 | 87.7% |
| Tablet | 1,129 | 62.2% |
| No Computing Device | 28 | 1.5% |
| Total | 1,816 | 100.0% |
Internet Access in Village Green
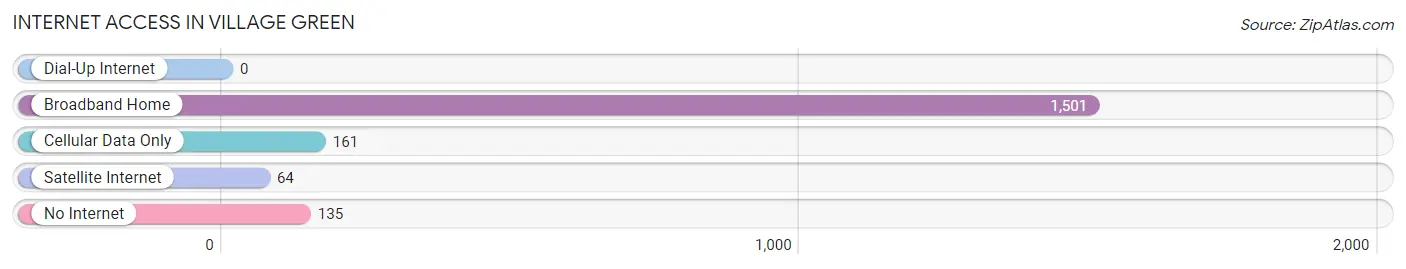
| Internet Type | # Households | % Households |
| Dial-Up Internet | 0 | 0.0% |
| Broadband Home | 1,501 | 82.7% |
| Cellular Data Only | 161 | 8.9% |
| Satellite Internet | 64 | 3.5% |
| No Internet | 135 | 7.4% |
| Total | 1,816 | 100.0% |
Village Green Summary
Village Green is a small hamlet located in the town of Brookhaven in Suffolk County, New York. It is situated on the south shore of Long Island, approximately 60 miles east of New York City. The hamlet is bordered by the hamlets of Bellport to the west, East Patchogue to the east, and Mastic Beach to the south.
History
The area that is now Village Green was originally inhabited by the Secatogue Indians, a sub-tribe of the Montaukett Indians. The Secatogue Indians were a peaceful tribe that lived off the land, fishing and hunting for food. The first European settlers arrived in the area in the late 1600s, and the hamlet was officially established in 1750.
The hamlet was originally known as “The Green” due to its lush vegetation and abundance of trees. In the late 1800s, the hamlet was renamed “Village Green” to distinguish it from other nearby hamlets.
Geography
Village Green is located on the south shore of Long Island, approximately 60 miles east of New York City. The hamlet is bordered by the hamlets of Bellport to the west, East Patchogue to the east, and Mastic Beach to the south.
The hamlet is situated on a flat plain, with an elevation of just 10 feet above sea level. The area is mostly wooded, with a few small ponds and streams. The climate is temperate, with mild winters and hot, humid summers.
Economy
The economy of Village Green is largely based on tourism and agriculture. The hamlet is home to several small businesses, including restaurants, shops, and a few small farms. The hamlet is also home to a few small manufacturing companies.
The hamlet is also home to a few small wineries, which produce a variety of wines. The hamlet is also home to a few small art galleries, which showcase the work of local artists.
Demographics
As of the 2010 census, the population of Village Green was 2,845. The population is predominantly white (90.3%), with a small percentage of African Americans (3.2%), Hispanics (2.7%), and Asians (1.7%). The median household income is $63,929, and the median home value is $323,400.
Conclusion
Village Green is a small hamlet located in the town of Brookhaven in Suffolk County, New York. It is situated on the south shore of Long Island, approximately 60 miles east of New York City. The hamlet is bordered by the hamlets of Bellport to the west, East Patchogue to the east, and Mastic Beach to the south. The economy of Village Green is largely based on tourism and agriculture, and the population is predominantly white. The hamlet is home to several small businesses, including restaurants, shops, and a few small farms. The hamlet is also home to a few small wineries, which produce a variety of wines, and a few small art galleries, which showcase the work of local artists.
Common Questions
What is Per Capita Income in Village Green?
Per Capita income in Village Green is $35,538.
What is the Median Family Income in Village Green?
Median Family Income in Village Green is $71,563.
What is the Median Household income in Village Green?
Median Household Income in Village Green is $60,089.
What is Income or Wage Gap in Village Green?
Income or Wage Gap in Village Green is 41.7%.
Women in Village Green earn 58.3 cents for every dollar earned by a man.
What is Inequality or Gini Index in Village Green?
Inequality or Gini Index in Village Green is 0.37.
What is the Total Population of Village Green?
Total Population of Village Green is 3,747.
What is the Total Male Population of Village Green?
Total Male Population of Village Green is 1,784.
What is the Total Female Population of Village Green?
Total Female Population of Village Green is 1,963.
What is the Ratio of Males per 100 Females in Village Green?
There are 90.88 Males per 100 Females in Village Green.
What is the Ratio of Females per 100 Males in Village Green?
There are 110.03 Females per 100 Males in Village Green.
What is the Median Population Age in Village Green?
Median Population Age in Village Green is 35.9 Years.
What is the Average Family Size in Village Green
Average Family Size in Village Green is 2.9 People.
What is the Average Household Size in Village Green
Average Household Size in Village Green is 2.1 People.
How Large is the Labor Force in Village Green?
There are 2,086 People in the Labor Forcein in Village Green.
What is the Percentage of People in the Labor Force in Village Green?
68.3% of People are in the Labor Force in Village Green.
What is the Unemployment Rate in Village Green?
Unemployment Rate in Village Green is 5.8%.