Scottsville, NY Map & Demographics
Scottsville Map
Scottsville Overview
$37,334
PER CAPITA INCOME
$94,750
AVG FAMILY INCOME
$70,556
AVG HOUSEHOLD INCOME
39.1%
WAGE / INCOME GAP [ % ]
60.9¢/ $1
WAGE / INCOME GAP [ $ ]
0.35
INEQUALITY / GINI INDEX
2,482
TOTAL POPULATION
1,289
MALE POPULATION
1,193
FEMALE POPULATION
108.05
MALES / 100 FEMALES
92.55
FEMALES / 100 MALES
38.3
MEDIAN AGE
2.9
AVG FAMILY SIZE
2.3
AVG HOUSEHOLD SIZE
1,446
LABOR FORCE [ PEOPLE ]
70.7%
PERCENT IN LABOR FORCE
3.8%
UNEMPLOYMENT RATE
Scottsville Zip Codes
Scottsville Area Codes
Income in Scottsville
Income Overview in Scottsville
Per Capita Income in Scottsville is $37,334, while median incomes of families and households are $94,750 and $70,556 respectively.
| Characteristic | Number | Measure |
| Per Capita Income | 2,482 | $37,334 |
| Median Family Income | 633 | $94,750 |
| Mean Family Income | 633 | $103,728 |
| Median Household Income | 1,048 | $70,556 |
| Mean Household Income | 1,048 | $85,674 |
| Income Deficit | 633 | $0 |
| Wage / Income Gap (%) | 2,482 | 39.09% |
| Wage / Income Gap ($) | 2,482 | 60.91¢ per $1 |
| Gini / Inequality Index | 2,482 | 0.35 |
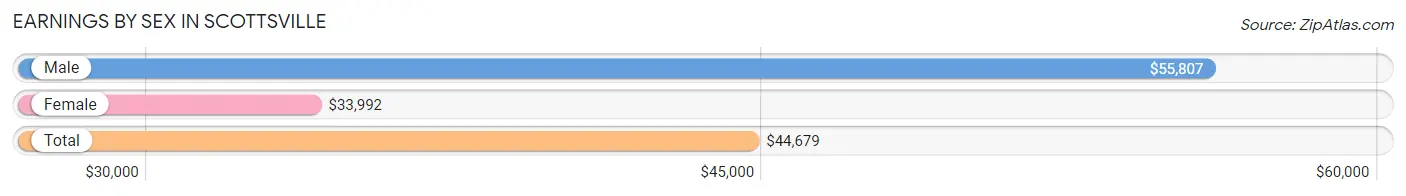
Earnings by Sex in Scottsville
Average Earnings in Scottsville are $44,679, $55,807 for men and $33,992 for women, a difference of 39.1%.
| Sex | Number | Average Earnings |
| Male | 879 (60.0%) | $55,807 |
| Female | 587 (40.0%) | $33,992 |
| Total | 1,466 (100.0%) | $44,679 |
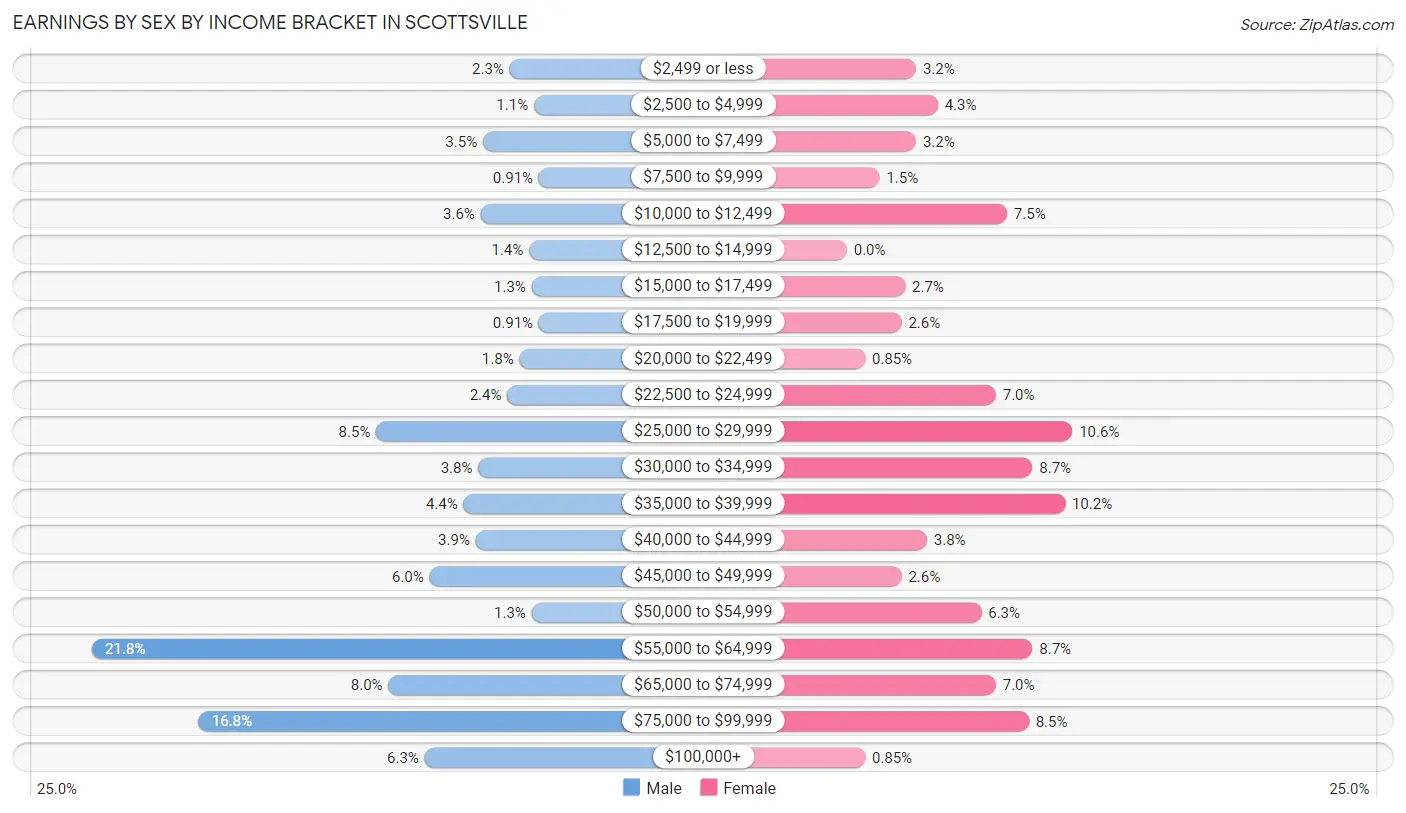
Earnings by Sex by Income Bracket in Scottsville
The most common earnings brackets in Scottsville are $55,000 to $64,999 for men (192 | 21.8%) and $25,000 to $29,999 for women (62 | 10.6%).
| Income | Male | Female |
| $2,499 or less | 20 (2.3%) | 19 (3.2%) |
| $2,500 to $4,999 | 10 (1.1%) | 25 (4.3%) |
| $5,000 to $7,499 | 31 (3.5%) | 19 (3.2%) |
| $7,500 to $9,999 | 8 (0.9%) | 9 (1.5%) |
| $10,000 to $12,499 | 32 (3.6%) | 44 (7.5%) |
| $12,500 to $14,999 | 12 (1.4%) | 0 (0.0%) |
| $15,000 to $17,499 | 11 (1.3%) | 16 (2.7%) |
| $17,500 to $19,999 | 8 (0.9%) | 15 (2.6%) |
| $20,000 to $22,499 | 16 (1.8%) | 5 (0.9%) |
| $22,500 to $24,999 | 21 (2.4%) | 41 (7.0%) |
| $25,000 to $29,999 | 75 (8.5%) | 62 (10.6%) |
| $30,000 to $34,999 | 33 (3.7%) | 51 (8.7%) |
| $35,000 to $39,999 | 39 (4.4%) | 60 (10.2%) |
| $40,000 to $44,999 | 34 (3.9%) | 22 (3.7%) |
| $45,000 to $49,999 | 53 (6.0%) | 15 (2.6%) |
| $50,000 to $54,999 | 11 (1.3%) | 37 (6.3%) |
| $55,000 to $64,999 | 192 (21.8%) | 51 (8.7%) |
| $65,000 to $74,999 | 70 (8.0%) | 41 (7.0%) |
| $75,000 to $99,999 | 148 (16.8%) | 50 (8.5%) |
| $100,000+ | 55 (6.3%) | 5 (0.9%) |
| Total | 879 (100.0%) | 587 (100.0%) |
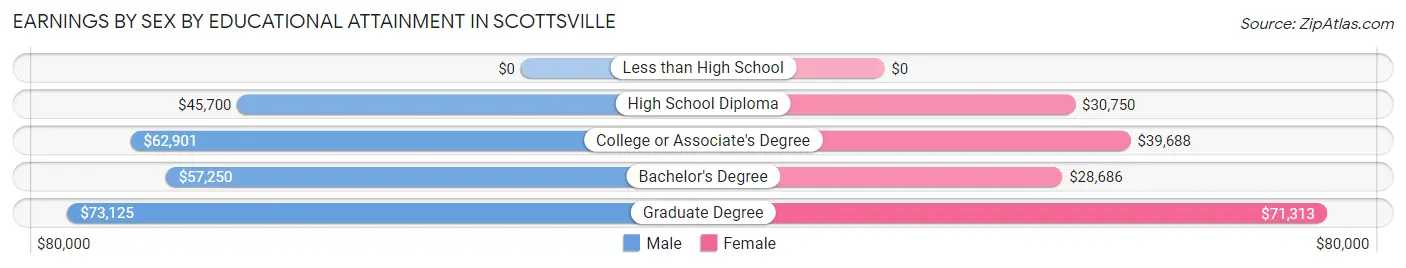
Earnings by Sex by Educational Attainment in Scottsville
Average earnings in Scottsville are $56,788 for men and $38,140 for women, a difference of 32.8%. Men with an educational attainment of graduate degree enjoy the highest average annual earnings of $73,125, while those with high school diploma education earn the least with $45,700. Women with an educational attainment of graduate degree earn the most with the average annual earnings of $71,313, while those with bachelor's degree education have the smallest earnings of $28,686.
| Educational Attainment | Male Income | Female Income |
| Less than High School | - | - |
| High School Diploma | $45,700 | $30,750 |
| College or Associate's Degree | $62,901 | $39,688 |
| Bachelor's Degree | $57,250 | $28,686 |
| Graduate Degree | $73,125 | $71,313 |
| Total | $56,788 | $38,140 |
Family Income in Scottsville
Family Income Brackets in Scottsville
According to the Scottsville family income data, there are 179 families falling into the $100,000 to $149,999 income range, which is the most common income bracket and makes up 28.3% of all families. Conversely, the $15,000 to $24,999 income bracket is the least frequent group with only 2 families (0.3%) belonging to this category.
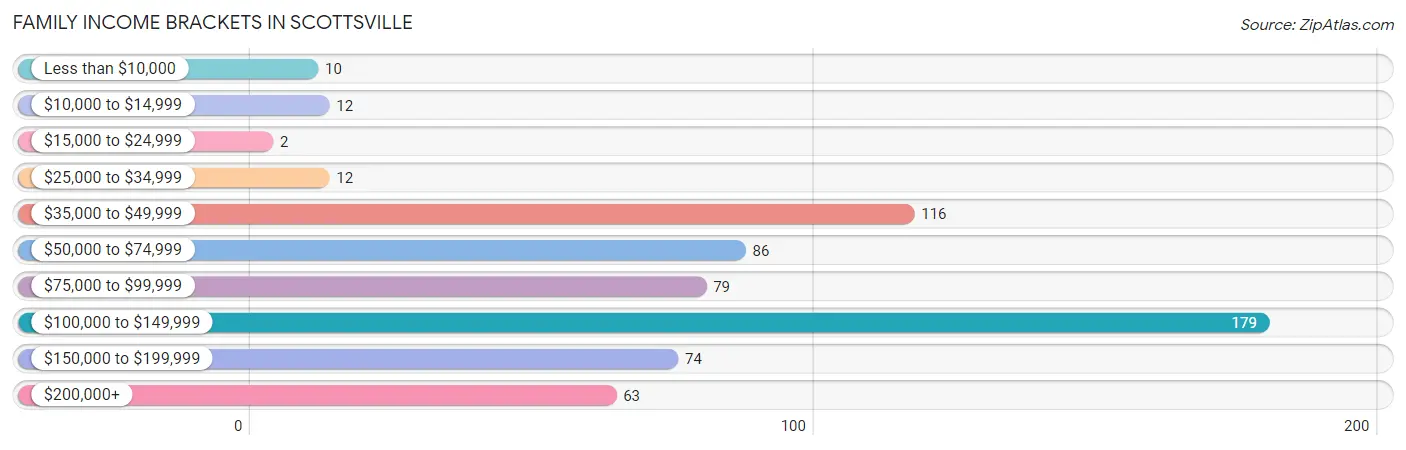
| Income Bracket | # Families | % Families |
| Less than $10,000 | 10 | 1.6% |
| $10,000 to $14,999 | 12 | 1.9% |
| $15,000 to $24,999 | 2 | 0.3% |
| $25,000 to $34,999 | 12 | 1.9% |
| $35,000 to $49,999 | 116 | 18.3% |
| $50,000 to $74,999 | 86 | 13.6% |
| $75,000 to $99,999 | 79 | 12.5% |
| $100,000 to $149,999 | 179 | 28.3% |
| $150,000 to $199,999 | 74 | 11.7% |
| $200,000+ | 63 | 10.0% |
Family Income by Famaliy Size in Scottsville
3-person families (95 | 15.0%) account for the highest median family income in Scottsville with $136,016 per family, while 2-person families (290 | 45.8%) have the highest median income of $52,552 per family member.
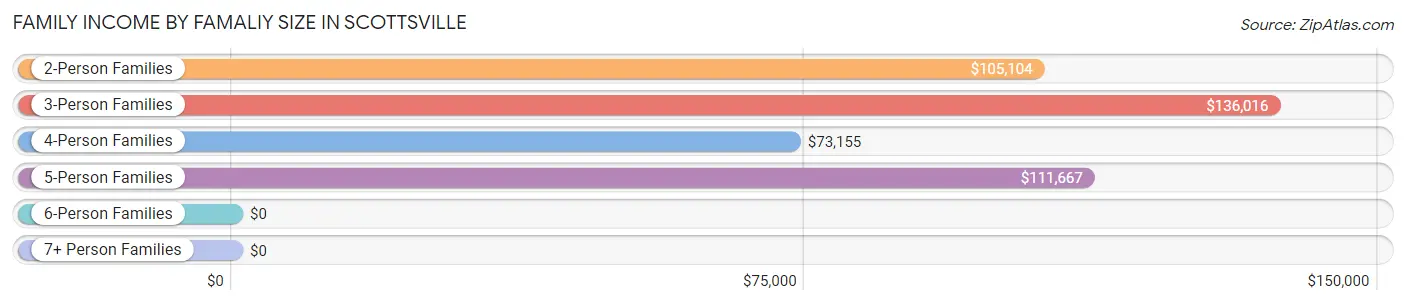
| Income Bracket | # Families | Median Income |
| 2-Person Families | 290 (45.8%) | $105,104 |
| 3-Person Families | 95 (15.0%) | $136,016 |
| 4-Person Families | 209 (33.0%) | $73,155 |
| 5-Person Families | 24 (3.8%) | $111,667 |
| 6-Person Families | 5 (0.8%) | $0 |
| 7+ Person Families | 10 (1.6%) | $0 |
| Total | 633 (100.0%) | $94,750 |
Family Income by Number of Earners in Scottsville
The median family income in Scottsville is $94,750, with families comprising 3+ earners (93) having the highest median family income of $140,250, while families with no earners (75) have the lowest median family income of $55,859, accounting for 14.7% and 11.8% of families, respectively.
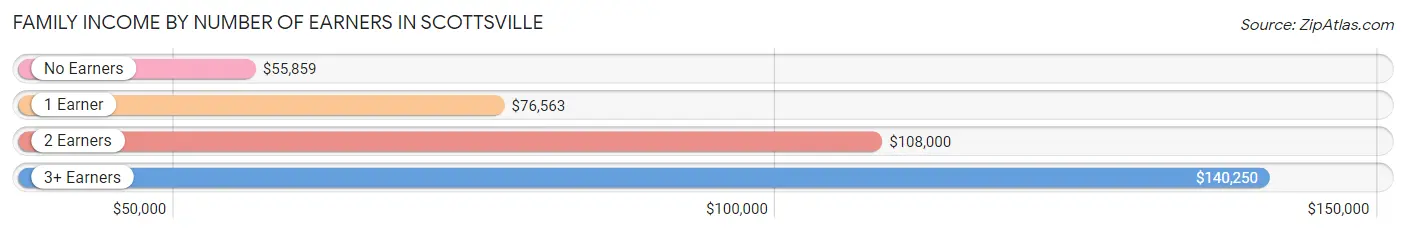
| Number of Earners | # Families | Median Income |
| No Earners | 75 (11.8%) | $55,859 |
| 1 Earner | 175 (27.7%) | $76,563 |
| 2 Earners | 290 (45.8%) | $108,000 |
| 3+ Earners | 93 (14.7%) | $140,250 |
| Total | 633 (100.0%) | $94,750 |
Household Income in Scottsville
Household Income Brackets in Scottsville
With 289 households falling in the category, the $50,000 to $74,999 income range is the most frequent in Scottsville, accounting for 27.6% of all households. In contrast, only 10 households (0.9%) fall into the less than $10,000 income bracket, making it the least populous group.
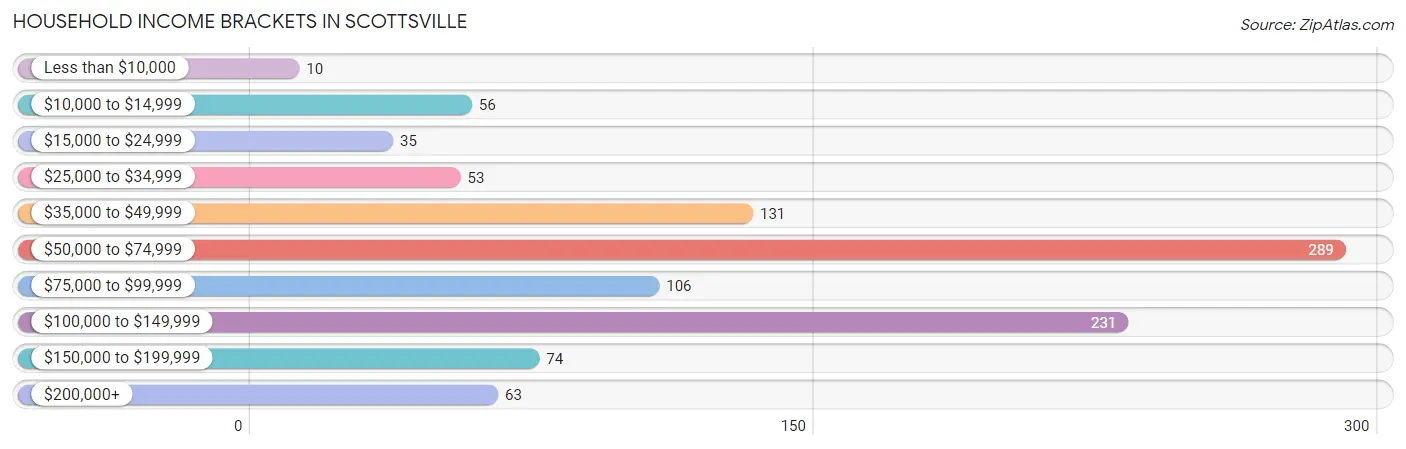
| Income Bracket | # Households | % Households |
| Less than $10,000 | 10 | 1.0% |
| $10,000 to $14,999 | 56 | 5.3% |
| $15,000 to $24,999 | 35 | 3.3% |
| $25,000 to $34,999 | 53 | 5.1% |
| $35,000 to $49,999 | 131 | 12.5% |
| $50,000 to $74,999 | 289 | 27.6% |
| $75,000 to $99,999 | 106 | 10.1% |
| $100,000 to $149,999 | 231 | 22.0% |
| $150,000 to $199,999 | 74 | 7.1% |
| $200,000+ | 63 | 6.0% |
Household Income by Householder Age in Scottsville
The median household income in Scottsville is $70,556, with the highest median household income of $109,000 found in the 15 to 24 years age bracket for the primary householder. A total of 26 households (2.5%) fall into this category. Meanwhile, the 65+ years age bracket for the primary householder has the lowest median household income of $55,750, with 259 households (24.7%) in this group.
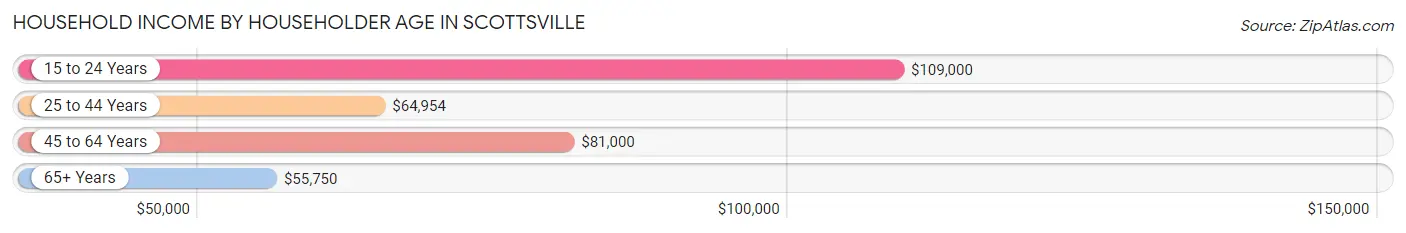
| Income Bracket | # Households | Median Income |
| 15 to 24 Years | 26 (2.5%) | $109,000 |
| 25 to 44 Years | 459 (43.8%) | $64,954 |
| 45 to 64 Years | 304 (29.0%) | $81,000 |
| 65+ Years | 259 (24.7%) | $55,750 |
| Total | 1,048 (100.0%) | $70,556 |
Poverty in Scottsville
Income Below Poverty by Sex and Age in Scottsville
With 11.3% poverty level for males and 12.2% for females among the residents of Scottsville, 65 to 74 year old males and 6 to 11 year old females are the most vulnerable to poverty, with 36 males (25.2%) and 47 females (44.3%) in their respective age groups living below the poverty level.
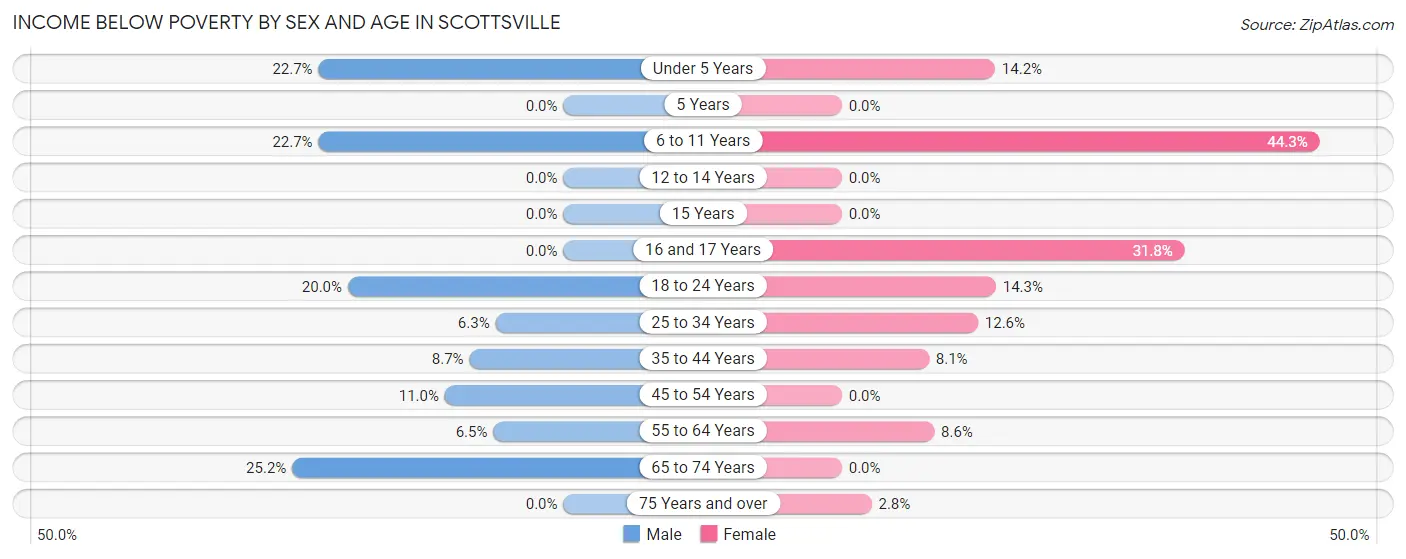
| Age Bracket | Male | Female |
| Under 5 Years | 10 (22.7%) | 27 (14.2%) |
| 5 Years | 0 (0.0%) | 0 (0.0%) |
| 6 to 11 Years | 10 (22.7%) | 47 (44.3%) |
| 12 to 14 Years | 0 (0.0%) | 0 (0.0%) |
| 15 Years | 0 (0.0%) | 0 (0.0%) |
| 16 and 17 Years | 0 (0.0%) | 7 (31.8%) |
| 18 to 24 Years | 24 (20.0%) | 14 (14.3%) |
| 25 to 34 Years | 15 (6.3%) | 24 (12.6%) |
| 35 to 44 Years | 26 (8.7%) | 8 (8.1%) |
| 45 to 54 Years | 11 (11.0%) | 0 (0.0%) |
| 55 to 64 Years | 13 (6.5%) | 15 (8.6%) |
| 65 to 74 Years | 36 (25.2%) | 0 (0.0%) |
| 75 Years and over | 0 (0.0%) | 4 (2.8%) |
| Total | 145 (11.3%) | 146 (12.2%) |
Income Above Poverty by Sex and Age in Scottsville
According to the poverty statistics in Scottsville, males aged 5 years and females aged 5 years are the age groups that are most secure financially, with 100.0% of males and 100.0% of females in these age groups living above the poverty line.
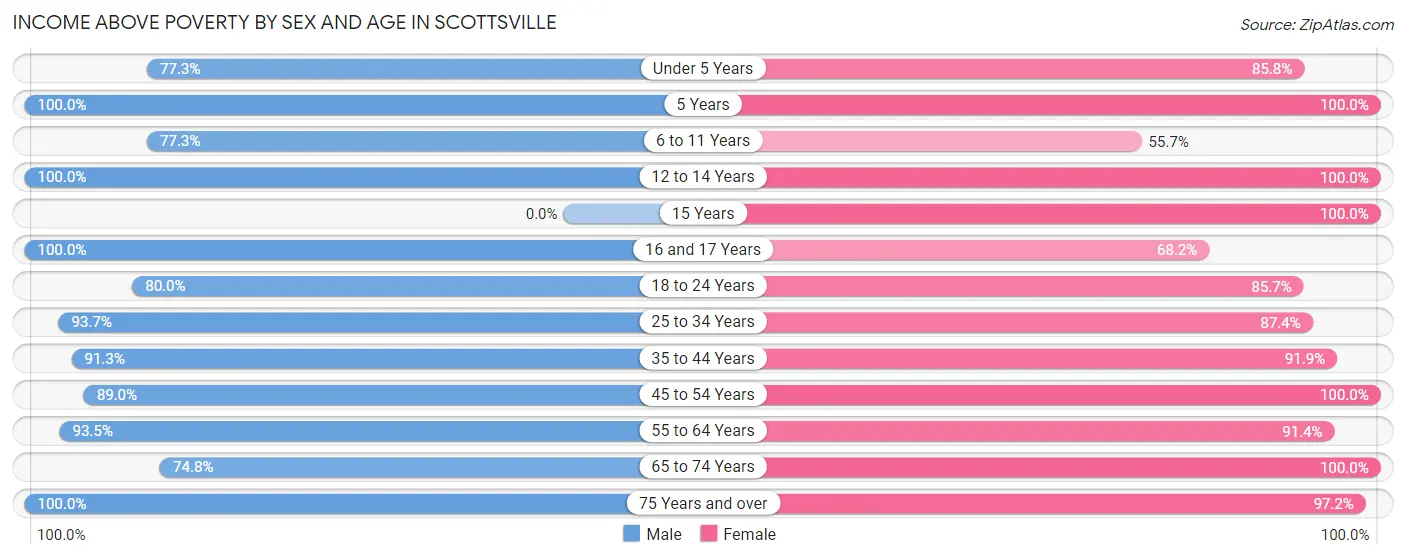
| Age Bracket | Male | Female |
| Under 5 Years | 34 (77.3%) | 163 (85.8%) |
| 5 Years | 4 (100.0%) | 9 (100.0%) |
| 6 to 11 Years | 34 (77.3%) | 59 (55.7%) |
| 12 to 14 Years | 30 (100.0%) | 6 (100.0%) |
| 15 Years | 0 (0.0%) | 4 (100.0%) |
| 16 and 17 Years | 20 (100.0%) | 15 (68.2%) |
| 18 to 24 Years | 96 (80.0%) | 84 (85.7%) |
| 25 to 34 Years | 223 (93.7%) | 166 (87.4%) |
| 35 to 44 Years | 272 (91.3%) | 91 (91.9%) |
| 45 to 54 Years | 89 (89.0%) | 71 (100.0%) |
| 55 to 64 Years | 187 (93.5%) | 160 (91.4%) |
| 65 to 74 Years | 107 (74.8%) | 78 (100.0%) |
| 75 Years and over | 48 (100.0%) | 141 (97.2%) |
| Total | 1,144 (88.7%) | 1,047 (87.8%) |
Income Below Poverty Among Married-Couple Families in Scottsville
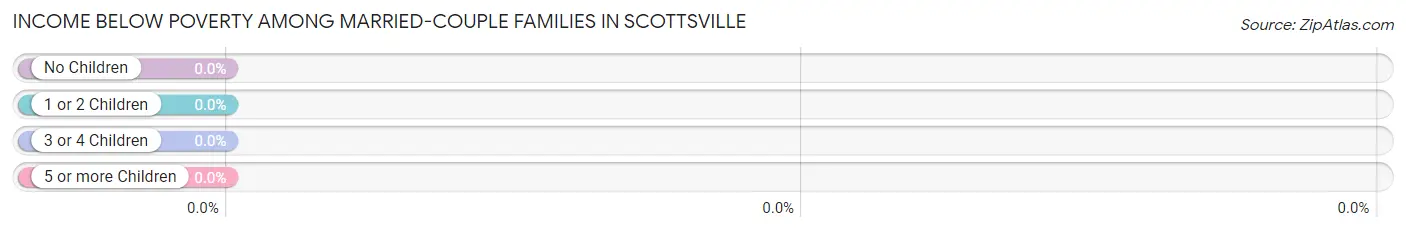
| Children | Above Poverty | Below Poverty |
| No Children | 314 (100.0%) | 0 (0.0%) |
| 1 or 2 Children | 163 (100.0%) | 0 (0.0%) |
| 3 or 4 Children | 29 (100.0%) | 0 (0.0%) |
| 5 or more Children | 0 (0.0%) | 0 (0.0%) |
| Total | 506 (100.0%) | 0 (0.0%) |
Income Below Poverty Among Single-Parent Households in Scottsville
According to the poverty data in Scottsville, 24.4% or 10 single-father households and 16.3% or 14 single-mother households are living below the poverty line. Among single-father households, those with 3 or 4 children have the highest poverty rate, with 10 households (100.0%) experiencing poverty. Likewise, among single-mother households, those with 3 or 4 children have the highest poverty rate, with 14 households (100.0%) falling below the poverty line.
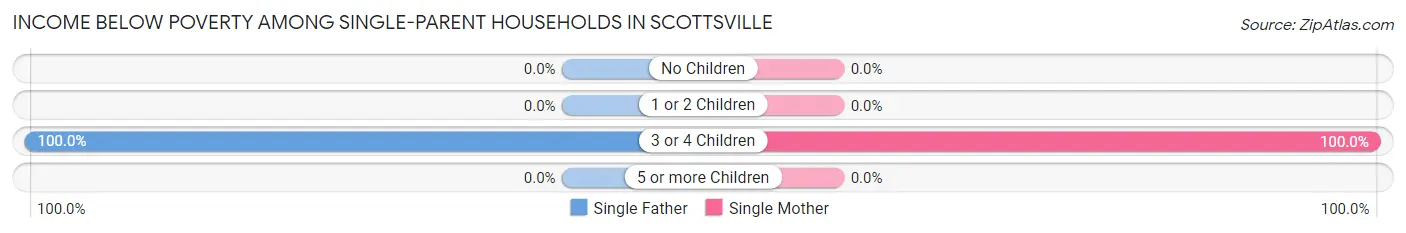
| Children | Single Father | Single Mother |
| No Children | 0 (0.0%) | 0 (0.0%) |
| 1 or 2 Children | 0 (0.0%) | 0 (0.0%) |
| 3 or 4 Children | 10 (100.0%) | 14 (100.0%) |
| 5 or more Children | 0 (0.0%) | 0 (0.0%) |
| Total | 10 (24.4%) | 14 (16.3%) |
Income Below Poverty Among Married-Couple vs Single-Parent Households in Scottsville
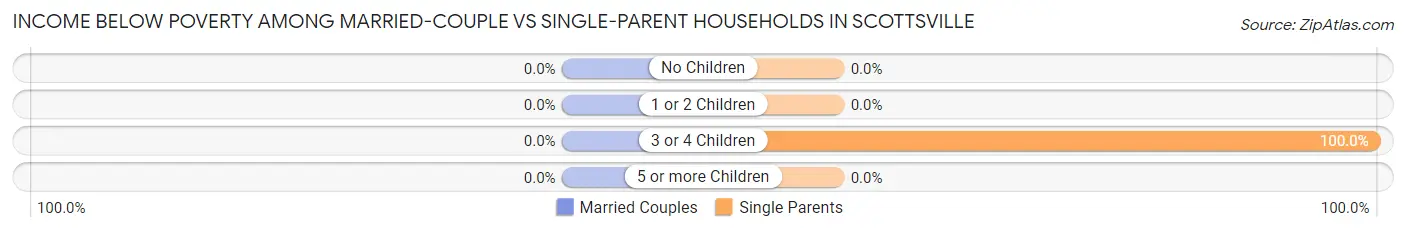
| Children | Married-Couple Families | Single-Parent Households |
| No Children | 0 (0.0%) | 0 (0.0%) |
| 1 or 2 Children | 0 (0.0%) | 0 (0.0%) |
| 3 or 4 Children | 0 (0.0%) | 24 (100.0%) |
| 5 or more Children | 0 (0.0%) | 0 (0.0%) |
| Total | 0 (0.0%) | 24 (18.9%) |
Race in Scottsville
The most populous races in Scottsville are White / Caucasian (2,307 | 92.9%), Hispanic or Latino (131 | 5.3%), and Black / African American (78 | 3.1%).
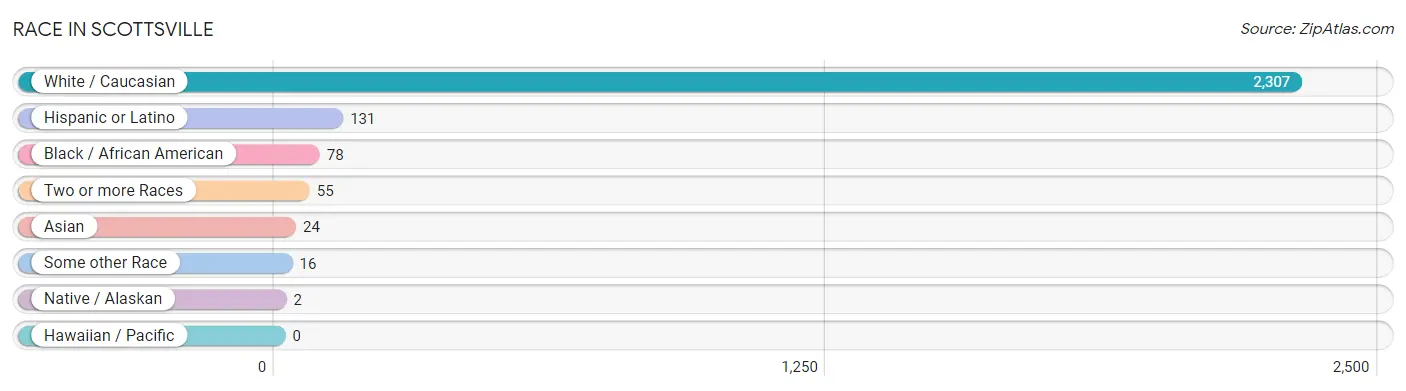
| Race | # Population | % Population |
| Asian | 24 | 1.0% |
| Black / African American | 78 | 3.1% |
| Hawaiian / Pacific | 0 | 0.0% |
| Hispanic or Latino | 131 | 5.3% |
| Native / Alaskan | 2 | 0.1% |
| White / Caucasian | 2,307 | 92.9% |
| Two or more Races | 55 | 2.2% |
| Some other Race | 16 | 0.6% |
| Total | 2,482 | 100.0% |
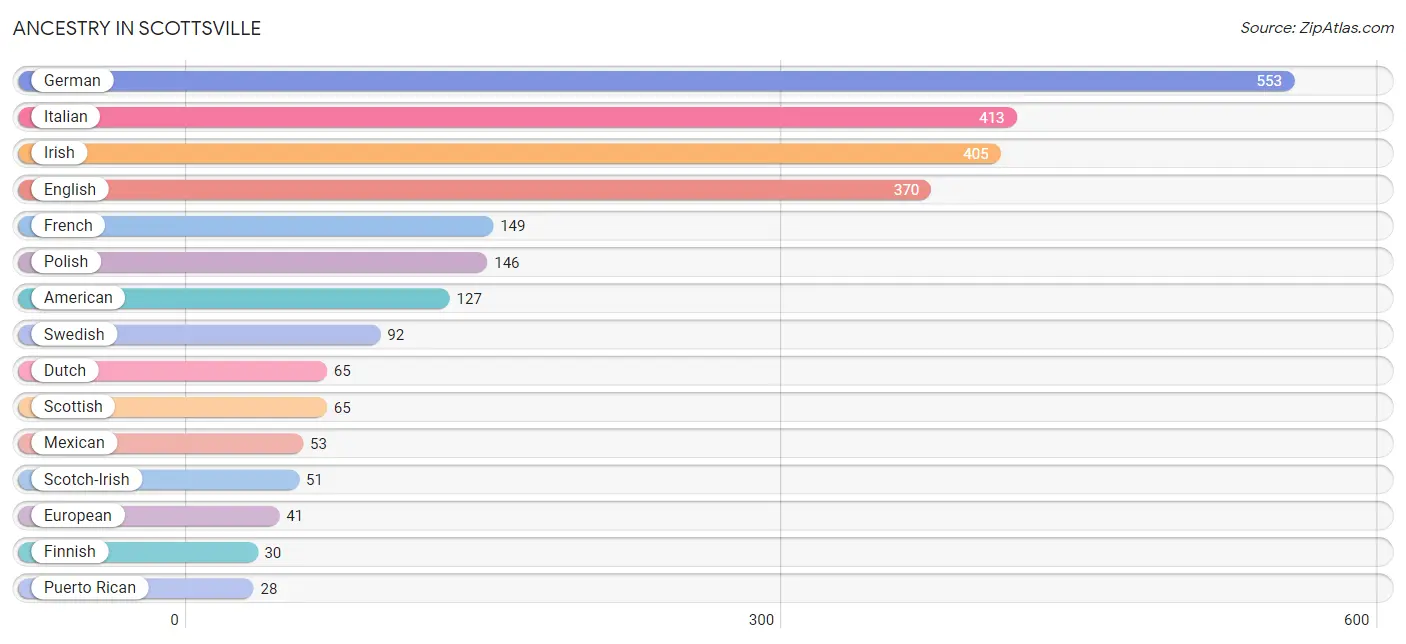
Ancestry in Scottsville
The most populous ancestries reported in Scottsville are German (553 | 22.3%), Italian (413 | 16.6%), Irish (405 | 16.3%), English (370 | 14.9%), and French (149 | 6.0%), together accounting for 76.2% of all Scottsville residents.
| Ancestry | # Population | % Population |
| African | 4 | 0.2% |
| American | 127 | 5.1% |
| Arab | 6 | 0.2% |
| Belgian | 16 | 0.6% |
| British | 4 | 0.2% |
| Canadian | 22 | 0.9% |
| Central American | 16 | 0.6% |
| Creek | 8 | 0.3% |
| Croatian | 6 | 0.2% |
| Cuban | 14 | 0.6% |
| Czech | 4 | 0.2% |
| Danish | 20 | 0.8% |
| Dutch | 65 | 2.6% |
| English | 370 | 14.9% |
| European | 41 | 1.7% |
| Finnish | 30 | 1.2% |
| French | 149 | 6.0% |
| French Canadian | 22 | 0.9% |
| German | 553 | 22.3% |
| Greek | 21 | 0.9% |
| Guatemalan | 16 | 0.6% |
| Indian (Asian) | 6 | 0.2% |
| Irish | 405 | 16.3% |
| Iroquois | 2 | 0.1% |
| Italian | 413 | 16.6% |
| Jamaican | 4 | 0.2% |
| Korean | 5 | 0.2% |
| Latvian | 24 | 1.0% |
| Mexican | 53 | 2.1% |
| Norwegian | 21 | 0.9% |
| Polish | 146 | 5.9% |
| Puerto Rican | 28 | 1.1% |
| Romanian | 3 | 0.1% |
| Russian | 23 | 0.9% |
| Samoan | 8 | 0.3% |
| Scandinavian | 12 | 0.5% |
| Scotch-Irish | 51 | 2.1% |
| Scottish | 65 | 2.6% |
| Subsaharan African | 4 | 0.2% |
| Swedish | 92 | 3.7% |
| Swiss | 5 | 0.2% |
| Thai | 19 | 0.8% |
| Ukrainian | 9 | 0.4% |
| Welsh | 17 | 0.7% | View All 44 Rows |
Immigrants in Scottsville
The most numerous immigrant groups reported in Scottsville came from Europe (27 | 1.1%), Canada (26 | 1.1%), Asia (24 | 1.0%), South Central Asia (19 | 0.8%), and Northern Europe (17 | 0.7%), together accounting for 4.6% of all Scottsville residents.
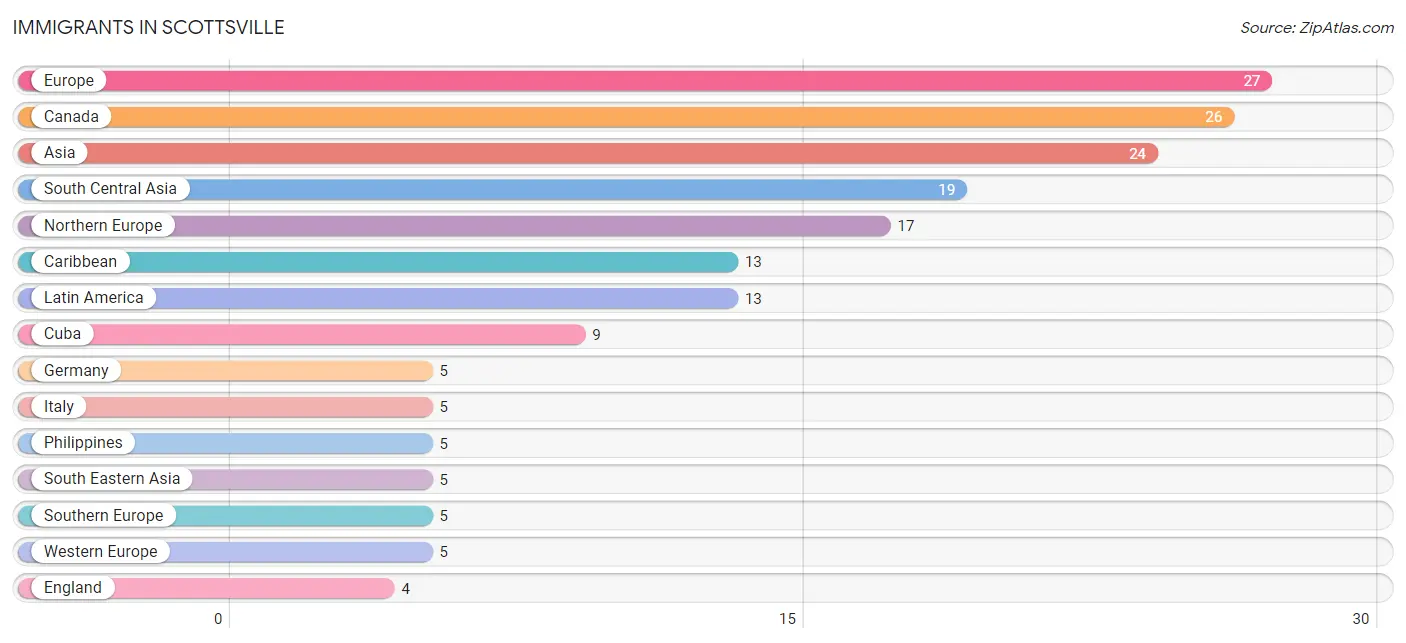
| Immigration Origin | # Population | % Population |
| Asia | 24 | 1.0% |
| Canada | 26 | 1.1% |
| Caribbean | 13 | 0.5% |
| Cuba | 9 | 0.4% |
| England | 4 | 0.2% |
| Europe | 27 | 1.1% |
| Germany | 5 | 0.2% |
| Italy | 5 | 0.2% |
| Jamaica | 4 | 0.2% |
| Latin America | 13 | 0.5% |
| Northern Europe | 17 | 0.7% |
| Philippines | 5 | 0.2% |
| Scotland | 3 | 0.1% |
| South Central Asia | 19 | 0.8% |
| South Eastern Asia | 5 | 0.2% |
| Southern Europe | 5 | 0.2% |
| Western Europe | 5 | 0.2% | View All 17 Rows |
Sex and Age in Scottsville
Sex and Age in Scottsville
The most populous age groups in Scottsville are 25 to 29 Years (180 | 14.0%) for men and Under 5 Years (190 | 15.9%) for women.
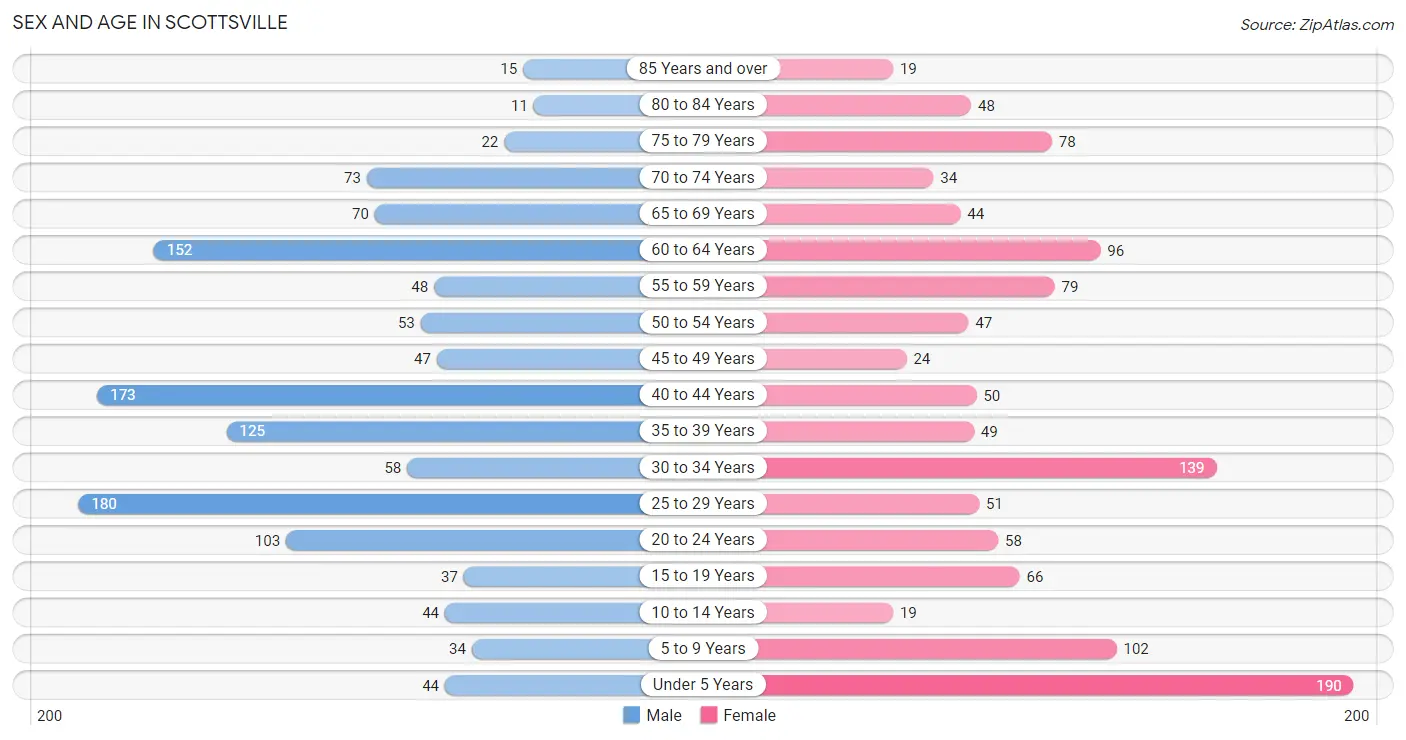
| Age Bracket | Male | Female |
| Under 5 Years | 44 (3.4%) | 190 (15.9%) |
| 5 to 9 Years | 34 (2.6%) | 102 (8.6%) |
| 10 to 14 Years | 44 (3.4%) | 19 (1.6%) |
| 15 to 19 Years | 37 (2.9%) | 66 (5.5%) |
| 20 to 24 Years | 103 (8.0%) | 58 (4.9%) |
| 25 to 29 Years | 180 (14.0%) | 51 (4.3%) |
| 30 to 34 Years | 58 (4.5%) | 139 (11.7%) |
| 35 to 39 Years | 125 (9.7%) | 49 (4.1%) |
| 40 to 44 Years | 173 (13.4%) | 50 (4.2%) |
| 45 to 49 Years | 47 (3.6%) | 24 (2.0%) |
| 50 to 54 Years | 53 (4.1%) | 47 (3.9%) |
| 55 to 59 Years | 48 (3.7%) | 79 (6.6%) |
| 60 to 64 Years | 152 (11.8%) | 96 (8.1%) |
| 65 to 69 Years | 70 (5.4%) | 44 (3.7%) |
| 70 to 74 Years | 73 (5.7%) | 34 (2.9%) |
| 75 to 79 Years | 22 (1.7%) | 78 (6.5%) |
| 80 to 84 Years | 11 (0.9%) | 48 (4.0%) |
| 85 Years and over | 15 (1.2%) | 19 (1.6%) |
| Total | 1,289 (100.0%) | 1,193 (100.0%) |
Families and Households in Scottsville
Median Family Size in Scottsville
The median family size in Scottsville is 2.94 persons per family, with single female/mother families (86 | 13.6%) accounting for the largest median family size of 4.01 persons per family. On the other hand, single male/father families (41 | 6.5%) represent the smallest median family size with 2.51 persons per family.
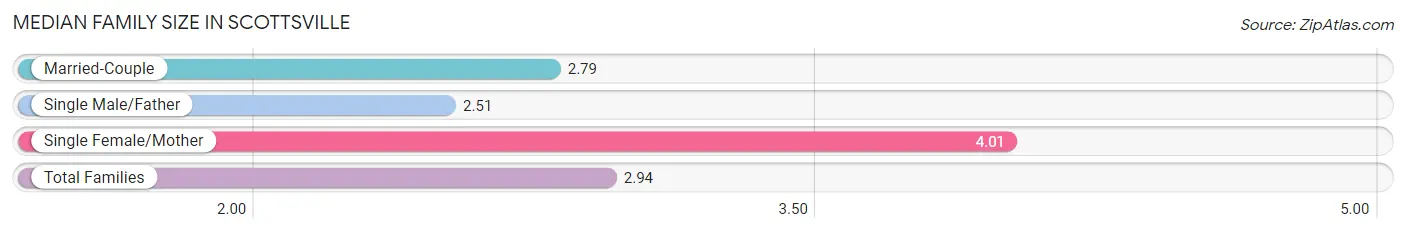
| Family Type | # Families | Family Size |
| Married-Couple | 506 (79.9%) | 2.79 |
| Single Male/Father | 41 (6.5%) | 2.51 |
| Single Female/Mother | 86 (13.6%) | 4.01 |
| Total Families | 633 (100.0%) | 2.94 |
Median Household Size in Scottsville
The median household size in Scottsville is 2.34 persons per household, with single female/mother households (86 | 8.2%) accounting for the largest median household size of 4.56 persons per household. non-family households (415 | 39.6%) represent the smallest median household size with 1.21 persons per household.
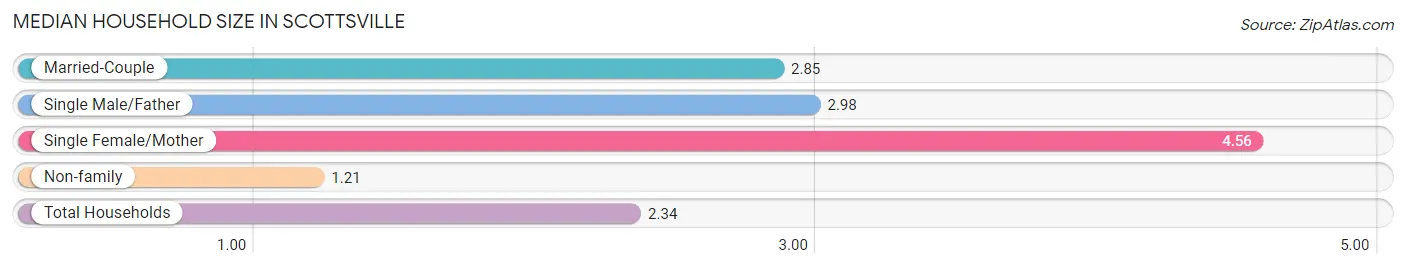
| Household Type | # Households | Household Size |
| Married-Couple | 506 (48.3%) | 2.85 |
| Single Male/Father | 41 (3.9%) | 2.98 |
| Single Female/Mother | 86 (8.2%) | 4.56 |
| Non-family | 415 (39.6%) | 1.21 |
| Total Households | 1,048 (100.0%) | 2.34 |
Household Size by Marriage Status in Scottsville
Out of a total of 1,048 households in Scottsville, 633 (60.4%) are family households, while 415 (39.6%) are nonfamily households. The most numerous type of family households are 2-person households, comprising 279, and the most common type of nonfamily households are 1-person households, comprising 350.
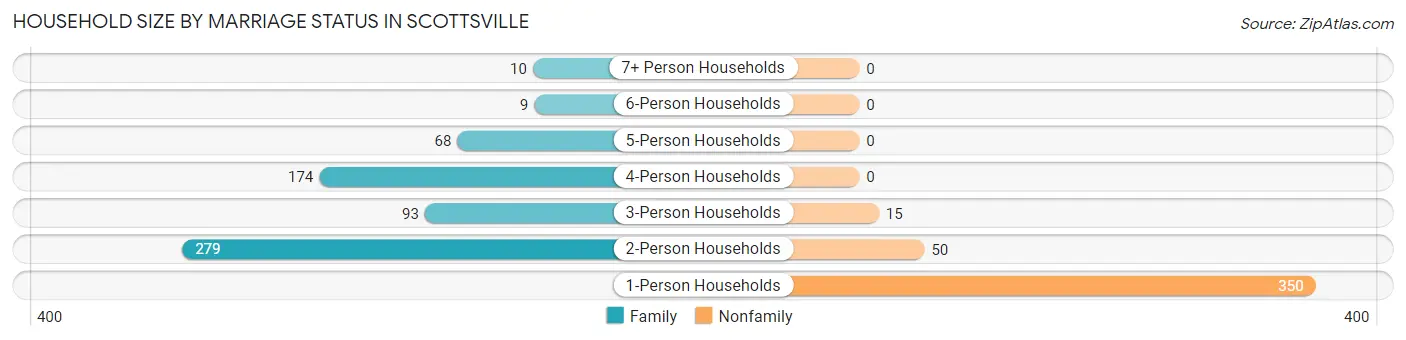
| Household Size | Family Households | Nonfamily Households |
| 1-Person Households | - | 350 (33.4%) |
| 2-Person Households | 279 (26.6%) | 50 (4.8%) |
| 3-Person Households | 93 (8.9%) | 15 (1.4%) |
| 4-Person Households | 174 (16.6%) | 0 (0.0%) |
| 5-Person Households | 68 (6.5%) | 0 (0.0%) |
| 6-Person Households | 9 (0.9%) | 0 (0.0%) |
| 7+ Person Households | 10 (0.9%) | 0 (0.0%) |
| Total | 633 (60.4%) | 415 (39.6%) |
Female Fertility in Scottsville
Fertility by Age in Scottsville
Average fertility rate in Scottsville is 52.0 births per 1,000 women. Women in the age bracket of 20 to 34 years have the highest fertility rate with 69.0 births per 1,000 women. Women in the age bracket of 20 to 34 years acount for 73.9% of all women with births.
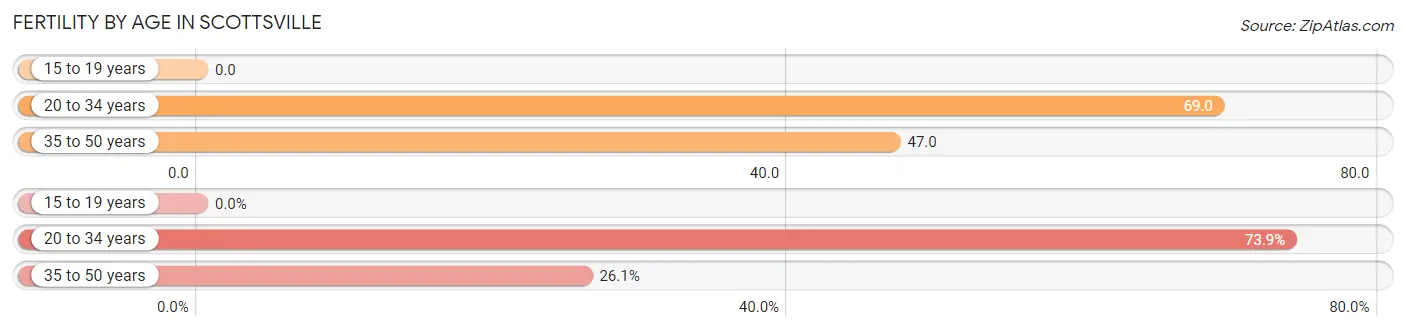
| Age Bracket | Women with Births | Births / 1,000 Women |
| 15 to 19 years | 0 (0.0%) | 0.0 |
| 20 to 34 years | 17 (73.9%) | 69.0 |
| 35 to 50 years | 6 (26.1%) | 47.0 |
| Total | 23 (100.0%) | 52.0 |
Fertility by Age by Marriage Status in Scottsville
52.2% of women with births (23) in Scottsville are married. The highest percentage of unmarried women with births falls into 35 to 50 years age bracket with 100.0% of them unmarried at the time of birth, while the lowest percentage of unmarried women with births belong to 20 to 34 years age bracket with 29.4% of them unmarried.
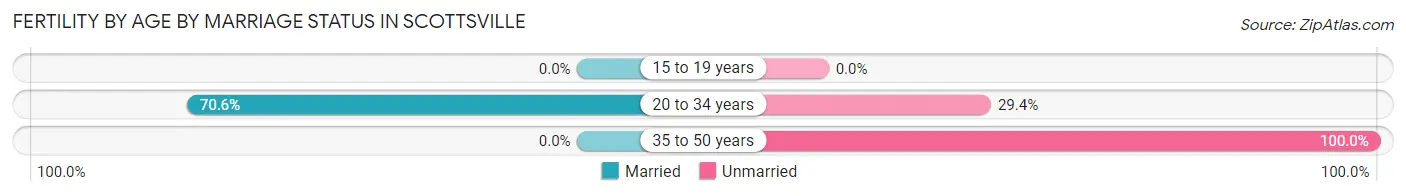
| Age Bracket | Married | Unmarried |
| 15 to 19 years | 0 (0.0%) | 0 (0.0%) |
| 20 to 34 years | 12 (70.6%) | 5 (29.4%) |
| 35 to 50 years | 0 (0.0%) | 6 (100.0%) |
| Total | 12 (52.2%) | 11 (47.8%) |
Fertility by Education in Scottsville
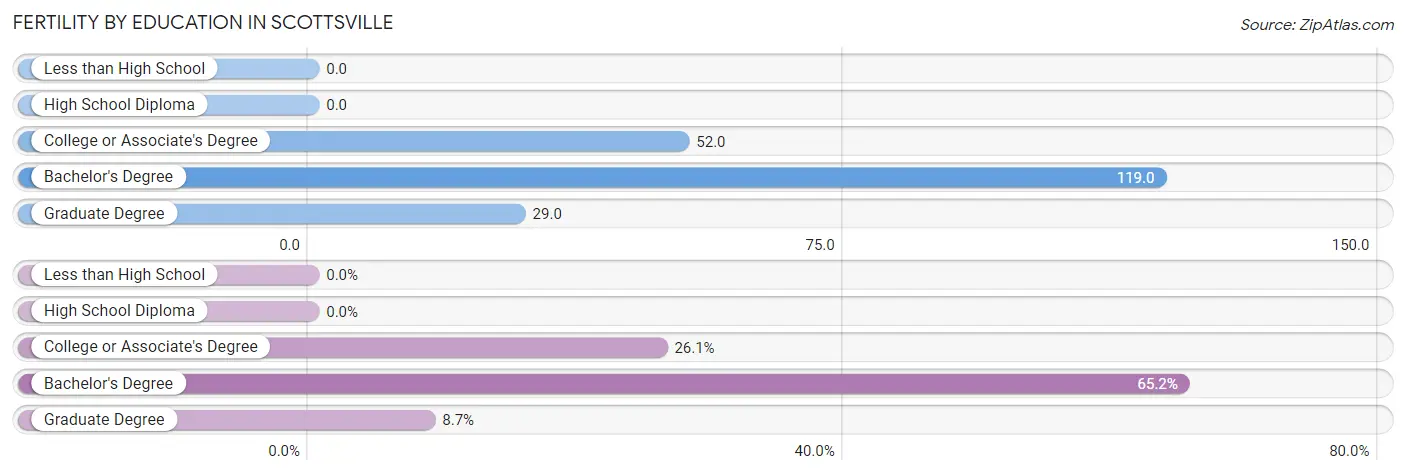
| Educational Attainment | Women with Births | Births / 1,000 Women |
| Less than High School | 0 (0.0%) | 0.0 |
| High School Diploma | 0 (0.0%) | 0.0 |
| College or Associate's Degree | 6 (26.1%) | 52.0 |
| Bachelor's Degree | 15 (65.2%) | 119.0 |
| Graduate Degree | 2 (8.7%) | 29.0 |
| Total | 23 (100.0%) | 52.0 |
Fertility by Education by Marriage Status in Scottsville
47.8% of women with births in Scottsville are unmarried. Women with the educational attainment of graduate degree are most likely to be married with 100.0% of them married at childbirth, while women with the educational attainment of college or associate's degree are least likely to be married with 100.0% of them unmarried at childbirth.
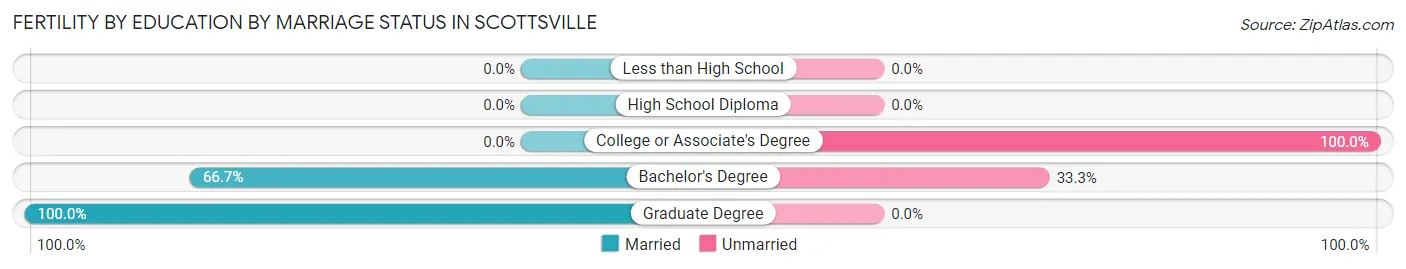
| Educational Attainment | Married | Unmarried |
| Less than High School | 0 (0.0%) | 0 (0.0%) |
| High School Diploma | 0 (0.0%) | 0 (0.0%) |
| College or Associate's Degree | 0 (0.0%) | 6 (100.0%) |
| Bachelor's Degree | 10 (66.7%) | 5 (33.3%) |
| Graduate Degree | 2 (100.0%) | 0 (0.0%) |
| Total | 12 (52.2%) | 11 (47.8%) |
Employment Characteristics in Scottsville
Employment by Class of Employer in Scottsville
Among the 1,361 employed individuals in Scottsville, private company employees (956 | 70.2%), not-for-profit organizations (157 | 11.5%), and local government employees (82 | 6.0%) make up the most common classes of employment.
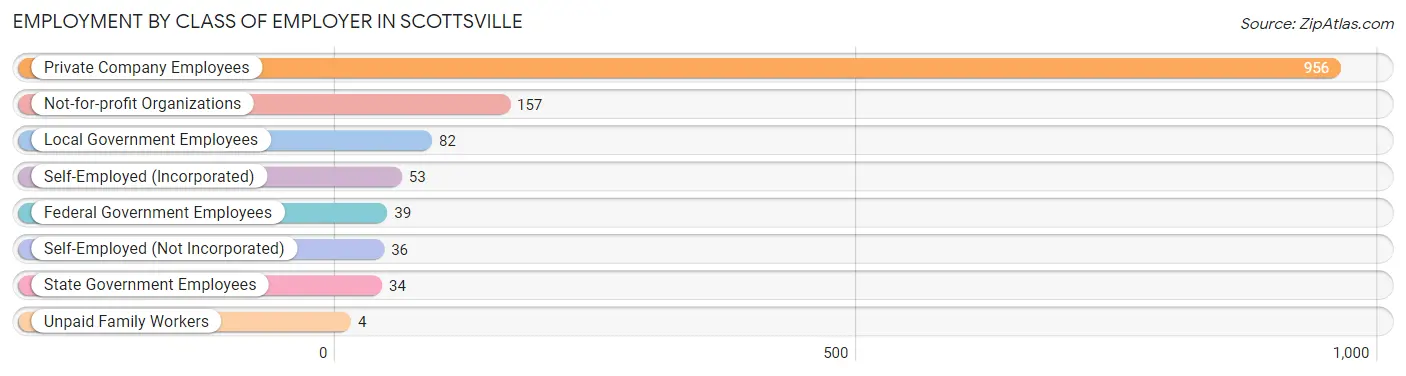
| Employer Class | # Employees | % Employees |
| Private Company Employees | 956 | 70.2% |
| Self-Employed (Incorporated) | 53 | 3.9% |
| Self-Employed (Not Incorporated) | 36 | 2.6% |
| Not-for-profit Organizations | 157 | 11.5% |
| Local Government Employees | 82 | 6.0% |
| State Government Employees | 34 | 2.5% |
| Federal Government Employees | 39 | 2.9% |
| Unpaid Family Workers | 4 | 0.3% |
| Total | 1,361 | 100.0% |
Employment Status by Age in Scottsville
According to the labor force statistics for Scottsville, out of the total population over 16 years of age (2,045), 70.7% or 1,446 individuals are in the labor force, with 3.8% or 55 of them unemployed. The age group with the highest labor force participation rate is 25 to 29 years, with 97.8% or 226 individuals in the labor force. Within the labor force, the 75 years and over age range has the highest percentage of unemployed individuals, with 58.3% or 7 of them being unemployed.
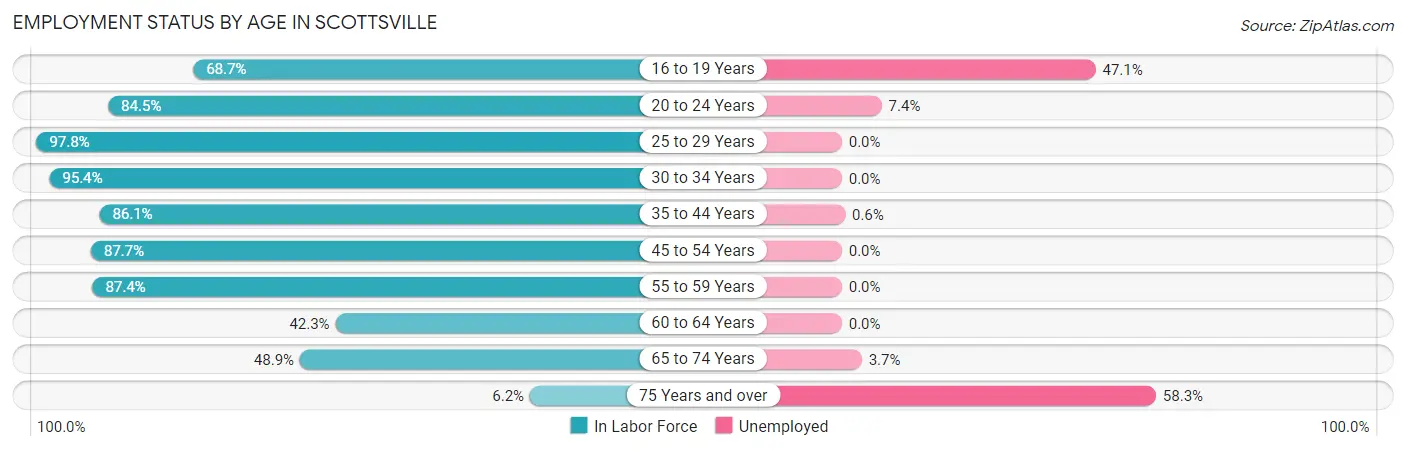
| Age Bracket | In Labor Force | Unemployed |
| 16 to 19 Years | 68 (68.7%) | 32 (47.1%) |
| 20 to 24 Years | 136 (84.5%) | 10 (7.4%) |
| 25 to 29 Years | 226 (97.8%) | 0 (0.0%) |
| 30 to 34 Years | 188 (95.4%) | 0 (0.0%) |
| 35 to 44 Years | 342 (86.1%) | 2 (0.6%) |
| 45 to 54 Years | 150 (87.7%) | 0 (0.0%) |
| 55 to 59 Years | 111 (87.4%) | 0 (0.0%) |
| 60 to 64 Years | 105 (42.3%) | 0 (0.0%) |
| 65 to 74 Years | 108 (48.9%) | 4 (3.7%) |
| 75 Years and over | 12 (6.2%) | 7 (58.3%) |
| Total | 1,446 (70.7%) | 55 (3.8%) |
Employment Status by Educational Attainment in Scottsville
According to labor force statistics for Scottsville, 81.8% of individuals (1,121) out of the total population between 25 and 64 years of age (1,371) are in the labor force, with 0.2% or 2 of them being unemployed. The group with the highest labor force participation rate are those with the educational attainment of college / associate degree, with 89.6% or 430 individuals in the labor force. Within the labor force, individuals with college / associate degree education have the highest percentage of unemployment, with 0.5% or 2 of them being unemployed.
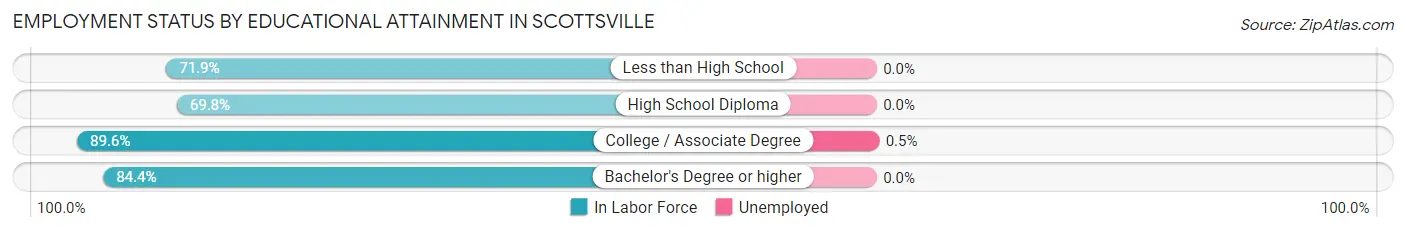
| Educational Attainment | In Labor Force | Unemployed |
| Less than High School | 41 (71.9%) | 0 (0.0%) |
| High School Diploma | 252 (69.8%) | 0 (0.0%) |
| College / Associate Degree | 430 (89.6%) | 2 (0.5%) |
| Bachelor's Degree or higher | 399 (84.4%) | 0 (0.0%) |
| Total | 1,121 (81.8%) | 3 (0.2%) |
Employment Occupations by Sex in Scottsville
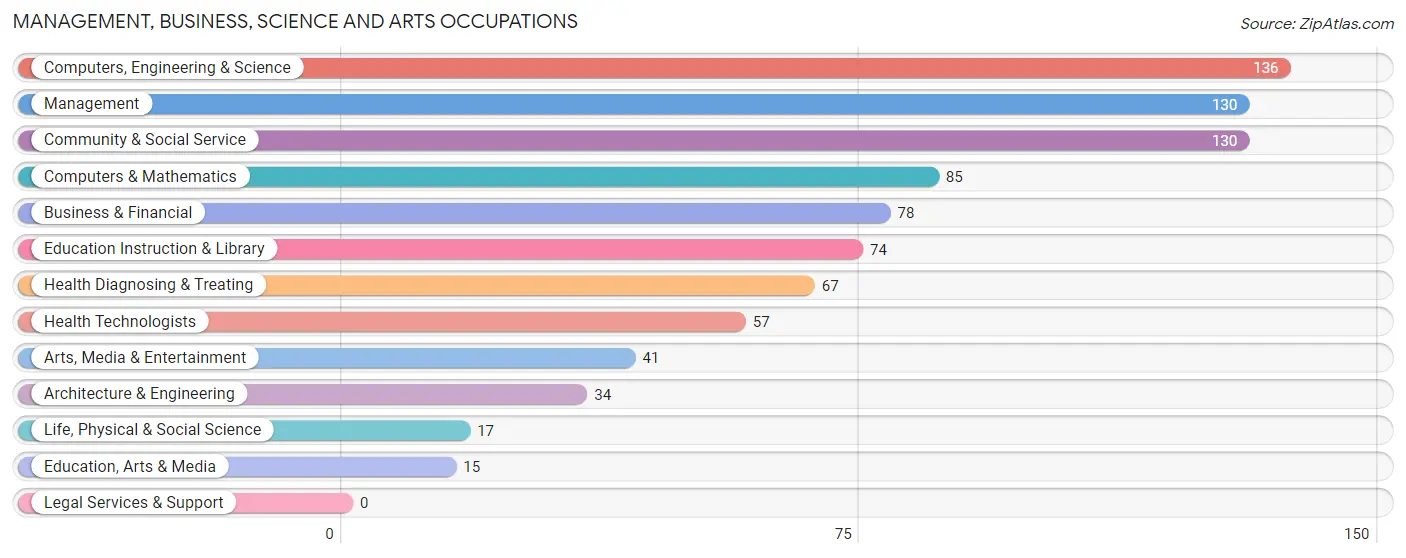
Management, Business, Science and Arts Occupations
The most common Management, Business, Science and Arts occupations in Scottsville are Computers, Engineering & Science (136 | 9.8%), Management (130 | 9.3%), Community & Social Service (130 | 9.3%), Computers & Mathematics (85 | 6.1%), and Business & Financial (78 | 5.6%).
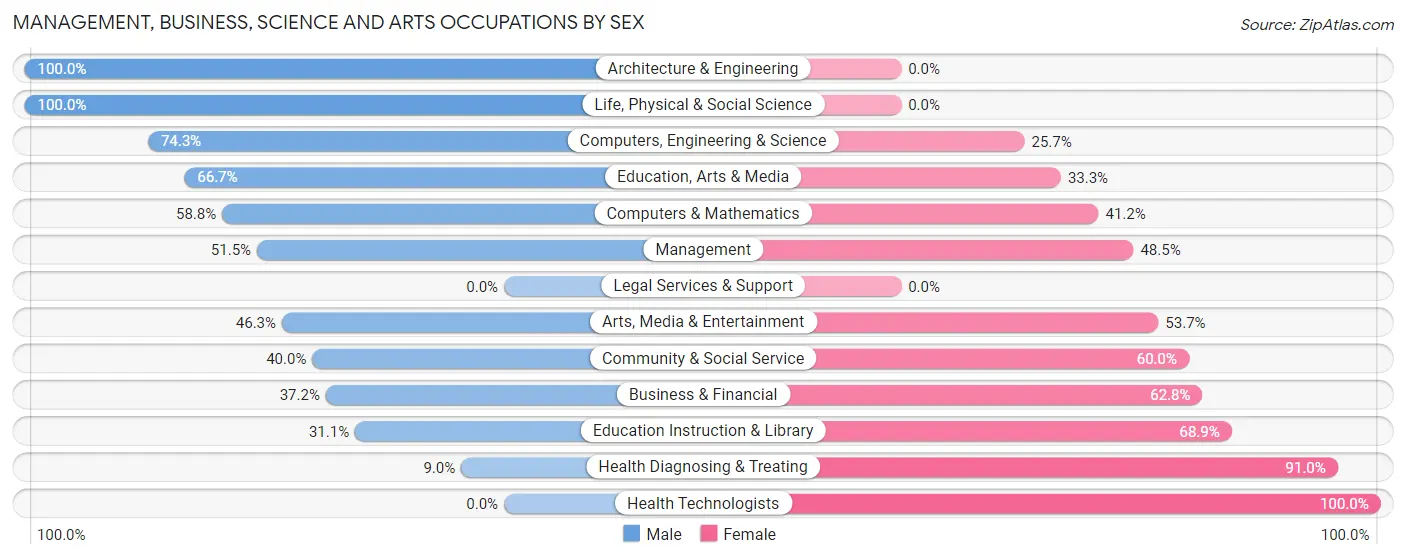
Management, Business, Science and Arts Occupations by Sex
Within the Management, Business, Science and Arts occupations in Scottsville, the most male-oriented occupations are Architecture & Engineering (100.0%), Life, Physical & Social Science (100.0%), and Computers, Engineering & Science (74.3%), while the most female-oriented occupations are Health Technologists (100.0%), Health Diagnosing & Treating (91.0%), and Education Instruction & Library (68.9%).
| Occupation | Male | Female |
| Management | 67 (51.5%) | 63 (48.5%) |
| Business & Financial | 29 (37.2%) | 49 (62.8%) |
| Computers, Engineering & Science | 101 (74.3%) | 35 (25.7%) |
| Computers & Mathematics | 50 (58.8%) | 35 (41.2%) |
| Architecture & Engineering | 34 (100.0%) | 0 (0.0%) |
| Life, Physical & Social Science | 17 (100.0%) | 0 (0.0%) |
| Community & Social Service | 52 (40.0%) | 78 (60.0%) |
| Education, Arts & Media | 10 (66.7%) | 5 (33.3%) |
| Legal Services & Support | 0 (0.0%) | 0 (0.0%) |
| Education Instruction & Library | 23 (31.1%) | 51 (68.9%) |
| Arts, Media & Entertainment | 19 (46.3%) | 22 (53.7%) |
| Health Diagnosing & Treating | 6 (9.0%) | 61 (91.0%) |
| Health Technologists | 0 (0.0%) | 57 (100.0%) |
| Total (Category) | 255 (47.1%) | 286 (52.9%) |
| Total (Overall) | 853 (61.3%) | 538 (38.7%) |
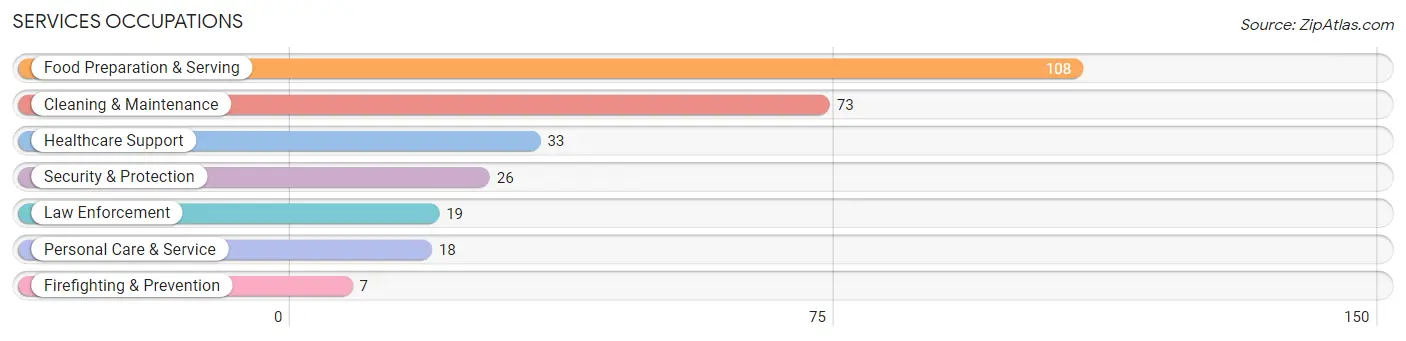
Services Occupations
The most common Services occupations in Scottsville are Food Preparation & Serving (108 | 7.8%), Cleaning & Maintenance (73 | 5.2%), Healthcare Support (33 | 2.4%), Security & Protection (26 | 1.9%), and Law Enforcement (19 | 1.4%).
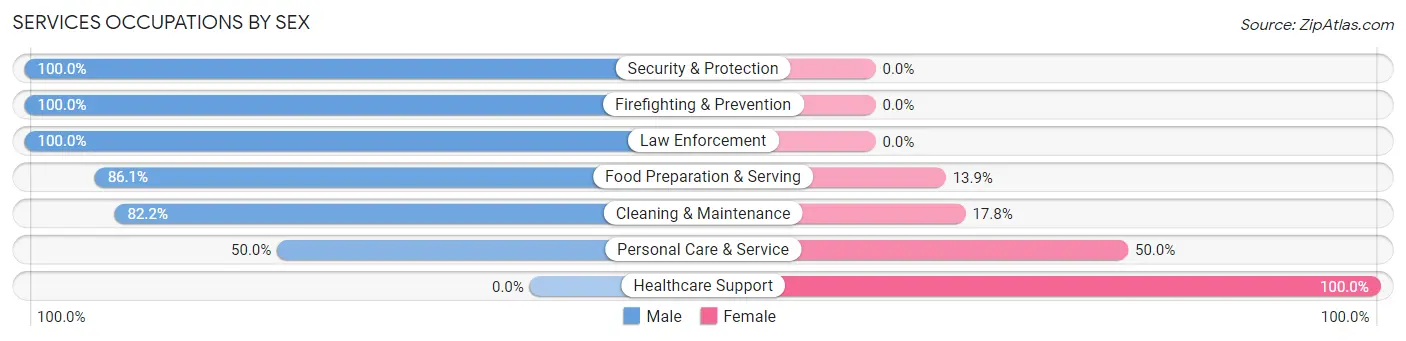
Services Occupations by Sex
Within the Services occupations in Scottsville, the most male-oriented occupations are Security & Protection (100.0%), Firefighting & Prevention (100.0%), and Law Enforcement (100.0%), while the most female-oriented occupations are Healthcare Support (100.0%), Personal Care & Service (50.0%), and Cleaning & Maintenance (17.8%).
| Occupation | Male | Female |
| Healthcare Support | 0 (0.0%) | 33 (100.0%) |
| Security & Protection | 26 (100.0%) | 0 (0.0%) |
| Firefighting & Prevention | 7 (100.0%) | 0 (0.0%) |
| Law Enforcement | 19 (100.0%) | 0 (0.0%) |
| Food Preparation & Serving | 93 (86.1%) | 15 (13.9%) |
| Cleaning & Maintenance | 60 (82.2%) | 13 (17.8%) |
| Personal Care & Service | 9 (50.0%) | 9 (50.0%) |
| Total (Category) | 188 (72.9%) | 70 (27.1%) |
| Total (Overall) | 853 (61.3%) | 538 (38.7%) |
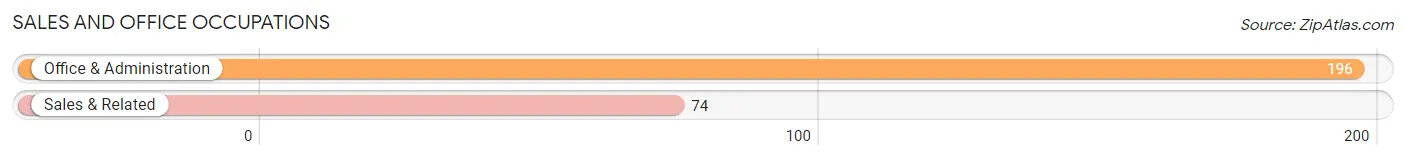
Sales and Office Occupations
The most common Sales and Office occupations in Scottsville are Office & Administration (196 | 14.1%), and Sales & Related (74 | 5.3%).
Sales and Office Occupations by Sex
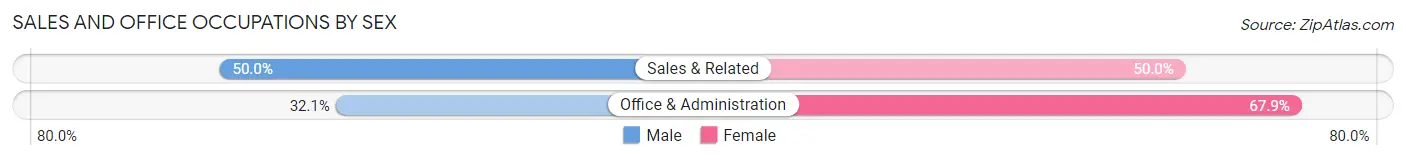
| Occupation | Male | Female |
| Sales & Related | 37 (50.0%) | 37 (50.0%) |
| Office & Administration | 63 (32.1%) | 133 (67.9%) |
| Total (Category) | 100 (37.0%) | 170 (63.0%) |
| Total (Overall) | 853 (61.3%) | 538 (38.7%) |
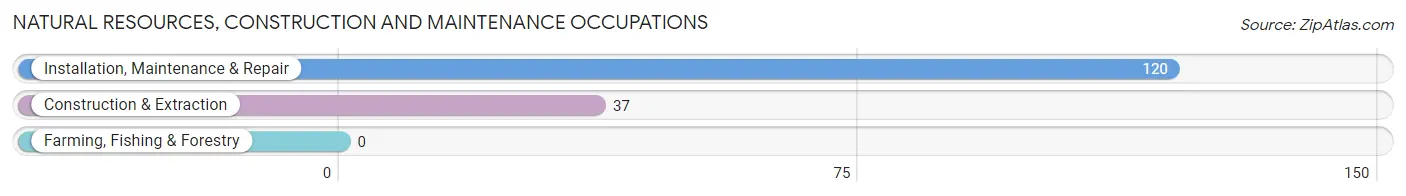
Natural Resources, Construction and Maintenance Occupations
The most common Natural Resources, Construction and Maintenance occupations in Scottsville are Installation, Maintenance & Repair (120 | 8.6%), and Construction & Extraction (37 | 2.7%).
Natural Resources, Construction and Maintenance Occupations by Sex
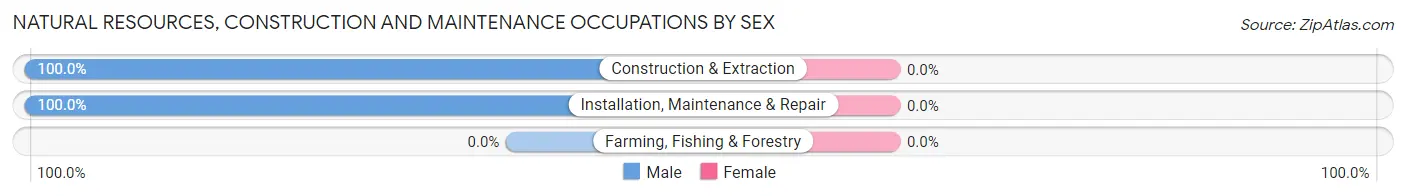
| Occupation | Male | Female |
| Farming, Fishing & Forestry | 0 (0.0%) | 0 (0.0%) |
| Construction & Extraction | 37 (100.0%) | 0 (0.0%) |
| Installation, Maintenance & Repair | 120 (100.0%) | 0 (0.0%) |
| Total (Category) | 157 (100.0%) | 0 (0.0%) |
| Total (Overall) | 853 (61.3%) | 538 (38.7%) |
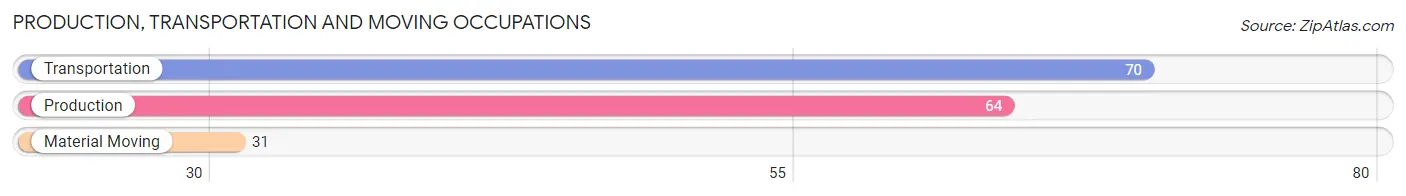
Production, Transportation and Moving Occupations
The most common Production, Transportation and Moving occupations in Scottsville are Transportation (70 | 5.0%), Production (64 | 4.6%), and Material Moving (31 | 2.2%).
Production, Transportation and Moving Occupations by Sex
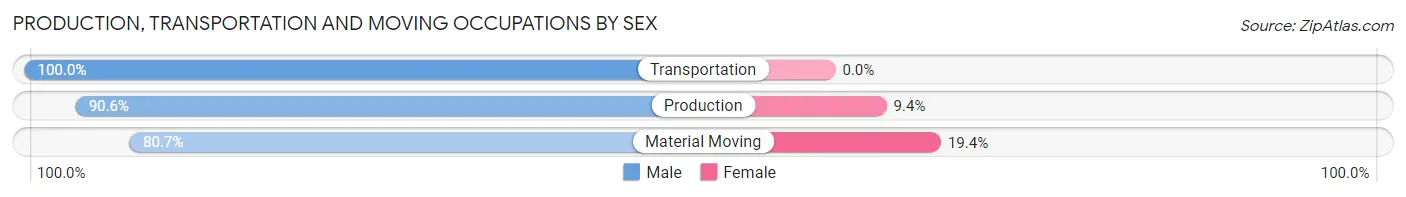
| Occupation | Male | Female |
| Production | 58 (90.6%) | 6 (9.4%) |
| Transportation | 70 (100.0%) | 0 (0.0%) |
| Material Moving | 25 (80.6%) | 6 (19.4%) |
| Total (Category) | 153 (92.7%) | 12 (7.3%) |
| Total (Overall) | 853 (61.3%) | 538 (38.7%) |
Employment Industries by Sex in Scottsville
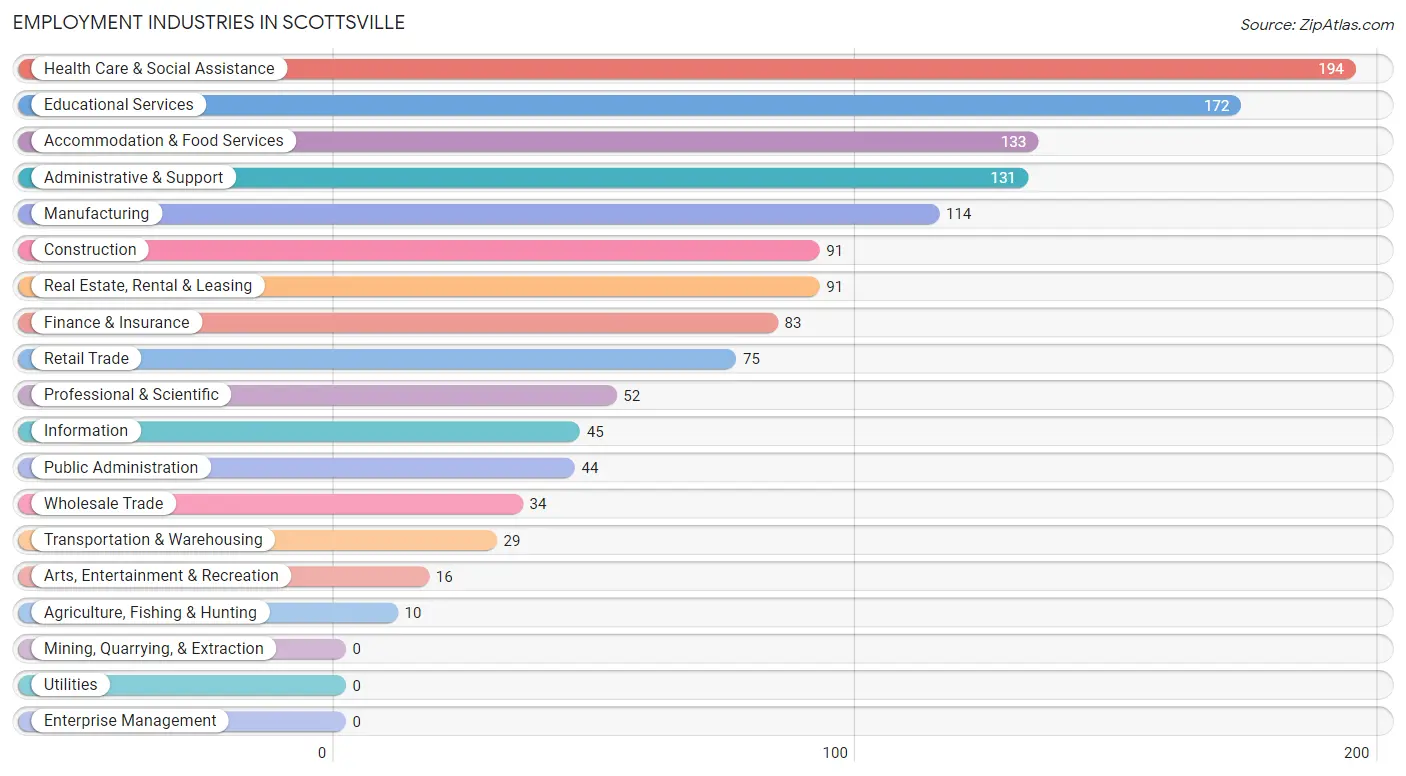
Employment Industries in Scottsville
The major employment industries in Scottsville include Health Care & Social Assistance (194 | 14.0%), Educational Services (172 | 12.4%), Accommodation & Food Services (133 | 9.6%), Administrative & Support (131 | 9.4%), and Manufacturing (114 | 8.2%).
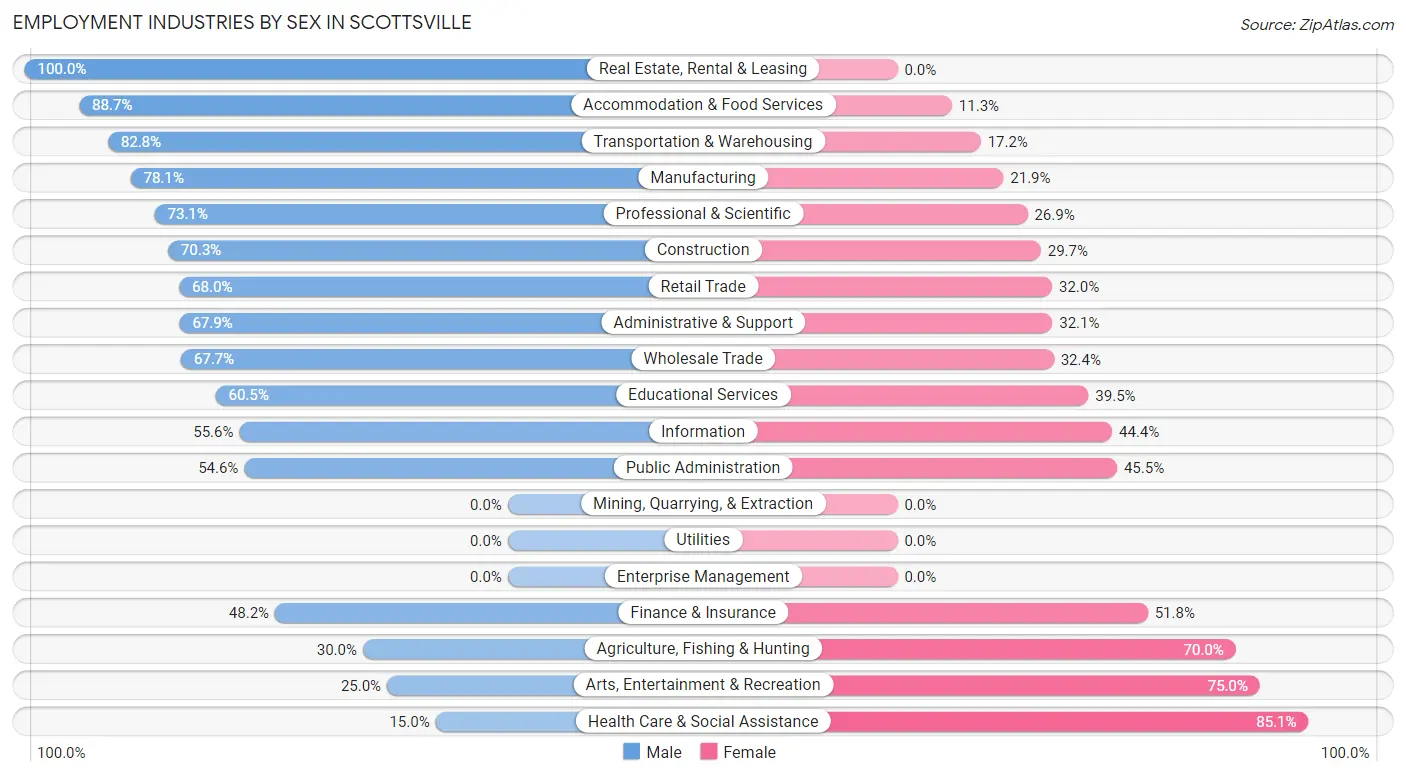
Employment Industries by Sex in Scottsville
The Scottsville industries that see more men than women are Real Estate, Rental & Leasing (100.0%), Accommodation & Food Services (88.7%), and Transportation & Warehousing (82.8%), whereas the industries that tend to have a higher number of women are Health Care & Social Assistance (85.1%), Arts, Entertainment & Recreation (75.0%), and Agriculture, Fishing & Hunting (70.0%).
| Industry | Male | Female |
| Agriculture, Fishing & Hunting | 3 (30.0%) | 7 (70.0%) |
| Mining, Quarrying, & Extraction | 0 (0.0%) | 0 (0.0%) |
| Construction | 64 (70.3%) | 27 (29.7%) |
| Manufacturing | 89 (78.1%) | 25 (21.9%) |
| Wholesale Trade | 23 (67.6%) | 11 (32.4%) |
| Retail Trade | 51 (68.0%) | 24 (32.0%) |
| Transportation & Warehousing | 24 (82.8%) | 5 (17.2%) |
| Utilities | 0 (0.0%) | 0 (0.0%) |
| Information | 25 (55.6%) | 20 (44.4%) |
| Finance & Insurance | 40 (48.2%) | 43 (51.8%) |
| Real Estate, Rental & Leasing | 91 (100.0%) | 0 (0.0%) |
| Professional & Scientific | 38 (73.1%) | 14 (26.9%) |
| Enterprise Management | 0 (0.0%) | 0 (0.0%) |
| Administrative & Support | 89 (67.9%) | 42 (32.1%) |
| Educational Services | 104 (60.5%) | 68 (39.5%) |
| Health Care & Social Assistance | 29 (14.9%) | 165 (85.1%) |
| Arts, Entertainment & Recreation | 4 (25.0%) | 12 (75.0%) |
| Accommodation & Food Services | 118 (88.7%) | 15 (11.3%) |
| Public Administration | 24 (54.5%) | 20 (45.5%) |
| Total | 853 (61.3%) | 538 (38.7%) |
Education in Scottsville
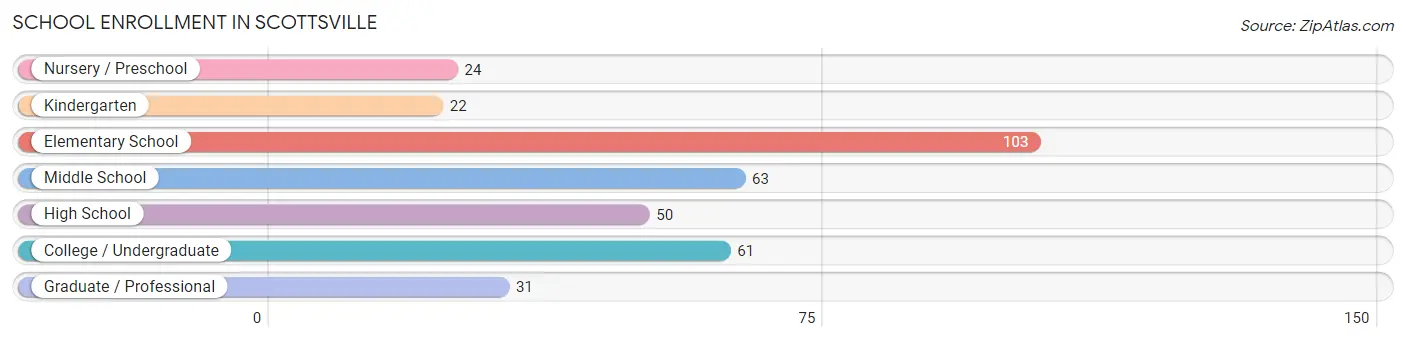
School Enrollment in Scottsville
The most common levels of schooling among the 354 students in Scottsville are elementary school (103 | 29.1%), middle school (63 | 17.8%), and college / undergraduate (61 | 17.2%).
| School Level | # Students | % Students |
| Nursery / Preschool | 24 | 6.8% |
| Kindergarten | 22 | 6.2% |
| Elementary School | 103 | 29.1% |
| Middle School | 63 | 17.8% |
| High School | 50 | 14.1% |
| College / Undergraduate | 61 | 17.2% |
| Graduate / Professional | 31 | 8.8% |
| Total | 354 | 100.0% |
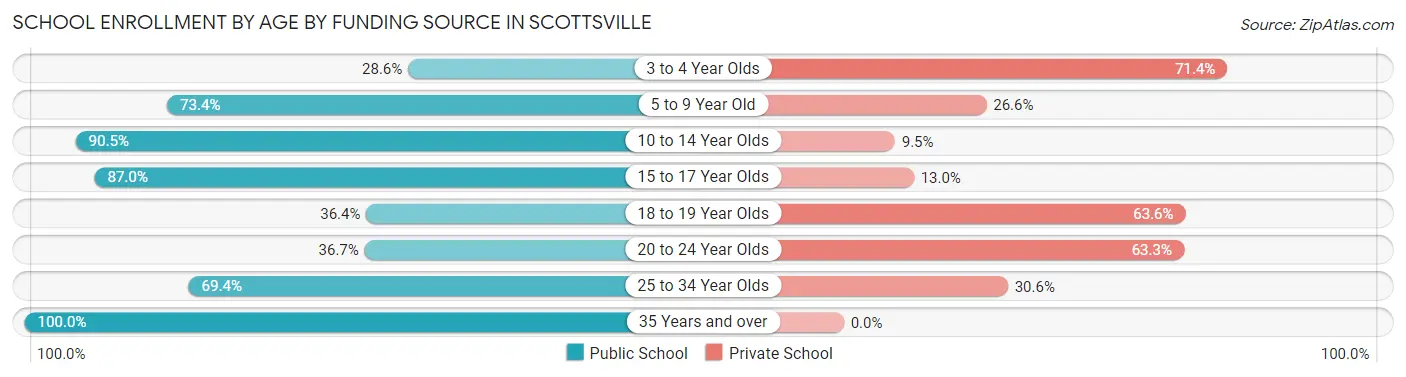
School Enrollment by Age by Funding Source in Scottsville
Out of a total of 354 students who are enrolled in schools in Scottsville, 98 (27.7%) attend a private institution, while the remaining 256 (72.3%) are enrolled in public schools. The age group of 3 to 4 year olds has the highest likelihood of being enrolled in private schools, with 15 (71.4% in the age bracket) enrolled. Conversely, the age group of 35 years and over has the lowest likelihood of being enrolled in a private school, with 19 (100.0% in the age bracket) attending a public institution.
| Age Bracket | Public School | Private School |
| 3 to 4 Year Olds | 6 (28.6%) | 15 (71.4%) |
| 5 to 9 Year Old | 94 (73.4%) | 34 (26.6%) |
| 10 to 14 Year Olds | 57 (90.5%) | 6 (9.5%) |
| 15 to 17 Year Olds | 40 (87.0%) | 6 (13.0%) |
| 18 to 19 Year Olds | 4 (36.4%) | 7 (63.6%) |
| 20 to 24 Year Olds | 11 (36.7%) | 19 (63.3%) |
| 25 to 34 Year Olds | 25 (69.4%) | 11 (30.6%) |
| 35 Years and over | 19 (100.0%) | 0 (0.0%) |
| Total | 256 (72.3%) | 98 (27.7%) |
Educational Attainment by Field of Study in Scottsville
Education (119 | 16.9%), science & technology (112 | 15.9%), liberal arts & history (71 | 10.1%), business (64 | 9.1%), and social sciences (61 | 8.6%) are the most common fields of study among 705 individuals in Scottsville who have obtained a bachelor's degree or higher.
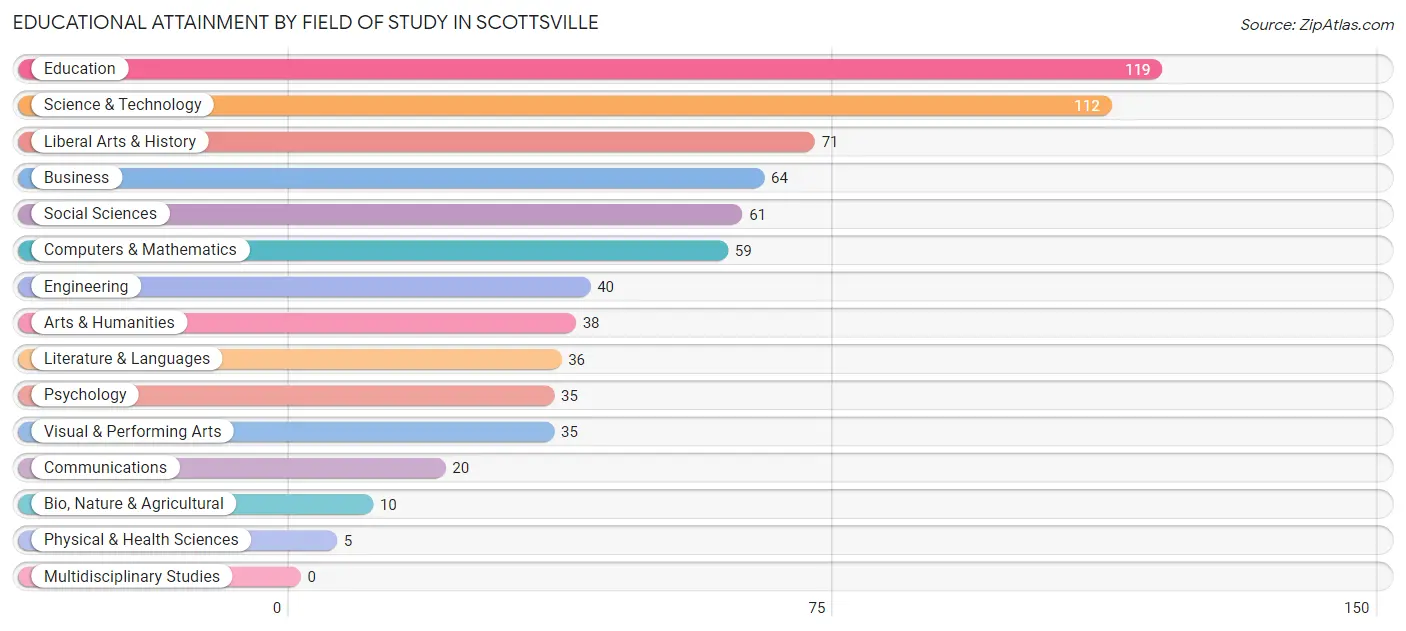
| Field of Study | # Graduates | % Graduates |
| Computers & Mathematics | 59 | 8.4% |
| Bio, Nature & Agricultural | 10 | 1.4% |
| Physical & Health Sciences | 5 | 0.7% |
| Psychology | 35 | 5.0% |
| Social Sciences | 61 | 8.6% |
| Engineering | 40 | 5.7% |
| Multidisciplinary Studies | 0 | 0.0% |
| Science & Technology | 112 | 15.9% |
| Business | 64 | 9.1% |
| Education | 119 | 16.9% |
| Literature & Languages | 36 | 5.1% |
| Liberal Arts & History | 71 | 10.1% |
| Visual & Performing Arts | 35 | 5.0% |
| Communications | 20 | 2.8% |
| Arts & Humanities | 38 | 5.4% |
| Total | 705 | 100.0% |
Transportation & Commute in Scottsville
Vehicle Availability by Sex in Scottsville
The most prevalent vehicle ownership categories in Scottsville are males with 2 vehicles (383, accounting for 45.8%) and females with 2 vehicles (271, making up 73.1%).
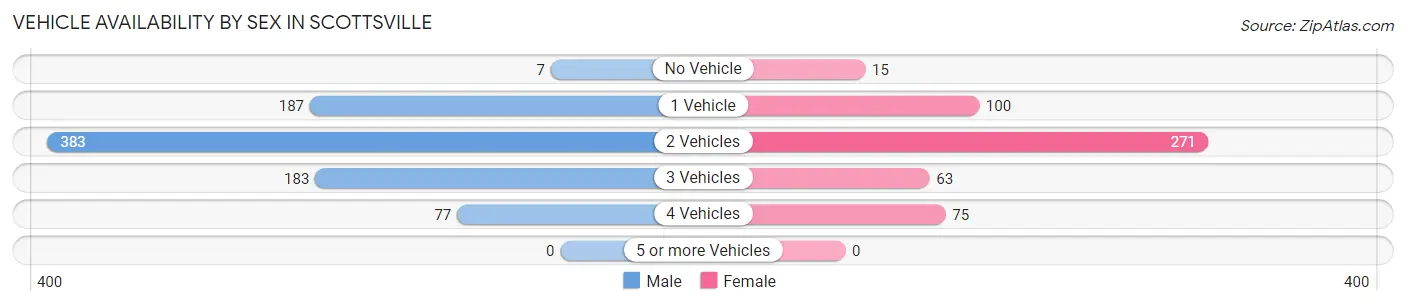
| Vehicles Available | Male | Female |
| No Vehicle | 7 (0.8%) | 15 (2.9%) |
| 1 Vehicle | 187 (22.3%) | 100 (19.1%) |
| 2 Vehicles | 383 (45.8%) | 271 (51.7%) |
| 3 Vehicles | 183 (21.9%) | 63 (12.0%) |
| 4 Vehicles | 77 (9.2%) | 75 (14.3%) |
| 5 or more Vehicles | 0 (0.0%) | 0 (0.0%) |
| Total | 837 (100.0%) | 524 (100.0%) |
Commute Time in Scottsville
The most frequently occuring commute durations in Scottsville are 20 to 24 minutes (300 commuters, 23.8%), 25 to 29 minutes (200 commuters, 15.9%), and 10 to 14 minutes (188 commuters, 14.9%).
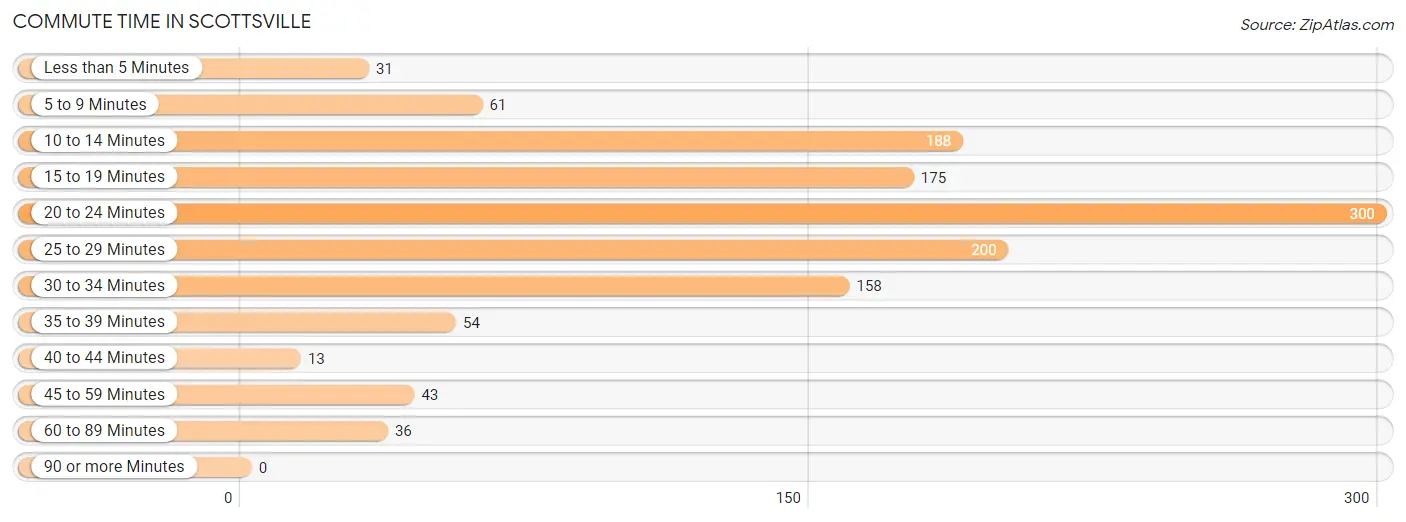
| Commute Time | # Commuters | % Commuters |
| Less than 5 Minutes | 31 | 2.5% |
| 5 to 9 Minutes | 61 | 4.9% |
| 10 to 14 Minutes | 188 | 14.9% |
| 15 to 19 Minutes | 175 | 13.9% |
| 20 to 24 Minutes | 300 | 23.8% |
| 25 to 29 Minutes | 200 | 15.9% |
| 30 to 34 Minutes | 158 | 12.6% |
| 35 to 39 Minutes | 54 | 4.3% |
| 40 to 44 Minutes | 13 | 1.0% |
| 45 to 59 Minutes | 43 | 3.4% |
| 60 to 89 Minutes | 36 | 2.9% |
| 90 or more Minutes | 0 | 0.0% |
Commute Time by Sex in Scottsville
The most common commute times in Scottsville are 20 to 24 minutes (191 commuters, 24.6%) for males and 20 to 24 minutes (109 commuters, 22.6%) for females.
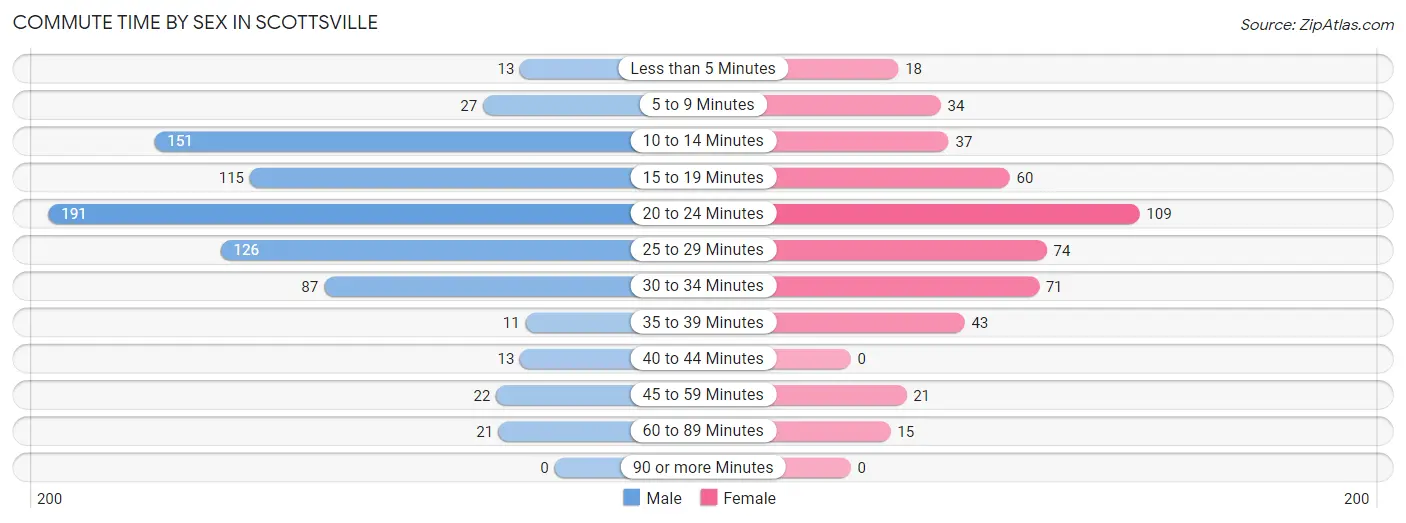
| Commute Time | Male | Female |
| Less than 5 Minutes | 13 (1.7%) | 18 (3.7%) |
| 5 to 9 Minutes | 27 (3.5%) | 34 (7.0%) |
| 10 to 14 Minutes | 151 (19.4%) | 37 (7.7%) |
| 15 to 19 Minutes | 115 (14.8%) | 60 (12.4%) |
| 20 to 24 Minutes | 191 (24.6%) | 109 (22.6%) |
| 25 to 29 Minutes | 126 (16.2%) | 74 (15.3%) |
| 30 to 34 Minutes | 87 (11.2%) | 71 (14.7%) |
| 35 to 39 Minutes | 11 (1.4%) | 43 (8.9%) |
| 40 to 44 Minutes | 13 (1.7%) | 0 (0.0%) |
| 45 to 59 Minutes | 22 (2.8%) | 21 (4.4%) |
| 60 to 89 Minutes | 21 (2.7%) | 15 (3.1%) |
| 90 or more Minutes | 0 (0.0%) | 0 (0.0%) |
Time of Departure to Work by Sex in Scottsville
The most frequent times of departure to work in Scottsville are 6:30 AM to 6:59 AM (166, 21.4%) for males and 7:30 AM to 7:59 AM (122, 25.3%) for females.
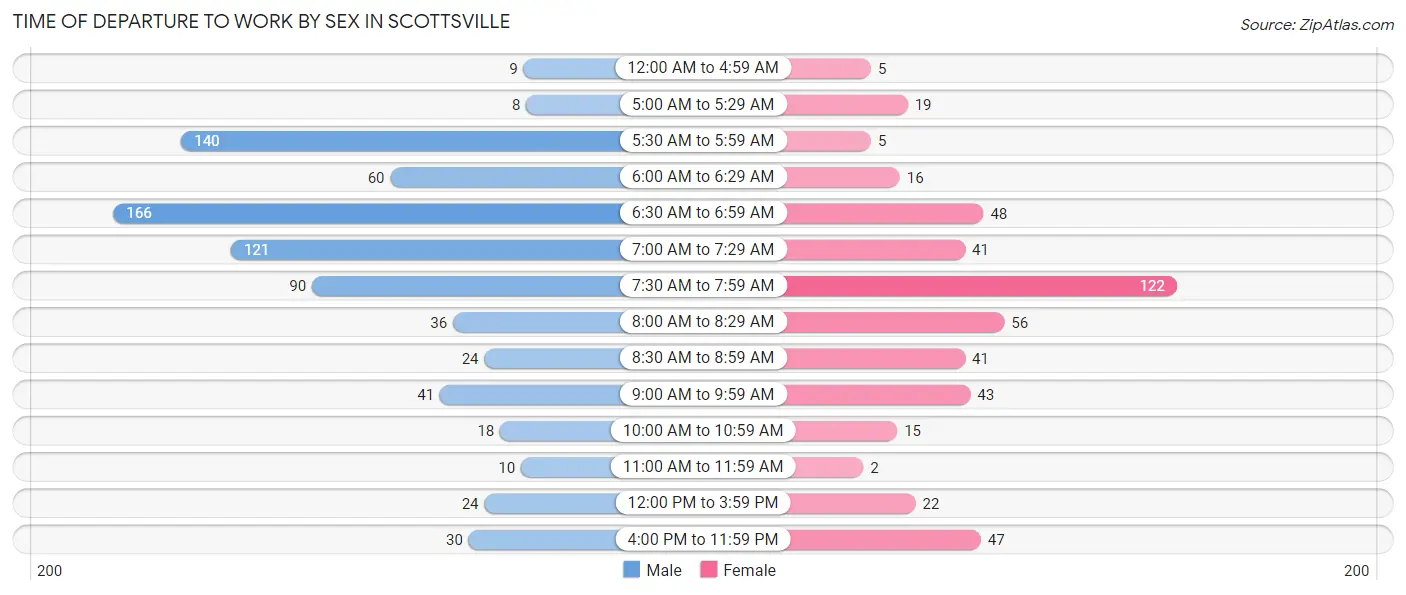
| Time of Departure | Male | Female |
| 12:00 AM to 4:59 AM | 9 (1.2%) | 5 (1.0%) |
| 5:00 AM to 5:29 AM | 8 (1.0%) | 19 (3.9%) |
| 5:30 AM to 5:59 AM | 140 (18.0%) | 5 (1.0%) |
| 6:00 AM to 6:29 AM | 60 (7.7%) | 16 (3.3%) |
| 6:30 AM to 6:59 AM | 166 (21.4%) | 48 (10.0%) |
| 7:00 AM to 7:29 AM | 121 (15.6%) | 41 (8.5%) |
| 7:30 AM to 7:59 AM | 90 (11.6%) | 122 (25.3%) |
| 8:00 AM to 8:29 AM | 36 (4.6%) | 56 (11.6%) |
| 8:30 AM to 8:59 AM | 24 (3.1%) | 41 (8.5%) |
| 9:00 AM to 9:59 AM | 41 (5.3%) | 43 (8.9%) |
| 10:00 AM to 10:59 AM | 18 (2.3%) | 15 (3.1%) |
| 11:00 AM to 11:59 AM | 10 (1.3%) | 2 (0.4%) |
| 12:00 PM to 3:59 PM | 24 (3.1%) | 22 (4.6%) |
| 4:00 PM to 11:59 PM | 30 (3.9%) | 47 (9.8%) |
| Total | 777 (100.0%) | 482 (100.0%) |
Housing Occupancy in Scottsville
Occupancy by Ownership in Scottsville
Of the total 1,048 dwellings in Scottsville, owner-occupied units account for 771 (73.6%), while renter-occupied units make up 277 (26.4%).
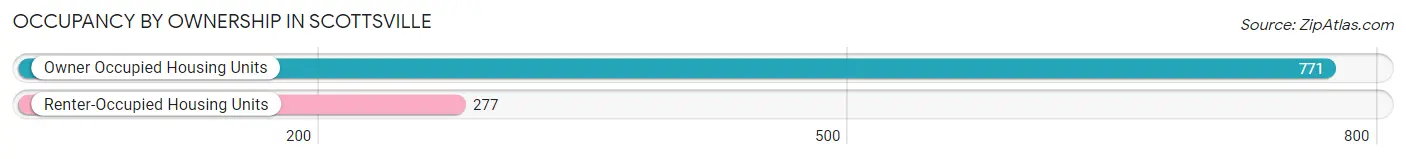
| Occupancy | # Housing Units | % Housing Units |
| Owner Occupied Housing Units | 771 | 73.6% |
| Renter-Occupied Housing Units | 277 | 26.4% |
| Total Occupied Housing Units | 1,048 | 100.0% |
Occupancy by Household Size in Scottsville
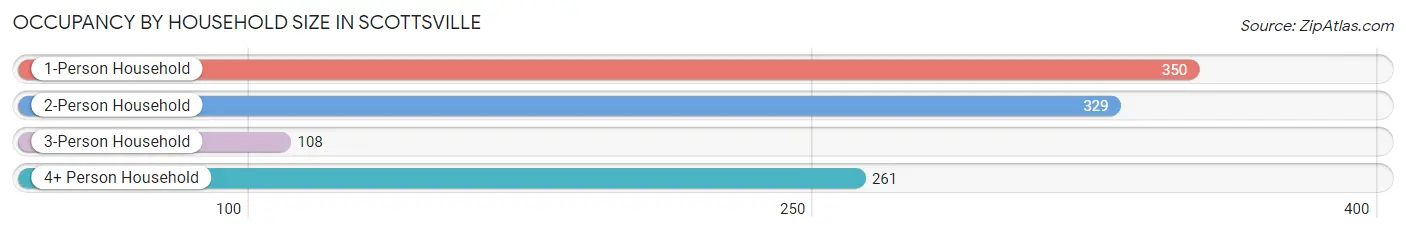
| Household Size | # Housing Units | % Housing Units |
| 1-Person Household | 350 | 33.4% |
| 2-Person Household | 329 | 31.4% |
| 3-Person Household | 108 | 10.3% |
| 4+ Person Household | 261 | 24.9% |
| Total Housing Units | 1,048 | 100.0% |
Occupancy by Ownership by Household Size in Scottsville
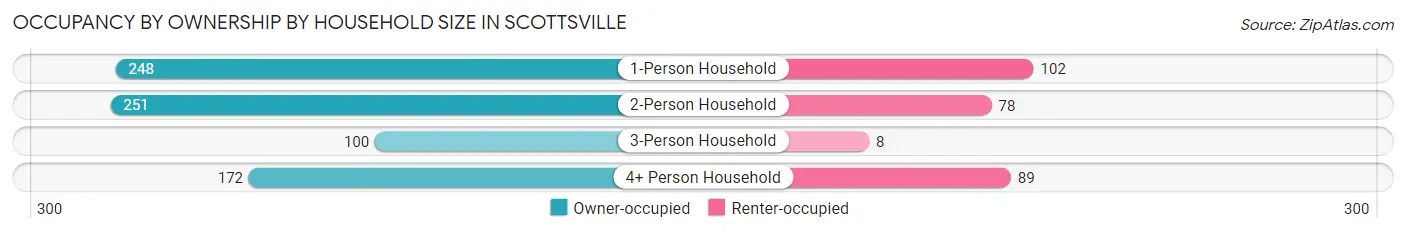
| Household Size | Owner-occupied | Renter-occupied |
| 1-Person Household | 248 (70.9%) | 102 (29.1%) |
| 2-Person Household | 251 (76.3%) | 78 (23.7%) |
| 3-Person Household | 100 (92.6%) | 8 (7.4%) |
| 4+ Person Household | 172 (65.9%) | 89 (34.1%) |
| Total Housing Units | 771 (73.6%) | 277 (26.4%) |
Occupancy by Educational Attainment in Scottsville
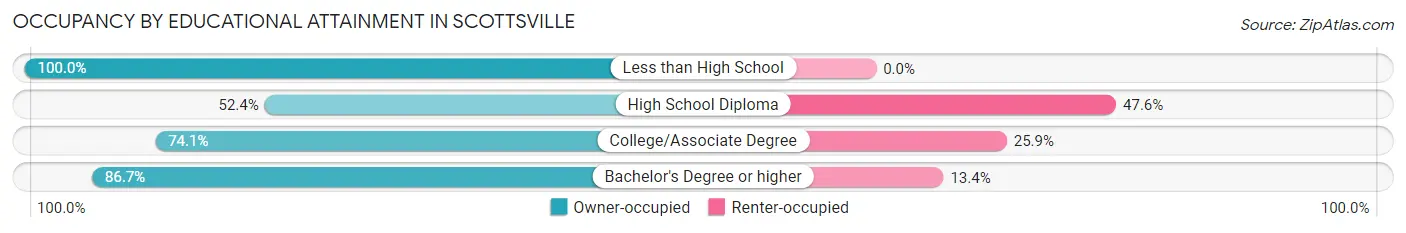
| Household Size | Owner-occupied | Renter-occupied |
| Less than High School | 24 (100.0%) | 0 (0.0%) |
| High School Diploma | 140 (52.4%) | 127 (47.6%) |
| College/Associate Degree | 289 (74.1%) | 101 (25.9%) |
| Bachelor's Degree or higher | 318 (86.7%) | 49 (13.4%) |
Occupancy by Age of Householder in Scottsville
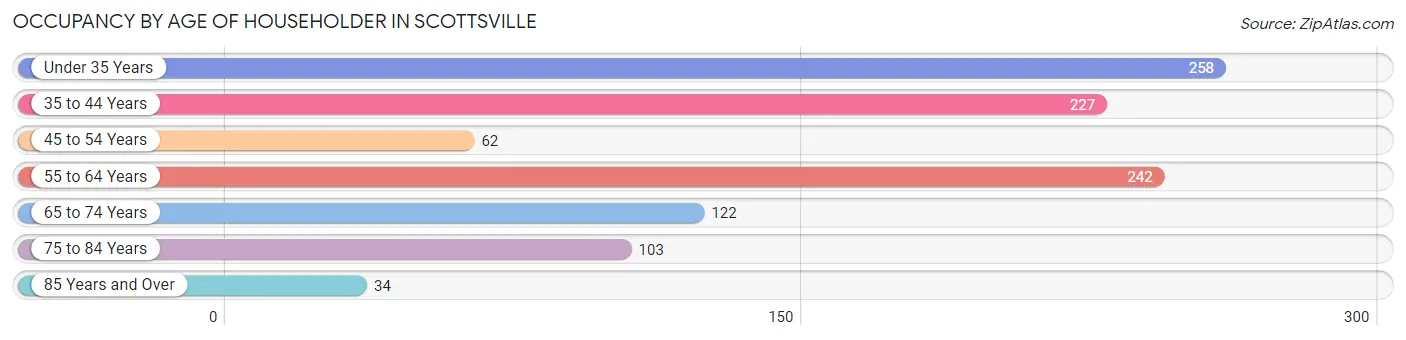
| Age Bracket | # Households | % Households |
| Under 35 Years | 258 | 24.6% |
| 35 to 44 Years | 227 | 21.7% |
| 45 to 54 Years | 62 | 5.9% |
| 55 to 64 Years | 242 | 23.1% |
| 65 to 74 Years | 122 | 11.6% |
| 75 to 84 Years | 103 | 9.8% |
| 85 Years and Over | 34 | 3.2% |
| Total | 1,048 | 100.0% |
Housing Finances in Scottsville
Median Income by Occupancy in Scottsville
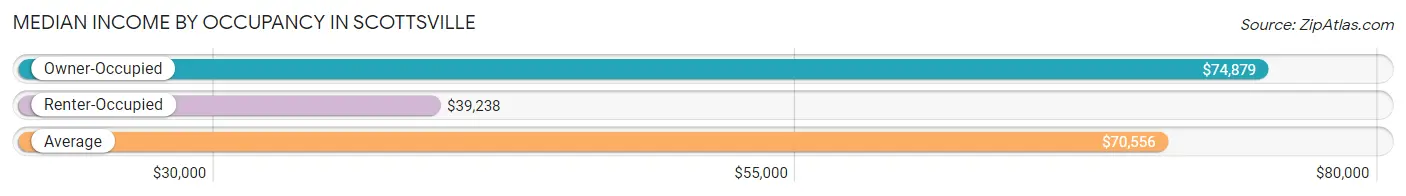
| Occupancy Type | # Households | Median Income |
| Owner-Occupied | 771 (73.6%) | $74,879 |
| Renter-Occupied | 277 (26.4%) | $39,238 |
| Average | 1,048 (100.0%) | $70,556 |
Occupancy by Householder Income Bracket in Scottsville
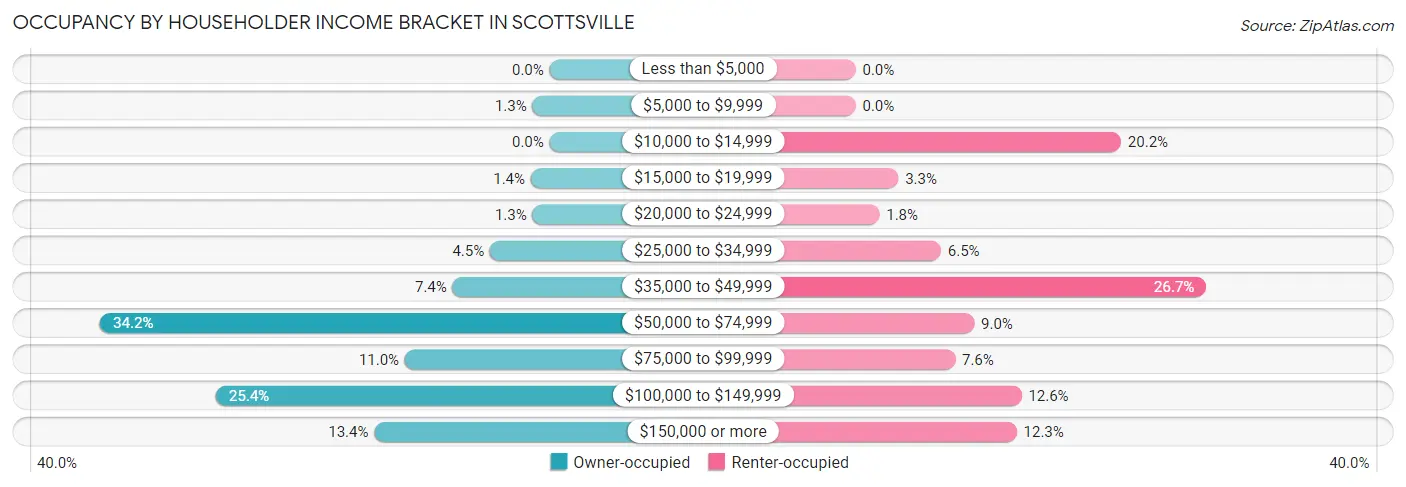
| Income Bracket | Owner-occupied | Renter-occupied |
| Less than $5,000 | 0 (0.0%) | 0 (0.0%) |
| $5,000 to $9,999 | 10 (1.3%) | 0 (0.0%) |
| $10,000 to $14,999 | 0 (0.0%) | 56 (20.2%) |
| $15,000 to $19,999 | 11 (1.4%) | 9 (3.3%) |
| $20,000 to $24,999 | 10 (1.3%) | 5 (1.8%) |
| $25,000 to $34,999 | 35 (4.5%) | 18 (6.5%) |
| $35,000 to $49,999 | 57 (7.4%) | 74 (26.7%) |
| $50,000 to $74,999 | 264 (34.2%) | 25 (9.0%) |
| $75,000 to $99,999 | 85 (11.0%) | 21 (7.6%) |
| $100,000 to $149,999 | 196 (25.4%) | 35 (12.6%) |
| $150,000 or more | 103 (13.4%) | 34 (12.3%) |
| Total | 771 (100.0%) | 277 (100.0%) |
Monthly Housing Cost Tiers in Scottsville
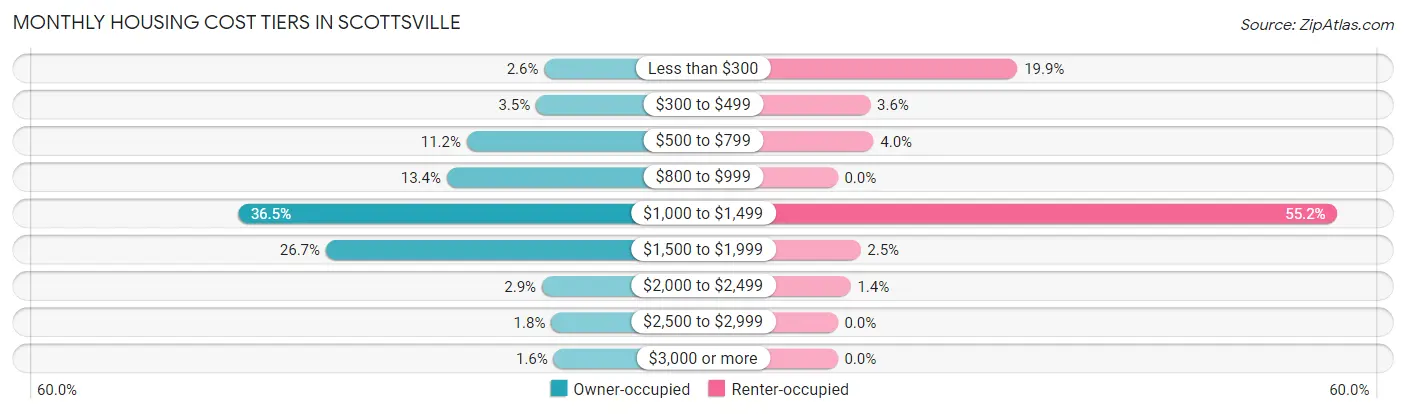
| Monthly Cost | Owner-occupied | Renter-occupied |
| Less than $300 | 20 (2.6%) | 55 (19.9%) |
| $300 to $499 | 27 (3.5%) | 10 (3.6%) |
| $500 to $799 | 86 (11.2%) | 11 (4.0%) |
| $800 to $999 | 103 (13.4%) | 0 (0.0%) |
| $1,000 to $1,499 | 281 (36.4%) | 153 (55.2%) |
| $1,500 to $1,999 | 206 (26.7%) | 7 (2.5%) |
| $2,000 to $2,499 | 22 (2.9%) | 4 (1.4%) |
| $2,500 to $2,999 | 14 (1.8%) | 0 (0.0%) |
| $3,000 or more | 12 (1.6%) | 0 (0.0%) |
| Total | 771 (100.0%) | 277 (100.0%) |
Physical Housing Characteristics in Scottsville
Housing Structures in Scottsville
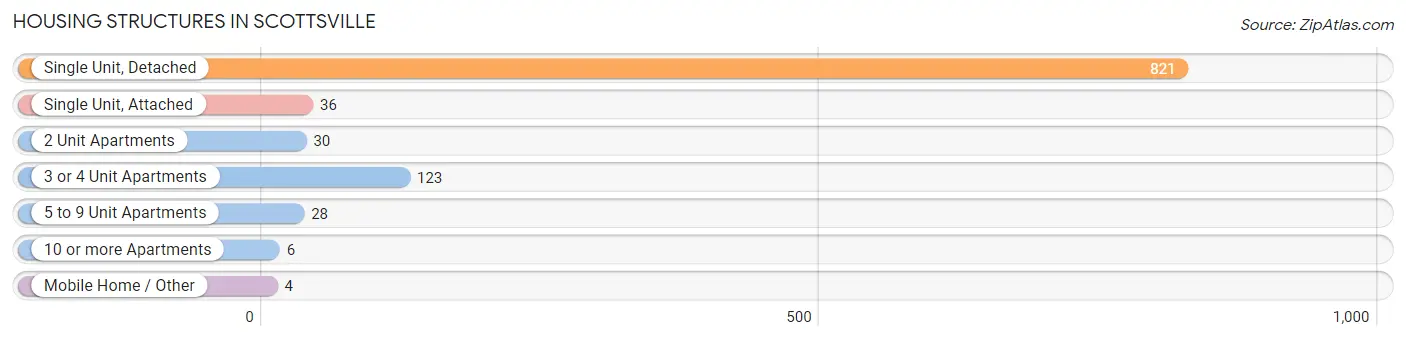
| Structure Type | # Housing Units | % Housing Units |
| Single Unit, Detached | 821 | 78.3% |
| Single Unit, Attached | 36 | 3.4% |
| 2 Unit Apartments | 30 | 2.9% |
| 3 or 4 Unit Apartments | 123 | 11.7% |
| 5 to 9 Unit Apartments | 28 | 2.7% |
| 10 or more Apartments | 6 | 0.6% |
| Mobile Home / Other | 4 | 0.4% |
| Total | 1,048 | 100.0% |
Housing Structures by Occupancy in Scottsville
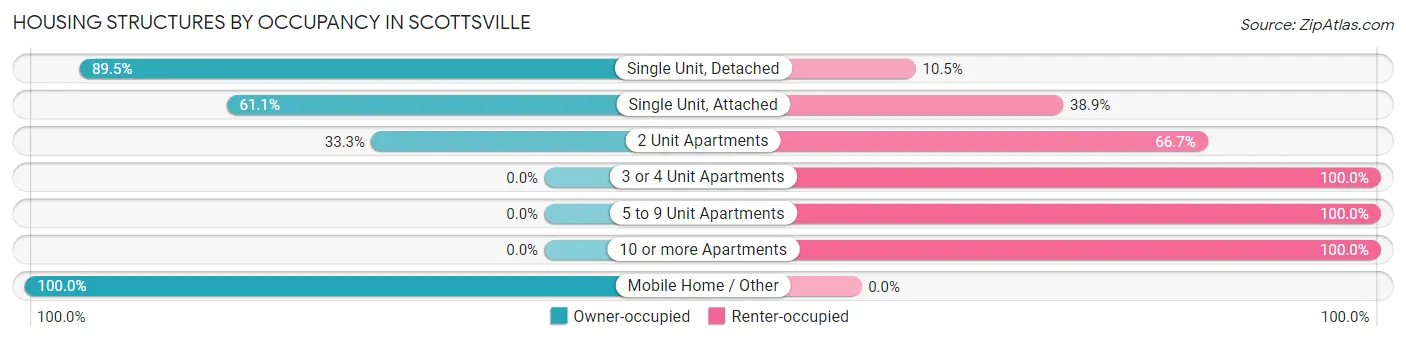
| Structure Type | Owner-occupied | Renter-occupied |
| Single Unit, Detached | 735 (89.5%) | 86 (10.5%) |
| Single Unit, Attached | 22 (61.1%) | 14 (38.9%) |
| 2 Unit Apartments | 10 (33.3%) | 20 (66.7%) |
| 3 or 4 Unit Apartments | 0 (0.0%) | 123 (100.0%) |
| 5 to 9 Unit Apartments | 0 (0.0%) | 28 (100.0%) |
| 10 or more Apartments | 0 (0.0%) | 6 (100.0%) |
| Mobile Home / Other | 4 (100.0%) | 0 (0.0%) |
| Total | 771 (73.6%) | 277 (26.4%) |
Housing Structures by Number of Rooms in Scottsville
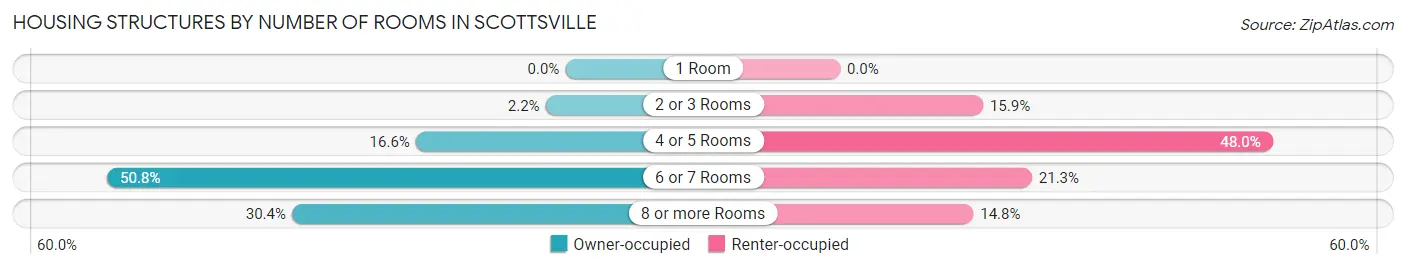
| Number of Rooms | Owner-occupied | Renter-occupied |
| 1 Room | 0 (0.0%) | 0 (0.0%) |
| 2 or 3 Rooms | 17 (2.2%) | 44 (15.9%) |
| 4 or 5 Rooms | 128 (16.6%) | 133 (48.0%) |
| 6 or 7 Rooms | 392 (50.8%) | 59 (21.3%) |
| 8 or more Rooms | 234 (30.3%) | 41 (14.8%) |
| Total | 771 (100.0%) | 277 (100.0%) |
Housing Structure by Heating Type in Scottsville
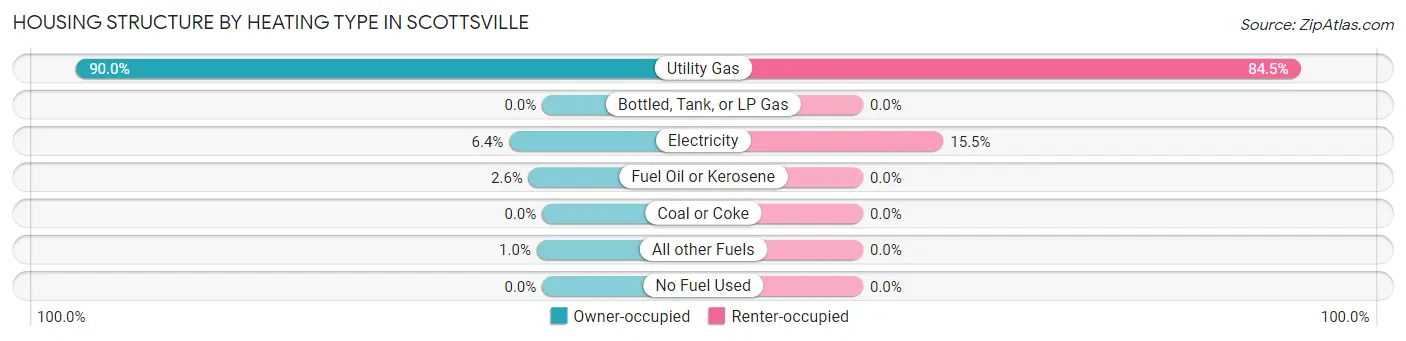
| Heating Type | Owner-occupied | Renter-occupied |
| Utility Gas | 694 (90.0%) | 234 (84.5%) |
| Bottled, Tank, or LP Gas | 0 (0.0%) | 0 (0.0%) |
| Electricity | 49 (6.4%) | 43 (15.5%) |
| Fuel Oil or Kerosene | 20 (2.6%) | 0 (0.0%) |
| Coal or Coke | 0 (0.0%) | 0 (0.0%) |
| All other Fuels | 8 (1.0%) | 0 (0.0%) |
| No Fuel Used | 0 (0.0%) | 0 (0.0%) |
| Total | 771 (100.0%) | 277 (100.0%) |
Household Vehicle Usage in Scottsville
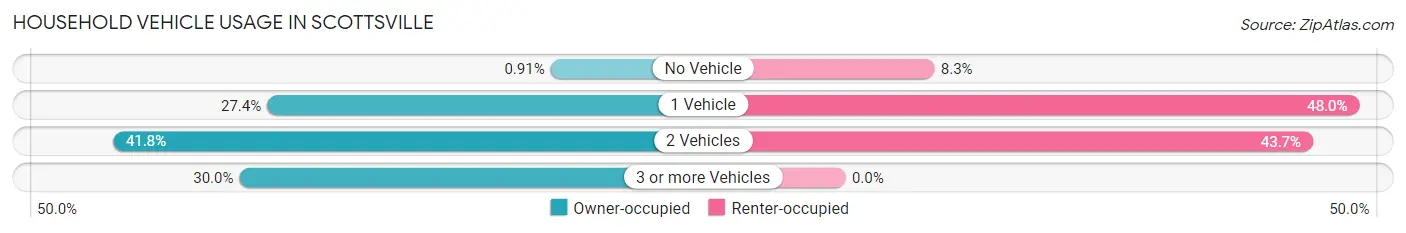
| Vehicles per Household | Owner-occupied | Renter-occupied |
| No Vehicle | 7 (0.9%) | 23 (8.3%) |
| 1 Vehicle | 211 (27.4%) | 133 (48.0%) |
| 2 Vehicles | 322 (41.8%) | 121 (43.7%) |
| 3 or more Vehicles | 231 (30.0%) | 0 (0.0%) |
| Total | 771 (100.0%) | 277 (100.0%) |
Real Estate & Mortgages in Scottsville
Real Estate and Mortgage Overview in Scottsville
| Characteristic | Without Mortgage | With Mortgage |
| Housing Units | 185 | 586 |
| Median Property Value | $158,800 | $158,000 |
| Median Household Income | $61,563 | $72 |
| Monthly Housing Costs | $757 | $12 |
| Real Estate Taxes | $5,475 | $7 |
Property Value by Mortgage Status in Scottsville
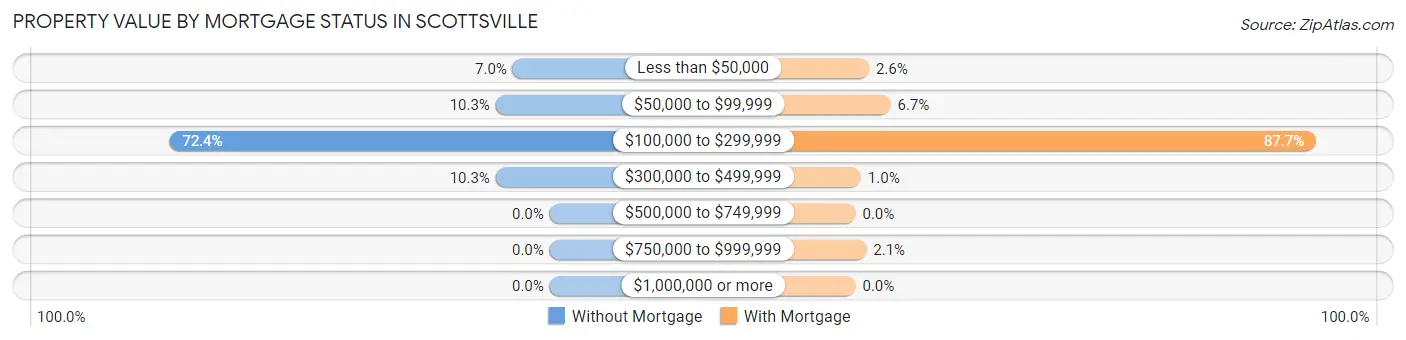
| Property Value | Without Mortgage | With Mortgage |
| Less than $50,000 | 13 (7.0%) | 15 (2.6%) |
| $50,000 to $99,999 | 19 (10.3%) | 39 (6.7%) |
| $100,000 to $299,999 | 134 (72.4%) | 514 (87.7%) |
| $300,000 to $499,999 | 19 (10.3%) | 6 (1.0%) |
| $500,000 to $749,999 | 0 (0.0%) | 0 (0.0%) |
| $750,000 to $999,999 | 0 (0.0%) | 12 (2.1%) |
| $1,000,000 or more | 0 (0.0%) | 0 (0.0%) |
| Total | 185 (100.0%) | 586 (100.0%) |
Household Income by Mortgage Status in Scottsville
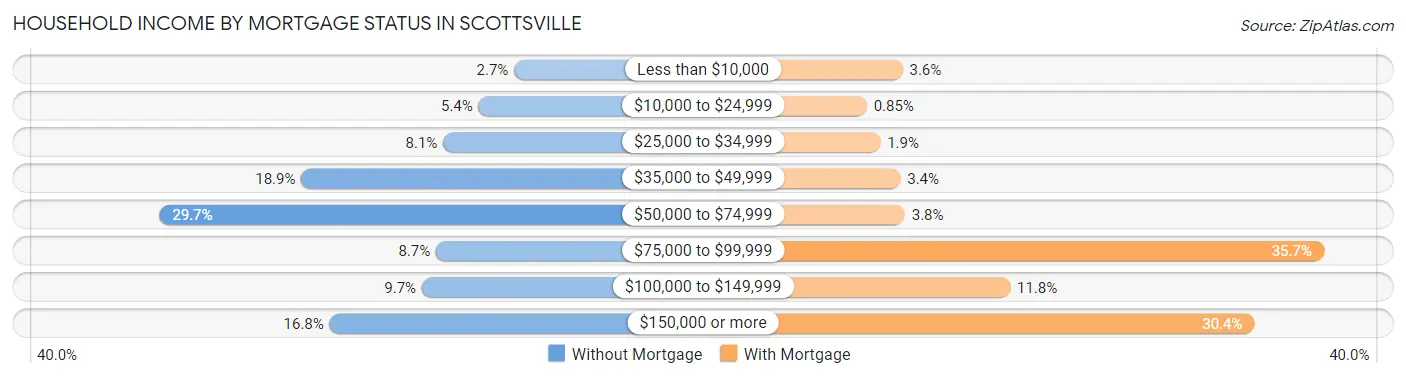
| Household Income | Without Mortgage | With Mortgage |
| Less than $10,000 | 5 (2.7%) | 21 (3.6%) |
| $10,000 to $24,999 | 10 (5.4%) | 5 (0.9%) |
| $25,000 to $34,999 | 15 (8.1%) | 11 (1.9%) |
| $35,000 to $49,999 | 35 (18.9%) | 20 (3.4%) |
| $50,000 to $74,999 | 55 (29.7%) | 22 (3.7%) |
| $75,000 to $99,999 | 16 (8.6%) | 209 (35.7%) |
| $100,000 to $149,999 | 18 (9.7%) | 69 (11.8%) |
| $150,000 or more | 31 (16.8%) | 178 (30.4%) |
| Total | 185 (100.0%) | 586 (100.0%) |
Property Value to Household Income Ratio in Scottsville
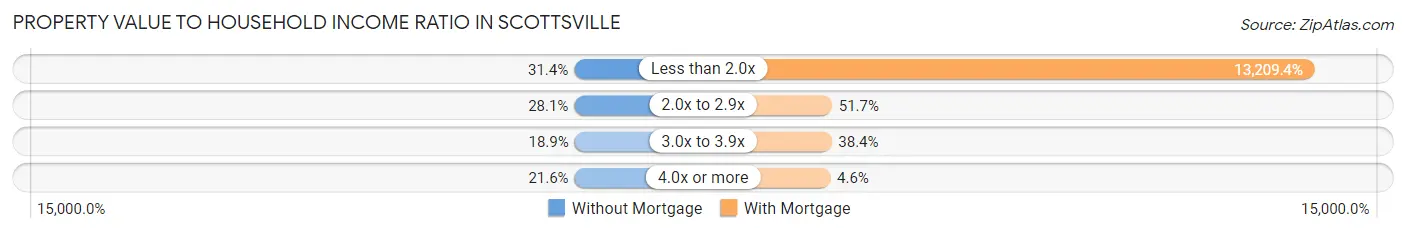
| Value-to-Income Ratio | Without Mortgage | With Mortgage |
| Less than 2.0x | 58 (31.4%) | 77,407 (13,209.4%) |
| 2.0x to 2.9x | 52 (28.1%) | 303 (51.7%) |
| 3.0x to 3.9x | 35 (18.9%) | 225 (38.4%) |
| 4.0x or more | 40 (21.6%) | 27 (4.6%) |
| Total | 185 (100.0%) | 586 (100.0%) |
Real Estate Taxes by Mortgage Status in Scottsville
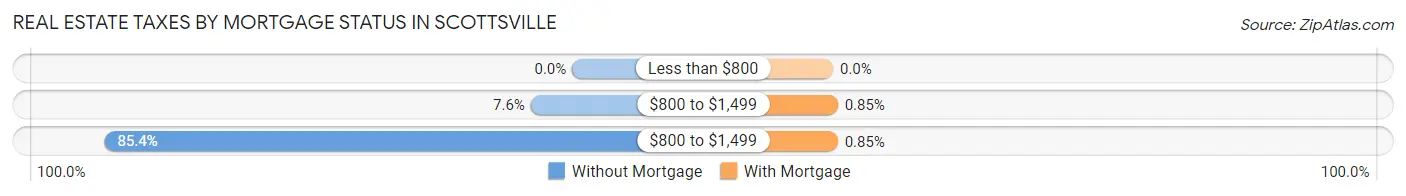
| Property Taxes | Without Mortgage | With Mortgage |
| Less than $800 | 0 (0.0%) | 0 (0.0%) |
| $800 to $1,499 | 14 (7.6%) | 5 (0.9%) |
| $800 to $1,499 | 158 (85.4%) | 5 (0.9%) |
| Total | 185 (100.0%) | 586 (100.0%) |
Health & Disability in Scottsville
Health Insurance Coverage by Age in Scottsville
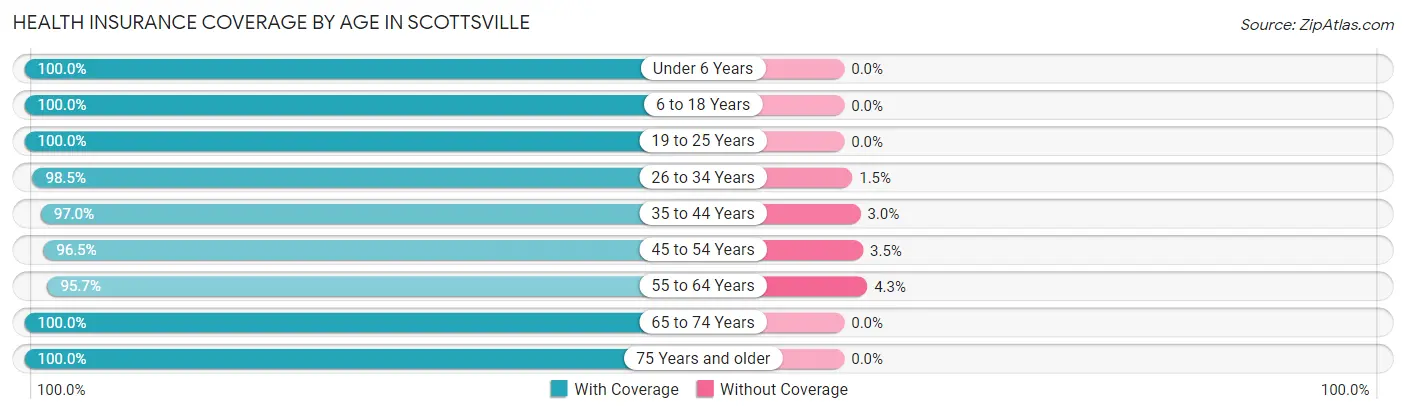
| Age Bracket | With Coverage | Without Coverage |
| Under 6 Years | 247 (100.0%) | 0 (0.0%) |
| 6 to 18 Years | 283 (100.0%) | 0 (0.0%) |
| 19 to 25 Years | 191 (100.0%) | 0 (0.0%) |
| 26 to 34 Years | 398 (98.5%) | 6 (1.5%) |
| 35 to 44 Years | 385 (97.0%) | 12 (3.0%) |
| 45 to 54 Years | 165 (96.5%) | 6 (3.5%) |
| 55 to 64 Years | 359 (95.7%) | 16 (4.3%) |
| 65 to 74 Years | 221 (100.0%) | 0 (0.0%) |
| 75 Years and older | 193 (100.0%) | 0 (0.0%) |
| Total | 2,442 (98.4%) | 40 (1.6%) |
Health Insurance Coverage by Citizenship Status in Scottsville
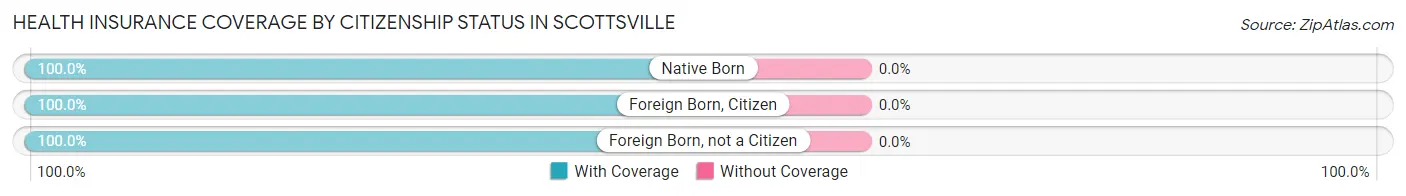
| Citizenship Status | With Coverage | Without Coverage |
| Native Born | 247 (100.0%) | 0 (0.0%) |
| Foreign Born, Citizen | 283 (100.0%) | 0 (0.0%) |
| Foreign Born, not a Citizen | 191 (100.0%) | 0 (0.0%) |
Health Insurance Coverage by Household Income in Scottsville
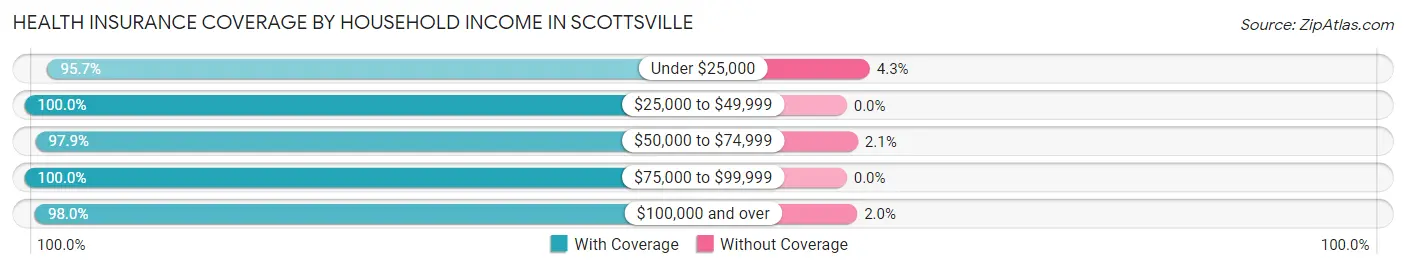
| Household Income | With Coverage | Without Coverage |
| Under $25,000 | 133 (95.7%) | 6 (4.3%) |
| $25,000 to $49,999 | 301 (100.0%) | 0 (0.0%) |
| $50,000 to $74,999 | 566 (97.9%) | 12 (2.1%) |
| $75,000 to $99,999 | 319 (100.0%) | 0 (0.0%) |
| $100,000 and over | 1,098 (98.0%) | 22 (2.0%) |
Public vs Private Health Insurance Coverage by Age in Scottsville
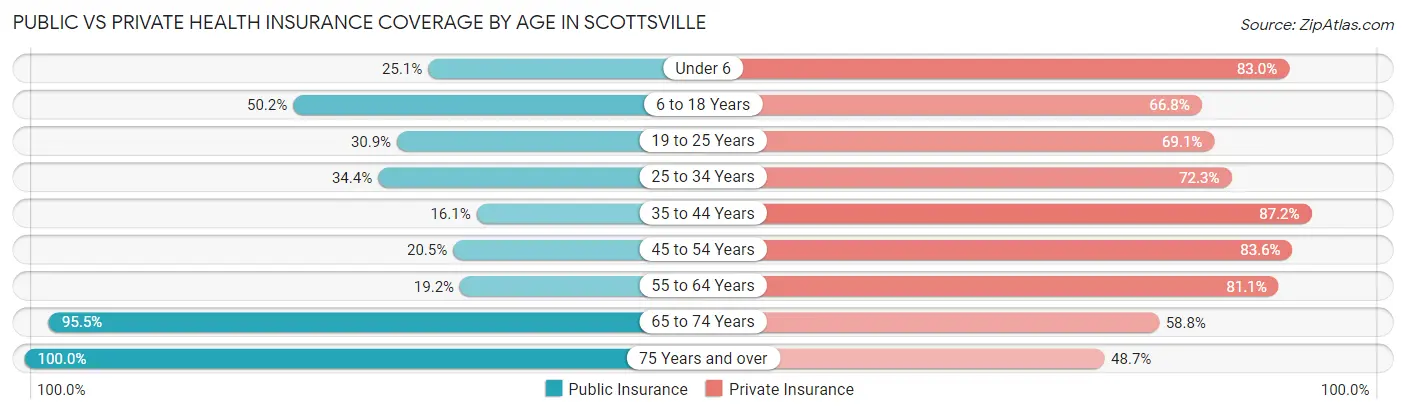
| Age Bracket | Public Insurance | Private Insurance |
| Under 6 | 62 (25.1%) | 205 (83.0%) |
| 6 to 18 Years | 142 (50.2%) | 189 (66.8%) |
| 19 to 25 Years | 59 (30.9%) | 132 (69.1%) |
| 25 to 34 Years | 139 (34.4%) | 292 (72.3%) |
| 35 to 44 Years | 64 (16.1%) | 346 (87.2%) |
| 45 to 54 Years | 35 (20.5%) | 143 (83.6%) |
| 55 to 64 Years | 72 (19.2%) | 304 (81.1%) |
| 65 to 74 Years | 211 (95.5%) | 130 (58.8%) |
| 75 Years and over | 193 (100.0%) | 94 (48.7%) |
| Total | 977 (39.4%) | 1,835 (73.9%) |
Disability Status by Sex by Age in Scottsville
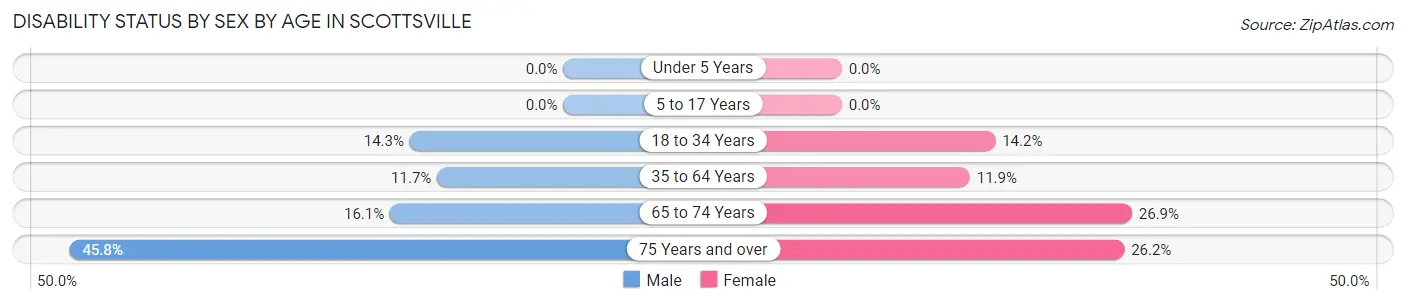
| Age Bracket | Male | Female |
| Under 5 Years | 0 (0.0%) | 0 (0.0%) |
| 5 to 17 Years | 0 (0.0%) | 0 (0.0%) |
| 18 to 34 Years | 51 (14.2%) | 41 (14.2%) |
| 35 to 64 Years | 70 (11.7%) | 41 (11.9%) |
| 65 to 74 Years | 23 (16.1%) | 21 (26.9%) |
| 75 Years and over | 22 (45.8%) | 38 (26.2%) |
Disability Class by Sex by Age in Scottsville
Disability Class: Hearing Difficulty
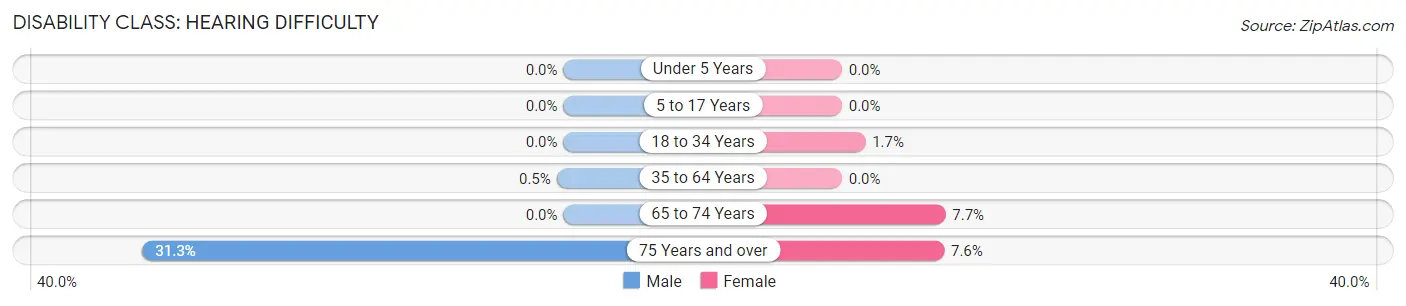
| Age Bracket | Male | Female |
| Under 5 Years | 0 (0.0%) | 0 (0.0%) |
| 5 to 17 Years | 0 (0.0%) | 0 (0.0%) |
| 18 to 34 Years | 0 (0.0%) | 5 (1.7%) |
| 35 to 64 Years | 3 (0.5%) | 0 (0.0%) |
| 65 to 74 Years | 0 (0.0%) | 6 (7.7%) |
| 75 Years and over | 15 (31.2%) | 11 (7.6%) |
Disability Class: Vision Difficulty
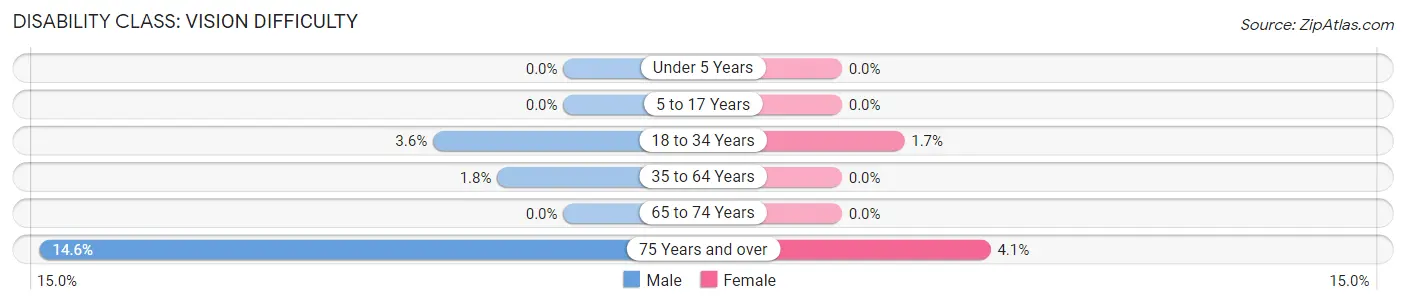
| Age Bracket | Male | Female |
| Under 5 Years | 0 (0.0%) | 0 (0.0%) |
| 5 to 17 Years | 0 (0.0%) | 0 (0.0%) |
| 18 to 34 Years | 13 (3.6%) | 5 (1.7%) |
| 35 to 64 Years | 11 (1.8%) | 0 (0.0%) |
| 65 to 74 Years | 0 (0.0%) | 0 (0.0%) |
| 75 Years and over | 7 (14.6%) | 6 (4.1%) |
Disability Class: Cognitive Difficulty
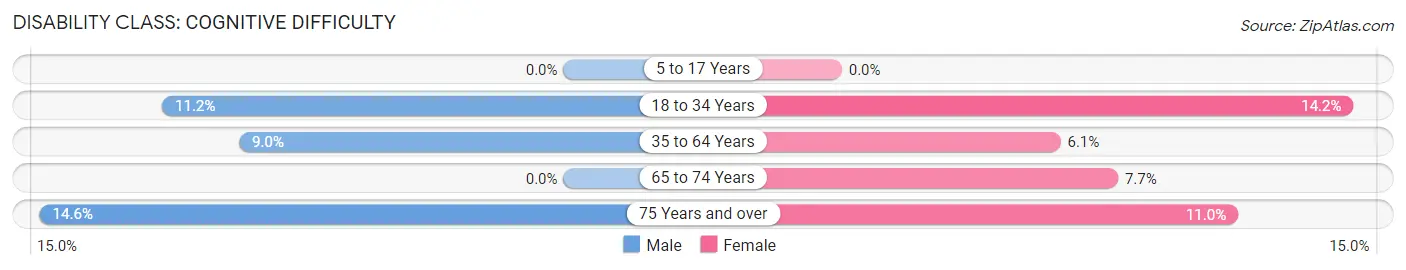
| Age Bracket | Male | Female |
| 5 to 17 Years | 0 (0.0%) | 0 (0.0%) |
| 18 to 34 Years | 40 (11.2%) | 41 (14.2%) |
| 35 to 64 Years | 54 (9.0%) | 21 (6.1%) |
| 65 to 74 Years | 0 (0.0%) | 6 (7.7%) |
| 75 Years and over | 7 (14.6%) | 16 (11.0%) |
Disability Class: Ambulatory Difficulty
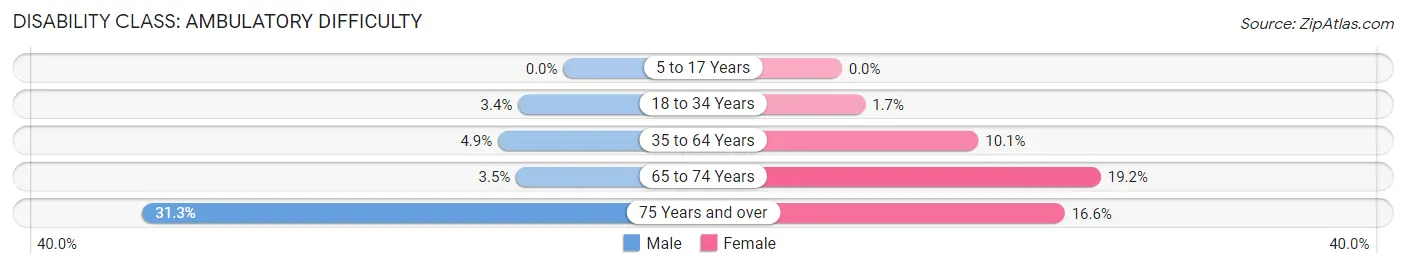
| Age Bracket | Male | Female |
| 5 to 17 Years | 0 (0.0%) | 0 (0.0%) |
| 18 to 34 Years | 12 (3.4%) | 5 (1.7%) |
| 35 to 64 Years | 29 (4.9%) | 35 (10.1%) |
| 65 to 74 Years | 5 (3.5%) | 15 (19.2%) |
| 75 Years and over | 15 (31.2%) | 24 (16.6%) |
Disability Class: Self-Care Difficulty
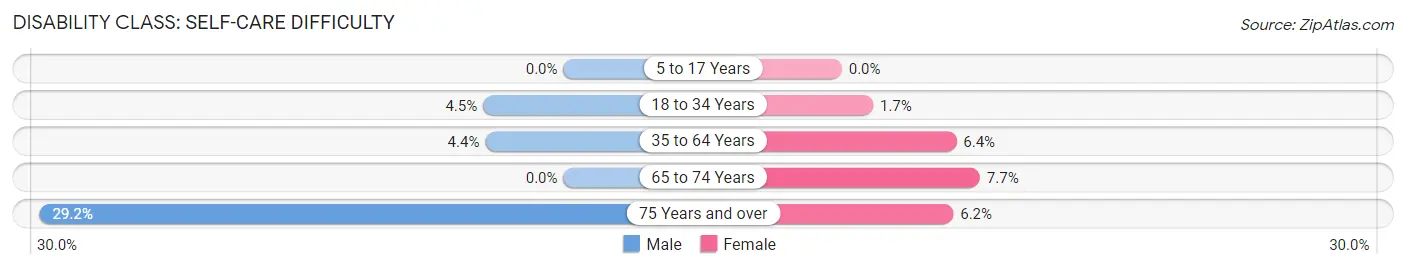
| Age Bracket | Male | Female |
| 5 to 17 Years | 0 (0.0%) | 0 (0.0%) |
| 18 to 34 Years | 16 (4.5%) | 5 (1.7%) |
| 35 to 64 Years | 26 (4.3%) | 22 (6.4%) |
| 65 to 74 Years | 0 (0.0%) | 6 (7.7%) |
| 75 Years and over | 14 (29.2%) | 9 (6.2%) |
Technology Access in Scottsville
Computing Device Access in Scottsville
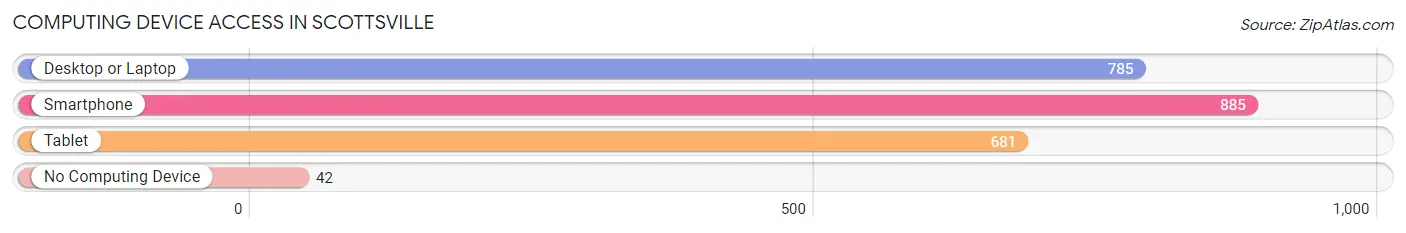
| Device Type | # Households | % Households |
| Desktop or Laptop | 785 | 74.9% |
| Smartphone | 885 | 84.5% |
| Tablet | 681 | 65.0% |
| No Computing Device | 42 | 4.0% |
| Total | 1,048 | 100.0% |
Internet Access in Scottsville
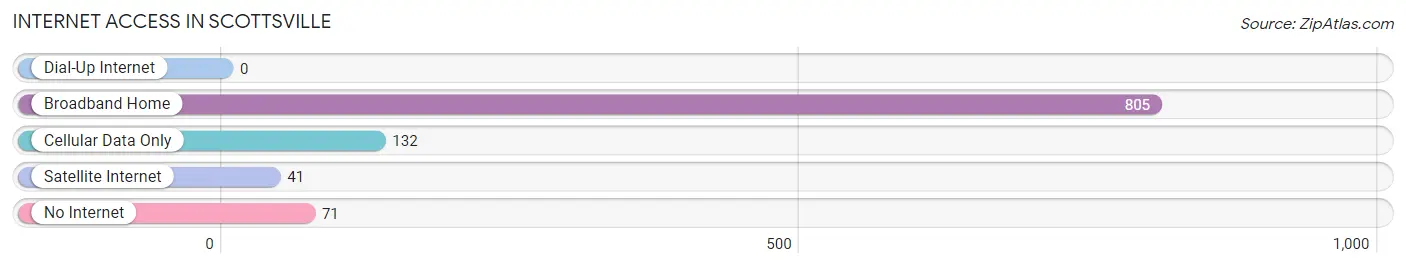
| Internet Type | # Households | % Households |
| Dial-Up Internet | 0 | 0.0% |
| Broadband Home | 805 | 76.8% |
| Cellular Data Only | 132 | 12.6% |
| Satellite Internet | 41 | 3.9% |
| No Internet | 71 | 6.8% |
| Total | 1,048 | 100.0% |
Scottsville Summary
Scottsville is a small village located in the town of Wheatland in Monroe County, New York. It is situated on the Genesee River, about 20 miles south of Rochester. The village has a population of 1,741 as of the 2010 census.
History
The area that is now Scottsville was first settled in 1790 by a group of Quakers from Pennsylvania. The village was originally known as “Quaker Settlement” and was later renamed “Scottsville” in honor of William Scott, a local landowner.
The village was incorporated in 1827 and was an important stop on the Genesee Valley Canal, which opened in 1836. The canal was a major transportation route for goods and passengers between Rochester and Buffalo. The canal was eventually replaced by the New York Central Railroad in 1853.
The village was also home to a number of mills, including a grist mill, a saw mill, and a paper mill. The paper mill was the largest employer in the village until it closed in the late 19th century.
Geography
Scottsville is located at 43° 8' N, 77° 52' W (43.1333, -77.8667). The village is situated on the Genesee River, about 20 miles south of Rochester. The total area of the village is 0.7 square miles, all of which is land.
The village is located in the Finger Lakes region of New York and is surrounded by rolling hills and farmland. The climate is generally mild, with cold winters and warm summers.
Economy
The economy of Scottsville is largely based on agriculture and tourism. The village is home to a number of small businesses, including restaurants, shops, and services.
The village is also home to a number of small manufacturing companies, including a plastics manufacturer and a metal fabrication company.
Demographics
As of the 2010 census, the population of Scottsville was 1,741. The racial makeup of the village was 94.3% White, 2.2% African American, 0.3% Native American, 0.7% Asian, 0.1% Pacific Islander, and 2.4% from other races. Hispanic or Latino of any race were 3.2% of the population.
The median household income in Scottsville was $45,938, and the median family income was $51,964. The per capita income for the village was $20,945. About 8.3% of families and 10.2% of the population were below the poverty line, including 14.2% of those under age 18 and 5.2% of those age 65 or over.
Conclusion
Scottsville is a small village located in the town of Wheatland in Monroe County, New York. It is situated on the Genesee River, about 20 miles south of Rochester. The village has a population of 1,741 as of the 2010 census. The economy of Scottsville is largely based on agriculture and tourism, and the village is home to a number of small businesses, including restaurants, shops, and services. The racial makeup of the village is 94.3% White, 2.2% African American, 0.3% Native American, 0.7% Asian, 0.1% Pacific Islander, and 2.4% from other races. The median household income in Scottsville was $45,938, and the median family income was $51,964.
Common Questions
What is Per Capita Income in Scottsville?
Per Capita income in Scottsville is $37,334.
What is the Median Family Income in Scottsville?
Median Family Income in Scottsville is $94,750.
What is the Median Household income in Scottsville?
Median Household Income in Scottsville is $70,556.
What is Income or Wage Gap in Scottsville?
Income or Wage Gap in Scottsville is 39.1%.
Women in Scottsville earn 60.9 cents for every dollar earned by a man.
What is Inequality or Gini Index in Scottsville?
Inequality or Gini Index in Scottsville is 0.35.
What is the Total Population of Scottsville?
Total Population of Scottsville is 2,482.
What is the Total Male Population of Scottsville?
Total Male Population of Scottsville is 1,289.
What is the Total Female Population of Scottsville?
Total Female Population of Scottsville is 1,193.
What is the Ratio of Males per 100 Females in Scottsville?
There are 108.05 Males per 100 Females in Scottsville.
What is the Ratio of Females per 100 Males in Scottsville?
There are 92.55 Females per 100 Males in Scottsville.
What is the Median Population Age in Scottsville?
Median Population Age in Scottsville is 38.3 Years.
What is the Average Family Size in Scottsville
Average Family Size in Scottsville is 2.9 People.
What is the Average Household Size in Scottsville
Average Household Size in Scottsville is 2.3 People.
How Large is the Labor Force in Scottsville?
There are 1,446 People in the Labor Forcein in Scottsville.
What is the Percentage of People in the Labor Force in Scottsville?
70.7% of People are in the Labor Force in Scottsville.
What is the Unemployment Rate in Scottsville?
Unemployment Rate in Scottsville is 3.8%.