Area Code 310 Map & Demographics
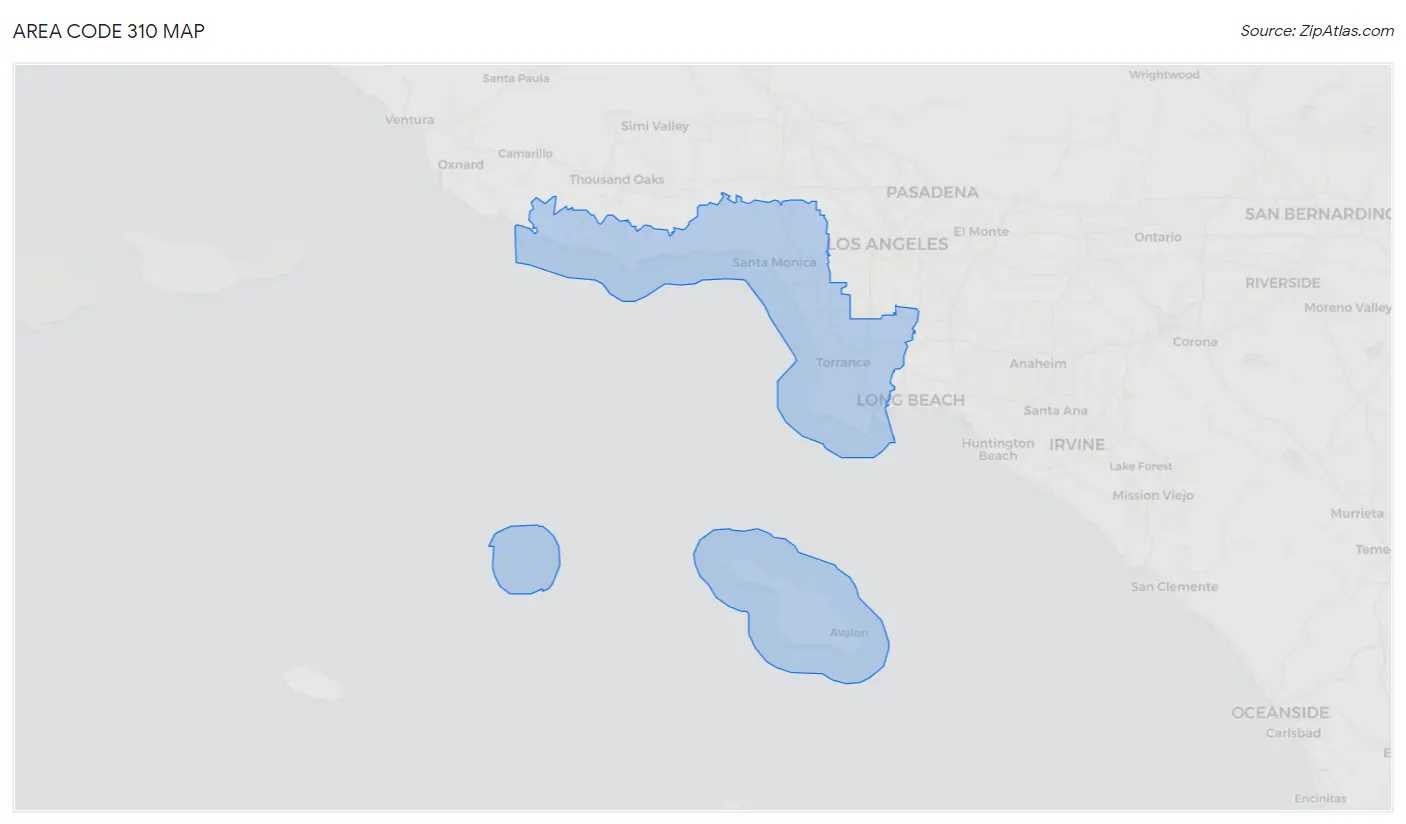
Area Code 310 Map
Area Code 310 Overview
$57,384
PER CAPITA INCOME
$122,787
AVG FAMILY INCOME
$98,455
AVG HOUSEHOLD INCOME
24.1%
WAGE / INCOME GAP [ % ]
75.9¢/ $1
WAGE / INCOME GAP [ $ ]
$11,618
FAMILY INCOME DEFICIT
33.49
INEQUALITY / GINI INDEX
2,321,747
TOTAL POPULATION
1,147,510
MALE POPULATION
1,174,237
FEMALE POPULATION
97.72
MALES / 100 FEMALES
102.33
FEMALES / 100 MALES
39.1
MEDIAN AGE
3.3
AVG FAMILY SIZE
2.6
AVG HOUSEHOLD SIZE
1,218,235
LABOR FORCE [ PEOPLE ]
64.6%
PERCENT IN LABOR FORCE
7.3%
UNEMPLOYMENT RATE
Income in Area Code 310
Income Overview in Area Code 310
Per Capita Income in Area Code 310 is $57,384, while median incomes of families and households are $122,787 and $98,455 respectively.
| Characteristic | Number | Measure |
| Per Capita Income | 2,321,747 | $57,384 |
| Median Family Income | 510,473 | $122,787 |
| Mean Family Income | 510,473 | $12,143,202 |
| Median Household Income | 852,820 | $98,455 |
| Mean Household Income | 852,820 | $10,002,554 |
| Income Deficit | 510,473 | $11,618 |
| Wage / Income Gap (%) | 2,321,747 | 24.11% |
| Wage / Income Gap ($) | 2,321,747 | 75.89¢ per $1 |
| Gini / Inequality Index | 2,321,747 | 33.49 |
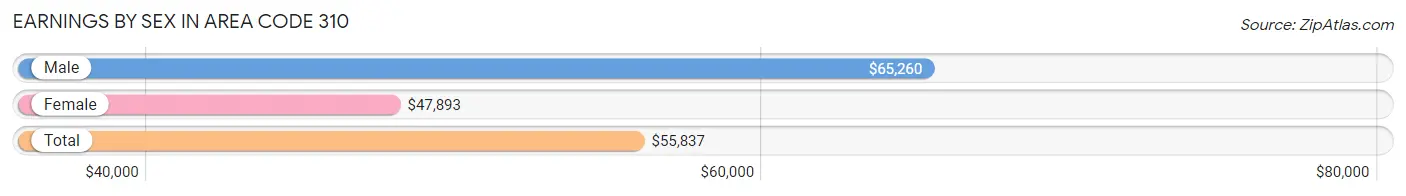
Earnings by Sex in Area Code 310
Average Earnings in Area Code 310 are $55,837, $65,260 for men and $47,893 for women, a difference of 26.6%.
| Sex | Number | Average Earnings |
| Male | 674,892 (53.3%) | $65,260 |
| Female | 592,266 (46.7%) | $47,893 |
| Total | 1,267,158 (100.0%) | $55,837 |
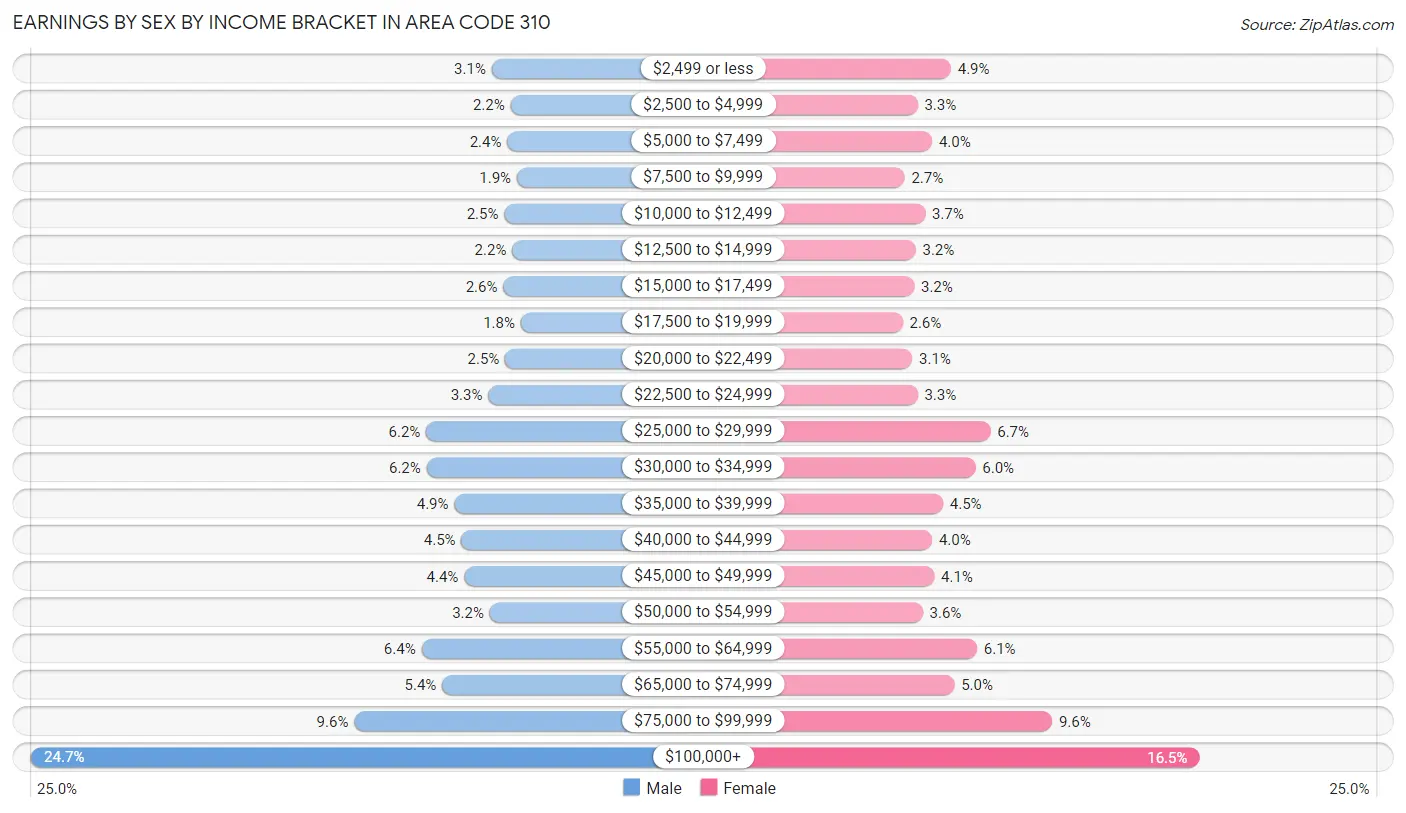
Earnings by Sex by Income Bracket in Area Code 310
The most common earnings brackets in Area Code 310 are $100,000+ for men (166,606 | 24.7%) and $100,000+ for women (97,775 | 16.5%).
| Income | Male | Female |
| $2,499 or less | 21,084 (3.1%) | 28,814 (4.9%) |
| $2,500 to $4,999 | 15,108 (2.2%) | 19,593 (3.3%) |
| $5,000 to $7,499 | 16,153 (2.4%) | 23,630 (4.0%) |
| $7,500 to $9,999 | 13,084 (1.9%) | 16,012 (2.7%) |
| $10,000 to $12,499 | 17,071 (2.5%) | 21,697 (3.7%) |
| $12,500 to $14,999 | 14,568 (2.2%) | 19,088 (3.2%) |
| $15,000 to $17,499 | 17,439 (2.6%) | 18,647 (3.2%) |
| $17,500 to $19,999 | 11,903 (1.8%) | 15,447 (2.6%) |
| $20,000 to $22,499 | 16,824 (2.5%) | 18,116 (3.1%) |
| $22,500 to $24,999 | 22,127 (3.3%) | 19,620 (3.3%) |
| $25,000 to $29,999 | 41,800 (6.2%) | 39,825 (6.7%) |
| $30,000 to $34,999 | 41,622 (6.2%) | 35,644 (6.0%) |
| $35,000 to $39,999 | 32,867 (4.9%) | 26,669 (4.5%) |
| $40,000 to $44,999 | 30,628 (4.5%) | 23,639 (4.0%) |
| $45,000 to $49,999 | 29,769 (4.4%) | 24,238 (4.1%) |
| $50,000 to $54,999 | 21,696 (3.2%) | 21,045 (3.5%) |
| $55,000 to $64,999 | 43,286 (6.4%) | 36,044 (6.1%) |
| $65,000 to $74,999 | 36,707 (5.4%) | 29,788 (5.0%) |
| $75,000 to $99,999 | 64,550 (9.6%) | 56,935 (9.6%) |
| $100,000+ | 166,606 (24.7%) | 97,775 (16.5%) |
| Total | 674,892 (100.0%) | 592,266 (100.0%) |
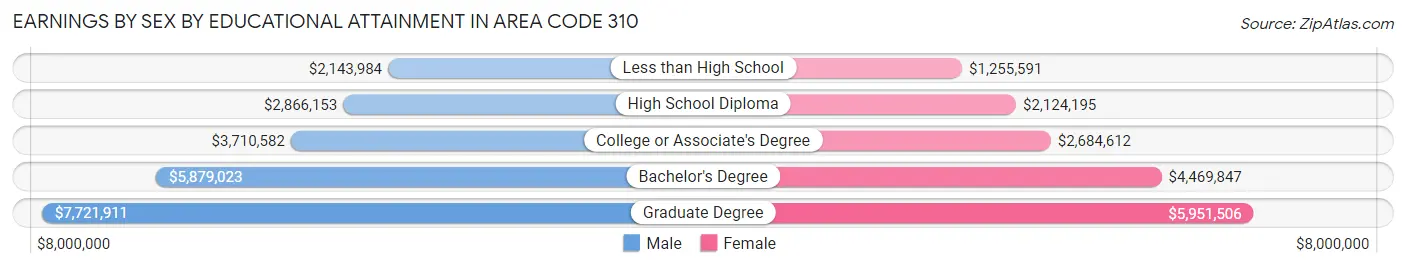
Earnings by Sex by Educational Attainment in Area Code 310
Average earnings in Area Code 310 are $5,019,033 for men and $3,697,816 for women, a difference of 26.3%. Men with an educational attainment of graduate degree enjoy the highest average annual earnings of $7,721,911, while those with less than high school education earn the least with $2,143,984. Women with an educational attainment of graduate degree earn the most with the average annual earnings of $5,951,506, while those with less than high school education have the smallest earnings of $1,255,591.
| Educational Attainment | Male Income | Female Income |
| Less than High School | $2,143,984 | $1,255,591 |
| High School Diploma | $2,866,153 | $2,124,195 |
| College or Associate's Degree | $3,710,582 | $2,684,612 |
| Bachelor's Degree | $5,879,023 | $4,469,847 |
| Graduate Degree | $7,721,911 | $5,951,506 |
| Total | $5,019,033 | $3,697,816 |
Family Income in Area Code 310
Family Income Brackets in Area Code 310
According to the Area Code 310 family income data, there are 8,909,285 families falling into the $200,000+ income range, which is the most common income bracket and makes up 1,745.3% of all families. Conversely, the $10,000 to $14,999 income bracket is the least frequent group with only 571,219 families (111.9%) belonging to this category.
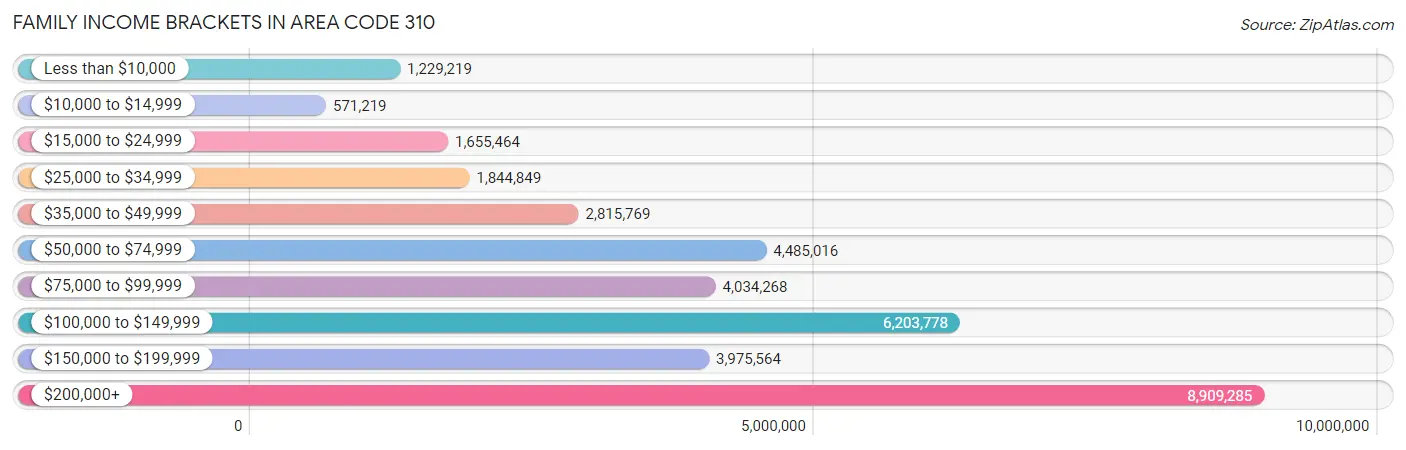
| Income Bracket | # Families | % Families |
| Less than $10,000 | 1,229,219 | 240.8% |
| $10,000 to $14,999 | 571,219 | 111.9% |
| $15,000 to $24,999 | 1,655,464 | 324.3% |
| $25,000 to $34,999 | 1,844,849 | 361.4% |
| $35,000 to $49,999 | 2,815,769 | 551.6% |
| $50,000 to $74,999 | 4,485,016 | 878.6% |
| $75,000 to $99,999 | 4,034,268 | 790.3% |
| $100,000 to $149,999 | 6,203,778 | 1,215.3% |
| $150,000 to $199,999 | 3,975,564 | 778.8% |
| $200,000+ | 8,909,285 | 1,745.3% |
Family Income by Famaliy Size in Area Code 310
4-person families (103,572 | 20.3%) account for the highest median family income in Area Code 310 with $143,914 per family, while 2-person families (202,734 | 39.7%) have the highest median income of $53,132 per family member.
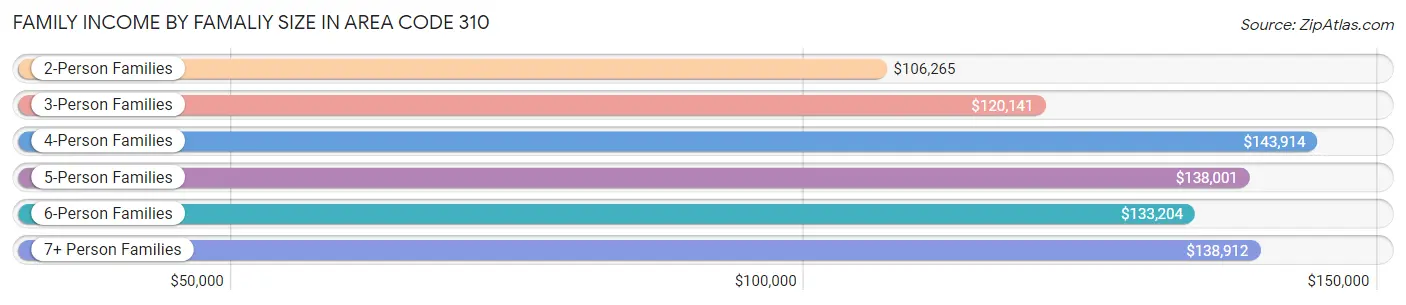
| Income Bracket | # Families | Median Income |
| 2-Person Families | 202,734 (39.7%) | $106,265 |
| 3-Person Families | 120,365 (23.6%) | $120,141 |
| 4-Person Families | 103,572 (20.3%) | $143,914 |
| 5-Person Families | 49,772 (9.8%) | $138,001 |
| 6-Person Families | 19,247 (3.8%) | $133,204 |
| 7+ Person Families | 14,783 (2.9%) | $138,912 |
| Total | 510,473 (100.0%) | $122,787 |
Family Income by Number of Earners in Area Code 310
The median family income in Area Code 310 is $122,787, with families comprising 3+ earners (74,901) having the highest median family income of $161,351, while families with no earners (56,180) have the lowest median family income of $53,792, accounting for 14.7% and 11.0% of families, respectively.
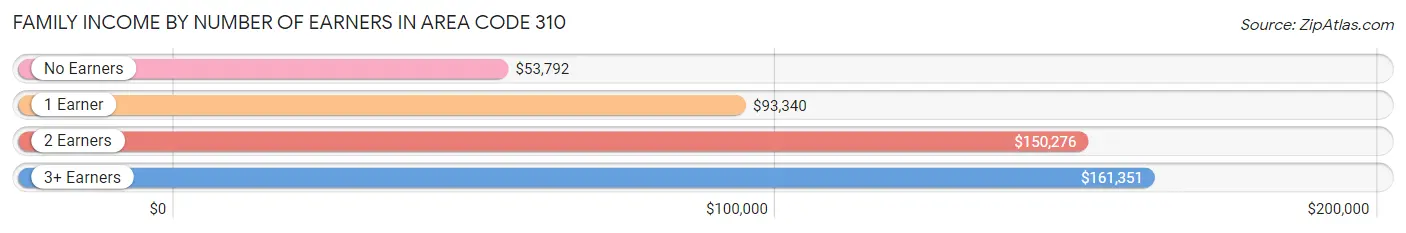
| Number of Earners | # Families | Median Income |
| No Earners | 56,180 (11.0%) | $53,792 |
| 1 Earner | 167,690 (32.9%) | $93,340 |
| 2 Earners | 211,702 (41.5%) | $150,276 |
| 3+ Earners | 74,901 (14.7%) | $161,351 |
| Total | 510,473 (100.0%) | $122,787 |
Household Income in Area Code 310
Household Income Brackets in Area Code 310
With 11,456,784 households falling in the category, the $200,000+ income range is the most frequent in Area Code 310, accounting for 1,343.4% of all households. In contrast, only 2,997,662 households (351.5%) fall into the $10,000 to $14,999 income bracket, making it the least populous group.
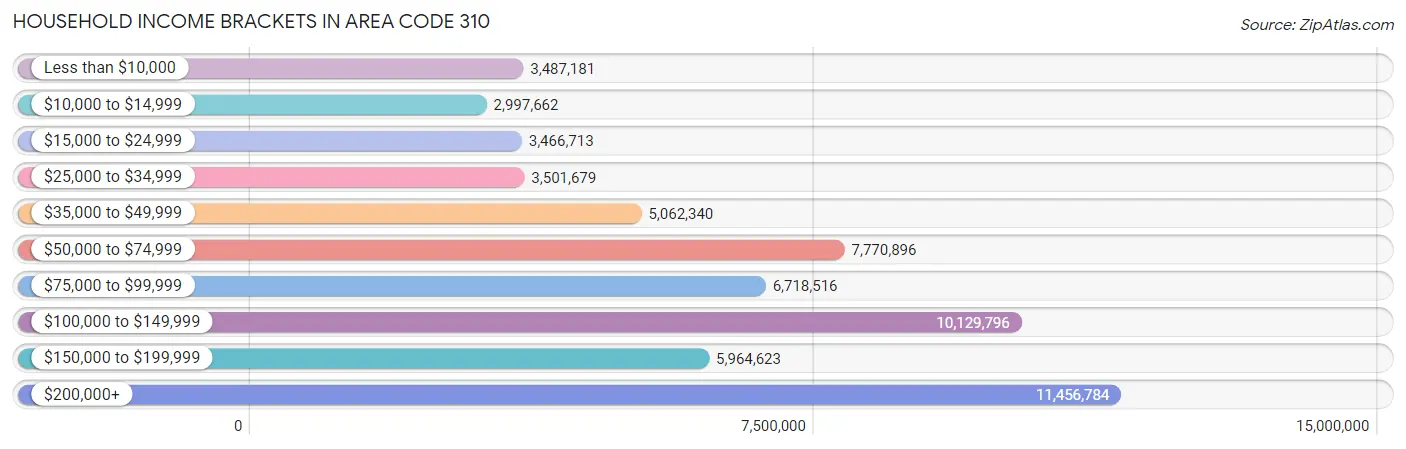
| Income Bracket | # Households | % Households |
| Less than $10,000 | 3,487,181 | 408.9% |
| $10,000 to $14,999 | 2,997,662 | 351.5% |
| $15,000 to $24,999 | 3,466,713 | 406.5% |
| $25,000 to $34,999 | 3,501,679 | 410.6% |
| $35,000 to $49,999 | 5,062,340 | 593.6% |
| $50,000 to $74,999 | 7,770,896 | 911.2% |
| $75,000 to $99,999 | 6,718,516 | 787.8% |
| $100,000 to $149,999 | 10,129,796 | 1,187.8% |
| $150,000 to $199,999 | 5,964,623 | 699.4% |
| $200,000+ | 11,456,784 | 1,343.4% |
Household Income by Householder Age in Area Code 310
The median household income in Area Code 310 is $98,455, with the highest median household income of $112,992 found in the 25 to 44 years age bracket for the primary householder. A total of 318,964 households (37.4%) fall into this category. Meanwhile, the 65+ years age bracket for the primary householder has the lowest median household income of $67,360, with 189,240 households (22.2%) in this group.
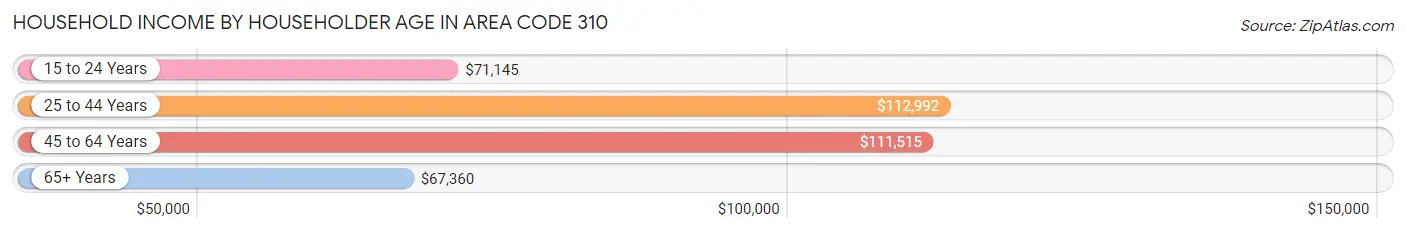
| Income Bracket | # Households | Median Income |
| 15 to 24 Years | 25,997 (3.0%) | $71,145 |
| 25 to 44 Years | 318,964 (37.4%) | $112,992 |
| 45 to 64 Years | 318,619 (37.4%) | $111,515 |
| 65+ Years | 189,240 (22.2%) | $67,360 |
| Total | 852,820 (100.0%) | $98,455 |
Poverty in Area Code 310
Income Below Poverty by Sex and Age in Area Code 310
With 13.4% poverty level for males and 15.3% for females among the residents of Area Code 310, 15 year old males and 15 year old females are the most vulnerable to poverty, with 3,110 males (21.4%) and 3,081 females (23.2%) in their respective age groups living below the poverty level.
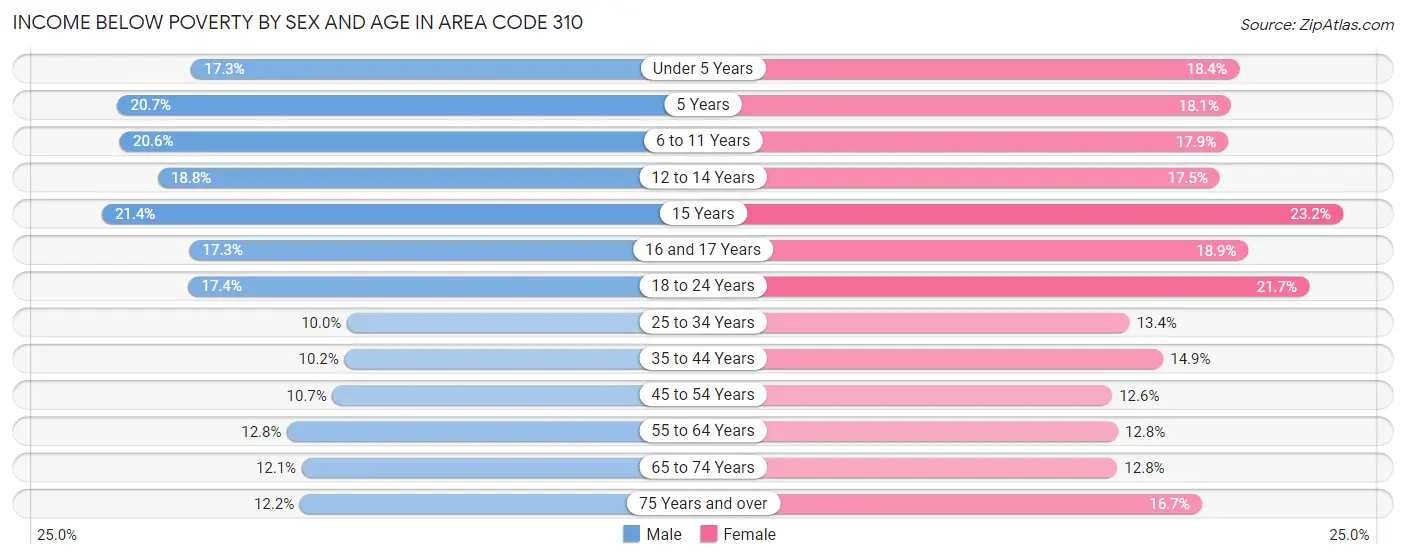
| Age Bracket | Male | Female |
| Under 5 Years | 11,279 (17.3%) | 11,395 (18.4%) |
| 5 Years | 2,745 (20.7%) | 2,178 (18.0%) |
| 6 to 11 Years | 16,981 (20.6%) | 14,444 (17.9%) |
| 12 to 14 Years | 8,225 (18.8%) | 7,124 (17.5%) |
| 15 Years | 3,110 (21.4%) | 3,081 (23.2%) |
| 16 and 17 Years | 4,762 (17.3%) | 4,949 (18.9%) |
| 18 to 24 Years | 17,058 (17.4%) | 21,418 (21.7%) |
| 25 to 34 Years | 19,752 (10.0%) | 26,030 (13.4%) |
| 35 to 44 Years | 16,816 (10.2%) | 23,583 (14.9%) |
| 45 to 54 Years | 15,930 (10.7%) | 19,091 (12.6%) |
| 55 to 64 Years | 17,620 (12.8%) | 17,996 (12.8%) |
| 65 to 74 Years | 10,336 (12.1%) | 12,279 (12.8%) |
| 75 Years and over | 6,372 (12.2%) | 13,273 (16.7%) |
| Total | 150,986 (13.4%) | 176,841 (15.3%) |
Income Above Poverty by Sex and Age in Area Code 310
According to the poverty statistics in Area Code 310, males aged 25 to 34 years and females aged 45 to 54 years are the age groups that are most secure financially, with 90.0% of males and 87.5% of females in these age groups living above the poverty line.
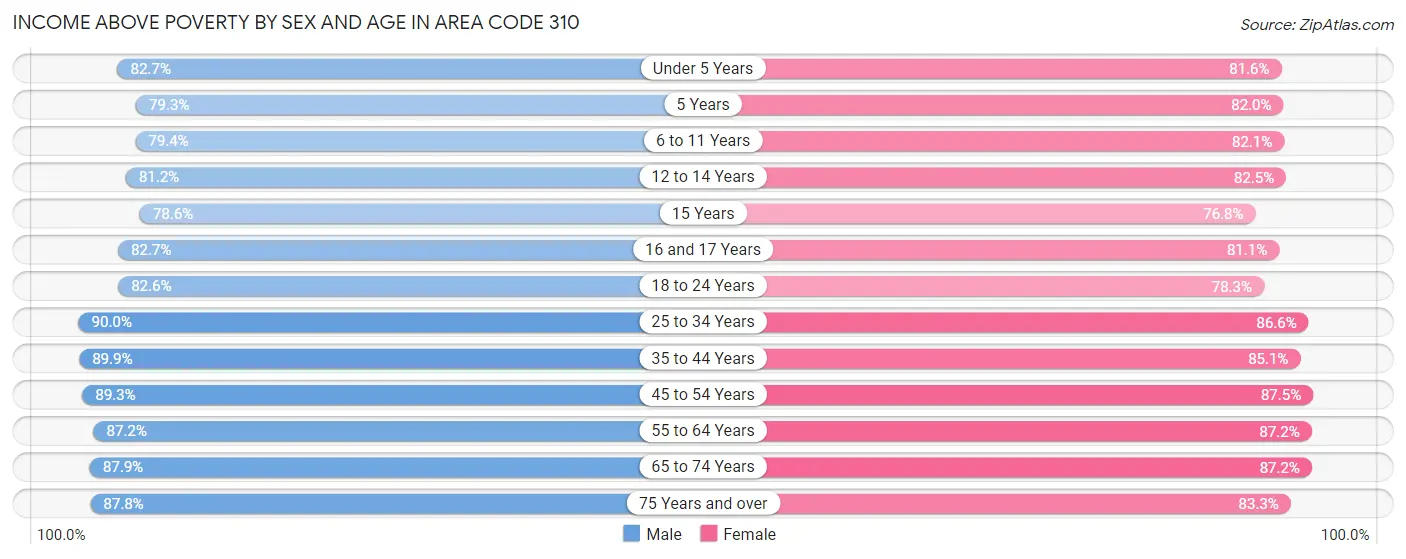
| Age Bracket | Male | Female |
| Under 5 Years | 54,053 (82.7%) | 50,462 (81.6%) |
| 5 Years | 10,526 (79.3%) | 9,886 (82.0%) |
| 6 to 11 Years | 65,584 (79.4%) | 66,173 (82.1%) |
| 12 to 14 Years | 35,506 (81.2%) | 33,495 (82.5%) |
| 15 Years | 11,416 (78.6%) | 10,177 (76.8%) |
| 16 and 17 Years | 22,704 (82.7%) | 21,285 (81.1%) |
| 18 to 24 Years | 81,015 (82.6%) | 77,423 (78.3%) |
| 25 to 34 Years | 177,224 (90.0%) | 168,817 (86.6%) |
| 35 to 44 Years | 148,812 (89.8%) | 134,502 (85.1%) |
| 45 to 54 Years | 132,796 (89.3%) | 133,039 (87.5%) |
| 55 to 64 Years | 119,924 (87.2%) | 122,355 (87.2%) |
| 65 to 74 Years | 74,868 (87.9%) | 83,703 (87.2%) |
| 75 Years and over | 45,759 (87.8%) | 66,230 (83.3%) |
| Total | 980,187 (86.7%) | 977,547 (84.7%) |
Income Below Poverty Among Married-Couple Families in Area Code 310
The poverty statistics for married-couple families in Area Code 310 show that 6.2% or 21,025 of the total 341,241 families live below the poverty line. Families with 5 or more children have the highest poverty rate of 31.1%, comprising of 718 families. On the other hand, families with no children have the lowest poverty rate of 4.1%, which includes 7,502 families.
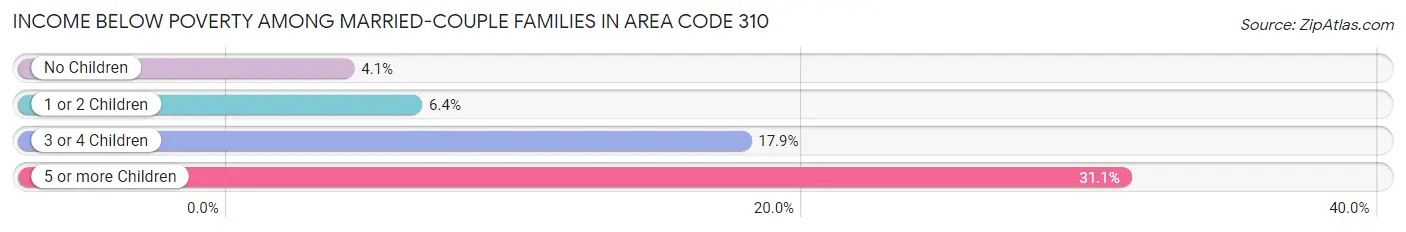
| Children | Above Poverty | Below Poverty |
| No Children | 177,527 (96.0%) | 7,502 (4.1%) |
| 1 or 2 Children | 120,073 (93.6%) | 8,230 (6.4%) |
| 3 or 4 Children | 21,026 (82.1%) | 4,575 (17.9%) |
| 5 or more Children | 1,590 (68.9%) | 718 (31.1%) |
| Total | 320,216 (93.8%) | 21,025 (6.2%) |
Income Below Poverty Among Single-Parent Households in Area Code 310
According to the poverty data in Area Code 310, 12.9% or 6,840 single-father households and 20.7% or 24,058 single-mother households are living below the poverty line. Among single-father households, those with 3 or 4 children have the highest poverty rate, with 1,255 households (31.7%) experiencing poverty. Likewise, among single-mother households, those with 5 or more children have the highest poverty rate, with 938 households (59.1%) falling below the poverty line.
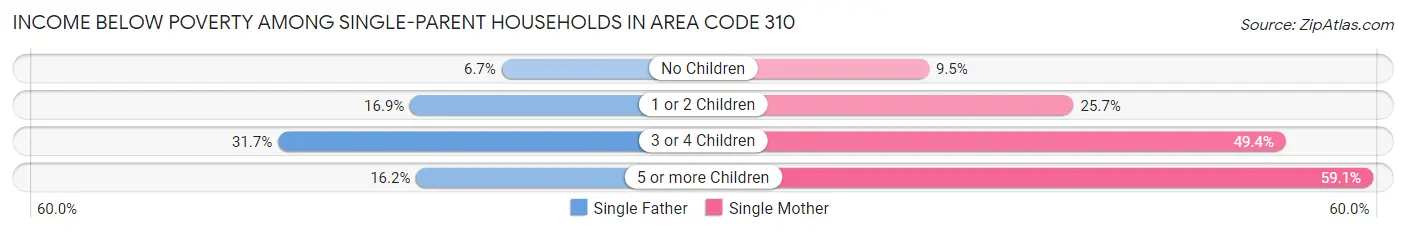
| Children | Single Father | Single Mother |
| No Children | 1,789 (6.7%) | 5,120 (9.5%) |
| 1 or 2 Children | 3,765 (16.9%) | 13,033 (25.7%) |
| 3 or 4 Children | 1,255 (31.7%) | 4,967 (49.4%) |
| 5 or more Children | 31 (16.2%) | 938 (59.1%) |
| Total | 6,840 (12.9%) | 24,058 (20.7%) |
Income Below Poverty Among Married-Couple vs Single-Parent Households in Area Code 310
The poverty data for Area Code 310 shows that 21,025 of the married-couple family households (6.2%) and 30,898 of the single-parent households (18.3%) are living below the poverty level. Within the married-couple family households, those with 5 or more children have the highest poverty rate, with 718 households (31.1%) falling below the poverty line. Among the single-parent households, those with 5 or more children have the highest poverty rate, with 969 household (54.5%) living below poverty.
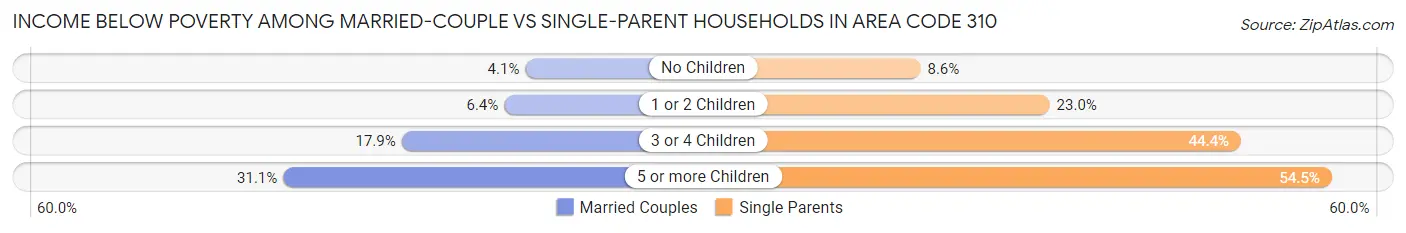
| Children | Married-Couple Families | Single-Parent Households |
| No Children | 7,502 (4.1%) | 6,909 (8.6%) |
| 1 or 2 Children | 8,230 (6.4%) | 16,798 (23.0%) |
| 3 or 4 Children | 4,575 (17.9%) | 6,222 (44.4%) |
| 5 or more Children | 718 (31.1%) | 969 (54.5%) |
| Total | 21,025 (6.2%) | 30,898 (18.3%) |
Race in Area Code 310
The most populous races in Area Code 310 are White / Caucasian (972,143 | 41.9%), Hispanic or Latino (961,707 | 41.4%), and Some other Race (417,314 | 18.0%).
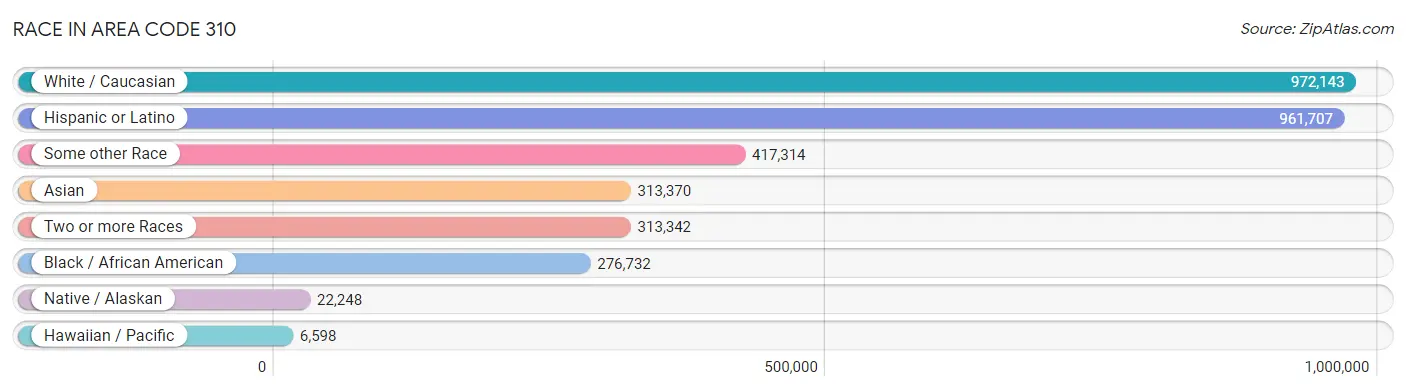
| Race | # Population | % Population |
| Asian | 313,370 | 13.5% |
| Black / African American | 276,732 | 11.9% |
| Hawaiian / Pacific | 6,598 | 0.3% |
| Hispanic or Latino | 961,707 | 41.4% |
| Native / Alaskan | 22,248 | 1.0% |
| White / Caucasian | 972,143 | 41.9% |
| Two or more Races | 313,342 | 13.5% |
| Some other Race | 417,314 | 18.0% |
| Total | 2,321,747 | 100.0% |
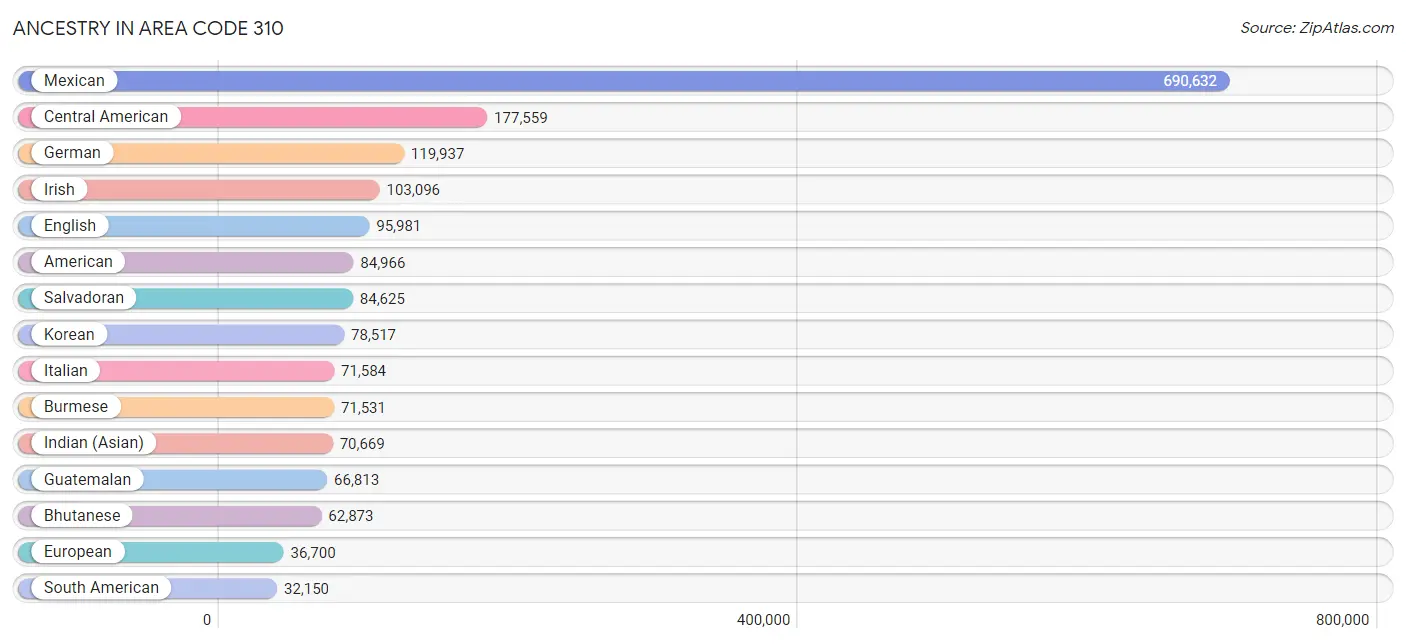
Ancestry in Area Code 310
The most populous ancestries reported in Area Code 310 are Mexican (690,632 | 29.7%), Central American (177,559 | 7.6%), German (119,937 | 5.2%), Irish (103,096 | 4.4%), and English (95,981 | 4.1%), together accounting for 51.1% of all Area Code 310 residents.
| Ancestry | # Population | % Population |
| Afghan | 1,011 | 0.0% |
| African | 12,553 | 0.5% |
| Alaska Native | 115 | 0.0% |
| Alaskan Athabascan | 6 | 0.0% |
| Albanian | 260 | 0.0% |
| Aleut | 11 | 0.0% |
| Alsatian | 4 | 0.0% |
| American | 84,966 | 3.7% |
| Apache | 1,598 | 0.1% |
| Arab | 21,888 | 0.9% |
| Arapaho | 7 | 0.0% |
| Argentinean | 5,305 | 0.2% |
| Armenian | 14,283 | 0.6% |
| Assyrian / Chaldean / Syriac | 698 | 0.0% |
| Australian | 1,873 | 0.1% |
| Austrian | 4,752 | 0.2% |
| Bahamian | 158 | 0.0% |
| Bangladeshi | 397 | 0.0% |
| Barbadian | 166 | 0.0% |
| Basque | 368 | 0.0% |
| Belgian | 1,314 | 0.1% |
| Belizean | 5,684 | 0.2% |
| Bhutanese | 62,873 | 2.7% |
| Blackfeet | 1,149 | 0.1% |
| Bolivian | 946 | 0.0% |
| Brazilian | 5,255 | 0.2% |
| British | 12,441 | 0.5% |
| British West Indian | 447 | 0.0% |
| Bulgarian | 756 | 0.0% |
| Burmese | 71,531 | 3.1% |
| Cajun | 161 | 0.0% |
| Cambodian | 1,357 | 0.1% |
| Canadian | 4,746 | 0.2% |
| Cape Verdean | 145 | 0.0% |
| Carpatho Rusyn | 10 | 0.0% |
| Celtic | 102 | 0.0% |
| Central American | 177,559 | 7.6% |
| Central American Indian | 6,716 | 0.3% |
| Cherokee | 4,588 | 0.2% |
| Cheyenne | 42 | 0.0% |
| Chickasaw | 217 | 0.0% |
| Chilean | 1,614 | 0.1% |
| Chinese | 143 | 0.0% |
| Chippewa | 491 | 0.0% |
| Choctaw | 937 | 0.0% |
| Colombian | 7,954 | 0.3% |
| Colville | 30 | 0.0% |
| Comanche | 179 | 0.0% |
| Costa Rican | 2,068 | 0.1% |
| Cree | 101 | 0.0% |
| Creek | 136 | 0.0% |
| Croatian | 5,550 | 0.2% |
| Crow | 20 | 0.0% |
| Cuban | 8,758 | 0.4% |
| Cypriot | 28 | 0.0% |
| Czech | 4,690 | 0.2% |
| Czechoslovakian | 1,025 | 0.0% |
| Danish | 5,716 | 0.3% |
| Delaware | 391 | 0.0% |
| Dominican | 2,035 | 0.1% |
| Dutch | 12,755 | 0.5% |
| Dutch West Indian | 45 | 0.0% |
| Eastern European | 13,312 | 0.6% |
| Ecuadorian | 5,030 | 0.2% |
| Egyptian | 5,186 | 0.2% |
| English | 95,981 | 4.1% |
| Estonian | 267 | 0.0% |
| Ethiopian | 4,275 | 0.2% |
| European | 36,700 | 1.6% |
| Fijian | 41 | 0.0% |
| Filipino | 7,798 | 0.3% |
| Finnish | 2,468 | 0.1% |
| French | 29,468 | 1.3% |
| French American Indian | 634 | 0.0% |
| French Canadian | 4,984 | 0.2% |
| German | 119,937 | 5.2% |
| German Russian | 92 | 0.0% |
| Ghanaian | 959 | 0.0% |
| Greek | 8,247 | 0.4% |
| Guamanian / Chamorro | 1,338 | 0.1% |
| Guatemalan | 66,813 | 2.9% |
| Guyanese | 525 | 0.0% |
| Haitian | 2,033 | 0.1% |
| Hmong | 41 | 0.0% |
| Honduran | 15,380 | 0.7% |
| Hopi | 95 | 0.0% |
| Houma | 1 | 0.0% |
| Hungarian | 7,826 | 0.3% |
| Icelander | 368 | 0.0% |
| Indian (Asian) | 70,669 | 3.0% |
| Indonesian | 1,985 | 0.1% |
| Inupiat | 62 | 0.0% |
| Iranian | 31,088 | 1.3% |
| Iraqi | 704 | 0.0% |
| Irish | 103,096 | 4.4% |
| Iroquois | 136 | 0.0% |
| Israeli | 4,511 | 0.2% |
| Italian | 71,584 | 3.1% |
| Jamaican | 5,707 | 0.3% |
| Japanese | 15,237 | 0.7% |
| Jordanian | 882 | 0.0% |
| Kenyan | 332 | 0.0% |
| Kiowa | 63 | 0.0% |
| Korean | 78,517 | 3.4% |
| Laotian | 2,898 | 0.1% |
| Latvian | 671 | 0.0% |
| Lebanese | 4,845 | 0.2% |
| Liberian | 132 | 0.0% |
| Lithuanian | 3,739 | 0.2% |
| Lumbee | 31 | 0.0% |
| Luxembourger | 46 | 0.0% |
| Macedonian | 121 | 0.0% |
| Malaysian | 1,157 | 0.1% |
| Maltese | 116 | 0.0% |
| Mexican | 690,632 | 29.7% |
| Mexican American Indian | 13,513 | 0.6% |
| Mongolian | 254 | 0.0% |
| Moroccan | 1,225 | 0.1% |
| Native Hawaiian | 4,548 | 0.2% |
| Navajo | 1,196 | 0.1% |
| Nepalese | 62 | 0.0% |
| New Zealander | 457 | 0.0% |
| Nicaraguan | 5,788 | 0.3% |
| Nigerian | 6,827 | 0.3% |
| Northern European | 2,935 | 0.1% |
| Norwegian | 12,818 | 0.5% |
| Okinawan | 159 | 0.0% |
| Osage | 109 | 0.0% |
| Ottawa | 16 | 0.0% |
| Paiute | 429 | 0.0% |
| Pakistani | 6,209 | 0.3% |
| Palestinian | 1,576 | 0.1% |
| Panamanian | 1,668 | 0.1% |
| Paraguayan | 52 | 0.0% |
| Pennsylvania German | 77 | 0.0% |
| Peruvian | 8,579 | 0.4% |
| Pima | 202 | 0.0% |
| Polish | 31,971 | 1.4% |
| Portuguese | 6,189 | 0.3% |
| Potawatomi | 65 | 0.0% |
| Pueblo | 332 | 0.0% |
| Puerto Rican | 11,659 | 0.5% |
| Romanian | 3,815 | 0.2% |
| Russian | 31,427 | 1.3% |
| Salvadoran | 84,625 | 3.6% |
| Samoan | 4,606 | 0.2% |
| Scandinavian | 3,724 | 0.2% |
| Scotch-Irish | 6,930 | 0.3% |
| Scottish | 18,971 | 0.8% |
| Seminole | 116 | 0.0% |
| Senegalese | 37 | 0.0% |
| Serbian | 1,970 | 0.1% |
| Shoshone | 76 | 0.0% |
| Sierra Leonean | 125 | 0.0% |
| Sioux | 454 | 0.0% |
| Slavic | 725 | 0.0% |
| Slovak | 1,984 | 0.1% |
| Slovene | 528 | 0.0% |
| Somali | 45 | 0.0% |
| South African | 1,137 | 0.1% |
| South American | 32,150 | 1.4% |
| South American Indian | 987 | 0.0% |
| Soviet Union | 89 | 0.0% |
| Spaniard | 8,713 | 0.4% |
| Spanish | 6,849 | 0.3% |
| Spanish American | 353 | 0.0% |
| Spanish American Indian | 155 | 0.0% |
| Sri Lankan | 21,123 | 0.9% |
| Subsaharan African | 28,470 | 1.2% |
| Sudanese | 117 | 0.0% |
| Swedish | 14,130 | 0.6% |
| Swiss | 4,038 | 0.2% |
| Syrian | 1,982 | 0.1% |
| Taiwanese | 48 | 0.0% |
| Thai | 30,985 | 1.3% |
| Tlingit-Haida | 22 | 0.0% |
| Tohono O'Odham | 87 | 0.0% |
| Tongan | 1,422 | 0.1% |
| Trinidadian and Tobagonian | 1,009 | 0.0% |
| Turkish | 2,446 | 0.1% |
| U.S. Virgin Islander | 73 | 0.0% |
| Ugandan | 134 | 0.0% |
| Ukrainian | 6,388 | 0.3% |
| Uruguayan | 494 | 0.0% |
| Ute | 37 | 0.0% |
| Venezuelan | 1,884 | 0.1% |
| Vietnamese | 2,045 | 0.1% |
| Welsh | 5,636 | 0.2% |
| West Indian | 731 | 0.0% |
| Yakama | 7 | 0.0% |
| Yaqui | 535 | 0.0% |
| Yugoslavian | 990 | 0.0% |
| Yuman | 227 | 0.0% |
| Yup'ik | 3 | 0.0% |
| Zimbabwean | 30 | 0.0% | View All 195 Rows |
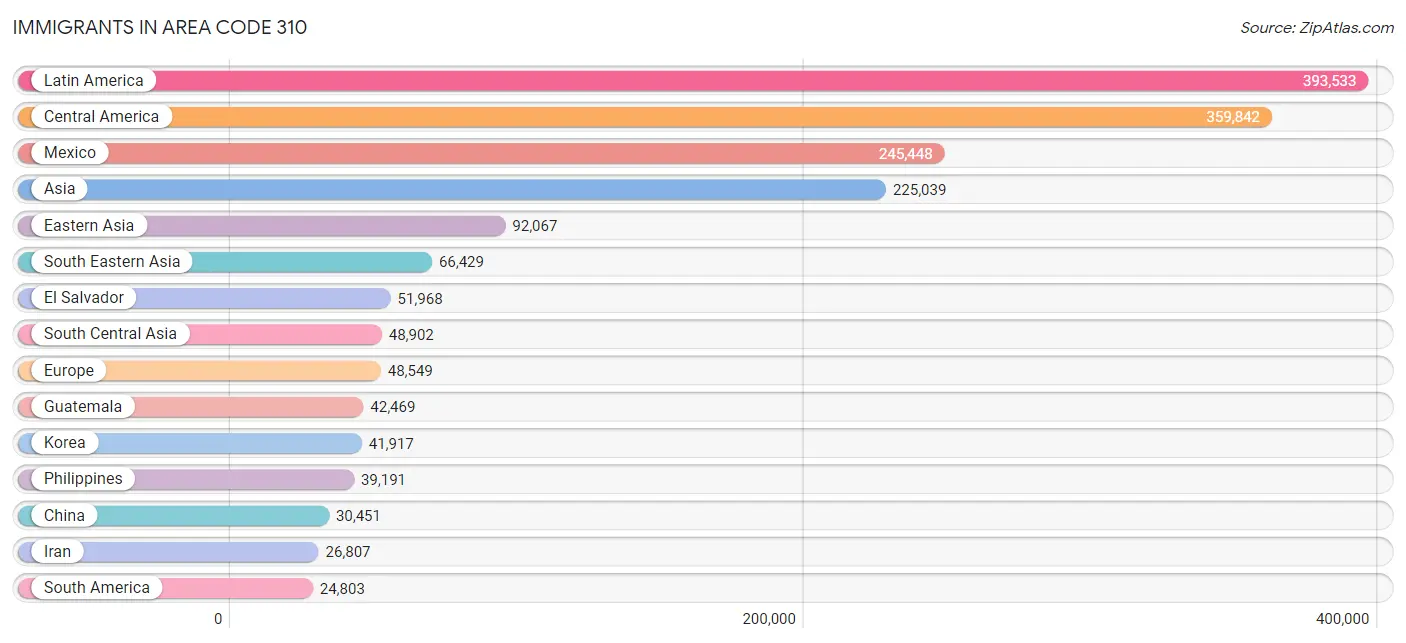
Immigrants in Area Code 310
The most numerous immigrant groups reported in Area Code 310 came from Latin America (393,533 | 17.0%), Central America (359,842 | 15.5%), Mexico (245,448 | 10.6%), Asia (225,039 | 9.7%), and Eastern Asia (92,067 | 4.0%), together accounting for 56.7% of all Area Code 310 residents.
| Immigration Origin | # Population | % Population |
| Afghanistan | 774 | 0.0% |
| Africa | 21,843 | 0.9% |
| Albania | 91 | 0.0% |
| Argentina | 3,362 | 0.1% |
| Armenia | 3,759 | 0.2% |
| Asia | 225,039 | 9.7% |
| Australia | 2,123 | 0.1% |
| Austria | 587 | 0.0% |
| Azores | 24 | 0.0% |
| Bahamas | 106 | 0.0% |
| Bangladesh | 2,115 | 0.1% |
| Barbados | 111 | 0.0% |
| Belarus | 823 | 0.0% |
| Belgium | 318 | 0.0% |
| Belize | 4,359 | 0.2% |
| Bolivia | 578 | 0.0% |
| Bosnia and Herzegovina | 151 | 0.0% |
| Brazil | 5,732 | 0.3% |
| Bulgaria | 447 | 0.0% |
| Cabo Verde | 17 | 0.0% |
| Cambodia | 6,654 | 0.3% |
| Cameroon | 390 | 0.0% |
| Canada | 8,578 | 0.4% |
| Caribbean | 8,888 | 0.4% |
| Central America | 359,842 | 15.5% |
| Chile | 929 | 0.0% |
| China | 30,451 | 1.3% |
| Colombia | 3,600 | 0.2% |
| Congo | 162 | 0.0% |
| Costa Rica | 932 | 0.0% |
| Croatia | 992 | 0.0% |
| Cuba | 3,303 | 0.1% |
| Czechoslovakia | 789 | 0.0% |
| Denmark | 517 | 0.0% |
| Dominican Republic | 527 | 0.0% |
| Eastern Africa | 4,869 | 0.2% |
| Eastern Asia | 92,067 | 4.0% |
| Eastern Europe | 17,479 | 0.7% |
| Ecuador | 2,440 | 0.1% |
| Egypt | 4,273 | 0.2% |
| El Salvador | 51,968 | 2.2% |
| England | 4,942 | 0.2% |
| Eritrea | 375 | 0.0% |
| Ethiopia | 2,758 | 0.1% |
| Europe | 48,549 | 2.1% |
| Fiji | 628 | 0.0% |
| France | 3,924 | 0.2% |
| Germany | 4,655 | 0.2% |
| Ghana | 606 | 0.0% |
| Greece | 882 | 0.0% |
| Grenada | 222 | 0.0% |
| Guatemala | 42,469 | 1.8% |
| Guyana | 507 | 0.0% |
| Haiti | 807 | 0.0% |
| Honduras | 9,842 | 0.4% |
| Hong Kong | 2,591 | 0.1% |
| Hungary | 1,020 | 0.0% |
| India | 15,034 | 0.6% |
| Indonesia | 1,958 | 0.1% |
| Iran | 26,807 | 1.1% |
| Iraq | 691 | 0.0% |
| Ireland | 995 | 0.0% |
| Israel | 4,428 | 0.2% |
| Italy | 2,849 | 0.1% |
| Jamaica | 2,766 | 0.1% |
| Japan | 18,888 | 0.8% |
| Jordan | 964 | 0.0% |
| Kazakhstan | 367 | 0.0% |
| Kenya | 683 | 0.0% |
| Korea | 41,917 | 1.8% |
| Kuwait | 435 | 0.0% |
| Laos | 237 | 0.0% |
| Latin America | 393,533 | 17.0% |
| Latvia | 136 | 0.0% |
| Lebanon | 1,758 | 0.1% |
| Liberia | 133 | 0.0% |
| Lithuania | 756 | 0.0% |
| Malaysia | 580 | 0.0% |
| Mexico | 245,448 | 10.6% |
| Middle Africa | 692 | 0.0% |
| Moldova | 179 | 0.0% |
| Morocco | 672 | 0.0% |
| Nepal | 443 | 0.0% |
| Netherlands | 1,116 | 0.1% |
| Nicaragua | 3,720 | 0.2% |
| Nigeria | 6,432 | 0.3% |
| North Macedonia | 13 | 0.0% |
| Northern Africa | 5,967 | 0.3% |
| Northern Europe | 14,760 | 0.6% |
| Norway | 209 | 0.0% |
| Oceania | 4,766 | 0.2% |
| Pakistan | 2,445 | 0.1% |
| Panama | 929 | 0.0% |
| Peru | 5,655 | 0.2% |
| Philippines | 39,191 | 1.7% |
| Poland | 1,936 | 0.1% |
| Portugal | 215 | 0.0% |
| Romania | 1,077 | 0.1% |
| Russia | 4,530 | 0.2% |
| Saudi Arabia | 546 | 0.0% |
| Scotland | 820 | 0.0% |
| Senegal | 85 | 0.0% |
| Serbia | 653 | 0.0% |
| Sierra Leone | 319 | 0.0% |
| Singapore | 755 | 0.0% |
| Somalia | 49 | 0.0% |
| South Africa | 1,906 | 0.1% |
| South America | 24,803 | 1.1% |
| South Central Asia | 48,902 | 2.1% |
| South Eastern Asia | 66,429 | 2.9% |
| Southern Europe | 5,072 | 0.2% |
| Spain | 1,126 | 0.1% |
| Sri Lanka | 743 | 0.0% |
| Sudan | 411 | 0.0% |
| Sweden | 1,098 | 0.1% |
| Switzerland | 400 | 0.0% |
| Syria | 1,733 | 0.1% |
| Taiwan | 7,271 | 0.3% |
| Thailand | 3,810 | 0.2% |
| Trinidad and Tobago | 776 | 0.0% |
| Turkey | 1,499 | 0.1% |
| Uganda | 418 | 0.0% |
| Ukraine | 2,573 | 0.1% |
| Uruguay | 393 | 0.0% |
| Uzbekistan | 69 | 0.0% |
| Venezuela | 1,459 | 0.1% |
| Vietnam | 11,491 | 0.5% |
| West Indies | 89 | 0.0% |
| Western Africa | 7,934 | 0.3% |
| Western Asia | 17,197 | 0.7% |
| Western Europe | 11,049 | 0.5% |
| Yemen | 17 | 0.0% |
| Zaire | 98 | 0.0% |
| Zimbabwe | 77 | 0.0% | View All 134 Rows |
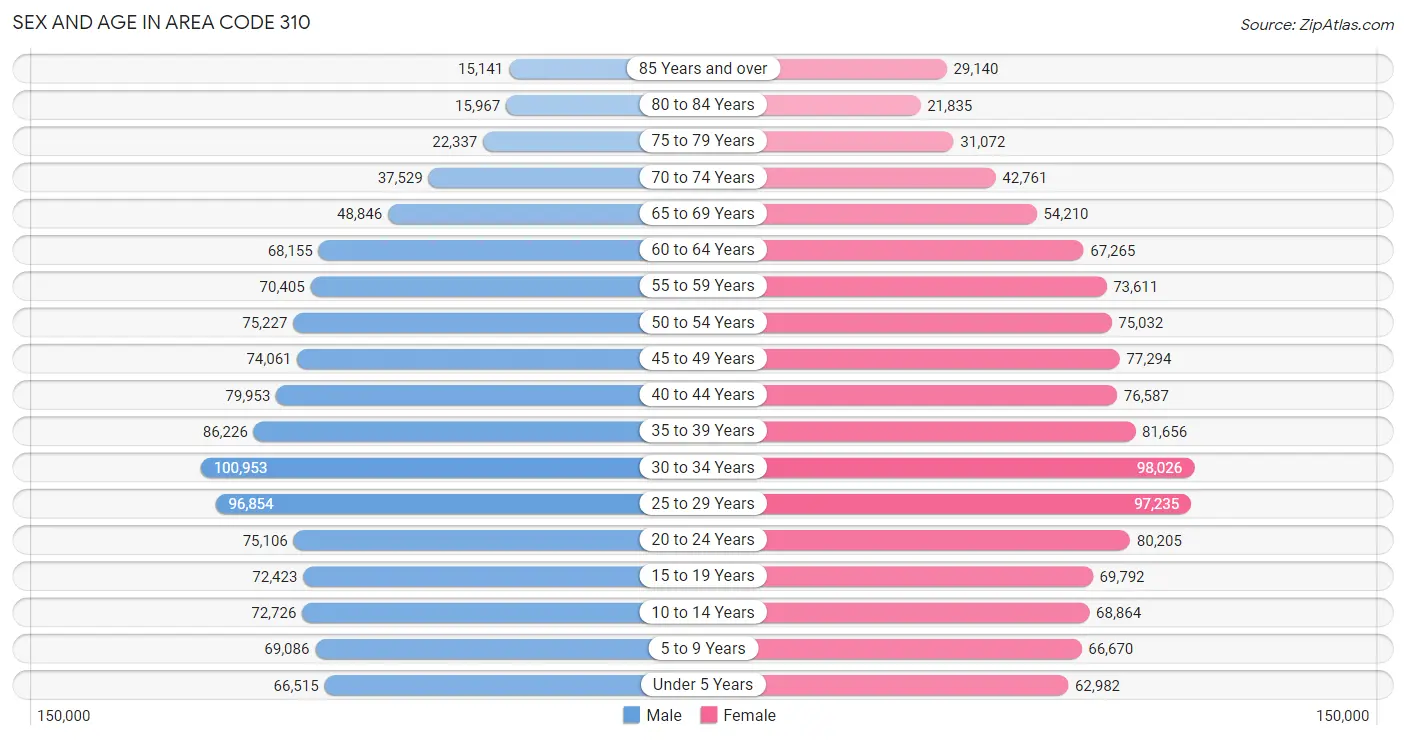
Sex and Age in Area Code 310
Sex and Age in Area Code 310
The most populous age groups in Area Code 310 are 30 to 34 Years (100,953 | 8.8%) for men and 30 to 34 Years (98,026 | 8.4%) for women.
| Age Bracket | Male | Female |
| Under 5 Years | 66,515 (5.8%) | 62,982 (5.4%) |
| 5 to 9 Years | 69,086 (6.0%) | 66,670 (5.7%) |
| 10 to 14 Years | 72,726 (6.3%) | 68,864 (5.9%) |
| 15 to 19 Years | 72,423 (6.3%) | 69,792 (5.9%) |
| 20 to 24 Years | 75,106 (6.6%) | 80,205 (6.8%) |
| 25 to 29 Years | 96,854 (8.4%) | 97,235 (8.3%) |
| 30 to 34 Years | 100,953 (8.8%) | 98,026 (8.4%) |
| 35 to 39 Years | 86,226 (7.5%) | 81,656 (7.0%) |
| 40 to 44 Years | 79,953 (7.0%) | 76,587 (6.5%) |
| 45 to 49 Years | 74,061 (6.5%) | 77,294 (6.6%) |
| 50 to 54 Years | 75,227 (6.6%) | 75,032 (6.4%) |
| 55 to 59 Years | 70,405 (6.1%) | 73,611 (6.3%) |
| 60 to 64 Years | 68,155 (5.9%) | 67,265 (5.7%) |
| 65 to 69 Years | 48,846 (4.3%) | 54,210 (4.6%) |
| 70 to 74 Years | 37,529 (3.3%) | 42,761 (3.6%) |
| 75 to 79 Years | 22,337 (1.9%) | 31,072 (2.6%) |
| 80 to 84 Years | 15,967 (1.4%) | 21,835 (1.9%) |
| 85 Years and over | 15,141 (1.3%) | 29,140 (2.5%) |
| Total | 1,147,510 (100.0%) | 1,174,237 (100.0%) |
Families and Households in Area Code 310
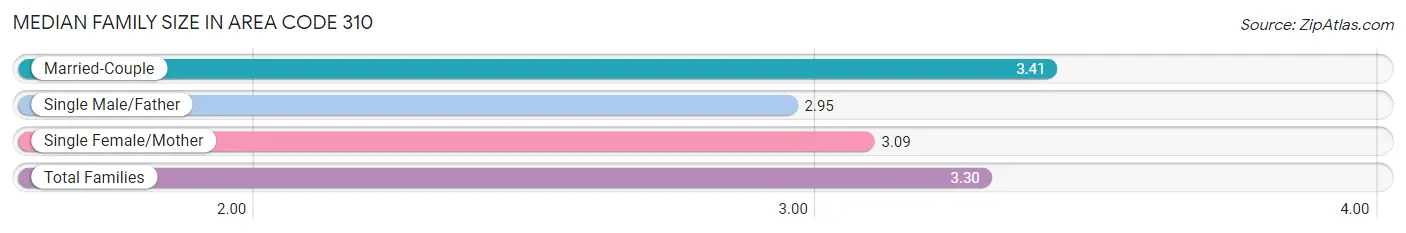
Median Family Size in Area Code 310
The median family size in Area Code 310 is 3.29 persons per family, with married-couple families (341,241 | 66.8%) accounting for the largest median family size of 3.412 persons per family. On the other hand, single male/father families (53,175 | 10.4%) represent the smallest median family size with 2.95 persons per family.
| Family Type | # Families | Family Size |
| Married-Couple | 341,241 (66.8%) | 3.41 |
| Single Male/Father | 53,175 (10.4%) | 2.95 |
| Single Female/Mother | 116,057 (22.7%) | 3.09 |
| Total Families | 510,473 (100.0%) | 3.29 |
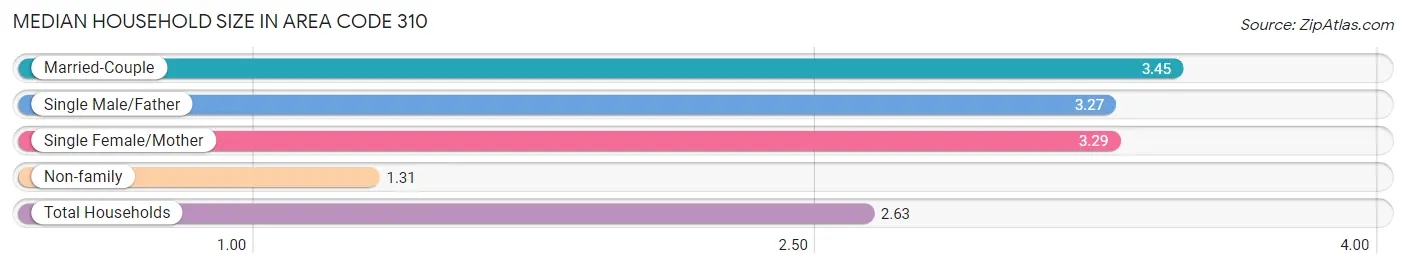
Median Household Size in Area Code 310
The median household size in Area Code 310 is 2.63 persons per household, with married-couple households (341,241 | 40.0%) accounting for the largest median household size of 3.45385 persons per household. non-family households (342,347 | 40.1%) represent the smallest median household size with 1.30 persons per household.
| Household Type | # Households | Household Size |
| Married-Couple | 341,241 (40.0%) | 3.45 |
| Single Male/Father | 53,175 (6.2%) | 3.27 |
| Single Female/Mother | 116,057 (13.6%) | 3.29 |
| Non-family | 342,347 (40.1%) | 1.30 |
| Total Households | 852,820 (100.0%) | 2.63 |
Household Size by Marriage Status in Area Code 310
Out of a total of 852,820 households in Area Code 310, 510,473 (59.9%) are family households, while 342,347 (40.1%) are nonfamily households. The most numerous type of family households are 2-person households, comprising 185,171, and the most common type of nonfamily households are 1-person households, comprising 263,400.
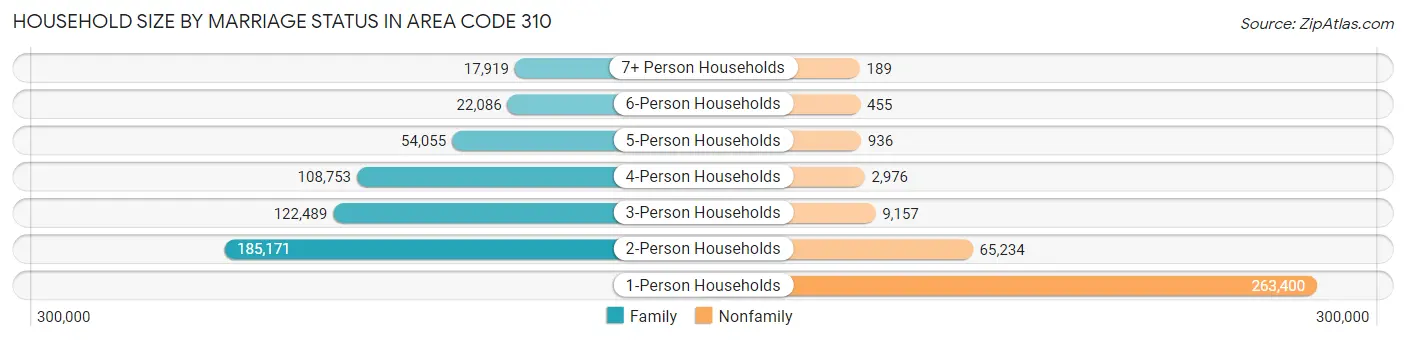
| Household Size | Family Households | Nonfamily Households |
| 1-Person Households | - | 263,400 (30.9%) |
| 2-Person Households | 185,171 (21.7%) | 65,234 (7.6%) |
| 3-Person Households | 122,489 (14.4%) | 9,157 (1.1%) |
| 4-Person Households | 108,753 (12.8%) | 2,976 (0.4%) |
| 5-Person Households | 54,055 (6.3%) | 936 (0.1%) |
| 6-Person Households | 22,086 (2.6%) | 455 (0.1%) |
| 7+ Person Households | 17,919 (2.1%) | 189 (0.0%) |
| Total | 510,473 (59.9%) | 342,347 (40.1%) |
Female Fertility in Area Code 310
Fertility by Age in Area Code 310
Average fertility rate in Area Code 310 is 43.8 births per 1,000 women. Women in the age bracket of 20 to 34 years have the highest fertility rate with 59.8 births per 1,000 women. Women in the age bracket of 20 to 34 years acount for 62.2% of all women with births.
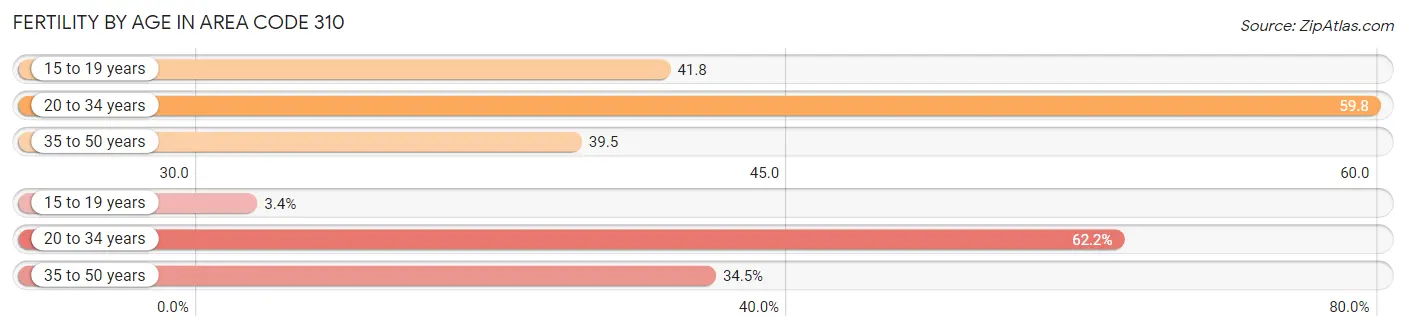
| Age Bracket | Women with Births | Births / 1,000 Women |
| 15 to 19 years | 924 (3.4%) | 41.8 |
| 20 to 34 years | 17,142 (62.2%) | 59.8 |
| 35 to 50 years | 9,502 (34.5%) | 39.5 |
| Total | 27,568 (100.0%) | 43.8 |
Fertility by Age by Marriage Status in Area Code 310
64.9% of women with births (27,568) in Area Code 310 are married. The highest percentage of unmarried women with births falls into 15 to 19 years age bracket with 95.7% of them unmarried at the time of birth, while the lowest percentage of unmarried women with births belong to 35 to 50 years age bracket with 29.8% of them unmarried.
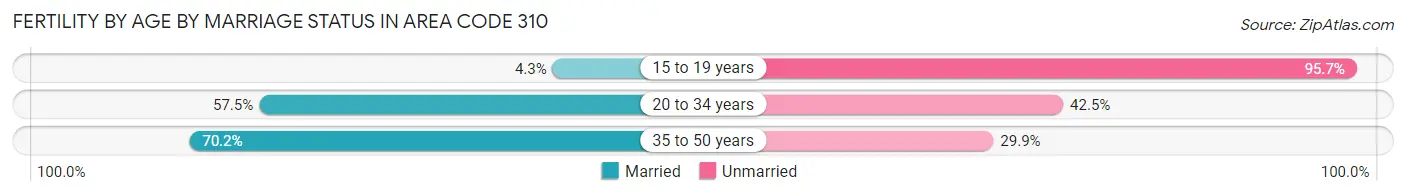
| Age Bracket | Married | Unmarried |
| 15 to 19 years | 40 (4.3%) | 884 (95.7%) |
| 20 to 34 years | 9,859 (57.5%) | 7,283 (42.5%) |
| 35 to 50 years | 6,666 (70.2%) | 2,836 (29.8%) |
| Total | 17,902 (64.9%) | 9,666 (35.1%) |
Fertility by Education in Area Code 310
Average fertility rate in Area Code 310 is 43.8 births per 1,000 women. Women with the education attainment of high school diploma have the highest fertility rate of 65.8 births per 1,000 women, while women with the education attainment of less than high school have the lowest fertility at 42.9 births per 1,000 women. Women with the education attainment of college or associate's degree represent 24.6% of all women with births.
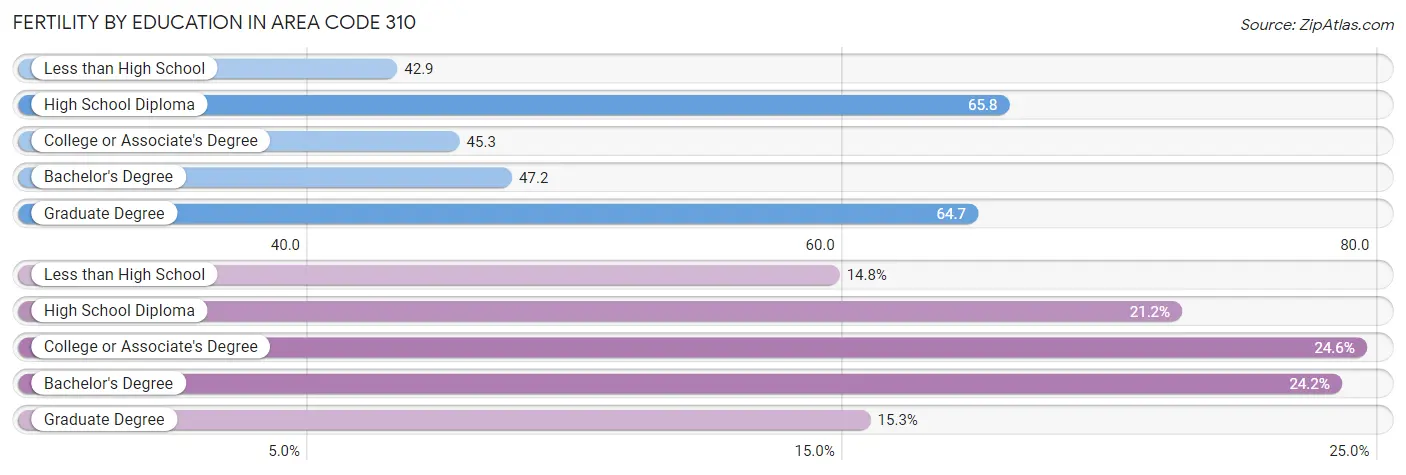
| Educational Attainment | Women with Births | Births / 1,000 Women |
| Less than High School | 4,065 (14.7%) | 42.9 |
| High School Diploma | 5,833 (21.2%) | 65.8 |
| College or Associate's Degree | 6,786 (24.6%) | 45.3 |
| Bachelor's Degree | 6,659 (24.1%) | 47.2 |
| Graduate Degree | 4,225 (15.3%) | 64.7 |
| Total | 27,568 (100.0%) | 43.8 |
Fertility by Education by Marriage Status in Area Code 310
35.1% of women with births in Area Code 310 are unmarried. Women with the educational attainment of graduate degree are most likely to be married with 59.7% of them married at childbirth, while women with the educational attainment of less than high school are least likely to be married with 65.1% of them unmarried at childbirth.
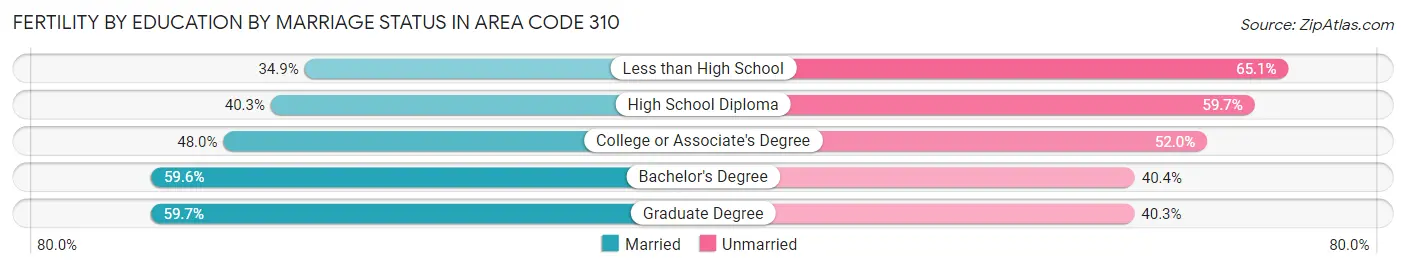
| Educational Attainment | Married | Unmarried |
| Less than High School | 1,418 (34.9%) | 2,647 (65.1%) |
| High School Diploma | 2,351 (40.3%) | 3,482 (59.7%) |
| College or Associate's Degree | 3,255 (48.0%) | 3,531 (52.0%) |
| Bachelor's Degree | 3,970 (59.6%) | 2,689 (40.4%) |
| Graduate Degree | 2,522 (59.7%) | 1,703 (40.3%) |
| Total | 17,902 (64.9%) | 9,666 (35.1%) |
Employment Characteristics in Area Code 310
Employment by Class of Employer in Area Code 310
Among the 1,126,461 employed individuals in Area Code 310, private company employees (757,770 | 67.3%), self-employed (not incorporated) (99,076 | 8.8%), and not-for-profit organizations (78,668 | 7.0%) make up the most common classes of employment.
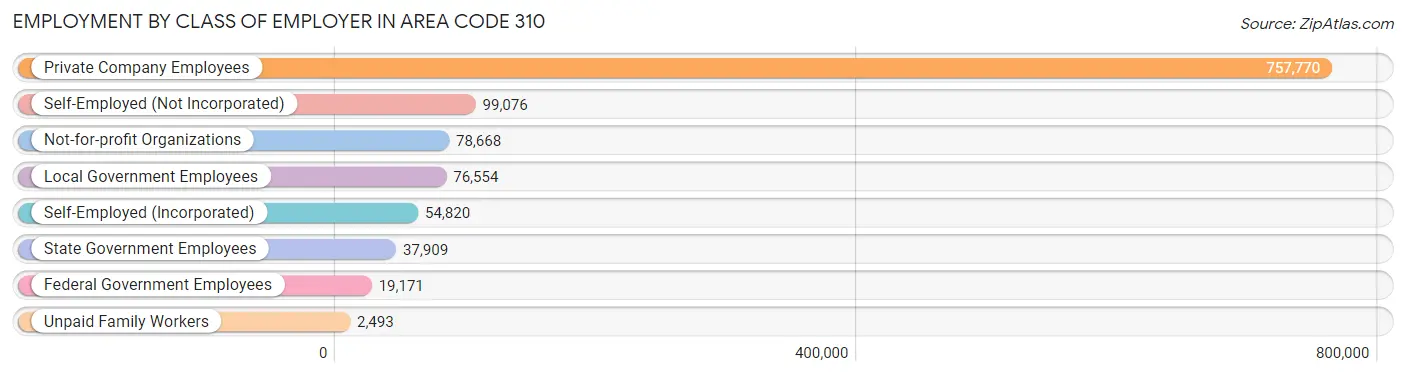
| Employer Class | # Employees | % Employees |
| Private Company Employees | 757,770 | 67.3% |
| Self-Employed (Incorporated) | 54,820 | 4.9% |
| Self-Employed (Not Incorporated) | 99,076 | 8.8% |
| Not-for-profit Organizations | 78,668 | 7.0% |
| Local Government Employees | 76,554 | 6.8% |
| State Government Employees | 37,909 | 3.4% |
| Federal Government Employees | 19,171 | 1.7% |
| Unpaid Family Workers | 2,493 | 0.2% |
| Total | 1,126,461 | 100.0% |
Employment Status by Age in Area Code 310
According to the labor force statistics for Area Code 310, out of the total population over 16 years of age (1,887,094), 64.6% or 1,218,308 individuals are in the labor force, with 7.3% or 89,058 of them unemployed. The age group with the highest labor force participation rate is 30 to 34 years, with 86.2% or 171,480 individuals in the labor force. Within the labor force, the 16 to 19 years age range has the highest percentage of unemployed individuals, with 1,373.9% or 381,010 of them being unemployed.
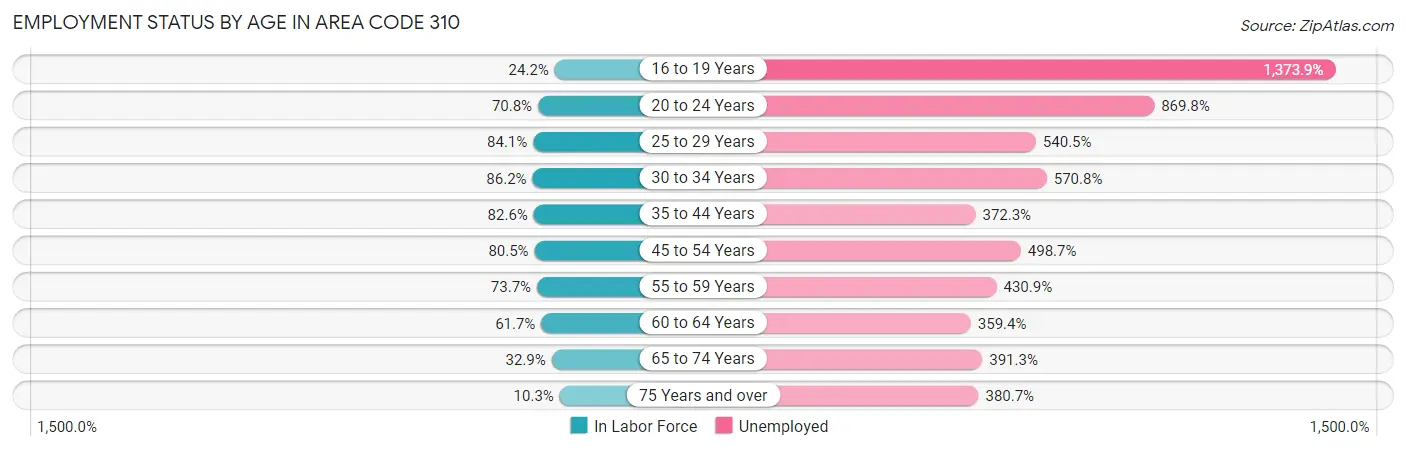
| Age Bracket | In Labor Force | Unemployed |
| 16 to 19 Years | 27,733 (24.2%) | 381,010 (1,373.9%) |
| 20 to 24 Years | 109,940 (70.8%) | 956,302 (869.8%) |
| 25 to 29 Years | 163,297 (84.1%) | 882,669 (540.5%) |
| 30 to 34 Years | 171,470 (86.2%) | 978,808 (570.8%) |
| 35 to 44 Years | 268,091 (82.6%) | 998,144 (372.3%) |
| 45 to 54 Years | 242,812 (80.5%) | 1,210,839 (498.7%) |
| 55 to 59 Years | 106,080 (73.7%) | 457,107 (430.9%) |
| 60 to 64 Years | 83,587 (61.7%) | 300,390 (359.4%) |
| 65 to 74 Years | 60,384 (32.9%) | 236,251 (391.3%) |
| 75 Years and over | 14,003 (10.3%) | 53,283 (380.7%) |
| Total | 1,218,235 (64.6%) | 89,004 (7.3%) |
Employment Status by Educational Attainment in Area Code 310
According to labor force statistics for Area Code 310, 79.0% of individuals (1,025,327) out of the total population between 25 and 64 years of age (1,298,540) are in the labor force, with 464.5% or 4,762,644 of them being unemployed. The group with the highest labor force participation rate are those with the educational attainment of bachelor's degree or higher, with 85.6% or 458,197 individuals in the labor force. Within the labor force, individuals with less than high school education have the highest percentage of unemployment, with 719.7% or 990,717 of them being unemployed.
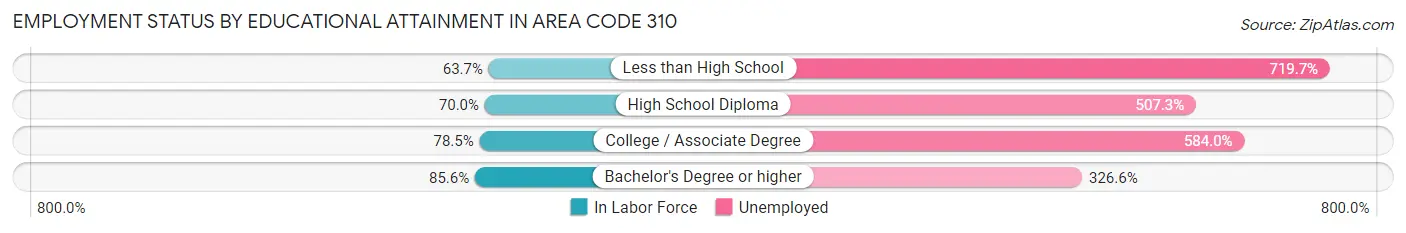
| Educational Attainment | In Labor Force | Unemployed |
| Less than High School | 137,655 (63.7%) | 1,556,020 (719.7%) |
| High School Diploma | 162,035 (70.0%) | 1,175,181 (507.3%) |
| College / Associate Degree | 247,268 (78.5%) | 1,840,505 (584.0%) |
| Bachelor's Degree or higher | 458,177 (85.6%) | 1,749,031 (326.6%) |
| Total | 1,025,269 (79.0%) | 6,031,718 (464.5%) |
Employment Occupations by Sex in Area Code 310
Management, Business, Science and Arts Occupations
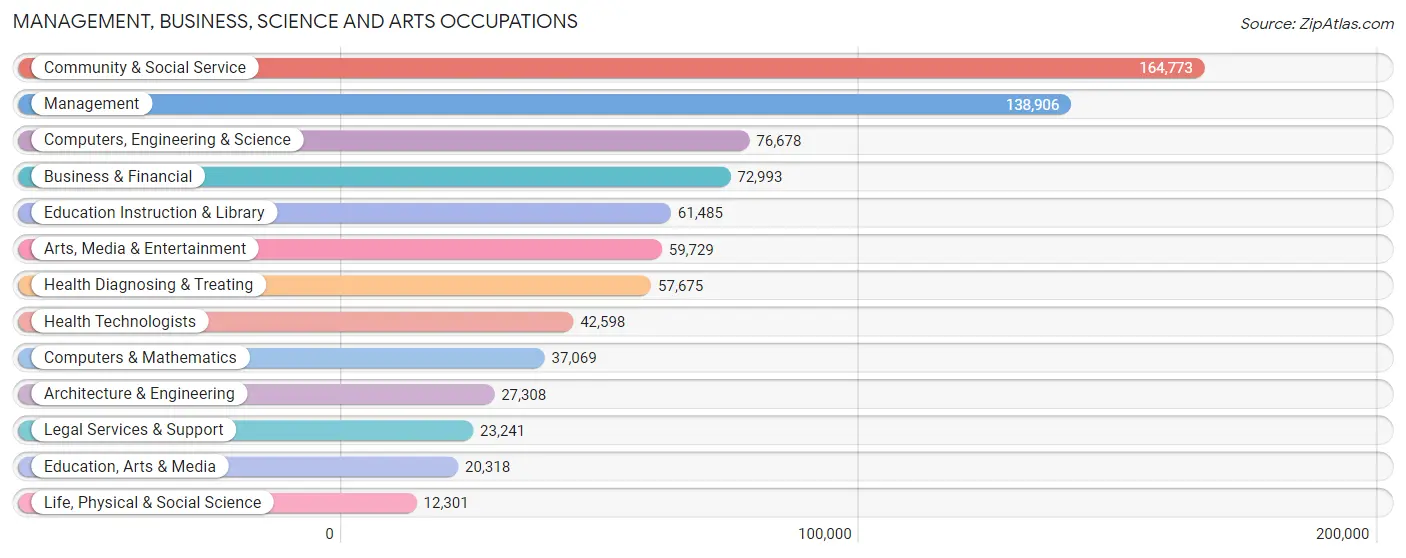
The most common Management, Business, Science and Arts occupations in Area Code 310 are Community & Social Service (164,773 | 14.2%), Management (138,906 | 12.0%), Computers, Engineering & Science (76,678 | 6.6%), Business & Financial (72,993 | 6.3%), and Education Instruction & Library (61,485 | 5.3%).
Management, Business, Science and Arts Occupations by Sex
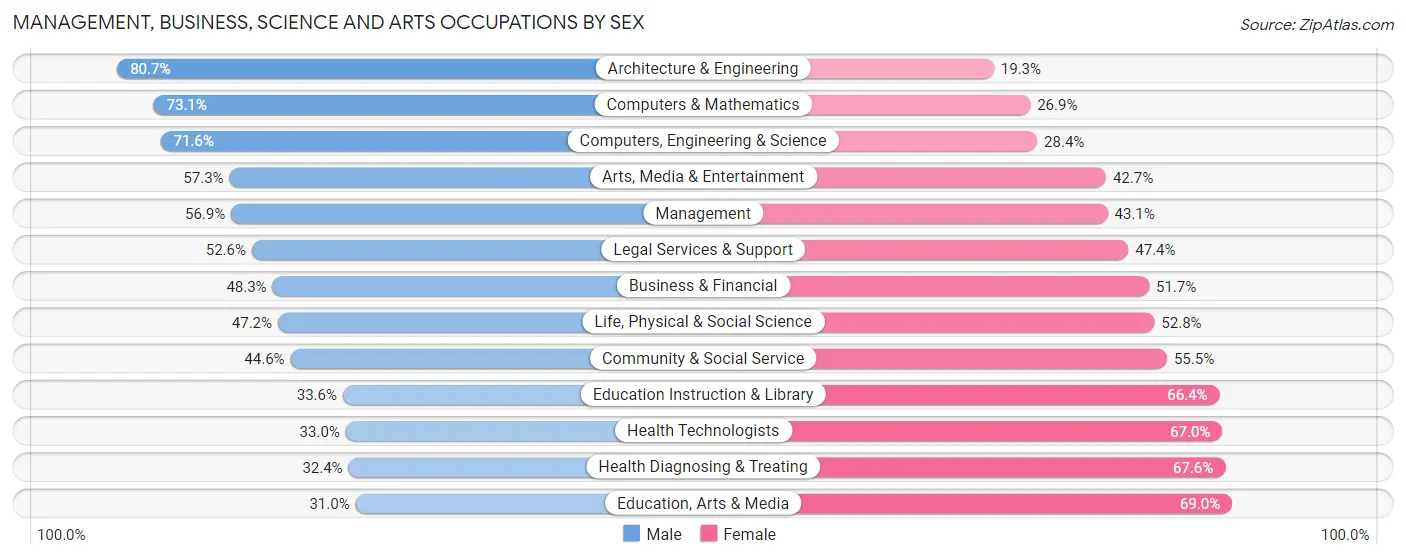
Within the Management, Business, Science and Arts occupations in Area Code 310, the most male-oriented occupations are Architecture & Engineering (80.7%), Computers & Mathematics (73.1%), and Computers, Engineering & Science (71.6%), while the most female-oriented occupations are Education, Arts & Media (69.0%), Health Diagnosing & Treating (67.6%), and Health Technologists (67.0%).
| Occupation | Male | Female |
| Management | 79,087 (56.9%) | 59,819 (43.1%) |
| Business & Financial | 35,257 (48.3%) | 37,736 (51.7%) |
| Computers, Engineering & Science | 54,921 (71.6%) | 21,757 (28.4%) |
| Computers & Mathematics | 27,090 (73.1%) | 9,979 (26.9%) |
| Architecture & Engineering | 22,029 (80.7%) | 5,279 (19.3%) |
| Life, Physical & Social Science | 5,802 (47.2%) | 6,499 (52.8%) |
| Community & Social Service | 73,406 (44.6%) | 91,367 (55.4%) |
| Education, Arts & Media | 6,295 (31.0%) | 14,023 (69.0%) |
| Legal Services & Support | 12,227 (52.6%) | 11,014 (47.4%) |
| Education Instruction & Library | 20,674 (33.6%) | 40,811 (66.4%) |
| Arts, Media & Entertainment | 34,210 (57.3%) | 25,519 (42.7%) |
| Health Diagnosing & Treating | 18,708 (32.4%) | 38,967 (67.6%) |
| Health Technologists | 14,069 (33.0%) | 28,529 (67.0%) |
| Total (Category) | 261,379 (51.1%) | 249,646 (48.8%) |
| Total (Overall) | 620,210 (53.6%) | 537,618 (46.4%) |
Services Occupations
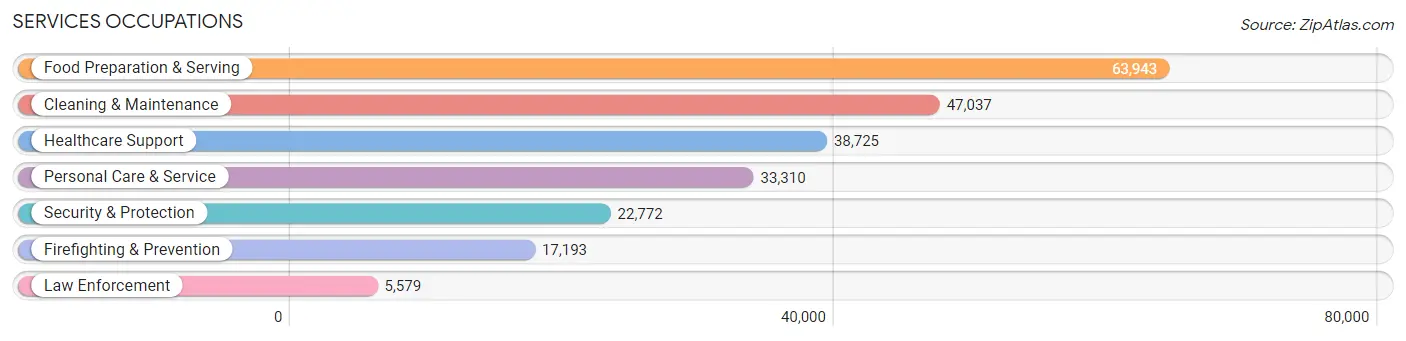
The most common Services occupations in Area Code 310 are Food Preparation & Serving (63,943 | 5.5%), Cleaning & Maintenance (47,037 | 4.1%), Healthcare Support (38,725 | 3.3%), Personal Care & Service (33,310 | 2.9%), and Security & Protection (22,772 | 2.0%).
Services Occupations by Sex
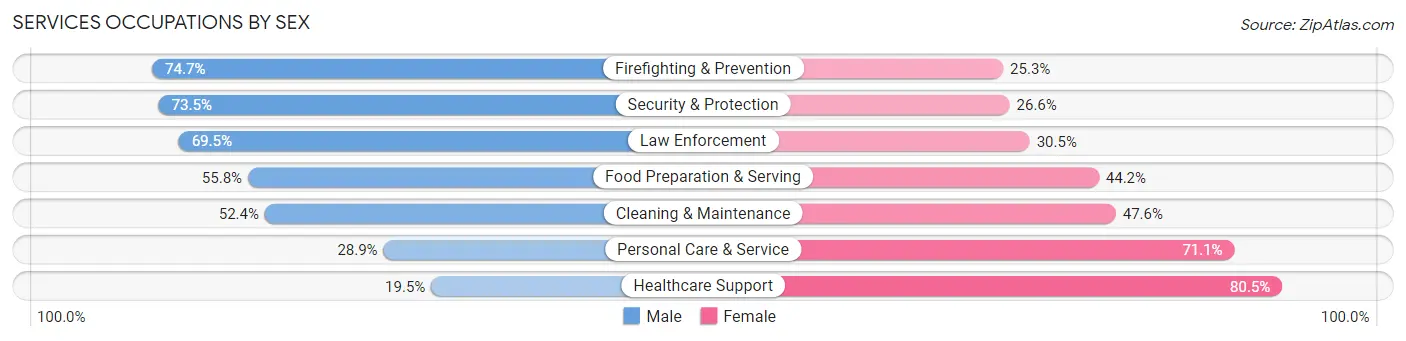
Within the Services occupations in Area Code 310, the most male-oriented occupations are Firefighting & Prevention (74.7%), Security & Protection (73.5%), and Law Enforcement (69.5%), while the most female-oriented occupations are Healthcare Support (80.5%), Personal Care & Service (71.1%), and Cleaning & Maintenance (47.6%).
| Occupation | Male | Female |
| Healthcare Support | 7,547 (19.5%) | 31,178 (80.5%) |
| Security & Protection | 16,725 (73.5%) | 6,047 (26.6%) |
| Firefighting & Prevention | 12,849 (74.7%) | 4,344 (25.3%) |
| Law Enforcement | 3,876 (69.5%) | 1,703 (30.5%) |
| Food Preparation & Serving | 35,666 (55.8%) | 28,277 (44.2%) |
| Cleaning & Maintenance | 24,663 (52.4%) | 22,374 (47.6%) |
| Personal Care & Service | 9,641 (28.9%) | 23,669 (71.1%) |
| Total (Category) | 94,242 (45.8%) | 111,545 (54.2%) |
| Total (Overall) | 620,210 (53.6%) | 537,618 (46.4%) |
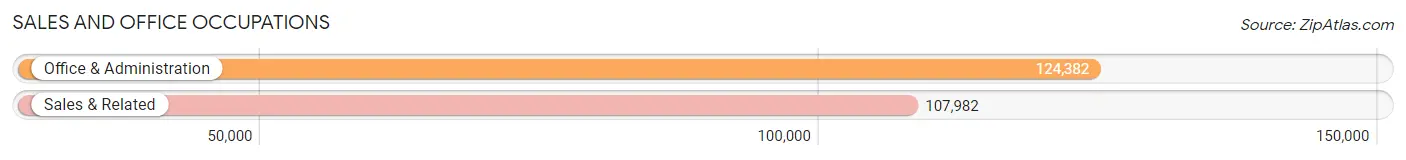
Sales and Office Occupations
The most common Sales and Office occupations in Area Code 310 are Office & Administration (124,382 | 10.7%), and Sales & Related (107,982 | 9.3%).
Sales and Office Occupations by Sex
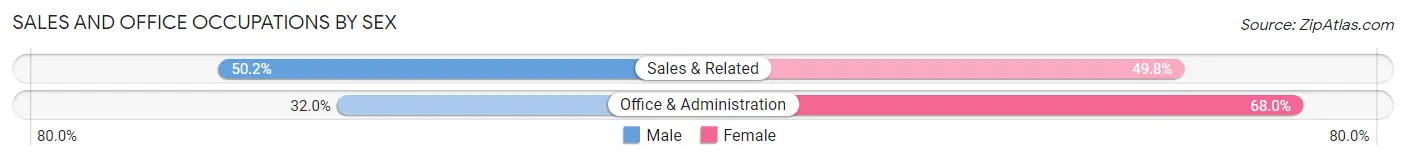
| Occupation | Male | Female |
| Sales & Related | 54,191 (50.2%) | 53,791 (49.8%) |
| Office & Administration | 39,793 (32.0%) | 84,589 (68.0%) |
| Total (Category) | 93,984 (40.5%) | 138,380 (59.6%) |
| Total (Overall) | 620,210 (53.6%) | 537,618 (46.4%) |
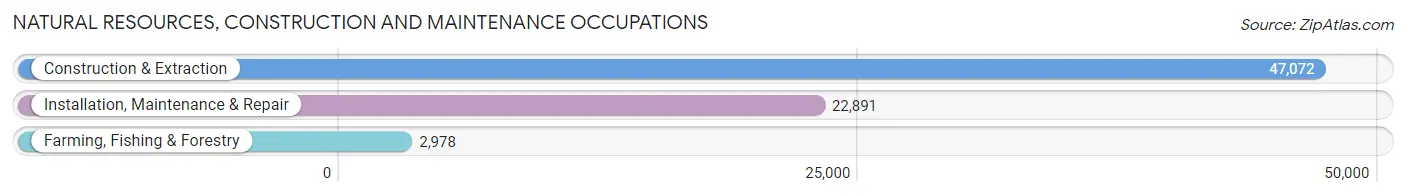
Natural Resources, Construction and Maintenance Occupations
The most common Natural Resources, Construction and Maintenance occupations in Area Code 310 are Construction & Extraction (47,072 | 4.1%), Installation, Maintenance & Repair (22,891 | 2.0%), and Farming, Fishing & Forestry (2,978 | 0.3%).
Natural Resources, Construction and Maintenance Occupations by Sex
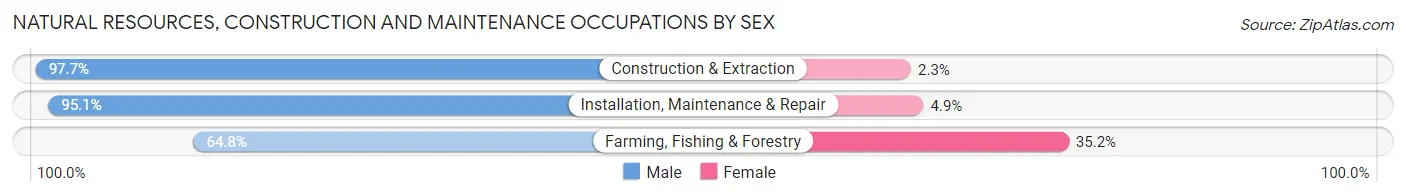
| Occupation | Male | Female |
| Farming, Fishing & Forestry | 1,931 (64.8%) | 1,047 (35.2%) |
| Construction & Extraction | 45,981 (97.7%) | 1,091 (2.3%) |
| Installation, Maintenance & Repair | 21,762 (95.1%) | 1,129 (4.9%) |
| Total (Category) | 69,674 (95.5%) | 3,267 (4.5%) |
| Total (Overall) | 620,210 (53.6%) | 537,618 (46.4%) |
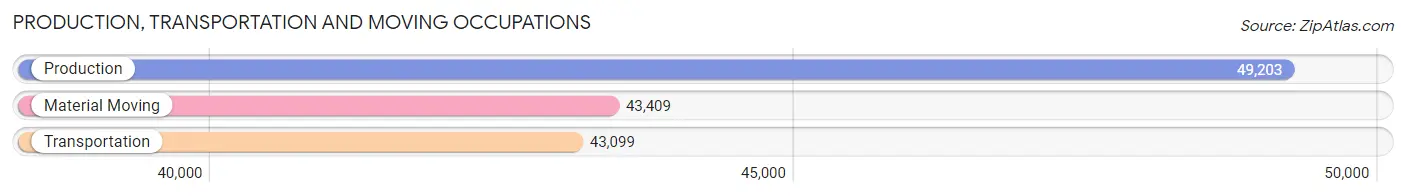
Production, Transportation and Moving Occupations
The most common Production, Transportation and Moving occupations in Area Code 310 are Production (49,203 | 4.3%), Material Moving (43,409 | 3.7%), and Transportation (43,099 | 3.7%).
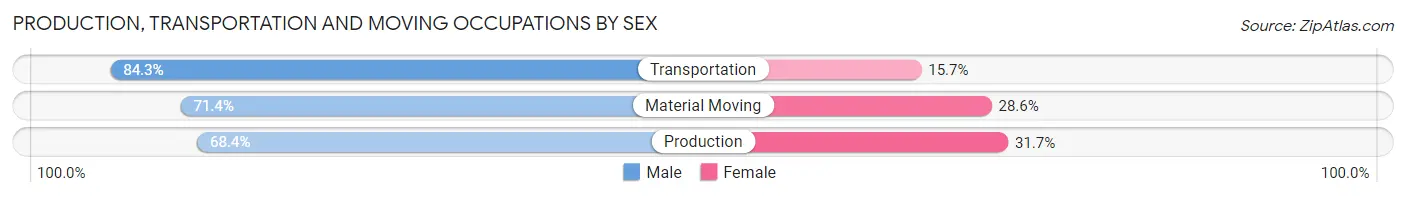
Production, Transportation and Moving Occupations by Sex
| Occupation | Male | Female |
| Production | 33,628 (68.3%) | 15,575 (31.7%) |
| Transportation | 36,318 (84.3%) | 6,781 (15.7%) |
| Material Moving | 30,985 (71.4%) | 12,424 (28.6%) |
| Total (Category) | 100,931 (74.4%) | 34,780 (25.6%) |
| Total (Overall) | 620,210 (53.6%) | 537,618 (46.4%) |
Employment Industries by Sex in Area Code 310
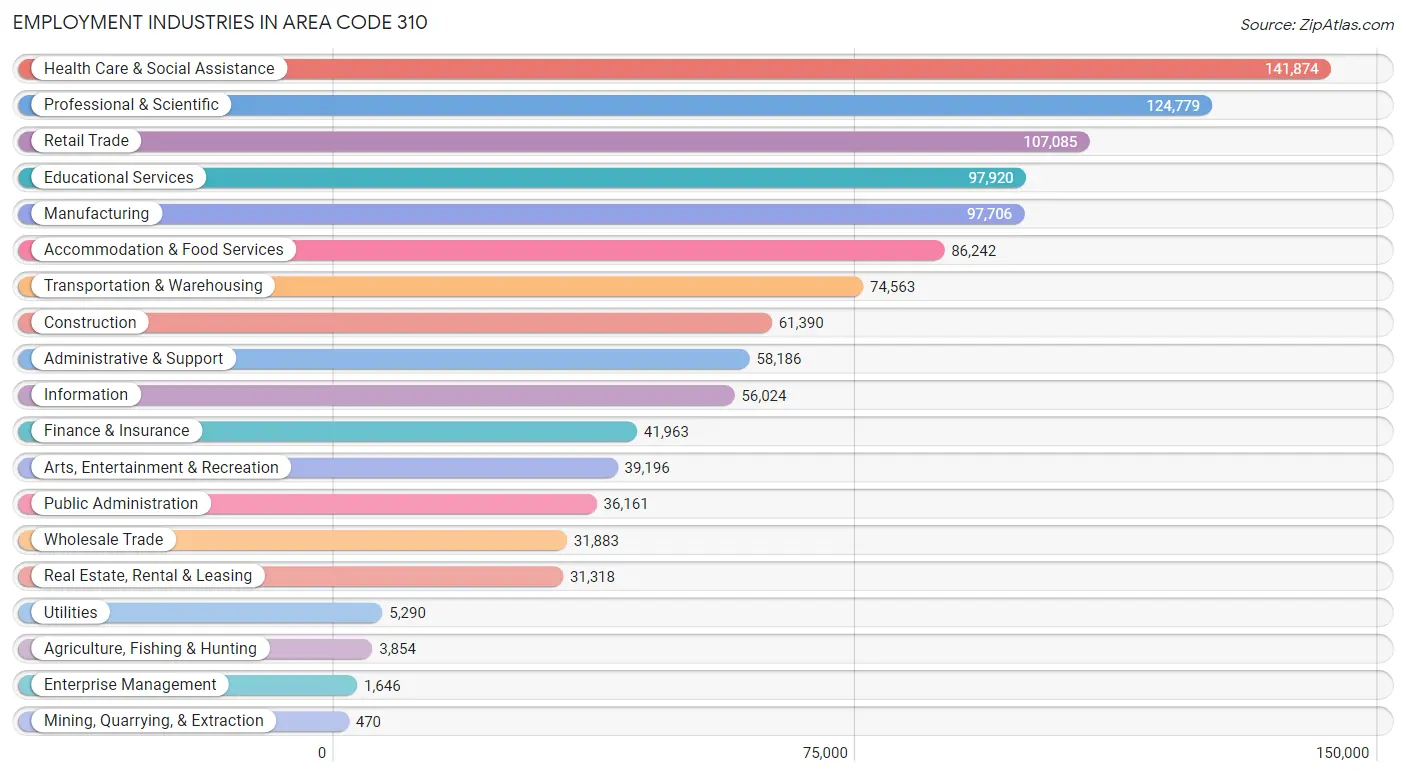
Employment Industries in Area Code 310
The major employment industries in Area Code 310 include Health Care & Social Assistance (141,874 | 12.2%), Professional & Scientific (124,779 | 10.8%), Retail Trade (107,085 | 9.2%), Educational Services (97,920 | 8.5%), and Manufacturing (97,706 | 8.4%).
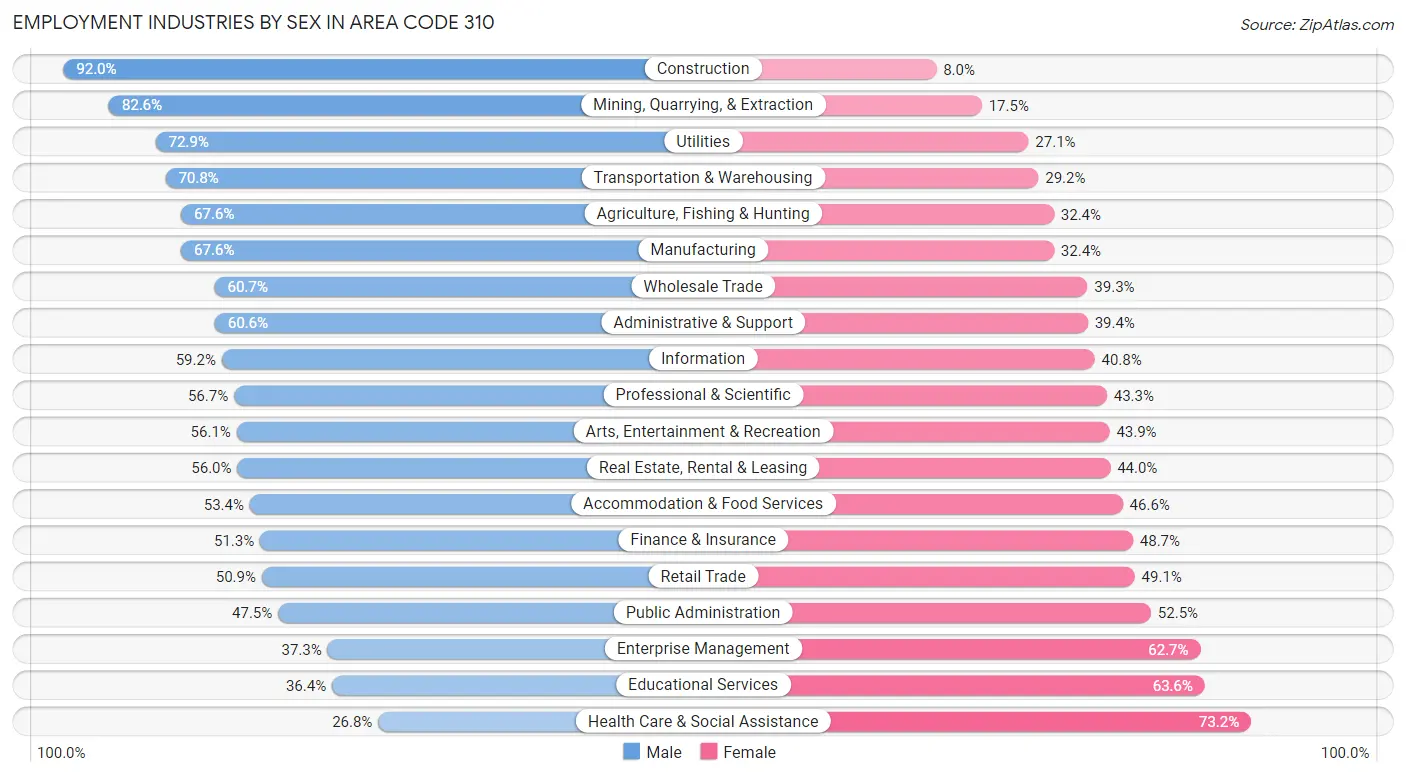
Employment Industries by Sex in Area Code 310
The Area Code 310 industries that see more men than women are Construction (92.0%), Mining, Quarrying, & Extraction (82.6%), and Utilities (72.9%), whereas the industries that tend to have a higher number of women are Health Care & Social Assistance (73.2%), Educational Services (63.6%), and Enterprise Management (62.7%).
| Industry | Male | Female |
| Agriculture, Fishing & Hunting | 2,606 (67.6%) | 1,248 (32.4%) |
| Mining, Quarrying, & Extraction | 388 (82.6%) | 82 (17.4%) |
| Construction | 56,459 (92.0%) | 4,931 (8.0%) |
| Manufacturing | 66,057 (67.6%) | 31,649 (32.4%) |
| Wholesale Trade | 19,348 (60.7%) | 12,535 (39.3%) |
| Retail Trade | 54,511 (50.9%) | 52,574 (49.1%) |
| Transportation & Warehousing | 52,824 (70.8%) | 21,739 (29.2%) |
| Utilities | 3,856 (72.9%) | 1,434 (27.1%) |
| Information | 33,169 (59.2%) | 22,855 (40.8%) |
| Finance & Insurance | 21,514 (51.3%) | 20,449 (48.7%) |
| Real Estate, Rental & Leasing | 17,525 (56.0%) | 13,793 (44.0%) |
| Professional & Scientific | 70,703 (56.7%) | 54,076 (43.3%) |
| Enterprise Management | 614 (37.3%) | 1,032 (62.7%) |
| Administrative & Support | 35,270 (60.6%) | 22,916 (39.4%) |
| Educational Services | 35,628 (36.4%) | 62,292 (63.6%) |
| Health Care & Social Assistance | 38,041 (26.8%) | 103,833 (73.2%) |
| Arts, Entertainment & Recreation | 21,991 (56.1%) | 17,205 (43.9%) |
| Accommodation & Food Services | 46,040 (53.4%) | 40,202 (46.6%) |
| Public Administration | 17,189 (47.5%) | 18,972 (52.5%) |
| Total | 620,210 (53.6%) | 537,618 (46.4%) |
Education in Area Code 310
School Enrollment in Area Code 310
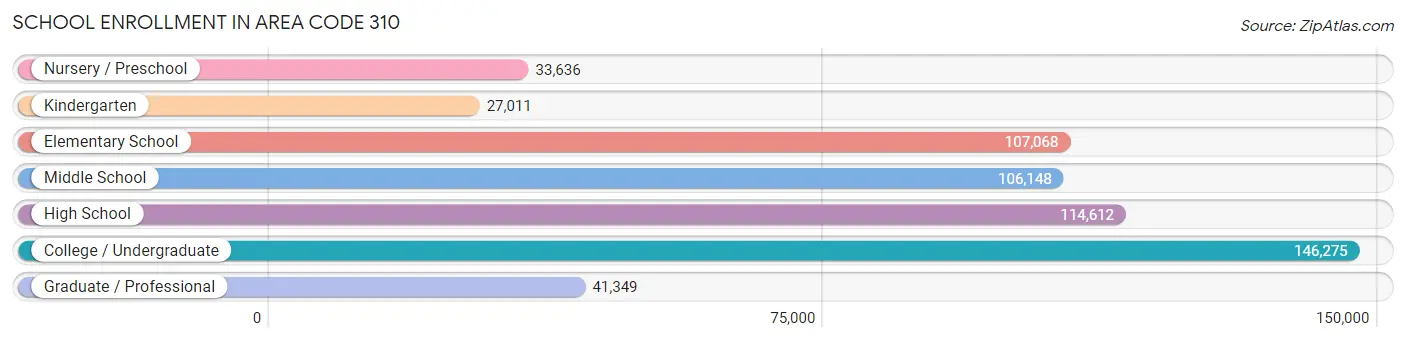
The most common levels of schooling among the 576,099 students in Area Code 310 are college / undergraduate (146,275 | 25.4%), high school (114,612 | 19.9%), and elementary school (107,068 | 18.6%).
| School Level | # Students | % Students |
| Nursery / Preschool | 33,636 | 5.8% |
| Kindergarten | 27,011 | 4.7% |
| Elementary School | 107,068 | 18.6% |
| Middle School | 106,148 | 18.4% |
| High School | 114,612 | 19.9% |
| College / Undergraduate | 146,275 | 25.4% |
| Graduate / Professional | 41,349 | 7.2% |
| Total | 576,099 | 100.0% |
School Enrollment by Age by Funding Source in Area Code 310
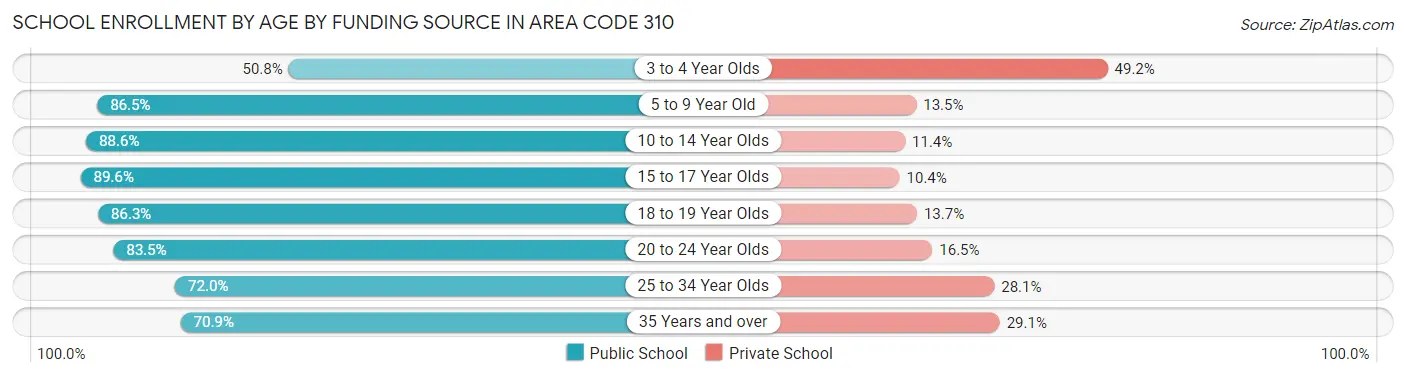
Out of a total of 576,099 students who are enrolled in schools in Area Code 310, 97,120 (16.9%) attend a private institution, while the remaining 478,979 (83.1%) are enrolled in public schools. The age group of 3 to 4 year olds has the highest likelihood of being enrolled in private schools, with 13,500 (49.2% in the age bracket) enrolled. Conversely, the age group of 15 to 17 year olds has the lowest likelihood of being enrolled in a private school, with 70,996 (89.6% in the age bracket) attending a public institution.
| Age Bracket | Public School | Private School |
| 3 to 4 Year Olds | 13,959 (50.8%) | 13,500 (49.2%) |
| 5 to 9 Year Old | 110,483 (86.5%) | 17,294 (13.5%) |
| 10 to 14 Year Olds | 122,259 (88.6%) | 15,793 (11.4%) |
| 15 to 17 Year Olds | 70,996 (89.6%) | 8,260 (10.4%) |
| 18 to 19 Year Olds | 41,581 (86.3%) | 6,578 (13.7%) |
| 20 to 24 Year Olds | 59,602 (83.5%) | 11,793 (16.5%) |
| 25 to 34 Year Olds | 36,715 (72.0%) | 14,317 (28.1%) |
| 35 Years and over | 23,384 (70.9%) | 9,585 (29.1%) |
| Total | 478,979 (83.1%) | 97,120 (16.9%) |
Educational Attainment by Field of Study in Area Code 310
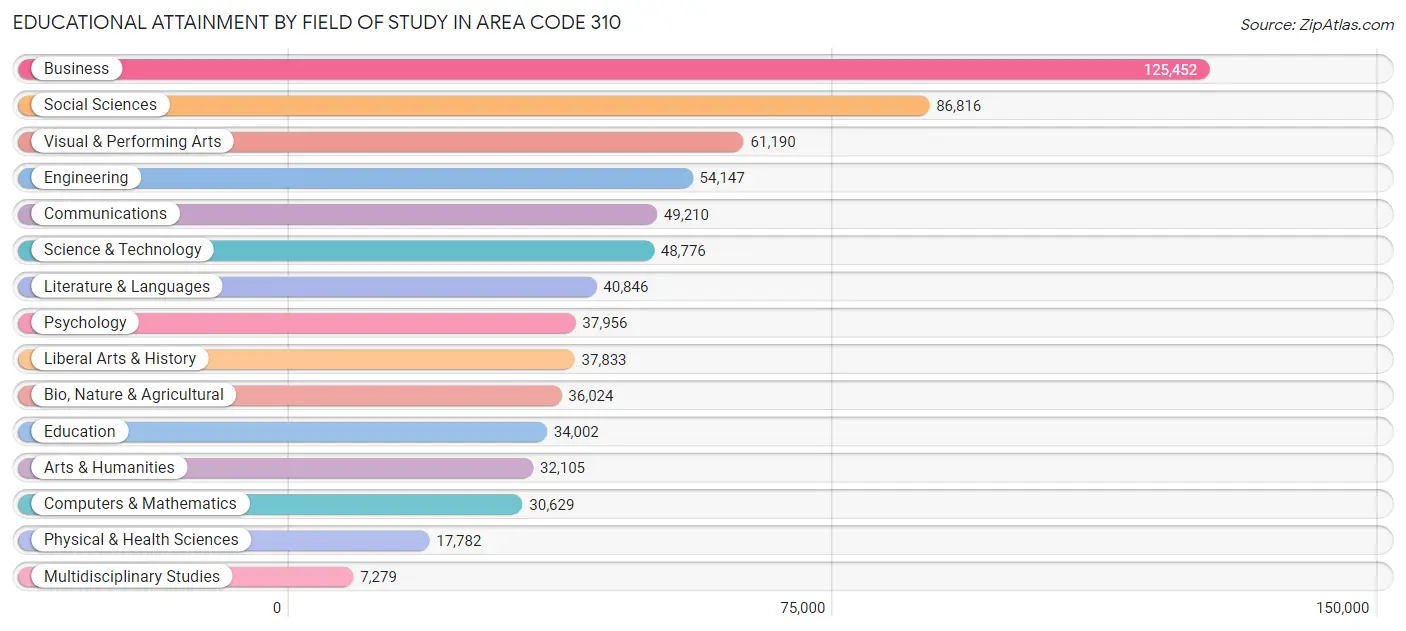
Business (125,452 | 17.9%), social sciences (86,816 | 12.4%), visual & performing arts (61,190 | 8.7%), engineering (54,147 | 7.7%), and communications (49,210 | 7.0%) are the most common fields of study among 700,047 individuals in Area Code 310 who have obtained a bachelor's degree or higher.
| Field of Study | # Graduates | % Graduates |
| Computers & Mathematics | 30,629 | 4.4% |
| Bio, Nature & Agricultural | 36,024 | 5.1% |
| Physical & Health Sciences | 17,782 | 2.5% |
| Psychology | 37,956 | 5.4% |
| Social Sciences | 86,816 | 12.4% |
| Engineering | 54,147 | 7.7% |
| Multidisciplinary Studies | 7,279 | 1.0% |
| Science & Technology | 48,776 | 7.0% |
| Business | 125,452 | 17.9% |
| Education | 34,002 | 4.9% |
| Literature & Languages | 40,846 | 5.8% |
| Liberal Arts & History | 37,833 | 5.4% |
| Visual & Performing Arts | 61,190 | 8.7% |
| Communications | 49,210 | 7.0% |
| Arts & Humanities | 32,105 | 4.6% |
| Total | 700,047 | 100.0% |
Transportation & Commute in Area Code 310
Vehicle Availability by Sex in Area Code 310
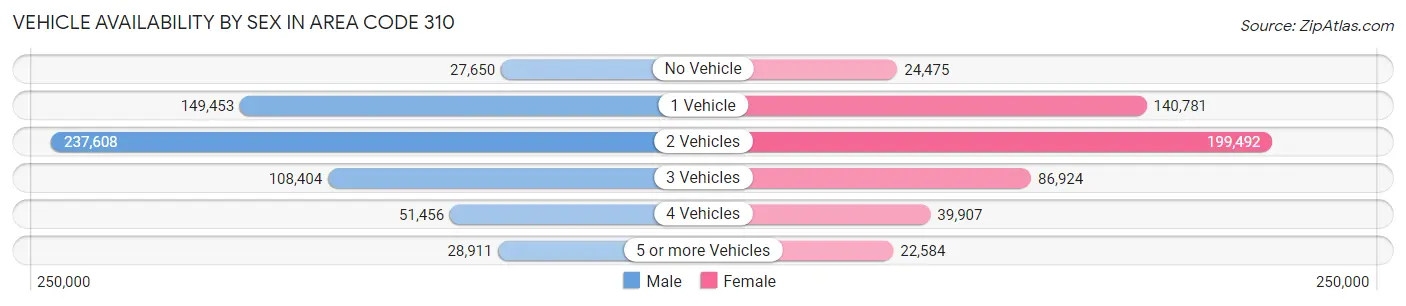
The most prevalent vehicle ownership categories in Area Code 310 are males with 2 vehicles (237,608, accounting for 39.4%) and females with 2 vehicles (199,492, making up 46.2%).
| Vehicles Available | Male | Female |
| No Vehicle | 27,650 (4.6%) | 24,475 (4.8%) |
| 1 Vehicle | 149,453 (24.8%) | 140,781 (27.4%) |
| 2 Vehicles | 237,608 (39.4%) | 199,492 (38.8%) |
| 3 Vehicles | 108,404 (18.0%) | 86,924 (16.9%) |
| 4 Vehicles | 51,456 (8.5%) | 39,907 (7.8%) |
| 5 or more Vehicles | 28,911 (4.8%) | 22,584 (4.4%) |
| Total | 603,482 (100.0%) | 514,163 (100.0%) |
Commute Time in Area Code 310
The most frequently occuring commute durations in Area Code 310 are 30 to 34 minutes (167,719 commuters, 17.5%), 15 to 19 minutes (141,105 commuters, 14.7%), and 20 to 24 minutes (141,029 commuters, 14.7%).
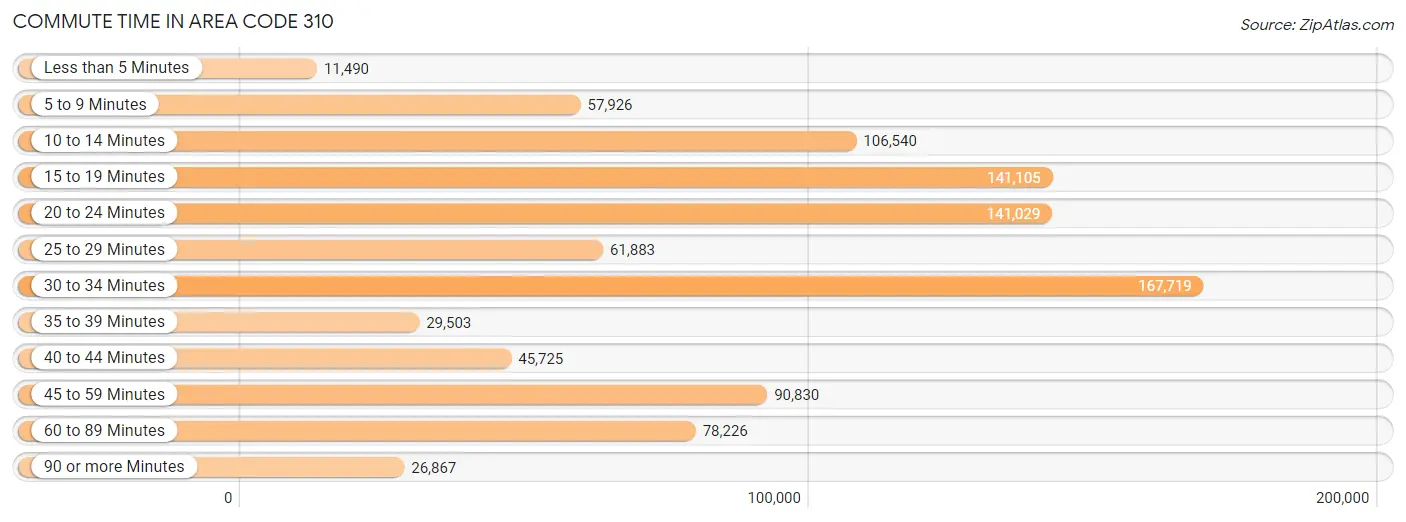
| Commute Time | # Commuters | % Commuters |
| Less than 5 Minutes | 11,490 | 1.2% |
| 5 to 9 Minutes | 57,926 | 6.0% |
| 10 to 14 Minutes | 106,540 | 11.1% |
| 15 to 19 Minutes | 141,105 | 14.7% |
| 20 to 24 Minutes | 141,029 | 14.7% |
| 25 to 29 Minutes | 61,883 | 6.5% |
| 30 to 34 Minutes | 167,719 | 17.5% |
| 35 to 39 Minutes | 29,503 | 3.1% |
| 40 to 44 Minutes | 45,725 | 4.8% |
| 45 to 59 Minutes | 90,830 | 9.5% |
| 60 to 89 Minutes | 78,226 | 8.2% |
| 90 or more Minutes | 26,867 | 2.8% |
Commute Time by Sex in Area Code 310
The most common commute times in Area Code 310 are 30 to 34 minutes (95,909 commuters, 18.2%) for males and 30 to 34 minutes (71,810 commuters, 16.6%) for females.
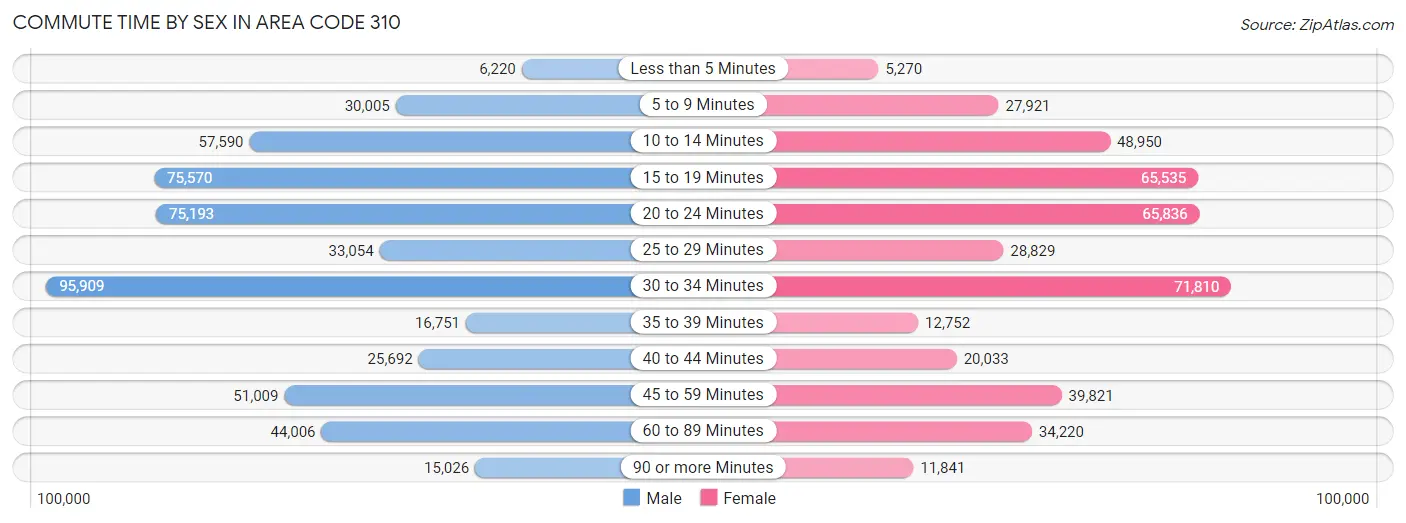
| Commute Time | Male | Female |
| Less than 5 Minutes | 6,220 (1.2%) | 5,270 (1.2%) |
| 5 to 9 Minutes | 30,005 (5.7%) | 27,921 (6.5%) |
| 10 to 14 Minutes | 57,590 (11.0%) | 48,950 (11.3%) |
| 15 to 19 Minutes | 75,570 (14.4%) | 65,535 (15.1%) |
| 20 to 24 Minutes | 75,193 (14.3%) | 65,836 (15.2%) |
| 25 to 29 Minutes | 33,054 (6.3%) | 28,829 (6.7%) |
| 30 to 34 Minutes | 95,909 (18.2%) | 71,810 (16.6%) |
| 35 to 39 Minutes | 16,751 (3.2%) | 12,752 (2.9%) |
| 40 to 44 Minutes | 25,692 (4.9%) | 20,033 (4.6%) |
| 45 to 59 Minutes | 51,009 (9.7%) | 39,821 (9.2%) |
| 60 to 89 Minutes | 44,006 (8.4%) | 34,220 (7.9%) |
| 90 or more Minutes | 15,026 (2.9%) | 11,841 (2.7%) |
Time of Departure to Work by Sex in Area Code 310
The most frequent times of departure to work in Area Code 310 are 8:00 AM to 8:29 AM (67,050, 12.8%) for males and 8:00 AM to 8:29 AM (62,648, 14.5%) for females.
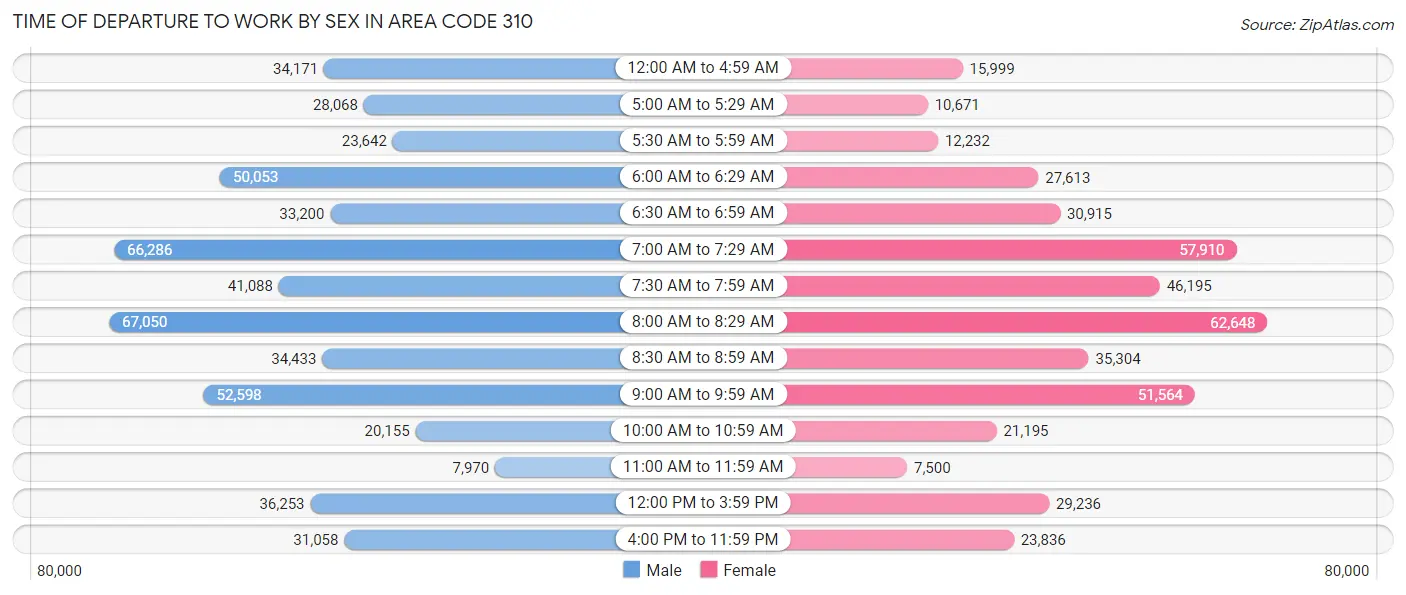
| Time of Departure | Male | Female |
| 12:00 AM to 4:59 AM | 34,171 (6.5%) | 15,999 (3.7%) |
| 5:00 AM to 5:29 AM | 28,068 (5.3%) | 10,671 (2.5%) |
| 5:30 AM to 5:59 AM | 23,642 (4.5%) | 12,232 (2.8%) |
| 6:00 AM to 6:29 AM | 50,053 (9.5%) | 27,613 (6.4%) |
| 6:30 AM to 6:59 AM | 33,200 (6.3%) | 30,915 (7.1%) |
| 7:00 AM to 7:29 AM | 66,286 (12.6%) | 57,910 (13.4%) |
| 7:30 AM to 7:59 AM | 41,088 (7.8%) | 46,195 (10.7%) |
| 8:00 AM to 8:29 AM | 67,050 (12.8%) | 62,648 (14.5%) |
| 8:30 AM to 8:59 AM | 34,433 (6.6%) | 35,304 (8.2%) |
| 9:00 AM to 9:59 AM | 52,598 (10.0%) | 51,564 (11.9%) |
| 10:00 AM to 10:59 AM | 20,155 (3.8%) | 21,195 (4.9%) |
| 11:00 AM to 11:59 AM | 7,970 (1.5%) | 7,500 (1.7%) |
| 12:00 PM to 3:59 PM | 36,253 (6.9%) | 29,236 (6.8%) |
| 4:00 PM to 11:59 PM | 31,058 (5.9%) | 23,836 (5.5%) |
| Total | 526,025 (100.0%) | 432,818 (100.0%) |
Housing Occupancy in Area Code 310
Occupancy by Ownership in Area Code 310
Of the total 852,820 dwellings in Area Code 310, owner-occupied units account for 348,470 (40.9%), while renter-occupied units make up 504,350 (59.1%).
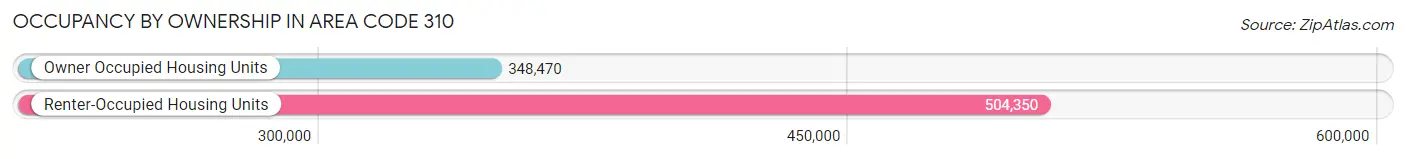
| Occupancy | # Housing Units | % Housing Units |
| Owner Occupied Housing Units | 348,470 | 40.9% |
| Renter-Occupied Housing Units | 504,350 | 59.1% |
| Total Occupied Housing Units | 852,820 | 100.0% |
Occupancy by Household Size in Area Code 310
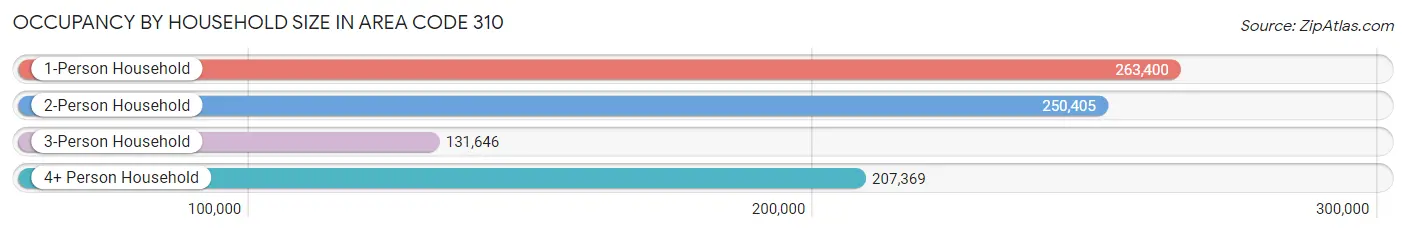
| Household Size | # Housing Units | % Housing Units |
| 1-Person Household | 263,400 | 30.9% |
| 2-Person Household | 250,405 | 29.4% |
| 3-Person Household | 131,646 | 15.4% |
| 4+ Person Household | 207,369 | 24.3% |
| Total Housing Units | 852,820 | 100.0% |
Occupancy by Ownership by Household Size in Area Code 310
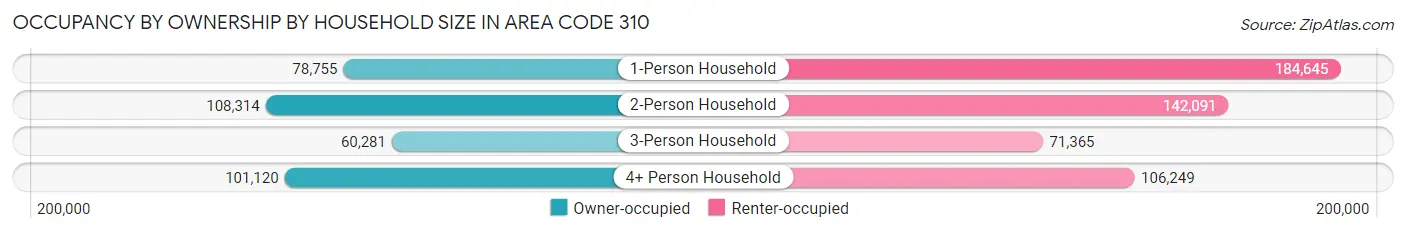
| Household Size | Owner-occupied | Renter-occupied |
| 1-Person Household | 78,755 (29.9%) | 184,645 (70.1%) |
| 2-Person Household | 108,314 (43.3%) | 142,091 (56.7%) |
| 3-Person Household | 60,281 (45.8%) | 71,365 (54.2%) |
| 4+ Person Household | 101,120 (48.8%) | 106,249 (51.2%) |
| Total Housing Units | 348,470 (40.9%) | 504,350 (59.1%) |
Occupancy by Educational Attainment in Area Code 310
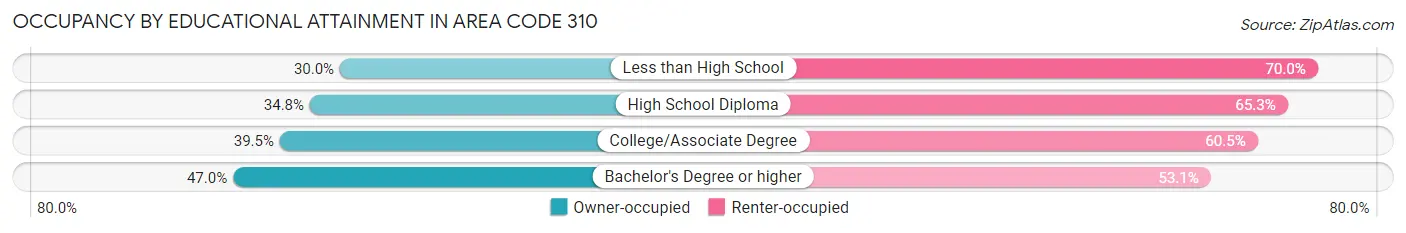
| Household Size | Owner-occupied | Renter-occupied |
| Less than High School | 35,616 (30.0%) | 83,196 (70.0%) |
| High School Diploma | 43,970 (34.7%) | 82,576 (65.2%) |
| College/Associate Degree | 86,744 (39.5%) | 132,735 (60.5%) |
| Bachelor's Degree or higher | 182,140 (46.9%) | 205,843 (53.0%) |
Occupancy by Age of Householder in Area Code 310
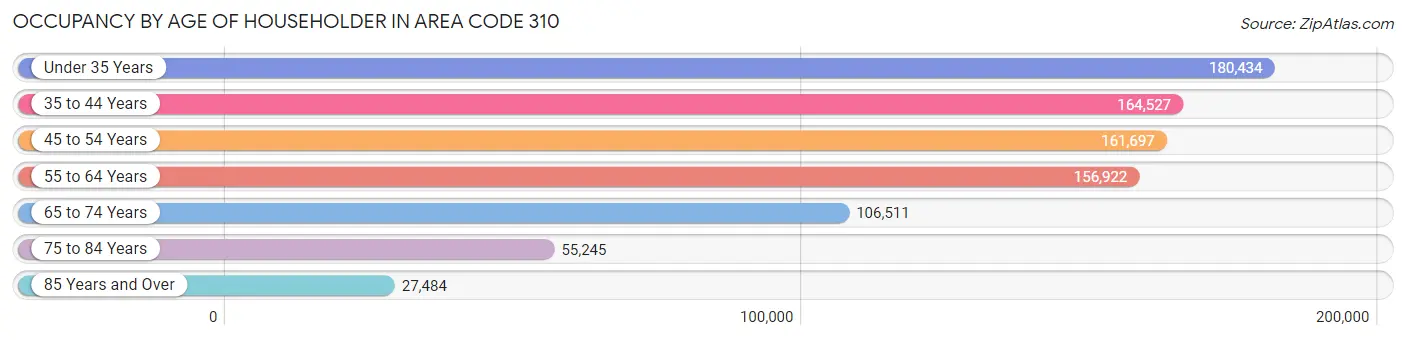
| Age Bracket | # Households | % Households |
| Under 35 Years | 180,434 | 21.2% |
| 35 to 44 Years | 164,527 | 19.3% |
| 45 to 54 Years | 161,697 | 19.0% |
| 55 to 64 Years | 156,922 | 18.4% |
| 65 to 74 Years | 106,511 | 12.5% |
| 75 to 84 Years | 55,245 | 6.5% |
| 85 Years and Over | 27,484 | 3.2% |
| Total | 852,820 | 100.0% |
Housing Finances in Area Code 310
Median Income by Occupancy in Area Code 310
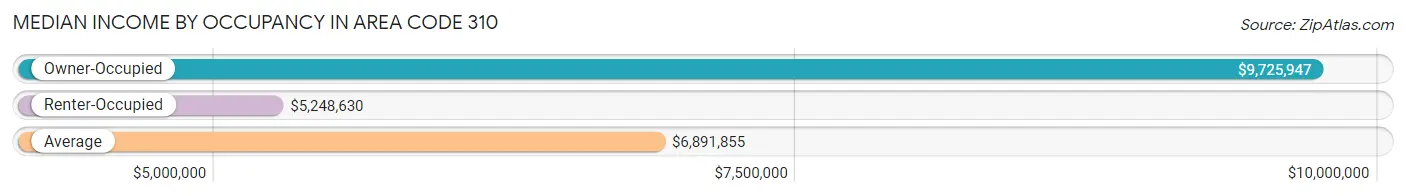
| Occupancy Type | # Households | Median Income |
| Owner-Occupied | 348,470 (40.9%) | $9,725,947 |
| Renter-Occupied | 504,350 (59.1%) | $5,248,630 |
| Average | 852,820 (100.0%) | $6,891,855 |
Occupancy by Householder Income Bracket in Area Code 310
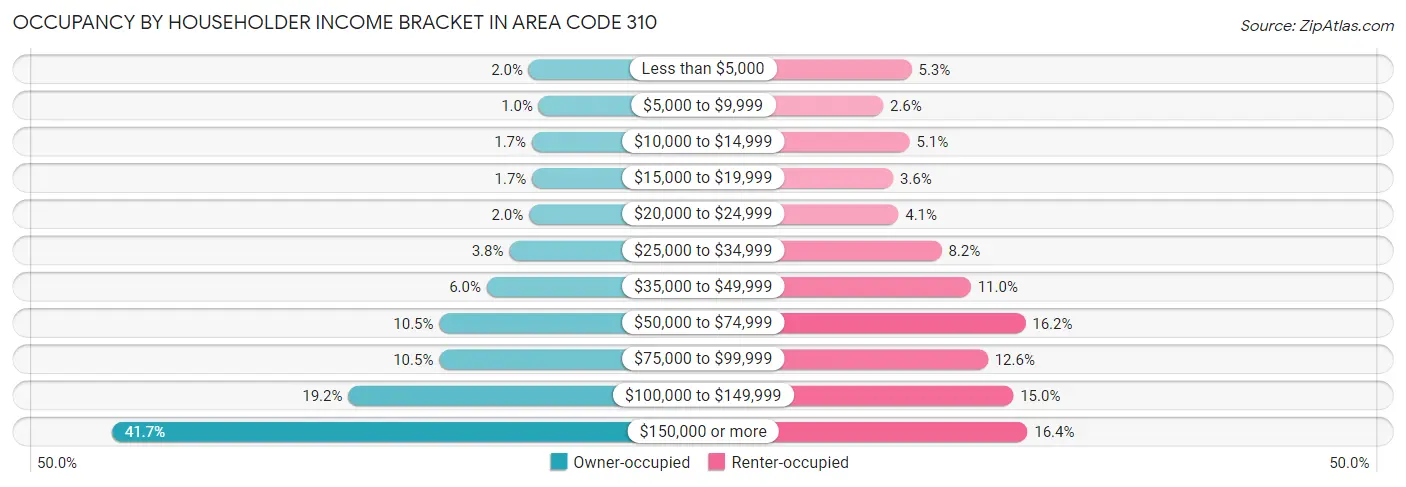
| Income Bracket | Owner-occupied | Renter-occupied |
| Less than $5,000 | 6,896 (2.0%) | 26,873 (5.3%) |
| $5,000 to $9,999 | 3,586 (1.0%) | 13,201 (2.6%) |
| $10,000 to $14,999 | 5,875 (1.7%) | 25,948 (5.1%) |
| $15,000 to $19,999 | 5,794 (1.7%) | 17,992 (3.6%) |
| $20,000 to $24,999 | 6,800 (1.9%) | 20,519 (4.1%) |
| $25,000 to $34,999 | 13,390 (3.8%) | 41,231 (8.2%) |
| $35,000 to $49,999 | 20,855 (6.0%) | 55,343 (11.0%) |
| $50,000 to $74,999 | 36,600 (10.5%) | 81,530 (16.2%) |
| $75,000 to $99,999 | 36,611 (10.5%) | 63,484 (12.6%) |
| $100,000 to $149,999 | 66,785 (19.2%) | 75,740 (15.0%) |
| $150,000 or more | 145,278 (41.7%) | 82,489 (16.4%) |
| Total | 348,470 (100.0%) | 504,350 (100.0%) |
Monthly Housing Cost Tiers in Area Code 310
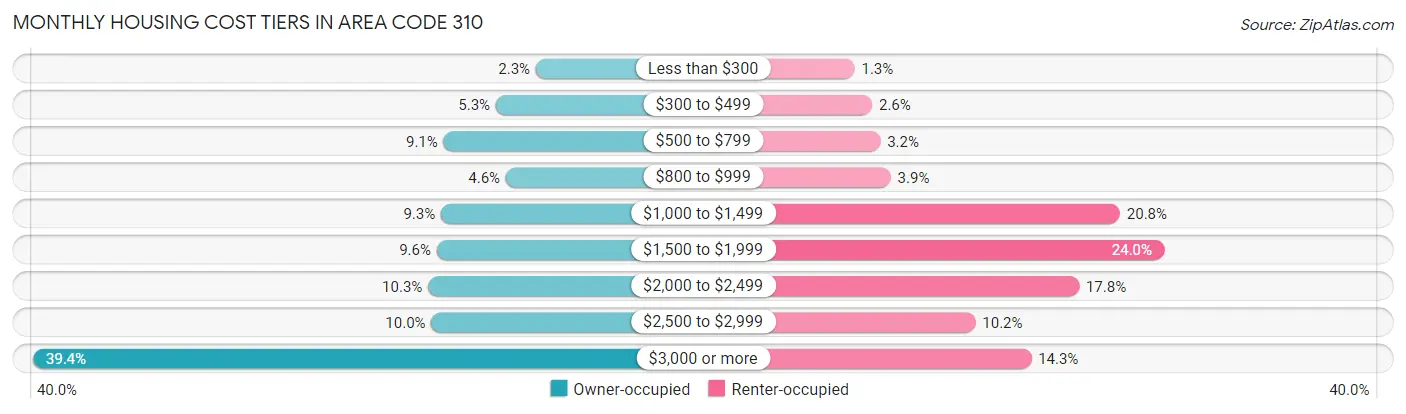
| Monthly Cost | Owner-occupied | Renter-occupied |
| Less than $300 | 8,149 (2.3%) | 6,342 (1.3%) |
| $300 to $499 | 18,441 (5.3%) | 12,846 (2.5%) |
| $500 to $799 | 31,840 (9.1%) | 15,892 (3.2%) |
| $800 to $999 | 15,852 (4.5%) | 19,762 (3.9%) |
| $1,000 to $1,499 | 32,501 (9.3%) | 104,915 (20.8%) |
| $1,500 to $1,999 | 33,598 (9.6%) | 121,265 (24.0%) |
| $2,000 to $2,499 | 35,839 (10.3%) | 89,701 (17.8%) |
| $2,500 to $2,999 | 34,993 (10.0%) | 51,252 (10.2%) |
| $3,000 or more | 137,257 (39.4%) | 71,982 (14.3%) |
| Total | 348,470 (100.0%) | 504,350 (100.0%) |
Physical Housing Characteristics in Area Code 310
Housing Structures in Area Code 310
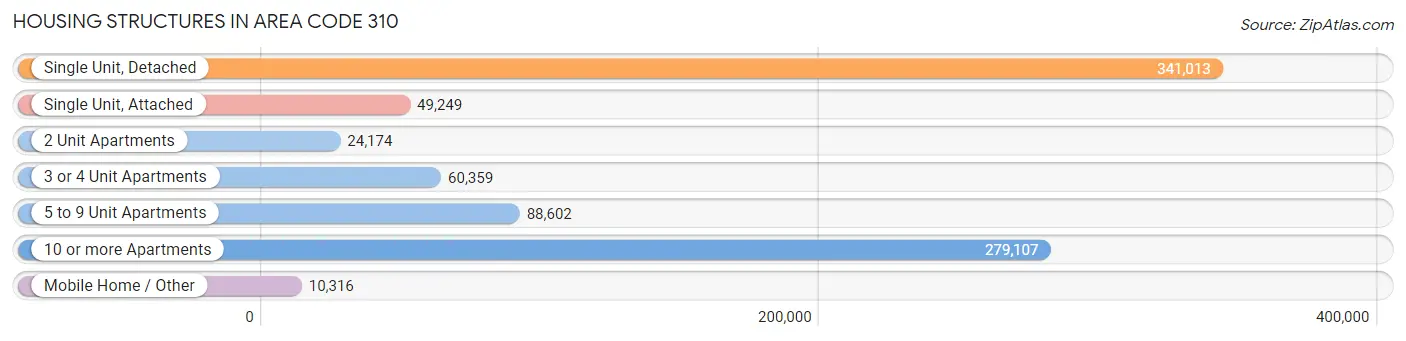
| Structure Type | # Housing Units | % Housing Units |
| Single Unit, Detached | 341,013 | 40.0% |
| Single Unit, Attached | 49,249 | 5.8% |
| 2 Unit Apartments | 24,174 | 2.8% |
| 3 or 4 Unit Apartments | 60,359 | 7.1% |
| 5 to 9 Unit Apartments | 88,602 | 10.4% |
| 10 or more Apartments | 279,107 | 32.7% |
| Mobile Home / Other | 10,316 | 1.2% |
| Total | 852,820 | 100.0% |
Housing Structures by Occupancy in Area Code 310
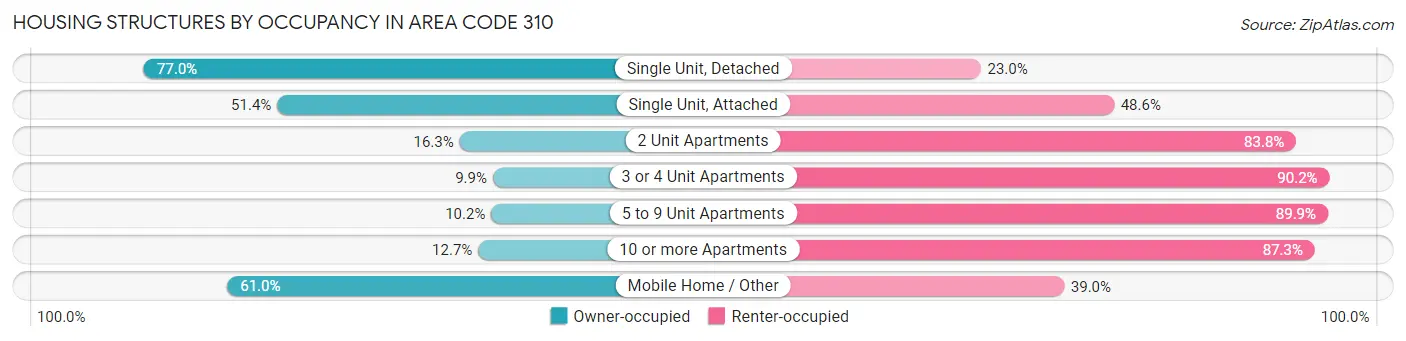
| Structure Type | Owner-occupied | Renter-occupied |
| Single Unit, Detached | 262,652 (77.0%) | 78,361 (23.0%) |
| Single Unit, Attached | 25,300 (51.4%) | 23,949 (48.6%) |
| 2 Unit Apartments | 3,928 (16.3%) | 20,246 (83.8%) |
| 3 or 4 Unit Apartments | 5,948 (9.9%) | 54,411 (90.1%) |
| 5 to 9 Unit Apartments | 8,993 (10.2%) | 79,609 (89.8%) |
| 10 or more Apartments | 35,359 (12.7%) | 243,748 (87.3%) |
| Mobile Home / Other | 6,290 (61.0%) | 4,026 (39.0%) |
| Total | 348,470 (40.9%) | 504,350 (59.1%) |
Housing Structures by Number of Rooms in Area Code 310
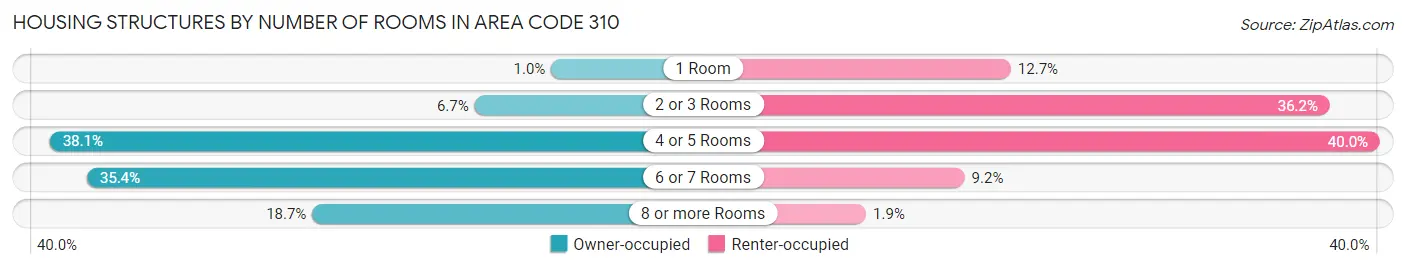
| Number of Rooms | Owner-occupied | Renter-occupied |
| 1 Room | 3,635 (1.0%) | 63,788 (12.7%) |
| 2 or 3 Rooms | 23,371 (6.7%) | 182,765 (36.2%) |
| 4 or 5 Rooms | 132,899 (38.1%) | 201,468 (40.0%) |
| 6 or 7 Rooms | 123,314 (35.4%) | 46,536 (9.2%) |
| 8 or more Rooms | 65,251 (18.7%) | 9,793 (1.9%) |
| Total | 348,470 (100.0%) | 504,350 (100.0%) |
Housing Structure by Heating Type in Area Code 310
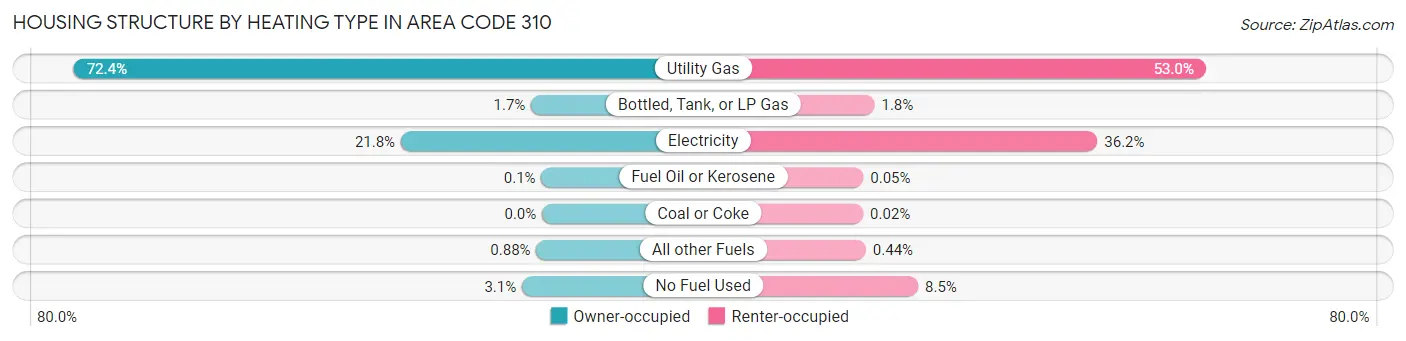
| Heating Type | Owner-occupied | Renter-occupied |
| Utility Gas | 252,297 (72.4%) | 267,155 (53.0%) |
| Bottled, Tank, or LP Gas | 5,894 (1.7%) | 8,997 (1.8%) |
| Electricity | 76,042 (21.8%) | 182,687 (36.2%) |
| Fuel Oil or Kerosene | 347 (0.1%) | 270 (0.1%) |
| Coal or Coke | 16 (0.0%) | 77 (0.0%) |
| All other Fuels | 3,070 (0.9%) | 2,232 (0.4%) |
| No Fuel Used | 10,804 (3.1%) | 42,932 (8.5%) |
| Total | 348,470 (100.0%) | 504,350 (100.0%) |
Household Vehicle Usage in Area Code 310
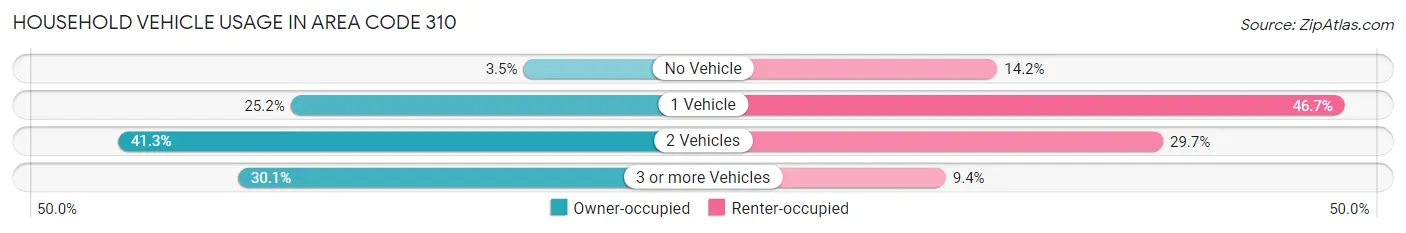
| Vehicles per Household | Owner-occupied | Renter-occupied |
| No Vehicle | 12,037 (3.5%) | 71,785 (14.2%) |
| 1 Vehicle | 87,740 (25.2%) | 235,277 (46.7%) |
| 2 Vehicles | 143,838 (41.3%) | 149,784 (29.7%) |
| 3 or more Vehicles | 104,855 (30.1%) | 47,504 (9.4%) |
| Total | 348,470 (100.0%) | 504,350 (100.0%) |
Real Estate & Mortgages in Area Code 310
Real Estate and Mortgage Overview in Area Code 310
| Characteristic | Without Mortgage | With Mortgage |
| Housing Units | 109,067 | 239,403 |
| Median Property Value | $72,035,908 | $76,140,510 |
| Median Household Income | $6,370,160 | $114,114 |
| Monthly Housing Costs | $63,839 | $130,977 |
| Real Estate Taxes | $336,400 | $3,196 |
Property Value by Mortgage Status in Area Code 310
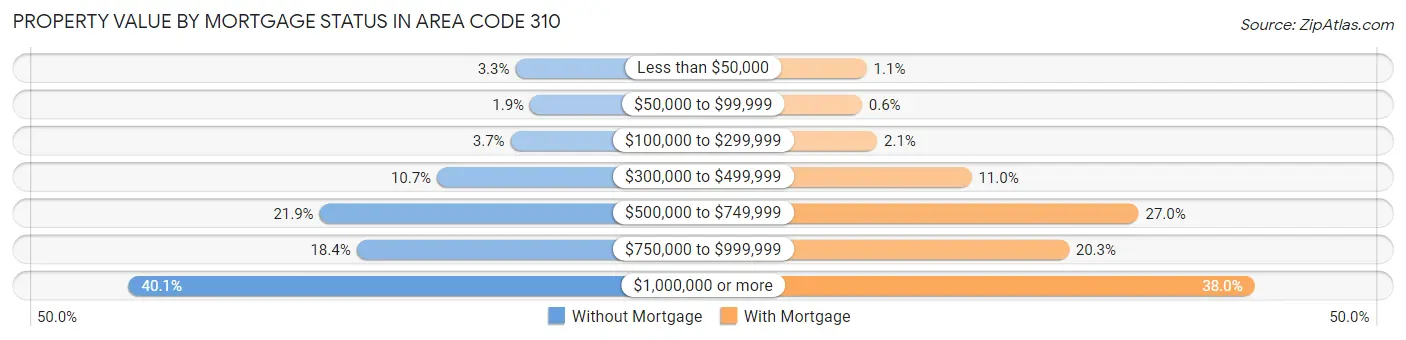
| Property Value | Without Mortgage | With Mortgage |
| Less than $50,000 | 3,567 (3.3%) | 2,547 (1.1%) |
| $50,000 to $99,999 | 2,042 (1.9%) | 1,448 (0.6%) |
| $100,000 to $299,999 | 4,069 (3.7%) | 4,901 (2.1%) |
| $300,000 to $499,999 | 11,705 (10.7%) | 26,423 (11.0%) |
| $500,000 to $749,999 | 23,904 (21.9%) | 64,518 (27.0%) |
| $750,000 to $999,999 | 20,058 (18.4%) | 48,613 (20.3%) |
| $1,000,000 or more | 43,722 (40.1%) | 90,953 (38.0%) |
| Total | 109,067 (100.0%) | 239,403 (100.0%) |
Household Income by Mortgage Status in Area Code 310
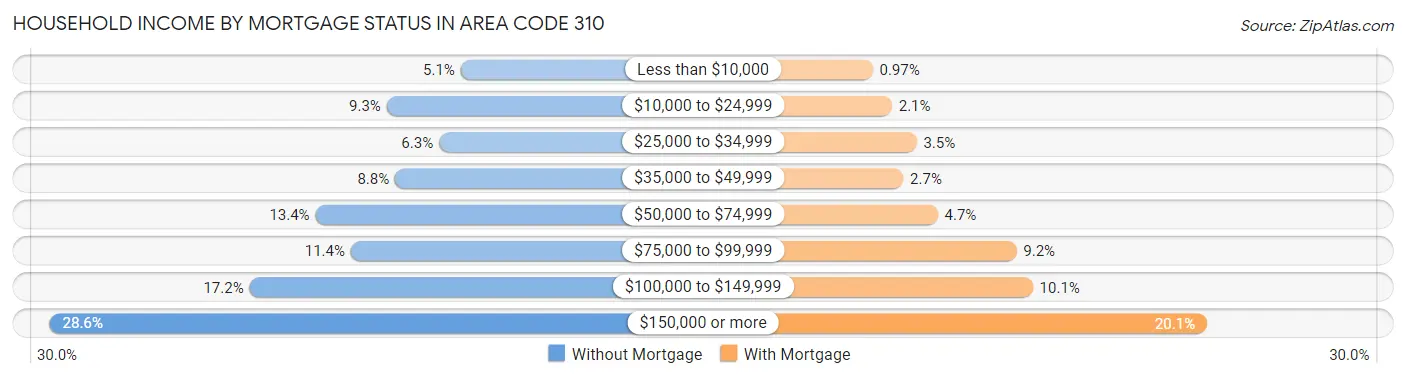
| Household Income | Without Mortgage | With Mortgage |
| Less than $10,000 | 5,537 (5.1%) | 2,313 (1.0%) |
| $10,000 to $24,999 | 10,149 (9.3%) | 4,945 (2.1%) |
| $25,000 to $34,999 | 6,888 (6.3%) | 8,320 (3.5%) |
| $35,000 to $49,999 | 9,635 (8.8%) | 6,502 (2.7%) |
| $50,000 to $74,999 | 14,596 (13.4%) | 11,220 (4.7%) |
| $75,000 to $99,999 | 12,389 (11.4%) | 22,004 (9.2%) |
| $100,000 to $149,999 | 18,709 (17.2%) | 24,222 (10.1%) |
| $150,000 or more | 31,164 (28.6%) | 48,076 (20.1%) |
| Total | 109,067 (100.0%) | 239,403 (100.0%) |
Property Value to Household Income Ratio in Area Code 310
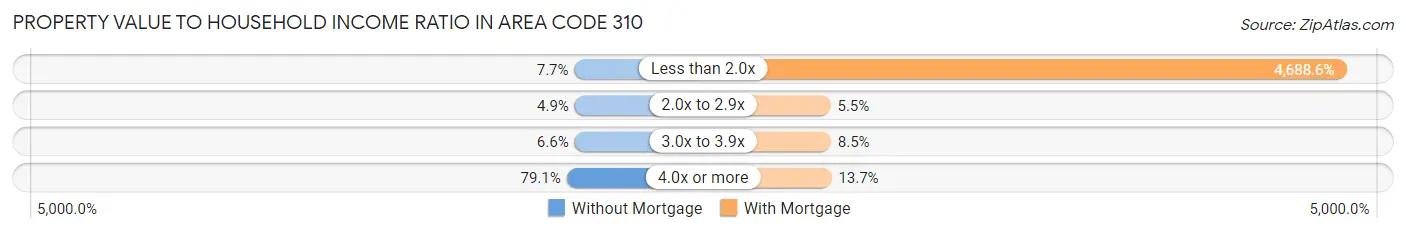
| Value-to-Income Ratio | Without Mortgage | With Mortgage |
| Less than 2.0x | 8,358 (7.7%) | 11,224,591 (4,688.6%) |
| 2.0x to 2.9x | 5,362 (4.9%) | 13,139 (5.5%) |
| 3.0x to 3.9x | 7,225 (6.6%) | 20,446 (8.5%) |
| 4.0x or more | 86,214 (79.0%) | 32,882 (13.7%) |
| Total | 109,067 (100.0%) | 239,403 (100.0%) |
Real Estate Taxes by Mortgage Status in Area Code 310
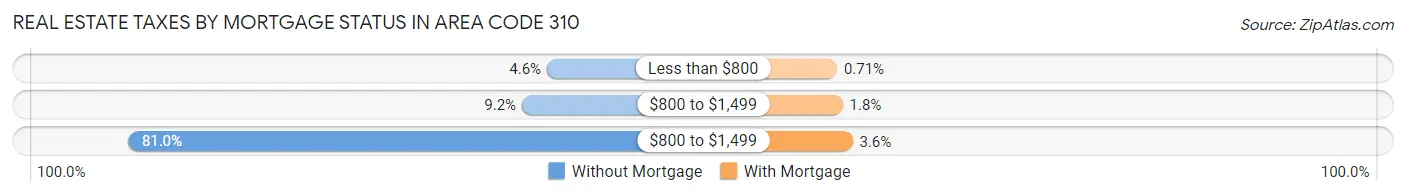
| Property Taxes | Without Mortgage | With Mortgage |
| Less than $800 | 5,013 (4.6%) | 1,709 (0.7%) |
| $800 to $1,499 | 10,001 (9.2%) | 4,186 (1.8%) |
| $800 to $1,499 | 88,295 (80.9%) | 8,489 (3.5%) |
| Total | 109,067 (100.0%) | 239,403 (100.0%) |
Health & Disability in Area Code 310
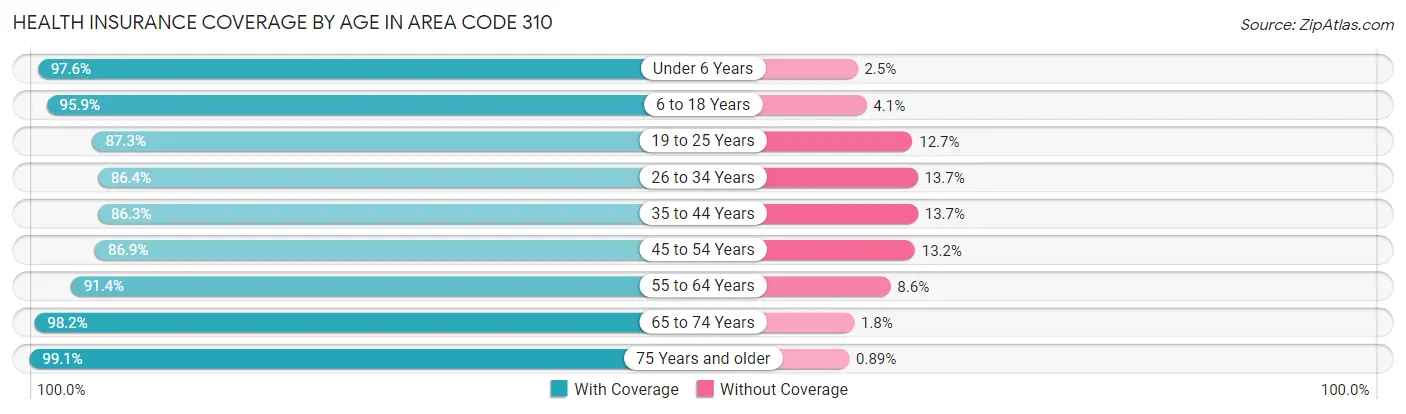
Health Insurance Coverage by Age in Area Code 310
| Age Bracket | With Coverage | Without Coverage |
| Under 6 Years | 151,744 (97.6%) | 3,813 (2.5%) |
| 6 to 18 Years | 348,942 (95.9%) | 14,988 (4.1%) |
| 19 to 25 Years | 195,085 (87.3%) | 28,338 (12.7%) |
| 26 to 34 Years | 304,001 (86.4%) | 48,073 (13.7%) |
| 35 to 44 Years | 278,975 (86.3%) | 44,305 (13.7%) |
| 45 to 54 Years | 261,302 (86.9%) | 39,559 (13.2%) |
| 55 to 64 Years | 254,006 (91.4%) | 23,888 (8.6%) |
| 65 to 74 Years | 177,895 (98.2%) | 3,291 (1.8%) |
| 75 Years and older | 130,460 (99.1%) | 1,174 (0.9%) |
| Total | 2,102,410 (91.0%) | 207,429 (9.0%) |
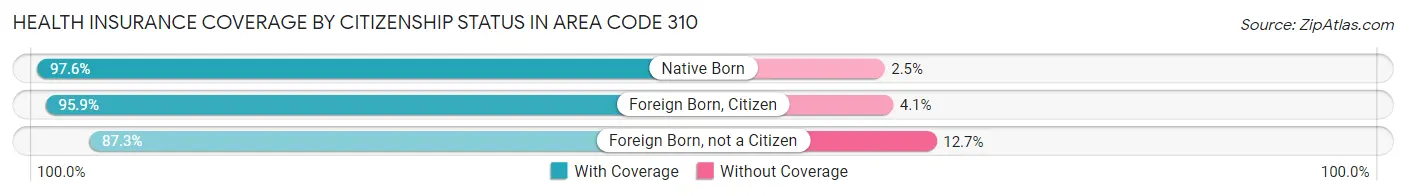
Health Insurance Coverage by Citizenship Status in Area Code 310
| Citizenship Status | With Coverage | Without Coverage |
| Native Born | 151,744 (97.6%) | 3,813 (2.5%) |
| Foreign Born, Citizen | 348,942 (95.9%) | 14,988 (4.1%) |
| Foreign Born, not a Citizen | 195,085 (87.3%) | 28,338 (12.7%) |
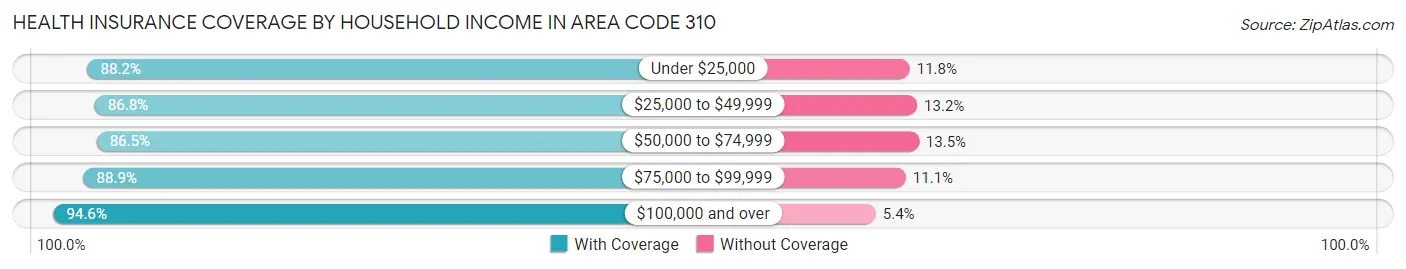
Health Insurance Coverage by Household Income in Area Code 310
| Household Income | With Coverage | Without Coverage |
| Under $25,000 | 216,060 (88.2%) | 28,937 (11.8%) |
| $25,000 to $49,999 | 278,799 (86.8%) | 42,328 (13.2%) |
| $50,000 to $74,999 | 272,673 (86.5%) | 42,608 (13.5%) |
| $75,000 to $99,999 | 242,094 (88.9%) | 30,150 (11.1%) |
| $100,000 and over | 1,053,593 (94.6%) | 60,595 (5.4%) |
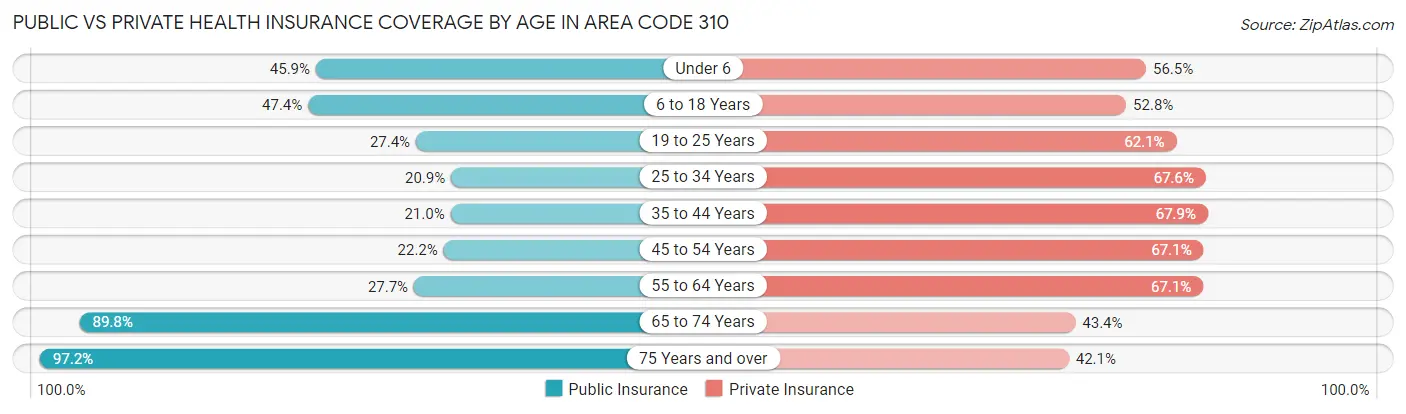
Public vs Private Health Insurance Coverage by Age in Area Code 310
| Age Bracket | Public Insurance | Private Insurance |
| Under 6 | 71,470 (45.9%) | 87,864 (56.5%) |
| 6 to 18 Years | 172,440 (47.4%) | 192,093 (52.8%) |
| 19 to 25 Years | 61,123 (27.4%) | 138,777 (62.1%) |
| 25 to 34 Years | 73,412 (20.8%) | 237,855 (67.6%) |
| 35 to 44 Years | 67,723 (20.9%) | 219,604 (67.9%) |
| 45 to 54 Years | 66,859 (22.2%) | 201,963 (67.1%) |
| 55 to 64 Years | 77,051 (27.7%) | 186,382 (67.1%) |
| 65 to 74 Years | 162,685 (89.8%) | 78,553 (43.3%) |
| 75 Years and over | 127,888 (97.2%) | 55,459 (42.1%) |
| Total | 880,651 (38.1%) | 1,398,550 (60.6%) |
Disability Status by Sex by Age in Area Code 310
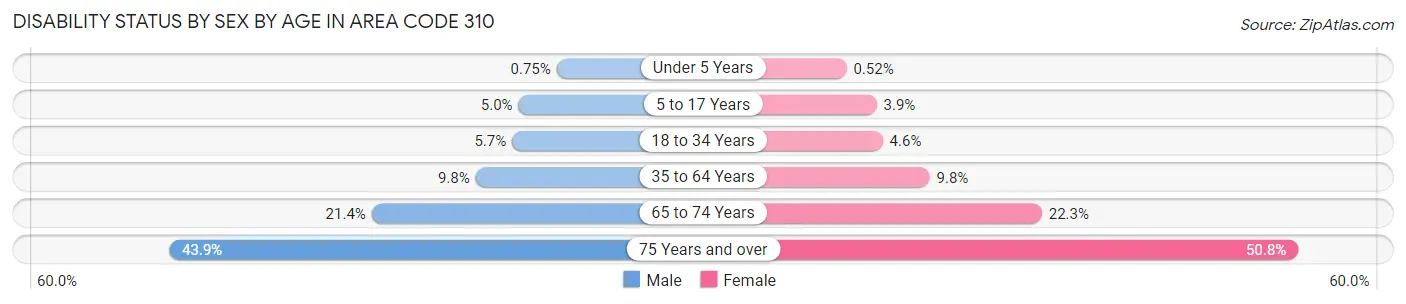
| Age Bracket | Male | Female |
| Under 5 Years | 501 (0.7%) | 326 (0.5%) |
| 5 to 17 Years | 9,190 (5.0%) | 6,801 (3.9%) |
| 18 to 34 Years | 17,207 (5.7%) | 13,869 (4.5%) |
| 35 to 64 Years | 44,159 (9.8%) | 44,067 (9.8%) |
| 65 to 74 Years | 18,192 (21.3%) | 21,376 (22.3%) |
| 75 Years and over | 22,898 (43.9%) | 40,406 (50.8%) |
Disability Class by Sex by Age in Area Code 310
Disability Class: Hearing Difficulty
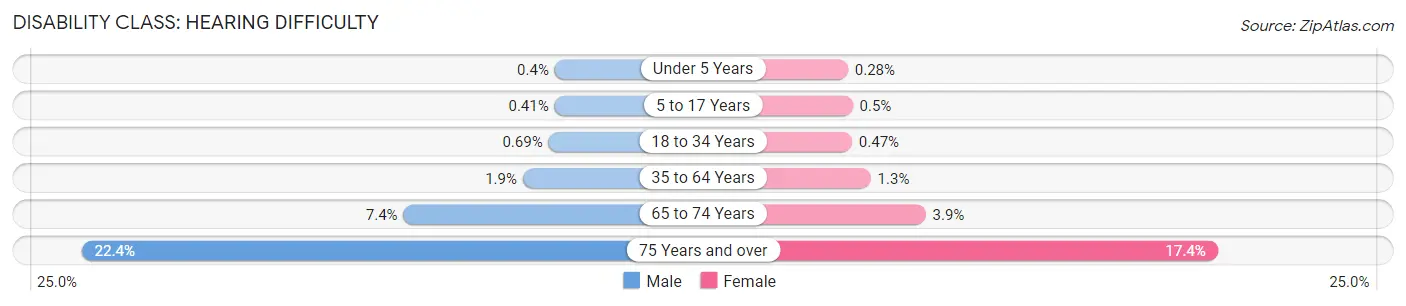
| Age Bracket | Male | Female |
| Under 5 Years | 266 (0.4%) | 177 (0.3%) |
| 5 to 17 Years | 750 (0.4%) | 882 (0.5%) |
| 18 to 34 Years | 2,066 (0.7%) | 1,438 (0.5%) |
| 35 to 64 Years | 8,510 (1.9%) | 6,047 (1.3%) |
| 65 to 74 Years | 6,320 (7.4%) | 3,731 (3.9%) |
| 75 Years and over | 11,649 (22.4%) | 13,867 (17.4%) |
Disability Class: Vision Difficulty
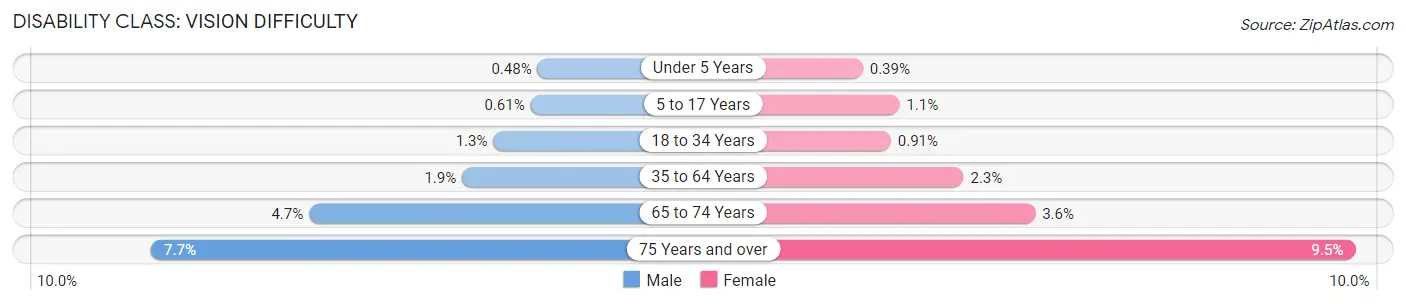
| Age Bracket | Male | Female |
| Under 5 Years | 320 (0.5%) | 244 (0.4%) |
| 5 to 17 Years | 1,124 (0.6%) | 1,881 (1.1%) |
| 18 to 34 Years | 3,912 (1.3%) | 2,785 (0.9%) |
| 35 to 64 Years | 8,474 (1.9%) | 10,179 (2.3%) |
| 65 to 74 Years | 4,022 (4.7%) | 3,442 (3.6%) |
| 75 Years and over | 3,987 (7.6%) | 7,576 (9.5%) |
Disability Class: Cognitive Difficulty
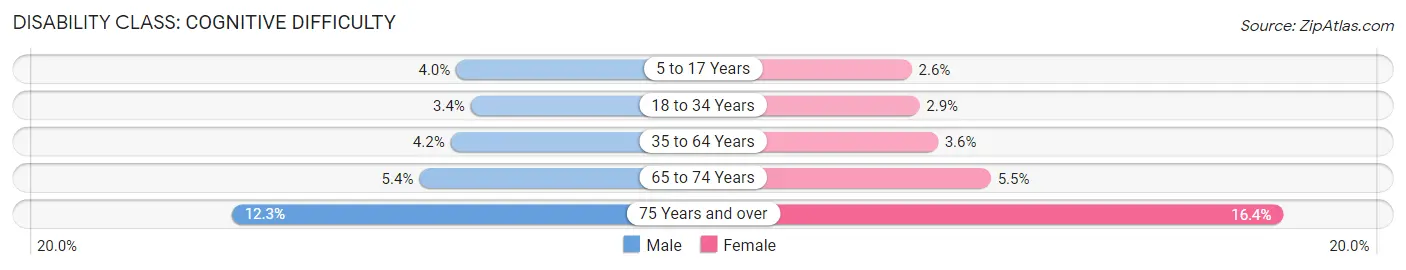
| Age Bracket | Male | Female |
| 5 to 17 Years | 7,317 (4.0%) | 4,534 (2.6%) |
| 18 to 34 Years | 10,378 (3.4%) | 8,790 (2.9%) |
| 35 to 64 Years | 18,907 (4.2%) | 16,048 (3.6%) |
| 65 to 74 Years | 4,556 (5.3%) | 5,307 (5.5%) |
| 75 Years and over | 6,415 (12.3%) | 13,029 (16.4%) |
Disability Class: Ambulatory Difficulty
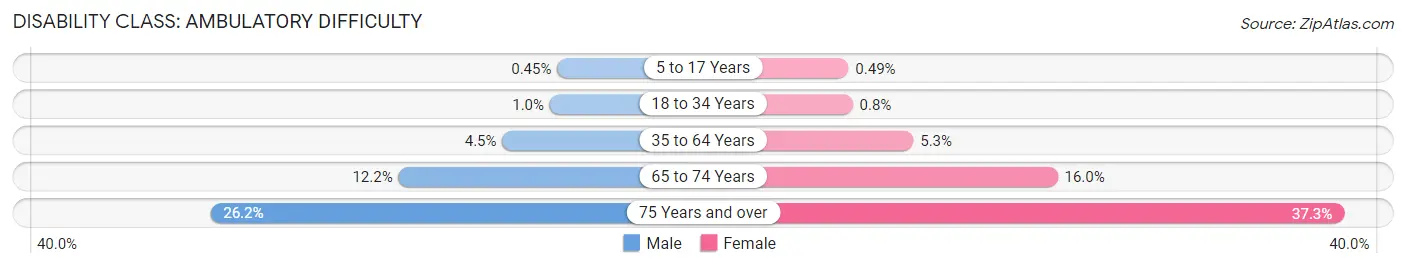
| Age Bracket | Male | Female |
| 5 to 17 Years | 827 (0.4%) | 858 (0.5%) |
| 18 to 34 Years | 3,006 (1.0%) | 2,443 (0.8%) |
| 35 to 64 Years | 20,442 (4.5%) | 23,939 (5.3%) |
| 65 to 74 Years | 10,428 (12.2%) | 15,380 (16.0%) |
| 75 Years and over | 13,664 (26.2%) | 29,647 (37.3%) |
Disability Class: Self-Care Difficulty
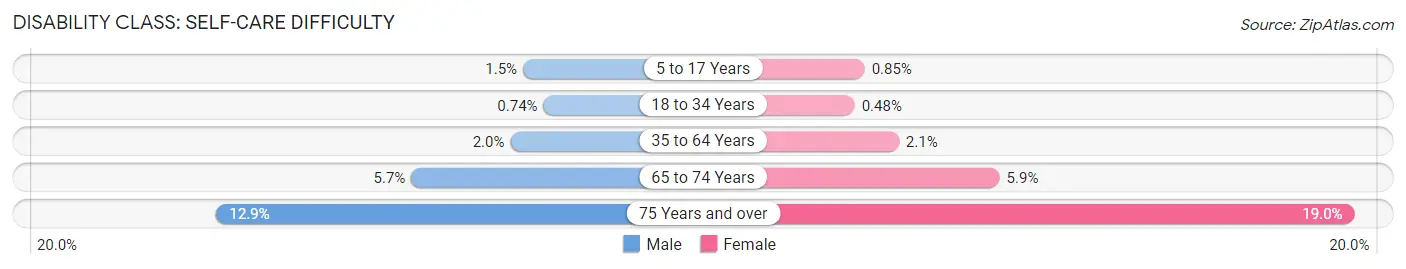
| Age Bracket | Male | Female |
| 5 to 17 Years | 2,752 (1.5%) | 1,482 (0.9%) |
| 18 to 34 Years | 2,235 (0.7%) | 1,462 (0.5%) |
| 35 to 64 Years | 8,902 (2.0%) | 9,546 (2.1%) |
| 65 to 74 Years | 4,812 (5.7%) | 5,626 (5.9%) |
| 75 Years and over | 6,714 (12.9%) | 15,127 (19.0%) |
Technology Access in Area Code 310
Computing Device Access in Area Code 310
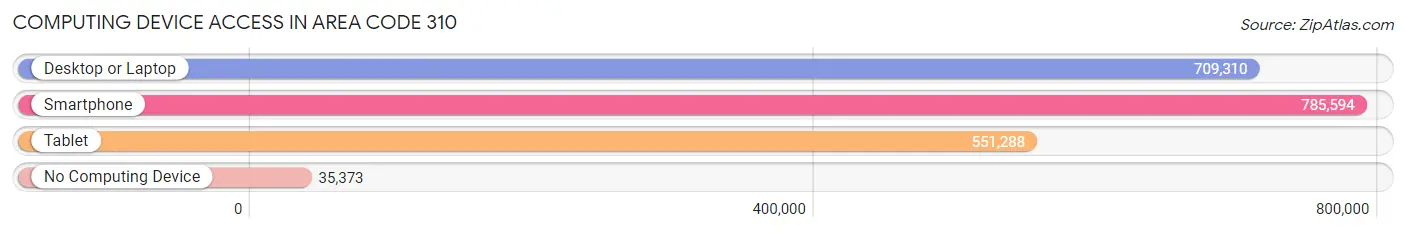
| Device Type | # Households | % Households |
| Desktop or Laptop | 709,310 | 83.2% |
| Smartphone | 785,594 | 92.1% |
| Tablet | 551,288 | 64.6% |
| No Computing Device | 35,373 | 4.2% |
| Total | 852,820 | 100.0% |
Internet Access in Area Code 310
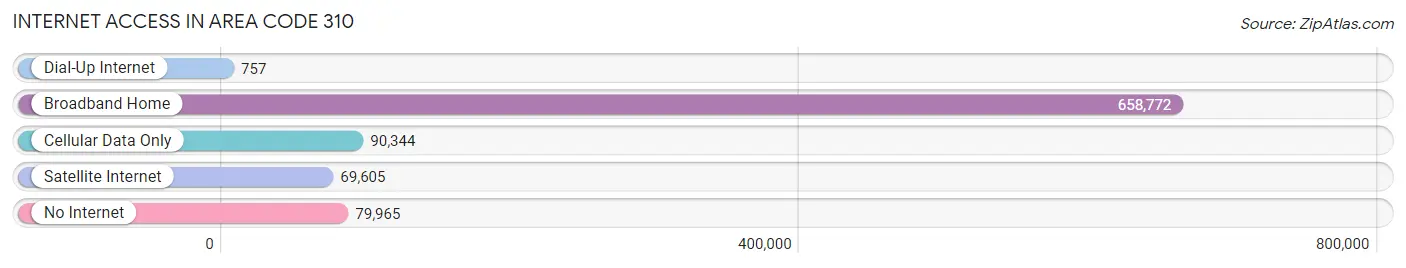
| Internet Type | # Households | % Households |
| Dial-Up Internet | 757 | 0.1% |
| Broadband Home | 658,772 | 77.2% |
| Cellular Data Only | 90,344 | 10.6% |
| Satellite Internet | 69,605 | 8.2% |
| No Internet | 79,965 | 9.4% |
| Total | 852,820 | 100.0% |
Area Code 310 Summary
Geography
Area code 310 is a telephone area code in the North American Numbering Plan (NANP) for the state of California. It covers the West Los Angeles and South Bay areas of Los Angeles County, including the cities of Beverly Hills, Santa Monica, Inglewood, and Torrance.
Social
Area code 310 is a popular area code in California, and is known for its vibrant social scene. It is home to many popular attractions, such as the Santa Monica Pier, the Hollywood Walk of Fame, and the Getty Center. It is also home to many popular restaurants, bars, and clubs.
Economics
Area code 310 is an economically prosperous area of California. It is home to many large businesses, such as the Los Angeles Times, the Los Angeles Lakers, and the Los Angeles Dodgers. It is also home to many high-end shopping centers, such as the Beverly Center and the Third Street Promenade.
Demographics
Area code 310 is home to a diverse population. According to the 2010 census, the population of the area code was 1,711,263. The population is made up of a variety of ethnicities, including White (44.2%), Hispanic or Latino (33.2%), African American (11.2%), Asian (7.3%), and other (4.1%). The median household income in the area code is $63,837.
Common Questions
What is Per Capita Income in Area Code 310?
Per Capita income in Area Code 310 is $57,384.
What is the Median Family Income in Area Code 310?
Median Family Income in Area Code 310 is $122,787.
What is the Median Household income in Area Code 310?
Median Household Income in Area Code 310 is $98,455.
What is Income or Wage Gap in Area Code 310?
Income or Wage Gap in Area Code 310 is 24.1%.
Women in Area Code 310 earn 75.9 cents for every dollar earned by a man.
What is Family Income Deficit in Area Code 310?
Family Income Deficit in Area Code 310 is $11,618.
Families that are below poverty line in Area Code 310 earn $11,618 less on average than the poverty threshold level.
What is Inequality or Gini Index in Area Code 310?
Inequality or Gini Index in Area Code 310 is 33.49.
What is the Total Population of Area Code 310?
Total Population of Area Code 310 is 2,321,747.
What is the Total Male Population of Area Code 310?
Total Male Population of Area Code 310 is 1,147,510.
What is the Total Female Population of Area Code 310?
Total Female Population of Area Code 310 is 1,174,237.
What is the Ratio of Males per 100 Females in Area Code 310?
There are 97.72 Males per 100 Females in Area Code 310.
What is the Ratio of Females per 100 Males in Area Code 310?
There are 102.33 Females per 100 Males in Area Code 310.
What is the Median Population Age in Area Code 310?
Median Population Age in Area Code 310 is 39.1 Years.
What is the Average Family Size in Area Code 310
Average Family Size in Area Code 310 is 3.3 People.
What is the Average Household Size in Area Code 310
Average Household Size in Area Code 310 is 2.6 People.
How Large is the Labor Force in Area Code 310?
There are 1,218,235 People in the Labor Forcein in Area Code 310.
What is the Percentage of People in the Labor Force in Area Code 310?
64.6% of People are in the Labor Force in Area Code 310.
What is the Unemployment Rate in Area Code 310?
Unemployment Rate in Area Code 310 is 7.3%.