Area Code 562 Map & Demographics
Area Code 562 Map
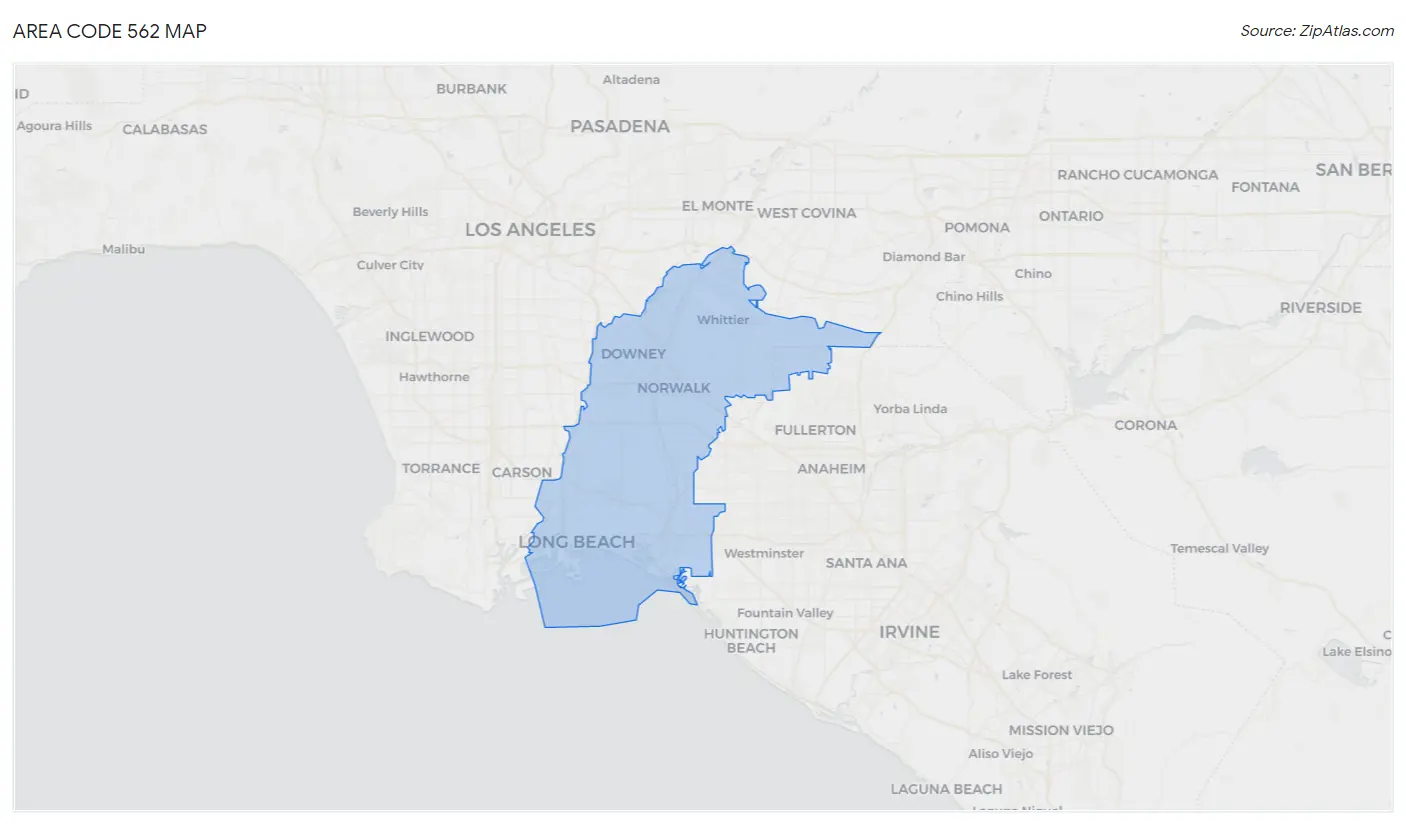
Area Code 562 Overview
$37,467
PER CAPITA INCOME
$97,120
AVG FAMILY INCOME
$83,558
AVG HOUSEHOLD INCOME
22.7%
WAGE / INCOME GAP [ % ]
77.3¢/ $1
WAGE / INCOME GAP [ $ ]
$11,533
FAMILY INCOME DEFICIT
25.94
INEQUALITY / GINI INDEX
2,365,238
TOTAL POPULATION
1,176,713
MALE POPULATION
1,188,525
FEMALE POPULATION
99.01
MALES / 100 FEMALES
101.00
FEMALES / 100 MALES
38.1
MEDIAN AGE
3.6
AVG FAMILY SIZE
3.0
AVG HOUSEHOLD SIZE
1,227,486
LABOR FORCE [ PEOPLE ]
64.2%
PERCENT IN LABOR FORCE
7.1%
UNEMPLOYMENT RATE
Income in Area Code 562
Income Overview in Area Code 562
Per Capita Income in Area Code 562 is $37,467, while median incomes of families and households are $97,120 and $83,558 respectively.
| Characteristic | Number | Measure |
| Per Capita Income | 2,365,238 | $37,467 |
| Median Family Income | 521,816 | $97,120 |
| Mean Family Income | 521,816 | $7,171,287 |
| Median Household Income | 770,308 | $83,558 |
| Mean Household Income | 770,308 | $6,355,400 |
| Income Deficit | 521,816 | $11,533 |
| Wage / Income Gap (%) | 2,365,238 | 22.68% |
| Wage / Income Gap ($) | 2,365,238 | 77.32¢ per $1 |
| Gini / Inequality Index | 2,365,238 | 25.94 |
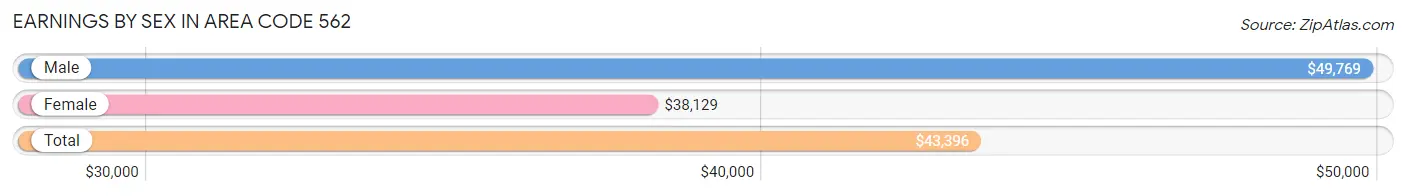
Earnings by Sex in Area Code 562
Average Earnings in Area Code 562 are $43,396, $49,769 for men and $38,129 for women, a difference of 23.4%.
| Sex | Number | Average Earnings |
| Male | 677,549 (53.9%) | $49,769 |
| Female | 578,921 (46.1%) | $38,129 |
| Total | 1,256,470 (100.0%) | $43,396 |
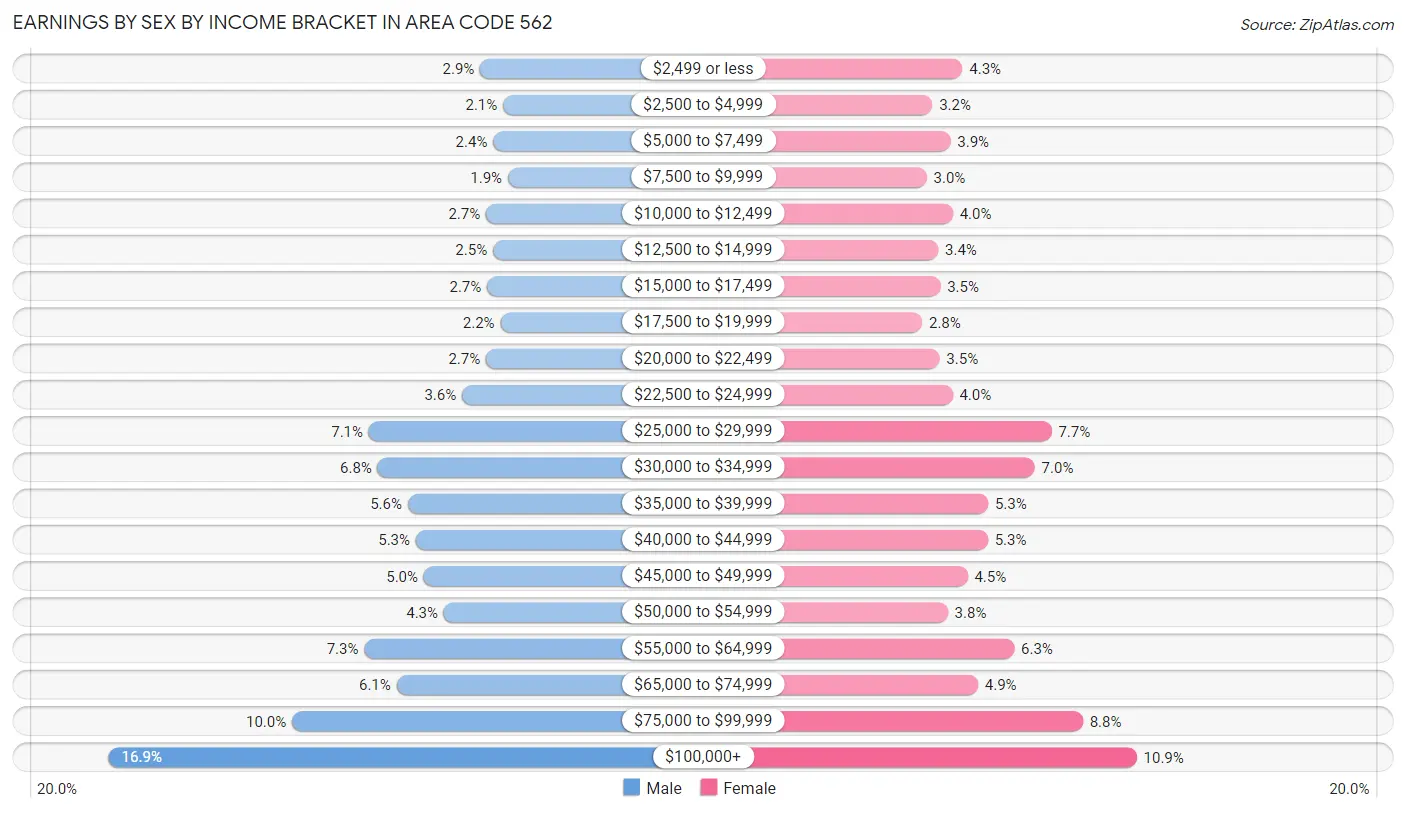
Earnings by Sex by Income Bracket in Area Code 562
The most common earnings brackets in Area Code 562 are $100,000+ for men (114,178 | 16.9%) and $100,000+ for women (62,856 | 10.9%).
| Income | Male | Female |
| $2,499 or less | 19,819 (2.9%) | 25,087 (4.3%) |
| $2,500 to $4,999 | 14,003 (2.1%) | 18,504 (3.2%) |
| $5,000 to $7,499 | 16,565 (2.4%) | 22,490 (3.9%) |
| $7,500 to $9,999 | 12,803 (1.9%) | 17,290 (3.0%) |
| $10,000 to $12,499 | 18,329 (2.7%) | 23,000 (4.0%) |
| $12,500 to $14,999 | 16,594 (2.5%) | 19,784 (3.4%) |
| $15,000 to $17,499 | 18,111 (2.7%) | 20,254 (3.5%) |
| $17,500 to $19,999 | 14,696 (2.2%) | 16,354 (2.8%) |
| $20,000 to $22,499 | 18,361 (2.7%) | 20,087 (3.5%) |
| $22,500 to $24,999 | 24,455 (3.6%) | 22,911 (4.0%) |
| $25,000 to $29,999 | 48,139 (7.1%) | 44,375 (7.7%) |
| $30,000 to $34,999 | 45,900 (6.8%) | 40,768 (7.0%) |
| $35,000 to $39,999 | 38,211 (5.6%) | 30,604 (5.3%) |
| $40,000 to $44,999 | 36,183 (5.3%) | 30,560 (5.3%) |
| $45,000 to $49,999 | 34,123 (5.0%) | 26,186 (4.5%) |
| $50,000 to $54,999 | 29,095 (4.3%) | 21,911 (3.8%) |
| $55,000 to $64,999 | 49,268 (7.3%) | 36,286 (6.3%) |
| $65,000 to $74,999 | 41,070 (6.1%) | 28,437 (4.9%) |
| $75,000 to $99,999 | 67,646 (10.0%) | 51,177 (8.8%) |
| $100,000+ | 114,178 (16.9%) | 62,856 (10.9%) |
| Total | 677,549 (100.0%) | 578,921 (100.0%) |
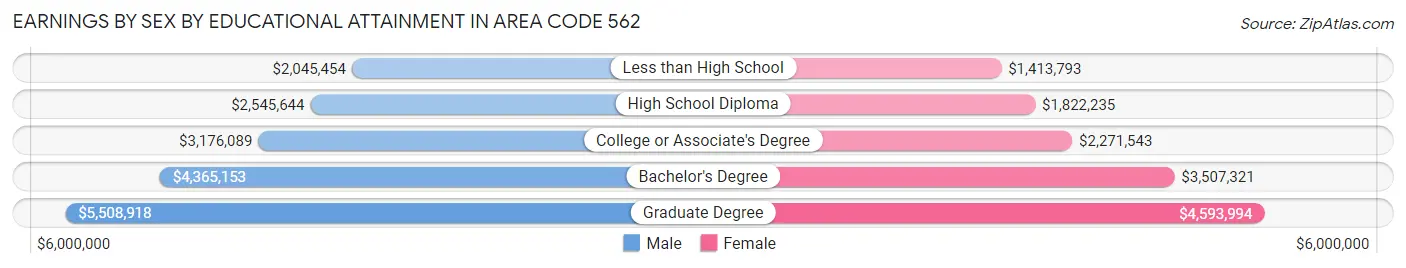
Earnings by Sex by Educational Attainment in Area Code 562
Average earnings in Area Code 562 are $3,280,656 for men and $2,595,126 for women, a difference of 20.9%. Men with an educational attainment of graduate degree enjoy the highest average annual earnings of $5,508,918, while those with less than high school education earn the least with $2,045,454. Women with an educational attainment of graduate degree earn the most with the average annual earnings of $4,593,994, while those with less than high school education have the smallest earnings of $1,413,793.
| Educational Attainment | Male Income | Female Income |
| Less than High School | $2,045,454 | $1,413,793 |
| High School Diploma | $2,545,644 | $1,822,235 |
| College or Associate's Degree | $3,176,089 | $2,271,543 |
| Bachelor's Degree | $4,365,153 | $3,507,321 |
| Graduate Degree | $5,508,918 | $4,593,994 |
| Total | $3,280,656 | $2,595,126 |
Family Income in Area Code 562
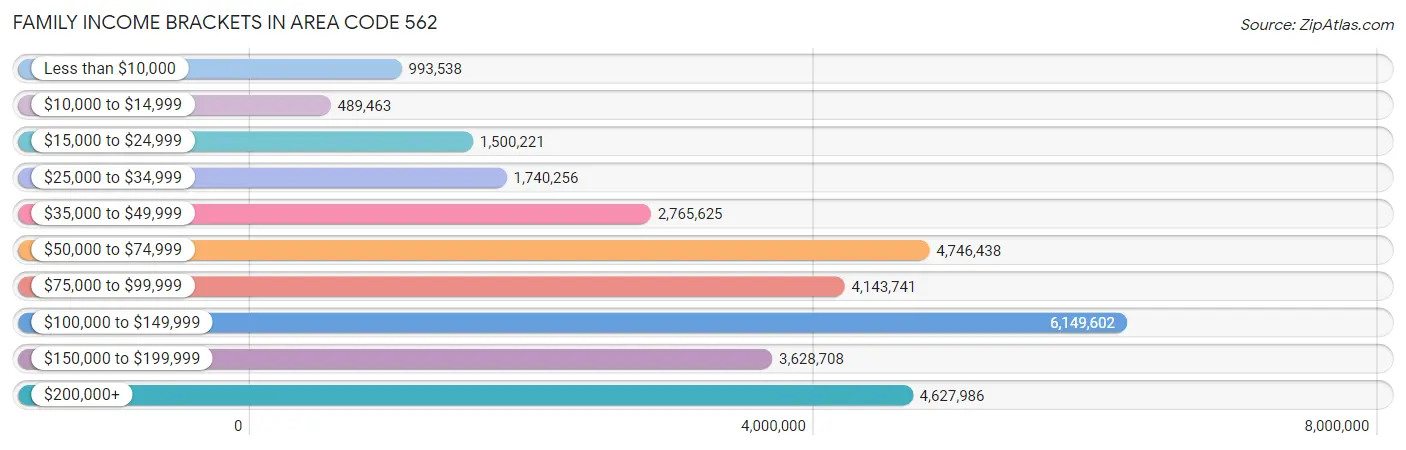
Family Income Brackets in Area Code 562
According to the Area Code 562 family income data, there are 6,149,602 families falling into the $100,000 to $149,999 income range, which is the most common income bracket and makes up 1,178.5% of all families. Conversely, the $10,000 to $14,999 income bracket is the least frequent group with only 489,463 families (93.8%) belonging to this category.
| Income Bracket | # Families | % Families |
| Less than $10,000 | 993,538 | 190.4% |
| $10,000 to $14,999 | 489,463 | 93.8% |
| $15,000 to $24,999 | 1,500,221 | 287.5% |
| $25,000 to $34,999 | 1,740,256 | 333.5% |
| $35,000 to $49,999 | 2,765,625 | 530.0% |
| $50,000 to $74,999 | 4,746,438 | 909.6% |
| $75,000 to $99,999 | 4,143,741 | 794.1% |
| $100,000 to $149,999 | 6,149,602 | 1,178.5% |
| $150,000 to $199,999 | 3,628,708 | 695.4% |
| $200,000+ | 4,627,986 | 886.9% |
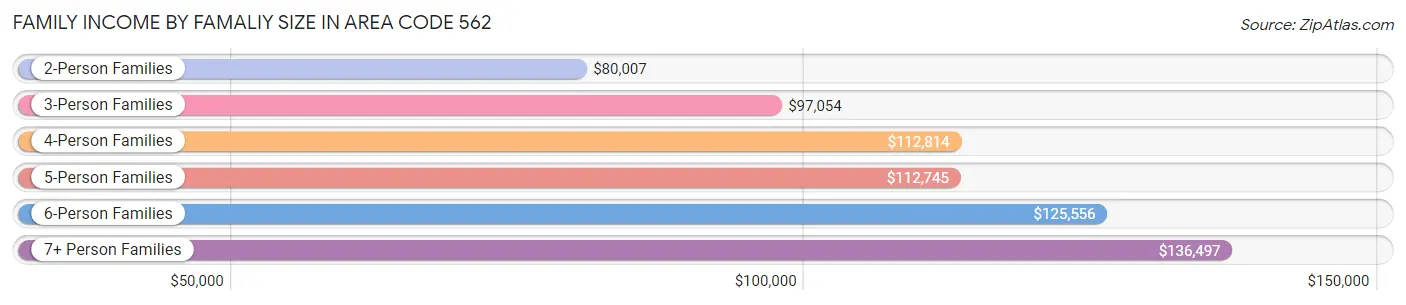
Family Income by Famaliy Size in Area Code 562
7+ person families (22,118 | 4.2%) account for the highest median family income in Area Code 562 with $136,497 per family, while 2-person families (178,585 | 34.2%) have the highest median income of $40,003 per family member.
| Income Bracket | # Families | Median Income |
| 2-Person Families | 178,585 (34.2%) | $80,007 |
| 3-Person Families | 121,684 (23.3%) | $97,054 |
| 4-Person Families | 110,964 (21.3%) | $112,814 |
| 5-Person Families | 61,058 (11.7%) | $112,745 |
| 6-Person Families | 27,407 (5.2%) | $125,556 |
| 7+ Person Families | 22,118 (4.2%) | $136,497 |
| Total | 521,816 (100.0%) | $97,120 |
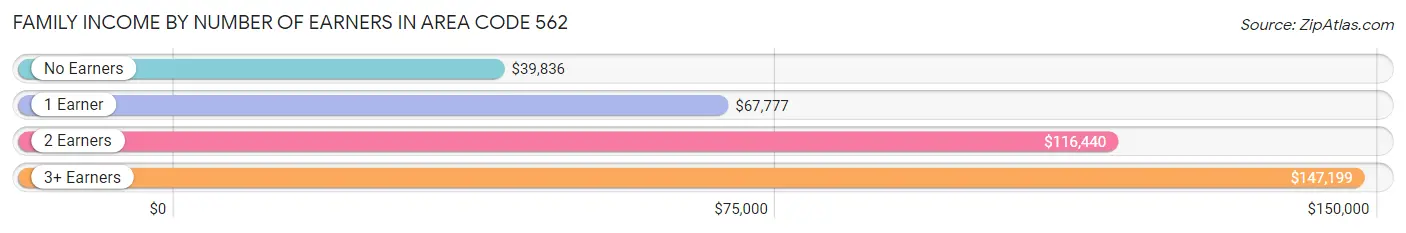
Family Income by Number of Earners in Area Code 562
The median family income in Area Code 562 is $97,120, with families comprising 3+ earners (104,188) having the highest median family income of $147,199, while families with no earners (54,829) have the lowest median family income of $39,836, accounting for 20.0% and 10.5% of families, respectively.
| Number of Earners | # Families | Median Income |
| No Earners | 54,829 (10.5%) | $39,836 |
| 1 Earner | 159,792 (30.6%) | $67,777 |
| 2 Earners | 203,007 (38.9%) | $116,440 |
| 3+ Earners | 104,188 (20.0%) | $147,199 |
| Total | 521,816 (100.0%) | $97,120 |
Household Income in Area Code 562
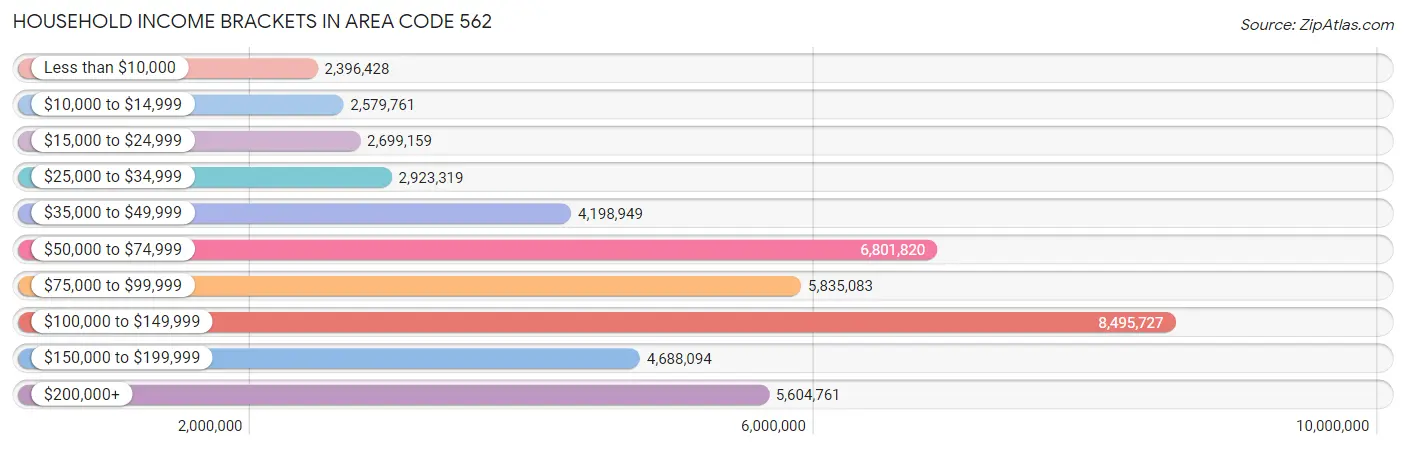
Household Income Brackets in Area Code 562
With 8,495,727 households falling in the category, the $100,000 to $149,999 income range is the most frequent in Area Code 562, accounting for 1,102.9% of all households. In contrast, only 2,396,428 households (311.1%) fall into the less than $10,000 income bracket, making it the least populous group.
| Income Bracket | # Households | % Households |
| Less than $10,000 | 2,396,428 | 311.1% |
| $10,000 to $14,999 | 2,579,761 | 334.9% |
| $15,000 to $24,999 | 2,699,159 | 350.4% |
| $25,000 to $34,999 | 2,923,319 | 379.5% |
| $35,000 to $49,999 | 4,198,949 | 545.1% |
| $50,000 to $74,999 | 6,801,820 | 883.0% |
| $75,000 to $99,999 | 5,835,083 | 757.5% |
| $100,000 to $149,999 | 8,495,727 | 1,102.9% |
| $150,000 to $199,999 | 4,688,094 | 608.6% |
| $200,000+ | 5,604,761 | 727.6% |
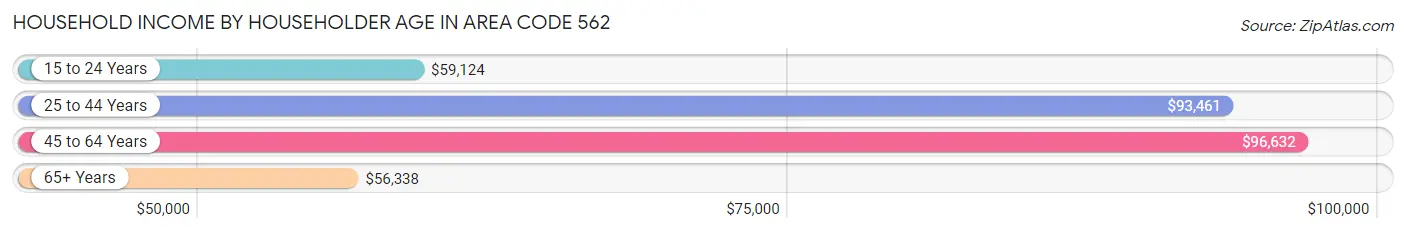
Household Income by Householder Age in Area Code 562
The median household income in Area Code 562 is $83,558, with the highest median household income of $96,632 found in the 45 to 64 years age bracket for the primary householder. A total of 305,069 households (39.6%) fall into this category. Meanwhile, the 65+ years age bracket for the primary householder has the lowest median household income of $56,338, with 172,472 households (22.4%) in this group.
| Income Bracket | # Households | Median Income |
| 15 to 24 Years | 20,140 (2.6%) | $59,124 |
| 25 to 44 Years | 272,627 (35.4%) | $93,461 |
| 45 to 64 Years | 305,069 (39.6%) | $96,632 |
| 65+ Years | 172,472 (22.4%) | $56,338 |
| Total | 770,308 (100.0%) | $83,558 |
Poverty in Area Code 562
Income Below Poverty by Sex and Age in Area Code 562
With 11.9% poverty level for males and 14.1% for females among the residents of Area Code 562, 5 year old males and 15 year old females are the most vulnerable to poverty, with 2,731 males (19.8%) and 2,946 females (19.2%) in their respective age groups living below the poverty level.
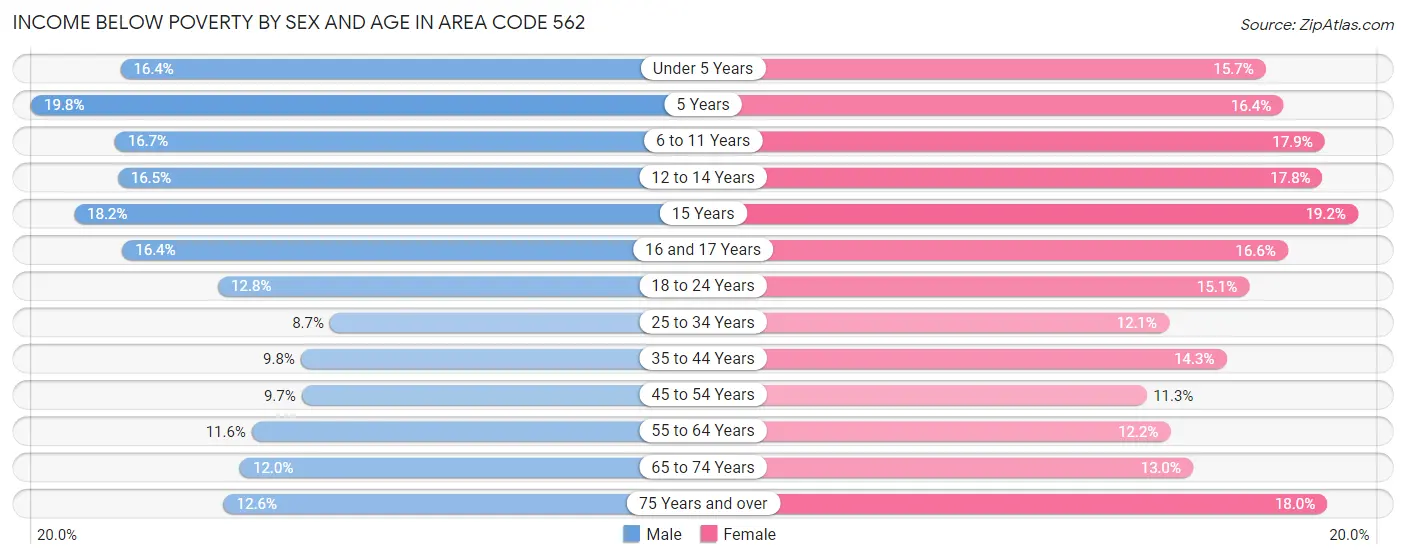
| Age Bracket | Male | Female |
| Under 5 Years | 10,602 (16.4%) | 9,976 (15.7%) |
| 5 Years | 2,731 (19.8%) | 2,113 (16.4%) |
| 6 to 11 Years | 14,366 (16.7%) | 14,622 (17.9%) |
| 12 to 14 Years | 7,970 (16.5%) | 7,744 (17.8%) |
| 15 Years | 2,772 (18.2%) | 2,946 (19.2%) |
| 16 and 17 Years | 5,143 (16.4%) | 4,881 (16.6%) |
| 18 to 24 Years | 14,402 (12.8%) | 17,194 (15.1%) |
| 25 to 34 Years | 17,049 (8.7%) | 22,783 (12.1%) |
| 35 to 44 Years | 16,263 (9.8%) | 22,355 (14.3%) |
| 45 to 54 Years | 14,942 (9.7%) | 17,353 (11.3%) |
| 55 to 64 Years | 16,328 (11.6%) | 17,560 (12.2%) |
| 65 to 74 Years | 10,113 (12.0%) | 12,734 (13.0%) |
| 75 Years and over | 6,290 (12.6%) | 13,758 (18.0%) |
| Total | 138,971 (11.9%) | 166,019 (14.1%) |
Income Above Poverty by Sex and Age in Area Code 562
According to the poverty statistics in Area Code 562, males aged 25 to 34 years and females aged 45 to 54 years are the age groups that are most secure financially, with 91.3% of males and 88.7% of females in these age groups living above the poverty line.
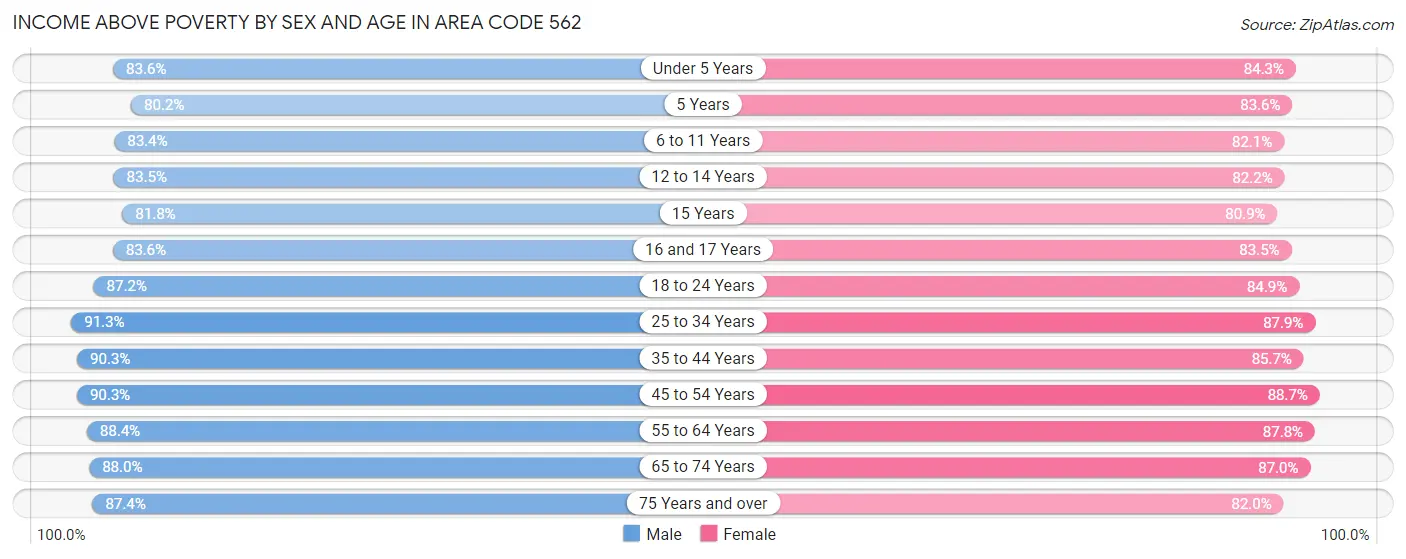
| Age Bracket | Male | Female |
| Under 5 Years | 53,900 (83.6%) | 53,453 (84.3%) |
| 5 Years | 11,093 (80.2%) | 10,786 (83.6%) |
| 6 to 11 Years | 71,907 (83.4%) | 66,995 (82.1%) |
| 12 to 14 Years | 40,205 (83.5%) | 35,657 (82.2%) |
| 15 Years | 12,490 (81.8%) | 12,440 (80.8%) |
| 16 and 17 Years | 26,270 (83.6%) | 24,608 (83.5%) |
| 18 to 24 Years | 97,903 (87.2%) | 96,556 (84.9%) |
| 25 to 34 Years | 179,487 (91.3%) | 164,867 (87.9%) |
| 35 to 44 Years | 150,597 (90.2%) | 134,293 (85.7%) |
| 45 to 54 Years | 138,861 (90.3%) | 136,209 (88.7%) |
| 55 to 64 Years | 124,782 (88.4%) | 126,464 (87.8%) |
| 65 to 74 Years | 74,172 (88.0%) | 84,957 (87.0%) |
| 75 Years and over | 43,606 (87.4%) | 62,628 (82.0%) |
| Total | 1,025,273 (88.1%) | 1,009,913 (85.9%) |
Income Below Poverty Among Married-Couple Families in Area Code 562
The poverty statistics for married-couple families in Area Code 562 show that 6.1% or 20,801 of the total 341,019 families live below the poverty line. Families with 5 or more children have the highest poverty rate of 23.4%, comprising of 605 families. On the other hand, families with no children have the lowest poverty rate of 4.7%, which includes 8,458 families.
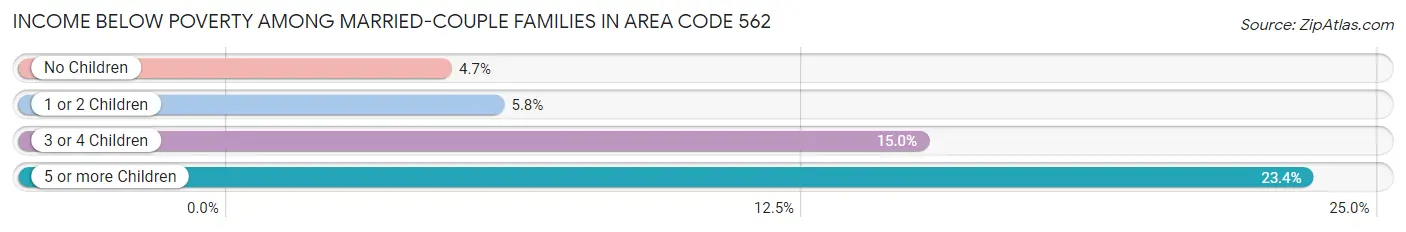
| Children | Above Poverty | Below Poverty |
| No Children | 173,181 (95.3%) | 8,458 (4.7%) |
| 1 or 2 Children | 120,680 (94.2%) | 7,425 (5.8%) |
| 3 or 4 Children | 24,376 (85.0%) | 4,313 (15.0%) |
| 5 or more Children | 1,981 (76.6%) | 605 (23.4%) |
| Total | 320,218 (93.9%) | 20,801 (6.1%) |
Income Below Poverty Among Single-Parent Households in Area Code 562
According to the poverty data in Area Code 562, 11.0% or 6,623 single-father households and 18.6% or 22,406 single-mother households are living below the poverty line. Among single-father households, those with 3 or 4 children have the highest poverty rate, with 1,419 households (29.1%) experiencing poverty. Likewise, among single-mother households, those with 5 or more children have the highest poverty rate, with 716 households (52.6%) falling below the poverty line.
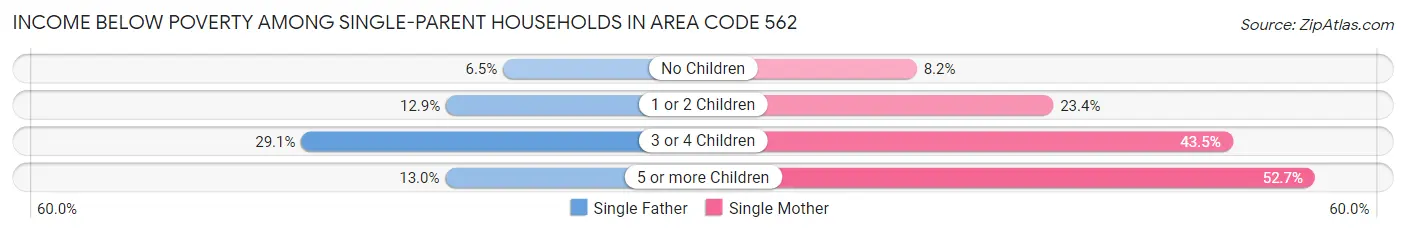
| Children | Single Father | Single Mother |
| No Children | 1,977 (6.5%) | 4,518 (8.2%) |
| 1 or 2 Children | 3,200 (12.9%) | 12,380 (23.4%) |
| 3 or 4 Children | 1,419 (29.1%) | 4,792 (43.4%) |
| 5 or more Children | 27 (13.0%) | 716 (52.6%) |
| Total | 6,623 (11.0%) | 22,406 (18.6%) |
Income Below Poverty Among Married-Couple vs Single-Parent Households in Area Code 562
The poverty data for Area Code 562 shows that 20,801 of the married-couple family households (6.1%) and 29,029 of the single-parent households (16.1%) are living below the poverty level. Within the married-couple family households, those with 5 or more children have the highest poverty rate, with 605 households (23.4%) falling below the poverty line. Among the single-parent households, those with 5 or more children have the highest poverty rate, with 743 household (47.4%) living below poverty.
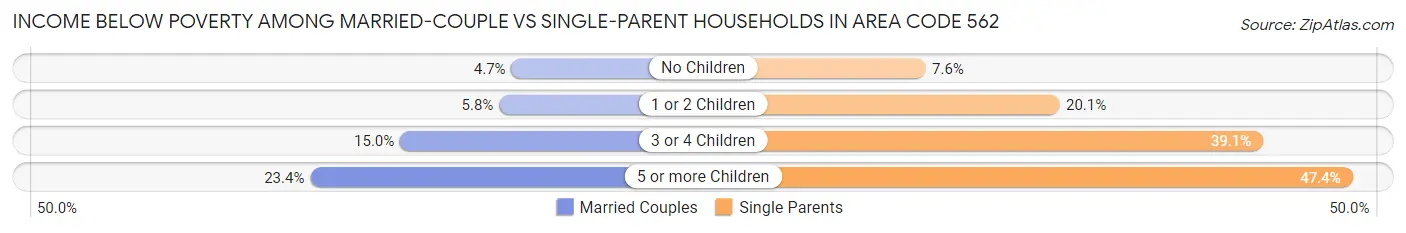
| Children | Married-Couple Families | Single-Parent Households |
| No Children | 8,458 (4.7%) | 6,495 (7.6%) |
| 1 or 2 Children | 7,425 (5.8%) | 15,580 (20.1%) |
| 3 or 4 Children | 4,313 (15.0%) | 6,211 (39.1%) |
| 5 or more Children | 605 (23.4%) | 743 (47.4%) |
| Total | 20,801 (6.1%) | 29,029 (16.1%) |
Race in Area Code 562
The most populous races in Area Code 562 are Hispanic or Latino (1,360,350 | 57.5%), White / Caucasian (888,620 | 37.6%), and Some other Race (624,429 | 26.4%).
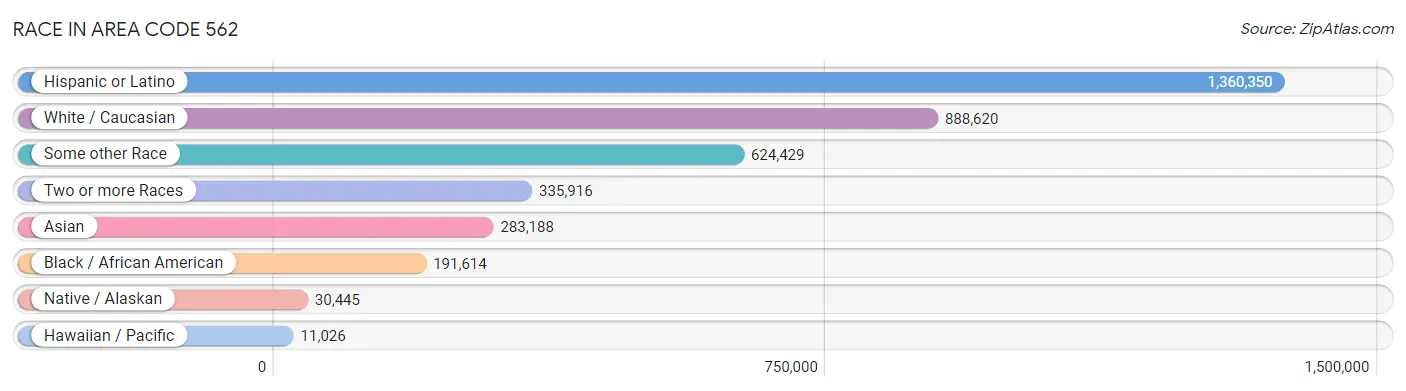
| Race | # Population | % Population |
| Asian | 283,188 | 12.0% |
| Black / African American | 191,614 | 8.1% |
| Hawaiian / Pacific | 11,026 | 0.5% |
| Hispanic or Latino | 1,360,350 | 57.5% |
| Native / Alaskan | 30,445 | 1.3% |
| White / Caucasian | 888,620 | 37.6% |
| Two or more Races | 335,916 | 14.2% |
| Some other Race | 624,429 | 26.4% |
| Total | 2,365,238 | 100.0% |
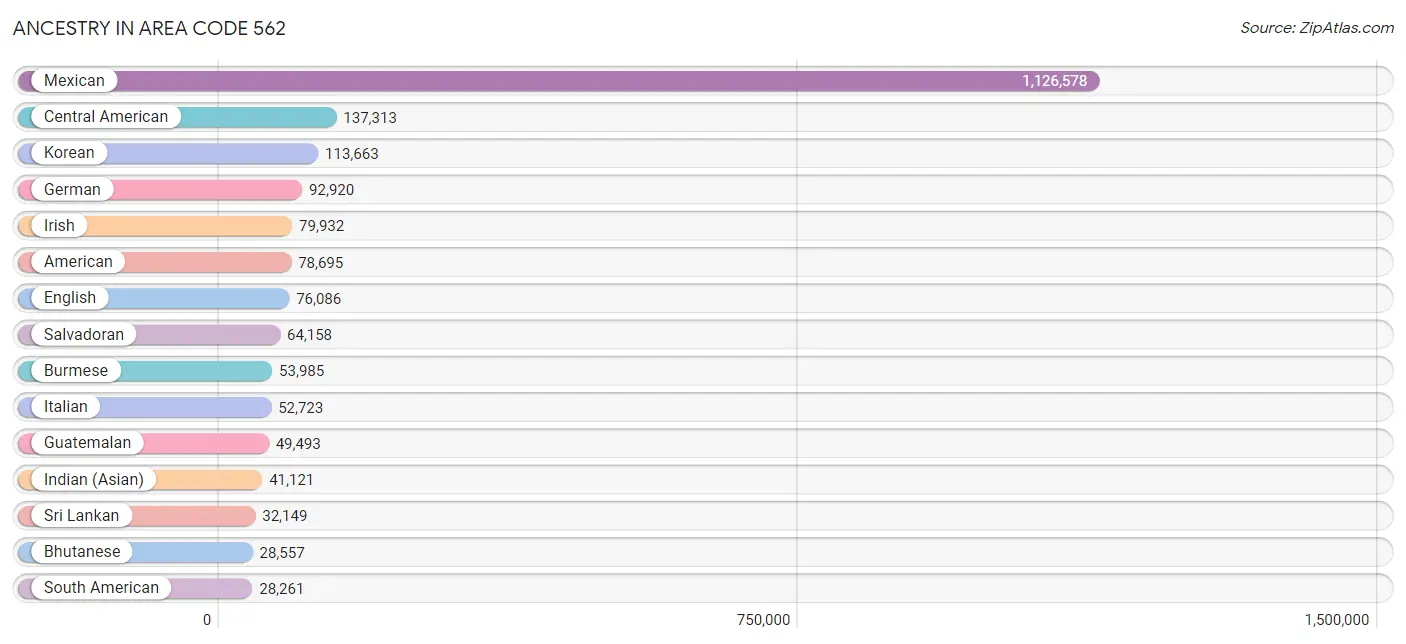
Ancestry in Area Code 562
The most populous ancestries reported in Area Code 562 are Mexican (1,126,578 | 47.6%), Central American (137,313 | 5.8%), Korean (113,663 | 4.8%), German (92,920 | 3.9%), and Irish (79,932 | 3.4%), together accounting for 65.6% of all Area Code 562 residents.
| Ancestry | # Population | % Population |
| Afghan | 436 | 0.0% |
| African | 9,164 | 0.4% |
| Alaska Native | 97 | 0.0% |
| Alaskan Athabascan | 38 | 0.0% |
| Albanian | 168 | 0.0% |
| Aleut | 11 | 0.0% |
| Alsatian | 16 | 0.0% |
| American | 78,695 | 3.3% |
| Apache | 2,026 | 0.1% |
| Arab | 11,858 | 0.5% |
| Arapaho | 13 | 0.0% |
| Argentinean | 3,694 | 0.2% |
| Armenian | 4,731 | 0.2% |
| Assyrian / Chaldean / Syriac | 161 | 0.0% |
| Australian | 626 | 0.0% |
| Austrian | 2,152 | 0.1% |
| Bahamian | 102 | 0.0% |
| Bangladeshi | 273 | 0.0% |
| Barbadian | 165 | 0.0% |
| Basque | 588 | 0.0% |
| Belgian | 832 | 0.0% |
| Belizean | 2,497 | 0.1% |
| Bermudan | 11 | 0.0% |
| Bhutanese | 28,557 | 1.2% |
| Blackfeet | 944 | 0.0% |
| Bolivian | 964 | 0.0% |
| Brazilian | 2,117 | 0.1% |
| British | 6,843 | 0.3% |
| British West Indian | 107 | 0.0% |
| Bulgarian | 408 | 0.0% |
| Burmese | 53,985 | 2.3% |
| Cajun | 110 | 0.0% |
| Cambodian | 1,069 | 0.1% |
| Canadian | 2,765 | 0.1% |
| Cape Verdean | 176 | 0.0% |
| Celtic | 201 | 0.0% |
| Central American | 137,313 | 5.8% |
| Central American Indian | 7,544 | 0.3% |
| Cherokee | 3,464 | 0.2% |
| Cheyenne | 182 | 0.0% |
| Chickasaw | 294 | 0.0% |
| Chilean | 1,171 | 0.1% |
| Chinese | 96 | 0.0% |
| Chippewa | 367 | 0.0% |
| Choctaw | 1,003 | 0.0% |
| Colombian | 7,125 | 0.3% |
| Colville | 20 | 0.0% |
| Comanche | 319 | 0.0% |
| Costa Rican | 2,108 | 0.1% |
| Cree | 86 | 0.0% |
| Creek | 244 | 0.0% |
| Croatian | 4,636 | 0.2% |
| Crow | 7 | 0.0% |
| Cuban | 9,347 | 0.4% |
| Cypriot | 30 | 0.0% |
| Czech | 2,802 | 0.1% |
| Czechoslovakian | 833 | 0.0% |
| Danish | 4,130 | 0.2% |
| Delaware | 133 | 0.0% |
| Dominican | 1,383 | 0.1% |
| Dutch | 11,926 | 0.5% |
| Dutch West Indian | 53 | 0.0% |
| Eastern European | 3,118 | 0.1% |
| Ecuadorian | 5,172 | 0.2% |
| Egyptian | 3,858 | 0.2% |
| English | 76,086 | 3.2% |
| Estonian | 144 | 0.0% |
| Ethiopian | 987 | 0.0% |
| European | 20,640 | 0.9% |
| Fijian | 44 | 0.0% |
| Filipino | 2,915 | 0.1% |
| Finnish | 1,916 | 0.1% |
| French | 22,025 | 0.9% |
| French American Indian | 118 | 0.0% |
| French Canadian | 3,830 | 0.2% |
| German | 92,920 | 3.9% |
| German Russian | 94 | 0.0% |
| Ghanaian | 418 | 0.0% |
| Greek | 5,989 | 0.3% |
| Guamanian / Chamorro | 2,990 | 0.1% |
| Guatemalan | 49,493 | 2.1% |
| Guyanese | 301 | 0.0% |
| Haitian | 963 | 0.0% |
| Honduran | 11,952 | 0.5% |
| Hopi | 65 | 0.0% |
| Hungarian | 3,548 | 0.2% |
| Icelander | 315 | 0.0% |
| Indian (Asian) | 41,121 | 1.7% |
| Indonesian | 414 | 0.0% |
| Inupiat | 9 | 0.0% |
| Iranian | 3,744 | 0.2% |
| Iraqi | 76 | 0.0% |
| Irish | 79,932 | 3.4% |
| Iroquois | 186 | 0.0% |
| Israeli | 640 | 0.0% |
| Italian | 52,723 | 2.2% |
| Jamaican | 2,702 | 0.1% |
| Japanese | 26,469 | 1.1% |
| Jordanian | 875 | 0.0% |
| Kenyan | 262 | 0.0% |
| Kiowa | 63 | 0.0% |
| Korean | 113,663 | 4.8% |
| Laotian | 2,311 | 0.1% |
| Latvian | 326 | 0.0% |
| Lebanese | 3,011 | 0.1% |
| Lithuanian | 1,362 | 0.1% |
| Lumbee | 56 | 0.0% |
| Luxembourger | 42 | 0.0% |
| Macedonian | 97 | 0.0% |
| Malaysian | 3,449 | 0.2% |
| Maltese | 80 | 0.0% |
| Mexican | 1,126,578 | 47.6% |
| Mexican American Indian | 18,147 | 0.8% |
| Mongolian | 128 | 0.0% |
| Moroccan | 167 | 0.0% |
| Native Hawaiian | 5,361 | 0.2% |
| Navajo | 1,572 | 0.1% |
| New Zealander | 340 | 0.0% |
| Nicaraguan | 7,358 | 0.3% |
| Nigerian | 5,122 | 0.2% |
| Northern European | 1,676 | 0.1% |
| Norwegian | 11,571 | 0.5% |
| Okinawan | 57 | 0.0% |
| Osage | 148 | 0.0% |
| Ottawa | 69 | 0.0% |
| Paiute | 90 | 0.0% |
| Pakistani | 5,422 | 0.2% |
| Palestinian | 654 | 0.0% |
| Panamanian | 1,197 | 0.1% |
| Paraguayan | 12 | 0.0% |
| Pennsylvania German | 225 | 0.0% |
| Peruvian | 8,329 | 0.4% |
| Pima | 190 | 0.0% |
| Polish | 16,338 | 0.7% |
| Portuguese | 6,964 | 0.3% |
| Potawatomi | 149 | 0.0% |
| Pueblo | 259 | 0.0% |
| Puerto Rican | 12,233 | 0.5% |
| Romanian | 2,966 | 0.1% |
| Russian | 11,492 | 0.5% |
| Salvadoran | 64,158 | 2.7% |
| Samoan | 7,598 | 0.3% |
| Scandinavian | 3,998 | 0.2% |
| Scotch-Irish | 5,909 | 0.3% |
| Scottish | 14,259 | 0.6% |
| Seminole | 98 | 0.0% |
| Senegalese | 8 | 0.0% |
| Serbian | 738 | 0.0% |
| Shoshone | 39 | 0.0% |
| Sierra Leonean | 20 | 0.0% |
| Sioux | 693 | 0.0% |
| Slavic | 548 | 0.0% |
| Slovak | 751 | 0.0% |
| Slovene | 358 | 0.0% |
| Somali | 15 | 0.0% |
| South African | 449 | 0.0% |
| South American | 28,261 | 1.2% |
| South American Indian | 541 | 0.0% |
| Soviet Union | 37 | 0.0% |
| Spaniard | 10,507 | 0.4% |
| Spanish | 5,772 | 0.2% |
| Spanish American | 420 | 0.0% |
| Spanish American Indian | 448 | 0.0% |
| Sri Lankan | 32,149 | 1.4% |
| Subsaharan African | 17,602 | 0.7% |
| Sudanese | 286 | 0.0% |
| Swedish | 10,754 | 0.4% |
| Swiss | 2,252 | 0.1% |
| Syrian | 665 | 0.0% |
| Taiwanese | 45 | 0.0% |
| Thai | 15,535 | 0.7% |
| Tlingit-Haida | 19 | 0.0% |
| Tohono O'Odham | 267 | 0.0% |
| Tongan | 1,063 | 0.0% |
| Trinidadian and Tobagonian | 512 | 0.0% |
| Turkish | 1,002 | 0.0% |
| U.S. Virgin Islander | 12 | 0.0% |
| Ukrainian | 2,441 | 0.1% |
| Uruguayan | 435 | 0.0% |
| Ute | 16 | 0.0% |
| Venezuelan | 1,131 | 0.1% |
| Vietnamese | 2,459 | 0.1% |
| Welsh | 5,644 | 0.2% |
| West Indian | 661 | 0.0% |
| Yakama | 36 | 0.0% |
| Yaqui | 1,287 | 0.1% |
| Yugoslavian | 790 | 0.0% |
| Yuman | 124 | 0.0% |
| Yup'ik | 27 | 0.0% |
| Zimbabwean | 19 | 0.0% | View All 190 Rows |
Immigrants in Area Code 562
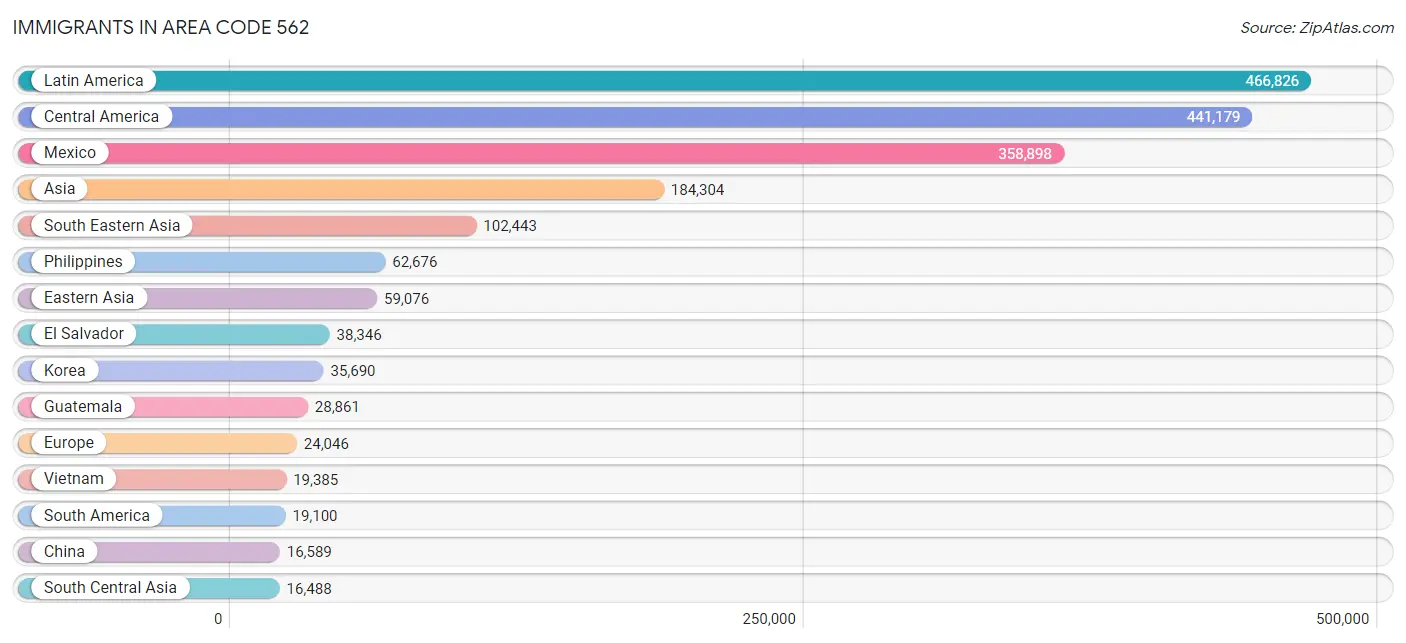
The most numerous immigrant groups reported in Area Code 562 came from Latin America (466,826 | 19.7%), Central America (441,179 | 18.6%), Mexico (358,898 | 15.2%), Asia (184,304 | 7.8%), and South Eastern Asia (102,443 | 4.3%), together accounting for 65.7% of all Area Code 562 residents.
| Immigration Origin | # Population | % Population |
| Afghanistan | 353 | 0.0% |
| Africa | 12,259 | 0.5% |
| Albania | 24 | 0.0% |
| Argentina | 2,229 | 0.1% |
| Armenia | 812 | 0.0% |
| Asia | 184,304 | 7.8% |
| Australia | 795 | 0.0% |
| Austria | 165 | 0.0% |
| Azores | 115 | 0.0% |
| Bahamas | 73 | 0.0% |
| Bangladesh | 2,441 | 0.1% |
| Barbados | 151 | 0.0% |
| Belarus | 194 | 0.0% |
| Belgium | 168 | 0.0% |
| Belize | 1,401 | 0.1% |
| Bolivia | 816 | 0.0% |
| Bosnia and Herzegovina | 279 | 0.0% |
| Brazil | 2,407 | 0.1% |
| Bulgaria | 285 | 0.0% |
| Cabo Verde | 9 | 0.0% |
| Cambodia | 12,365 | 0.5% |
| Cameroon | 314 | 0.0% |
| Canada | 4,237 | 0.2% |
| Caribbean | 6,547 | 0.3% |
| Central America | 441,179 | 18.6% |
| Chile | 989 | 0.0% |
| China | 16,589 | 0.7% |
| Colombia | 3,645 | 0.2% |
| Costa Rica | 1,060 | 0.0% |
| Croatia | 647 | 0.0% |
| Cuba | 3,778 | 0.2% |
| Czechoslovakia | 489 | 0.0% |
| Denmark | 158 | 0.0% |
| Dominica | 43 | 0.0% |
| Dominican Republic | 539 | 0.0% |
| Eastern Africa | 1,918 | 0.1% |
| Eastern Asia | 59,076 | 2.5% |
| Eastern Europe | 9,265 | 0.4% |
| Ecuador | 2,058 | 0.1% |
| Egypt | 3,200 | 0.1% |
| El Salvador | 38,346 | 1.6% |
| England | 2,419 | 0.1% |
| Eritrea | 155 | 0.0% |
| Ethiopia | 737 | 0.0% |
| Europe | 24,046 | 1.0% |
| Fiji | 631 | 0.0% |
| France | 958 | 0.0% |
| Germany | 2,613 | 0.1% |
| Ghana | 376 | 0.0% |
| Greece | 565 | 0.0% |
| Grenada | 28 | 0.0% |
| Guatemala | 28,861 | 1.2% |
| Guyana | 180 | 0.0% |
| Haiti | 195 | 0.0% |
| Honduras | 7,658 | 0.3% |
| Hong Kong | 1,421 | 0.1% |
| Hungary | 206 | 0.0% |
| India | 7,373 | 0.3% |
| Indonesia | 1,530 | 0.1% |
| Iran | 2,432 | 0.1% |
| Iraq | 247 | 0.0% |
| Ireland | 583 | 0.0% |
| Israel | 613 | 0.0% |
| Italy | 1,594 | 0.1% |
| Jamaica | 957 | 0.0% |
| Japan | 6,128 | 0.3% |
| Jordan | 1,026 | 0.0% |
| Kazakhstan | 104 | 0.0% |
| Kenya | 566 | 0.0% |
| Korea | 35,690 | 1.5% |
| Kuwait | 256 | 0.0% |
| Laos | 1,340 | 0.1% |
| Latin America | 466,826 | 19.7% |
| Latvia | 99 | 0.0% |
| Lebanon | 809 | 0.0% |
| Liberia | 107 | 0.0% |
| Lithuania | 39 | 0.0% |
| Malaysia | 259 | 0.0% |
| Mexico | 358,898 | 15.2% |
| Micronesia | 15 | 0.0% |
| Middle Africa | 319 | 0.0% |
| Moldova | 337 | 0.0% |
| Morocco | 176 | 0.0% |
| Nepal | 2,000 | 0.1% |
| Netherlands | 805 | 0.0% |
| Nicaragua | 4,024 | 0.2% |
| Nigeria | 4,333 | 0.2% |
| North Macedonia | 11 | 0.0% |
| Northern Africa | 3,756 | 0.2% |
| Northern Europe | 5,978 | 0.3% |
| Norway | 90 | 0.0% |
| Oceania | 3,722 | 0.2% |
| Pakistan | 1,376 | 0.1% |
| Panama | 665 | 0.0% |
| Peru | 5,672 | 0.2% |
| Philippines | 62,676 | 2.6% |
| Poland | 1,043 | 0.0% |
| Portugal | 734 | 0.0% |
| Romania | 1,429 | 0.1% |
| Russia | 2,020 | 0.1% |
| Saudi Arabia | 203 | 0.0% |
| Scotland | 369 | 0.0% |
| Senegal | 103 | 0.0% |
| Serbia | 127 | 0.0% |
| Sierra Leone | 103 | 0.0% |
| Singapore | 308 | 0.0% |
| Somalia | 46 | 0.0% |
| South Africa | 769 | 0.0% |
| South America | 19,100 | 0.8% |
| South Central Asia | 16,488 | 0.7% |
| South Eastern Asia | 102,443 | 4.3% |
| Southern Europe | 3,825 | 0.2% |
| Spain | 820 | 0.0% |
| Sri Lanka | 371 | 0.0% |
| St. Vincent and the Grenadines | 6 | 0.0% |
| Sudan | 283 | 0.0% |
| Sweden | 289 | 0.0% |
| Switzerland | 144 | 0.0% |
| Syria | 638 | 0.0% |
| Taiwan | 4,353 | 0.2% |
| Thailand | 4,029 | 0.2% |
| Trinidad and Tobago | 488 | 0.0% |
| Turkey | 998 | 0.0% |
| Uganda | 22 | 0.0% |
| Ukraine | 1,047 | 0.0% |
| Uruguay | 210 | 0.0% |
| Uzbekistan | 16 | 0.0% |
| Venezuela | 763 | 0.0% |
| Vietnam | 19,385 | 0.8% |
| West Indies | 15 | 0.0% |
| Western Africa | 5,179 | 0.2% |
| Western Asia | 5,958 | 0.3% |
| Western Europe | 4,864 | 0.2% |
| Zaire | 5 | 0.0% |
| Zimbabwe | 76 | 0.0% | View All 135 Rows |
Sex and Age in Area Code 562
Sex and Age in Area Code 562
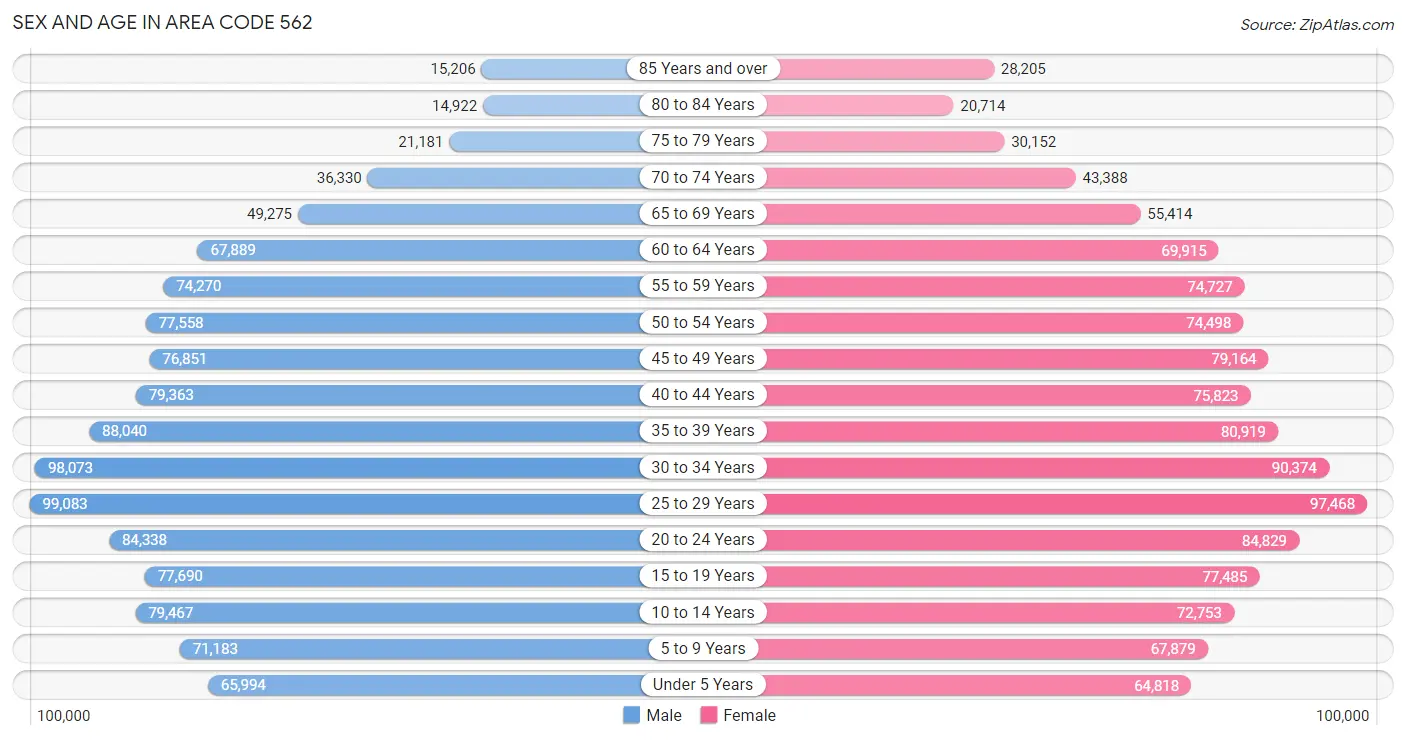
The most populous age groups in Area Code 562 are 25 to 29 Years (99,083 | 8.4%) for men and 25 to 29 Years (97,468 | 8.2%) for women.
| Age Bracket | Male | Female |
| Under 5 Years | 65,994 (5.6%) | 64,818 (5.4%) |
| 5 to 9 Years | 71,183 (6.0%) | 67,879 (5.7%) |
| 10 to 14 Years | 79,467 (6.8%) | 72,753 (6.1%) |
| 15 to 19 Years | 77,690 (6.6%) | 77,485 (6.5%) |
| 20 to 24 Years | 84,338 (7.2%) | 84,829 (7.1%) |
| 25 to 29 Years | 99,083 (8.4%) | 97,468 (8.2%) |
| 30 to 34 Years | 98,073 (8.3%) | 90,374 (7.6%) |
| 35 to 39 Years | 88,040 (7.5%) | 80,919 (6.8%) |
| 40 to 44 Years | 79,363 (6.7%) | 75,823 (6.4%) |
| 45 to 49 Years | 76,851 (6.5%) | 79,164 (6.7%) |
| 50 to 54 Years | 77,558 (6.6%) | 74,498 (6.3%) |
| 55 to 59 Years | 74,270 (6.3%) | 74,727 (6.3%) |
| 60 to 64 Years | 67,889 (5.8%) | 69,915 (5.9%) |
| 65 to 69 Years | 49,275 (4.2%) | 55,414 (4.7%) |
| 70 to 74 Years | 36,330 (3.1%) | 43,388 (3.6%) |
| 75 to 79 Years | 21,181 (1.8%) | 30,152 (2.5%) |
| 80 to 84 Years | 14,922 (1.3%) | 20,714 (1.7%) |
| 85 Years and over | 15,206 (1.3%) | 28,205 (2.4%) |
| Total | 1,176,713 (100.0%) | 1,188,525 (100.0%) |
Families and Households in Area Code 562
Median Family Size in Area Code 562
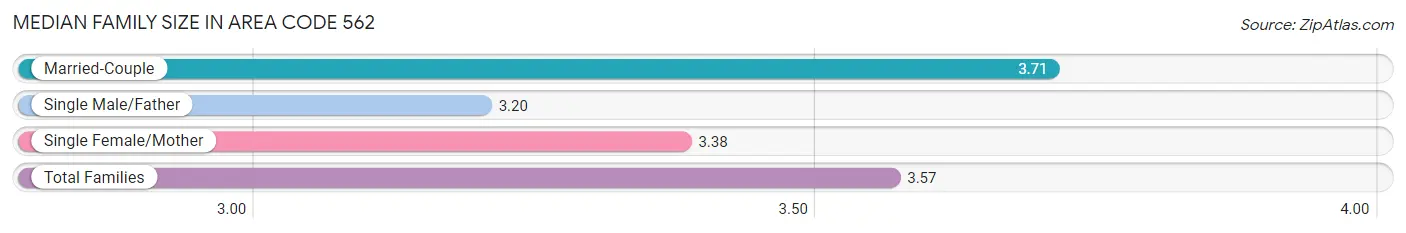
The median family size in Area Code 562 is 3.57 persons per family, with married-couple families (341,019 | 65.3%) accounting for the largest median family size of 3.70779 persons per family. On the other hand, single male/father families (60,186 | 11.5%) represent the smallest median family size with 3.20 persons per family.
| Family Type | # Families | Family Size |
| Married-Couple | 341,019 (65.3%) | 3.71 |
| Single Male/Father | 60,186 (11.5%) | 3.20 |
| Single Female/Mother | 120,611 (23.1%) | 3.38 |
| Total Families | 521,816 (100.0%) | 3.57 |
Median Household Size in Area Code 562
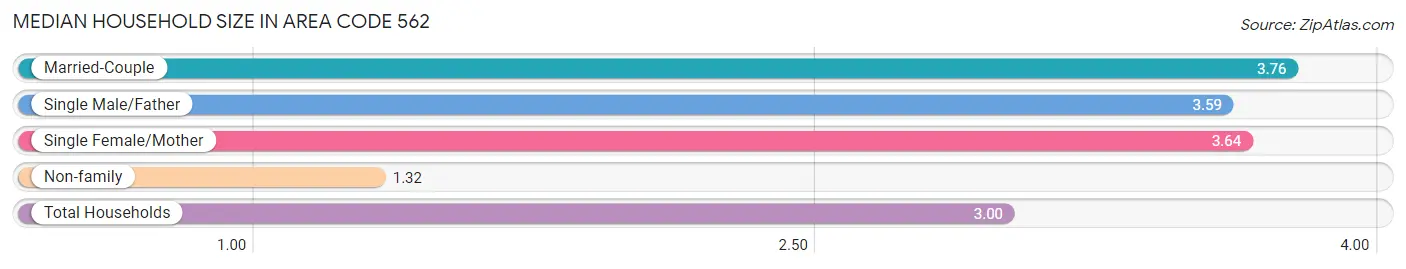
The median household size in Area Code 562 is 3.00 persons per household, with married-couple households (341,019 | 44.3%) accounting for the largest median household size of 3.76254 persons per household. non-family households (248,492 | 32.3%) represent the smallest median household size with 1.32 persons per household.
| Household Type | # Households | Household Size |
| Married-Couple | 341,019 (44.3%) | 3.76 |
| Single Male/Father | 60,186 (7.8%) | 3.59 |
| Single Female/Mother | 120,611 (15.7%) | 3.64 |
| Non-family | 248,492 (32.3%) | 1.32 |
| Total Households | 770,308 (100.0%) | 3.00 |
Household Size by Marriage Status in Area Code 562
Out of a total of 770,308 households in Area Code 562, 521,816 (67.7%) are family households, while 248,492 (32.3%) are nonfamily households. The most numerous type of family households are 2-person households, comprising 159,280, and the most common type of nonfamily households are 1-person households, comprising 192,110.
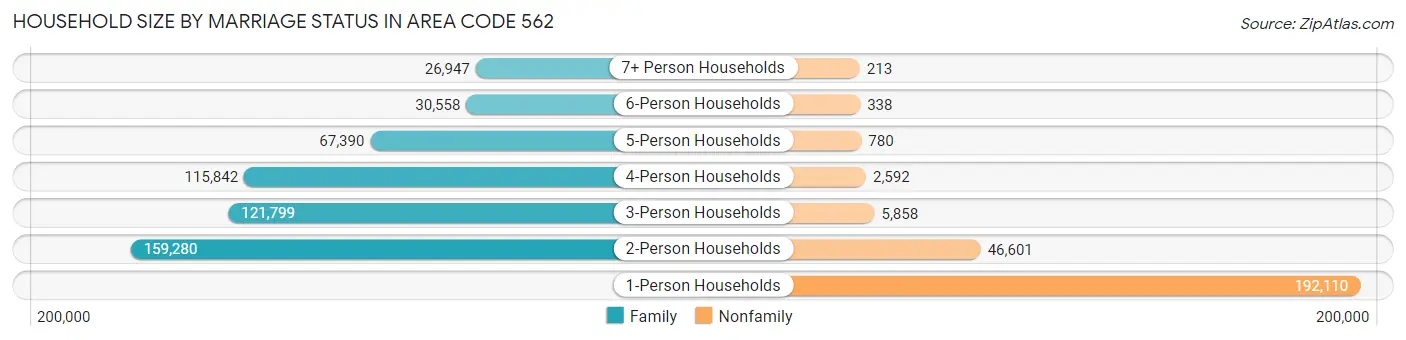
| Household Size | Family Households | Nonfamily Households |
| 1-Person Households | - | 192,110 (24.9%) |
| 2-Person Households | 159,280 (20.7%) | 46,601 (6.0%) |
| 3-Person Households | 121,799 (15.8%) | 5,858 (0.8%) |
| 4-Person Households | 115,842 (15.0%) | 2,592 (0.3%) |
| 5-Person Households | 67,390 (8.7%) | 780 (0.1%) |
| 6-Person Households | 30,558 (4.0%) | 338 (0.0%) |
| 7+ Person Households | 26,947 (3.5%) | 213 (0.0%) |
| Total | 521,816 (67.7%) | 248,492 (32.3%) |
Female Fertility in Area Code 562
Fertility by Age in Area Code 562
Average fertility rate in Area Code 562 is 43.2 births per 1,000 women. Women in the age bracket of 20 to 34 years have the highest fertility rate with 59.9 births per 1,000 women. Women in the age bracket of 20 to 34 years acount for 63.4% of all women with births.
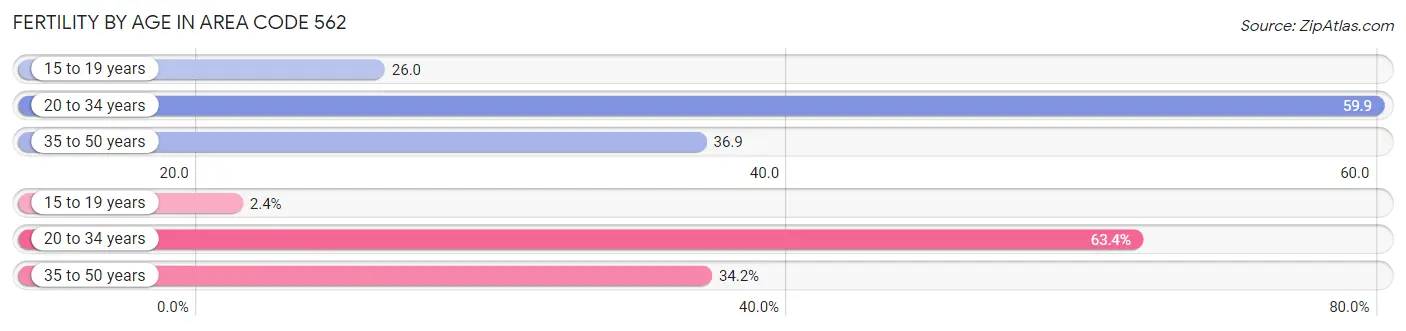
| Age Bracket | Women with Births | Births / 1,000 Women |
| 15 to 19 years | 640 (2.4%) | 26.0 |
| 20 to 34 years | 17,195 (63.4%) | 59.9 |
| 35 to 50 years | 9,268 (34.2%) | 36.9 |
| Total | 27,103 (100.0%) | 43.2 |
Fertility by Age by Marriage Status in Area Code 562
65.8% of women with births (27,103) in Area Code 562 are married. The highest percentage of unmarried women with births falls into 15 to 19 years age bracket with 100.0% of them unmarried at the time of birth, while the lowest percentage of unmarried women with births belong to 35 to 50 years age bracket with 27.8% of them unmarried.
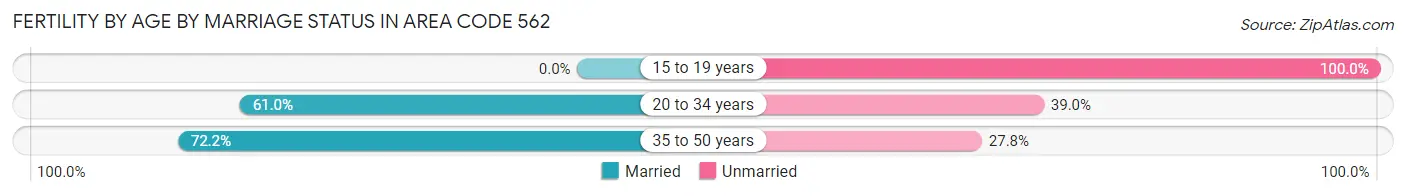
| Age Bracket | Married | Unmarried |
| 15 to 19 years | 0 (0.0%) | 640 (100.0%) |
| 20 to 34 years | 10,490 (61.0%) | 6,705 (39.0%) |
| 35 to 50 years | 6,695 (72.2%) | 2,573 (27.8%) |
| Total | 17,842 (65.8%) | 9,261 (34.2%) |
Fertility by Education in Area Code 562
Average fertility rate in Area Code 562 is 43.2 births per 1,000 women. Women with the education attainment of graduate degree have the highest fertility rate of 67.6 births per 1,000 women, while women with the education attainment of less than high school have the lowest fertility at 33.1 births per 1,000 women. Women with the education attainment of college or associate's degree represent 31.1% of all women with births.
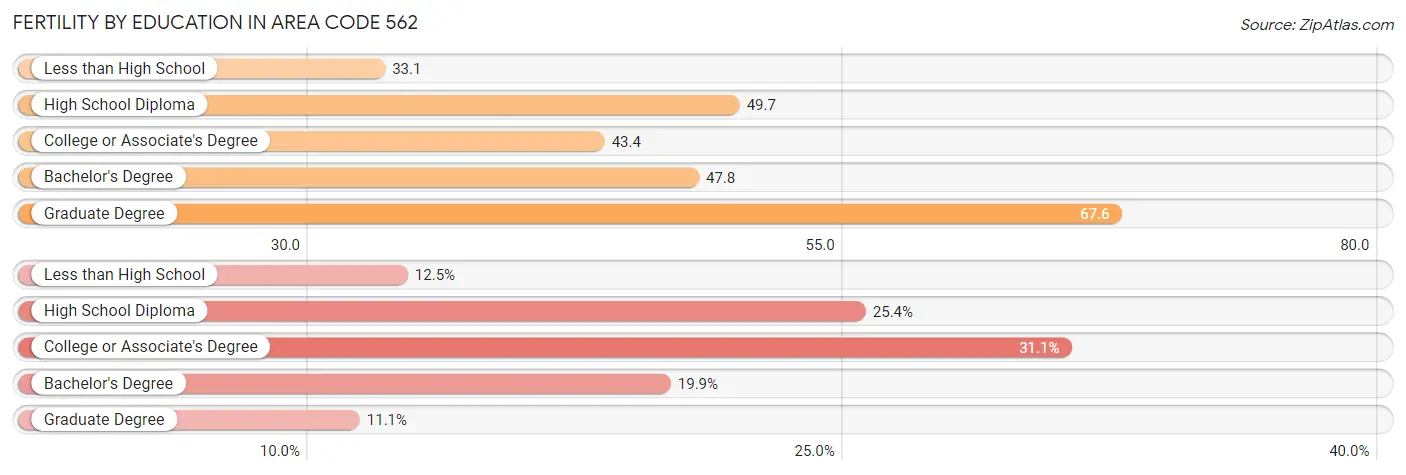
| Educational Attainment | Women with Births | Births / 1,000 Women |
| Less than High School | 3,384 (12.5%) | 33.1 |
| High School Diploma | 6,874 (25.4%) | 49.7 |
| College or Associate's Degree | 8,437 (31.1%) | 43.4 |
| Bachelor's Degree | 5,388 (19.9%) | 47.8 |
| Graduate Degree | 3,020 (11.1%) | 67.6 |
| Total | 27,103 (100.0%) | 43.2 |
Fertility by Education by Marriage Status in Area Code 562
34.2% of women with births in Area Code 562 are unmarried. Women with the educational attainment of bachelor's degree are most likely to be married with 58.2% of them married at childbirth, while women with the educational attainment of high school diploma are least likely to be married with 56.4% of them unmarried at childbirth.
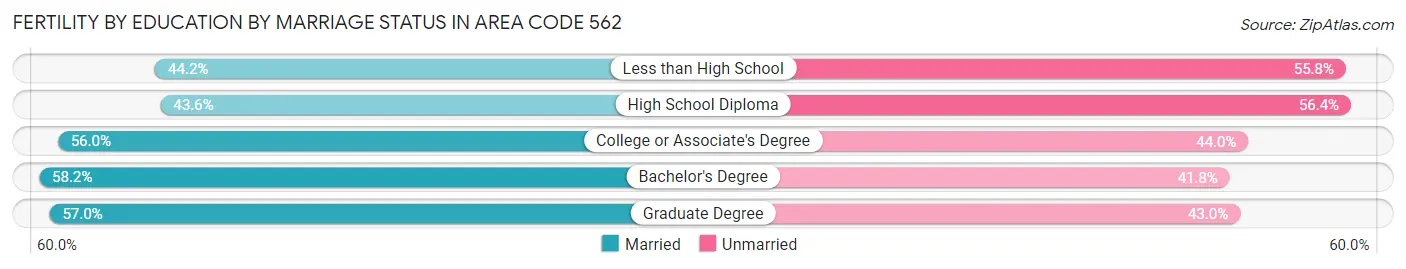
| Educational Attainment | Married | Unmarried |
| Less than High School | 1,496 (44.2%) | 1,888 (55.8%) |
| High School Diploma | 2,996 (43.6%) | 3,878 (56.4%) |
| College or Associate's Degree | 4,724 (56.0%) | 3,713 (44.0%) |
| Bachelor's Degree | 3,138 (58.2%) | 2,250 (41.8%) |
| Graduate Degree | 1,721 (57.0%) | 1,299 (43.0%) |
| Total | 17,842 (65.8%) | 9,261 (34.2%) |
Employment Characteristics in Area Code 562
Employment by Class of Employer in Area Code 562
Among the 1,134,474 employed individuals in Area Code 562, private company employees (793,606 | 70.0%), local government employees (97,714 | 8.6%), and self-employed (not incorporated) (77,880 | 6.9%) make up the most common classes of employment.
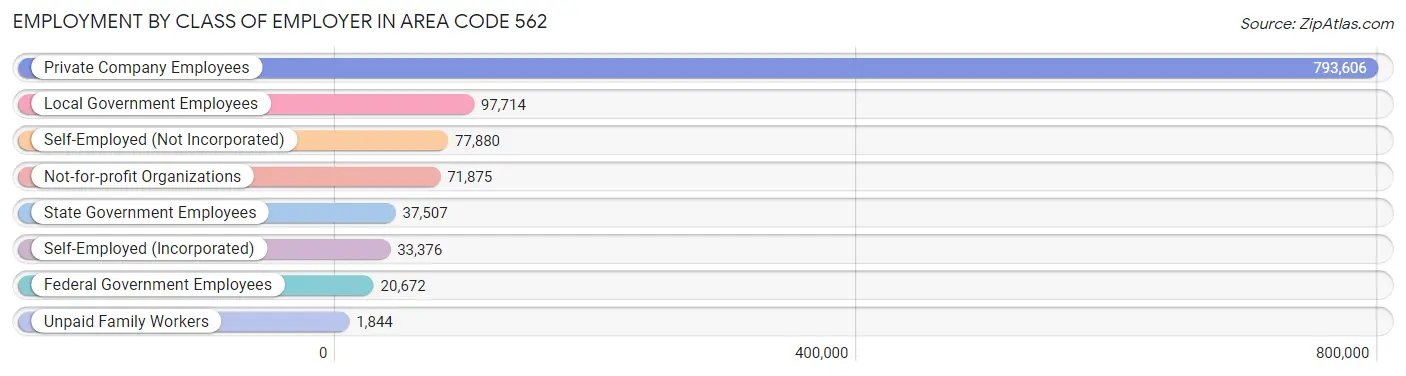
| Employer Class | # Employees | % Employees |
| Private Company Employees | 793,606 | 70.0% |
| Self-Employed (Incorporated) | 33,376 | 2.9% |
| Self-Employed (Not Incorporated) | 77,880 | 6.9% |
| Not-for-profit Organizations | 71,875 | 6.3% |
| Local Government Employees | 97,714 | 8.6% |
| State Government Employees | 37,507 | 3.3% |
| Federal Government Employees | 20,672 | 1.8% |
| Unpaid Family Workers | 1,844 | 0.2% |
| Total | 1,134,474 | 100.0% |
Employment Status by Age in Area Code 562
According to the labor force statistics for Area Code 562, out of the total population over 16 years of age (1,912,461), 64.2% or 1,227,417 individuals are in the labor force, with 7.0% or 86,533 of them unemployed. The age group with the highest labor force participation rate is 30 to 34 years, with 84.8% or 159,728 individuals in the labor force. Within the labor force, the 16 to 19 years age range has the highest percentage of unemployed individuals, with 1,115.8% or 413,248 of them being unemployed.
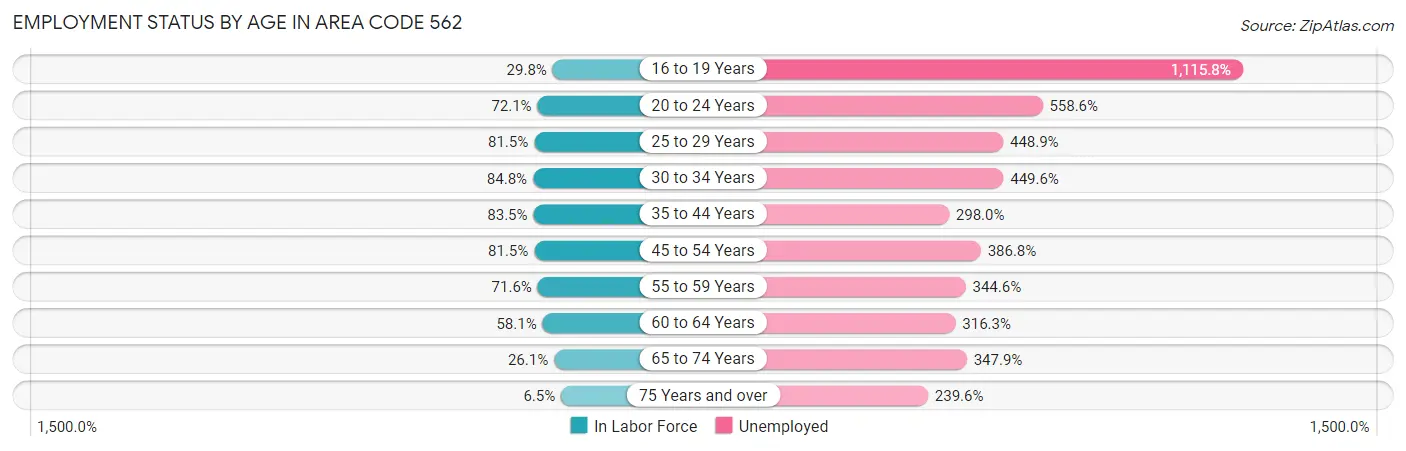
| Age Bracket | In Labor Force | Unemployed |
| 16 to 19 Years | 37,032 (29.7%) | 413,248 (1,115.8%) |
| 20 to 24 Years | 121,902 (72.1%) | 680,945 (558.6%) |
| 25 to 29 Years | 160,156 (81.5%) | 718,913 (448.9%) |
| 30 to 34 Years | 159,731 (84.8%) | 718,137 (449.6%) |
| 35 to 44 Years | 270,751 (83.5%) | 806,859 (298.0%) |
| 45 to 54 Years | 250,914 (81.5%) | 970,574 (386.8%) |
| 55 to 59 Years | 106,619 (71.6%) | 367,419 (344.6%) |
| 60 to 64 Years | 80,083 (58.1%) | 253,287 (316.3%) |
| 65 to 74 Years | 48,199 (26.1%) | 167,702 (347.9%) |
| 75 Years and over | 8,477 (6.5%) | 20,306 (239.6%) |
| Total | 1,227,486 (64.2%) | 86,543 (7.0%) |
Employment Status by Educational Attainment in Area Code 562
According to labor force statistics for Area Code 562, 77.7% of individuals (1,013,611) out of the total population between 25 and 64 years of age (1,304,015) are in the labor force, with 374.5% or 3,795,973 of them being unemployed. The group with the highest labor force participation rate are those with the educational attainment of bachelor's degree or higher, with 86.8% or 319,644 individuals in the labor force. Within the labor force, individuals with less than high school education have the highest percentage of unemployment, with 520.3% or 888,215 of them being unemployed.
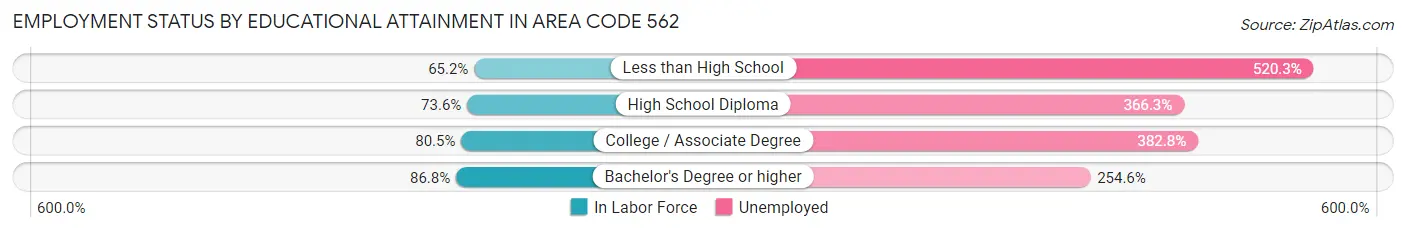
| Educational Attainment | In Labor Force | Unemployed |
| Less than High School | 170,725 (65.2%) | 1,362,707 (520.3%) |
| High School Diploma | 220,490 (73.6%) | 1,098,090 (366.3%) |
| College / Associate Degree | 301,154 (80.5%) | 1,431,634 (382.8%) |
| Bachelor's Degree or higher | 319,662 (86.8%) | 937,789 (254.6%) |
| Total | 1,013,562 (77.7%) | 4,883,536 (374.5%) |
Employment Occupations by Sex in Area Code 562
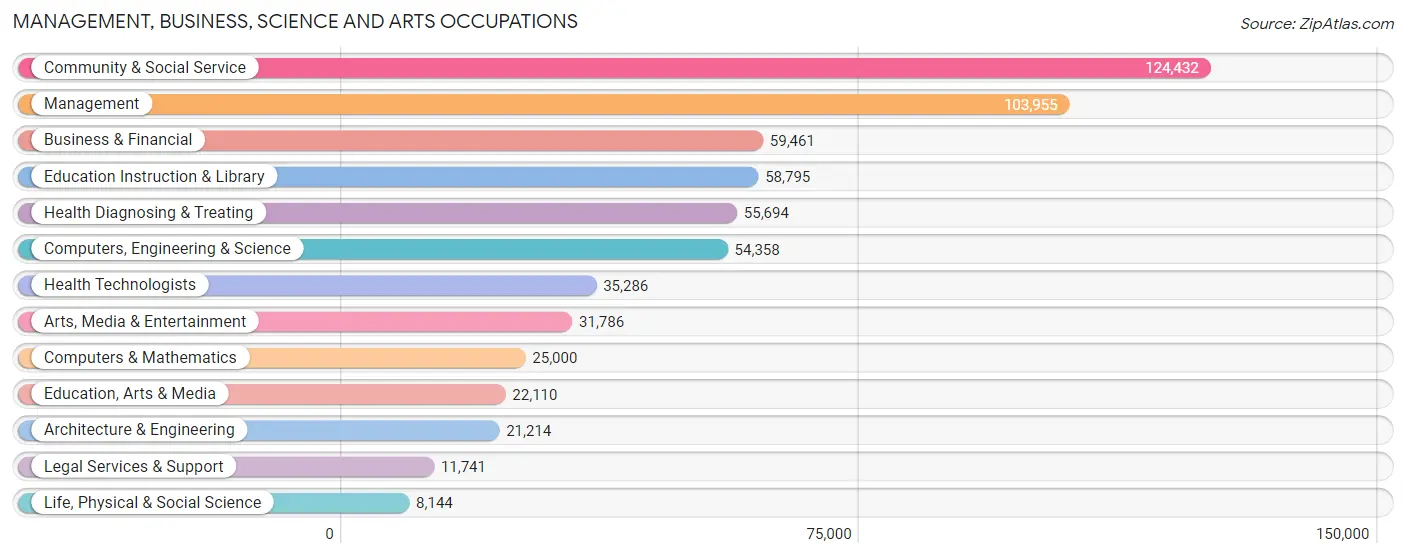
Management, Business, Science and Arts Occupations
The most common Management, Business, Science and Arts occupations in Area Code 562 are Community & Social Service (124,432 | 10.7%), Management (103,955 | 8.9%), Business & Financial (59,461 | 5.1%), Education Instruction & Library (58,795 | 5.1%), and Health Diagnosing & Treating (55,694 | 4.8%).
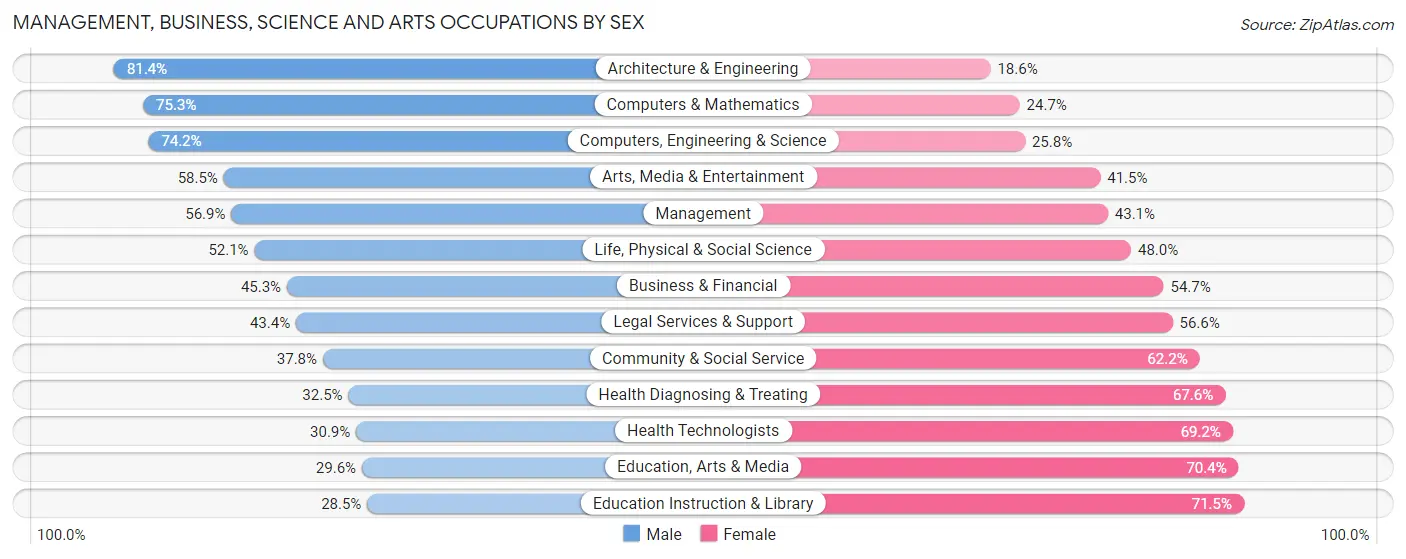
Management, Business, Science and Arts Occupations by Sex
Within the Management, Business, Science and Arts occupations in Area Code 562, the most male-oriented occupations are Architecture & Engineering (81.4%), Computers & Mathematics (75.3%), and Computers, Engineering & Science (74.2%), while the most female-oriented occupations are Education Instruction & Library (71.5%), Education, Arts & Media (70.4%), and Health Technologists (69.2%).
| Occupation | Male | Female |
| Management | 59,130 (56.9%) | 44,825 (43.1%) |
| Business & Financial | 26,920 (45.3%) | 32,541 (54.7%) |
| Computers, Engineering & Science | 40,319 (74.2%) | 14,039 (25.8%) |
| Computers & Mathematics | 18,819 (75.3%) | 6,181 (24.7%) |
| Architecture & Engineering | 17,261 (81.4%) | 3,953 (18.6%) |
| Life, Physical & Social Science | 4,239 (52.0%) | 3,905 (47.9%) |
| Community & Social Service | 47,006 (37.8%) | 77,426 (62.2%) |
| Education, Arts & Media | 6,554 (29.6%) | 15,556 (70.4%) |
| Legal Services & Support | 5,094 (43.4%) | 6,647 (56.6%) |
| Education Instruction & Library | 16,774 (28.5%) | 42,021 (71.5%) |
| Arts, Media & Entertainment | 18,584 (58.5%) | 13,202 (41.5%) |
| Health Diagnosing & Treating | 18,070 (32.5%) | 37,624 (67.5%) |
| Health Technologists | 10,884 (30.8%) | 24,402 (69.2%) |
| Total (Category) | 191,445 (48.1%) | 206,455 (51.9%) |
| Total (Overall) | 628,909 (54.0%) | 535,537 (46.0%) |
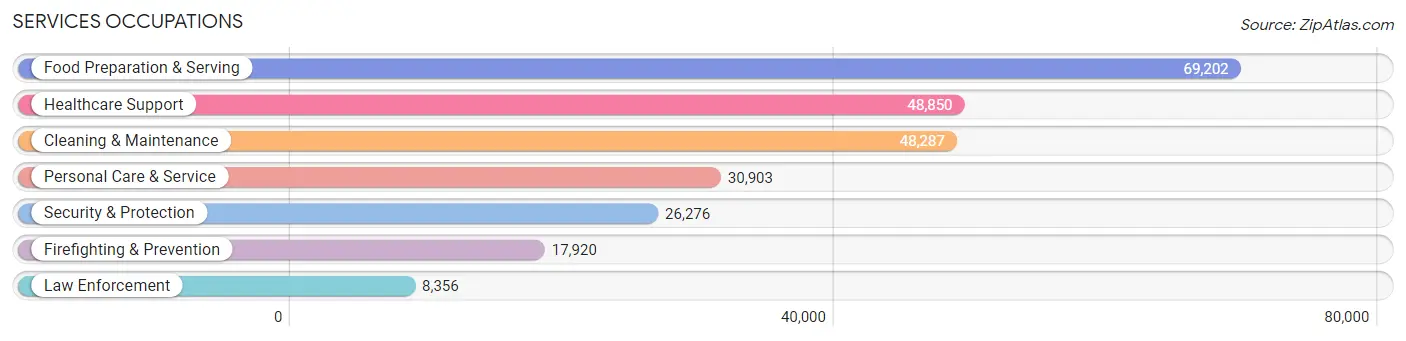
Services Occupations
The most common Services occupations in Area Code 562 are Food Preparation & Serving (69,202 | 5.9%), Healthcare Support (48,850 | 4.2%), Cleaning & Maintenance (48,287 | 4.2%), Personal Care & Service (30,903 | 2.6%), and Security & Protection (26,276 | 2.3%).
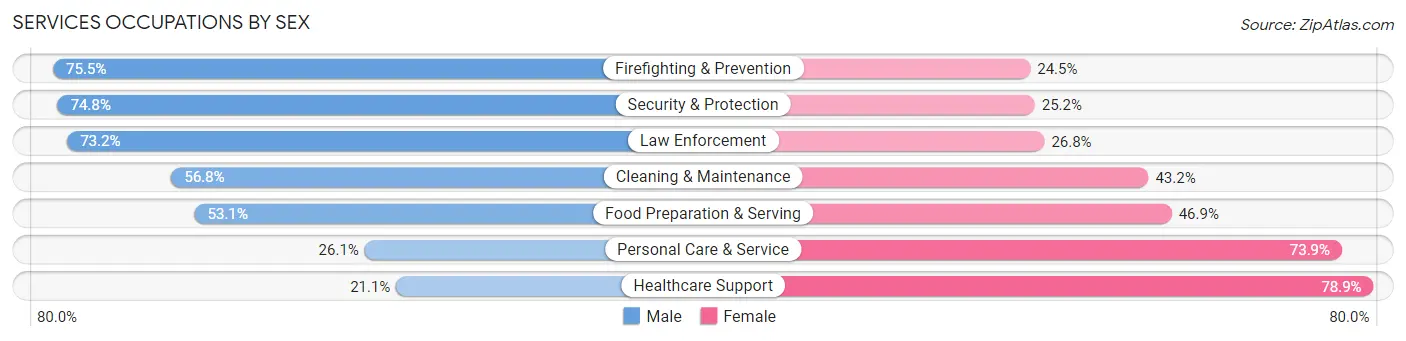
Services Occupations by Sex
Within the Services occupations in Area Code 562, the most male-oriented occupations are Firefighting & Prevention (75.5%), Security & Protection (74.8%), and Law Enforcement (73.2%), while the most female-oriented occupations are Healthcare Support (78.9%), Personal Care & Service (73.9%), and Food Preparation & Serving (46.9%).
| Occupation | Male | Female |
| Healthcare Support | 10,321 (21.1%) | 38,529 (78.9%) |
| Security & Protection | 19,646 (74.8%) | 6,630 (25.2%) |
| Firefighting & Prevention | 13,526 (75.5%) | 4,394 (24.5%) |
| Law Enforcement | 6,120 (73.2%) | 2,236 (26.8%) |
| Food Preparation & Serving | 36,729 (53.1%) | 32,473 (46.9%) |
| Cleaning & Maintenance | 27,409 (56.8%) | 20,878 (43.2%) |
| Personal Care & Service | 8,075 (26.1%) | 22,828 (73.9%) |
| Total (Category) | 102,180 (45.7%) | 121,338 (54.3%) |
| Total (Overall) | 628,909 (54.0%) | 535,537 (46.0%) |
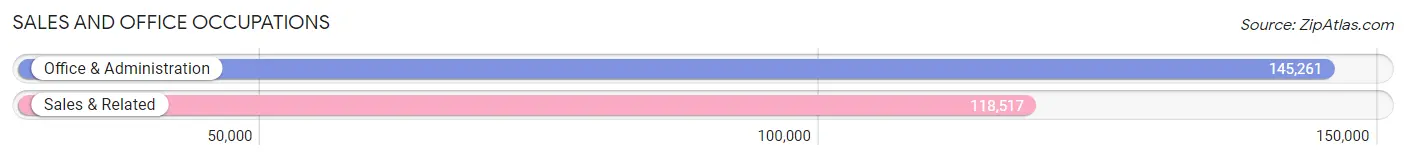
Sales and Office Occupations
The most common Sales and Office occupations in Area Code 562 are Office & Administration (145,261 | 12.5%), and Sales & Related (118,517 | 10.2%).
Sales and Office Occupations by Sex
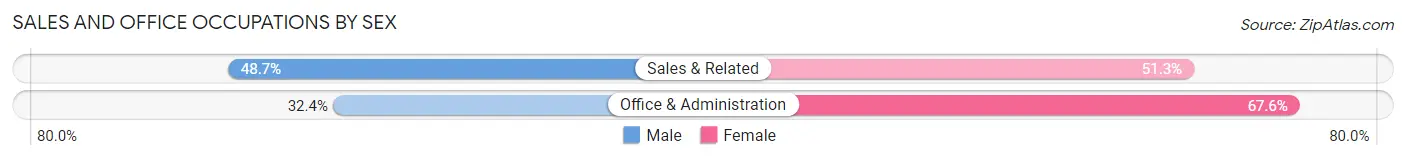
| Occupation | Male | Female |
| Sales & Related | 57,738 (48.7%) | 60,779 (51.3%) |
| Office & Administration | 47,124 (32.4%) | 98,137 (67.6%) |
| Total (Category) | 104,862 (39.8%) | 158,916 (60.3%) |
| Total (Overall) | 628,909 (54.0%) | 535,537 (46.0%) |
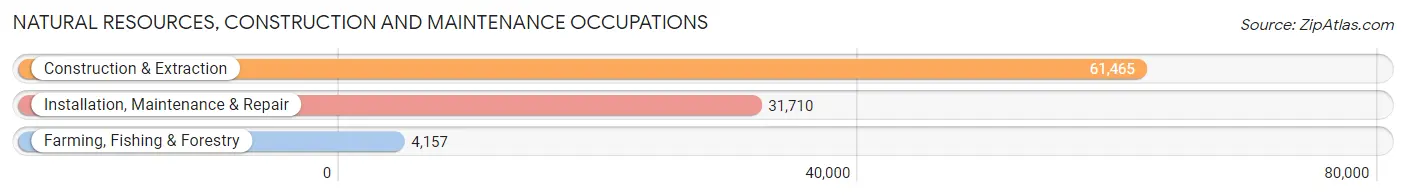
Natural Resources, Construction and Maintenance Occupations
The most common Natural Resources, Construction and Maintenance occupations in Area Code 562 are Construction & Extraction (61,465 | 5.3%), Installation, Maintenance & Repair (31,710 | 2.7%), and Farming, Fishing & Forestry (4,157 | 0.4%).
Natural Resources, Construction and Maintenance Occupations by Sex
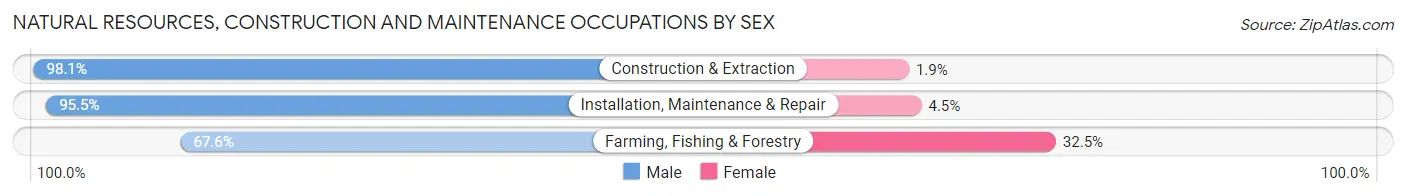
| Occupation | Male | Female |
| Farming, Fishing & Forestry | 2,808 (67.5%) | 1,349 (32.5%) |
| Construction & Extraction | 60,308 (98.1%) | 1,157 (1.9%) |
| Installation, Maintenance & Repair | 30,284 (95.5%) | 1,426 (4.5%) |
| Total (Category) | 93,400 (96.0%) | 3,932 (4.0%) |
| Total (Overall) | 628,909 (54.0%) | 535,537 (46.0%) |
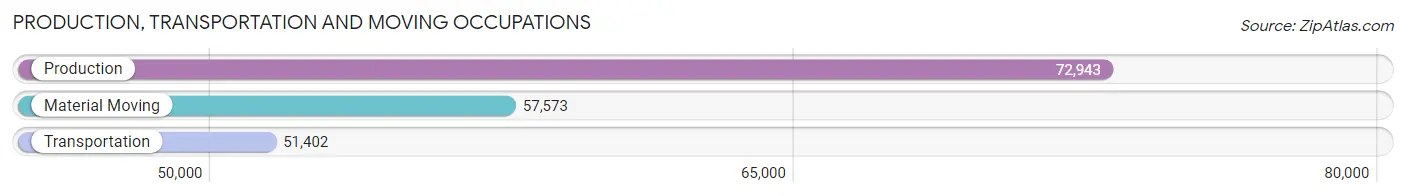
Production, Transportation and Moving Occupations
The most common Production, Transportation and Moving occupations in Area Code 562 are Production (72,943 | 6.3%), Material Moving (57,573 | 4.9%), and Transportation (51,402 | 4.4%).
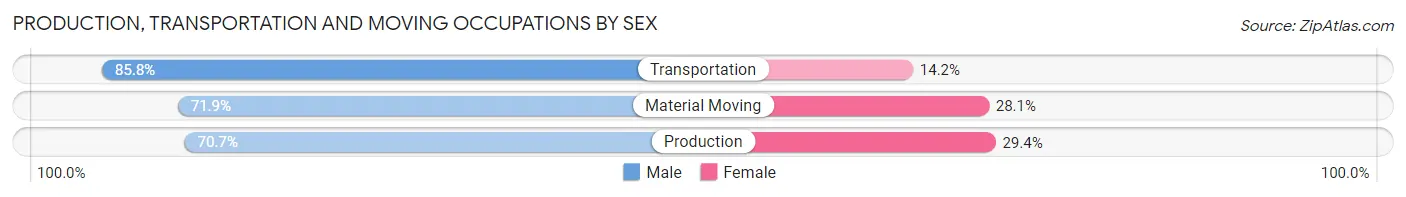
Production, Transportation and Moving Occupations by Sex
| Occupation | Male | Female |
| Production | 51,535 (70.7%) | 21,408 (29.3%) |
| Transportation | 44,106 (85.8%) | 7,296 (14.2%) |
| Material Moving | 41,381 (71.9%) | 16,192 (28.1%) |
| Total (Category) | 137,022 (75.3%) | 44,896 (24.7%) |
| Total (Overall) | 628,909 (54.0%) | 535,537 (46.0%) |
Employment Industries by Sex in Area Code 562
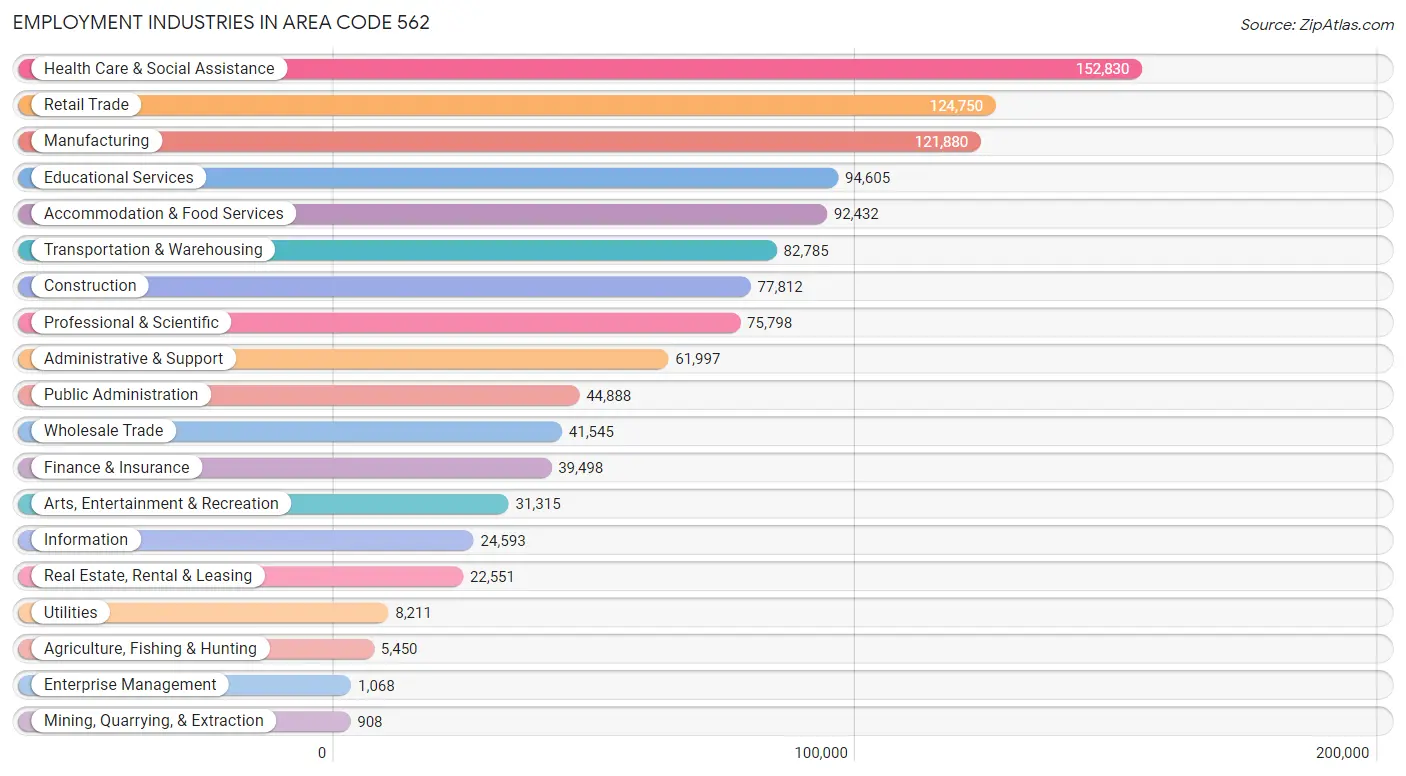
Employment Industries in Area Code 562
The major employment industries in Area Code 562 include Health Care & Social Assistance (152,830 | 13.1%), Retail Trade (124,750 | 10.7%), Manufacturing (121,880 | 10.5%), Educational Services (94,605 | 8.1%), and Accommodation & Food Services (92,432 | 7.9%).
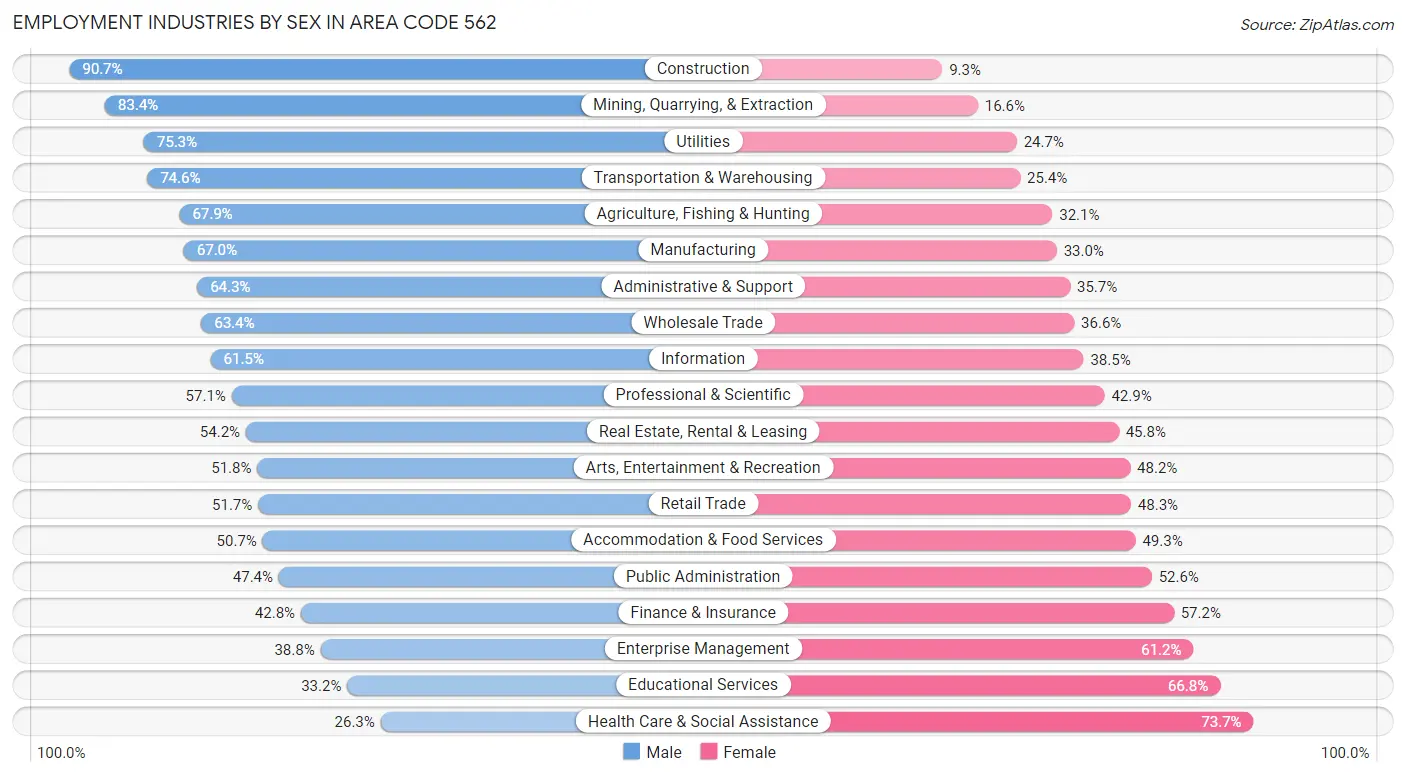
Employment Industries by Sex in Area Code 562
The Area Code 562 industries that see more men than women are Construction (90.7%), Mining, Quarrying, & Extraction (83.4%), and Utilities (75.3%), whereas the industries that tend to have a higher number of women are Health Care & Social Assistance (73.7%), Educational Services (66.8%), and Enterprise Management (61.2%).
| Industry | Male | Female |
| Agriculture, Fishing & Hunting | 3,703 (67.9%) | 1,747 (32.1%) |
| Mining, Quarrying, & Extraction | 757 (83.4%) | 151 (16.6%) |
| Construction | 70,602 (90.7%) | 7,210 (9.3%) |
| Manufacturing | 81,694 (67.0%) | 40,186 (33.0%) |
| Wholesale Trade | 26,346 (63.4%) | 15,199 (36.6%) |
| Retail Trade | 64,458 (51.7%) | 60,292 (48.3%) |
| Transportation & Warehousing | 61,767 (74.6%) | 21,018 (25.4%) |
| Utilities | 6,184 (75.3%) | 2,027 (24.7%) |
| Information | 15,122 (61.5%) | 9,471 (38.5%) |
| Finance & Insurance | 16,908 (42.8%) | 22,590 (57.2%) |
| Real Estate, Rental & Leasing | 12,221 (54.2%) | 10,330 (45.8%) |
| Professional & Scientific | 43,310 (57.1%) | 32,488 (42.9%) |
| Enterprise Management | 414 (38.8%) | 654 (61.2%) |
| Administrative & Support | 39,843 (64.3%) | 22,154 (35.7%) |
| Educational Services | 31,432 (33.2%) | 63,173 (66.8%) |
| Health Care & Social Assistance | 40,211 (26.3%) | 112,619 (73.7%) |
| Arts, Entertainment & Recreation | 16,229 (51.8%) | 15,086 (48.2%) |
| Accommodation & Food Services | 46,877 (50.7%) | 45,555 (49.3%) |
| Public Administration | 21,263 (47.4%) | 23,625 (52.6%) |
| Total | 628,909 (54.0%) | 535,537 (46.0%) |
Education in Area Code 562
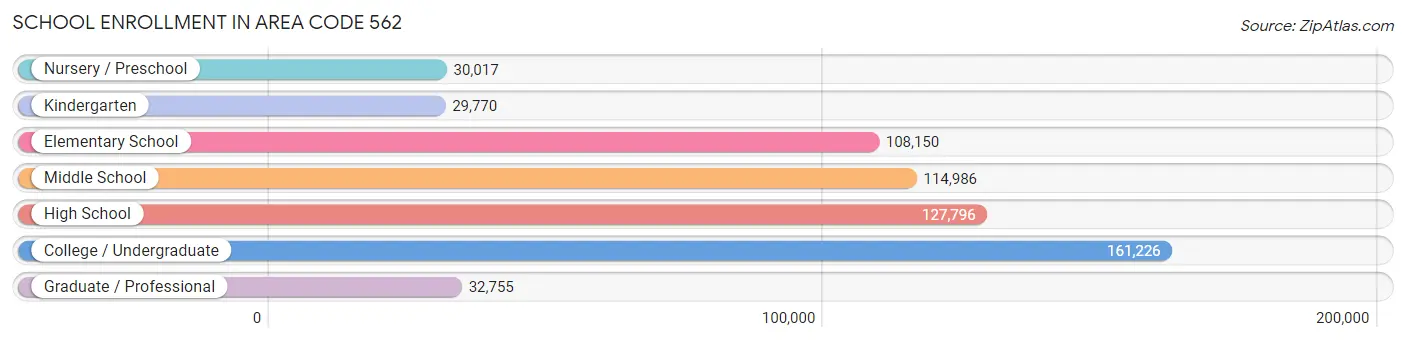
School Enrollment in Area Code 562
The most common levels of schooling among the 604,700 students in Area Code 562 are college / undergraduate (161,226 | 26.7%), high school (127,796 | 21.1%), and middle school (114,986 | 19.0%).
| School Level | # Students | % Students |
| Nursery / Preschool | 30,017 | 5.0% |
| Kindergarten | 29,770 | 4.9% |
| Elementary School | 108,150 | 17.9% |
| Middle School | 114,986 | 19.0% |
| High School | 127,796 | 21.1% |
| College / Undergraduate | 161,226 | 26.7% |
| Graduate / Professional | 32,755 | 5.4% |
| Total | 604,700 | 100.0% |
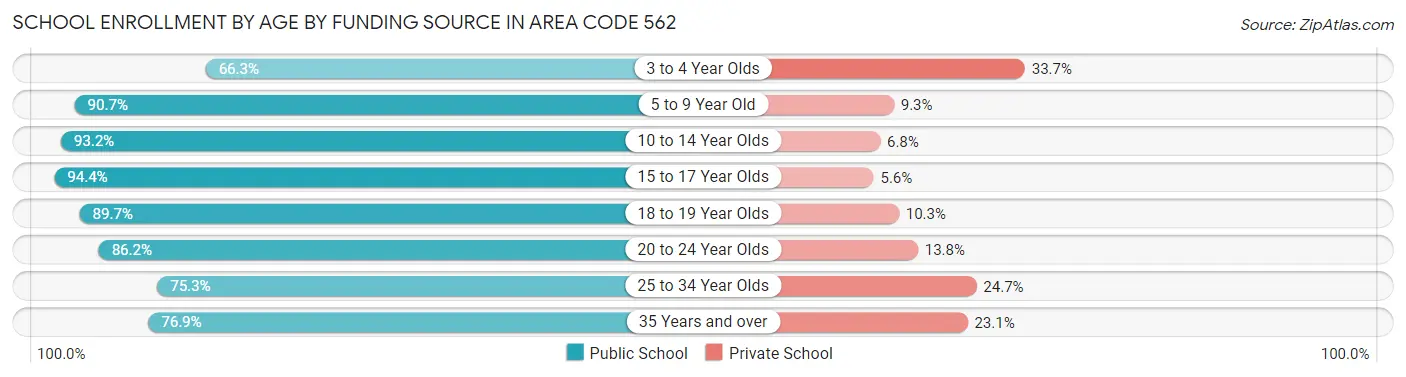
School Enrollment by Age by Funding Source in Area Code 562
Out of a total of 604,700 students who are enrolled in schools in Area Code 562, 72,671 (12.0%) attend a private institution, while the remaining 532,029 (88.0%) are enrolled in public schools. The age group of 3 to 4 year olds has the highest likelihood of being enrolled in private schools, with 8,681 (33.7% in the age bracket) enrolled. Conversely, the age group of 15 to 17 year olds has the lowest likelihood of being enrolled in a private school, with 83,414 (94.4% in the age bracket) attending a public institution.
| Age Bracket | Public School | Private School |
| 3 to 4 Year Olds | 17,048 (66.3%) | 8,681 (33.7%) |
| 5 to 9 Year Old | 118,142 (90.7%) | 12,162 (9.3%) |
| 10 to 14 Year Olds | 137,406 (93.2%) | 9,974 (6.8%) |
| 15 to 17 Year Olds | 83,414 (94.4%) | 4,907 (5.6%) |
| 18 to 19 Year Olds | 42,703 (89.7%) | 4,880 (10.3%) |
| 20 to 24 Year Olds | 64,619 (86.2%) | 10,356 (13.8%) |
| 25 to 34 Year Olds | 40,562 (75.3%) | 13,322 (24.7%) |
| 35 Years and over | 28,101 (76.9%) | 8,423 (23.1%) |
| Total | 532,029 (88.0%) | 72,671 (12.0%) |
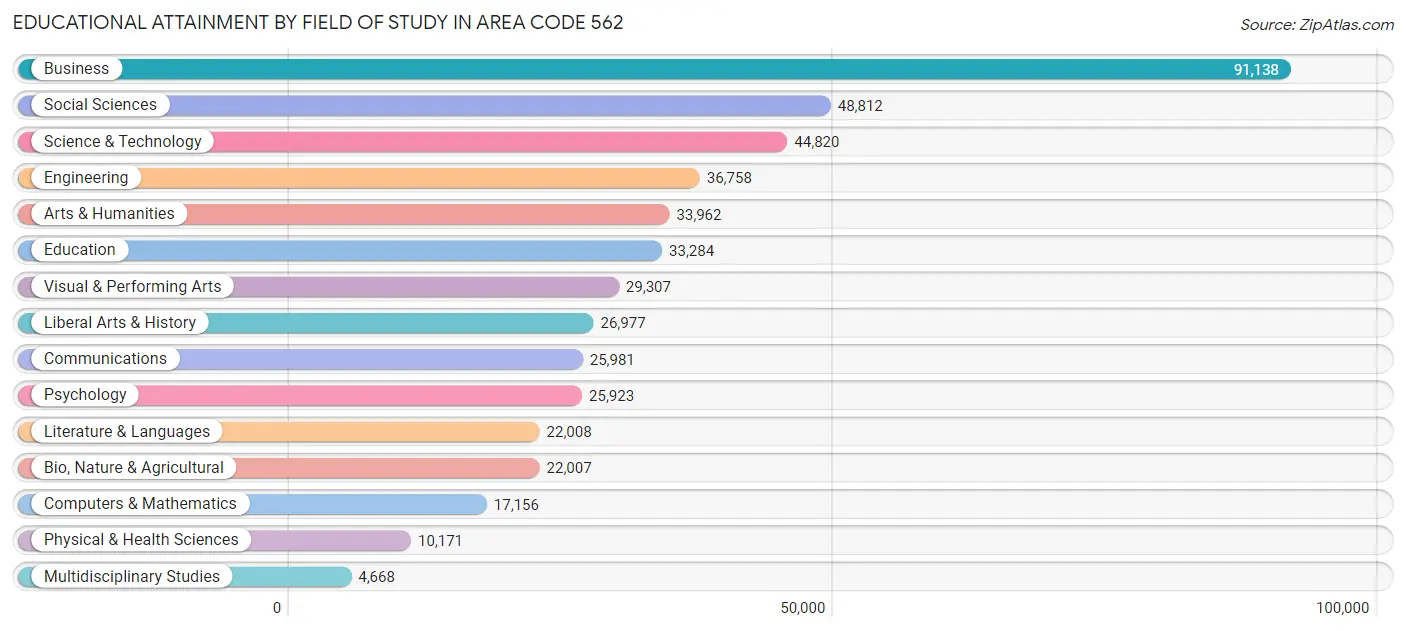
Educational Attainment by Field of Study in Area Code 562
Business (91,138 | 19.3%), social sciences (48,812 | 10.3%), science & technology (44,820 | 9.5%), engineering (36,758 | 7.8%), and arts & humanities (33,962 | 7.2%) are the most common fields of study among 472,972 individuals in Area Code 562 who have obtained a bachelor's degree or higher.
| Field of Study | # Graduates | % Graduates |
| Computers & Mathematics | 17,156 | 3.6% |
| Bio, Nature & Agricultural | 22,007 | 4.6% |
| Physical & Health Sciences | 10,171 | 2.1% |
| Psychology | 25,923 | 5.5% |
| Social Sciences | 48,812 | 10.3% |
| Engineering | 36,758 | 7.8% |
| Multidisciplinary Studies | 4,668 | 1.0% |
| Science & Technology | 44,820 | 9.5% |
| Business | 91,138 | 19.3% |
| Education | 33,284 | 7.0% |
| Literature & Languages | 22,008 | 4.6% |
| Liberal Arts & History | 26,977 | 5.7% |
| Visual & Performing Arts | 29,307 | 6.2% |
| Communications | 25,981 | 5.5% |
| Arts & Humanities | 33,962 | 7.2% |
| Total | 472,972 | 100.0% |
Transportation & Commute in Area Code 562
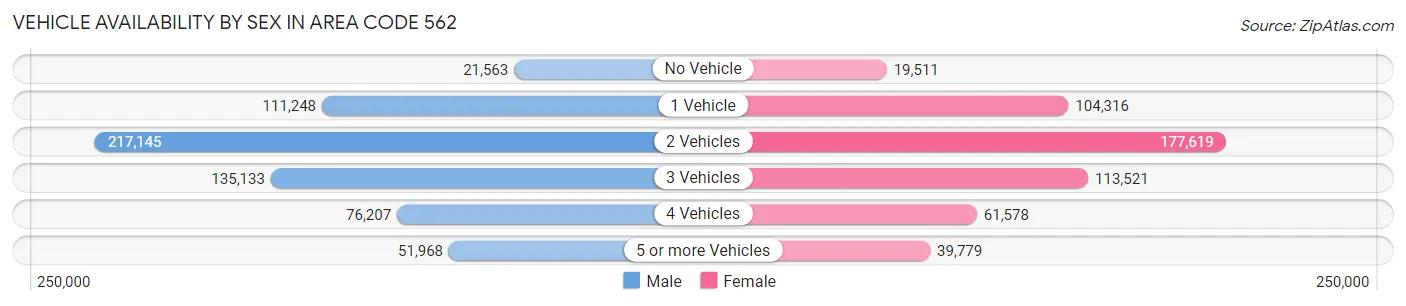
Vehicle Availability by Sex in Area Code 562
The most prevalent vehicle ownership categories in Area Code 562 are males with 2 vehicles (217,145, accounting for 35.4%) and females with 2 vehicles (177,619, making up 42.1%).
| Vehicles Available | Male | Female |
| No Vehicle | 21,563 (3.5%) | 19,511 (3.8%) |
| 1 Vehicle | 111,248 (18.1%) | 104,316 (20.2%) |
| 2 Vehicles | 217,145 (35.4%) | 177,619 (34.4%) |
| 3 Vehicles | 135,133 (22.0%) | 113,521 (22.0%) |
| 4 Vehicles | 76,207 (12.4%) | 61,578 (11.9%) |
| 5 or more Vehicles | 51,968 (8.5%) | 39,779 (7.7%) |
| Total | 613,264 (100.0%) | 516,324 (100.0%) |
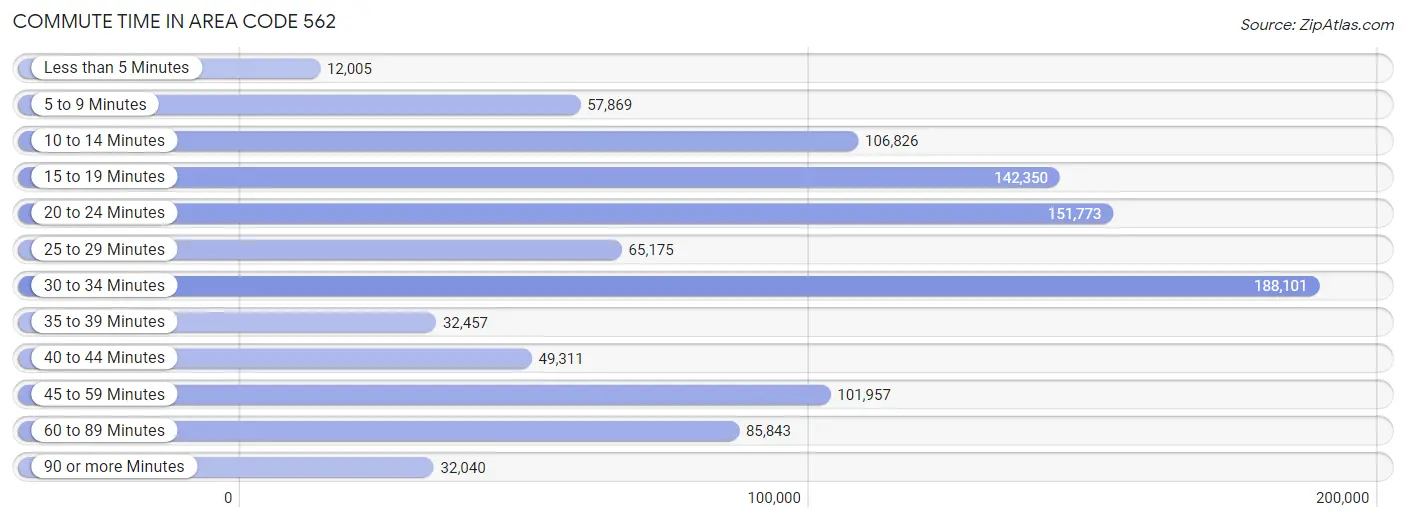
Commute Time in Area Code 562
The most frequently occuring commute durations in Area Code 562 are 30 to 34 minutes (188,101 commuters, 18.3%), 20 to 24 minutes (151,773 commuters, 14.8%), and 15 to 19 minutes (142,350 commuters, 13.9%).
| Commute Time | # Commuters | % Commuters |
| Less than 5 Minutes | 12,005 | 1.2% |
| 5 to 9 Minutes | 57,869 | 5.6% |
| 10 to 14 Minutes | 106,826 | 10.4% |
| 15 to 19 Minutes | 142,350 | 13.9% |
| 20 to 24 Minutes | 151,773 | 14.8% |
| 25 to 29 Minutes | 65,175 | 6.4% |
| 30 to 34 Minutes | 188,101 | 18.3% |
| 35 to 39 Minutes | 32,457 | 3.2% |
| 40 to 44 Minutes | 49,311 | 4.8% |
| 45 to 59 Minutes | 101,957 | 9.9% |
| 60 to 89 Minutes | 85,843 | 8.4% |
| 90 or more Minutes | 32,040 | 3.1% |
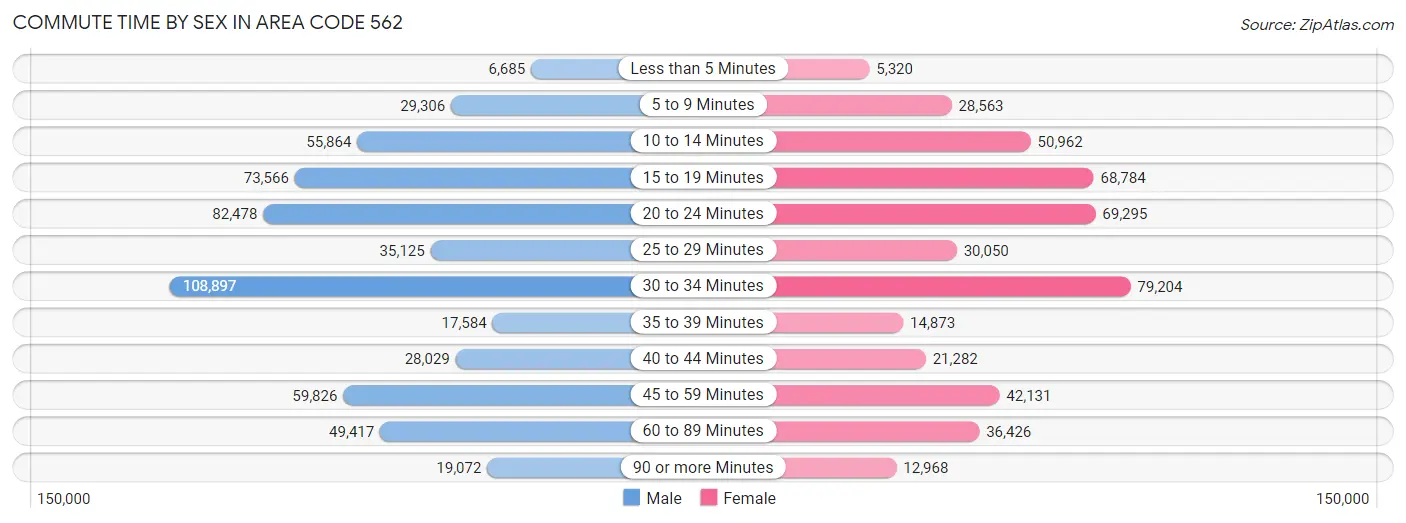
Commute Time by Sex in Area Code 562
The most common commute times in Area Code 562 are 30 to 34 minutes (108,897 commuters, 19.2%) for males and 30 to 34 minutes (79,204 commuters, 17.2%) for females.
| Commute Time | Male | Female |
| Less than 5 Minutes | 6,685 (1.2%) | 5,320 (1.2%) |
| 5 to 9 Minutes | 29,306 (5.2%) | 28,563 (6.2%) |
| 10 to 14 Minutes | 55,864 (9.9%) | 50,962 (11.1%) |
| 15 to 19 Minutes | 73,566 (13.0%) | 68,784 (15.0%) |
| 20 to 24 Minutes | 82,478 (14.6%) | 69,295 (15.1%) |
| 25 to 29 Minutes | 35,125 (6.2%) | 30,050 (6.5%) |
| 30 to 34 Minutes | 108,897 (19.2%) | 79,204 (17.2%) |
| 35 to 39 Minutes | 17,584 (3.1%) | 14,873 (3.2%) |
| 40 to 44 Minutes | 28,029 (5.0%) | 21,282 (4.6%) |
| 45 to 59 Minutes | 59,826 (10.6%) | 42,131 (9.2%) |
| 60 to 89 Minutes | 49,417 (8.7%) | 36,426 (7.9%) |
| 90 or more Minutes | 19,072 (3.4%) | 12,968 (2.8%) |
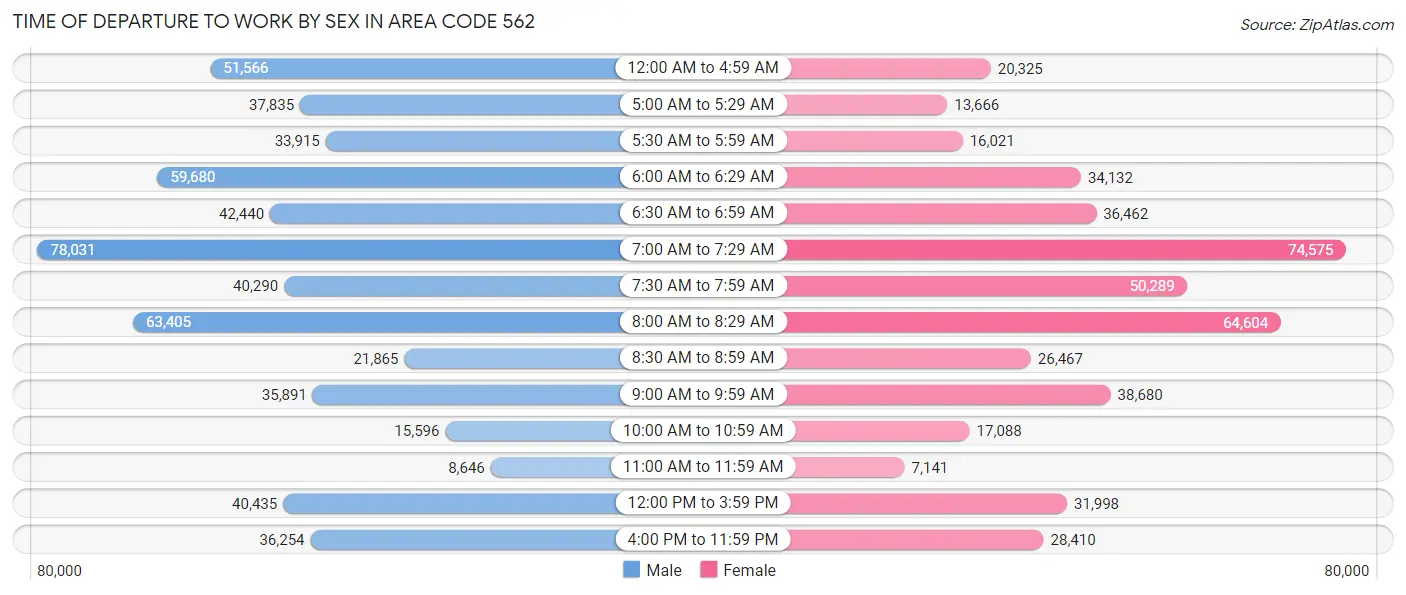
Time of Departure to Work by Sex in Area Code 562
The most frequent times of departure to work in Area Code 562 are 7:00 AM to 7:29 AM (78,031, 13.8%) for males and 7:00 AM to 7:29 AM (74,575, 16.2%) for females.
| Time of Departure | Male | Female |
| 12:00 AM to 4:59 AM | 51,566 (9.1%) | 20,325 (4.4%) |
| 5:00 AM to 5:29 AM | 37,835 (6.7%) | 13,666 (3.0%) |
| 5:30 AM to 5:59 AM | 33,915 (6.0%) | 16,021 (3.5%) |
| 6:00 AM to 6:29 AM | 59,680 (10.5%) | 34,132 (7.4%) |
| 6:30 AM to 6:59 AM | 42,440 (7.5%) | 36,462 (7.9%) |
| 7:00 AM to 7:29 AM | 78,031 (13.8%) | 74,575 (16.2%) |
| 7:30 AM to 7:59 AM | 40,290 (7.1%) | 50,289 (10.9%) |
| 8:00 AM to 8:29 AM | 63,405 (11.2%) | 64,604 (14.1%) |
| 8:30 AM to 8:59 AM | 21,865 (3.9%) | 26,467 (5.8%) |
| 9:00 AM to 9:59 AM | 35,891 (6.3%) | 38,680 (8.4%) |
| 10:00 AM to 10:59 AM | 15,596 (2.8%) | 17,088 (3.7%) |
| 11:00 AM to 11:59 AM | 8,646 (1.5%) | 7,141 (1.5%) |
| 12:00 PM to 3:59 PM | 40,435 (7.1%) | 31,998 (7.0%) |
| 4:00 PM to 11:59 PM | 36,254 (6.4%) | 28,410 (6.2%) |
| Total | 565,849 (100.0%) | 459,858 (100.0%) |
Housing Occupancy in Area Code 562
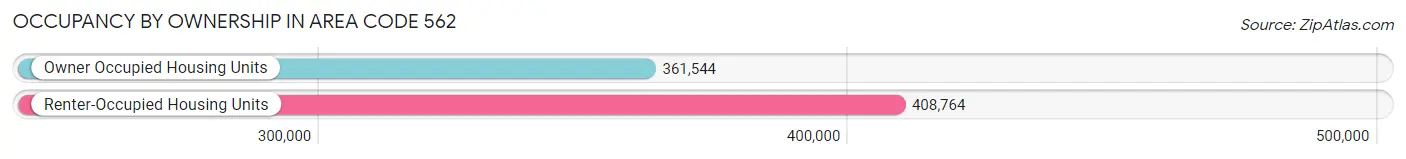
Occupancy by Ownership in Area Code 562
Of the total 770,308 dwellings in Area Code 562, owner-occupied units account for 361,544 (46.9%), while renter-occupied units make up 408,764 (53.1%).
| Occupancy | # Housing Units | % Housing Units |
| Owner Occupied Housing Units | 361,544 | 46.9% |
| Renter-Occupied Housing Units | 408,764 | 53.1% |
| Total Occupied Housing Units | 770,308 | 100.0% |
Occupancy by Household Size in Area Code 562
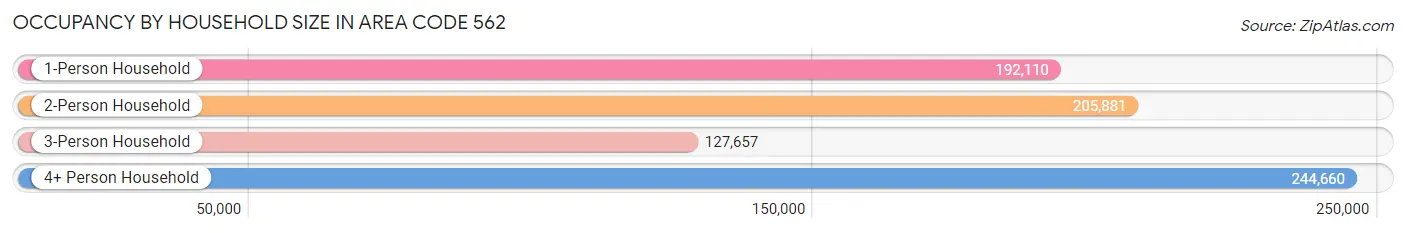
| Household Size | # Housing Units | % Housing Units |
| 1-Person Household | 192,110 | 24.9% |
| 2-Person Household | 205,881 | 26.7% |
| 3-Person Household | 127,657 | 16.6% |
| 4+ Person Household | 244,660 | 31.8% |
| Total Housing Units | 770,308 | 100.0% |
Occupancy by Ownership by Household Size in Area Code 562
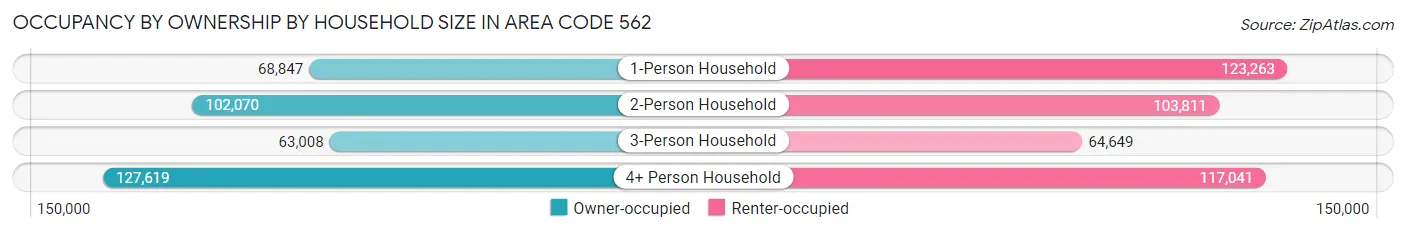
| Household Size | Owner-occupied | Renter-occupied |
| 1-Person Household | 68,847 (35.8%) | 123,263 (64.2%) |
| 2-Person Household | 102,070 (49.6%) | 103,811 (50.4%) |
| 3-Person Household | 63,008 (49.4%) | 64,649 (50.6%) |
| 4+ Person Household | 127,619 (52.2%) | 117,041 (47.8%) |
| Total Housing Units | 361,544 (46.9%) | 408,764 (53.1%) |
Occupancy by Educational Attainment in Area Code 562
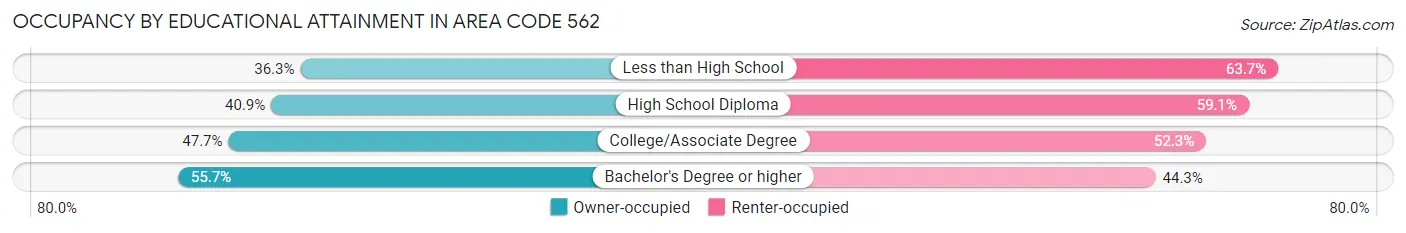
| Household Size | Owner-occupied | Renter-occupied |
| Less than High School | 49,939 (36.3%) | 87,730 (63.7%) |
| High School Diploma | 60,444 (40.9%) | 87,325 (59.1%) |
| College/Associate Degree | 112,140 (47.7%) | 123,072 (52.3%) |
| Bachelor's Degree or higher | 139,021 (55.7%) | 110,637 (44.3%) |
Occupancy by Age of Householder in Area Code 562
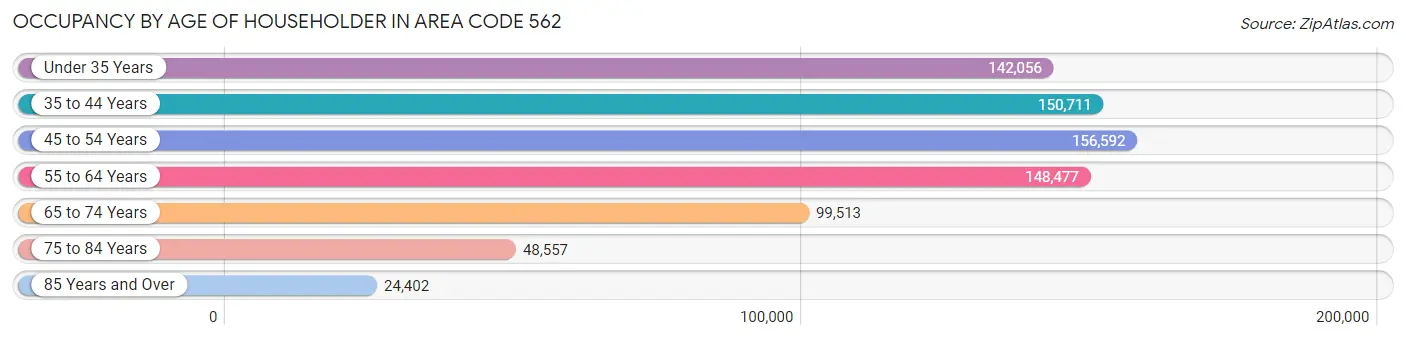
| Age Bracket | # Households | % Households |
| Under 35 Years | 142,056 | 18.4% |
| 35 to 44 Years | 150,711 | 19.6% |
| 45 to 54 Years | 156,592 | 20.3% |
| 55 to 64 Years | 148,477 | 19.3% |
| 65 to 74 Years | 99,513 | 12.9% |
| 75 to 84 Years | 48,557 | 6.3% |
| 85 Years and Over | 24,402 | 3.2% |
| Total | 770,308 | 100.0% |
Housing Finances in Area Code 562
Median Income by Occupancy in Area Code 562
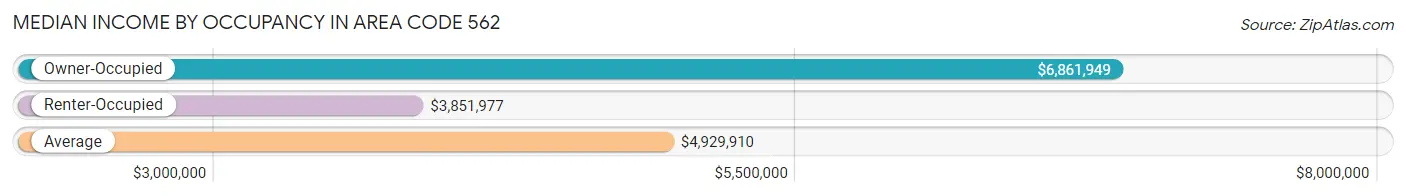
| Occupancy Type | # Households | Median Income |
| Owner-Occupied | 361,544 (46.9%) | $6,861,949 |
| Renter-Occupied | 408,764 (53.1%) | $3,851,977 |
| Average | 770,308 (100.0%) | $4,929,910 |
Occupancy by Householder Income Bracket in Area Code 562
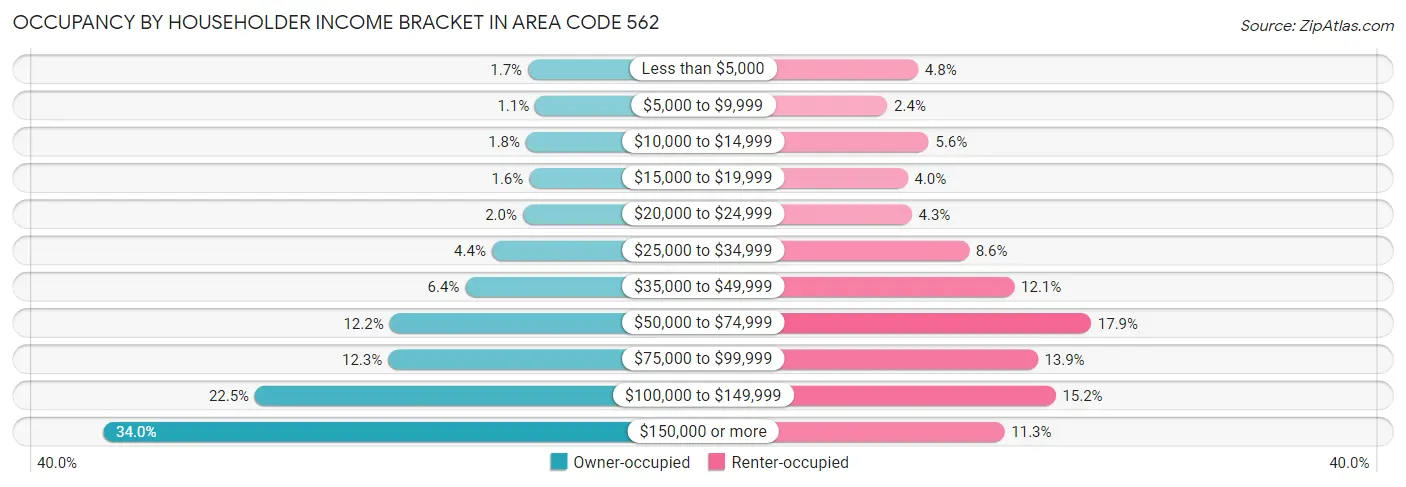
| Income Bracket | Owner-occupied | Renter-occupied |
| Less than $5,000 | 5,978 (1.7%) | 19,423 (4.8%) |
| $5,000 to $9,999 | 4,009 (1.1%) | 9,851 (2.4%) |
| $10,000 to $14,999 | 6,539 (1.8%) | 22,730 (5.6%) |
| $15,000 to $19,999 | 5,641 (1.6%) | 16,169 (4.0%) |
| $20,000 to $24,999 | 7,382 (2.0%) | 17,462 (4.3%) |
| $25,000 to $34,999 | 15,961 (4.4%) | 35,226 (8.6%) |
| $35,000 to $49,999 | 23,257 (6.4%) | 49,371 (12.1%) |
| $50,000 to $74,999 | 44,119 (12.2%) | 73,278 (17.9%) |
| $75,000 to $99,999 | 44,517 (12.3%) | 56,656 (13.9%) |
| $100,000 to $149,999 | 81,158 (22.5%) | 62,249 (15.2%) |
| $150,000 or more | 122,983 (34.0%) | 46,349 (11.3%) |
| Total | 361,544 (100.0%) | 408,764 (100.0%) |
Monthly Housing Cost Tiers in Area Code 562
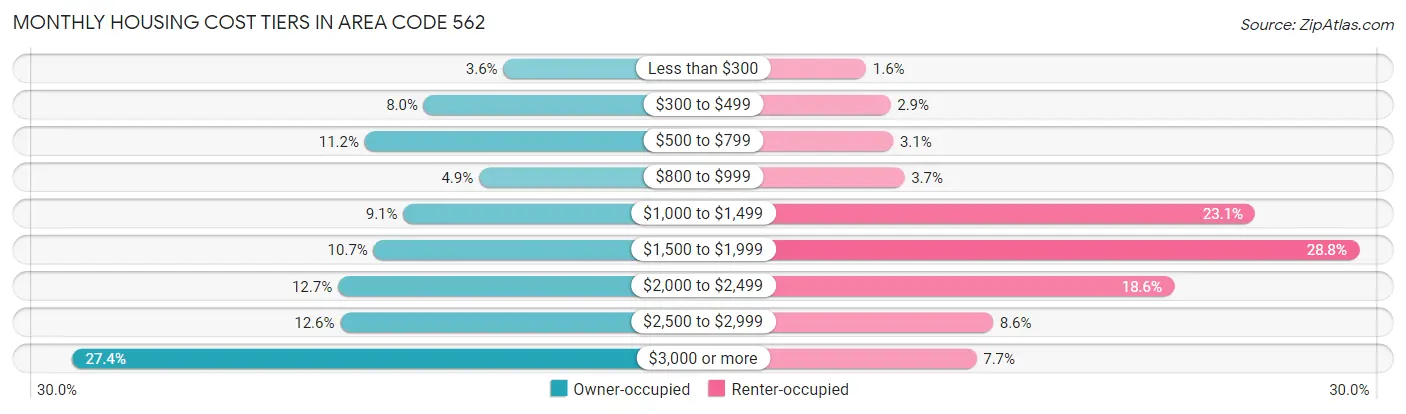
| Monthly Cost | Owner-occupied | Renter-occupied |
| Less than $300 | 12,834 (3.5%) | 6,398 (1.6%) |
| $300 to $499 | 28,744 (8.0%) | 11,916 (2.9%) |
| $500 to $799 | 40,515 (11.2%) | 12,541 (3.1%) |
| $800 to $999 | 17,720 (4.9%) | 15,093 (3.7%) |
| $1,000 to $1,499 | 32,837 (9.1%) | 94,266 (23.1%) |
| $1,500 to $1,999 | 38,764 (10.7%) | 117,737 (28.8%) |
| $2,000 to $2,499 | 45,869 (12.7%) | 75,964 (18.6%) |
| $2,500 to $2,999 | 45,395 (12.6%) | 35,072 (8.6%) |
| $3,000 or more | 98,866 (27.4%) | 31,361 (7.7%) |
| Total | 361,544 (100.0%) | 408,764 (100.0%) |
Physical Housing Characteristics in Area Code 562
Housing Structures in Area Code 562
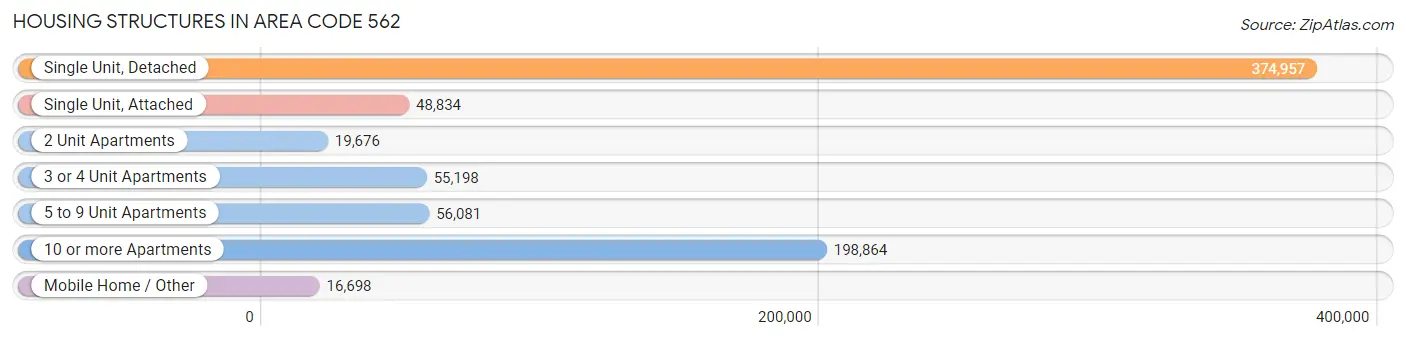
| Structure Type | # Housing Units | % Housing Units |
| Single Unit, Detached | 374,957 | 48.7% |
| Single Unit, Attached | 48,834 | 6.3% |
| 2 Unit Apartments | 19,676 | 2.5% |
| 3 or 4 Unit Apartments | 55,198 | 7.2% |
| 5 to 9 Unit Apartments | 56,081 | 7.3% |
| 10 or more Apartments | 198,864 | 25.8% |
| Mobile Home / Other | 16,698 | 2.2% |
| Total | 770,308 | 100.0% |
Housing Structures by Occupancy in Area Code 562
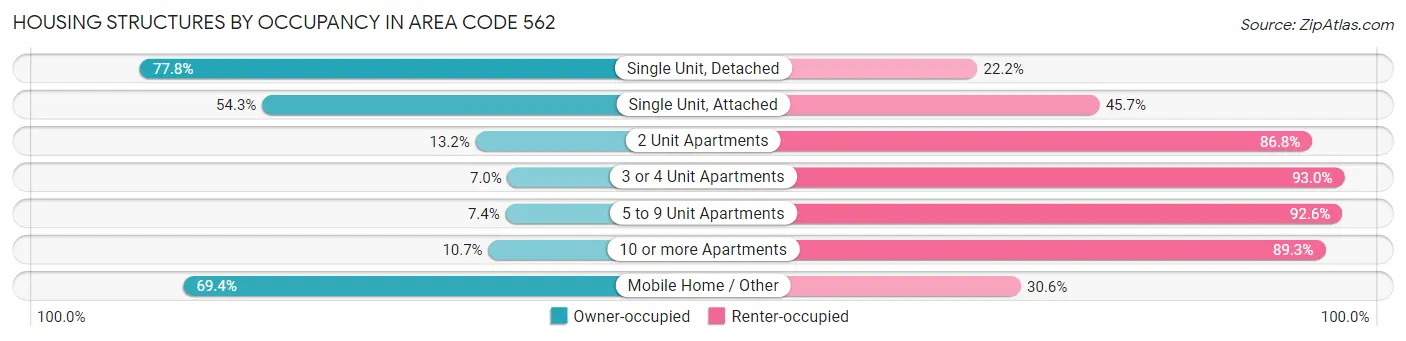
| Structure Type | Owner-occupied | Renter-occupied |
| Single Unit, Detached | 291,595 (77.8%) | 83,362 (22.2%) |
| Single Unit, Attached | 26,497 (54.3%) | 22,337 (45.7%) |
| 2 Unit Apartments | 2,593 (13.2%) | 17,083 (86.8%) |
| 3 or 4 Unit Apartments | 3,863 (7.0%) | 51,335 (93.0%) |
| 5 to 9 Unit Apartments | 4,148 (7.4%) | 51,933 (92.6%) |
| 10 or more Apartments | 21,259 (10.7%) | 177,605 (89.3%) |
| Mobile Home / Other | 11,589 (69.4%) | 5,109 (30.6%) |
| Total | 361,544 (46.9%) | 408,764 (53.1%) |
Housing Structures by Number of Rooms in Area Code 562
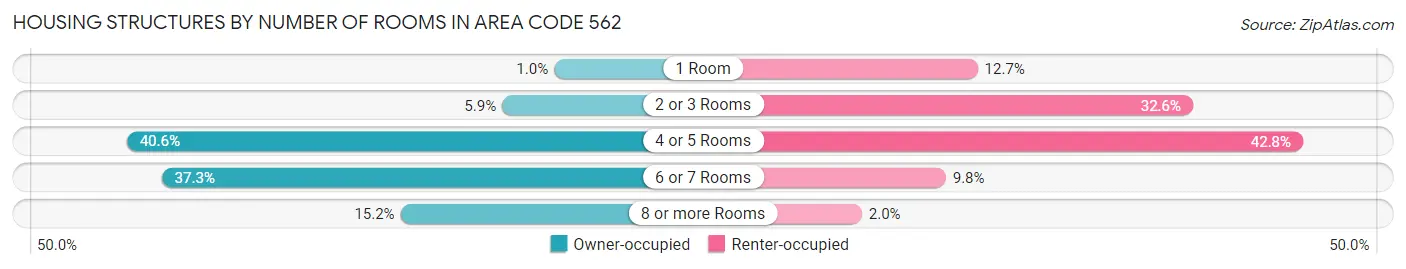
| Number of Rooms | Owner-occupied | Renter-occupied |
| 1 Room | 3,748 (1.0%) | 52,096 (12.7%) |
| 2 or 3 Rooms | 21,162 (5.9%) | 133,366 (32.6%) |
| 4 or 5 Rooms | 146,606 (40.6%) | 174,980 (42.8%) |
| 6 or 7 Rooms | 134,928 (37.3%) | 40,037 (9.8%) |
| 8 or more Rooms | 55,100 (15.2%) | 8,285 (2.0%) |
| Total | 361,544 (100.0%) | 408,764 (100.0%) |
Housing Structure by Heating Type in Area Code 562
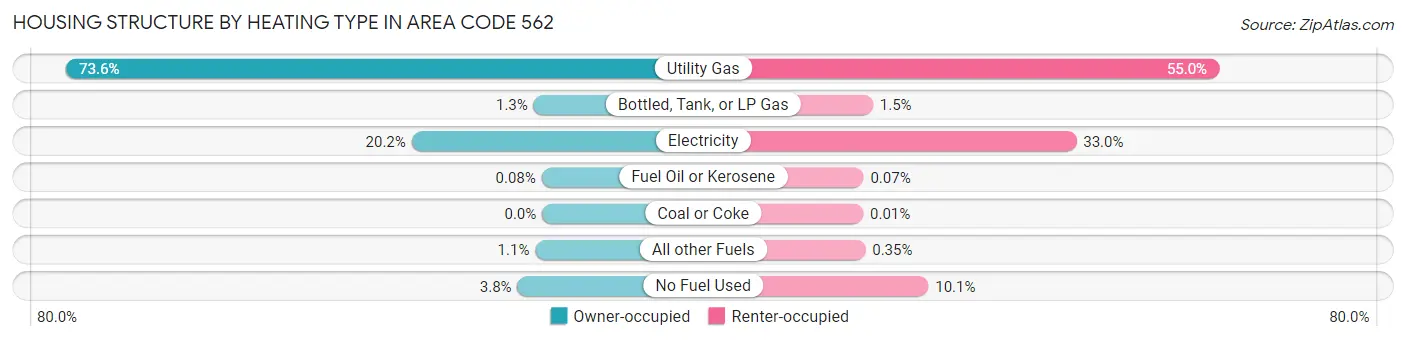
| Heating Type | Owner-occupied | Renter-occupied |
| Utility Gas | 265,984 (73.6%) | 224,869 (55.0%) |
| Bottled, Tank, or LP Gas | 4,725 (1.3%) | 6,169 (1.5%) |
| Electricity | 72,912 (20.2%) | 134,716 (33.0%) |
| Fuel Oil or Kerosene | 296 (0.1%) | 298 (0.1%) |
| Coal or Coke | 15 (0.0%) | 37 (0.0%) |
| All other Fuels | 3,824 (1.1%) | 1,444 (0.4%) |
| No Fuel Used | 13,788 (3.8%) | 41,231 (10.1%) |
| Total | 361,544 (100.0%) | 408,764 (100.0%) |
Household Vehicle Usage in Area Code 562
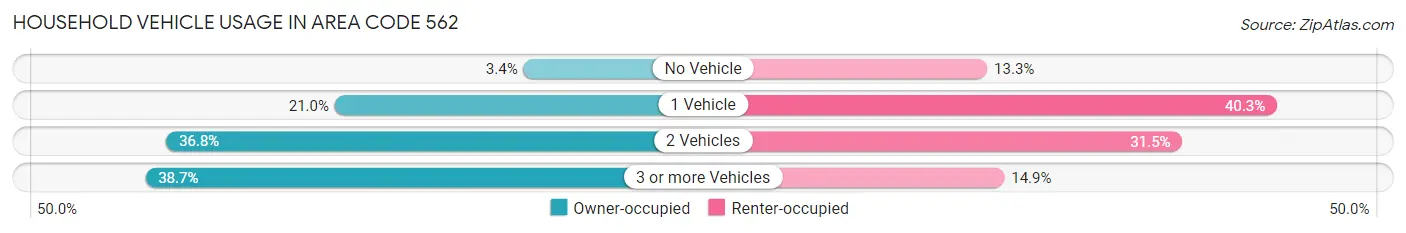
| Vehicles per Household | Owner-occupied | Renter-occupied |
| No Vehicle | 12,383 (3.4%) | 54,266 (13.3%) |
| 1 Vehicle | 76,057 (21.0%) | 164,893 (40.3%) |
| 2 Vehicles | 133,044 (36.8%) | 128,766 (31.5%) |
| 3 or more Vehicles | 140,060 (38.7%) | 60,839 (14.9%) |
| Total | 361,544 (100.0%) | 408,764 (100.0%) |
Real Estate & Mortgages in Area Code 562
Real Estate and Mortgage Overview in Area Code 562
| Characteristic | Without Mortgage | With Mortgage |
| Housing Units | 113,996 | 247,548 |
| Median Property Value | $38,644,100 | $42,082,400 |
| Median Household Income | $4,598,604 | $97,478 |
| Monthly Housing Costs | $39,213 | $97,848 |
| Real Estate Taxes | $193,462 | $4,078 |
Property Value by Mortgage Status in Area Code 562
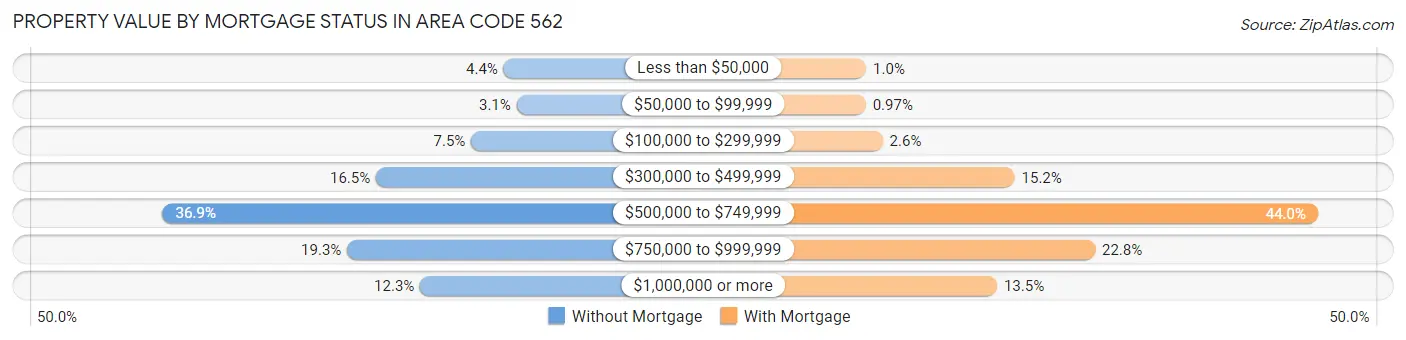
| Property Value | Without Mortgage | With Mortgage |
| Less than $50,000 | 4,987 (4.4%) | 2,500 (1.0%) |
| $50,000 to $99,999 | 3,582 (3.1%) | 2,398 (1.0%) |
| $100,000 to $299,999 | 8,515 (7.5%) | 6,375 (2.6%) |
| $300,000 to $499,999 | 18,845 (16.5%) | 37,506 (15.1%) |
| $500,000 to $749,999 | 42,023 (36.9%) | 108,976 (44.0%) |
| $750,000 to $999,999 | 21,983 (19.3%) | 56,456 (22.8%) |
| $1,000,000 or more | 14,061 (12.3%) | 33,337 (13.5%) |
| Total | 113,996 (100.0%) | 247,548 (100.0%) |
Household Income by Mortgage Status in Area Code 562
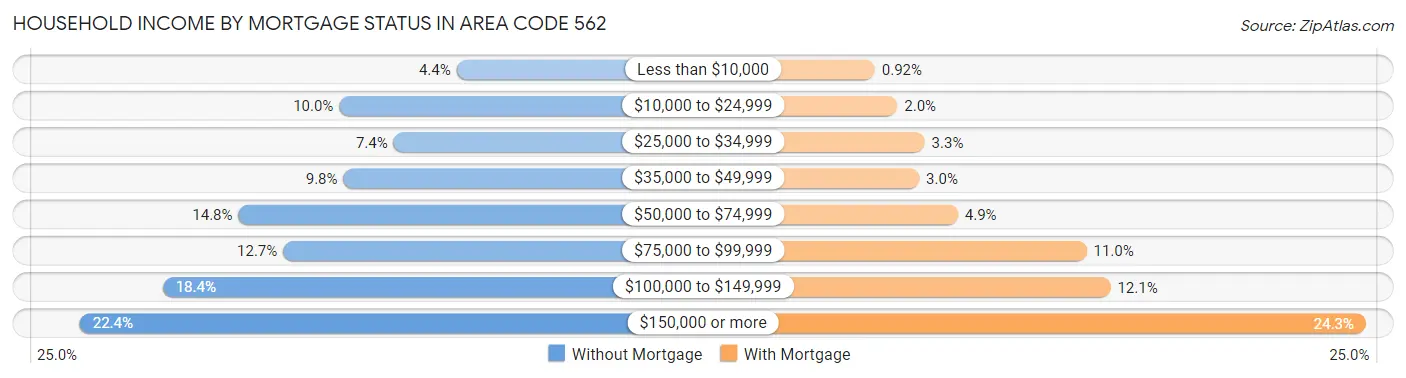
| Household Income | Without Mortgage | With Mortgage |
| Less than $10,000 | 5,049 (4.4%) | 2,272 (0.9%) |
| $10,000 to $24,999 | 11,419 (10.0%) | 4,938 (2.0%) |
| $25,000 to $34,999 | 8,472 (7.4%) | 8,143 (3.3%) |
| $35,000 to $49,999 | 11,190 (9.8%) | 7,489 (3.0%) |
| $50,000 to $74,999 | 16,897 (14.8%) | 12,067 (4.9%) |
| $75,000 to $99,999 | 14,461 (12.7%) | 27,222 (11.0%) |
| $100,000 to $149,999 | 21,003 (18.4%) | 30,056 (12.1%) |
| $150,000 or more | 25,505 (22.4%) | 60,155 (24.3%) |
| Total | 113,996 (100.0%) | 247,548 (100.0%) |
Property Value to Household Income Ratio in Area Code 562
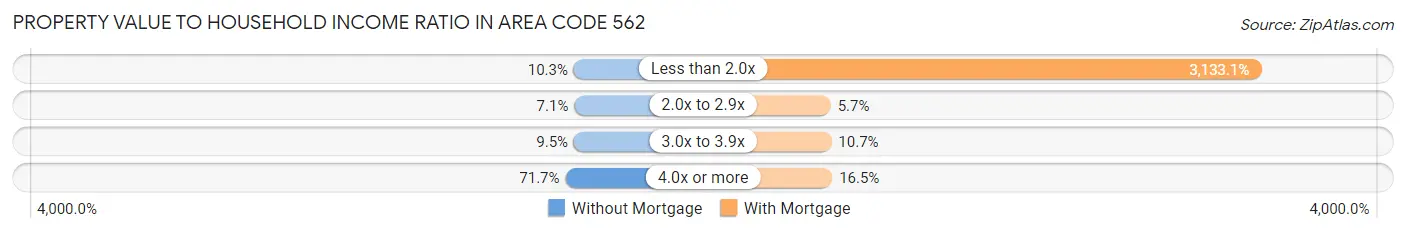
| Value-to-Income Ratio | Without Mortgage | With Mortgage |
| Less than 2.0x | 11,759 (10.3%) | 7,755,807 (3,133.1%) |
| 2.0x to 2.9x | 8,038 (7.0%) | 14,145 (5.7%) |
| 3.0x to 3.9x | 10,770 (9.5%) | 26,564 (10.7%) |
| 4.0x or more | 81,732 (71.7%) | 40,790 (16.5%) |
| Total | 113,996 (100.0%) | 247,548 (100.0%) |
Real Estate Taxes by Mortgage Status in Area Code 562
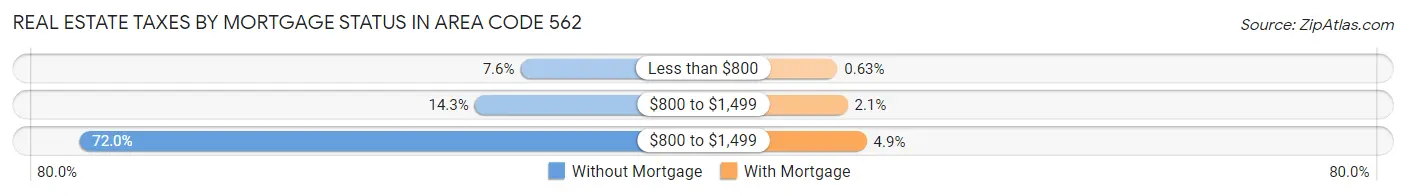
| Property Taxes | Without Mortgage | With Mortgage |
| Less than $800 | 8,626 (7.6%) | 1,548 (0.6%) |
| $800 to $1,499 | 16,243 (14.2%) | 5,240 (2.1%) |
| $800 to $1,499 | 82,062 (72.0%) | 12,148 (4.9%) |
| Total | 113,996 (100.0%) | 247,548 (100.0%) |
Health & Disability in Area Code 562
Health Insurance Coverage by Age in Area Code 562
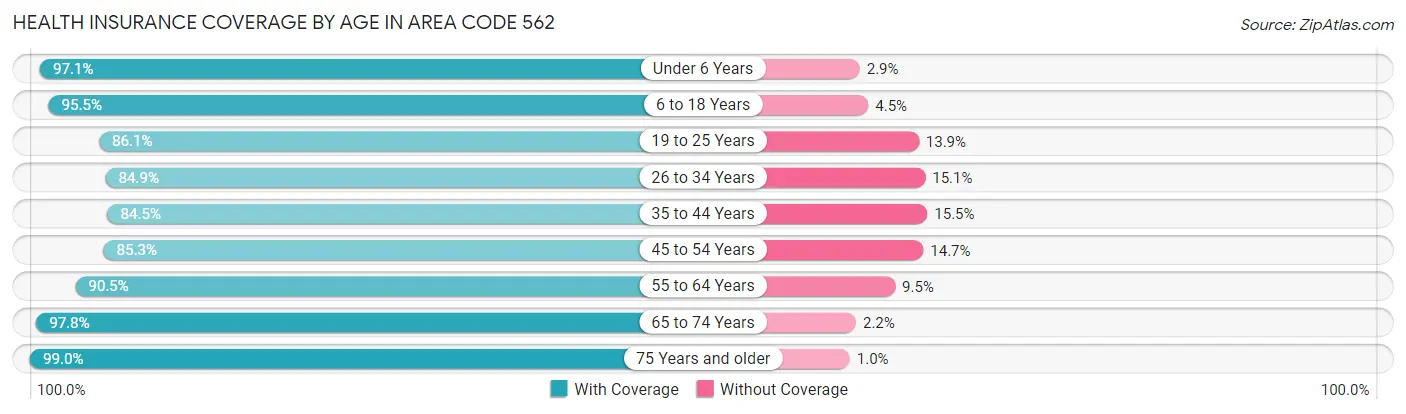
| Age Bracket | With Coverage | Without Coverage |
| Under 6 Years | 153,503 (97.1%) | 4,574 (2.9%) |
| 6 to 18 Years | 371,447 (95.5%) | 17,403 (4.5%) |
| 19 to 25 Years | 205,049 (86.1%) | 33,100 (13.9%) |
| 26 to 34 Years | 292,102 (84.9%) | 51,952 (15.1%) |
| 35 to 44 Years | 272,902 (84.5%) | 50,027 (15.5%) |
| 45 to 54 Years | 261,934 (85.3%) | 45,271 (14.7%) |
| 55 to 64 Years | 258,095 (90.5%) | 27,014 (9.5%) |
| 65 to 74 Years | 177,988 (97.8%) | 3,988 (2.2%) |
| 75 Years and older | 124,972 (99.0%) | 1,310 (1.0%) |
| Total | 2,117,992 (90.0%) | 234,639 (10.0%) |
Health Insurance Coverage by Citizenship Status in Area Code 562
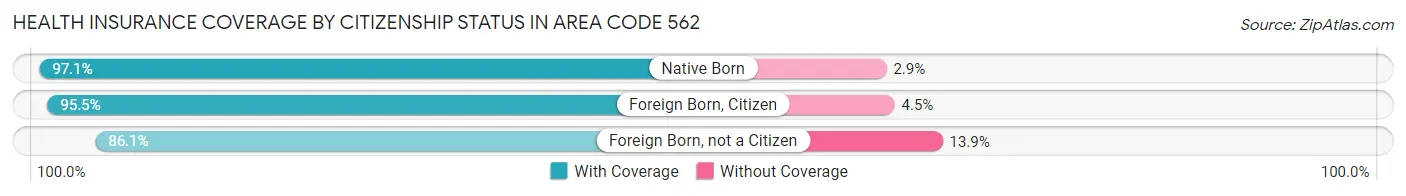
| Citizenship Status | With Coverage | Without Coverage |
| Native Born | 153,503 (97.1%) | 4,574 (2.9%) |
| Foreign Born, Citizen | 371,447 (95.5%) | 17,403 (4.5%) |
| Foreign Born, not a Citizen | 205,049 (86.1%) | 33,100 (13.9%) |
Health Insurance Coverage by Household Income in Area Code 562
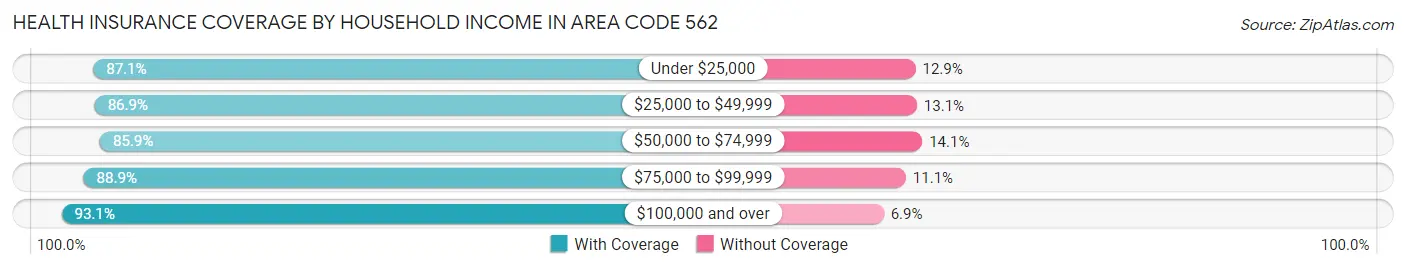
| Household Income | With Coverage | Without Coverage |
| Under $25,000 | 191,904 (87.1%) | 28,373 (12.9%) |
| $25,000 to $49,999 | 278,200 (86.9%) | 42,083 (13.1%) |
| $50,000 to $74,999 | 298,282 (85.9%) | 49,081 (14.1%) |
| $75,000 to $99,999 | 285,245 (88.9%) | 35,510 (11.1%) |
| $100,000 and over | 1,036,208 (93.1%) | 77,091 (6.9%) |
Public vs Private Health Insurance Coverage by Age in Area Code 562
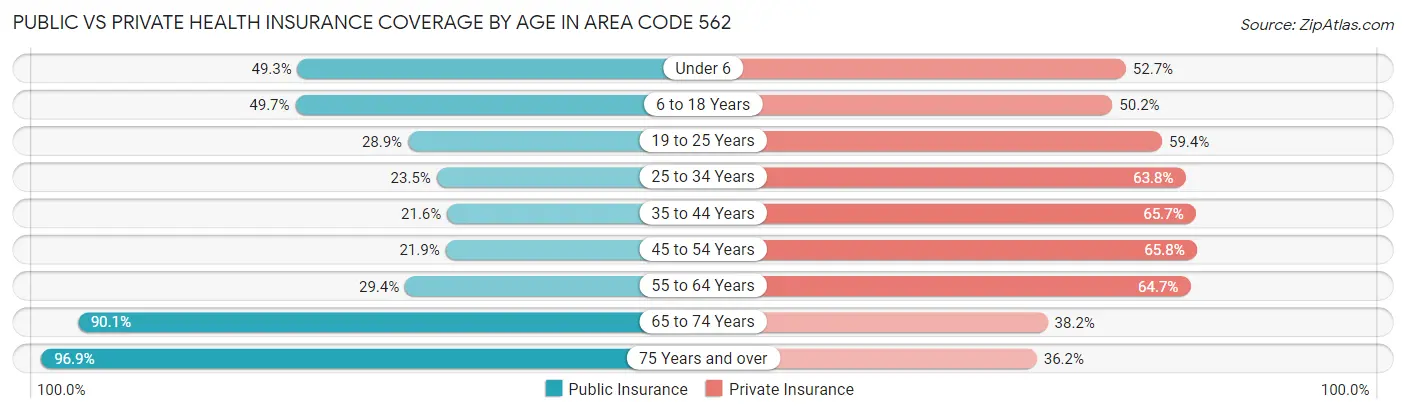
| Age Bracket | Public Insurance | Private Insurance |
| Under 6 | 77,973 (49.3%) | 83,352 (52.7%) |
| 6 to 18 Years | 193,400 (49.7%) | 195,337 (50.2%) |
| 19 to 25 Years | 68,699 (28.8%) | 141,565 (59.4%) |
| 25 to 34 Years | 80,934 (23.5%) | 219,337 (63.7%) |
| 35 to 44 Years | 69,681 (21.6%) | 212,039 (65.7%) |
| 45 to 54 Years | 67,216 (21.9%) | 202,245 (65.8%) |
| 55 to 64 Years | 83,791 (29.4%) | 184,322 (64.6%) |
| 65 to 74 Years | 164,017 (90.1%) | 69,534 (38.2%) |
| 75 Years and over | 122,386 (96.9%) | 45,707 (36.2%) |
| Total | 928,097 (39.5%) | 1,353,438 (57.5%) |
Disability Status by Sex by Age in Area Code 562
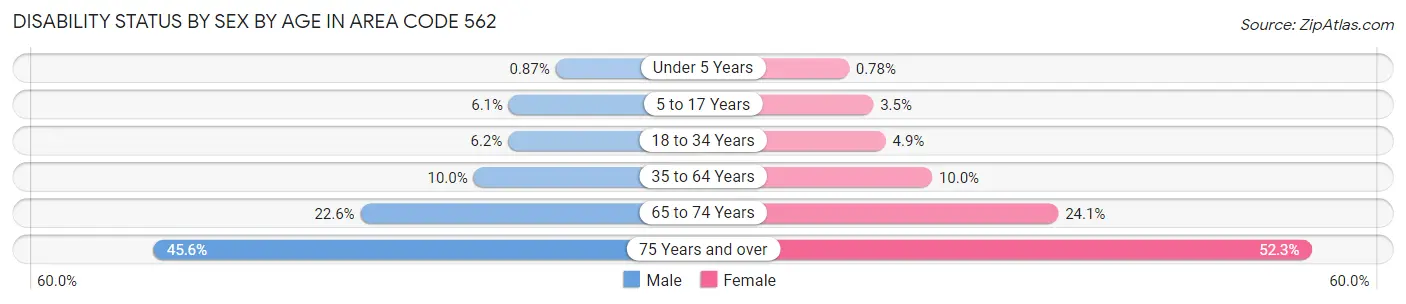
| Age Bracket | Male | Female |
| Under 5 Years | 575 (0.9%) | 504 (0.8%) |
| 5 to 17 Years | 11,988 (6.1%) | 6,503 (3.5%) |
| 18 to 34 Years | 19,101 (6.1%) | 14,870 (4.9%) |
| 35 to 64 Years | 46,127 (10.0%) | 45,580 (10.0%) |
| 65 to 74 Years | 19,046 (22.6%) | 23,545 (24.1%) |
| 75 Years and over | 22,751 (45.6%) | 39,939 (52.3%) |
Disability Class by Sex by Age in Area Code 562
Disability Class: Hearing Difficulty
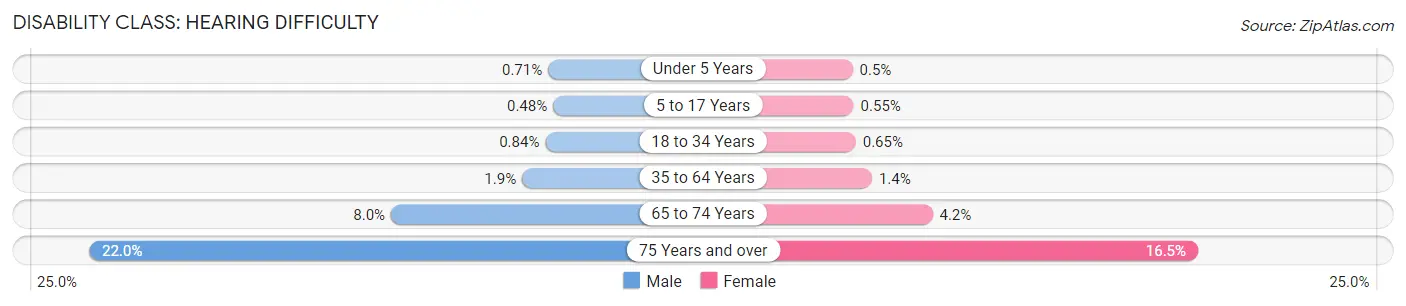
| Age Bracket | Male | Female |
| Under 5 Years | 469 (0.7%) | 325 (0.5%) |
| 5 to 17 Years | 939 (0.5%) | 1,023 (0.5%) |
| 18 to 34 Years | 2,601 (0.8%) | 1,973 (0.6%) |
| 35 to 64 Years | 8,870 (1.9%) | 6,345 (1.4%) |
| 65 to 74 Years | 6,739 (8.0%) | 4,109 (4.2%) |
| 75 Years and over | 10,980 (22.0%) | 12,616 (16.5%) |
Disability Class: Vision Difficulty
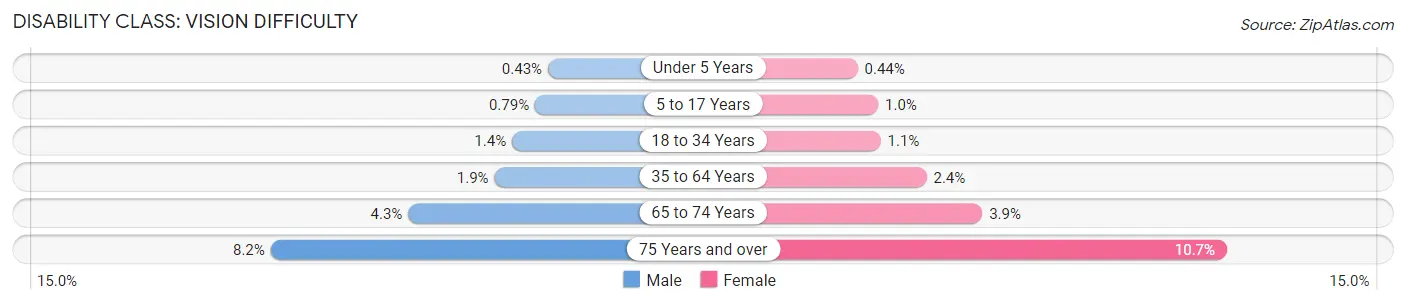
| Age Bracket | Male | Female |
| Under 5 Years | 285 (0.4%) | 284 (0.4%) |
| 5 to 17 Years | 1,556 (0.8%) | 1,875 (1.0%) |
| 18 to 34 Years | 4,437 (1.4%) | 3,288 (1.1%) |
| 35 to 64 Years | 8,856 (1.9%) | 10,740 (2.4%) |
| 65 to 74 Years | 3,639 (4.3%) | 3,824 (3.9%) |
| 75 Years and over | 4,069 (8.2%) | 8,192 (10.7%) |
Disability Class: Cognitive Difficulty
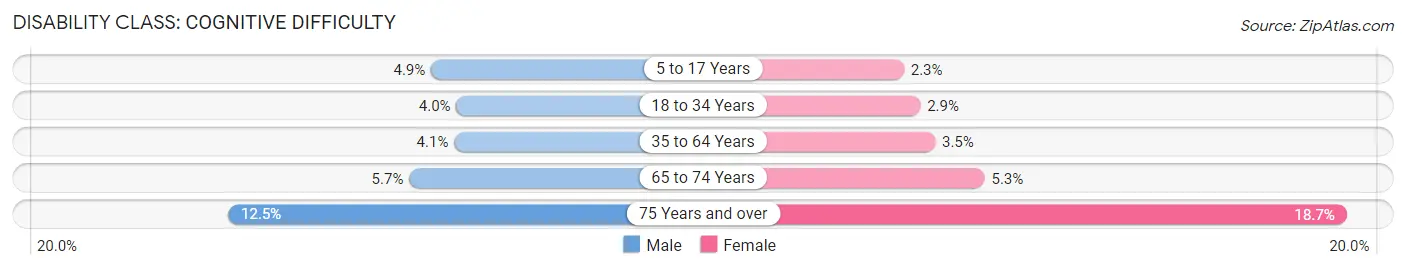
| Age Bracket | Male | Female |
| 5 to 17 Years | 9,697 (4.9%) | 4,260 (2.3%) |
| 18 to 34 Years | 12,332 (4.0%) | 8,867 (2.9%) |
| 35 to 64 Years | 18,659 (4.1%) | 15,711 (3.5%) |
| 65 to 74 Years | 4,824 (5.7%) | 5,180 (5.3%) |
| 75 Years and over | 6,210 (12.4%) | 14,315 (18.7%) |
Disability Class: Ambulatory Difficulty
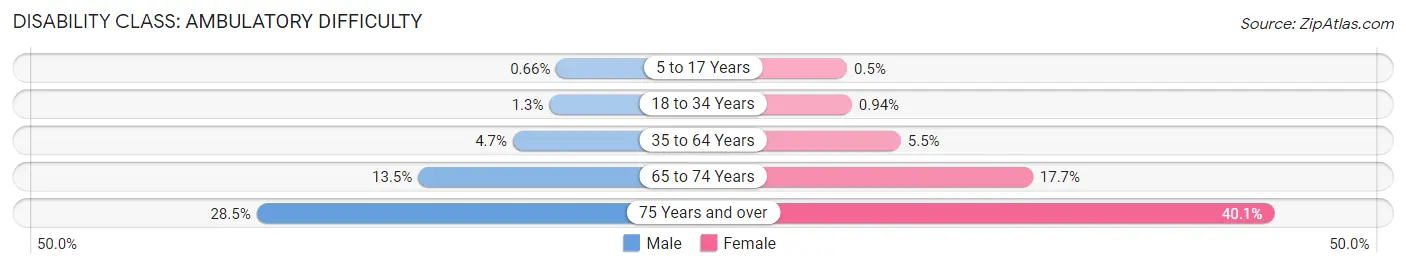
| Age Bracket | Male | Female |
| 5 to 17 Years | 1,305 (0.7%) | 934 (0.5%) |
| 18 to 34 Years | 4,039 (1.3%) | 2,866 (0.9%) |
| 35 to 64 Years | 21,649 (4.7%) | 24,879 (5.5%) |
| 65 to 74 Years | 11,360 (13.5%) | 17,322 (17.7%) |
| 75 Years and over | 14,209 (28.5%) | 30,645 (40.1%) |
Disability Class: Self-Care Difficulty

| Age Bracket | Male | Female |
| 5 to 17 Years | 3,921 (2.0%) | 1,696 (0.9%) |
| 18 to 34 Years | 3,521 (1.1%) | 2,249 (0.7%) |
| 35 to 64 Years | 9,269 (2.0%) | 10,272 (2.3%) |
| 65 to 74 Years | 4,420 (5.2%) | 5,967 (6.1%) |
| 75 Years and over | 6,696 (13.4%) | 16,011 (21.0%) |
Technology Access in Area Code 562
Computing Device Access in Area Code 562
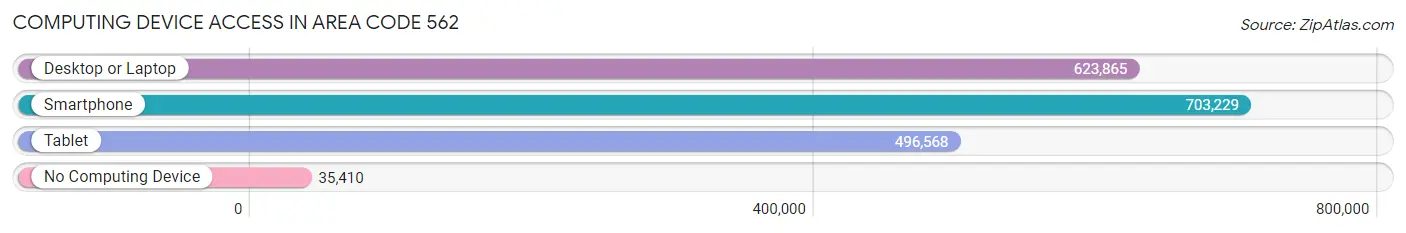
| Device Type | # Households | % Households |
| Desktop or Laptop | 623,865 | 81.0% |
| Smartphone | 703,229 | 91.3% |
| Tablet | 496,568 | 64.5% |
| No Computing Device | 35,410 | 4.6% |
| Total | 770,308 | 100.0% |
Internet Access in Area Code 562
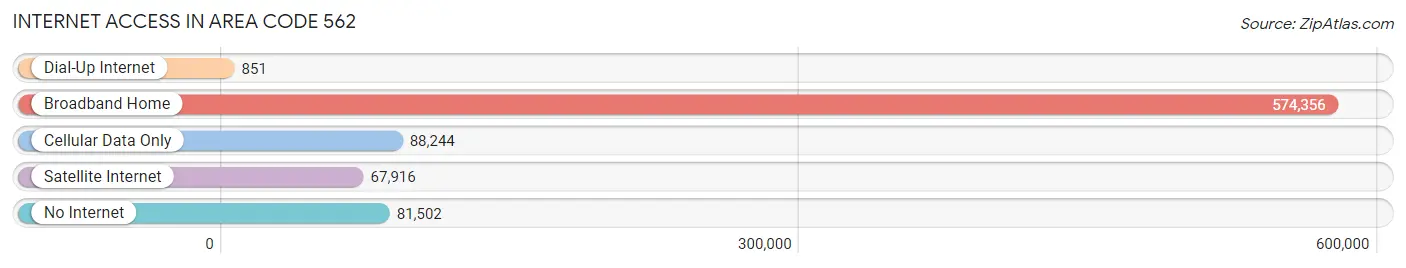
| Internet Type | # Households | % Households |
| Dial-Up Internet | 851 | 0.1% |
| Broadband Home | 574,356 | 74.6% |
| Cellular Data Only | 88,244 | 11.5% |
| Satellite Internet | 67,916 | 8.8% |
| No Internet | 81,502 | 10.6% |
| Total | 770,308 | 100.0% |
Area Code 562 Summary
Geography
Area code 562 is a telephone area code in the North American Numbering Plan (NANP) for the Greater Los Angeles area of Southern California. It was created in 1997 as a split from area code 310. It serves the cities of Long Beach, Lakewood, Cerritos, Norwalk, Downey, Bellflower, and Paramount.
Social
Area code 562 is home to a diverse population of people from all walks of life. The area is known for its vibrant culture, with a variety of restaurants, bars, and entertainment venues. The area is also home to a number of universities and colleges, including California State University, Long Beach, and Long Beach City College.
Economics
Area code 562 is a major economic hub in Southern California. The area is home to a number of large corporations, including Boeing, Raytheon, and Molina Healthcare. The area is also home to a number of small businesses, including restaurants, retail stores, and professional services.
Demographics
Area code 562 is home to a diverse population of people from all walks of life. According to the 2010 census, the population of the area was 1,845,000, with a median age of 33.7 years. The area is also home to a large Hispanic population, with nearly 40% of the population identifying as Hispanic or Latino.
Common Questions
What is Per Capita Income in Area Code 562?
Per Capita income in Area Code 562 is $37,467.
What is the Median Family Income in Area Code 562?
Median Family Income in Area Code 562 is $97,120.
What is the Median Household income in Area Code 562?
Median Household Income in Area Code 562 is $83,558.
What is Income or Wage Gap in Area Code 562?
Income or Wage Gap in Area Code 562 is 22.7%.
Women in Area Code 562 earn 77.3 cents for every dollar earned by a man.
What is Family Income Deficit in Area Code 562?
Family Income Deficit in Area Code 562 is $11,533.
Families that are below poverty line in Area Code 562 earn $11,533 less on average than the poverty threshold level.
What is Inequality or Gini Index in Area Code 562?
Inequality or Gini Index in Area Code 562 is 25.94.
What is the Total Population of Area Code 562?
Total Population of Area Code 562 is 2,365,238.
What is the Total Male Population of Area Code 562?
Total Male Population of Area Code 562 is 1,176,713.
What is the Total Female Population of Area Code 562?
Total Female Population of Area Code 562 is 1,188,525.
What is the Ratio of Males per 100 Females in Area Code 562?
There are 99.01 Males per 100 Females in Area Code 562.
What is the Ratio of Females per 100 Males in Area Code 562?
There are 101.00 Females per 100 Males in Area Code 562.
What is the Median Population Age in Area Code 562?
Median Population Age in Area Code 562 is 38.1 Years.
What is the Average Family Size in Area Code 562
Average Family Size in Area Code 562 is 3.6 People.
What is the Average Household Size in Area Code 562
Average Household Size in Area Code 562 is 3.0 People.
How Large is the Labor Force in Area Code 562?
There are 1,227,486 People in the Labor Forcein in Area Code 562.
What is the Percentage of People in the Labor Force in Area Code 562?
64.2% of People are in the Labor Force in Area Code 562.
What is the Unemployment Rate in Area Code 562?
Unemployment Rate in Area Code 562 is 7.1%.