Area Code 818 Map & Demographics
Area Code 818 Map
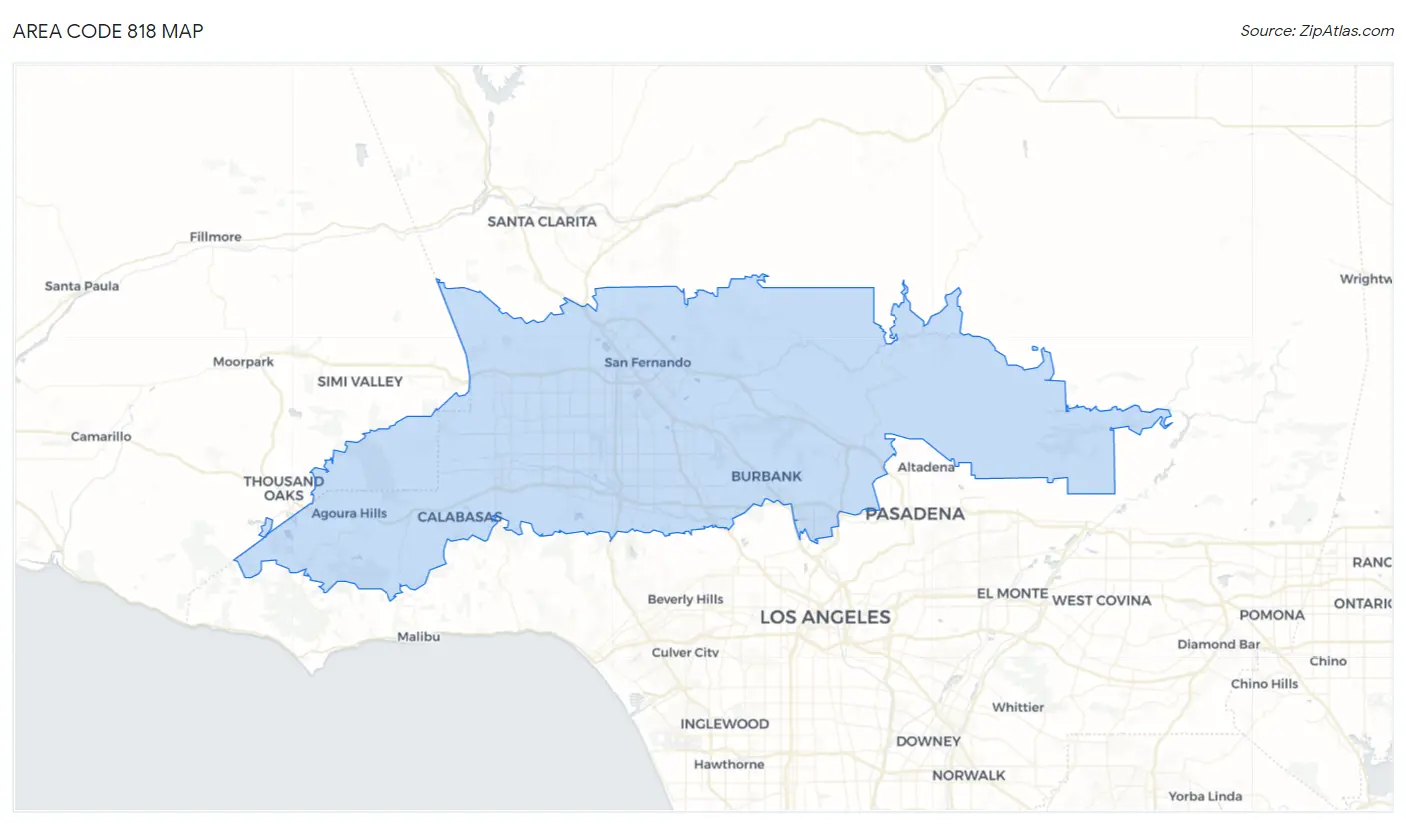
Area Code 818 Overview
$54,061
PER CAPITA INCOME
$114,756
AVG FAMILY INCOME
$93,640
AVG HOUSEHOLD INCOME
22.9%
WAGE / INCOME GAP [ % ]
77.1¢/ $1
WAGE / INCOME GAP [ $ ]
$10,541
FAMILY INCOME DEFICIT
33.09
INEQUALITY / GINI INDEX
2,178,533
TOTAL POPULATION
1,083,635
MALE POPULATION
1,094,898
FEMALE POPULATION
98.97
MALES / 100 FEMALES
101.04
FEMALES / 100 MALES
40.3
MEDIAN AGE
3.2
AVG FAMILY SIZE
2.6
AVG HOUSEHOLD SIZE
1,176,304
LABOR FORCE [ PEOPLE ]
64.7%
PERCENT IN LABOR FORCE
7.2%
UNEMPLOYMENT RATE
Income in Area Code 818
Income Overview in Area Code 818
Per Capita Income in Area Code 818 is $54,061, while median incomes of families and households are $114,756 and $93,640 respectively.
| Characteristic | Number | Measure |
| Per Capita Income | 2,178,533 | $54,061 |
| Median Family Income | 488,031 | $114,756 |
| Mean Family Income | 488,031 | $10,848,288 |
| Median Household Income | 797,962 | $93,640 |
| Mean Household Income | 797,962 | $9,181,984 |
| Income Deficit | 488,031 | $10,541 |
| Wage / Income Gap (%) | 2,178,533 | 22.94% |
| Wage / Income Gap ($) | 2,178,533 | 77.06¢ per $1 |
| Gini / Inequality Index | 2,178,533 | 33.09 |
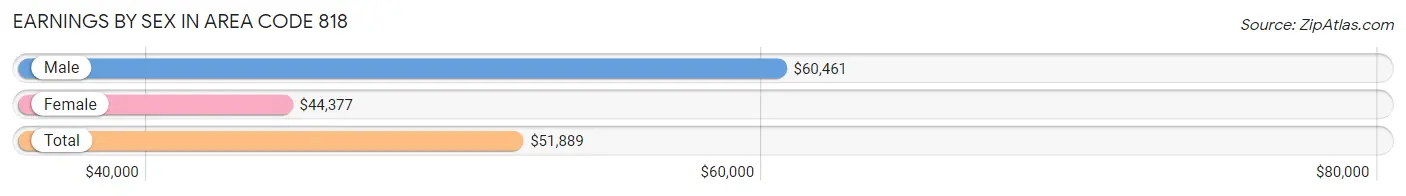
Earnings by Sex in Area Code 818
Average Earnings in Area Code 818 are $51,889, $60,461 for men and $44,377 for women, a difference of 26.6%.
| Sex | Number | Average Earnings |
| Male | 652,426 (53.7%) | $60,461 |
| Female | 563,386 (46.3%) | $44,377 |
| Total | 1,215,812 (100.0%) | $51,889 |
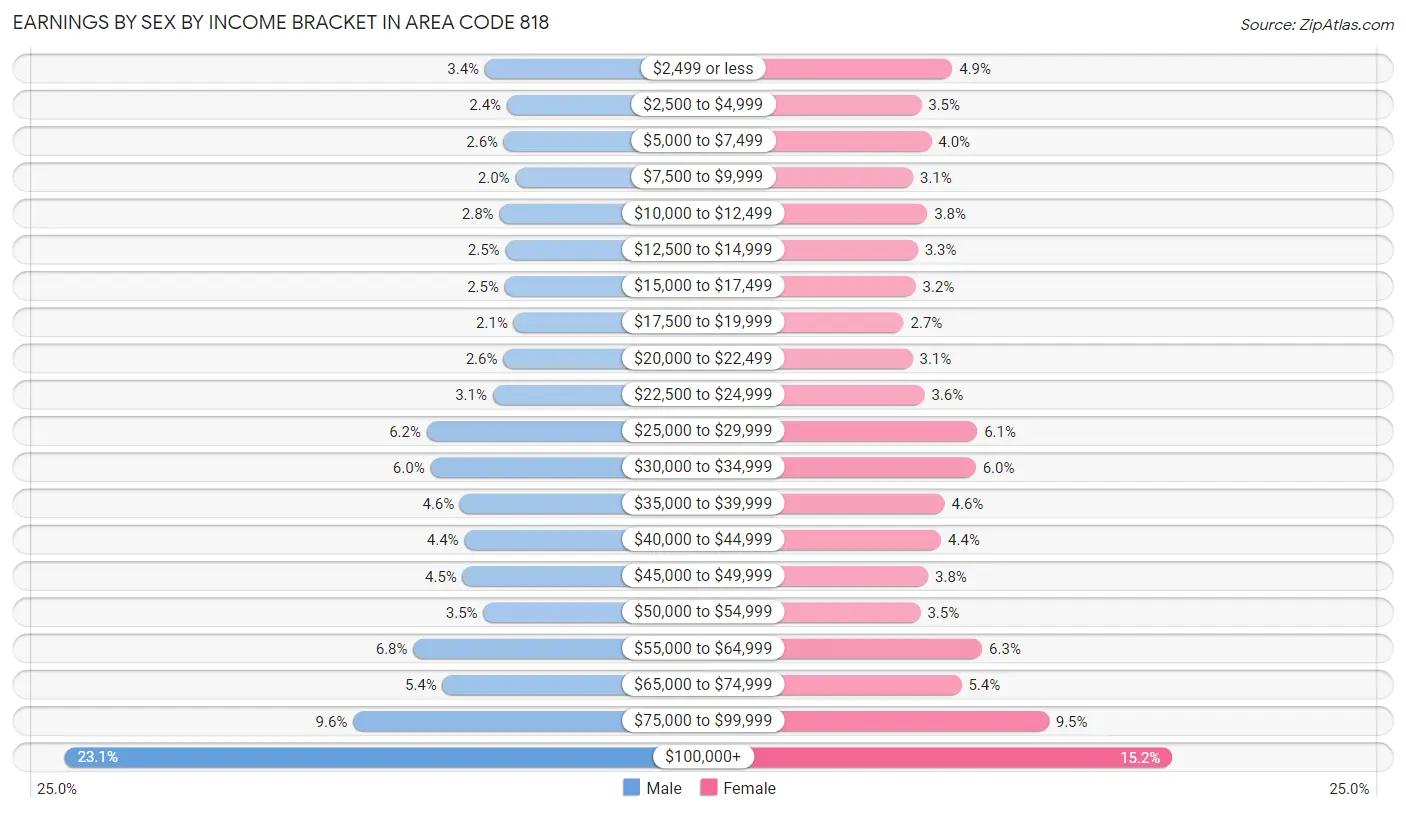
Earnings by Sex by Income Bracket in Area Code 818
The most common earnings brackets in Area Code 818 are $100,000+ for men (150,891 | 23.1%) and $100,000+ for women (85,832 | 15.2%).
| Income | Male | Female |
| $2,499 or less | 22,456 (3.4%) | 27,820 (4.9%) |
| $2,500 to $4,999 | 15,701 (2.4%) | 19,639 (3.5%) |
| $5,000 to $7,499 | 16,635 (2.5%) | 22,322 (4.0%) |
| $7,500 to $9,999 | 13,097 (2.0%) | 17,440 (3.1%) |
| $10,000 to $12,499 | 18,028 (2.8%) | 21,263 (3.8%) |
| $12,500 to $14,999 | 16,204 (2.5%) | 18,715 (3.3%) |
| $15,000 to $17,499 | 16,356 (2.5%) | 18,126 (3.2%) |
| $17,500 to $19,999 | 13,634 (2.1%) | 14,996 (2.7%) |
| $20,000 to $22,499 | 16,807 (2.6%) | 17,369 (3.1%) |
| $22,500 to $24,999 | 20,024 (3.1%) | 20,518 (3.6%) |
| $25,000 to $29,999 | 40,209 (6.2%) | 34,399 (6.1%) |
| $30,000 to $34,999 | 39,103 (6.0%) | 34,040 (6.0%) |
| $35,000 to $39,999 | 29,989 (4.6%) | 25,782 (4.6%) |
| $40,000 to $44,999 | 28,704 (4.4%) | 24,921 (4.4%) |
| $45,000 to $49,999 | 29,252 (4.5%) | 21,468 (3.8%) |
| $50,000 to $54,999 | 22,921 (3.5%) | 19,446 (3.5%) |
| $55,000 to $64,999 | 44,325 (6.8%) | 35,709 (6.3%) |
| $65,000 to $74,999 | 35,388 (5.4%) | 30,264 (5.4%) |
| $75,000 to $99,999 | 62,702 (9.6%) | 53,317 (9.5%) |
| $100,000+ | 150,891 (23.1%) | 85,832 (15.2%) |
| Total | 652,426 (100.0%) | 563,386 (100.0%) |
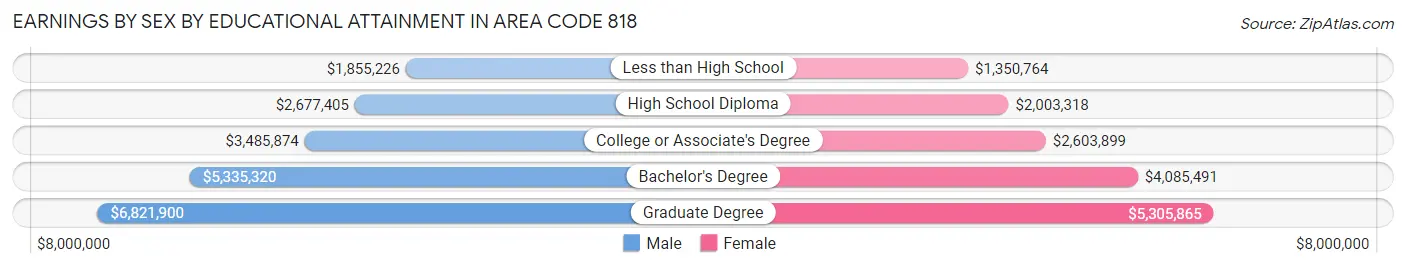
Earnings by Sex by Educational Attainment in Area Code 818
Average earnings in Area Code 818 are $4,463,469 for men and $3,289,971 for women, a difference of 26.3%. Men with an educational attainment of graduate degree enjoy the highest average annual earnings of $6,821,900, while those with less than high school education earn the least with $1,855,226. Women with an educational attainment of graduate degree earn the most with the average annual earnings of $5,305,865, while those with less than high school education have the smallest earnings of $1,350,764.
| Educational Attainment | Male Income | Female Income |
| Less than High School | $1,855,226 | $1,350,764 |
| High School Diploma | $2,677,405 | $2,003,318 |
| College or Associate's Degree | $3,485,874 | $2,603,899 |
| Bachelor's Degree | $5,335,320 | $4,085,491 |
| Graduate Degree | $6,821,900 | $5,305,865 |
| Total | $4,463,469 | $3,289,971 |
Family Income in Area Code 818
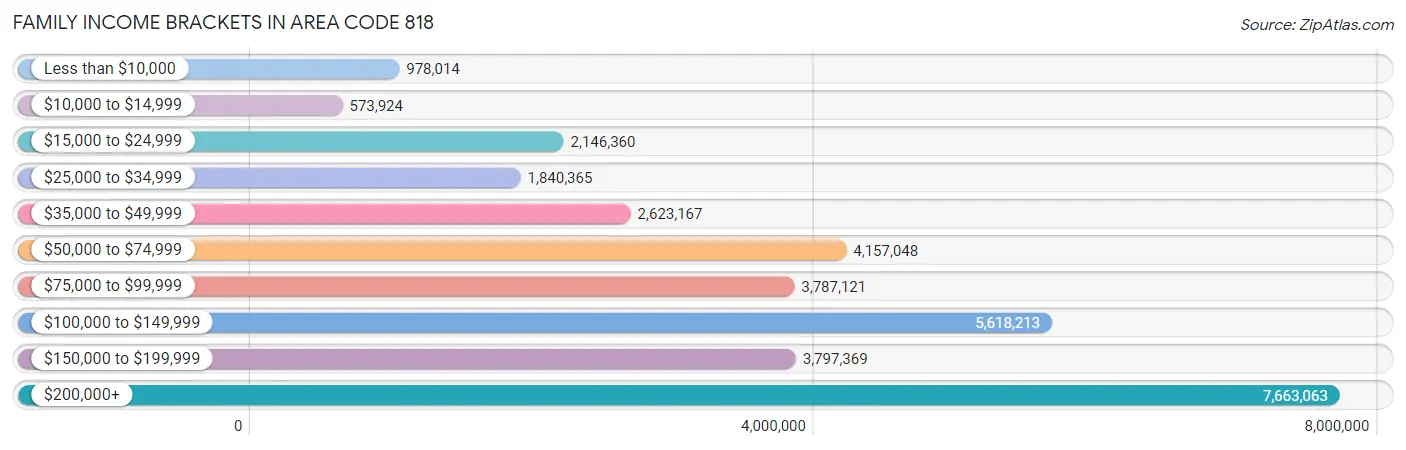
Family Income Brackets in Area Code 818
According to the Area Code 818 family income data, there are 7,663,063 families falling into the $200,000+ income range, which is the most common income bracket and makes up 1,570.2% of all families. Conversely, the $10,000 to $14,999 income bracket is the least frequent group with only 573,924 families (117.6%) belonging to this category.
| Income Bracket | # Families | % Families |
| Less than $10,000 | 978,014 | 200.4% |
| $10,000 to $14,999 | 573,924 | 117.6% |
| $15,000 to $24,999 | 2,146,360 | 439.8% |
| $25,000 to $34,999 | 1,840,365 | 377.1% |
| $35,000 to $49,999 | 2,623,167 | 537.5% |
| $50,000 to $74,999 | 4,157,048 | 851.8% |
| $75,000 to $99,999 | 3,787,121 | 776.0% |
| $100,000 to $149,999 | 5,618,213 | 1,151.2% |
| $150,000 to $199,999 | 3,797,369 | 778.1% |
| $200,000+ | 7,663,063 | 1,570.2% |
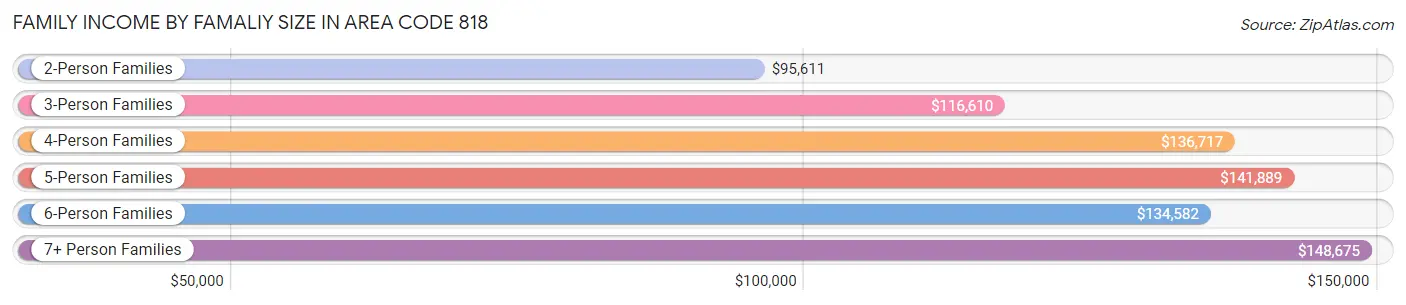
Family Income by Famaliy Size in Area Code 818
7+ person families (11,278 | 2.3%) account for the highest median family income in Area Code 818 with $148,675 per family, while 2-person families (196,002 | 40.2%) have the highest median income of $47,806 per family member.
| Income Bracket | # Families | Median Income |
| 2-Person Families | 196,002 (40.2%) | $95,611 |
| 3-Person Families | 116,791 (23.9%) | $116,610 |
| 4-Person Families | 102,172 (20.9%) | $136,717 |
| 5-Person Families | 46,171 (9.5%) | $141,889 |
| 6-Person Families | 15,617 (3.2%) | $134,582 |
| 7+ Person Families | 11,278 (2.3%) | $148,675 |
| Total | 488,031 (100.0%) | $114,756 |
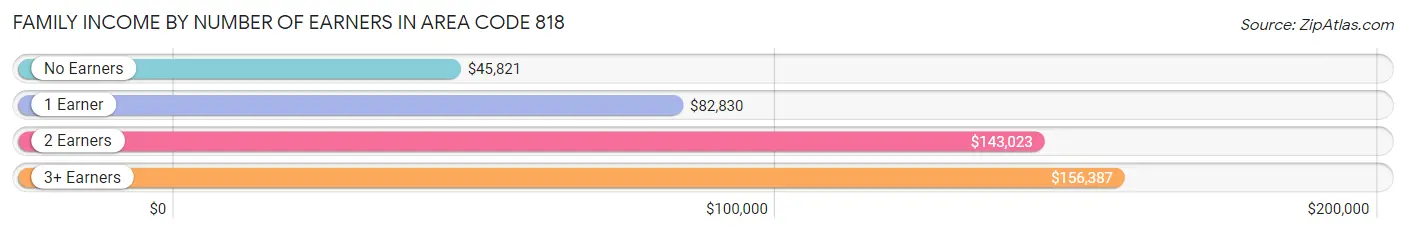
Family Income by Number of Earners in Area Code 818
The median family income in Area Code 818 is $114,756, with families comprising 3+ earners (75,730) having the highest median family income of $156,387, while families with no earners (53,053) have the lowest median family income of $45,821, accounting for 15.5% and 10.9% of families, respectively.
| Number of Earners | # Families | Median Income |
| No Earners | 53,053 (10.9%) | $45,821 |
| 1 Earner | 153,549 (31.5%) | $82,830 |
| 2 Earners | 205,699 (42.1%) | $143,023 |
| 3+ Earners | 75,730 (15.5%) | $156,387 |
| Total | 488,031 (100.0%) | $114,756 |
Household Income in Area Code 818
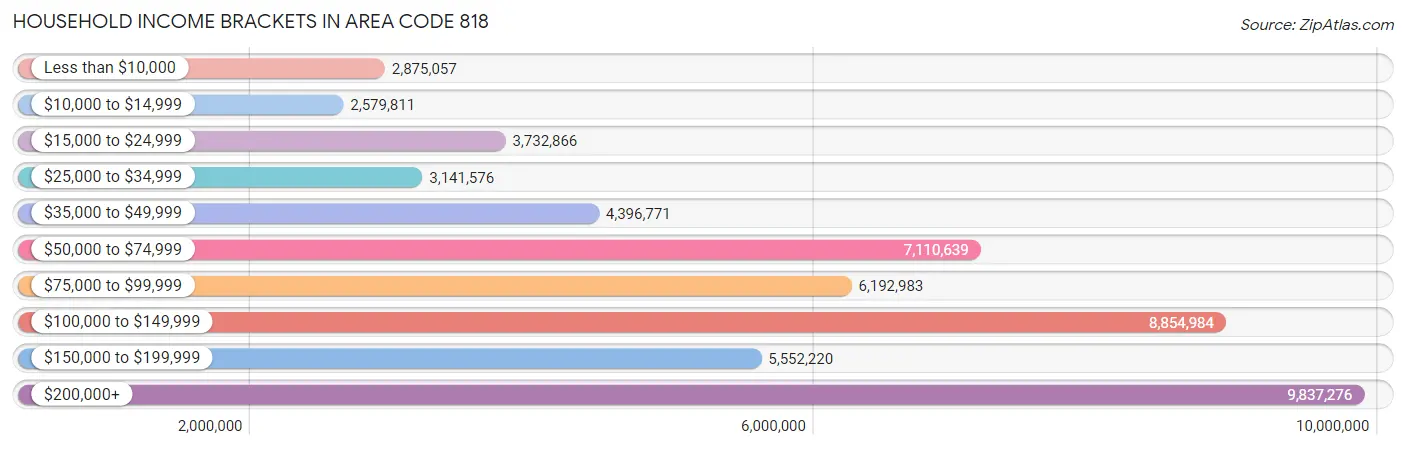
Household Income Brackets in Area Code 818
With 9,837,276 households falling in the category, the $200,000+ income range is the most frequent in Area Code 818, accounting for 1,232.8% of all households. In contrast, only 2,579,811 households (323.3%) fall into the $10,000 to $14,999 income bracket, making it the least populous group.
| Income Bracket | # Households | % Households |
| Less than $10,000 | 2,875,057 | 360.3% |
| $10,000 to $14,999 | 2,579,811 | 323.3% |
| $15,000 to $24,999 | 3,732,866 | 467.8% |
| $25,000 to $34,999 | 3,141,576 | 393.7% |
| $35,000 to $49,999 | 4,396,771 | 551.0% |
| $50,000 to $74,999 | 7,110,639 | 891.1% |
| $75,000 to $99,999 | 6,192,983 | 776.1% |
| $100,000 to $149,999 | 8,854,984 | 1,109.7% |
| $150,000 to $199,999 | 5,552,220 | 695.8% |
| $200,000+ | 9,837,276 | 1,232.8% |
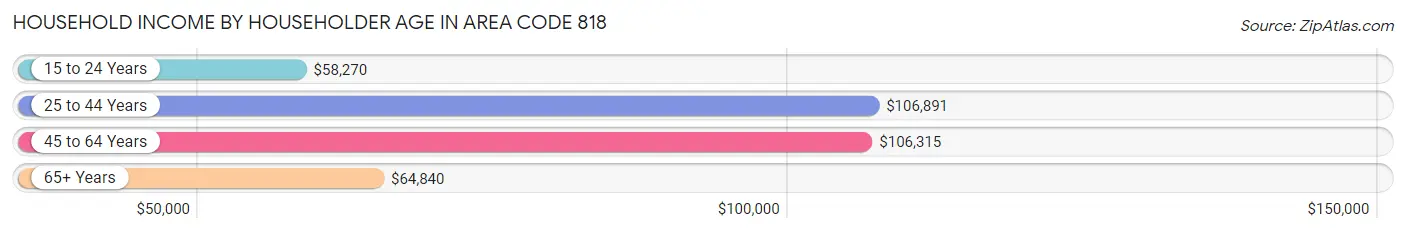
Household Income by Householder Age in Area Code 818
The median household income in Area Code 818 is $93,640, with the highest median household income of $106,891 found in the 25 to 44 years age bracket for the primary householder. A total of 290,406 households (36.4%) fall into this category. Meanwhile, the 15 to 24 years age bracket for the primary householder has the lowest median household income of $58,270, with 25,011 households (3.1%) in this group.
| Income Bracket | # Households | Median Income |
| 15 to 24 Years | 25,011 (3.1%) | $58,270 |
| 25 to 44 Years | 290,406 (36.4%) | $106,891 |
| 45 to 64 Years | 295,608 (37.0%) | $106,315 |
| 65+ Years | 186,937 (23.4%) | $64,840 |
| Total | 797,962 (100.0%) | $93,640 |
Poverty in Area Code 818
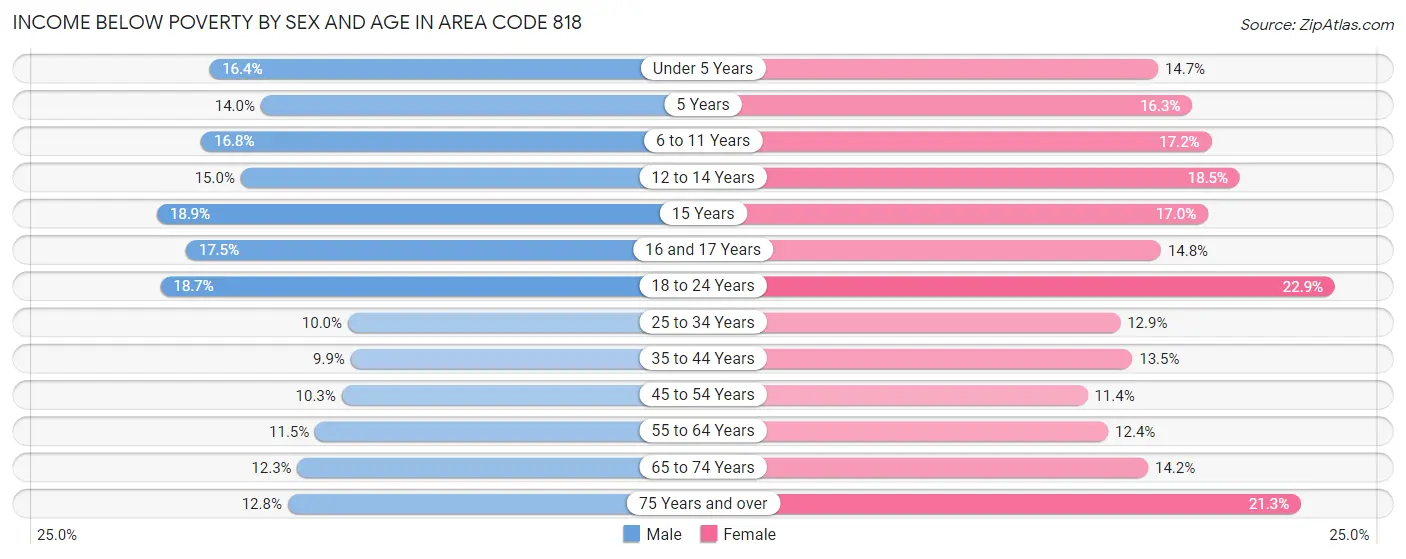
Income Below Poverty by Sex and Age in Area Code 818
With 12.6% poverty level for males and 15.0% for females among the residents of Area Code 818, 15 year old males and 18 to 24 year old females are the most vulnerable to poverty, with 2,136 males (18.9%) and 21,719 females (22.9%) in their respective age groups living below the poverty level.
| Age Bracket | Male | Female |
| Under 5 Years | 8,885 (16.4%) | 7,601 (14.7%) |
| 5 Years | 1,547 (14.0%) | 1,616 (16.3%) |
| 6 to 11 Years | 11,506 (16.8%) | 11,185 (17.2%) |
| 12 to 14 Years | 5,527 (15.0%) | 6,346 (18.5%) |
| 15 Years | 2,136 (18.9%) | 2,017 (17.0%) |
| 16 and 17 Years | 4,304 (17.5%) | 3,498 (14.8%) |
| 18 to 24 Years | 17,577 (18.7%) | 21,719 (22.9%) |
| 25 to 34 Years | 18,515 (10.0%) | 22,851 (12.9%) |
| 35 to 44 Years | 15,315 (9.9%) | 19,770 (13.5%) |
| 45 to 54 Years | 14,902 (10.3%) | 16,333 (11.4%) |
| 55 to 64 Years | 15,269 (11.5%) | 16,661 (12.4%) |
| 65 to 74 Years | 10,570 (12.3%) | 14,286 (14.2%) |
| 75 Years and over | 7,391 (12.8%) | 17,694 (21.3%) |
| Total | 133,444 (12.6%) | 161,577 (15.0%) |
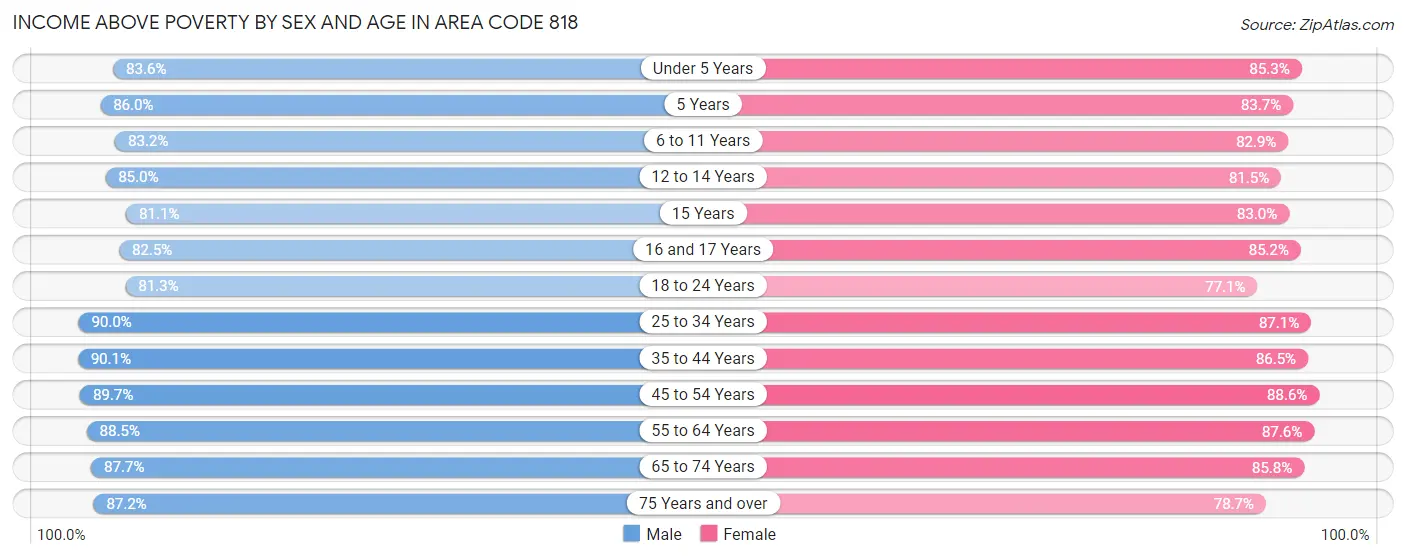
Income Above Poverty by Sex and Age in Area Code 818
According to the poverty statistics in Area Code 818, males aged 35 to 44 years and females aged 45 to 54 years are the age groups that are most secure financially, with 90.1% of males and 88.6% of females in these age groups living above the poverty line.
| Age Bracket | Male | Female |
| Under 5 Years | 45,190 (83.6%) | 44,195 (85.3%) |
| 5 Years | 9,470 (86.0%) | 8,323 (83.7%) |
| 6 to 11 Years | 56,933 (83.2%) | 54,036 (82.9%) |
| 12 to 14 Years | 31,388 (85.0%) | 28,006 (81.5%) |
| 15 Years | 9,192 (81.1%) | 9,852 (83.0%) |
| 16 and 17 Years | 20,269 (82.5%) | 20,123 (85.2%) |
| 18 to 24 Years | 76,442 (81.3%) | 73,202 (77.1%) |
| 25 to 34 Years | 166,673 (90.0%) | 154,049 (87.1%) |
| 35 to 44 Years | 139,867 (90.1%) | 126,868 (86.5%) |
| 45 to 54 Years | 129,862 (89.7%) | 126,976 (88.6%) |
| 55 to 64 Years | 117,262 (88.5%) | 118,178 (87.6%) |
| 65 to 74 Years | 75,068 (87.7%) | 86,214 (85.8%) |
| 75 Years and over | 50,384 (87.2%) | 65,325 (78.7%) |
| Total | 928,000 (87.4%) | 915,347 (85.0%) |
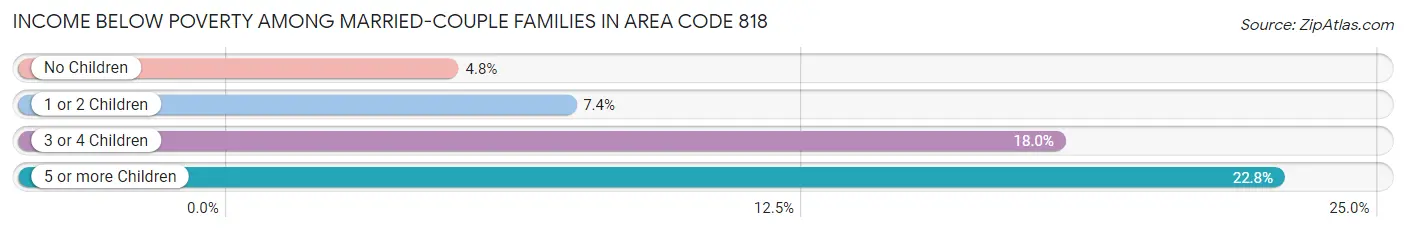
Income Below Poverty Among Married-Couple Families in Area Code 818
The poverty statistics for married-couple families in Area Code 818 show that 6.6% or 22,771 of the total 343,391 families live below the poverty line. Families with 5 or more children have the highest poverty rate of 22.8%, comprising of 288 families. On the other hand, families with no children have the lowest poverty rate of 4.8%, which includes 9,395 families.
| Children | Above Poverty | Below Poverty |
| No Children | 186,180 (95.2%) | 9,395 (4.8%) |
| 1 or 2 Children | 115,729 (92.6%) | 9,192 (7.4%) |
| 3 or 4 Children | 17,735 (82.0%) | 3,896 (18.0%) |
| 5 or more Children | 976 (77.2%) | 288 (22.8%) |
| Total | 320,620 (93.4%) | 22,771 (6.6%) |
Income Below Poverty Among Single-Parent Households in Area Code 818
According to the poverty data in Area Code 818, 11.0% or 5,264 single-father households and 18.6% or 17,953 single-mother households are living below the poverty line. Among single-father households, those with 5 or more children have the highest poverty rate, with 43 households (44.8%) experiencing poverty. Likewise, among single-mother households, those with 5 or more children have the highest poverty rate, with 250 households (60.4%) falling below the poverty line.
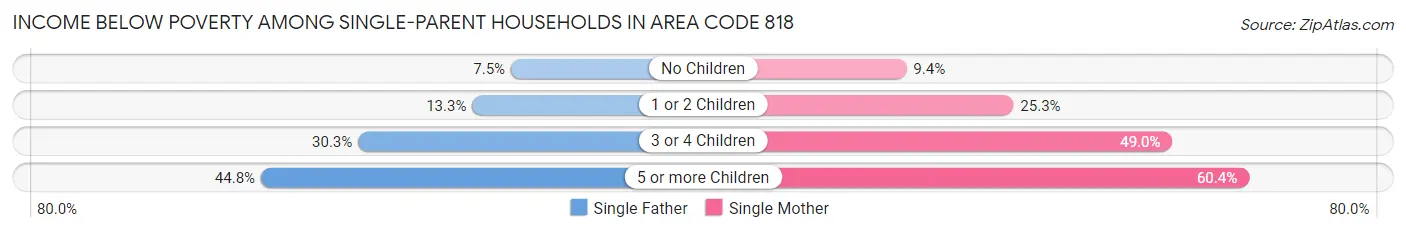
| Children | Single Father | Single Mother |
| No Children | 2,120 (7.5%) | 4,772 (9.3%) |
| 1 or 2 Children | 2,246 (13.3%) | 9,855 (25.3%) |
| 3 or 4 Children | 855 (30.3%) | 3,076 (49.0%) |
| 5 or more Children | 43 (44.8%) | 250 (60.4%) |
| Total | 5,264 (11.0%) | 17,953 (18.6%) |
Income Below Poverty Among Married-Couple vs Single-Parent Households in Area Code 818
The poverty data for Area Code 818 shows that 22,771 of the married-couple family households (6.6%) and 23,217 of the single-parent households (16.1%) are living below the poverty level. Within the married-couple family households, those with 5 or more children have the highest poverty rate, with 288 households (22.8%) falling below the poverty line. Among the single-parent households, those with 5 or more children have the highest poverty rate, with 293 household (57.5%) living below poverty.
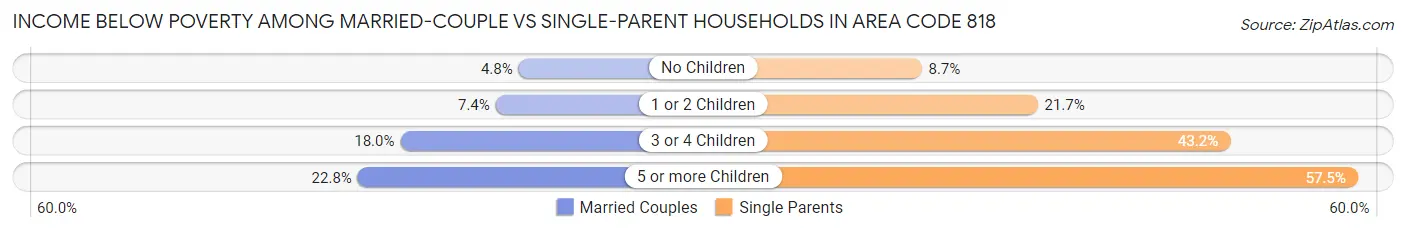
| Children | Married-Couple Families | Single-Parent Households |
| No Children | 9,395 (4.8%) | 6,892 (8.7%) |
| 1 or 2 Children | 9,192 (7.4%) | 12,101 (21.7%) |
| 3 or 4 Children | 3,896 (18.0%) | 3,931 (43.2%) |
| 5 or more Children | 288 (22.8%) | 293 (57.5%) |
| Total | 22,771 (6.6%) | 23,217 (16.1%) |
Race in Area Code 818
The most populous races in Area Code 818 are White / Caucasian (1,064,680 | 48.9%), Hispanic or Latino (813,037 | 37.3%), and Some other Race (412,412 | 18.9%).
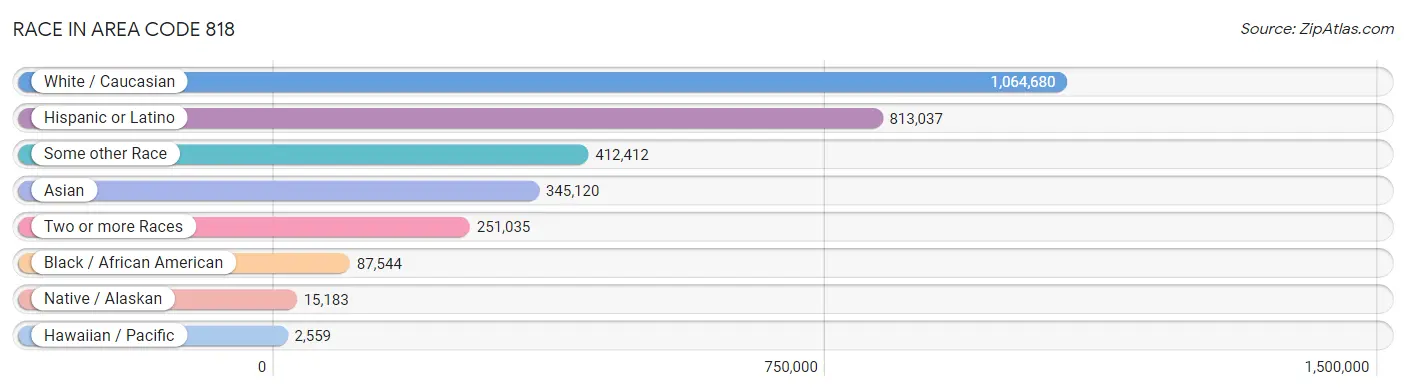
| Race | # Population | % Population |
| Asian | 345,120 | 15.8% |
| Black / African American | 87,544 | 4.0% |
| Hawaiian / Pacific | 2,559 | 0.1% |
| Hispanic or Latino | 813,037 | 37.3% |
| Native / Alaskan | 15,183 | 0.7% |
| White / Caucasian | 1,064,680 | 48.9% |
| Two or more Races | 251,035 | 11.5% |
| Some other Race | 412,412 | 18.9% |
| Total | 2,178,533 | 100.0% |
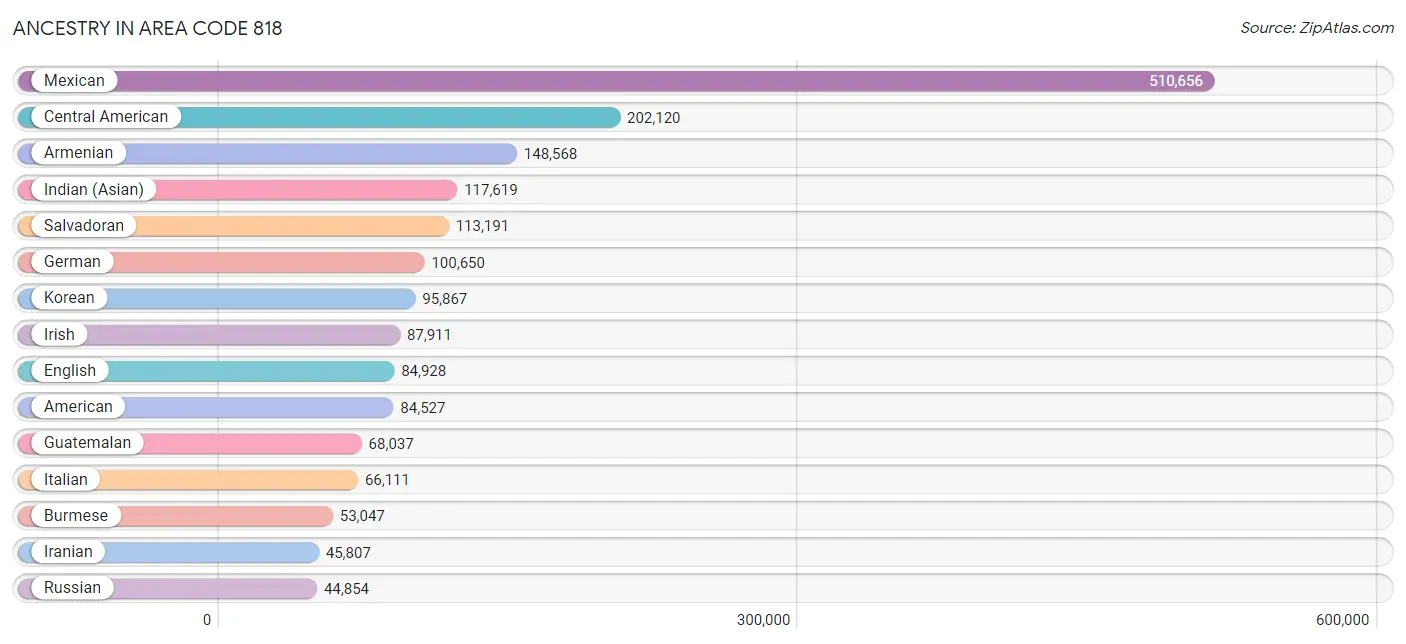
Ancestry in Area Code 818
The most populous ancestries reported in Area Code 818 are Mexican (510,656 | 23.4%), Central American (202,120 | 9.3%), Armenian (148,568 | 6.8%), Indian (Asian) (117,619 | 5.4%), and Salvadoran (113,191 | 5.2%), together accounting for 50.1% of all Area Code 818 residents.
| Ancestry | # Population | % Population |
| Afghan | 2,697 | 0.1% |
| African | 6,319 | 0.3% |
| Alaska Native | 79 | 0.0% |
| Alaskan Athabascan | 19 | 0.0% |
| Albanian | 197 | 0.0% |
| Aleut | 21 | 0.0% |
| American | 84,527 | 3.9% |
| Apache | 1,333 | 0.1% |
| Arab | 25,040 | 1.1% |
| Argentinean | 5,979 | 0.3% |
| Armenian | 148,568 | 6.8% |
| Assyrian / Chaldean / Syriac | 1,616 | 0.1% |
| Australian | 1,619 | 0.1% |
| Austrian | 5,206 | 0.2% |
| Bahamian | 177 | 0.0% |
| Bangladeshi | 161 | 0.0% |
| Barbadian | 80 | 0.0% |
| Basque | 723 | 0.0% |
| Belgian | 1,292 | 0.1% |
| Belizean | 1,182 | 0.1% |
| Bermudan | 31 | 0.0% |
| Bhutanese | 29,908 | 1.4% |
| Blackfeet | 931 | 0.0% |
| Bolivian | 2,036 | 0.1% |
| Brazilian | 3,690 | 0.2% |
| British | 11,372 | 0.5% |
| British West Indian | 350 | 0.0% |
| Bulgarian | 969 | 0.0% |
| Burmese | 53,047 | 2.4% |
| Cajun | 72 | 0.0% |
| Cambodian | 381 | 0.0% |
| Canadian | 3,956 | 0.2% |
| Cape Verdean | 322 | 0.0% |
| Carpatho Rusyn | 25 | 0.0% |
| Celtic | 108 | 0.0% |
| Central American | 202,120 | 9.3% |
| Central American Indian | 4,709 | 0.2% |
| Cherokee | 4,081 | 0.2% |
| Cheyenne | 59 | 0.0% |
| Chickasaw | 343 | 0.0% |
| Chilean | 2,692 | 0.1% |
| Chinese | 68 | 0.0% |
| Chippewa | 312 | 0.0% |
| Choctaw | 1,042 | 0.1% |
| Colombian | 11,191 | 0.5% |
| Comanche | 63 | 0.0% |
| Costa Rican | 2,056 | 0.1% |
| Cree | 27 | 0.0% |
| Creek | 132 | 0.0% |
| Croatian | 2,264 | 0.1% |
| Crow | 13 | 0.0% |
| Cuban | 9,034 | 0.4% |
| Cypriot | 38 | 0.0% |
| Czech | 3,763 | 0.2% |
| Czechoslovakian | 1,307 | 0.1% |
| Danish | 4,831 | 0.2% |
| Delaware | 241 | 0.0% |
| Dominican | 1,814 | 0.1% |
| Dutch | 8,953 | 0.4% |
| Dutch West Indian | 4 | 0.0% |
| Eastern European | 15,080 | 0.7% |
| Ecuadorian | 4,760 | 0.2% |
| Egyptian | 5,047 | 0.2% |
| English | 84,928 | 3.9% |
| Estonian | 188 | 0.0% |
| Ethiopian | 1,415 | 0.1% |
| European | 31,768 | 1.5% |
| Filipino | 6,594 | 0.3% |
| Finnish | 1,758 | 0.1% |
| French | 24,924 | 1.1% |
| French American Indian | 103 | 0.0% |
| French Canadian | 3,682 | 0.2% |
| German | 100,650 | 4.6% |
| German Russian | 22 | 0.0% |
| Ghanaian | 1,096 | 0.1% |
| Greek | 8,308 | 0.4% |
| Guamanian / Chamorro | 964 | 0.0% |
| Guatemalan | 68,037 | 3.1% |
| Guyanese | 273 | 0.0% |
| Haitian | 794 | 0.0% |
| Hmong | 41 | 0.0% |
| Honduran | 8,872 | 0.4% |
| Hopi | 65 | 0.0% |
| Hungarian | 9,091 | 0.4% |
| Icelander | 346 | 0.0% |
| Indian (Asian) | 117,619 | 5.4% |
| Indonesian | 1,405 | 0.1% |
| Inupiat | 30 | 0.0% |
| Iranian | 45,807 | 2.1% |
| Iraqi | 1,255 | 0.1% |
| Irish | 87,911 | 4.0% |
| Iroquois | 362 | 0.0% |
| Israeli | 7,367 | 0.3% |
| Italian | 66,111 | 3.0% |
| Jamaican | 2,420 | 0.1% |
| Japanese | 3,786 | 0.2% |
| Jordanian | 987 | 0.1% |
| Kenyan | 264 | 0.0% |
| Kiowa | 37 | 0.0% |
| Korean | 95,867 | 4.4% |
| Laotian | 4,615 | 0.2% |
| Latvian | 592 | 0.0% |
| Lebanese | 6,487 | 0.3% |
| Liberian | 92 | 0.0% |
| Lithuanian | 3,070 | 0.1% |
| Lumbee | 20 | 0.0% |
| Luxembourger | 36 | 0.0% |
| Macedonian | 150 | 0.0% |
| Malaysian | 739 | 0.0% |
| Maltese | 134 | 0.0% |
| Menominee | 42 | 0.0% |
| Mexican | 510,656 | 23.4% |
| Mexican American Indian | 8,983 | 0.4% |
| Mongolian | 375 | 0.0% |
| Moroccan | 1,123 | 0.1% |
| Native Hawaiian | 2,016 | 0.1% |
| Navajo | 1,082 | 0.1% |
| Nepalese | 136 | 0.0% |
| New Zealander | 195 | 0.0% |
| Nicaraguan | 6,719 | 0.3% |
| Nigerian | 2,315 | 0.1% |
| Northern European | 2,509 | 0.1% |
| Norwegian | 11,878 | 0.5% |
| Okinawan | 116 | 0.0% |
| Osage | 168 | 0.0% |
| Paiute | 20 | 0.0% |
| Pakistani | 9,563 | 0.4% |
| Palestinian | 1,497 | 0.1% |
| Panamanian | 1,188 | 0.1% |
| Paraguayan | 66 | 0.0% |
| Pennsylvania German | 173 | 0.0% |
| Peruvian | 10,480 | 0.5% |
| Pima | 33 | 0.0% |
| Polish | 34,134 | 1.6% |
| Portuguese | 5,188 | 0.2% |
| Potawatomi | 14 | 0.0% |
| Pueblo | 622 | 0.0% |
| Puerto Rican | 10,575 | 0.5% |
| Romanian | 5,448 | 0.3% |
| Russian | 44,854 | 2.1% |
| Salvadoran | 113,191 | 5.2% |
| Samoan | 1,402 | 0.1% |
| Scandinavian | 3,104 | 0.1% |
| Scotch-Irish | 6,768 | 0.3% |
| Scottish | 17,578 | 0.8% |
| Seminole | 97 | 0.0% |
| Senegalese | 83 | 0.0% |
| Serbian | 1,510 | 0.1% |
| Shoshone | 56 | 0.0% |
| Sierra Leonean | 149 | 0.0% |
| Sioux | 461 | 0.0% |
| Slavic | 829 | 0.0% |
| Slovak | 1,737 | 0.1% |
| Slovene | 586 | 0.0% |
| Somali | 35 | 0.0% |
| South African | 1,088 | 0.1% |
| South American | 41,315 | 1.9% |
| South American Indian | 732 | 0.0% |
| Soviet Union | 66 | 0.0% |
| Spaniard | 7,584 | 0.4% |
| Spanish | 4,992 | 0.2% |
| Spanish American | 272 | 0.0% |
| Spanish American Indian | 101 | 0.0% |
| Sri Lankan | 28,947 | 1.3% |
| Subsaharan African | 14,254 | 0.6% |
| Sudanese | 30 | 0.0% |
| Swedish | 11,728 | 0.5% |
| Swiss | 3,224 | 0.2% |
| Syrian | 2,414 | 0.1% |
| Taiwanese | 188 | 0.0% |
| Thai | 35,617 | 1.6% |
| Tlingit-Haida | 59 | 0.0% |
| Tohono O'Odham | 42 | 0.0% |
| Tongan | 588 | 0.0% |
| Trinidadian and Tobagonian | 748 | 0.0% |
| Turkish | 2,383 | 0.1% |
| U.S. Virgin Islander | 185 | 0.0% |
| Ugandan | 303 | 0.0% |
| Ukrainian | 10,539 | 0.5% |
| Uruguayan | 950 | 0.0% |
| Ute | 13 | 0.0% |
| Venezuelan | 2,686 | 0.1% |
| Vietnamese | 2,408 | 0.1% |
| Welsh | 4,969 | 0.2% |
| West Indian | 645 | 0.0% |
| Yaqui | 793 | 0.0% |
| Yugoslavian | 694 | 0.0% |
| Yuman | 27 | 0.0% |
| Zimbabwean | 55 | 0.0% | View All 189 Rows |
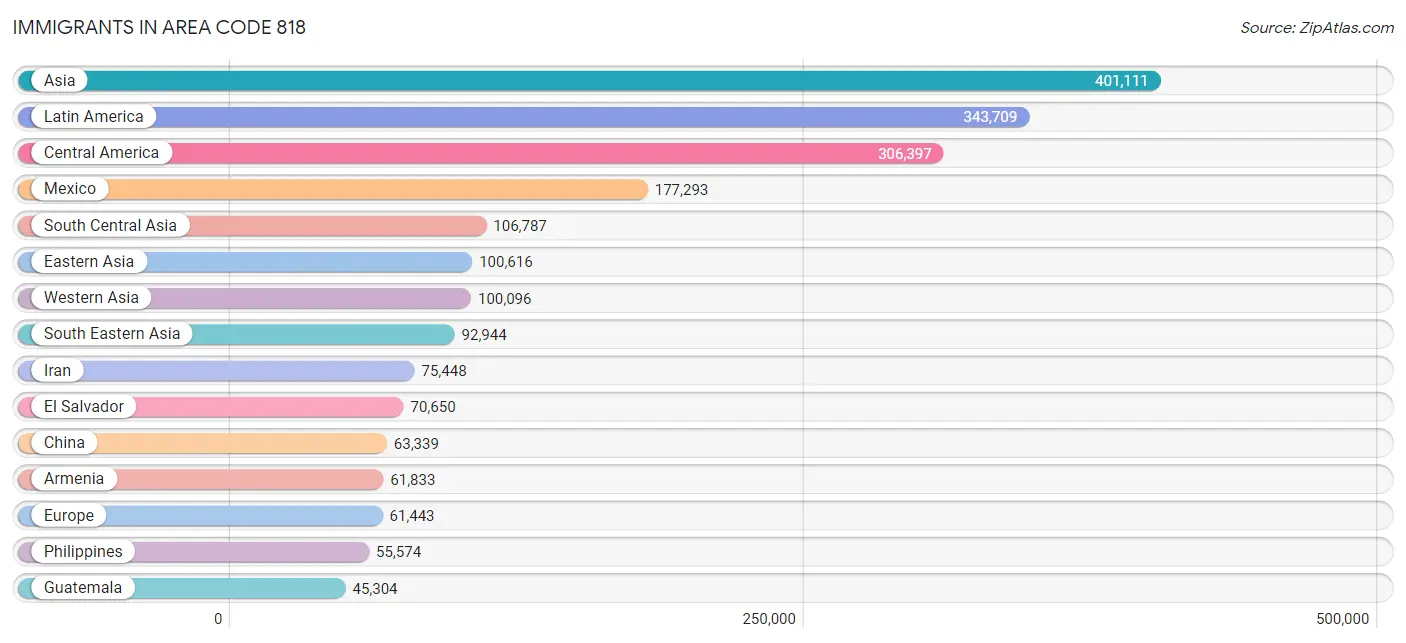
Immigrants in Area Code 818
The most numerous immigrant groups reported in Area Code 818 came from Asia (401,111 | 18.4%), Latin America (343,709 | 15.8%), Central America (306,397 | 14.1%), Mexico (177,293 | 8.1%), and South Central Asia (106,787 | 4.9%), together accounting for 61.3% of all Area Code 818 residents.
| Immigration Origin | # Population | % Population |
| Afghanistan | 2,048 | 0.1% |
| Africa | 13,271 | 0.6% |
| Albania | 73 | 0.0% |
| Argentina | 3,934 | 0.2% |
| Armenia | 61,833 | 2.8% |
| Asia | 401,111 | 18.4% |
| Australia | 2,192 | 0.1% |
| Austria | 783 | 0.0% |
| Azores | 12 | 0.0% |
| Bahamas | 30 | 0.0% |
| Bangladesh | 3,525 | 0.2% |
| Barbados | 29 | 0.0% |
| Belarus | 1,217 | 0.1% |
| Belgium | 497 | 0.0% |
| Belize | 812 | 0.0% |
| Bolivia | 1,588 | 0.1% |
| Bosnia and Herzegovina | 332 | 0.0% |
| Brazil | 3,761 | 0.2% |
| Bulgaria | 1,335 | 0.1% |
| Cambodia | 2,544 | 0.1% |
| Cameroon | 53 | 0.0% |
| Canada | 8,538 | 0.4% |
| Caribbean | 6,577 | 0.3% |
| Central America | 306,397 | 14.1% |
| Chile | 1,828 | 0.1% |
| China | 63,339 | 2.9% |
| Colombia | 6,353 | 0.3% |
| Costa Rica | 817 | 0.0% |
| Croatia | 584 | 0.0% |
| Cuba | 3,312 | 0.2% |
| Czechoslovakia | 741 | 0.0% |
| Denmark | 298 | 0.0% |
| Dominica | 12 | 0.0% |
| Dominican Republic | 647 | 0.0% |
| Eastern Africa | 2,617 | 0.1% |
| Eastern Asia | 100,616 | 4.6% |
| Eastern Europe | 33,115 | 1.5% |
| Ecuador | 2,824 | 0.1% |
| Egypt | 4,113 | 0.2% |
| El Salvador | 70,650 | 3.2% |
| England | 4,000 | 0.2% |
| Eritrea | 136 | 0.0% |
| Ethiopia | 564 | 0.0% |
| Europe | 61,443 | 2.8% |
| Fiji | 127 | 0.0% |
| France | 3,937 | 0.2% |
| Germany | 4,611 | 0.2% |
| Ghana | 712 | 0.0% |
| Greece | 1,267 | 0.1% |
| Grenada | 199 | 0.0% |
| Guatemala | 45,304 | 2.1% |
| Guyana | 255 | 0.0% |
| Haiti | 399 | 0.0% |
| Honduras | 6,892 | 0.3% |
| Hong Kong | 6,968 | 0.3% |
| Hungary | 1,220 | 0.1% |
| India | 19,120 | 0.9% |
| Indonesia | 3,782 | 0.2% |
| Iran | 75,448 | 3.5% |
| Iraq | 4,905 | 0.2% |
| Ireland | 747 | 0.0% |
| Israel | 8,393 | 0.4% |
| Italy | 2,993 | 0.1% |
| Jamaica | 1,092 | 0.1% |
| Japan | 6,994 | 0.3% |
| Jordan | 1,088 | 0.1% |
| Kazakhstan | 1,296 | 0.1% |
| Kenya | 599 | 0.0% |
| Korea | 30,140 | 1.4% |
| Kuwait | 869 | 0.0% |
| Laos | 428 | 0.0% |
| Latin America | 343,709 | 15.8% |
| Latvia | 168 | 0.0% |
| Lebanon | 8,080 | 0.4% |
| Liberia | 48 | 0.0% |
| Lithuania | 300 | 0.0% |
| Malaysia | 996 | 0.1% |
| Mexico | 177,293 | 8.1% |
| Micronesia | 34 | 0.0% |
| Middle Africa | 177 | 0.0% |
| Moldova | 694 | 0.0% |
| Morocco | 663 | 0.0% |
| Nepal | 546 | 0.0% |
| Netherlands | 905 | 0.0% |
| Nicaragua | 3,380 | 0.2% |
| Nigeria | 1,324 | 0.1% |
| North Macedonia | 111 | 0.0% |
| Northern Africa | 5,475 | 0.3% |
| Northern Europe | 11,388 | 0.5% |
| Norway | 146 | 0.0% |
| Oceania | 3,439 | 0.2% |
| Pakistan | 1,762 | 0.1% |
| Panama | 518 | 0.0% |
| Peru | 7,172 | 0.3% |
| Philippines | 55,574 | 2.5% |
| Poland | 2,120 | 0.1% |
| Portugal | 268 | 0.0% |
| Romania | 2,317 | 0.1% |
| Russia | 11,390 | 0.5% |
| Saudi Arabia | 541 | 0.0% |
| Scotland | 727 | 0.0% |
| Senegal | 103 | 0.0% |
| Serbia | 457 | 0.0% |
| Sierra Leone | 117 | 0.0% |
| Singapore | 538 | 0.0% |
| Somalia | 12 | 0.0% |
| South Africa | 2,030 | 0.1% |
| South America | 30,735 | 1.4% |
| South Central Asia | 106,787 | 4.9% |
| South Eastern Asia | 92,944 | 4.3% |
| Southern Europe | 5,484 | 0.3% |
| Spain | 910 | 0.0% |
| Sri Lanka | 1,678 | 0.1% |
| St. Vincent and the Grenadines | 54 | 0.0% |
| Sudan | 187 | 0.0% |
| Sweden | 1,029 | 0.1% |
| Switzerland | 608 | 0.0% |
| Syria | 6,278 | 0.3% |
| Taiwan | 9,036 | 0.4% |
| Thailand | 6,311 | 0.3% |
| Trinidad and Tobago | 269 | 0.0% |
| Turkey | 2,324 | 0.1% |
| Uganda | 731 | 0.0% |
| Ukraine | 7,775 | 0.4% |
| Uruguay | 682 | 0.0% |
| Uzbekistan | 981 | 0.1% |
| Venezuela | 2,053 | 0.1% |
| Vietnam | 21,173 | 1.0% |
| West Indies | 253 | 0.0% |
| Western Africa | 2,500 | 0.1% |
| Western Asia | 100,096 | 4.6% |
| Western Europe | 11,406 | 0.5% |
| Yemen | 7 | 0.0% |
| Zaire | 105 | 0.0% |
| Zimbabwe | 191 | 0.0% | View All 135 Rows |
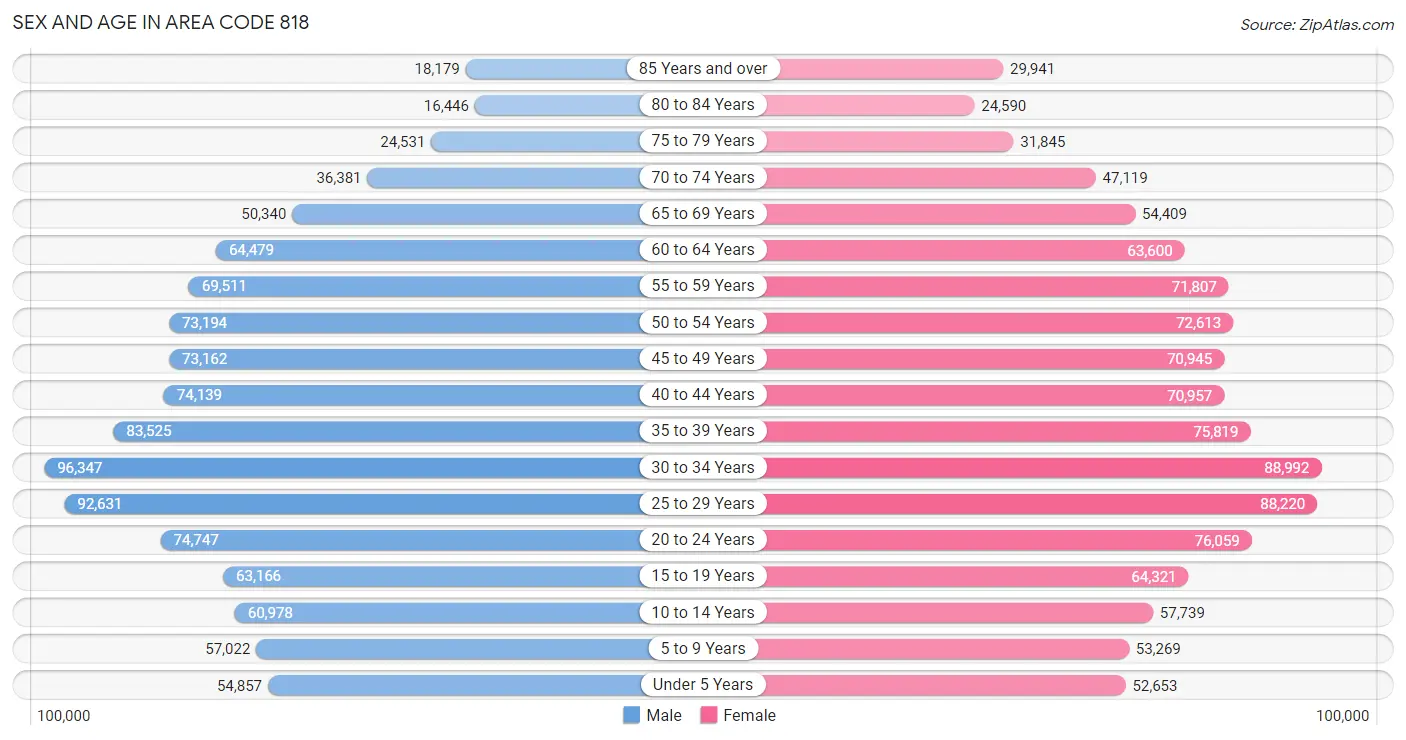
Sex and Age in Area Code 818
Sex and Age in Area Code 818
The most populous age groups in Area Code 818 are 30 to 34 Years (96,347 | 8.9%) for men and 30 to 34 Years (88,992 | 8.1%) for women.
| Age Bracket | Male | Female |
| Under 5 Years | 54,857 (5.1%) | 52,653 (4.8%) |
| 5 to 9 Years | 57,022 (5.3%) | 53,269 (4.9%) |
| 10 to 14 Years | 60,978 (5.6%) | 57,739 (5.3%) |
| 15 to 19 Years | 63,166 (5.8%) | 64,321 (5.9%) |
| 20 to 24 Years | 74,747 (6.9%) | 76,059 (7.0%) |
| 25 to 29 Years | 92,631 (8.6%) | 88,220 (8.1%) |
| 30 to 34 Years | 96,347 (8.9%) | 88,992 (8.1%) |
| 35 to 39 Years | 83,525 (7.7%) | 75,819 (6.9%) |
| 40 to 44 Years | 74,139 (6.8%) | 70,957 (6.5%) |
| 45 to 49 Years | 73,162 (6.8%) | 70,945 (6.5%) |
| 50 to 54 Years | 73,194 (6.8%) | 72,613 (6.6%) |
| 55 to 59 Years | 69,511 (6.4%) | 71,807 (6.6%) |
| 60 to 64 Years | 64,479 (5.9%) | 63,600 (5.8%) |
| 65 to 69 Years | 50,340 (4.6%) | 54,409 (5.0%) |
| 70 to 74 Years | 36,381 (3.4%) | 47,119 (4.3%) |
| 75 to 79 Years | 24,531 (2.3%) | 31,845 (2.9%) |
| 80 to 84 Years | 16,446 (1.5%) | 24,590 (2.2%) |
| 85 Years and over | 18,179 (1.7%) | 29,941 (2.7%) |
| Total | 1,083,635 (100.0%) | 1,094,898 (100.0%) |
Families and Households in Area Code 818
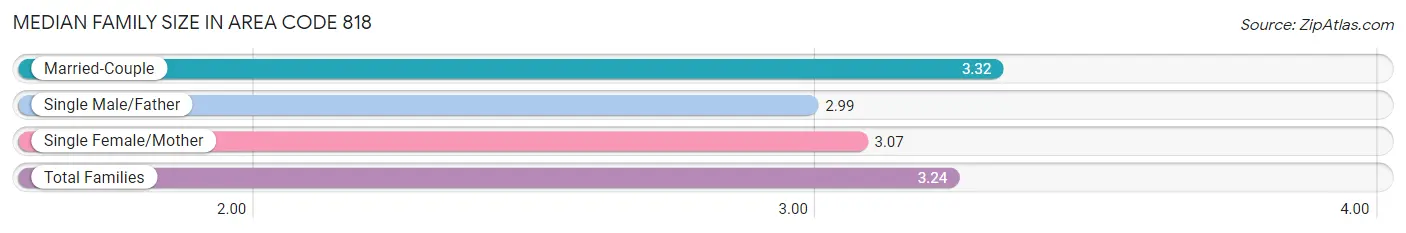
Median Family Size in Area Code 818
The median family size in Area Code 818 is 3.24 persons per family, with married-couple families (343,391 | 70.4%) accounting for the largest median family size of 3.31529 persons per family. On the other hand, single male/father families (47,964 | 9.8%) represent the smallest median family size with 2.99 persons per family.
| Family Type | # Families | Family Size |
| Married-Couple | 343,391 (70.4%) | 3.32 |
| Single Male/Father | 47,964 (9.8%) | 2.99 |
| Single Female/Mother | 96,676 (19.8%) | 3.07 |
| Total Families | 488,031 (100.0%) | 3.24 |
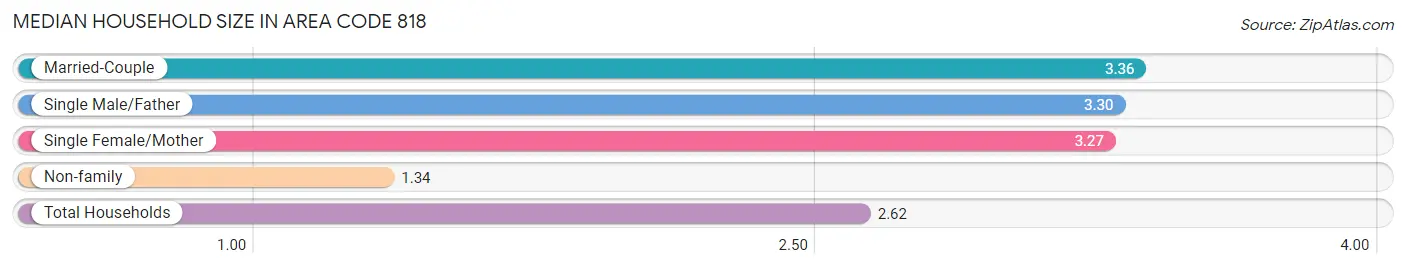
Median Household Size in Area Code 818
The median household size in Area Code 818 is 2.62 persons per household, with married-couple households (343,391 | 43.0%) accounting for the largest median household size of 3.35588 persons per household. non-family households (309,931 | 38.8%) represent the smallest median household size with 1.34 persons per household.
| Household Type | # Households | Household Size |
| Married-Couple | 343,391 (43.0%) | 3.36 |
| Single Male/Father | 47,964 (6.0%) | 3.30 |
| Single Female/Mother | 96,676 (12.1%) | 3.27 |
| Non-family | 309,931 (38.8%) | 1.34 |
| Total Households | 797,962 (100.0%) | 2.62 |
Household Size by Marriage Status in Area Code 818
Out of a total of 797,962 households in Area Code 818, 488,031 (61.2%) are family households, while 309,931 (38.8%) are nonfamily households. The most numerous type of family households are 2-person households, comprising 178,718, and the most common type of nonfamily households are 1-person households, comprising 233,084.
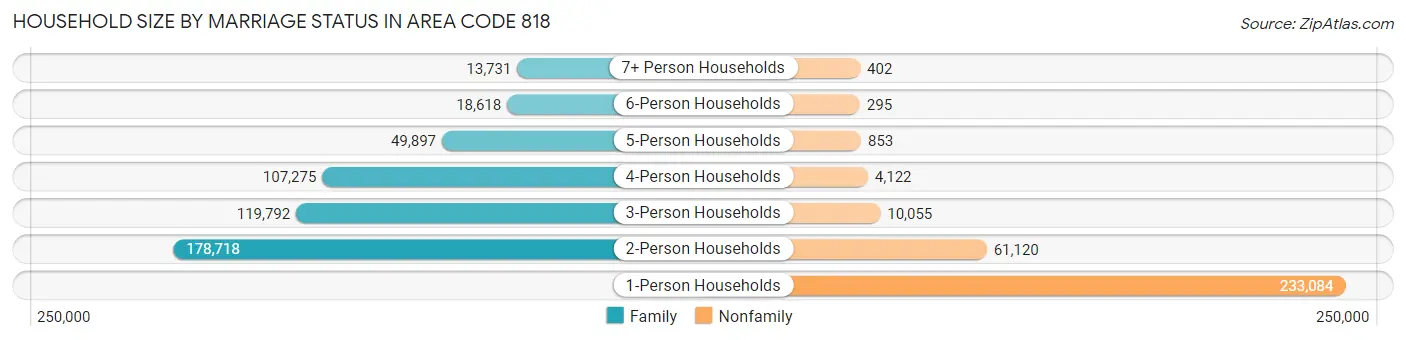
| Household Size | Family Households | Nonfamily Households |
| 1-Person Households | - | 233,084 (29.2%) |
| 2-Person Households | 178,718 (22.4%) | 61,120 (7.7%) |
| 3-Person Households | 119,792 (15.0%) | 10,055 (1.3%) |
| 4-Person Households | 107,275 (13.4%) | 4,122 (0.5%) |
| 5-Person Households | 49,897 (6.2%) | 853 (0.1%) |
| 6-Person Households | 18,618 (2.3%) | 295 (0.0%) |
| 7+ Person Households | 13,731 (1.7%) | 402 (0.1%) |
| Total | 488,031 (61.2%) | 309,931 (38.8%) |
Female Fertility in Area Code 818
Fertility by Age in Area Code 818
Average fertility rate in Area Code 818 is 43.8 births per 1,000 women. Women in the age bracket of 20 to 34 years have the highest fertility rate with 49.9 births per 1,000 women. Women in the age bracket of 20 to 34 years acount for 55.4% of all women with births.
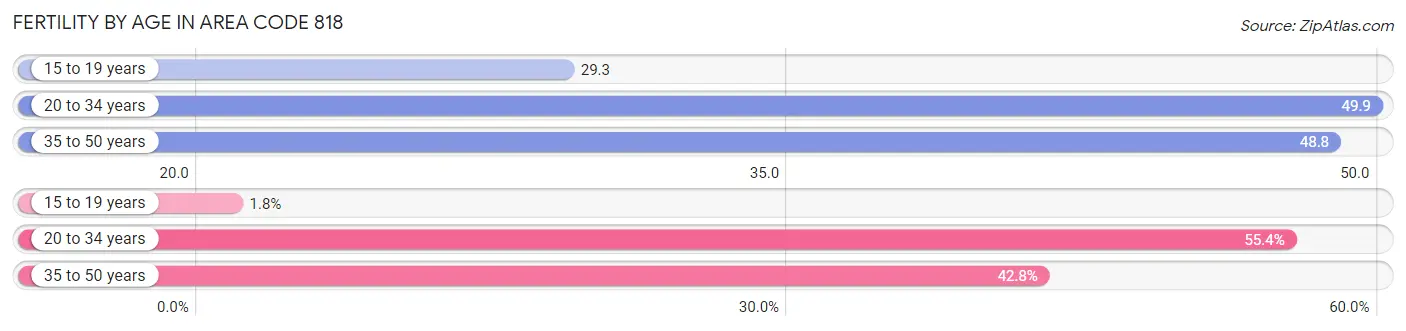
| Age Bracket | Women with Births | Births / 1,000 Women |
| 15 to 19 years | 386 (1.8%) | 29.3 |
| 20 to 34 years | 12,182 (55.4%) | 49.9 |
| 35 to 50 years | 9,421 (42.8%) | 48.8 |
| Total | 21,989 (100.0%) | 43.8 |
Fertility by Age by Marriage Status in Area Code 818
74.8% of women with births (21,989) in Area Code 818 are married. The highest percentage of unmarried women with births falls into 15 to 19 years age bracket with 96.4% of them unmarried at the time of birth, while the lowest percentage of unmarried women with births belong to 35 to 50 years age bracket with 26.9% of them unmarried.
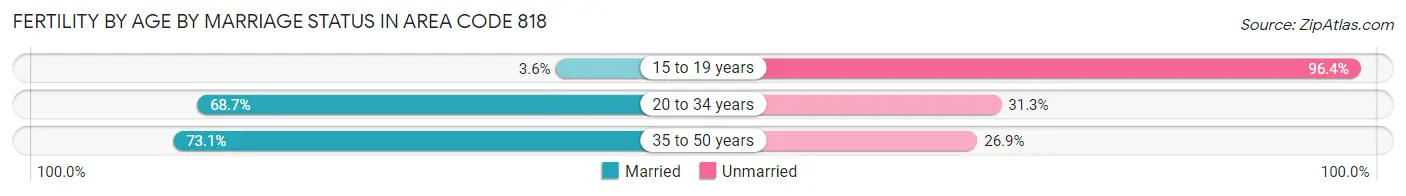
| Age Bracket | Married | Unmarried |
| 15 to 19 years | 14 (3.6%) | 372 (96.4%) |
| 20 to 34 years | 8,370 (68.7%) | 3,812 (31.3%) |
| 35 to 50 years | 6,884 (73.1%) | 2,537 (26.9%) |
| Total | 16,442 (74.8%) | 5,547 (25.2%) |
Fertility by Education in Area Code 818
Average fertility rate in Area Code 818 is 43.8 births per 1,000 women. Women with the education attainment of graduate degree have the highest fertility rate of 68.7 births per 1,000 women, while women with the education attainment of less than high school have the lowest fertility at 33.1 births per 1,000 women. Women with the education attainment of bachelor's degree represent 30.2% of all women with births.
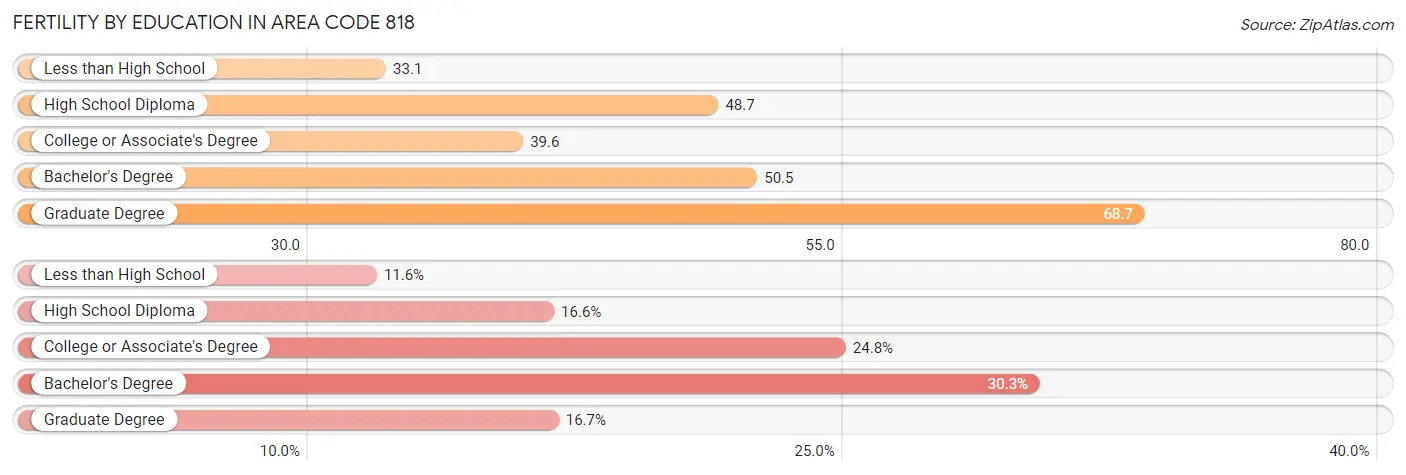
| Educational Attainment | Women with Births | Births / 1,000 Women |
| Less than High School | 2,555 (11.6%) | 33.1 |
| High School Diploma | 3,650 (16.6%) | 48.7 |
| College or Associate's Degree | 5,454 (24.8%) | 39.5 |
| Bachelor's Degree | 6,651 (30.2%) | 50.5 |
| Graduate Degree | 3,679 (16.7%) | 68.7 |
| Total | 21,989 (100.0%) | 43.8 |
Fertility by Education by Marriage Status in Area Code 818
25.2% of women with births in Area Code 818 are unmarried. Women with the educational attainment of graduate degree are most likely to be married with 89.5% of them married at childbirth, while women with the educational attainment of less than high school are least likely to be married with 57.7% of them unmarried at childbirth.
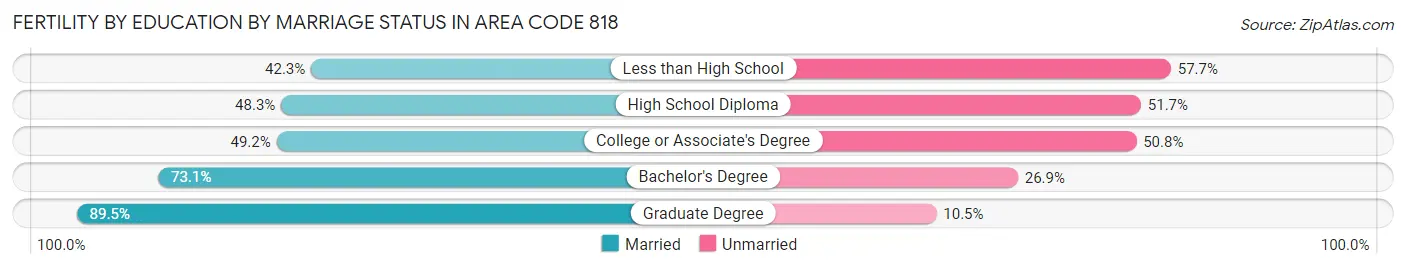
| Educational Attainment | Married | Unmarried |
| Less than High School | 1,080 (42.3%) | 1,475 (57.7%) |
| High School Diploma | 1,763 (48.3%) | 1,887 (51.7%) |
| College or Associate's Degree | 2,685 (49.2%) | 2,769 (50.8%) |
| Bachelor's Degree | 4,862 (73.1%) | 1,789 (26.9%) |
| Graduate Degree | 3,293 (89.5%) | 386 (10.5%) |
| Total | 16,442 (74.8%) | 5,547 (25.2%) |
Employment Characteristics in Area Code 818
Employment by Class of Employer in Area Code 818
Among the 1,077,236 employed individuals in Area Code 818, private company employees (706,944 | 65.6%), self-employed (not incorporated) (110,619 | 10.3%), and not-for-profit organizations (79,225 | 7.3%) make up the most common classes of employment.
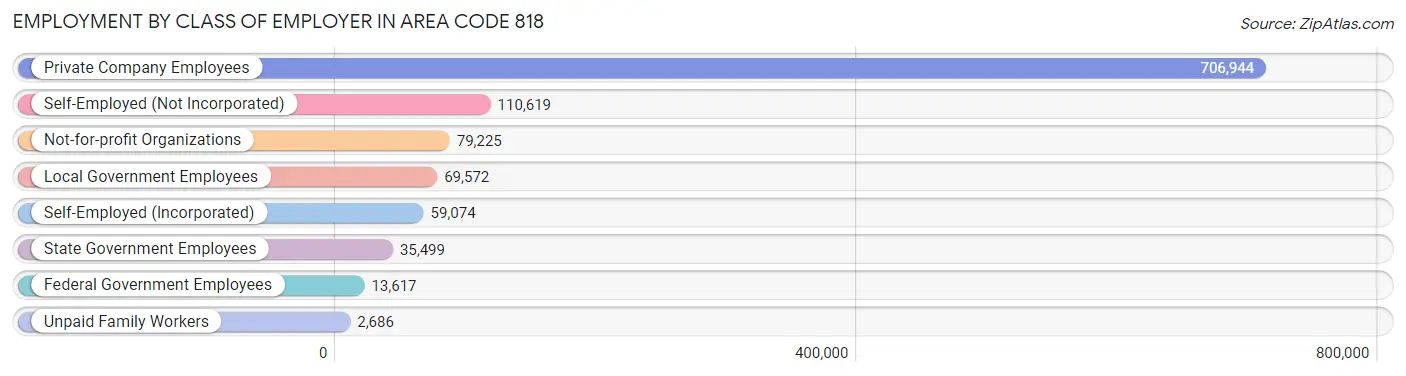
| Employer Class | # Employees | % Employees |
| Private Company Employees | 706,944 | 65.6% |
| Self-Employed (Incorporated) | 59,074 | 5.5% |
| Self-Employed (Not Incorporated) | 110,619 | 10.3% |
| Not-for-profit Organizations | 79,225 | 7.3% |
| Local Government Employees | 69,572 | 6.5% |
| State Government Employees | 35,499 | 3.3% |
| Federal Government Employees | 13,617 | 1.3% |
| Unpaid Family Workers | 2,686 | 0.3% |
| Total | 1,077,236 | 100.0% |
Employment Status by Age in Area Code 818
According to the labor force statistics for Area Code 818, out of the total population over 16 years of age (1,818,792), 64.7% or 1,176,213 individuals are in the labor force, with 7.2% or 84,570 of them unemployed. The age group with the highest labor force participation rate is 30 to 34 years, with 84.3% or 156,296 individuals in the labor force. Within the labor force, the 16 to 19 years age range has the highest percentage of unemployed individuals, with 1,332.3% or 369,367 of them being unemployed.
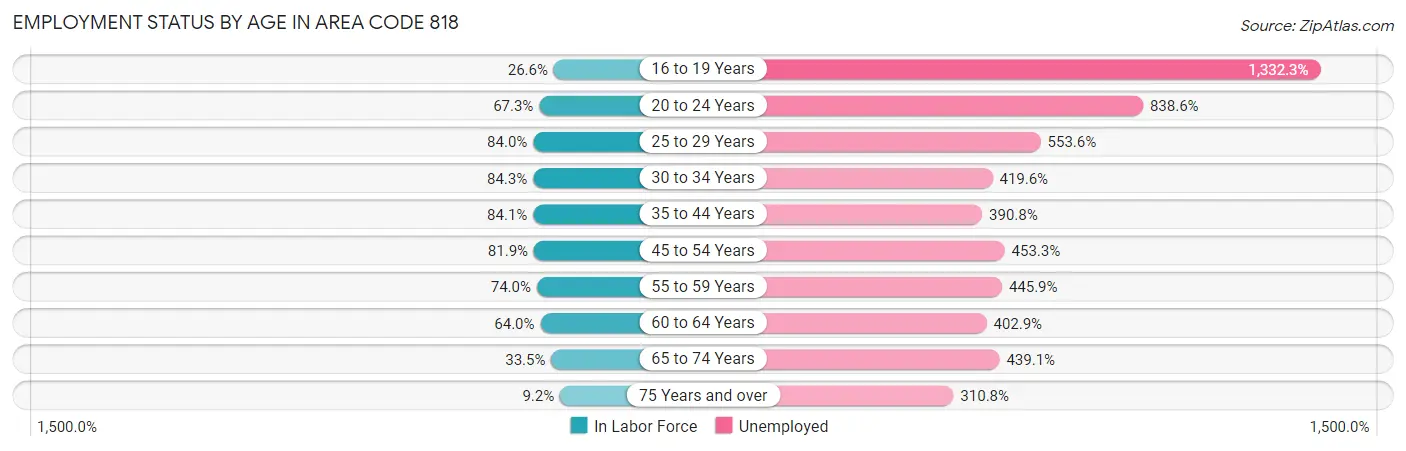
| Age Bracket | In Labor Force | Unemployed |
| 16 to 19 Years | 27,728 (26.6%) | 369,367 (1,332.3%) |
| 20 to 24 Years | 101,504 (67.3%) | 851,246 (838.6%) |
| 25 to 29 Years | 151,970 (84.0%) | 841,300 (553.6%) |
| 30 to 34 Years | 156,296 (84.3%) | 655,818 (419.6%) |
| 35 to 44 Years | 255,916 (84.1%) | 1,000,104 (390.8%) |
| 45 to 54 Years | 237,431 (81.9%) | 1,076,316 (453.3%) |
| 55 to 59 Years | 104,533 (74.0%) | 466,113 (445.9%) |
| 60 to 64 Years | 81,957 (64.0%) | 330,209 (402.9%) |
| 65 to 74 Years | 63,138 (33.5%) | 277,243 (439.1%) |
| 75 Years and over | 13,429 (9.2%) | 41,750 (310.8%) |
| Total | 1,176,304 (64.7%) | 84,529 (7.2%) |
Employment Status by Educational Attainment in Area Code 818
According to labor force statistics for Area Code 818, 80.4% of individuals (989,119) out of the total population between 25 and 64 years of age (1,229,941) are in the labor force, with 428.0% or 4,233,429 of them being unemployed. The group with the highest labor force participation rate are those with the educational attainment of bachelor's degree or higher, with 87.1% or 456,731 individuals in the labor force. Within the labor force, individuals with college / associate degree education have the highest percentage of unemployment, with 564.9% or 1,363,013 of them being unemployed.
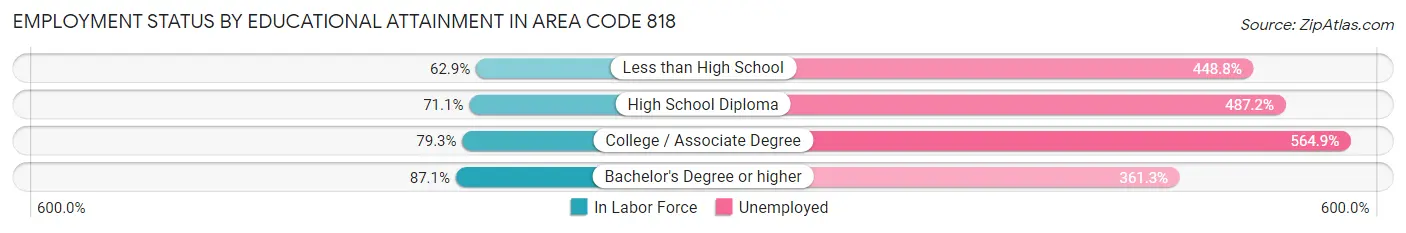
| Educational Attainment | In Labor Force | Unemployed |
| Less than High School | 111,127 (62.9%) | 792,563 (448.8%) |
| High School Diploma | 159,592 (71.1%) | 1,094,193 (487.2%) |
| College / Associate Degree | 241,270 (79.3%) | 1,719,454 (564.9%) |
| Bachelor's Degree or higher | 456,707 (87.1%) | 1,894,567 (361.3%) |
| Total | 989,148 (80.4%) | 5,264,147 (428.0%) |
Employment Occupations by Sex in Area Code 818
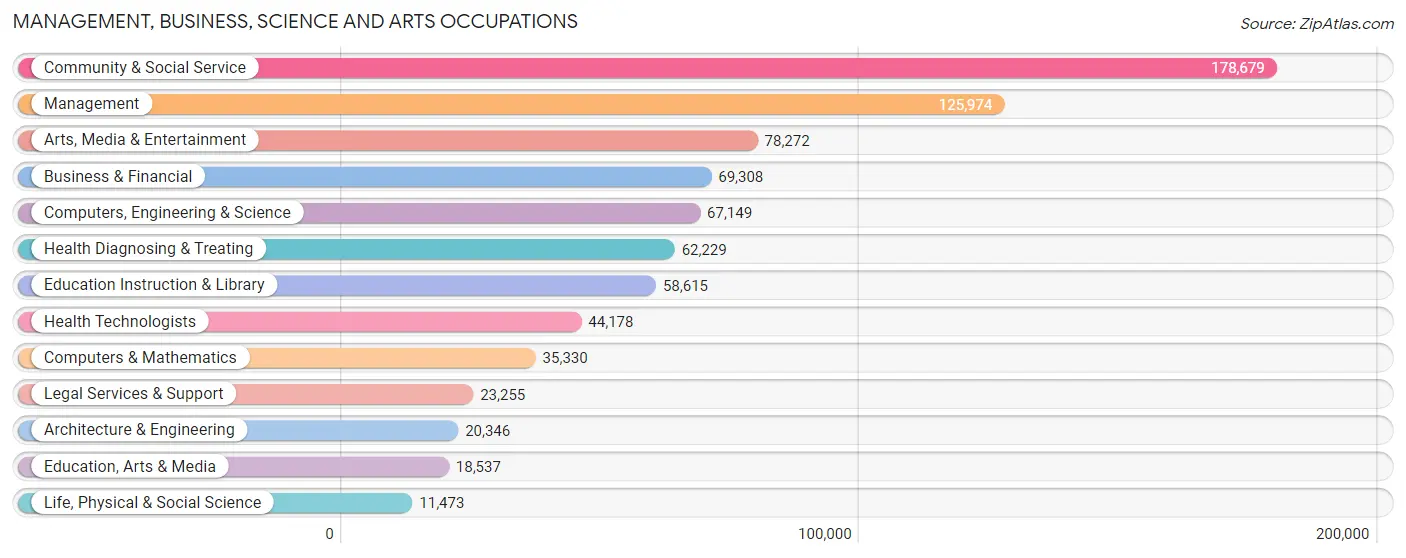
Management, Business, Science and Arts Occupations
The most common Management, Business, Science and Arts occupations in Area Code 818 are Community & Social Service (178,679 | 16.2%), Management (125,974 | 11.4%), Arts, Media & Entertainment (78,272 | 7.1%), Business & Financial (69,308 | 6.3%), and Computers, Engineering & Science (67,149 | 6.1%).
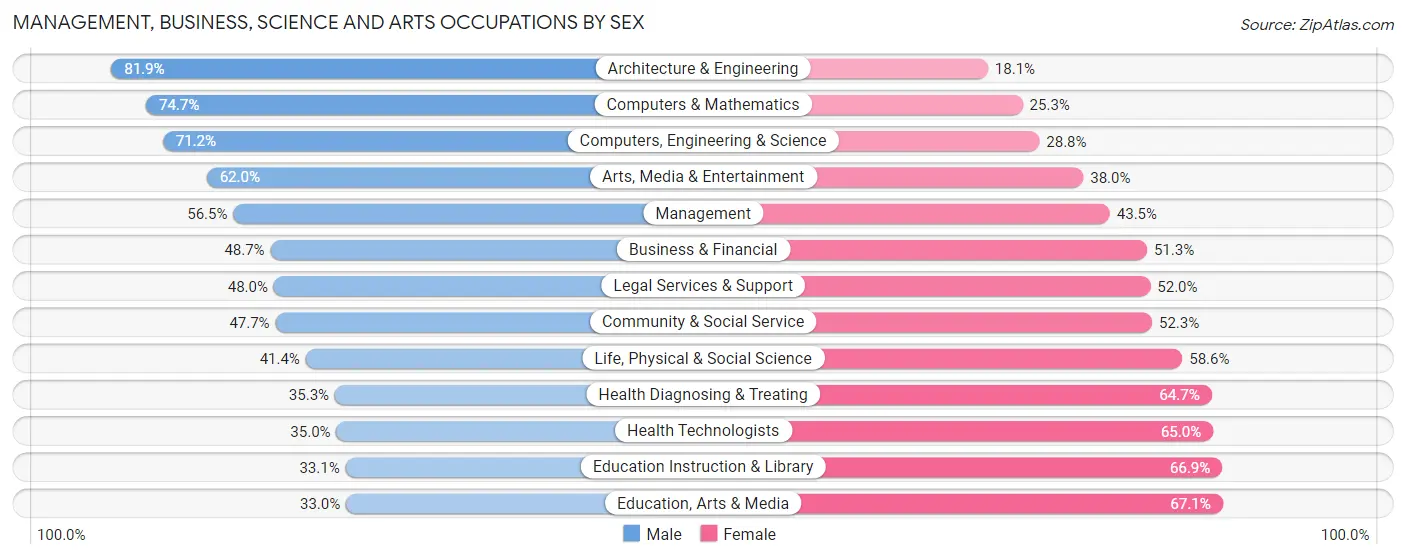
Management, Business, Science and Arts Occupations by Sex
Within the Management, Business, Science and Arts occupations in Area Code 818, the most male-oriented occupations are Architecture & Engineering (81.9%), Computers & Mathematics (74.7%), and Computers, Engineering & Science (71.2%), while the most female-oriented occupations are Education, Arts & Media (67.0%), Education Instruction & Library (66.9%), and Health Technologists (65.0%).
| Occupation | Male | Female |
| Management | 71,135 (56.5%) | 54,839 (43.5%) |
| Business & Financial | 33,769 (48.7%) | 35,539 (51.3%) |
| Computers, Engineering & Science | 47,787 (71.2%) | 19,362 (28.8%) |
| Computers & Mathematics | 26,376 (74.7%) | 8,954 (25.3%) |
| Architecture & Engineering | 16,666 (81.9%) | 3,680 (18.1%) |
| Life, Physical & Social Science | 4,745 (41.4%) | 6,728 (58.6%) |
| Community & Social Service | 85,182 (47.7%) | 93,497 (52.3%) |
| Education, Arts & Media | 6,108 (33.0%) | 12,429 (67.0%) |
| Legal Services & Support | 11,168 (48.0%) | 12,087 (52.0%) |
| Education Instruction & Library | 19,379 (33.1%) | 39,236 (66.9%) |
| Arts, Media & Entertainment | 48,527 (62.0%) | 29,745 (38.0%) |
| Health Diagnosing & Treating | 21,948 (35.3%) | 40,281 (64.7%) |
| Health Technologists | 15,445 (35.0%) | 28,733 (65.0%) |
| Total (Category) | 259,821 (51.6%) | 243,518 (48.4%) |
| Total (Overall) | 596,018 (53.9%) | 509,596 (46.1%) |
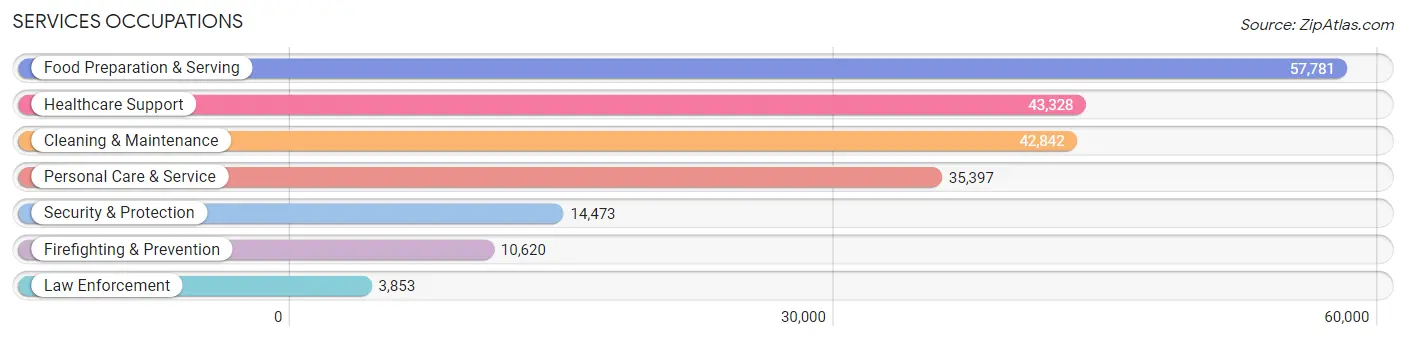
Services Occupations
The most common Services occupations in Area Code 818 are Food Preparation & Serving (57,781 | 5.2%), Healthcare Support (43,328 | 3.9%), Cleaning & Maintenance (42,842 | 3.9%), Personal Care & Service (35,397 | 3.2%), and Security & Protection (14,473 | 1.3%).
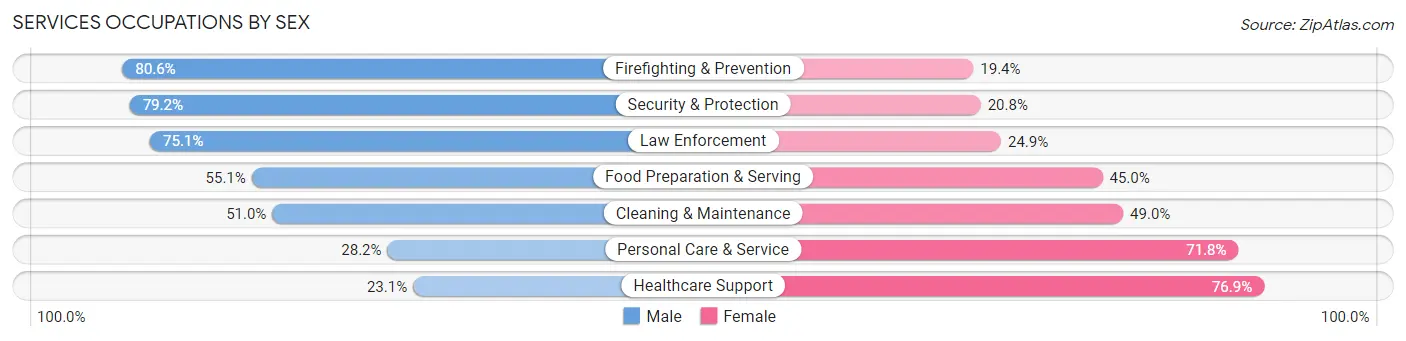
Services Occupations by Sex
Within the Services occupations in Area Code 818, the most male-oriented occupations are Firefighting & Prevention (80.6%), Security & Protection (79.2%), and Law Enforcement (75.1%), while the most female-oriented occupations are Healthcare Support (76.9%), Personal Care & Service (71.8%), and Cleaning & Maintenance (49.0%).
| Occupation | Male | Female |
| Healthcare Support | 10,003 (23.1%) | 33,325 (76.9%) |
| Security & Protection | 11,458 (79.2%) | 3,015 (20.8%) |
| Firefighting & Prevention | 8,563 (80.6%) | 2,057 (19.4%) |
| Law Enforcement | 2,895 (75.1%) | 958 (24.9%) |
| Food Preparation & Serving | 31,811 (55.0%) | 25,970 (45.0%) |
| Cleaning & Maintenance | 21,835 (51.0%) | 21,007 (49.0%) |
| Personal Care & Service | 9,968 (28.2%) | 25,429 (71.8%) |
| Total (Category) | 85,075 (43.9%) | 108,746 (56.1%) |
| Total (Overall) | 596,018 (53.9%) | 509,596 (46.1%) |
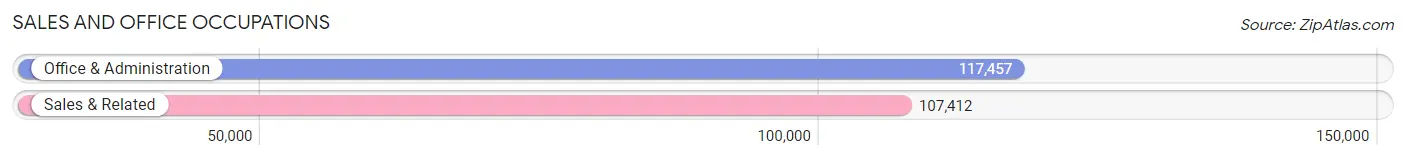
Sales and Office Occupations
The most common Sales and Office occupations in Area Code 818 are Office & Administration (117,457 | 10.6%), and Sales & Related (107,412 | 9.7%).
Sales and Office Occupations by Sex
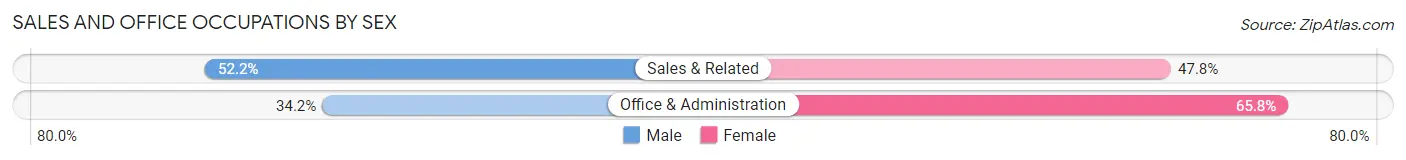
| Occupation | Male | Female |
| Sales & Related | 56,095 (52.2%) | 51,317 (47.8%) |
| Office & Administration | 40,204 (34.2%) | 77,253 (65.8%) |
| Total (Category) | 96,299 (42.8%) | 128,570 (57.2%) |
| Total (Overall) | 596,018 (53.9%) | 509,596 (46.1%) |
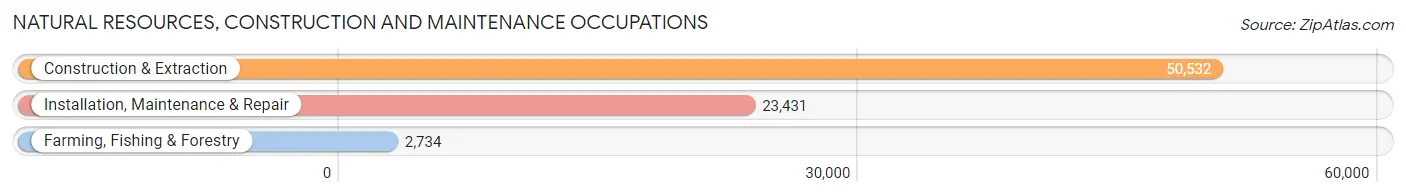
Natural Resources, Construction and Maintenance Occupations
The most common Natural Resources, Construction and Maintenance occupations in Area Code 818 are Construction & Extraction (50,532 | 4.6%), Installation, Maintenance & Repair (23,431 | 2.1%), and Farming, Fishing & Forestry (2,734 | 0.3%).
Natural Resources, Construction and Maintenance Occupations by Sex
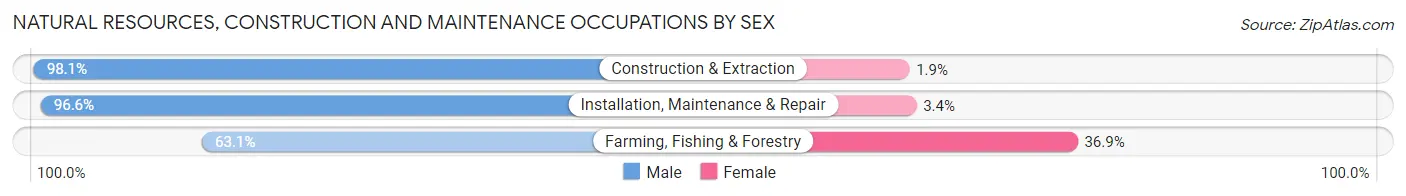
| Occupation | Male | Female |
| Farming, Fishing & Forestry | 1,724 (63.1%) | 1,010 (36.9%) |
| Construction & Extraction | 49,556 (98.1%) | 976 (1.9%) |
| Installation, Maintenance & Repair | 22,637 (96.6%) | 794 (3.4%) |
| Total (Category) | 73,917 (96.4%) | 2,780 (3.6%) |
| Total (Overall) | 596,018 (53.9%) | 509,596 (46.1%) |
Production, Transportation and Moving Occupations
The most common Production, Transportation and Moving occupations in Area Code 818 are Production (46,252 | 4.2%), Transportation (34,534 | 3.1%), and Material Moving (26,102 | 2.4%).
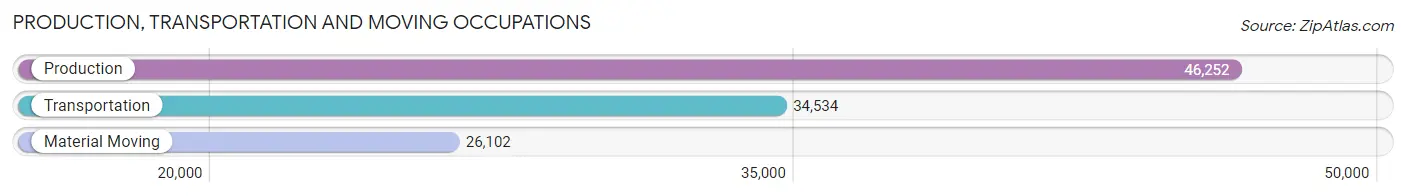
Production, Transportation and Moving Occupations by Sex
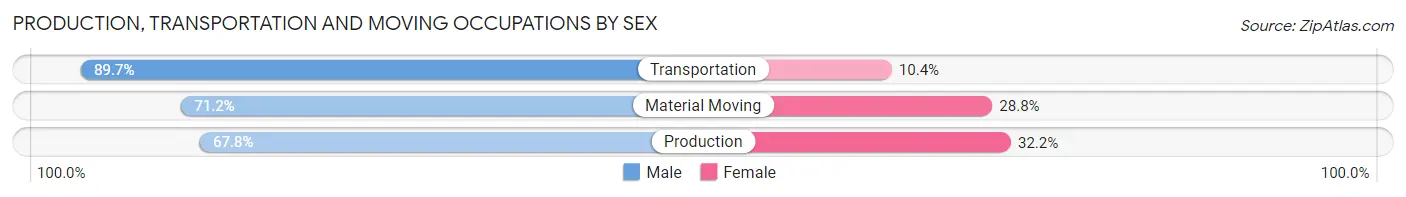
| Occupation | Male | Female |
| Production | 31,357 (67.8%) | 14,895 (32.2%) |
| Transportation | 30,960 (89.6%) | 3,574 (10.3%) |
| Material Moving | 18,589 (71.2%) | 7,513 (28.8%) |
| Total (Category) | 80,906 (75.7%) | 25,982 (24.3%) |
| Total (Overall) | 596,018 (53.9%) | 509,596 (46.1%) |
Employment Industries by Sex in Area Code 818
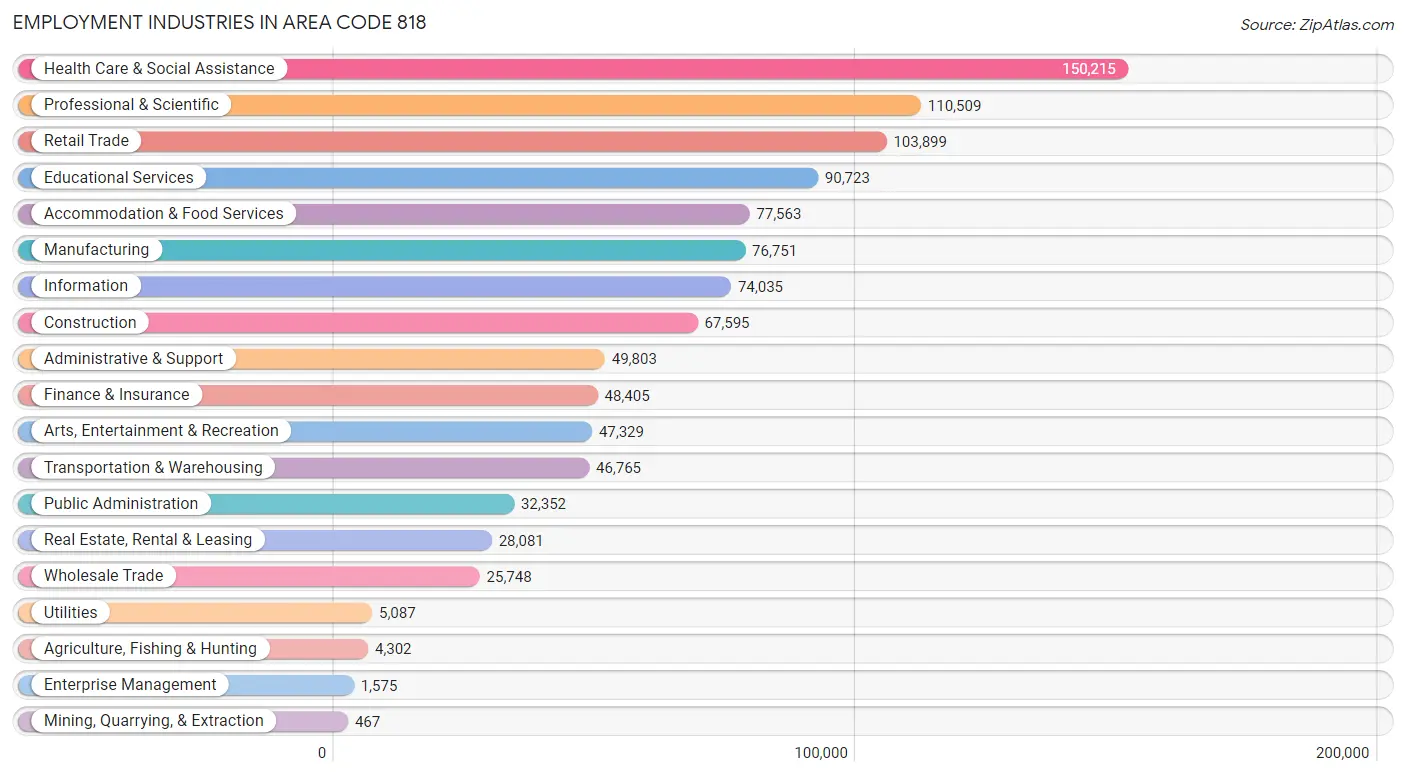
Employment Industries in Area Code 818
The major employment industries in Area Code 818 include Health Care & Social Assistance (150,215 | 13.6%), Professional & Scientific (110,509 | 10.0%), Retail Trade (103,899 | 9.4%), Educational Services (90,723 | 8.2%), and Accommodation & Food Services (77,563 | 7.0%).
Employment Industries by Sex in Area Code 818
The Area Code 818 industries that see more men than women are Mining, Quarrying, & Extraction (91.4%), Construction (91.3%), and Transportation & Warehousing (78.6%), whereas the industries that tend to have a higher number of women are Health Care & Social Assistance (71.2%), Educational Services (62.9%), and Public Administration (52.1%).
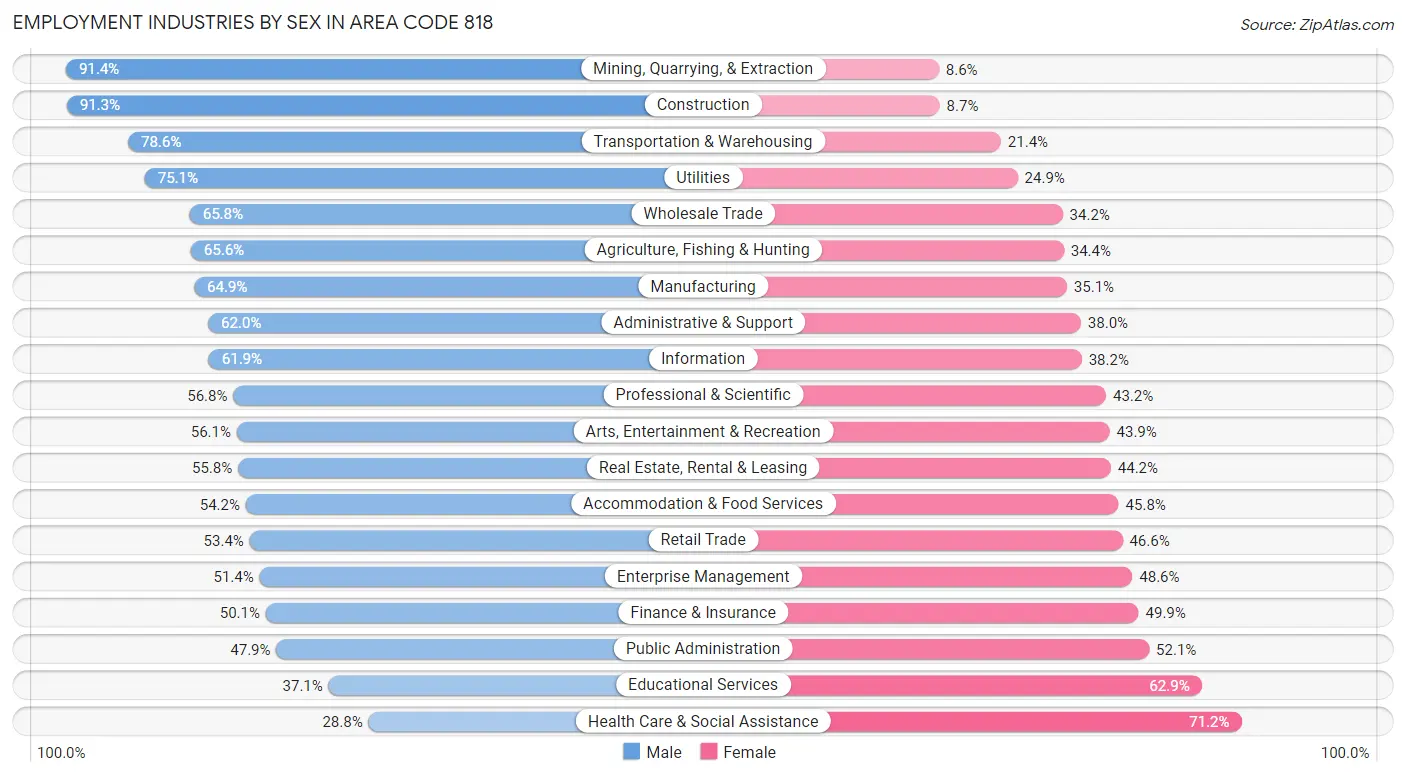
| Industry | Male | Female |
| Agriculture, Fishing & Hunting | 2,821 (65.6%) | 1,481 (34.4%) |
| Mining, Quarrying, & Extraction | 427 (91.4%) | 40 (8.6%) |
| Construction | 61,687 (91.3%) | 5,908 (8.7%) |
| Manufacturing | 49,829 (64.9%) | 26,922 (35.1%) |
| Wholesale Trade | 16,941 (65.8%) | 8,807 (34.2%) |
| Retail Trade | 55,502 (53.4%) | 48,397 (46.6%) |
| Transportation & Warehousing | 36,749 (78.6%) | 10,016 (21.4%) |
| Utilities | 3,821 (75.1%) | 1,266 (24.9%) |
| Information | 45,791 (61.9%) | 28,244 (38.2%) |
| Finance & Insurance | 24,240 (50.1%) | 24,165 (49.9%) |
| Real Estate, Rental & Leasing | 15,675 (55.8%) | 12,406 (44.2%) |
| Professional & Scientific | 62,783 (56.8%) | 47,726 (43.2%) |
| Enterprise Management | 809 (51.4%) | 766 (48.6%) |
| Administrative & Support | 30,887 (62.0%) | 18,916 (38.0%) |
| Educational Services | 33,635 (37.1%) | 57,088 (62.9%) |
| Health Care & Social Assistance | 43,296 (28.8%) | 106,919 (71.2%) |
| Arts, Entertainment & Recreation | 26,544 (56.1%) | 20,785 (43.9%) |
| Accommodation & Food Services | 42,048 (54.2%) | 35,515 (45.8%) |
| Public Administration | 15,494 (47.9%) | 16,858 (52.1%) |
| Total | 596,018 (53.9%) | 509,596 (46.1%) |
Education in Area Code 818
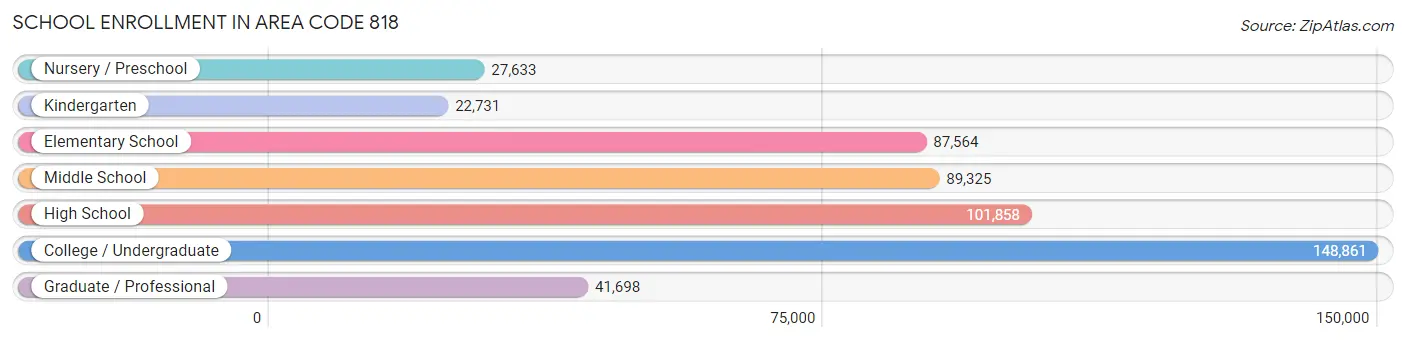
School Enrollment in Area Code 818
The most common levels of schooling among the 519,670 students in Area Code 818 are college / undergraduate (148,861 | 28.6%), high school (101,858 | 19.6%), and middle school (89,325 | 17.2%).
| School Level | # Students | % Students |
| Nursery / Preschool | 27,633 | 5.3% |
| Kindergarten | 22,731 | 4.4% |
| Elementary School | 87,564 | 16.9% |
| Middle School | 89,325 | 17.2% |
| High School | 101,858 | 19.6% |
| College / Undergraduate | 148,861 | 28.6% |
| Graduate / Professional | 41,698 | 8.0% |
| Total | 519,670 | 100.0% |
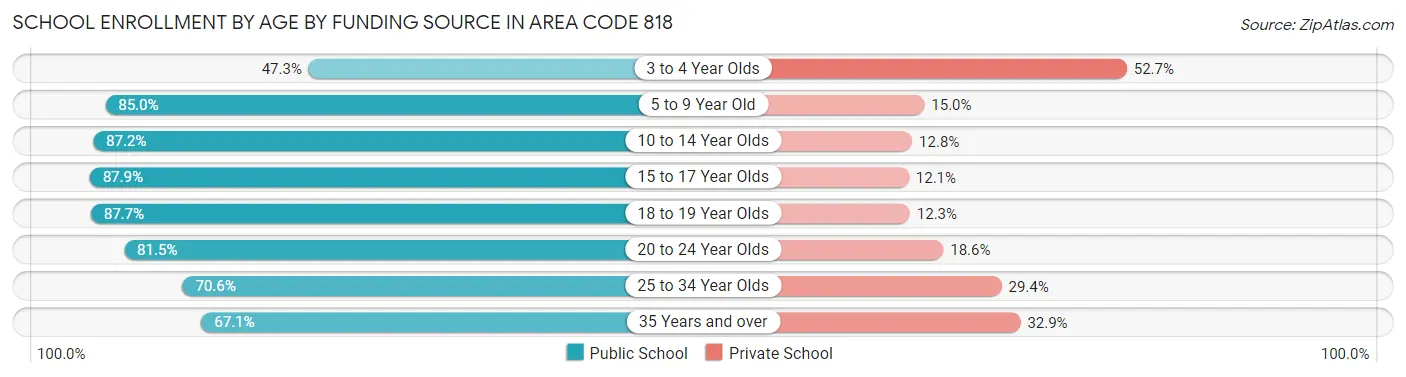
School Enrollment by Age by Funding Source in Area Code 818
Out of a total of 519,670 students who are enrolled in schools in Area Code 818, 96,722 (18.6%) attend a private institution, while the remaining 422,948 (81.4%) are enrolled in public schools. The age group of 3 to 4 year olds has the highest likelihood of being enrolled in private schools, with 12,267 (52.7% in the age bracket) enrolled. Conversely, the age group of 15 to 17 year olds has the lowest likelihood of being enrolled in a private school, with 61,301 (87.9% in the age bracket) attending a public institution.
| Age Bracket | Public School | Private School |
| 3 to 4 Year Olds | 10,991 (47.3%) | 12,267 (52.7%) |
| 5 to 9 Year Old | 89,006 (85.0%) | 15,747 (15.0%) |
| 10 to 14 Year Olds | 101,232 (87.2%) | 14,802 (12.8%) |
| 15 to 17 Year Olds | 61,301 (87.9%) | 8,468 (12.1%) |
| 18 to 19 Year Olds | 40,434 (87.7%) | 5,685 (12.3%) |
| 20 to 24 Year Olds | 62,468 (81.5%) | 14,227 (18.5%) |
| 25 to 34 Year Olds | 35,958 (70.6%) | 14,979 (29.4%) |
| 35 Years and over | 21,534 (67.1%) | 10,571 (32.9%) |
| Total | 422,948 (81.4%) | 96,722 (18.6%) |
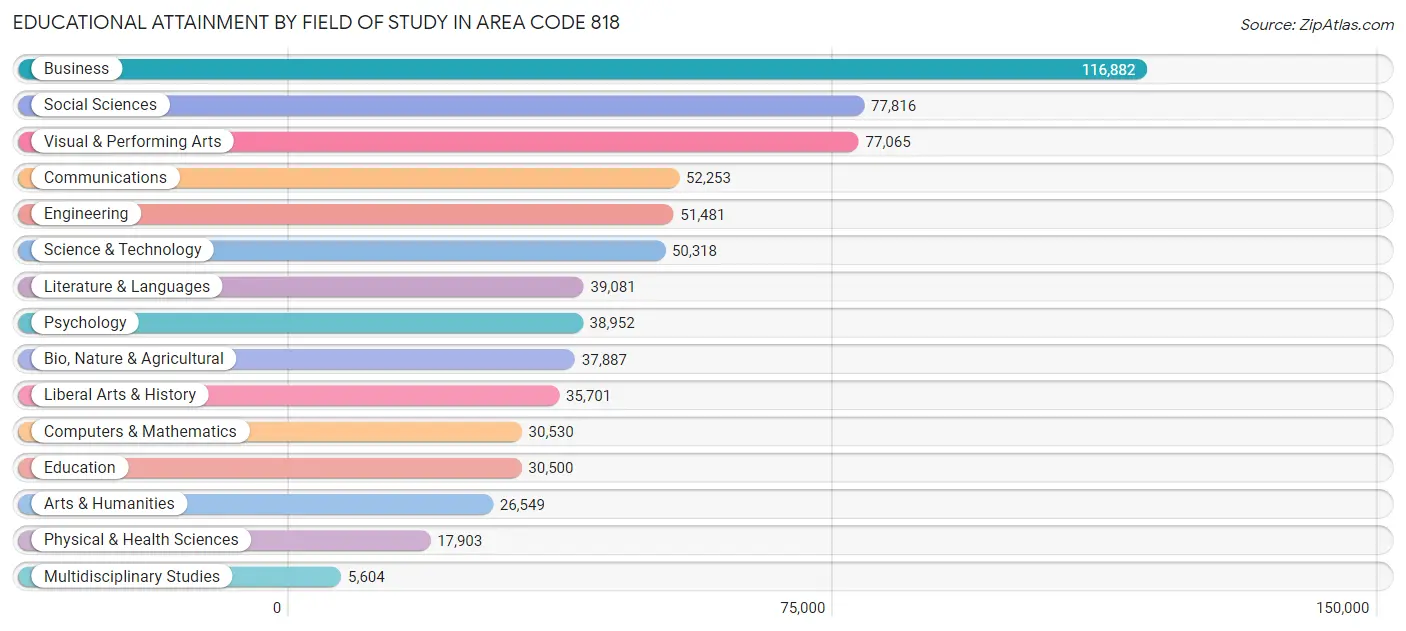
Educational Attainment by Field of Study in Area Code 818
Business (116,882 | 17.0%), social sciences (77,816 | 11.3%), visual & performing arts (77,065 | 11.2%), communications (52,253 | 7.6%), and engineering (51,481 | 7.5%) are the most common fields of study among 688,522 individuals in Area Code 818 who have obtained a bachelor's degree or higher.
| Field of Study | # Graduates | % Graduates |
| Computers & Mathematics | 30,530 | 4.4% |
| Bio, Nature & Agricultural | 37,887 | 5.5% |
| Physical & Health Sciences | 17,903 | 2.6% |
| Psychology | 38,952 | 5.7% |
| Social Sciences | 77,816 | 11.3% |
| Engineering | 51,481 | 7.5% |
| Multidisciplinary Studies | 5,604 | 0.8% |
| Science & Technology | 50,318 | 7.3% |
| Business | 116,882 | 17.0% |
| Education | 30,500 | 4.4% |
| Literature & Languages | 39,081 | 5.7% |
| Liberal Arts & History | 35,701 | 5.2% |
| Visual & Performing Arts | 77,065 | 11.2% |
| Communications | 52,253 | 7.6% |
| Arts & Humanities | 26,549 | 3.9% |
| Total | 688,522 | 100.0% |
Transportation & Commute in Area Code 818
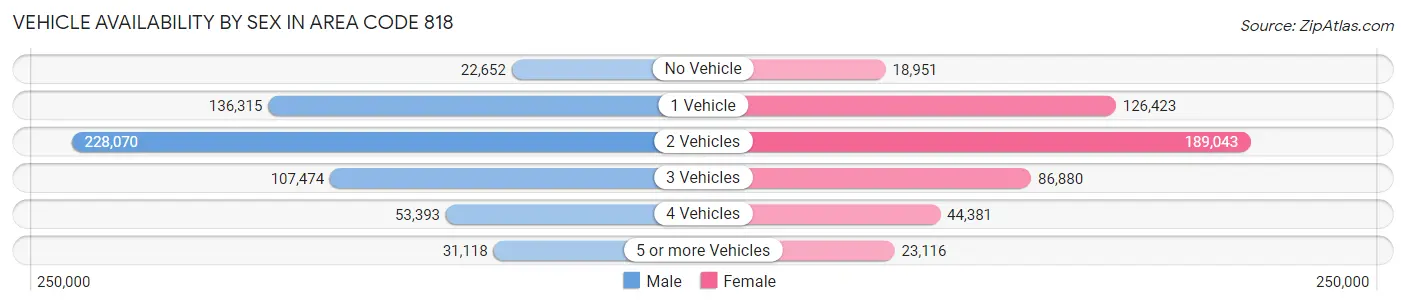
Vehicle Availability by Sex in Area Code 818
The most prevalent vehicle ownership categories in Area Code 818 are males with 2 vehicles (228,070, accounting for 39.4%) and females with 2 vehicles (189,043, making up 46.7%).
| Vehicles Available | Male | Female |
| No Vehicle | 22,652 (3.9%) | 18,951 (3.9%) |
| 1 Vehicle | 136,315 (23.5%) | 126,423 (25.9%) |
| 2 Vehicles | 228,070 (39.4%) | 189,043 (38.7%) |
| 3 Vehicles | 107,474 (18.6%) | 86,880 (17.8%) |
| 4 Vehicles | 53,393 (9.2%) | 44,381 (9.1%) |
| 5 or more Vehicles | 31,118 (5.4%) | 23,116 (4.7%) |
| Total | 579,022 (100.0%) | 488,794 (100.0%) |
Commute Time in Area Code 818
The most frequently occuring commute durations in Area Code 818 are 30 to 34 minutes (157,031 commuters, 17.4%), 15 to 19 minutes (130,196 commuters, 14.4%), and 20 to 24 minutes (123,492 commuters, 13.7%).
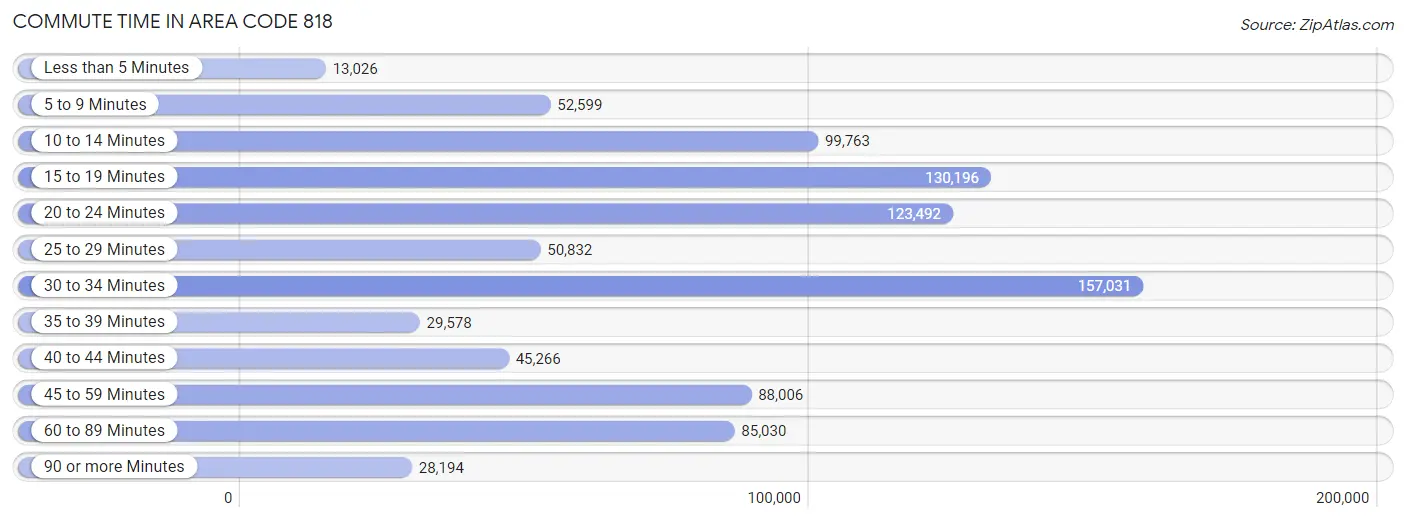
| Commute Time | # Commuters | % Commuters |
| Less than 5 Minutes | 13,026 | 1.4% |
| 5 to 9 Minutes | 52,599 | 5.8% |
| 10 to 14 Minutes | 99,763 | 11.1% |
| 15 to 19 Minutes | 130,196 | 14.4% |
| 20 to 24 Minutes | 123,492 | 13.7% |
| 25 to 29 Minutes | 50,832 | 5.6% |
| 30 to 34 Minutes | 157,031 | 17.4% |
| 35 to 39 Minutes | 29,578 | 3.3% |
| 40 to 44 Minutes | 45,266 | 5.0% |
| 45 to 59 Minutes | 88,006 | 9.8% |
| 60 to 89 Minutes | 85,030 | 9.4% |
| 90 or more Minutes | 28,194 | 3.1% |
Commute Time by Sex in Area Code 818
The most common commute times in Area Code 818 are 30 to 34 minutes (91,262 commuters, 18.4%) for males and 30 to 34 minutes (65,769 commuters, 16.1%) for females.
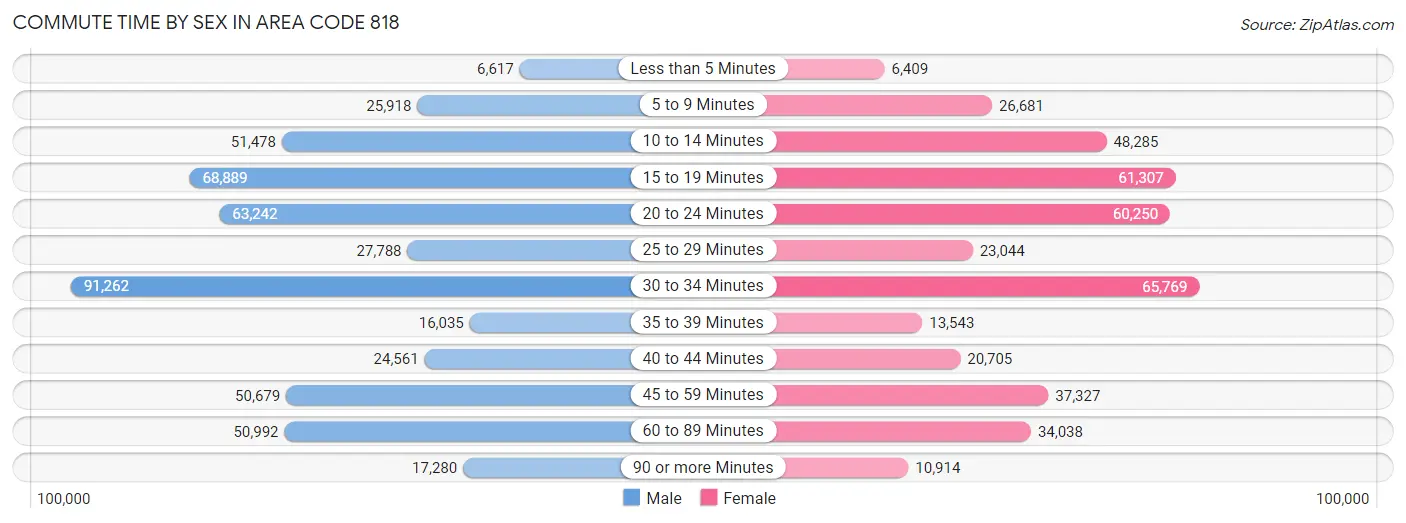
| Commute Time | Male | Female |
| Less than 5 Minutes | 6,617 (1.3%) | 6,409 (1.6%) |
| 5 to 9 Minutes | 25,918 (5.2%) | 26,681 (6.5%) |
| 10 to 14 Minutes | 51,478 (10.4%) | 48,285 (11.8%) |
| 15 to 19 Minutes | 68,889 (13.9%) | 61,307 (15.0%) |
| 20 to 24 Minutes | 63,242 (12.8%) | 60,250 (14.8%) |
| 25 to 29 Minutes | 27,788 (5.6%) | 23,044 (5.6%) |
| 30 to 34 Minutes | 91,262 (18.4%) | 65,769 (16.1%) |
| 35 to 39 Minutes | 16,035 (3.2%) | 13,543 (3.3%) |
| 40 to 44 Minutes | 24,561 (5.0%) | 20,705 (5.1%) |
| 45 to 59 Minutes | 50,679 (10.2%) | 37,327 (9.1%) |
| 60 to 89 Minutes | 50,992 (10.3%) | 34,038 (8.3%) |
| 90 or more Minutes | 17,280 (3.5%) | 10,914 (2.7%) |
Time of Departure to Work by Sex in Area Code 818
The most frequent times of departure to work in Area Code 818 are 8:00 AM to 8:29 AM (66,289, 13.4%) for males and 8:00 AM to 8:29 AM (60,686, 14.9%) for females.
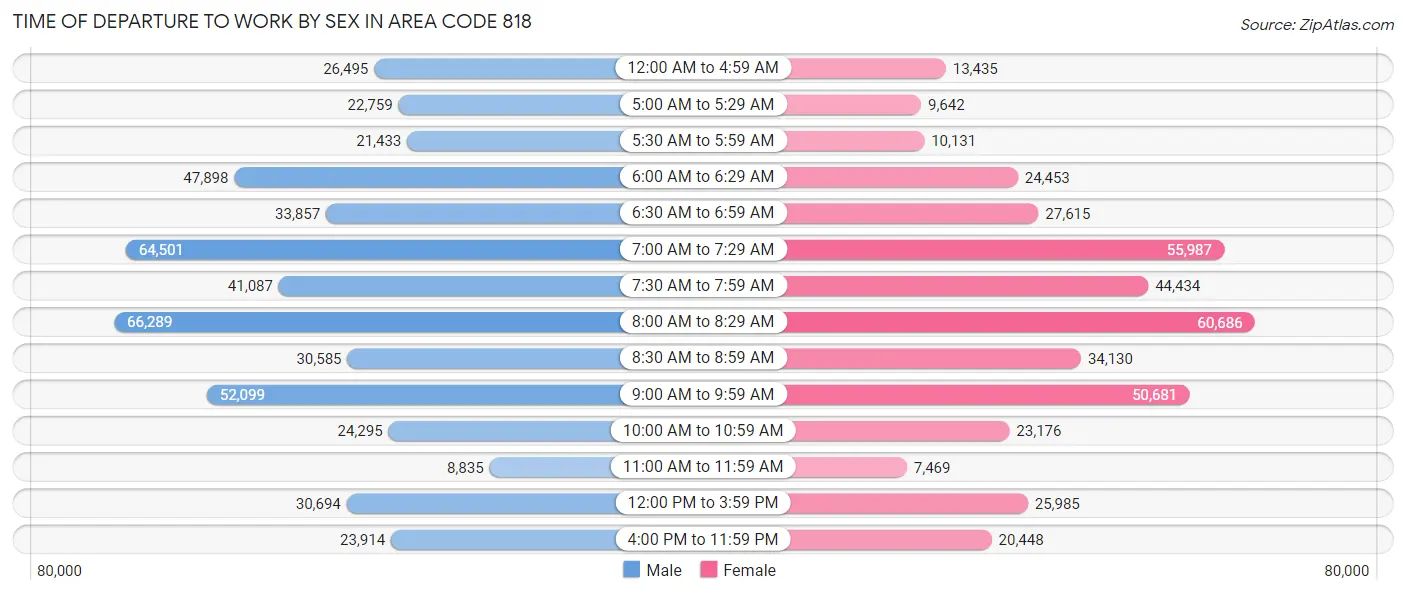
| Time of Departure | Male | Female |
| 12:00 AM to 4:59 AM | 26,495 (5.4%) | 13,435 (3.3%) |
| 5:00 AM to 5:29 AM | 22,759 (4.6%) | 9,642 (2.4%) |
| 5:30 AM to 5:59 AM | 21,433 (4.3%) | 10,131 (2.5%) |
| 6:00 AM to 6:29 AM | 47,898 (9.7%) | 24,453 (6.0%) |
| 6:30 AM to 6:59 AM | 33,857 (6.8%) | 27,615 (6.8%) |
| 7:00 AM to 7:29 AM | 64,501 (13.0%) | 55,987 (13.7%) |
| 7:30 AM to 7:59 AM | 41,087 (8.3%) | 44,434 (10.9%) |
| 8:00 AM to 8:29 AM | 66,289 (13.4%) | 60,686 (14.9%) |
| 8:30 AM to 8:59 AM | 30,585 (6.2%) | 34,130 (8.4%) |
| 9:00 AM to 9:59 AM | 52,099 (10.5%) | 50,681 (12.4%) |
| 10:00 AM to 10:59 AM | 24,295 (4.9%) | 23,176 (5.7%) |
| 11:00 AM to 11:59 AM | 8,835 (1.8%) | 7,469 (1.8%) |
| 12:00 PM to 3:59 PM | 30,694 (6.2%) | 25,985 (6.4%) |
| 4:00 PM to 11:59 PM | 23,914 (4.8%) | 20,448 (5.0%) |
| Total | 494,741 (100.0%) | 408,272 (100.0%) |
Housing Occupancy in Area Code 818
Occupancy by Ownership in Area Code 818
Of the total 797,962 dwellings in Area Code 818, owner-occupied units account for 339,774 (42.6%), while renter-occupied units make up 458,188 (57.4%).
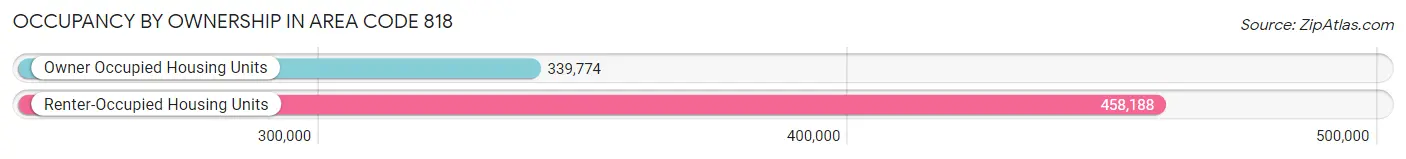
| Occupancy | # Housing Units | % Housing Units |
| Owner Occupied Housing Units | 339,774 | 42.6% |
| Renter-Occupied Housing Units | 458,188 | 57.4% |
| Total Occupied Housing Units | 797,962 | 100.0% |
Occupancy by Household Size in Area Code 818
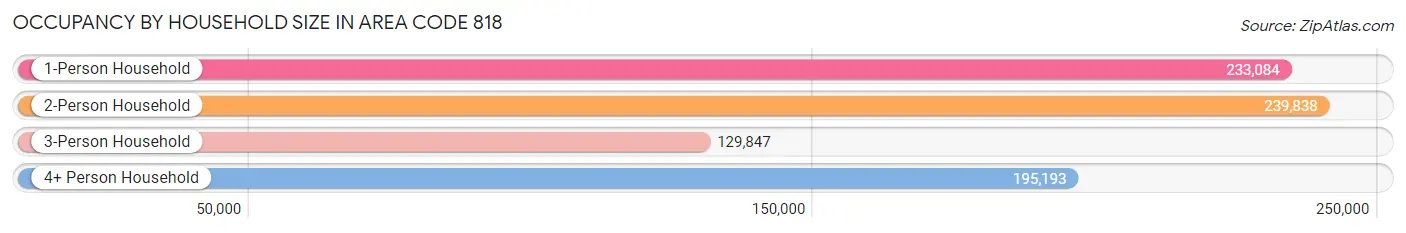
| Household Size | # Housing Units | % Housing Units |
| 1-Person Household | 233,084 | 29.2% |
| 2-Person Household | 239,838 | 30.1% |
| 3-Person Household | 129,847 | 16.3% |
| 4+ Person Household | 195,193 | 24.5% |
| Total Housing Units | 797,962 | 100.0% |
Occupancy by Ownership by Household Size in Area Code 818
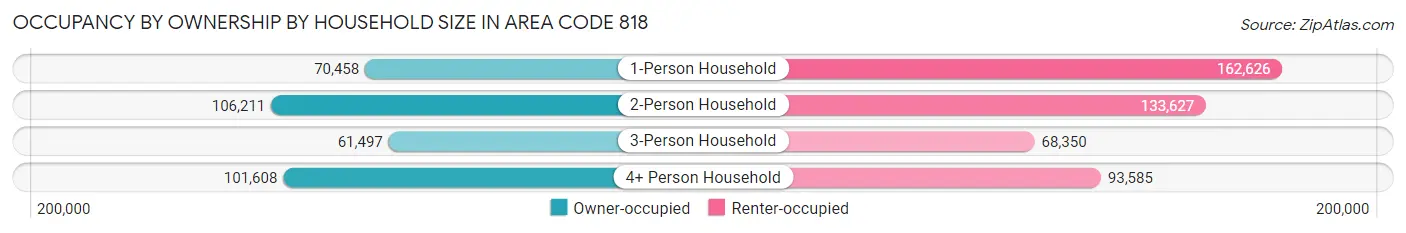
| Household Size | Owner-occupied | Renter-occupied |
| 1-Person Household | 70,458 (30.2%) | 162,626 (69.8%) |
| 2-Person Household | 106,211 (44.3%) | 133,627 (55.7%) |
| 3-Person Household | 61,497 (47.4%) | 68,350 (52.6%) |
| 4+ Person Household | 101,608 (52.1%) | 93,585 (47.9%) |
| Total Housing Units | 339,774 (42.6%) | 458,188 (57.4%) |
Occupancy by Educational Attainment in Area Code 818
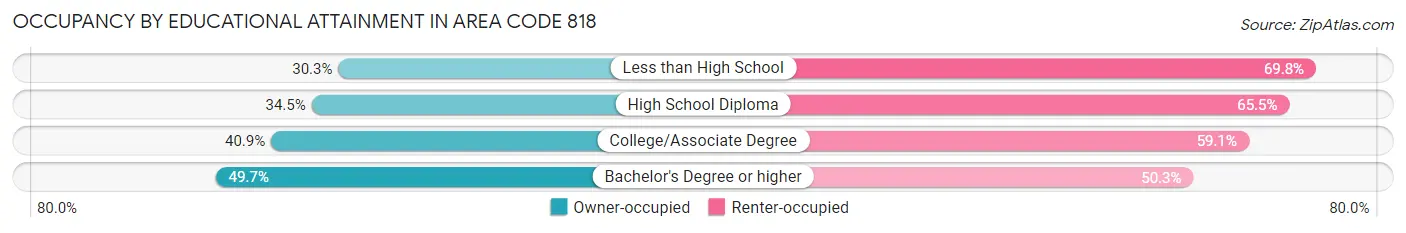
| Household Size | Owner-occupied | Renter-occupied |
| Less than High School | 31,074 (30.2%) | 71,665 (69.8%) |
| High School Diploma | 43,046 (34.5%) | 81,794 (65.5%) |
| College/Associate Degree | 83,069 (40.9%) | 119,985 (59.1%) |
| Bachelor's Degree or higher | 182,585 (49.7%) | 184,744 (50.3%) |
Occupancy by Age of Householder in Area Code 818
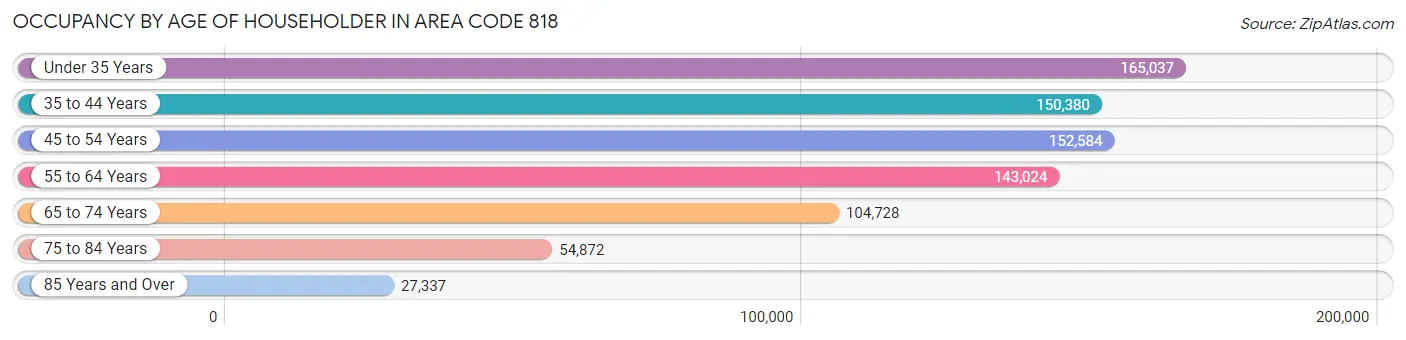
| Age Bracket | # Households | % Households |
| Under 35 Years | 165,037 | 20.7% |
| 35 to 44 Years | 150,380 | 18.9% |
| 45 to 54 Years | 152,584 | 19.1% |
| 55 to 64 Years | 143,024 | 17.9% |
| 65 to 74 Years | 104,728 | 13.1% |
| 75 to 84 Years | 54,872 | 6.9% |
| 85 Years and Over | 27,337 | 3.4% |
| Total | 797,962 | 100.0% |
Housing Finances in Area Code 818
Median Income by Occupancy in Area Code 818
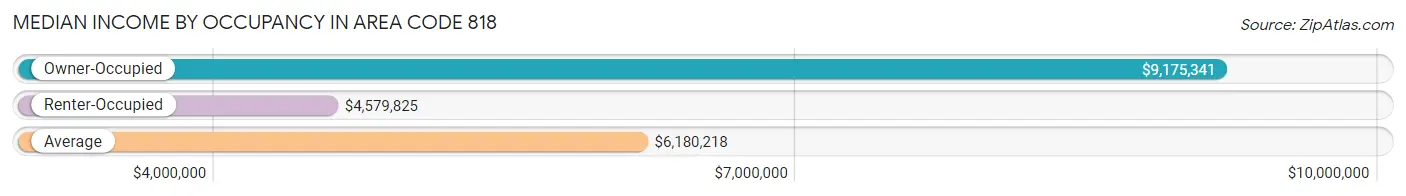
| Occupancy Type | # Households | Median Income |
| Owner-Occupied | 339,774 (42.6%) | $9,175,341 |
| Renter-Occupied | 458,188 (57.4%) | $4,579,825 |
| Average | 797,962 (100.0%) | $6,180,218 |
Occupancy by Householder Income Bracket in Area Code 818
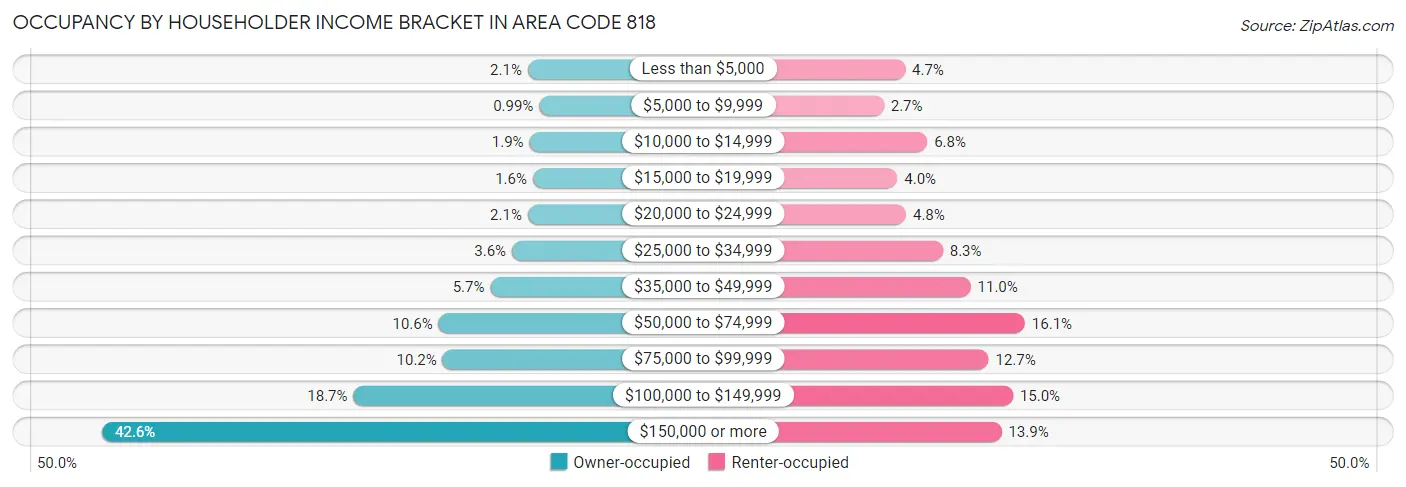
| Income Bracket | Owner-occupied | Renter-occupied |
| Less than $5,000 | 7,061 (2.1%) | 21,612 (4.7%) |
| $5,000 to $9,999 | 3,349 (1.0%) | 12,344 (2.7%) |
| $10,000 to $14,999 | 6,512 (1.9%) | 31,313 (6.8%) |
| $15,000 to $19,999 | 5,434 (1.6%) | 18,223 (4.0%) |
| $20,000 to $24,999 | 7,079 (2.1%) | 22,041 (4.8%) |
| $25,000 to $34,999 | 12,187 (3.6%) | 38,072 (8.3%) |
| $35,000 to $49,999 | 19,205 (5.7%) | 50,235 (11.0%) |
| $50,000 to $74,999 | 35,951 (10.6%) | 73,926 (16.1%) |
| $75,000 to $99,999 | 34,634 (10.2%) | 58,037 (12.7%) |
| $100,000 to $149,999 | 63,511 (18.7%) | 68,698 (15.0%) |
| $150,000 or more | 144,851 (42.6%) | 63,687 (13.9%) |
| Total | 339,774 (100.0%) | 458,188 (100.0%) |
Monthly Housing Cost Tiers in Area Code 818
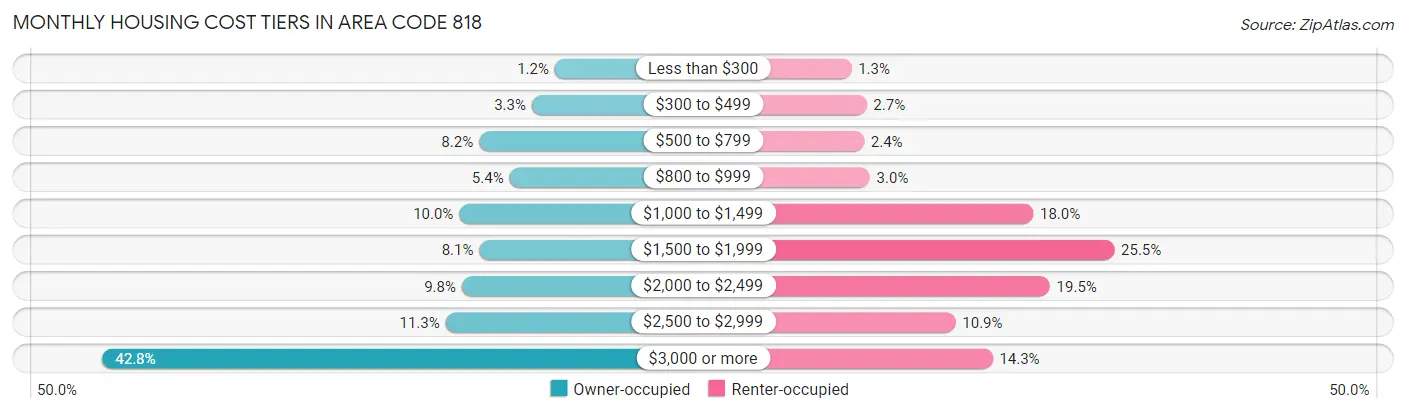
| Monthly Cost | Owner-occupied | Renter-occupied |
| Less than $300 | 4,034 (1.2%) | 5,832 (1.3%) |
| $300 to $499 | 11,243 (3.3%) | 12,228 (2.7%) |
| $500 to $799 | 27,754 (8.2%) | 11,113 (2.4%) |
| $800 to $999 | 18,214 (5.4%) | 13,605 (3.0%) |
| $1,000 to $1,499 | 33,941 (10.0%) | 82,537 (18.0%) |
| $1,500 to $1,999 | 27,662 (8.1%) | 116,720 (25.5%) |
| $2,000 to $2,499 | 33,111 (9.8%) | 89,524 (19.5%) |
| $2,500 to $2,999 | 38,239 (11.3%) | 49,747 (10.9%) |
| $3,000 or more | 145,576 (42.8%) | 65,380 (14.3%) |
| Total | 339,774 (100.0%) | 458,188 (100.0%) |
Physical Housing Characteristics in Area Code 818
Housing Structures in Area Code 818
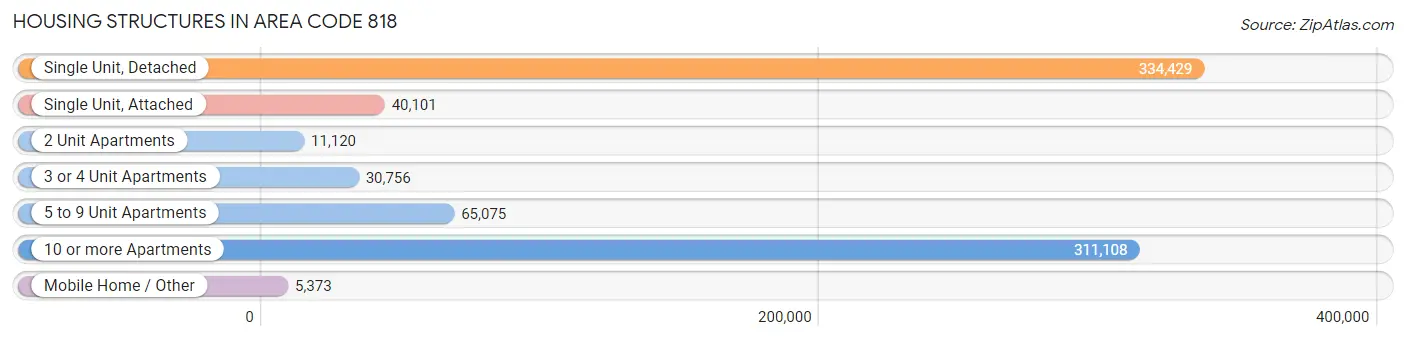
| Structure Type | # Housing Units | % Housing Units |
| Single Unit, Detached | 334,429 | 41.9% |
| Single Unit, Attached | 40,101 | 5.0% |
| 2 Unit Apartments | 11,120 | 1.4% |
| 3 or 4 Unit Apartments | 30,756 | 3.8% |
| 5 to 9 Unit Apartments | 65,075 | 8.2% |
| 10 or more Apartments | 311,108 | 39.0% |
| Mobile Home / Other | 5,373 | 0.7% |
| Total | 797,962 | 100.0% |
Housing Structures by Occupancy in Area Code 818
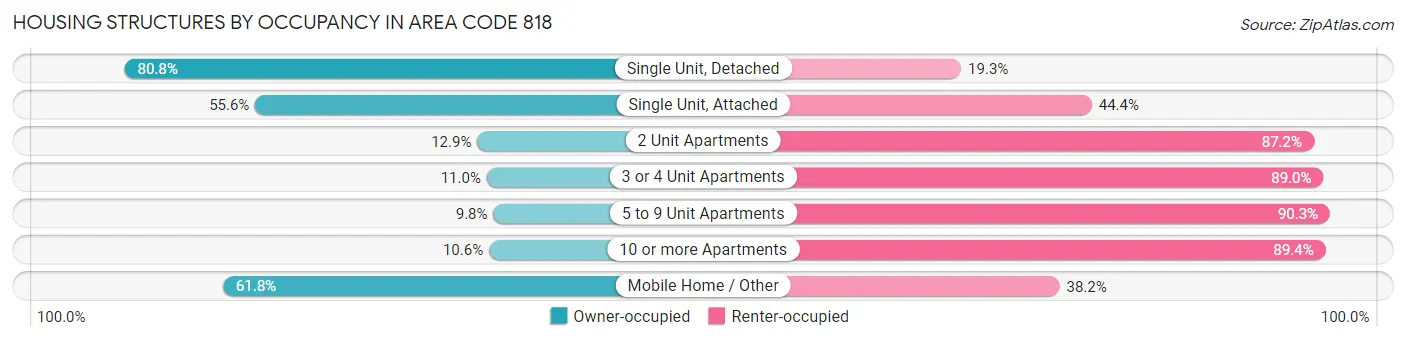
| Structure Type | Owner-occupied | Renter-occupied |
| Single Unit, Detached | 270,058 (80.7%) | 64,371 (19.3%) |
| Single Unit, Attached | 22,295 (55.6%) | 17,806 (44.4%) |
| 2 Unit Apartments | 1,429 (12.9%) | 9,691 (87.2%) |
| 3 or 4 Unit Apartments | 3,390 (11.0%) | 27,366 (89.0%) |
| 5 to 9 Unit Apartments | 6,342 (9.8%) | 58,733 (90.2%) |
| 10 or more Apartments | 32,939 (10.6%) | 278,169 (89.4%) |
| Mobile Home / Other | 3,321 (61.8%) | 2,052 (38.2%) |
| Total | 339,774 (42.6%) | 458,188 (57.4%) |
Housing Structures by Number of Rooms in Area Code 818
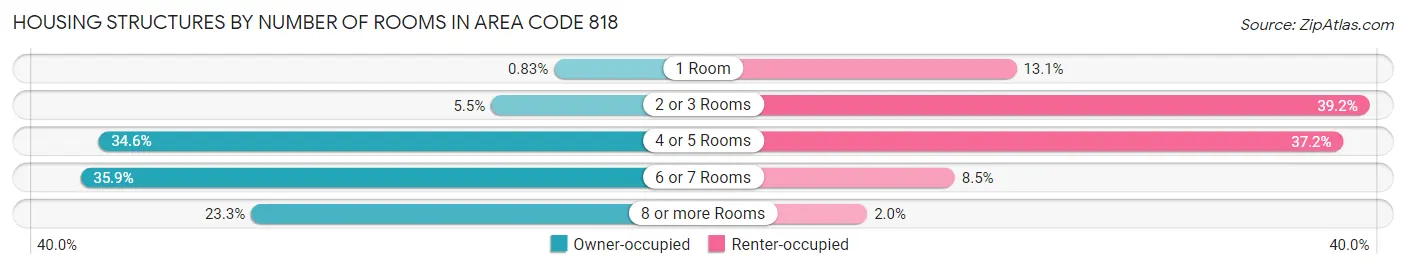
| Number of Rooms | Owner-occupied | Renter-occupied |
| 1 Room | 2,811 (0.8%) | 59,845 (13.1%) |
| 2 or 3 Rooms | 18,651 (5.5%) | 179,513 (39.2%) |
| 4 or 5 Rooms | 117,407 (34.5%) | 170,643 (37.2%) |
| 6 or 7 Rooms | 121,920 (35.9%) | 38,928 (8.5%) |
| 8 or more Rooms | 78,985 (23.3%) | 9,259 (2.0%) |
| Total | 339,774 (100.0%) | 458,188 (100.0%) |
Housing Structure by Heating Type in Area Code 818
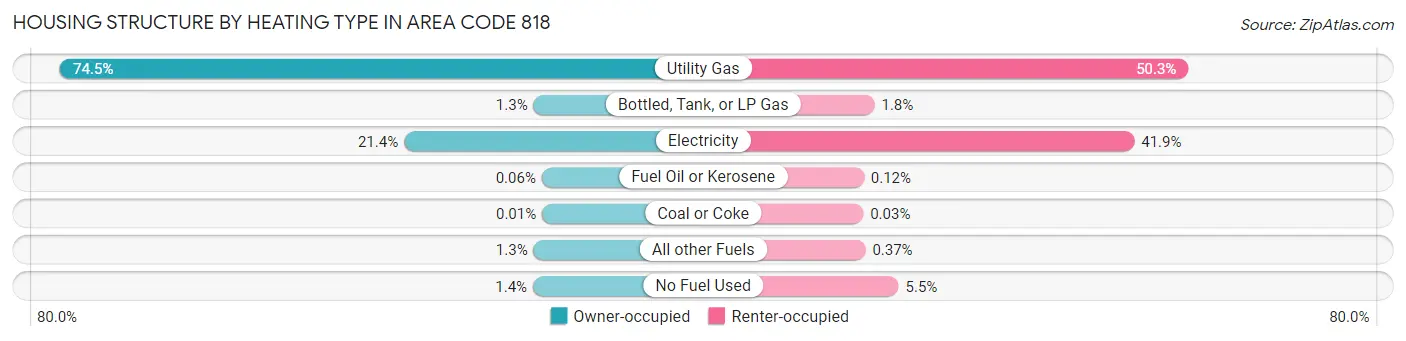
| Heating Type | Owner-occupied | Renter-occupied |
| Utility Gas | 253,162 (74.5%) | 230,272 (50.3%) |
| Bottled, Tank, or LP Gas | 4,511 (1.3%) | 8,158 (1.8%) |
| Electricity | 72,537 (21.3%) | 192,126 (41.9%) |
| Fuel Oil or Kerosene | 193 (0.1%) | 561 (0.1%) |
| Coal or Coke | 18 (0.0%) | 151 (0.0%) |
| All other Fuels | 4,532 (1.3%) | 1,709 (0.4%) |
| No Fuel Used | 4,821 (1.4%) | 25,211 (5.5%) |
| Total | 339,774 (100.0%) | 458,188 (100.0%) |
Household Vehicle Usage in Area Code 818
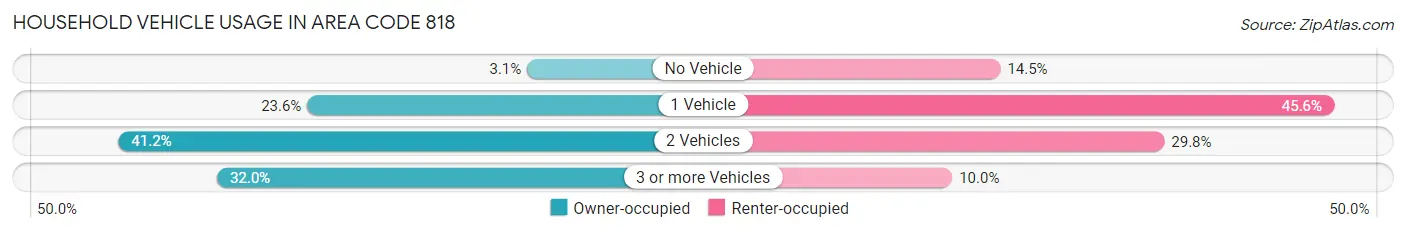
| Vehicles per Household | Owner-occupied | Renter-occupied |
| No Vehicle | 10,513 (3.1%) | 66,526 (14.5%) |
| 1 Vehicle | 80,264 (23.6%) | 209,095 (45.6%) |
| 2 Vehicles | 140,120 (41.2%) | 136,646 (29.8%) |
| 3 or more Vehicles | 108,877 (32.0%) | 45,921 (10.0%) |
| Total | 339,774 (100.0%) | 458,188 (100.0%) |
Real Estate & Mortgages in Area Code 818
Real Estate and Mortgage Overview in Area Code 818
| Characteristic | Without Mortgage | With Mortgage |
| Housing Units | 101,082 | 238,692 |
| Median Property Value | $60,269,002 | $64,202,103 |
| Median Household Income | $5,875,577 | $115,328 |
| Monthly Housing Costs | $62,623 | $141,374 |
| Real Estate Taxes | $302,915 | $3,250 |
Property Value by Mortgage Status in Area Code 818
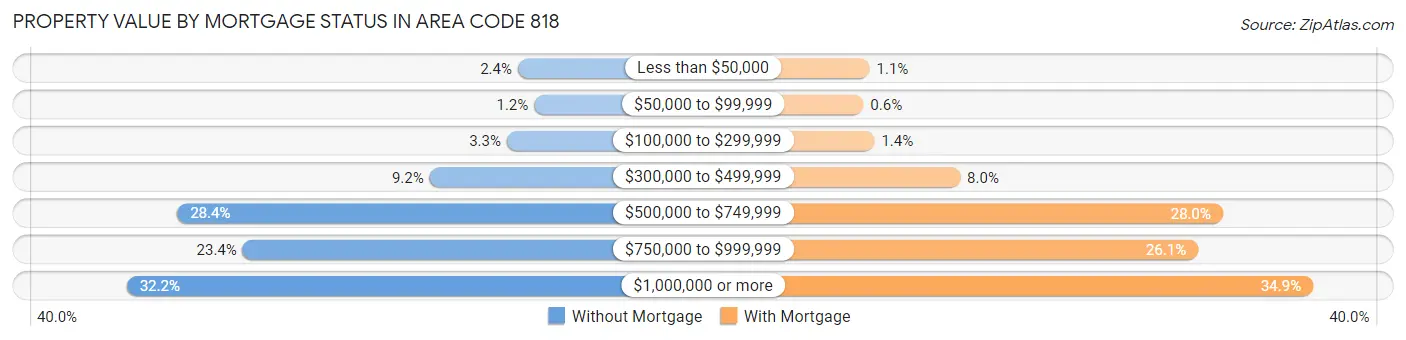
| Property Value | Without Mortgage | With Mortgage |
| Less than $50,000 | 2,449 (2.4%) | 2,543 (1.1%) |
| $50,000 to $99,999 | 1,194 (1.2%) | 1,422 (0.6%) |
| $100,000 to $299,999 | 3,294 (3.3%) | 3,428 (1.4%) |
| $300,000 to $499,999 | 9,247 (9.1%) | 19,027 (8.0%) |
| $500,000 to $749,999 | 28,678 (28.4%) | 66,792 (28.0%) |
| $750,000 to $999,999 | 23,648 (23.4%) | 62,295 (26.1%) |
| $1,000,000 or more | 32,572 (32.2%) | 83,185 (34.8%) |
| Total | 101,082 (100.0%) | 238,692 (100.0%) |
Household Income by Mortgage Status in Area Code 818
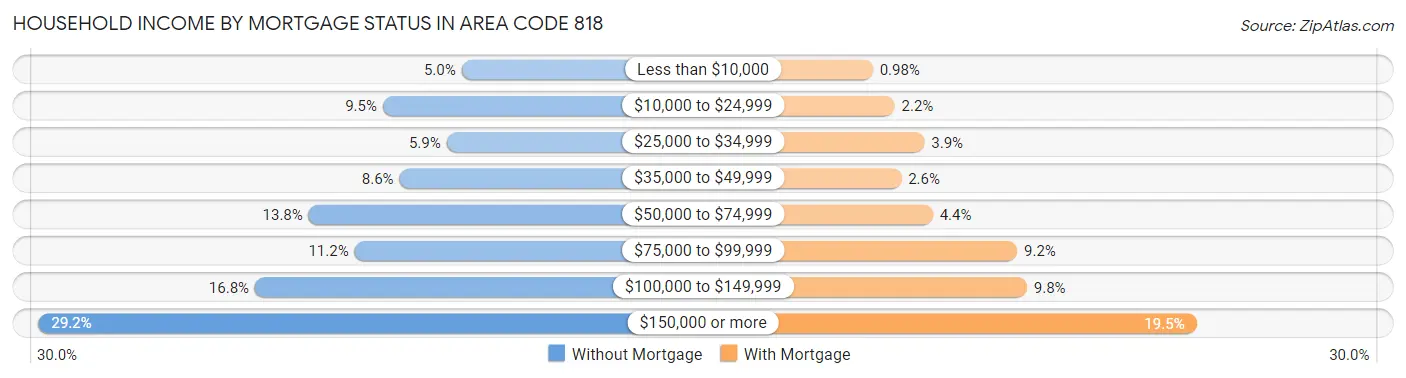
| Household Income | Without Mortgage | With Mortgage |
| Less than $10,000 | 5,085 (5.0%) | 2,349 (1.0%) |
| $10,000 to $24,999 | 9,634 (9.5%) | 5,325 (2.2%) |
| $25,000 to $34,999 | 5,955 (5.9%) | 9,391 (3.9%) |
| $35,000 to $49,999 | 8,676 (8.6%) | 6,232 (2.6%) |
| $50,000 to $74,999 | 13,916 (13.8%) | 10,529 (4.4%) |
| $75,000 to $99,999 | 11,268 (11.2%) | 22,035 (9.2%) |
| $100,000 to $149,999 | 17,025 (16.8%) | 23,366 (9.8%) |
| $150,000 or more | 29,523 (29.2%) | 46,486 (19.5%) |
| Total | 101,082 (100.0%) | 238,692 (100.0%) |
Property Value to Household Income Ratio in Area Code 818
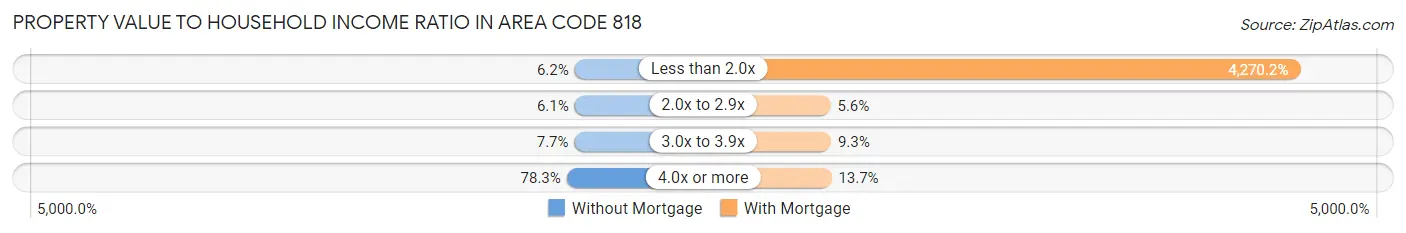
| Value-to-Income Ratio | Without Mortgage | With Mortgage |
| Less than 2.0x | 6,296 (6.2%) | 10,192,590 (4,270.2%) |
| 2.0x to 2.9x | 6,166 (6.1%) | 13,236 (5.6%) |
| 3.0x to 3.9x | 7,774 (7.7%) | 22,152 (9.3%) |
| 4.0x or more | 79,142 (78.3%) | 32,629 (13.7%) |
| Total | 101,082 (100.0%) | 238,692 (100.0%) |
Real Estate Taxes by Mortgage Status in Area Code 818
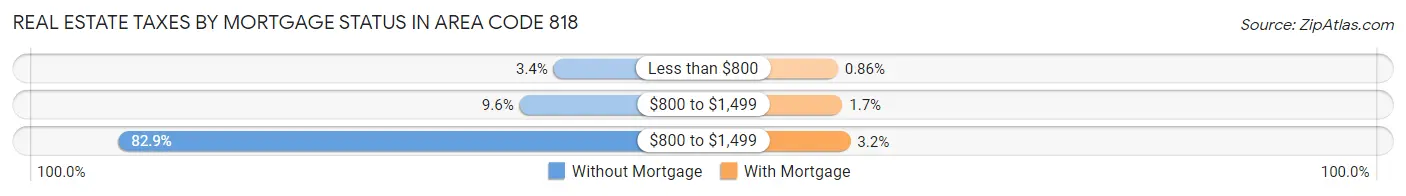
| Property Taxes | Without Mortgage | With Mortgage |
| Less than $800 | 3,414 (3.4%) | 2,045 (0.9%) |
| $800 to $1,499 | 9,709 (9.6%) | 4,065 (1.7%) |
| $800 to $1,499 | 83,758 (82.9%) | 7,560 (3.2%) |
| Total | 101,082 (100.0%) | 238,692 (100.0%) |
Health & Disability in Area Code 818
Health Insurance Coverage by Age in Area Code 818
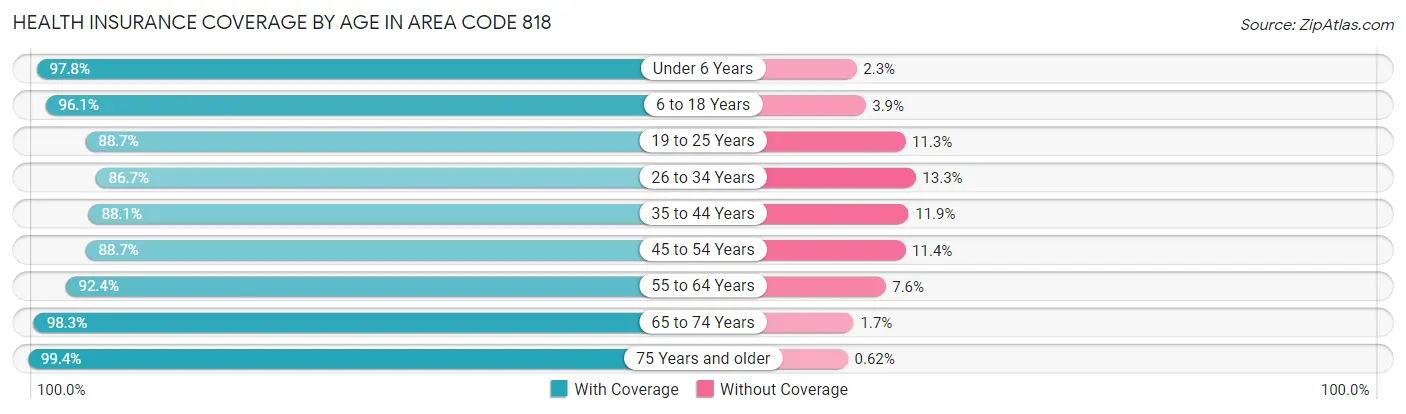
| Age Bracket | With Coverage | Without Coverage |
| Under 6 Years | 125,754 (97.8%) | 2,894 (2.2%) |
| 6 to 18 Years | 295,869 (96.1%) | 12,054 (3.9%) |
| 19 to 25 Years | 188,019 (88.7%) | 24,015 (11.3%) |
| 26 to 34 Years | 283,276 (86.7%) | 43,289 (13.3%) |
| 35 to 44 Years | 265,783 (88.1%) | 36,019 (11.9%) |
| 45 to 54 Years | 255,346 (88.6%) | 32,704 (11.4%) |
| 55 to 64 Years | 246,938 (92.4%) | 20,417 (7.6%) |
| 65 to 74 Years | 182,926 (98.3%) | 3,212 (1.7%) |
| 75 Years and older | 139,917 (99.4%) | 877 (0.6%) |
| Total | 1,983,828 (91.9%) | 175,481 (8.1%) |
Health Insurance Coverage by Citizenship Status in Area Code 818
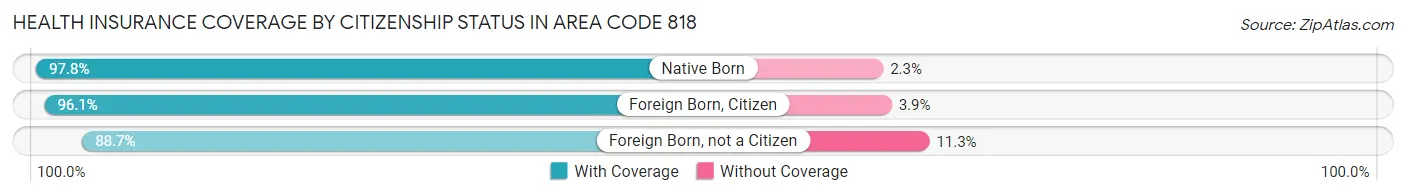
| Citizenship Status | With Coverage | Without Coverage |
| Native Born | 125,754 (97.8%) | 2,894 (2.2%) |
| Foreign Born, Citizen | 295,869 (96.1%) | 12,054 (3.9%) |
| Foreign Born, not a Citizen | 188,019 (88.7%) | 24,015 (11.3%) |
Health Insurance Coverage by Household Income in Area Code 818
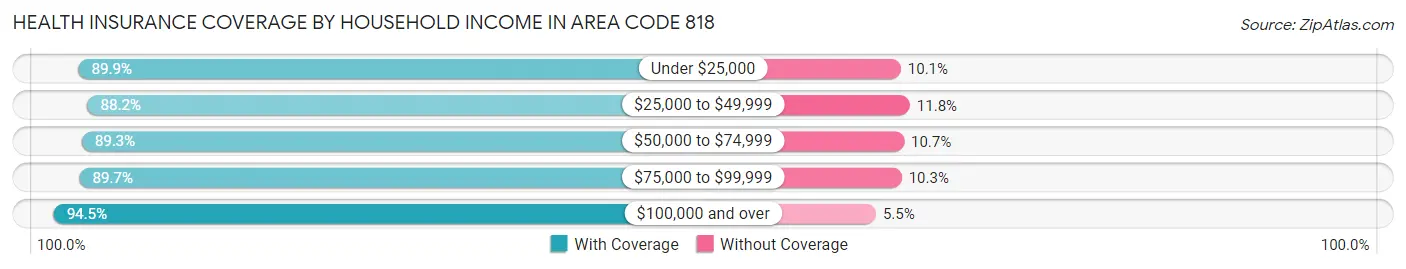
| Household Income | With Coverage | Without Coverage |
| Under $25,000 | 212,359 (89.9%) | 23,944 (10.1%) |
| $25,000 to $49,999 | 255,532 (88.2%) | 34,263 (11.8%) |
| $50,000 to $74,999 | 254,583 (89.3%) | 30,615 (10.7%) |
| $75,000 to $99,999 | 230,026 (89.7%) | 26,375 (10.3%) |
| $100,000 and over | 1,001,263 (94.5%) | 57,916 (5.5%) |
Public vs Private Health Insurance Coverage by Age in Area Code 818
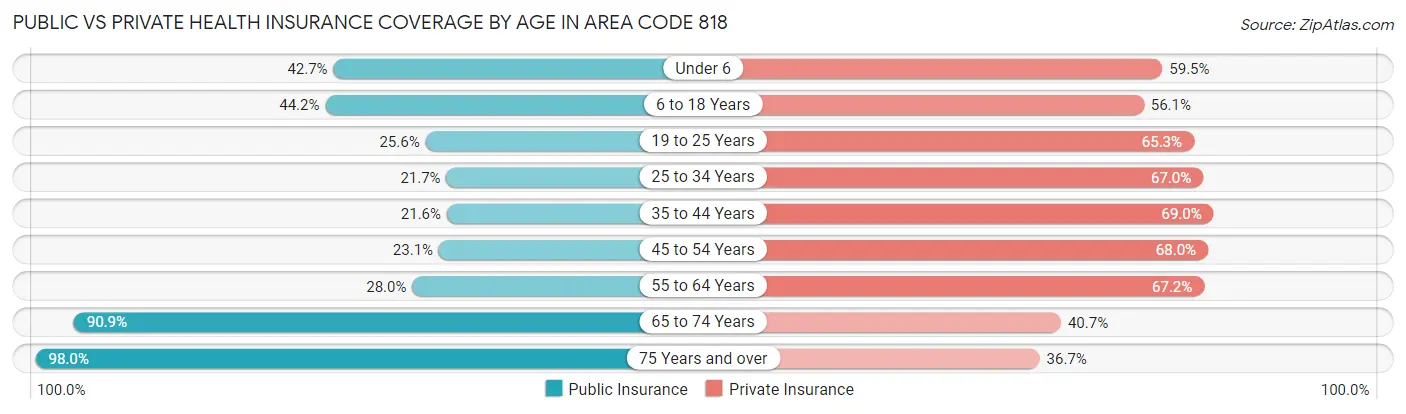
| Age Bracket | Public Insurance | Private Insurance |
| Under 6 | 54,899 (42.7%) | 76,544 (59.5%) |
| 6 to 18 Years | 136,071 (44.2%) | 172,608 (56.1%) |
| 19 to 25 Years | 54,250 (25.6%) | 138,545 (65.3%) |
| 25 to 34 Years | 70,867 (21.7%) | 218,936 (67.0%) |
| 35 to 44 Years | 65,264 (21.6%) | 208,284 (69.0%) |
| 45 to 54 Years | 66,548 (23.1%) | 195,719 (67.9%) |
| 55 to 64 Years | 74,968 (28.0%) | 179,768 (67.2%) |
| 65 to 74 Years | 169,134 (90.9%) | 75,714 (40.7%) |
| 75 Years and over | 137,922 (98.0%) | 51,716 (36.7%) |
| Total | 829,923 (38.4%) | 1,317,834 (61.0%) |
Disability Status by Sex by Age in Area Code 818
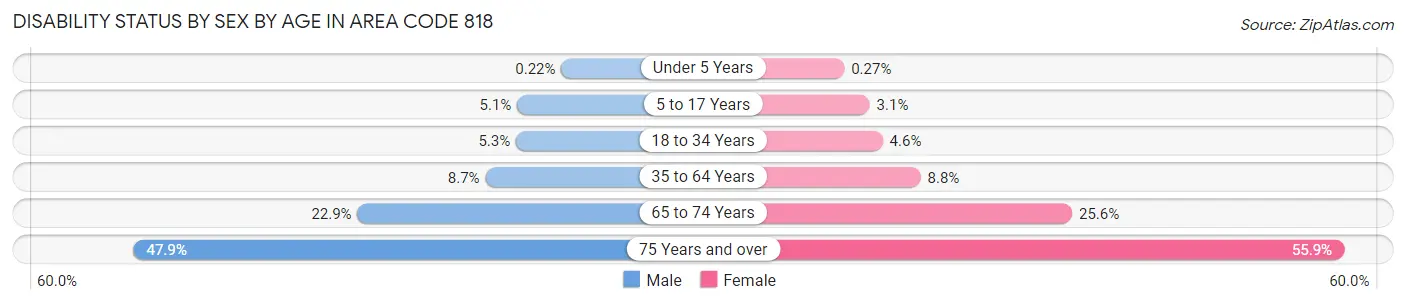
| Age Bracket | Male | Female |
| Under 5 Years | 119 (0.2%) | 144 (0.3%) |
| 5 to 17 Years | 7,910 (5.1%) | 4,549 (3.1%) |
| 18 to 34 Years | 15,034 (5.3%) | 12,824 (4.5%) |
| 35 to 64 Years | 37,518 (8.7%) | 37,304 (8.8%) |
| 65 to 74 Years | 19,633 (22.9%) | 25,773 (25.6%) |
| 75 Years and over | 27,649 (47.9%) | 46,426 (55.9%) |
Disability Class by Sex by Age in Area Code 818
Disability Class: Hearing Difficulty
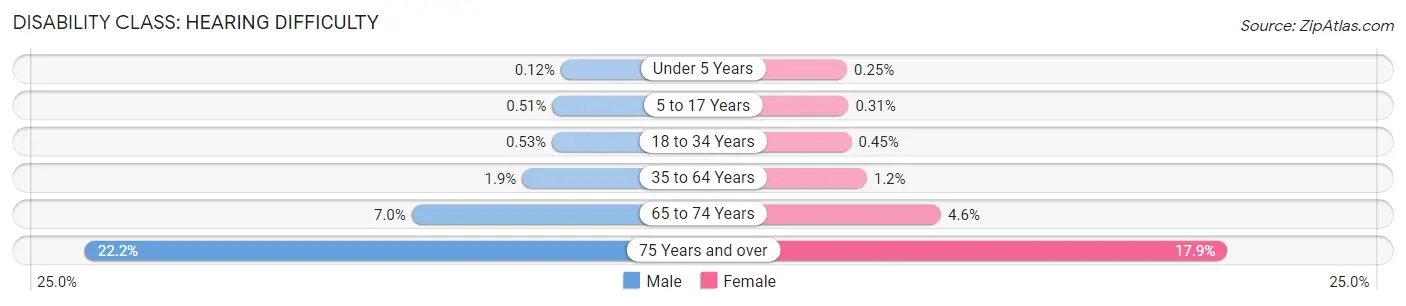
| Age Bracket | Male | Female |
| Under 5 Years | 67 (0.1%) | 133 (0.3%) |
| 5 to 17 Years | 784 (0.5%) | 454 (0.3%) |
| 18 to 34 Years | 1,511 (0.5%) | 1,280 (0.4%) |
| 35 to 64 Years | 8,272 (1.9%) | 4,942 (1.2%) |
| 65 to 74 Years | 6,026 (7.0%) | 4,633 (4.6%) |
| 75 Years and over | 12,824 (22.2%) | 14,840 (17.9%) |
Disability Class: Vision Difficulty
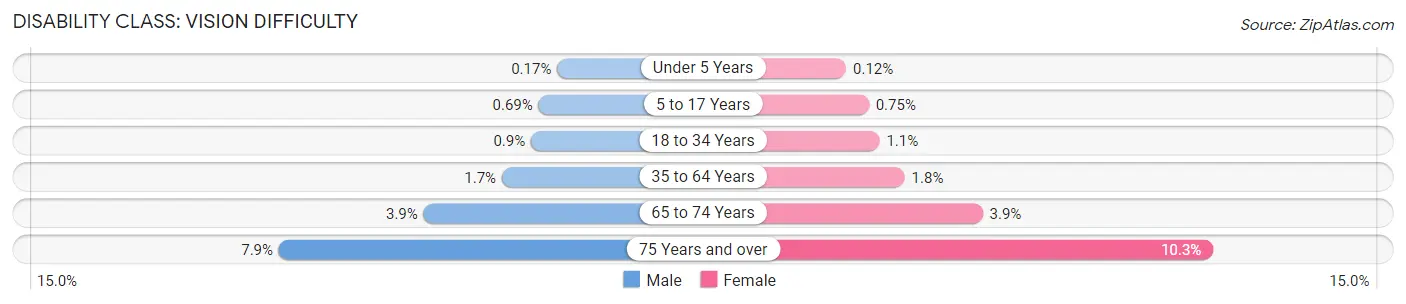
| Age Bracket | Male | Female |
| Under 5 Years | 91 (0.2%) | 62 (0.1%) |
| 5 to 17 Years | 1,062 (0.7%) | 1,094 (0.7%) |
| 18 to 34 Years | 2,563 (0.9%) | 2,951 (1.1%) |
| 35 to 64 Years | 7,396 (1.7%) | 7,433 (1.8%) |
| 65 to 74 Years | 3,329 (3.9%) | 3,935 (3.9%) |
| 75 Years and over | 4,577 (7.9%) | 8,586 (10.3%) |
Disability Class: Cognitive Difficulty
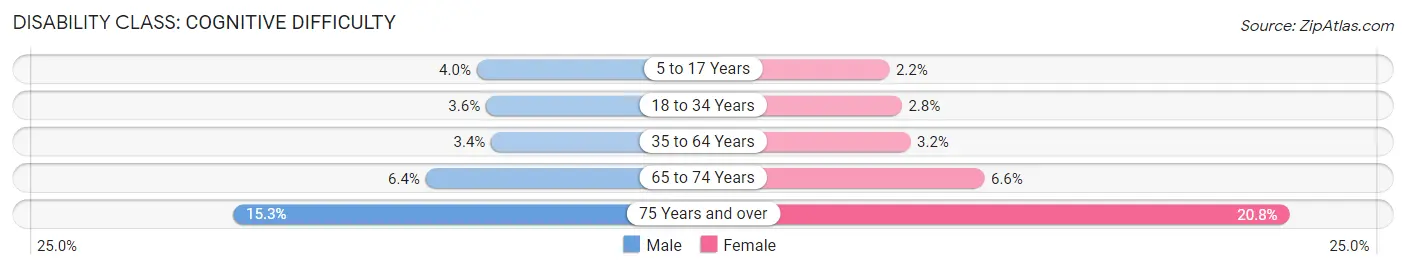
| Age Bracket | Male | Female |
| 5 to 17 Years | 6,182 (4.0%) | 3,217 (2.2%) |
| 18 to 34 Years | 10,241 (3.6%) | 7,798 (2.8%) |
| 35 to 64 Years | 14,477 (3.4%) | 13,462 (3.2%) |
| 65 to 74 Years | 5,468 (6.4%) | 6,634 (6.6%) |
| 75 Years and over | 8,853 (15.3%) | 17,239 (20.8%) |
Disability Class: Ambulatory Difficulty
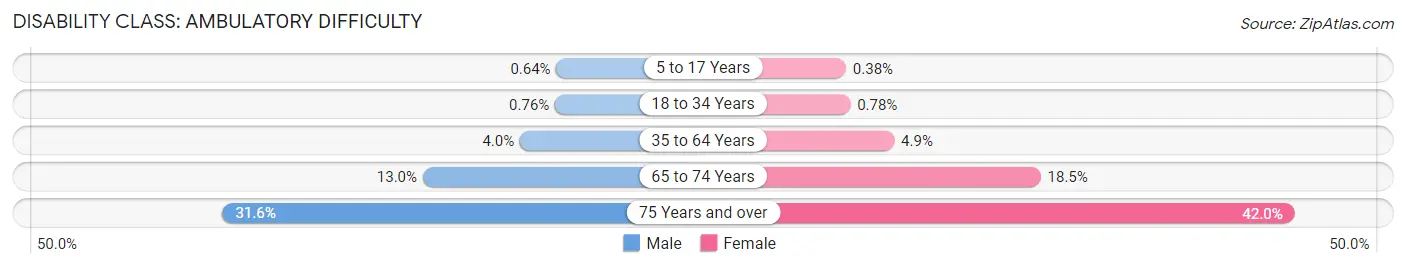
| Age Bracket | Male | Female |
| 5 to 17 Years | 982 (0.6%) | 562 (0.4%) |
| 18 to 34 Years | 2,172 (0.8%) | 2,204 (0.8%) |
| 35 to 64 Years | 17,365 (4.0%) | 20,667 (4.9%) |
| 65 to 74 Years | 11,168 (13.0%) | 18,540 (18.4%) |
| 75 Years and over | 18,277 (31.6%) | 34,885 (42.0%) |
Disability Class: Self-Care Difficulty
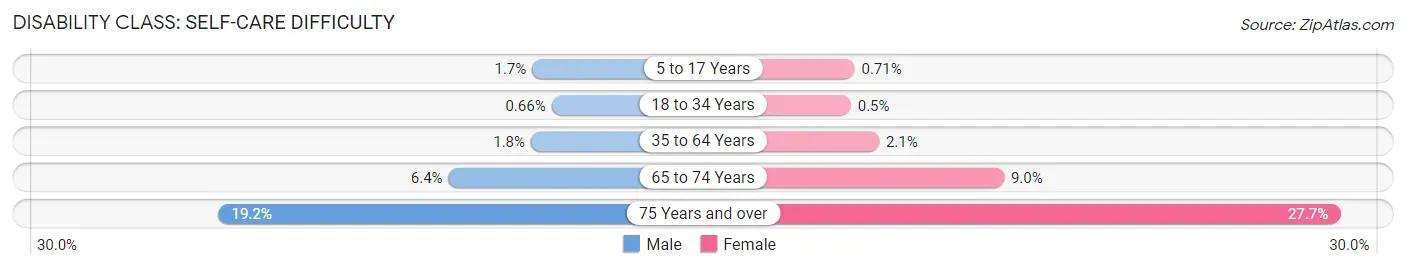
| Age Bracket | Male | Female |
| 5 to 17 Years | 2,679 (1.7%) | 1,035 (0.7%) |
| 18 to 34 Years | 1,873 (0.7%) | 1,402 (0.5%) |
| 35 to 64 Years | 7,818 (1.8%) | 8,773 (2.1%) |
| 65 to 74 Years | 5,479 (6.4%) | 9,071 (9.0%) |
| 75 Years and over | 11,093 (19.2%) | 23,032 (27.7%) |
Technology Access in Area Code 818
Computing Device Access in Area Code 818
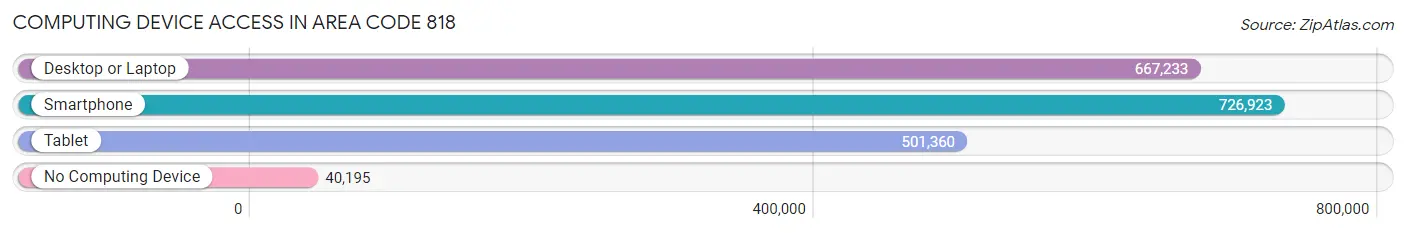
| Device Type | # Households | % Households |
| Desktop or Laptop | 667,233 | 83.6% |
| Smartphone | 726,923 | 91.1% |
| Tablet | 501,360 | 62.8% |
| No Computing Device | 40,195 | 5.0% |
| Total | 797,962 | 100.0% |
Internet Access in Area Code 818
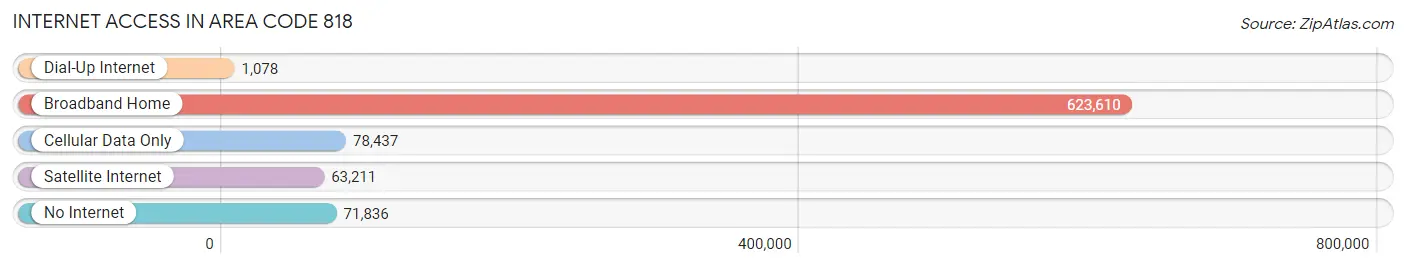
| Internet Type | # Households | % Households |
| Dial-Up Internet | 1,078 | 0.1% |
| Broadband Home | 623,610 | 78.1% |
| Cellular Data Only | 78,437 | 9.8% |
| Satellite Internet | 63,211 | 7.9% |
| No Internet | 71,836 | 9.0% |
| Total | 797,962 | 100.0% |
Area Code 818 Summary
Geography
Area code 818 is located in the state of California and covers the San Fernando Valley, which is located in the northern part of Los Angeles County. It includes the cities of Burbank, Glendale, San Fernando, and Calabasas.
Social
Area code 818 is home to a diverse population of people from all walks of life. The area is known for its vibrant culture, with a variety of restaurants, bars, and entertainment venues. It is also home to many celebrities, including actors, musicians, and athletes.
Economics
Area code 818 is an economically prosperous area, with a strong job market and a high median income. The area is home to many large businesses, including the Walt Disney Company, Warner Bros., and Universal Studios. It is also home to a number of technology companies, such as Google and Microsoft.
Demographics
Area code 818 is home to a diverse population, with a majority of residents being of Hispanic or Latino origin. The area also has a large population of Asian Americans, as well as a significant number of African Americans. The median age of residents is 34, and the median household income is $63,000.
Common Questions
What is Per Capita Income in Area Code 818?
Per Capita income in Area Code 818 is $54,061.
What is the Median Family Income in Area Code 818?
Median Family Income in Area Code 818 is $114,756.
What is the Median Household income in Area Code 818?
Median Household Income in Area Code 818 is $93,640.
What is Income or Wage Gap in Area Code 818?
Income or Wage Gap in Area Code 818 is 22.9%.
Women in Area Code 818 earn 77.1 cents for every dollar earned by a man.
What is Family Income Deficit in Area Code 818?
Family Income Deficit in Area Code 818 is $10,541.
Families that are below poverty line in Area Code 818 earn $10,541 less on average than the poverty threshold level.
What is Inequality or Gini Index in Area Code 818?
Inequality or Gini Index in Area Code 818 is 33.09.
What is the Total Population of Area Code 818?
Total Population of Area Code 818 is 2,178,533.
What is the Total Male Population of Area Code 818?
Total Male Population of Area Code 818 is 1,083,635.
What is the Total Female Population of Area Code 818?
Total Female Population of Area Code 818 is 1,094,898.
What is the Ratio of Males per 100 Females in Area Code 818?
There are 98.97 Males per 100 Females in Area Code 818.
What is the Ratio of Females per 100 Males in Area Code 818?
There are 101.04 Females per 100 Males in Area Code 818.
What is the Median Population Age in Area Code 818?
Median Population Age in Area Code 818 is 40.3 Years.
What is the Average Family Size in Area Code 818
Average Family Size in Area Code 818 is 3.2 People.
What is the Average Household Size in Area Code 818
Average Household Size in Area Code 818 is 2.6 People.
How Large is the Labor Force in Area Code 818?
There are 1,176,304 People in the Labor Forcein in Area Code 818.
What is the Percentage of People in the Labor Force in Area Code 818?
64.7% of People are in the Labor Force in Area Code 818.
What is the Unemployment Rate in Area Code 818?
Unemployment Rate in Area Code 818 is 7.2%.