Area Code 213 Map & Demographics
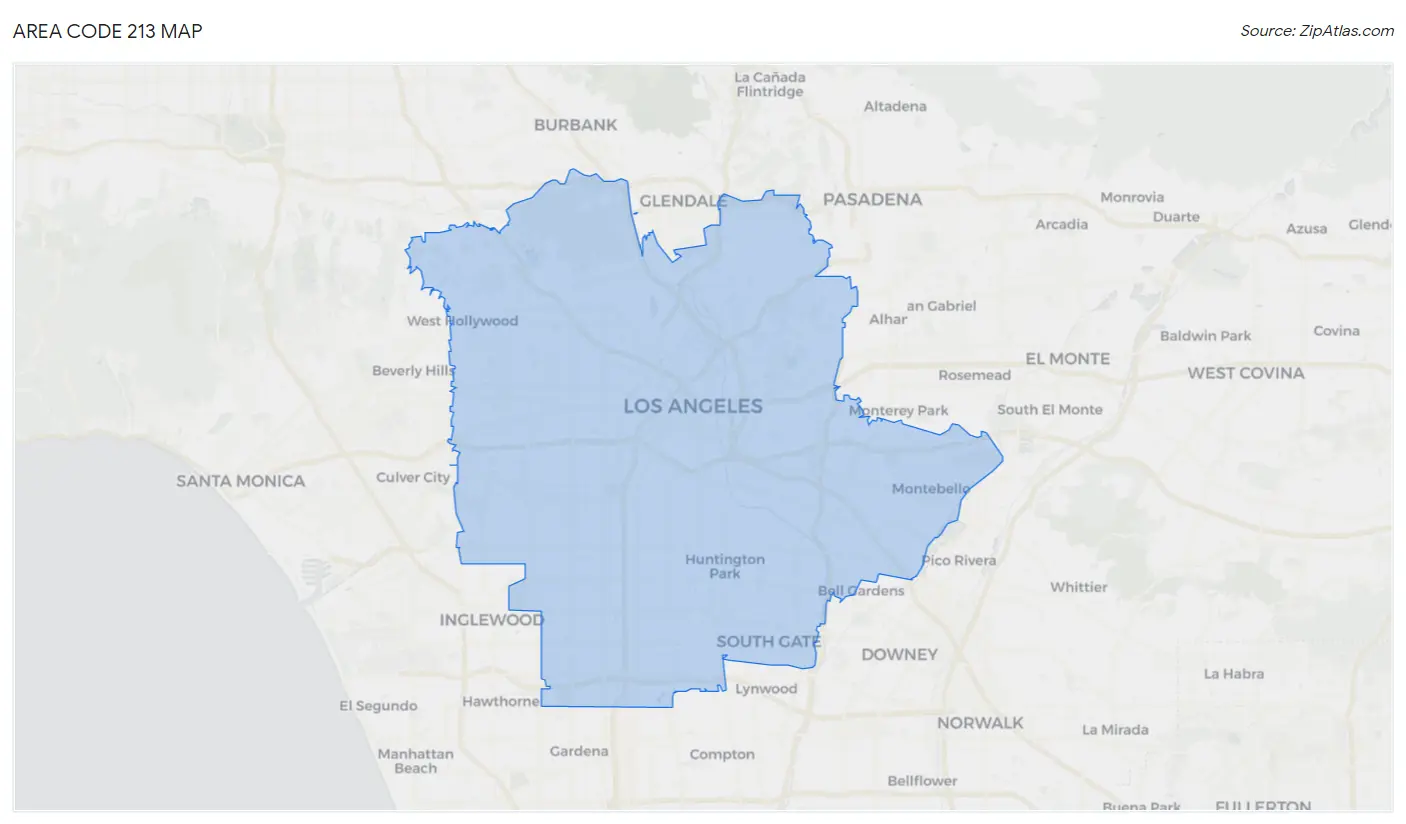
Area Code 213 Map
Area Code 213 Overview
$39,975
PER CAPITA INCOME
$87,156
AVG FAMILY INCOME
$69,174
AVG HOUSEHOLD INCOME
18.1%
WAGE / INCOME GAP [ % ]
81.9¢/ $1
WAGE / INCOME GAP [ $ ]
$11,071
FAMILY INCOME DEFICIT
14.72
INEQUALITY / GINI INDEX
1,031,920
TOTAL POPULATION
516,310
MALE POPULATION
515,610
FEMALE POPULATION
100.14
MALES / 100 FEMALES
99.86
FEMALES / 100 MALES
36.5
MEDIAN AGE
3.3
AVG FAMILY SIZE
2.5
AVG HOUSEHOLD SIZE
537,267
LABOR FORCE [ PEOPLE ]
63.5%
PERCENT IN LABOR FORCE
9.8%
UNEMPLOYMENT RATE
Income in Area Code 213
Income Overview in Area Code 213
Per Capita Income in Area Code 213 is $39,975, while median incomes of families and households are $87,156 and $69,174 respectively.
| Characteristic | Number | Measure |
| Per Capita Income | 1,031,920 | $39,975 |
| Median Family Income | 211,734 | $87,156 |
| Mean Family Income | 211,734 | $3,700,055 |
| Median Household Income | 370,787 | $69,174 |
| Mean Household Income | 370,787 | $3,053,845 |
| Income Deficit | 211,734 | $11,071 |
| Wage / Income Gap (%) | 1,031,920 | 18.10% |
| Wage / Income Gap ($) | 1,031,920 | 81.90¢ per $1 |
| Gini / Inequality Index | 1,031,920 | 14.72 |
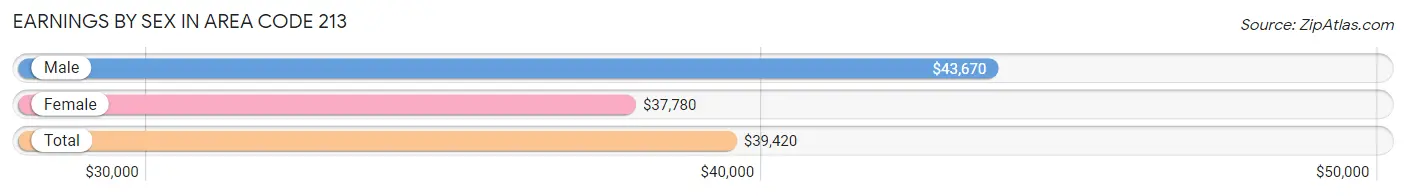
Earnings by Sex in Area Code 213
Average Earnings in Area Code 213 are $39,420, $43,670 for men and $37,780 for women, a difference of 13.5%.
| Sex | Number | Average Earnings |
| Male | 305,839 (54.2%) | $43,670 |
| Female | 258,344 (45.8%) | $37,780 |
| Total | 564,183 (100.0%) | $39,420 |
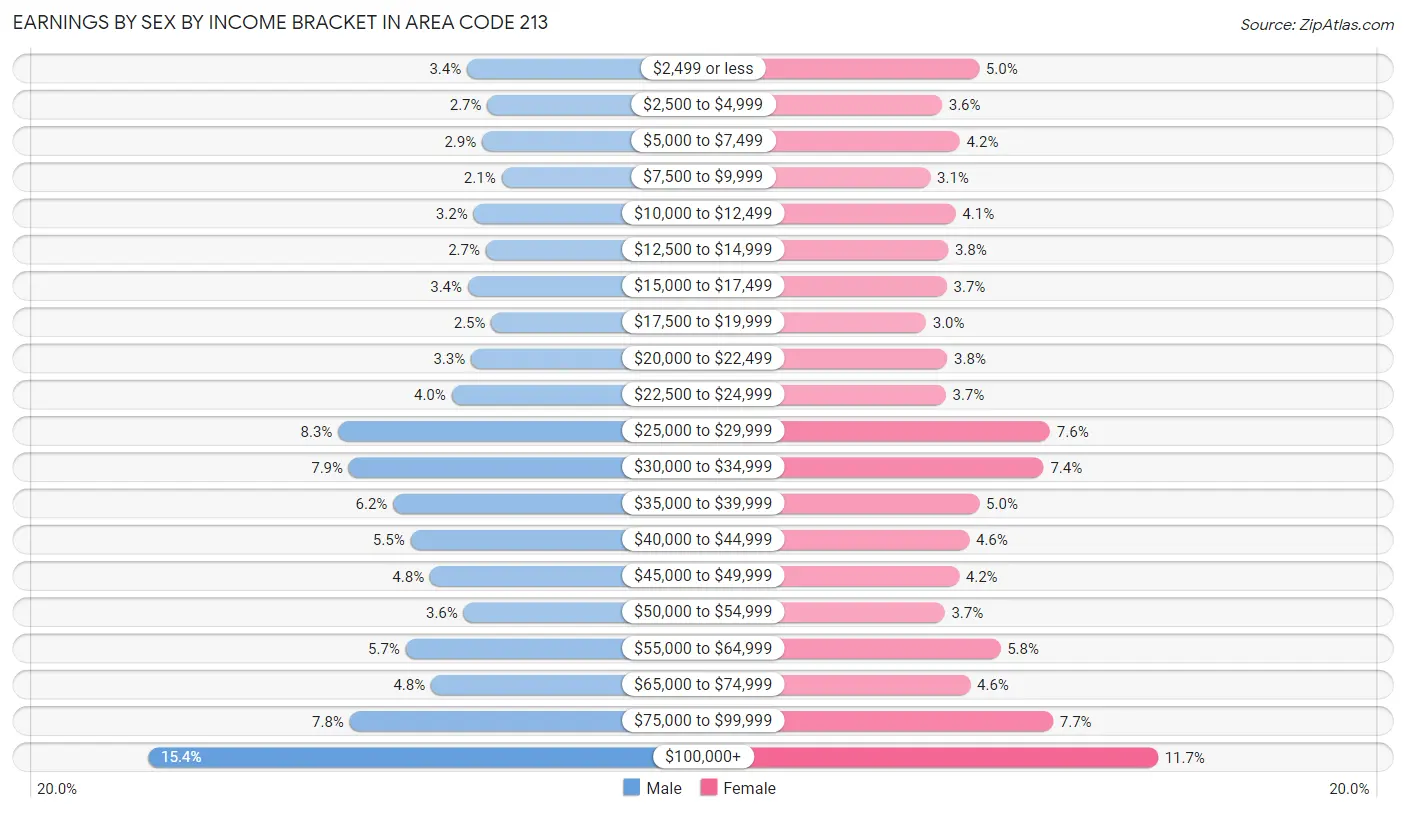
Earnings by Sex by Income Bracket in Area Code 213
The most common earnings brackets in Area Code 213 are $100,000+ for men (46,995 | 15.4%) and $100,000+ for women (30,087 | 11.7%).
| Income | Male | Female |
| $2,499 or less | 10,455 (3.4%) | 12,795 (5.0%) |
| $2,500 to $4,999 | 8,138 (2.7%) | 9,186 (3.6%) |
| $5,000 to $7,499 | 8,751 (2.9%) | 10,922 (4.2%) |
| $7,500 to $9,999 | 6,519 (2.1%) | 8,050 (3.1%) |
| $10,000 to $12,499 | 9,713 (3.2%) | 10,505 (4.1%) |
| $12,500 to $14,999 | 8,324 (2.7%) | 9,796 (3.8%) |
| $15,000 to $17,499 | 10,374 (3.4%) | 9,669 (3.7%) |
| $17,500 to $19,999 | 7,690 (2.5%) | 7,640 (3.0%) |
| $20,000 to $22,499 | 9,998 (3.3%) | 9,715 (3.8%) |
| $22,500 to $24,999 | 12,219 (4.0%) | 9,570 (3.7%) |
| $25,000 to $29,999 | 25,246 (8.3%) | 19,666 (7.6%) |
| $30,000 to $34,999 | 23,997 (7.9%) | 19,033 (7.4%) |
| $35,000 to $39,999 | 18,932 (6.2%) | 12,823 (5.0%) |
| $40,000 to $44,999 | 16,942 (5.5%) | 11,832 (4.6%) |
| $45,000 to $49,999 | 14,725 (4.8%) | 10,857 (4.2%) |
| $50,000 to $54,999 | 10,842 (3.5%) | 9,464 (3.7%) |
| $55,000 to $64,999 | 17,481 (5.7%) | 14,865 (5.8%) |
| $65,000 to $74,999 | 14,584 (4.8%) | 11,924 (4.6%) |
| $75,000 to $99,999 | 23,914 (7.8%) | 19,945 (7.7%) |
| $100,000+ | 46,995 (15.4%) | 30,087 (11.7%) |
| Total | 305,839 (100.0%) | 258,344 (100.0%) |
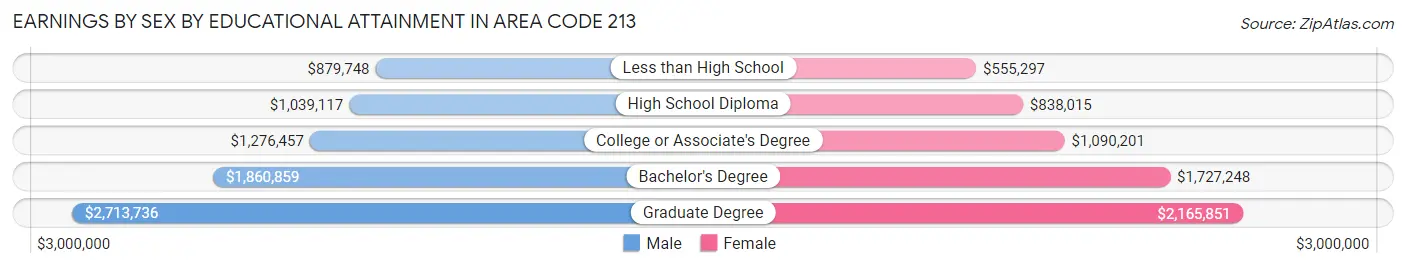
Earnings by Sex by Educational Attainment in Area Code 213
Average earnings in Area Code 213 are $1,444,331 for men and $1,385,542 for women, a difference of 4.1%. Men with an educational attainment of graduate degree enjoy the highest average annual earnings of $2,713,736, while those with less than high school education earn the least with $879,748. Women with an educational attainment of graduate degree earn the most with the average annual earnings of $2,165,851, while those with less than high school education have the smallest earnings of $555,297.
| Educational Attainment | Male Income | Female Income |
| Less than High School | $879,748 | $555,297 |
| High School Diploma | $1,039,117 | $838,015 |
| College or Associate's Degree | $1,276,457 | $1,090,201 |
| Bachelor's Degree | $1,860,859 | $1,727,248 |
| Graduate Degree | $2,713,736 | $2,165,851 |
| Total | $1,444,331 | $1,385,542 |
Family Income in Area Code 213
Family Income Brackets in Area Code 213
According to the Area Code 213 family income data, there are 1,212,177 families falling into the $100,000 to $149,999 income range, which is the most common income bracket and makes up 572.5% of all families. Conversely, the $10,000 to $14,999 income bracket is the least frequent group with only 185,267 families (87.5%) belonging to this category.
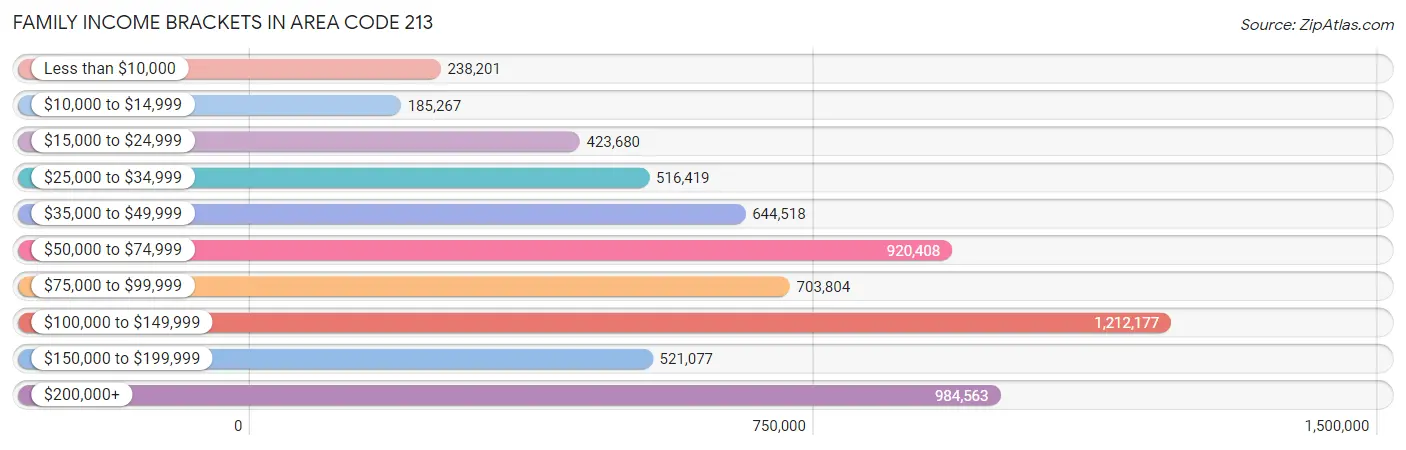
| Income Bracket | # Families | % Families |
| Less than $10,000 | 238,201 | 112.5% |
| $10,000 to $14,999 | 185,267 | 87.5% |
| $15,000 to $24,999 | 423,680 | 200.1% |
| $25,000 to $34,999 | 516,419 | 243.9% |
| $35,000 to $49,999 | 644,518 | 304.4% |
| $50,000 to $74,999 | 920,408 | 434.7% |
| $75,000 to $99,999 | 703,804 | 332.4% |
| $100,000 to $149,999 | 1,212,177 | 572.5% |
| $150,000 to $199,999 | 521,077 | 246.1% |
| $200,000+ | 984,563 | 465.0% |
Family Income by Famaliy Size in Area Code 213
7+ person families (7,729 | 3.6%) account for the highest median family income in Area Code 213 with $120,573 per family, while 2-person families (81,333 | 38.4%) have the highest median income of $39,263 per family member.
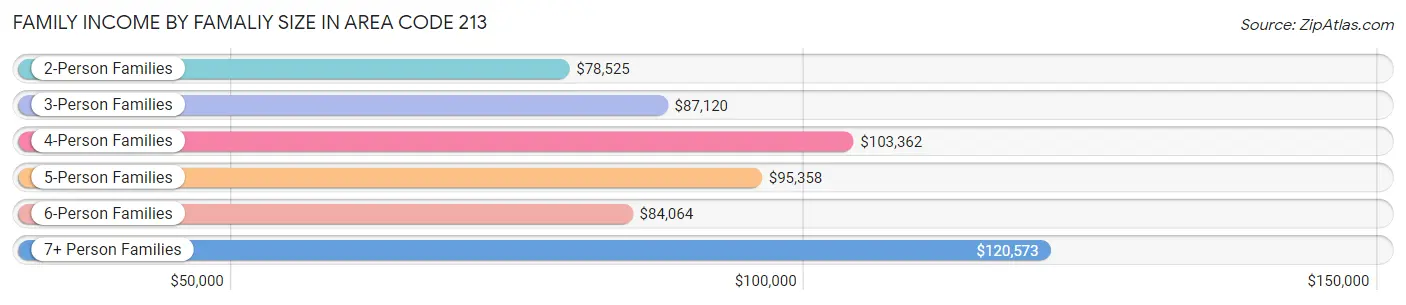
| Income Bracket | # Families | Median Income |
| 2-Person Families | 81,333 (38.4%) | $78,525 |
| 3-Person Families | 51,258 (24.2%) | $87,120 |
| 4-Person Families | 41,877 (19.8%) | $103,362 |
| 5-Person Families | 20,835 (9.8%) | $95,358 |
| 6-Person Families | 8,702 (4.1%) | $84,064 |
| 7+ Person Families | 7,729 (3.6%) | $120,573 |
| Total | 211,734 (100.0%) | $87,156 |
Family Income by Number of Earners in Area Code 213
The median family income in Area Code 213 is $87,156, with families comprising 3+ earners (32,960) having the highest median family income of $124,567, while families with no earners (21,414) have the lowest median family income of $30,591, accounting for 15.6% and 10.1% of families, respectively.
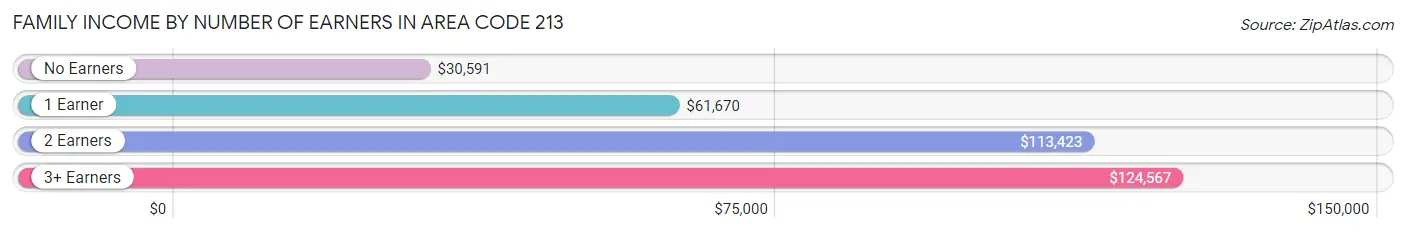
| Number of Earners | # Families | Median Income |
| No Earners | 21,414 (10.1%) | $30,591 |
| 1 Earner | 73,496 (34.7%) | $61,670 |
| 2 Earners | 83,864 (39.6%) | $113,423 |
| 3+ Earners | 32,960 (15.6%) | $124,567 |
| Total | 211,734 (100.0%) | $87,156 |
Household Income in Area Code 213
Household Income Brackets in Area Code 213
With 1,915,486 households falling in the category, the $50,000 to $74,999 income range is the most frequent in Area Code 213, accounting for 516.6% of all households. In contrast, only 806,462 households (217.5%) fall into the $15,000 to $24,999 income bracket, making it the least populous group.
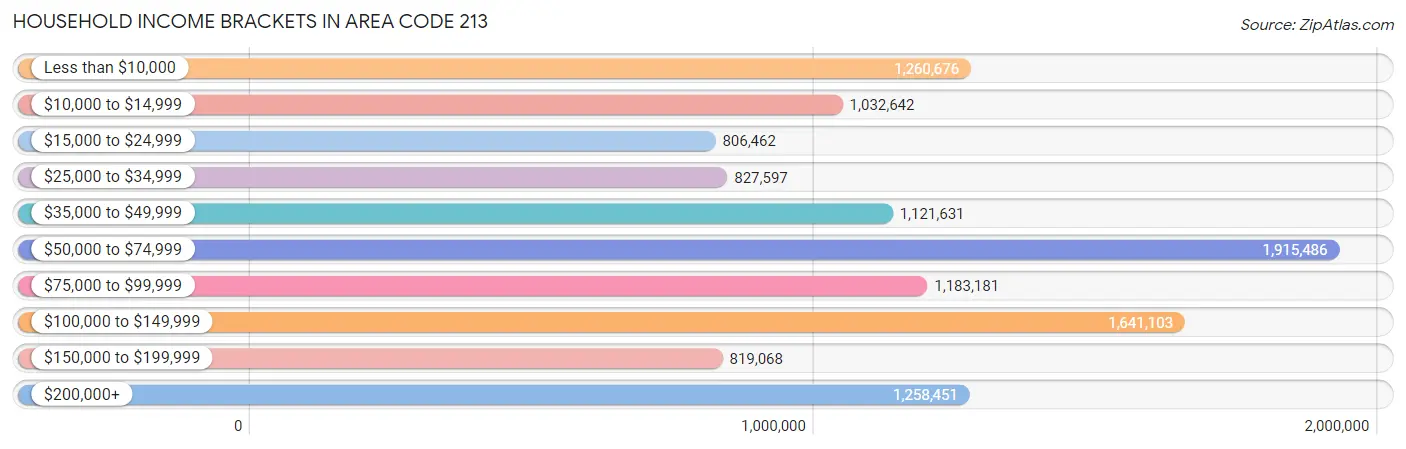
| Income Bracket | # Households | % Households |
| Less than $10,000 | 1,260,676 | 340.0% |
| $10,000 to $14,999 | 1,032,642 | 278.5% |
| $15,000 to $24,999 | 806,462 | 217.5% |
| $25,000 to $34,999 | 827,597 | 223.2% |
| $35,000 to $49,999 | 1,121,631 | 302.5% |
| $50,000 to $74,999 | 1,915,486 | 516.6% |
| $75,000 to $99,999 | 1,183,181 | 319.1% |
| $100,000 to $149,999 | 1,641,103 | 442.6% |
| $150,000 to $199,999 | 819,068 | 220.9% |
| $200,000+ | 1,258,451 | 339.4% |
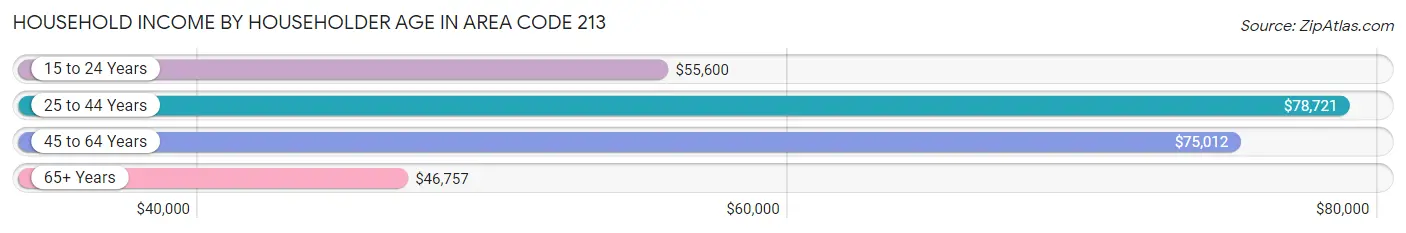
Household Income by Householder Age in Area Code 213
The median household income in Area Code 213 is $69,174, with the highest median household income of $78,721 found in the 25 to 44 years age bracket for the primary householder. A total of 150,956 households (40.7%) fall into this category. Meanwhile, the 65+ years age bracket for the primary householder has the lowest median household income of $46,756, with 71,582 households (19.3%) in this group.
| Income Bracket | # Households | Median Income |
| 15 to 24 Years | 13,574 (3.7%) | $55,600 |
| 25 to 44 Years | 150,956 (40.7%) | $78,721 |
| 45 to 64 Years | 134,675 (36.3%) | $75,012 |
| 65+ Years | 71,582 (19.3%) | $46,756 |
| Total | 370,787 (100.0%) | $69,174 |
Poverty in Area Code 213
Income Below Poverty by Sex and Age in Area Code 213
With 19.1% poverty level for males and 21.1% for females among the residents of Area Code 213, 15 year old males and 15 year old females are the most vulnerable to poverty, with 2,121 males (32.1%) and 1,724 females (29.4%) in their respective age groups living below the poverty level.
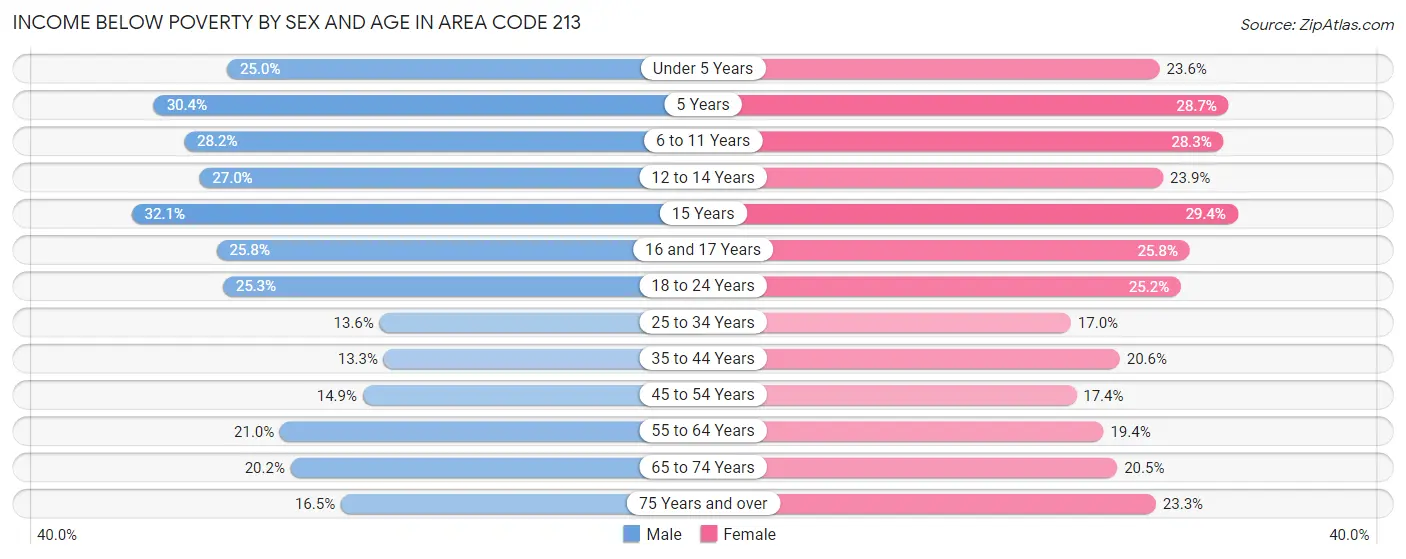
| Age Bracket | Male | Female |
| Under 5 Years | 7,060 (25.0%) | 6,044 (23.6%) |
| 5 Years | 1,635 (30.4%) | 1,441 (28.7%) |
| 6 to 11 Years | 10,127 (28.2%) | 9,954 (28.3%) |
| 12 to 14 Years | 4,771 (27.0%) | 4,054 (23.9%) |
| 15 Years | 2,121 (32.1%) | 1,724 (29.4%) |
| 16 and 17 Years | 2,764 (25.8%) | 2,821 (25.8%) |
| 18 to 24 Years | 12,629 (25.3%) | 11,633 (25.2%) |
| 25 to 34 Years | 13,448 (13.6%) | 15,925 (17.0%) |
| 35 to 44 Years | 10,316 (13.3%) | 14,815 (20.6%) |
| 45 to 54 Years | 9,776 (14.9%) | 11,551 (17.4%) |
| 55 to 64 Years | 11,962 (21.0%) | 11,004 (19.4%) |
| 65 to 74 Years | 7,060 (20.2%) | 7,918 (20.4%) |
| 75 Years and over | 3,013 (16.5%) | 7,359 (23.3%) |
| Total | 96,682 (19.1%) | 106,243 (21.1%) |
Income Above Poverty by Sex and Age in Area Code 213
According to the poverty statistics in Area Code 213, males aged 35 to 44 years and females aged 25 to 34 years are the age groups that are most secure financially, with 86.7% of males and 83.0% of females in these age groups living above the poverty line.
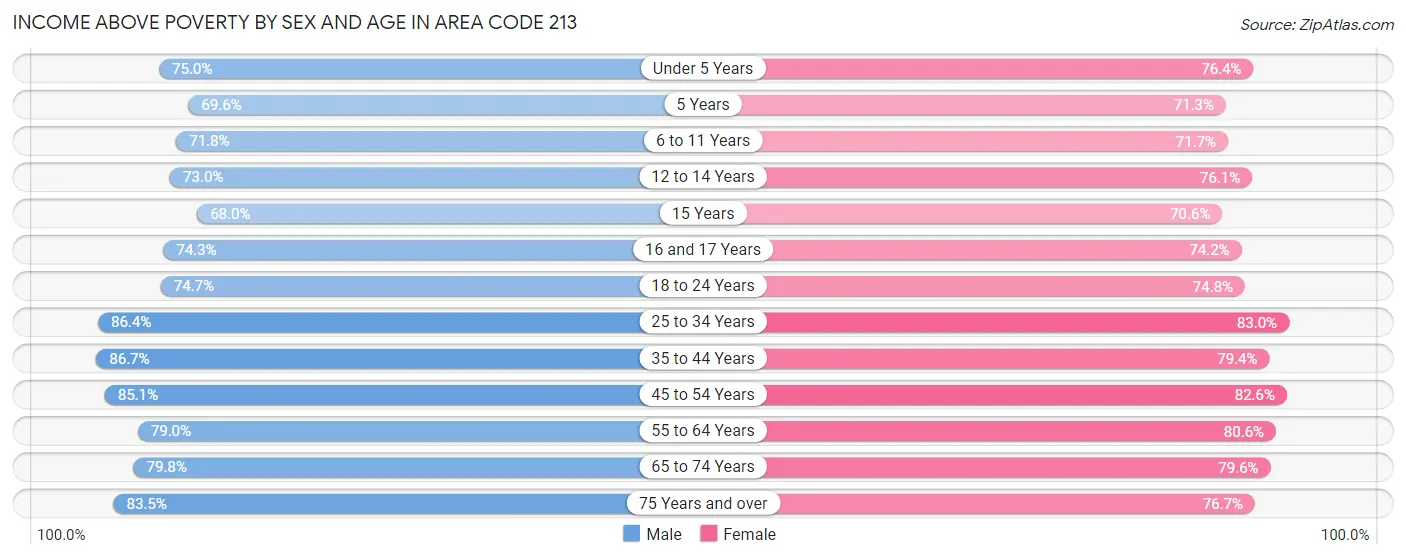
| Age Bracket | Male | Female |
| Under 5 Years | 21,218 (75.0%) | 19,569 (76.4%) |
| 5 Years | 3,742 (69.6%) | 3,576 (71.3%) |
| 6 to 11 Years | 25,836 (71.8%) | 25,164 (71.7%) |
| 12 to 14 Years | 12,888 (73.0%) | 12,937 (76.1%) |
| 15 Years | 4,497 (67.9%) | 4,141 (70.6%) |
| 16 and 17 Years | 7,971 (74.3%) | 8,099 (74.2%) |
| 18 to 24 Years | 37,331 (74.7%) | 34,568 (74.8%) |
| 25 to 34 Years | 85,170 (86.4%) | 77,696 (83.0%) |
| 35 to 44 Years | 67,098 (86.7%) | 56,967 (79.4%) |
| 45 to 54 Years | 55,890 (85.1%) | 54,780 (82.6%) |
| 55 to 64 Years | 44,921 (79.0%) | 45,621 (80.6%) |
| 65 to 74 Years | 27,826 (79.8%) | 30,805 (79.5%) |
| 75 Years and over | 15,232 (83.5%) | 24,197 (76.7%) |
| Total | 409,620 (80.9%) | 398,120 (78.9%) |
Income Below Poverty Among Married-Couple Families in Area Code 213
The poverty statistics for married-couple families in Area Code 213 show that 9.3% or 11,614 of the total 124,804 families live below the poverty line. Families with 5 or more children have the highest poverty rate of 30.3%, comprising of 314 families. On the other hand, families with no children have the lowest poverty rate of 6.2%, which includes 4,225 families.
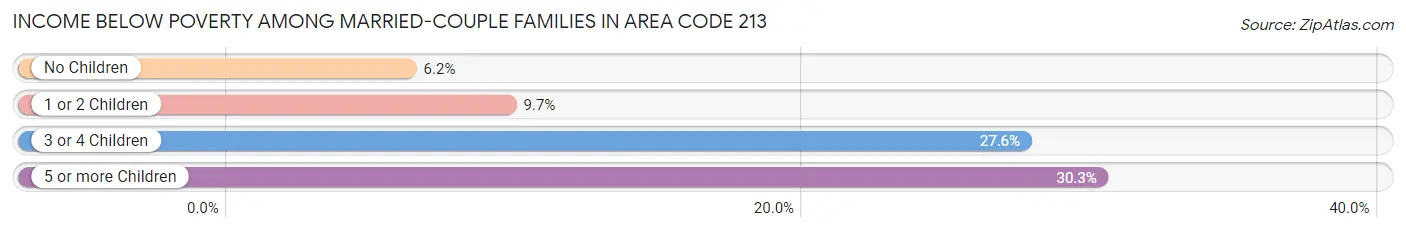
| Children | Above Poverty | Below Poverty |
| No Children | 63,726 (93.8%) | 4,225 (6.2%) |
| 1 or 2 Children | 42,054 (90.3%) | 4,520 (9.7%) |
| 3 or 4 Children | 6,688 (72.4%) | 2,555 (27.6%) |
| 5 or more Children | 722 (69.7%) | 314 (30.3%) |
| Total | 113,190 (90.7%) | 11,614 (9.3%) |
Income Below Poverty Among Single-Parent Households in Area Code 213
According to the poverty data in Area Code 213, 17.9% or 4,999 single-father households and 24.9% or 14,674 single-mother households are living below the poverty line. Among single-father households, those with 3 or 4 children have the highest poverty rate, with 1,007 households (41.6%) experiencing poverty. Likewise, among single-mother households, those with 5 or more children have the highest poverty rate, with 525 households (77.1%) falling below the poverty line.
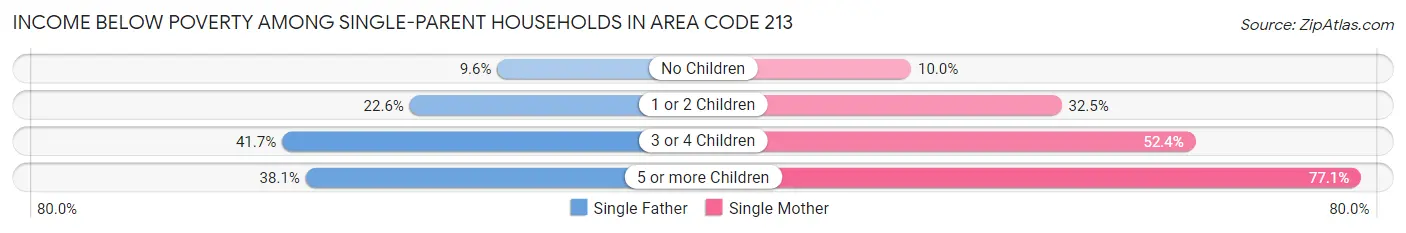
| Children | Single Father | Single Mother |
| No Children | 1,331 (9.6%) | 2,654 (10.0%) |
| 1 or 2 Children | 2,592 (22.6%) | 8,440 (32.5%) |
| 3 or 4 Children | 1,007 (41.6%) | 3,055 (52.4%) |
| 5 or more Children | 69 (38.1%) | 525 (77.1%) |
| Total | 4,999 (17.9%) | 14,674 (24.9%) |
Income Below Poverty Among Married-Couple vs Single-Parent Households in Area Code 213
The poverty data for Area Code 213 shows that 11,614 of the married-couple family households (9.3%) and 19,673 of the single-parent households (22.6%) are living below the poverty level. Within the married-couple family households, those with 5 or more children have the highest poverty rate, with 314 households (30.3%) falling below the poverty line. Among the single-parent households, those with 5 or more children have the highest poverty rate, with 594 household (68.9%) living below poverty.
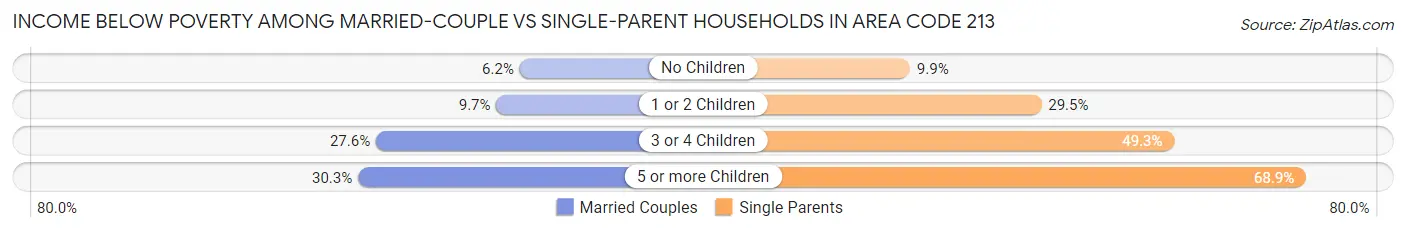
| Children | Married-Couple Families | Single-Parent Households |
| No Children | 4,225 (6.2%) | 3,985 (9.9%) |
| 1 or 2 Children | 4,520 (9.7%) | 11,032 (29.4%) |
| 3 or 4 Children | 2,555 (27.6%) | 4,062 (49.3%) |
| 5 or more Children | 314 (30.3%) | 594 (68.9%) |
| Total | 11,614 (9.3%) | 19,673 (22.6%) |
Race in Area Code 213
The most populous races in Area Code 213 are Hispanic or Latino (527,399 | 51.1%), White / Caucasian (347,726 | 33.7%), and Some other Race (265,445 | 25.7%).
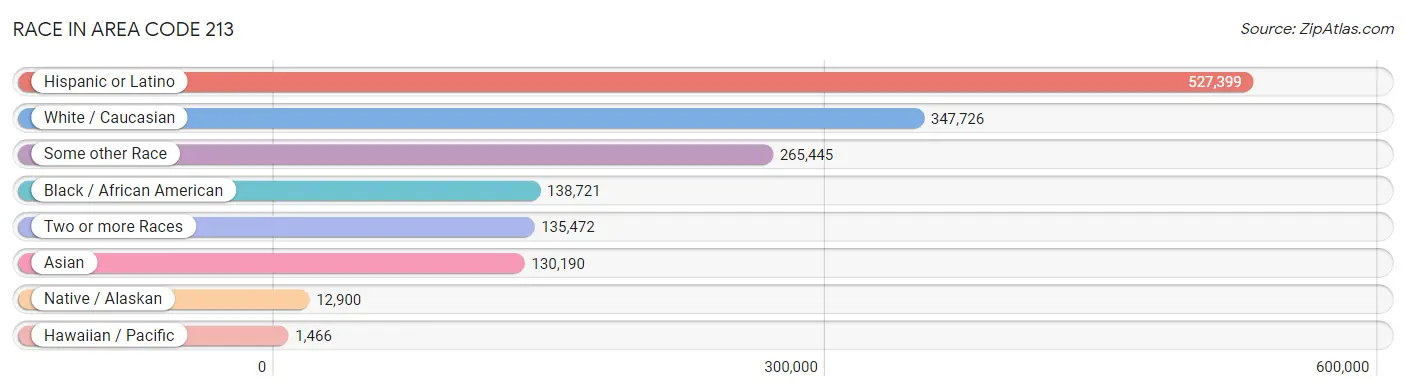
| Race | # Population | % Population |
| Asian | 130,190 | 12.6% |
| Black / African American | 138,721 | 13.4% |
| Hawaiian / Pacific | 1,466 | 0.1% |
| Hispanic or Latino | 527,399 | 51.1% |
| Native / Alaskan | 12,900 | 1.3% |
| White / Caucasian | 347,726 | 33.7% |
| Two or more Races | 135,472 | 13.1% |
| Some other Race | 265,445 | 25.7% |
| Total | 1,031,920 | 100.0% |
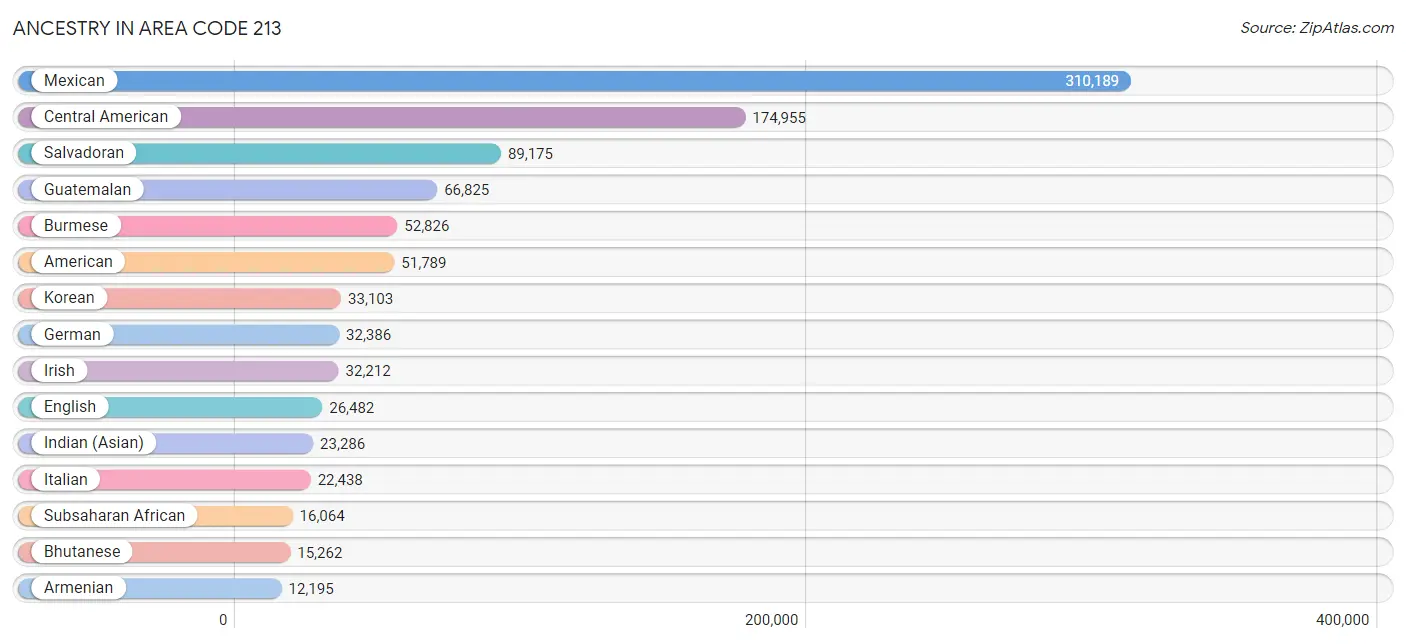
Ancestry in Area Code 213
The most populous ancestries reported in Area Code 213 are Mexican (310,189 | 30.1%), Central American (174,955 | 17.0%), Salvadoran (89,175 | 8.6%), Guatemalan (66,825 | 6.5%), and Burmese (52,826 | 5.1%), together accounting for 67.2% of all Area Code 213 residents.
| Ancestry | # Population | % Population |
| Afghan | 277 | 0.0% |
| African | 7,929 | 0.8% |
| Alaska Native | 58 | 0.0% |
| Albanian | 63 | 0.0% |
| American | 51,789 | 5.0% |
| Apache | 552 | 0.1% |
| Arab | 6,442 | 0.6% |
| Argentinean | 1,493 | 0.1% |
| Armenian | 12,195 | 1.2% |
| Assyrian / Chaldean / Syriac | 176 | 0.0% |
| Australian | 516 | 0.1% |
| Austrian | 1,329 | 0.1% |
| Bahamian | 236 | 0.0% |
| Bangladeshi | 58 | 0.0% |
| Barbadian | 7 | 0.0% |
| Basque | 177 | 0.0% |
| Belgian | 414 | 0.0% |
| Belizean | 4,132 | 0.4% |
| Bhutanese | 15,262 | 1.5% |
| Blackfeet | 652 | 0.1% |
| Bolivian | 350 | 0.0% |
| Brazilian | 1,050 | 0.1% |
| British | 4,153 | 0.4% |
| British West Indian | 245 | 0.0% |
| Bulgarian | 349 | 0.0% |
| Burmese | 52,826 | 5.1% |
| Cajun | 35 | 0.0% |
| Cambodian | 1,036 | 0.1% |
| Canadian | 1,452 | 0.1% |
| Cape Verdean | 296 | 0.0% |
| Celtic | 90 | 0.0% |
| Central American | 174,955 | 17.0% |
| Central American Indian | 5,525 | 0.5% |
| Cherokee | 2,753 | 0.3% |
| Cheyenne | 8 | 0.0% |
| Chickasaw | 114 | 0.0% |
| Chilean | 1,009 | 0.1% |
| Chinese | 35 | 0.0% |
| Chippewa | 136 | 0.0% |
| Choctaw | 717 | 0.1% |
| Colombian | 2,491 | 0.2% |
| Colville | 6 | 0.0% |
| Comanche | 42 | 0.0% |
| Costa Rican | 899 | 0.1% |
| Cree | 66 | 0.0% |
| Creek | 178 | 0.0% |
| Croatian | 774 | 0.1% |
| Cuban | 3,563 | 0.4% |
| Cypriot | 22 | 0.0% |
| Czech | 970 | 0.1% |
| Czechoslovakian | 398 | 0.0% |
| Danish | 1,713 | 0.2% |
| Delaware | 16 | 0.0% |
| Dominican | 1,053 | 0.1% |
| Dutch | 2,369 | 0.2% |
| Dutch West Indian | 4 | 0.0% |
| Eastern European | 3,862 | 0.4% |
| Ecuadorian | 2,645 | 0.3% |
| Egyptian | 695 | 0.1% |
| English | 26,482 | 2.6% |
| Estonian | 115 | 0.0% |
| Ethiopian | 2,370 | 0.2% |
| European | 9,345 | 0.9% |
| Filipino | 1,848 | 0.2% |
| Finnish | 747 | 0.1% |
| French | 9,467 | 0.9% |
| French American Indian | 139 | 0.0% |
| French Canadian | 1,194 | 0.1% |
| German | 32,386 | 3.1% |
| German Russian | 36 | 0.0% |
| Ghanaian | 870 | 0.1% |
| Greek | 2,601 | 0.3% |
| Guamanian / Chamorro | 418 | 0.0% |
| Guatemalan | 66,825 | 6.5% |
| Guyanese | 146 | 0.0% |
| Haitian | 1,268 | 0.1% |
| Honduran | 11,229 | 1.1% |
| Hopi | 25 | 0.0% |
| Hungarian | 2,220 | 0.2% |
| Icelander | 80 | 0.0% |
| Indian (Asian) | 23,286 | 2.3% |
| Indonesian | 391 | 0.0% |
| Inupiat | 70 | 0.0% |
| Iranian | 5,546 | 0.5% |
| Iraqi | 265 | 0.0% |
| Irish | 32,212 | 3.1% |
| Iroquois | 93 | 0.0% |
| Israeli | 1,278 | 0.1% |
| Italian | 22,438 | 2.2% |
| Jamaican | 2,841 | 0.3% |
| Japanese | 1,366 | 0.1% |
| Jordanian | 374 | 0.0% |
| Kenyan | 273 | 0.0% |
| Kiowa | 63 | 0.0% |
| Korean | 33,103 | 3.2% |
| Laotian | 974 | 0.1% |
| Latvian | 246 | 0.0% |
| Lebanese | 2,089 | 0.2% |
| Liberian | 2 | 0.0% |
| Lithuanian | 968 | 0.1% |
| Lumbee | 10 | 0.0% |
| Luxembourger | 82 | 0.0% |
| Macedonian | 10 | 0.0% |
| Malaysian | 216 | 0.0% |
| Maltese | 119 | 0.0% |
| Mexican | 310,189 | 30.1% |
| Mexican American Indian | 7,013 | 0.7% |
| Mongolian | 142 | 0.0% |
| Moroccan | 606 | 0.1% |
| Native Hawaiian | 1,507 | 0.2% |
| Navajo | 709 | 0.1% |
| Nepalese | 15 | 0.0% |
| New Zealander | 190 | 0.0% |
| Nicaraguan | 4,815 | 0.5% |
| Nigerian | 3,209 | 0.3% |
| Northern European | 629 | 0.1% |
| Norwegian | 3,155 | 0.3% |
| Okinawan | 88 | 0.0% |
| Osage | 16 | 0.0% |
| Paiute | 21 | 0.0% |
| Pakistani | 2,355 | 0.2% |
| Palestinian | 148 | 0.0% |
| Panamanian | 840 | 0.1% |
| Paraguayan | 54 | 0.0% |
| Pennsylvania German | 19 | 0.0% |
| Peruvian | 2,408 | 0.2% |
| Pima | 71 | 0.0% |
| Polish | 10,265 | 1.0% |
| Portuguese | 1,886 | 0.2% |
| Pueblo | 75 | 0.0% |
| Puerto Rican | 4,408 | 0.4% |
| Romanian | 1,746 | 0.2% |
| Russian | 11,502 | 1.1% |
| Salvadoran | 89,175 | 8.6% |
| Samoan | 407 | 0.0% |
| Scandinavian | 976 | 0.1% |
| Scotch-Irish | 2,629 | 0.3% |
| Scottish | 5,559 | 0.5% |
| Seminole | 103 | 0.0% |
| Senegalese | 161 | 0.0% |
| Serbian | 314 | 0.0% |
| Sierra Leonean | 17 | 0.0% |
| Sioux | 219 | 0.0% |
| Slavic | 134 | 0.0% |
| Slovak | 510 | 0.1% |
| Slovene | 301 | 0.0% |
| Somali | 94 | 0.0% |
| South African | 241 | 0.0% |
| South American | 11,524 | 1.1% |
| South American Indian | 402 | 0.0% |
| Soviet Union | 54 | 0.0% |
| Spaniard | 3,153 | 0.3% |
| Spanish | 2,321 | 0.2% |
| Spanish American | 162 | 0.0% |
| Spanish American Indian | 151 | 0.0% |
| Sri Lankan | 5,887 | 0.6% |
| Subsaharan African | 16,064 | 1.6% |
| Sudanese | 12 | 0.0% |
| Swedish | 3,864 | 0.4% |
| Swiss | 1,419 | 0.1% |
| Syrian | 887 | 0.1% |
| Taiwanese | 177 | 0.0% |
| Thai | 7,595 | 0.7% |
| Tlingit-Haida | 17 | 0.0% |
| Tohono O'Odham | 133 | 0.0% |
| Tongan | 357 | 0.0% |
| Trinidadian and Tobagonian | 468 | 0.1% |
| Turkish | 679 | 0.1% |
| U.S. Virgin Islander | 17 | 0.0% |
| Ukrainian | 2,777 | 0.3% |
| Uruguayan | 44 | 0.0% |
| Venezuelan | 899 | 0.1% |
| Vietnamese | 1,421 | 0.1% |
| Welsh | 2,052 | 0.2% |
| West Indian | 365 | 0.0% |
| Yaqui | 113 | 0.0% |
| Yugoslavian | 96 | 0.0% |
| Zimbabwean | 14 | 0.0% | View All 178 Rows |
Immigrants in Area Code 213
The most numerous immigrant groups reported in Area Code 213 came from Latin America (254,878 | 24.7%), Central America (241,798 | 23.4%), Mexico (121,331 | 11.8%), Asia (102,010 | 9.9%), and El Salvador (57,328 | 5.6%), together accounting for 75.3% of all Area Code 213 residents.
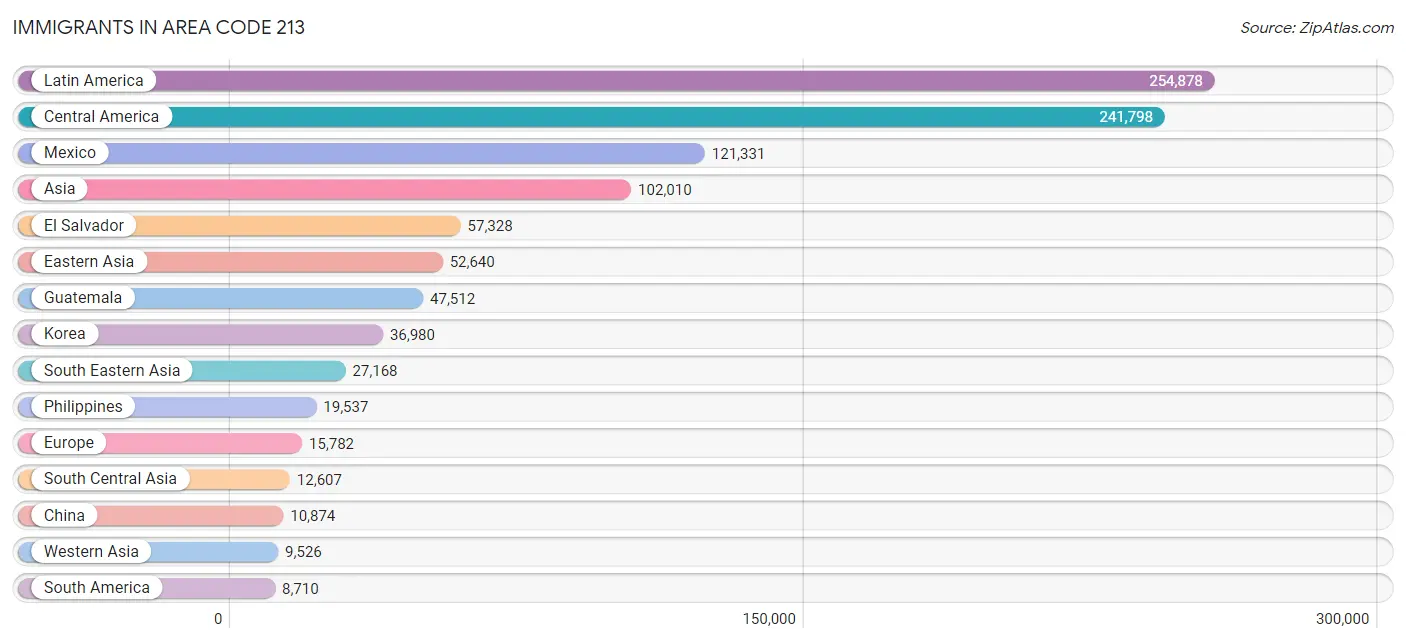
| Immigration Origin | # Population | % Population |
| Afghanistan | 39 | 0.0% |
| Africa | 7,900 | 0.8% |
| Albania | 11 | 0.0% |
| Argentina | 1,105 | 0.1% |
| Armenia | 4,709 | 0.5% |
| Asia | 102,010 | 9.9% |
| Australia | 1,169 | 0.1% |
| Austria | 142 | 0.0% |
| Azores | 17 | 0.0% |
| Bahamas | 27 | 0.0% |
| Bangladesh | 1,631 | 0.2% |
| Barbados | 7 | 0.0% |
| Belarus | 328 | 0.0% |
| Belgium | 121 | 0.0% |
| Belize | 3,540 | 0.3% |
| Bolivia | 343 | 0.0% |
| Brazil | 1,496 | 0.1% |
| Bulgaria | 302 | 0.0% |
| Cambodia | 733 | 0.1% |
| Cameroon | 120 | 0.0% |
| Canada | 2,235 | 0.2% |
| Caribbean | 4,370 | 0.4% |
| Central America | 241,798 | 23.4% |
| Chile | 514 | 0.1% |
| China | 10,874 | 1.1% |
| Colombia | 1,187 | 0.1% |
| Congo | 86 | 0.0% |
| Costa Rica | 368 | 0.0% |
| Croatia | 201 | 0.0% |
| Cuba | 1,308 | 0.1% |
| Czechoslovakia | 207 | 0.0% |
| Denmark | 245 | 0.0% |
| Dominica | 134 | 0.0% |
| Dominican Republic | 265 | 0.0% |
| Eastern Africa | 2,628 | 0.3% |
| Eastern Asia | 52,640 | 5.1% |
| Eastern Europe | 7,704 | 0.7% |
| Ecuador | 1,762 | 0.2% |
| Egypt | 449 | 0.0% |
| El Salvador | 57,328 | 5.6% |
| England | 1,219 | 0.1% |
| Eritrea | 334 | 0.0% |
| Ethiopia | 1,655 | 0.2% |
| Europe | 15,782 | 1.5% |
| Fiji | 138 | 0.0% |
| France | 849 | 0.1% |
| Germany | 1,088 | 0.1% |
| Ghana | 519 | 0.1% |
| Greece | 226 | 0.0% |
| Grenada | 181 | 0.0% |
| Guatemala | 47,512 | 4.6% |
| Guyana | 113 | 0.0% |
| Haiti | 346 | 0.0% |
| Honduras | 7,782 | 0.7% |
| Hong Kong | 748 | 0.1% |
| Hungary | 225 | 0.0% |
| India | 4,121 | 0.4% |
| Indonesia | 799 | 0.1% |
| Iran | 5,772 | 0.6% |
| Iraq | 199 | 0.0% |
| Ireland | 309 | 0.0% |
| Israel | 1,213 | 0.1% |
| Italy | 644 | 0.1% |
| Jamaica | 1,694 | 0.2% |
| Japan | 4,083 | 0.4% |
| Jordan | 346 | 0.0% |
| Kazakhstan | 287 | 0.0% |
| Kenya | 405 | 0.0% |
| Korea | 36,980 | 3.6% |
| Kuwait | 61 | 0.0% |
| Laos | 173 | 0.0% |
| Latin America | 254,878 | 24.7% |
| Latvia | 104 | 0.0% |
| Lebanon | 1,012 | 0.1% |
| Liberia | 18 | 0.0% |
| Malaysia | 277 | 0.0% |
| Mexico | 121,331 | 11.8% |
| Middle Africa | 259 | 0.0% |
| Moldova | 390 | 0.0% |
| Morocco | 272 | 0.0% |
| Nepal | 248 | 0.0% |
| Netherlands | 252 | 0.0% |
| Nicaragua | 3,293 | 0.3% |
| Nigeria | 2,203 | 0.2% |
| Northern Africa | 952 | 0.1% |
| Northern Europe | 3,812 | 0.4% |
| Norway | 60 | 0.0% |
| Oceania | 1,968 | 0.2% |
| Pakistan | 300 | 0.0% |
| Panama | 418 | 0.0% |
| Peru | 1,365 | 0.1% |
| Philippines | 19,537 | 1.9% |
| Poland | 294 | 0.0% |
| Portugal | 135 | 0.0% |
| Romania | 477 | 0.1% |
| Russia | 2,491 | 0.2% |
| Saudi Arabia | 96 | 0.0% |
| Scotland | 249 | 0.0% |
| Senegal | 124 | 0.0% |
| Serbia | 170 | 0.0% |
| Sierra Leone | 127 | 0.0% |
| Singapore | 224 | 0.0% |
| South Africa | 374 | 0.0% |
| South America | 8,710 | 0.8% |
| South Central Asia | 12,607 | 1.2% |
| South Eastern Asia | 27,168 | 2.6% |
| Southern Europe | 1,264 | 0.1% |
| Spain | 259 | 0.0% |
| Sri Lanka | 167 | 0.0% |
| St. Vincent and the Grenadines | 20 | 0.0% |
| Sudan | 21 | 0.0% |
| Sweden | 199 | 0.0% |
| Switzerland | 405 | 0.0% |
| Syria | 1,053 | 0.1% |
| Taiwan | 1,410 | 0.1% |
| Thailand | 1,585 | 0.2% |
| Trinidad and Tobago | 322 | 0.0% |
| Turkey | 363 | 0.0% |
| Uganda | 87 | 0.0% |
| Ukraine | 2,092 | 0.2% |
| Uruguay | 81 | 0.0% |
| Uzbekistan | 10 | 0.0% |
| Venezuela | 676 | 0.1% |
| Vietnam | 3,507 | 0.3% |
| West Indies | 43 | 0.0% |
| Western Africa | 3,095 | 0.3% |
| Western Asia | 9,526 | 0.9% |
| Western Europe | 2,879 | 0.3% |
| Zimbabwe | 23 | 0.0% | View All 129 Rows |
Sex and Age in Area Code 213
Sex and Age in Area Code 213
The most populous age groups in Area Code 213 are 30 to 34 Years (49,695 | 9.6%) for men and 25 to 29 Years (47,763 | 9.3%) for women.
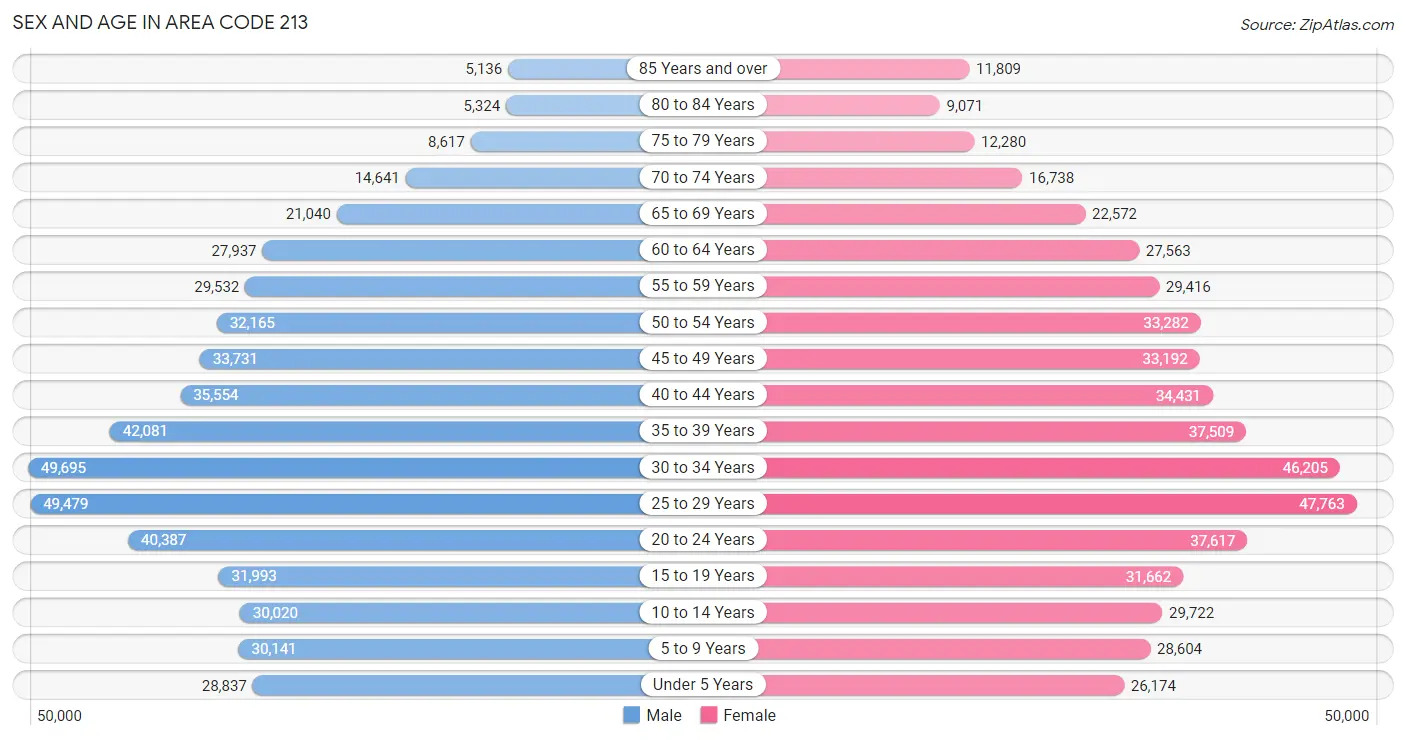
| Age Bracket | Male | Female |
| Under 5 Years | 28,837 (5.6%) | 26,174 (5.1%) |
| 5 to 9 Years | 30,141 (5.8%) | 28,604 (5.6%) |
| 10 to 14 Years | 30,020 (5.8%) | 29,722 (5.8%) |
| 15 to 19 Years | 31,993 (6.2%) | 31,662 (6.1%) |
| 20 to 24 Years | 40,387 (7.8%) | 37,617 (7.3%) |
| 25 to 29 Years | 49,479 (9.6%) | 47,763 (9.3%) |
| 30 to 34 Years | 49,695 (9.6%) | 46,205 (9.0%) |
| 35 to 39 Years | 42,081 (8.2%) | 37,509 (7.3%) |
| 40 to 44 Years | 35,554 (6.9%) | 34,431 (6.7%) |
| 45 to 49 Years | 33,731 (6.5%) | 33,192 (6.4%) |
| 50 to 54 Years | 32,165 (6.2%) | 33,282 (6.5%) |
| 55 to 59 Years | 29,532 (5.7%) | 29,416 (5.7%) |
| 60 to 64 Years | 27,937 (5.4%) | 27,563 (5.3%) |
| 65 to 69 Years | 21,040 (4.1%) | 22,572 (4.4%) |
| 70 to 74 Years | 14,641 (2.8%) | 16,738 (3.3%) |
| 75 to 79 Years | 8,617 (1.7%) | 12,280 (2.4%) |
| 80 to 84 Years | 5,324 (1.0%) | 9,071 (1.8%) |
| 85 Years and over | 5,136 (1.0%) | 11,809 (2.3%) |
| Total | 516,310 (100.0%) | 515,610 (100.0%) |
Families and Households in Area Code 213
Median Family Size in Area Code 213
The median family size in Area Code 213 is 3.28 persons per family, with married-couple families (124,804 | 58.9%) accounting for the largest median family size of 3.406 persons per family. On the other hand, single male/father families (27,987 | 13.2%) represent the smallest median family size with 2.99 persons per family.
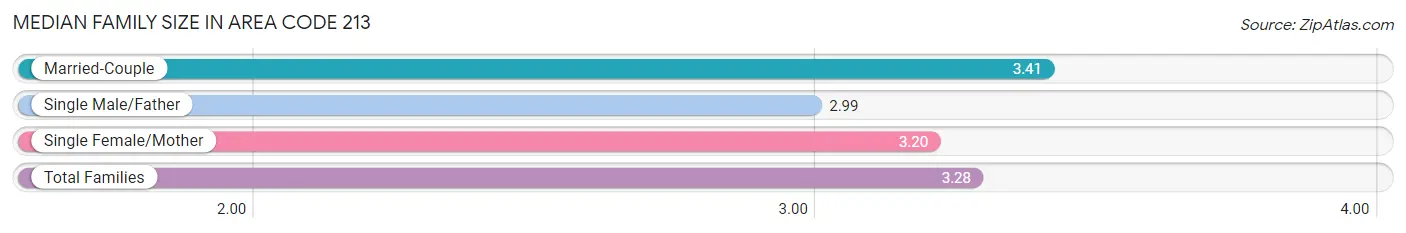
| Family Type | # Families | Family Size |
| Married-Couple | 124,804 (58.9%) | 3.41 |
| Single Male/Father | 27,987 (13.2%) | 2.99 |
| Single Female/Mother | 58,943 (27.8%) | 3.20 |
| Total Families | 211,734 (100.0%) | 3.28 |
Median Household Size in Area Code 213
The median household size in Area Code 213 is 2.53 persons per household, with married-couple households (124,804 | 33.7%) accounting for the largest median household size of 3.45966 persons per household. non-family households (159,053 | 42.9%) represent the smallest median household size with 1.38 persons per household.
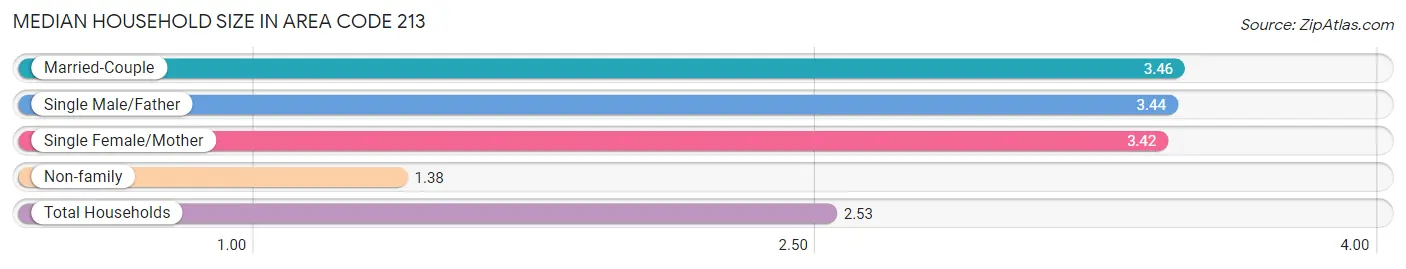
| Household Type | # Households | Household Size |
| Married-Couple | 124,804 (33.7%) | 3.46 |
| Single Male/Father | 27,987 (7.5%) | 3.44 |
| Single Female/Mother | 58,943 (15.9%) | 3.42 |
| Non-family | 159,053 (42.9%) | 1.38 |
| Total Households | 370,787 (100.0%) | 2.53 |
Household Size by Marriage Status in Area Code 213
Out of a total of 370,787 households in Area Code 213, 211,734 (57.1%) are family households, while 159,053 (42.9%) are nonfamily households. The most numerous type of family households are 2-person households, comprising 72,099, and the most common type of nonfamily households are 1-person households, comprising 119,438.
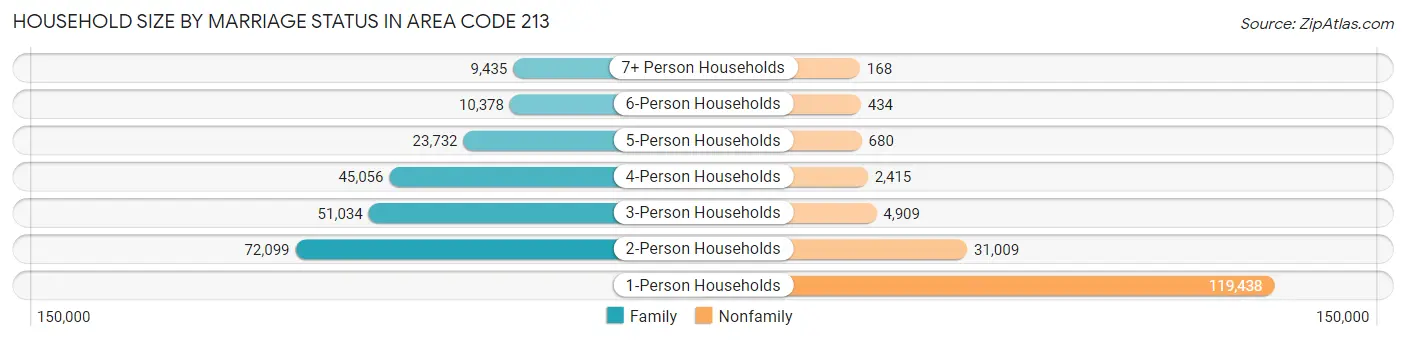
| Household Size | Family Households | Nonfamily Households |
| 1-Person Households | - | 119,438 (32.2%) |
| 2-Person Households | 72,099 (19.4%) | 31,009 (8.4%) |
| 3-Person Households | 51,034 (13.8%) | 4,909 (1.3%) |
| 4-Person Households | 45,056 (12.1%) | 2,415 (0.6%) |
| 5-Person Households | 23,732 (6.4%) | 680 (0.2%) |
| 6-Person Households | 10,378 (2.8%) | 434 (0.1%) |
| 7+ Person Households | 9,435 (2.5%) | 168 (0.1%) |
| Total | 211,734 (57.1%) | 159,053 (42.9%) |
Female Fertility in Area Code 213
Fertility by Age in Area Code 213
Average fertility rate in Area Code 213 is 37.6 births per 1,000 women. Women in the age bracket of 20 to 34 years have the highest fertility rate with 51.3 births per 1,000 women. Women in the age bracket of 20 to 34 years acount for 62.4% of all women with births.
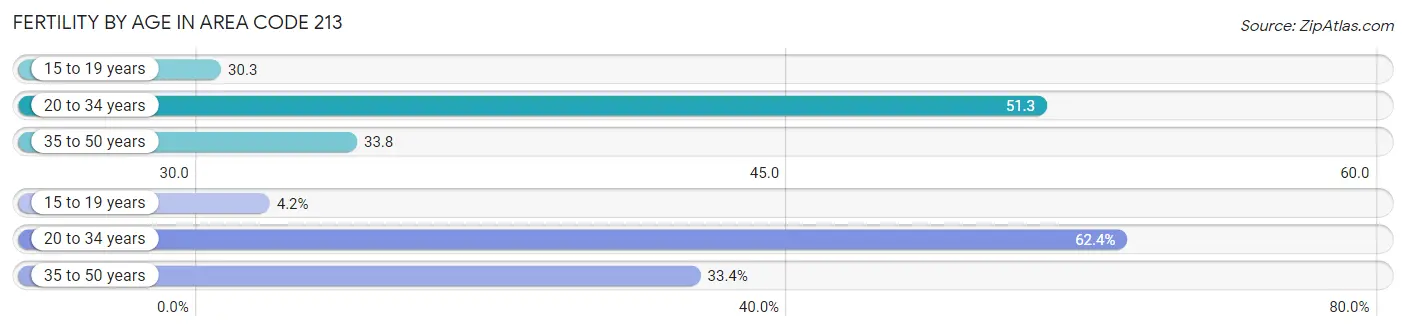
| Age Bracket | Women with Births | Births / 1,000 Women |
| 15 to 19 years | 503 (4.2%) | 30.3 |
| 20 to 34 years | 7,487 (62.4%) | 51.3 |
| 35 to 50 years | 4,012 (33.4%) | 33.8 |
| Total | 12,002 (100.0%) | 37.6 |
Fertility by Age by Marriage Status in Area Code 213
56.1% of women with births (12,002) in Area Code 213 are married. The highest percentage of unmarried women with births falls into 15 to 19 years age bracket with 85.1% of them unmarried at the time of birth, while the lowest percentage of unmarried women with births belong to 35 to 50 years age bracket with 35.0% of them unmarried.
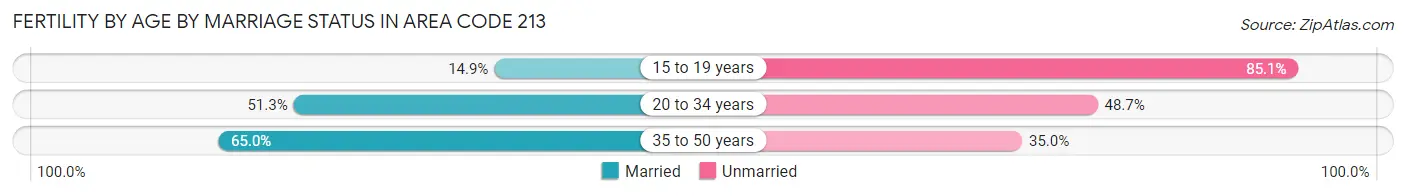
| Age Bracket | Married | Unmarried |
| 15 to 19 years | 75 (14.9%) | 428 (85.1%) |
| 20 to 34 years | 3,839 (51.3%) | 3,648 (48.7%) |
| 35 to 50 years | 2,606 (65.0%) | 1,406 (35.0%) |
| Total | 6,738 (56.1%) | 5,264 (43.9%) |
Fertility by Education in Area Code 213
Average fertility rate in Area Code 213 is 37.6 births per 1,000 women. Women with the education attainment of high school diploma have the highest fertility rate of 49.6 births per 1,000 women, while women with the education attainment of graduate degree have the lowest fertility at 43.0 births per 1,000 women. Women with the education attainment of college or associate's degree represent 27.2% of all women with births.
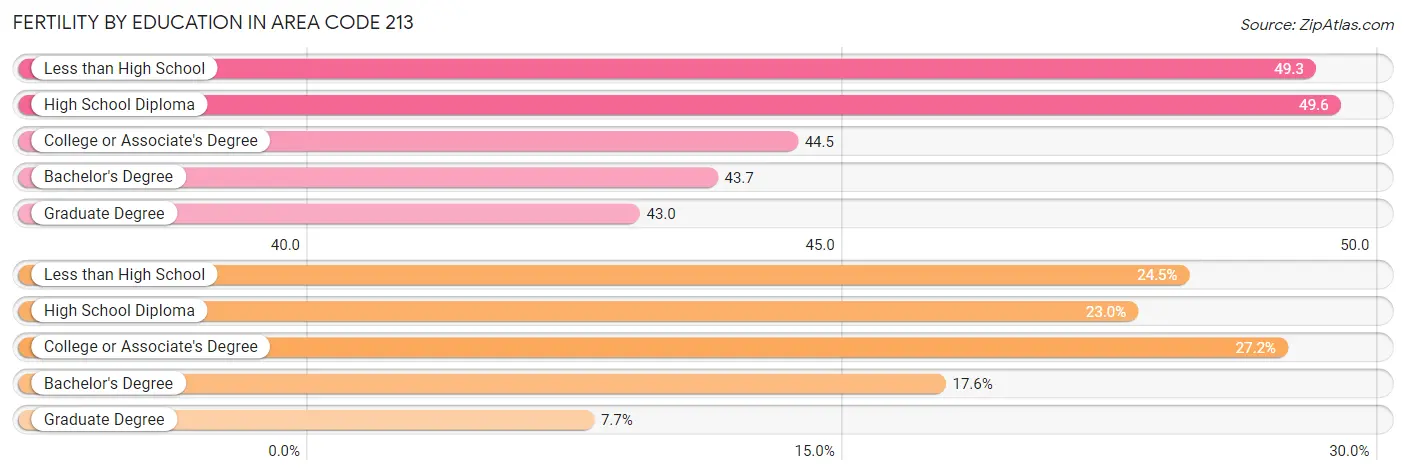
| Educational Attainment | Women with Births | Births / 1,000 Women |
| Less than High School | 2,934 (24.4%) | 49.3 |
| High School Diploma | 2,762 (23.0%) | 49.6 |
| College or Associate's Degree | 3,267 (27.2%) | 44.5 |
| Bachelor's Degree | 2,112 (17.6%) | 43.7 |
| Graduate Degree | 927 (7.7%) | 43.0 |
| Total | 12,002 (100.0%) | 37.6 |
Fertility by Education by Marriage Status in Area Code 213
43.9% of women with births in Area Code 213 are unmarried. Women with the educational attainment of bachelor's degree are most likely to be married with 56.9% of them married at childbirth, while women with the educational attainment of college or associate's degree are least likely to be married with 58.8% of them unmarried at childbirth.
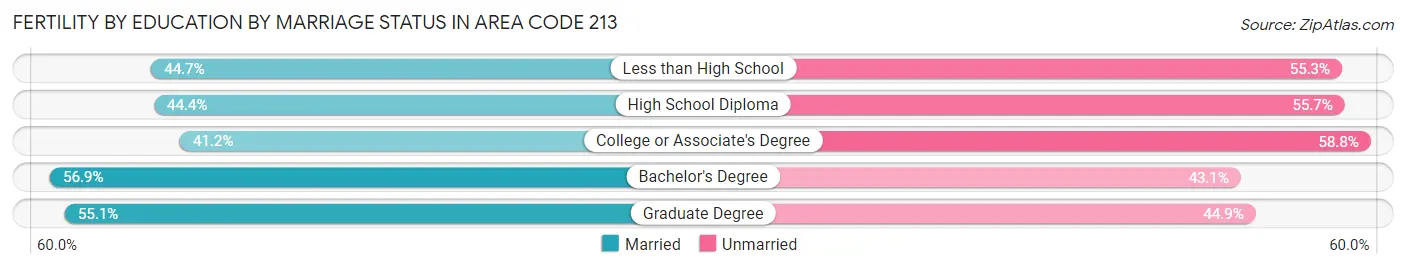
| Educational Attainment | Married | Unmarried |
| Less than High School | 1,311 (44.7%) | 1,623 (55.3%) |
| High School Diploma | 1,225 (44.4%) | 1,537 (55.6%) |
| College or Associate's Degree | 1,346 (41.2%) | 1,921 (58.8%) |
| Bachelor's Degree | 1,202 (56.9%) | 910 (43.1%) |
| Graduate Degree | 511 (55.1%) | 416 (44.9%) |
| Total | 6,738 (56.1%) | 5,264 (43.9%) |
Employment Characteristics in Area Code 213
Employment by Class of Employer in Area Code 213
Among the 497,050 employed individuals in Area Code 213, private company employees (334,316 | 67.3%), self-employed (not incorporated) (55,869 | 11.2%), and not-for-profit organizations (35,232 | 7.1%) make up the most common classes of employment.
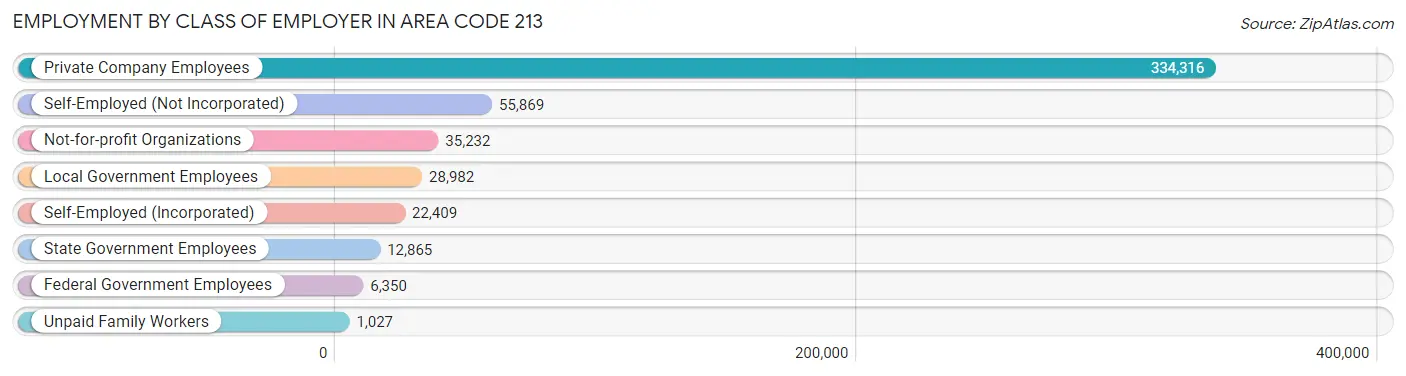
| Employer Class | # Employees | % Employees |
| Private Company Employees | 334,316 | 67.3% |
| Self-Employed (Incorporated) | 22,409 | 4.5% |
| Self-Employed (Not Incorporated) | 55,869 | 11.2% |
| Not-for-profit Organizations | 35,232 | 7.1% |
| Local Government Employees | 28,982 | 5.8% |
| State Government Employees | 12,865 | 2.6% |
| Federal Government Employees | 6,350 | 1.3% |
| Unpaid Family Workers | 1,027 | 0.2% |
| Total | 497,050 | 100.0% |
Employment Status by Age in Area Code 213
According to the labor force statistics for Area Code 213, out of the total population over 16 years of age (845,933), 63.5% or 537,252 individuals are in the labor force, with 9.8% or 52,651 of them unemployed. The age group with the highest labor force participation rate is 30 to 34 years, with 81.5% or 78,178 individuals in the labor force. Within the labor force, the 16 to 19 years age range has the highest percentage of unemployed individuals, with 751.9% or 115,687 of them being unemployed.
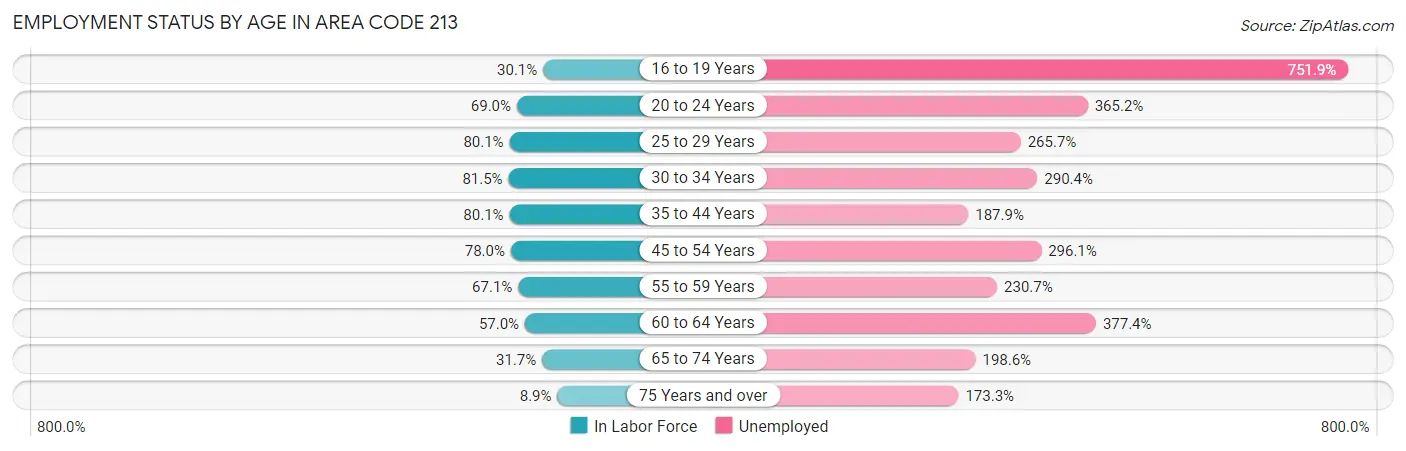
| Age Bracket | In Labor Force | Unemployed |
| 16 to 19 Years | 15,385 (30.1%) | 115,687 (751.9%) |
| 20 to 24 Years | 53,828 (69.0%) | 196,591 (365.2%) |
| 25 to 29 Years | 77,847 (80.0%) | 206,826 (265.7%) |
| 30 to 34 Years | 78,173 (81.5%) | 227,029 (290.4%) |
| 35 to 44 Years | 119,858 (80.1%) | 225,206 (187.9%) |
| 45 to 54 Years | 103,273 (78.0%) | 305,797 (296.1%) |
| 55 to 59 Years | 39,560 (67.1%) | 91,265 (230.7%) |
| 60 to 64 Years | 31,642 (57.0%) | 119,413 (377.4%) |
| 65 to 74 Years | 23,759 (31.7%) | 47,181 (198.6%) |
| 75 Years and over | 4,647 (8.9%) | 8,057 (173.3%) |
| Total | 537,267 (63.5%) | 52,634 (9.8%) |
Employment Status by Educational Attainment in Area Code 213
According to labor force statistics for Area Code 213, 75.9% of individuals (447,693) out of the total population between 25 and 64 years of age (589,535) are in the labor force, with 280.5% or 1,255,779 of them being unemployed. The group with the highest labor force participation rate are those with the educational attainment of bachelor's degree or higher, with 86.2% or 170,304 individuals in the labor force. Within the labor force, individuals with less than high school education have the highest percentage of unemployment, with 334.8% or 296,485 of them being unemployed.
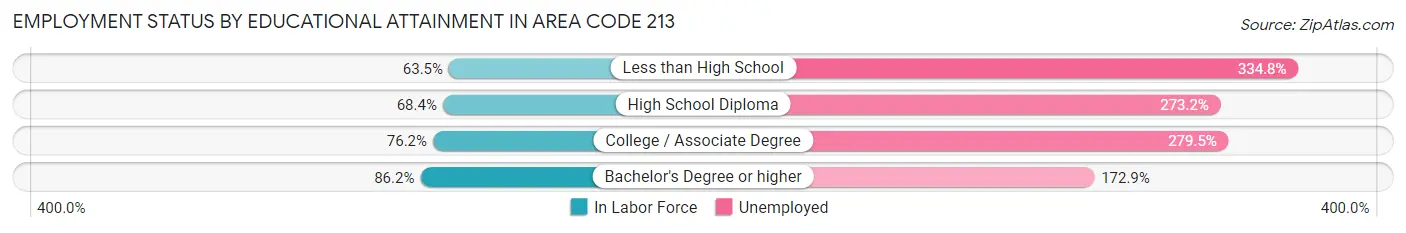
| Educational Attainment | In Labor Force | Unemployed |
| Less than High School | 88,556 (63.5%) | 466,684 (334.8%) |
| High School Diploma | 76,910 (68.4%) | 307,205 (273.2%) |
| College / Associate Degree | 106,842 (76.2%) | 391,848 (279.5%) |
| Bachelor's Degree or higher | 170,313 (86.2%) | 341,478 (172.9%) |
| Total | 447,717 (75.9%) | 1,653,646 (280.5%) |
Employment Occupations by Sex in Area Code 213
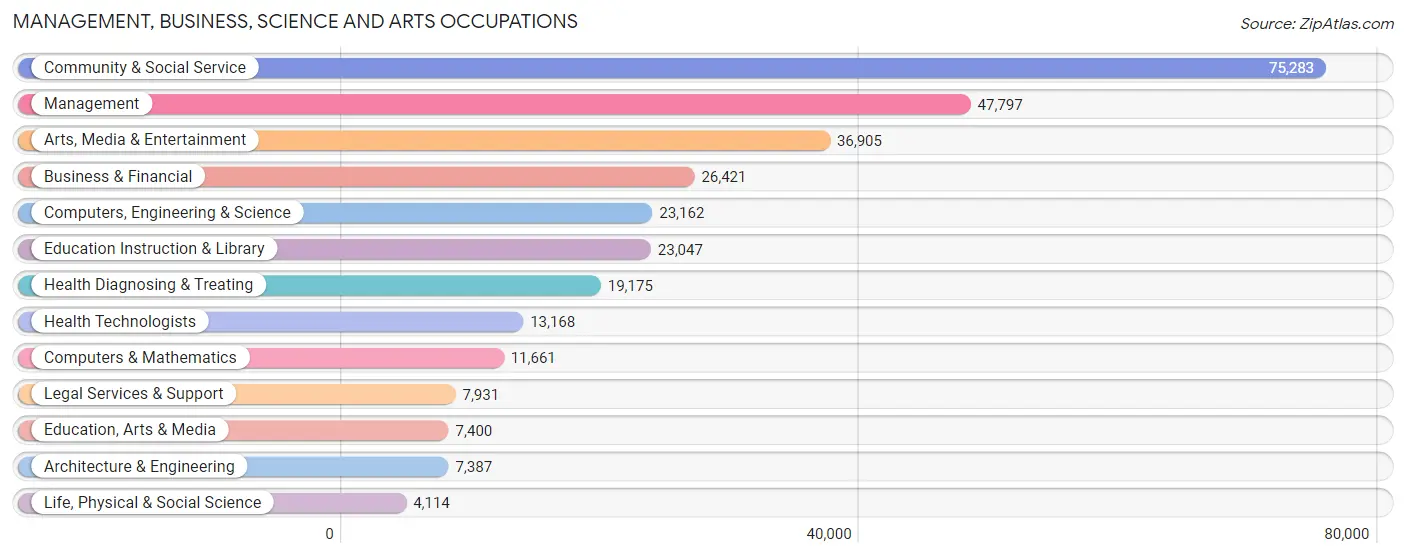
Management, Business, Science and Arts Occupations
The most common Management, Business, Science and Arts occupations in Area Code 213 are Community & Social Service (75,283 | 14.7%), Management (47,797 | 9.3%), Arts, Media & Entertainment (36,905 | 7.2%), Business & Financial (26,421 | 5.2%), and Computers, Engineering & Science (23,162 | 4.5%).
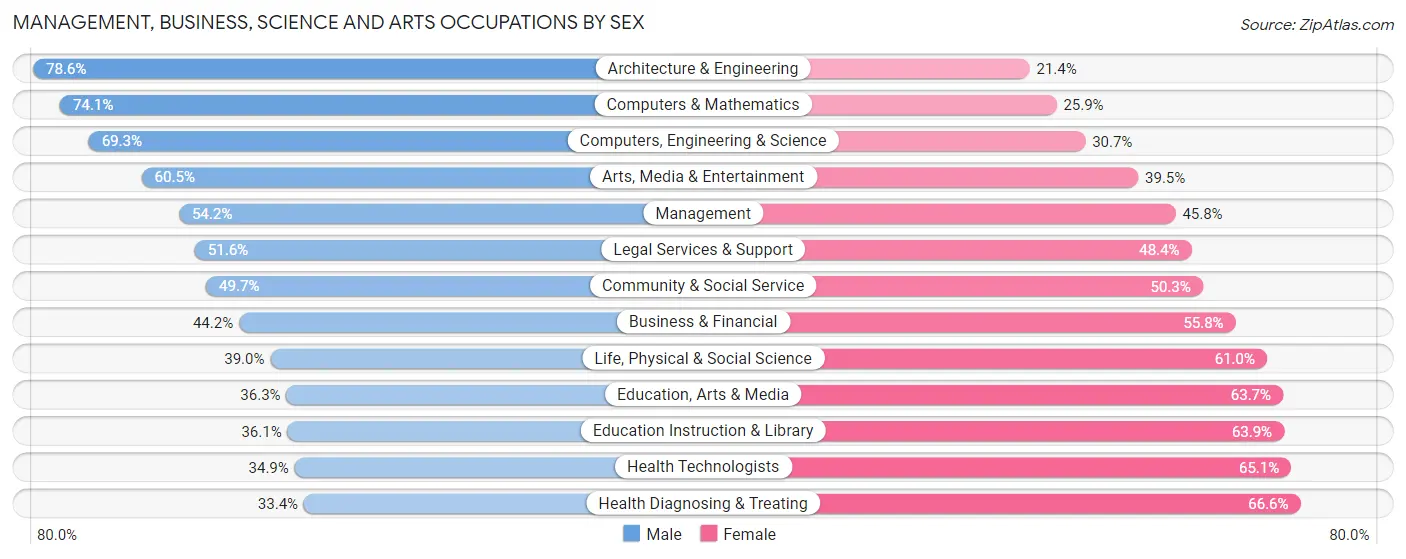
Management, Business, Science and Arts Occupations by Sex
Within the Management, Business, Science and Arts occupations in Area Code 213, the most male-oriented occupations are Architecture & Engineering (78.6%), Computers & Mathematics (74.1%), and Computers, Engineering & Science (69.3%), while the most female-oriented occupations are Health Diagnosing & Treating (66.6%), Health Technologists (65.1%), and Education Instruction & Library (63.9%).
| Occupation | Male | Female |
| Management | 25,918 (54.2%) | 21,879 (45.8%) |
| Business & Financial | 11,684 (44.2%) | 14,737 (55.8%) |
| Computers, Engineering & Science | 16,048 (69.3%) | 7,114 (30.7%) |
| Computers & Mathematics | 8,640 (74.1%) | 3,021 (25.9%) |
| Architecture & Engineering | 5,804 (78.6%) | 1,583 (21.4%) |
| Life, Physical & Social Science | 1,604 (39.0%) | 2,510 (61.0%) |
| Community & Social Service | 37,417 (49.7%) | 37,866 (50.3%) |
| Education, Arts & Media | 2,687 (36.3%) | 4,713 (63.7%) |
| Legal Services & Support | 4,090 (51.6%) | 3,841 (48.4%) |
| Education Instruction & Library | 8,327 (36.1%) | 14,720 (63.9%) |
| Arts, Media & Entertainment | 22,313 (60.5%) | 14,592 (39.5%) |
| Health Diagnosing & Treating | 6,403 (33.4%) | 12,772 (66.6%) |
| Health Technologists | 4,601 (34.9%) | 8,567 (65.1%) |
| Total (Category) | 97,470 (50.8%) | 94,368 (49.2%) |
| Total (Overall) | 278,582 (54.5%) | 232,996 (45.5%) |
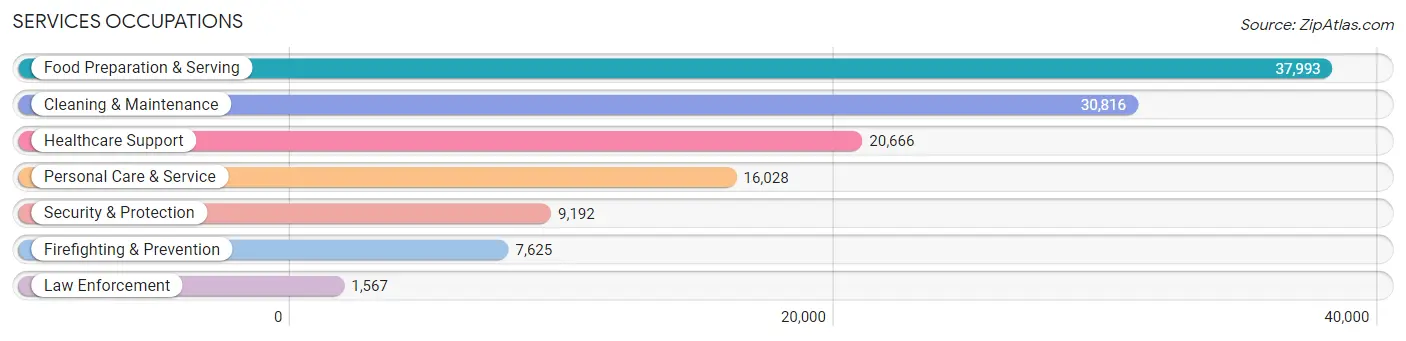
Services Occupations
The most common Services occupations in Area Code 213 are Food Preparation & Serving (37,993 | 7.4%), Cleaning & Maintenance (30,816 | 6.0%), Healthcare Support (20,666 | 4.0%), Personal Care & Service (16,028 | 3.1%), and Security & Protection (9,192 | 1.8%).
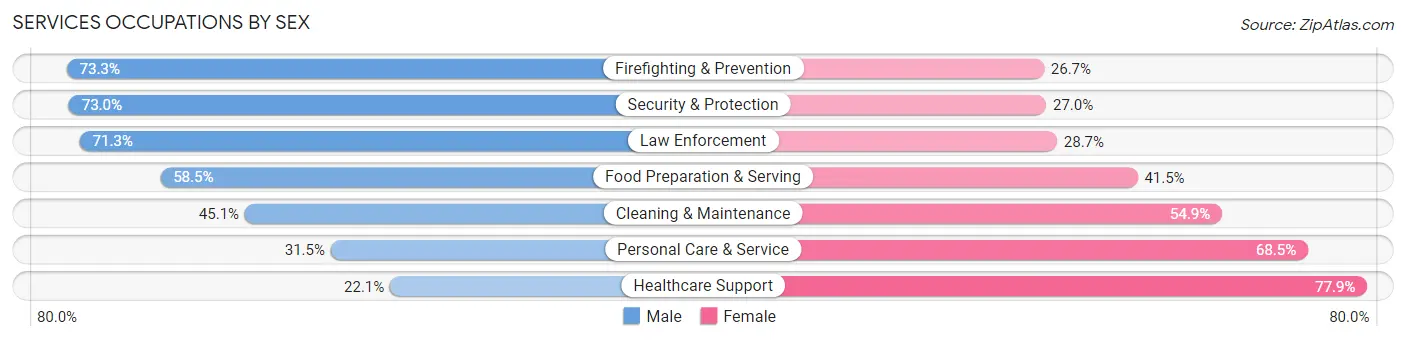
Services Occupations by Sex
Within the Services occupations in Area Code 213, the most male-oriented occupations are Firefighting & Prevention (73.3%), Security & Protection (73.0%), and Law Enforcement (71.3%), while the most female-oriented occupations are Healthcare Support (77.9%), Personal Care & Service (68.5%), and Cleaning & Maintenance (54.9%).
| Occupation | Male | Female |
| Healthcare Support | 4,568 (22.1%) | 16,098 (77.9%) |
| Security & Protection | 6,709 (73.0%) | 2,483 (27.0%) |
| Firefighting & Prevention | 5,592 (73.3%) | 2,033 (26.7%) |
| Law Enforcement | 1,117 (71.3%) | 450 (28.7%) |
| Food Preparation & Serving | 22,231 (58.5%) | 15,762 (41.5%) |
| Cleaning & Maintenance | 13,899 (45.1%) | 16,917 (54.9%) |
| Personal Care & Service | 5,048 (31.5%) | 10,980 (68.5%) |
| Total (Category) | 52,455 (45.7%) | 62,240 (54.3%) |
| Total (Overall) | 278,582 (54.5%) | 232,996 (45.5%) |
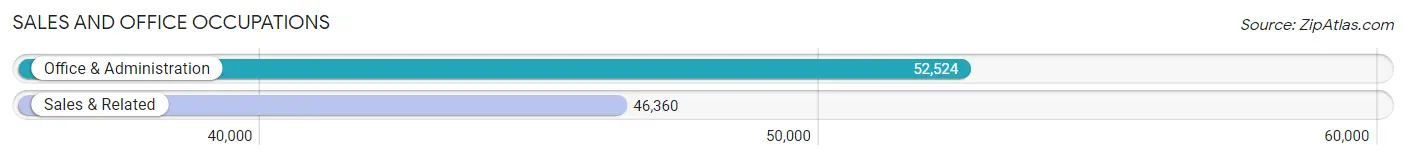
Sales and Office Occupations
The most common Sales and Office occupations in Area Code 213 are Office & Administration (52,524 | 10.3%), and Sales & Related (46,360 | 9.1%).
Sales and Office Occupations by Sex
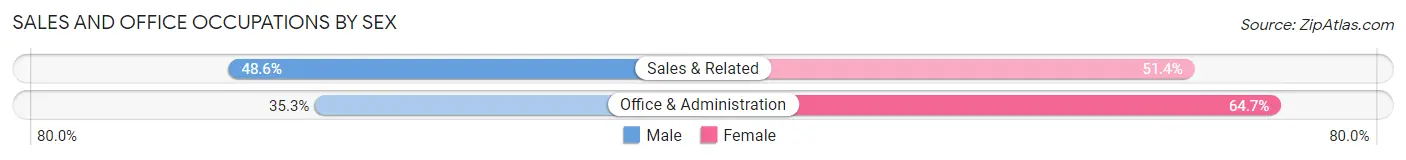
| Occupation | Male | Female |
| Sales & Related | 22,541 (48.6%) | 23,819 (51.4%) |
| Office & Administration | 18,539 (35.3%) | 33,985 (64.7%) |
| Total (Category) | 41,080 (41.5%) | 57,804 (58.5%) |
| Total (Overall) | 278,582 (54.5%) | 232,996 (45.5%) |
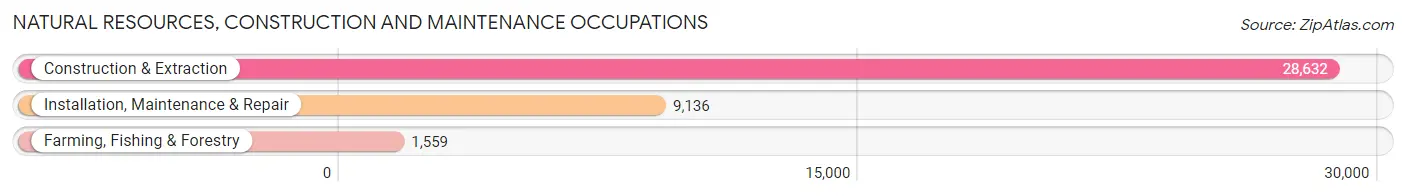
Natural Resources, Construction and Maintenance Occupations
The most common Natural Resources, Construction and Maintenance occupations in Area Code 213 are Construction & Extraction (28,632 | 5.6%), Installation, Maintenance & Repair (9,136 | 1.8%), and Farming, Fishing & Forestry (1,559 | 0.3%).
Natural Resources, Construction and Maintenance Occupations by Sex
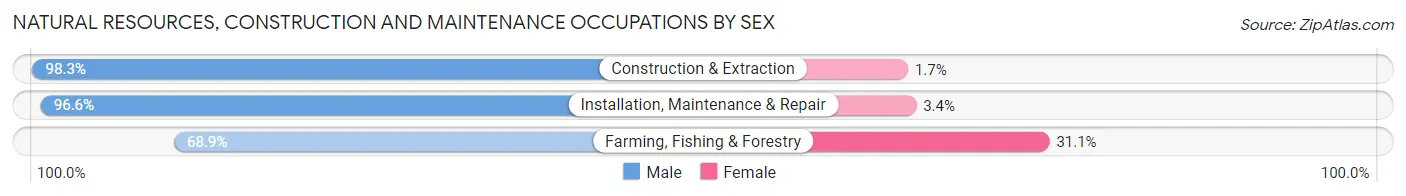
| Occupation | Male | Female |
| Farming, Fishing & Forestry | 1,074 (68.9%) | 485 (31.1%) |
| Construction & Extraction | 28,152 (98.3%) | 480 (1.7%) |
| Installation, Maintenance & Repair | 8,826 (96.6%) | 310 (3.4%) |
| Total (Category) | 38,052 (96.8%) | 1,275 (3.2%) |
| Total (Overall) | 278,582 (54.5%) | 232,996 (45.5%) |
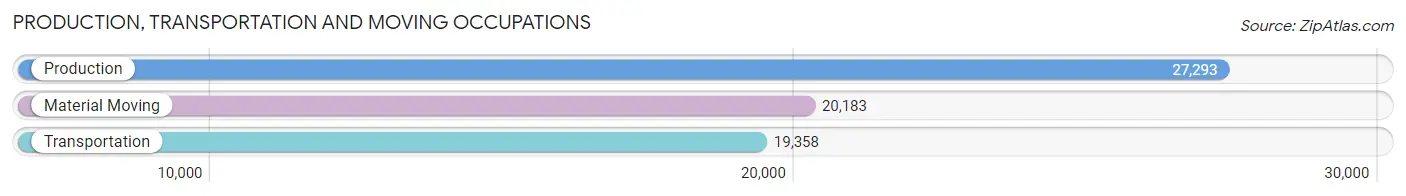
Production, Transportation and Moving Occupations
The most common Production, Transportation and Moving occupations in Area Code 213 are Production (27,293 | 5.3%), Material Moving (20,183 | 4.0%), and Transportation (19,358 | 3.8%).
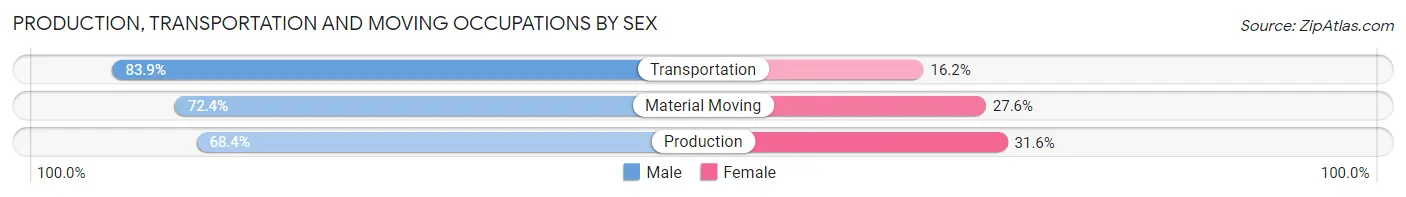
Production, Transportation and Moving Occupations by Sex
| Occupation | Male | Female |
| Production | 18,677 (68.4%) | 8,616 (31.6%) |
| Transportation | 16,232 (83.9%) | 3,126 (16.2%) |
| Material Moving | 14,616 (72.4%) | 5,567 (27.6%) |
| Total (Category) | 49,525 (74.1%) | 17,309 (25.9%) |
| Total (Overall) | 278,582 (54.5%) | 232,996 (45.5%) |
Employment Industries by Sex in Area Code 213
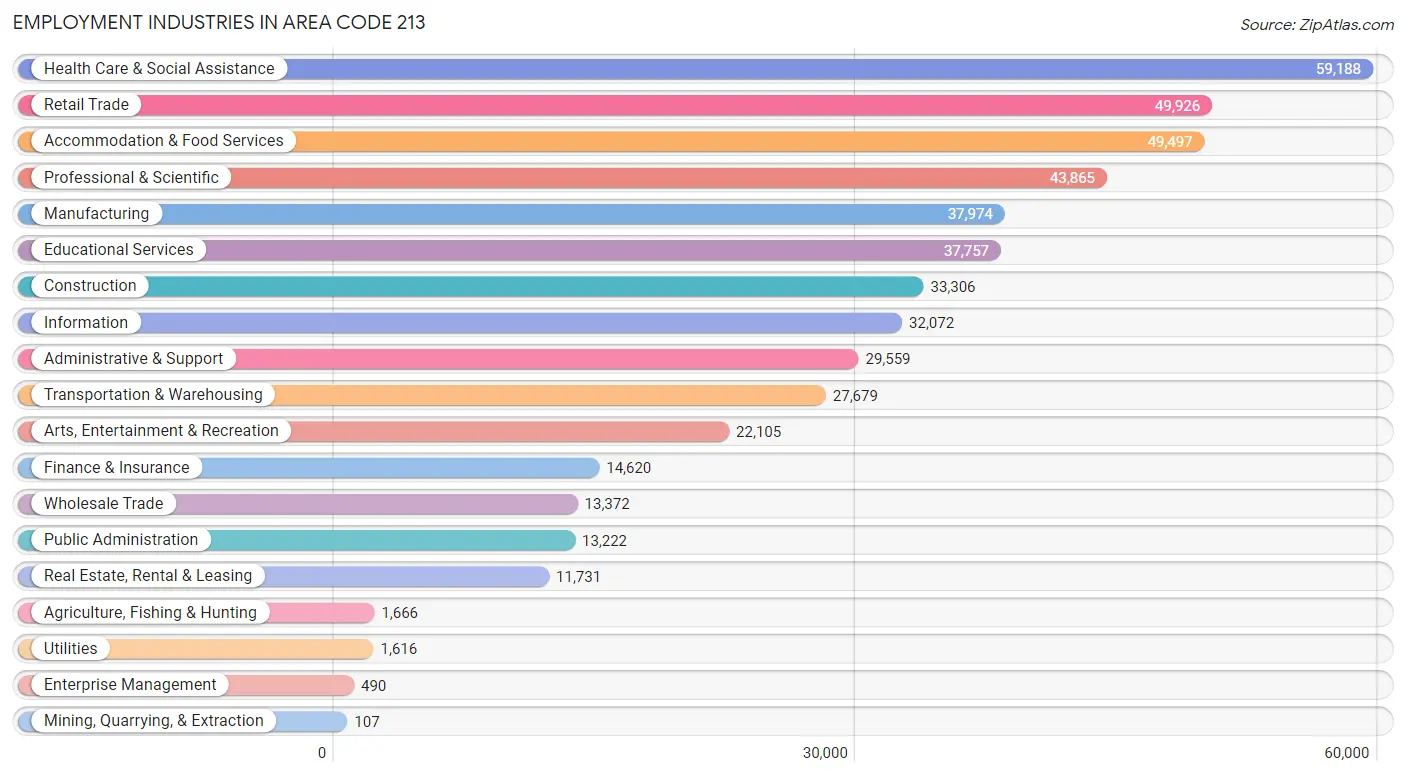
Employment Industries in Area Code 213
The major employment industries in Area Code 213 include Health Care & Social Assistance (59,188 | 11.6%), Retail Trade (49,926 | 9.8%), Accommodation & Food Services (49,497 | 9.7%), Professional & Scientific (43,865 | 8.6%), and Manufacturing (37,974 | 7.4%).
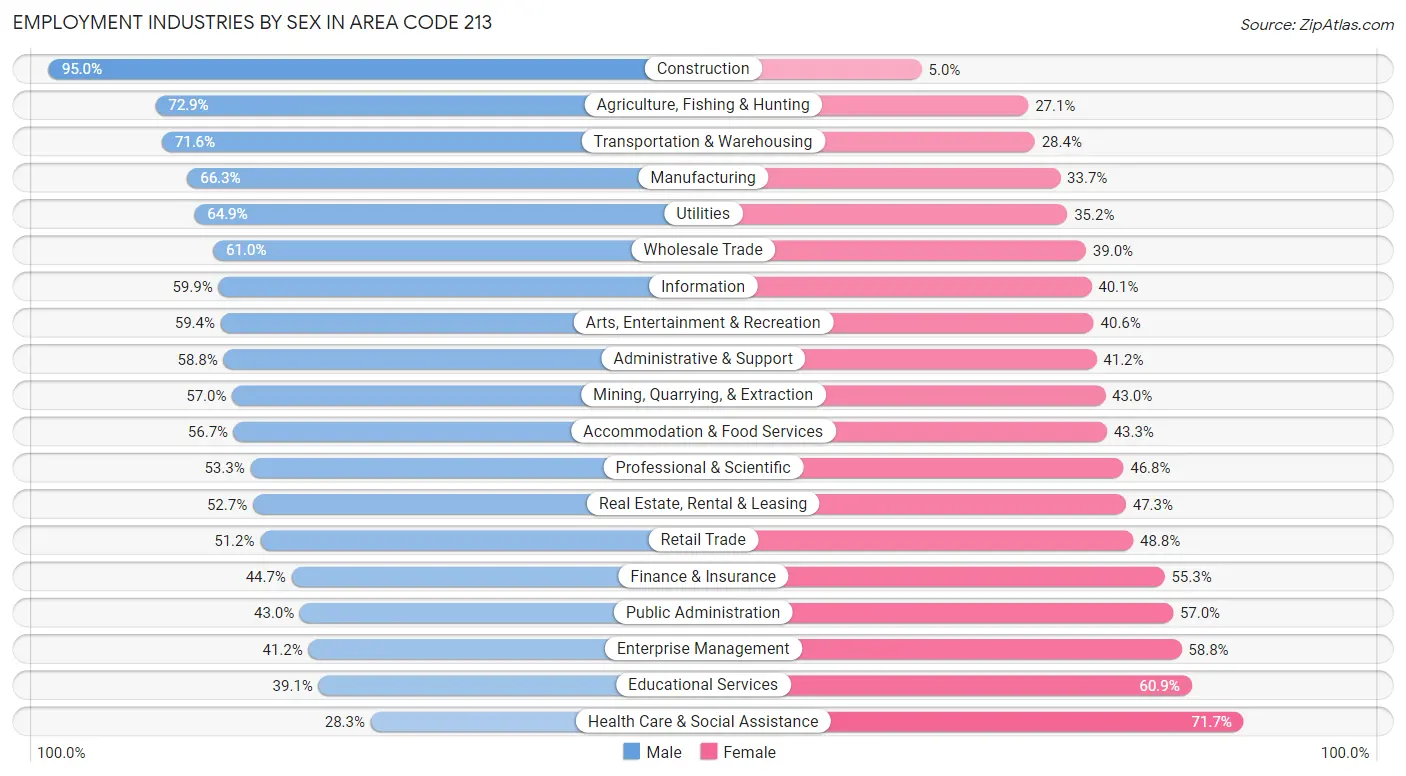
Employment Industries by Sex in Area Code 213
The Area Code 213 industries that see more men than women are Construction (95.0%), Agriculture, Fishing & Hunting (72.9%), and Transportation & Warehousing (71.6%), whereas the industries that tend to have a higher number of women are Health Care & Social Assistance (71.7%), Educational Services (60.9%), and Enterprise Management (58.8%).
| Industry | Male | Female |
| Agriculture, Fishing & Hunting | 1,215 (72.9%) | 451 (27.1%) |
| Mining, Quarrying, & Extraction | 61 (57.0%) | 46 (43.0%) |
| Construction | 31,638 (95.0%) | 1,668 (5.0%) |
| Manufacturing | 25,185 (66.3%) | 12,789 (33.7%) |
| Wholesale Trade | 8,154 (61.0%) | 5,218 (39.0%) |
| Retail Trade | 25,568 (51.2%) | 24,358 (48.8%) |
| Transportation & Warehousing | 19,812 (71.6%) | 7,867 (28.4%) |
| Utilities | 1,048 (64.8%) | 568 (35.1%) |
| Information | 19,200 (59.9%) | 12,872 (40.1%) |
| Finance & Insurance | 6,538 (44.7%) | 8,082 (55.3%) |
| Real Estate, Rental & Leasing | 6,186 (52.7%) | 5,545 (47.3%) |
| Professional & Scientific | 23,357 (53.2%) | 20,508 (46.8%) |
| Enterprise Management | 202 (41.2%) | 288 (58.8%) |
| Administrative & Support | 17,388 (58.8%) | 12,171 (41.2%) |
| Educational Services | 14,775 (39.1%) | 22,982 (60.9%) |
| Health Care & Social Assistance | 16,776 (28.3%) | 42,412 (71.7%) |
| Arts, Entertainment & Recreation | 13,129 (59.4%) | 8,976 (40.6%) |
| Accommodation & Food Services | 28,055 (56.7%) | 21,442 (43.3%) |
| Public Administration | 5,681 (43.0%) | 7,541 (57.0%) |
| Total | 278,582 (54.5%) | 232,996 (45.5%) |
Education in Area Code 213
School Enrollment in Area Code 213
The most common levels of schooling among the 253,508 students in Area Code 213 are college / undergraduate (69,236 | 27.3%), high school (47,965 | 18.9%), and elementary school (46,396 | 18.3%).
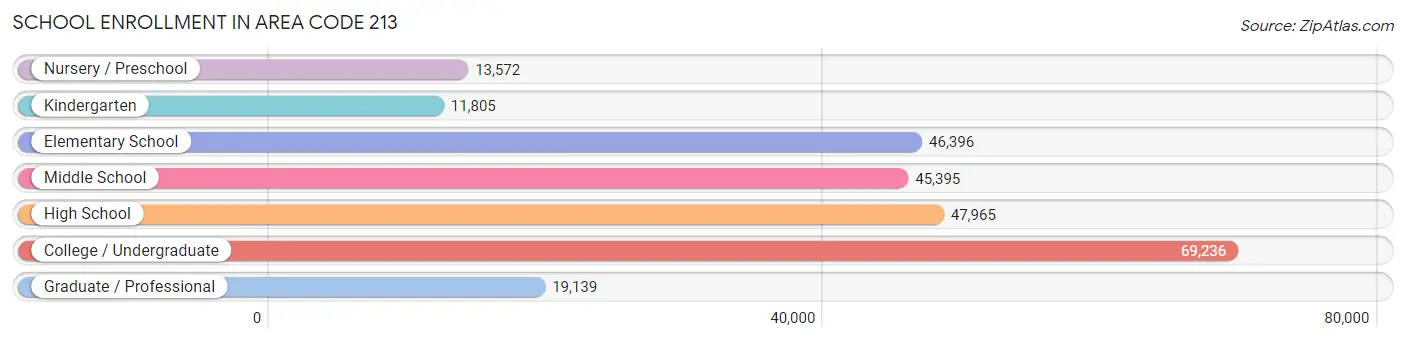
| School Level | # Students | % Students |
| Nursery / Preschool | 13,572 | 5.3% |
| Kindergarten | 11,805 | 4.7% |
| Elementary School | 46,396 | 18.3% |
| Middle School | 45,395 | 17.9% |
| High School | 47,965 | 18.9% |
| College / Undergraduate | 69,236 | 27.3% |
| Graduate / Professional | 19,139 | 7.5% |
| Total | 253,508 | 100.0% |
School Enrollment by Age by Funding Source in Area Code 213
Out of a total of 253,508 students who are enrolled in schools in Area Code 213, 51,727 (20.4%) attend a private institution, while the remaining 201,781 (79.6%) are enrolled in public schools. The age group of 3 to 4 year olds has the highest likelihood of being enrolled in private schools, with 4,942 (43.4% in the age bracket) enrolled. Conversely, the age group of 10 to 14 year olds has the lowest likelihood of being enrolled in a private school, with 52,033 (89.9% in the age bracket) attending a public institution.
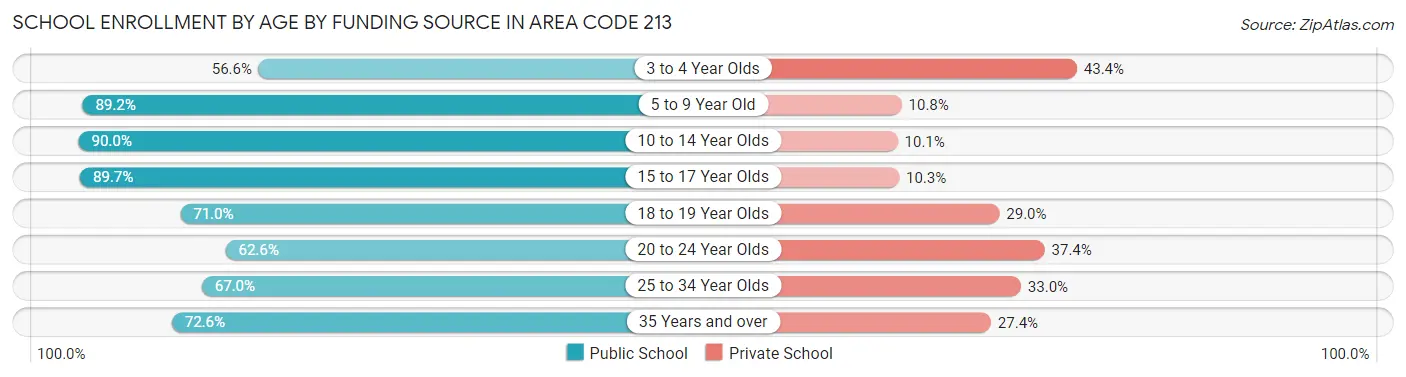
| Age Bracket | Public School | Private School |
| 3 to 4 Year Olds | 6,435 (56.6%) | 4,942 (43.4%) |
| 5 to 9 Year Old | 49,204 (89.2%) | 5,953 (10.8%) |
| 10 to 14 Year Olds | 52,033 (89.9%) | 5,811 (10.1%) |
| 15 to 17 Year Olds | 29,635 (89.7%) | 3,409 (10.3%) |
| 18 to 19 Year Olds | 16,258 (71.0%) | 6,640 (29.0%) |
| 20 to 24 Year Olds | 21,924 (62.6%) | 13,114 (37.4%) |
| 25 to 34 Year Olds | 16,690 (67.0%) | 8,225 (33.0%) |
| 35 Years and over | 9,605 (72.6%) | 3,630 (27.4%) |
| Total | 201,781 (79.6%) | 51,727 (20.4%) |
Educational Attainment by Field of Study in Area Code 213
Business (40,273 | 16.2%), visual & performing arts (34,014 | 13.7%), social sciences (29,209 | 11.7%), communications (21,916 | 8.8%), and science & technology (17,132 | 6.9%) are the most common fields of study among 248,629 individuals in Area Code 213 who have obtained a bachelor's degree or higher.
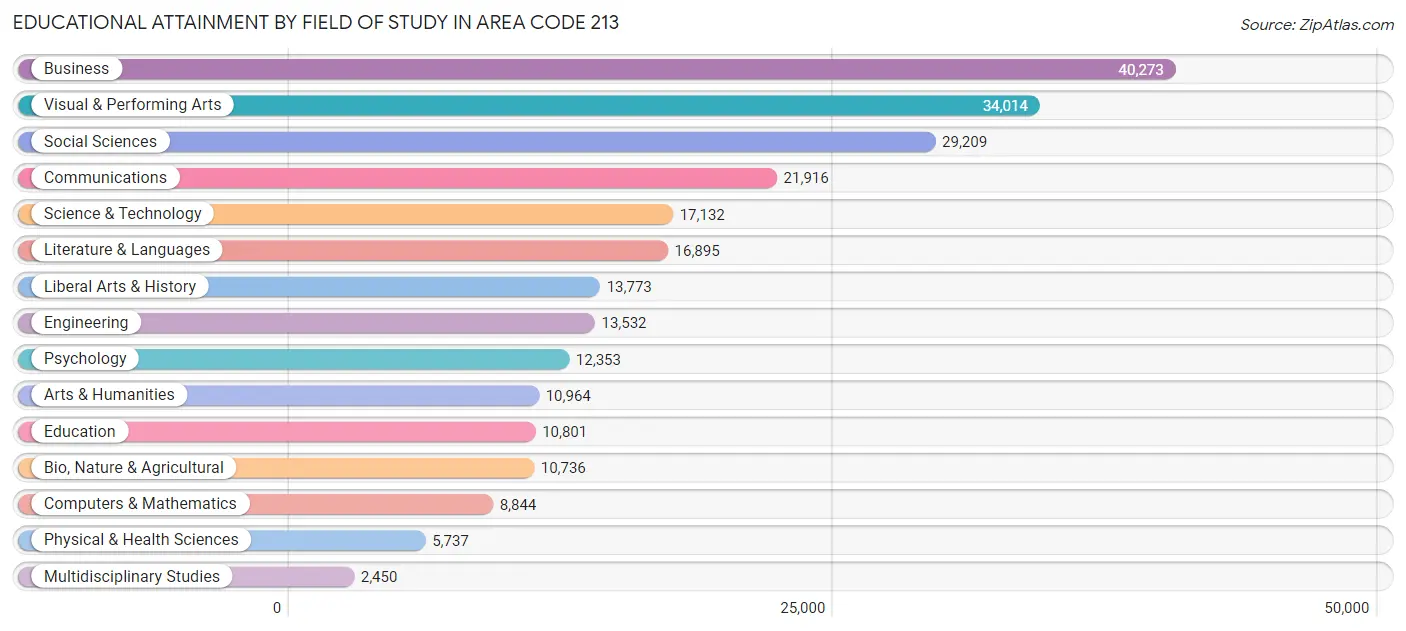
| Field of Study | # Graduates | % Graduates |
| Computers & Mathematics | 8,844 | 3.6% |
| Bio, Nature & Agricultural | 10,736 | 4.3% |
| Physical & Health Sciences | 5,737 | 2.3% |
| Psychology | 12,353 | 5.0% |
| Social Sciences | 29,209 | 11.7% |
| Engineering | 13,532 | 5.4% |
| Multidisciplinary Studies | 2,450 | 1.0% |
| Science & Technology | 17,132 | 6.9% |
| Business | 40,273 | 16.2% |
| Education | 10,801 | 4.3% |
| Literature & Languages | 16,895 | 6.8% |
| Liberal Arts & History | 13,773 | 5.5% |
| Visual & Performing Arts | 34,014 | 13.7% |
| Communications | 21,916 | 8.8% |
| Arts & Humanities | 10,964 | 4.4% |
| Total | 248,629 | 100.0% |
Transportation & Commute in Area Code 213
Vehicle Availability by Sex in Area Code 213
The most prevalent vehicle ownership categories in Area Code 213 are males with 2 vehicles (92,674, accounting for 34.4%) and females with 2 vehicles (78,899, making up 41.8%).
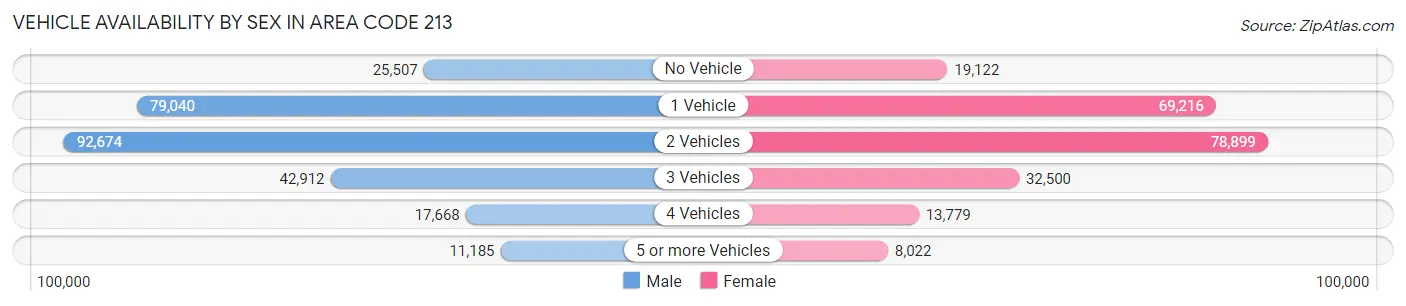
| Vehicles Available | Male | Female |
| No Vehicle | 25,507 (9.5%) | 19,122 (8.6%) |
| 1 Vehicle | 79,040 (29.4%) | 69,216 (31.2%) |
| 2 Vehicles | 92,674 (34.4%) | 78,899 (35.6%) |
| 3 Vehicles | 42,912 (16.0%) | 32,500 (14.7%) |
| 4 Vehicles | 17,668 (6.6%) | 13,779 (6.2%) |
| 5 or more Vehicles | 11,185 (4.2%) | 8,022 (3.6%) |
| Total | 268,986 (100.0%) | 221,538 (100.0%) |
Commute Time in Area Code 213
The most frequently occuring commute durations in Area Code 213 are 30 to 34 minutes (93,277 commuters, 21.7%), 20 to 24 minutes (56,222 commuters, 13.1%), and 15 to 19 minutes (50,547 commuters, 11.7%).
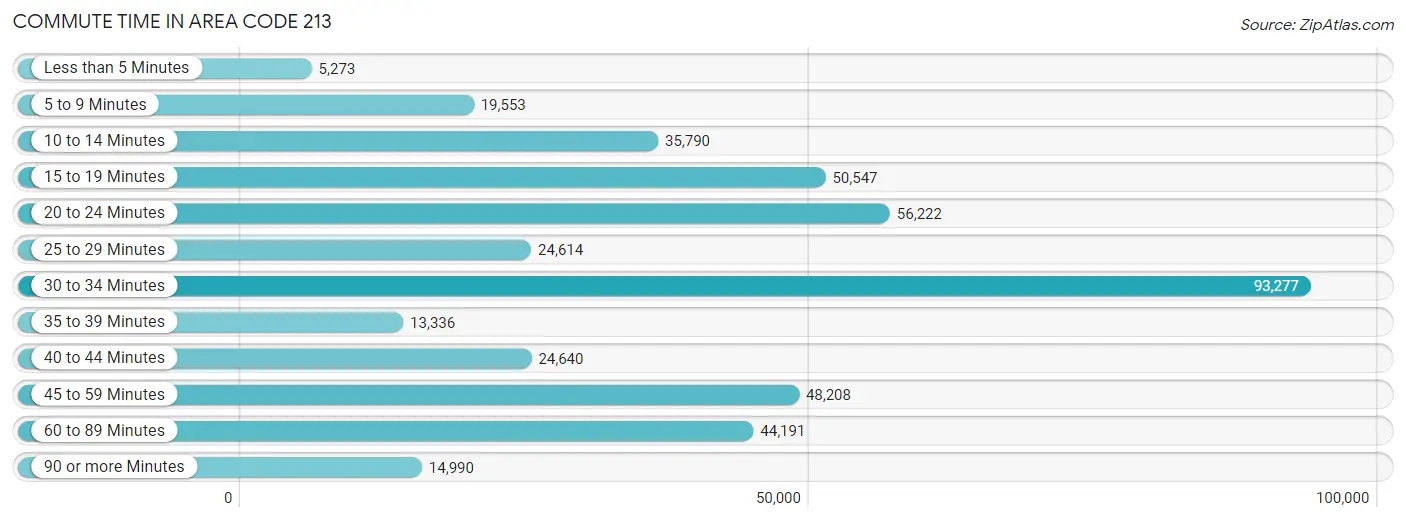
| Commute Time | # Commuters | % Commuters |
| Less than 5 Minutes | 5,273 | 1.2% |
| 5 to 9 Minutes | 19,553 | 4.5% |
| 10 to 14 Minutes | 35,790 | 8.3% |
| 15 to 19 Minutes | 50,547 | 11.7% |
| 20 to 24 Minutes | 56,222 | 13.1% |
| 25 to 29 Minutes | 24,614 | 5.7% |
| 30 to 34 Minutes | 93,277 | 21.7% |
| 35 to 39 Minutes | 13,336 | 3.1% |
| 40 to 44 Minutes | 24,640 | 5.7% |
| 45 to 59 Minutes | 48,208 | 11.2% |
| 60 to 89 Minutes | 44,191 | 10.3% |
| 90 or more Minutes | 14,990 | 3.5% |
Commute Time by Sex in Area Code 213
The most common commute times in Area Code 213 are 30 to 34 minutes (55,372 commuters, 23.1%) for males and 30 to 34 minutes (37,905 commuters, 19.8%) for females.
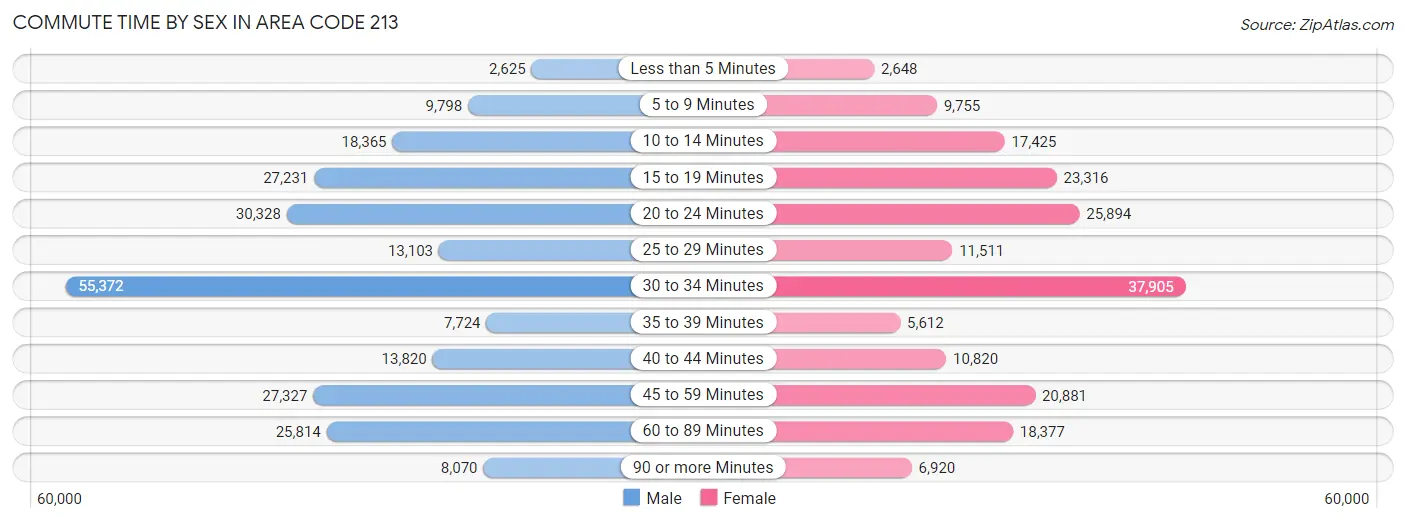
| Commute Time | Male | Female |
| Less than 5 Minutes | 2,625 (1.1%) | 2,648 (1.4%) |
| 5 to 9 Minutes | 9,798 (4.1%) | 9,755 (5.1%) |
| 10 to 14 Minutes | 18,365 (7.7%) | 17,425 (9.1%) |
| 15 to 19 Minutes | 27,231 (11.4%) | 23,316 (12.2%) |
| 20 to 24 Minutes | 30,328 (12.7%) | 25,894 (13.6%) |
| 25 to 29 Minutes | 13,103 (5.5%) | 11,511 (6.0%) |
| 30 to 34 Minutes | 55,372 (23.1%) | 37,905 (19.8%) |
| 35 to 39 Minutes | 7,724 (3.2%) | 5,612 (2.9%) |
| 40 to 44 Minutes | 13,820 (5.8%) | 10,820 (5.7%) |
| 45 to 59 Minutes | 27,327 (11.4%) | 20,881 (10.9%) |
| 60 to 89 Minutes | 25,814 (10.8%) | 18,377 (9.6%) |
| 90 or more Minutes | 8,070 (3.4%) | 6,920 (3.6%) |
Time of Departure to Work by Sex in Area Code 213
The most frequent times of departure to work in Area Code 213 are 7:00 AM to 7:29 AM (33,355, 13.9%) for males and 7:00 AM to 7:29 AM (28,951, 15.1%) for females.
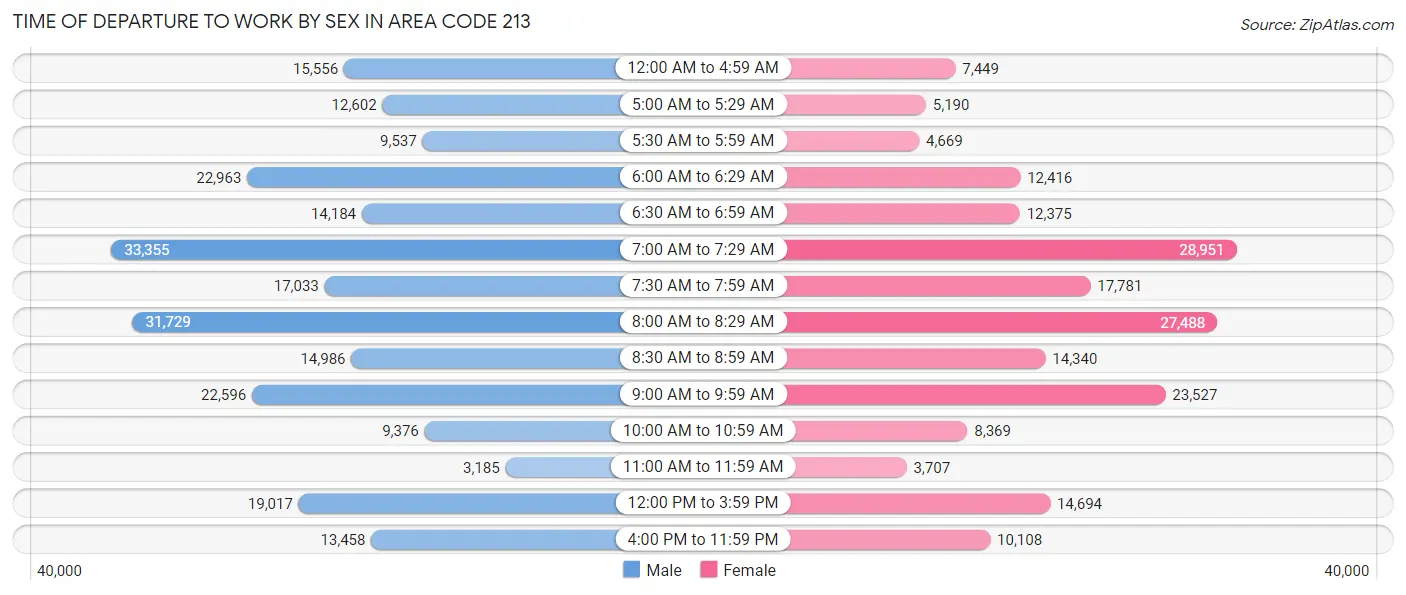
| Time of Departure | Male | Female |
| 12:00 AM to 4:59 AM | 15,556 (6.5%) | 7,449 (3.9%) |
| 5:00 AM to 5:29 AM | 12,602 (5.3%) | 5,190 (2.7%) |
| 5:30 AM to 5:59 AM | 9,537 (4.0%) | 4,669 (2.4%) |
| 6:00 AM to 6:29 AM | 22,963 (9.6%) | 12,416 (6.5%) |
| 6:30 AM to 6:59 AM | 14,184 (5.9%) | 12,375 (6.5%) |
| 7:00 AM to 7:29 AM | 33,355 (13.9%) | 28,951 (15.1%) |
| 7:30 AM to 7:59 AM | 17,033 (7.1%) | 17,781 (9.3%) |
| 8:00 AM to 8:29 AM | 31,729 (13.2%) | 27,488 (14.4%) |
| 8:30 AM to 8:59 AM | 14,986 (6.3%) | 14,340 (7.5%) |
| 9:00 AM to 9:59 AM | 22,596 (9.4%) | 23,527 (12.3%) |
| 10:00 AM to 10:59 AM | 9,376 (3.9%) | 8,369 (4.4%) |
| 11:00 AM to 11:59 AM | 3,185 (1.3%) | 3,707 (1.9%) |
| 12:00 PM to 3:59 PM | 19,017 (7.9%) | 14,694 (7.7%) |
| 4:00 PM to 11:59 PM | 13,458 (5.6%) | 10,108 (5.3%) |
| Total | 239,577 (100.0%) | 191,064 (100.0%) |
Housing Occupancy in Area Code 213
Occupancy by Ownership in Area Code 213
Of the total 370,787 dwellings in Area Code 213, owner-occupied units account for 108,526 (29.3%), while renter-occupied units make up 262,261 (70.7%).
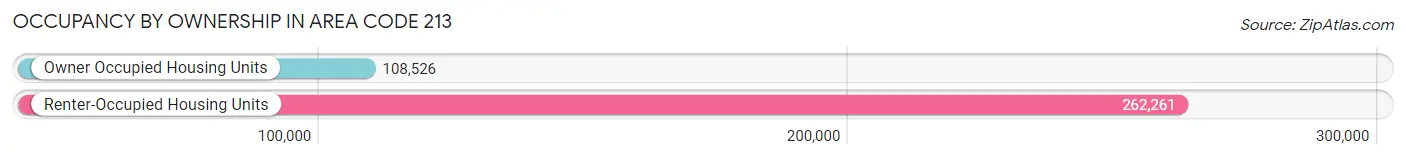
| Occupancy | # Housing Units | % Housing Units |
| Owner Occupied Housing Units | 108,526 | 29.3% |
| Renter-Occupied Housing Units | 262,261 | 70.7% |
| Total Occupied Housing Units | 370,787 | 100.0% |
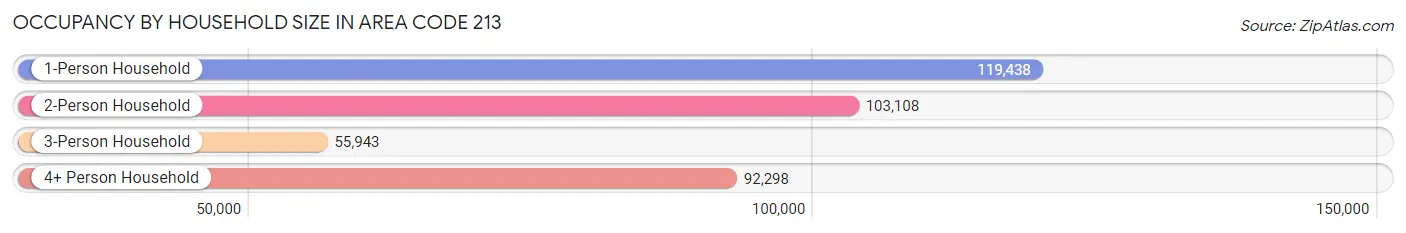
Occupancy by Household Size in Area Code 213
| Household Size | # Housing Units | % Housing Units |
| 1-Person Household | 119,438 | 32.2% |
| 2-Person Household | 103,108 | 27.8% |
| 3-Person Household | 55,943 | 15.1% |
| 4+ Person Household | 92,298 | 24.9% |
| Total Housing Units | 370,787 | 100.0% |
Occupancy by Ownership by Household Size in Area Code 213
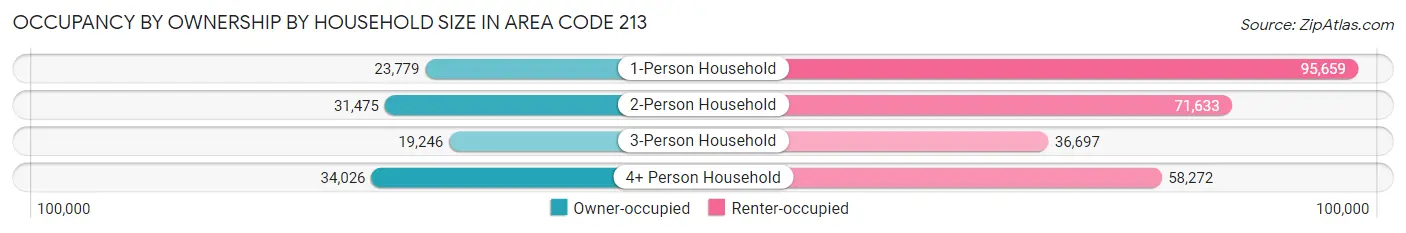
| Household Size | Owner-occupied | Renter-occupied |
| 1-Person Household | 23,779 (19.9%) | 95,659 (80.1%) |
| 2-Person Household | 31,475 (30.5%) | 71,633 (69.5%) |
| 3-Person Household | 19,246 (34.4%) | 36,697 (65.6%) |
| 4+ Person Household | 34,026 (36.9%) | 58,272 (63.1%) |
| Total Housing Units | 108,526 (29.3%) | 262,261 (70.7%) |
Occupancy by Educational Attainment in Area Code 213
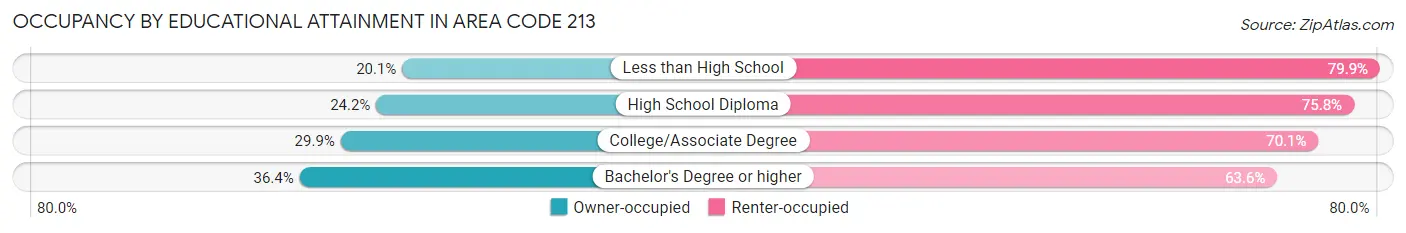
| Household Size | Owner-occupied | Renter-occupied |
| Less than High School | 15,801 (20.1%) | 62,779 (79.9%) |
| High School Diploma | 15,026 (24.2%) | 46,984 (75.8%) |
| College/Associate Degree | 27,791 (29.9%) | 65,245 (70.1%) |
| Bachelor's Degree or higher | 49,908 (36.4%) | 87,253 (63.6%) |
Occupancy by Age of Householder in Area Code 213
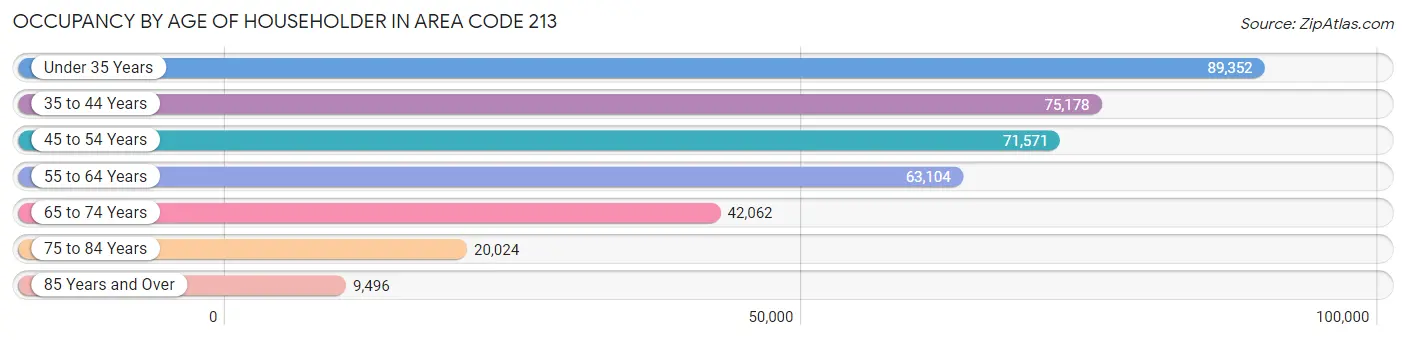
| Age Bracket | # Households | % Households |
| Under 35 Years | 89,352 | 24.1% |
| 35 to 44 Years | 75,178 | 20.3% |
| 45 to 54 Years | 71,571 | 19.3% |
| 55 to 64 Years | 63,104 | 17.0% |
| 65 to 74 Years | 42,062 | 11.3% |
| 75 to 84 Years | 20,024 | 5.4% |
| 85 Years and Over | 9,496 | 2.6% |
| Total | 370,787 | 100.0% |
Housing Finances in Area Code 213
Median Income by Occupancy in Area Code 213
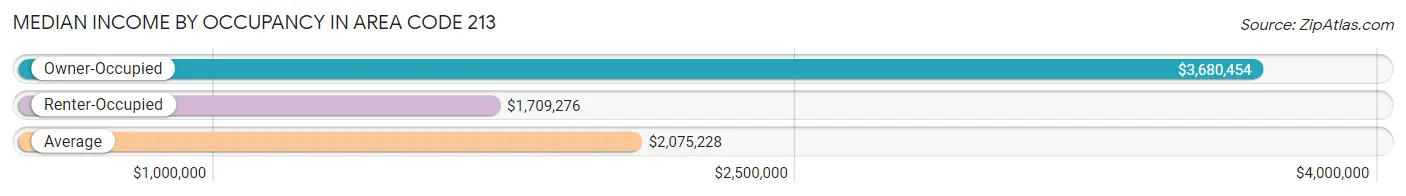
| Occupancy Type | # Households | Median Income |
| Owner-Occupied | 108,526 (29.3%) | $3,680,454 |
| Renter-Occupied | 262,261 (70.7%) | $1,709,276 |
| Average | 370,787 (100.0%) | $2,075,228 |
Occupancy by Householder Income Bracket in Area Code 213
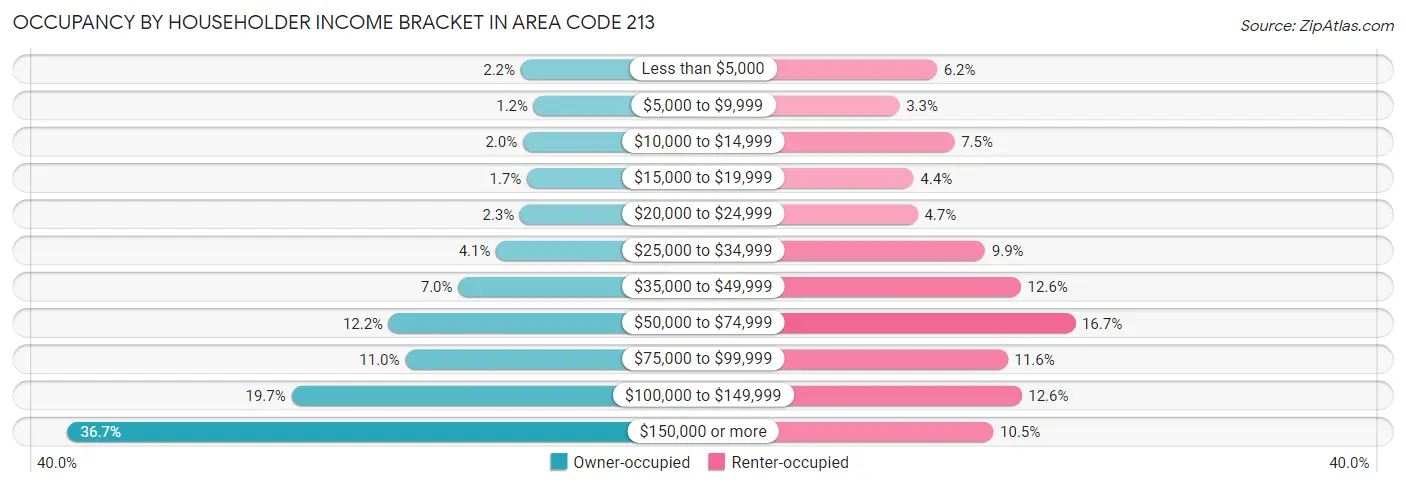
| Income Bracket | Owner-occupied | Renter-occupied |
| Less than $5,000 | 2,379 (2.2%) | 16,222 (6.2%) |
| $5,000 to $9,999 | 1,307 (1.2%) | 8,735 (3.3%) |
| $10,000 to $14,999 | 2,196 (2.0%) | 19,711 (7.5%) |
| $15,000 to $19,999 | 1,863 (1.7%) | 11,553 (4.4%) |
| $20,000 to $24,999 | 2,439 (2.2%) | 12,366 (4.7%) |
| $25,000 to $34,999 | 4,405 (4.1%) | 25,844 (9.9%) |
| $35,000 to $49,999 | 7,539 (7.0%) | 33,000 (12.6%) |
| $50,000 to $74,999 | 13,288 (12.2%) | 43,858 (16.7%) |
| $75,000 to $99,999 | 11,926 (11.0%) | 30,369 (11.6%) |
| $100,000 to $149,999 | 21,337 (19.7%) | 33,118 (12.6%) |
| $150,000 or more | 39,847 (36.7%) | 27,485 (10.5%) |
| Total | 108,526 (100.0%) | 262,261 (100.0%) |
Monthly Housing Cost Tiers in Area Code 213
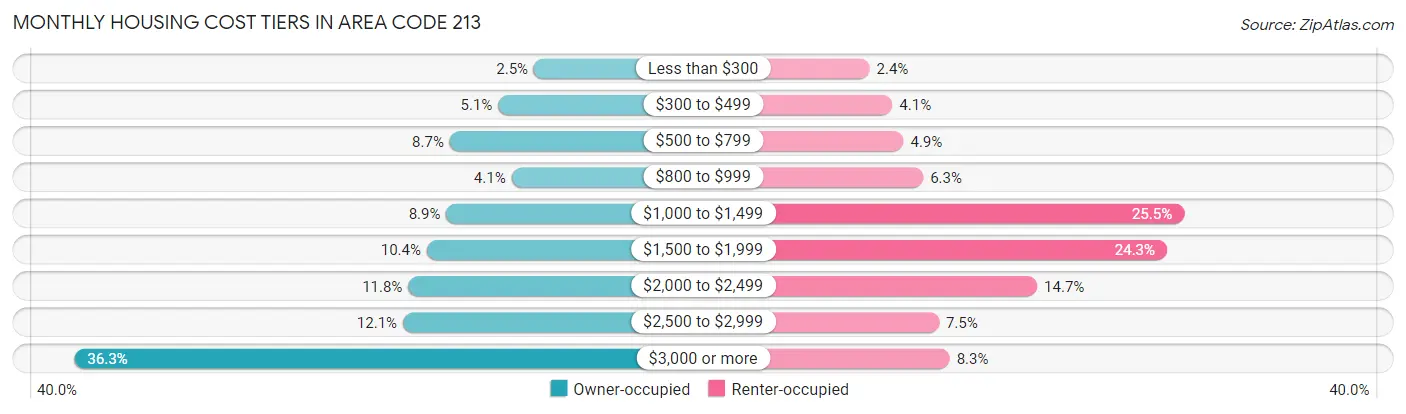
| Monthly Cost | Owner-occupied | Renter-occupied |
| Less than $300 | 2,703 (2.5%) | 6,222 (2.4%) |
| $300 to $499 | 5,561 (5.1%) | 10,621 (4.1%) |
| $500 to $799 | 9,435 (8.7%) | 12,768 (4.9%) |
| $800 to $999 | 4,492 (4.1%) | 16,580 (6.3%) |
| $1,000 to $1,499 | 9,701 (8.9%) | 66,937 (25.5%) |
| $1,500 to $1,999 | 11,268 (10.4%) | 63,617 (24.3%) |
| $2,000 to $2,499 | 12,757 (11.7%) | 38,584 (14.7%) |
| $2,500 to $2,999 | 13,180 (12.1%) | 19,615 (7.5%) |
| $3,000 or more | 39,429 (36.3%) | 21,688 (8.3%) |
| Total | 108,526 (100.0%) | 262,261 (100.0%) |
Physical Housing Characteristics in Area Code 213
Housing Structures in Area Code 213
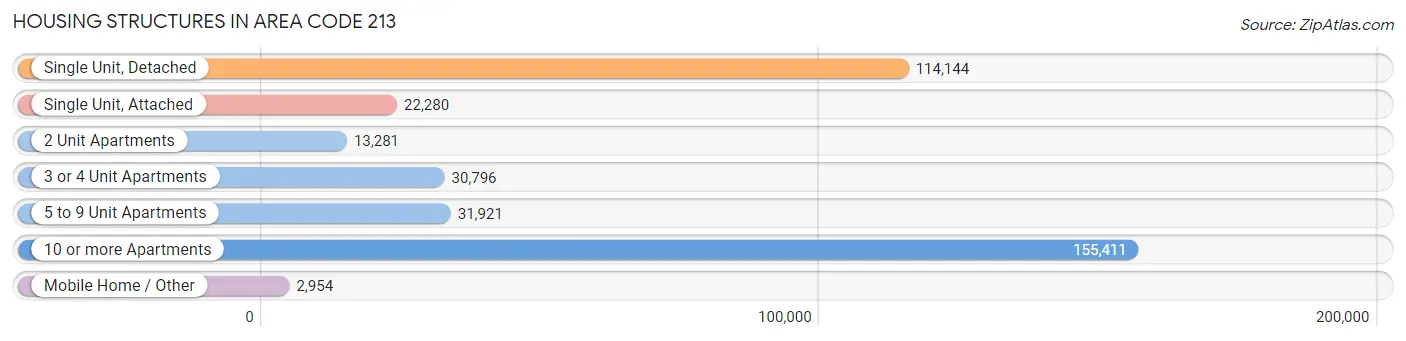
| Structure Type | # Housing Units | % Housing Units |
| Single Unit, Detached | 114,144 | 30.8% |
| Single Unit, Attached | 22,280 | 6.0% |
| 2 Unit Apartments | 13,281 | 3.6% |
| 3 or 4 Unit Apartments | 30,796 | 8.3% |
| 5 to 9 Unit Apartments | 31,921 | 8.6% |
| 10 or more Apartments | 155,411 | 41.9% |
| Mobile Home / Other | 2,954 | 0.8% |
| Total | 370,787 | 100.0% |
Housing Structures by Occupancy in Area Code 213
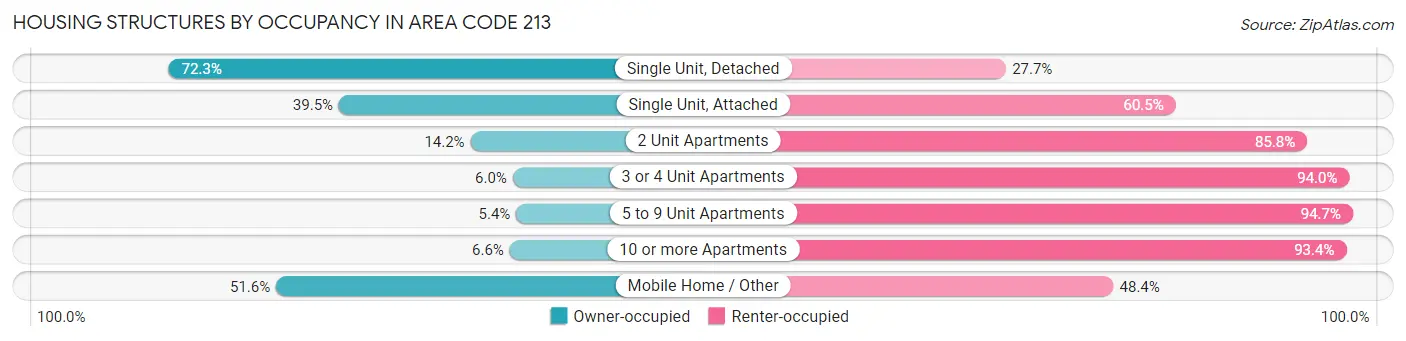
| Structure Type | Owner-occupied | Renter-occupied |
| Single Unit, Detached | 82,492 (72.3%) | 31,652 (27.7%) |
| Single Unit, Attached | 8,796 (39.5%) | 13,484 (60.5%) |
| 2 Unit Apartments | 1,880 (14.2%) | 11,401 (85.8%) |
| 3 or 4 Unit Apartments | 1,853 (6.0%) | 28,943 (94.0%) |
| 5 to 9 Unit Apartments | 1,707 (5.3%) | 30,214 (94.7%) |
| 10 or more Apartments | 10,274 (6.6%) | 145,137 (93.4%) |
| Mobile Home / Other | 1,524 (51.6%) | 1,430 (48.4%) |
| Total | 108,526 (29.3%) | 262,261 (70.7%) |
Housing Structures by Number of Rooms in Area Code 213
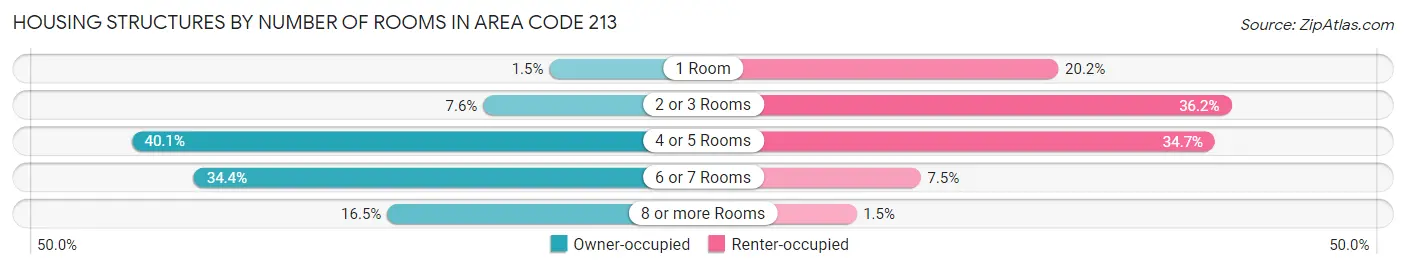
| Number of Rooms | Owner-occupied | Renter-occupied |
| 1 Room | 1,598 (1.5%) | 52,913 (20.2%) |
| 2 or 3 Rooms | 8,242 (7.6%) | 94,908 (36.2%) |
| 4 or 5 Rooms | 43,530 (40.1%) | 90,950 (34.7%) |
| 6 or 7 Rooms | 37,282 (34.4%) | 19,532 (7.4%) |
| 8 or more Rooms | 17,874 (16.5%) | 3,958 (1.5%) |
| Total | 108,526 (100.0%) | 262,261 (100.0%) |
Housing Structure by Heating Type in Area Code 213
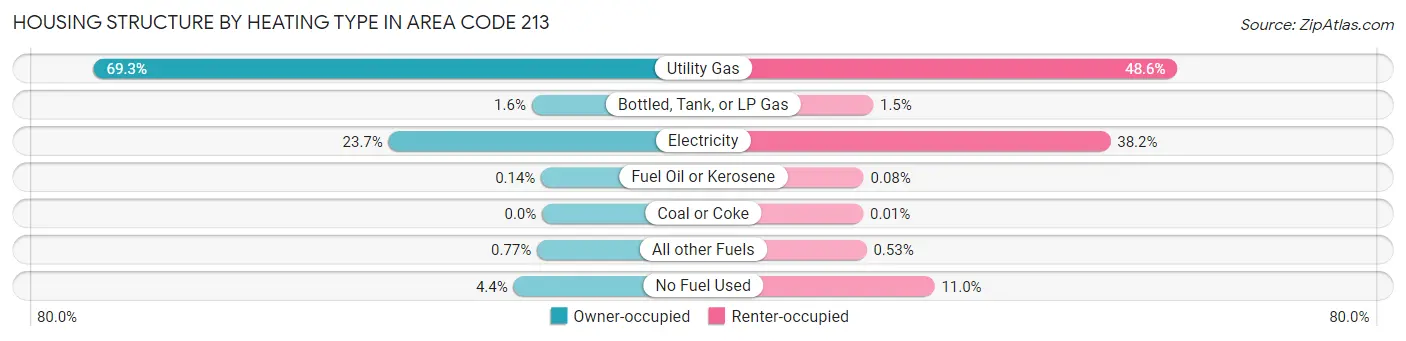
| Heating Type | Owner-occupied | Renter-occupied |
| Utility Gas | 75,247 (69.3%) | 127,403 (48.6%) |
| Bottled, Tank, or LP Gas | 1,741 (1.6%) | 4,026 (1.5%) |
| Electricity | 25,756 (23.7%) | 100,235 (38.2%) |
| Fuel Oil or Kerosene | 154 (0.1%) | 218 (0.1%) |
| Coal or Coke | 0 (0.0%) | 36 (0.0%) |
| All other Fuels | 839 (0.8%) | 1,401 (0.5%) |
| No Fuel Used | 4,789 (4.4%) | 28,942 (11.0%) |
| Total | 108,526 (100.0%) | 262,261 (100.0%) |
Household Vehicle Usage in Area Code 213
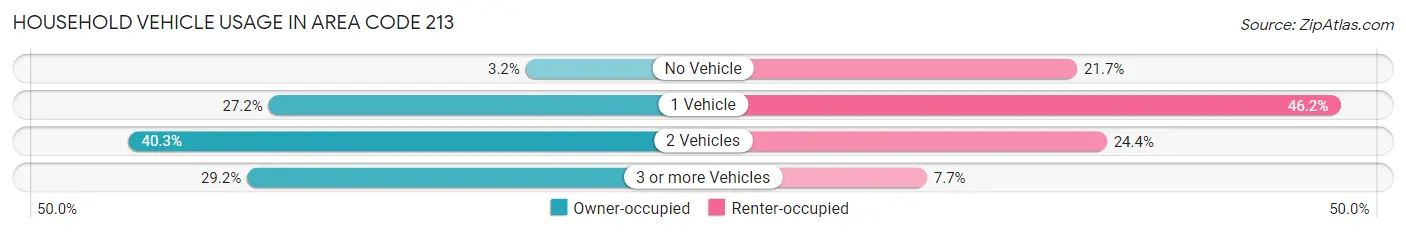
| Vehicles per Household | Owner-occupied | Renter-occupied |
| No Vehicle | 3,510 (3.2%) | 56,860 (21.7%) |
| 1 Vehicle | 29,554 (27.2%) | 121,229 (46.2%) |
| 2 Vehicles | 43,728 (40.3%) | 64,109 (24.4%) |
| 3 or more Vehicles | 31,734 (29.2%) | 20,063 (7.6%) |
| Total | 108,526 (100.0%) | 262,261 (100.0%) |
Real Estate & Mortgages in Area Code 213
Real Estate and Mortgage Overview in Area Code 213
| Characteristic | Without Mortgage | With Mortgage |
| Housing Units | 30,830 | 77,696 |
| Median Property Value | $22,252,800 | $24,794,600 |
| Median Household Income | $2,317,300 | $32,293 |
| Monthly Housing Costs | $23,376 | $38,697 |
| Real Estate Taxes | $97,782 | $1,167 |
Property Value by Mortgage Status in Area Code 213
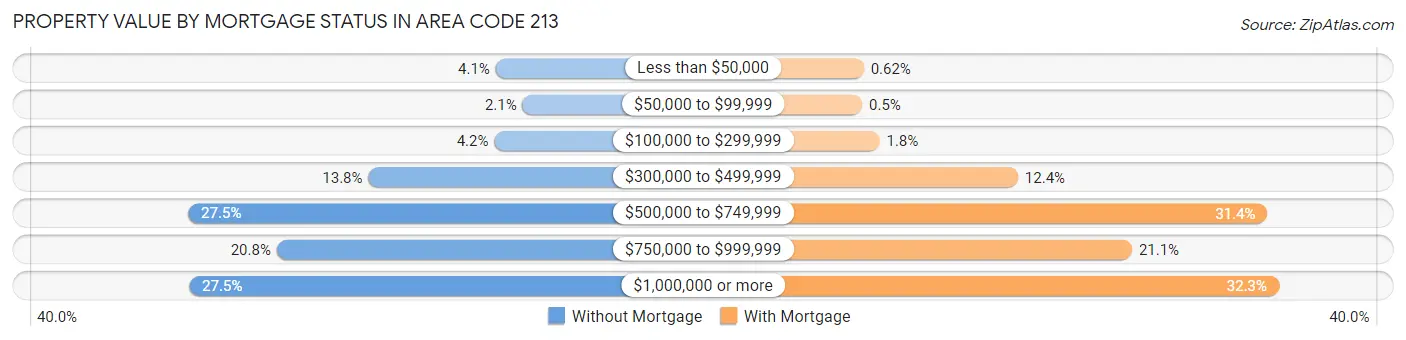
| Property Value | Without Mortgage | With Mortgage |
| Less than $50,000 | 1,268 (4.1%) | 481 (0.6%) |
| $50,000 to $99,999 | 635 (2.1%) | 385 (0.5%) |
| $100,000 to $299,999 | 1,297 (4.2%) | 1,422 (1.8%) |
| $300,000 to $499,999 | 4,259 (13.8%) | 9,610 (12.4%) |
| $500,000 to $749,999 | 8,492 (27.5%) | 24,378 (31.4%) |
| $750,000 to $999,999 | 6,410 (20.8%) | 16,363 (21.1%) |
| $1,000,000 or more | 8,469 (27.5%) | 25,057 (32.3%) |
| Total | 30,830 (100.0%) | 77,696 (100.0%) |
Household Income by Mortgage Status in Area Code 213
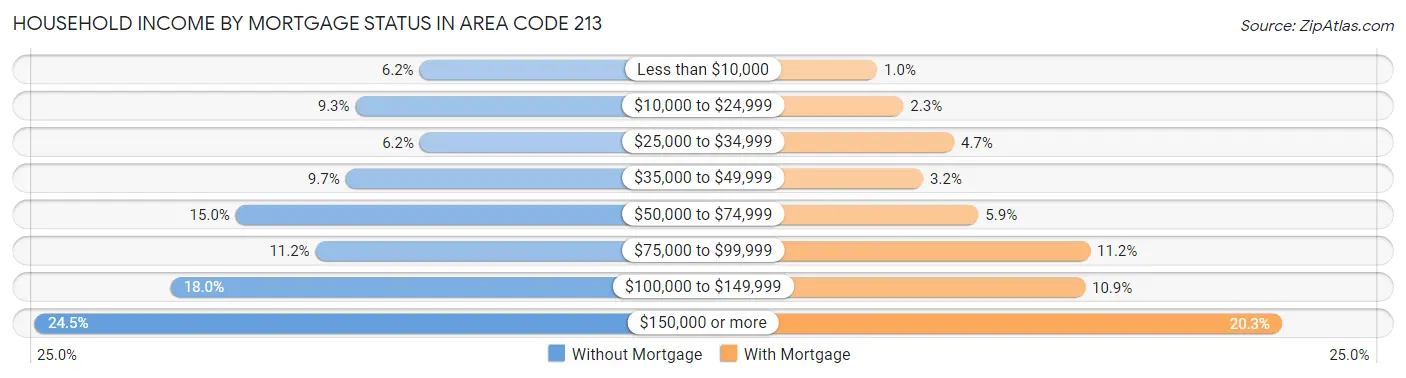
| Household Income | Without Mortgage | With Mortgage |
| Less than $10,000 | 1,911 (6.2%) | 802 (1.0%) |
| $10,000 to $24,999 | 2,853 (9.2%) | 1,775 (2.3%) |
| $25,000 to $34,999 | 1,906 (6.2%) | 3,645 (4.7%) |
| $35,000 to $49,999 | 2,996 (9.7%) | 2,499 (3.2%) |
| $50,000 to $74,999 | 4,610 (14.9%) | 4,543 (5.9%) |
| $75,000 to $99,999 | 3,437 (11.2%) | 8,678 (11.2%) |
| $100,000 to $149,999 | 5,563 (18.0%) | 8,489 (10.9%) |
| $150,000 or more | 7,554 (24.5%) | 15,774 (20.3%) |
| Total | 30,830 (100.0%) | 77,696 (100.0%) |
Property Value to Household Income Ratio in Area Code 213
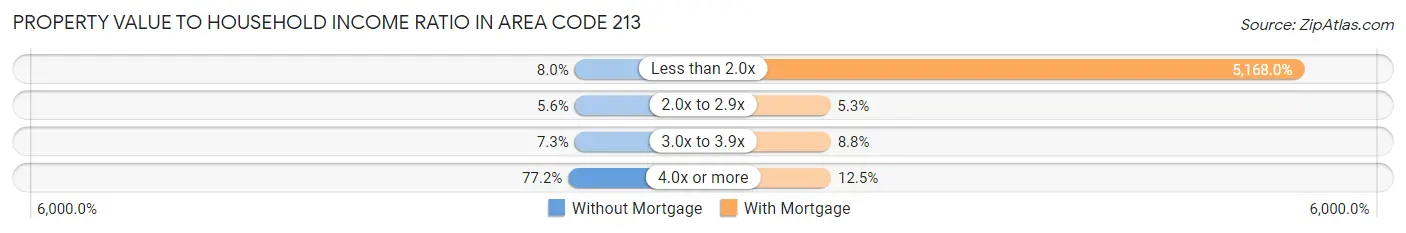
| Value-to-Income Ratio | Without Mortgage | With Mortgage |
| Less than 2.0x | 2,479 (8.0%) | 4,015,346 (5,168.0%) |
| 2.0x to 2.9x | 1,718 (5.6%) | 4,137 (5.3%) |
| 3.0x to 3.9x | 2,236 (7.2%) | 6,863 (8.8%) |
| 4.0x or more | 23,808 (77.2%) | 9,704 (12.5%) |
| Total | 30,830 (100.0%) | 77,696 (100.0%) |
Real Estate Taxes by Mortgage Status in Area Code 213
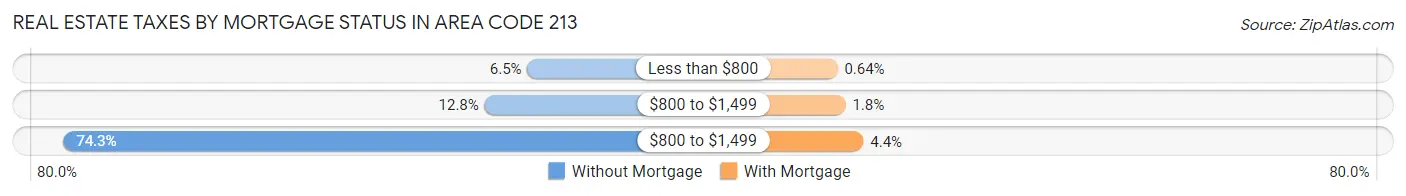
| Property Taxes | Without Mortgage | With Mortgage |
| Less than $800 | 2,013 (6.5%) | 499 (0.6%) |
| $800 to $1,499 | 3,941 (12.8%) | 1,417 (1.8%) |
| $800 to $1,499 | 22,919 (74.3%) | 3,443 (4.4%) |
| Total | 30,830 (100.0%) | 77,696 (100.0%) |
Health & Disability in Area Code 213
Health Insurance Coverage by Age in Area Code 213
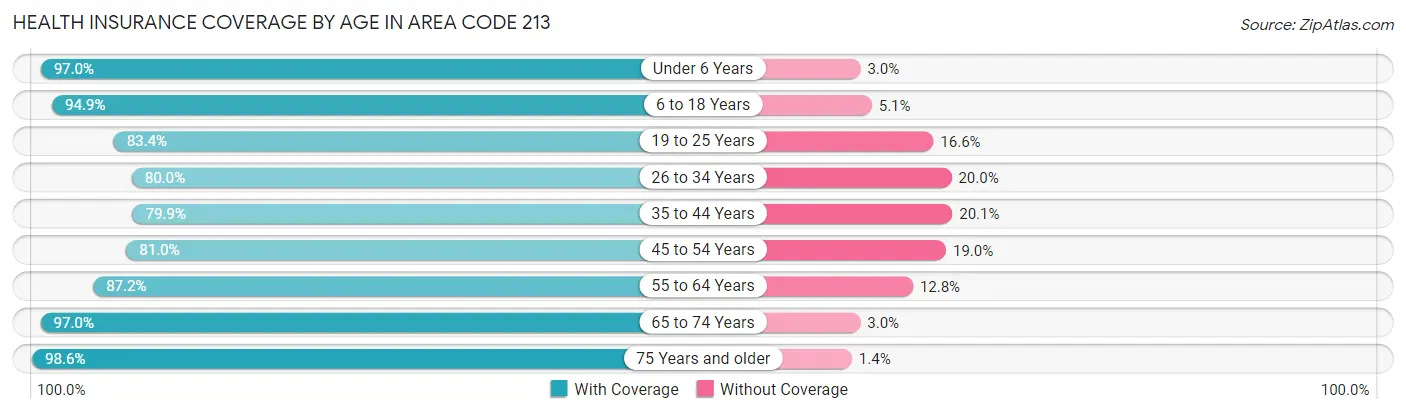
| Age Bracket | With Coverage | Without Coverage |
| Under 6 Years | 63,761 (97.0%) | 1,979 (3.0%) |
| 6 to 18 Years | 148,335 (94.9%) | 8,023 (5.1%) |
| 19 to 25 Years | 94,376 (83.4%) | 18,813 (16.6%) |
| 26 to 34 Years | 138,043 (80.0%) | 34,496 (20.0%) |
| 35 to 44 Years | 119,234 (79.9%) | 30,069 (20.1%) |
| 45 to 54 Years | 106,932 (81.0%) | 25,049 (19.0%) |
| 55 to 64 Years | 98,991 (87.2%) | 14,528 (12.8%) |
| 65 to 74 Years | 71,409 (97.0%) | 2,200 (3.0%) |
| 75 Years and older | 49,095 (98.6%) | 706 (1.4%) |
| Total | 890,176 (86.8%) | 135,863 (13.2%) |
Health Insurance Coverage by Citizenship Status in Area Code 213
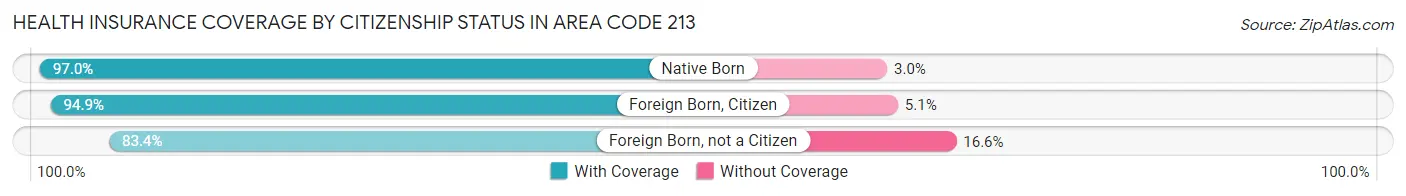
| Citizenship Status | With Coverage | Without Coverage |
| Native Born | 63,761 (97.0%) | 1,979 (3.0%) |
| Foreign Born, Citizen | 148,335 (94.9%) | 8,023 (5.1%) |
| Foreign Born, not a Citizen | 94,376 (83.4%) | 18,813 (16.6%) |
Health Insurance Coverage by Household Income in Area Code 213
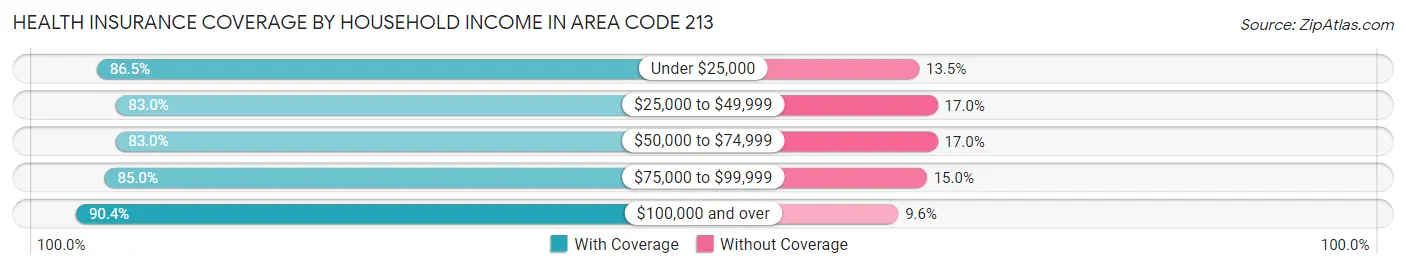
| Household Income | With Coverage | Without Coverage |
| Under $25,000 | 126,131 (86.5%) | 19,742 (13.5%) |
| $25,000 to $49,999 | 152,482 (83.0%) | 31,277 (17.0%) |
| $50,000 to $74,999 | 131,723 (83.0%) | 26,951 (17.0%) |
| $75,000 to $99,999 | 105,804 (85.0%) | 18,648 (15.0%) |
| $100,000 and over | 348,747 (90.4%) | 37,162 (9.6%) |
Public vs Private Health Insurance Coverage by Age in Area Code 213
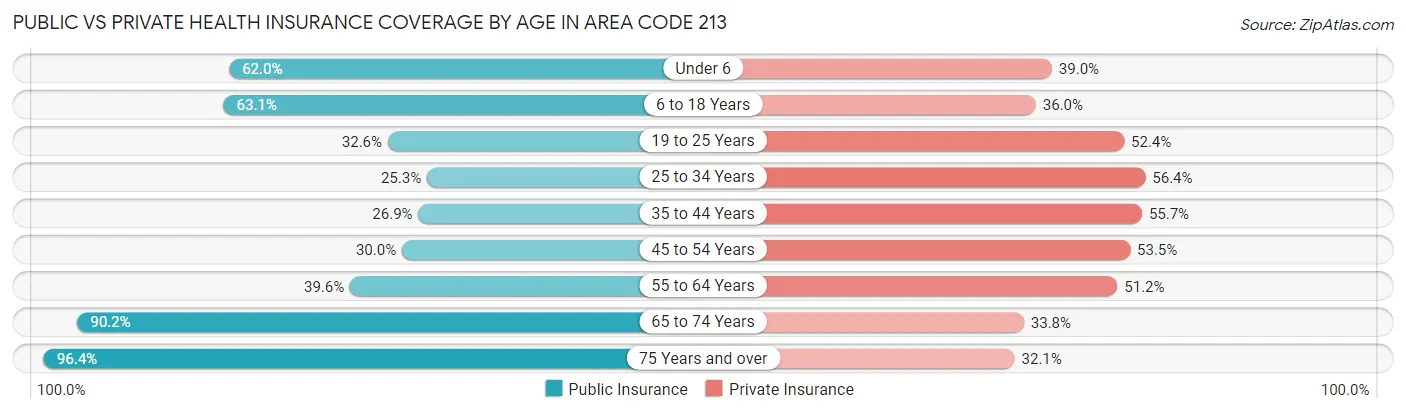
| Age Bracket | Public Insurance | Private Insurance |
| Under 6 | 40,763 (62.0%) | 25,638 (39.0%) |
| 6 to 18 Years | 98,579 (63.0%) | 56,322 (36.0%) |
| 19 to 25 Years | 36,862 (32.6%) | 59,315 (52.4%) |
| 25 to 34 Years | 43,678 (25.3%) | 97,226 (56.4%) |
| 35 to 44 Years | 40,167 (26.9%) | 83,170 (55.7%) |
| 45 to 54 Years | 39,523 (29.9%) | 70,636 (53.5%) |
| 55 to 64 Years | 44,944 (39.6%) | 58,067 (51.1%) |
| 65 to 74 Years | 66,404 (90.2%) | 24,870 (33.8%) |
| 75 Years and over | 48,014 (96.4%) | 15,978 (32.1%) |
| Total | 458,934 (44.7%) | 491,222 (47.9%) |
Disability Status by Sex by Age in Area Code 213
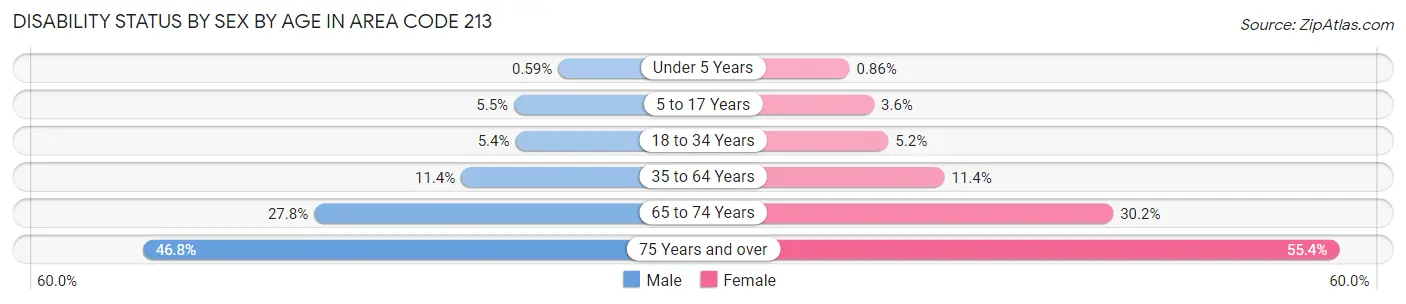
| Age Bracket | Male | Female |
| Under 5 Years | 169 (0.6%) | 225 (0.9%) |
| 5 to 17 Years | 4,270 (5.5%) | 2,705 (3.6%) |
| 18 to 34 Years | 8,226 (5.3%) | 7,591 (5.2%) |
| 35 to 64 Years | 22,780 (11.4%) | 22,287 (11.4%) |
| 65 to 74 Years | 9,689 (27.8%) | 11,705 (30.2%) |
| 75 Years and over | 8,544 (46.8%) | 17,475 (55.4%) |
Disability Class by Sex by Age in Area Code 213
Disability Class: Hearing Difficulty
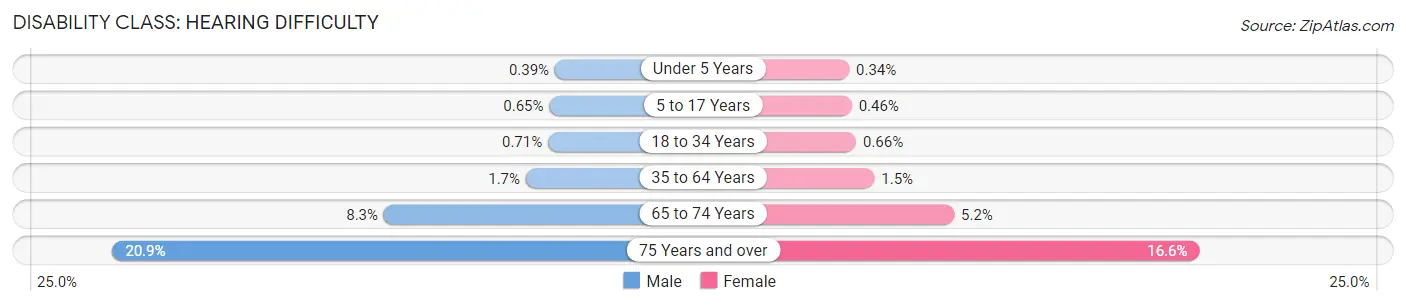
| Age Bracket | Male | Female |
| Under 5 Years | 113 (0.4%) | 88 (0.3%) |
| 5 to 17 Years | 504 (0.6%) | 349 (0.5%) |
| 18 to 34 Years | 1,091 (0.7%) | 963 (0.7%) |
| 35 to 64 Years | 3,474 (1.7%) | 2,936 (1.5%) |
| 65 to 74 Years | 2,905 (8.3%) | 2,019 (5.2%) |
| 75 Years and over | 3,818 (20.9%) | 5,235 (16.6%) |
Disability Class: Vision Difficulty
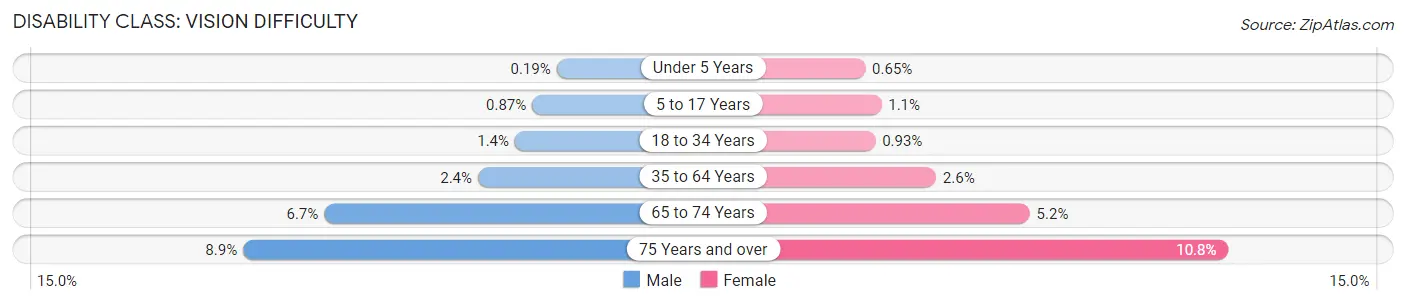
| Age Bracket | Male | Female |
| Under 5 Years | 56 (0.2%) | 169 (0.6%) |
| 5 to 17 Years | 675 (0.9%) | 827 (1.1%) |
| 18 to 34 Years | 2,081 (1.3%) | 1,365 (0.9%) |
| 35 to 64 Years | 4,763 (2.4%) | 5,112 (2.6%) |
| 65 to 74 Years | 2,322 (6.7%) | 2,027 (5.2%) |
| 75 Years and over | 1,627 (8.9%) | 3,396 (10.8%) |
Disability Class: Cognitive Difficulty
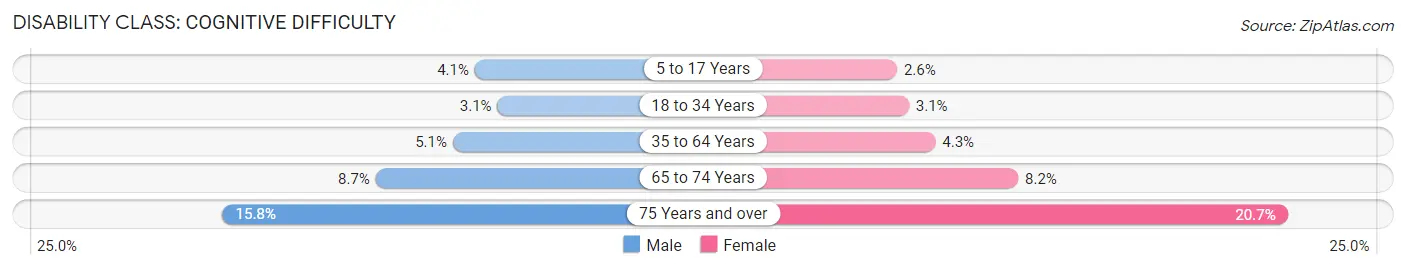
| Age Bracket | Male | Female |
| 5 to 17 Years | 3,185 (4.1%) | 1,927 (2.6%) |
| 18 to 34 Years | 4,699 (3.1%) | 4,546 (3.1%) |
| 35 to 64 Years | 10,260 (5.1%) | 8,456 (4.3%) |
| 65 to 74 Years | 3,039 (8.7%) | 3,168 (8.2%) |
| 75 Years and over | 2,885 (15.8%) | 6,526 (20.7%) |
Disability Class: Ambulatory Difficulty
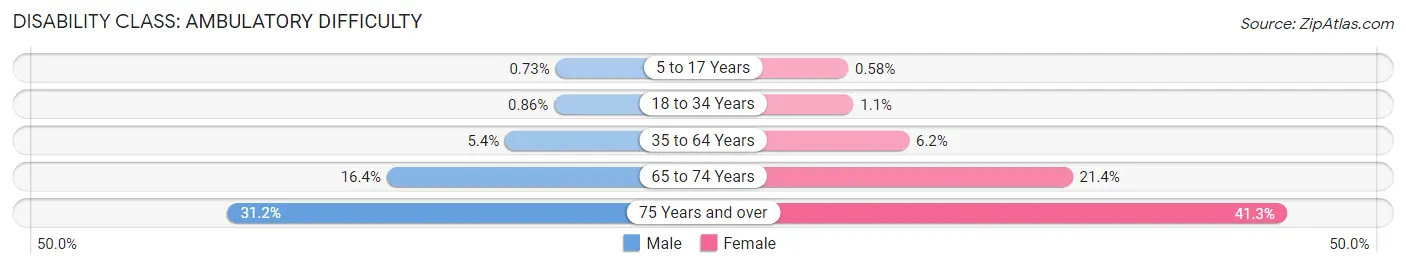
| Age Bracket | Male | Female |
| 5 to 17 Years | 569 (0.7%) | 437 (0.6%) |
| 18 to 34 Years | 1,326 (0.9%) | 1,571 (1.1%) |
| 35 to 64 Years | 10,818 (5.4%) | 12,157 (6.2%) |
| 65 to 74 Years | 5,717 (16.4%) | 8,294 (21.4%) |
| 75 Years and over | 5,687 (31.2%) | 13,031 (41.3%) |
Disability Class: Self-Care Difficulty
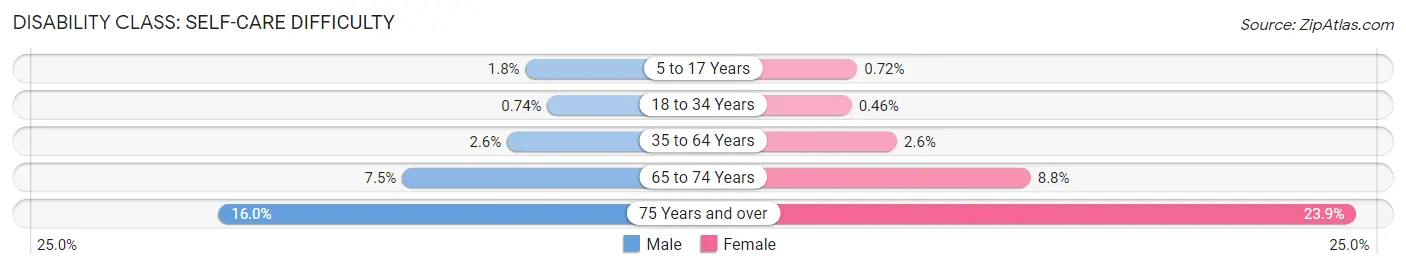
| Age Bracket | Male | Female |
| 5 to 17 Years | 1,369 (1.8%) | 544 (0.7%) |
| 18 to 34 Years | 1,137 (0.7%) | 668 (0.5%) |
| 35 to 64 Years | 5,218 (2.6%) | 5,008 (2.6%) |
| 65 to 74 Years | 2,608 (7.5%) | 3,395 (8.8%) |
| 75 Years and over | 2,921 (16.0%) | 7,528 (23.9%) |
Technology Access in Area Code 213
Computing Device Access in Area Code 213
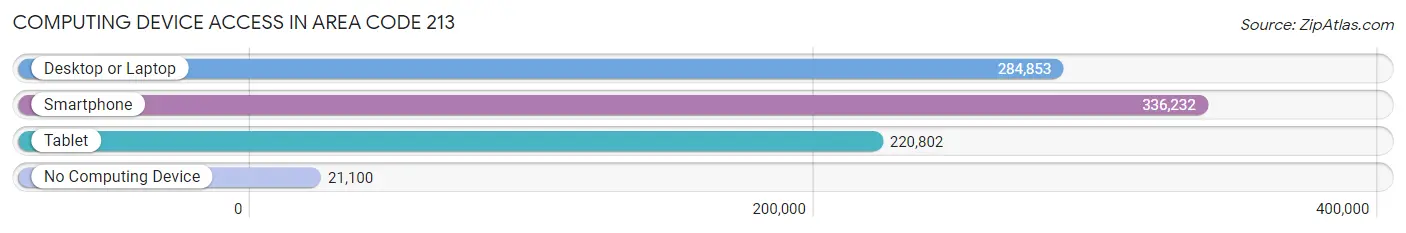
| Device Type | # Households | % Households |
| Desktop or Laptop | 284,853 | 76.8% |
| Smartphone | 336,232 | 90.7% |
| Tablet | 220,802 | 59.6% |
| No Computing Device | 21,100 | 5.7% |
| Total | 370,787 | 100.0% |
Internet Access in Area Code 213
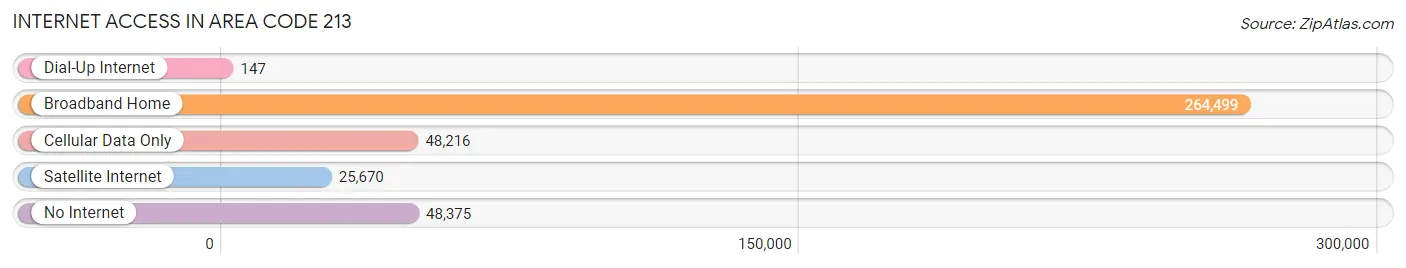
| Internet Type | # Households | % Households |
| Dial-Up Internet | 147 | 0.0% |
| Broadband Home | 264,499 | 71.3% |
| Cellular Data Only | 48,216 | 13.0% |
| Satellite Internet | 25,670 | 6.9% |
| No Internet | 48,375 | 13.1% |
| Total | 370,787 | 100.0% |
Area Code 213 Summary
Geography
Area code 213 is a telephone area code in the North American Numbering Plan (NANP) for the city of Los Angeles, California. It covers the downtown area of the city, as well as the surrounding communities of East Los Angeles, South Los Angeles, and Westlake.
Social
Area code 213 is a vibrant and diverse area of Los Angeles. It is home to a variety of cultures, including Mexican, Central American, African American, and Asian. The area is known for its vibrant nightlife, with a variety of bars, clubs, and restaurants.
Economics
Area code 213 is an economically diverse area of Los Angeles. It is home to a variety of businesses, from small mom-and-pop shops to large corporate offices. The area is also home to a number of financial institutions, including banks, credit unions, and investment firms.
Demographics
Area code 213 is home to a diverse population. According to the 2010 census, the population of the area was over 1.2 million people. The population is predominantly Hispanic, with a large African American population as well. The median household income in the area is $37,000, and the median age is 33.
Common Questions
What is Per Capita Income in Area Code 213?
Per Capita income in Area Code 213 is $39,975.
What is the Median Family Income in Area Code 213?
Median Family Income in Area Code 213 is $87,156.
What is the Median Household income in Area Code 213?
Median Household Income in Area Code 213 is $69,174.
What is Income or Wage Gap in Area Code 213?
Income or Wage Gap in Area Code 213 is 18.1%.
Women in Area Code 213 earn 81.9 cents for every dollar earned by a man.
What is Family Income Deficit in Area Code 213?
Family Income Deficit in Area Code 213 is $11,071.
Families that are below poverty line in Area Code 213 earn $11,071 less on average than the poverty threshold level.
What is Inequality or Gini Index in Area Code 213?
Inequality or Gini Index in Area Code 213 is 14.72.
What is the Total Population of Area Code 213?
Total Population of Area Code 213 is 1,031,920.
What is the Total Male Population of Area Code 213?
Total Male Population of Area Code 213 is 516,310.
What is the Total Female Population of Area Code 213?
Total Female Population of Area Code 213 is 515,610.
What is the Ratio of Males per 100 Females in Area Code 213?
There are 100.14 Males per 100 Females in Area Code 213.
What is the Ratio of Females per 100 Males in Area Code 213?
There are 99.86 Females per 100 Males in Area Code 213.
What is the Median Population Age in Area Code 213?
Median Population Age in Area Code 213 is 36.5 Years.
What is the Average Family Size in Area Code 213
Average Family Size in Area Code 213 is 3.3 People.
What is the Average Household Size in Area Code 213
Average Household Size in Area Code 213 is 2.5 People.
How Large is the Labor Force in Area Code 213?
There are 537,267 People in the Labor Forcein in Area Code 213.
What is the Percentage of People in the Labor Force in Area Code 213?
63.5% of People are in the Labor Force in Area Code 213.
What is the Unemployment Rate in Area Code 213?
Unemployment Rate in Area Code 213 is 9.8%.