Area Code 424 Map & Demographics
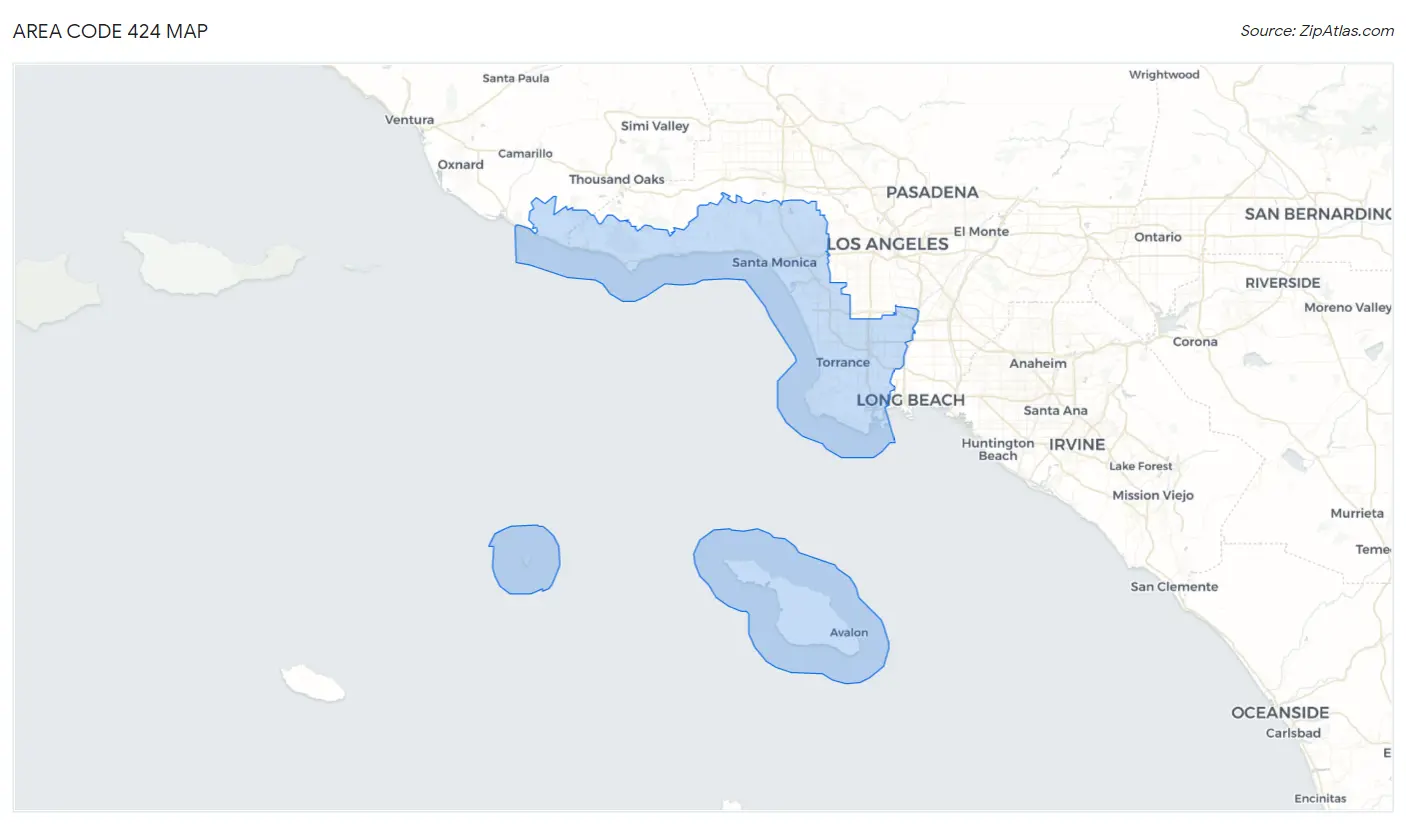
Area Code 424 Map
Area Code 424 Overview
$55,294
PER CAPITA INCOME
$117,701
AVG FAMILY INCOME
$93,684
AVG HOUSEHOLD INCOME
21.6%
WAGE / INCOME GAP [ % ]
78.4¢/ $1
WAGE / INCOME GAP [ $ ]
$11,654
FAMILY INCOME DEFICIT
21.15
INEQUALITY / GINI INDEX
1,433,367
TOTAL POPULATION
715,665
MALE POPULATION
717,702
FEMALE POPULATION
99.72
MALES / 100 FEMALES
100.28
FEMALES / 100 MALES
38.6
MEDIAN AGE
3.3
AVG FAMILY SIZE
2.5
AVG HOUSEHOLD SIZE
780,717
LABOR FORCE [ PEOPLE ]
66.3%
PERCENT IN LABOR FORCE
7.9%
UNEMPLOYMENT RATE
Income in Area Code 424
Income Overview in Area Code 424
Per Capita Income in Area Code 424 is $55,294, while median incomes of families and households are $117,701 and $93,684 respectively.
| Characteristic | Number | Measure |
| Per Capita Income | 1,433,367 | $55,294 |
| Median Family Income | 312,633 | $117,701 |
| Mean Family Income | 312,633 | $7,165,207 |
| Median Household Income | 552,630 | $93,684 |
| Mean Household Income | 552,630 | $5,899,752 |
| Income Deficit | 312,633 | $11,654 |
| Wage / Income Gap (%) | 1,433,367 | 21.58% |
| Wage / Income Gap ($) | 1,433,367 | 78.42¢ per $1 |
| Gini / Inequality Index | 1,433,367 | 21.15 |
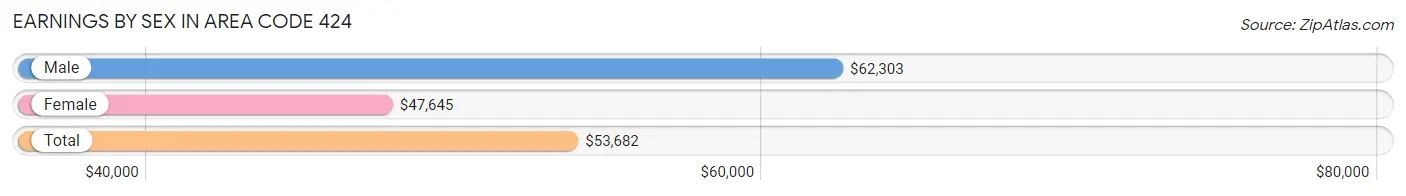
Earnings by Sex in Area Code 424
Average Earnings in Area Code 424 are $53,682, $62,303 for men and $47,645 for women, a difference of 23.5%.
| Sex | Number | Average Earnings |
| Male | 432,326 (53.4%) | $62,303 |
| Female | 377,127 (46.6%) | $47,645 |
| Total | 809,453 (100.0%) | $53,682 |
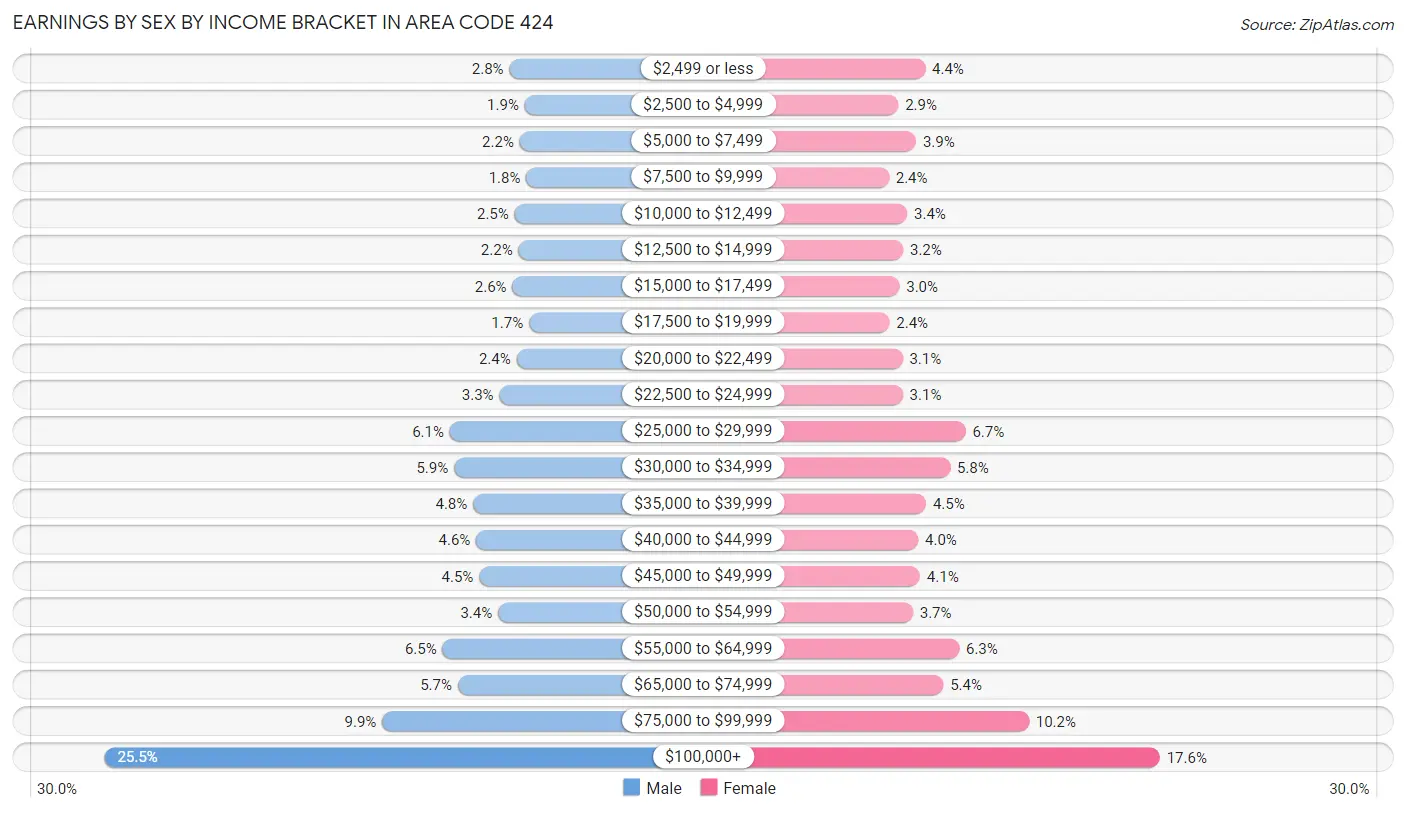
Earnings by Sex by Income Bracket in Area Code 424
The most common earnings brackets in Area Code 424 are $100,000+ for men (110,298 | 25.5%) and $100,000+ for women (66,323 | 17.6%).
| Income | Male | Female |
| $2,499 or less | 11,876 (2.8%) | 16,604 (4.4%) |
| $2,500 to $4,999 | 8,164 (1.9%) | 10,916 (2.9%) |
| $5,000 to $7,499 | 9,384 (2.2%) | 14,686 (3.9%) |
| $7,500 to $9,999 | 7,779 (1.8%) | 8,918 (2.4%) |
| $10,000 to $12,499 | 10,640 (2.5%) | 12,773 (3.4%) |
| $12,500 to $14,999 | 9,681 (2.2%) | 11,902 (3.2%) |
| $15,000 to $17,499 | 11,171 (2.6%) | 11,117 (2.9%) |
| $17,500 to $19,999 | 7,140 (1.7%) | 9,007 (2.4%) |
| $20,000 to $22,499 | 10,162 (2.4%) | 11,789 (3.1%) |
| $22,500 to $24,999 | 14,324 (3.3%) | 11,834 (3.1%) |
| $25,000 to $29,999 | 26,374 (6.1%) | 25,168 (6.7%) |
| $30,000 to $34,999 | 25,327 (5.9%) | 21,857 (5.8%) |
| $35,000 to $39,999 | 20,725 (4.8%) | 16,799 (4.4%) |
| $40,000 to $44,999 | 19,978 (4.6%) | 15,107 (4.0%) |
| $45,000 to $49,999 | 19,222 (4.4%) | 15,501 (4.1%) |
| $50,000 to $54,999 | 14,668 (3.4%) | 13,975 (3.7%) |
| $55,000 to $64,999 | 28,164 (6.5%) | 23,810 (6.3%) |
| $65,000 to $74,999 | 24,434 (5.7%) | 20,455 (5.4%) |
| $75,000 to $99,999 | 42,815 (9.9%) | 38,586 (10.2%) |
| $100,000+ | 110,298 (25.5%) | 66,323 (17.6%) |
| Total | 432,326 (100.0%) | 377,127 (100.0%) |
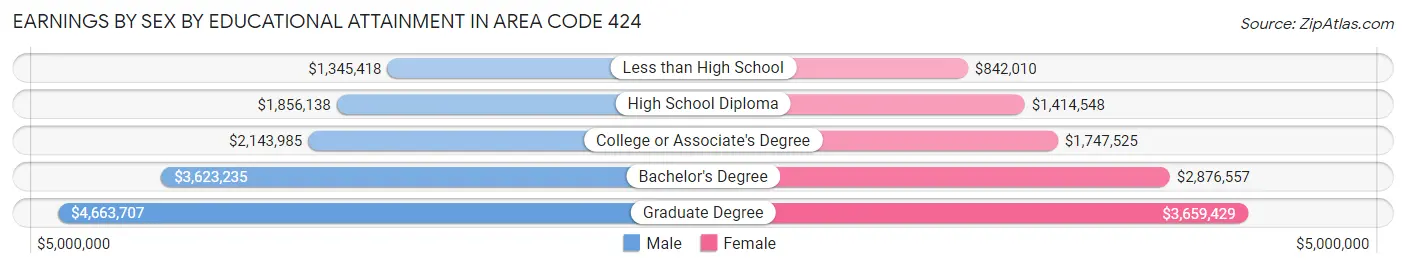
Earnings by Sex by Educational Attainment in Area Code 424
Average earnings in Area Code 424 are $3,002,893 for men and $2,328,909 for women, a difference of 22.4%. Men with an educational attainment of graduate degree enjoy the highest average annual earnings of $4,663,707, while those with less than high school education earn the least with $1,345,418. Women with an educational attainment of graduate degree earn the most with the average annual earnings of $3,659,429, while those with less than high school education have the smallest earnings of $842,010.
| Educational Attainment | Male Income | Female Income |
| Less than High School | $1,345,418 | $842,010 |
| High School Diploma | $1,856,138 | $1,414,548 |
| College or Associate's Degree | $2,143,985 | $1,747,525 |
| Bachelor's Degree | $3,623,235 | $2,876,557 |
| Graduate Degree | $4,663,707 | $3,659,429 |
| Total | $3,002,893 | $2,328,909 |
Family Income in Area Code 424
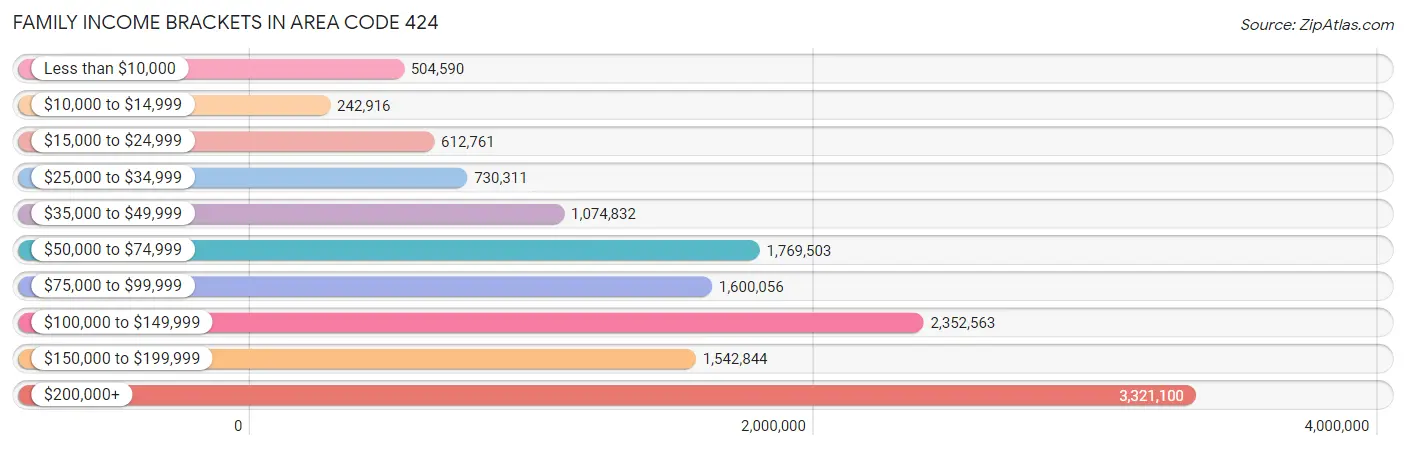
Family Income Brackets in Area Code 424
According to the Area Code 424 family income data, there are 3,321,100 families falling into the $200,000+ income range, which is the most common income bracket and makes up 1,062.3% of all families. Conversely, the $10,000 to $14,999 income bracket is the least frequent group with only 242,916 families (77.7%) belonging to this category.
| Income Bracket | # Families | % Families |
| Less than $10,000 | 504,590 | 161.4% |
| $10,000 to $14,999 | 242,916 | 77.7% |
| $15,000 to $24,999 | 612,761 | 196.0% |
| $25,000 to $34,999 | 730,311 | 233.6% |
| $35,000 to $49,999 | 1,074,832 | 343.8% |
| $50,000 to $74,999 | 1,769,503 | 566.0% |
| $75,000 to $99,999 | 1,600,056 | 511.8% |
| $100,000 to $149,999 | 2,352,563 | 752.5% |
| $150,000 to $199,999 | 1,542,844 | 493.5% |
| $200,000+ | 3,321,100 | 1,062.3% |
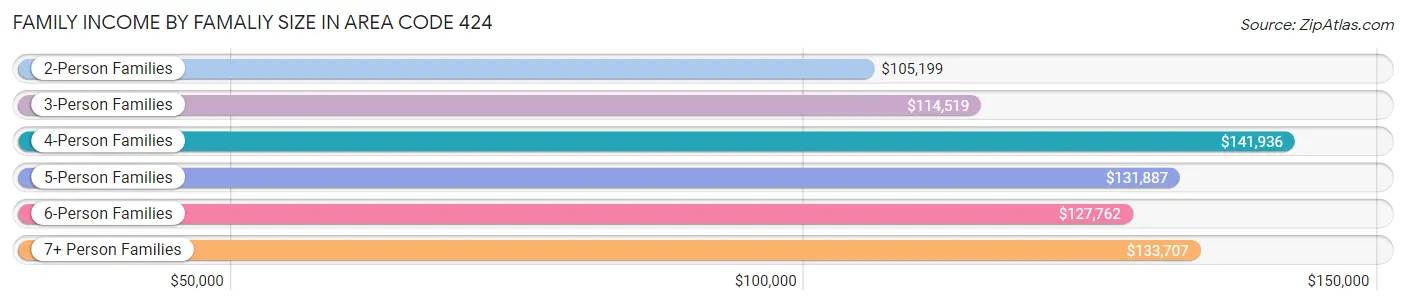
Family Income by Famaliy Size in Area Code 424
4-person families (60,391 | 19.3%) account for the highest median family income in Area Code 424 with $141,936 per family, while 2-person families (129,811 | 41.5%) have the highest median income of $52,599 per family member.
| Income Bracket | # Families | Median Income |
| 2-Person Families | 129,811 (41.5%) | $105,199 |
| 3-Person Families | 74,347 (23.8%) | $114,519 |
| 4-Person Families | 60,391 (19.3%) | $141,936 |
| 5-Person Families | 28,660 (9.2%) | $131,887 |
| 6-Person Families | 10,736 (3.4%) | $127,762 |
| 7+ Person Families | 8,688 (2.8%) | $133,707 |
| Total | 312,633 (100.0%) | $117,701 |
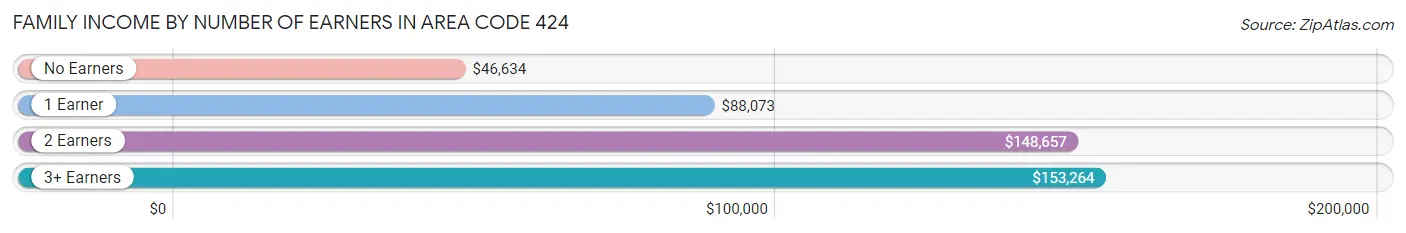
Family Income by Number of Earners in Area Code 424
The median family income in Area Code 424 is $117,701, with families comprising 3+ earners (43,631) having the highest median family income of $153,264, while families with no earners (32,163) have the lowest median family income of $46,634, accounting for 14.0% and 10.3% of families, respectively.
| Number of Earners | # Families | Median Income |
| No Earners | 32,163 (10.3%) | $46,634 |
| 1 Earner | 101,326 (32.4%) | $88,073 |
| 2 Earners | 135,513 (43.3%) | $148,657 |
| 3+ Earners | 43,631 (14.0%) | $153,264 |
| Total | 312,633 (100.0%) | $117,701 |
Household Income in Area Code 424
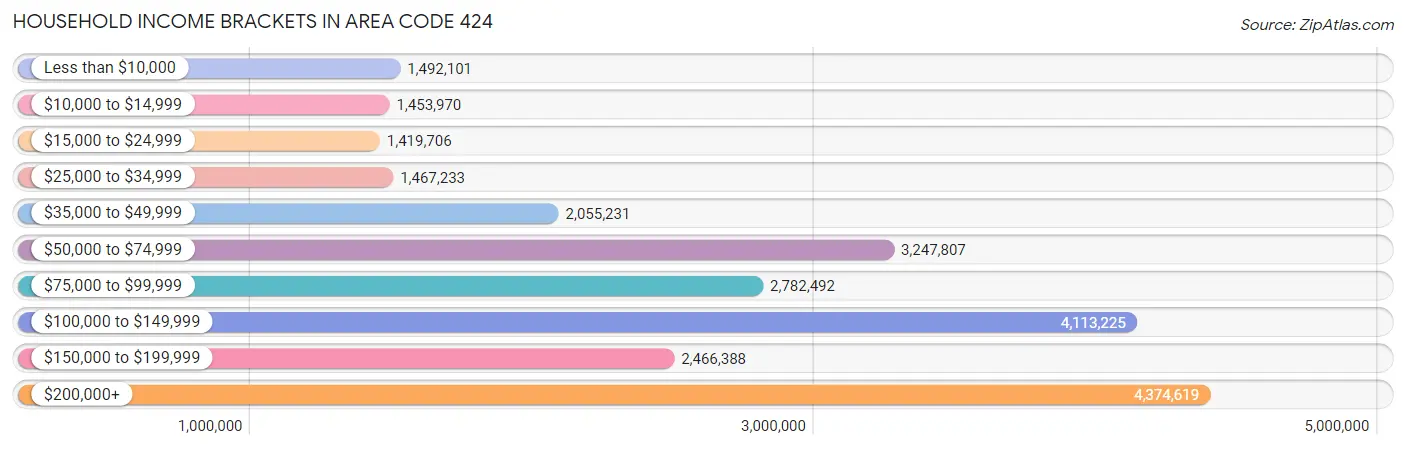
Household Income Brackets in Area Code 424
With 4,374,619 households falling in the category, the $200,000+ income range is the most frequent in Area Code 424, accounting for 791.6% of all households. In contrast, only 1,419,706 households (256.9%) fall into the $15,000 to $24,999 income bracket, making it the least populous group.
| Income Bracket | # Households | % Households |
| Less than $10,000 | 1,492,101 | 270.0% |
| $10,000 to $14,999 | 1,453,970 | 263.1% |
| $15,000 to $24,999 | 1,419,706 | 256.9% |
| $25,000 to $34,999 | 1,467,233 | 265.5% |
| $35,000 to $49,999 | 2,055,231 | 371.9% |
| $50,000 to $74,999 | 3,247,807 | 587.7% |
| $75,000 to $99,999 | 2,782,492 | 503.5% |
| $100,000 to $149,999 | 4,113,225 | 744.3% |
| $150,000 to $199,999 | 2,466,388 | 446.3% |
| $200,000+ | 4,374,619 | 791.6% |
Household Income by Householder Age in Area Code 424
The median household income in Area Code 424 is $93,684, with the highest median household income of $106,577 found in the 25 to 44 years age bracket for the primary householder. A total of 214,601 households (38.8%) fall into this category. Meanwhile, the 65+ years age bracket for the primary householder has the lowest median household income of $62,072, with 118,566 households (21.4%) in this group.
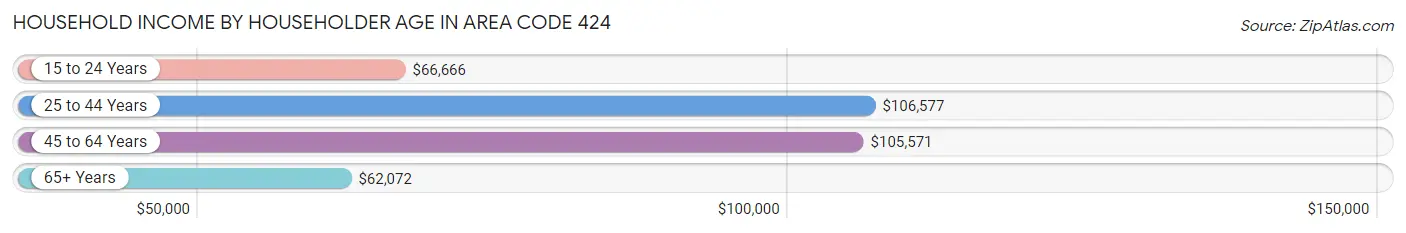
| Income Bracket | # Households | Median Income |
| 15 to 24 Years | 15,943 (2.9%) | $66,666 |
| 25 to 44 Years | 214,601 (38.8%) | $106,577 |
| 45 to 64 Years | 203,520 (36.8%) | $105,571 |
| 65+ Years | 118,566 (21.4%) | $62,072 |
| Total | 552,630 (100.0%) | $93,684 |
Poverty in Area Code 424
Income Below Poverty by Sex and Age in Area Code 424
With 13.2% poverty level for males and 14.5% for females among the residents of Area Code 424, 5 year old males and 15 year old females are the most vulnerable to poverty, with 1,643 males (21.1%) and 1,559 females (21.5%) in their respective age groups living below the poverty level.
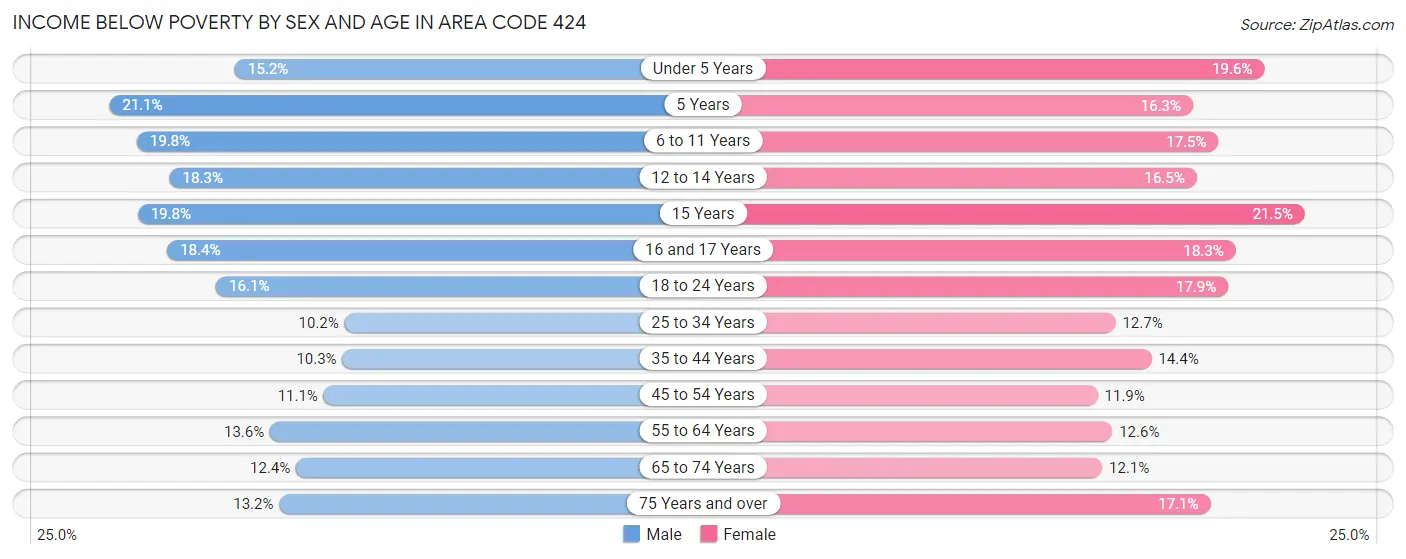
| Age Bracket | Male | Female |
| Under 5 Years | 6,135 (15.2%) | 7,328 (19.6%) |
| 5 Years | 1,643 (21.1%) | 1,146 (16.3%) |
| 6 to 11 Years | 9,541 (19.8%) | 8,334 (17.5%) |
| 12 to 14 Years | 4,573 (18.3%) | 3,931 (16.5%) |
| 15 Years | 1,705 (19.8%) | 1,559 (21.5%) |
| 16 and 17 Years | 3,084 (18.4%) | 2,725 (18.3%) |
| 18 to 24 Years | 9,305 (16.1%) | 10,003 (17.9%) |
| 25 to 34 Years | 13,263 (10.2%) | 16,267 (12.7%) |
| 35 to 44 Years | 11,075 (10.2%) | 14,452 (14.4%) |
| 45 to 54 Years | 10,652 (11.1%) | 11,307 (11.9%) |
| 55 to 64 Years | 11,649 (13.6%) | 10,814 (12.6%) |
| 65 to 74 Years | 6,647 (12.4%) | 7,062 (12.1%) |
| 75 Years and over | 4,005 (13.2%) | 8,169 (17.1%) |
| Total | 93,277 (13.2%) | 103,097 (14.5%) |
Income Above Poverty by Sex and Age in Area Code 424
According to the poverty statistics in Area Code 424, males aged 25 to 34 years and females aged 45 to 54 years are the age groups that are most secure financially, with 89.8% of males and 88.1% of females in these age groups living above the poverty line.
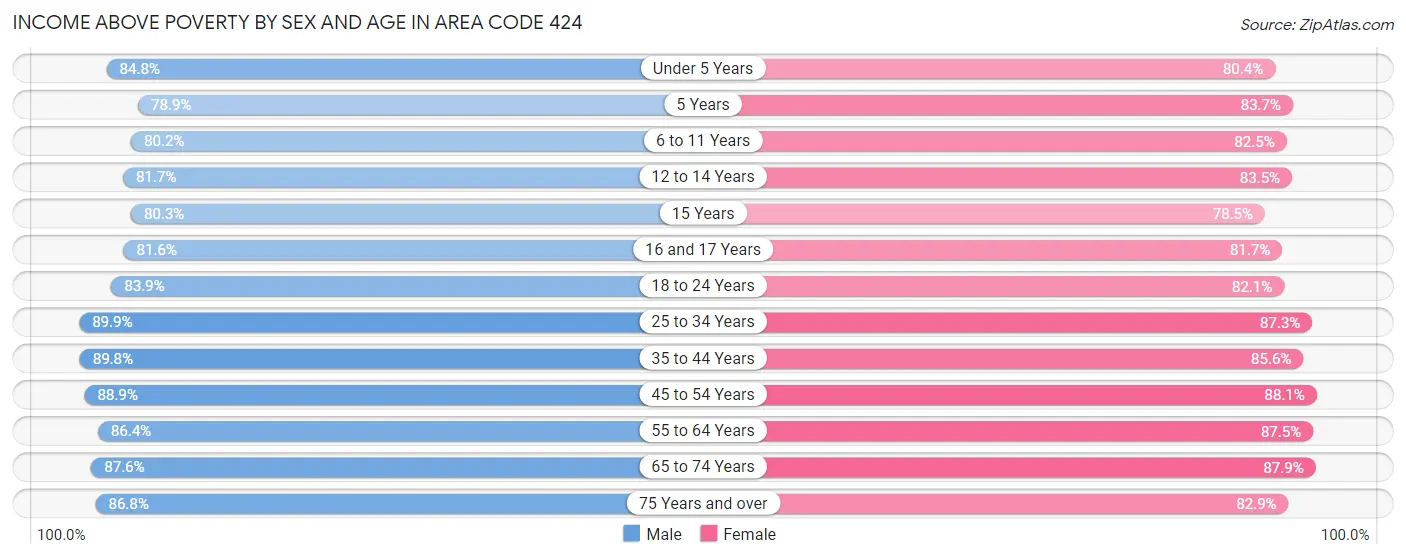
| Age Bracket | Male | Female |
| Under 5 Years | 34,111 (84.8%) | 30,060 (80.4%) |
| 5 Years | 6,156 (78.9%) | 5,891 (83.7%) |
| 6 to 11 Years | 38,677 (80.2%) | 39,376 (82.5%) |
| 12 to 14 Years | 20,463 (81.7%) | 19,950 (83.5%) |
| 15 Years | 6,930 (80.2%) | 5,699 (78.5%) |
| 16 and 17 Years | 13,693 (81.6%) | 12,188 (81.7%) |
| 18 to 24 Years | 48,455 (83.9%) | 45,810 (82.1%) |
| 25 to 34 Years | 117,421 (89.8%) | 111,787 (87.3%) |
| 35 to 44 Years | 96,970 (89.7%) | 86,148 (85.6%) |
| 45 to 54 Years | 85,149 (88.9%) | 83,970 (88.1%) |
| 55 to 64 Years | 73,965 (86.4%) | 75,361 (87.5%) |
| 65 to 74 Years | 46,962 (87.6%) | 51,388 (87.9%) |
| 75 Years and over | 26,378 (86.8%) | 39,616 (82.9%) |
| Total | 615,330 (86.8%) | 607,244 (85.5%) |
Income Below Poverty Among Married-Couple Families in Area Code 424
The poverty statistics for married-couple families in Area Code 424 show that 6.4% or 13,349 of the total 209,465 families live below the poverty line. Families with 5 or more children have the highest poverty rate of 35.7%, comprising of 572 families. On the other hand, families with no children have the lowest poverty rate of 4.2%, which includes 4,753 families.
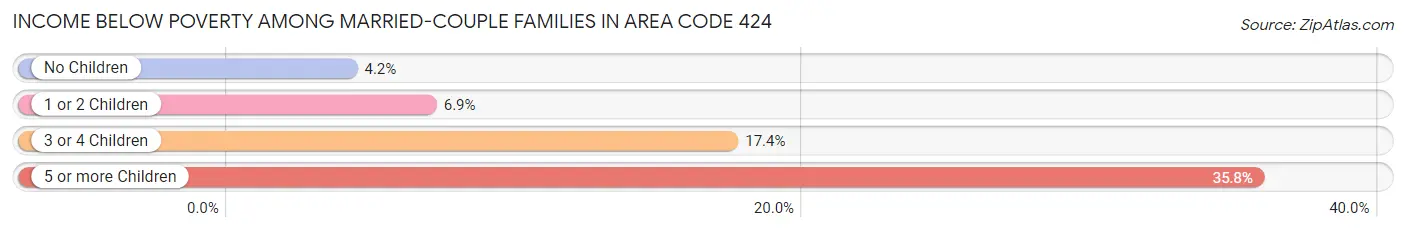
| Children | Above Poverty | Below Poverty |
| No Children | 109,439 (95.8%) | 4,753 (4.2%) |
| 1 or 2 Children | 73,505 (93.1%) | 5,462 (6.9%) |
| 3 or 4 Children | 12,144 (82.6%) | 2,562 (17.4%) |
| 5 or more Children | 1,028 (64.2%) | 572 (35.7%) |
| Total | 196,116 (93.6%) | 13,349 (6.4%) |
Income Below Poverty Among Single-Parent Households in Area Code 424
According to the poverty data in Area Code 424, 12.3% or 4,083 single-father households and 19.3% or 13,497 single-mother households are living below the poverty line. Among single-father households, those with 5 or more children have the highest poverty rate, with 31 households (32.0%) experiencing poverty. Likewise, among single-mother households, those with 3 or 4 children have the highest poverty rate, with 2,740 households (53.2%) falling below the poverty line.
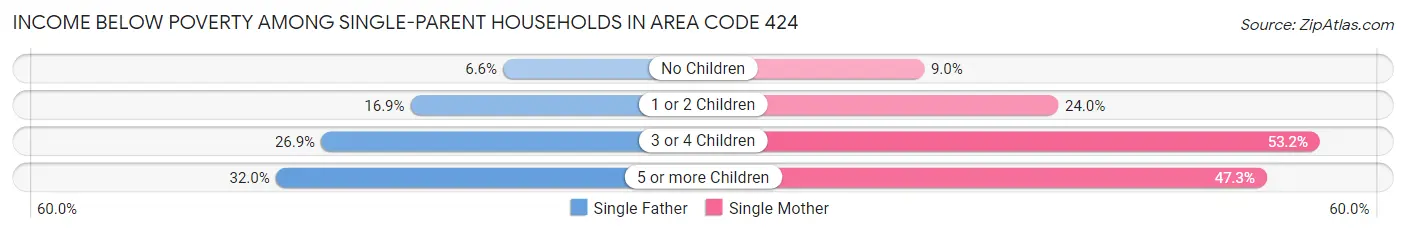
| Children | Single Father | Single Mother |
| No Children | 1,117 (6.6%) | 2,970 (9.0%) |
| 1 or 2 Children | 2,308 (16.9%) | 7,413 (24.0%) |
| 3 or 4 Children | 627 (26.9%) | 2,740 (53.2%) |
| 5 or more Children | 31 (32.0%) | 374 (47.3%) |
| Total | 4,083 (12.3%) | 13,497 (19.3%) |
Income Below Poverty Among Married-Couple vs Single-Parent Households in Area Code 424
The poverty data for Area Code 424 shows that 13,349 of the married-couple family households (6.4%) and 17,580 of the single-parent households (17.0%) are living below the poverty level. Within the married-couple family households, those with 5 or more children have the highest poverty rate, with 572 households (35.7%) falling below the poverty line. Among the single-parent households, those with 5 or more children have the highest poverty rate, with 405 household (45.6%) living below poverty.
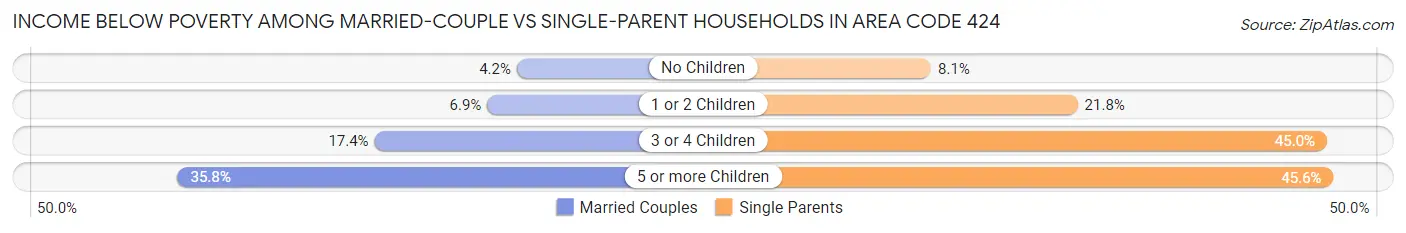
| Children | Married-Couple Families | Single-Parent Households |
| No Children | 4,753 (4.2%) | 4,087 (8.1%) |
| 1 or 2 Children | 5,462 (6.9%) | 9,721 (21.8%) |
| 3 or 4 Children | 2,562 (17.4%) | 3,367 (45.0%) |
| 5 or more Children | 572 (35.7%) | 405 (45.6%) |
| Total | 13,349 (6.4%) | 17,580 (17.0%) |
Race in Area Code 424
The most populous races in Area Code 424 are White / Caucasian (631,687 | 44.1%), Hispanic or Latino (587,785 | 41.0%), and Some other Race (243,460 | 17.0%).
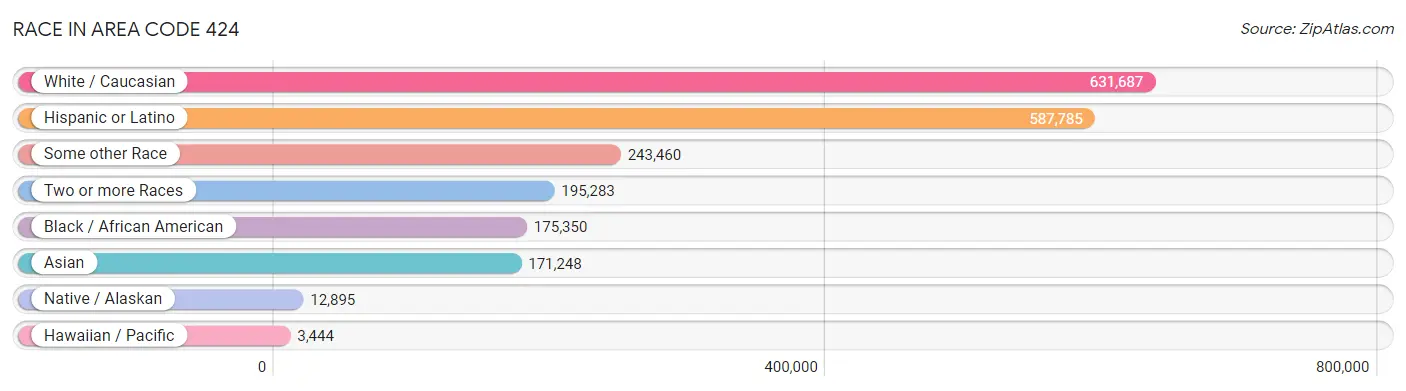
| Race | # Population | % Population |
| Asian | 171,248 | 11.9% |
| Black / African American | 175,350 | 12.2% |
| Hawaiian / Pacific | 3,444 | 0.2% |
| Hispanic or Latino | 587,785 | 41.0% |
| Native / Alaskan | 12,895 | 0.9% |
| White / Caucasian | 631,687 | 44.1% |
| Two or more Races | 195,283 | 13.6% |
| Some other Race | 243,460 | 17.0% |
| Total | 1,433,367 | 100.0% |
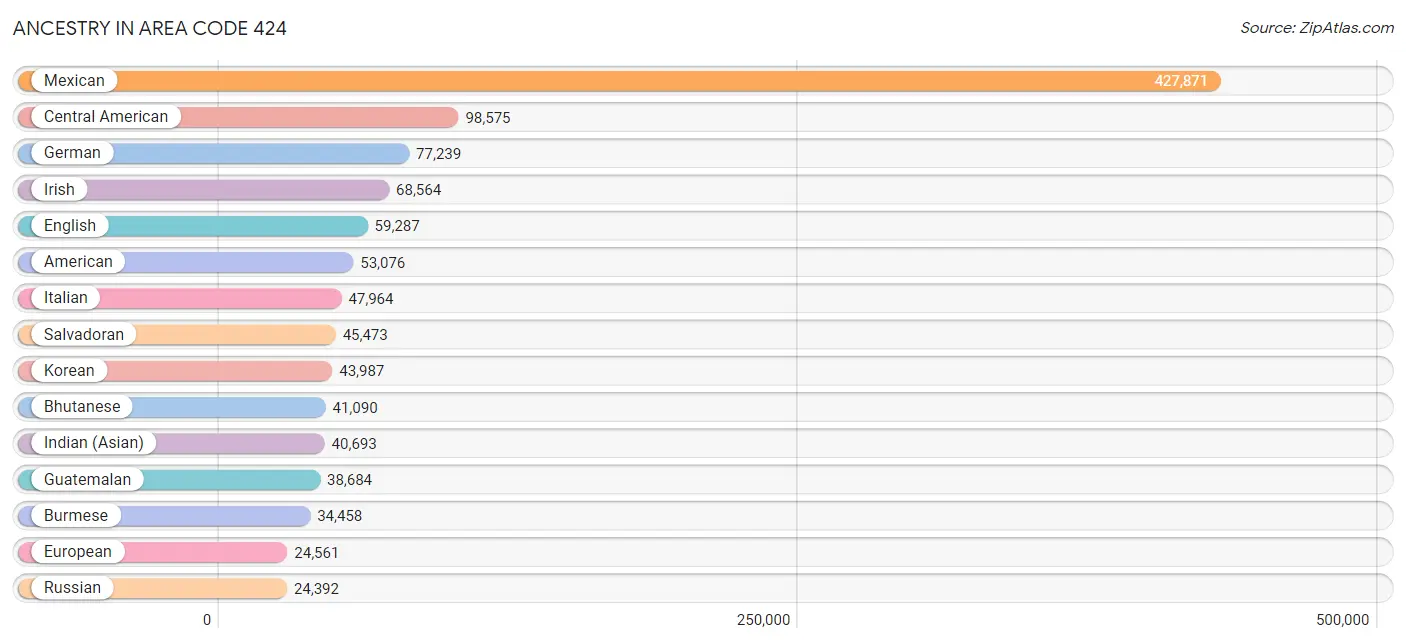
Ancestry in Area Code 424
The most populous ancestries reported in Area Code 424 are Mexican (427,871 | 29.8%), Central American (98,575 | 6.9%), German (77,239 | 5.4%), Irish (68,564 | 4.8%), and English (59,287 | 4.1%), together accounting for 51.0% of all Area Code 424 residents.
| Ancestry | # Population | % Population |
| Afghan | 609 | 0.0% |
| African | 8,224 | 0.6% |
| Alaska Native | 95 | 0.0% |
| Alaskan Athabascan | 6 | 0.0% |
| Albanian | 165 | 0.0% |
| Aleut | 11 | 0.0% |
| Alsatian | 4 | 0.0% |
| American | 53,076 | 3.7% |
| Apache | 1,023 | 0.1% |
| Arab | 14,217 | 1.0% |
| Arapaho | 7 | 0.0% |
| Argentinean | 3,698 | 0.3% |
| Armenian | 4,995 | 0.4% |
| Assyrian / Chaldean / Syriac | 482 | 0.0% |
| Australian | 1,208 | 0.1% |
| Austrian | 3,407 | 0.2% |
| Bahamian | 188 | 0.0% |
| Bangladeshi | 188 | 0.0% |
| Barbadian | 166 | 0.0% |
| Basque | 216 | 0.0% |
| Belgian | 799 | 0.1% |
| Belizean | 4,172 | 0.3% |
| Bhutanese | 41,090 | 2.9% |
| Blackfeet | 914 | 0.1% |
| Bolivian | 460 | 0.0% |
| Brazilian | 4,062 | 0.3% |
| British | 7,587 | 0.5% |
| British West Indian | 385 | 0.0% |
| Bulgarian | 770 | 0.1% |
| Burmese | 34,458 | 2.4% |
| Cajun | 86 | 0.0% |
| Cambodian | 458 | 0.0% |
| Canadian | 3,527 | 0.3% |
| Cape Verdean | 221 | 0.0% |
| Celtic | 85 | 0.0% |
| Central American | 98,575 | 6.9% |
| Central American Indian | 3,711 | 0.3% |
| Cherokee | 3,051 | 0.2% |
| Cheyenne | 17 | 0.0% |
| Chickasaw | 143 | 0.0% |
| Chilean | 1,208 | 0.1% |
| Chinese | 125 | 0.0% |
| Chippewa | 356 | 0.0% |
| Choctaw | 662 | 0.1% |
| Colombian | 5,210 | 0.4% |
| Colville | 30 | 0.0% |
| Comanche | 137 | 0.0% |
| Costa Rican | 1,084 | 0.1% |
| Cree | 113 | 0.0% |
| Creek | 115 | 0.0% |
| Croatian | 4,674 | 0.3% |
| Crow | 6 | 0.0% |
| Cuban | 5,598 | 0.4% |
| Cypriot | 38 | 0.0% |
| Czech | 3,033 | 0.2% |
| Czechoslovakian | 549 | 0.0% |
| Danish | 3,500 | 0.2% |
| Delaware | 370 | 0.0% |
| Dominican | 1,455 | 0.1% |
| Dutch | 7,690 | 0.5% |
| Dutch West Indian | 45 | 0.0% |
| Eastern European | 9,138 | 0.6% |
| Ecuadorian | 2,924 | 0.2% |
| Egyptian | 3,614 | 0.3% |
| English | 59,287 | 4.1% |
| Estonian | 190 | 0.0% |
| Ethiopian | 3,451 | 0.2% |
| European | 24,561 | 1.7% |
| Fijian | 24 | 0.0% |
| Filipino | 4,389 | 0.3% |
| Finnish | 1,862 | 0.1% |
| French | 19,692 | 1.4% |
| French American Indian | 348 | 0.0% |
| French Canadian | 3,369 | 0.2% |
| German | 77,239 | 5.4% |
| German Russian | 64 | 0.0% |
| Ghanaian | 762 | 0.1% |
| Greek | 5,141 | 0.4% |
| Guamanian / Chamorro | 677 | 0.1% |
| Guatemalan | 38,684 | 2.7% |
| Guyanese | 330 | 0.0% |
| Haitian | 1,206 | 0.1% |
| Honduran | 7,601 | 0.5% |
| Hopi | 40 | 0.0% |
| Houma | 1 | 0.0% |
| Hungarian | 4,874 | 0.3% |
| Icelander | 220 | 0.0% |
| Indian (Asian) | 40,693 | 2.8% |
| Indonesian | 882 | 0.1% |
| Inupiat | 49 | 0.0% |
| Iranian | 21,018 | 1.5% |
| Iraqi | 388 | 0.0% |
| Irish | 68,564 | 4.8% |
| Iroquois | 88 | 0.0% |
| Israeli | 3,581 | 0.3% |
| Italian | 47,964 | 3.4% |
| Jamaican | 4,357 | 0.3% |
| Japanese | 1,906 | 0.1% |
| Jordanian | 673 | 0.1% |
| Kenyan | 331 | 0.0% |
| Kiowa | 63 | 0.0% |
| Korean | 43,987 | 3.1% |
| Laotian | 2,072 | 0.1% |
| Latvian | 603 | 0.0% |
| Lebanese | 3,138 | 0.2% |
| Liberian | 47 | 0.0% |
| Lithuanian | 2,765 | 0.2% |
| Lumbee | 11 | 0.0% |
| Luxembourger | 9 | 0.0% |
| Macedonian | 89 | 0.0% |
| Malaysian | 599 | 0.0% |
| Maltese | 133 | 0.0% |
| Mexican | 427,871 | 29.8% |
| Mexican American Indian | 8,712 | 0.6% |
| Mongolian | 170 | 0.0% |
| Moroccan | 1,161 | 0.1% |
| Native Hawaiian | 3,224 | 0.2% |
| Navajo | 885 | 0.1% |
| Nepalese | 47 | 0.0% |
| New Zealander | 330 | 0.0% |
| Nicaraguan | 3,748 | 0.3% |
| Nigerian | 4,462 | 0.3% |
| Northern European | 1,742 | 0.1% |
| Norwegian | 7,843 | 0.5% |
| Okinawan | 138 | 0.0% |
| Osage | 69 | 0.0% |
| Ottawa | 16 | 0.0% |
| Paiute | 371 | 0.0% |
| Pakistani | 3,497 | 0.2% |
| Palestinian | 777 | 0.1% |
| Panamanian | 1,024 | 0.1% |
| Paraguayan | 84 | 0.0% |
| Pennsylvania German | 74 | 0.0% |
| Peruvian | 5,716 | 0.4% |
| Pima | 32 | 0.0% |
| Polish | 22,271 | 1.5% |
| Portuguese | 4,096 | 0.3% |
| Potawatomi | 65 | 0.0% |
| Pueblo | 256 | 0.0% |
| Puerto Rican | 7,879 | 0.5% |
| Romanian | 3,007 | 0.2% |
| Russian | 24,392 | 1.7% |
| Salvadoran | 45,473 | 3.2% |
| Samoan | 2,400 | 0.2% |
| Scandinavian | 2,203 | 0.2% |
| Scotch-Irish | 4,245 | 0.3% |
| Scottish | 11,481 | 0.8% |
| Seminole | 111 | 0.0% |
| Senegalese | 29 | 0.0% |
| Serbian | 990 | 0.1% |
| Shoshone | 69 | 0.0% |
| Sierra Leonean | 125 | 0.0% |
| Sioux | 360 | 0.0% |
| Slavic | 561 | 0.0% |
| Slovak | 1,089 | 0.1% |
| Slovene | 321 | 0.0% |
| South African | 591 | 0.0% |
| South American | 21,328 | 1.5% |
| South American Indian | 753 | 0.1% |
| Soviet Union | 19 | 0.0% |
| Spaniard | 6,117 | 0.4% |
| Spanish | 4,636 | 0.3% |
| Spanish American | 232 | 0.0% |
| Spanish American Indian | 20 | 0.0% |
| Sri Lankan | 11,201 | 0.8% |
| Subsaharan African | 19,701 | 1.4% |
| Sudanese | 117 | 0.0% |
| Swedish | 9,113 | 0.6% |
| Swiss | 2,659 | 0.2% |
| Syrian | 987 | 0.1% |
| Taiwanese | 151 | 0.0% |
| Thai | 20,785 | 1.5% |
| Tlingit-Haida | 5 | 0.0% |
| Tohono O'Odham | 37 | 0.0% |
| Tongan | 595 | 0.0% |
| Trinidadian and Tobagonian | 752 | 0.1% |
| Turkish | 1,577 | 0.1% |
| U.S. Virgin Islander | 22 | 0.0% |
| Ugandan | 134 | 0.0% |
| Ukrainian | 5,201 | 0.4% |
| Uruguayan | 409 | 0.0% |
| Ute | 37 | 0.0% |
| Venezuelan | 1,477 | 0.1% |
| Vietnamese | 631 | 0.0% |
| Welsh | 3,641 | 0.3% |
| West Indian | 428 | 0.0% |
| Yakama | 3 | 0.0% |
| Yaqui | 319 | 0.0% |
| Yugoslavian | 759 | 0.1% |
| Yuman | 190 | 0.0% |
| Zimbabwean | 38 | 0.0% | View All 191 Rows |
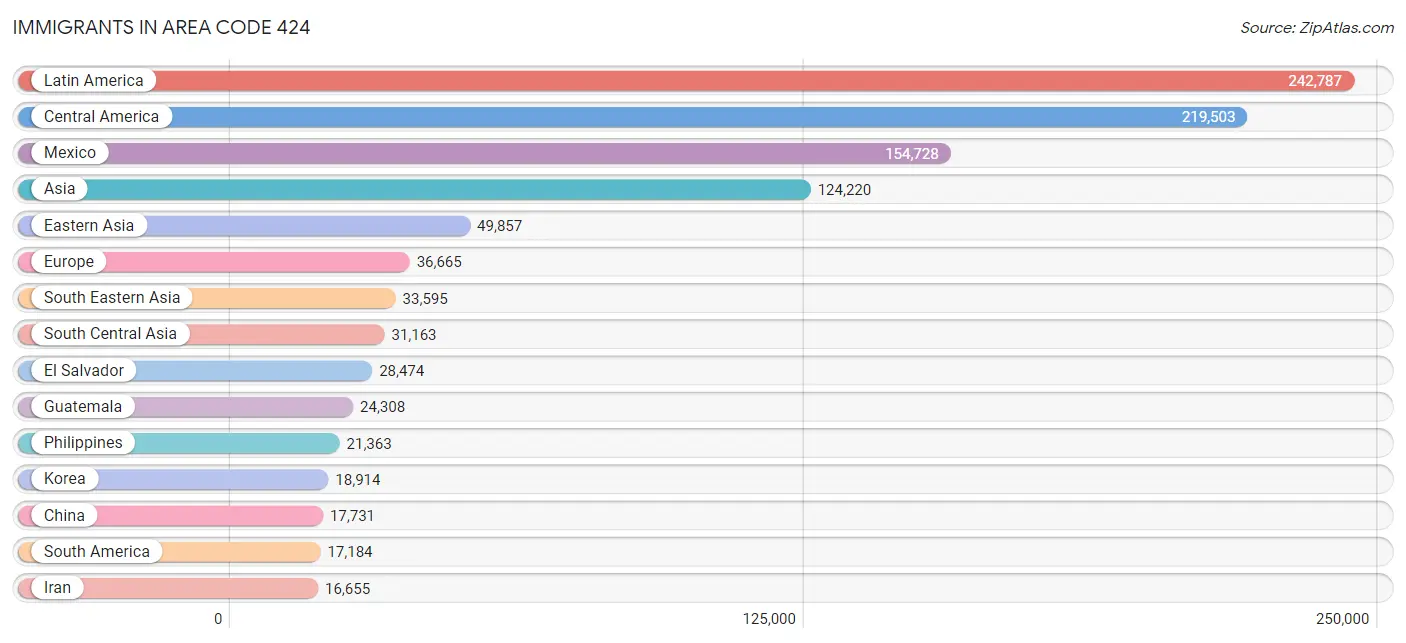
Immigrants in Area Code 424
The most numerous immigrant groups reported in Area Code 424 came from Latin America (242,787 | 16.9%), Central America (219,503 | 15.3%), Mexico (154,728 | 10.8%), Asia (124,220 | 8.7%), and Eastern Asia (49,857 | 3.5%), together accounting for 55.2% of all Area Code 424 residents.
| Immigration Origin | # Population | % Population |
| Afghanistan | 559 | 0.0% |
| Africa | 16,064 | 1.1% |
| Albania | 78 | 0.0% |
| Argentina | 2,527 | 0.2% |
| Armenia | 1,056 | 0.1% |
| Asia | 124,220 | 8.7% |
| Australia | 1,422 | 0.1% |
| Austria | 411 | 0.0% |
| Azores | 24 | 0.0% |
| Bahamas | 55 | 0.0% |
| Bangladesh | 685 | 0.1% |
| Barbados | 95 | 0.0% |
| Belarus | 778 | 0.1% |
| Belgium | 140 | 0.0% |
| Belize | 3,211 | 0.2% |
| Bolivia | 277 | 0.0% |
| Bosnia and Herzegovina | 75 | 0.0% |
| Brazil | 3,994 | 0.3% |
| Bulgaria | 546 | 0.0% |
| Cabo Verde | 8 | 0.0% |
| Cambodia | 752 | 0.1% |
| Cameroon | 256 | 0.0% |
| Canada | 6,012 | 0.4% |
| Caribbean | 6,100 | 0.4% |
| Central America | 219,503 | 15.3% |
| Chile | 611 | 0.0% |
| China | 17,731 | 1.2% |
| Colombia | 2,335 | 0.2% |
| Congo | 76 | 0.0% |
| Costa Rica | 537 | 0.0% |
| Croatia | 732 | 0.1% |
| Cuba | 2,230 | 0.2% |
| Czechoslovakia | 633 | 0.0% |
| Denmark | 357 | 0.0% |
| Dominican Republic | 234 | 0.0% |
| Eastern Africa | 4,335 | 0.3% |
| Eastern Asia | 49,857 | 3.5% |
| Eastern Europe | 15,040 | 1.1% |
| Ecuador | 1,570 | 0.1% |
| Egypt | 2,843 | 0.2% |
| El Salvador | 28,474 | 2.0% |
| England | 3,723 | 0.3% |
| Eritrea | 301 | 0.0% |
| Ethiopia | 2,477 | 0.2% |
| Europe | 36,665 | 2.6% |
| Fiji | 443 | 0.0% |
| France | 2,729 | 0.2% |
| Germany | 3,105 | 0.2% |
| Ghana | 463 | 0.0% |
| Greece | 528 | 0.0% |
| Grenada | 219 | 0.0% |
| Guatemala | 24,308 | 1.7% |
| Guyana | 327 | 0.0% |
| Haiti | 486 | 0.0% |
| Honduras | 5,126 | 0.4% |
| Hong Kong | 1,596 | 0.1% |
| Hungary | 713 | 0.1% |
| India | 10,265 | 0.7% |
| Indonesia | 1,467 | 0.1% |
| Iran | 16,655 | 1.2% |
| Iraq | 446 | 0.0% |
| Ireland | 752 | 0.1% |
| Israel | 3,306 | 0.2% |
| Italy | 2,267 | 0.2% |
| Jamaica | 2,032 | 0.1% |
| Japan | 13,023 | 0.9% |
| Jordan | 594 | 0.0% |
| Kazakhstan | 333 | 0.0% |
| Kenya | 655 | 0.1% |
| Korea | 18,914 | 1.3% |
| Kuwait | 222 | 0.0% |
| Laos | 136 | 0.0% |
| Latin America | 242,787 | 16.9% |
| Latvia | 90 | 0.0% |
| Lebanon | 1,492 | 0.1% |
| Liberia | 87 | 0.0% |
| Lithuania | 659 | 0.1% |
| Malaysia | 356 | 0.0% |
| Mexico | 154,728 | 10.8% |
| Middle Africa | 430 | 0.0% |
| Moldova | 223 | 0.0% |
| Morocco | 498 | 0.0% |
| Nepal | 368 | 0.0% |
| Netherlands | 763 | 0.1% |
| Nicaragua | 2,433 | 0.2% |
| Nigeria | 4,655 | 0.3% |
| North Macedonia | 13 | 0.0% |
| Northern Africa | 4,010 | 0.3% |
| Northern Europe | 10,213 | 0.7% |
| Norway | 164 | 0.0% |
| Oceania | 2,904 | 0.2% |
| Pakistan | 1,804 | 0.1% |
| Panama | 561 | 0.0% |
| Peru | 3,837 | 0.3% |
| Philippines | 21,363 | 1.5% |
| Poland | 1,333 | 0.1% |
| Portugal | 160 | 0.0% |
| Romania | 674 | 0.1% |
| Russia | 4,061 | 0.3% |
| Saudi Arabia | 203 | 0.0% |
| Scotland | 508 | 0.0% |
| Senegal | 57 | 0.0% |
| Serbia | 279 | 0.0% |
| Sierra Leone | 319 | 0.0% |
| Singapore | 482 | 0.0% |
| Somalia | 25 | 0.0% |
| South Africa | 1,146 | 0.1% |
| South America | 17,184 | 1.2% |
| South Central Asia | 31,163 | 2.2% |
| South Eastern Asia | 33,595 | 2.3% |
| Southern Europe | 3,648 | 0.3% |
| Spain | 693 | 0.1% |
| Sri Lanka | 379 | 0.0% |
| Sudan | 183 | 0.0% |
| Sweden | 788 | 0.1% |
| Switzerland | 456 | 0.0% |
| Syria | 219 | 0.0% |
| Taiwan | 4,281 | 0.3% |
| Thailand | 2,032 | 0.1% |
| Trinidad and Tobago | 565 | 0.0% |
| Turkey | 1,086 | 0.1% |
| Uganda | 380 | 0.0% |
| Ukraine | 3,172 | 0.2% |
| Uruguay | 354 | 0.0% |
| Uzbekistan | 45 | 0.0% |
| Venezuela | 1,197 | 0.1% |
| Vietnam | 6,213 | 0.4% |
| West Indies | 59 | 0.0% |
| Western Africa | 5,823 | 0.4% |
| Western Asia | 9,412 | 0.7% |
| Western Europe | 7,626 | 0.5% |
| Yemen | 7 | 0.0% |
| Zaire | 98 | 0.0% |
| Zimbabwe | 87 | 0.0% | View All 134 Rows |
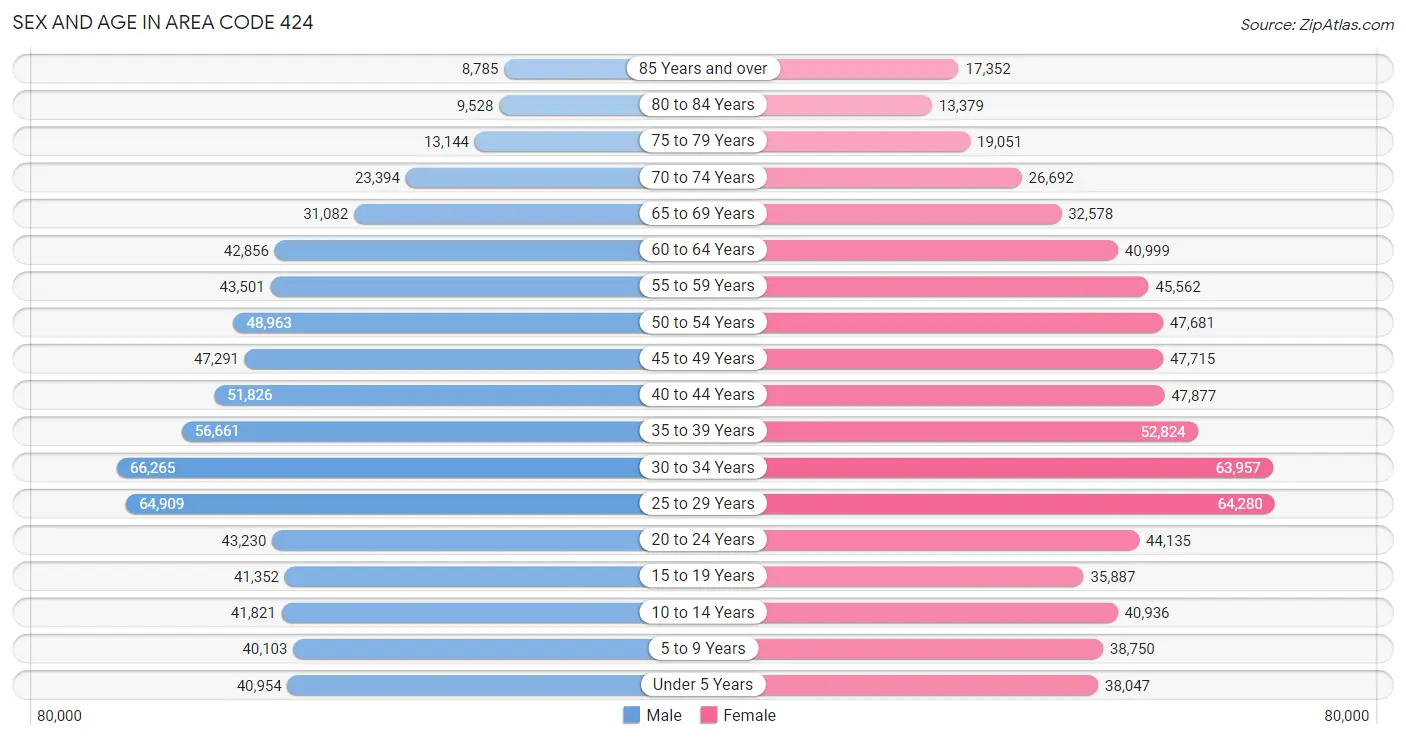
Sex and Age in Area Code 424
Sex and Age in Area Code 424
The most populous age groups in Area Code 424 are 30 to 34 Years (66,265 | 9.3%) for men and 25 to 29 Years (64,280 | 9.0%) for women.
| Age Bracket | Male | Female |
| Under 5 Years | 40,954 (5.7%) | 38,047 (5.3%) |
| 5 to 9 Years | 40,103 (5.6%) | 38,750 (5.4%) |
| 10 to 14 Years | 41,821 (5.8%) | 40,936 (5.7%) |
| 15 to 19 Years | 41,352 (5.8%) | 35,887 (5.0%) |
| 20 to 24 Years | 43,230 (6.0%) | 44,135 (6.1%) |
| 25 to 29 Years | 64,909 (9.1%) | 64,280 (9.0%) |
| 30 to 34 Years | 66,265 (9.3%) | 63,957 (8.9%) |
| 35 to 39 Years | 56,661 (7.9%) | 52,824 (7.4%) |
| 40 to 44 Years | 51,826 (7.2%) | 47,877 (6.7%) |
| 45 to 49 Years | 47,291 (6.6%) | 47,715 (6.7%) |
| 50 to 54 Years | 48,963 (6.8%) | 47,681 (6.6%) |
| 55 to 59 Years | 43,501 (6.1%) | 45,562 (6.4%) |
| 60 to 64 Years | 42,856 (6.0%) | 40,999 (5.7%) |
| 65 to 69 Years | 31,082 (4.3%) | 32,578 (4.5%) |
| 70 to 74 Years | 23,394 (3.3%) | 26,692 (3.7%) |
| 75 to 79 Years | 13,144 (1.8%) | 19,051 (2.6%) |
| 80 to 84 Years | 9,528 (1.3%) | 13,379 (1.9%) |
| 85 Years and over | 8,785 (1.2%) | 17,352 (2.4%) |
| Total | 715,665 (100.0%) | 717,702 (100.0%) |
Families and Households in Area Code 424
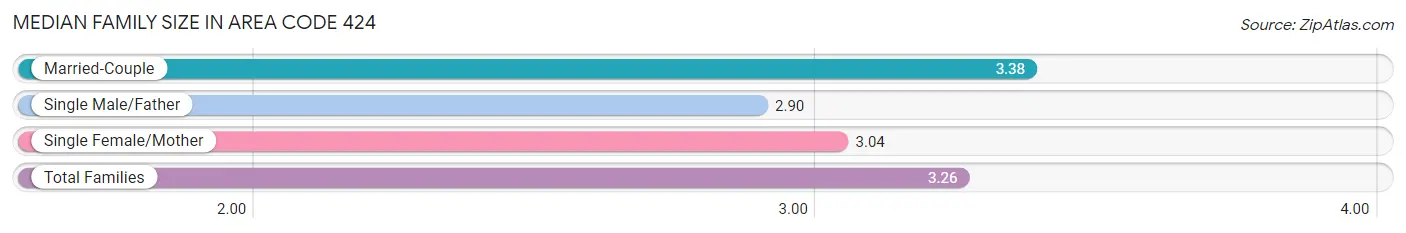
Median Family Size in Area Code 424
The median family size in Area Code 424 is 3.25 persons per family, with married-couple families (209,465 | 67.0%) accounting for the largest median family size of 3.37545 persons per family. On the other hand, single male/father families (33,159 | 10.6%) represent the smallest median family size with 2.90 persons per family.
| Family Type | # Families | Family Size |
| Married-Couple | 209,465 (67.0%) | 3.38 |
| Single Male/Father | 33,159 (10.6%) | 2.90 |
| Single Female/Mother | 70,009 (22.4%) | 3.04 |
| Total Families | 312,633 (100.0%) | 3.25 |
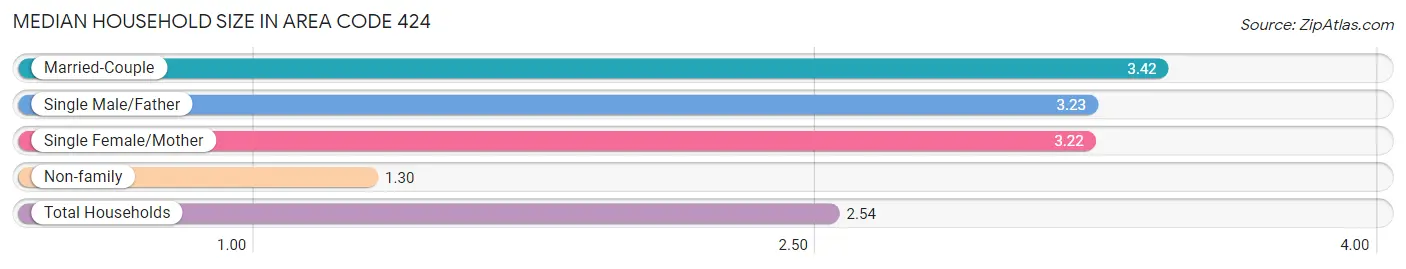
Median Household Size in Area Code 424
The median household size in Area Code 424 is 2.54 persons per household, with married-couple households (209,465 | 37.9%) accounting for the largest median household size of 3.41545 persons per household. non-family households (239,997 | 43.4%) represent the smallest median household size with 1.30 persons per household.
| Household Type | # Households | Household Size |
| Married-Couple | 209,465 (37.9%) | 3.42 |
| Single Male/Father | 33,159 (6.0%) | 3.23 |
| Single Female/Mother | 70,009 (12.7%) | 3.22 |
| Non-family | 239,997 (43.4%) | 1.30 |
| Total Households | 552,630 (100.0%) | 2.54 |
Household Size by Marriage Status in Area Code 424
Out of a total of 552,630 households in Area Code 424, 312,633 (56.6%) are family households, while 239,997 (43.4%) are nonfamily households. The most numerous type of family households are 2-person households, comprising 118,287, and the most common type of nonfamily households are 1-person households, comprising 184,430.
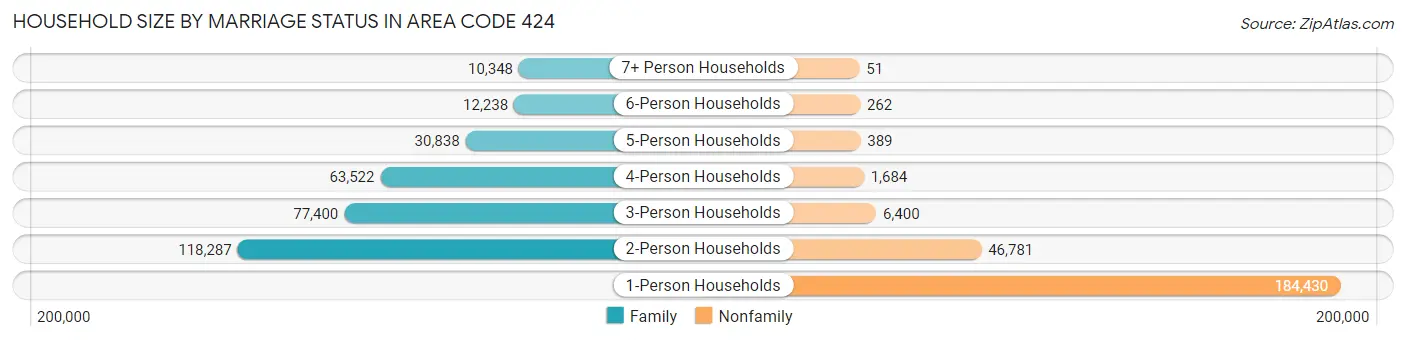
| Household Size | Family Households | Nonfamily Households |
| 1-Person Households | - | 184,430 (33.4%) |
| 2-Person Households | 118,287 (21.4%) | 46,781 (8.5%) |
| 3-Person Households | 77,400 (14.0%) | 6,400 (1.2%) |
| 4-Person Households | 63,522 (11.5%) | 1,684 (0.3%) |
| 5-Person Households | 30,838 (5.6%) | 389 (0.1%) |
| 6-Person Households | 12,238 (2.2%) | 262 (0.1%) |
| 7+ Person Households | 10,348 (1.9%) | 51 (0.0%) |
| Total | 312,633 (56.6%) | 239,997 (43.4%) |
Female Fertility in Area Code 424
Fertility by Age in Area Code 424
Average fertility rate in Area Code 424 is 44.4 births per 1,000 women. Women in the age bracket of 20 to 34 years have the highest fertility rate with 58.4 births per 1,000 women. Women in the age bracket of 20 to 34 years acount for 61.4% of all women with births.
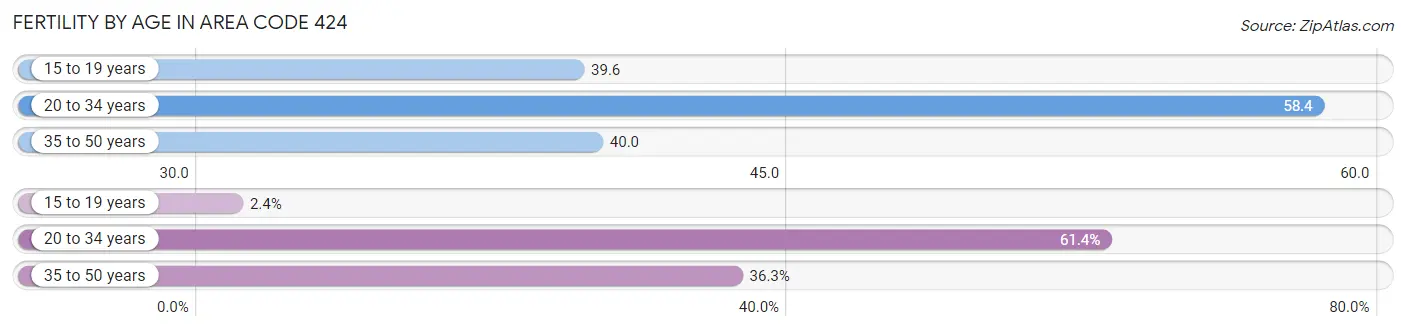
| Age Bracket | Women with Births | Births / 1,000 Women |
| 15 to 19 years | 410 (2.4%) | 39.6 |
| 20 to 34 years | 10,606 (61.4%) | 58.4 |
| 35 to 50 years | 6,271 (36.3%) | 40.0 |
| Total | 17,287 (100.0%) | 44.4 |
Fertility by Age by Marriage Status in Area Code 424
64.8% of women with births (17,287) in Area Code 424 are married. The highest percentage of unmarried women with births falls into 15 to 19 years age bracket with 100.0% of them unmarried at the time of birth, while the lowest percentage of unmarried women with births belong to 35 to 50 years age bracket with 30.8% of them unmarried.
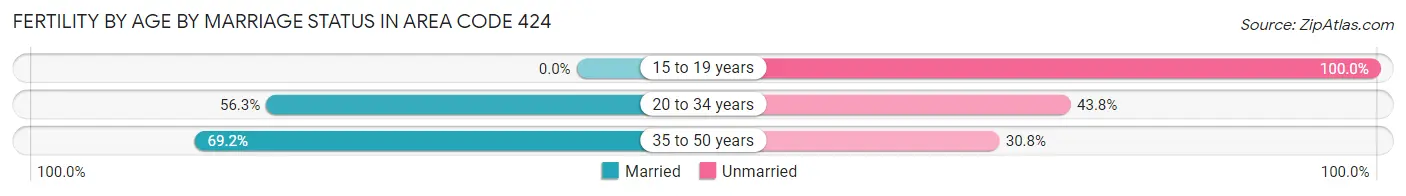
| Age Bracket | Married | Unmarried |
| 15 to 19 years | 0 (0.0%) | 410 (100.0%) |
| 20 to 34 years | 5,966 (56.2%) | 4,640 (43.8%) |
| 35 to 50 years | 4,338 (69.2%) | 1,933 (30.8%) |
| Total | 11,210 (64.8%) | 6,077 (35.1%) |
Fertility by Education in Area Code 424
Average fertility rate in Area Code 424 is 44.4 births per 1,000 women. Women with the education attainment of graduate degree have the highest fertility rate of 69.9 births per 1,000 women, while women with the education attainment of bachelor's degree have the lowest fertility at 43.5 births per 1,000 women. Women with the education attainment of college or associate's degree represent 24.9% of all women with births.
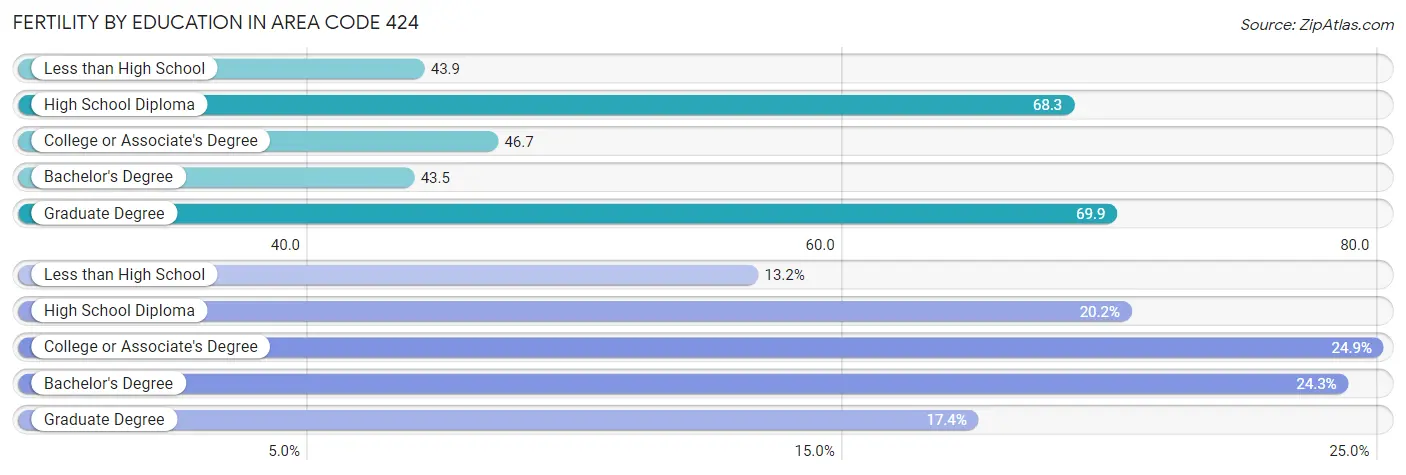
| Educational Attainment | Women with Births | Births / 1,000 Women |
| Less than High School | 2,283 (13.2%) | 43.9 |
| High School Diploma | 3,495 (20.2%) | 68.3 |
| College or Associate's Degree | 4,312 (24.9%) | 46.7 |
| Bachelor's Degree | 4,197 (24.3%) | 43.5 |
| Graduate Degree | 3,000 (17.3%) | 69.9 |
| Total | 17,287 (100.0%) | 44.4 |
Fertility by Education by Marriage Status in Area Code 424
35.1% of women with births in Area Code 424 are unmarried. Women with the educational attainment of graduate degree are most likely to be married with 63.9% of them married at childbirth, while women with the educational attainment of less than high school are least likely to be married with 64.6% of them unmarried at childbirth.
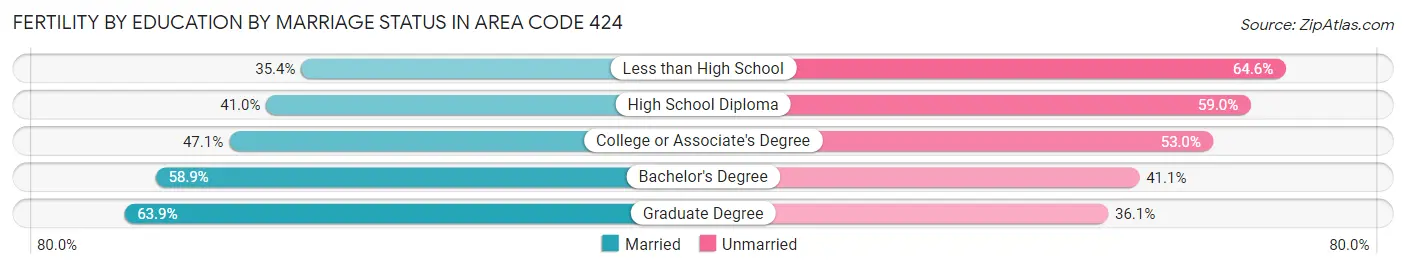
| Educational Attainment | Married | Unmarried |
| Less than High School | 808 (35.4%) | 1,475 (64.6%) |
| High School Diploma | 1,434 (41.0%) | 2,061 (59.0%) |
| College or Associate's Degree | 2,029 (47.0%) | 2,283 (52.9%) |
| Bachelor's Degree | 2,472 (58.9%) | 1,725 (41.1%) |
| Graduate Degree | 1,918 (63.9%) | 1,082 (36.1%) |
| Total | 11,210 (64.8%) | 6,077 (35.1%) |
Employment Characteristics in Area Code 424
Employment by Class of Employer in Area Code 424
Among the 722,699 employed individuals in Area Code 424, private company employees (486,455 | 67.3%), self-employed (not incorporated) (65,992 | 9.1%), and not-for-profit organizations (50,554 | 7.0%) make up the most common classes of employment.
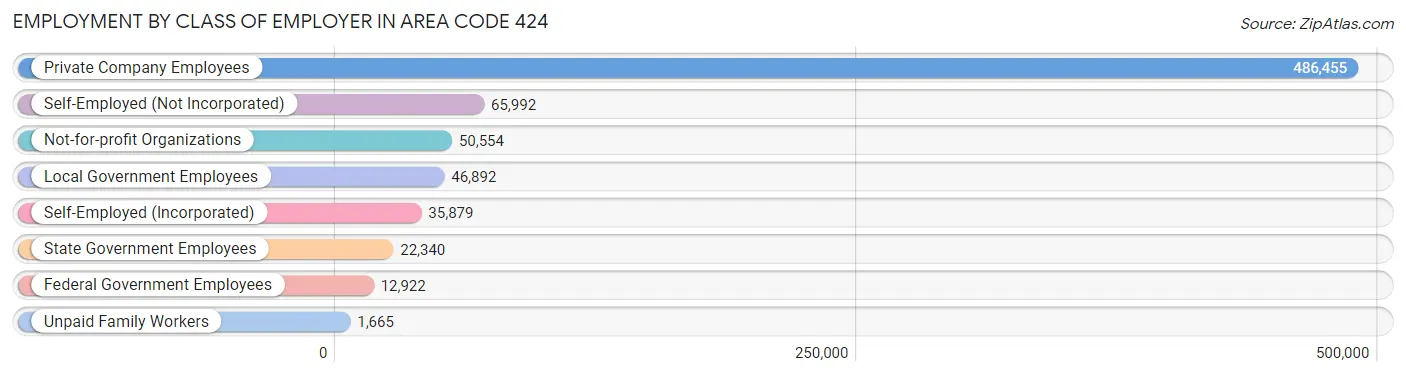
| Employer Class | # Employees | % Employees |
| Private Company Employees | 486,455 | 67.3% |
| Self-Employed (Incorporated) | 35,879 | 5.0% |
| Self-Employed (Not Incorporated) | 65,992 | 9.1% |
| Not-for-profit Organizations | 50,554 | 7.0% |
| Local Government Employees | 46,892 | 6.5% |
| State Government Employees | 22,340 | 3.1% |
| Federal Government Employees | 12,922 | 1.8% |
| Unpaid Family Workers | 1,665 | 0.2% |
| Total | 722,699 | 100.0% |
Employment Status by Age in Area Code 424
According to the labor force statistics for Area Code 424, out of the total population over 16 years of age (1,176,858), 66.3% or 780,728 individuals are in the labor force, with 7.9% or 61,678 of them unemployed. The age group with the highest labor force participation rate is 30 to 34 years, with 86.8% or 112,994 individuals in the labor force. Within the labor force, the 16 to 19 years age range has the highest percentage of unemployed individuals, with 997.3% or 153,245 of them being unemployed.
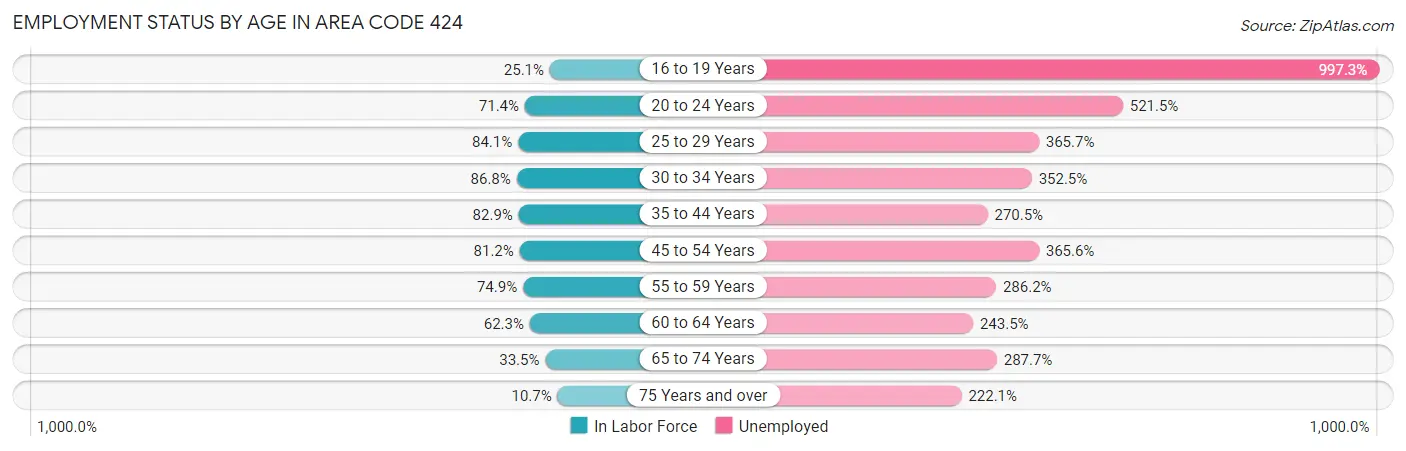
| Age Bracket | In Labor Force | Unemployed |
| 16 to 19 Years | 15,363 (25.1%) | 153,245 (997.3%) |
| 20 to 24 Years | 62,394 (71.4%) | 325,395 (521.5%) |
| 25 to 29 Years | 108,685 (84.1%) | 397,468 (365.7%) |
| 30 to 34 Years | 112,999 (86.8%) | 398,304 (352.5%) |
| 35 to 44 Years | 173,505 (82.9%) | 469,320 (270.5%) |
| 45 to 54 Years | 155,645 (81.2%) | 569,016 (365.6%) |
| 55 to 59 Years | 66,710 (74.9%) | 190,918 (286.2%) |
| 60 to 64 Years | 52,242 (62.3%) | 127,209 (243.5%) |
| 65 to 74 Years | 38,074 (33.5%) | 109,530 (287.7%) |
| 75 Years and over | 8,700 (10.7%) | 19,325 (222.1%) |
| Total | 780,717 (66.3%) | 61,711 (7.9%) |
Employment Status by Educational Attainment in Area Code 424
According to labor force statistics for Area Code 424, 79.3% of individuals (660,535) out of the total population between 25 and 64 years of age (833,167) are in the labor force, with 325.0% or 2,146,739 of them being unemployed. The group with the highest labor force participation rate are those with the educational attainment of bachelor's degree or higher, with 86.1% or 311,298 individuals in the labor force. Within the labor force, individuals with less than high school education have the highest percentage of unemployment, with 531.7% or 432,565 of them being unemployed.
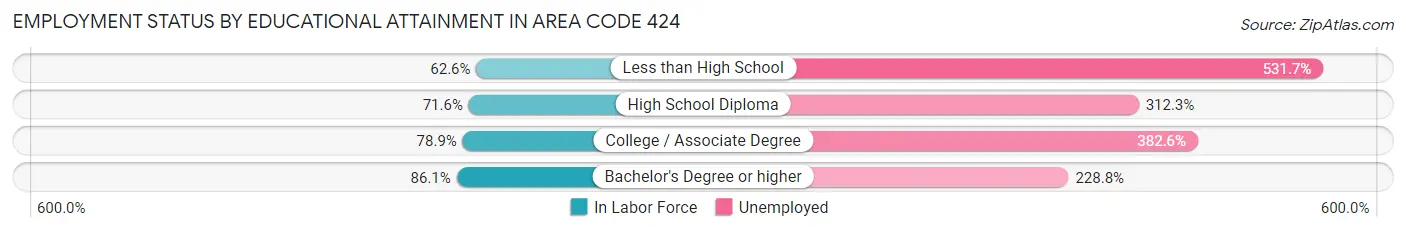
| Educational Attainment | In Labor Force | Unemployed |
| Less than High School | 81,351 (62.6%) | 691,109 (531.7%) |
| High School Diploma | 102,364 (71.6%) | 446,230 (312.3%) |
| College / Associate Degree | 156,591 (78.9%) | 759,763 (382.6%) |
| Bachelor's Degree or higher | 311,306 (86.1%) | 827,620 (228.8%) |
| Total | 660,502 (79.3%) | 2,707,793 (325.0%) |
Employment Occupations by Sex in Area Code 424
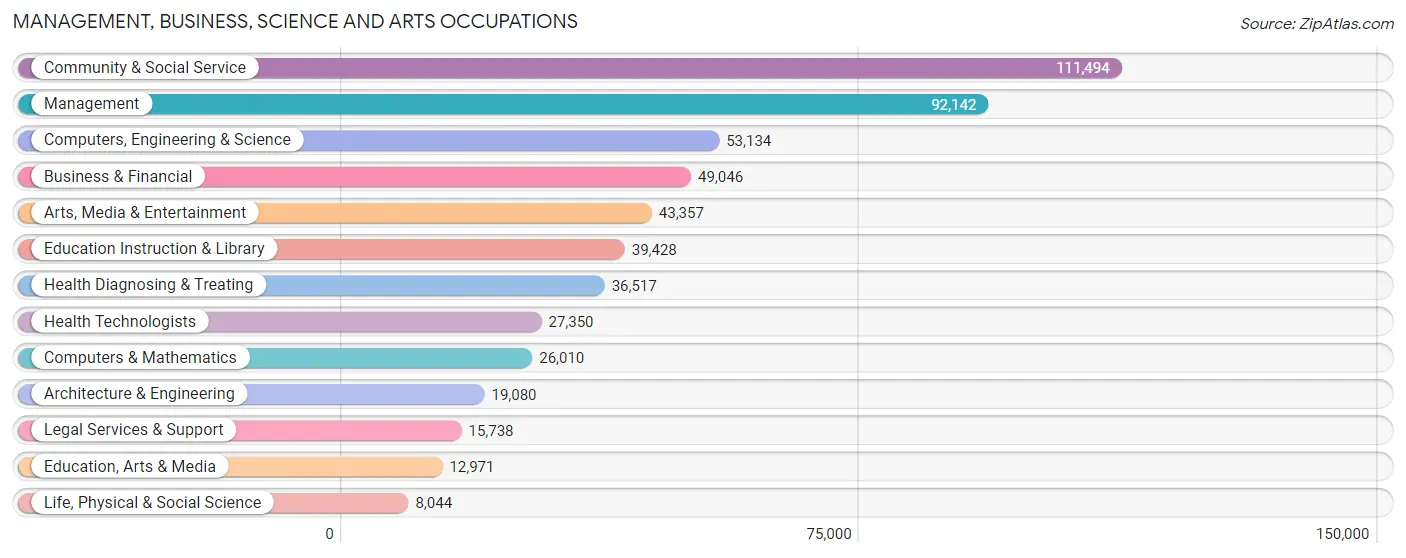
Management, Business, Science and Arts Occupations
The most common Management, Business, Science and Arts occupations in Area Code 424 are Community & Social Service (111,494 | 15.0%), Management (92,142 | 12.4%), Computers, Engineering & Science (53,134 | 7.2%), Business & Financial (49,046 | 6.6%), and Arts, Media & Entertainment (43,357 | 5.8%).
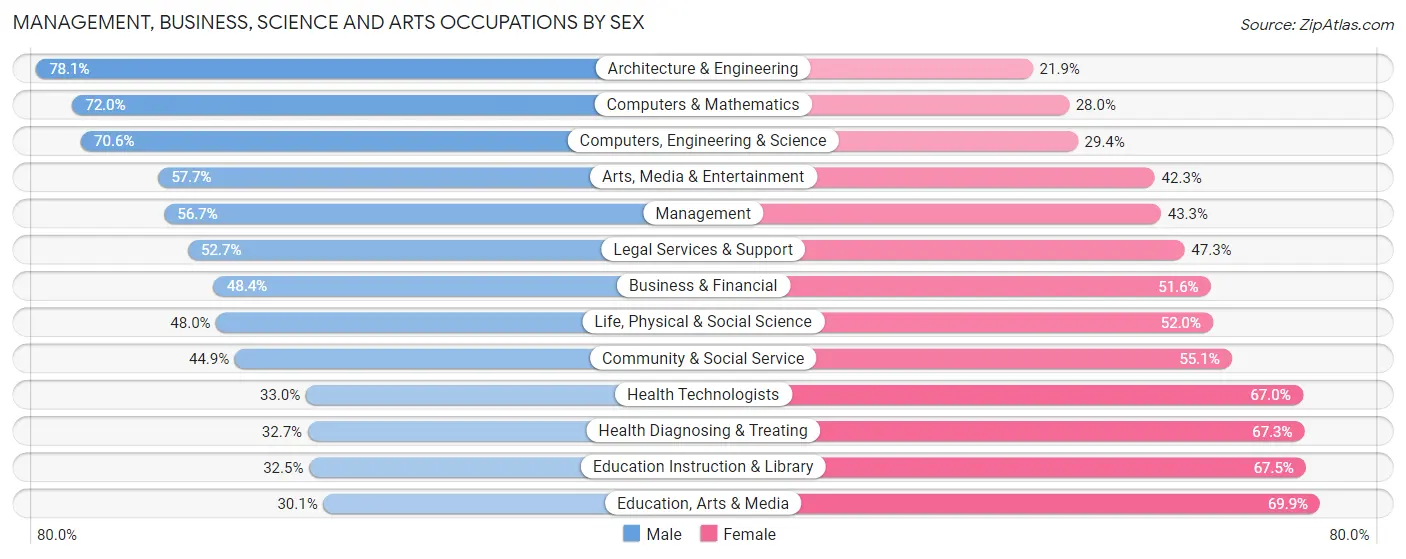
Management, Business, Science and Arts Occupations by Sex
Within the Management, Business, Science and Arts occupations in Area Code 424, the most male-oriented occupations are Architecture & Engineering (78.1%), Computers & Mathematics (72.0%), and Computers, Engineering & Science (70.6%), while the most female-oriented occupations are Education, Arts & Media (69.9%), Education Instruction & Library (67.5%), and Health Diagnosing & Treating (67.3%).
| Occupation | Male | Female |
| Management | 52,220 (56.7%) | 39,922 (43.3%) |
| Business & Financial | 23,740 (48.4%) | 25,306 (51.6%) |
| Computers, Engineering & Science | 37,491 (70.6%) | 15,643 (29.4%) |
| Computers & Mathematics | 18,738 (72.0%) | 7,272 (28.0%) |
| Architecture & Engineering | 14,893 (78.1%) | 4,187 (21.9%) |
| Life, Physical & Social Science | 3,860 (48.0%) | 4,184 (52.0%) |
| Community & Social Service | 50,034 (44.9%) | 61,460 (55.1%) |
| Education, Arts & Media | 3,907 (30.1%) | 9,064 (69.9%) |
| Legal Services & Support | 8,298 (52.7%) | 7,440 (47.3%) |
| Education Instruction & Library | 12,814 (32.5%) | 26,614 (67.5%) |
| Arts, Media & Entertainment | 25,015 (57.7%) | 18,342 (42.3%) |
| Health Diagnosing & Treating | 11,947 (32.7%) | 24,570 (67.3%) |
| Health Technologists | 9,033 (33.0%) | 18,317 (67.0%) |
| Total (Category) | 175,432 (51.2%) | 166,901 (48.7%) |
| Total (Overall) | 398,236 (53.7%) | 343,757 (46.3%) |
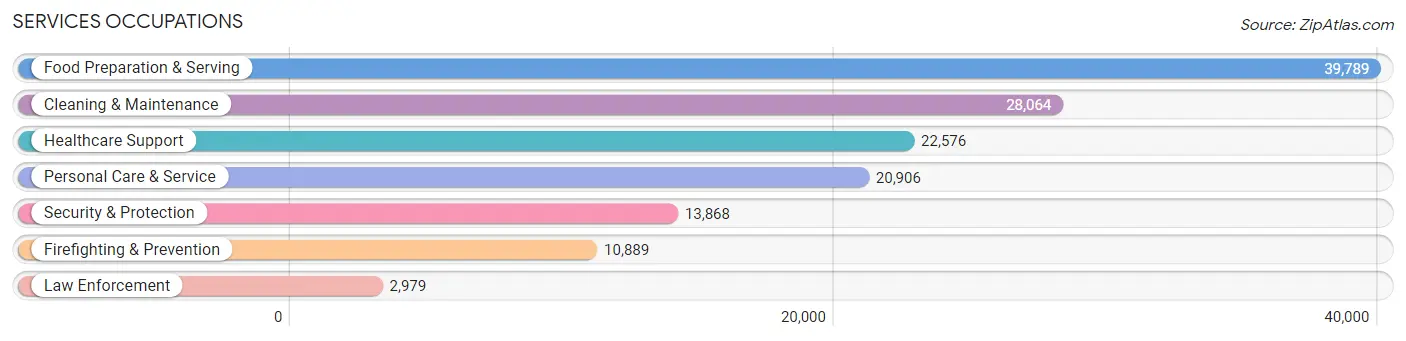
Services Occupations
The most common Services occupations in Area Code 424 are Food Preparation & Serving (39,789 | 5.4%), Cleaning & Maintenance (28,064 | 3.8%), Healthcare Support (22,576 | 3.0%), Personal Care & Service (20,906 | 2.8%), and Security & Protection (13,868 | 1.9%).
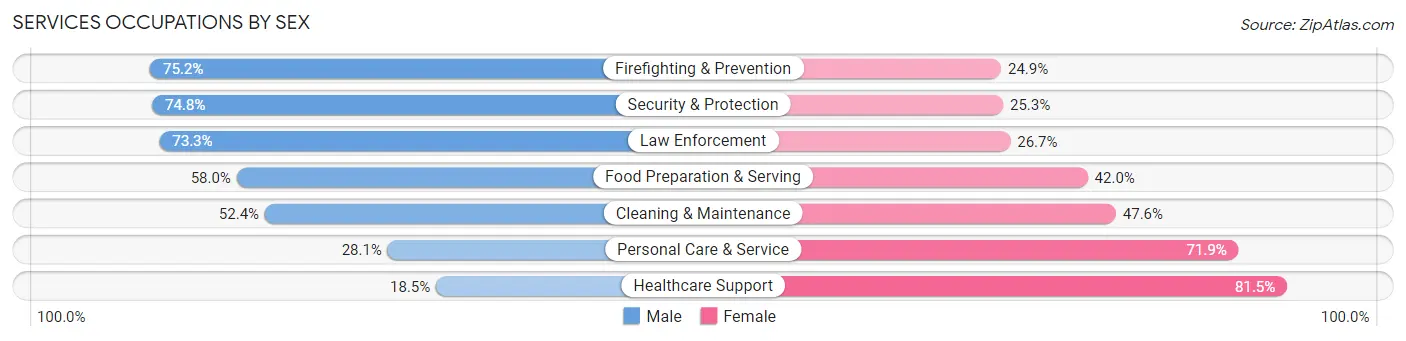
Services Occupations by Sex
Within the Services occupations in Area Code 424, the most male-oriented occupations are Firefighting & Prevention (75.1%), Security & Protection (74.8%), and Law Enforcement (73.3%), while the most female-oriented occupations are Healthcare Support (81.5%), Personal Care & Service (71.9%), and Cleaning & Maintenance (47.6%).
| Occupation | Male | Female |
| Healthcare Support | 4,179 (18.5%) | 18,397 (81.5%) |
| Security & Protection | 10,367 (74.8%) | 3,501 (25.3%) |
| Firefighting & Prevention | 8,183 (75.1%) | 2,706 (24.8%) |
| Law Enforcement | 2,184 (73.3%) | 795 (26.7%) |
| Food Preparation & Serving | 23,077 (58.0%) | 16,712 (42.0%) |
| Cleaning & Maintenance | 14,709 (52.4%) | 13,355 (47.6%) |
| Personal Care & Service | 5,874 (28.1%) | 15,032 (71.9%) |
| Total (Category) | 58,206 (46.5%) | 66,997 (53.5%) |
| Total (Overall) | 398,236 (53.7%) | 343,757 (46.3%) |
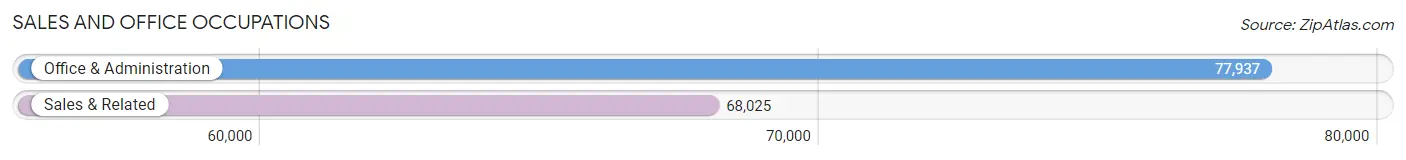
Sales and Office Occupations
The most common Sales and Office occupations in Area Code 424 are Office & Administration (77,937 | 10.5%), and Sales & Related (68,025 | 9.2%).
Sales and Office Occupations by Sex
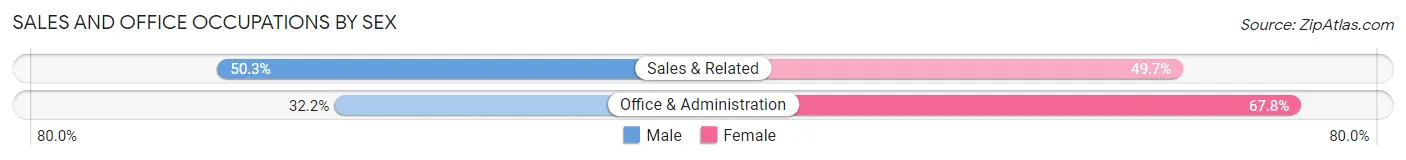
| Occupation | Male | Female |
| Sales & Related | 34,245 (50.3%) | 33,780 (49.7%) |
| Office & Administration | 25,130 (32.2%) | 52,807 (67.8%) |
| Total (Category) | 59,375 (40.7%) | 86,587 (59.3%) |
| Total (Overall) | 398,236 (53.7%) | 343,757 (46.3%) |
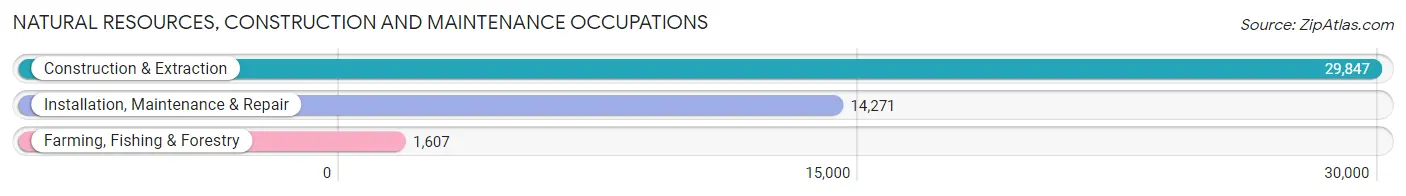
Natural Resources, Construction and Maintenance Occupations
The most common Natural Resources, Construction and Maintenance occupations in Area Code 424 are Construction & Extraction (29,847 | 4.0%), Installation, Maintenance & Repair (14,271 | 1.9%), and Farming, Fishing & Forestry (1,607 | 0.2%).
Natural Resources, Construction and Maintenance Occupations by Sex
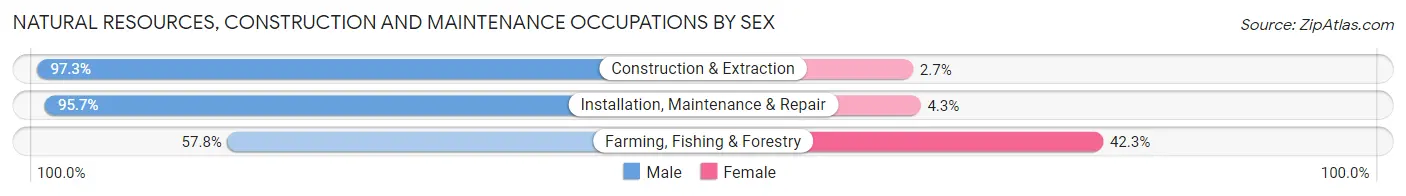
| Occupation | Male | Female |
| Farming, Fishing & Forestry | 928 (57.8%) | 679 (42.2%) |
| Construction & Extraction | 29,041 (97.3%) | 806 (2.7%) |
| Installation, Maintenance & Repair | 13,661 (95.7%) | 610 (4.3%) |
| Total (Category) | 43,630 (95.4%) | 2,095 (4.6%) |
| Total (Overall) | 398,236 (53.7%) | 343,757 (46.3%) |
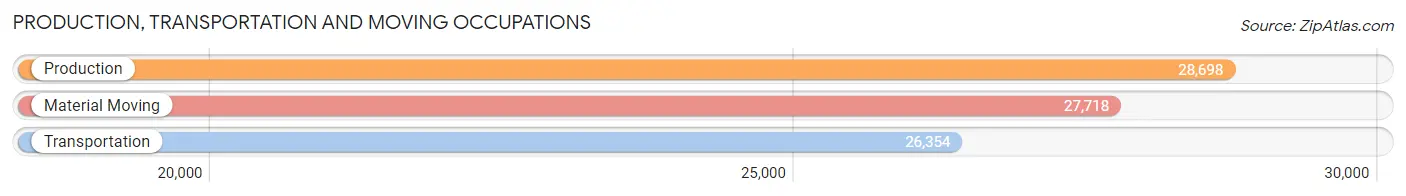
Production, Transportation and Moving Occupations
The most common Production, Transportation and Moving occupations in Area Code 424 are Production (28,698 | 3.9%), Material Moving (27,718 | 3.7%), and Transportation (26,354 | 3.5%).
Production, Transportation and Moving Occupations by Sex
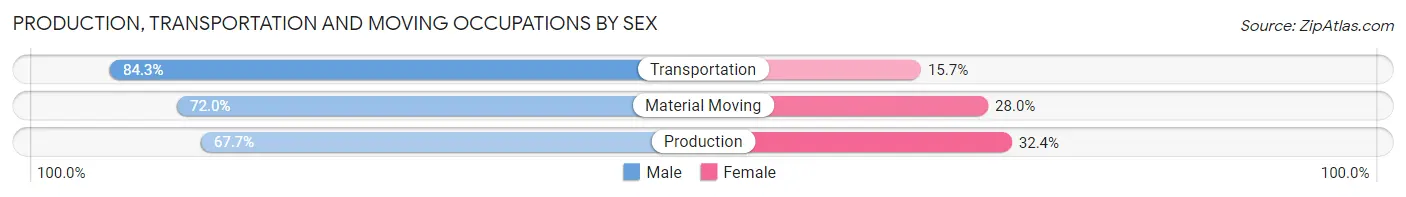
| Occupation | Male | Female |
| Production | 19,413 (67.6%) | 9,285 (32.4%) |
| Transportation | 22,222 (84.3%) | 4,132 (15.7%) |
| Material Moving | 19,958 (72.0%) | 7,760 (28.0%) |
| Total (Category) | 61,593 (74.4%) | 21,177 (25.6%) |
| Total (Overall) | 398,236 (53.7%) | 343,757 (46.3%) |
Employment Industries by Sex in Area Code 424
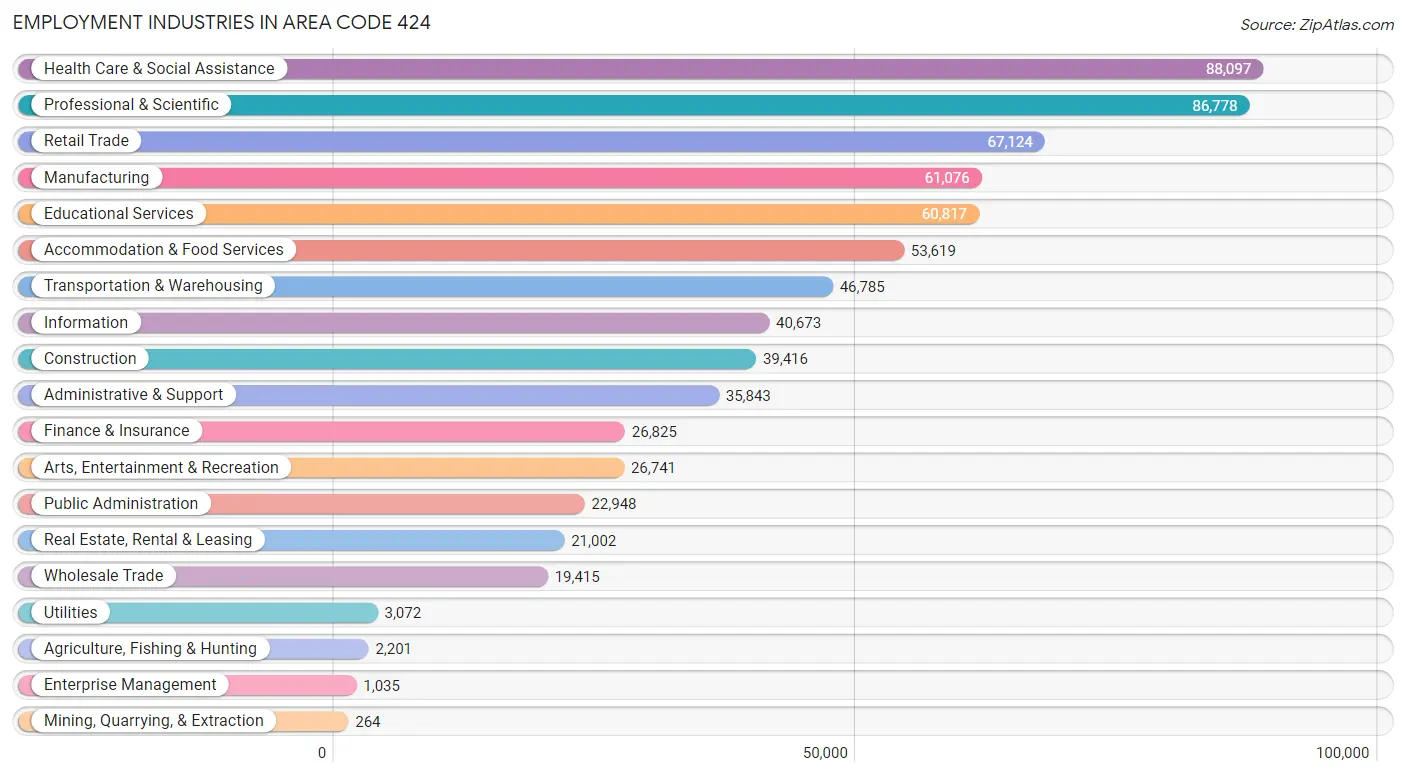
Employment Industries in Area Code 424
The major employment industries in Area Code 424 include Health Care & Social Assistance (88,097 | 11.9%), Professional & Scientific (86,778 | 11.7%), Retail Trade (67,124 | 9.0%), Manufacturing (61,076 | 8.2%), and Educational Services (60,817 | 8.2%).
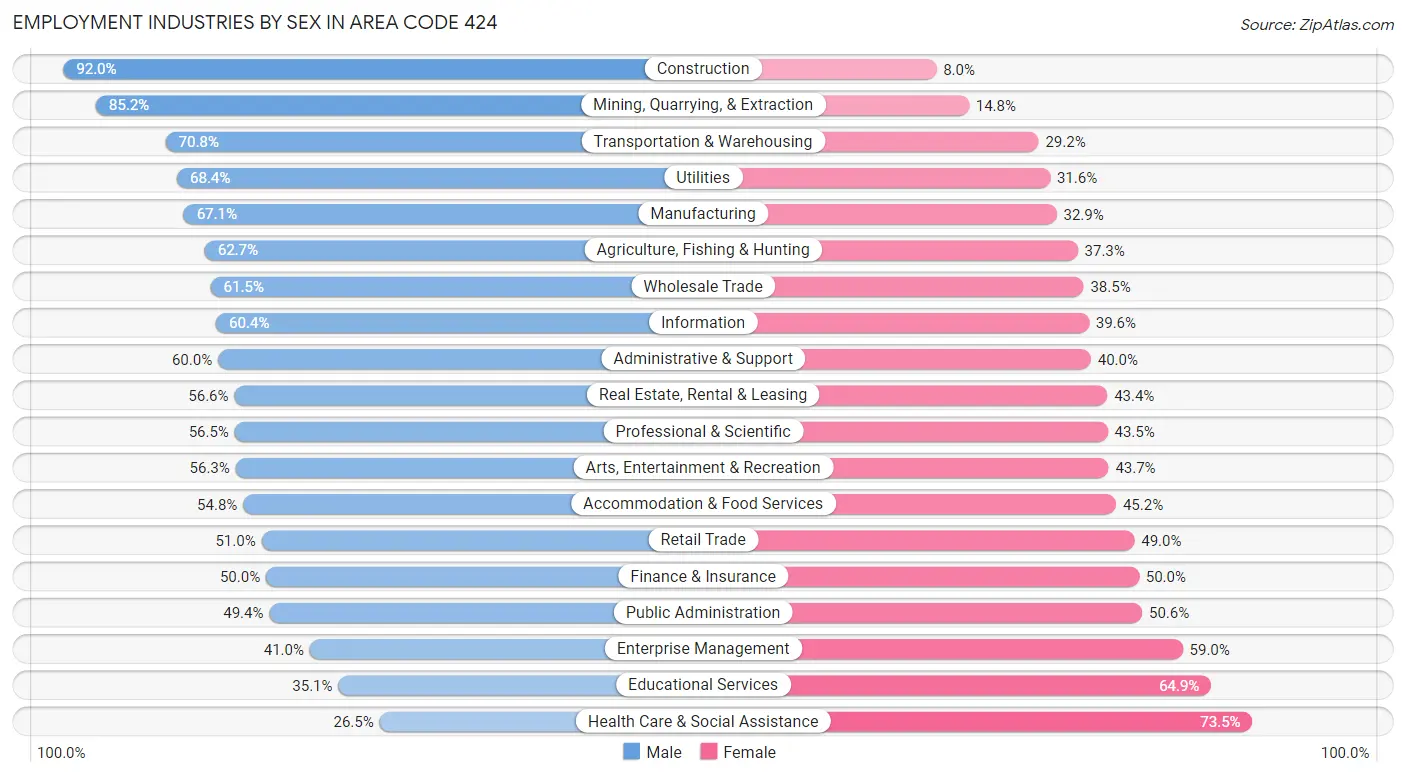
Employment Industries by Sex in Area Code 424
The Area Code 424 industries that see more men than women are Construction (92.0%), Mining, Quarrying, & Extraction (85.2%), and Transportation & Warehousing (70.8%), whereas the industries that tend to have a higher number of women are Health Care & Social Assistance (73.5%), Educational Services (64.9%), and Enterprise Management (59.0%).
| Industry | Male | Female |
| Agriculture, Fishing & Hunting | 1,380 (62.7%) | 821 (37.3%) |
| Mining, Quarrying, & Extraction | 225 (85.2%) | 39 (14.8%) |
| Construction | 36,252 (92.0%) | 3,164 (8.0%) |
| Manufacturing | 40,959 (67.1%) | 20,117 (32.9%) |
| Wholesale Trade | 11,938 (61.5%) | 7,477 (38.5%) |
| Retail Trade | 34,215 (51.0%) | 32,909 (49.0%) |
| Transportation & Warehousing | 33,123 (70.8%) | 13,662 (29.2%) |
| Utilities | 2,102 (68.4%) | 970 (31.6%) |
| Information | 24,553 (60.4%) | 16,120 (39.6%) |
| Finance & Insurance | 13,422 (50.0%) | 13,403 (50.0%) |
| Real Estate, Rental & Leasing | 11,883 (56.6%) | 9,119 (43.4%) |
| Professional & Scientific | 49,035 (56.5%) | 37,743 (43.5%) |
| Enterprise Management | 424 (41.0%) | 611 (59.0%) |
| Administrative & Support | 21,495 (60.0%) | 14,348 (40.0%) |
| Educational Services | 21,324 (35.1%) | 39,493 (64.9%) |
| Health Care & Social Assistance | 23,370 (26.5%) | 64,727 (73.5%) |
| Arts, Entertainment & Recreation | 15,060 (56.3%) | 11,681 (43.7%) |
| Accommodation & Food Services | 29,360 (54.8%) | 24,259 (45.2%) |
| Public Administration | 11,326 (49.4%) | 11,622 (50.6%) |
| Total | 398,236 (53.7%) | 343,757 (46.3%) |
Education in Area Code 424
School Enrollment in Area Code 424
The most common levels of schooling among the 330,479 students in Area Code 424 are college / undergraduate (76,437 | 23.1%), high school (66,878 | 20.2%), and elementary school (62,349 | 18.9%).
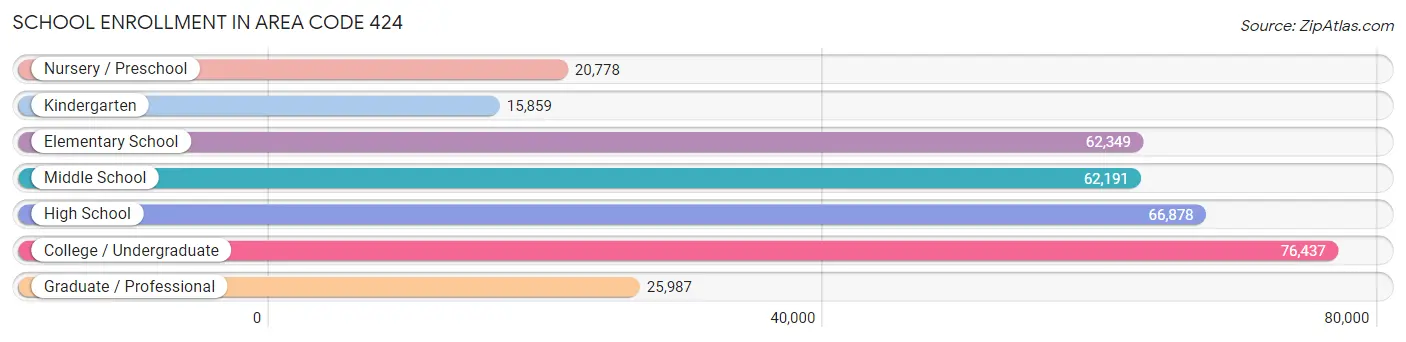
| School Level | # Students | % Students |
| Nursery / Preschool | 20,778 | 6.3% |
| Kindergarten | 15,859 | 4.8% |
| Elementary School | 62,349 | 18.9% |
| Middle School | 62,191 | 18.8% |
| High School | 66,878 | 20.2% |
| College / Undergraduate | 76,437 | 23.1% |
| Graduate / Professional | 25,987 | 7.9% |
| Total | 330,479 | 100.0% |
School Enrollment by Age by Funding Source in Area Code 424
Out of a total of 330,479 students who are enrolled in schools in Area Code 424, 58,565 (17.7%) attend a private institution, while the remaining 271,914 (82.3%) are enrolled in public schools. The age group of 3 to 4 year olds has the highest likelihood of being enrolled in private schools, with 9,278 (52.8% in the age bracket) enrolled. Conversely, the age group of 15 to 17 year olds has the lowest likelihood of being enrolled in a private school, with 41,265 (89.3% in the age bracket) attending a public institution.
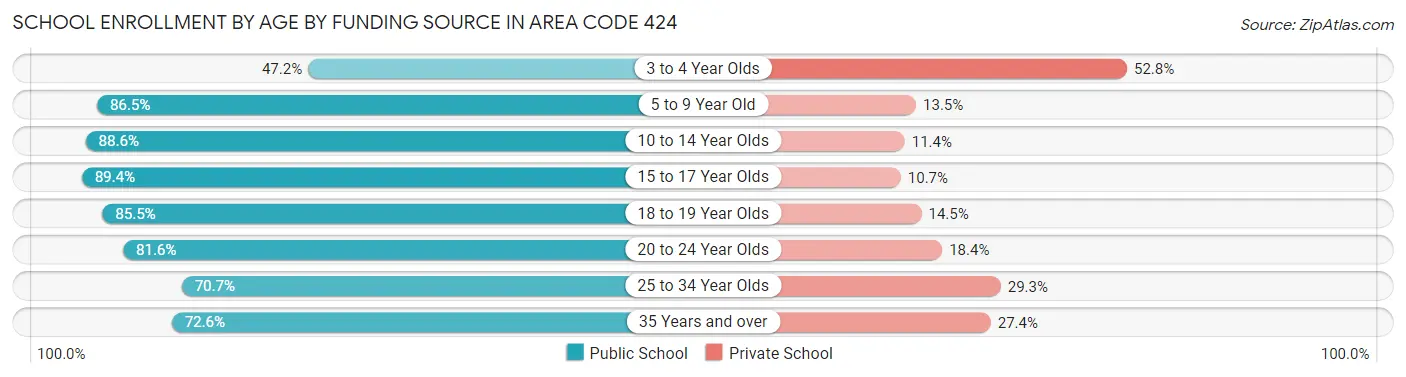
| Age Bracket | Public School | Private School |
| 3 to 4 Year Olds | 8,299 (47.2%) | 9,278 (52.8%) |
| 5 to 9 Year Old | 64,148 (86.5%) | 10,007 (13.5%) |
| 10 to 14 Year Olds | 71,556 (88.6%) | 9,185 (11.4%) |
| 15 to 17 Year Olds | 41,265 (89.3%) | 4,917 (10.6%) |
| 18 to 19 Year Olds | 19,125 (85.5%) | 3,244 (14.5%) |
| 20 to 24 Year Olds | 28,738 (81.6%) | 6,463 (18.4%) |
| 25 to 34 Year Olds | 22,727 (70.7%) | 9,403 (29.3%) |
| 35 Years and over | 16,059 (72.6%) | 6,065 (27.4%) |
| Total | 271,914 (82.3%) | 58,565 (17.7%) |
Educational Attainment by Field of Study in Area Code 424
Business (84,185 | 18.1%), social sciences (57,563 | 12.3%), visual & performing arts (43,682 | 9.4%), engineering (36,225 | 7.8%), and communications (35,159 | 7.5%) are the most common fields of study among 466,244 individuals in Area Code 424 who have obtained a bachelor's degree or higher.
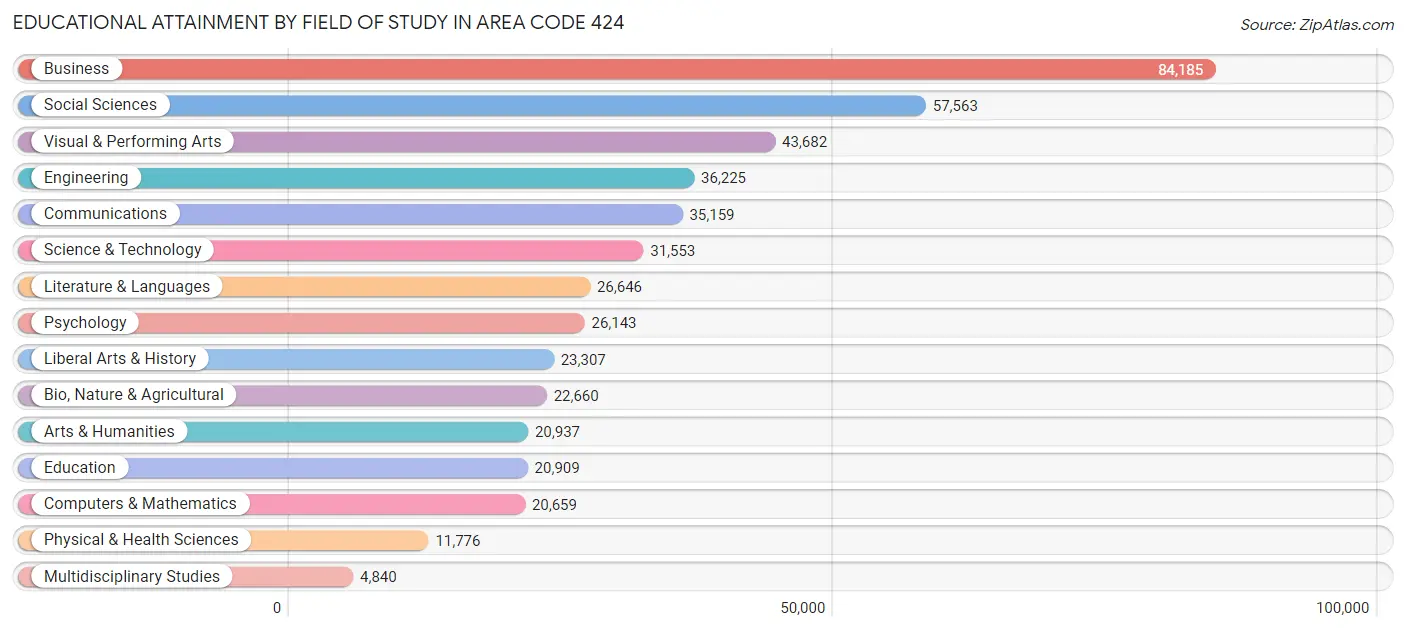
| Field of Study | # Graduates | % Graduates |
| Computers & Mathematics | 20,659 | 4.4% |
| Bio, Nature & Agricultural | 22,660 | 4.9% |
| Physical & Health Sciences | 11,776 | 2.5% |
| Psychology | 26,143 | 5.6% |
| Social Sciences | 57,563 | 12.3% |
| Engineering | 36,225 | 7.8% |
| Multidisciplinary Studies | 4,840 | 1.0% |
| Science & Technology | 31,553 | 6.8% |
| Business | 84,185 | 18.1% |
| Education | 20,909 | 4.5% |
| Literature & Languages | 26,646 | 5.7% |
| Liberal Arts & History | 23,307 | 5.0% |
| Visual & Performing Arts | 43,682 | 9.4% |
| Communications | 35,159 | 7.5% |
| Arts & Humanities | 20,937 | 4.5% |
| Total | 466,244 | 100.0% |
Transportation & Commute in Area Code 424
Vehicle Availability by Sex in Area Code 424
The most prevalent vehicle ownership categories in Area Code 424 are males with 2 vehicles (156,334, accounting for 40.3%) and females with 2 vehicles (133,167, making up 47.2%).
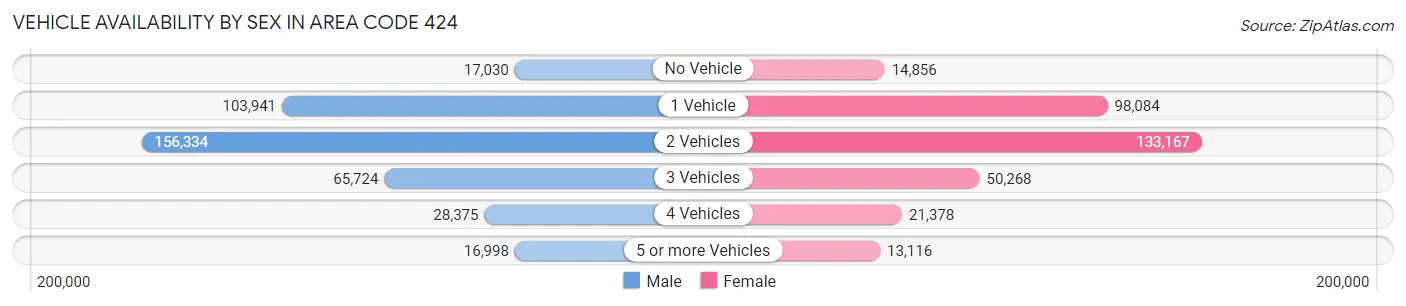
| Vehicles Available | Male | Female |
| No Vehicle | 17,030 (4.4%) | 14,856 (4.5%) |
| 1 Vehicle | 103,941 (26.8%) | 98,084 (29.6%) |
| 2 Vehicles | 156,334 (40.3%) | 133,167 (40.3%) |
| 3 Vehicles | 65,724 (16.9%) | 50,268 (15.2%) |
| 4 Vehicles | 28,375 (7.3%) | 21,378 (6.5%) |
| 5 or more Vehicles | 16,998 (4.4%) | 13,116 (4.0%) |
| Total | 388,402 (100.0%) | 330,869 (100.0%) |
Commute Time in Area Code 424
The most frequently occuring commute durations in Area Code 424 are 30 to 34 minutes (104,908 commuters, 17.3%), 15 to 19 minutes (89,243 commuters, 14.7%), and 20 to 24 minutes (88,149 commuters, 14.5%).
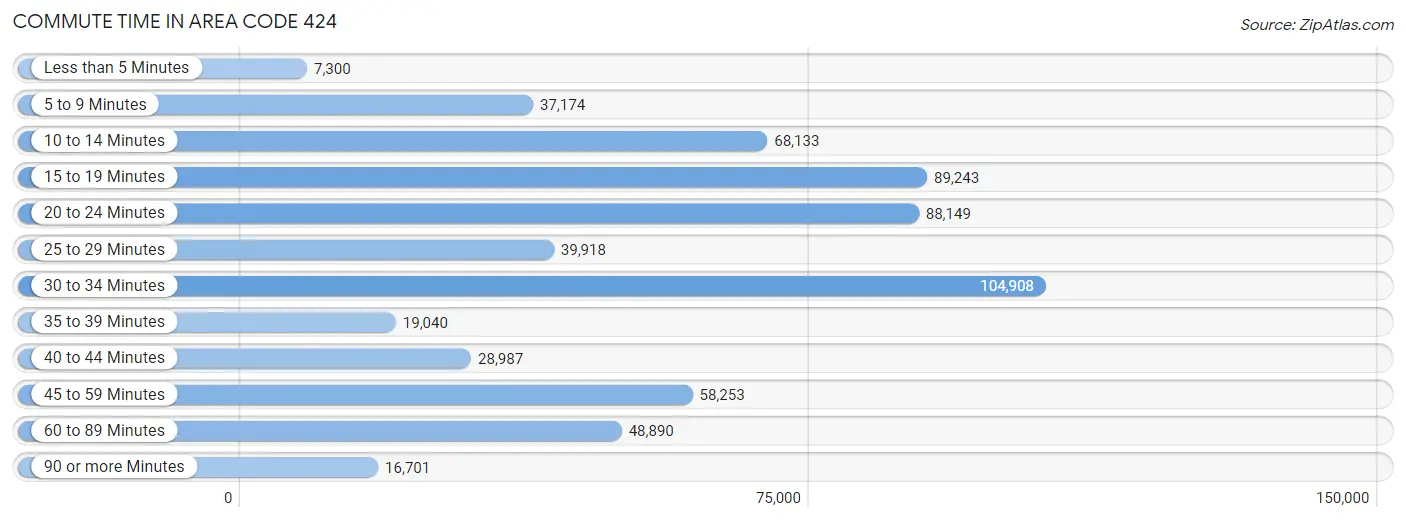
| Commute Time | # Commuters | % Commuters |
| Less than 5 Minutes | 7,300 | 1.2% |
| 5 to 9 Minutes | 37,174 | 6.1% |
| 10 to 14 Minutes | 68,133 | 11.2% |
| 15 to 19 Minutes | 89,243 | 14.7% |
| 20 to 24 Minutes | 88,149 | 14.5% |
| 25 to 29 Minutes | 39,918 | 6.6% |
| 30 to 34 Minutes | 104,908 | 17.3% |
| 35 to 39 Minutes | 19,040 | 3.1% |
| 40 to 44 Minutes | 28,987 | 4.8% |
| 45 to 59 Minutes | 58,253 | 9.6% |
| 60 to 89 Minutes | 48,890 | 8.1% |
| 90 or more Minutes | 16,701 | 2.8% |
Commute Time by Sex in Area Code 424
The most common commute times in Area Code 424 are 30 to 34 minutes (58,853 commuters, 17.7%) for males and 30 to 34 minutes (46,055 commuters, 16.8%) for females.
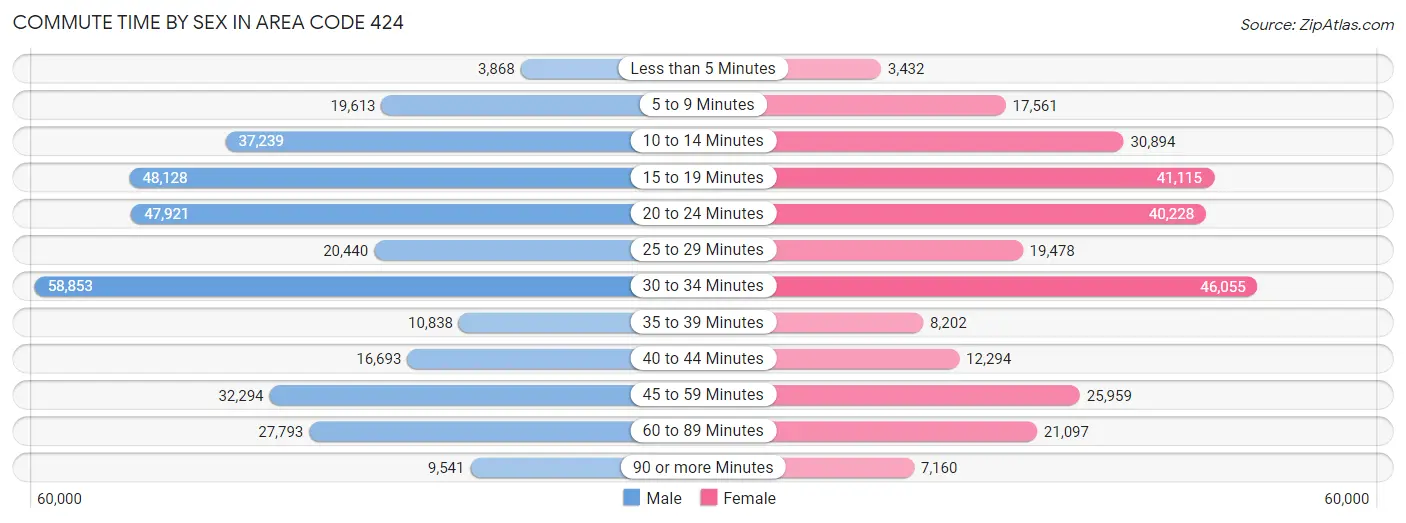
| Commute Time | Male | Female |
| Less than 5 Minutes | 3,868 (1.2%) | 3,432 (1.3%) |
| 5 to 9 Minutes | 19,613 (5.9%) | 17,561 (6.4%) |
| 10 to 14 Minutes | 37,239 (11.2%) | 30,894 (11.3%) |
| 15 to 19 Minutes | 48,128 (14.4%) | 41,115 (15.0%) |
| 20 to 24 Minutes | 47,921 (14.4%) | 40,228 (14.7%) |
| 25 to 29 Minutes | 20,440 (6.1%) | 19,478 (7.1%) |
| 30 to 34 Minutes | 58,853 (17.7%) | 46,055 (16.8%) |
| 35 to 39 Minutes | 10,838 (3.3%) | 8,202 (3.0%) |
| 40 to 44 Minutes | 16,693 (5.0%) | 12,294 (4.5%) |
| 45 to 59 Minutes | 32,294 (9.7%) | 25,959 (9.5%) |
| 60 to 89 Minutes | 27,793 (8.3%) | 21,097 (7.7%) |
| 90 or more Minutes | 9,541 (2.9%) | 7,160 (2.6%) |
Time of Departure to Work by Sex in Area Code 424
The most frequent times of departure to work in Area Code 424 are 8:00 AM to 8:29 AM (42,405, 12.7%) for males and 8:00 AM to 8:29 AM (39,329, 14.4%) for females.
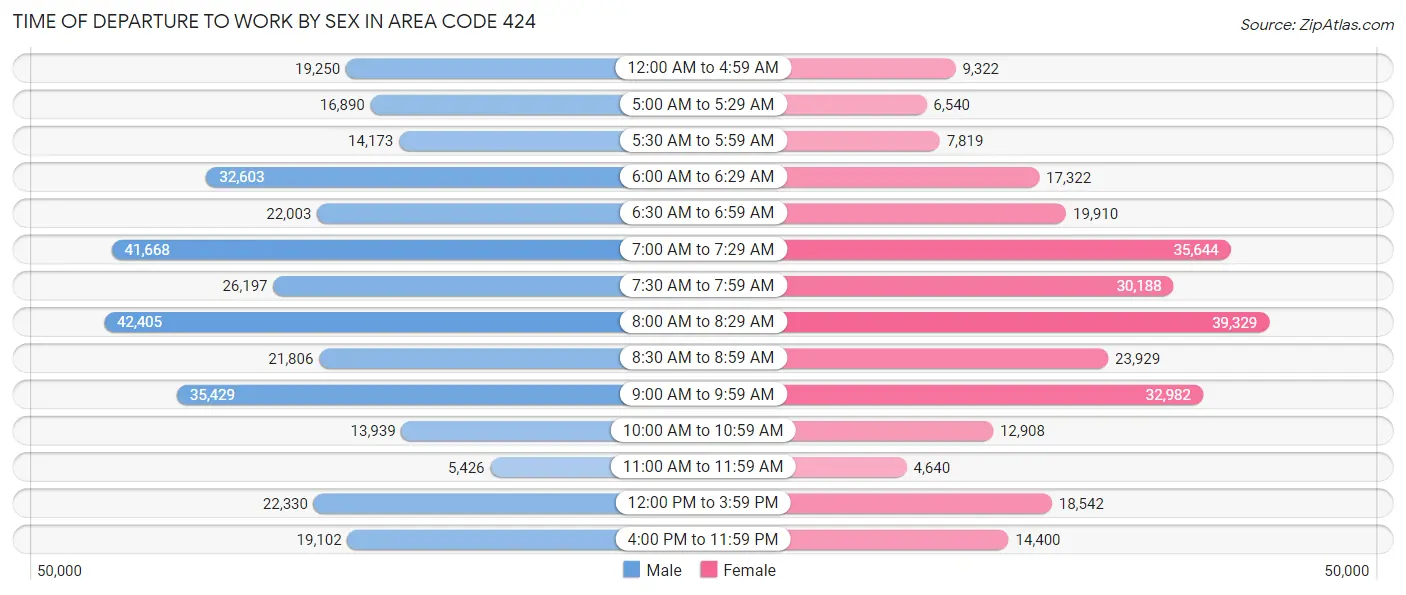
| Time of Departure | Male | Female |
| 12:00 AM to 4:59 AM | 19,250 (5.8%) | 9,322 (3.4%) |
| 5:00 AM to 5:29 AM | 16,890 (5.1%) | 6,540 (2.4%) |
| 5:30 AM to 5:59 AM | 14,173 (4.3%) | 7,819 (2.9%) |
| 6:00 AM to 6:29 AM | 32,603 (9.8%) | 17,322 (6.3%) |
| 6:30 AM to 6:59 AM | 22,003 (6.6%) | 19,910 (7.3%) |
| 7:00 AM to 7:29 AM | 41,668 (12.5%) | 35,644 (13.0%) |
| 7:30 AM to 7:59 AM | 26,197 (7.9%) | 30,188 (11.0%) |
| 8:00 AM to 8:29 AM | 42,405 (12.7%) | 39,329 (14.4%) |
| 8:30 AM to 8:59 AM | 21,806 (6.5%) | 23,929 (8.7%) |
| 9:00 AM to 9:59 AM | 35,429 (10.6%) | 32,982 (12.1%) |
| 10:00 AM to 10:59 AM | 13,939 (4.2%) | 12,908 (4.7%) |
| 11:00 AM to 11:59 AM | 5,426 (1.6%) | 4,640 (1.7%) |
| 12:00 PM to 3:59 PM | 22,330 (6.7%) | 18,542 (6.8%) |
| 4:00 PM to 11:59 PM | 19,102 (5.7%) | 14,400 (5.3%) |
| Total | 333,221 (100.0%) | 273,475 (100.0%) |
Housing Occupancy in Area Code 424
Occupancy by Ownership in Area Code 424
Of the total 552,630 dwellings in Area Code 424, owner-occupied units account for 206,844 (37.4%), while renter-occupied units make up 345,786 (62.6%).
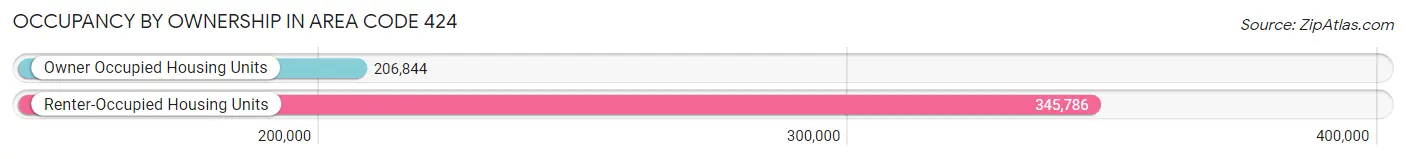
| Occupancy | # Housing Units | % Housing Units |
| Owner Occupied Housing Units | 206,844 | 37.4% |
| Renter-Occupied Housing Units | 345,786 | 62.6% |
| Total Occupied Housing Units | 552,630 | 100.0% |
Occupancy by Household Size in Area Code 424
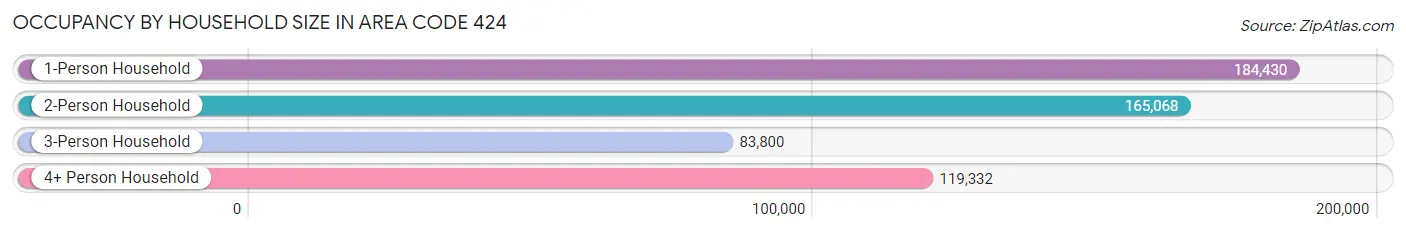
| Household Size | # Housing Units | % Housing Units |
| 1-Person Household | 184,430 | 33.4% |
| 2-Person Household | 165,068 | 29.9% |
| 3-Person Household | 83,800 | 15.2% |
| 4+ Person Household | 119,332 | 21.6% |
| Total Housing Units | 552,630 | 100.0% |
Occupancy by Ownership by Household Size in Area Code 424
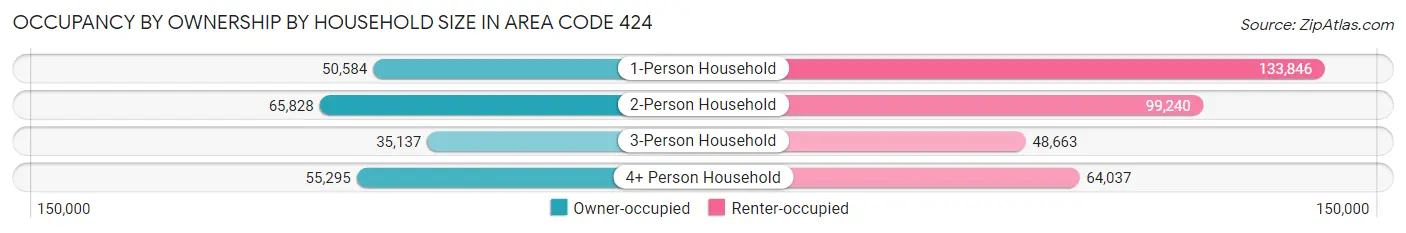
| Household Size | Owner-occupied | Renter-occupied |
| 1-Person Household | 50,584 (27.4%) | 133,846 (72.6%) |
| 2-Person Household | 65,828 (39.9%) | 99,240 (60.1%) |
| 3-Person Household | 35,137 (41.9%) | 48,663 (58.1%) |
| 4+ Person Household | 55,295 (46.3%) | 64,037 (53.7%) |
| Total Housing Units | 206,844 (37.4%) | 345,786 (62.6%) |
Occupancy by Educational Attainment in Area Code 424
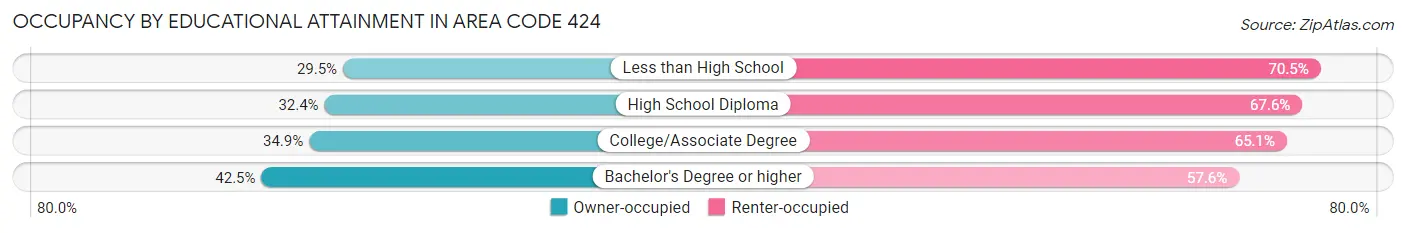
| Household Size | Owner-occupied | Renter-occupied |
| Less than High School | 21,074 (29.5%) | 50,343 (70.5%) |
| High School Diploma | 25,465 (32.4%) | 53,030 (67.6%) |
| College/Associate Degree | 49,024 (34.9%) | 91,520 (65.1%) |
| Bachelor's Degree or higher | 111,281 (42.4%) | 150,893 (57.6%) |
Occupancy by Age of Householder in Area Code 424
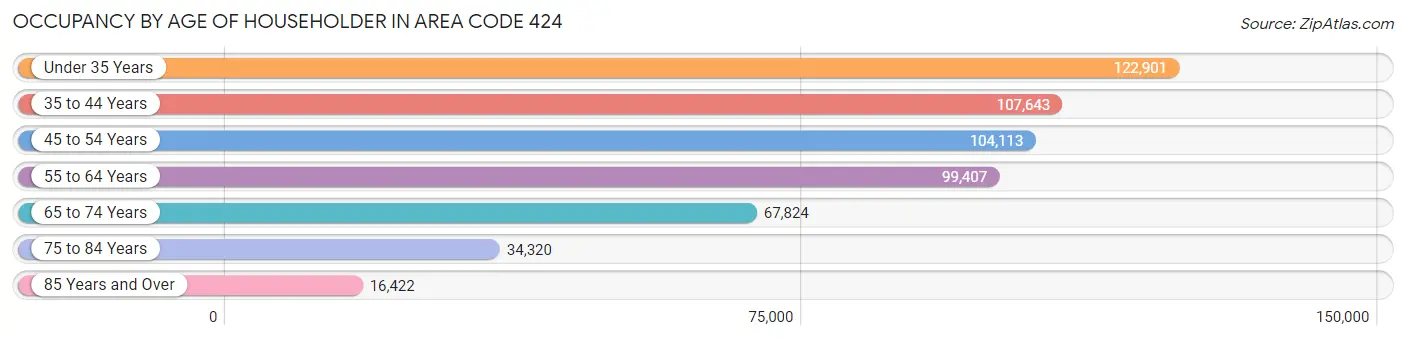
| Age Bracket | # Households | % Households |
| Under 35 Years | 122,901 | 22.2% |
| 35 to 44 Years | 107,643 | 19.5% |
| 45 to 54 Years | 104,113 | 18.8% |
| 55 to 64 Years | 99,407 | 18.0% |
| 65 to 74 Years | 67,824 | 12.3% |
| 75 to 84 Years | 34,320 | 6.2% |
| 85 Years and Over | 16,422 | 3.0% |
| Total | 552,630 | 100.0% |
Housing Finances in Area Code 424
Median Income by Occupancy in Area Code 424
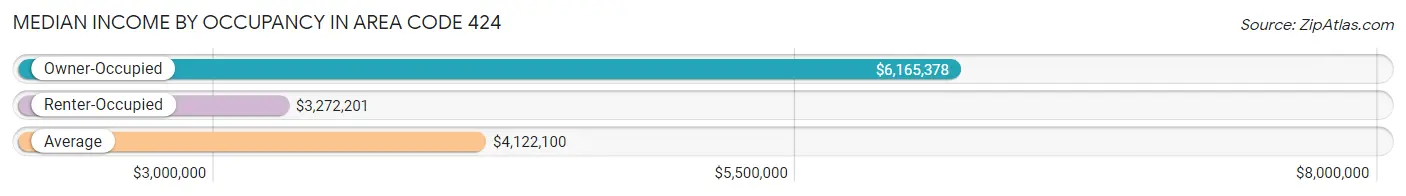
| Occupancy Type | # Households | Median Income |
| Owner-Occupied | 206,844 (37.4%) | $6,165,378 |
| Renter-Occupied | 345,786 (62.6%) | $3,272,201 |
| Average | 552,630 (100.0%) | $4,122,100 |
Occupancy by Householder Income Bracket in Area Code 424
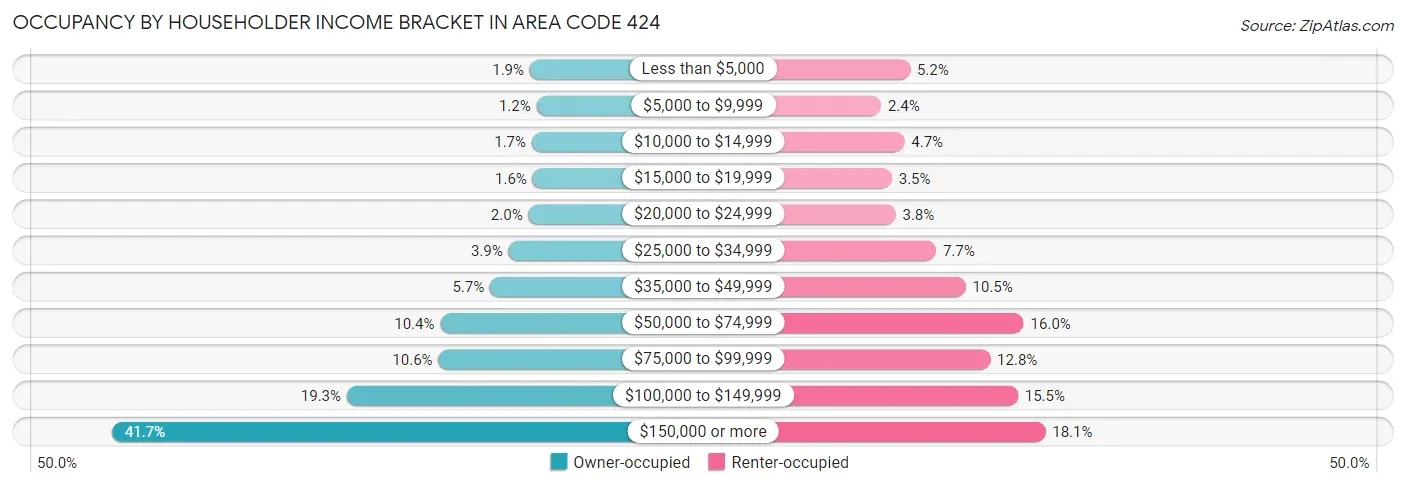
| Income Bracket | Owner-occupied | Renter-occupied |
| Less than $5,000 | 3,892 (1.9%) | 17,901 (5.2%) |
| $5,000 to $9,999 | 2,571 (1.2%) | 8,367 (2.4%) |
| $10,000 to $14,999 | 3,494 (1.7%) | 16,092 (4.6%) |
| $15,000 to $19,999 | 3,325 (1.6%) | 11,930 (3.5%) |
| $20,000 to $24,999 | 4,158 (2.0%) | 13,181 (3.8%) |
| $25,000 to $34,999 | 8,082 (3.9%) | 26,476 (7.7%) |
| $35,000 to $49,999 | 11,725 (5.7%) | 36,235 (10.5%) |
| $50,000 to $74,999 | 21,534 (10.4%) | 55,372 (16.0%) |
| $75,000 to $99,999 | 21,900 (10.6%) | 44,331 (12.8%) |
| $100,000 to $149,999 | 39,936 (19.3%) | 53,412 (15.4%) |
| $150,000 or more | 86,227 (41.7%) | 62,489 (18.1%) |
| Total | 206,844 (100.0%) | 345,786 (100.0%) |
Monthly Housing Cost Tiers in Area Code 424
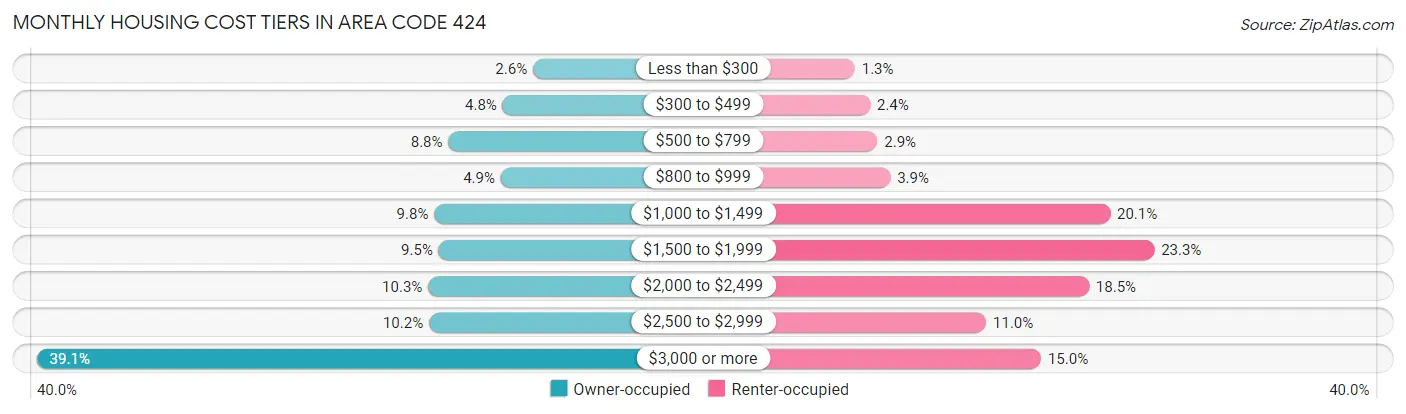
| Monthly Cost | Owner-occupied | Renter-occupied |
| Less than $300 | 5,286 (2.6%) | 4,438 (1.3%) |
| $300 to $499 | 9,906 (4.8%) | 8,304 (2.4%) |
| $500 to $799 | 18,178 (8.8%) | 10,162 (2.9%) |
| $800 to $999 | 10,193 (4.9%) | 13,444 (3.9%) |
| $1,000 to $1,499 | 20,343 (9.8%) | 69,448 (20.1%) |
| $1,500 to $1,999 | 19,659 (9.5%) | 80,662 (23.3%) |
| $2,000 to $2,499 | 21,258 (10.3%) | 64,037 (18.5%) |
| $2,500 to $2,999 | 21,132 (10.2%) | 37,859 (11.0%) |
| $3,000 or more | 80,889 (39.1%) | 51,839 (15.0%) |
| Total | 206,844 (100.0%) | 345,786 (100.0%) |
Physical Housing Characteristics in Area Code 424
Housing Structures in Area Code 424
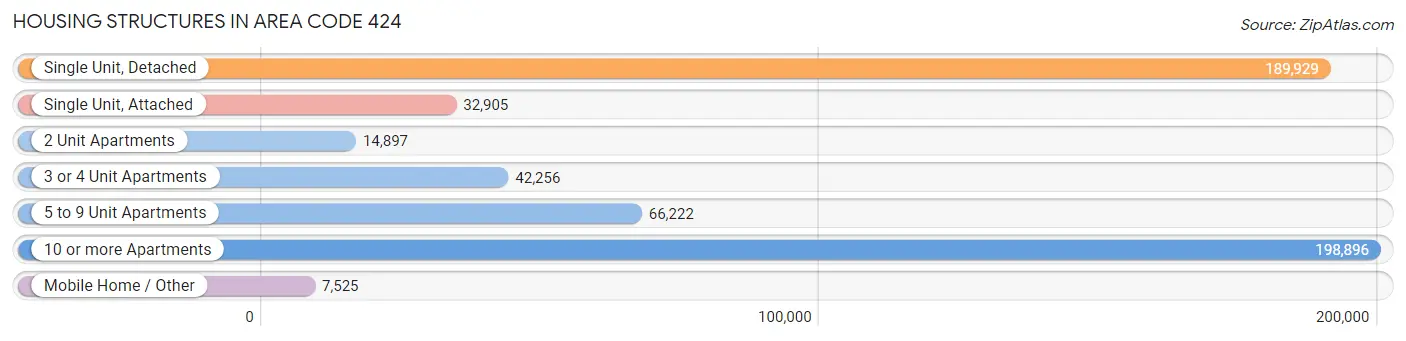
| Structure Type | # Housing Units | % Housing Units |
| Single Unit, Detached | 189,929 | 34.4% |
| Single Unit, Attached | 32,905 | 5.9% |
| 2 Unit Apartments | 14,897 | 2.7% |
| 3 or 4 Unit Apartments | 42,256 | 7.6% |
| 5 to 9 Unit Apartments | 66,222 | 12.0% |
| 10 or more Apartments | 198,896 | 36.0% |
| Mobile Home / Other | 7,525 | 1.4% |
| Total | 552,630 | 100.0% |
Housing Structures by Occupancy in Area Code 424
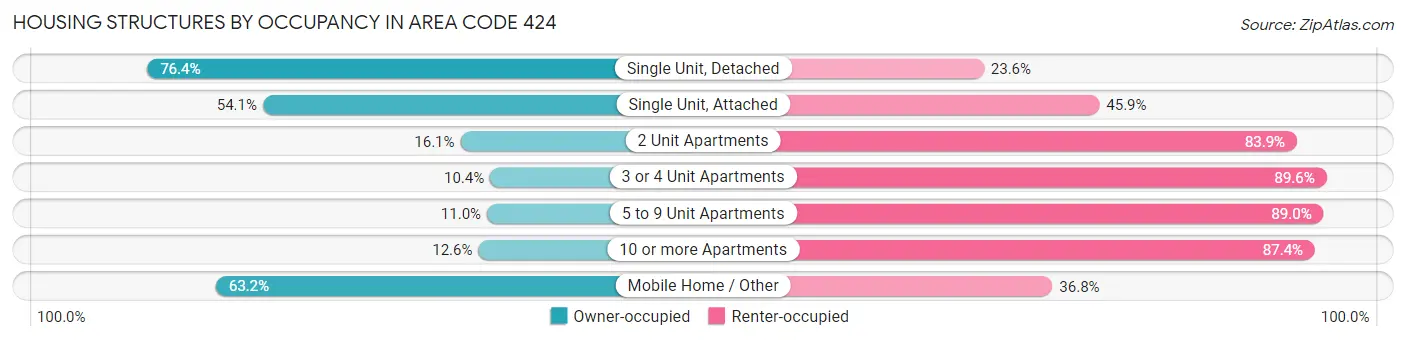
| Structure Type | Owner-occupied | Renter-occupied |
| Single Unit, Detached | 145,077 (76.4%) | 44,852 (23.6%) |
| Single Unit, Attached | 17,816 (54.1%) | 15,089 (45.9%) |
| 2 Unit Apartments | 2,398 (16.1%) | 12,499 (83.9%) |
| 3 or 4 Unit Apartments | 4,392 (10.4%) | 37,864 (89.6%) |
| 5 to 9 Unit Apartments | 7,275 (11.0%) | 58,947 (89.0%) |
| 10 or more Apartments | 25,132 (12.6%) | 173,764 (87.4%) |
| Mobile Home / Other | 4,754 (63.2%) | 2,771 (36.8%) |
| Total | 206,844 (37.4%) | 345,786 (62.6%) |
Housing Structures by Number of Rooms in Area Code 424
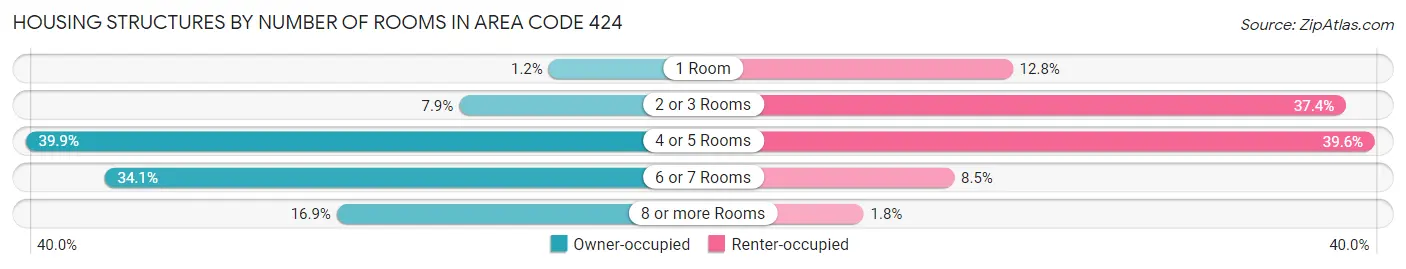
| Number of Rooms | Owner-occupied | Renter-occupied |
| 1 Room | 2,534 (1.2%) | 44,187 (12.8%) |
| 2 or 3 Rooms | 16,237 (7.9%) | 129,461 (37.4%) |
| 4 or 5 Rooms | 82,592 (39.9%) | 136,861 (39.6%) |
| 6 or 7 Rooms | 70,495 (34.1%) | 29,221 (8.5%) |
| 8 or more Rooms | 34,986 (16.9%) | 6,056 (1.8%) |
| Total | 206,844 (100.0%) | 345,786 (100.0%) |
Housing Structure by Heating Type in Area Code 424
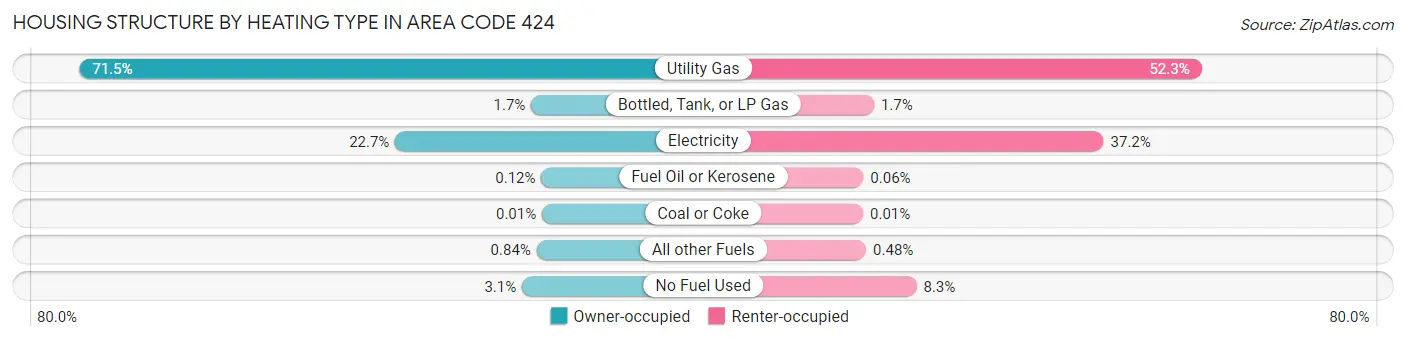
| Heating Type | Owner-occupied | Renter-occupied |
| Utility Gas | 147,972 (71.5%) | 180,874 (52.3%) |
| Bottled, Tank, or LP Gas | 3,506 (1.7%) | 5,843 (1.7%) |
| Electricity | 46,968 (22.7%) | 128,586 (37.2%) |
| Fuel Oil or Kerosene | 238 (0.1%) | 198 (0.1%) |
| Coal or Coke | 16 (0.0%) | 41 (0.0%) |
| All other Fuels | 1,728 (0.8%) | 1,648 (0.5%) |
| No Fuel Used | 6,416 (3.1%) | 28,596 (8.3%) |
| Total | 206,844 (100.0%) | 345,786 (100.0%) |
Household Vehicle Usage in Area Code 424
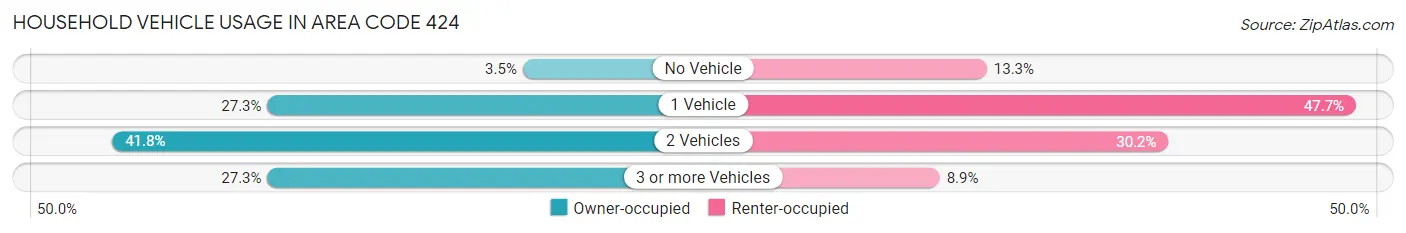
| Vehicles per Household | Owner-occupied | Renter-occupied |
| No Vehicle | 7,238 (3.5%) | 45,829 (13.3%) |
| 1 Vehicle | 56,547 (27.3%) | 164,952 (47.7%) |
| 2 Vehicles | 86,499 (41.8%) | 104,404 (30.2%) |
| 3 or more Vehicles | 56,560 (27.3%) | 30,601 (8.8%) |
| Total | 206,844 (100.0%) | 345,786 (100.0%) |
Real Estate & Mortgages in Area Code 424
Real Estate and Mortgage Overview in Area Code 424
| Characteristic | Without Mortgage | With Mortgage |
| Housing Units | 63,991 | 142,853 |
| Median Property Value | $44,186,104 | $47,861,905 |
| Median Household Income | $3,821,732 | $68,659 |
| Monthly Housing Costs | $40,909 | $78,093 |
| Real Estate Taxes | $204,157 | $1,952 |
Property Value by Mortgage Status in Area Code 424
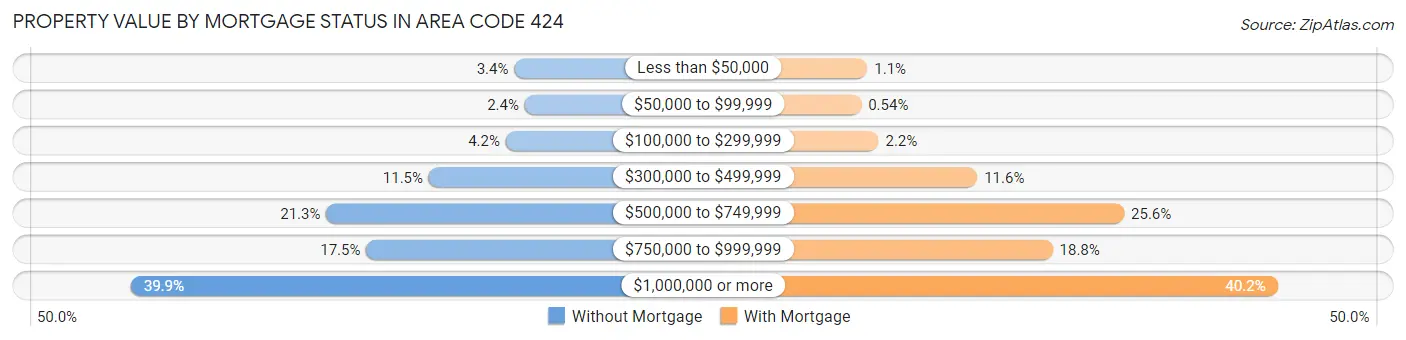
| Property Value | Without Mortgage | With Mortgage |
| Less than $50,000 | 2,152 (3.4%) | 1,607 (1.1%) |
| $50,000 to $99,999 | 1,507 (2.4%) | 778 (0.5%) |
| $100,000 to $299,999 | 2,668 (4.2%) | 3,129 (2.2%) |
| $300,000 to $499,999 | 7,361 (11.5%) | 16,556 (11.6%) |
| $500,000 to $749,999 | 13,613 (21.3%) | 36,546 (25.6%) |
| $750,000 to $999,999 | 11,171 (17.5%) | 26,818 (18.8%) |
| $1,000,000 or more | 25,519 (39.9%) | 57,419 (40.2%) |
| Total | 63,991 (100.0%) | 142,853 (100.0%) |
Household Income by Mortgage Status in Area Code 424
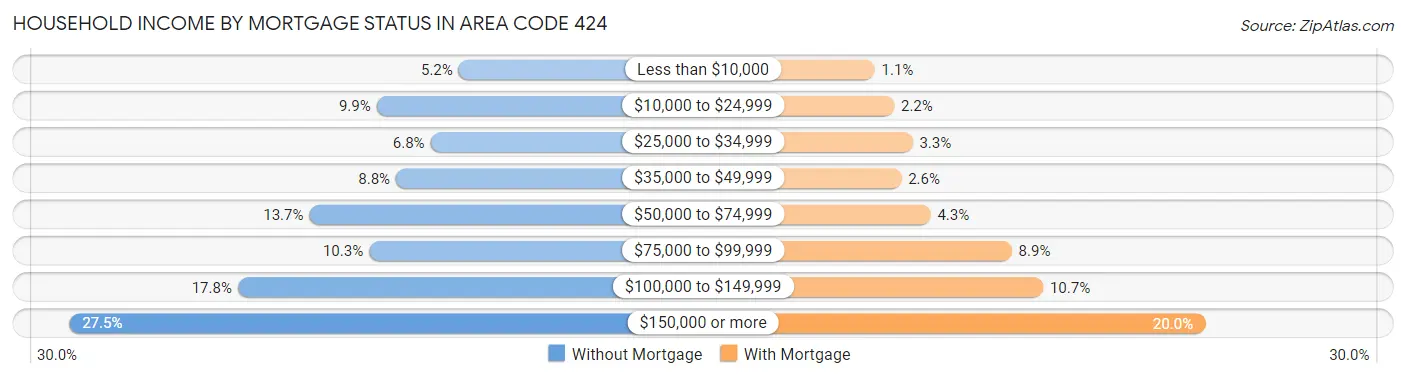
| Household Income | Without Mortgage | With Mortgage |
| Less than $10,000 | 3,327 (5.2%) | 1,551 (1.1%) |
| $10,000 to $24,999 | 6,330 (9.9%) | 3,136 (2.2%) |
| $25,000 to $34,999 | 4,356 (6.8%) | 4,647 (3.3%) |
| $35,000 to $49,999 | 5,616 (8.8%) | 3,726 (2.6%) |
| $50,000 to $74,999 | 8,787 (13.7%) | 6,109 (4.3%) |
| $75,000 to $99,999 | 6,604 (10.3%) | 12,747 (8.9%) |
| $100,000 to $149,999 | 11,403 (17.8%) | 15,296 (10.7%) |
| $150,000 or more | 17,568 (27.5%) | 28,533 (20.0%) |
| Total | 63,991 (100.0%) | 142,853 (100.0%) |
Property Value to Household Income Ratio in Area Code 424
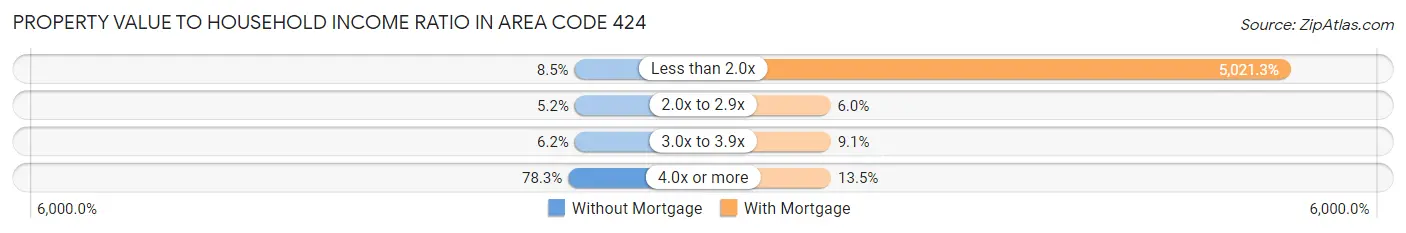
| Value-to-Income Ratio | Without Mortgage | With Mortgage |
| Less than 2.0x | 5,444 (8.5%) | 7,173,039 (5,021.3%) |
| 2.0x to 2.9x | 3,319 (5.2%) | 8,564 (6.0%) |
| 3.0x to 3.9x | 3,989 (6.2%) | 13,031 (9.1%) |
| 4.0x or more | 50,128 (78.3%) | 19,227 (13.5%) |
| Total | 63,991 (100.0%) | 142,853 (100.0%) |
Real Estate Taxes by Mortgage Status in Area Code 424
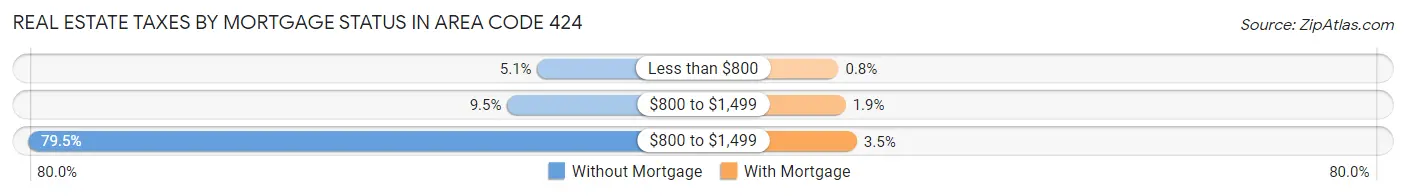
| Property Taxes | Without Mortgage | With Mortgage |
| Less than $800 | 3,245 (5.1%) | 1,140 (0.8%) |
| $800 to $1,499 | 6,059 (9.5%) | 2,640 (1.8%) |
| $800 to $1,499 | 50,869 (79.5%) | 4,988 (3.5%) |
| Total | 63,991 (100.0%) | 142,853 (100.0%) |
Health & Disability in Area Code 424
Health Insurance Coverage by Age in Area Code 424
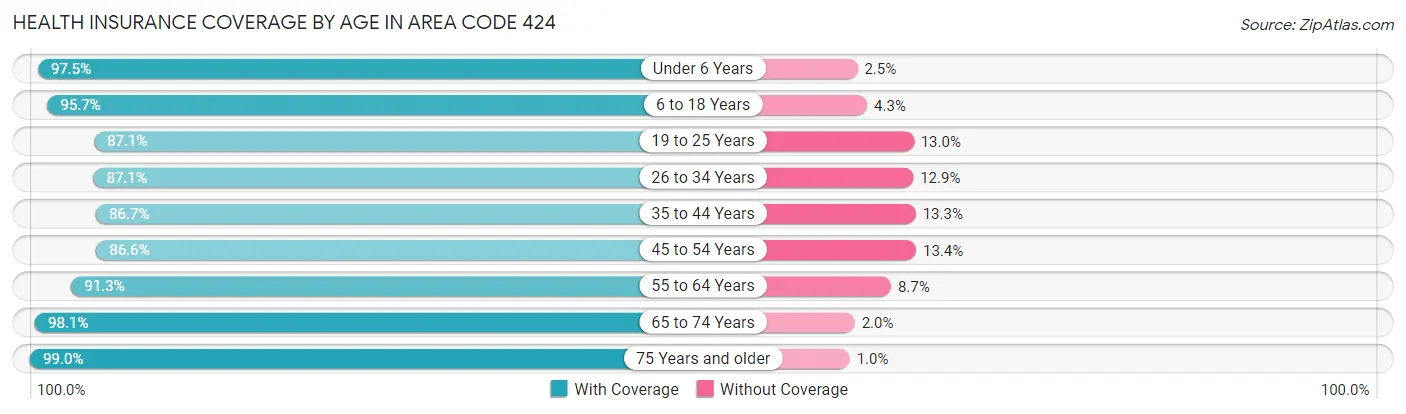
| Age Bracket | With Coverage | Without Coverage |
| Under 6 Years | 91,735 (97.5%) | 2,310 (2.5%) |
| 6 to 18 Years | 200,723 (95.7%) | 8,939 (4.3%) |
| 19 to 25 Years | 109,724 (87.1%) | 16,322 (13.0%) |
| 26 to 34 Years | 202,947 (87.1%) | 29,958 (12.9%) |
| 35 to 44 Years | 180,435 (86.7%) | 27,725 (13.3%) |
| 45 to 54 Years | 165,476 (86.6%) | 25,554 (13.4%) |
| 55 to 64 Years | 156,837 (91.3%) | 14,959 (8.7%) |
| 65 to 74 Years | 109,869 (98.1%) | 2,190 (1.9%) |
| 75 Years and older | 77,381 (99.0%) | 787 (1.0%) |
| Total | 1,295,127 (91.0%) | 128,744 (9.0%) |
Health Insurance Coverage by Citizenship Status in Area Code 424
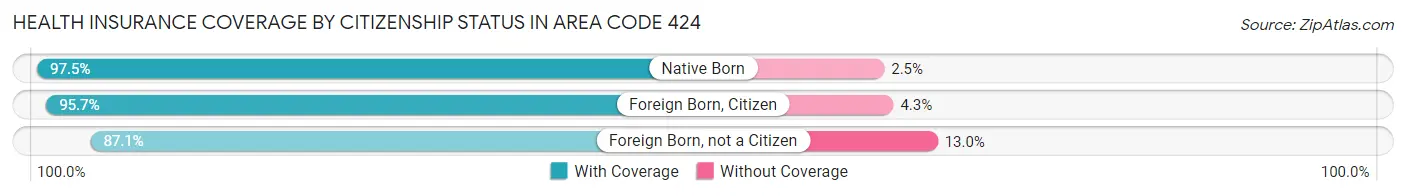
| Citizenship Status | With Coverage | Without Coverage |
| Native Born | 91,735 (97.5%) | 2,310 (2.5%) |
| Foreign Born, Citizen | 200,723 (95.7%) | 8,939 (4.3%) |
| Foreign Born, not a Citizen | 109,724 (87.1%) | 16,322 (13.0%) |
Health Insurance Coverage by Household Income in Area Code 424
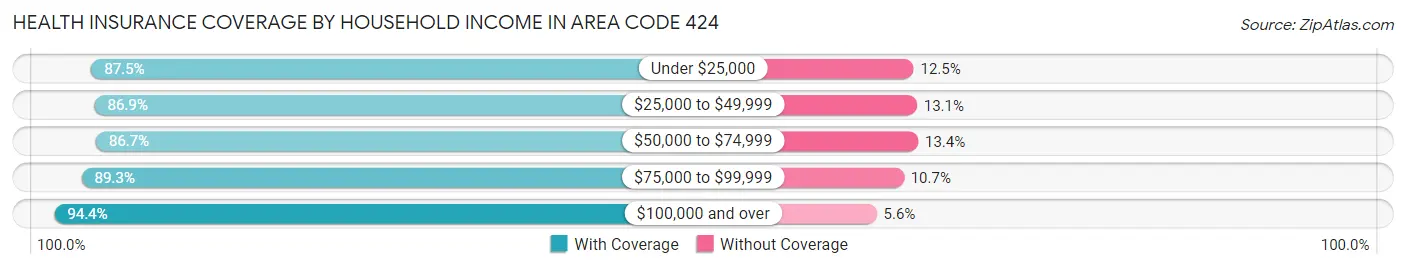
| Household Income | With Coverage | Without Coverage |
| Under $25,000 | 130,019 (87.5%) | 18,581 (12.5%) |
| $25,000 to $49,999 | 168,107 (86.9%) | 25,374 (13.1%) |
| $50,000 to $74,999 | 166,566 (86.7%) | 25,661 (13.4%) |
| $75,000 to $99,999 | 153,327 (89.3%) | 18,316 (10.7%) |
| $100,000 and over | 658,544 (94.4%) | 38,945 (5.6%) |
Public vs Private Health Insurance Coverage by Age in Area Code 424
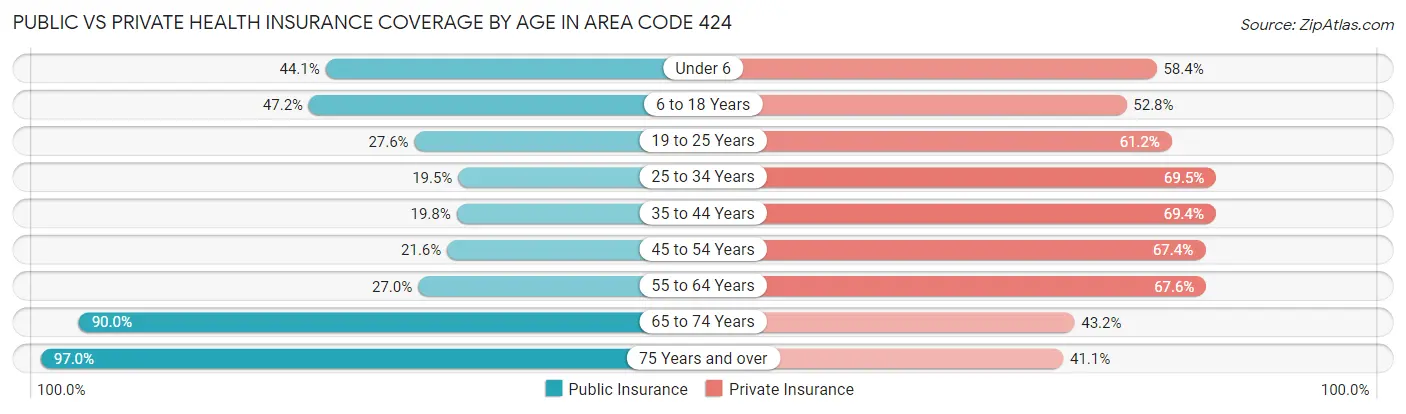
| Age Bracket | Public Insurance | Private Insurance |
| Under 6 | 41,509 (44.1%) | 54,929 (58.4%) |
| 6 to 18 Years | 99,018 (47.2%) | 110,734 (52.8%) |
| 19 to 25 Years | 34,839 (27.6%) | 77,179 (61.2%) |
| 25 to 34 Years | 45,453 (19.5%) | 161,813 (69.5%) |
| 35 to 44 Years | 41,269 (19.8%) | 144,477 (69.4%) |
| 45 to 54 Years | 41,224 (21.6%) | 128,776 (67.4%) |
| 55 to 64 Years | 46,336 (27.0%) | 116,186 (67.6%) |
| 65 to 74 Years | 100,799 (89.9%) | 48,370 (43.2%) |
| 75 Years and over | 75,806 (97.0%) | 32,105 (41.1%) |
| Total | 526,253 (37.0%) | 874,569 (61.4%) |
Disability Status by Sex by Age in Area Code 424
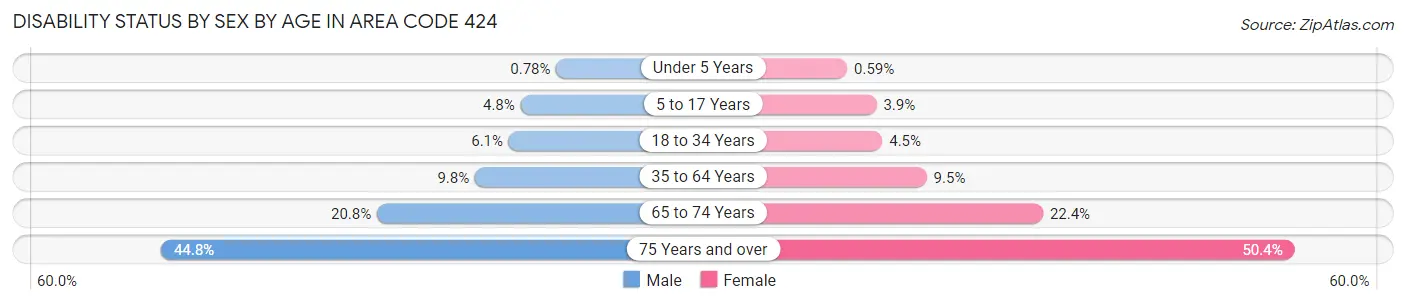
| Age Bracket | Male | Female |
| Under 5 Years | 319 (0.8%) | 223 (0.6%) |
| 5 to 17 Years | 5,104 (4.8%) | 3,932 (3.9%) |
| 18 to 34 Years | 11,468 (6.1%) | 8,382 (4.5%) |
| 35 to 64 Years | 28,416 (9.8%) | 26,634 (9.5%) |
| 65 to 74 Years | 11,126 (20.7%) | 13,094 (22.4%) |
| 75 Years and over | 13,615 (44.8%) | 24,087 (50.4%) |
Disability Class by Sex by Age in Area Code 424
Disability Class: Hearing Difficulty
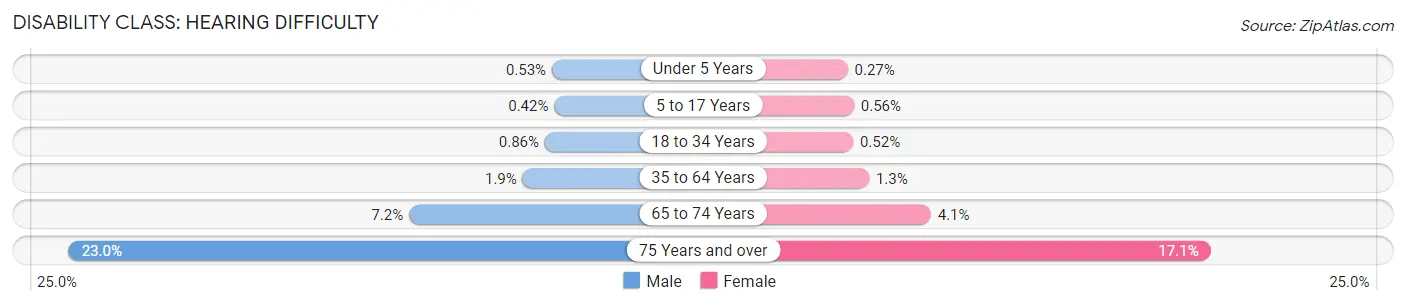
| Age Bracket | Male | Female |
| Under 5 Years | 217 (0.5%) | 103 (0.3%) |
| 5 to 17 Years | 454 (0.4%) | 573 (0.6%) |
| 18 to 34 Years | 1,628 (0.9%) | 960 (0.5%) |
| 35 to 64 Years | 5,469 (1.9%) | 3,538 (1.3%) |
| 65 to 74 Years | 3,838 (7.2%) | 2,416 (4.1%) |
| 75 Years and over | 6,973 (23.0%) | 8,176 (17.1%) |
Disability Class: Vision Difficulty
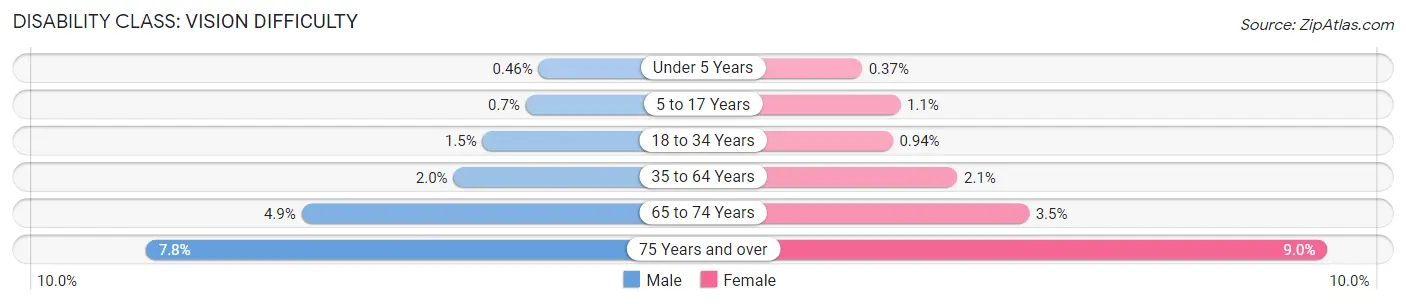
| Age Bracket | Male | Female |
| Under 5 Years | 187 (0.5%) | 141 (0.4%) |
| 5 to 17 Years | 755 (0.7%) | 1,103 (1.1%) |
| 18 to 34 Years | 2,835 (1.5%) | 1,747 (0.9%) |
| 35 to 64 Years | 5,894 (2.0%) | 6,036 (2.1%) |
| 65 to 74 Years | 2,606 (4.9%) | 2,026 (3.5%) |
| 75 Years and over | 2,354 (7.7%) | 4,306 (9.0%) |
Disability Class: Cognitive Difficulty
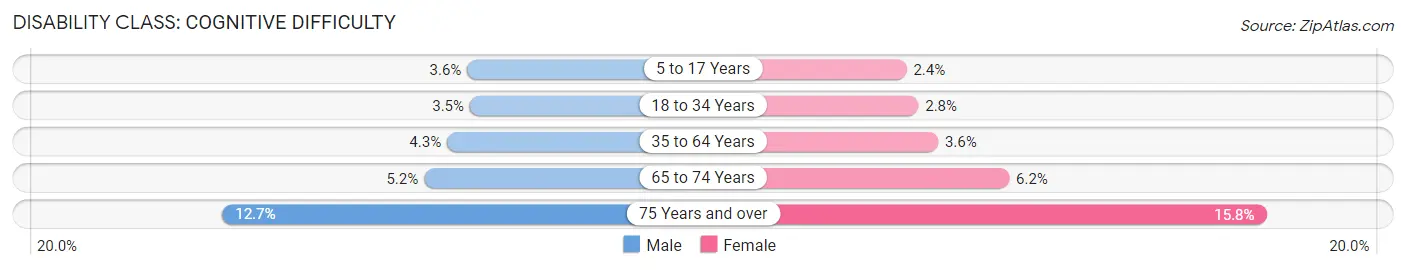
| Age Bracket | Male | Female |
| 5 to 17 Years | 3,827 (3.6%) | 2,449 (2.4%) |
| 18 to 34 Years | 6,552 (3.5%) | 5,265 (2.8%) |
| 35 to 64 Years | 12,491 (4.3%) | 10,060 (3.6%) |
| 65 to 74 Years | 2,773 (5.2%) | 3,631 (6.2%) |
| 75 Years and over | 3,846 (12.7%) | 7,530 (15.8%) |
Disability Class: Ambulatory Difficulty
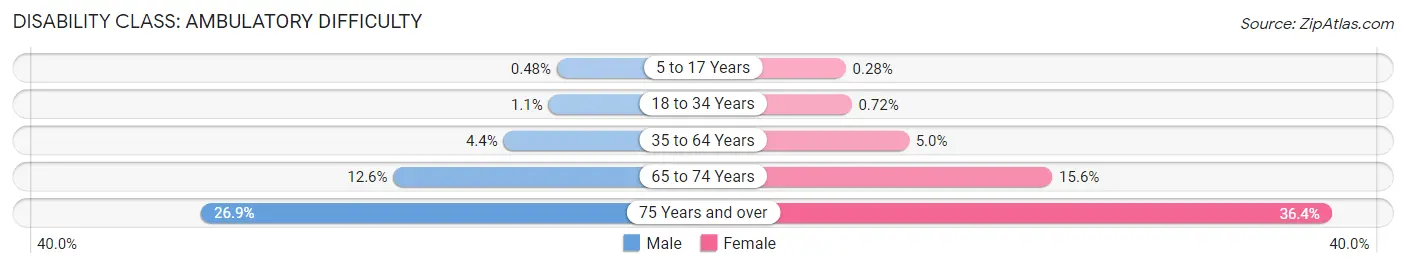
| Age Bracket | Male | Female |
| 5 to 17 Years | 513 (0.5%) | 290 (0.3%) |
| 18 to 34 Years | 2,068 (1.1%) | 1,333 (0.7%) |
| 35 to 64 Years | 12,834 (4.4%) | 14,006 (5.0%) |
| 65 to 74 Years | 6,763 (12.6%) | 9,129 (15.6%) |
| 75 Years and over | 8,169 (26.9%) | 17,381 (36.4%) |
Disability Class: Self-Care Difficulty
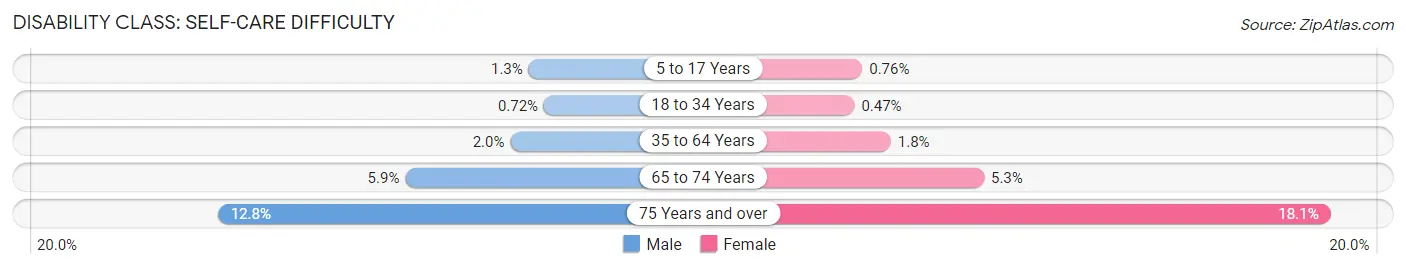
| Age Bracket | Male | Female |
| 5 to 17 Years | 1,383 (1.3%) | 771 (0.8%) |
| 18 to 34 Years | 1,367 (0.7%) | 873 (0.5%) |
| 35 to 64 Years | 5,688 (2.0%) | 5,134 (1.8%) |
| 65 to 74 Years | 3,148 (5.9%) | 3,086 (5.3%) |
| 75 Years and over | 3,899 (12.8%) | 8,667 (18.1%) |
Technology Access in Area Code 424
Computing Device Access in Area Code 424
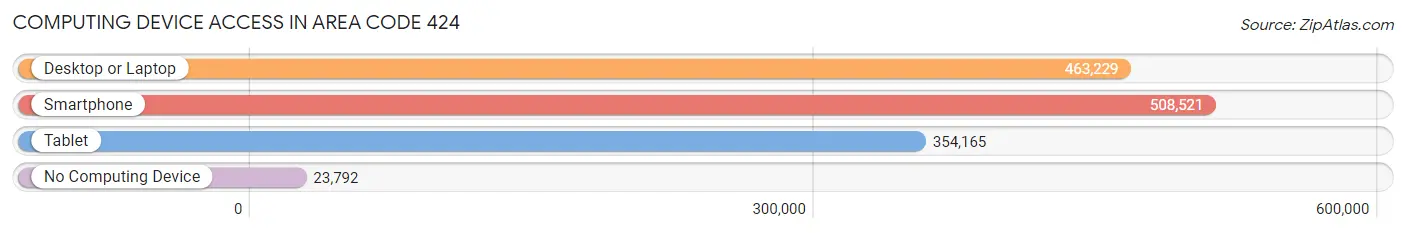
| Device Type | # Households | % Households |
| Desktop or Laptop | 463,229 | 83.8% |
| Smartphone | 508,521 | 92.0% |
| Tablet | 354,165 | 64.1% |
| No Computing Device | 23,792 | 4.3% |
| Total | 552,630 | 100.0% |
Internet Access in Area Code 424
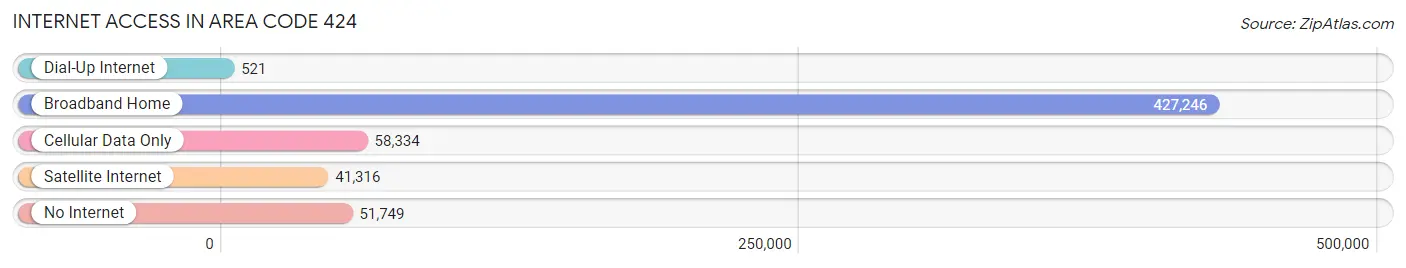
| Internet Type | # Households | % Households |
| Dial-Up Internet | 521 | 0.1% |
| Broadband Home | 427,246 | 77.3% |
| Cellular Data Only | 58,334 | 10.6% |
| Satellite Internet | 41,316 | 7.5% |
| No Internet | 51,749 | 9.4% |
| Total | 552,630 | 100.0% |
Area Code 424 Summary
Geography
Area code 424 is a telephone area code in the North American Numbering Plan (NANP) for the West Los Angeles and South Bay areas of Los Angeles County, California. It was created in 2006 as an overlay to area code 310.
Social
Area code 424 is home to many of the most affluent and influential neighborhoods in Los Angeles, including Beverly Hills, Bel Air, Brentwood, and Malibu. It is also home to many celebrities, business executives, and other high-profile individuals.
Economics
Area code 424 is home to some of the most expensive real estate in the United States. It is also home to many of the most successful businesses in the Los Angeles area, including entertainment, technology, and finance.
Demographics
Area code 424 is home to a diverse population, with a majority of residents being of Hispanic or Latino origin. The population is also well-educated, with a high percentage of college graduates. The median household income is significantly higher than the national average.
Common Questions
What is Per Capita Income in Area Code 424?
Per Capita income in Area Code 424 is $55,294.
What is the Median Family Income in Area Code 424?
Median Family Income in Area Code 424 is $117,701.
What is the Median Household income in Area Code 424?
Median Household Income in Area Code 424 is $93,684.
What is Income or Wage Gap in Area Code 424?
Income or Wage Gap in Area Code 424 is 21.6%.
Women in Area Code 424 earn 78.4 cents for every dollar earned by a man.
What is Family Income Deficit in Area Code 424?
Family Income Deficit in Area Code 424 is $11,654.
Families that are below poverty line in Area Code 424 earn $11,654 less on average than the poverty threshold level.
What is Inequality or Gini Index in Area Code 424?
Inequality or Gini Index in Area Code 424 is 21.15.
What is the Total Population of Area Code 424?
Total Population of Area Code 424 is 1,433,367.
What is the Total Male Population of Area Code 424?
Total Male Population of Area Code 424 is 715,665.
What is the Total Female Population of Area Code 424?
Total Female Population of Area Code 424 is 717,702.
What is the Ratio of Males per 100 Females in Area Code 424?
There are 99.72 Males per 100 Females in Area Code 424.
What is the Ratio of Females per 100 Males in Area Code 424?
There are 100.28 Females per 100 Males in Area Code 424.
What is the Median Population Age in Area Code 424?
Median Population Age in Area Code 424 is 38.6 Years.
What is the Average Family Size in Area Code 424
Average Family Size in Area Code 424 is 3.3 People.
What is the Average Household Size in Area Code 424
Average Household Size in Area Code 424 is 2.5 People.
How Large is the Labor Force in Area Code 424?
There are 780,717 People in the Labor Forcein in Area Code 424.
What is the Percentage of People in the Labor Force in Area Code 424?
66.3% of People are in the Labor Force in Area Code 424.
What is the Unemployment Rate in Area Code 424?
Unemployment Rate in Area Code 424 is 7.9%.