Los Angeles County, CA Map & Demographics
Los Angeles County Map
Los Angeles County Overview
$41,847
PER CAPITA INCOME
$93,675
AVG FAMILY INCOME
$83,411
AVG HOUSEHOLD INCOME
20.7%
WAGE / INCOME GAP [ % ]
79.3¢/ $1
WAGE / INCOME GAP [ $ ]
$11,092
FAMILY INCOME DEFICIT
0.50
INEQUALITY / GINI INDEX
9,936,690
TOTAL POPULATION
4,937,101
MALE POPULATION
4,999,589
FEMALE POPULATION
98.75
MALES / 100 FEMALES
101.27
FEMALES / 100 MALES
37.4
MEDIAN AGE
3.6
AVG FAMILY SIZE
2.9
AVG HOUSEHOLD SIZE
5,240,280
LABOR FORCE [ PEOPLE ]
64.8%
PERCENT IN LABOR FORCE
7.0%
UNEMPLOYMENT RATE
Income in Los Angeles County
Income Overview in Los Angeles County
Per Capita Income in Los Angeles County is $41,847, while median incomes of families and households are $93,675 and $83,411 respectively.
| Characteristic | Number | Measure |
| Per Capita Income | 9,936,690 | $41,847 |
| Median Family Income | 2,218,646 | $93,675 |
| Mean Family Income | 2,218,646 | $133,537 |
| Median Household Income | 3,363,093 | $83,411 |
| Mean Household Income | 3,363,093 | $119,756 |
| Income Deficit | 2,218,646 | $11,092 |
| Wage / Income Gap (%) | 9,936,690 | 20.75% |
| Wage / Income Gap ($) | 9,936,690 | 79.25¢ per $1 |
| Gini / Inequality Index | 9,936,690 | 0.50 |
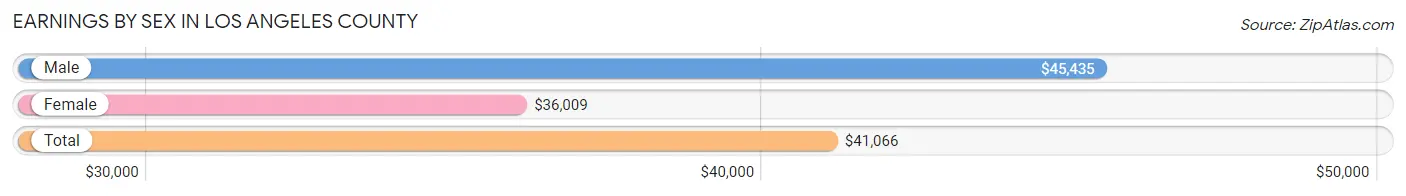
Earnings by Sex in Los Angeles County
Average Earnings in Los Angeles County are $41,066, $45,435 for men and $36,009 for women, a difference of 20.7%.
| Sex | Number | Average Earnings |
| Male | 2,859,852 (53.8%) | $45,435 |
| Female | 2,458,014 (46.2%) | $36,009 |
| Total | 5,317,866 (100.0%) | $41,066 |
Earnings by Sex by Income Bracket in Los Angeles County
The most common earnings brackets in Los Angeles County are $100,000+ for men (581,812 | 20.3%) and $100,000+ for women (337,214 | 13.7%).
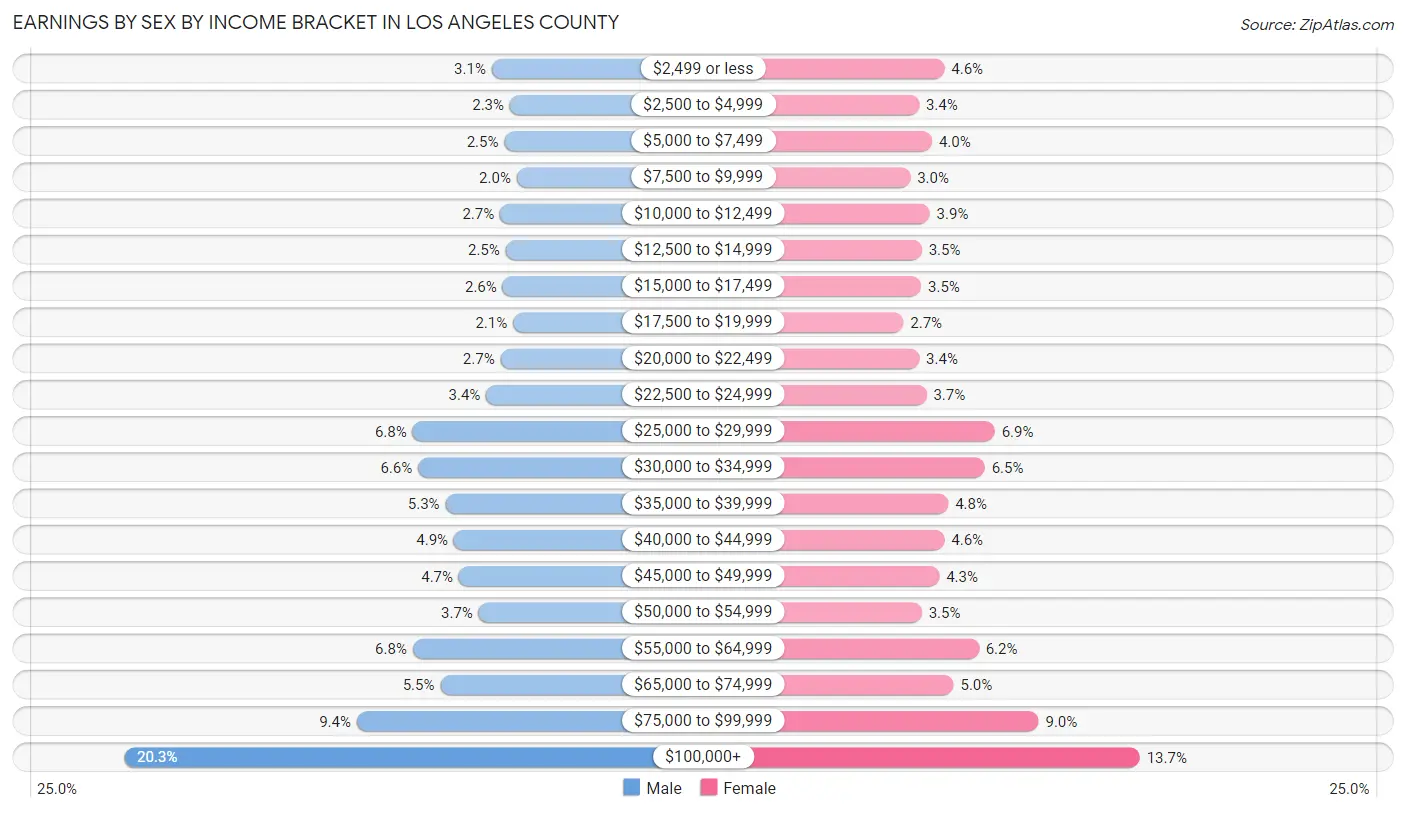
| Income | Male | Female |
| $2,499 or less | 89,272 (3.1%) | 112,382 (4.6%) |
| $2,500 to $4,999 | 64,983 (2.3%) | 83,183 (3.4%) |
| $5,000 to $7,499 | 72,493 (2.5%) | 98,034 (4.0%) |
| $7,500 to $9,999 | 55,749 (1.9%) | 72,893 (3.0%) |
| $10,000 to $12,499 | 78,169 (2.7%) | 95,427 (3.9%) |
| $12,500 to $14,999 | 70,528 (2.5%) | 86,294 (3.5%) |
| $15,000 to $17,499 | 74,547 (2.6%) | 85,466 (3.5%) |
| $17,500 to $19,999 | 60,679 (2.1%) | 65,142 (2.6%) |
| $20,000 to $22,499 | 77,368 (2.7%) | 83,424 (3.4%) |
| $22,500 to $24,999 | 96,719 (3.4%) | 91,683 (3.7%) |
| $25,000 to $29,999 | 195,334 (6.8%) | 170,433 (6.9%) |
| $30,000 to $34,999 | 187,994 (6.6%) | 158,851 (6.5%) |
| $35,000 to $39,999 | 151,184 (5.3%) | 116,772 (4.8%) |
| $40,000 to $44,999 | 139,822 (4.9%) | 112,390 (4.6%) |
| $45,000 to $49,999 | 133,315 (4.7%) | 106,521 (4.3%) |
| $50,000 to $54,999 | 106,739 (3.7%) | 86,356 (3.5%) |
| $55,000 to $64,999 | 194,951 (6.8%) | 151,867 (6.2%) |
| $65,000 to $74,999 | 158,197 (5.5%) | 122,978 (5.0%) |
| $75,000 to $99,999 | 269,997 (9.4%) | 220,704 (9.0%) |
| $100,000+ | 581,812 (20.3%) | 337,214 (13.7%) |
| Total | 2,859,852 (100.0%) | 2,458,014 (100.0%) |
Earnings by Sex by Educational Attainment in Los Angeles County
Average earnings in Los Angeles County are $50,755 for men and $41,504 for women, a difference of 18.2%. Men with an educational attainment of graduate degree enjoy the highest average annual earnings of $108,774, while those with less than high school education earn the least with $32,344. Women with an educational attainment of graduate degree earn the most with the average annual earnings of $84,269, while those with less than high school education have the smallest earnings of $22,775.
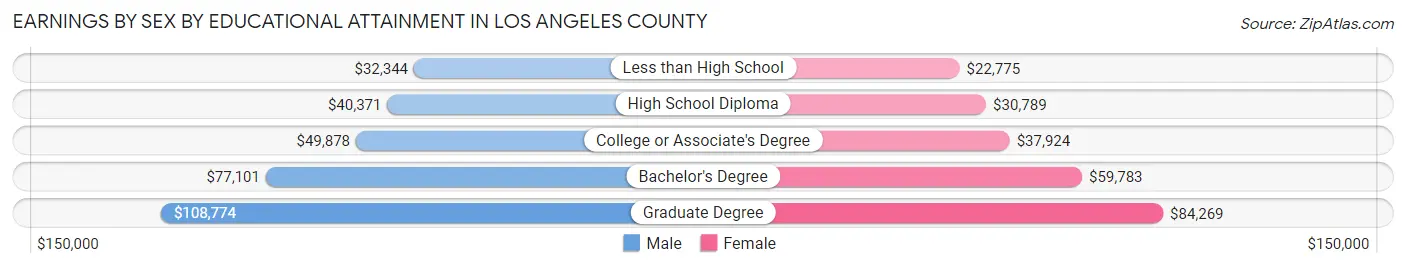
| Educational Attainment | Male Income | Female Income |
| Less than High School | $32,344 | $22,775 |
| High School Diploma | $40,371 | $30,789 |
| College or Associate's Degree | $49,878 | $37,924 |
| Bachelor's Degree | $77,101 | $59,783 |
| Graduate Degree | $108,774 | $84,269 |
| Total | $50,755 | $41,504 |
Family Income in Los Angeles County
Family Income Brackets in Los Angeles County
According to the Los Angeles County family income data, there are 412,668 families falling into the $100,000 to $149,999 income range, which is the most common income bracket and makes up 18.6% of all families. Conversely, the $10,000 to $14,999 income bracket is the least frequent group with only 42,154 families (1.9%) belonging to this category.
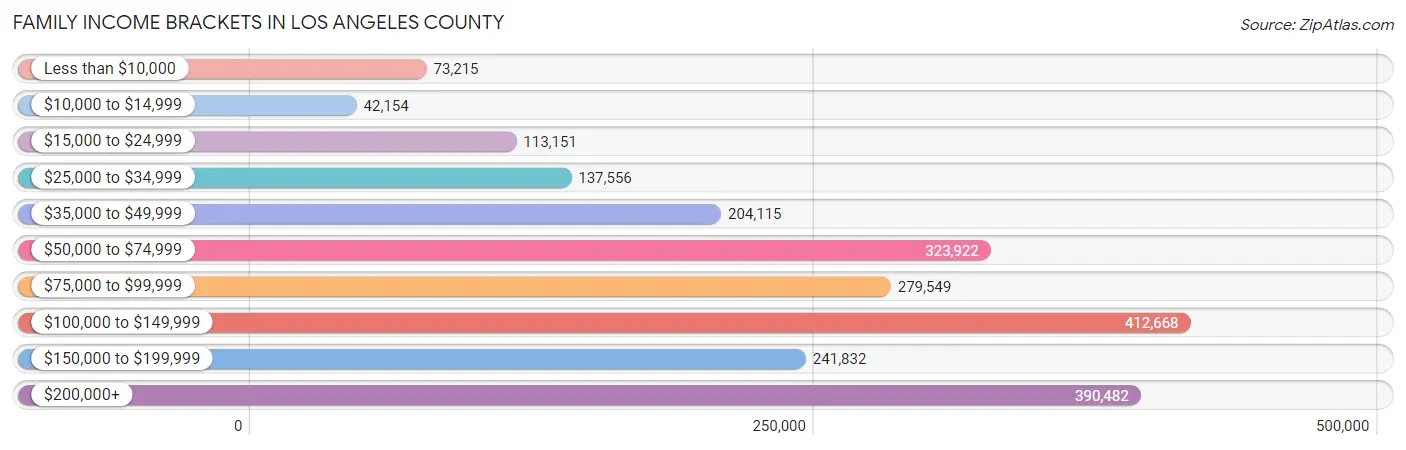
| Income Bracket | # Families | % Families |
| Less than $10,000 | 73,215 | 3.3% |
| $10,000 to $14,999 | 42,154 | 1.9% |
| $15,000 to $24,999 | 113,151 | 5.1% |
| $25,000 to $34,999 | 137,556 | 6.2% |
| $35,000 to $49,999 | 204,115 | 9.2% |
| $50,000 to $74,999 | 323,922 | 14.6% |
| $75,000 to $99,999 | 279,549 | 12.6% |
| $100,000 to $149,999 | 412,668 | 18.6% |
| $150,000 to $199,999 | 241,832 | 10.9% |
| $200,000+ | 390,482 | 17.6% |
Family Income by Famaliy Size in Los Angeles County
7+ person families (77,454 | 3.5%) account for the highest median family income in Los Angeles County with $121,923 per family, while 2-person families (811,472 | 36.6%) have the highest median income of $41,458 per family member.
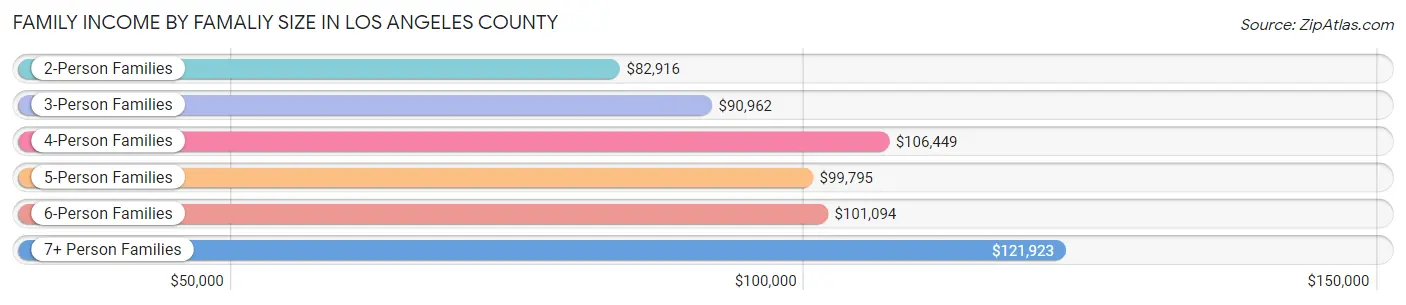
| Income Bracket | # Families | Median Income |
| 2-Person Families | 811,472 (36.6%) | $82,916 |
| 3-Person Families | 530,209 (23.9%) | $90,962 |
| 4-Person Families | 464,200 (20.9%) | $106,449 |
| 5-Person Families | 237,488 (10.7%) | $99,795 |
| 6-Person Families | 97,823 (4.4%) | $101,094 |
| 7+ Person Families | 77,454 (3.5%) | $121,923 |
| Total | 2,218,646 (100.0%) | $93,675 |
Family Income by Number of Earners in Los Angeles County
The median family income in Los Angeles County is $93,675, with families comprising 3+ earners (380,175) having the highest median family income of $135,991, while families with no earners (242,301) have the lowest median family income of $33,758, accounting for 17.1% and 10.9% of families, respectively.
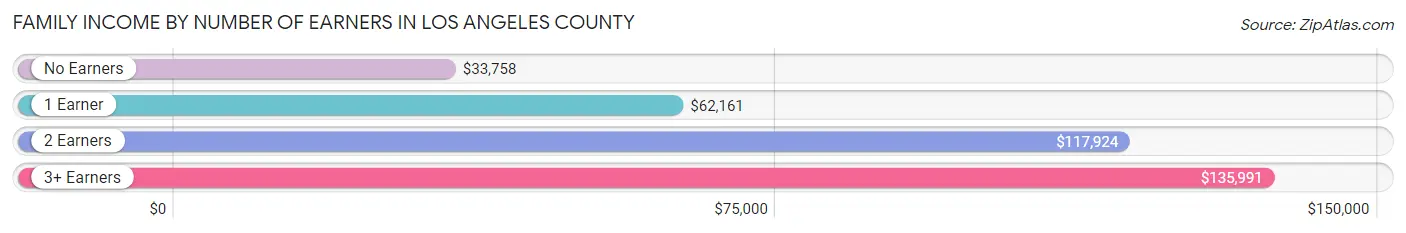
| Number of Earners | # Families | Median Income |
| No Earners | 242,301 (10.9%) | $33,758 |
| 1 Earner | 704,801 (31.8%) | $62,161 |
| 2 Earners | 891,369 (40.2%) | $117,924 |
| 3+ Earners | 380,175 (17.1%) | $135,991 |
| Total | 2,218,646 (100.0%) | $93,675 |
Household Income in Los Angeles County
Household Income Brackets in Los Angeles County
With 585,178 households falling in the category, the $100,000 to $149,999 income range is the most frequent in Los Angeles County, accounting for 17.4% of all households. In contrast, only 131,161 households (3.9%) fall into the $10,000 to $14,999 income bracket, making it the least populous group.
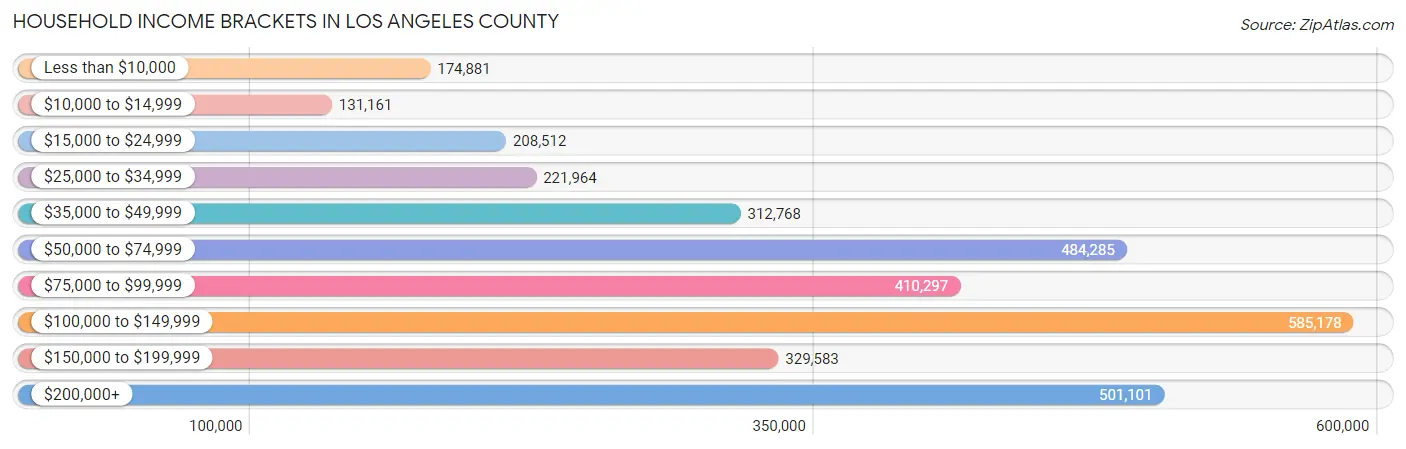
| Income Bracket | # Households | % Households |
| Less than $10,000 | 174,881 | 5.2% |
| $10,000 to $14,999 | 131,161 | 3.9% |
| $15,000 to $24,999 | 208,512 | 6.2% |
| $25,000 to $34,999 | 221,964 | 6.6% |
| $35,000 to $49,999 | 312,768 | 9.3% |
| $50,000 to $74,999 | 484,285 | 14.4% |
| $75,000 to $99,999 | 410,297 | 12.2% |
| $100,000 to $149,999 | 585,178 | 17.4% |
| $150,000 to $199,999 | 329,583 | 9.8% |
| $200,000+ | 501,101 | 14.9% |
Household Income by Householder Age in Los Angeles County
The median household income in Los Angeles County is $83,411, with the highest median household income of $94,252 found in the 45 to 64 years age bracket for the primary householder. A total of 1,314,495 households (39.1%) fall into this category. Meanwhile, the 15 to 24 years age bracket for the primary householder has the lowest median household income of $50,204, with 86,436 households (2.6%) in this group.
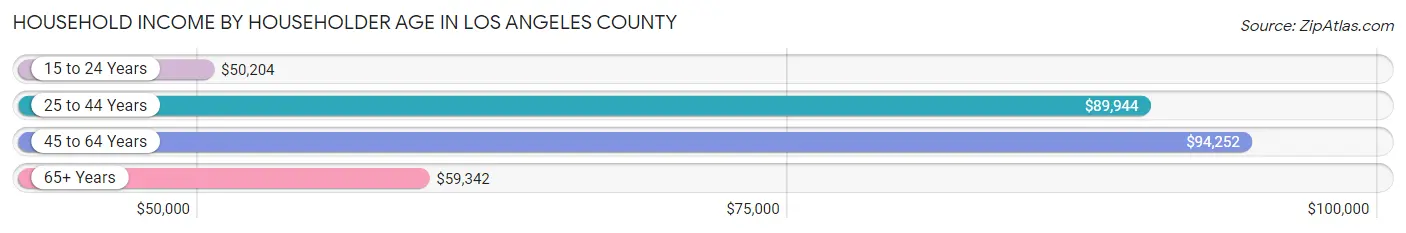
| Income Bracket | # Households | Median Income |
| 15 to 24 Years | 86,436 (2.6%) | $50,204 |
| 25 to 44 Years | 1,185,714 (35.3%) | $89,944 |
| 45 to 64 Years | 1,314,495 (39.1%) | $94,252 |
| 65+ Years | 776,448 (23.1%) | $59,342 |
| Total | 3,363,093 (100.0%) | $83,411 |
Poverty in Los Angeles County
Income Below Poverty by Sex and Age in Los Angeles County
With 12.5% poverty level for males and 14.9% for females among the residents of Los Angeles County, 15 year old males and 15 year old females are the most vulnerable to poverty, with 11,809 males (18.9%) and 12,202 females (19.8%) in their respective age groups living below the poverty level.
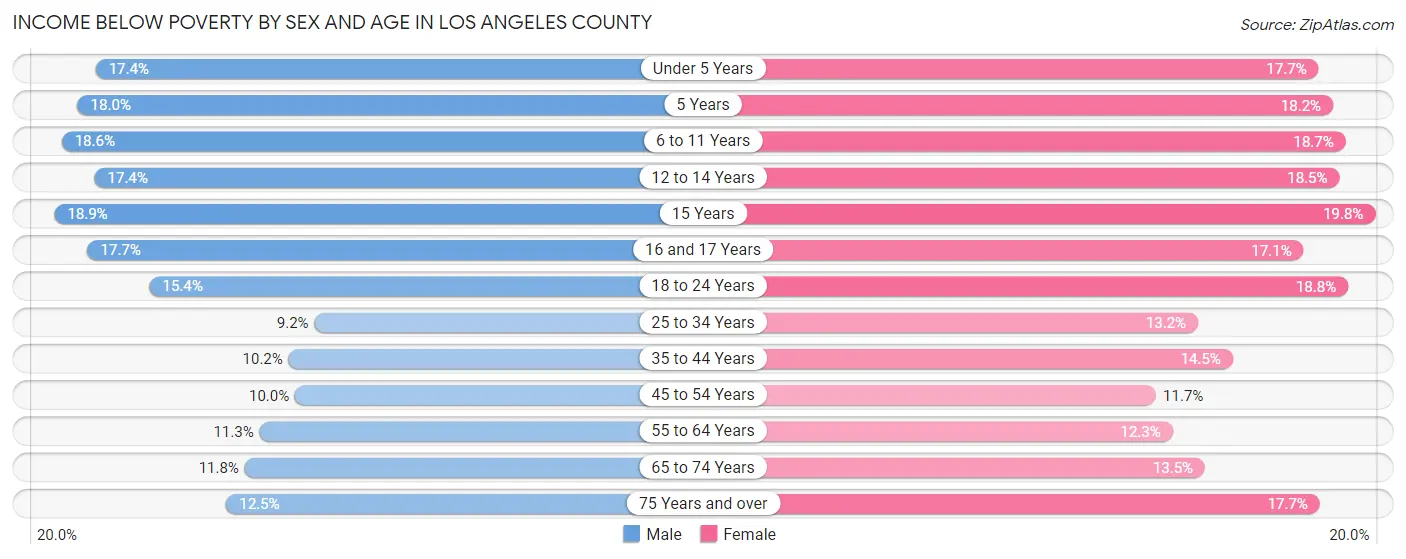
| Age Bracket | Male | Female |
| Under 5 Years | 46,897 (17.4%) | 45,687 (17.7%) |
| 5 Years | 9,583 (18.0%) | 9,372 (18.2%) |
| 6 to 11 Years | 65,702 (18.6%) | 62,763 (18.7%) |
| 12 to 14 Years | 33,590 (17.4%) | 33,354 (18.5%) |
| 15 Years | 11,809 (18.9%) | 12,202 (19.8%) |
| 16 and 17 Years | 21,978 (17.7%) | 20,024 (17.1%) |
| 18 to 24 Years | 68,441 (15.4%) | 80,569 (18.8%) |
| 25 to 34 Years | 73,984 (9.2%) | 102,208 (13.2%) |
| 35 to 44 Years | 71,308 (10.2%) | 97,914 (14.5%) |
| 45 to 54 Years | 65,657 (10.0%) | 76,194 (11.7%) |
| 55 to 64 Years | 66,633 (11.3%) | 75,195 (12.3%) |
| 65 to 74 Years | 44,202 (11.8%) | 58,683 (13.5%) |
| 75 Years and over | 29,067 (12.5%) | 60,962 (17.7%) |
| Total | 608,851 (12.5%) | 735,127 (14.9%) |
Income Above Poverty by Sex and Age in Los Angeles County
According to the poverty statistics in Los Angeles County, males aged 25 to 34 years and females aged 45 to 54 years are the age groups that are most secure financially, with 90.8% of males and 88.3% of females in these age groups living above the poverty line.
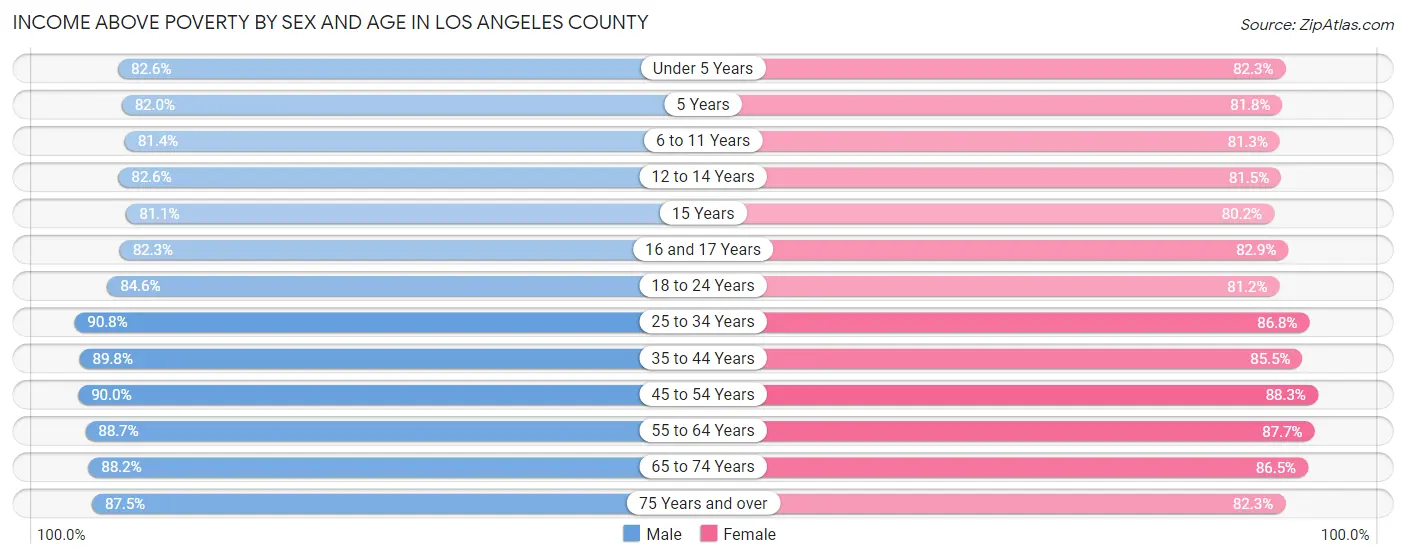
| Age Bracket | Male | Female |
| Under 5 Years | 223,195 (82.6%) | 212,423 (82.3%) |
| 5 Years | 43,582 (82.0%) | 42,045 (81.8%) |
| 6 to 11 Years | 287,138 (81.4%) | 272,906 (81.3%) |
| 12 to 14 Years | 159,442 (82.6%) | 147,233 (81.5%) |
| 15 Years | 50,697 (81.1%) | 49,425 (80.2%) |
| 16 and 17 Years | 102,463 (82.3%) | 96,792 (82.9%) |
| 18 to 24 Years | 377,213 (84.6%) | 348,290 (81.2%) |
| 25 to 34 Years | 726,634 (90.8%) | 670,648 (86.8%) |
| 35 to 44 Years | 627,990 (89.8%) | 576,973 (85.5%) |
| 45 to 54 Years | 593,310 (90.0%) | 576,706 (88.3%) |
| 55 to 64 Years | 524,047 (88.7%) | 537,323 (87.7%) |
| 65 to 74 Years | 329,586 (88.2%) | 376,570 (86.5%) |
| 75 Years and over | 203,256 (87.5%) | 282,737 (82.3%) |
| Total | 4,248,553 (87.5%) | 4,190,071 (85.1%) |
Income Below Poverty Among Married-Couple Families in Los Angeles County
The poverty statistics for married-couple families in Los Angeles County show that 6.3% or 94,068 of the total 1,482,931 families live below the poverty line. Families with 5 or more children have the highest poverty rate of 24.4%, comprising of 2,208 families. On the other hand, families with no children have the lowest poverty rate of 4.6%, which includes 37,193 families.
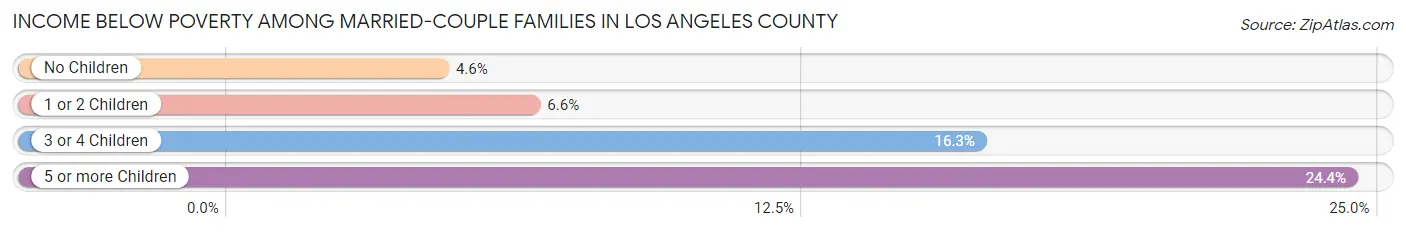
| Children | Above Poverty | Below Poverty |
| No Children | 772,274 (95.4%) | 37,193 (4.6%) |
| 1 or 2 Children | 515,087 (93.4%) | 36,251 (6.6%) |
| 3 or 4 Children | 94,650 (83.7%) | 18,416 (16.3%) |
| 5 or more Children | 6,852 (75.6%) | 2,208 (24.4%) |
| Total | 1,388,863 (93.7%) | 94,068 (6.3%) |
Income Below Poverty Among Single-Parent Households in Los Angeles County
According to the poverty data in Los Angeles County, 11.9% or 28,667 single-father households and 20.0% or 98,762 single-mother households are living below the poverty line. Among single-father households, those with 5 or more children have the highest poverty rate, with 707 households (43.5%) experiencing poverty. Likewise, among single-mother households, those with 5 or more children have the highest poverty rate, with 2,956 households (53.9%) falling below the poverty line.
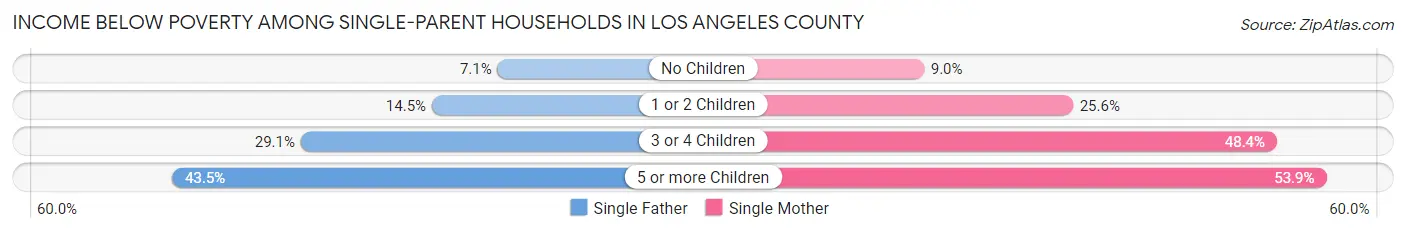
| Children | Single Father | Single Mother |
| No Children | 9,151 (7.1%) | 21,024 (8.9%) |
| 1 or 2 Children | 13,565 (14.5%) | 53,917 (25.6%) |
| 3 or 4 Children | 5,244 (29.1%) | 20,865 (48.4%) |
| 5 or more Children | 707 (43.5%) | 2,956 (53.9%) |
| Total | 28,667 (11.9%) | 98,762 (20.0%) |
Income Below Poverty Among Married-Couple vs Single-Parent Households in Los Angeles County
The poverty data for Los Angeles County shows that 94,068 of the married-couple family households (6.3%) and 127,429 of the single-parent households (17.3%) are living below the poverty level. Within the married-couple family households, those with 5 or more children have the highest poverty rate, with 2,208 households (24.4%) falling below the poverty line. Among the single-parent households, those with 5 or more children have the highest poverty rate, with 3,663 household (51.6%) living below poverty.
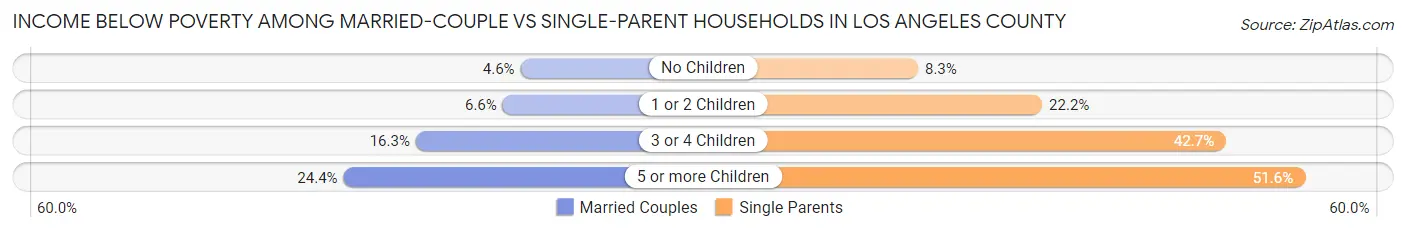
| Children | Married-Couple Families | Single-Parent Households |
| No Children | 37,193 (4.6%) | 30,175 (8.3%) |
| 1 or 2 Children | 36,251 (6.6%) | 67,482 (22.2%) |
| 3 or 4 Children | 18,416 (16.3%) | 26,109 (42.7%) |
| 5 or more Children | 2,208 (24.4%) | 3,663 (51.6%) |
| Total | 94,068 (6.3%) | 127,429 (17.3%) |
Race in Los Angeles County
The most populous races in Los Angeles County are Hispanic or Latino (4,837,594 | 48.7%), White / Caucasian (3,937,901 | 39.6%), and Some other Race (2,253,956 | 22.7%).
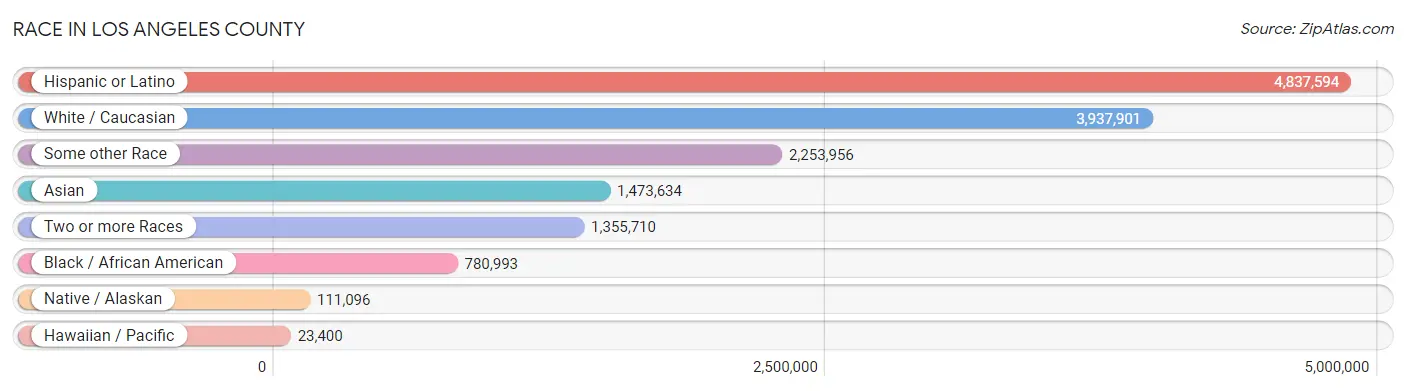
| Race | # Population | % Population |
| Asian | 1,473,634 | 14.8% |
| Black / African American | 780,993 | 7.9% |
| Hawaiian / Pacific | 23,400 | 0.2% |
| Hispanic or Latino | 4,837,594 | 48.7% |
| Native / Alaskan | 111,096 | 1.1% |
| White / Caucasian | 3,937,901 | 39.6% |
| Two or more Races | 1,355,710 | 13.6% |
| Some other Race | 2,253,956 | 22.7% |
| Total | 9,936,690 | 100.0% |
Ancestry in Los Angeles County
The most populous ancestries reported in Los Angeles County are Mexican (3,586,953 | 36.1%), Central American (835,935 | 8.4%), Indian (Asian) (517,044 | 5.2%), Salvadoran (438,782 | 4.4%), and German (420,916 | 4.2%), together accounting for 58.4% of all Los Angeles County residents.
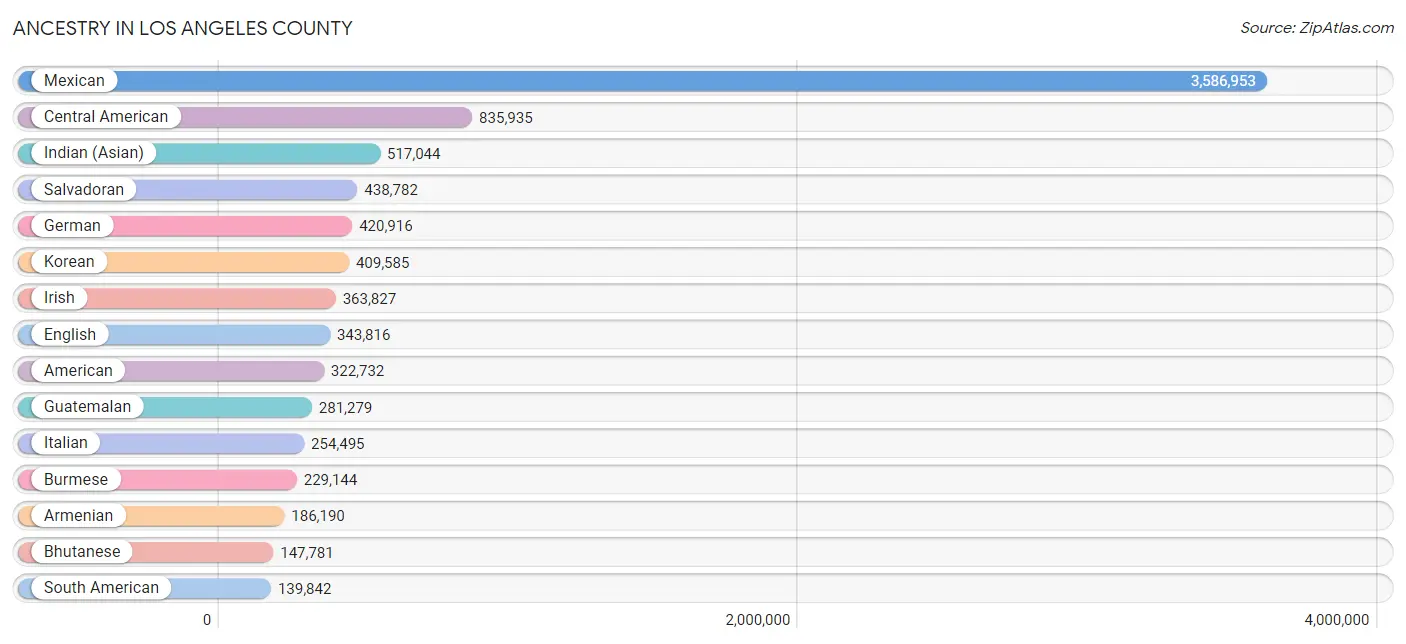
| Ancestry | # Population | % Population |
| Afghan | 5,239 | 0.1% |
| African | 43,863 | 0.4% |
| Alaska Native | 274 | 0.0% |
| Alaskan Athabascan | 53 | 0.0% |
| Albanian | 1,219 | 0.0% |
| Aleut | 79 | 0.0% |
| Alsatian | 76 | 0.0% |
| American | 322,732 | 3.3% |
| Apache | 6,838 | 0.1% |
| Arab | 78,768 | 0.8% |
| Arapaho | 52 | 0.0% |
| Argentinean | 21,258 | 0.2% |
| Armenian | 186,190 | 1.9% |
| Assyrian / Chaldean / Syriac | 3,056 | 0.0% |
| Australian | 5,264 | 0.1% |
| Austrian | 14,980 | 0.2% |
| Bahamian | 649 | 0.0% |
| Bangladeshi | 1,365 | 0.0% |
| Barbadian | 681 | 0.0% |
| Basque | 2,453 | 0.0% |
| Belgian | 4,030 | 0.0% |
| Belizean | 15,540 | 0.2% |
| Bermudan | 55 | 0.0% |
| Bhutanese | 147,781 | 1.5% |
| Blackfeet | 4,760 | 0.1% |
| Bolivian | 5,072 | 0.1% |
| Brazilian | 13,470 | 0.1% |
| British | 40,887 | 0.4% |
| British West Indian | 1,014 | 0.0% |
| Bulgarian | 2,802 | 0.0% |
| Burmese | 229,144 | 2.3% |
| Cajun | 600 | 0.0% |
| Cambodian | 2,659 | 0.0% |
| Canadian | 15,385 | 0.2% |
| Cape Verdean | 710 | 0.0% |
| Carpatho Rusyn | 83 | 0.0% |
| Celtic | 472 | 0.0% |
| Central American | 835,935 | 8.4% |
| Central American Indian | 31,839 | 0.3% |
| Cherokee | 17,836 | 0.2% |
| Cheyenne | 366 | 0.0% |
| Chickasaw | 1,211 | 0.0% |
| Chilean | 8,777 | 0.1% |
| Chinese | 586 | 0.0% |
| Chippewa | 1,505 | 0.0% |
| Choctaw | 4,541 | 0.1% |
| Colombian | 34,176 | 0.3% |
| Colville | 89 | 0.0% |
| Comanche | 584 | 0.0% |
| Costa Rican | 9,996 | 0.1% |
| Cree | 202 | 0.0% |
| Creek | 1,197 | 0.0% |
| Croatian | 11,886 | 0.1% |
| Crow | 40 | 0.0% |
| Cuban | 40,264 | 0.4% |
| Cypriot | 149 | 0.0% |
| Czech | 14,773 | 0.2% |
| Czechoslovakian | 4,020 | 0.0% |
| Danish | 20,152 | 0.2% |
| Delaware | 496 | 0.0% |
| Dominican | 6,968 | 0.1% |
| Dutch | 42,718 | 0.4% |
| Dutch West Indian | 129 | 0.0% |
| Eastern European | 37,837 | 0.4% |
| Ecuadorian | 21,269 | 0.2% |
| Egyptian | 18,636 | 0.2% |
| English | 343,816 | 3.5% |
| Estonian | 992 | 0.0% |
| Ethiopian | 10,175 | 0.1% |
| European | 113,315 | 1.1% |
| Fijian | 52 | 0.0% |
| Filipino | 39,045 | 0.4% |
| Finnish | 8,521 | 0.1% |
| French | 105,206 | 1.1% |
| French American Indian | 1,079 | 0.0% |
| French Canadian | 15,982 | 0.2% |
| German | 420,916 | 4.2% |
| German Russian | 221 | 0.0% |
| Ghanaian | 2,950 | 0.0% |
| Greek | 26,771 | 0.3% |
| Guamanian / Chamorro | 6,866 | 0.1% |
| Guatemalan | 281,279 | 2.8% |
| Guyanese | 1,304 | 0.0% |
| Haitian | 4,804 | 0.1% |
| Hmong | 56 | 0.0% |
| Honduran | 56,224 | 0.6% |
| Hopi | 429 | 0.0% |
| Houma | 1 | 0.0% |
| Hungarian | 27,692 | 0.3% |
| Icelander | 1,330 | 0.0% |
| Indian (Asian) | 517,044 | 5.2% |
| Indonesian | 8,052 | 0.1% |
| Inupiat | 270 | 0.0% |
| Iranian | 83,511 | 0.8% |
| Iraqi | 2,752 | 0.0% |
| Irish | 363,827 | 3.7% |
| Iroquois | 1,084 | 0.0% |
| Israeli | 15,002 | 0.2% |
| Italian | 254,495 | 2.6% |
| Jamaican | 14,764 | 0.2% |
| Japanese | 40,105 | 0.4% |
| Jordanian | 3,409 | 0.0% |
| Kenyan | 1,768 | 0.0% |
| Kiowa | 128 | 0.0% |
| Korean | 409,585 | 4.1% |
| Laotian | 14,903 | 0.2% |
| Latvian | 2,632 | 0.0% |
| Lebanese | 20,215 | 0.2% |
| Liberian | 637 | 0.0% |
| Lithuanian | 10,740 | 0.1% |
| Lumbee | 251 | 0.0% |
| Luxembourger | 324 | 0.0% |
| Macedonian | 643 | 0.0% |
| Malaysian | 5,178 | 0.1% |
| Maltese | 616 | 0.0% |
| Menominee | 55 | 0.0% |
| Mexican | 3,586,953 | 36.1% |
| Mexican American Indian | 67,394 | 0.7% |
| Mongolian | 1,442 | 0.0% |
| Moroccan | 3,762 | 0.0% |
| Native Hawaiian | 14,406 | 0.1% |
| Navajo | 6,143 | 0.1% |
| Nepalese | 183 | 0.0% |
| New Zealander | 952 | 0.0% |
| Nicaraguan | 36,877 | 0.4% |
| Nigerian | 17,893 | 0.2% |
| Northern European | 11,398 | 0.1% |
| Norwegian | 47,506 | 0.5% |
| Okinawan | 620 | 0.0% |
| Osage | 404 | 0.0% |
| Ottawa | 126 | 0.0% |
| Paiute | 727 | 0.0% |
| Pakistani | 28,301 | 0.3% |
| Palestinian | 4,997 | 0.1% |
| Panamanian | 5,170 | 0.1% |
| Paraguayan | 363 | 0.0% |
| Pennsylvania German | 592 | 0.0% |
| Peruvian | 37,550 | 0.4% |
| Pima | 442 | 0.0% |
| Polish | 104,762 | 1.1% |
| Portuguese | 23,309 | 0.2% |
| Potawatomi | 307 | 0.0% |
| Pueblo | 1,913 | 0.0% |
| Puerto Rican | 47,349 | 0.5% |
| Puget Sound Salish | 74 | 0.0% |
| Romanian | 15,285 | 0.2% |
| Russian | 109,202 | 1.1% |
| Salvadoran | 438,782 | 4.4% |
| Samoan | 12,936 | 0.1% |
| Scandinavian | 13,750 | 0.1% |
| Scotch-Irish | 27,587 | 0.3% |
| Scottish | 68,373 | 0.7% |
| Seminole | 795 | 0.0% |
| Senegalese | 264 | 0.0% |
| Serbian | 4,523 | 0.1% |
| Shoshone | 185 | 0.0% |
| Sierra Leonean | 701 | 0.0% |
| Sioux | 2,174 | 0.0% |
| Slavic | 2,817 | 0.0% |
| Slovak | 5,089 | 0.1% |
| Slovene | 2,422 | 0.0% |
| Somali | 147 | 0.0% |
| South African | 3,163 | 0.0% |
| South American | 139,842 | 1.4% |
| South American Indian | 2,718 | 0.0% |
| Soviet Union | 283 | 0.0% |
| Spaniard | 35,157 | 0.4% |
| Spanish | 26,068 | 0.3% |
| Spanish American | 1,266 | 0.0% |
| Spanish American Indian | 8,114 | 0.1% |
| Sri Lankan | 126,781 | 1.3% |
| Subsaharan African | 87,641 | 0.9% |
| Sudanese | 986 | 0.0% |
| Swedish | 49,903 | 0.5% |
| Swiss | 13,357 | 0.1% |
| Syrian | 7,518 | 0.1% |
| Taiwanese | 253 | 0.0% |
| Thai | 114,278 | 1.1% |
| Tlingit-Haida | 113 | 0.0% |
| Tohono O'Odham | 816 | 0.0% |
| Tongan | 2,888 | 0.0% |
| Trinidadian and Tobagonian | 2,358 | 0.0% |
| Turkish | 6,967 | 0.1% |
| U.S. Virgin Islander | 297 | 0.0% |
| Ugandan | 625 | 0.0% |
| Ukrainian | 27,337 | 0.3% |
| Uruguayan | 2,264 | 0.0% |
| Ute | 311 | 0.0% |
| Venezuelan | 7,396 | 0.1% |
| Vietnamese | 7,658 | 0.1% |
| Welsh | 21,810 | 0.2% |
| West Indian | 3,320 | 0.0% |
| Yakama | 39 | 0.0% |
| Yaqui | 3,697 | 0.0% |
| Yugoslavian | 2,799 | 0.0% |
| Yuman | 456 | 0.0% |
| Yup'ik | 27 | 0.0% |
| Zimbabwean | 262 | 0.0% | View All 198 Rows |
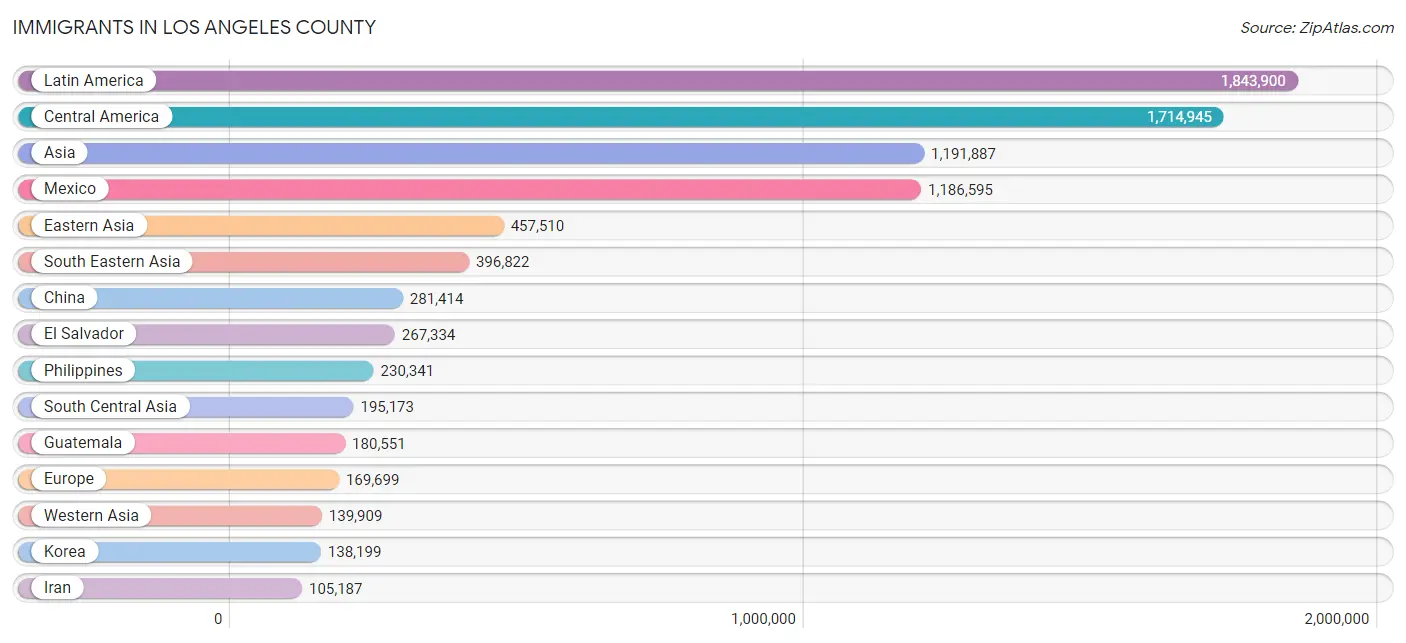
Immigrants in Los Angeles County
The most numerous immigrant groups reported in Los Angeles County came from Latin America (1,843,900 | 18.6%), Central America (1,714,945 | 17.3%), Asia (1,191,887 | 12.0%), Mexico (1,186,595 | 11.9%), and Eastern Asia (457,510 | 4.6%), together accounting for 64.3% of all Los Angeles County residents.
| Immigration Origin | # Population | % Population |
| Afghanistan | 3,825 | 0.0% |
| Africa | 62,527 | 0.6% |
| Albania | 398 | 0.0% |
| Argentina | 13,709 | 0.1% |
| Armenia | 70,473 | 0.7% |
| Asia | 1,191,887 | 12.0% |
| Australia | 7,692 | 0.1% |
| Austria | 2,122 | 0.0% |
| Azores | 233 | 0.0% |
| Bahamas | 325 | 0.0% |
| Bangladesh | 9,129 | 0.1% |
| Barbados | 391 | 0.0% |
| Belarus | 2,752 | 0.0% |
| Belgium | 1,444 | 0.0% |
| Belize | 12,428 | 0.1% |
| Bolivia | 3,315 | 0.0% |
| Bosnia and Herzegovina | 833 | 0.0% |
| Brazil | 13,849 | 0.1% |
| Bulgaria | 2,611 | 0.0% |
| Cabo Verde | 17 | 0.0% |
| Cambodia | 21,116 | 0.2% |
| Cameroon | 1,045 | 0.0% |
| Canada | 27,540 | 0.3% |
| Caribbean | 29,911 | 0.3% |
| Central America | 1,714,945 | 17.3% |
| Chile | 5,057 | 0.1% |
| China | 281,414 | 2.8% |
| Colombia | 18,154 | 0.2% |
| Congo | 342 | 0.0% |
| Costa Rica | 4,591 | 0.1% |
| Croatia | 1,782 | 0.0% |
| Cuba | 14,892 | 0.2% |
| Czechoslovakia | 2,577 | 0.0% |
| Denmark | 1,545 | 0.0% |
| Dominica | 398 | 0.0% |
| Dominican Republic | 2,324 | 0.0% |
| Eastern Africa | 14,344 | 0.1% |
| Eastern Asia | 457,510 | 4.6% |
| Eastern Europe | 73,897 | 0.7% |
| Ecuador | 11,012 | 0.1% |
| Egypt | 14,188 | 0.1% |
| El Salvador | 267,334 | 2.7% |
| England | 14,785 | 0.2% |
| Eritrea | 1,236 | 0.0% |
| Ethiopia | 6,639 | 0.1% |
| Europe | 169,699 | 1.7% |
| Fiji | 2,703 | 0.0% |
| France | 10,944 | 0.1% |
| Germany | 14,957 | 0.2% |
| Ghana | 2,819 | 0.0% |
| Greece | 3,141 | 0.0% |
| Grenada | 240 | 0.0% |
| Guatemala | 180,551 | 1.8% |
| Guyana | 1,429 | 0.0% |
| Haiti | 1,716 | 0.0% |
| Honduras | 37,517 | 0.4% |
| Hong Kong | 27,039 | 0.3% |
| Hungary | 3,492 | 0.0% |
| India | 57,971 | 0.6% |
| Indonesia | 12,503 | 0.1% |
| Iran | 105,187 | 1.1% |
| Iraq | 6,795 | 0.1% |
| Ireland | 2,709 | 0.0% |
| Israel | 15,476 | 0.2% |
| Italy | 8,654 | 0.1% |
| Jamaica | 6,340 | 0.1% |
| Japan | 36,409 | 0.4% |
| Jordan | 3,802 | 0.0% |
| Kazakhstan | 2,084 | 0.0% |
| Kenya | 2,548 | 0.0% |
| Korea | 138,199 | 1.4% |
| Kuwait | 1,797 | 0.0% |
| Laos | 2,616 | 0.0% |
| Latin America | 1,843,900 | 18.6% |
| Latvia | 844 | 0.0% |
| Lebanon | 15,414 | 0.2% |
| Liberia | 541 | 0.0% |
| Lithuania | 1,285 | 0.0% |
| Malaysia | 4,170 | 0.0% |
| Mexico | 1,186,595 | 11.9% |
| Micronesia | 358 | 0.0% |
| Middle Africa | 2,111 | 0.0% |
| Moldova | 1,715 | 0.0% |
| Morocco | 2,275 | 0.0% |
| Nepal | 2,807 | 0.0% |
| Netherlands | 3,895 | 0.0% |
| Nicaragua | 21,480 | 0.2% |
| Nigeria | 13,884 | 0.1% |
| North Macedonia | 145 | 0.0% |
| Northern Africa | 19,041 | 0.2% |
| Northern Europe | 42,373 | 0.4% |
| Norway | 668 | 0.0% |
| Oceania | 16,228 | 0.2% |
| Pakistan | 7,640 | 0.1% |
| Panama | 2,720 | 0.0% |
| Peru | 24,504 | 0.3% |
| Philippines | 230,341 | 2.3% |
| Poland | 5,641 | 0.1% |
| Portugal | 1,378 | 0.0% |
| Romania | 5,948 | 0.1% |
| Russia | 21,778 | 0.2% |
| Saudi Arabia | 1,266 | 0.0% |
| Scotland | 2,026 | 0.0% |
| Senegal | 272 | 0.0% |
| Serbia | 1,327 | 0.0% |
| Sierra Leone | 693 | 0.0% |
| Singapore | 2,376 | 0.0% |
| Somalia | 76 | 0.0% |
| South Africa | 5,486 | 0.1% |
| South America | 99,044 | 1.0% |
| South Central Asia | 195,173 | 2.0% |
| South Eastern Asia | 396,822 | 4.0% |
| Southern Europe | 17,466 | 0.2% |
| Spain | 4,151 | 0.0% |
| Sri Lanka | 3,822 | 0.0% |
| St. Vincent and the Grenadines | 74 | 0.0% |
| Sudan | 888 | 0.0% |
| Sweden | 3,308 | 0.0% |
| Switzerland | 2,090 | 0.0% |
| Syria | 11,537 | 0.1% |
| Taiwan | 61,102 | 0.6% |
| Thailand | 18,639 | 0.2% |
| Trinidad and Tobago | 1,893 | 0.0% |
| Turkey | 5,495 | 0.1% |
| Uganda | 1,618 | 0.0% |
| Ukraine | 15,888 | 0.2% |
| Uruguay | 1,428 | 0.0% |
| Uzbekistan | 1,954 | 0.0% |
| Venezuela | 5,747 | 0.1% |
| Vietnam | 95,644 | 1.0% |
| West Indies | 423 | 0.0% |
| Western Africa | 19,317 | 0.2% |
| Western Asia | 139,909 | 1.4% |
| Western Europe | 35,547 | 0.4% |
| Yemen | 52 | 0.0% |
| Zaire | 566 | 0.0% |
| Zimbabwe | 444 | 0.0% | View All 137 Rows |
Sex and Age in Los Angeles County
Sex and Age in Los Angeles County
The most populous age groups in Los Angeles County are 30 to 34 Years (407,998 | 8.3%) for men and 25 to 29 Years (389,008 | 7.8%) for women.
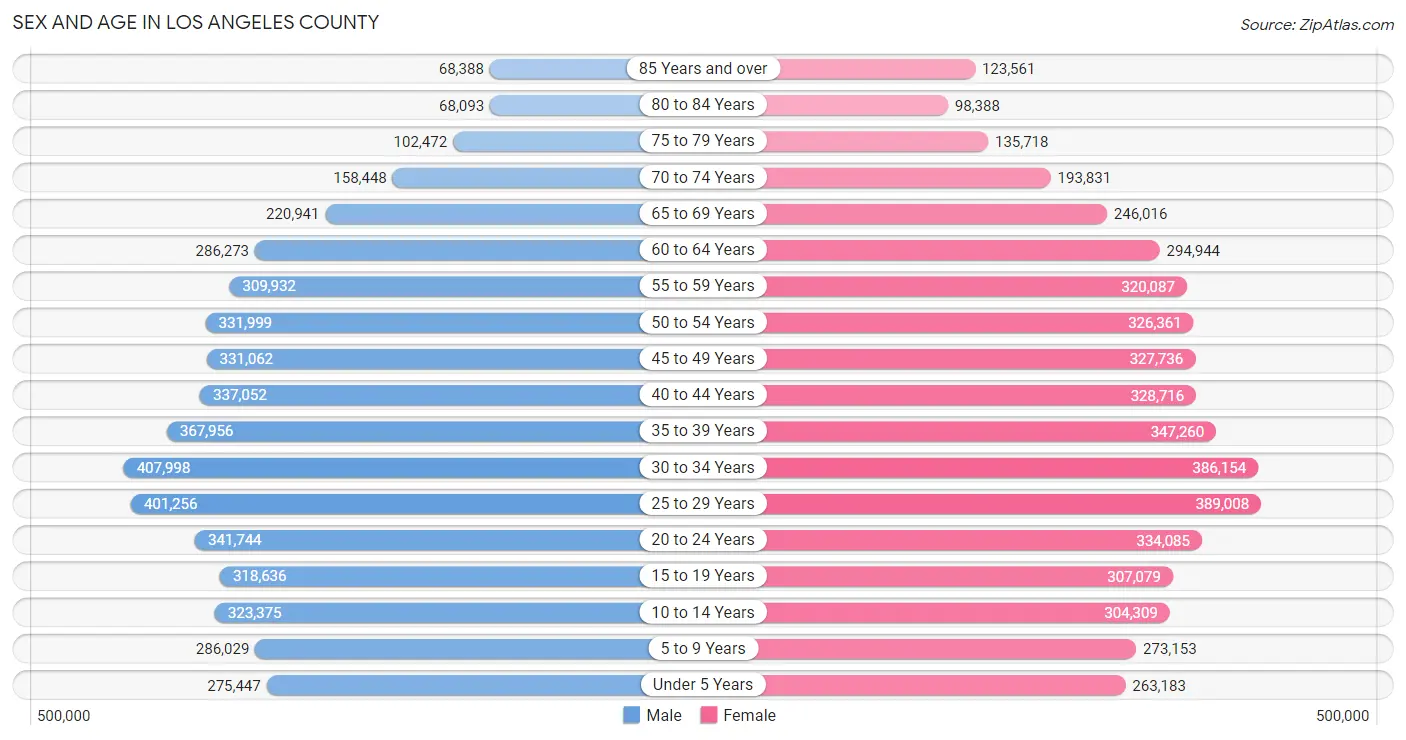
| Age Bracket | Male | Female |
| Under 5 Years | 275,447 (5.6%) | 263,183 (5.3%) |
| 5 to 9 Years | 286,029 (5.8%) | 273,153 (5.5%) |
| 10 to 14 Years | 323,375 (6.6%) | 304,309 (6.1%) |
| 15 to 19 Years | 318,636 (6.5%) | 307,079 (6.1%) |
| 20 to 24 Years | 341,744 (6.9%) | 334,085 (6.7%) |
| 25 to 29 Years | 401,256 (8.1%) | 389,008 (7.8%) |
| 30 to 34 Years | 407,998 (8.3%) | 386,154 (7.7%) |
| 35 to 39 Years | 367,956 (7.4%) | 347,260 (7.0%) |
| 40 to 44 Years | 337,052 (6.8%) | 328,716 (6.6%) |
| 45 to 49 Years | 331,062 (6.7%) | 327,736 (6.6%) |
| 50 to 54 Years | 331,999 (6.7%) | 326,361 (6.5%) |
| 55 to 59 Years | 309,932 (6.3%) | 320,087 (6.4%) |
| 60 to 64 Years | 286,273 (5.8%) | 294,944 (5.9%) |
| 65 to 69 Years | 220,941 (4.5%) | 246,016 (4.9%) |
| 70 to 74 Years | 158,448 (3.2%) | 193,831 (3.9%) |
| 75 to 79 Years | 102,472 (2.1%) | 135,718 (2.7%) |
| 80 to 84 Years | 68,093 (1.4%) | 98,388 (2.0%) |
| 85 Years and over | 68,388 (1.4%) | 123,561 (2.5%) |
| Total | 4,937,101 (100.0%) | 4,999,589 (100.0%) |
Families and Households in Los Angeles County
Median Family Size in Los Angeles County
The median family size in Los Angeles County is 3.56 persons per family, with married-couple families (1,482,931 | 66.8%) accounting for the largest median family size of 3.63 persons per family. On the other hand, single male/father families (241,546 | 10.9%) represent the smallest median family size with 3.26 persons per family.
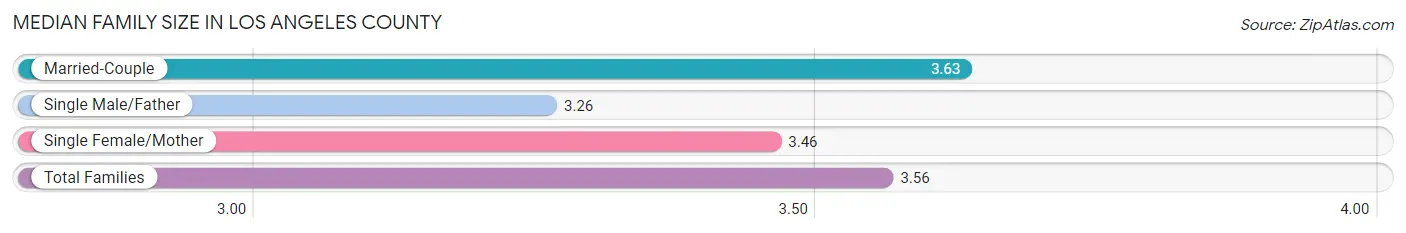
| Family Type | # Families | Family Size |
| Married-Couple | 1,482,931 (66.8%) | 3.63 |
| Single Male/Father | 241,546 (10.9%) | 3.26 |
| Single Female/Mother | 494,169 (22.3%) | 3.46 |
| Total Families | 2,218,646 (100.0%) | 3.56 |
Median Household Size in Los Angeles County
The median household size in Los Angeles County is 2.89 persons per household, with single female/mother households (494,169 | 14.7%) accounting for the largest median household size of 3.72 persons per household. non-family households (1,144,447 | 34.0%) represent the smallest median household size with 1.35 persons per household.
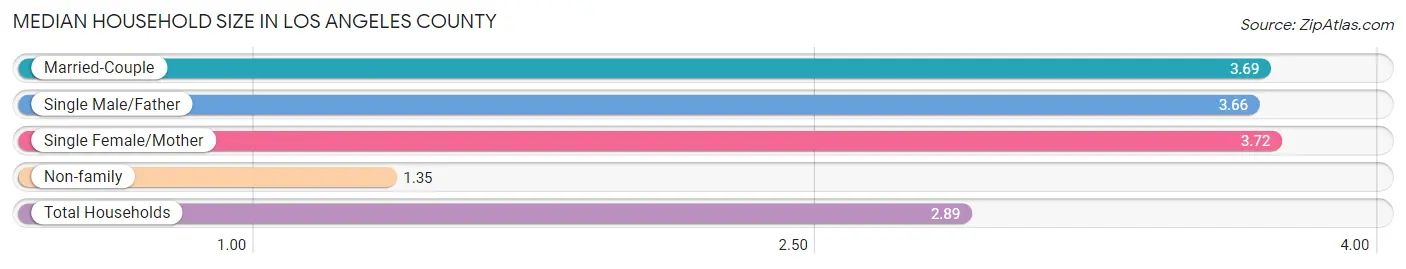
| Household Type | # Households | Household Size |
| Married-Couple | 1,482,931 (44.1%) | 3.69 |
| Single Male/Father | 241,546 (7.2%) | 3.66 |
| Single Female/Mother | 494,169 (14.7%) | 3.72 |
| Non-family | 1,144,447 (34.0%) | 1.35 |
| Total Households | 3,363,093 (100.0%) | 2.89 |
Household Size by Marriage Status in Los Angeles County
Out of a total of 3,363,093 households in Los Angeles County, 2,218,646 (66.0%) are family households, while 1,144,447 (34.0%) are nonfamily households. The most numerous type of family households are 2-person households, comprising 731,923, and the most common type of nonfamily households are 1-person households, comprising 870,733.
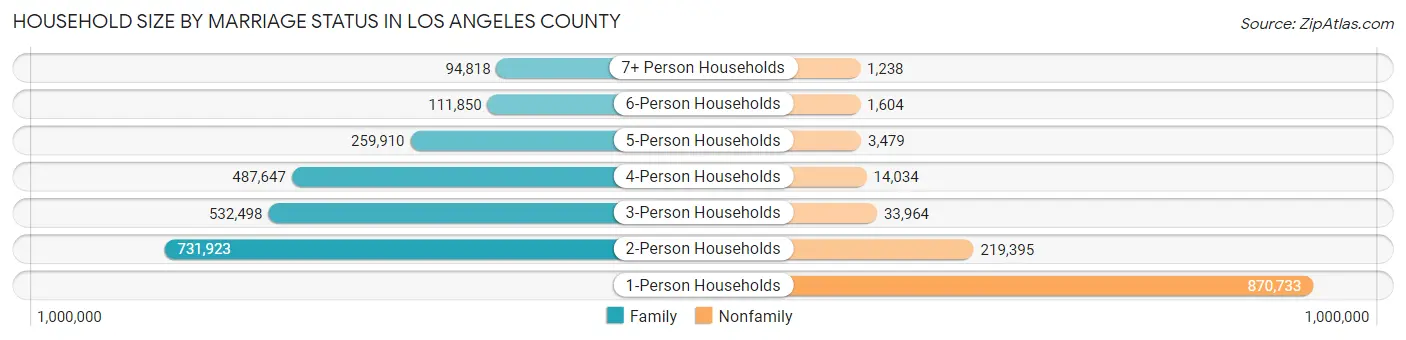
| Household Size | Family Households | Nonfamily Households |
| 1-Person Households | - | 870,733 (25.9%) |
| 2-Person Households | 731,923 (21.8%) | 219,395 (6.5%) |
| 3-Person Households | 532,498 (15.8%) | 33,964 (1.0%) |
| 4-Person Households | 487,647 (14.5%) | 14,034 (0.4%) |
| 5-Person Households | 259,910 (7.7%) | 3,479 (0.1%) |
| 6-Person Households | 111,850 (3.3%) | 1,604 (0.1%) |
| 7+ Person Households | 94,818 (2.8%) | 1,238 (0.0%) |
| Total | 2,218,646 (66.0%) | 1,144,447 (34.0%) |
Female Fertility in Los Angeles County
Fertility by Age in Los Angeles County
Average fertility rate in Los Angeles County is 43.0 births per 1,000 women. Women in the age bracket of 20 to 34 years have the highest fertility rate with 59.0 births per 1,000 women. Women in the age bracket of 20 to 34 years acount for 60.5% of all women with births.
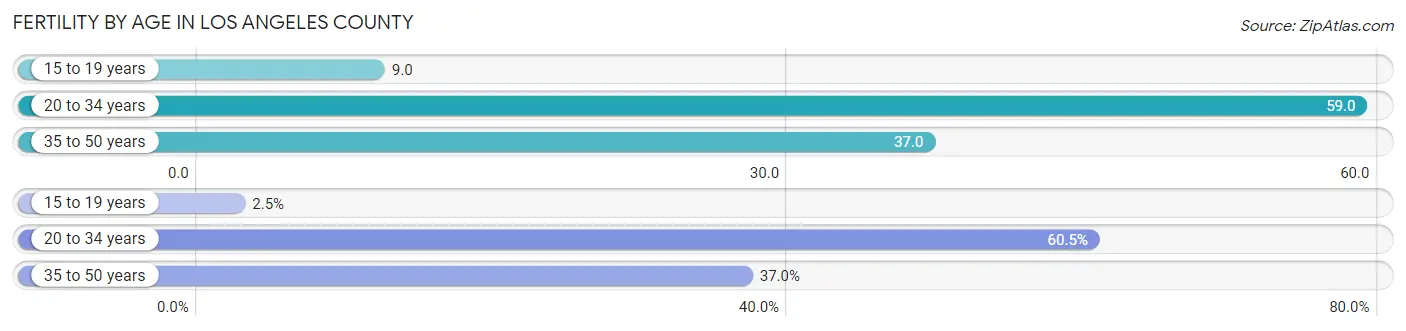
| Age Bracket | Women with Births | Births / 1,000 Women |
| 15 to 19 years | 2,721 (2.5%) | 9.0 |
| 20 to 34 years | 65,176 (60.5%) | 59.0 |
| 35 to 50 years | 39,818 (37.0%) | 37.0 |
| Total | 107,715 (100.0%) | 43.0 |
Fertility by Age by Marriage Status in Los Angeles County
64.6% of women with births (107,715) in Los Angeles County are married. The highest percentage of unmarried women with births falls into 15 to 19 years age bracket with 85.6% of them unmarried at the time of birth, while the lowest percentage of unmarried women with births belong to 35 to 50 years age bracket with 22.2% of them unmarried.
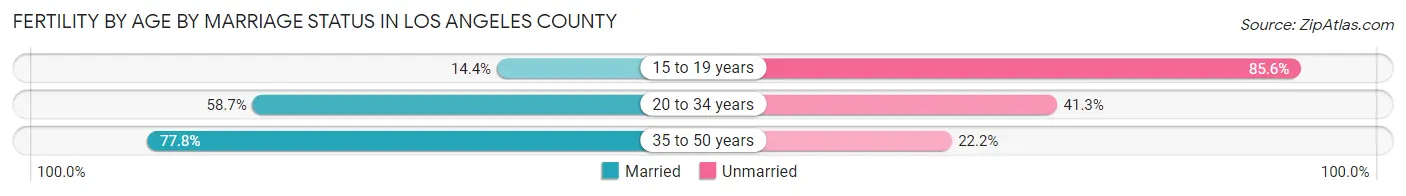
| Age Bracket | Married | Unmarried |
| 15 to 19 years | 392 (14.4%) | 2,329 (85.6%) |
| 20 to 34 years | 38,258 (58.7%) | 26,918 (41.3%) |
| 35 to 50 years | 30,978 (77.8%) | 8,840 (22.2%) |
| Total | 69,584 (64.6%) | 38,131 (35.4%) |
Fertility by Education in Los Angeles County
Average fertility rate in Los Angeles County is 43.0 births per 1,000 women. Women with the education attainment of graduate degree have the highest fertility rate of 51.0 births per 1,000 women, while women with the education attainment of less than high school have the lowest fertility at 33.0 births per 1,000 women. Women with the education attainment of college or associate's degree represent 27.4% of all women with births.
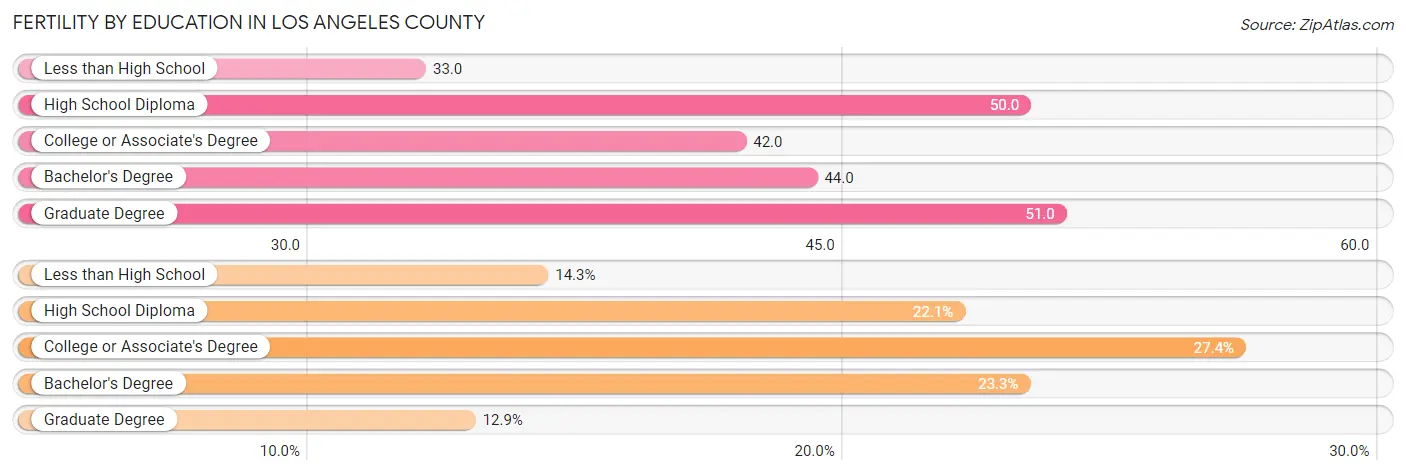
| Educational Attainment | Women with Births | Births / 1,000 Women |
| Less than High School | 15,389 (14.3%) | 33.0 |
| High School Diploma | 23,809 (22.1%) | 50.0 |
| College or Associate's Degree | 29,470 (27.4%) | 42.0 |
| Bachelor's Degree | 25,119 (23.3%) | 44.0 |
| Graduate Degree | 13,928 (12.9%) | 51.0 |
| Total | 107,715 (100.0%) | 43.0 |
Fertility by Education by Marriage Status in Los Angeles County
35.4% of women with births in Los Angeles County are unmarried. Women with the educational attainment of graduate degree are most likely to be married with 92.4% of them married at childbirth, while women with the educational attainment of less than high school are least likely to be married with 52.3% of them unmarried at childbirth.
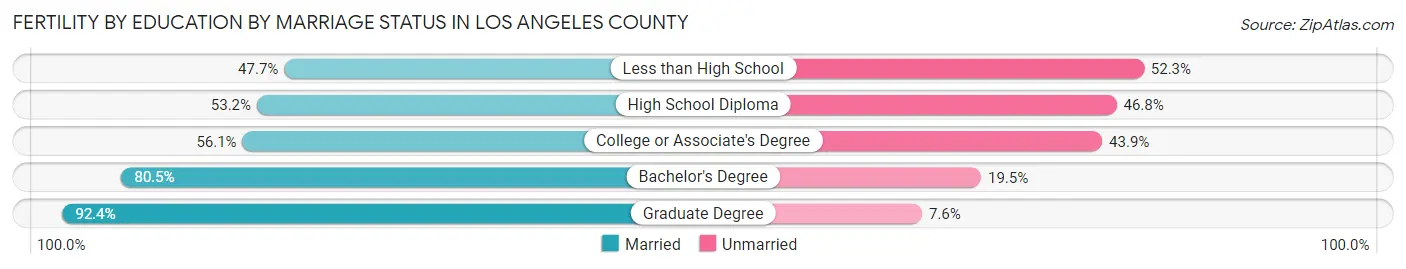
| Educational Attainment | Married | Unmarried |
| Less than High School | 7,341 (47.7%) | 8,048 (52.3%) |
| High School Diploma | 12,666 (53.2%) | 11,143 (46.8%) |
| College or Associate's Degree | 16,533 (56.1%) | 12,937 (43.9%) |
| Bachelor's Degree | 20,221 (80.5%) | 4,898 (19.5%) |
| Graduate Degree | 12,869 (92.4%) | 1,059 (7.6%) |
| Total | 69,584 (64.6%) | 38,131 (35.4%) |
Employment Characteristics in Los Angeles County
Employment by Class of Employer in Los Angeles County
Among the 4,737,721 employed individuals in Los Angeles County, private company employees (3,164,777 | 66.8%), self-employed (not incorporated) (415,206 | 8.8%), and local government employees (366,674 | 7.7%) make up the most common classes of employment.
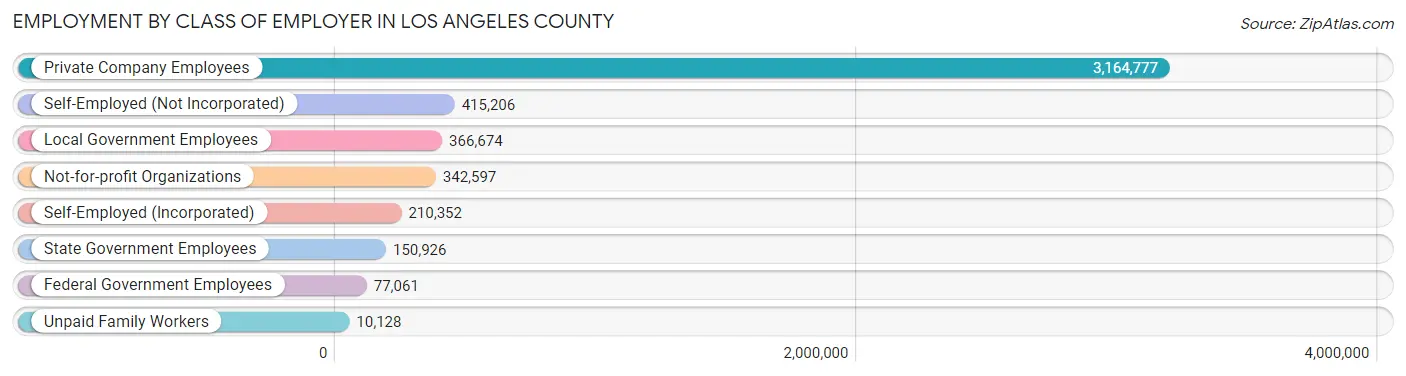
| Employer Class | # Employees | % Employees |
| Private Company Employees | 3,164,777 | 66.8% |
| Self-Employed (Incorporated) | 210,352 | 4.4% |
| Self-Employed (Not Incorporated) | 415,206 | 8.8% |
| Not-for-profit Organizations | 342,597 | 7.2% |
| Local Government Employees | 366,674 | 7.7% |
| State Government Employees | 150,926 | 3.2% |
| Federal Government Employees | 77,061 | 1.6% |
| Unpaid Family Workers | 10,128 | 0.2% |
| Total | 4,737,721 | 100.0% |
Employment Status by Age in Los Angeles County
According to the labor force statistics for Los Angeles County, out of the total population over 16 years of age (8,086,852), 64.8% or 5,240,280 individuals are in the labor force, with 7.0% or 366,820 of them unemployed. The age group with the highest labor force participation rate is 30 to 34 years, with 84.2% or 668,676 individuals in the labor force. Within the labor force, the 16 to 19 years age range has the highest percentage of unemployed individuals, with 21.8% or 28,746 of them being unemployed.
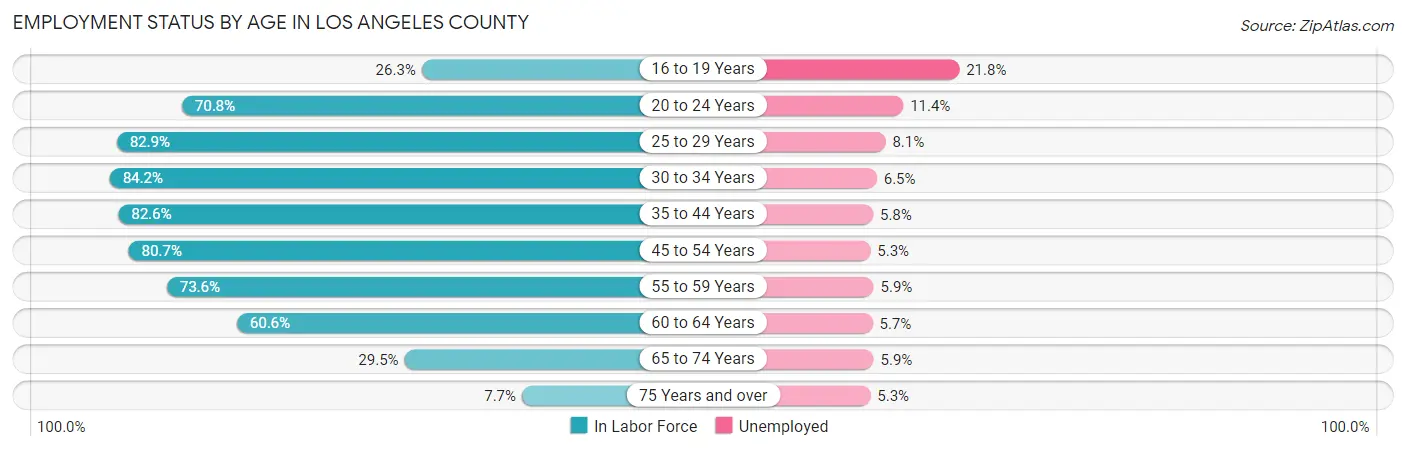
| Age Bracket | In Labor Force | Unemployed |
| 16 to 19 Years | 131,861 (26.3%) | 28,746 (21.8%) |
| 20 to 24 Years | 478,487 (70.8%) | 54,548 (11.4%) |
| 25 to 29 Years | 655,129 (82.9%) | 53,065 (8.1%) |
| 30 to 34 Years | 668,676 (84.2%) | 43,464 (6.5%) |
| 35 to 44 Years | 1,140,693 (82.6%) | 66,160 (5.8%) |
| 45 to 54 Years | 1,062,947 (80.7%) | 56,336 (5.3%) |
| 55 to 59 Years | 463,694 (73.6%) | 27,358 (5.9%) |
| 60 to 64 Years | 352,218 (60.6%) | 20,076 (5.7%) |
| 65 to 74 Years | 241,675 (29.5%) | 14,259 (5.9%) |
| 75 Years and over | 45,940 (7.7%) | 2,435 (5.3%) |
| Total | 5,240,280 (64.8%) | 366,820 (7.0%) |
Employment Status by Educational Attainment in Los Angeles County
According to labor force statistics for Los Angeles County, 79.0% of individuals (4,340,097) out of the total population between 25 and 64 years of age (5,493,794) are in the labor force, with 6.1% or 264,746 of them being unemployed. The group with the highest labor force participation rate are those with the educational attainment of bachelor's degree or higher, with 87.3% or 1,714,266 individuals in the labor force. Within the labor force, individuals with high school diploma education have the highest percentage of unemployment, with 6.9% or 57,516 of them being unemployed.
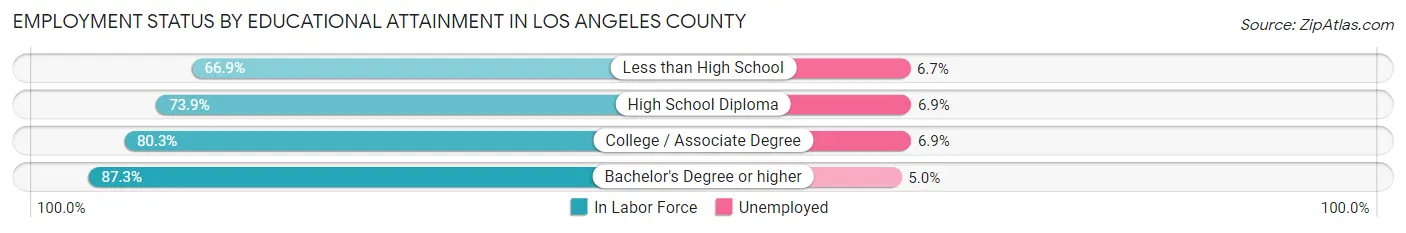
| Educational Attainment | In Labor Force | Unemployed |
| Less than High School | 663,461 (66.9%) | 66,445 (6.7%) |
| High School Diploma | 833,571 (73.9%) | 77,830 (6.9%) |
| College / Associate Degree | 1,132,593 (80.3%) | 97,321 (6.9%) |
| Bachelor's Degree or higher | 1,714,266 (87.3%) | 98,182 (5.0%) |
| Total | 4,340,097 (79.0%) | 335,121 (6.1%) |
Employment Occupations by Sex in Los Angeles County
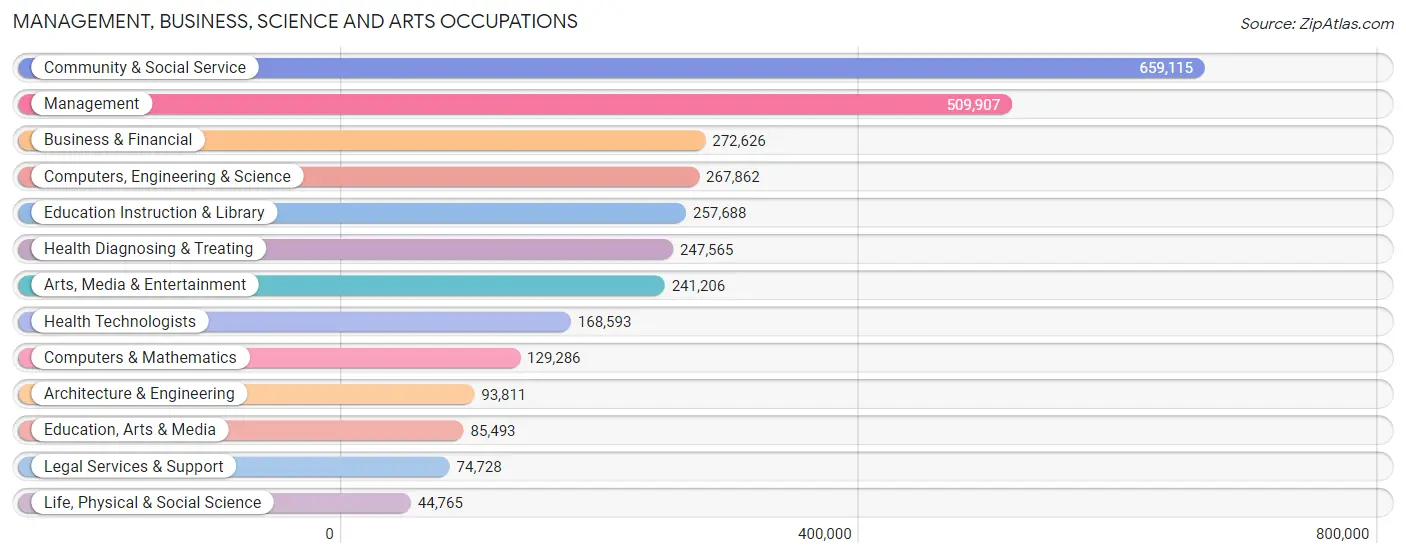
Management, Business, Science and Arts Occupations
The most common Management, Business, Science and Arts occupations in Los Angeles County are Community & Social Service (659,115 | 13.5%), Management (509,907 | 10.5%), Business & Financial (272,626 | 5.6%), Computers, Engineering & Science (267,862 | 5.5%), and Education Instruction & Library (257,688 | 5.3%).
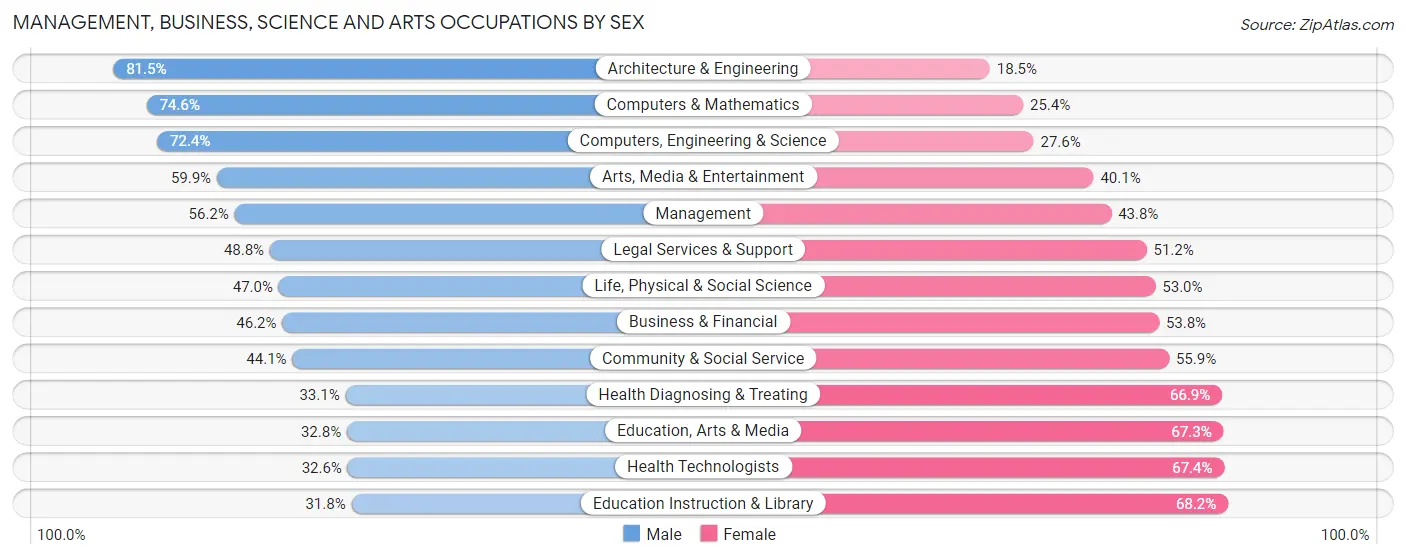
Management, Business, Science and Arts Occupations by Sex
Within the Management, Business, Science and Arts occupations in Los Angeles County, the most male-oriented occupations are Architecture & Engineering (81.5%), Computers & Mathematics (74.6%), and Computers, Engineering & Science (72.4%), while the most female-oriented occupations are Education Instruction & Library (68.2%), Health Technologists (67.4%), and Education, Arts & Media (67.2%).
| Occupation | Male | Female |
| Management | 286,495 (56.2%) | 223,412 (43.8%) |
| Business & Financial | 126,034 (46.2%) | 146,592 (53.8%) |
| Computers, Engineering & Science | 193,887 (72.4%) | 73,975 (27.6%) |
| Computers & Mathematics | 96,409 (74.6%) | 32,877 (25.4%) |
| Architecture & Engineering | 76,454 (81.5%) | 17,357 (18.5%) |
| Life, Physical & Social Science | 21,024 (47.0%) | 23,741 (53.0%) |
| Community & Social Service | 290,877 (44.1%) | 368,238 (55.9%) |
| Education, Arts & Media | 28,000 (32.8%) | 57,493 (67.2%) |
| Legal Services & Support | 36,484 (48.8%) | 38,244 (51.2%) |
| Education Instruction & Library | 81,966 (31.8%) | 175,722 (68.2%) |
| Arts, Media & Entertainment | 144,427 (59.9%) | 96,779 (40.1%) |
| Health Diagnosing & Treating | 81,853 (33.1%) | 165,712 (66.9%) |
| Health Technologists | 54,953 (32.6%) | 113,640 (67.4%) |
| Total (Category) | 979,146 (50.0%) | 977,929 (50.0%) |
| Total (Overall) | 2,631,638 (54.0%) | 2,237,982 (46.0%) |
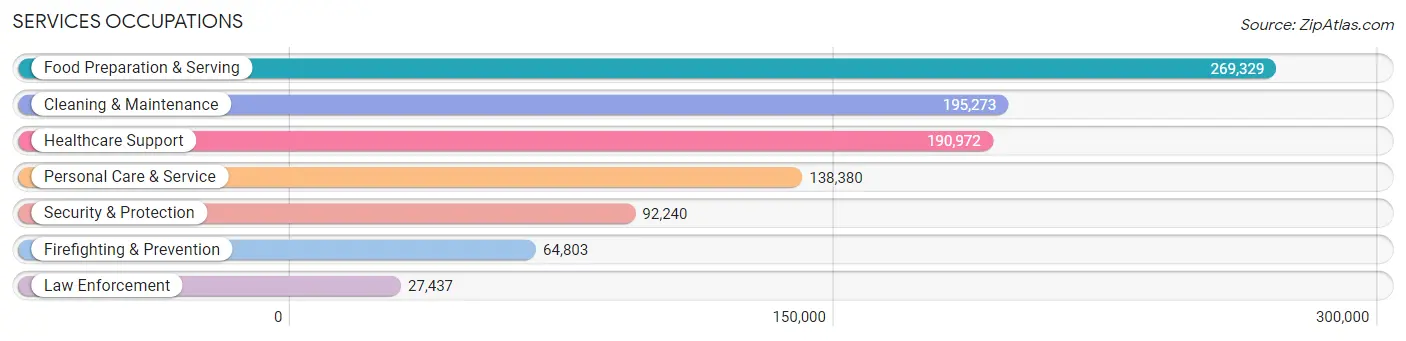
Services Occupations
The most common Services occupations in Los Angeles County are Food Preparation & Serving (269,329 | 5.5%), Cleaning & Maintenance (195,273 | 4.0%), Healthcare Support (190,972 | 3.9%), Personal Care & Service (138,380 | 2.8%), and Security & Protection (92,240 | 1.9%).
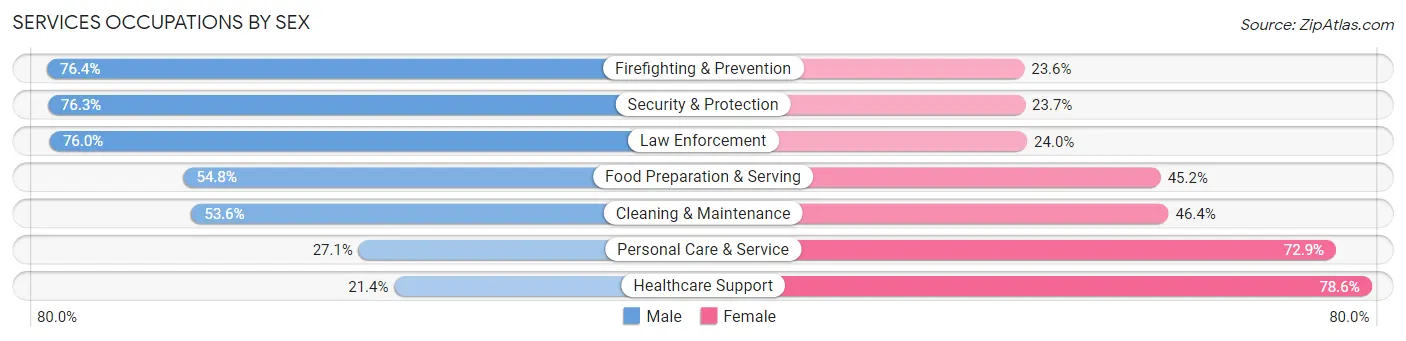
Services Occupations by Sex
Within the Services occupations in Los Angeles County, the most male-oriented occupations are Firefighting & Prevention (76.4%), Security & Protection (76.3%), and Law Enforcement (76.0%), while the most female-oriented occupations are Healthcare Support (78.6%), Personal Care & Service (72.9%), and Cleaning & Maintenance (46.4%).
| Occupation | Male | Female |
| Healthcare Support | 40,936 (21.4%) | 150,036 (78.6%) |
| Security & Protection | 70,375 (76.3%) | 21,865 (23.7%) |
| Firefighting & Prevention | 49,529 (76.4%) | 15,274 (23.6%) |
| Law Enforcement | 20,846 (76.0%) | 6,591 (24.0%) |
| Food Preparation & Serving | 147,649 (54.8%) | 121,680 (45.2%) |
| Cleaning & Maintenance | 104,634 (53.6%) | 90,639 (46.4%) |
| Personal Care & Service | 37,466 (27.1%) | 100,914 (72.9%) |
| Total (Category) | 401,060 (45.3%) | 485,134 (54.7%) |
| Total (Overall) | 2,631,638 (54.0%) | 2,237,982 (46.0%) |
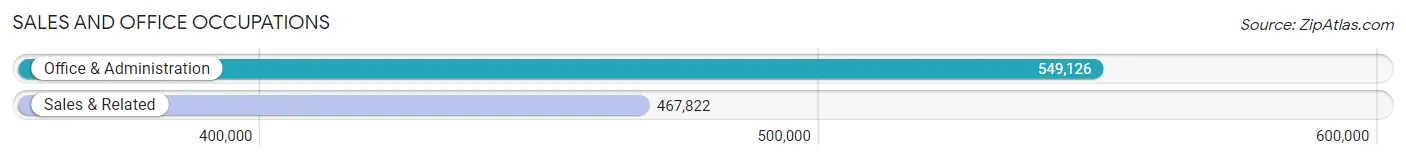
Sales and Office Occupations
The most common Sales and Office occupations in Los Angeles County are Office & Administration (549,126 | 11.3%), and Sales & Related (467,822 | 9.6%).
Sales and Office Occupations by Sex
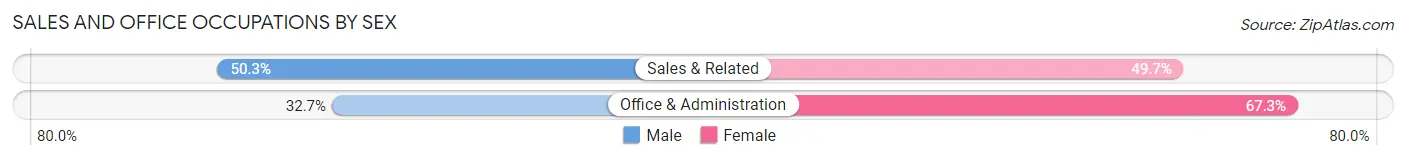
| Occupation | Male | Female |
| Sales & Related | 235,330 (50.3%) | 232,492 (49.7%) |
| Office & Administration | 179,745 (32.7%) | 369,381 (67.3%) |
| Total (Category) | 415,075 (40.8%) | 601,873 (59.2%) |
| Total (Overall) | 2,631,638 (54.0%) | 2,237,982 (46.0%) |
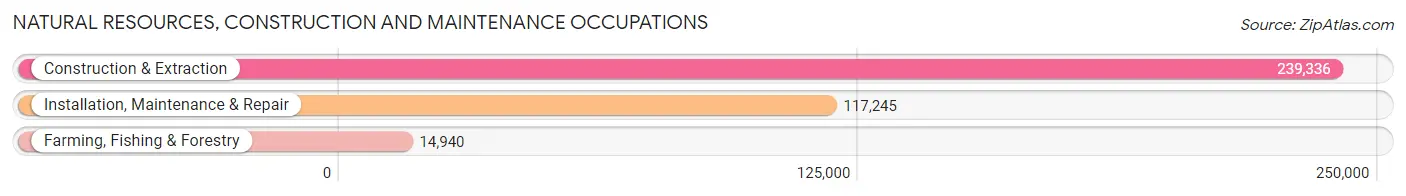
Natural Resources, Construction and Maintenance Occupations
The most common Natural Resources, Construction and Maintenance occupations in Los Angeles County are Construction & Extraction (239,336 | 4.9%), Installation, Maintenance & Repair (117,245 | 2.4%), and Farming, Fishing & Forestry (14,940 | 0.3%).
Natural Resources, Construction and Maintenance Occupations by Sex
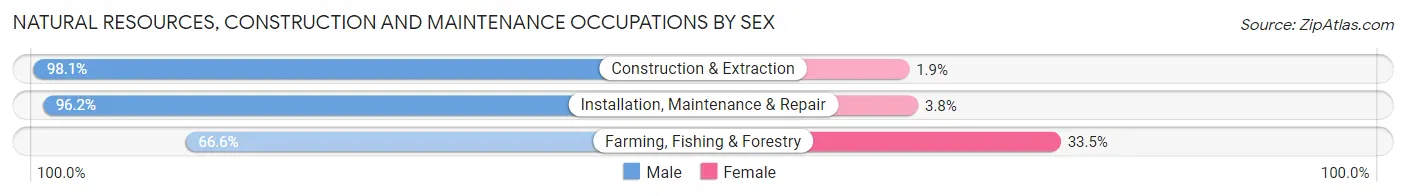
| Occupation | Male | Female |
| Farming, Fishing & Forestry | 9,943 (66.5%) | 4,997 (33.5%) |
| Construction & Extraction | 234,687 (98.1%) | 4,649 (1.9%) |
| Installation, Maintenance & Repair | 112,824 (96.2%) | 4,421 (3.8%) |
| Total (Category) | 357,454 (96.2%) | 14,067 (3.8%) |
| Total (Overall) | 2,631,638 (54.0%) | 2,237,982 (46.0%) |
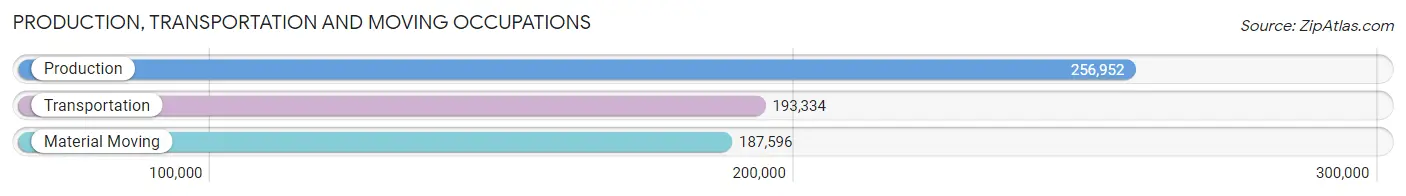
Production, Transportation and Moving Occupations
The most common Production, Transportation and Moving occupations in Los Angeles County are Production (256,952 | 5.3%), Transportation (193,334 | 4.0%), and Material Moving (187,596 | 3.8%).
Production, Transportation and Moving Occupations by Sex
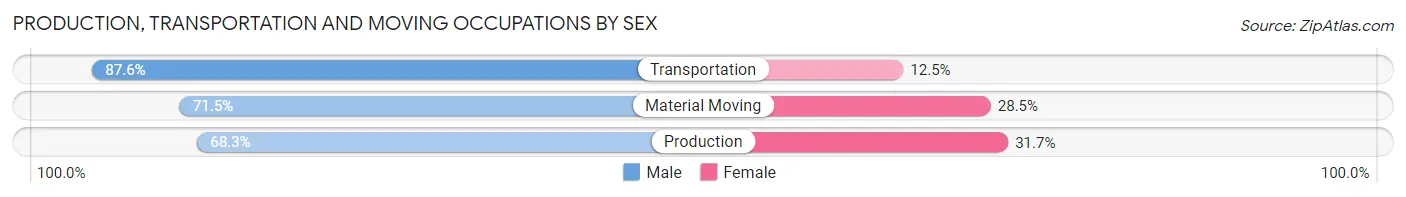
| Occupation | Male | Female |
| Production | 175,515 (68.3%) | 81,437 (31.7%) |
| Transportation | 169,255 (87.5%) | 24,079 (12.4%) |
| Material Moving | 134,133 (71.5%) | 53,463 (28.5%) |
| Total (Category) | 478,903 (75.1%) | 158,979 (24.9%) |
| Total (Overall) | 2,631,638 (54.0%) | 2,237,982 (46.0%) |
Employment Industries by Sex in Los Angeles County
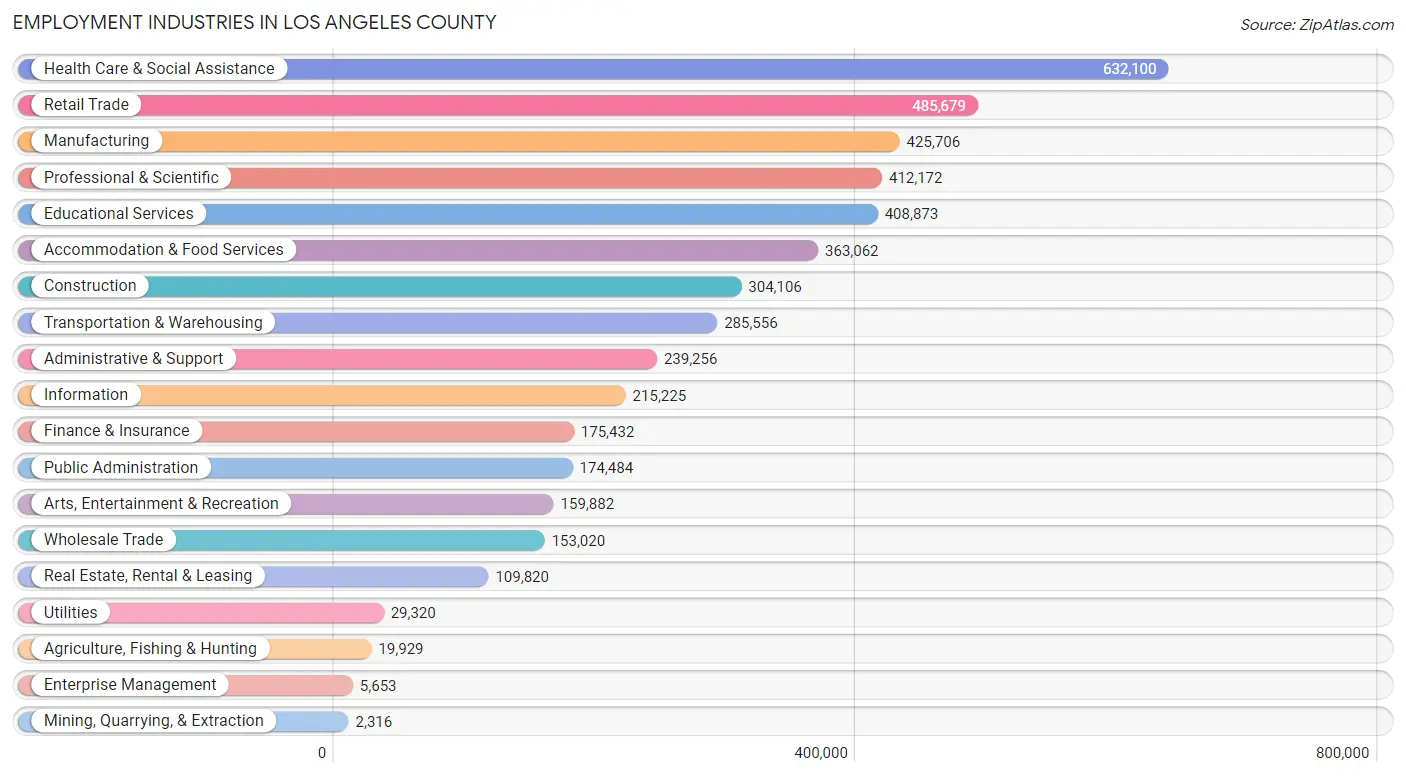
Employment Industries in Los Angeles County
The major employment industries in Los Angeles County include Health Care & Social Assistance (632,100 | 13.0%), Retail Trade (485,679 | 10.0%), Manufacturing (425,706 | 8.7%), Professional & Scientific (412,172 | 8.5%), and Educational Services (408,873 | 8.4%).
Employment Industries by Sex in Los Angeles County
The Los Angeles County industries that see more men than women are Construction (91.9%), Mining, Quarrying, & Extraction (86.2%), and Transportation & Warehousing (75.0%), whereas the industries that tend to have a higher number of women are Health Care & Social Assistance (72.5%), Educational Services (64.1%), and Enterprise Management (56.2%).
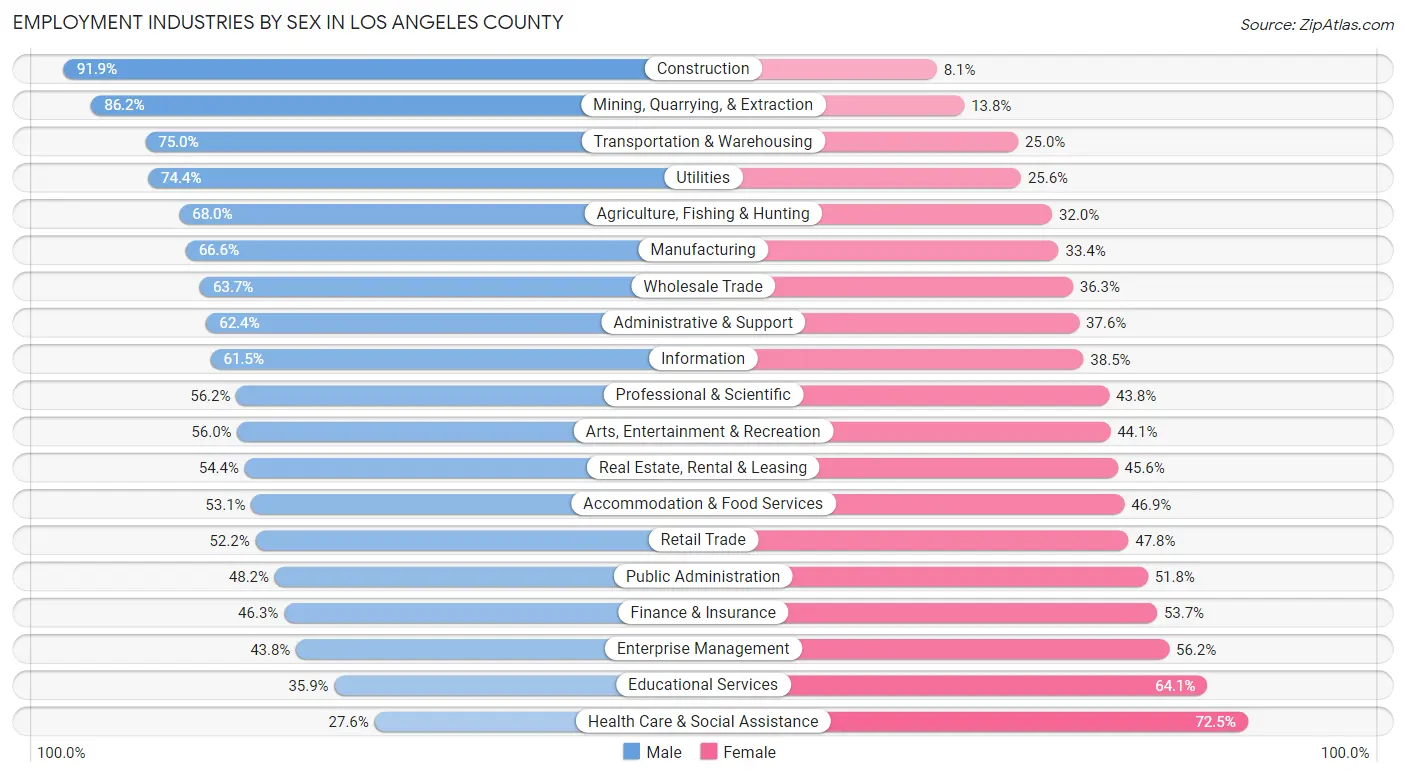
| Industry | Male | Female |
| Agriculture, Fishing & Hunting | 13,547 (68.0%) | 6,382 (32.0%) |
| Mining, Quarrying, & Extraction | 1,996 (86.2%) | 320 (13.8%) |
| Construction | 279,391 (91.9%) | 24,715 (8.1%) |
| Manufacturing | 283,708 (66.6%) | 141,998 (33.4%) |
| Wholesale Trade | 97,470 (63.7%) | 55,550 (36.3%) |
| Retail Trade | 253,558 (52.2%) | 232,121 (47.8%) |
| Transportation & Warehousing | 214,190 (75.0%) | 71,366 (25.0%) |
| Utilities | 21,822 (74.4%) | 7,498 (25.6%) |
| Information | 132,361 (61.5%) | 82,864 (38.5%) |
| Finance & Insurance | 81,182 (46.3%) | 94,250 (53.7%) |
| Real Estate, Rental & Leasing | 59,766 (54.4%) | 50,054 (45.6%) |
| Professional & Scientific | 231,557 (56.2%) | 180,615 (43.8%) |
| Enterprise Management | 2,475 (43.8%) | 3,178 (56.2%) |
| Administrative & Support | 149,246 (62.4%) | 90,010 (37.6%) |
| Educational Services | 146,681 (35.9%) | 262,192 (64.1%) |
| Health Care & Social Assistance | 174,171 (27.6%) | 457,929 (72.5%) |
| Arts, Entertainment & Recreation | 89,451 (55.9%) | 70,431 (44.1%) |
| Accommodation & Food Services | 192,654 (53.1%) | 170,408 (46.9%) |
| Public Administration | 84,100 (48.2%) | 90,384 (51.8%) |
| Total | 2,631,638 (54.0%) | 2,237,982 (46.0%) |
Education in Los Angeles County
School Enrollment in Los Angeles County
The most common levels of schooling among the 2,482,311 students in Los Angeles County are college / undergraduate (644,395 | 26.0%), high school (516,260 | 20.8%), and middle school (475,146 | 19.1%).
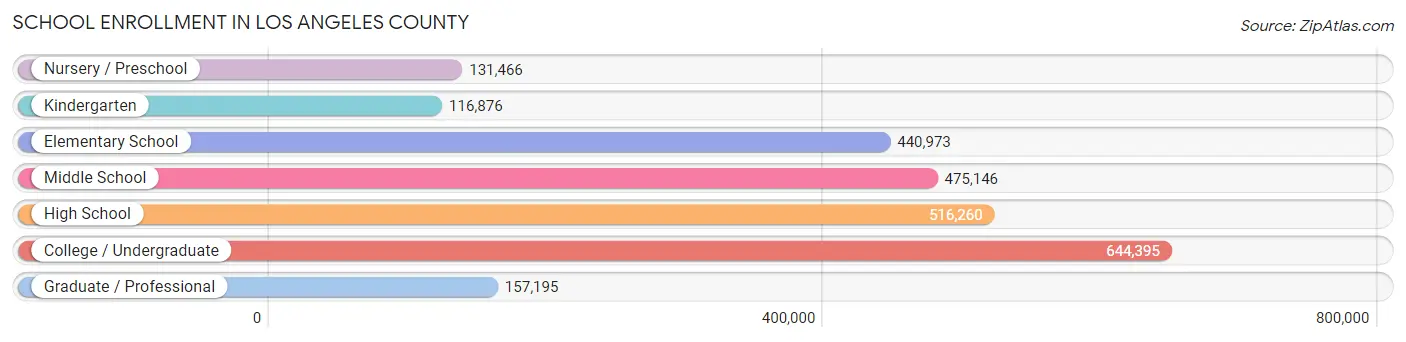
| School Level | # Students | % Students |
| Nursery / Preschool | 131,466 | 5.3% |
| Kindergarten | 116,876 | 4.7% |
| Elementary School | 440,973 | 17.8% |
| Middle School | 475,146 | 19.1% |
| High School | 516,260 | 20.8% |
| College / Undergraduate | 644,395 | 26.0% |
| Graduate / Professional | 157,195 | 6.3% |
| Total | 2,482,311 | 100.0% |
School Enrollment by Age by Funding Source in Los Angeles County
Out of a total of 2,482,311 students who are enrolled in schools in Los Angeles County, 402,134 (16.2%) attend a private institution, while the remaining 2,080,177 (83.8%) are enrolled in public schools. The age group of 3 to 4 year olds has the highest likelihood of being enrolled in private schools, with 47,646 (43.2% in the age bracket) enrolled. Conversely, the age group of 15 to 17 year olds has the lowest likelihood of being enrolled in a private school, with 324,035 (90.9% in the age bracket) attending a public institution.
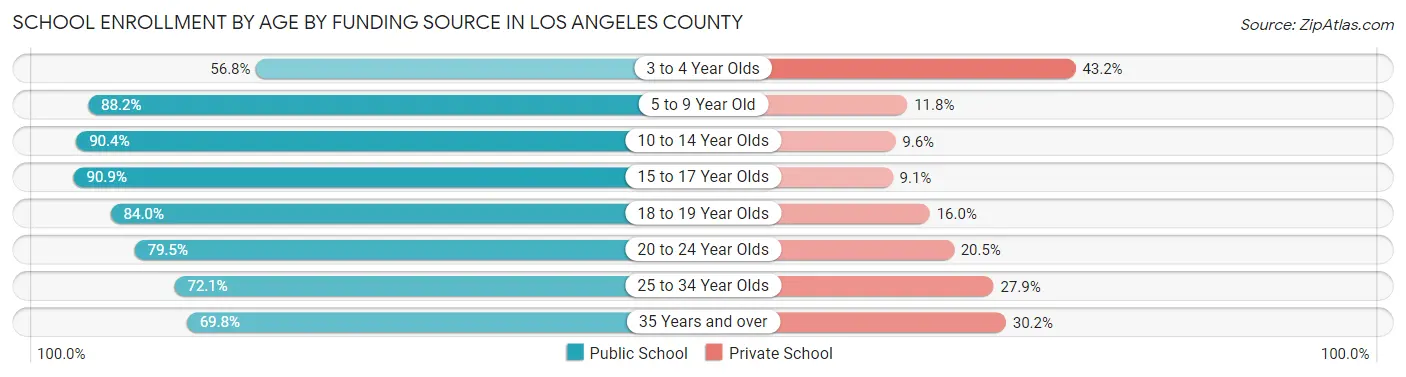
| Age Bracket | Public School | Private School |
| 3 to 4 Year Olds | 62,715 (56.8%) | 47,646 (43.2%) |
| 5 to 9 Year Old | 466,532 (88.2%) | 62,665 (11.8%) |
| 10 to 14 Year Olds | 552,406 (90.4%) | 58,791 (9.6%) |
| 15 to 17 Year Olds | 324,035 (90.9%) | 32,476 (9.1%) |
| 18 to 19 Year Olds | 169,690 (84.0%) | 32,398 (16.0%) |
| 20 to 24 Year Olds | 248,009 (79.5%) | 63,903 (20.5%) |
| 25 to 34 Year Olds | 154,335 (72.1%) | 59,729 (27.9%) |
| 35 Years and over | 102,595 (69.8%) | 44,386 (30.2%) |
| Total | 2,080,177 (83.8%) | 402,134 (16.2%) |
Educational Attainment by Field of Study in Los Angeles County
Business (458,575 | 17.9%), social sciences (285,627 | 11.1%), visual & performing arts (236,833 | 9.2%), science & technology (203,297 | 7.9%), and engineering (195,285 | 7.6%) are the most common fields of study among 2,565,163 individuals in Los Angeles County who have obtained a bachelor's degree or higher.
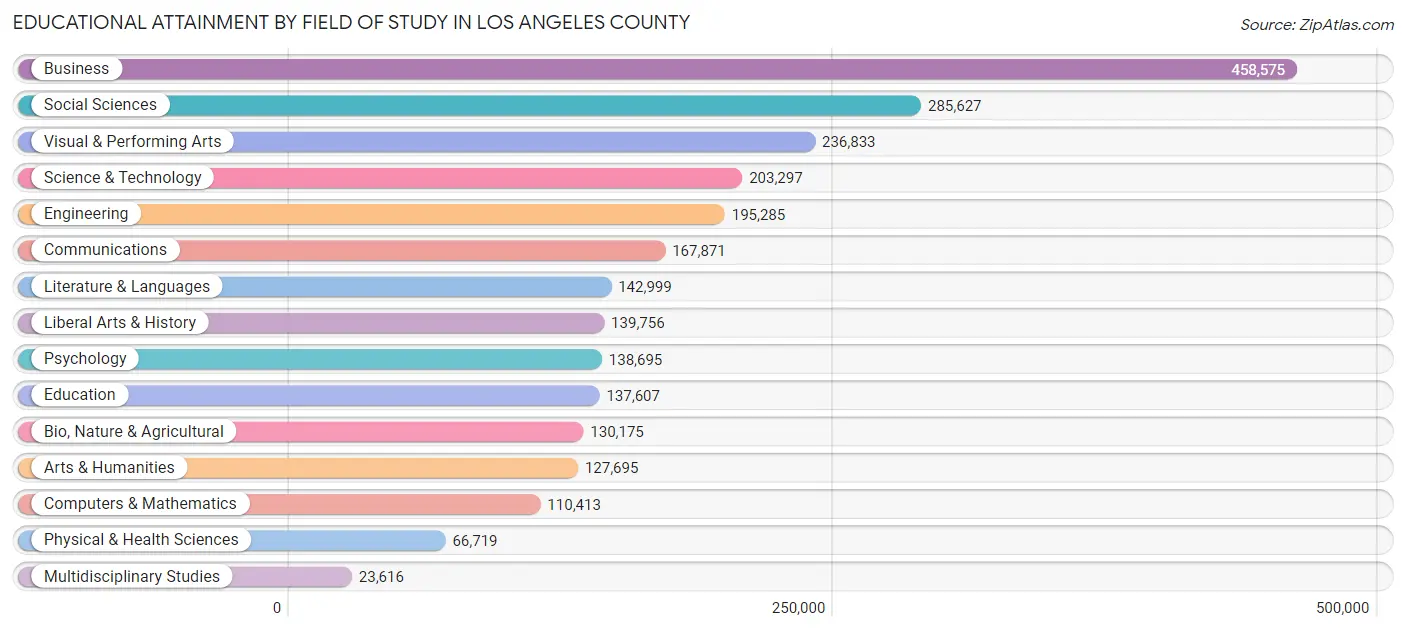
| Field of Study | # Graduates | % Graduates |
| Computers & Mathematics | 110,413 | 4.3% |
| Bio, Nature & Agricultural | 130,175 | 5.1% |
| Physical & Health Sciences | 66,719 | 2.6% |
| Psychology | 138,695 | 5.4% |
| Social Sciences | 285,627 | 11.1% |
| Engineering | 195,285 | 7.6% |
| Multidisciplinary Studies | 23,616 | 0.9% |
| Science & Technology | 203,297 | 7.9% |
| Business | 458,575 | 17.9% |
| Education | 137,607 | 5.4% |
| Literature & Languages | 142,999 | 5.6% |
| Liberal Arts & History | 139,756 | 5.4% |
| Visual & Performing Arts | 236,833 | 9.2% |
| Communications | 167,871 | 6.5% |
| Arts & Humanities | 127,695 | 5.0% |
| Total | 2,565,163 | 100.0% |
Transportation & Commute in Los Angeles County
Vehicle Availability by Sex in Los Angeles County
The most prevalent vehicle ownership categories in Los Angeles County are males with 2 vehicles (957,975, accounting for 37.4%) and females with 2 vehicles (784,293, making up 44.7%).
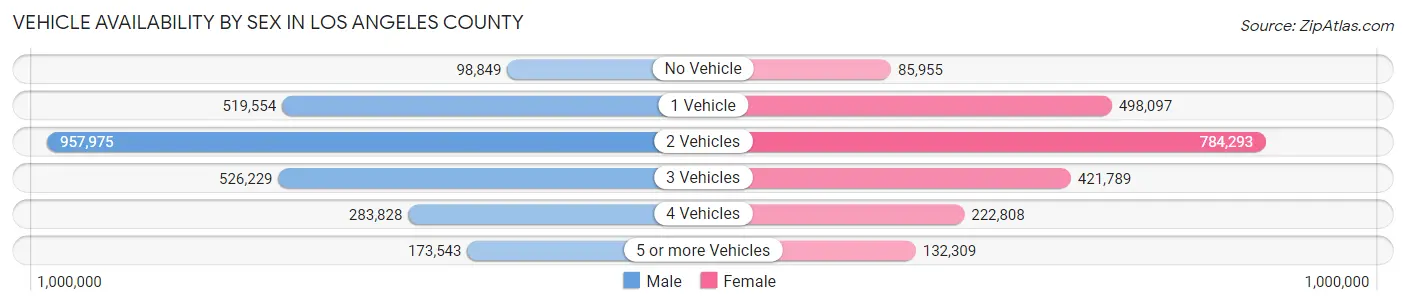
| Vehicles Available | Male | Female |
| No Vehicle | 98,849 (3.9%) | 85,955 (4.0%) |
| 1 Vehicle | 519,554 (20.3%) | 498,097 (23.2%) |
| 2 Vehicles | 957,975 (37.4%) | 784,293 (36.6%) |
| 3 Vehicles | 526,229 (20.6%) | 421,789 (19.7%) |
| 4 Vehicles | 283,828 (11.1%) | 222,808 (10.4%) |
| 5 or more Vehicles | 173,543 (6.8%) | 132,309 (6.2%) |
| Total | 2,559,978 (100.0%) | 2,145,251 (100.0%) |
Commute Time in Los Angeles County
The most frequently occuring commute durations in Los Angeles County are 30 to 34 minutes (731,410 commuters, 17.8%), 20 to 24 minutes (568,894 commuters, 13.8%), and 15 to 19 minutes (557,204 commuters, 13.6%).
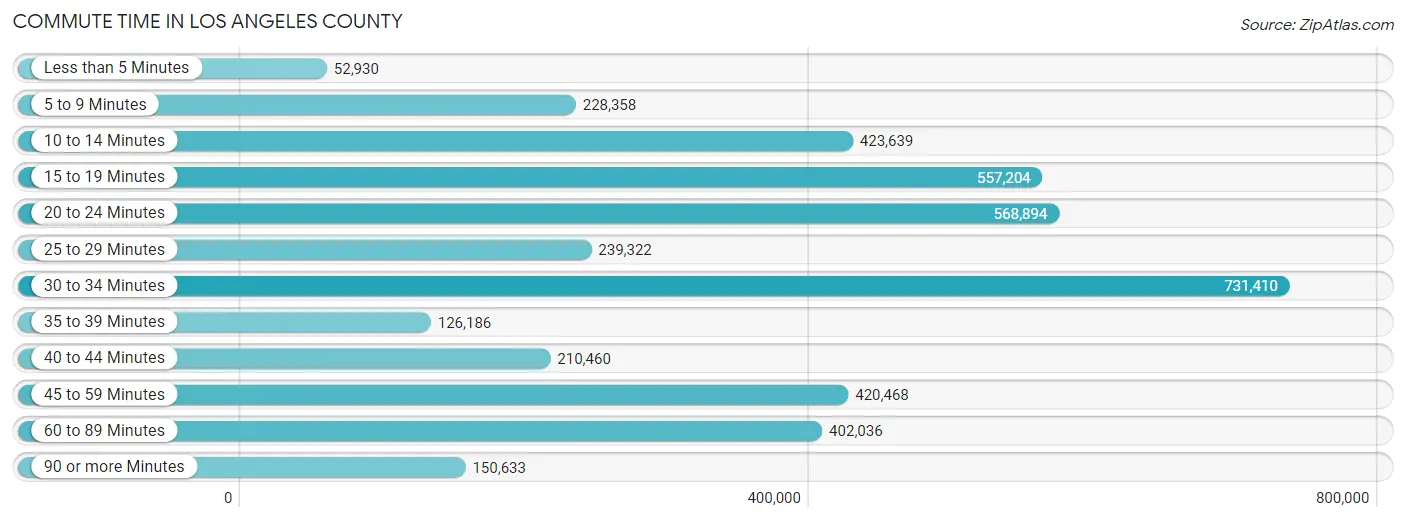
| Commute Time | # Commuters | % Commuters |
| Less than 5 Minutes | 52,930 | 1.3% |
| 5 to 9 Minutes | 228,358 | 5.6% |
| 10 to 14 Minutes | 423,639 | 10.3% |
| 15 to 19 Minutes | 557,204 | 13.6% |
| 20 to 24 Minutes | 568,894 | 13.8% |
| 25 to 29 Minutes | 239,322 | 5.8% |
| 30 to 34 Minutes | 731,410 | 17.8% |
| 35 to 39 Minutes | 126,186 | 3.1% |
| 40 to 44 Minutes | 210,460 | 5.1% |
| 45 to 59 Minutes | 420,468 | 10.2% |
| 60 to 89 Minutes | 402,036 | 9.8% |
| 90 or more Minutes | 150,633 | 3.7% |
Commute Time by Sex in Los Angeles County
The most common commute times in Los Angeles County are 30 to 34 minutes (425,741 commuters, 18.8%) for males and 30 to 34 minutes (305,669 commuters, 16.6%) for females.
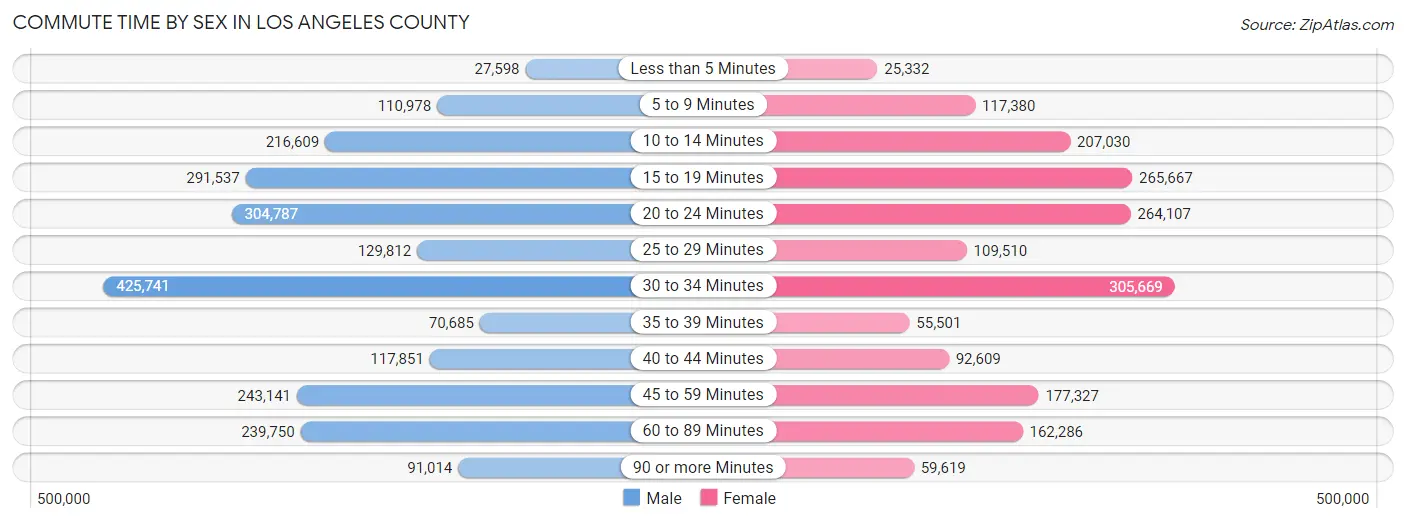
| Commute Time | Male | Female |
| Less than 5 Minutes | 27,598 (1.2%) | 25,332 (1.4%) |
| 5 to 9 Minutes | 110,978 (4.9%) | 117,380 (6.4%) |
| 10 to 14 Minutes | 216,609 (9.5%) | 207,030 (11.2%) |
| 15 to 19 Minutes | 291,537 (12.9%) | 265,667 (14.4%) |
| 20 to 24 Minutes | 304,787 (13.4%) | 264,107 (14.3%) |
| 25 to 29 Minutes | 129,812 (5.7%) | 109,510 (5.9%) |
| 30 to 34 Minutes | 425,741 (18.8%) | 305,669 (16.6%) |
| 35 to 39 Minutes | 70,685 (3.1%) | 55,501 (3.0%) |
| 40 to 44 Minutes | 117,851 (5.2%) | 92,609 (5.0%) |
| 45 to 59 Minutes | 243,141 (10.7%) | 177,327 (9.6%) |
| 60 to 89 Minutes | 239,750 (10.6%) | 162,286 (8.8%) |
| 90 or more Minutes | 91,014 (4.0%) | 59,619 (3.2%) |
Time of Departure to Work by Sex in Los Angeles County
The most frequent times of departure to work in Los Angeles County are 7:00 AM to 7:29 AM (293,417, 12.9%) for males and 7:00 AM to 7:29 AM (265,615, 14.4%) for females.
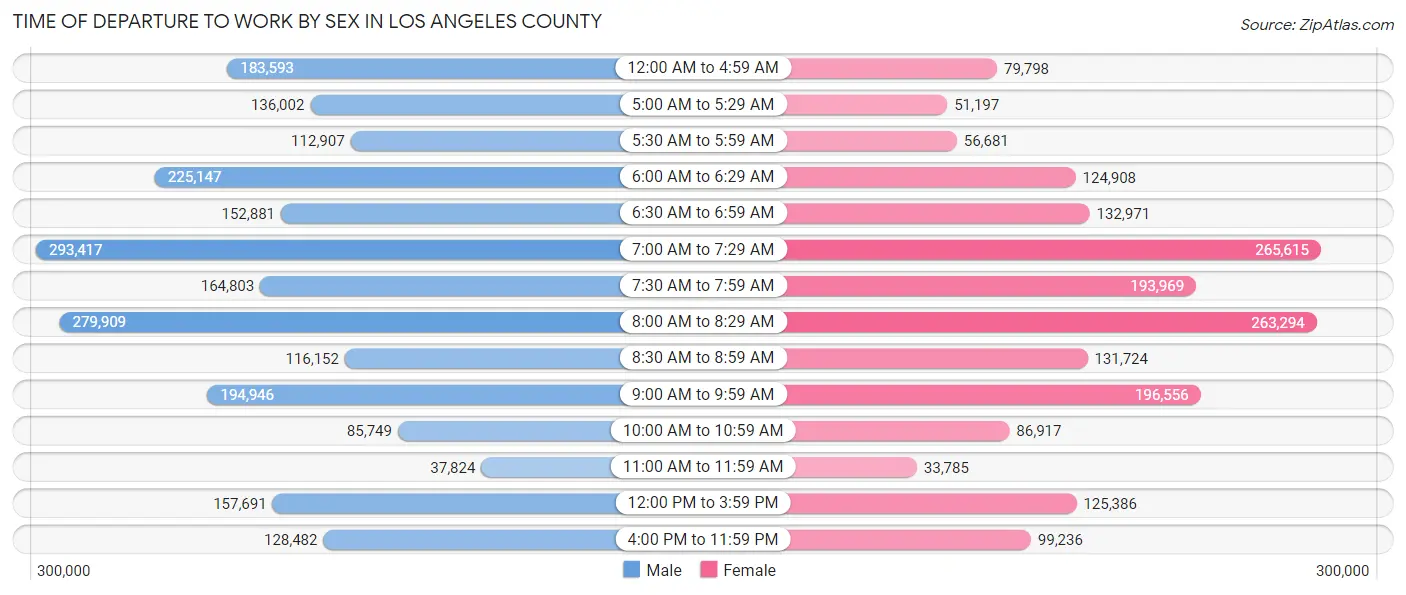
| Time of Departure | Male | Female |
| 12:00 AM to 4:59 AM | 183,593 (8.1%) | 79,798 (4.3%) |
| 5:00 AM to 5:29 AM | 136,002 (6.0%) | 51,197 (2.8%) |
| 5:30 AM to 5:59 AM | 112,907 (5.0%) | 56,681 (3.1%) |
| 6:00 AM to 6:29 AM | 225,147 (9.9%) | 124,908 (6.8%) |
| 6:30 AM to 6:59 AM | 152,881 (6.7%) | 132,971 (7.2%) |
| 7:00 AM to 7:29 AM | 293,417 (12.9%) | 265,615 (14.4%) |
| 7:30 AM to 7:59 AM | 164,803 (7.3%) | 193,969 (10.5%) |
| 8:00 AM to 8:29 AM | 279,909 (12.3%) | 263,294 (14.3%) |
| 8:30 AM to 8:59 AM | 116,152 (5.1%) | 131,724 (7.1%) |
| 9:00 AM to 9:59 AM | 194,946 (8.6%) | 196,556 (10.7%) |
| 10:00 AM to 10:59 AM | 85,749 (3.8%) | 86,917 (4.7%) |
| 11:00 AM to 11:59 AM | 37,824 (1.7%) | 33,785 (1.8%) |
| 12:00 PM to 3:59 PM | 157,691 (7.0%) | 125,386 (6.8%) |
| 4:00 PM to 11:59 PM | 128,482 (5.7%) | 99,236 (5.4%) |
| Total | 2,269,503 (100.0%) | 1,842,037 (100.0%) |
Housing Occupancy in Los Angeles County
Occupancy by Ownership in Los Angeles County
Of the total 3,363,093 dwellings in Los Angeles County, owner-occupied units account for 1,552,164 (46.2%), while renter-occupied units make up 1,810,929 (53.8%).
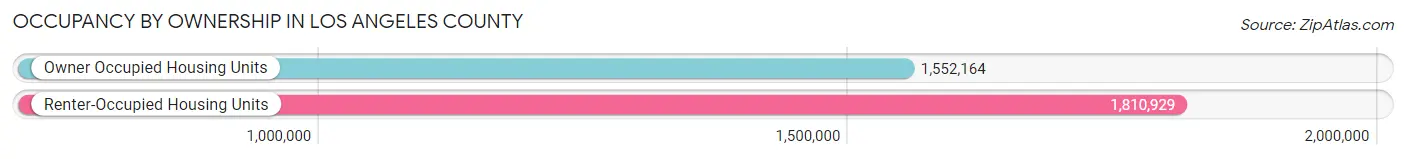
| Occupancy | # Housing Units | % Housing Units |
| Owner Occupied Housing Units | 1,552,164 | 46.2% |
| Renter-Occupied Housing Units | 1,810,929 | 53.8% |
| Total Occupied Housing Units | 3,363,093 | 100.0% |
Occupancy by Household Size in Los Angeles County
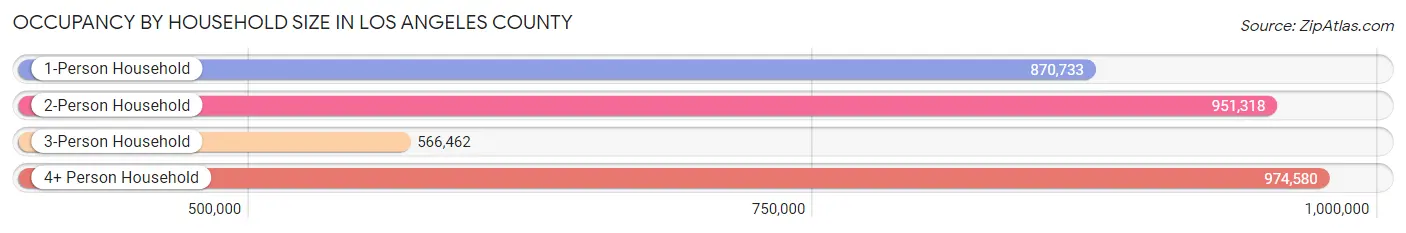
| Household Size | # Housing Units | % Housing Units |
| 1-Person Household | 870,733 | 25.9% |
| 2-Person Household | 951,318 | 28.3% |
| 3-Person Household | 566,462 | 16.8% |
| 4+ Person Household | 974,580 | 29.0% |
| Total Housing Units | 3,363,093 | 100.0% |
Occupancy by Ownership by Household Size in Los Angeles County
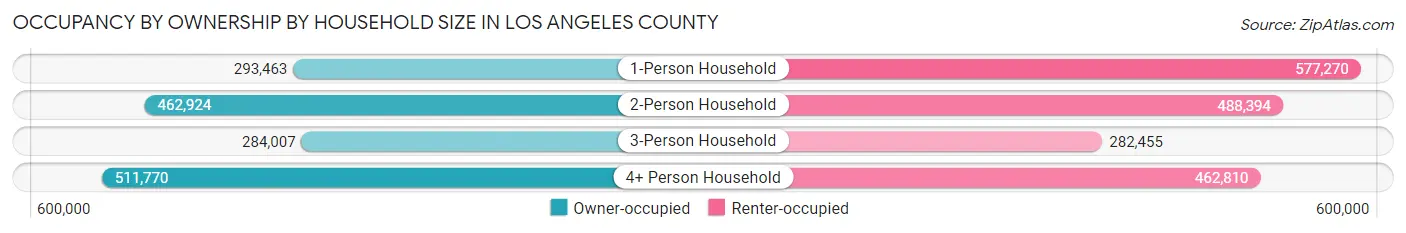
| Household Size | Owner-occupied | Renter-occupied |
| 1-Person Household | 293,463 (33.7%) | 577,270 (66.3%) |
| 2-Person Household | 462,924 (48.7%) | 488,394 (51.3%) |
| 3-Person Household | 284,007 (50.1%) | 282,455 (49.9%) |
| 4+ Person Household | 511,770 (52.5%) | 462,810 (47.5%) |
| Total Housing Units | 1,552,164 (46.2%) | 1,810,929 (53.8%) |
Occupancy by Educational Attainment in Los Angeles County
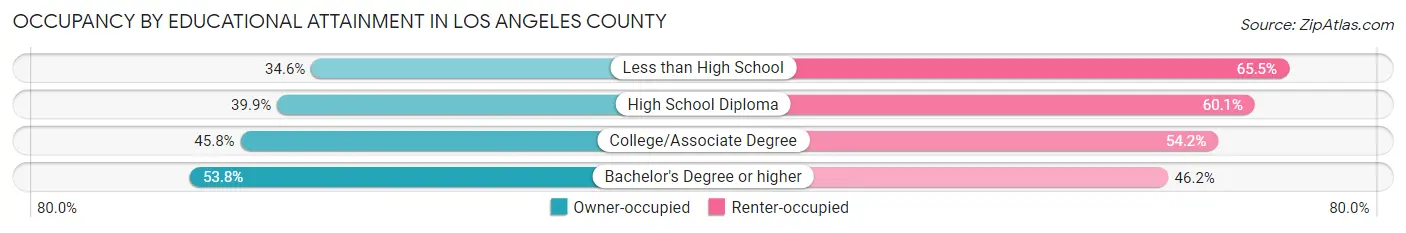
| Household Size | Owner-occupied | Renter-occupied |
| Less than High School | 188,609 (34.5%) | 357,256 (65.4%) |
| High School Diploma | 229,501 (39.9%) | 345,171 (60.1%) |
| College/Associate Degree | 410,779 (45.8%) | 486,670 (54.2%) |
| Bachelor's Degree or higher | 723,275 (53.8%) | 621,832 (46.2%) |
Occupancy by Age of Householder in Los Angeles County
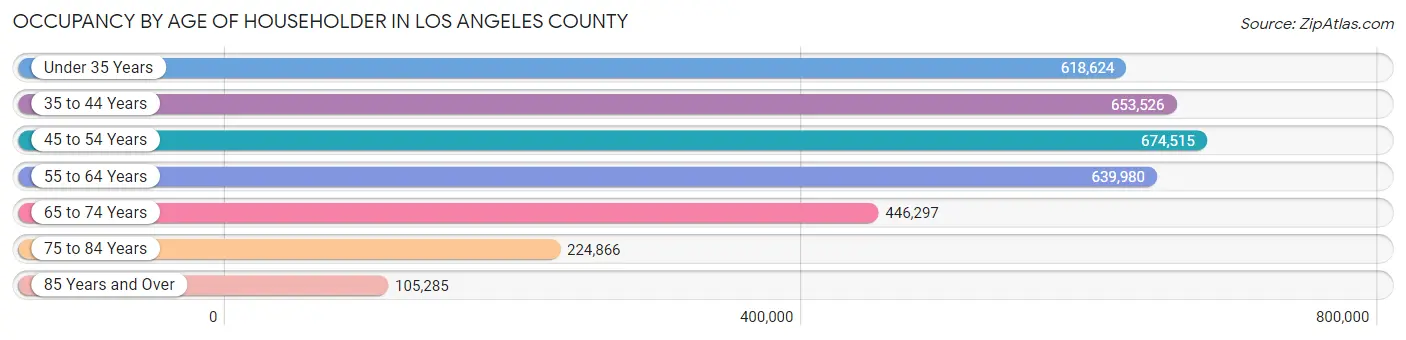
| Age Bracket | # Households | % Households |
| Under 35 Years | 618,624 | 18.4% |
| 35 to 44 Years | 653,526 | 19.4% |
| 45 to 54 Years | 674,515 | 20.1% |
| 55 to 64 Years | 639,980 | 19.0% |
| 65 to 74 Years | 446,297 | 13.3% |
| 75 to 84 Years | 224,866 | 6.7% |
| 85 Years and Over | 105,285 | 3.1% |
| Total | 3,363,093 | 100.0% |
Housing Finances in Los Angeles County
Median Income by Occupancy in Los Angeles County
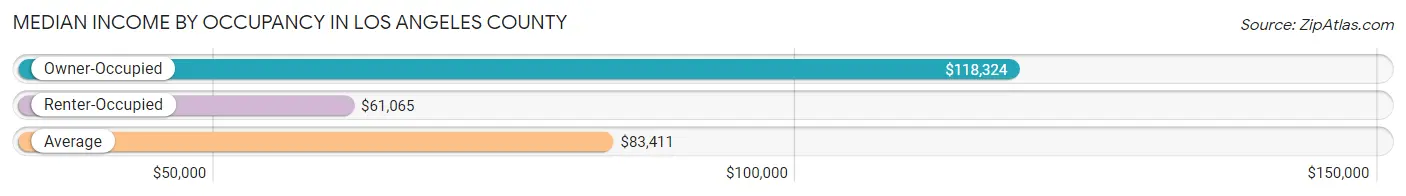
| Occupancy Type | # Households | Median Income |
| Owner-Occupied | 1,552,164 (46.2%) | $118,324 |
| Renter-Occupied | 1,810,929 (53.8%) | $61,065 |
| Average | 3,363,093 (100.0%) | $83,411 |
Occupancy by Householder Income Bracket in Los Angeles County
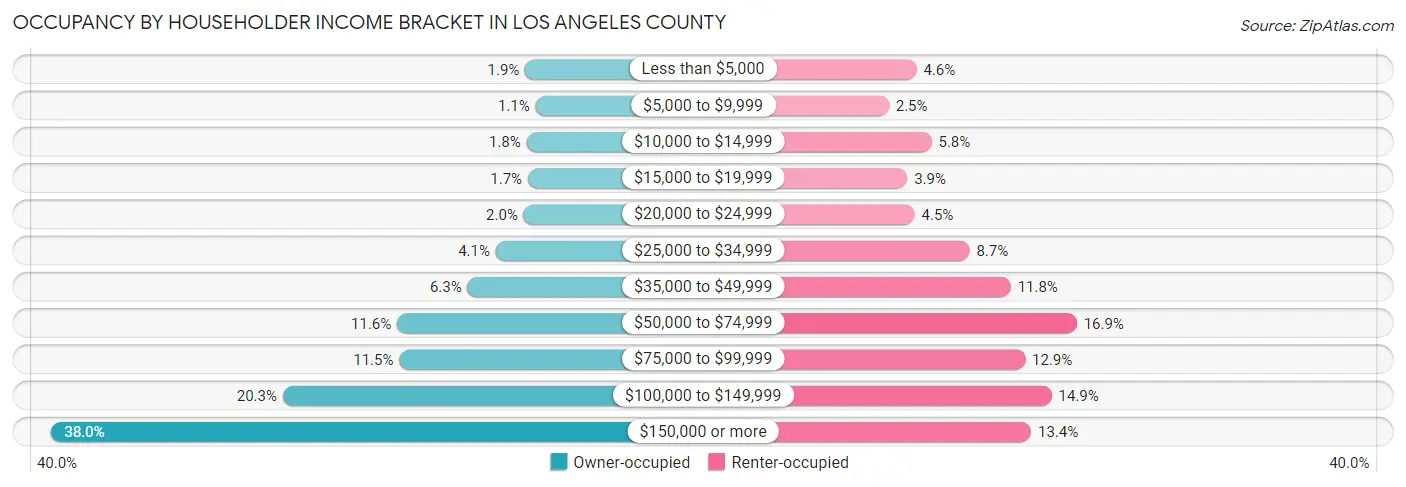
| Income Bracket | Owner-occupied | Renter-occupied |
| Less than $5,000 | 28,820 (1.9%) | 84,091 (4.6%) |
| $5,000 to $9,999 | 16,541 (1.1%) | 45,873 (2.5%) |
| $10,000 to $14,999 | 27,101 (1.8%) | 104,838 (5.8%) |
| $15,000 to $19,999 | 25,588 (1.7%) | 71,399 (3.9%) |
| $20,000 to $24,999 | 30,578 (2.0%) | 81,552 (4.5%) |
| $25,000 to $34,999 | 63,671 (4.1%) | 157,172 (8.7%) |
| $35,000 to $49,999 | 97,055 (6.2%) | 214,114 (11.8%) |
| $50,000 to $74,999 | 180,392 (11.6%) | 305,205 (16.9%) |
| $75,000 to $99,999 | 177,669 (11.5%) | 234,041 (12.9%) |
| $100,000 to $149,999 | 315,574 (20.3%) | 270,498 (14.9%) |
| $150,000 or more | 589,175 (38.0%) | 242,146 (13.4%) |
| Total | 1,552,164 (100.0%) | 1,810,929 (100.0%) |
Monthly Housing Cost Tiers in Los Angeles County
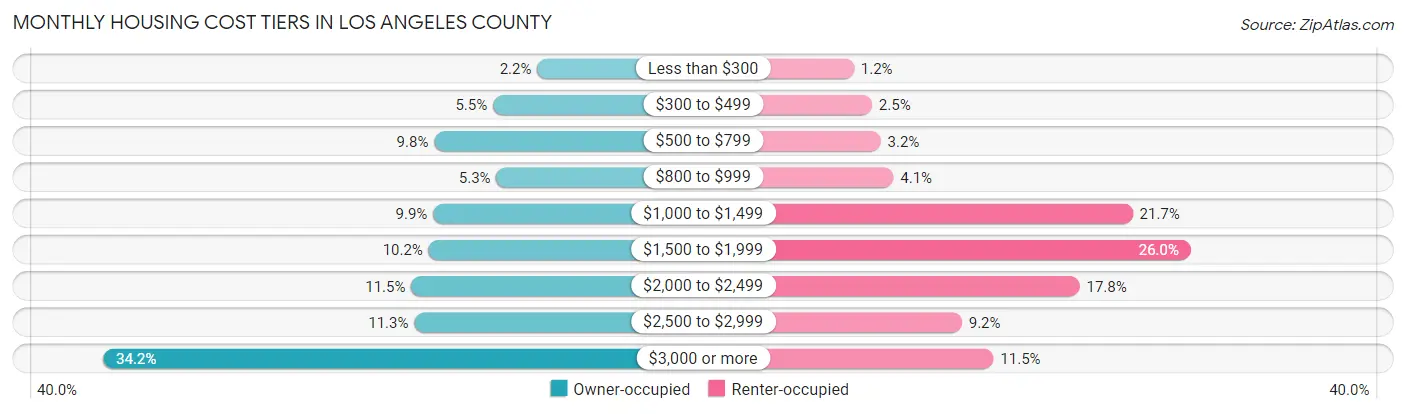
| Monthly Cost | Owner-occupied | Renter-occupied |
| Less than $300 | 34,795 (2.2%) | 21,893 (1.2%) |
| $300 to $499 | 85,306 (5.5%) | 45,959 (2.5%) |
| $500 to $799 | 152,558 (9.8%) | 57,539 (3.2%) |
| $800 to $999 | 81,431 (5.2%) | 74,663 (4.1%) |
| $1,000 to $1,499 | 153,746 (9.9%) | 393,654 (21.7%) |
| $1,500 to $1,999 | 158,992 (10.2%) | 471,272 (26.0%) |
| $2,000 to $2,499 | 178,821 (11.5%) | 322,973 (17.8%) |
| $2,500 to $2,999 | 175,353 (11.3%) | 165,835 (9.2%) |
| $3,000 or more | 531,162 (34.2%) | 208,077 (11.5%) |
| Total | 1,552,164 (100.0%) | 1,810,929 (100.0%) |
Physical Housing Characteristics in Los Angeles County
Housing Structures in Los Angeles County
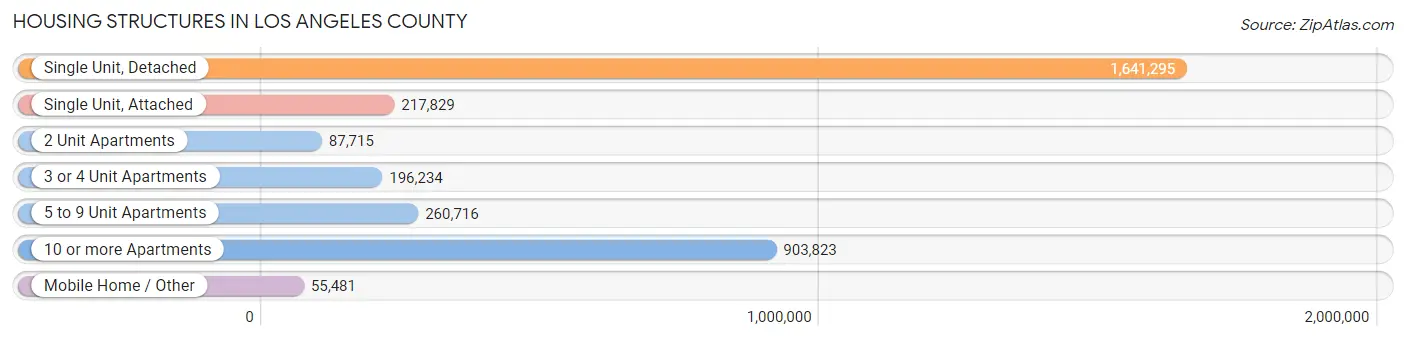
| Structure Type | # Housing Units | % Housing Units |
| Single Unit, Detached | 1,641,295 | 48.8% |
| Single Unit, Attached | 217,829 | 6.5% |
| 2 Unit Apartments | 87,715 | 2.6% |
| 3 or 4 Unit Apartments | 196,234 | 5.8% |
| 5 to 9 Unit Apartments | 260,716 | 7.7% |
| 10 or more Apartments | 903,823 | 26.9% |
| Mobile Home / Other | 55,481 | 1.7% |
| Total | 3,363,093 | 100.0% |
Housing Structures by Occupancy in Los Angeles County
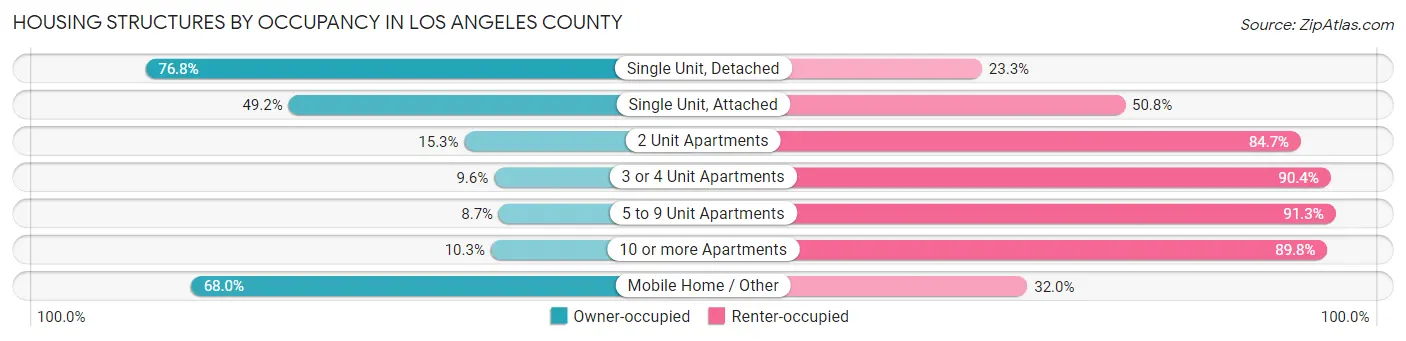
| Structure Type | Owner-occupied | Renter-occupied |
| Single Unit, Detached | 1,259,739 (76.7%) | 381,556 (23.3%) |
| Single Unit, Attached | 107,149 (49.2%) | 110,680 (50.8%) |
| 2 Unit Apartments | 13,444 (15.3%) | 74,271 (84.7%) |
| 3 or 4 Unit Apartments | 18,849 (9.6%) | 177,385 (90.4%) |
| 5 to 9 Unit Apartments | 22,616 (8.7%) | 238,100 (91.3%) |
| 10 or more Apartments | 92,635 (10.2%) | 811,188 (89.7%) |
| Mobile Home / Other | 37,732 (68.0%) | 17,749 (32.0%) |
| Total | 1,552,164 (46.2%) | 1,810,929 (53.8%) |
Housing Structures by Number of Rooms in Los Angeles County
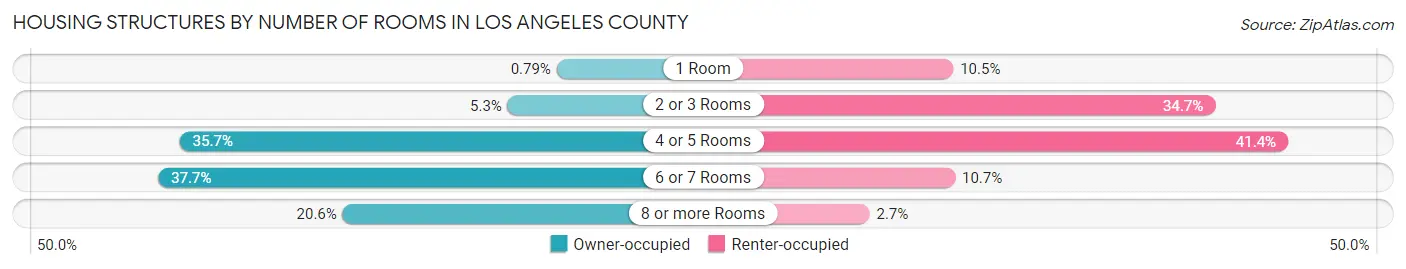
| Number of Rooms | Owner-occupied | Renter-occupied |
| 1 Room | 12,204 (0.8%) | 189,833 (10.5%) |
| 2 or 3 Rooms | 82,562 (5.3%) | 628,333 (34.7%) |
| 4 or 5 Rooms | 553,563 (35.7%) | 750,278 (41.4%) |
| 6 or 7 Rooms | 584,320 (37.7%) | 192,802 (10.6%) |
| 8 or more Rooms | 319,515 (20.6%) | 49,683 (2.7%) |
| Total | 1,552,164 (100.0%) | 1,810,929 (100.0%) |
Housing Structure by Heating Type in Los Angeles County
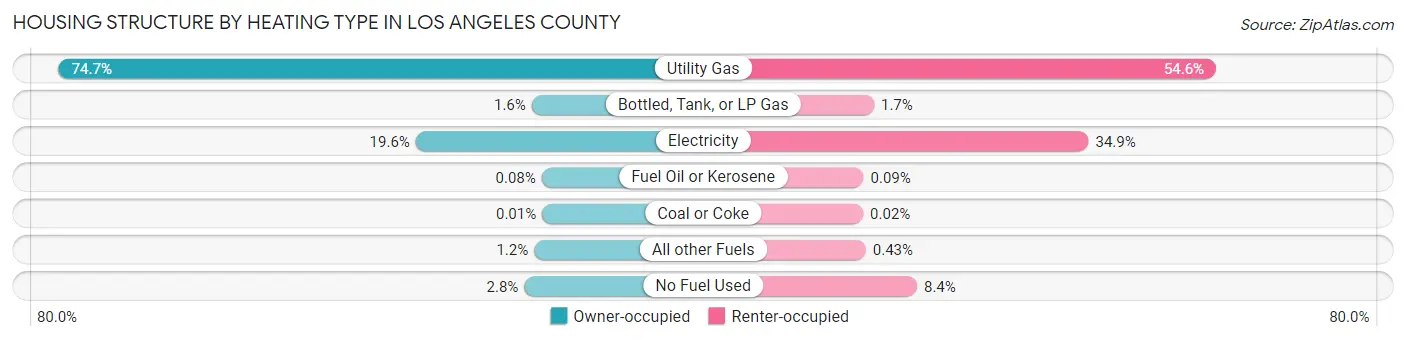
| Heating Type | Owner-occupied | Renter-occupied |
| Utility Gas | 1,159,989 (74.7%) | 987,857 (54.5%) |
| Bottled, Tank, or LP Gas | 25,085 (1.6%) | 30,867 (1.7%) |
| Electricity | 303,394 (19.6%) | 631,254 (34.9%) |
| Fuel Oil or Kerosene | 1,317 (0.1%) | 1,632 (0.1%) |
| Coal or Coke | 130 (0.0%) | 284 (0.0%) |
| All other Fuels | 19,321 (1.2%) | 7,801 (0.4%) |
| No Fuel Used | 42,928 (2.8%) | 151,234 (8.4%) |
| Total | 1,552,164 (100.0%) | 1,810,929 (100.0%) |
Household Vehicle Usage in Los Angeles County
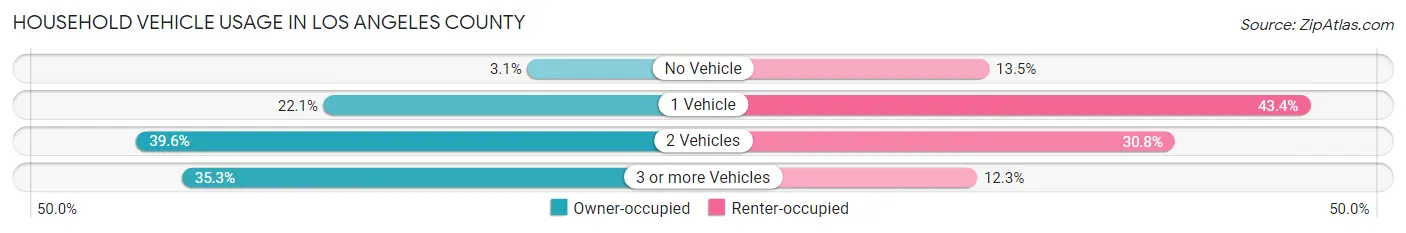
| Vehicles per Household | Owner-occupied | Renter-occupied |
| No Vehicle | 47,371 (3.0%) | 243,711 (13.5%) |
| 1 Vehicle | 342,553 (22.1%) | 786,401 (43.4%) |
| 2 Vehicles | 614,014 (39.6%) | 557,591 (30.8%) |
| 3 or more Vehicles | 548,226 (35.3%) | 223,226 (12.3%) |
| Total | 1,552,164 (100.0%) | 1,810,929 (100.0%) |
Real Estate & Mortgages in Los Angeles County
Real Estate and Mortgage Overview in Los Angeles County
| Characteristic | Without Mortgage | With Mortgage |
| Housing Units | 478,259 | 1,073,905 |
| Median Property Value | $709,800 | $741,200 |
| Median Household Income | $85,050 | $467,091 |
| Monthly Housing Costs | $754 | $518,268 |
| Real Estate Taxes | $3,777 | $16,638 |
Property Value by Mortgage Status in Los Angeles County
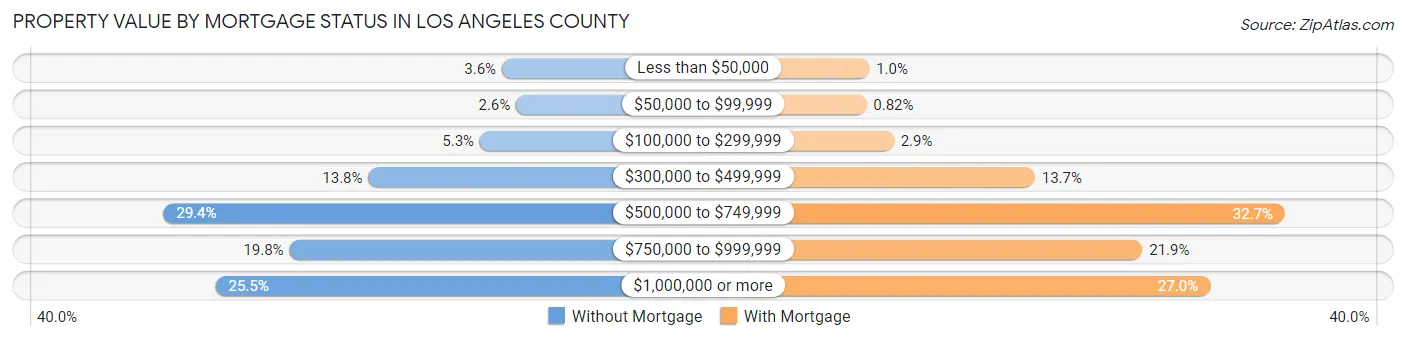
| Property Value | Without Mortgage | With Mortgage |
| Less than $50,000 | 17,379 (3.6%) | 11,180 (1.0%) |
| $50,000 to $99,999 | 12,196 (2.5%) | 8,782 (0.8%) |
| $100,000 to $299,999 | 25,387 (5.3%) | 31,288 (2.9%) |
| $300,000 to $499,999 | 66,035 (13.8%) | 146,720 (13.7%) |
| $500,000 to $749,999 | 140,755 (29.4%) | 351,314 (32.7%) |
| $750,000 to $999,999 | 94,776 (19.8%) | 234,612 (21.8%) |
| $1,000,000 or more | 121,731 (25.5%) | 290,009 (27.0%) |
| Total | 478,259 (100.0%) | 1,073,905 (100.0%) |
Household Income by Mortgage Status in Los Angeles County
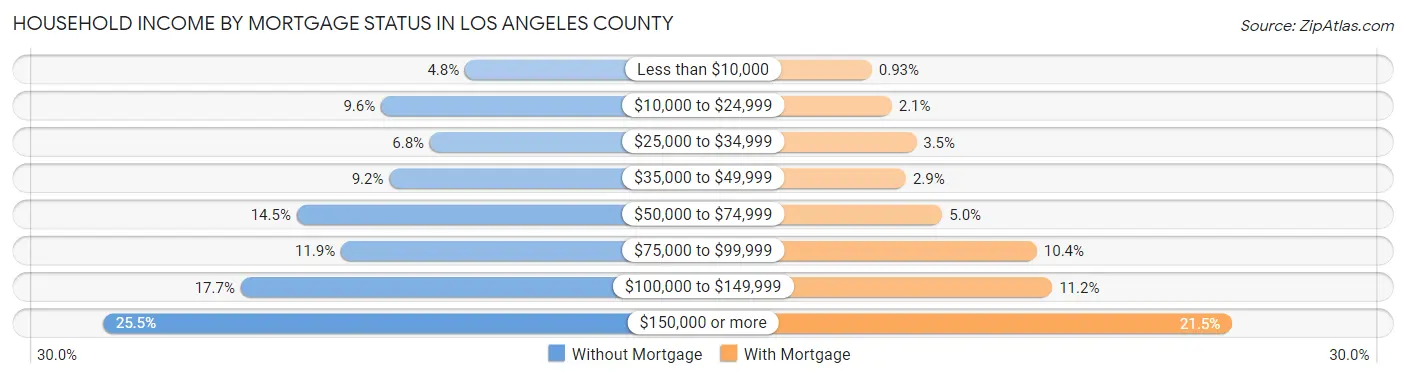
| Household Income | Without Mortgage | With Mortgage |
| Less than $10,000 | 23,079 (4.8%) | 9,973 (0.9%) |
| $10,000 to $24,999 | 46,039 (9.6%) | 22,282 (2.1%) |
| $25,000 to $34,999 | 32,723 (6.8%) | 37,228 (3.5%) |
| $35,000 to $49,999 | 43,812 (9.2%) | 30,948 (2.9%) |
| $50,000 to $74,999 | 69,101 (14.4%) | 53,243 (5.0%) |
| $75,000 to $99,999 | 57,002 (11.9%) | 111,291 (10.4%) |
| $100,000 to $149,999 | 84,419 (17.6%) | 120,667 (11.2%) |
| $150,000 or more | 122,084 (25.5%) | 231,155 (21.5%) |
| Total | 478,259 (100.0%) | 1,073,905 (100.0%) |
Property Value to Household Income Ratio in Los Angeles County
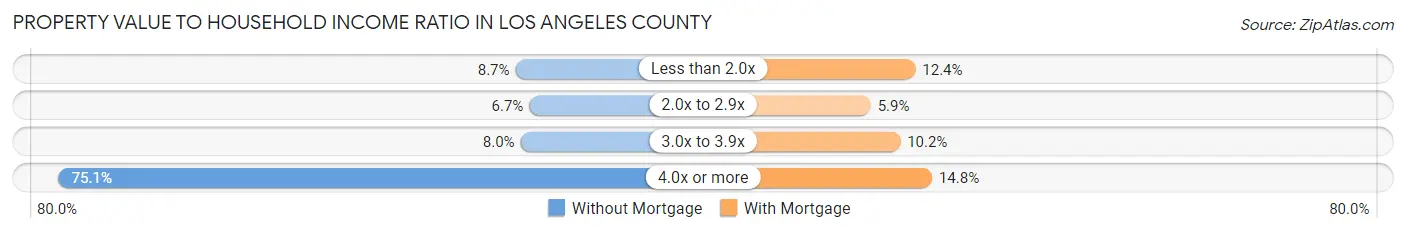
| Value-to-Income Ratio | Without Mortgage | With Mortgage |
| Less than 2.0x | 41,618 (8.7%) | 133,242 (12.4%) |
| 2.0x to 2.9x | 31,980 (6.7%) | 63,692 (5.9%) |
| 3.0x to 3.9x | 38,065 (8.0%) | 109,593 (10.2%) |
| 4.0x or more | 358,940 (75.0%) | 159,262 (14.8%) |
| Total | 478,259 (100.0%) | 1,073,905 (100.0%) |
Real Estate Taxes by Mortgage Status in Los Angeles County
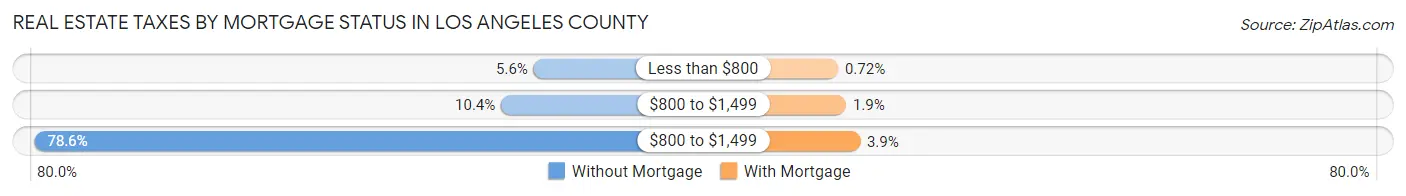
| Property Taxes | Without Mortgage | With Mortgage |
| Less than $800 | 26,838 (5.6%) | 7,759 (0.7%) |
| $800 to $1,499 | 49,577 (10.4%) | 20,263 (1.9%) |
| $800 to $1,499 | 375,761 (78.6%) | 42,223 (3.9%) |
| Total | 478,259 (100.0%) | 1,073,905 (100.0%) |
Health & Disability in Los Angeles County
Health Insurance Coverage by Age in Los Angeles County
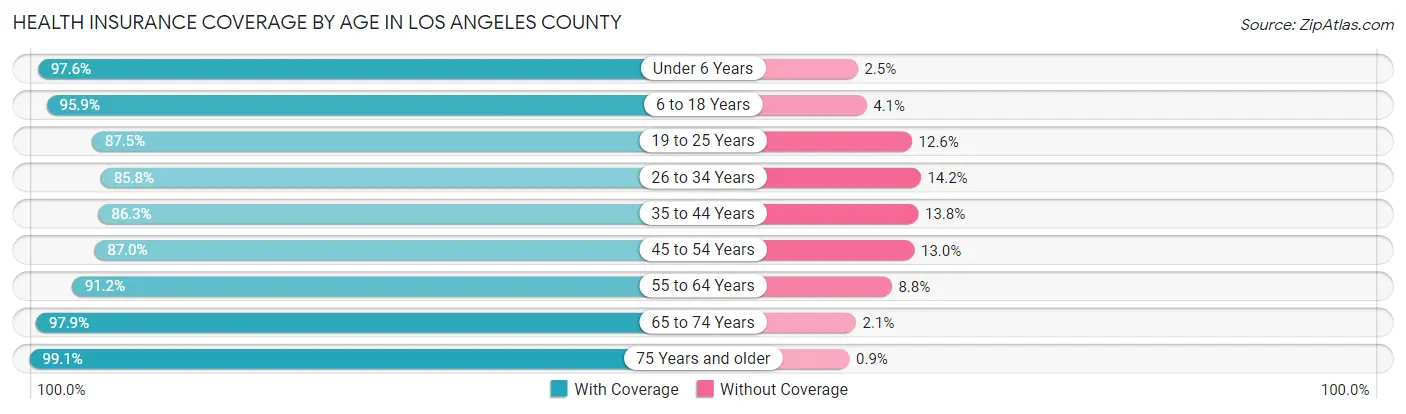
| Age Bracket | With Coverage | Without Coverage |
| Under 6 Years | 629,558 (97.6%) | 15,817 (2.5%) |
| 6 to 18 Years | 1,514,461 (95.9%) | 64,691 (4.1%) |
| 19 to 25 Years | 833,188 (87.5%) | 119,543 (12.6%) |
| 26 to 34 Years | 1,215,003 (85.8%) | 201,162 (14.2%) |
| 35 to 44 Years | 1,184,427 (86.3%) | 188,839 (13.8%) |
| 45 to 54 Years | 1,141,133 (87.0%) | 170,558 (13.0%) |
| 55 to 64 Years | 1,097,346 (91.2%) | 105,834 (8.8%) |
| 65 to 74 Years | 791,930 (97.9%) | 17,111 (2.1%) |
| 75 Years and older | 570,842 (99.1%) | 5,180 (0.9%) |
| Total | 8,977,888 (91.0%) | 888,735 (9.0%) |
Health Insurance Coverage by Citizenship Status in Los Angeles County
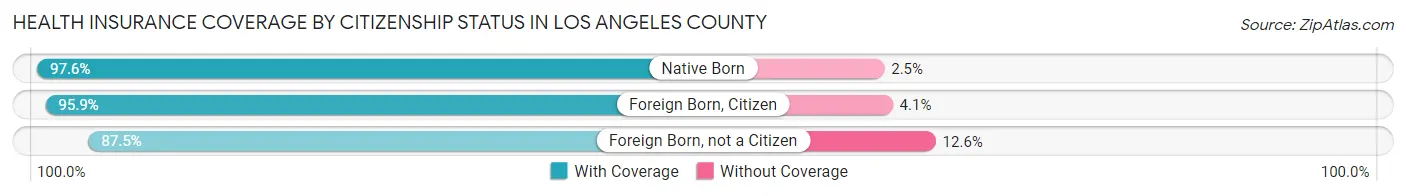
| Citizenship Status | With Coverage | Without Coverage |
| Native Born | 629,558 (97.6%) | 15,817 (2.5%) |
| Foreign Born, Citizen | 1,514,461 (95.9%) | 64,691 (4.1%) |
| Foreign Born, not a Citizen | 833,188 (87.5%) | 119,543 (12.6%) |
Health Insurance Coverage by Household Income in Los Angeles County
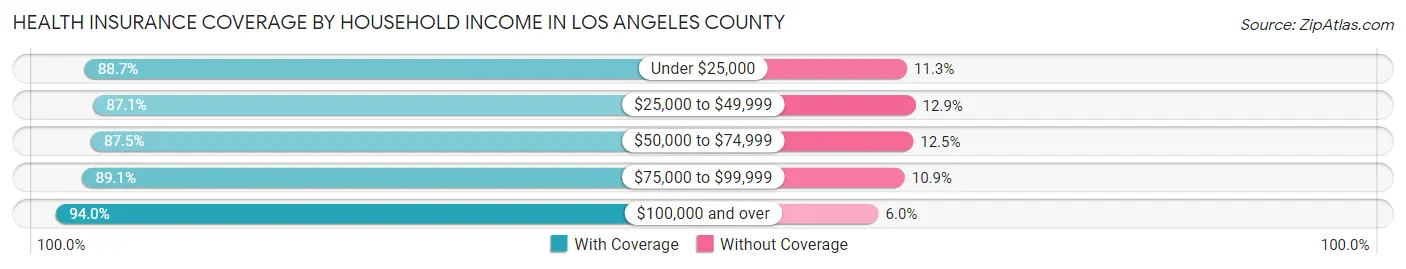
| Household Income | With Coverage | Without Coverage |
| Under $25,000 | 872,001 (88.7%) | 111,069 (11.3%) |
| $25,000 to $49,999 | 1,202,780 (87.1%) | 178,130 (12.9%) |
| $50,000 to $74,999 | 1,221,011 (87.5%) | 173,777 (12.5%) |
| $75,000 to $99,999 | 1,109,407 (89.1%) | 135,293 (10.9%) |
| $100,000 and over | 4,444,456 (94.0%) | 281,861 (6.0%) |
Public vs Private Health Insurance Coverage by Age in Los Angeles County
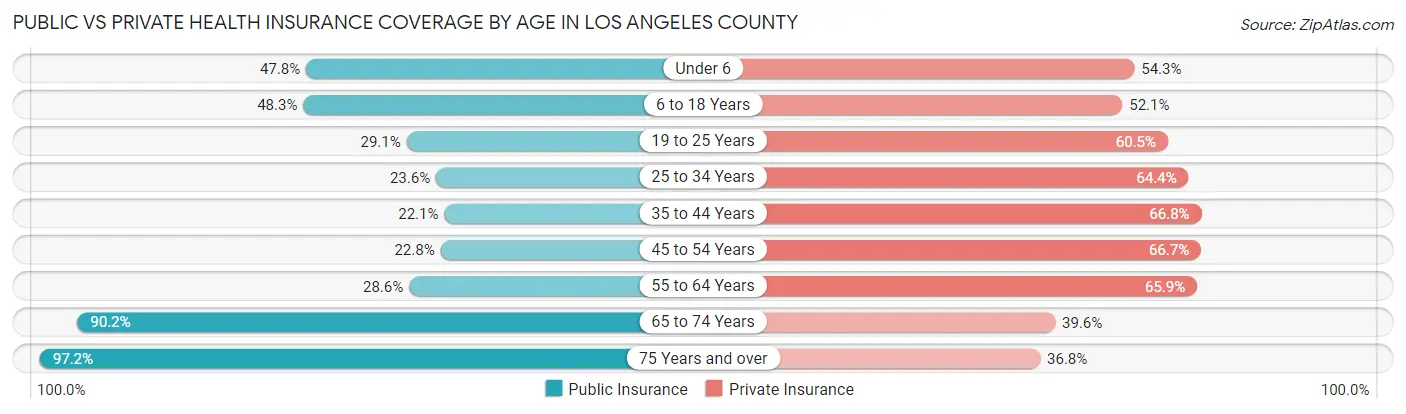
| Age Bracket | Public Insurance | Private Insurance |
| Under 6 | 308,172 (47.7%) | 350,351 (54.3%) |
| 6 to 18 Years | 762,405 (48.3%) | 822,286 (52.1%) |
| 19 to 25 Years | 277,273 (29.1%) | 576,475 (60.5%) |
| 25 to 34 Years | 334,808 (23.6%) | 911,436 (64.4%) |
| 35 to 44 Years | 303,526 (22.1%) | 916,712 (66.7%) |
| 45 to 54 Years | 299,176 (22.8%) | 874,907 (66.7%) |
| 55 to 64 Years | 344,613 (28.6%) | 793,281 (65.9%) |
| 65 to 74 Years | 729,730 (90.2%) | 320,277 (39.6%) |
| 75 Years and over | 559,691 (97.2%) | 212,020 (36.8%) |
| Total | 3,919,394 (39.7%) | 5,777,745 (58.6%) |
Disability Status by Sex by Age in Los Angeles County
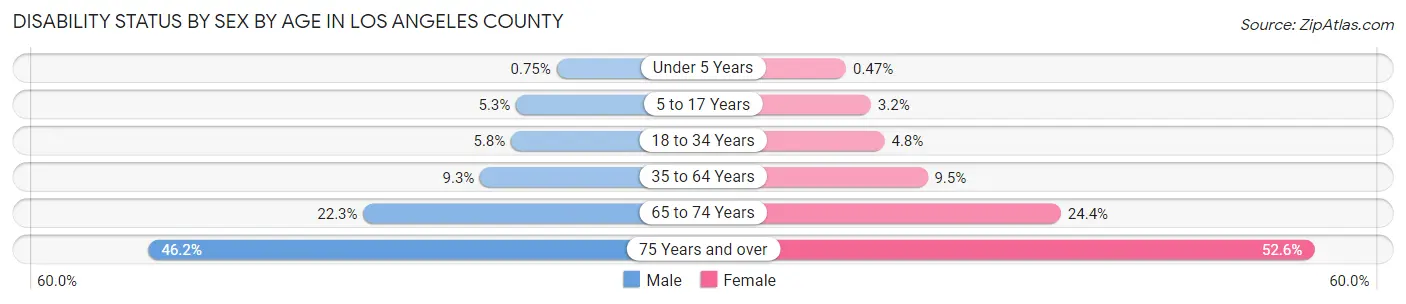
| Age Bracket | Male | Female |
| Under 5 Years | 2,058 (0.7%) | 1,228 (0.5%) |
| 5 to 17 Years | 41,904 (5.3%) | 24,515 (3.2%) |
| 18 to 34 Years | 73,734 (5.8%) | 58,741 (4.8%) |
| 35 to 64 Years | 180,398 (9.3%) | 185,069 (9.5%) |
| 65 to 74 Years | 83,253 (22.3%) | 106,203 (24.4%) |
| 75 Years and over | 107,337 (46.2%) | 180,749 (52.6%) |
Disability Class by Sex by Age in Los Angeles County
Disability Class: Hearing Difficulty
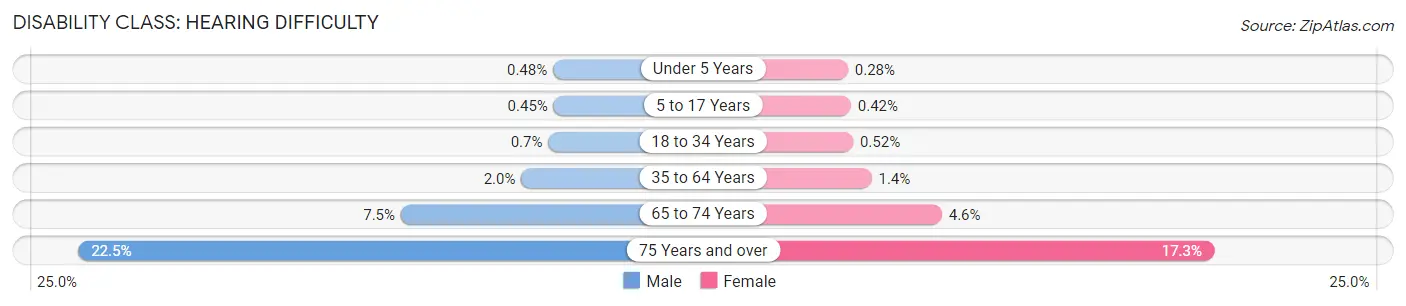
| Age Bracket | Male | Female |
| Under 5 Years | 1,313 (0.5%) | 729 (0.3%) |
| 5 to 17 Years | 3,610 (0.4%) | 3,141 (0.4%) |
| 18 to 34 Years | 8,819 (0.7%) | 6,383 (0.5%) |
| 35 to 64 Years | 37,938 (1.9%) | 26,739 (1.4%) |
| 65 to 74 Years | 28,198 (7.5%) | 20,177 (4.6%) |
| 75 Years and over | 52,295 (22.5%) | 59,321 (17.3%) |
Disability Class: Vision Difficulty
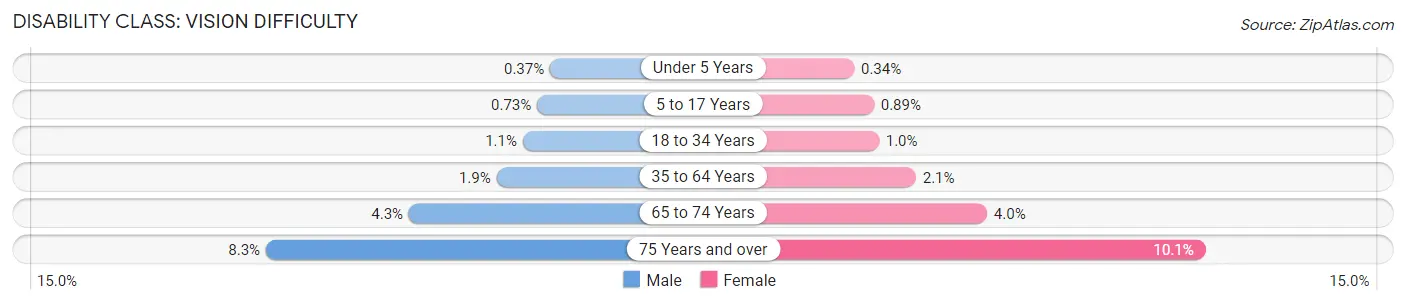
| Age Bracket | Male | Female |
| Under 5 Years | 1,028 (0.4%) | 892 (0.3%) |
| 5 to 17 Years | 5,826 (0.7%) | 6,767 (0.9%) |
| 18 to 34 Years | 14,343 (1.1%) | 12,692 (1.0%) |
| 35 to 64 Years | 36,205 (1.9%) | 39,975 (2.1%) |
| 65 to 74 Years | 16,091 (4.3%) | 17,593 (4.0%) |
| 75 Years and over | 19,241 (8.3%) | 34,819 (10.1%) |
Disability Class: Cognitive Difficulty
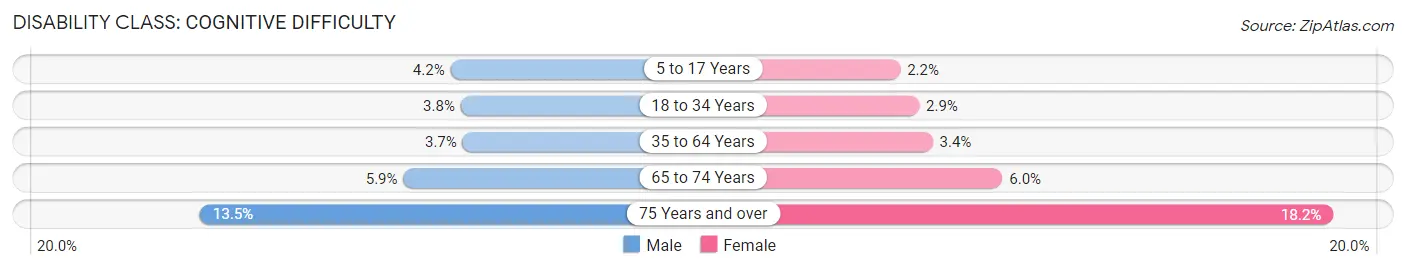
| Age Bracket | Male | Female |
| 5 to 17 Years | 33,357 (4.2%) | 16,400 (2.2%) |
| 18 to 34 Years | 48,333 (3.8%) | 35,396 (2.9%) |
| 35 to 64 Years | 72,890 (3.7%) | 65,451 (3.4%) |
| 65 to 74 Years | 22,204 (5.9%) | 25,952 (6.0%) |
| 75 Years and over | 31,333 (13.5%) | 62,674 (18.2%) |
Disability Class: Ambulatory Difficulty
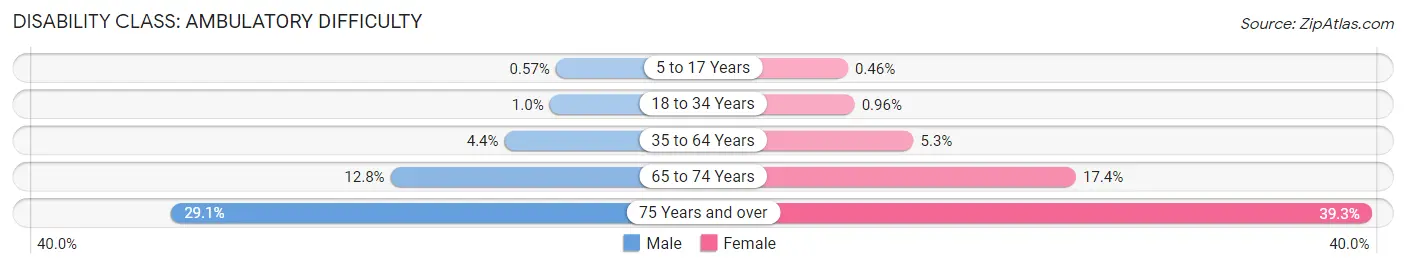
| Age Bracket | Male | Female |
| 5 to 17 Years | 4,548 (0.6%) | 3,463 (0.5%) |
| 18 to 34 Years | 13,094 (1.0%) | 11,873 (1.0%) |
| 35 to 64 Years | 85,259 (4.4%) | 103,430 (5.3%) |
| 65 to 74 Years | 48,002 (12.8%) | 75,686 (17.4%) |
| 75 Years and over | 67,633 (29.1%) | 135,187 (39.3%) |
Disability Class: Self-Care Difficulty
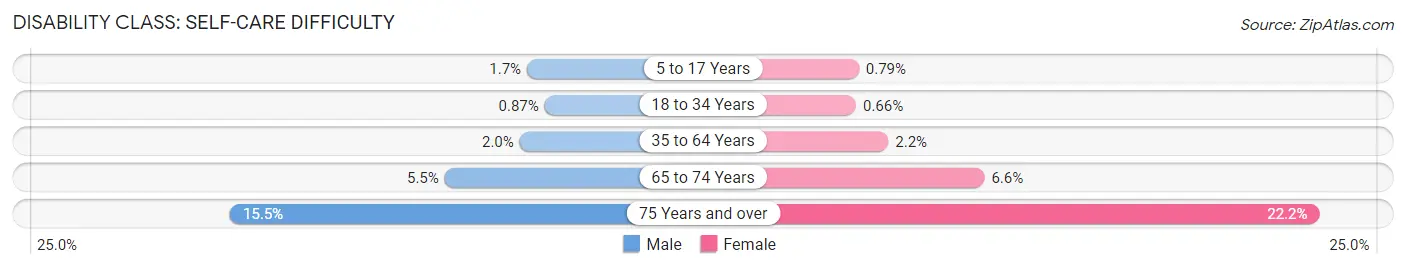
| Age Bracket | Male | Female |
| 5 to 17 Years | 13,434 (1.7%) | 6,004 (0.8%) |
| 18 to 34 Years | 11,081 (0.9%) | 8,114 (0.7%) |
| 35 to 64 Years | 39,535 (2.0%) | 41,937 (2.2%) |
| 65 to 74 Years | 20,599 (5.5%) | 28,802 (6.6%) |
| 75 Years and over | 35,940 (15.5%) | 76,165 (22.2%) |
Technology Access in Los Angeles County
Computing Device Access in Los Angeles County
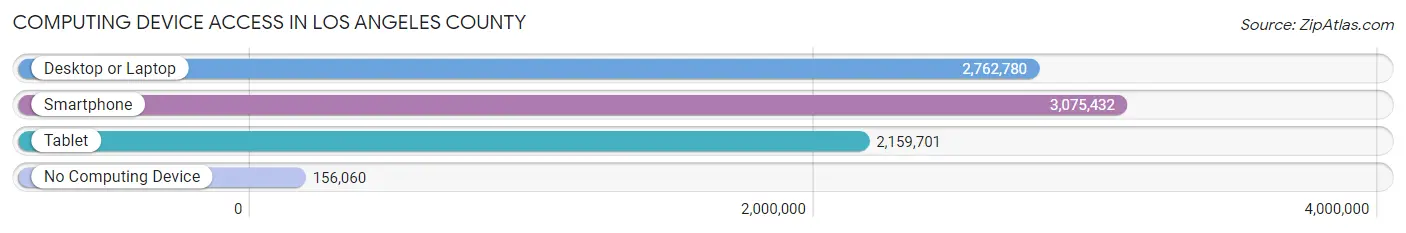
| Device Type | # Households | % Households |
| Desktop or Laptop | 2,762,780 | 82.2% |
| Smartphone | 3,075,432 | 91.4% |
| Tablet | 2,159,701 | 64.2% |
| No Computing Device | 156,060 | 4.6% |
| Total | 3,363,093 | 100.0% |
Internet Access in Los Angeles County
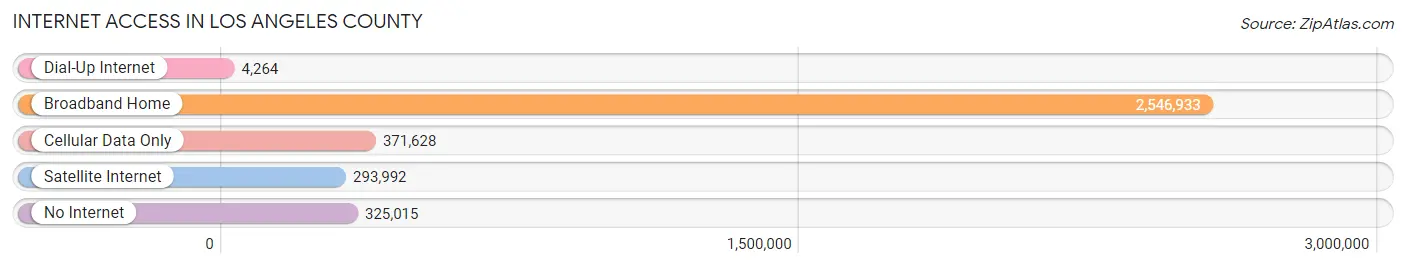
| Internet Type | # Households | % Households |
| Dial-Up Internet | 4,264 | 0.1% |
| Broadband Home | 2,546,933 | 75.7% |
| Cellular Data Only | 371,628 | 11.1% |
| Satellite Internet | 293,992 | 8.7% |
| No Internet | 325,015 | 9.7% |
| Total | 3,363,093 | 100.0% |
Los Angeles County Summary
Los Angeles County is the most populous county in the United States, with a population of 10,163,507 as of the 2019 census. It is located in the southern part of California, and is bordered by Ventura County to the west, Kern County to the north, San Bernardino County to the east, and Orange County to the south. The county seat is the city of Los Angeles, the largest city in the state and the second-largest in the country.
History
Los Angeles County was established in 1850, when California became a state. It was originally part of the larger San Bernardino County, but was split off in 1853. The county was named after the Los Angeles River, which was named by Spanish explorers in 1769.
The area was originally inhabited by the Tongva people, who were later displaced by Spanish settlers. The Spanish established the first mission in the area in 1771, and the city of Los Angeles was founded in 1781. The area was part of Mexico until 1848, when it became part of the United States after the Mexican-American War.
The county experienced rapid growth in the late 19th and early 20th centuries, as the area became a major center for the film and television industries. The population of the county more than doubled between 1950 and 1970, and has continued to grow since then.
Geography
Los Angeles County covers an area of 4,751 square miles, making it the largest county in the United States by area. It is located in the southern part of California, and is bordered by Ventura County to the west, Kern County to the north, San Bernardino County to the east, and Orange County to the south.
The county is divided into 88 cities and several unincorporated areas. The largest cities are Los Angeles, Long Beach, Glendale, Santa Clarita, and Lancaster. The county also includes several mountain ranges, including the San Gabriel Mountains, the Santa Monica Mountains, and the San Bernardino Mountains.
Economy
Los Angeles County is a major economic center in the United States. The county is home to several major industries, including entertainment, aerospace, technology, finance, and tourism.
The county is home to several major companies, including The Walt Disney Company, Warner Bros., Universal Pictures, and Paramount Pictures. It is also home to several major universities, including the University of California, Los Angeles, the University of Southern California, and California State University, Los Angeles.
The county has a gross domestic product of $717 billion, making it the third-largest economy in the United States. The median household income is $62,827, and the unemployment rate is 4.2%.
Demographics
As of the 2019 census, Los Angeles County had a population of 10,163,507. The population is racially and ethnically diverse, with the largest racial/ethnic groups being White (48.2%), Hispanic or Latino (47.2%), and Asian (11.2%).
The county is home to several major immigrant communities, including Mexican, Filipino, Korean, and Vietnamese. The largest foreign-born population is from Mexico, accounting for 28.3% of the population.
The county is also home to a large LGBT population, with an estimated 8.3% of the population identifying as LGBT.
Conclusion
Los Angeles County is the most populous county in the United States, with a population of 10,163,507 as of the 2019 census. It is located in the southern part of California, and is bordered by Ventura County to the west, Kern County to the north, San Bernardino County to the east, and Orange County to the south. The county is a major economic center in the United States, with a gross domestic product of $717 billion and a median household income of $62,827. The population is racially and ethnically diverse, with the largest racial/ethnic groups being White (48.2%), Hispanic or Latino (47.2%), and Asian (11.2%). The county is also home to several major immigrant communities, and a large LGBT population.
Common Questions
What is Per Capita Income in Los Angeles County?
Per Capita income in Los Angeles County is $41,847.
What is the Median Family Income in Los Angeles County?
Median Family Income in Los Angeles County is $93,675.
What is the Median Household income in Los Angeles County?
Median Household Income in Los Angeles County is $83,411.
What is Income or Wage Gap in Los Angeles County?
Income or Wage Gap in Los Angeles County is 20.7%.
Women in Los Angeles County earn 79.3 cents for every dollar earned by a man.
What is Family Income Deficit in Los Angeles County?
Family Income Deficit in Los Angeles County is $11,092.
Families that are below poverty line in Los Angeles County earn $11,092 less on average than the poverty threshold level.
What is Inequality or Gini Index in Los Angeles County?
Inequality or Gini Index in Los Angeles County is 0.50.
What is the Total Population of Los Angeles County?
Total Population of Los Angeles County is 9,936,690.
What is the Total Male Population of Los Angeles County?
Total Male Population of Los Angeles County is 4,937,101.
What is the Total Female Population of Los Angeles County?
Total Female Population of Los Angeles County is 4,999,589.
What is the Ratio of Males per 100 Females in Los Angeles County?
There are 98.75 Males per 100 Females in Los Angeles County.
What is the Ratio of Females per 100 Males in Los Angeles County?
There are 101.27 Females per 100 Males in Los Angeles County.
What is the Median Population Age in Los Angeles County?
Median Population Age in Los Angeles County is 37.4 Years.
What is the Average Family Size in Los Angeles County
Average Family Size in Los Angeles County is 3.6 People.
What is the Average Household Size in Los Angeles County
Average Household Size in Los Angeles County is 2.9 People.
How Large is the Labor Force in Los Angeles County?
There are 5,240,280 People in the Labor Forcein in Los Angeles County.
What is the Percentage of People in the Labor Force in Los Angeles County?
64.8% of People are in the Labor Force in Los Angeles County.
What is the Unemployment Rate in Los Angeles County?
Unemployment Rate in Los Angeles County is 7.0%.