Alameda County, CA Map & Demographics
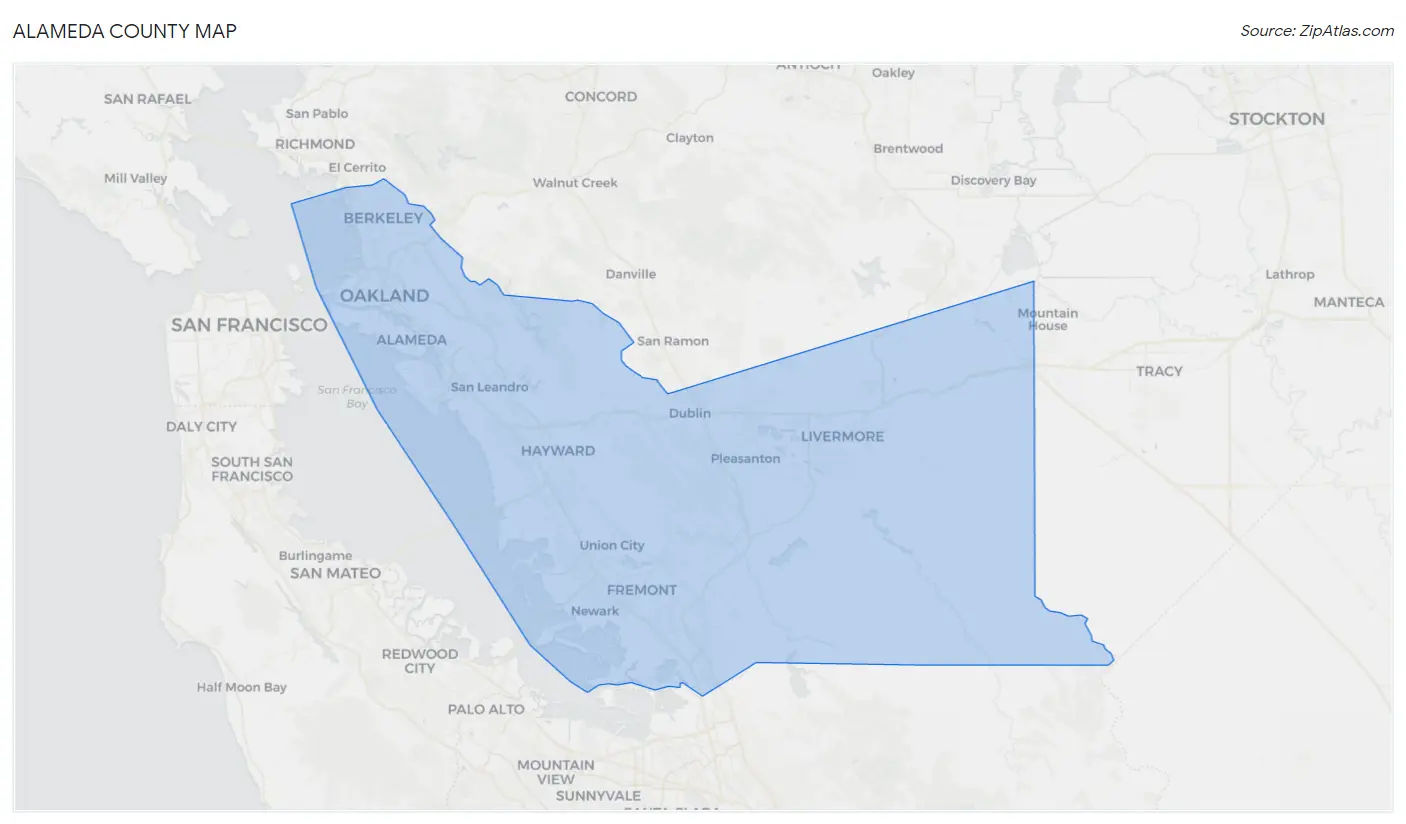
Alameda County Map
Alameda County Overview
$60,193
PER CAPITA INCOME
$149,535
AVG FAMILY INCOME
$122,488
AVG HOUSEHOLD INCOME
22.9%
WAGE / INCOME GAP [ % ]
77.1¢/ $1
WAGE / INCOME GAP [ $ ]
$10,750
FAMILY INCOME DEFICIT
0.47
INEQUALITY / GINI INDEX
1,663,823
TOTAL POPULATION
826,561
MALE POPULATION
837,262
FEMALE POPULATION
98.72
MALES / 100 FEMALES
101.29
FEMALES / 100 MALES
38.4
MEDIAN AGE
3.4
AVG FAMILY SIZE
2.8
AVG HOUSEHOLD SIZE
917,240
LABOR FORCE [ PEOPLE ]
67.0%
PERCENT IN LABOR FORCE
4.9%
UNEMPLOYMENT RATE
Income in Alameda County
Income Overview in Alameda County
Per Capita Income in Alameda County is $60,193, while median incomes of families and households are $149,535 and $122,488 respectively.
| Characteristic | Number | Measure |
| Per Capita Income | 1,663,823 | $60,193 |
| Median Family Income | 386,555 | $149,535 |
| Mean Family Income | 386,555 | $191,190 |
| Median Household Income | 585,818 | $122,488 |
| Mean Household Income | 585,818 | $164,668 |
| Income Deficit | 386,555 | $10,750 |
| Wage / Income Gap (%) | 1,663,823 | 22.88% |
| Wage / Income Gap ($) | 1,663,823 | 77.12¢ per $1 |
| Gini / Inequality Index | 1,663,823 | 0.47 |
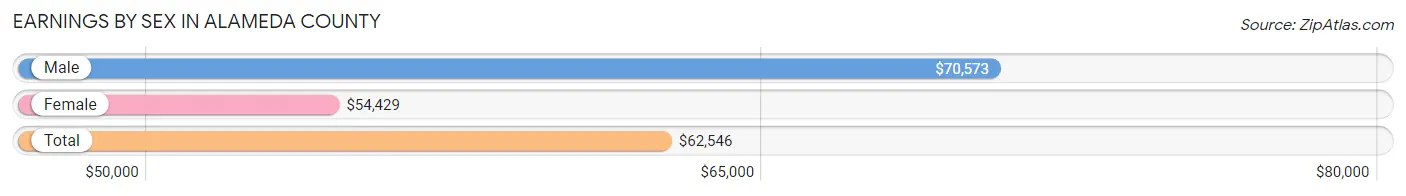
Earnings by Sex in Alameda County
Average Earnings in Alameda County are $62,546, $70,573 for men and $54,429 for women, a difference of 22.9%.
| Sex | Number | Average Earnings |
| Male | 502,355 (53.2%) | $70,573 |
| Female | 442,356 (46.8%) | $54,429 |
| Total | 944,711 (100.0%) | $62,546 |
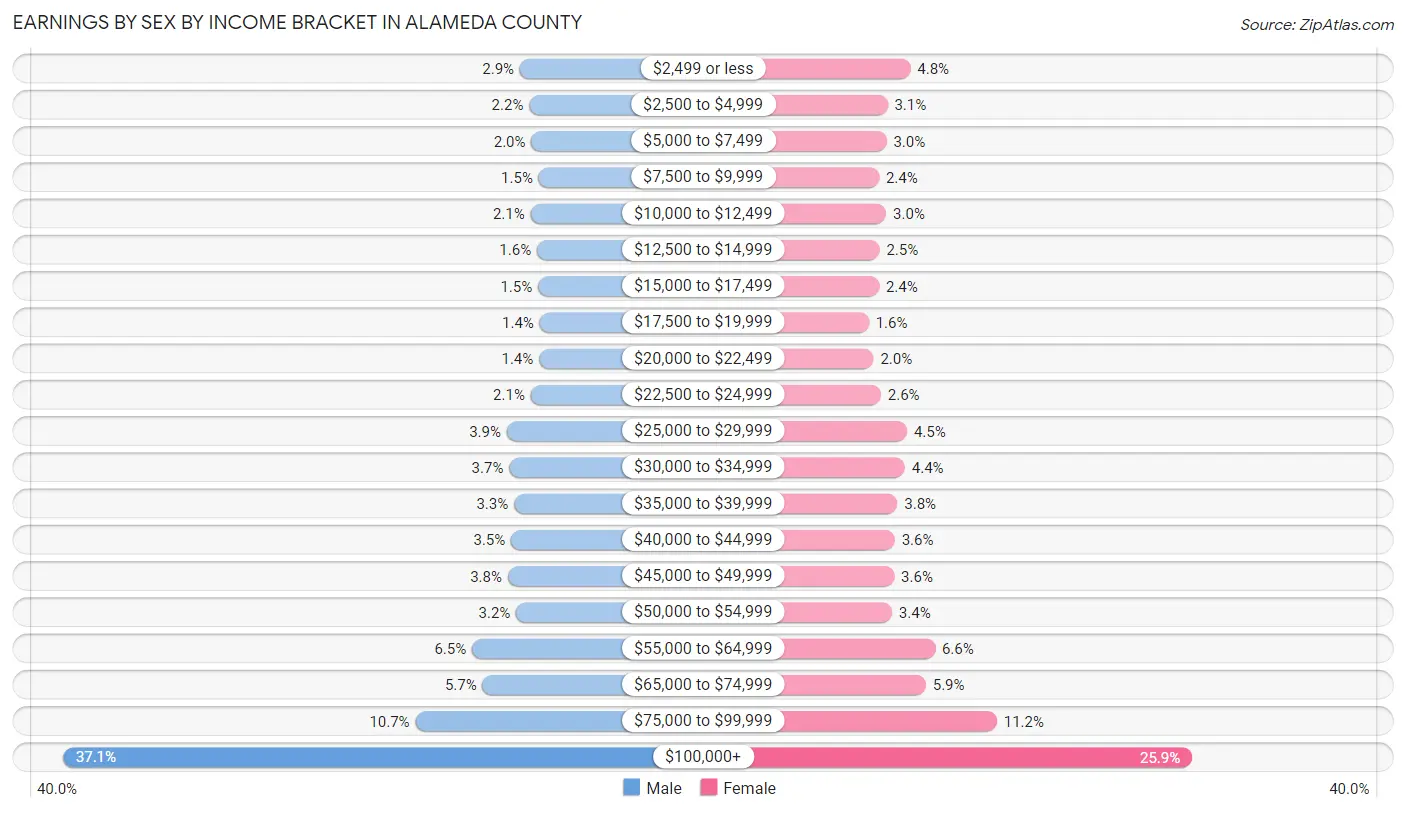
Earnings by Sex by Income Bracket in Alameda County
The most common earnings brackets in Alameda County are $100,000+ for men (186,514 | 37.1%) and $100,000+ for women (114,417 | 25.9%).
| Income | Male | Female |
| $2,499 or less | 14,472 (2.9%) | 21,073 (4.8%) |
| $2,500 to $4,999 | 10,959 (2.2%) | 13,501 (3.0%) |
| $5,000 to $7,499 | 10,170 (2.0%) | 13,159 (3.0%) |
| $7,500 to $9,999 | 7,395 (1.5%) | 10,659 (2.4%) |
| $10,000 to $12,499 | 10,434 (2.1%) | 13,071 (2.9%) |
| $12,500 to $14,999 | 8,033 (1.6%) | 10,816 (2.5%) |
| $15,000 to $17,499 | 7,618 (1.5%) | 10,674 (2.4%) |
| $17,500 to $19,999 | 7,020 (1.4%) | 7,241 (1.6%) |
| $20,000 to $22,499 | 7,239 (1.4%) | 8,849 (2.0%) |
| $22,500 to $24,999 | 10,396 (2.1%) | 11,266 (2.5%) |
| $25,000 to $29,999 | 19,412 (3.9%) | 19,964 (4.5%) |
| $30,000 to $34,999 | 18,495 (3.7%) | 19,230 (4.3%) |
| $35,000 to $39,999 | 16,693 (3.3%) | 16,783 (3.8%) |
| $40,000 to $44,999 | 17,776 (3.5%) | 15,889 (3.6%) |
| $45,000 to $49,999 | 19,034 (3.8%) | 15,711 (3.5%) |
| $50,000 to $54,999 | 15,866 (3.2%) | 14,947 (3.4%) |
| $55,000 to $64,999 | 32,486 (6.5%) | 29,234 (6.6%) |
| $65,000 to $74,999 | 28,555 (5.7%) | 26,168 (5.9%) |
| $75,000 to $99,999 | 53,788 (10.7%) | 49,704 (11.2%) |
| $100,000+ | 186,514 (37.1%) | 114,417 (25.9%) |
| Total | 502,355 (100.0%) | 442,356 (100.0%) |
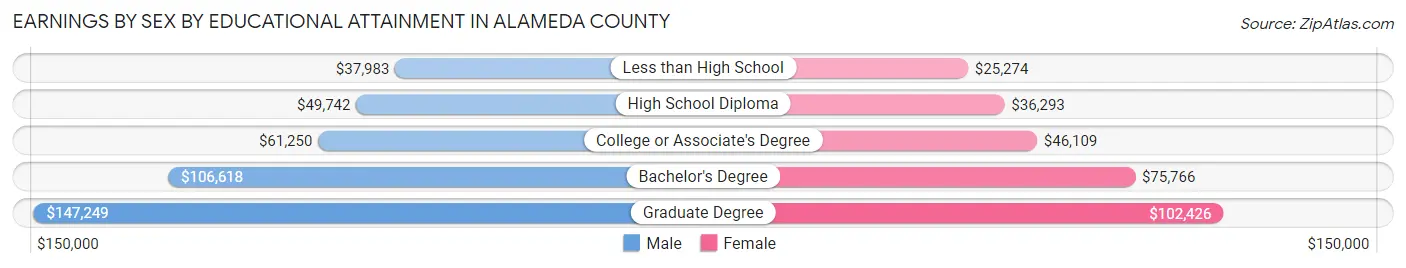
Earnings by Sex by Educational Attainment in Alameda County
Average earnings in Alameda County are $80,088 for men and $61,689 for women, a difference of 23.0%. Men with an educational attainment of graduate degree enjoy the highest average annual earnings of $147,249, while those with less than high school education earn the least with $37,983. Women with an educational attainment of graduate degree earn the most with the average annual earnings of $102,426, while those with less than high school education have the smallest earnings of $25,274.
| Educational Attainment | Male Income | Female Income |
| Less than High School | $37,983 | $25,274 |
| High School Diploma | $49,742 | $36,293 |
| College or Associate's Degree | $61,250 | $46,109 |
| Bachelor's Degree | $106,618 | $75,766 |
| Graduate Degree | $147,249 | $102,426 |
| Total | $80,088 | $61,689 |
Family Income in Alameda County
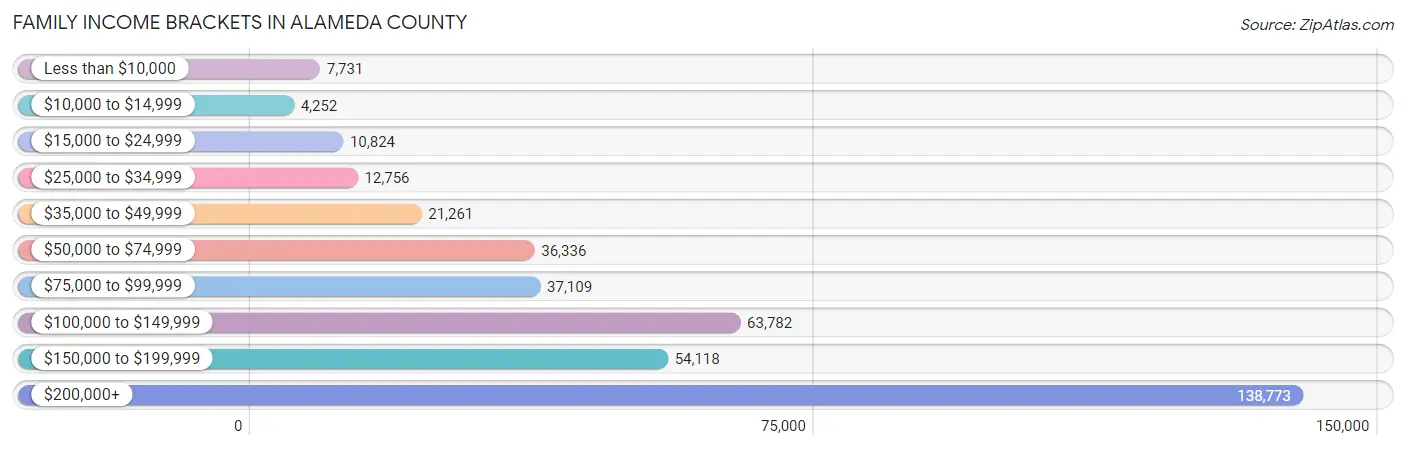
Family Income Brackets in Alameda County
According to the Alameda County family income data, there are 138,773 families falling into the $200,000+ income range, which is the most common income bracket and makes up 35.9% of all families. Conversely, the $10,000 to $14,999 income bracket is the least frequent group with only 4,252 families (1.1%) belonging to this category.
| Income Bracket | # Families | % Families |
| Less than $10,000 | 7,731 | 2.0% |
| $10,000 to $14,999 | 4,252 | 1.1% |
| $15,000 to $24,999 | 10,824 | 2.8% |
| $25,000 to $34,999 | 12,756 | 3.3% |
| $35,000 to $49,999 | 21,261 | 5.5% |
| $50,000 to $74,999 | 36,336 | 9.4% |
| $75,000 to $99,999 | 37,109 | 9.6% |
| $100,000 to $149,999 | 63,782 | 16.5% |
| $150,000 to $199,999 | 54,118 | 14.0% |
| $200,000+ | 138,773 | 35.9% |
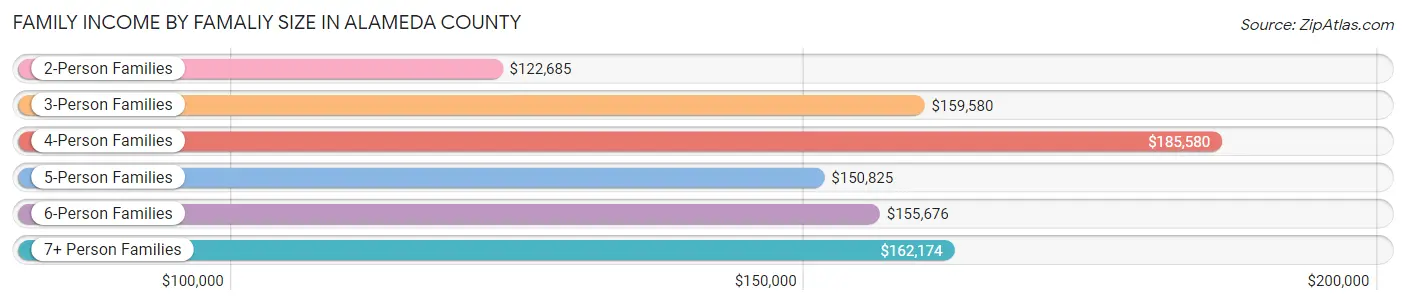
Family Income by Famaliy Size in Alameda County
4-person families (87,986 | 22.8%) account for the highest median family income in Alameda County with $185,580 per family, while 2-person families (152,491 | 39.5%) have the highest median income of $61,342 per family member.
| Income Bracket | # Families | Median Income |
| 2-Person Families | 152,491 (39.5%) | $122,685 |
| 3-Person Families | 93,212 (24.1%) | $159,580 |
| 4-Person Families | 87,986 (22.8%) | $185,580 |
| 5-Person Families | 33,747 (8.7%) | $150,825 |
| 6-Person Families | 12,042 (3.1%) | $155,676 |
| 7+ Person Families | 7,077 (1.8%) | $162,174 |
| Total | 386,555 (100.0%) | $149,535 |
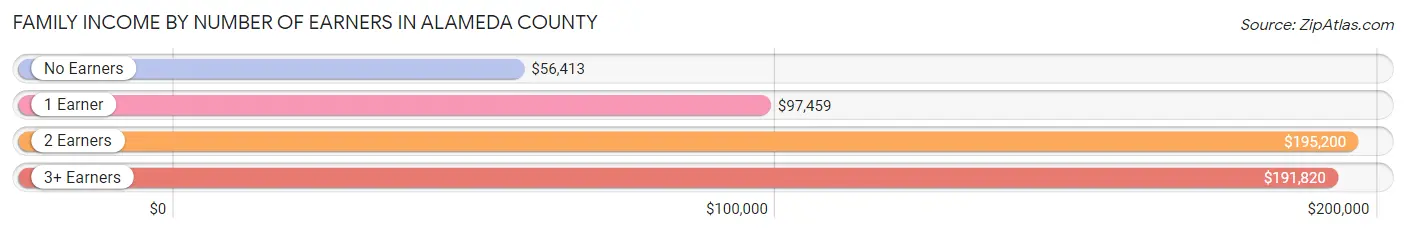
Family Income by Number of Earners in Alameda County
The median family income in Alameda County is $149,535, with families comprising 2 earners (179,755) having the highest median family income of $195,200, while families with no earners (38,593) have the lowest median family income of $56,413, accounting for 46.5% and 10.0% of families, respectively.
| Number of Earners | # Families | Median Income |
| No Earners | 38,593 (10.0%) | $56,413 |
| 1 Earner | 113,804 (29.4%) | $97,459 |
| 2 Earners | 179,755 (46.5%) | $195,200 |
| 3+ Earners | 54,403 (14.1%) | $191,820 |
| Total | 386,555 (100.0%) | $149,535 |
Household Income in Alameda County
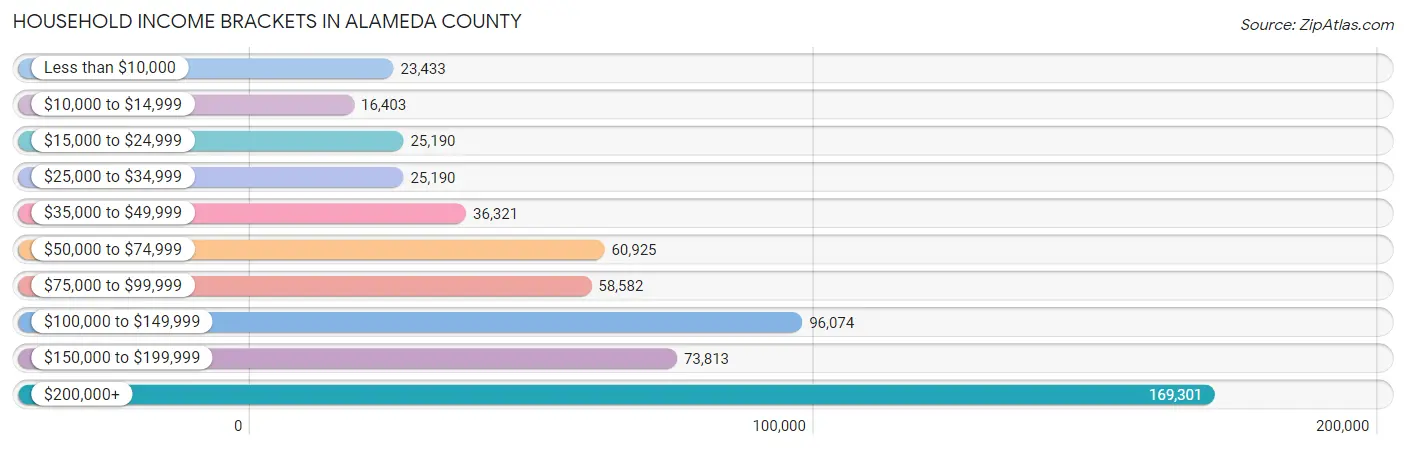
Household Income Brackets in Alameda County
With 169,301 households falling in the category, the $200,000+ income range is the most frequent in Alameda County, accounting for 28.9% of all households. In contrast, only 16,403 households (2.8%) fall into the $10,000 to $14,999 income bracket, making it the least populous group.
| Income Bracket | # Households | % Households |
| Less than $10,000 | 23,433 | 4.0% |
| $10,000 to $14,999 | 16,403 | 2.8% |
| $15,000 to $24,999 | 25,190 | 4.3% |
| $25,000 to $34,999 | 25,190 | 4.3% |
| $35,000 to $49,999 | 36,321 | 6.2% |
| $50,000 to $74,999 | 60,925 | 10.4% |
| $75,000 to $99,999 | 58,582 | 10.0% |
| $100,000 to $149,999 | 96,074 | 16.4% |
| $150,000 to $199,999 | 73,813 | 12.6% |
| $200,000+ | 169,301 | 28.9% |
Household Income by Householder Age in Alameda County
The median household income in Alameda County is $122,488, with the highest median household income of $145,771 found in the 25 to 44 years age bracket for the primary householder. A total of 216,482 households (36.9%) fall into this category. Meanwhile, the 15 to 24 years age bracket for the primary householder has the lowest median household income of $48,287, with 13,285 households (2.3%) in this group.
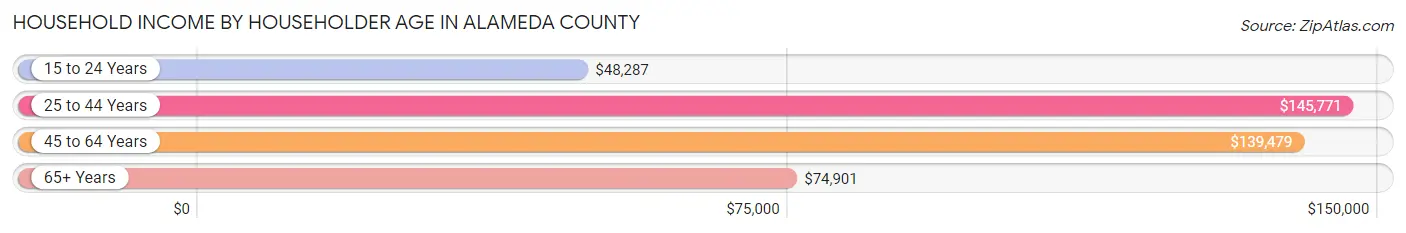
| Income Bracket | # Households | Median Income |
| 15 to 24 Years | 13,285 (2.3%) | $48,287 |
| 25 to 44 Years | 216,482 (36.9%) | $145,771 |
| 45 to 64 Years | 221,851 (37.9%) | $139,479 |
| 65+ Years | 134,200 (22.9%) | $74,901 |
| Total | 585,818 (100.0%) | $122,488 |
Poverty in Alameda County
Income Below Poverty by Sex and Age in Alameda County
With 8.3% poverty level for males and 10.0% for females among the residents of Alameda County, 18 to 24 year old males and 18 to 24 year old females are the most vulnerable to poverty, with 10,780 males (17.3%) and 13,297 females (21.8%) in their respective age groups living below the poverty level.
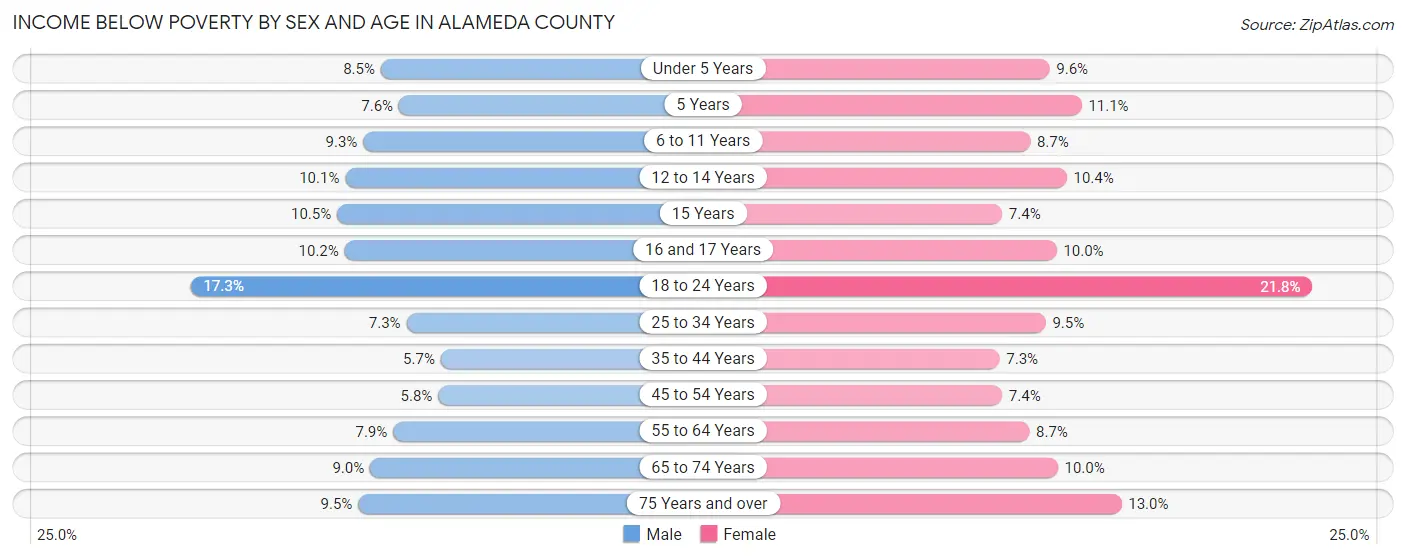
| Age Bracket | Male | Female |
| Under 5 Years | 3,828 (8.5%) | 4,186 (9.6%) |
| 5 Years | 781 (7.6%) | 1,017 (11.1%) |
| 6 to 11 Years | 5,284 (9.3%) | 4,696 (8.7%) |
| 12 to 14 Years | 2,772 (10.1%) | 2,798 (10.4%) |
| 15 Years | 979 (10.5%) | 627 (7.4%) |
| 16 and 17 Years | 1,924 (10.2%) | 1,861 (10.0%) |
| 18 to 24 Years | 10,780 (17.3%) | 13,297 (21.8%) |
| 25 to 34 Years | 9,752 (7.3%) | 12,434 (9.5%) |
| 35 to 44 Years | 7,458 (5.7%) | 9,264 (7.3%) |
| 45 to 54 Years | 6,543 (5.8%) | 8,091 (7.4%) |
| 55 to 64 Years | 7,915 (7.9%) | 8,848 (8.7%) |
| 65 to 74 Years | 5,923 (9.0%) | 7,599 (10.0%) |
| 75 Years and over | 3,758 (9.5%) | 7,428 (13.0%) |
| Total | 67,697 (8.3%) | 82,146 (10.0%) |
Income Above Poverty by Sex and Age in Alameda County
According to the poverty statistics in Alameda County, males aged 35 to 44 years and females aged 35 to 44 years are the age groups that are most secure financially, with 94.3% of males and 92.7% of females in these age groups living above the poverty line.
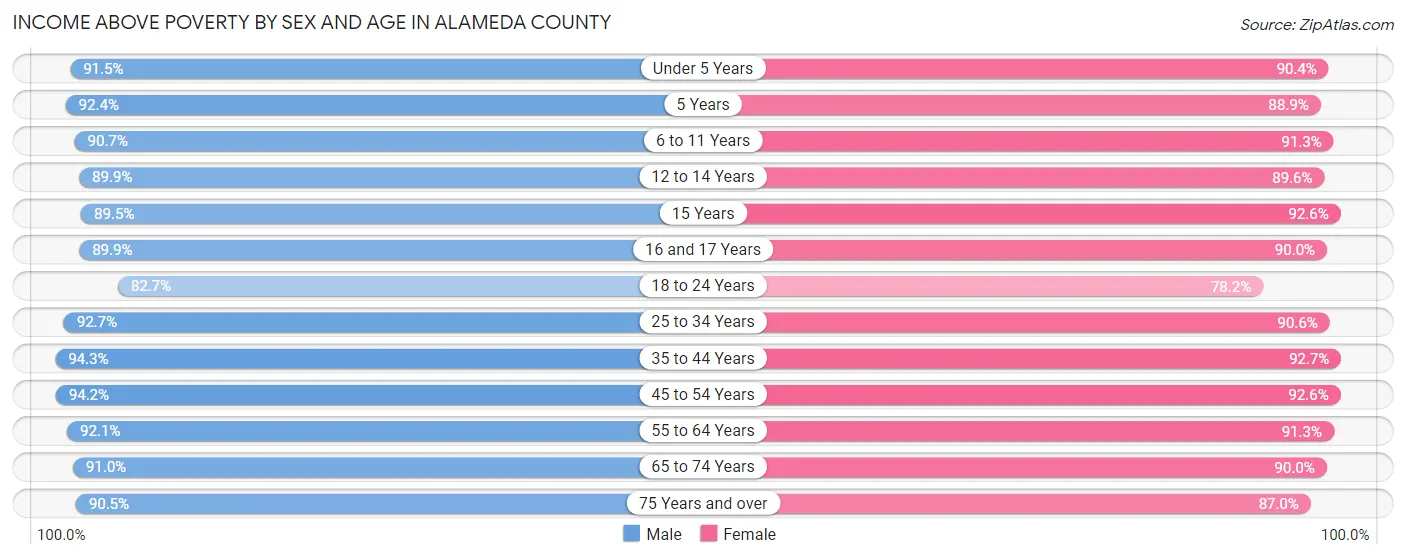
| Age Bracket | Male | Female |
| Under 5 Years | 41,343 (91.5%) | 39,274 (90.4%) |
| 5 Years | 9,458 (92.4%) | 8,128 (88.9%) |
| 6 to 11 Years | 51,591 (90.7%) | 49,123 (91.3%) |
| 12 to 14 Years | 24,629 (89.9%) | 24,019 (89.6%) |
| 15 Years | 8,342 (89.5%) | 7,814 (92.6%) |
| 16 and 17 Years | 17,032 (89.8%) | 16,825 (90.0%) |
| 18 to 24 Years | 51,545 (82.7%) | 47,603 (78.2%) |
| 25 to 34 Years | 124,169 (92.7%) | 119,196 (90.5%) |
| 35 to 44 Years | 123,667 (94.3%) | 117,473 (92.7%) |
| 45 to 54 Years | 106,091 (94.2%) | 100,859 (92.6%) |
| 55 to 64 Years | 92,281 (92.1%) | 92,931 (91.3%) |
| 65 to 74 Years | 60,136 (91.0%) | 68,301 (90.0%) |
| 75 Years and over | 35,698 (90.5%) | 49,844 (87.0%) |
| Total | 745,982 (91.7%) | 741,390 (90.0%) |
Income Below Poverty Among Married-Couple Families in Alameda County
The poverty statistics for married-couple families in Alameda County show that 3.2% or 9,550 of the total 294,689 families live below the poverty line. Families with 5 or more children have the highest poverty rate of 19.5%, comprising of 180 families. On the other hand, families with no children have the lowest poverty rate of 2.8%, which includes 4,335 families.
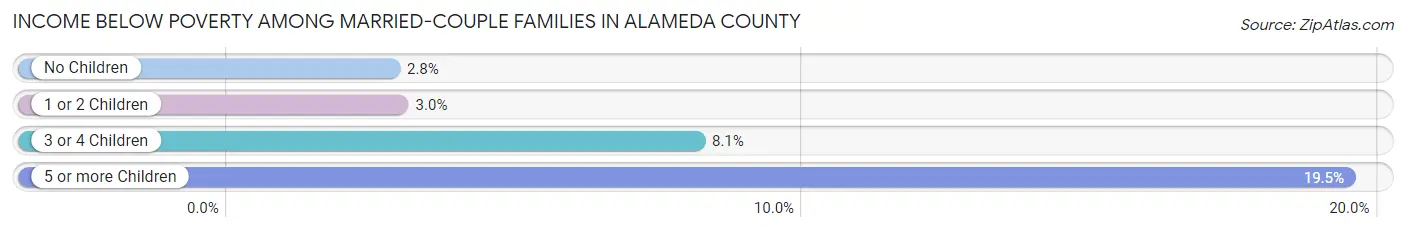
| Children | Above Poverty | Below Poverty |
| No Children | 149,326 (97.2%) | 4,335 (2.8%) |
| 1 or 2 Children | 119,514 (97.0%) | 3,658 (3.0%) |
| 3 or 4 Children | 15,554 (91.9%) | 1,377 (8.1%) |
| 5 or more Children | 745 (80.5%) | 180 (19.5%) |
| Total | 285,139 (96.8%) | 9,550 (3.2%) |
Income Below Poverty Among Single-Parent Households in Alameda County
According to the poverty data in Alameda County, 8.5% or 2,455 single-father households and 14.6% or 9,200 single-mother households are living below the poverty line. Among single-father households, those with 3 or 4 children have the highest poverty rate, with 147 households (12.4%) experiencing poverty. Likewise, among single-mother households, those with 5 or more children have the highest poverty rate, with 219 households (58.7%) falling below the poverty line.
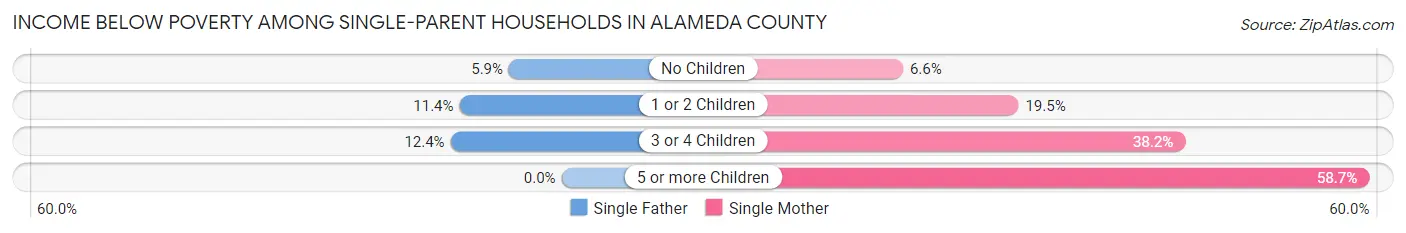
| Children | Single Father | Single Mother |
| No Children | 888 (5.9%) | 2,045 (6.6%) |
| 1 or 2 Children | 1,420 (11.4%) | 5,471 (19.5%) |
| 3 or 4 Children | 147 (12.4%) | 1,465 (38.2%) |
| 5 or more Children | 0 (0.0%) | 219 (58.7%) |
| Total | 2,455 (8.5%) | 9,200 (14.6%) |
Income Below Poverty Among Married-Couple vs Single-Parent Households in Alameda County
The poverty data for Alameda County shows that 9,550 of the married-couple family households (3.2%) and 11,655 of the single-parent households (12.7%) are living below the poverty level. Within the married-couple family households, those with 5 or more children have the highest poverty rate, with 180 households (19.5%) falling below the poverty line. Among the single-parent households, those with 5 or more children have the highest poverty rate, with 219 household (49.5%) living below poverty.
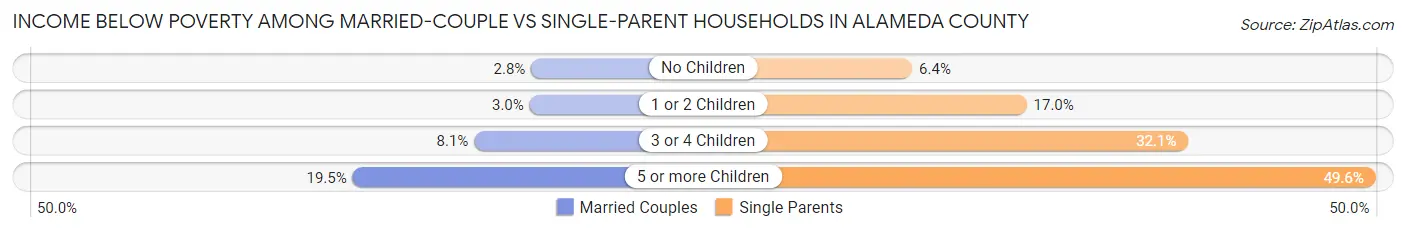
| Children | Married-Couple Families | Single-Parent Households |
| No Children | 4,335 (2.8%) | 2,933 (6.4%) |
| 1 or 2 Children | 3,658 (3.0%) | 6,891 (17.0%) |
| 3 or 4 Children | 1,377 (8.1%) | 1,612 (32.1%) |
| 5 or more Children | 180 (19.5%) | 219 (49.5%) |
| Total | 9,550 (3.2%) | 11,655 (12.7%) |
Race in Alameda County
The most populous races in Alameda County are White / Caucasian (565,911 | 34.0%), Asian (534,659 | 32.1%), and Hispanic or Latino (369,603 | 22.2%).
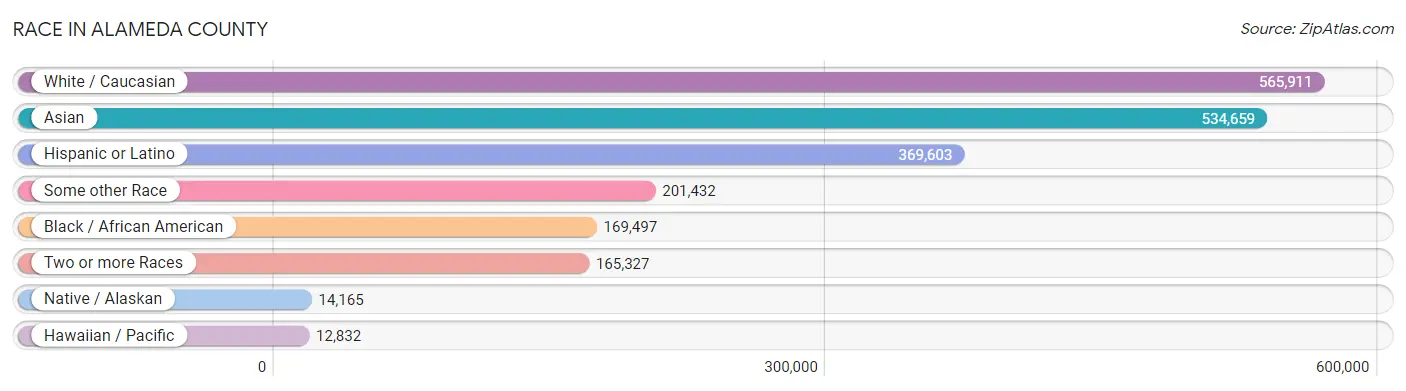
| Race | # Population | % Population |
| Asian | 534,659 | 32.1% |
| Black / African American | 169,497 | 10.2% |
| Hawaiian / Pacific | 12,832 | 0.8% |
| Hispanic or Latino | 369,603 | 22.2% |
| Native / Alaskan | 14,165 | 0.9% |
| White / Caucasian | 565,911 | 34.0% |
| Two or more Races | 165,327 | 9.9% |
| Some other Race | 201,432 | 12.1% |
| Total | 1,663,823 | 100.0% |
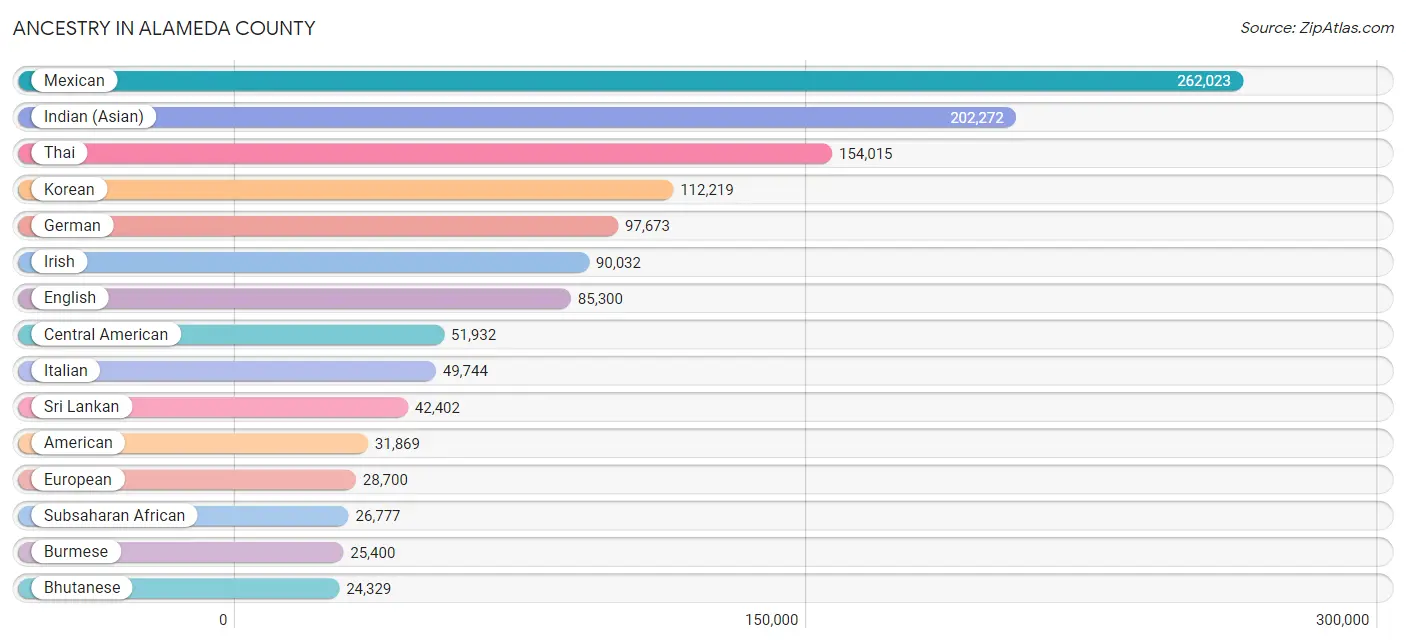
Ancestry in Alameda County
The most populous ancestries reported in Alameda County are Mexican (262,023 | 15.8%), Indian (Asian) (202,272 | 12.2%), Thai (154,015 | 9.3%), Korean (112,219 | 6.7%), and German (97,673 | 5.9%), together accounting for 49.8% of all Alameda County residents.
| Ancestry | # Population | % Population |
| Afghan | 10,637 | 0.6% |
| African | 8,242 | 0.5% |
| Alaska Native | 34 | 0.0% |
| Alaskan Athabascan | 2 | 0.0% |
| Albanian | 215 | 0.0% |
| Aleut | 66 | 0.0% |
| Alsatian | 55 | 0.0% |
| American | 31,869 | 1.9% |
| Apache | 1,156 | 0.1% |
| Arab | 15,423 | 0.9% |
| Arapaho | 9 | 0.0% |
| Argentinean | 2,323 | 0.1% |
| Armenian | 2,429 | 0.2% |
| Assyrian / Chaldean / Syriac | 396 | 0.0% |
| Australian | 566 | 0.0% |
| Austrian | 2,845 | 0.2% |
| Bahamian | 38 | 0.0% |
| Bangladeshi | 928 | 0.1% |
| Barbadian | 200 | 0.0% |
| Basque | 462 | 0.0% |
| Belgian | 1,190 | 0.1% |
| Belizean | 290 | 0.0% |
| Bermudan | 10 | 0.0% |
| Bhutanese | 24,329 | 1.5% |
| Blackfeet | 804 | 0.1% |
| Bolivian | 453 | 0.0% |
| Brazilian | 2,281 | 0.1% |
| British | 10,703 | 0.6% |
| British West Indian | 133 | 0.0% |
| Bulgarian | 740 | 0.0% |
| Burmese | 25,400 | 1.5% |
| Cajun | 161 | 0.0% |
| Cambodian | 1,245 | 0.1% |
| Canadian | 1,839 | 0.1% |
| Cape Verdean | 402 | 0.0% |
| Carpatho Rusyn | 22 | 0.0% |
| Celtic | 193 | 0.0% |
| Central American | 51,932 | 3.1% |
| Central American Indian | 4,572 | 0.3% |
| Cherokee | 3,999 | 0.2% |
| Cheyenne | 22 | 0.0% |
| Chickasaw | 196 | 0.0% |
| Chilean | 1,946 | 0.1% |
| Chinese | 116 | 0.0% |
| Chippewa | 275 | 0.0% |
| Choctaw | 1,374 | 0.1% |
| Colombian | 4,294 | 0.3% |
| Colville | 1 | 0.0% |
| Comanche | 107 | 0.0% |
| Costa Rican | 701 | 0.0% |
| Cree | 81 | 0.0% |
| Creek | 235 | 0.0% |
| Croatian | 2,558 | 0.2% |
| Crow | 105 | 0.0% |
| Cuban | 3,539 | 0.2% |
| Cypriot | 14 | 0.0% |
| Czech | 2,896 | 0.2% |
| Czechoslovakian | 759 | 0.1% |
| Danish | 5,768 | 0.4% |
| Delaware | 34 | 0.0% |
| Dominican | 938 | 0.1% |
| Dutch | 9,588 | 0.6% |
| Dutch West Indian | 69 | 0.0% |
| Eastern European | 6,578 | 0.4% |
| Ecuadorian | 700 | 0.0% |
| Egyptian | 1,898 | 0.1% |
| English | 85,300 | 5.1% |
| Estonian | 106 | 0.0% |
| Ethiopian | 7,613 | 0.5% |
| European | 28,700 | 1.7% |
| Fijian | 77 | 0.0% |
| Filipino | 10,182 | 0.6% |
| Finnish | 2,691 | 0.2% |
| French | 22,521 | 1.3% |
| French American Indian | 28 | 0.0% |
| French Canadian | 2,867 | 0.2% |
| German | 97,673 | 5.9% |
| German Russian | 25 | 0.0% |
| Ghanaian | 850 | 0.1% |
| Greek | 6,035 | 0.4% |
| Guamanian / Chamorro | 2,783 | 0.2% |
| Guatemalan | 18,312 | 1.1% |
| Guyanese | 104 | 0.0% |
| Haitian | 855 | 0.1% |
| Honduran | 3,773 | 0.2% |
| Hopi | 105 | 0.0% |
| Hungarian | 4,224 | 0.3% |
| Icelander | 212 | 0.0% |
| Indian (Asian) | 202,272 | 12.2% |
| Indonesian | 3,510 | 0.2% |
| Inupiat | 73 | 0.0% |
| Iranian | 7,502 | 0.4% |
| Iraqi | 375 | 0.0% |
| Irish | 90,032 | 5.4% |
| Iroquois | 368 | 0.0% |
| Israeli | 640 | 0.0% |
| Italian | 49,744 | 3.0% |
| Jamaican | 2,262 | 0.1% |
| Japanese | 6,388 | 0.4% |
| Jordanian | 689 | 0.0% |
| Kenyan | 425 | 0.0% |
| Kiowa | 33 | 0.0% |
| Korean | 112,219 | 6.7% |
| Laotian | 3,105 | 0.2% |
| Latvian | 446 | 0.0% |
| Lebanese | 1,817 | 0.1% |
| Liberian | 339 | 0.0% |
| Lithuanian | 2,526 | 0.2% |
| Lumbee | 17 | 0.0% |
| Luxembourger | 68 | 0.0% |
| Macedonian | 136 | 0.0% |
| Malaysian | 3,248 | 0.2% |
| Maltese | 353 | 0.0% |
| Mexican | 262,023 | 15.8% |
| Mexican American Indian | 5,671 | 0.3% |
| Mongolian | 754 | 0.1% |
| Moroccan | 865 | 0.1% |
| Native Hawaiian | 6,329 | 0.4% |
| Navajo | 1,057 | 0.1% |
| Nepalese | 1,108 | 0.1% |
| New Zealander | 453 | 0.0% |
| Nicaraguan | 6,343 | 0.4% |
| Nigerian | 5,117 | 0.3% |
| Northern European | 4,126 | 0.3% |
| Norwegian | 12,901 | 0.8% |
| Okinawan | 343 | 0.0% |
| Osage | 10 | 0.0% |
| Ottawa | 43 | 0.0% |
| Paiute | 132 | 0.0% |
| Pakistani | 3,421 | 0.2% |
| Palestinian | 1,346 | 0.1% |
| Panamanian | 1,048 | 0.1% |
| Paraguayan | 2 | 0.0% |
| Pennsylvania German | 118 | 0.0% |
| Peruvian | 5,153 | 0.3% |
| Pima | 21 | 0.0% |
| Polish | 18,017 | 1.1% |
| Portuguese | 23,502 | 1.4% |
| Potawatomi | 57 | 0.0% |
| Pueblo | 249 | 0.0% |
| Puerto Rican | 12,474 | 0.7% |
| Puget Sound Salish | 9 | 0.0% |
| Romanian | 2,342 | 0.1% |
| Russian | 13,746 | 0.8% |
| Salvadoran | 21,558 | 1.3% |
| Samoan | 3,752 | 0.2% |
| Scandinavian | 2,692 | 0.2% |
| Scotch-Irish | 7,371 | 0.4% |
| Scottish | 19,082 | 1.1% |
| Seminole | 251 | 0.0% |
| Senegalese | 188 | 0.0% |
| Serbian | 829 | 0.1% |
| Shoshone | 188 | 0.0% |
| Sierra Leonean | 237 | 0.0% |
| Sioux | 728 | 0.0% |
| Slavic | 410 | 0.0% |
| Slovak | 750 | 0.1% |
| Slovene | 707 | 0.0% |
| Somali | 14 | 0.0% |
| South African | 626 | 0.0% |
| South American | 16,362 | 1.0% |
| South American Indian | 479 | 0.0% |
| Spaniard | 7,132 | 0.4% |
| Spanish | 6,301 | 0.4% |
| Spanish American | 290 | 0.0% |
| Spanish American Indian | 120 | 0.0% |
| Sri Lankan | 42,402 | 2.5% |
| Subsaharan African | 26,777 | 1.6% |
| Sudanese | 484 | 0.0% |
| Swedish | 13,103 | 0.8% |
| Swiss | 4,174 | 0.3% |
| Syrian | 653 | 0.0% |
| Taiwanese | 13 | 0.0% |
| Thai | 154,015 | 9.3% |
| Tlingit-Haida | 58 | 0.0% |
| Tohono O'Odham | 114 | 0.0% |
| Tongan | 3,371 | 0.2% |
| Trinidadian and Tobagonian | 267 | 0.0% |
| Turkish | 1,772 | 0.1% |
| U.S. Virgin Islander | 18 | 0.0% |
| Ugandan | 71 | 0.0% |
| Ukrainian | 5,313 | 0.3% |
| Uruguayan | 415 | 0.0% |
| Ute | 103 | 0.0% |
| Venezuelan | 851 | 0.1% |
| Vietnamese | 847 | 0.1% |
| Welsh | 5,222 | 0.3% |
| West Indian | 526 | 0.0% |
| Yakama | 16 | 0.0% |
| Yaqui | 428 | 0.0% |
| Yugoslavian | 774 | 0.1% |
| Yuman | 4 | 0.0% |
| Yup'ik | 27 | 0.0% |
| Zimbabwean | 71 | 0.0% | View All 194 Rows |
Immigrants in Alameda County
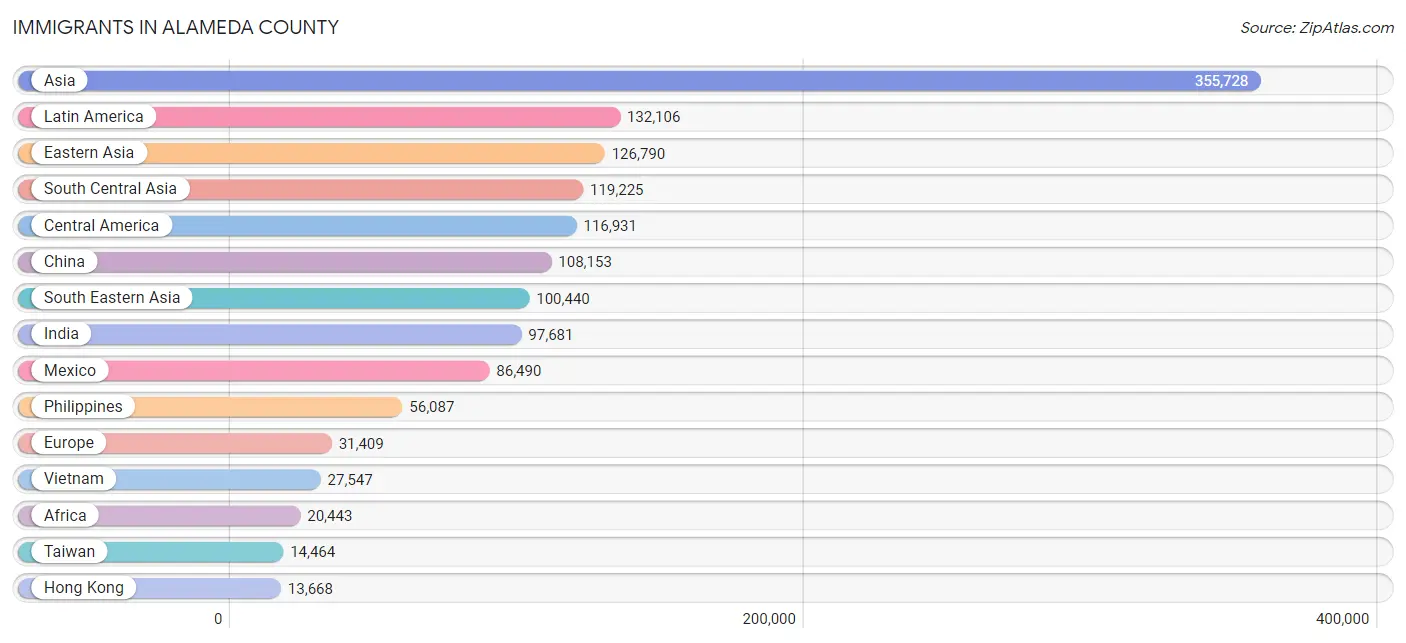
The most numerous immigrant groups reported in Alameda County came from Asia (355,728 | 21.4%), Latin America (132,106 | 7.9%), Eastern Asia (126,790 | 7.6%), South Central Asia (119,225 | 7.2%), and Central America (116,931 | 7.0%), together accounting for 51.1% of all Alameda County residents.
| Immigration Origin | # Population | % Population |
| Afghanistan | 7,836 | 0.5% |
| Africa | 20,443 | 1.2% |
| Albania | 104 | 0.0% |
| Argentina | 1,244 | 0.1% |
| Armenia | 243 | 0.0% |
| Asia | 355,728 | 21.4% |
| Australia | 983 | 0.1% |
| Austria | 254 | 0.0% |
| Azores | 388 | 0.0% |
| Bahamas | 50 | 0.0% |
| Bangladesh | 1,604 | 0.1% |
| Barbados | 87 | 0.0% |
| Belarus | 416 | 0.0% |
| Belgium | 351 | 0.0% |
| Belize | 233 | 0.0% |
| Bolivia | 248 | 0.0% |
| Bosnia and Herzegovina | 270 | 0.0% |
| Brazil | 2,479 | 0.2% |
| Bulgaria | 531 | 0.0% |
| Cabo Verde | 11 | 0.0% |
| Cambodia | 2,817 | 0.2% |
| Cameroon | 208 | 0.0% |
| Canada | 5,876 | 0.4% |
| Caribbean | 3,084 | 0.2% |
| Central America | 116,931 | 7.0% |
| Chile | 824 | 0.1% |
| China | 108,153 | 6.5% |
| Colombia | 2,375 | 0.1% |
| Congo | 112 | 0.0% |
| Costa Rica | 364 | 0.0% |
| Croatia | 511 | 0.0% |
| Cuba | 803 | 0.1% |
| Czechoslovakia | 324 | 0.0% |
| Denmark | 255 | 0.0% |
| Dominica | 35 | 0.0% |
| Dominican Republic | 348 | 0.0% |
| Eastern Africa | 8,352 | 0.5% |
| Eastern Asia | 126,790 | 7.6% |
| Eastern Europe | 10,462 | 0.6% |
| Ecuador | 238 | 0.0% |
| Egypt | 1,515 | 0.1% |
| El Salvador | 12,321 | 0.7% |
| England | 2,432 | 0.2% |
| Eritrea | 2,704 | 0.2% |
| Ethiopia | 3,687 | 0.2% |
| Europe | 31,409 | 1.9% |
| Fiji | 4,501 | 0.3% |
| France | 2,921 | 0.2% |
| Germany | 3,654 | 0.2% |
| Ghana | 664 | 0.0% |
| Greece | 525 | 0.0% |
| Grenada | 32 | 0.0% |
| Guatemala | 11,780 | 0.7% |
| Guyana | 101 | 0.0% |
| Haiti | 142 | 0.0% |
| Honduras | 2,406 | 0.1% |
| Hong Kong | 13,668 | 0.8% |
| Hungary | 187 | 0.0% |
| India | 97,681 | 5.9% |
| Indonesia | 2,837 | 0.2% |
| Iran | 4,878 | 0.3% |
| Iraq | 453 | 0.0% |
| Ireland | 770 | 0.1% |
| Israel | 1,291 | 0.1% |
| Italy | 1,482 | 0.1% |
| Jamaica | 1,158 | 0.1% |
| Japan | 4,884 | 0.3% |
| Jordan | 494 | 0.0% |
| Kazakhstan | 279 | 0.0% |
| Kenya | 785 | 0.1% |
| Korea | 12,990 | 0.8% |
| Kuwait | 372 | 0.0% |
| Laos | 1,702 | 0.1% |
| Latin America | 132,106 | 7.9% |
| Latvia | 71 | 0.0% |
| Lebanon | 707 | 0.0% |
| Liberia | 545 | 0.0% |
| Lithuania | 113 | 0.0% |
| Malaysia | 2,033 | 0.1% |
| Mexico | 86,490 | 5.2% |
| Micronesia | 16 | 0.0% |
| Middle Africa | 501 | 0.0% |
| Moldova | 412 | 0.0% |
| Morocco | 496 | 0.0% |
| Nepal | 1,553 | 0.1% |
| Netherlands | 675 | 0.0% |
| Nicaragua | 3,004 | 0.2% |
| Nigeria | 4,018 | 0.2% |
| North Macedonia | 16 | 0.0% |
| Northern Africa | 3,413 | 0.2% |
| Northern Europe | 7,614 | 0.5% |
| Norway | 206 | 0.0% |
| Oceania | 8,002 | 0.5% |
| Pakistan | 4,516 | 0.3% |
| Panama | 298 | 0.0% |
| Peru | 3,581 | 0.2% |
| Philippines | 56,087 | 3.4% |
| Poland | 1,192 | 0.1% |
| Portugal | 1,895 | 0.1% |
| Romania | 768 | 0.1% |
| Russia | 2,595 | 0.2% |
| Saudi Arabia | 518 | 0.0% |
| Scotland | 213 | 0.0% |
| Senegal | 306 | 0.0% |
| Serbia | 180 | 0.0% |
| Sierra Leone | 304 | 0.0% |
| Singapore | 1,239 | 0.1% |
| Somalia | 6 | 0.0% |
| South Africa | 894 | 0.1% |
| South America | 12,091 | 0.7% |
| South Central Asia | 119,225 | 7.2% |
| South Eastern Asia | 100,440 | 6.0% |
| Southern Europe | 4,800 | 0.3% |
| Spain | 825 | 0.1% |
| Sri Lanka | 670 | 0.0% |
| St. Vincent and the Grenadines | 11 | 0.0% |
| Sudan | 551 | 0.0% |
| Sweden | 524 | 0.0% |
| Switzerland | 535 | 0.0% |
| Syria | 402 | 0.0% |
| Taiwan | 14,464 | 0.9% |
| Thailand | 2,617 | 0.2% |
| Trinidad and Tobago | 287 | 0.0% |
| Turkey | 1,136 | 0.1% |
| Uganda | 294 | 0.0% |
| Ukraine | 1,826 | 0.1% |
| Uruguay | 220 | 0.0% |
| Uzbekistan | 121 | 0.0% |
| Venezuela | 637 | 0.0% |
| Vietnam | 27,547 | 1.7% |
| Western Africa | 6,551 | 0.4% |
| Western Asia | 8,680 | 0.5% |
| Western Europe | 8,390 | 0.5% |
| Yemen | 2,277 | 0.1% |
| Zaire | 154 | 0.0% |
| Zimbabwe | 348 | 0.0% | View All 136 Rows |
Sex and Age in Alameda County
Sex and Age in Alameda County
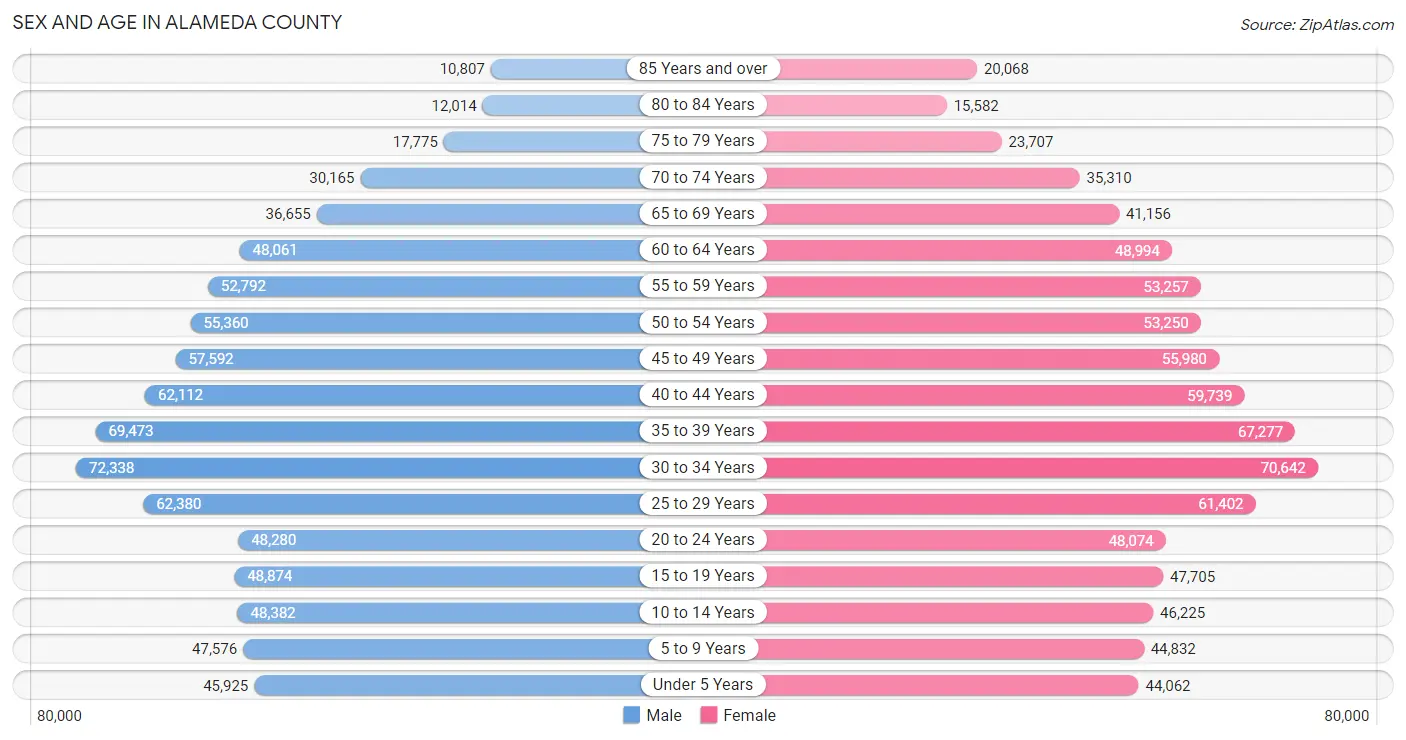
The most populous age groups in Alameda County are 30 to 34 Years (72,338 | 8.7%) for men and 30 to 34 Years (70,642 | 8.4%) for women.
| Age Bracket | Male | Female |
| Under 5 Years | 45,925 (5.6%) | 44,062 (5.3%) |
| 5 to 9 Years | 47,576 (5.8%) | 44,832 (5.3%) |
| 10 to 14 Years | 48,382 (5.9%) | 46,225 (5.5%) |
| 15 to 19 Years | 48,874 (5.9%) | 47,705 (5.7%) |
| 20 to 24 Years | 48,280 (5.8%) | 48,074 (5.7%) |
| 25 to 29 Years | 62,380 (7.5%) | 61,402 (7.3%) |
| 30 to 34 Years | 72,338 (8.7%) | 70,642 (8.4%) |
| 35 to 39 Years | 69,473 (8.4%) | 67,277 (8.0%) |
| 40 to 44 Years | 62,112 (7.5%) | 59,739 (7.1%) |
| 45 to 49 Years | 57,592 (7.0%) | 55,980 (6.7%) |
| 50 to 54 Years | 55,360 (6.7%) | 53,250 (6.4%) |
| 55 to 59 Years | 52,792 (6.4%) | 53,257 (6.4%) |
| 60 to 64 Years | 48,061 (5.8%) | 48,994 (5.9%) |
| 65 to 69 Years | 36,655 (4.4%) | 41,156 (4.9%) |
| 70 to 74 Years | 30,165 (3.6%) | 35,310 (4.2%) |
| 75 to 79 Years | 17,775 (2.1%) | 23,707 (2.8%) |
| 80 to 84 Years | 12,014 (1.5%) | 15,582 (1.9%) |
| 85 Years and over | 10,807 (1.3%) | 20,068 (2.4%) |
| Total | 826,561 (100.0%) | 837,262 (100.0%) |
Families and Households in Alameda County
Median Family Size in Alameda County
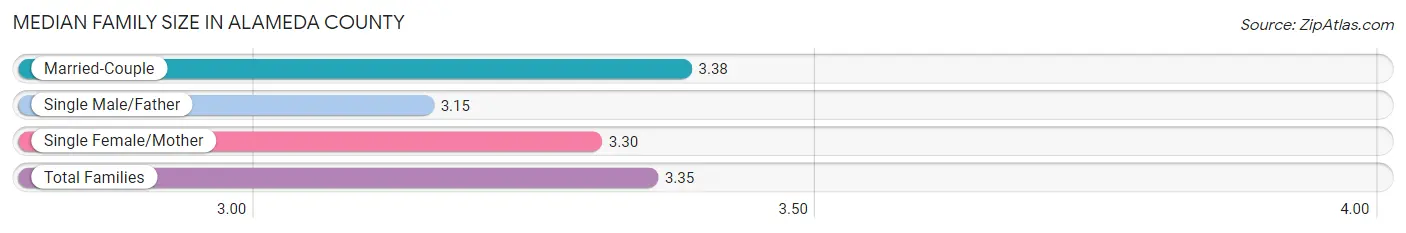
The median family size in Alameda County is 3.35 persons per family, with married-couple families (294,689 | 76.2%) accounting for the largest median family size of 3.38 persons per family. On the other hand, single male/father families (28,797 | 7.4%) represent the smallest median family size with 3.15 persons per family.
| Family Type | # Families | Family Size |
| Married-Couple | 294,689 (76.2%) | 3.38 |
| Single Male/Father | 28,797 (7.4%) | 3.15 |
| Single Female/Mother | 63,069 (16.3%) | 3.30 |
| Total Families | 386,555 (100.0%) | 3.35 |
Median Household Size in Alameda County
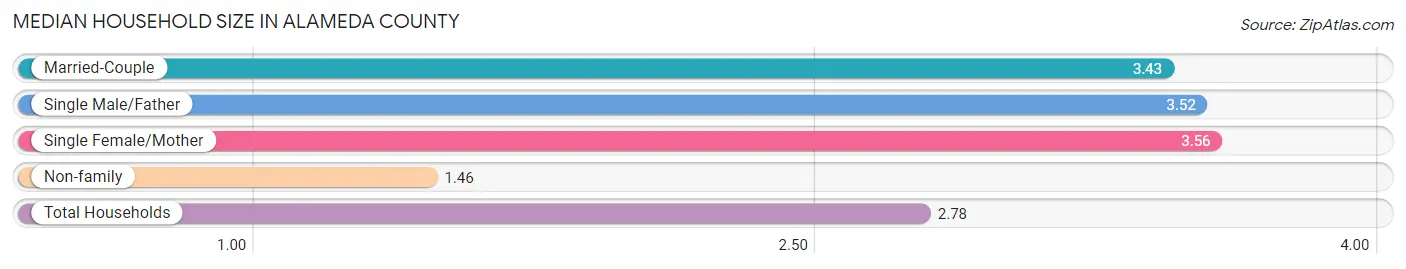
The median household size in Alameda County is 2.78 persons per household, with single female/mother households (63,069 | 10.8%) accounting for the largest median household size of 3.56 persons per household. non-family households (199,263 | 34.0%) represent the smallest median household size with 1.46 persons per household.
| Household Type | # Households | Household Size |
| Married-Couple | 294,689 (50.3%) | 3.43 |
| Single Male/Father | 28,797 (4.9%) | 3.52 |
| Single Female/Mother | 63,069 (10.8%) | 3.56 |
| Non-family | 199,263 (34.0%) | 1.46 |
| Total Households | 585,818 (100.0%) | 2.78 |
Household Size by Marriage Status in Alameda County
Out of a total of 585,818 households in Alameda County, 386,555 (66.0%) are family households, while 199,263 (34.0%) are nonfamily households. The most numerous type of family households are 2-person households, comprising 140,775, and the most common type of nonfamily households are 1-person households, comprising 145,759.
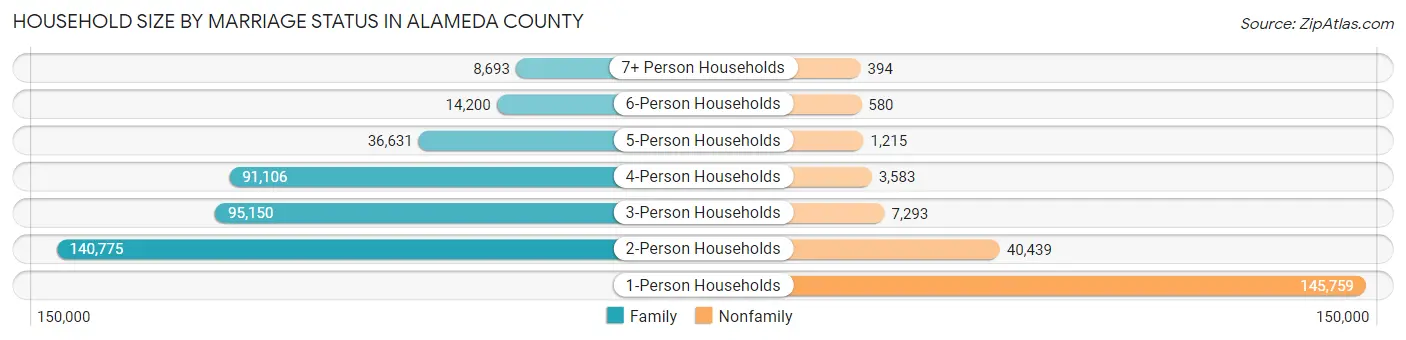
| Household Size | Family Households | Nonfamily Households |
| 1-Person Households | - | 145,759 (24.9%) |
| 2-Person Households | 140,775 (24.0%) | 40,439 (6.9%) |
| 3-Person Households | 95,150 (16.2%) | 7,293 (1.2%) |
| 4-Person Households | 91,106 (15.5%) | 3,583 (0.6%) |
| 5-Person Households | 36,631 (6.2%) | 1,215 (0.2%) |
| 6-Person Households | 14,200 (2.4%) | 580 (0.1%) |
| 7+ Person Households | 8,693 (1.5%) | 394 (0.1%) |
| Total | 386,555 (66.0%) | 199,263 (34.0%) |
Female Fertility in Alameda County
Fertility by Age in Alameda County
Average fertility rate in Alameda County is 45.0 births per 1,000 women. Women in the age bracket of 20 to 34 years have the highest fertility rate with 60.0 births per 1,000 women. Women in the age bracket of 20 to 34 years acount for 57.0% of all women with births.
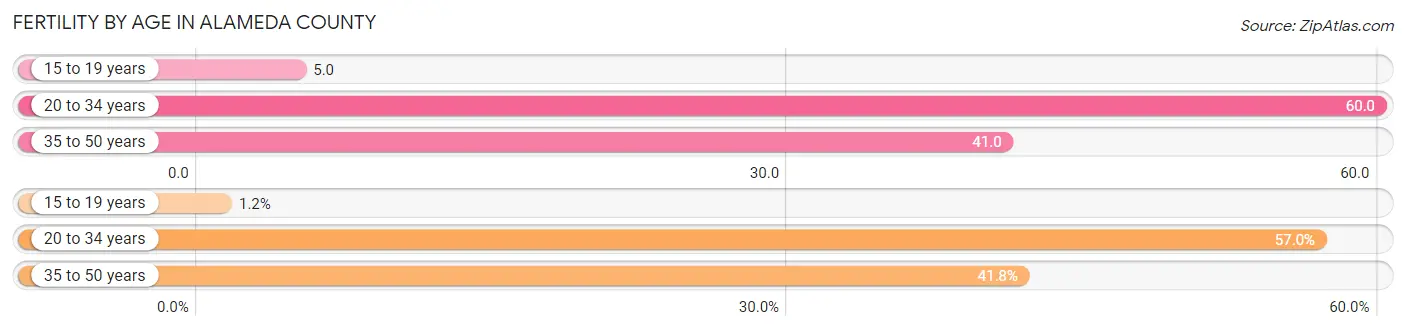
| Age Bracket | Women with Births | Births / 1,000 Women |
| 15 to 19 years | 233 (1.2%) | 5.0 |
| 20 to 34 years | 10,839 (57.0%) | 60.0 |
| 35 to 50 years | 7,961 (41.8%) | 41.0 |
| Total | 19,033 (100.0%) | 45.0 |
Fertility by Age by Marriage Status in Alameda County
77.6% of women with births (19,033) in Alameda County are married. The highest percentage of unmarried women with births falls into 15 to 19 years age bracket with 92.3% of them unmarried at the time of birth, while the lowest percentage of unmarried women with births belong to 35 to 50 years age bracket with 18.1% of them unmarried.
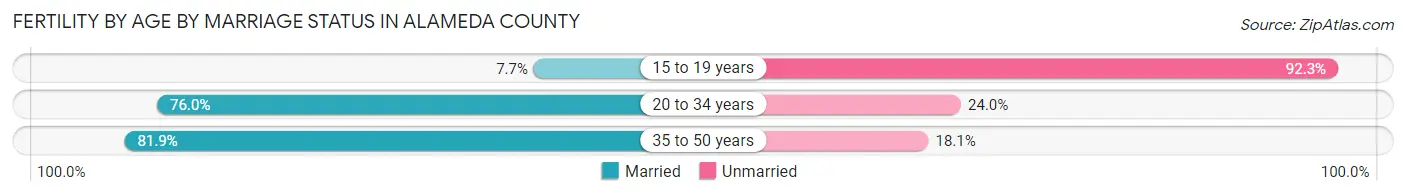
| Age Bracket | Married | Unmarried |
| 15 to 19 years | 18 (7.7%) | 215 (92.3%) |
| 20 to 34 years | 8,238 (76.0%) | 2,601 (24.0%) |
| 35 to 50 years | 6,520 (81.9%) | 1,441 (18.1%) |
| Total | 14,770 (77.6%) | 4,263 (22.4%) |
Fertility by Education in Alameda County
Average fertility rate in Alameda County is 45.0 births per 1,000 women. Women with the education attainment of graduate degree have the highest fertility rate of 69.0 births per 1,000 women, while women with the education attainment of less than high school have the lowest fertility at 26.0 births per 1,000 women. Women with the education attainment of bachelor's degree represent 33.1% of all women with births.
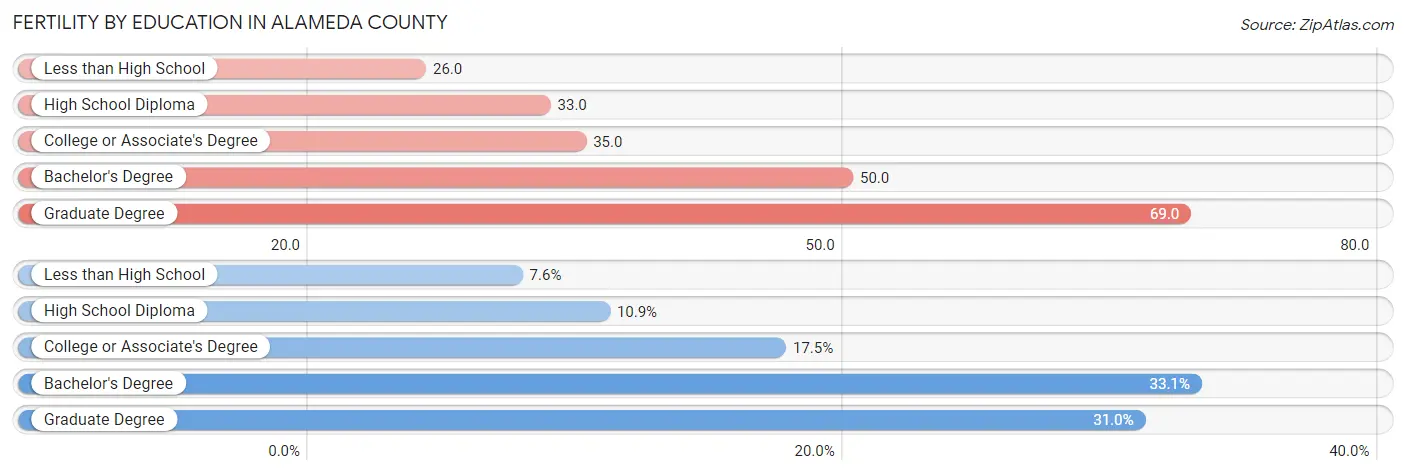
| Educational Attainment | Women with Births | Births / 1,000 Women |
| Less than High School | 1,450 (7.6%) | 26.0 |
| High School Diploma | 2,072 (10.9%) | 33.0 |
| College or Associate's Degree | 3,328 (17.5%) | 35.0 |
| Bachelor's Degree | 6,293 (33.1%) | 50.0 |
| Graduate Degree | 5,890 (30.9%) | 69.0 |
| Total | 19,033 (100.0%) | 45.0 |
Fertility by Education by Marriage Status in Alameda County
22.4% of women with births in Alameda County are unmarried. Women with the educational attainment of graduate degree are most likely to be married with 94.4% of them married at childbirth, while women with the educational attainment of high school diploma are least likely to be married with 51.4% of them unmarried at childbirth.
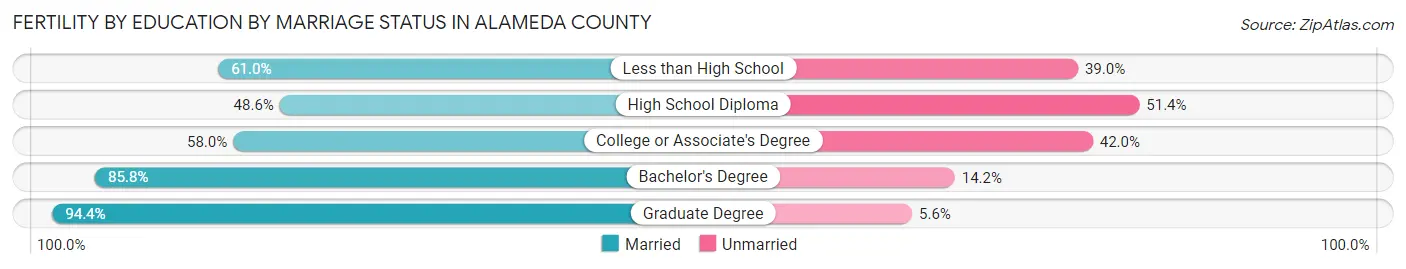
| Educational Attainment | Married | Unmarried |
| Less than High School | 884 (61.0%) | 566 (39.0%) |
| High School Diploma | 1,007 (48.6%) | 1,065 (51.4%) |
| College or Associate's Degree | 1,930 (58.0%) | 1,398 (42.0%) |
| Bachelor's Degree | 5,399 (85.8%) | 894 (14.2%) |
| Graduate Degree | 5,560 (94.4%) | 330 (5.6%) |
| Total | 14,770 (77.6%) | 4,263 (22.4%) |
Employment Characteristics in Alameda County
Employment by Class of Employer in Alameda County
Among the 827,327 employed individuals in Alameda County, private company employees (558,513 | 67.5%), not-for-profit organizations (76,549 | 9.2%), and local government employees (59,701 | 7.2%) make up the most common classes of employment.
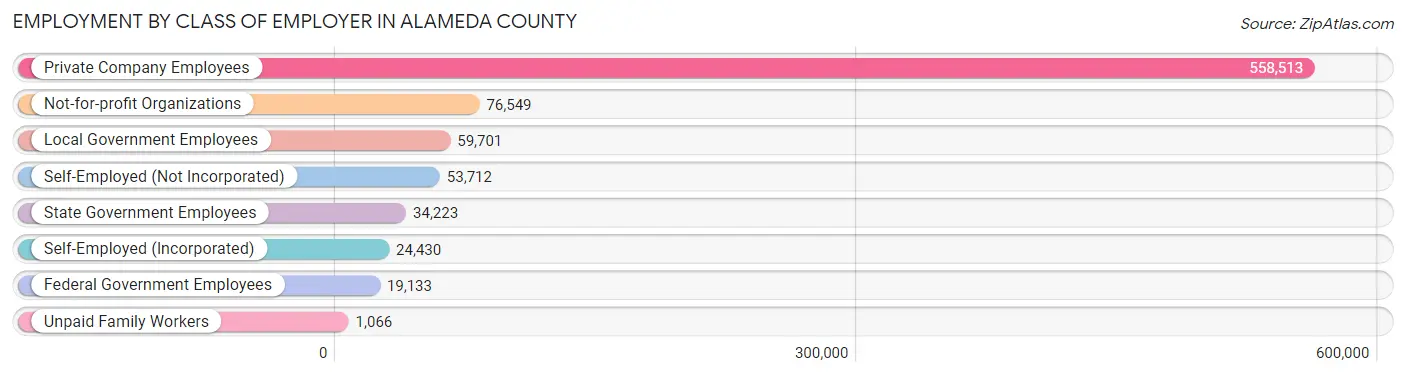
| Employer Class | # Employees | % Employees |
| Private Company Employees | 558,513 | 67.5% |
| Self-Employed (Incorporated) | 24,430 | 2.9% |
| Self-Employed (Not Incorporated) | 53,712 | 6.5% |
| Not-for-profit Organizations | 76,549 | 9.2% |
| Local Government Employees | 59,701 | 7.2% |
| State Government Employees | 34,223 | 4.1% |
| Federal Government Employees | 19,133 | 2.3% |
| Unpaid Family Workers | 1,066 | 0.1% |
| Total | 827,327 | 100.0% |
Employment Status by Age in Alameda County
According to the labor force statistics for Alameda County, out of the total population over 16 years of age (1,369,015), 67.0% or 917,240 individuals are in the labor force, with 4.9% or 44,945 of them unemployed. The age group with the highest labor force participation rate is 30 to 34 years, with 86.2% or 123,249 individuals in the labor force. Within the labor force, the 16 to 19 years age range has the highest percentage of unemployed individuals, with 14.0% or 3,308 of them being unemployed.
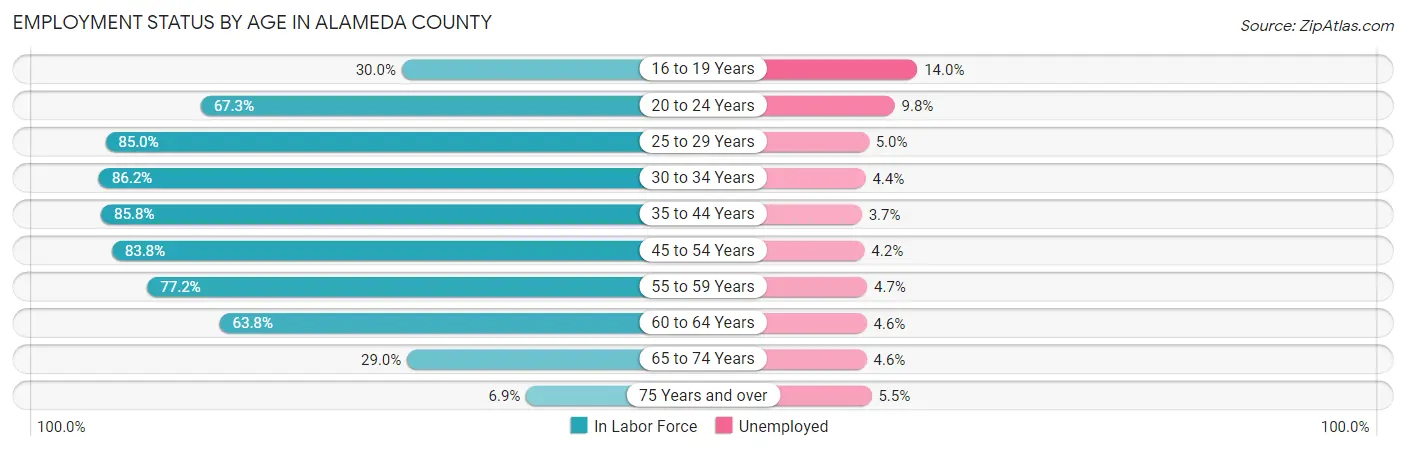
| Age Bracket | In Labor Force | Unemployed |
| 16 to 19 Years | 23,632 (30.0%) | 3,308 (14.0%) |
| 20 to 24 Years | 64,846 (67.3%) | 6,355 (9.8%) |
| 25 to 29 Years | 105,215 (85.0%) | 5,261 (5.0%) |
| 30 to 34 Years | 123,249 (86.2%) | 5,423 (4.4%) |
| 35 to 44 Years | 221,880 (85.8%) | 8,210 (3.7%) |
| 45 to 54 Years | 186,189 (83.8%) | 7,820 (4.2%) |
| 55 to 59 Years | 81,870 (77.2%) | 3,848 (4.7%) |
| 60 to 64 Years | 61,921 (63.8%) | 2,848 (4.6%) |
| 65 to 74 Years | 41,553 (29.0%) | 1,911 (4.6%) |
| 75 Years and over | 6,897 (6.9%) | 379 (5.5%) |
| Total | 917,240 (67.0%) | 44,945 (4.9%) |
Employment Status by Educational Attainment in Alameda County
According to labor force statistics for Alameda County, 82.1% of individuals (780,483) out of the total population between 25 and 64 years of age (950,649) are in the labor force, with 4.3% or 33,561 of them being unemployed. The group with the highest labor force participation rate are those with the educational attainment of bachelor's degree or higher, with 88.2% or 450,037 individuals in the labor force. Within the labor force, individuals with less than high school education have the highest percentage of unemployment, with 6.3% or 3,577 of them being unemployed.
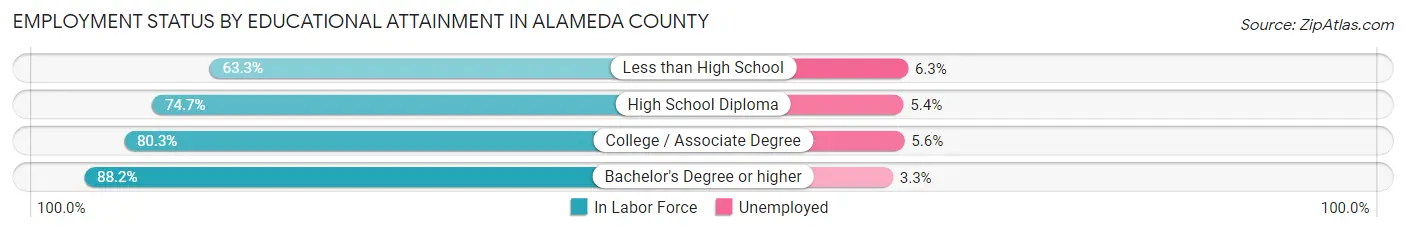
| Educational Attainment | In Labor Force | Unemployed |
| Less than High School | 56,782 (63.3%) | 5,651 (6.3%) |
| High School Diploma | 110,427 (74.7%) | 7,983 (5.4%) |
| College / Associate Degree | 162,907 (80.3%) | 11,361 (5.6%) |
| Bachelor's Degree or higher | 450,037 (88.2%) | 16,838 (3.3%) |
| Total | 780,483 (82.1%) | 40,878 (4.3%) |
Employment Occupations by Sex in Alameda County
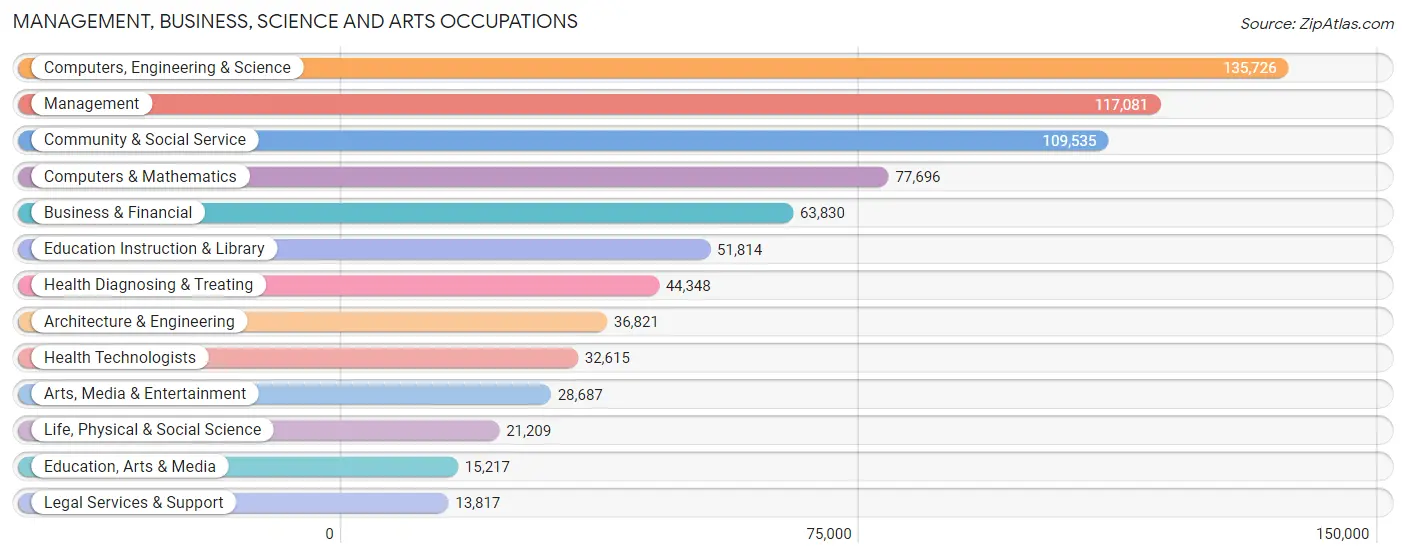
Management, Business, Science and Arts Occupations
The most common Management, Business, Science and Arts occupations in Alameda County are Computers, Engineering & Science (135,726 | 15.6%), Management (117,081 | 13.5%), Community & Social Service (109,535 | 12.6%), Computers & Mathematics (77,696 | 8.9%), and Business & Financial (63,830 | 7.3%).
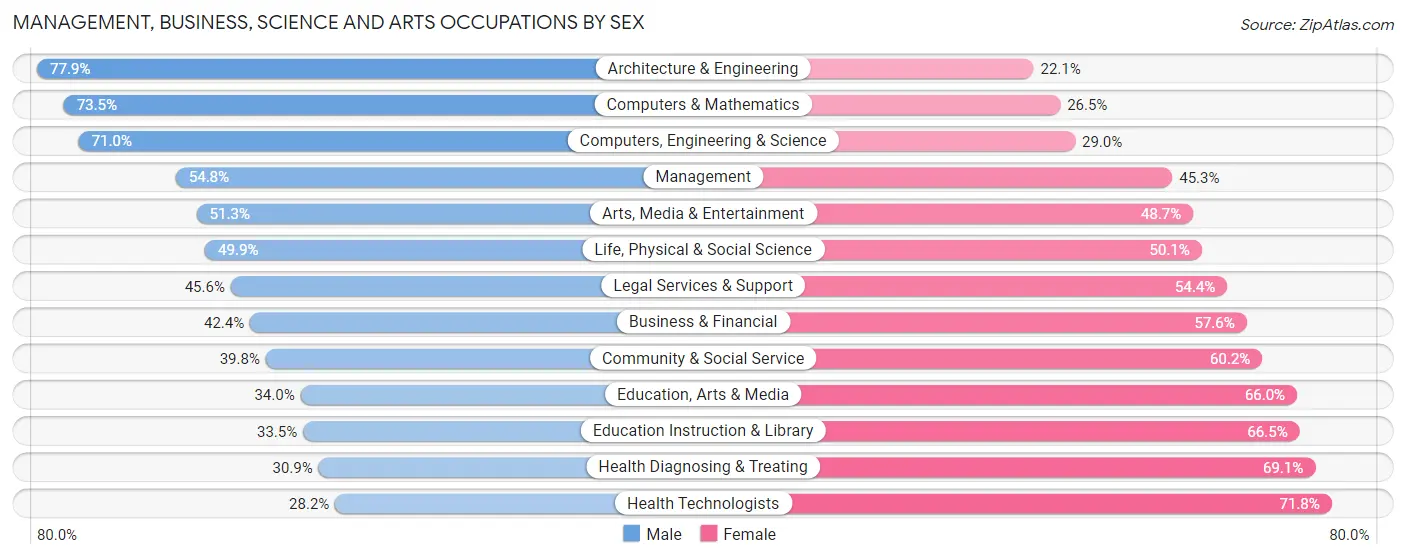
Management, Business, Science and Arts Occupations by Sex
Within the Management, Business, Science and Arts occupations in Alameda County, the most male-oriented occupations are Architecture & Engineering (77.9%), Computers & Mathematics (73.5%), and Computers, Engineering & Science (71.0%), while the most female-oriented occupations are Health Technologists (71.8%), Health Diagnosing & Treating (69.1%), and Education Instruction & Library (66.5%).
| Occupation | Male | Female |
| Management | 64,102 (54.7%) | 52,979 (45.3%) |
| Business & Financial | 27,047 (42.4%) | 36,783 (57.6%) |
| Computers, Engineering & Science | 96,339 (71.0%) | 39,387 (29.0%) |
| Computers & Mathematics | 57,078 (73.5%) | 20,618 (26.5%) |
| Architecture & Engineering | 28,687 (77.9%) | 8,134 (22.1%) |
| Life, Physical & Social Science | 10,574 (49.9%) | 10,635 (50.1%) |
| Community & Social Service | 43,553 (39.8%) | 65,982 (60.2%) |
| Education, Arts & Media | 5,168 (34.0%) | 10,049 (66.0%) |
| Legal Services & Support | 6,300 (45.6%) | 7,517 (54.4%) |
| Education Instruction & Library | 17,372 (33.5%) | 34,442 (66.5%) |
| Arts, Media & Entertainment | 14,713 (51.3%) | 13,974 (48.7%) |
| Health Diagnosing & Treating | 13,720 (30.9%) | 30,628 (69.1%) |
| Health Technologists | 9,188 (28.2%) | 23,427 (71.8%) |
| Total (Category) | 244,761 (52.0%) | 225,759 (48.0%) |
| Total (Overall) | 465,683 (53.5%) | 404,416 (46.5%) |
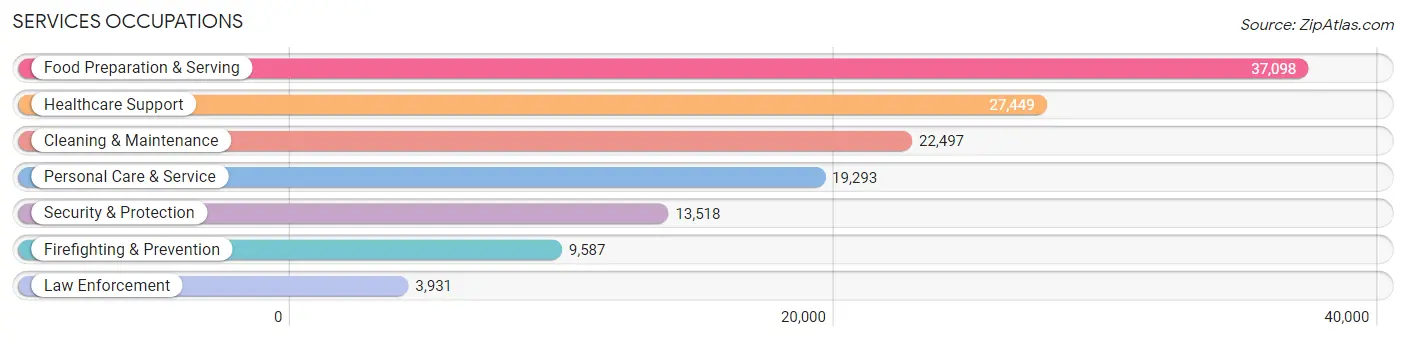
Services Occupations
The most common Services occupations in Alameda County are Food Preparation & Serving (37,098 | 4.3%), Healthcare Support (27,449 | 3.2%), Cleaning & Maintenance (22,497 | 2.6%), Personal Care & Service (19,293 | 2.2%), and Security & Protection (13,518 | 1.5%).
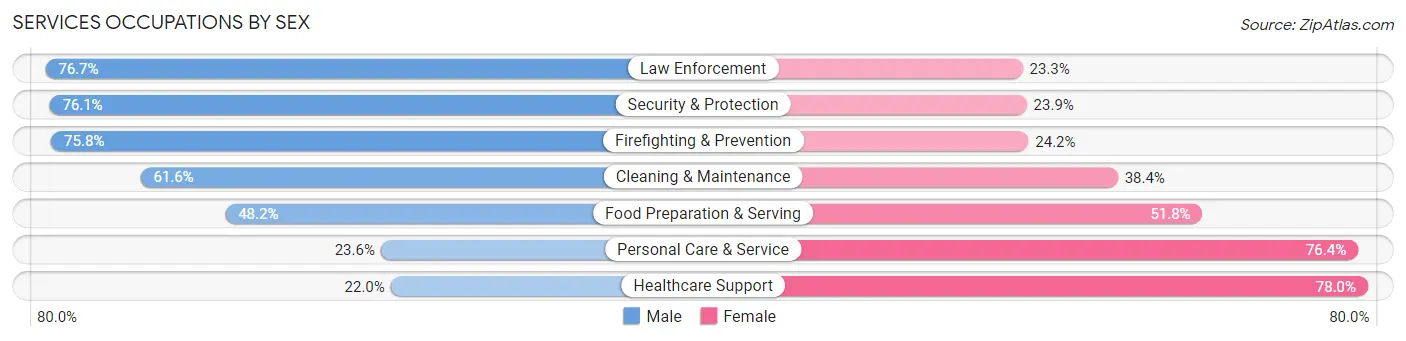
Services Occupations by Sex
Within the Services occupations in Alameda County, the most male-oriented occupations are Law Enforcement (76.7%), Security & Protection (76.1%), and Firefighting & Prevention (75.8%), while the most female-oriented occupations are Healthcare Support (78.0%), Personal Care & Service (76.4%), and Food Preparation & Serving (51.8%).
| Occupation | Male | Female |
| Healthcare Support | 6,044 (22.0%) | 21,405 (78.0%) |
| Security & Protection | 10,282 (76.1%) | 3,236 (23.9%) |
| Firefighting & Prevention | 7,266 (75.8%) | 2,321 (24.2%) |
| Law Enforcement | 3,016 (76.7%) | 915 (23.3%) |
| Food Preparation & Serving | 17,890 (48.2%) | 19,208 (51.8%) |
| Cleaning & Maintenance | 13,867 (61.6%) | 8,630 (38.4%) |
| Personal Care & Service | 4,549 (23.6%) | 14,744 (76.4%) |
| Total (Category) | 52,632 (43.9%) | 67,223 (56.1%) |
| Total (Overall) | 465,683 (53.5%) | 404,416 (46.5%) |
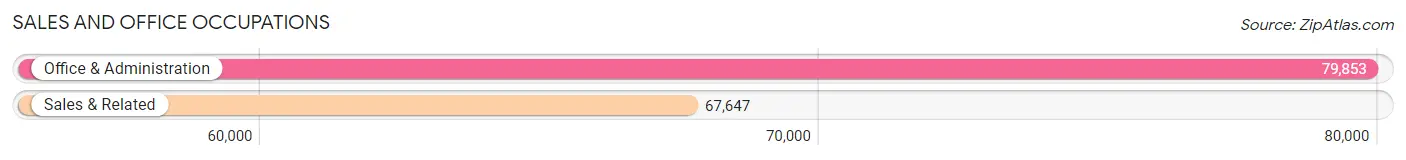
Sales and Office Occupations
The most common Sales and Office occupations in Alameda County are Office & Administration (79,853 | 9.2%), and Sales & Related (67,647 | 7.8%).
Sales and Office Occupations by Sex
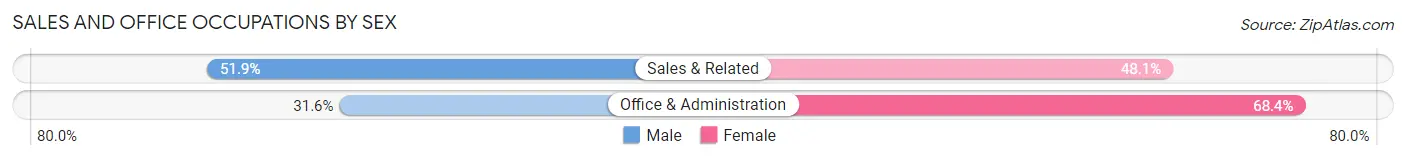
| Occupation | Male | Female |
| Sales & Related | 35,122 (51.9%) | 32,525 (48.1%) |
| Office & Administration | 25,218 (31.6%) | 54,635 (68.4%) |
| Total (Category) | 60,340 (40.9%) | 87,160 (59.1%) |
| Total (Overall) | 465,683 (53.5%) | 404,416 (46.5%) |
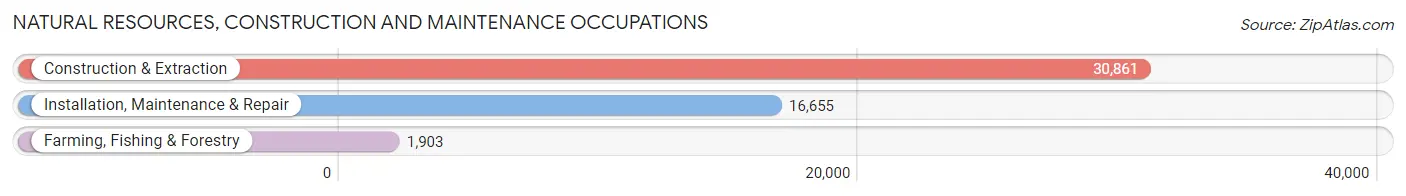
Natural Resources, Construction and Maintenance Occupations
The most common Natural Resources, Construction and Maintenance occupations in Alameda County are Construction & Extraction (30,861 | 3.5%), Installation, Maintenance & Repair (16,655 | 1.9%), and Farming, Fishing & Forestry (1,903 | 0.2%).
Natural Resources, Construction and Maintenance Occupations by Sex
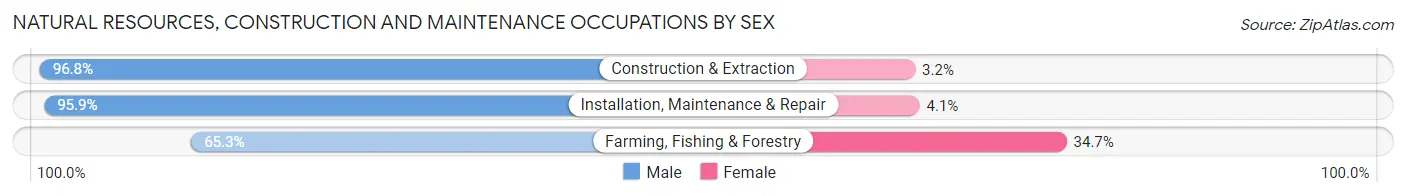
| Occupation | Male | Female |
| Farming, Fishing & Forestry | 1,243 (65.3%) | 660 (34.7%) |
| Construction & Extraction | 29,882 (96.8%) | 979 (3.2%) |
| Installation, Maintenance & Repair | 15,974 (95.9%) | 681 (4.1%) |
| Total (Category) | 47,099 (95.3%) | 2,320 (4.7%) |
| Total (Overall) | 465,683 (53.5%) | 404,416 (46.5%) |
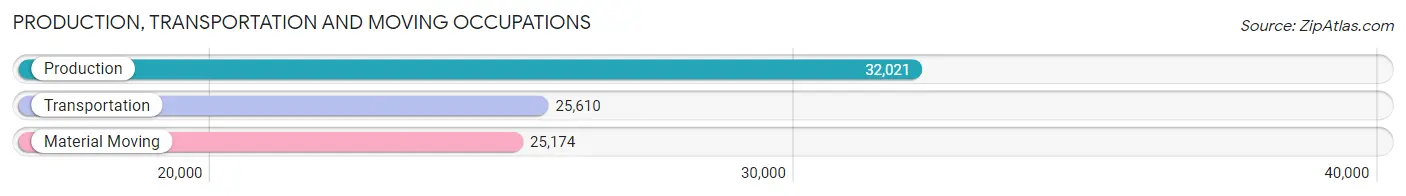
Production, Transportation and Moving Occupations
The most common Production, Transportation and Moving occupations in Alameda County are Production (32,021 | 3.7%), Transportation (25,610 | 2.9%), and Material Moving (25,174 | 2.9%).
Production, Transportation and Moving Occupations by Sex
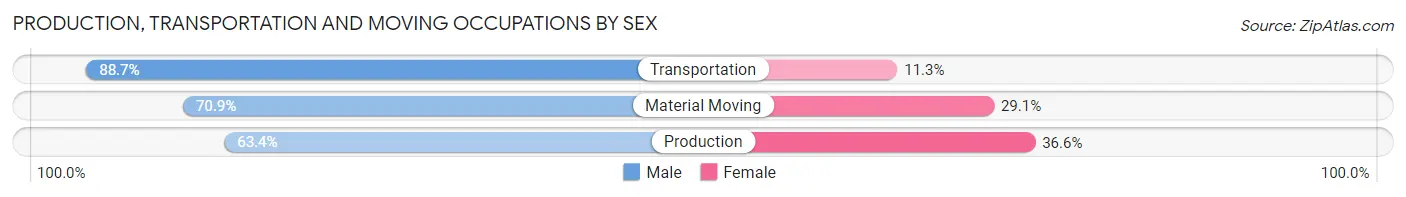
| Occupation | Male | Female |
| Production | 20,287 (63.4%) | 11,734 (36.6%) |
| Transportation | 22,709 (88.7%) | 2,901 (11.3%) |
| Material Moving | 17,855 (70.9%) | 7,319 (29.1%) |
| Total (Category) | 60,851 (73.5%) | 21,954 (26.5%) |
| Total (Overall) | 465,683 (53.5%) | 404,416 (46.5%) |
Employment Industries by Sex in Alameda County
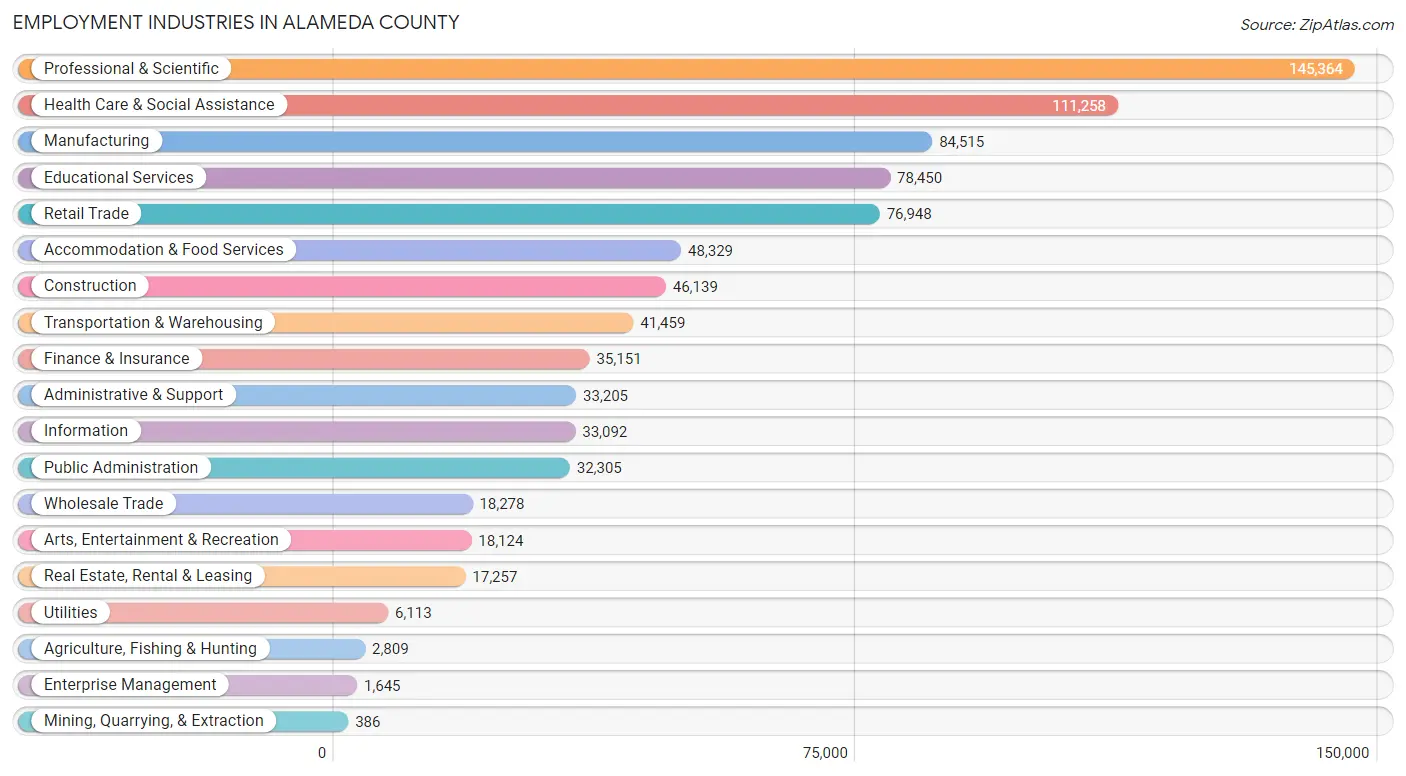
Employment Industries in Alameda County
The major employment industries in Alameda County include Professional & Scientific (145,364 | 16.7%), Health Care & Social Assistance (111,258 | 12.8%), Manufacturing (84,515 | 9.7%), Educational Services (78,450 | 9.0%), and Retail Trade (76,948 | 8.8%).
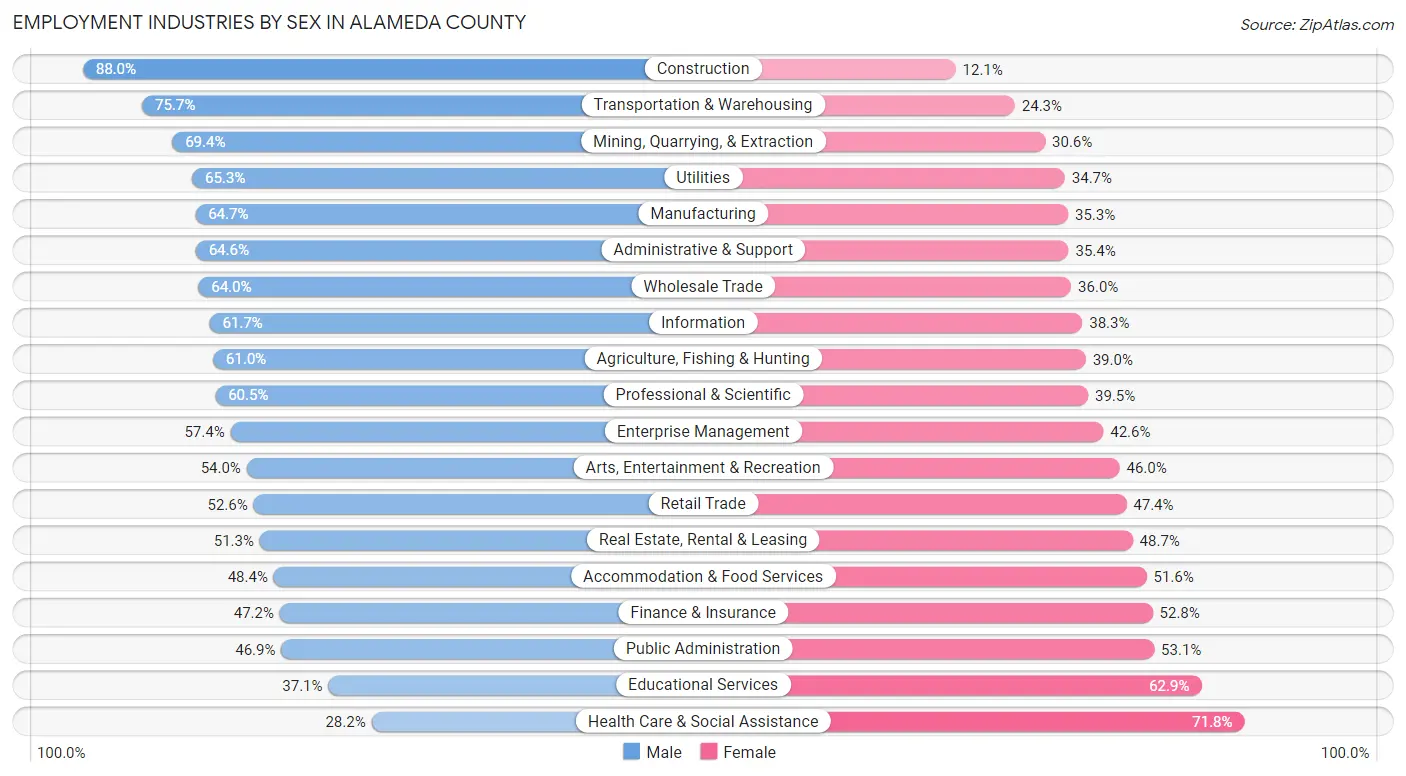
Employment Industries by Sex in Alameda County
The Alameda County industries that see more men than women are Construction (87.9%), Transportation & Warehousing (75.7%), and Mining, Quarrying, & Extraction (69.4%), whereas the industries that tend to have a higher number of women are Health Care & Social Assistance (71.8%), Educational Services (62.9%), and Public Administration (53.1%).
| Industry | Male | Female |
| Agriculture, Fishing & Hunting | 1,714 (61.0%) | 1,095 (39.0%) |
| Mining, Quarrying, & Extraction | 268 (69.4%) | 118 (30.6%) |
| Construction | 40,578 (87.9%) | 5,561 (12.0%) |
| Manufacturing | 54,662 (64.7%) | 29,853 (35.3%) |
| Wholesale Trade | 11,705 (64.0%) | 6,573 (36.0%) |
| Retail Trade | 40,486 (52.6%) | 36,462 (47.4%) |
| Transportation & Warehousing | 31,380 (75.7%) | 10,079 (24.3%) |
| Utilities | 3,994 (65.3%) | 2,119 (34.7%) |
| Information | 20,427 (61.7%) | 12,665 (38.3%) |
| Finance & Insurance | 16,584 (47.2%) | 18,567 (52.8%) |
| Real Estate, Rental & Leasing | 8,854 (51.3%) | 8,403 (48.7%) |
| Professional & Scientific | 88,003 (60.5%) | 57,361 (39.5%) |
| Enterprise Management | 944 (57.4%) | 701 (42.6%) |
| Administrative & Support | 21,442 (64.6%) | 11,763 (35.4%) |
| Educational Services | 29,121 (37.1%) | 49,329 (62.9%) |
| Health Care & Social Assistance | 31,371 (28.2%) | 79,887 (71.8%) |
| Arts, Entertainment & Recreation | 9,793 (54.0%) | 8,331 (46.0%) |
| Accommodation & Food Services | 23,408 (48.4%) | 24,921 (51.6%) |
| Public Administration | 15,137 (46.9%) | 17,168 (53.1%) |
| Total | 465,683 (53.5%) | 404,416 (46.5%) |
Education in Alameda County
School Enrollment in Alameda County
The most common levels of schooling among the 402,474 students in Alameda County are college / undergraduate (102,328 | 25.4%), high school (76,860 | 19.1%), and middle school (71,840 | 17.8%).
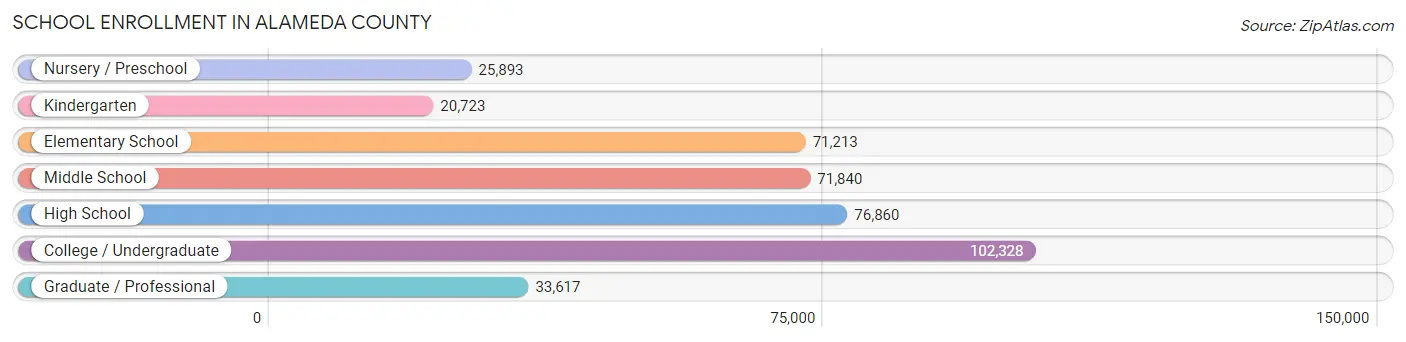
| School Level | # Students | % Students |
| Nursery / Preschool | 25,893 | 6.4% |
| Kindergarten | 20,723 | 5.1% |
| Elementary School | 71,213 | 17.7% |
| Middle School | 71,840 | 17.8% |
| High School | 76,860 | 19.1% |
| College / Undergraduate | 102,328 | 25.4% |
| Graduate / Professional | 33,617 | 8.4% |
| Total | 402,474 | 100.0% |
School Enrollment by Age by Funding Source in Alameda County
Out of a total of 402,474 students who are enrolled in schools in Alameda County, 66,006 (16.4%) attend a private institution, while the remaining 336,468 (83.6%) are enrolled in public schools. The age group of 3 to 4 year olds has the highest likelihood of being enrolled in private schools, with 12,509 (59.5% in the age bracket) enrolled. Conversely, the age group of 18 to 19 year olds has the lowest likelihood of being enrolled in a private school, with 31,232 (92.1% in the age bracket) attending a public institution.
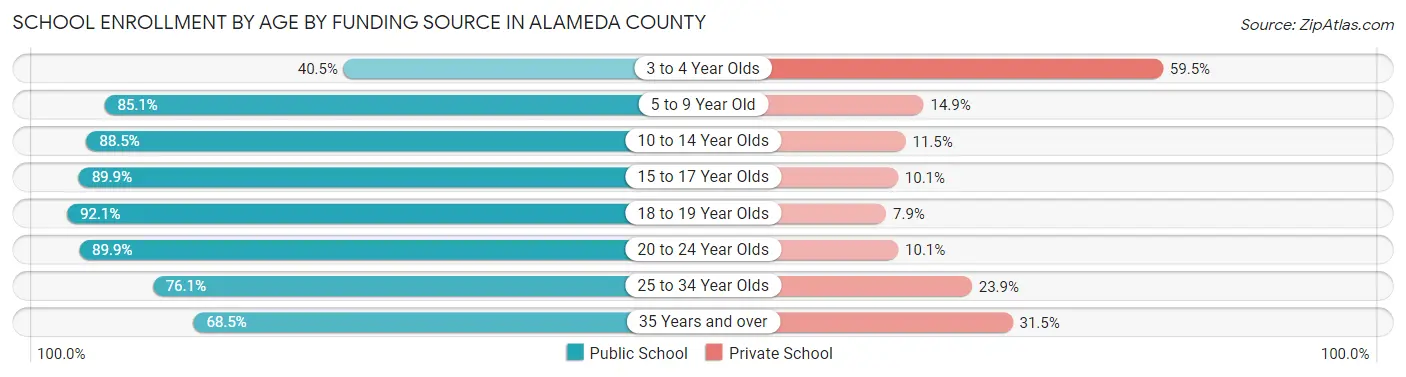
| Age Bracket | Public School | Private School |
| 3 to 4 Year Olds | 8,528 (40.5%) | 12,509 (59.5%) |
| 5 to 9 Year Old | 74,889 (85.1%) | 13,092 (14.9%) |
| 10 to 14 Year Olds | 81,879 (88.5%) | 10,660 (11.5%) |
| 15 to 17 Year Olds | 49,173 (89.9%) | 5,521 (10.1%) |
| 18 to 19 Year Olds | 31,232 (92.1%) | 2,679 (7.9%) |
| 20 to 24 Year Olds | 45,763 (89.9%) | 5,164 (10.1%) |
| 25 to 34 Year Olds | 28,146 (76.1%) | 8,827 (23.9%) |
| 35 Years and over | 16,733 (68.5%) | 7,679 (31.5%) |
| Total | 336,468 (83.6%) | 66,006 (16.4%) |
Educational Attainment by Field of Study in Alameda County
Business (91,658 | 14.0%), engineering (86,906 | 13.2%), social sciences (75,077 | 11.4%), computers & mathematics (62,534 | 9.5%), and science & technology (49,905 | 7.6%) are the most common fields of study among 656,679 individuals in Alameda County who have obtained a bachelor's degree or higher.
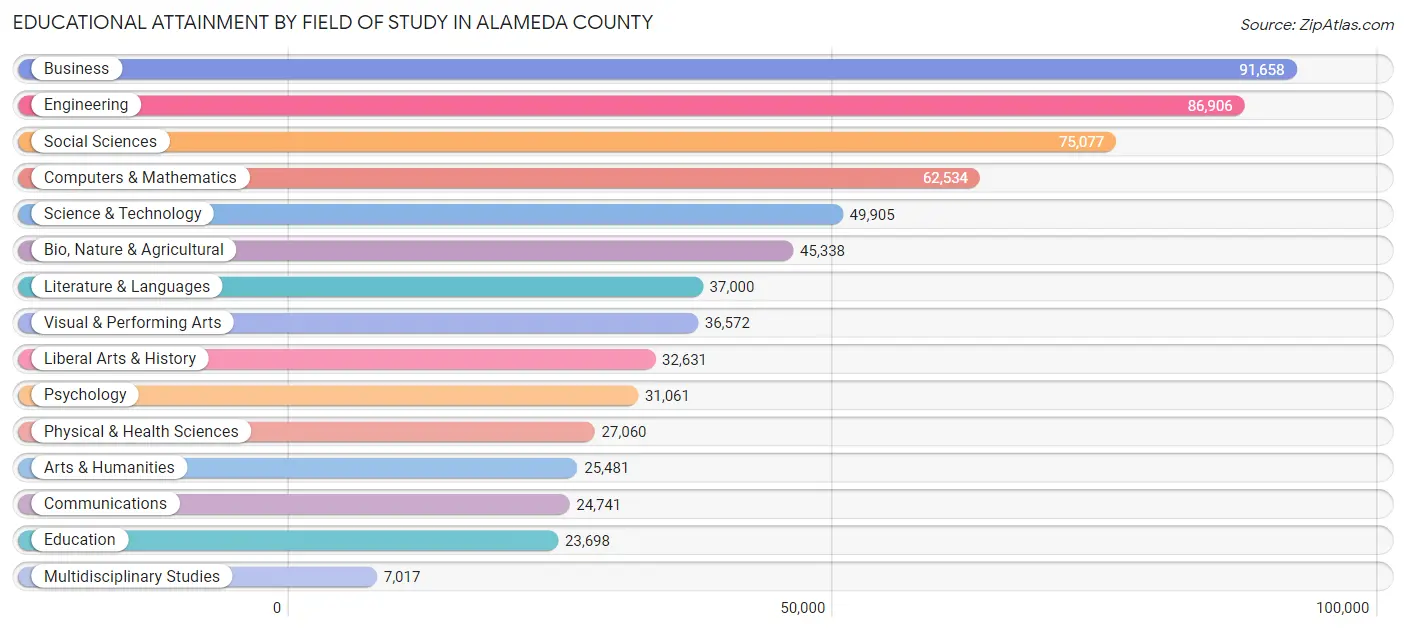
| Field of Study | # Graduates | % Graduates |
| Computers & Mathematics | 62,534 | 9.5% |
| Bio, Nature & Agricultural | 45,338 | 6.9% |
| Physical & Health Sciences | 27,060 | 4.1% |
| Psychology | 31,061 | 4.7% |
| Social Sciences | 75,077 | 11.4% |
| Engineering | 86,906 | 13.2% |
| Multidisciplinary Studies | 7,017 | 1.1% |
| Science & Technology | 49,905 | 7.6% |
| Business | 91,658 | 14.0% |
| Education | 23,698 | 3.6% |
| Literature & Languages | 37,000 | 5.6% |
| Liberal Arts & History | 32,631 | 5.0% |
| Visual & Performing Arts | 36,572 | 5.6% |
| Communications | 24,741 | 3.8% |
| Arts & Humanities | 25,481 | 3.9% |
| Total | 656,679 | 100.0% |
Transportation & Commute in Alameda County
Vehicle Availability by Sex in Alameda County
The most prevalent vehicle ownership categories in Alameda County are males with 2 vehicles (170,980, accounting for 38.8%) and females with 2 vehicles (143,001, making up 45.0%).
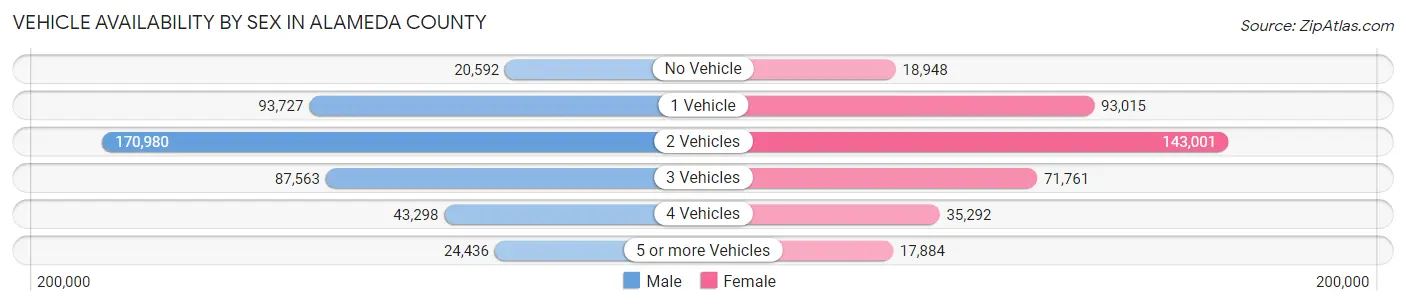
| Vehicles Available | Male | Female |
| No Vehicle | 20,592 (4.7%) | 18,948 (5.0%) |
| 1 Vehicle | 93,727 (21.3%) | 93,015 (24.5%) |
| 2 Vehicles | 170,980 (38.8%) | 143,001 (37.6%) |
| 3 Vehicles | 87,563 (19.9%) | 71,761 (18.9%) |
| 4 Vehicles | 43,298 (9.8%) | 35,292 (9.3%) |
| 5 or more Vehicles | 24,436 (5.6%) | 17,884 (4.7%) |
| Total | 440,596 (100.0%) | 379,901 (100.0%) |
Commute Time in Alameda County
The most frequently occuring commute durations in Alameda County are 30 to 34 minutes (94,553 commuters, 14.4%), 15 to 19 minutes (89,648 commuters, 13.7%), and 45 to 59 minutes (80,175 commuters, 12.2%).
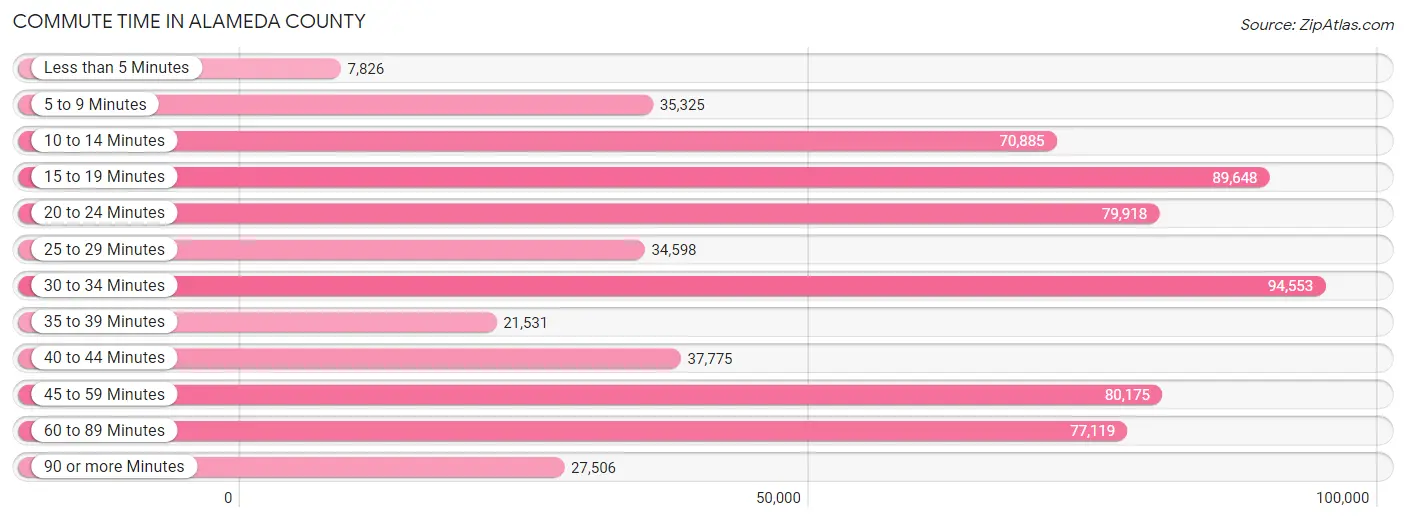
| Commute Time | # Commuters | % Commuters |
| Less than 5 Minutes | 7,826 | 1.2% |
| 5 to 9 Minutes | 35,325 | 5.4% |
| 10 to 14 Minutes | 70,885 | 10.8% |
| 15 to 19 Minutes | 89,648 | 13.7% |
| 20 to 24 Minutes | 79,918 | 12.2% |
| 25 to 29 Minutes | 34,598 | 5.3% |
| 30 to 34 Minutes | 94,553 | 14.4% |
| 35 to 39 Minutes | 21,531 | 3.3% |
| 40 to 44 Minutes | 37,775 | 5.8% |
| 45 to 59 Minutes | 80,175 | 12.2% |
| 60 to 89 Minutes | 77,119 | 11.7% |
| 90 or more Minutes | 27,506 | 4.2% |
Commute Time by Sex in Alameda County
The most common commute times in Alameda County are 30 to 34 minutes (52,810 commuters, 14.8%) for males and 15 to 19 minutes (44,431 commuters, 14.9%) for females.
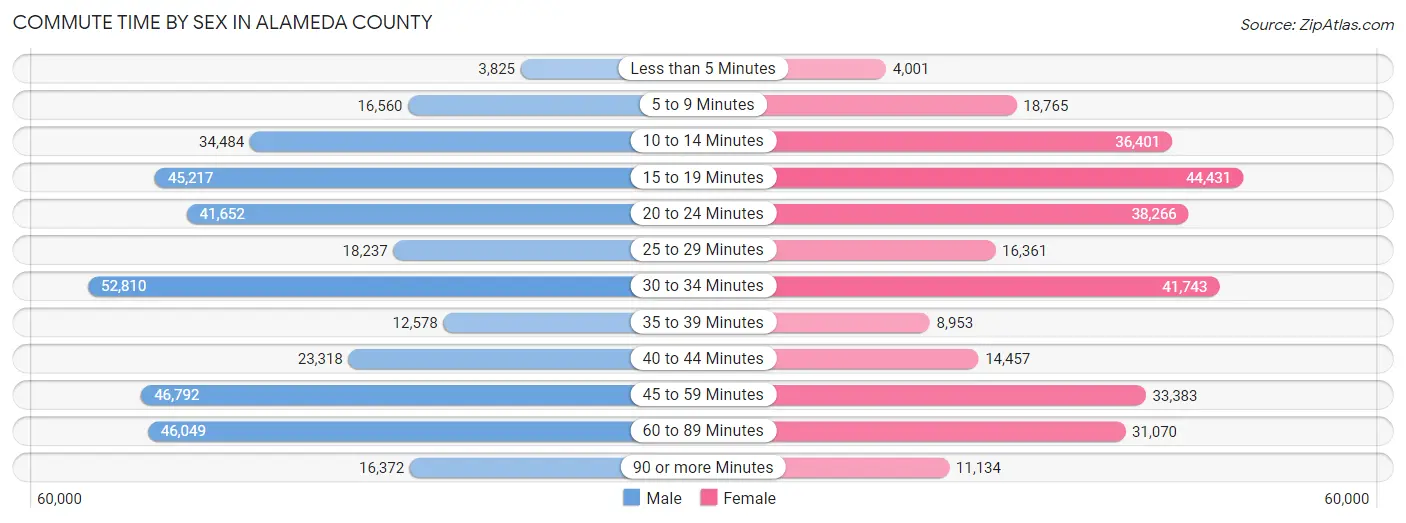
| Commute Time | Male | Female |
| Less than 5 Minutes | 3,825 (1.1%) | 4,001 (1.3%) |
| 5 to 9 Minutes | 16,560 (4.6%) | 18,765 (6.3%) |
| 10 to 14 Minutes | 34,484 (9.6%) | 36,401 (12.2%) |
| 15 to 19 Minutes | 45,217 (12.6%) | 44,431 (14.9%) |
| 20 to 24 Minutes | 41,652 (11.6%) | 38,266 (12.8%) |
| 25 to 29 Minutes | 18,237 (5.1%) | 16,361 (5.5%) |
| 30 to 34 Minutes | 52,810 (14.8%) | 41,743 (14.0%) |
| 35 to 39 Minutes | 12,578 (3.5%) | 8,953 (3.0%) |
| 40 to 44 Minutes | 23,318 (6.5%) | 14,457 (4.8%) |
| 45 to 59 Minutes | 46,792 (13.1%) | 33,383 (11.2%) |
| 60 to 89 Minutes | 46,049 (12.9%) | 31,070 (10.4%) |
| 90 or more Minutes | 16,372 (4.6%) | 11,134 (3.7%) |
Time of Departure to Work by Sex in Alameda County
The most frequent times of departure to work in Alameda County are 8:00 AM to 8:29 AM (51,437, 14.4%) for males and 8:00 AM to 8:29 AM (47,027, 15.7%) for females.
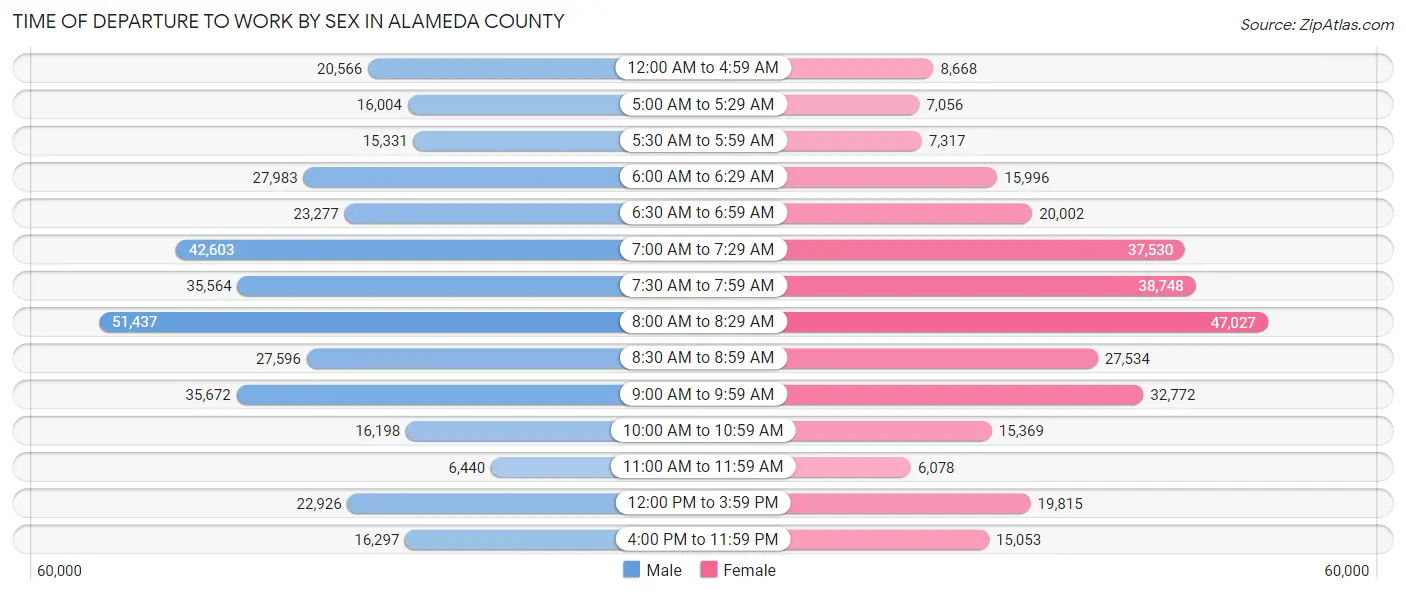
| Time of Departure | Male | Female |
| 12:00 AM to 4:59 AM | 20,566 (5.8%) | 8,668 (2.9%) |
| 5:00 AM to 5:29 AM | 16,004 (4.5%) | 7,056 (2.4%) |
| 5:30 AM to 5:59 AM | 15,331 (4.3%) | 7,317 (2.5%) |
| 6:00 AM to 6:29 AM | 27,983 (7.8%) | 15,996 (5.3%) |
| 6:30 AM to 6:59 AM | 23,277 (6.5%) | 20,002 (6.7%) |
| 7:00 AM to 7:29 AM | 42,603 (11.9%) | 37,530 (12.6%) |
| 7:30 AM to 7:59 AM | 35,564 (9.9%) | 38,748 (13.0%) |
| 8:00 AM to 8:29 AM | 51,437 (14.4%) | 47,027 (15.7%) |
| 8:30 AM to 8:59 AM | 27,596 (7.7%) | 27,534 (9.2%) |
| 9:00 AM to 9:59 AM | 35,672 (10.0%) | 32,772 (11.0%) |
| 10:00 AM to 10:59 AM | 16,198 (4.5%) | 15,369 (5.1%) |
| 11:00 AM to 11:59 AM | 6,440 (1.8%) | 6,078 (2.0%) |
| 12:00 PM to 3:59 PM | 22,926 (6.4%) | 19,815 (6.6%) |
| 4:00 PM to 11:59 PM | 16,297 (4.5%) | 15,053 (5.0%) |
| Total | 357,894 (100.0%) | 298,965 (100.0%) |
Housing Occupancy in Alameda County
Occupancy by Ownership in Alameda County
Of the total 585,818 dwellings in Alameda County, owner-occupied units account for 317,451 (54.2%), while renter-occupied units make up 268,367 (45.8%).
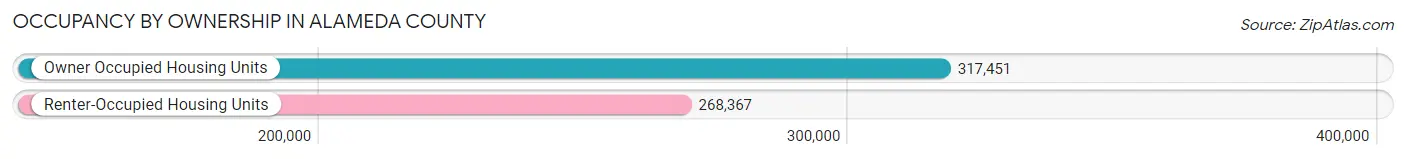
| Occupancy | # Housing Units | % Housing Units |
| Owner Occupied Housing Units | 317,451 | 54.2% |
| Renter-Occupied Housing Units | 268,367 | 45.8% |
| Total Occupied Housing Units | 585,818 | 100.0% |
Occupancy by Household Size in Alameda County
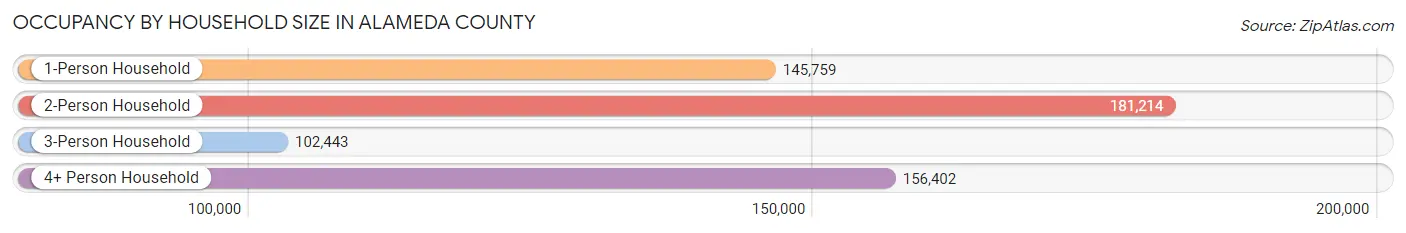
| Household Size | # Housing Units | % Housing Units |
| 1-Person Household | 145,759 | 24.9% |
| 2-Person Household | 181,214 | 30.9% |
| 3-Person Household | 102,443 | 17.5% |
| 4+ Person Household | 156,402 | 26.7% |
| Total Housing Units | 585,818 | 100.0% |
Occupancy by Ownership by Household Size in Alameda County
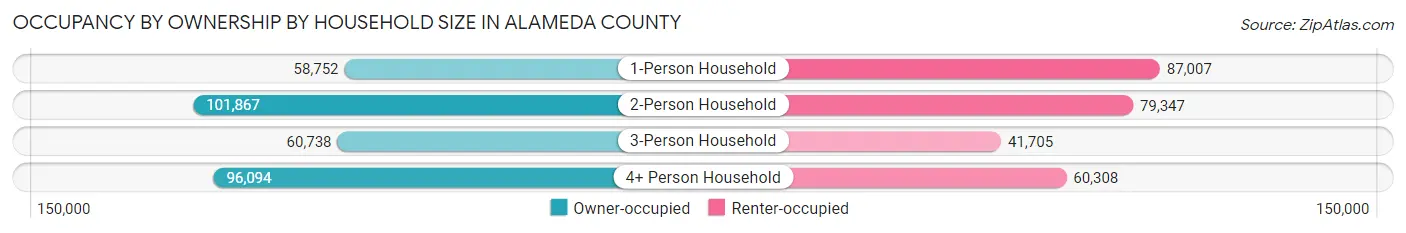
| Household Size | Owner-occupied | Renter-occupied |
| 1-Person Household | 58,752 (40.3%) | 87,007 (59.7%) |
| 2-Person Household | 101,867 (56.2%) | 79,347 (43.8%) |
| 3-Person Household | 60,738 (59.3%) | 41,705 (40.7%) |
| 4+ Person Household | 96,094 (61.4%) | 60,308 (38.6%) |
| Total Housing Units | 317,451 (54.2%) | 268,367 (45.8%) |
Occupancy by Educational Attainment in Alameda County
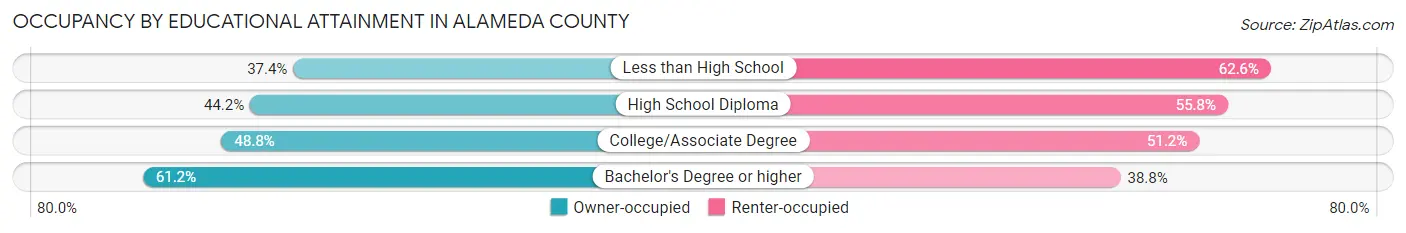
| Household Size | Owner-occupied | Renter-occupied |
| Less than High School | 17,586 (37.4%) | 29,441 (62.6%) |
| High School Diploma | 34,811 (44.2%) | 43,875 (55.8%) |
| College/Associate Degree | 65,453 (48.8%) | 68,722 (51.2%) |
| Bachelor's Degree or higher | 199,601 (61.2%) | 126,329 (38.8%) |
Occupancy by Age of Householder in Alameda County
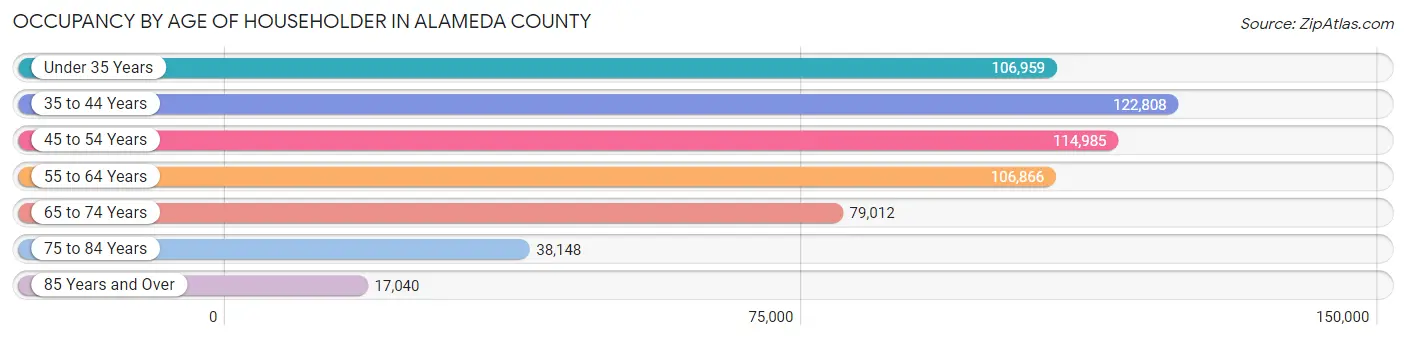
| Age Bracket | # Households | % Households |
| Under 35 Years | 106,959 | 18.3% |
| 35 to 44 Years | 122,808 | 21.0% |
| 45 to 54 Years | 114,985 | 19.6% |
| 55 to 64 Years | 106,866 | 18.2% |
| 65 to 74 Years | 79,012 | 13.5% |
| 75 to 84 Years | 38,148 | 6.5% |
| 85 Years and Over | 17,040 | 2.9% |
| Total | 585,818 | 100.0% |
Housing Finances in Alameda County
Median Income by Occupancy in Alameda County
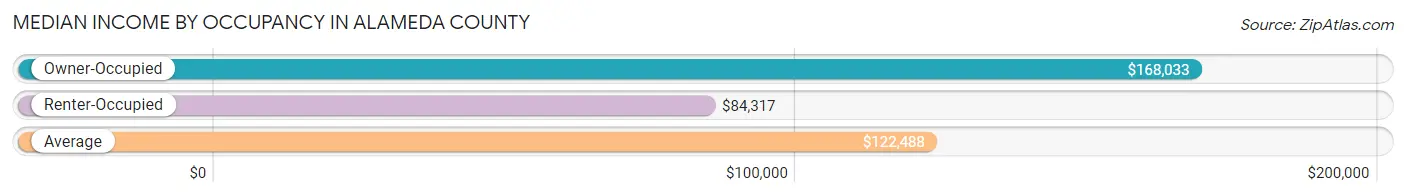
| Occupancy Type | # Households | Median Income |
| Owner-Occupied | 317,451 (54.2%) | $168,033 |
| Renter-Occupied | 268,367 (45.8%) | $84,317 |
| Average | 585,818 (100.0%) | $122,488 |
Occupancy by Householder Income Bracket in Alameda County
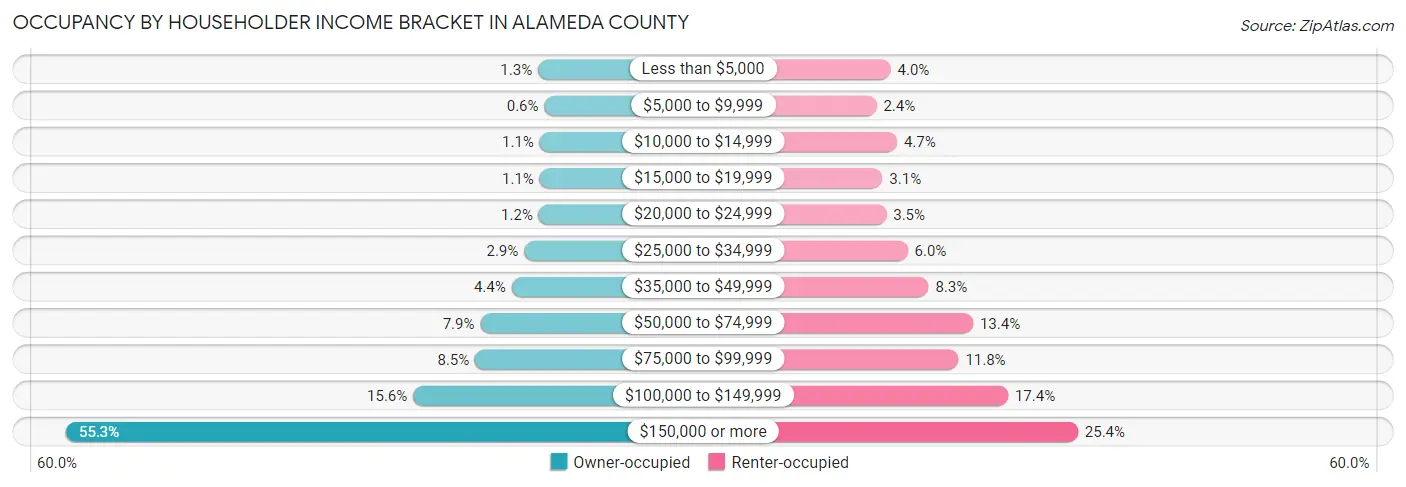
| Income Bracket | Owner-occupied | Renter-occupied |
| Less than $5,000 | 4,231 (1.3%) | 10,768 (4.0%) |
| $5,000 to $9,999 | 1,911 (0.6%) | 6,414 (2.4%) |
| $10,000 to $14,999 | 3,577 (1.1%) | 12,702 (4.7%) |
| $15,000 to $19,999 | 3,587 (1.1%) | 8,228 (3.1%) |
| $20,000 to $24,999 | 3,922 (1.2%) | 9,423 (3.5%) |
| $25,000 to $34,999 | 9,236 (2.9%) | 15,961 (5.9%) |
| $35,000 to $49,999 | 13,818 (4.3%) | 22,382 (8.3%) |
| $50,000 to $74,999 | 25,151 (7.9%) | 36,004 (13.4%) |
| $75,000 to $99,999 | 27,003 (8.5%) | 31,553 (11.8%) |
| $100,000 to $149,999 | 49,531 (15.6%) | 46,750 (17.4%) |
| $150,000 or more | 175,484 (55.3%) | 68,182 (25.4%) |
| Total | 317,451 (100.0%) | 268,367 (100.0%) |
Monthly Housing Cost Tiers in Alameda County
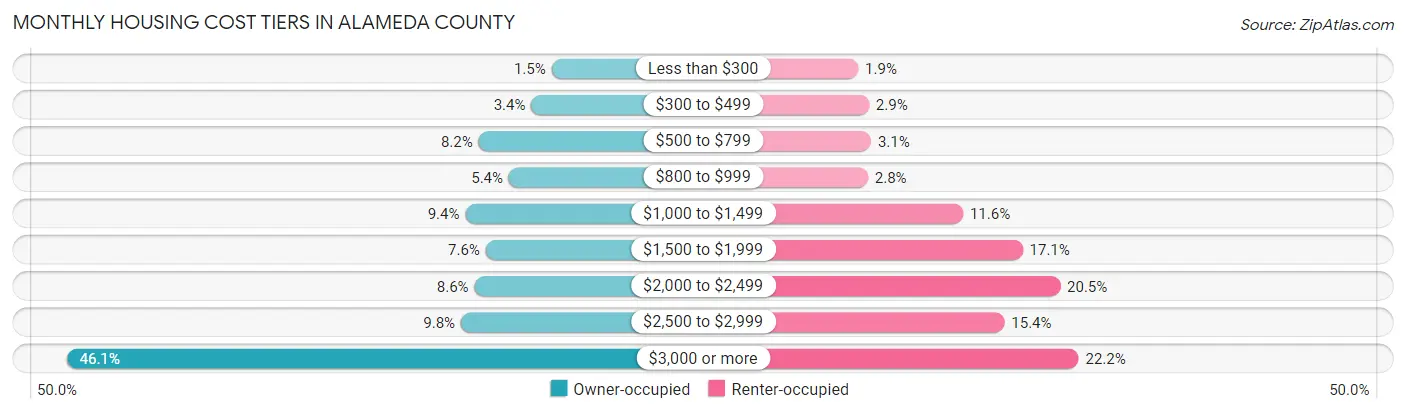
| Monthly Cost | Owner-occupied | Renter-occupied |
| Less than $300 | 4,732 (1.5%) | 5,136 (1.9%) |
| $300 to $499 | 10,649 (3.4%) | 7,780 (2.9%) |
| $500 to $799 | 26,054 (8.2%) | 8,280 (3.1%) |
| $800 to $999 | 17,201 (5.4%) | 7,511 (2.8%) |
| $1,000 to $1,499 | 29,933 (9.4%) | 31,025 (11.6%) |
| $1,500 to $1,999 | 23,969 (7.5%) | 45,744 (17.1%) |
| $2,000 to $2,499 | 27,274 (8.6%) | 55,014 (20.5%) |
| $2,500 to $2,999 | 31,207 (9.8%) | 41,248 (15.4%) |
| $3,000 or more | 146,432 (46.1%) | 59,571 (22.2%) |
| Total | 317,451 (100.0%) | 268,367 (100.0%) |
Physical Housing Characteristics in Alameda County
Housing Structures in Alameda County
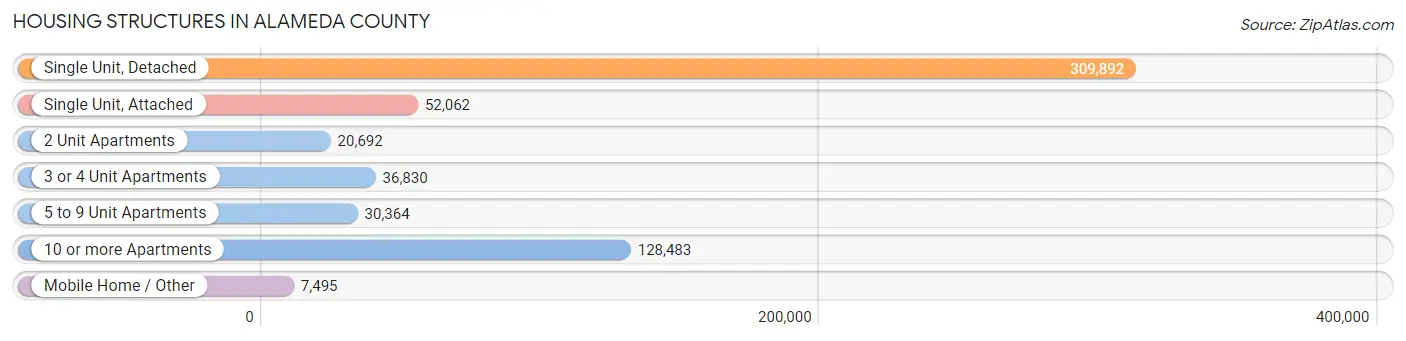
| Structure Type | # Housing Units | % Housing Units |
| Single Unit, Detached | 309,892 | 52.9% |
| Single Unit, Attached | 52,062 | 8.9% |
| 2 Unit Apartments | 20,692 | 3.5% |
| 3 or 4 Unit Apartments | 36,830 | 6.3% |
| 5 to 9 Unit Apartments | 30,364 | 5.2% |
| 10 or more Apartments | 128,483 | 21.9% |
| Mobile Home / Other | 7,495 | 1.3% |
| Total | 585,818 | 100.0% |
Housing Structures by Occupancy in Alameda County
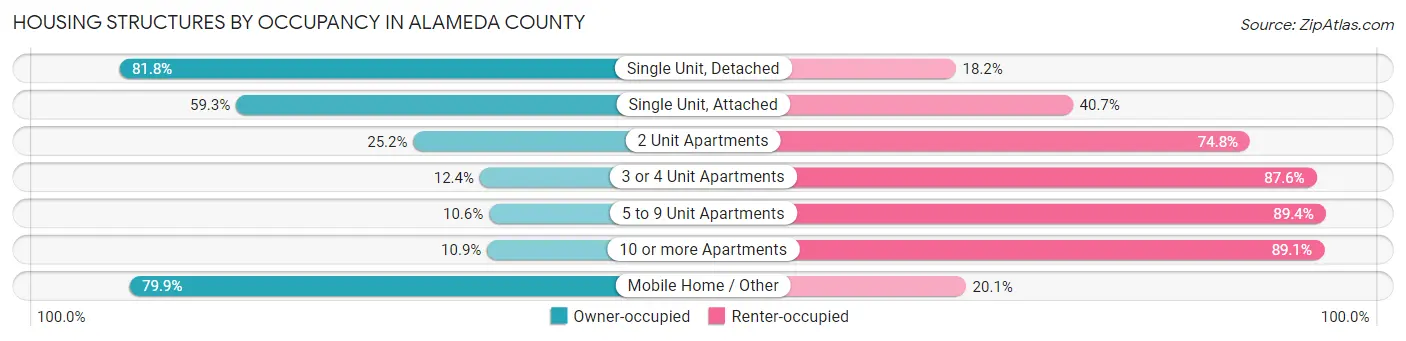
| Structure Type | Owner-occupied | Renter-occupied |
| Single Unit, Detached | 253,575 (81.8%) | 56,317 (18.2%) |
| Single Unit, Attached | 30,867 (59.3%) | 21,195 (40.7%) |
| 2 Unit Apartments | 5,206 (25.2%) | 15,486 (74.8%) |
| 3 or 4 Unit Apartments | 4,552 (12.4%) | 32,278 (87.6%) |
| 5 to 9 Unit Apartments | 3,211 (10.6%) | 27,153 (89.4%) |
| 10 or more Apartments | 14,053 (10.9%) | 114,430 (89.1%) |
| Mobile Home / Other | 5,987 (79.9%) | 1,508 (20.1%) |
| Total | 317,451 (54.2%) | 268,367 (45.8%) |
Housing Structures by Number of Rooms in Alameda County
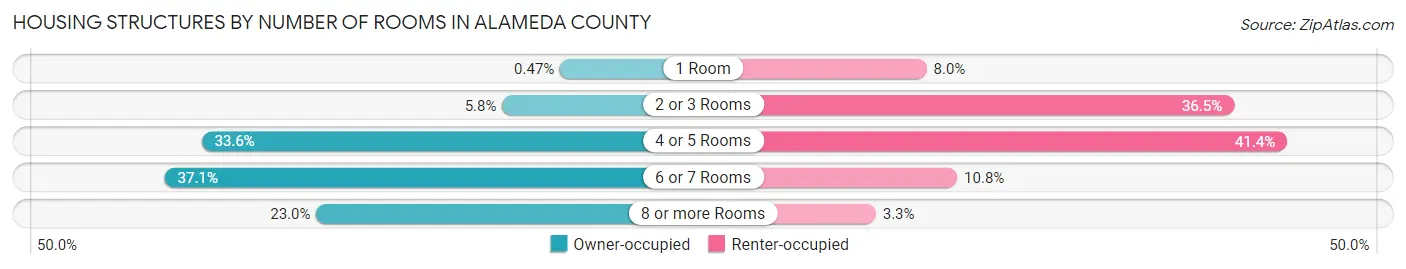
| Number of Rooms | Owner-occupied | Renter-occupied |
| 1 Room | 1,505 (0.5%) | 21,531 (8.0%) |
| 2 or 3 Rooms | 18,478 (5.8%) | 97,822 (36.4%) |
| 4 or 5 Rooms | 106,776 (33.6%) | 111,002 (41.4%) |
| 6 or 7 Rooms | 117,627 (37.0%) | 29,090 (10.8%) |
| 8 or more Rooms | 73,065 (23.0%) | 8,922 (3.3%) |
| Total | 317,451 (100.0%) | 268,367 (100.0%) |
Housing Structure by Heating Type in Alameda County
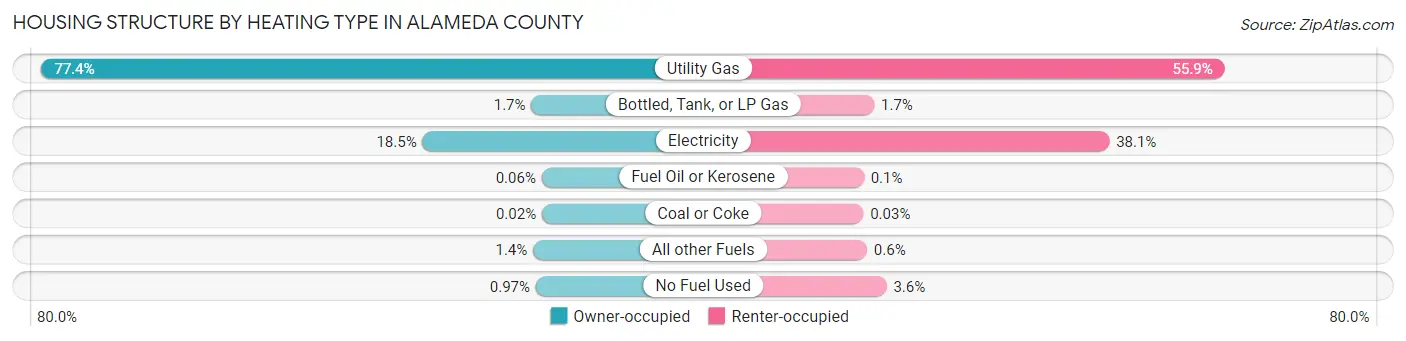
| Heating Type | Owner-occupied | Renter-occupied |
| Utility Gas | 245,730 (77.4%) | 149,978 (55.9%) |
| Bottled, Tank, or LP Gas | 5,277 (1.7%) | 4,601 (1.7%) |
| Electricity | 58,689 (18.5%) | 102,106 (38.1%) |
| Fuel Oil or Kerosene | 184 (0.1%) | 273 (0.1%) |
| Coal or Coke | 57 (0.0%) | 85 (0.0%) |
| All other Fuels | 4,422 (1.4%) | 1,622 (0.6%) |
| No Fuel Used | 3,092 (1.0%) | 9,702 (3.6%) |
| Total | 317,451 (100.0%) | 268,367 (100.0%) |
Household Vehicle Usage in Alameda County
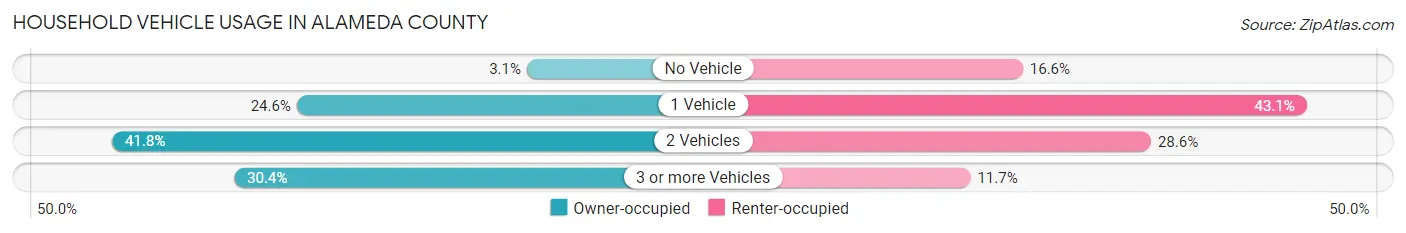
| Vehicles per Household | Owner-occupied | Renter-occupied |
| No Vehicle | 9,912 (3.1%) | 44,564 (16.6%) |
| 1 Vehicle | 78,089 (24.6%) | 115,674 (43.1%) |
| 2 Vehicles | 132,829 (41.8%) | 76,678 (28.6%) |
| 3 or more Vehicles | 96,621 (30.4%) | 31,451 (11.7%) |
| Total | 317,451 (100.0%) | 268,367 (100.0%) |
Real Estate & Mortgages in Alameda County
Real Estate and Mortgage Overview in Alameda County
| Characteristic | Without Mortgage | With Mortgage |
| Housing Units | 91,598 | 225,853 |
| Median Property Value | $935,400 | $1,029,700 |
| Median Household Income | $108,529 | $141,800 |
| Monthly Housing Costs | $888 | $144,269 |
| Real Estate Taxes | $5,359 | $2,805 |
Property Value by Mortgage Status in Alameda County
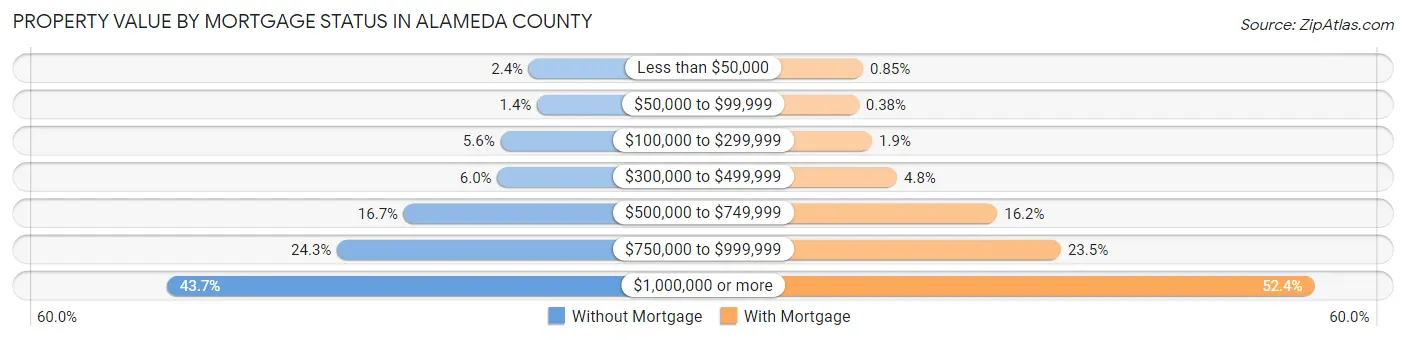
| Property Value | Without Mortgage | With Mortgage |
| Less than $50,000 | 2,158 (2.4%) | 1,919 (0.9%) |
| $50,000 to $99,999 | 1,298 (1.4%) | 854 (0.4%) |
| $100,000 to $299,999 | 5,142 (5.6%) | 4,295 (1.9%) |
| $300,000 to $499,999 | 5,458 (6.0%) | 10,738 (4.8%) |
| $500,000 to $749,999 | 15,248 (16.7%) | 36,578 (16.2%) |
| $750,000 to $999,999 | 22,240 (24.3%) | 53,025 (23.5%) |
| $1,000,000 or more | 40,054 (43.7%) | 118,444 (52.4%) |
| Total | 91,598 (100.0%) | 225,853 (100.0%) |
Household Income by Mortgage Status in Alameda County
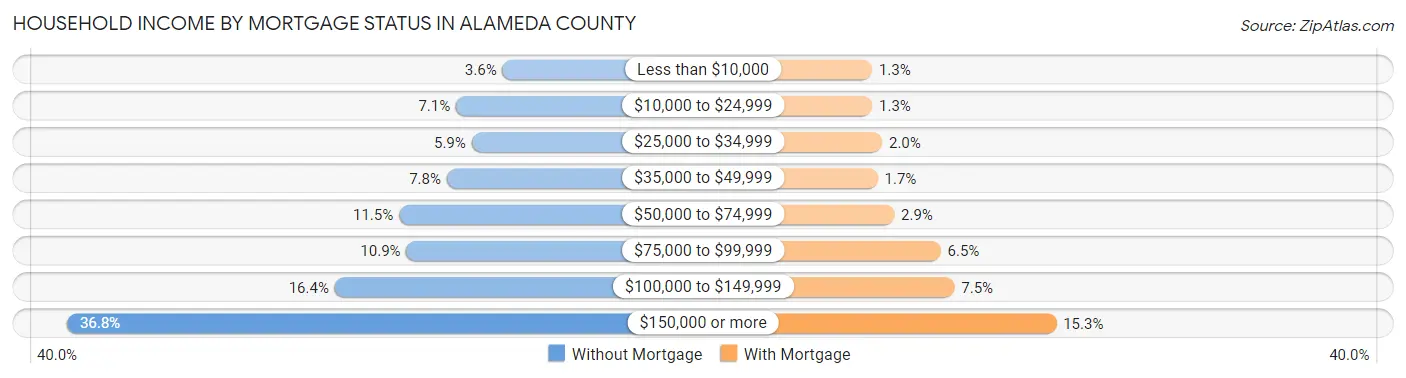
| Household Income | Without Mortgage | With Mortgage |
| Less than $10,000 | 3,286 (3.6%) | 2,812 (1.3%) |
| $10,000 to $24,999 | 6,527 (7.1%) | 2,856 (1.3%) |
| $25,000 to $34,999 | 5,441 (5.9%) | 4,559 (2.0%) |
| $35,000 to $49,999 | 7,168 (7.8%) | 3,795 (1.7%) |
| $50,000 to $74,999 | 10,505 (11.5%) | 6,650 (2.9%) |
| $75,000 to $99,999 | 9,996 (10.9%) | 14,646 (6.5%) |
| $100,000 to $149,999 | 14,991 (16.4%) | 17,007 (7.5%) |
| $150,000 or more | 33,684 (36.8%) | 34,540 (15.3%) |
| Total | 91,598 (100.0%) | 225,853 (100.0%) |
Property Value to Household Income Ratio in Alameda County
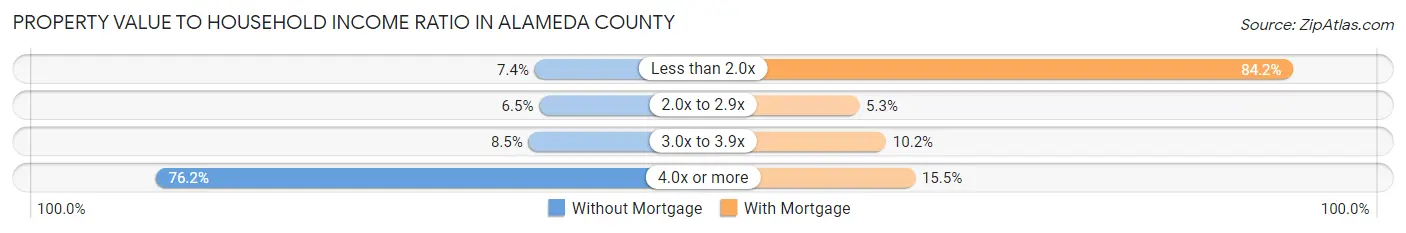
| Value-to-Income Ratio | Without Mortgage | With Mortgage |
| Less than 2.0x | 6,730 (7.3%) | 190,075 (84.2%) |
| 2.0x to 2.9x | 5,993 (6.5%) | 11,993 (5.3%) |
| 3.0x to 3.9x | 7,755 (8.5%) | 22,977 (10.2%) |
| 4.0x or more | 69,818 (76.2%) | 34,904 (15.4%) |
| Total | 91,598 (100.0%) | 225,853 (100.0%) |
Real Estate Taxes by Mortgage Status in Alameda County
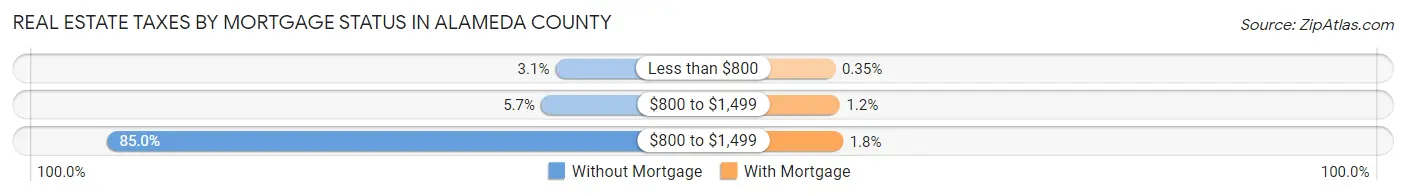
| Property Taxes | Without Mortgage | With Mortgage |
| Less than $800 | 2,819 (3.1%) | 787 (0.4%) |
| $800 to $1,499 | 5,235 (5.7%) | 2,676 (1.2%) |
| $800 to $1,499 | 77,880 (85.0%) | 3,970 (1.8%) |
| Total | 91,598 (100.0%) | 225,853 (100.0%) |
Health & Disability in Alameda County
Health Insurance Coverage by Age in Alameda County
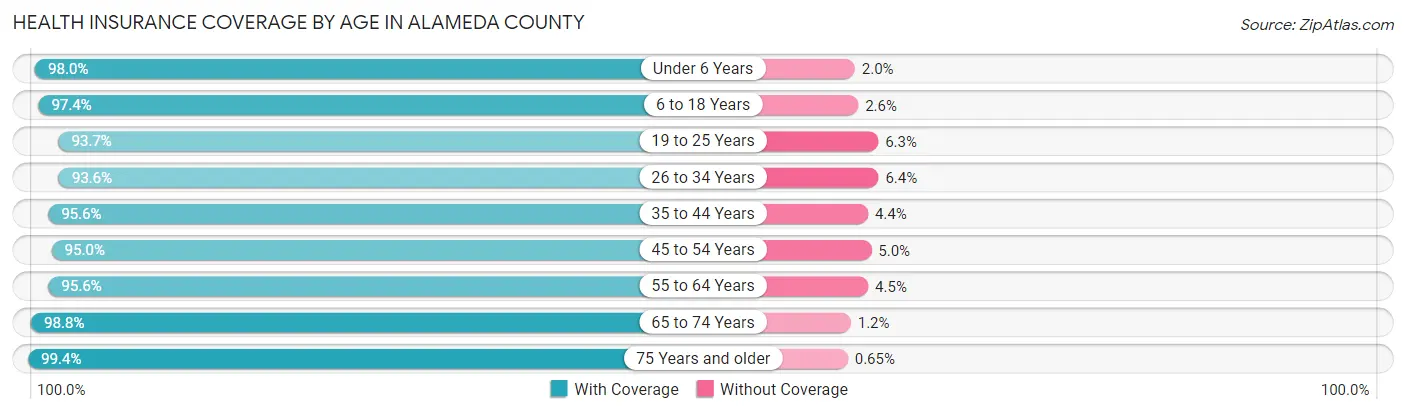
| Age Bracket | With Coverage | Without Coverage |
| Under 6 Years | 107,417 (98.0%) | 2,162 (2.0%) |
| 6 to 18 Years | 239,709 (97.4%) | 6,379 (2.6%) |
| 19 to 25 Years | 129,047 (93.7%) | 8,706 (6.3%) |
| 26 to 34 Years | 225,720 (93.6%) | 15,382 (6.4%) |
| 35 to 44 Years | 246,141 (95.6%) | 11,349 (4.4%) |
| 45 to 54 Years | 210,300 (95.0%) | 11,167 (5.0%) |
| 55 to 64 Years | 192,945 (95.6%) | 8,995 (4.4%) |
| 65 to 74 Years | 140,241 (98.8%) | 1,718 (1.2%) |
| 75 Years and older | 96,101 (99.4%) | 627 (0.6%) |
| Total | 1,587,621 (96.0%) | 66,485 (4.0%) |
Health Insurance Coverage by Citizenship Status in Alameda County
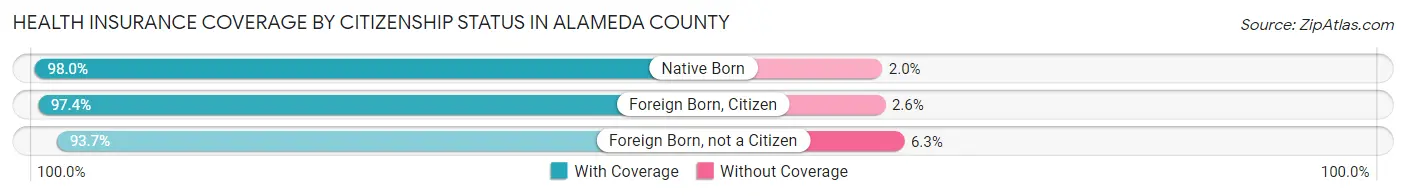
| Citizenship Status | With Coverage | Without Coverage |
| Native Born | 107,417 (98.0%) | 2,162 (2.0%) |
| Foreign Born, Citizen | 239,709 (97.4%) | 6,379 (2.6%) |
| Foreign Born, not a Citizen | 129,047 (93.7%) | 8,706 (6.3%) |
Health Insurance Coverage by Household Income in Alameda County
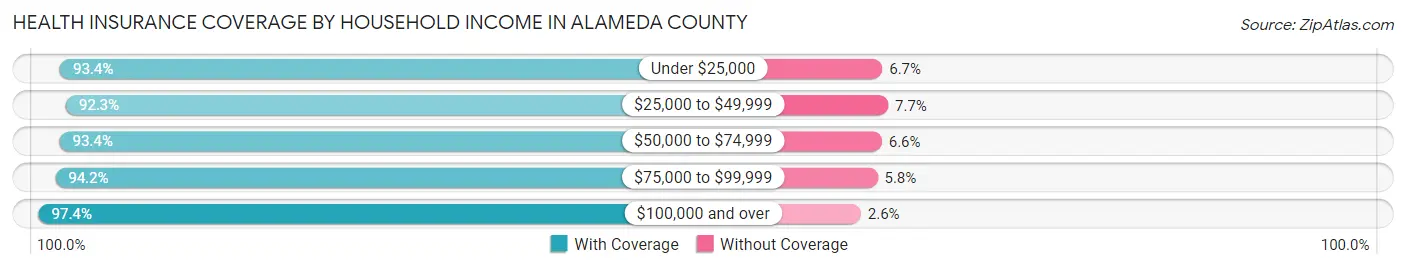
| Household Income | With Coverage | Without Coverage |
| Under $25,000 | 106,249 (93.3%) | 7,568 (6.7%) |
| $25,000 to $49,999 | 127,358 (92.3%) | 10,688 (7.7%) |
| $50,000 to $74,999 | 138,349 (93.4%) | 9,716 (6.6%) |
| $75,000 to $99,999 | 147,151 (94.2%) | 8,990 (5.8%) |
| $100,000 and over | 1,043,550 (97.4%) | 28,197 (2.6%) |
Public vs Private Health Insurance Coverage by Age in Alameda County
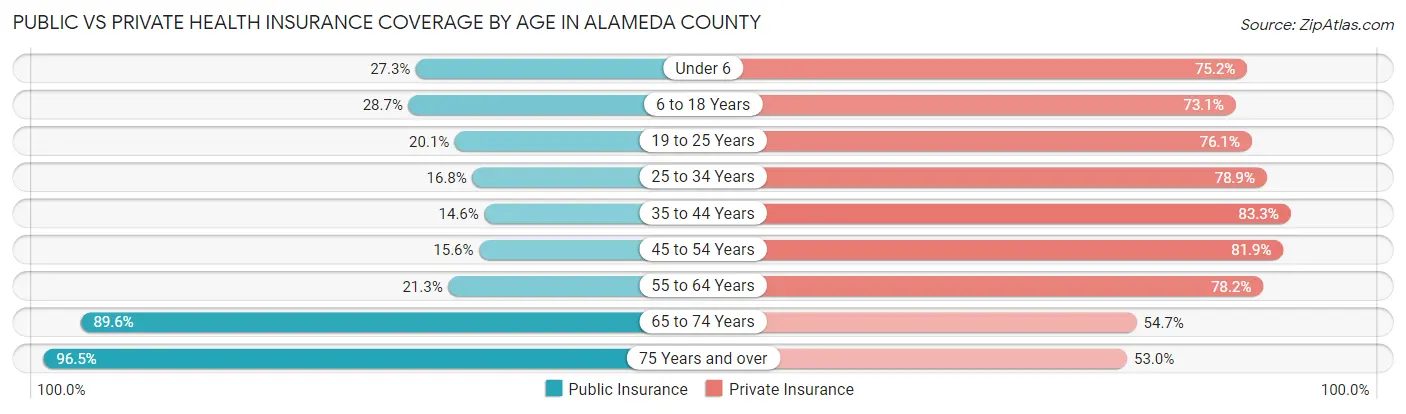
| Age Bracket | Public Insurance | Private Insurance |
| Under 6 | 29,922 (27.3%) | 82,451 (75.2%) |
| 6 to 18 Years | 70,639 (28.7%) | 179,832 (73.1%) |
| 19 to 25 Years | 27,660 (20.1%) | 104,812 (76.1%) |
| 25 to 34 Years | 40,603 (16.8%) | 190,178 (78.9%) |
| 35 to 44 Years | 37,621 (14.6%) | 214,493 (83.3%) |
| 45 to 54 Years | 34,531 (15.6%) | 181,474 (81.9%) |
| 55 to 64 Years | 43,058 (21.3%) | 157,957 (78.2%) |
| 65 to 74 Years | 127,231 (89.6%) | 77,678 (54.7%) |
| 75 Years and over | 93,347 (96.5%) | 51,215 (52.9%) |
| Total | 504,612 (30.5%) | 1,240,090 (75.0%) |
Disability Status by Sex by Age in Alameda County
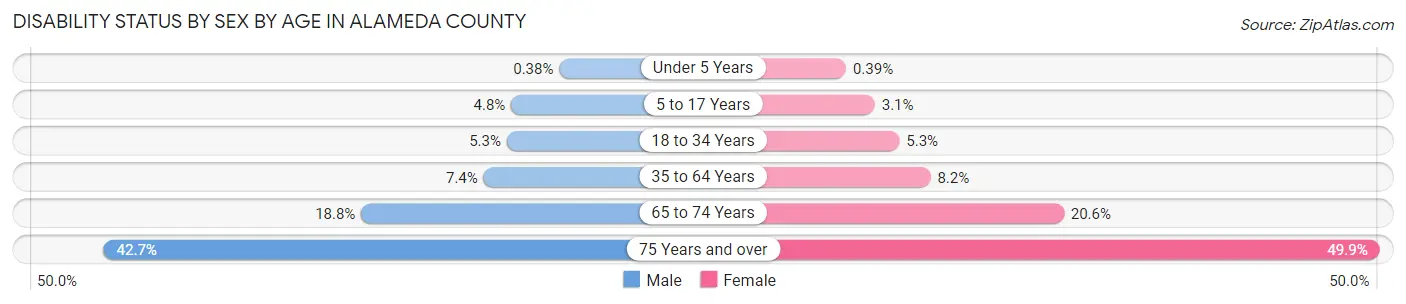
| Age Bracket | Male | Female |
| Under 5 Years | 174 (0.4%) | 173 (0.4%) |
| 5 to 17 Years | 6,018 (4.8%) | 3,619 (3.1%) |
| 18 to 34 Years | 10,604 (5.2%) | 10,687 (5.3%) |
| 35 to 64 Years | 25,419 (7.4%) | 27,762 (8.2%) |
| 65 to 74 Years | 12,391 (18.8%) | 15,639 (20.6%) |
| 75 Years and over | 16,831 (42.7%) | 28,580 (49.9%) |
Disability Class by Sex by Age in Alameda County
Disability Class: Hearing Difficulty
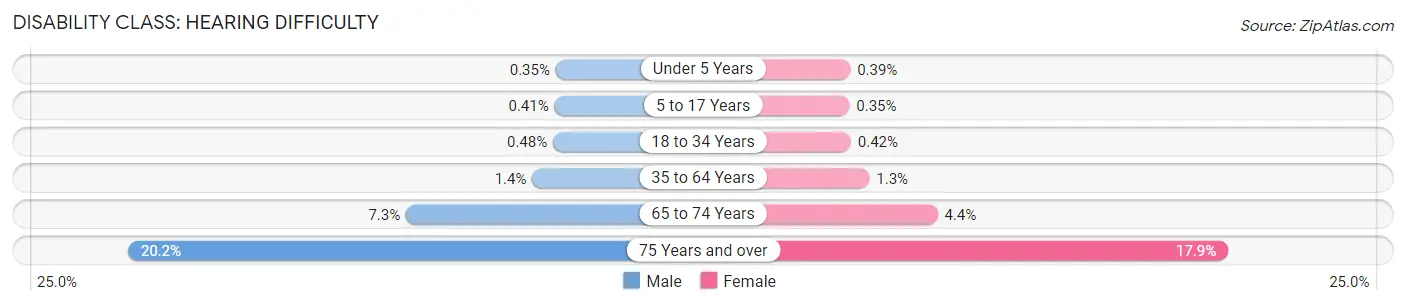
| Age Bracket | Male | Female |
| Under 5 Years | 161 (0.4%) | 173 (0.4%) |
| 5 to 17 Years | 508 (0.4%) | 410 (0.4%) |
| 18 to 34 Years | 966 (0.5%) | 837 (0.4%) |
| 35 to 64 Years | 4,935 (1.4%) | 4,325 (1.3%) |
| 65 to 74 Years | 4,825 (7.3%) | 3,368 (4.4%) |
| 75 Years and over | 7,974 (20.2%) | 10,262 (17.9%) |
Disability Class: Vision Difficulty
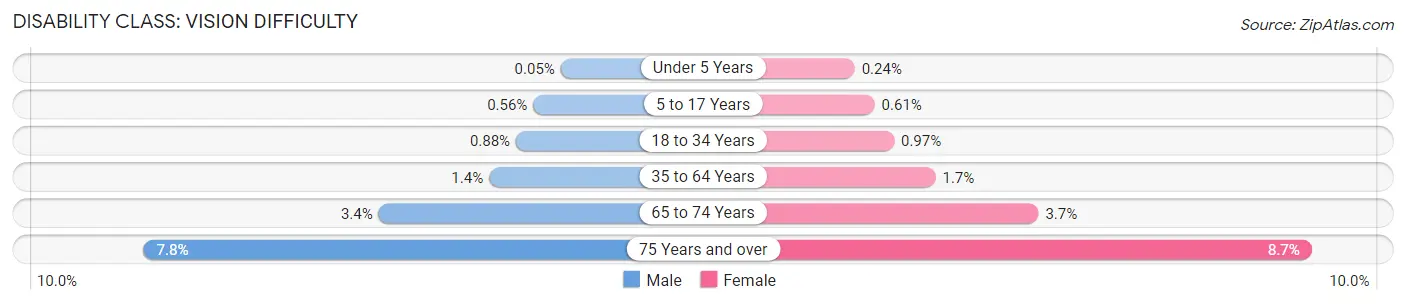
| Age Bracket | Male | Female |
| Under 5 Years | 22 (0.1%) | 107 (0.2%) |
| 5 to 17 Years | 698 (0.6%) | 726 (0.6%) |
| 18 to 34 Years | 1,773 (0.9%) | 1,946 (1.0%) |
| 35 to 64 Years | 4,726 (1.4%) | 5,883 (1.7%) |
| 65 to 74 Years | 2,265 (3.4%) | 2,772 (3.6%) |
| 75 Years and over | 3,072 (7.8%) | 4,994 (8.7%) |
Disability Class: Cognitive Difficulty
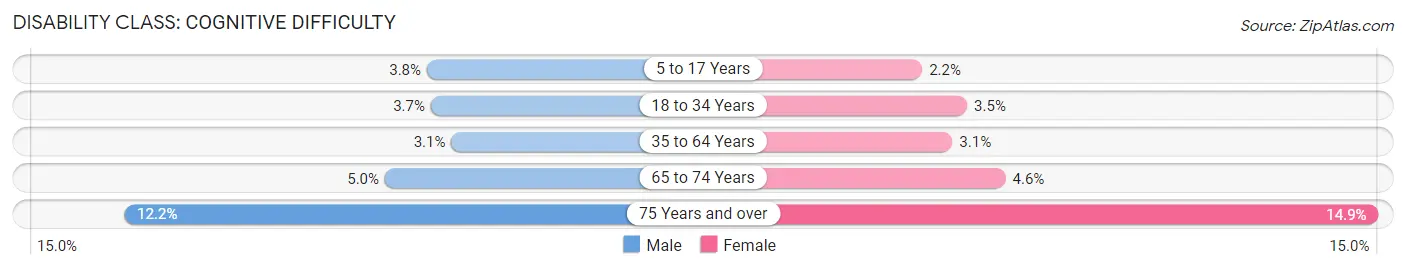
| Age Bracket | Male | Female |
| 5 to 17 Years | 4,731 (3.8%) | 2,651 (2.2%) |
| 18 to 34 Years | 7,451 (3.7%) | 6,978 (3.5%) |
| 35 to 64 Years | 10,702 (3.1%) | 10,384 (3.1%) |
| 65 to 74 Years | 3,285 (5.0%) | 3,462 (4.6%) |
| 75 Years and over | 4,826 (12.2%) | 8,559 (14.9%) |
Disability Class: Ambulatory Difficulty
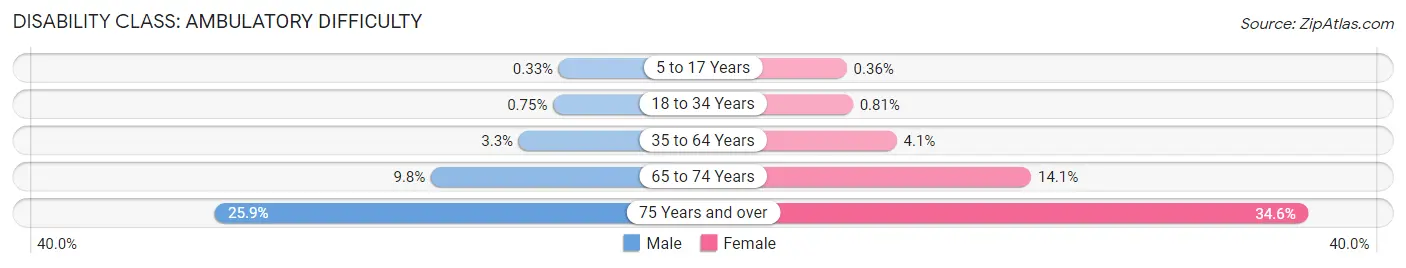
| Age Bracket | Male | Female |
| 5 to 17 Years | 407 (0.3%) | 426 (0.4%) |
| 18 to 34 Years | 1,514 (0.7%) | 1,629 (0.8%) |
| 35 to 64 Years | 11,320 (3.3%) | 13,722 (4.1%) |
| 65 to 74 Years | 6,484 (9.8%) | 10,664 (14.1%) |
| 75 Years and over | 10,201 (25.9%) | 19,802 (34.6%) |
Disability Class: Self-Care Difficulty
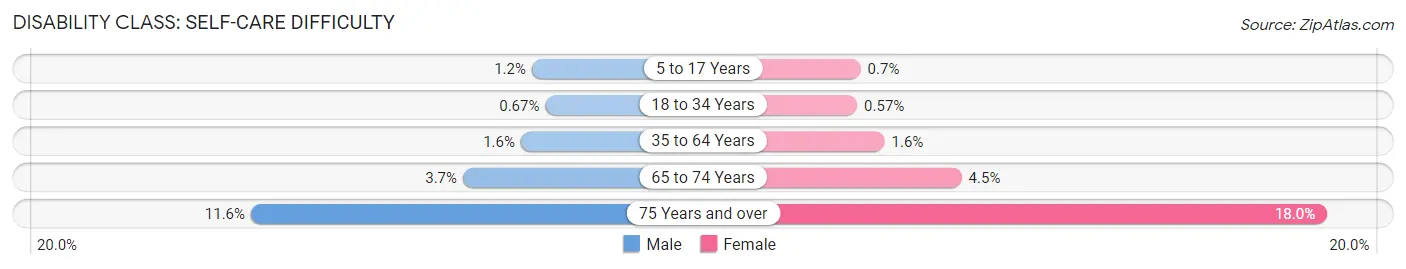
| Age Bracket | Male | Female |
| 5 to 17 Years | 1,450 (1.2%) | 823 (0.7%) |
| 18 to 34 Years | 1,344 (0.7%) | 1,138 (0.6%) |
| 35 to 64 Years | 5,418 (1.6%) | 5,374 (1.6%) |
| 65 to 74 Years | 2,464 (3.7%) | 3,380 (4.4%) |
| 75 Years and over | 4,575 (11.6%) | 10,314 (18.0%) |
Technology Access in Alameda County
Computing Device Access in Alameda County
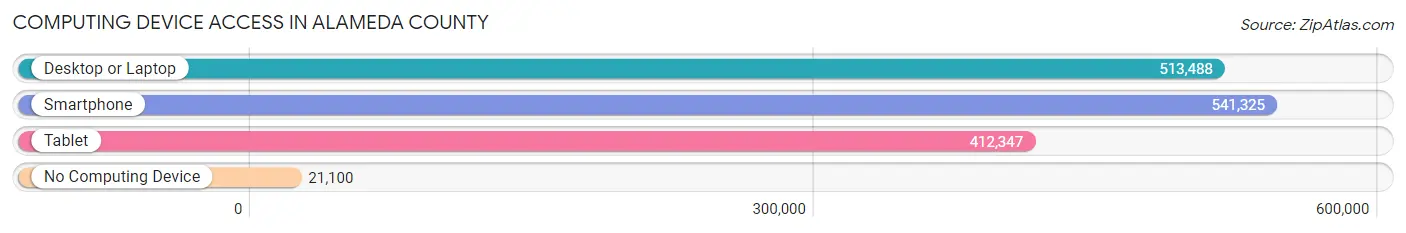
| Device Type | # Households | % Households |
| Desktop or Laptop | 513,488 | 87.6% |
| Smartphone | 541,325 | 92.4% |
| Tablet | 412,347 | 70.4% |
| No Computing Device | 21,100 | 3.6% |
| Total | 585,818 | 100.0% |
Internet Access in Alameda County
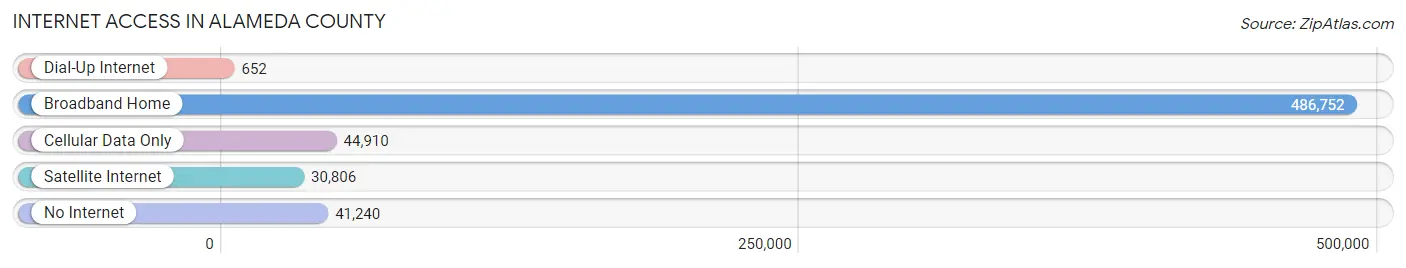
| Internet Type | # Households | % Households |
| Dial-Up Internet | 652 | 0.1% |
| Broadband Home | 486,752 | 83.1% |
| Cellular Data Only | 44,910 | 7.7% |
| Satellite Internet | 30,806 | 5.3% |
| No Internet | 41,240 | 7.0% |
| Total | 585,818 | 100.0% |
Alameda County Summary
Alameda County is located in the San Francisco Bay Area of California and is the seventh most populous county in the state. It is bordered by Contra Costa County to the north, San Joaquin County to the east, Santa Clara County to the south, and San Francisco Bay to the west. The county seat is Oakland, the largest city in the county. Alameda County is home to a diverse population of over 1.6 million people, with a wide range of ethnicities, cultures, and lifestyles.
Geography
Alameda County covers an area of 821 square miles, making it the third largest county in California. The county is divided into two distinct regions: the East Bay and the West Bay. The East Bay is home to the cities of Oakland, Berkeley, and Hayward, as well as the University of California, Berkeley. The West Bay is home to the cities of Fremont, Union City, and Newark, as well as the cities of San Leandro, Alameda, and Emeryville. The county is also home to several parks, including the East Bay Regional Park District, the San Francisco Bay National Wildlife Refuge, and the Tilden Regional Park.
History
Alameda County was established in 1853, when it was carved out of Contra Costa County. The county was named after the Spanish word for “grove of poplars”, which was the name of a creek that ran through the area. The county was originally home to the Ohlone people, who were the first inhabitants of the area. In the late 19th century, the county experienced a population boom due to the Gold Rush, and many of the cities in the county were founded during this time.
Economy
Alameda County is home to a diverse and vibrant economy. The county is home to several major employers, including the University of California, Berkeley, Kaiser Permanente, and Lawrence Livermore National Laboratory. The county is also home to several major industries, including technology, healthcare, finance, and manufacturing. The county is also home to several major ports, including the Port of Oakland, the Port of San Francisco, and the Port of Richmond.
Demographics
As of the 2020 census, Alameda County had a population of 1,639,637 people. The racial makeup of the county was 44.3% White, 24.2% Hispanic or Latino, 18.2% Asian, 8.7% Black or African American, 0.7% Native American, and 3.1% from other races. The median household income in the county was $90,837, and the median home value was $743,000.
Alameda County is a diverse and vibrant county with a rich history and a strong economy. The county is home to a wide range of people, cultures, and lifestyles, and is a great place to live, work, and play.
Common Questions
What is Per Capita Income in Alameda County?
Per Capita income in Alameda County is $60,193.
What is the Median Family Income in Alameda County?
Median Family Income in Alameda County is $149,535.
What is the Median Household income in Alameda County?
Median Household Income in Alameda County is $122,488.
What is Income or Wage Gap in Alameda County?
Income or Wage Gap in Alameda County is 22.9%.
Women in Alameda County earn 77.1 cents for every dollar earned by a man.
What is Family Income Deficit in Alameda County?
Family Income Deficit in Alameda County is $10,750.
Families that are below poverty line in Alameda County earn $10,750 less on average than the poverty threshold level.
What is Inequality or Gini Index in Alameda County?
Inequality or Gini Index in Alameda County is 0.47.
What is the Total Population of Alameda County?
Total Population of Alameda County is 1,663,823.
What is the Total Male Population of Alameda County?
Total Male Population of Alameda County is 826,561.
What is the Total Female Population of Alameda County?
Total Female Population of Alameda County is 837,262.
What is the Ratio of Males per 100 Females in Alameda County?
There are 98.72 Males per 100 Females in Alameda County.
What is the Ratio of Females per 100 Males in Alameda County?
There are 101.29 Females per 100 Males in Alameda County.
What is the Median Population Age in Alameda County?
Median Population Age in Alameda County is 38.4 Years.
What is the Average Family Size in Alameda County
Average Family Size in Alameda County is 3.4 People.
What is the Average Household Size in Alameda County
Average Household Size in Alameda County is 2.8 People.
How Large is the Labor Force in Alameda County?
There are 917,240 People in the Labor Forcein in Alameda County.
What is the Percentage of People in the Labor Force in Alameda County?
67.0% of People are in the Labor Force in Alameda County.
What is the Unemployment Rate in Alameda County?
Unemployment Rate in Alameda County is 4.9%.