Area Code 510 Map & Demographics
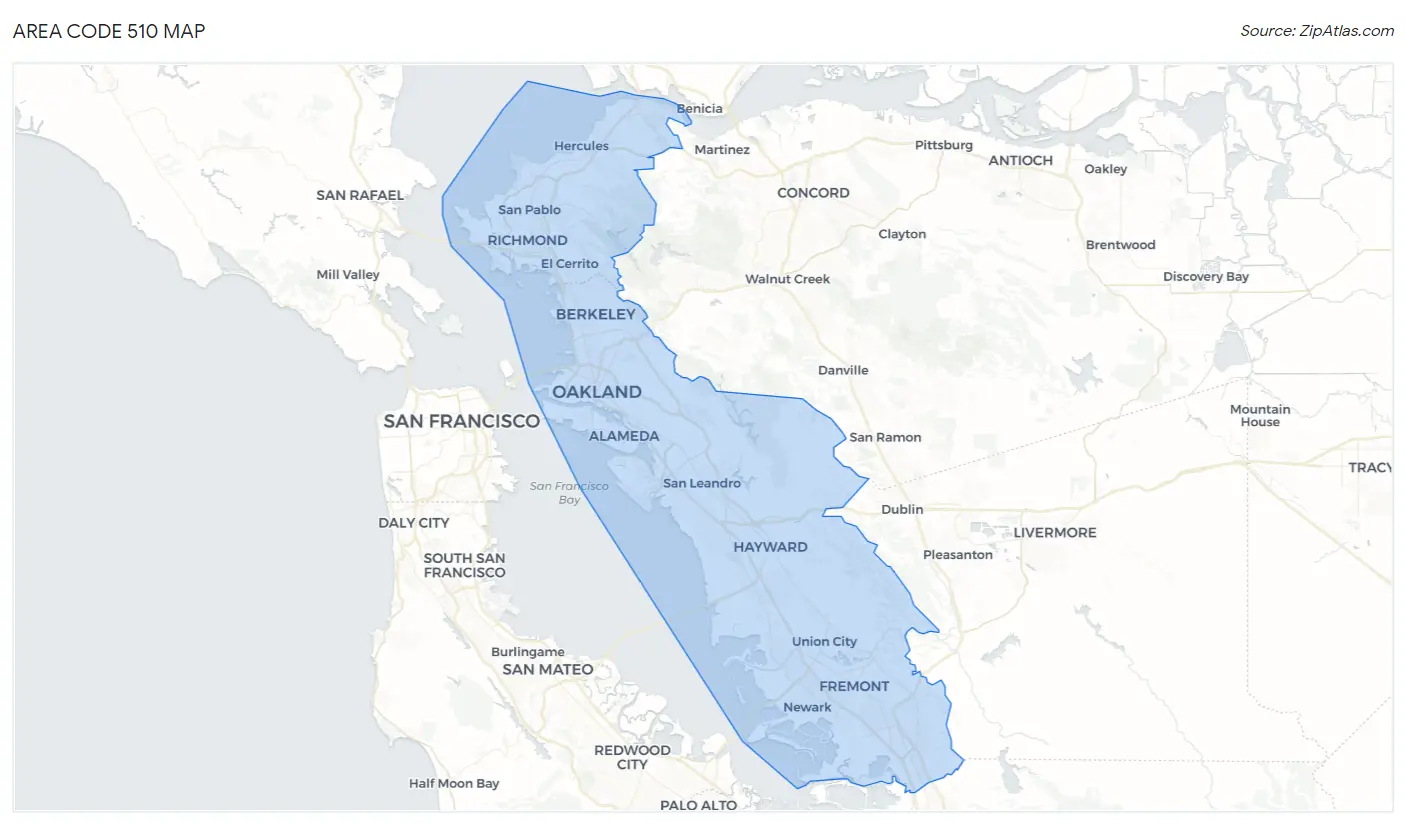
Area Code 510 Map
Area Code 510 Overview
$64,875
PER CAPITA INCOME
$147,076
AVG FAMILY INCOME
$123,778
AVG HOUSEHOLD INCOME
23.2%
WAGE / INCOME GAP [ % ]
76.8¢/ $1
WAGE / INCOME GAP [ $ ]
$11,028
FAMILY INCOME DEFICIT
31.76
INEQUALITY / GINI INDEX
2,159,978
TOTAL POPULATION
1,087,327
MALE POPULATION
1,072,651
FEMALE POPULATION
101.37
MALES / 100 FEMALES
98.65
FEMALES / 100 MALES
39.1
MEDIAN AGE
3.2
AVG FAMILY SIZE
2.6
AVG HOUSEHOLD SIZE
1,198,140
LABOR FORCE [ PEOPLE ]
66.3%
PERCENT IN LABOR FORCE
6.1%
UNEMPLOYMENT RATE
Income in Area Code 510
Income Overview in Area Code 510
Per Capita Income in Area Code 510 is $64,875, while median incomes of families and households are $147,076 and $123,778 respectively.
| Characteristic | Number | Measure |
| Per Capita Income | 2,159,978 | $64,875 |
| Median Family Income | 485,059 | $147,076 |
| Mean Family Income | 485,059 | $13,062,636 |
| Median Household Income | 791,463 | $123,778 |
| Mean Household Income | 791,463 | $11,332,572 |
| Income Deficit | 485,059 | $11,028 |
| Wage / Income Gap (%) | 2,159,978 | 23.23% |
| Wage / Income Gap ($) | 2,159,978 | 76.77¢ per $1 |
| Gini / Inequality Index | 2,159,978 | 31.76 |
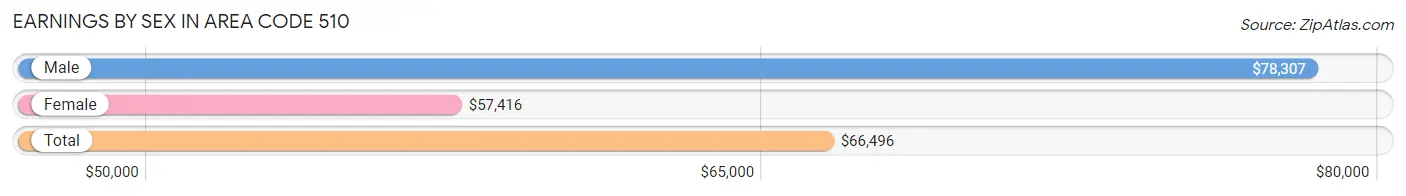
Earnings by Sex in Area Code 510
Average Earnings in Area Code 510 are $66,496, $78,307 for men and $57,416 for women, a difference of 26.7%.
| Sex | Number | Average Earnings |
| Male | 674,545 (53.8%) | $78,307 |
| Female | 579,017 (46.2%) | $57,416 |
| Total | 1,253,562 (100.0%) | $66,496 |
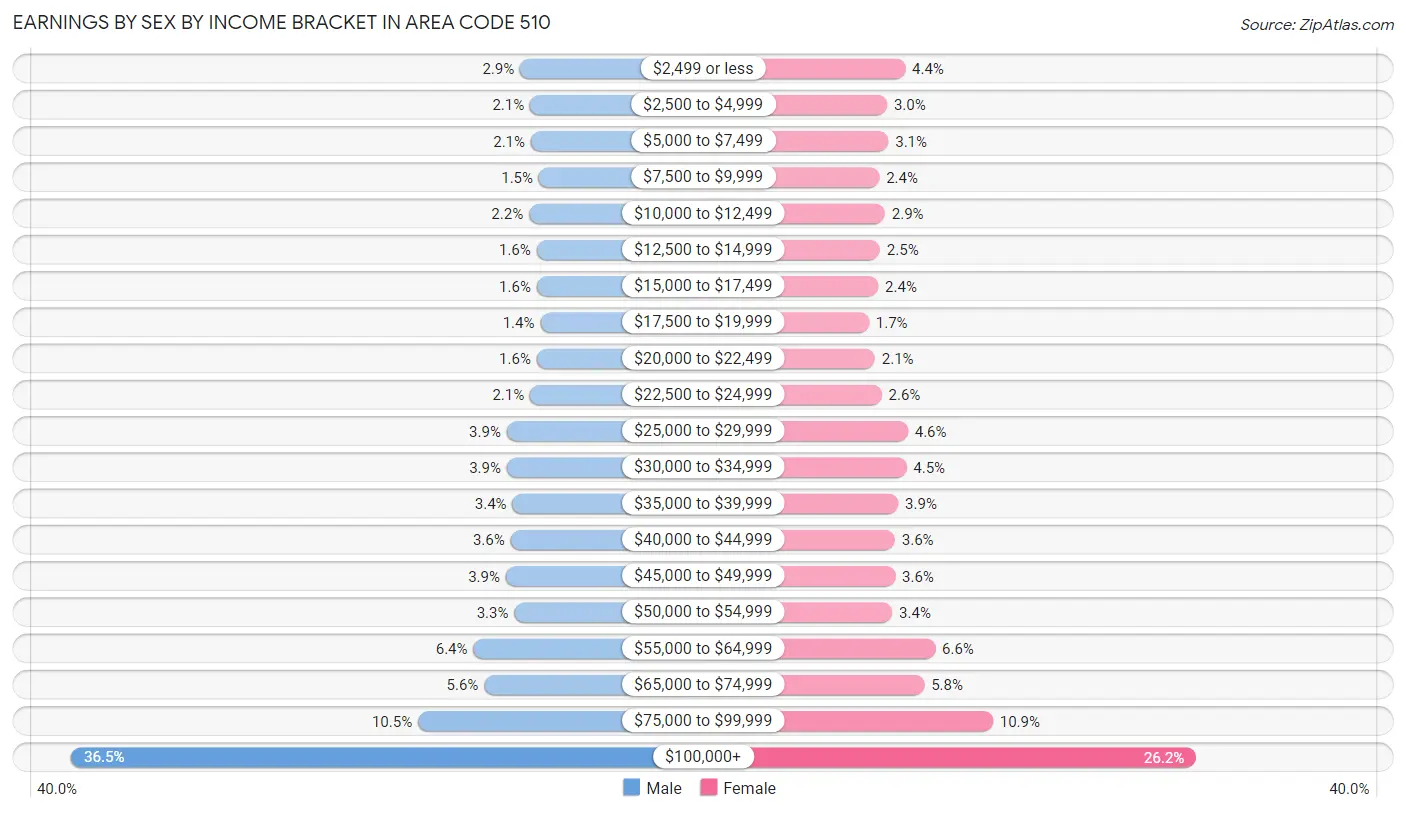
Earnings by Sex by Income Bracket in Area Code 510
The most common earnings brackets in Area Code 510 are $100,000+ for men (246,263 | 36.5%) and $100,000+ for women (151,593 | 26.2%).
| Income | Male | Female |
| $2,499 or less | 19,354 (2.9%) | 25,316 (4.4%) |
| $2,500 to $4,999 | 14,303 (2.1%) | 17,411 (3.0%) |
| $5,000 to $7,499 | 13,867 (2.1%) | 18,013 (3.1%) |
| $7,500 to $9,999 | 9,866 (1.5%) | 14,045 (2.4%) |
| $10,000 to $12,499 | 14,807 (2.2%) | 16,528 (2.9%) |
| $12,500 to $14,999 | 11,024 (1.6%) | 14,384 (2.5%) |
| $15,000 to $17,499 | 10,930 (1.6%) | 13,605 (2.4%) |
| $17,500 to $19,999 | 9,134 (1.3%) | 9,546 (1.7%) |
| $20,000 to $22,499 | 10,941 (1.6%) | 12,145 (2.1%) |
| $22,500 to $24,999 | 14,332 (2.1%) | 15,118 (2.6%) |
| $25,000 to $29,999 | 26,078 (3.9%) | 26,452 (4.6%) |
| $30,000 to $34,999 | 26,041 (3.9%) | 25,821 (4.5%) |
| $35,000 to $39,999 | 23,202 (3.4%) | 22,284 (3.8%) |
| $40,000 to $44,999 | 24,172 (3.6%) | 20,867 (3.6%) |
| $45,000 to $49,999 | 26,592 (3.9%) | 20,980 (3.6%) |
| $50,000 to $54,999 | 22,247 (3.3%) | 19,673 (3.4%) |
| $55,000 to $64,999 | 42,938 (6.4%) | 38,319 (6.6%) |
| $65,000 to $74,999 | 37,499 (5.6%) | 33,569 (5.8%) |
| $75,000 to $99,999 | 70,955 (10.5%) | 63,348 (10.9%) |
| $100,000+ | 246,263 (36.5%) | 151,593 (26.2%) |
| Total | 674,545 (100.0%) | 579,017 (100.0%) |
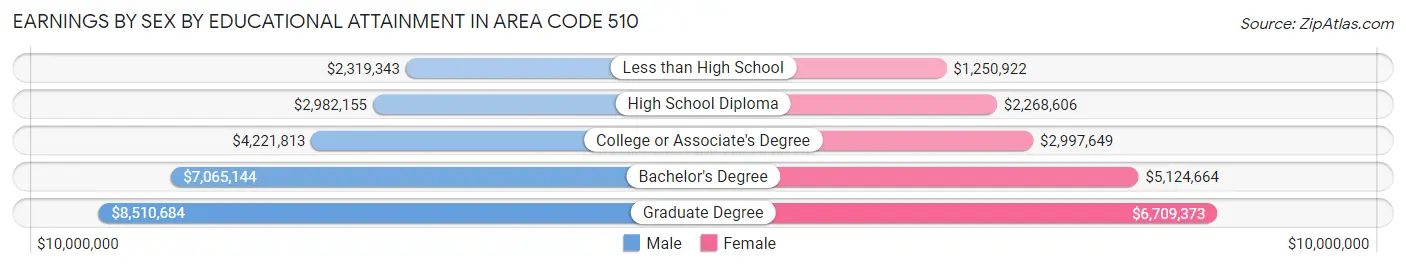
Earnings by Sex by Educational Attainment in Area Code 510
Average earnings in Area Code 510 are $5,890,161 for men and $4,410,818 for women, a difference of 25.1%. Men with an educational attainment of graduate degree enjoy the highest average annual earnings of $8,510,684, while those with less than high school education earn the least with $2,319,343. Women with an educational attainment of graduate degree earn the most with the average annual earnings of $6,709,373, while those with less than high school education have the smallest earnings of $1,250,922.
| Educational Attainment | Male Income | Female Income |
| Less than High School | $2,319,343 | $1,250,922 |
| High School Diploma | $2,982,155 | $2,268,606 |
| College or Associate's Degree | $4,221,813 | $2,997,649 |
| Bachelor's Degree | $7,065,144 | $5,124,664 |
| Graduate Degree | $8,510,684 | $6,709,373 |
| Total | $5,890,161 | $4,410,818 |
Family Income in Area Code 510
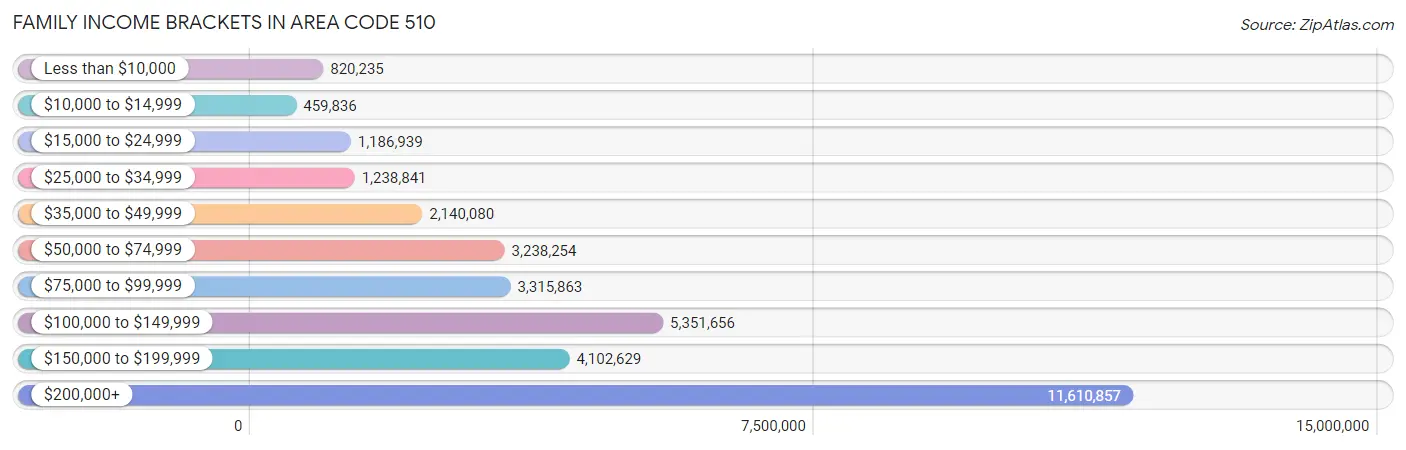
Family Income Brackets in Area Code 510
According to the Area Code 510 family income data, there are 11,610,857 families falling into the $200,000+ income range, which is the most common income bracket and makes up 2,393.7% of all families. Conversely, the $10,000 to $14,999 income bracket is the least frequent group with only 459,836 families (94.8%) belonging to this category.
| Income Bracket | # Families | % Families |
| Less than $10,000 | 820,235 | 169.1% |
| $10,000 to $14,999 | 459,836 | 94.8% |
| $15,000 to $24,999 | 1,186,939 | 244.7% |
| $25,000 to $34,999 | 1,238,841 | 255.4% |
| $35,000 to $49,999 | 2,140,080 | 441.2% |
| $50,000 to $74,999 | 3,238,254 | 667.6% |
| $75,000 to $99,999 | 3,315,863 | 683.6% |
| $100,000 to $149,999 | 5,351,656 | 1,103.3% |
| $150,000 to $199,999 | 4,102,629 | 845.8% |
| $200,000+ | 11,610,857 | 2,393.7% |
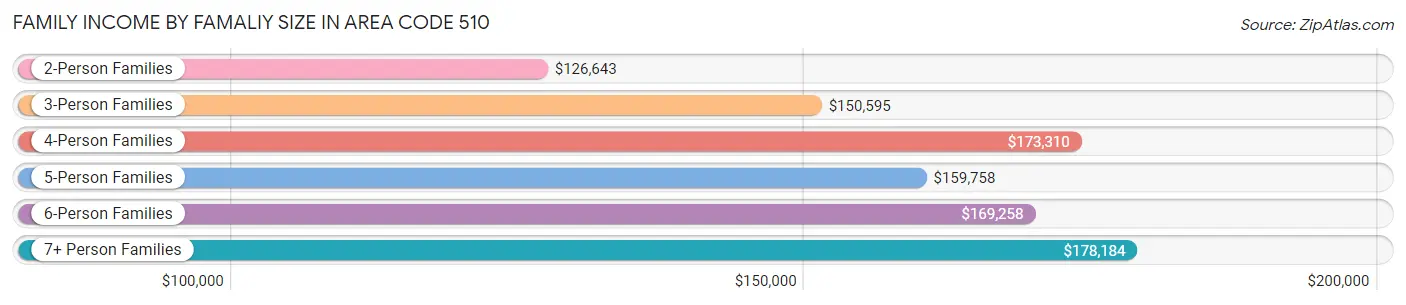
Family Income by Famaliy Size in Area Code 510
7+ person families (10,427 | 2.1%) account for the highest median family income in Area Code 510 with $178,184 per family, while 2-person families (200,323 | 41.3%) have the highest median income of $63,322 per family member.
| Income Bracket | # Families | Median Income |
| 2-Person Families | 200,323 (41.3%) | $126,643 |
| 3-Person Families | 117,997 (24.3%) | $150,595 |
| 4-Person Families | 99,600 (20.5%) | $173,310 |
| 5-Person Families | 40,306 (8.3%) | $159,758 |
| 6-Person Families | 16,406 (3.4%) | $169,258 |
| 7+ Person Families | 10,427 (2.1%) | $178,184 |
| Total | 485,059 (100.0%) | $147,076 |
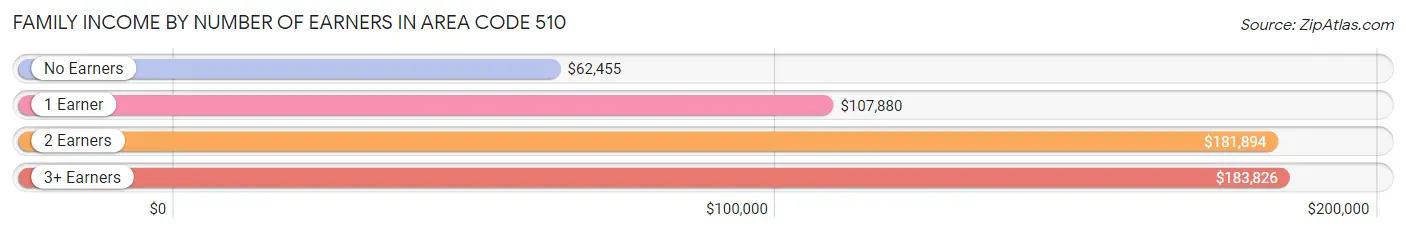
Family Income by Number of Earners in Area Code 510
The median family income in Area Code 510 is $147,076, with families comprising 3+ earners (70,022) having the highest median family income of $183,826, while families with no earners (50,995) have the lowest median family income of $62,455, accounting for 14.4% and 10.5% of families, respectively.
| Number of Earners | # Families | Median Income |
| No Earners | 50,995 (10.5%) | $62,455 |
| 1 Earner | 141,163 (29.1%) | $107,880 |
| 2 Earners | 222,879 (46.0%) | $181,894 |
| 3+ Earners | 70,022 (14.4%) | $183,826 |
| Total | 485,059 (100.0%) | $147,076 |
Household Income in Area Code 510
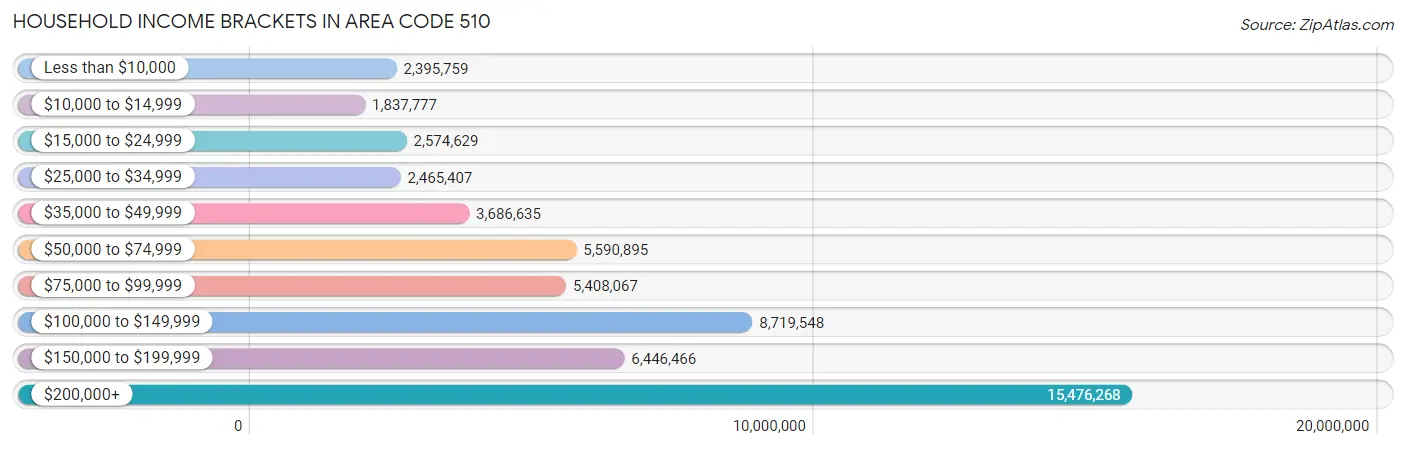
Household Income Brackets in Area Code 510
With 15,476,268 households falling in the category, the $200,000+ income range is the most frequent in Area Code 510, accounting for 1,955.4% of all households. In contrast, only 1,837,777 households (232.2%) fall into the $10,000 to $14,999 income bracket, making it the least populous group.
| Income Bracket | # Households | % Households |
| Less than $10,000 | 2,395,759 | 302.7% |
| $10,000 to $14,999 | 1,837,777 | 232.2% |
| $15,000 to $24,999 | 2,574,629 | 325.3% |
| $25,000 to $34,999 | 2,465,407 | 311.5% |
| $35,000 to $49,999 | 3,686,635 | 465.8% |
| $50,000 to $74,999 | 5,590,895 | 706.4% |
| $75,000 to $99,999 | 5,408,067 | 683.3% |
| $100,000 to $149,999 | 8,719,548 | 1,101.7% |
| $150,000 to $199,999 | 6,446,466 | 814.5% |
| $200,000+ | 15,476,268 | 1,955.4% |
Household Income by Householder Age in Area Code 510
The median household income in Area Code 510 is $123,778, with the highest median household income of $155,603 found in the 25 to 44 years age bracket for the primary householder. A total of 306,031 households (38.7%) fall into this category. Meanwhile, the 65+ years age bracket for the primary householder has the lowest median household income of $81,456, with 182,310 households (23.0%) in this group.
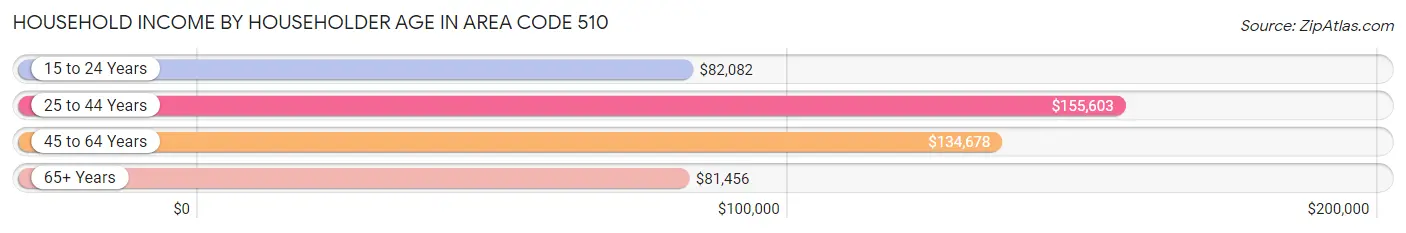
| Income Bracket | # Households | Median Income |
| 15 to 24 Years | 21,019 (2.7%) | $82,082 |
| 25 to 44 Years | 306,031 (38.7%) | $155,603 |
| 45 to 64 Years | 282,103 (35.6%) | $134,678 |
| 65+ Years | 182,310 (23.0%) | $81,456 |
| Total | 791,463 (100.0%) | $123,778 |
Poverty in Area Code 510
Income Below Poverty by Sex and Age in Area Code 510
With 9.3% poverty level for males and 10.9% for females among the residents of Area Code 510, 18 to 24 year old males and 18 to 24 year old females are the most vulnerable to poverty, with 14,192 males (17.3%) and 16,857 females (21.5%) in their respective age groups living below the poverty level.
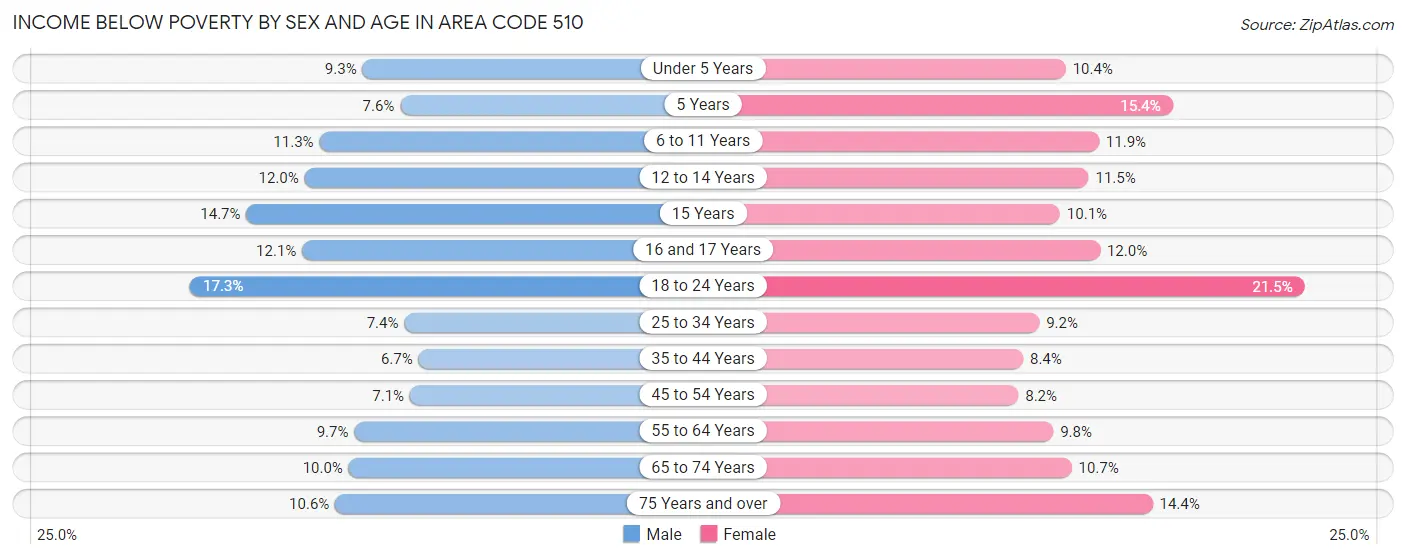
| Age Bracket | Male | Female |
| Under 5 Years | 5,213 (9.3%) | 5,574 (10.4%) |
| 5 Years | 941 (7.6%) | 1,709 (15.3%) |
| 6 to 11 Years | 7,333 (11.3%) | 7,530 (11.9%) |
| 12 to 14 Years | 3,955 (12.0%) | 3,512 (11.5%) |
| 15 Years | 1,575 (14.7%) | 1,051 (10.1%) |
| 16 and 17 Years | 2,830 (12.1%) | 2,518 (12.0%) |
| 18 to 24 Years | 14,192 (17.3%) | 16,857 (21.5%) |
| 25 to 34 Years | 14,958 (7.4%) | 17,023 (9.2%) |
| 35 to 44 Years | 11,588 (6.7%) | 13,449 (8.4%) |
| 45 to 54 Years | 10,272 (7.1%) | 11,097 (8.2%) |
| 55 to 64 Years | 12,583 (9.7%) | 12,598 (9.8%) |
| 65 to 74 Years | 8,776 (10.0%) | 10,739 (10.7%) |
| 75 Years and over | 5,674 (10.6%) | 11,264 (14.4%) |
| Total | 99,890 (9.3%) | 114,921 (10.9%) |
Income Above Poverty by Sex and Age in Area Code 510
According to the poverty statistics in Area Code 510, males aged 35 to 44 years and females aged 45 to 54 years are the age groups that are most secure financially, with 93.3% of males and 91.8% of females in these age groups living above the poverty line.
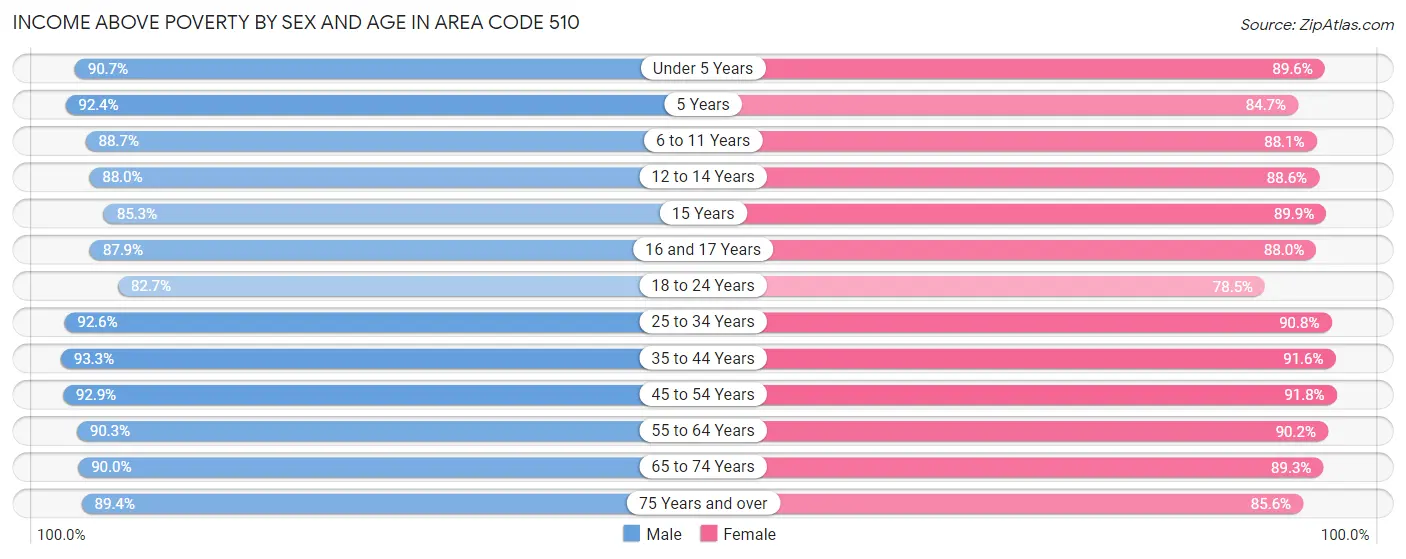
| Age Bracket | Male | Female |
| Under 5 Years | 50,706 (90.7%) | 48,087 (89.6%) |
| 5 Years | 11,495 (92.4%) | 9,421 (84.7%) |
| 6 to 11 Years | 57,473 (88.7%) | 55,602 (88.1%) |
| 12 to 14 Years | 28,982 (88.0%) | 27,161 (88.5%) |
| 15 Years | 9,133 (85.3%) | 9,331 (89.9%) |
| 16 and 17 Years | 20,528 (87.9%) | 18,492 (88.0%) |
| 18 to 24 Years | 67,728 (82.7%) | 61,639 (78.5%) |
| 25 to 34 Years | 187,833 (92.6%) | 168,827 (90.8%) |
| 35 to 44 Years | 160,785 (93.3%) | 146,523 (91.6%) |
| 45 to 54 Years | 134,010 (92.9%) | 124,432 (91.8%) |
| 55 to 64 Years | 117,088 (90.3%) | 115,811 (90.2%) |
| 65 to 74 Years | 79,380 (90.0%) | 90,032 (89.3%) |
| 75 Years and over | 47,919 (89.4%) | 66,826 (85.6%) |
| Total | 973,060 (90.7%) | 942,184 (89.1%) |
Income Below Poverty Among Married-Couple Families in Area Code 510
The poverty statistics for married-couple families in Area Code 510 show that 3.6% or 13,000 of the total 360,226 families live below the poverty line. Families with 5 or more children have the highest poverty rate of 16.3%, comprising of 180 families. On the other hand, families with no children have the lowest poverty rate of 2.9%, which includes 5,643 families.
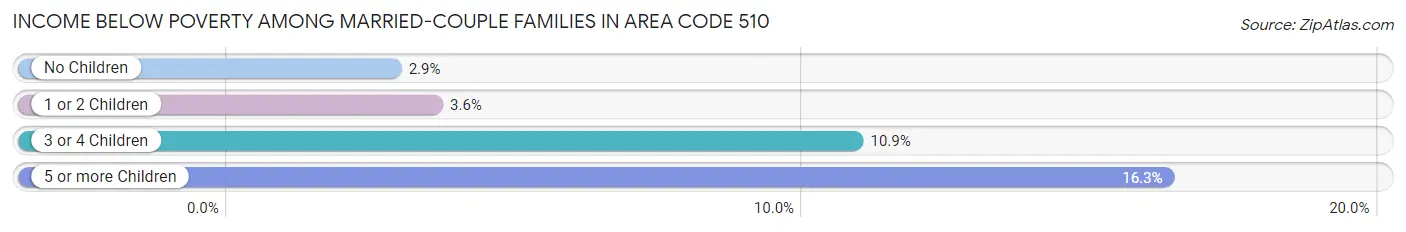
| Children | Above Poverty | Below Poverty |
| No Children | 192,265 (97.2%) | 5,643 (2.9%) |
| 1 or 2 Children | 136,722 (96.4%) | 5,060 (3.6%) |
| 3 or 4 Children | 17,315 (89.1%) | 2,117 (10.9%) |
| 5 or more Children | 924 (83.7%) | 180 (16.3%) |
| Total | 347,226 (96.4%) | 13,000 (3.6%) |
Income Below Poverty Among Single-Parent Households in Area Code 510
According to the poverty data in Area Code 510, 9.0% or 3,589 single-father households and 15.6% or 13,253 single-mother households are living below the poverty line. Among single-father households, those with 5 or more children have the highest poverty rate, with 22 households (25.6%) experiencing poverty. Likewise, among single-mother households, those with 5 or more children have the highest poverty rate, with 327 households (61.4%) falling below the poverty line.
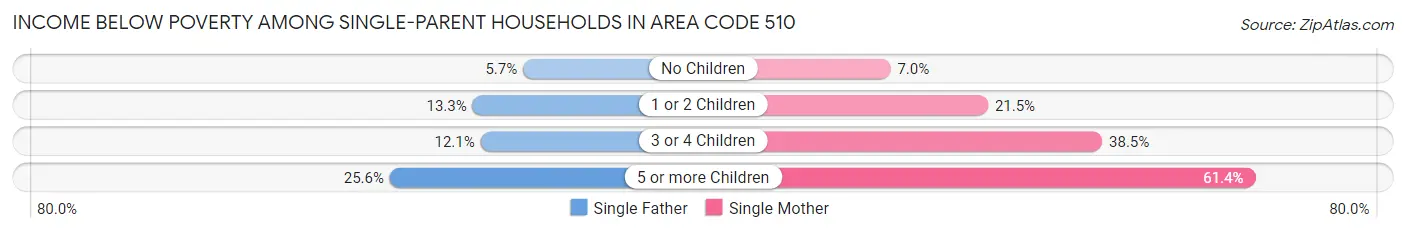
| Children | Single Father | Single Mother |
| No Children | 1,278 (5.7%) | 2,917 (7.0%) |
| 1 or 2 Children | 2,092 (13.3%) | 8,097 (21.5%) |
| 3 or 4 Children | 197 (12.1%) | 1,912 (38.5%) |
| 5 or more Children | 22 (25.6%) | 327 (61.4%) |
| Total | 3,589 (9.0%) | 13,253 (15.6%) |
Income Below Poverty Among Married-Couple vs Single-Parent Households in Area Code 510
The poverty data for Area Code 510 shows that 13,000 of the married-couple family households (3.6%) and 16,842 of the single-parent households (13.5%) are living below the poverty level. Within the married-couple family households, those with 5 or more children have the highest poverty rate, with 180 households (16.3%) falling below the poverty line. Among the single-parent households, those with 5 or more children have the highest poverty rate, with 349 household (56.4%) living below poverty.
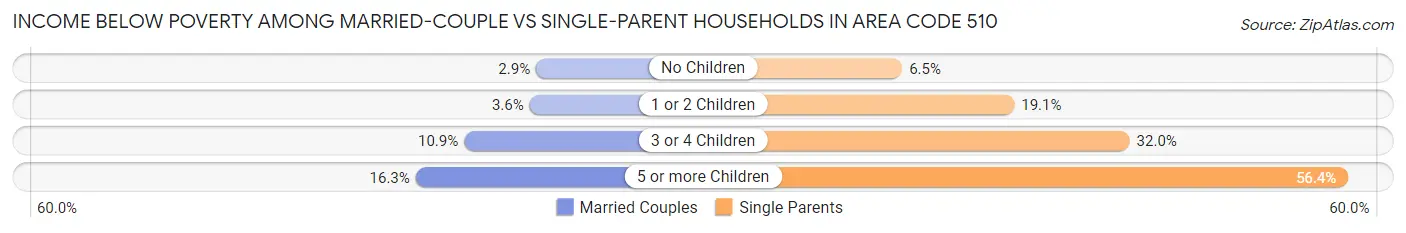
| Children | Married-Couple Families | Single-Parent Households |
| No Children | 5,643 (2.9%) | 4,195 (6.5%) |
| 1 or 2 Children | 5,060 (3.6%) | 10,189 (19.1%) |
| 3 or 4 Children | 2,117 (10.9%) | 2,109 (32.0%) |
| 5 or more Children | 180 (16.3%) | 349 (56.4%) |
| Total | 13,000 (3.6%) | 16,842 (13.5%) |
Race in Area Code 510
The most populous races in Area Code 510 are Asian (707,206 | 32.7%), White / Caucasian (695,195 | 32.2%), and Hispanic or Latino (504,362 | 23.4%).
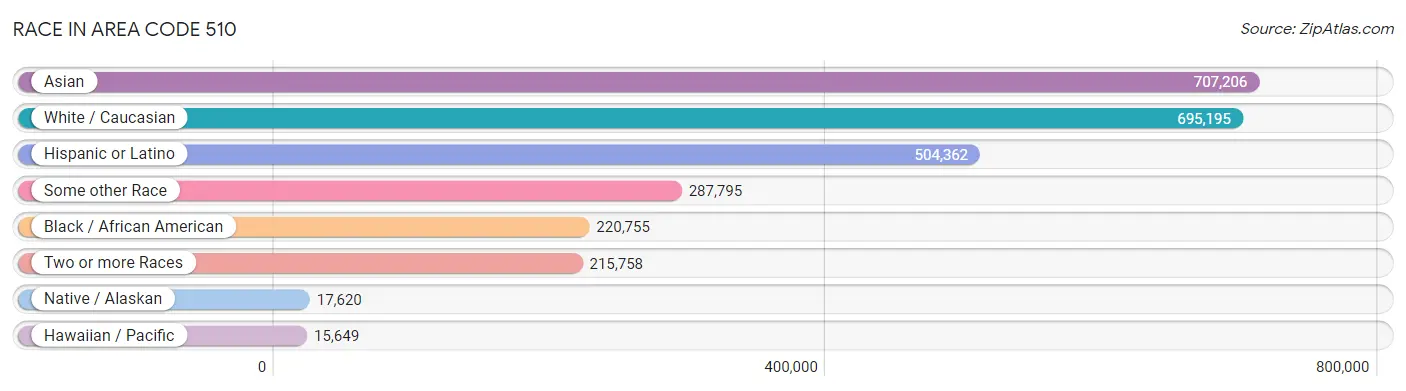
| Race | # Population | % Population |
| Asian | 707,206 | 32.7% |
| Black / African American | 220,755 | 10.2% |
| Hawaiian / Pacific | 15,649 | 0.7% |
| Hispanic or Latino | 504,362 | 23.4% |
| Native / Alaskan | 17,620 | 0.8% |
| White / Caucasian | 695,195 | 32.2% |
| Two or more Races | 215,758 | 10.0% |
| Some other Race | 287,795 | 13.3% |
| Total | 2,159,978 | 100.0% |
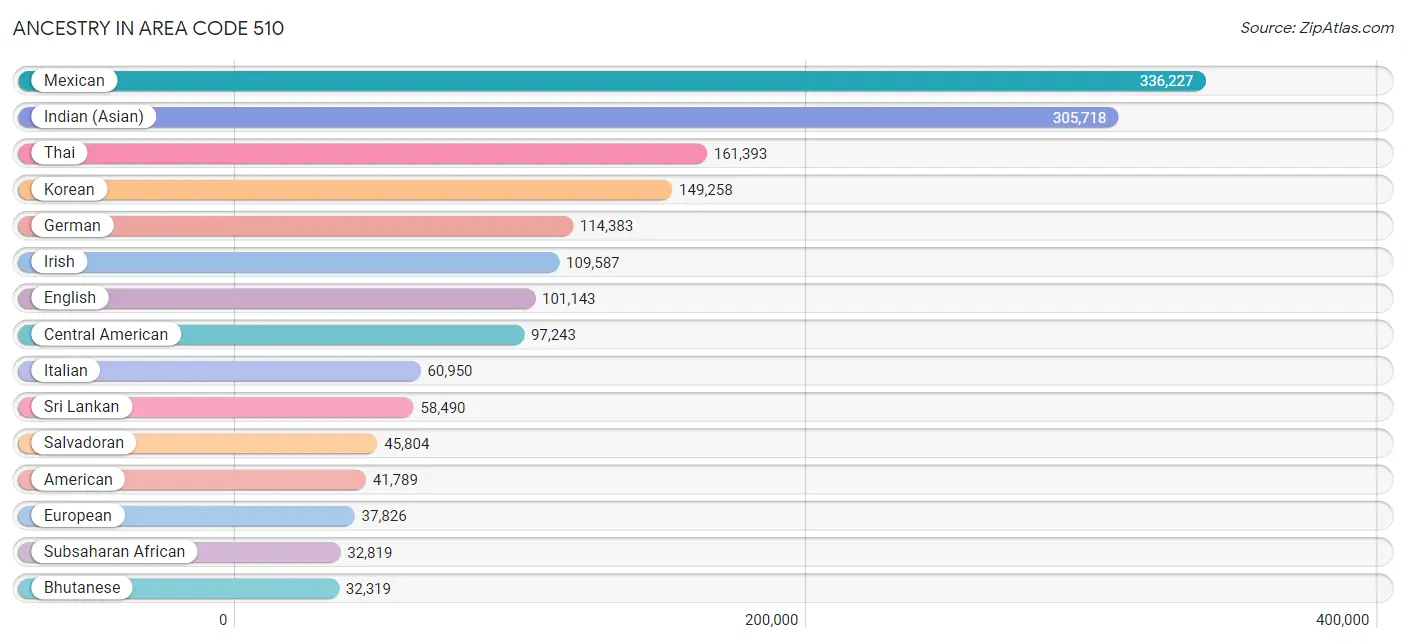
Ancestry in Area Code 510
The most populous ancestries reported in Area Code 510 are Mexican (336,227 | 15.6%), Indian (Asian) (305,718 | 14.1%), Thai (161,393 | 7.5%), Korean (149,258 | 6.9%), and German (114,383 | 5.3%), together accounting for 49.4% of all Area Code 510 residents.
| Ancestry | # Population | % Population |
| Afghan | 9,857 | 0.5% |
| African | 10,529 | 0.5% |
| Alaska Native | 39 | 0.0% |
| Alaskan Athabascan | 2 | 0.0% |
| Albanian | 456 | 0.0% |
| Aleut | 48 | 0.0% |
| Alsatian | 43 | 0.0% |
| American | 41,789 | 1.9% |
| Apache | 1,856 | 0.1% |
| Arab | 22,278 | 1.0% |
| Argentinean | 2,649 | 0.1% |
| Armenian | 3,663 | 0.2% |
| Assyrian / Chaldean / Syriac | 448 | 0.0% |
| Australian | 803 | 0.0% |
| Austrian | 3,637 | 0.2% |
| Bahamian | 38 | 0.0% |
| Bangladeshi | 1,128 | 0.1% |
| Barbadian | 225 | 0.0% |
| Basque | 653 | 0.0% |
| Belgian | 1,818 | 0.1% |
| Belizean | 353 | 0.0% |
| Bermudan | 42 | 0.0% |
| Bhutanese | 32,319 | 1.5% |
| Blackfeet | 889 | 0.0% |
| Bolivian | 459 | 0.0% |
| Brazilian | 3,654 | 0.2% |
| British | 13,113 | 0.6% |
| British West Indian | 186 | 0.0% |
| Bulgarian | 960 | 0.0% |
| Burmese | 31,011 | 1.4% |
| Cajun | 219 | 0.0% |
| Cambodian | 1,745 | 0.1% |
| Canadian | 2,481 | 0.1% |
| Cape Verdean | 454 | 0.0% |
| Carpatho Rusyn | 22 | 0.0% |
| Celtic | 208 | 0.0% |
| Central American | 97,243 | 4.5% |
| Central American Indian | 5,919 | 0.3% |
| Cherokee | 5,533 | 0.3% |
| Cheyenne | 35 | 0.0% |
| Chickasaw | 305 | 0.0% |
| Chilean | 2,334 | 0.1% |
| Chinese | 133 | 0.0% |
| Chippewa | 457 | 0.0% |
| Choctaw | 1,480 | 0.1% |
| Colombian | 4,842 | 0.2% |
| Colville | 1 | 0.0% |
| Comanche | 69 | 0.0% |
| Costa Rican | 1,316 | 0.1% |
| Cree | 85 | 0.0% |
| Creek | 306 | 0.0% |
| Croatian | 2,880 | 0.1% |
| Crow | 154 | 0.0% |
| Cuban | 4,265 | 0.2% |
| Cypriot | 36 | 0.0% |
| Czech | 4,265 | 0.2% |
| Czechoslovakian | 965 | 0.0% |
| Danish | 6,907 | 0.3% |
| Delaware | 85 | 0.0% |
| Dominican | 1,069 | 0.1% |
| Dutch | 11,423 | 0.5% |
| Dutch West Indian | 145 | 0.0% |
| Eastern European | 8,621 | 0.4% |
| Ecuadorian | 1,157 | 0.1% |
| Egyptian | 2,209 | 0.1% |
| English | 101,143 | 4.7% |
| Estonian | 124 | 0.0% |
| Ethiopian | 9,017 | 0.4% |
| European | 37,826 | 1.8% |
| Fijian | 77 | 0.0% |
| Filipino | 13,721 | 0.6% |
| Finnish | 3,234 | 0.2% |
| French | 28,453 | 1.3% |
| French American Indian | 71 | 0.0% |
| French Canadian | 3,704 | 0.2% |
| German | 114,383 | 5.3% |
| German Russian | 49 | 0.0% |
| Ghanaian | 1,040 | 0.1% |
| Greek | 6,810 | 0.3% |
| Guamanian / Chamorro | 3,087 | 0.1% |
| Guatemalan | 27,723 | 1.3% |
| Guyanese | 376 | 0.0% |
| Haitian | 1,146 | 0.1% |
| Honduran | 7,718 | 0.4% |
| Hopi | 108 | 0.0% |
| Hungarian | 5,289 | 0.2% |
| Icelander | 316 | 0.0% |
| Indian (Asian) | 305,718 | 14.1% |
| Indonesian | 4,132 | 0.2% |
| Inupiat | 194 | 0.0% |
| Iranian | 9,587 | 0.4% |
| Iraqi | 639 | 0.0% |
| Irish | 109,587 | 5.1% |
| Iroquois | 315 | 0.0% |
| Israeli | 734 | 0.0% |
| Italian | 60,950 | 2.8% |
| Jamaican | 2,602 | 0.1% |
| Japanese | 7,920 | 0.4% |
| Jordanian | 729 | 0.0% |
| Kenyan | 1,116 | 0.1% |
| Kiowa | 48 | 0.0% |
| Korean | 149,258 | 6.9% |
| Laotian | 3,780 | 0.2% |
| Latvian | 802 | 0.0% |
| Lebanese | 2,904 | 0.1% |
| Liberian | 414 | 0.0% |
| Lithuanian | 3,408 | 0.2% |
| Lumbee | 17 | 0.0% |
| Luxembourger | 88 | 0.0% |
| Macedonian | 190 | 0.0% |
| Malaysian | 5,497 | 0.3% |
| Maltese | 736 | 0.0% |
| Mexican | 336,227 | 15.6% |
| Mexican American Indian | 7,386 | 0.3% |
| Mongolian | 931 | 0.0% |
| Moroccan | 1,225 | 0.1% |
| Native Hawaiian | 7,089 | 0.3% |
| Navajo | 1,417 | 0.1% |
| Nepalese | 1,228 | 0.1% |
| New Zealander | 557 | 0.0% |
| Nicaraguan | 12,926 | 0.6% |
| Nigerian | 5,986 | 0.3% |
| Northern European | 4,634 | 0.2% |
| Norwegian | 15,449 | 0.7% |
| Okinawan | 566 | 0.0% |
| Osage | 40 | 0.0% |
| Ottawa | 38 | 0.0% |
| Paiute | 212 | 0.0% |
| Pakistani | 4,741 | 0.2% |
| Palestinian | 1,625 | 0.1% |
| Panamanian | 1,353 | 0.1% |
| Paraguayan | 10 | 0.0% |
| Pennsylvania German | 284 | 0.0% |
| Peruvian | 8,646 | 0.4% |
| Pima | 22 | 0.0% |
| Polish | 24,362 | 1.1% |
| Portuguese | 21,581 | 1.0% |
| Potawatomi | 50 | 0.0% |
| Pueblo | 276 | 0.0% |
| Puerto Rican | 14,541 | 0.7% |
| Puget Sound Salish | 9 | 0.0% |
| Romanian | 3,136 | 0.2% |
| Russian | 21,000 | 1.0% |
| Salvadoran | 45,804 | 2.1% |
| Samoan | 5,901 | 0.3% |
| Scandinavian | 3,526 | 0.2% |
| Scotch-Irish | 8,627 | 0.4% |
| Scottish | 22,845 | 1.1% |
| Seminole | 333 | 0.0% |
| Senegalese | 207 | 0.0% |
| Serbian | 1,149 | 0.1% |
| Shoshone | 188 | 0.0% |
| Sierra Leonean | 305 | 0.0% |
| Sioux | 943 | 0.0% |
| Slavic | 529 | 0.0% |
| Slovak | 1,352 | 0.1% |
| Slovene | 1,000 | 0.1% |
| Somali | 26 | 0.0% |
| South African | 726 | 0.0% |
| South American | 21,949 | 1.0% |
| South American Indian | 629 | 0.0% |
| Soviet Union | 126 | 0.0% |
| Spaniard | 8,799 | 0.4% |
| Spanish | 7,112 | 0.3% |
| Spanish American | 208 | 0.0% |
| Spanish American Indian | 137 | 0.0% |
| Sri Lankan | 58,490 | 2.7% |
| Subsaharan African | 32,819 | 1.5% |
| Sudanese | 481 | 0.0% |
| Swedish | 15,327 | 0.7% |
| Swiss | 4,878 | 0.2% |
| Syrian | 863 | 0.0% |
| Taiwanese | 48 | 0.0% |
| Thai | 161,393 | 7.5% |
| Tlingit-Haida | 116 | 0.0% |
| Tohono O'Odham | 120 | 0.0% |
| Tongan | 3,737 | 0.2% |
| Trinidadian and Tobagonian | 357 | 0.0% |
| Tsimshian | 100 | 0.0% |
| Turkish | 3,011 | 0.1% |
| U.S. Virgin Islander | 20 | 0.0% |
| Ugandan | 107 | 0.0% |
| Ukrainian | 7,332 | 0.3% |
| Uruguayan | 441 | 0.0% |
| Ute | 87 | 0.0% |
| Venezuelan | 1,080 | 0.1% |
| Vietnamese | 1,165 | 0.1% |
| Welsh | 6,777 | 0.3% |
| West Indian | 634 | 0.0% |
| Yakama | 16 | 0.0% |
| Yaqui | 454 | 0.0% |
| Yugoslavian | 896 | 0.0% |
| Yuman | 14 | 0.0% |
| Yup'ik | 39 | 0.0% |
| Zimbabwean | 96 | 0.0% | View All 195 Rows |
Immigrants in Area Code 510
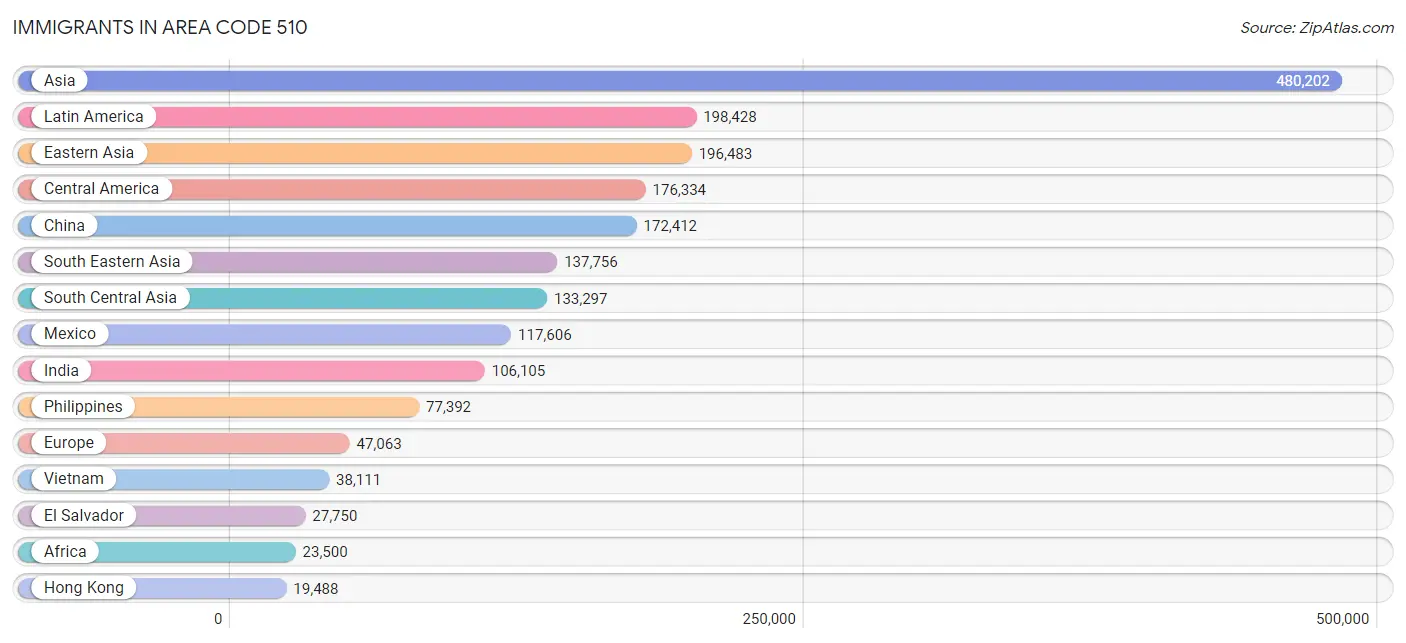
The most numerous immigrant groups reported in Area Code 510 came from Asia (480,202 | 22.2%), Latin America (198,428 | 9.2%), Eastern Asia (196,483 | 9.1%), Central America (176,334 | 8.2%), and China (172,412 | 8.0%), together accounting for 56.7% of all Area Code 510 residents.
| Immigration Origin | # Population | % Population |
| Afghanistan | 6,963 | 0.3% |
| Africa | 23,500 | 1.1% |
| Albania | 180 | 0.0% |
| Argentina | 1,590 | 0.1% |
| Armenia | 544 | 0.0% |
| Asia | 480,202 | 22.2% |
| Australia | 1,468 | 0.1% |
| Austria | 505 | 0.0% |
| Azores | 333 | 0.0% |
| Bahamas | 137 | 0.0% |
| Bangladesh | 1,992 | 0.1% |
| Barbados | 87 | 0.0% |
| Belarus | 865 | 0.0% |
| Belgium | 923 | 0.0% |
| Belize | 303 | 0.0% |
| Bolivia | 247 | 0.0% |
| Bosnia and Herzegovina | 306 | 0.0% |
| Brazil | 4,057 | 0.2% |
| Bulgaria | 657 | 0.0% |
| Cabo Verde | 11 | 0.0% |
| Cambodia | 3,353 | 0.2% |
| Cameroon | 219 | 0.0% |
| Canada | 9,043 | 0.4% |
| Caribbean | 3,733 | 0.2% |
| Central America | 176,334 | 8.2% |
| Chile | 1,140 | 0.1% |
| China | 172,412 | 8.0% |
| Colombia | 3,204 | 0.2% |
| Congo | 93 | 0.0% |
| Costa Rica | 660 | 0.0% |
| Croatia | 581 | 0.0% |
| Cuba | 1,086 | 0.1% |
| Czechoslovakia | 568 | 0.0% |
| Denmark | 387 | 0.0% |
| Dominica | 35 | 0.0% |
| Dominican Republic | 412 | 0.0% |
| Eastern Africa | 9,738 | 0.4% |
| Eastern Asia | 196,483 | 9.1% |
| Eastern Europe | 16,774 | 0.8% |
| Ecuador | 433 | 0.0% |
| Egypt | 1,353 | 0.1% |
| El Salvador | 27,750 | 1.3% |
| England | 2,568 | 0.1% |
| Eritrea | 3,006 | 0.1% |
| Ethiopia | 4,078 | 0.2% |
| Europe | 47,063 | 2.2% |
| Fiji | 4,424 | 0.2% |
| France | 4,894 | 0.2% |
| Germany | 5,148 | 0.2% |
| Ghana | 740 | 0.0% |
| Greece | 640 | 0.0% |
| Grenada | 49 | 0.0% |
| Guatemala | 17,670 | 0.8% |
| Guyana | 215 | 0.0% |
| Haiti | 205 | 0.0% |
| Honduras | 5,051 | 0.2% |
| Hong Kong | 19,488 | 0.9% |
| Hungary | 282 | 0.0% |
| India | 106,105 | 4.9% |
| Indonesia | 3,656 | 0.2% |
| Iran | 6,728 | 0.3% |
| Iraq | 609 | 0.0% |
| Ireland | 1,340 | 0.1% |
| Israel | 1,624 | 0.1% |
| Italy | 2,246 | 0.1% |
| Jamaica | 1,192 | 0.1% |
| Japan | 7,377 | 0.3% |
| Jordan | 656 | 0.0% |
| Kazakhstan | 449 | 0.0% |
| Kenya | 1,248 | 0.1% |
| Korea | 15,687 | 0.7% |
| Kuwait | 469 | 0.0% |
| Laos | 2,701 | 0.1% |
| Latin America | 198,428 | 9.2% |
| Latvia | 114 | 0.0% |
| Lebanon | 1,020 | 0.1% |
| Liberia | 593 | 0.0% |
| Lithuania | 122 | 0.0% |
| Malaysia | 2,489 | 0.1% |
| Mexico | 117,606 | 5.4% |
| Middle Africa | 527 | 0.0% |
| Moldova | 681 | 0.0% |
| Morocco | 691 | 0.0% |
| Nepal | 3,024 | 0.1% |
| Netherlands | 890 | 0.0% |
| Nicaragua | 6,653 | 0.3% |
| Nigeria | 4,431 | 0.2% |
| North Macedonia | 106 | 0.0% |
| Northern Africa | 4,268 | 0.2% |
| Northern Europe | 10,401 | 0.5% |
| Norway | 290 | 0.0% |
| Oceania | 9,550 | 0.4% |
| Pakistan | 6,256 | 0.3% |
| Panama | 606 | 0.0% |
| Peru | 5,899 | 0.3% |
| Philippines | 77,392 | 3.6% |
| Poland | 1,423 | 0.1% |
| Portugal | 1,590 | 0.1% |
| Romania | 942 | 0.0% |
| Russia | 5,166 | 0.2% |
| Saudi Arabia | 675 | 0.0% |
| Scotland | 213 | 0.0% |
| Senegal | 316 | 0.0% |
| Serbia | 150 | 0.0% |
| Sierra Leone | 302 | 0.0% |
| Singapore | 1,610 | 0.1% |
| Somalia | 52 | 0.0% |
| South Africa | 914 | 0.0% |
| South America | 18,361 | 0.9% |
| South Central Asia | 133,297 | 6.2% |
| South Eastern Asia | 137,756 | 6.4% |
| Southern Europe | 6,317 | 0.3% |
| Spain | 1,785 | 0.1% |
| Sri Lanka | 1,195 | 0.1% |
| St. Vincent and the Grenadines | 11 | 0.0% |
| Sudan | 553 | 0.0% |
| Sweden | 726 | 0.0% |
| Switzerland | 883 | 0.0% |
| Syria | 447 | 0.0% |
| Taiwan | 18,495 | 0.9% |
| Thailand | 3,736 | 0.2% |
| Trinidad and Tobago | 340 | 0.0% |
| Turkey | 1,512 | 0.1% |
| Uganda | 325 | 0.0% |
| Ukraine | 3,045 | 0.1% |
| Uruguay | 250 | 0.0% |
| Uzbekistan | 300 | 0.0% |
| Venezuela | 1,182 | 0.1% |
| Vietnam | 38,111 | 1.8% |
| West Indies | 1 | 0.0% |
| Western Africa | 7,173 | 0.3% |
| Western Asia | 11,866 | 0.5% |
| Western Europe | 13,243 | 0.6% |
| Yemen | 3,368 | 0.2% |
| Zaire | 154 | 0.0% |
| Zimbabwe | 372 | 0.0% | View All 136 Rows |
Sex and Age in Area Code 510
Sex and Age in Area Code 510
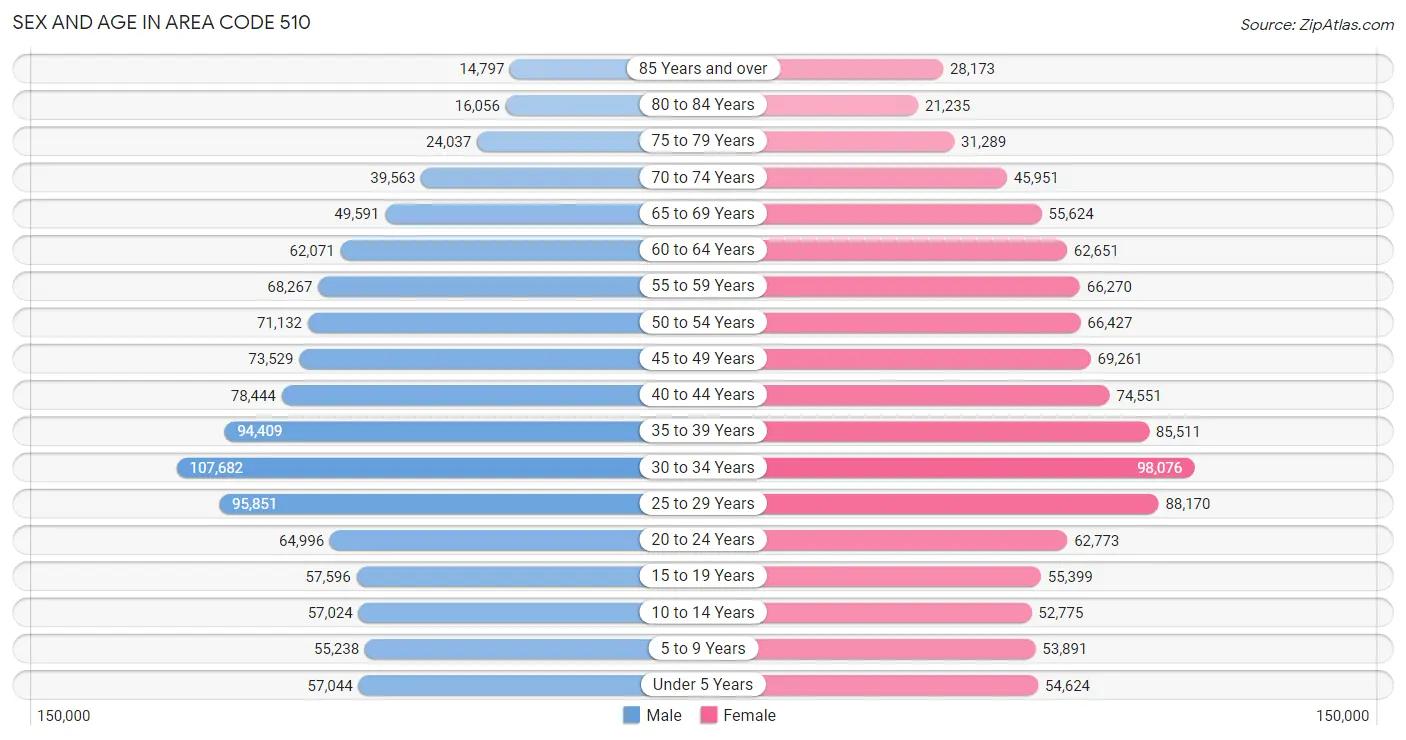
The most populous age groups in Area Code 510 are 30 to 34 Years (107,682 | 9.9%) for men and 30 to 34 Years (98,076 | 9.1%) for women.
| Age Bracket | Male | Female |
| Under 5 Years | 57,044 (5.2%) | 54,624 (5.1%) |
| 5 to 9 Years | 55,238 (5.1%) | 53,891 (5.0%) |
| 10 to 14 Years | 57,024 (5.2%) | 52,775 (4.9%) |
| 15 to 19 Years | 57,596 (5.3%) | 55,399 (5.2%) |
| 20 to 24 Years | 64,996 (6.0%) | 62,773 (5.9%) |
| 25 to 29 Years | 95,851 (8.8%) | 88,170 (8.2%) |
| 30 to 34 Years | 107,682 (9.9%) | 98,076 (9.1%) |
| 35 to 39 Years | 94,409 (8.7%) | 85,511 (8.0%) |
| 40 to 44 Years | 78,444 (7.2%) | 74,551 (7.0%) |
| 45 to 49 Years | 73,529 (6.8%) | 69,261 (6.5%) |
| 50 to 54 Years | 71,132 (6.5%) | 66,427 (6.2%) |
| 55 to 59 Years | 68,267 (6.3%) | 66,270 (6.2%) |
| 60 to 64 Years | 62,071 (5.7%) | 62,651 (5.8%) |
| 65 to 69 Years | 49,591 (4.6%) | 55,624 (5.2%) |
| 70 to 74 Years | 39,563 (3.6%) | 45,951 (4.3%) |
| 75 to 79 Years | 24,037 (2.2%) | 31,289 (2.9%) |
| 80 to 84 Years | 16,056 (1.5%) | 21,235 (2.0%) |
| 85 Years and over | 14,797 (1.4%) | 28,173 (2.6%) |
| Total | 1,087,327 (100.0%) | 1,072,651 (100.0%) |
Families and Households in Area Code 510
Median Family Size in Area Code 510
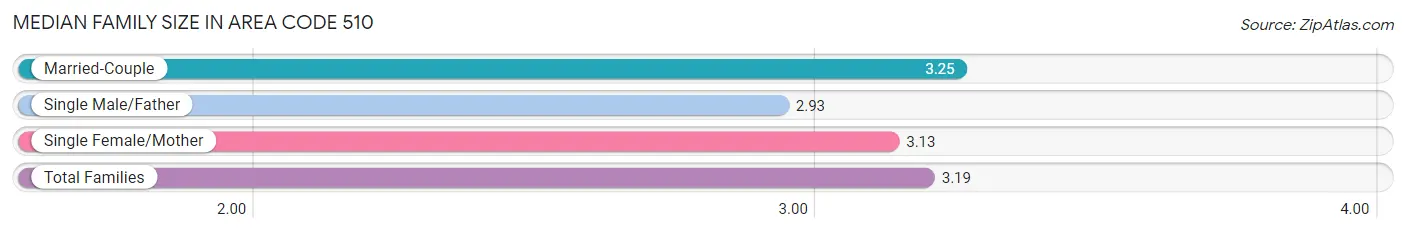
The median family size in Area Code 510 is 3.19 persons per family, with married-couple families (360,226 | 74.3%) accounting for the largest median family size of 3.24985 persons per family. On the other hand, single male/father families (39,859 | 8.2%) represent the smallest median family size with 2.93 persons per family.
| Family Type | # Families | Family Size |
| Married-Couple | 360,226 (74.3%) | 3.25 |
| Single Male/Father | 39,859 (8.2%) | 2.93 |
| Single Female/Mother | 84,974 (17.5%) | 3.13 |
| Total Families | 485,059 (100.0%) | 3.19 |
Median Household Size in Area Code 510
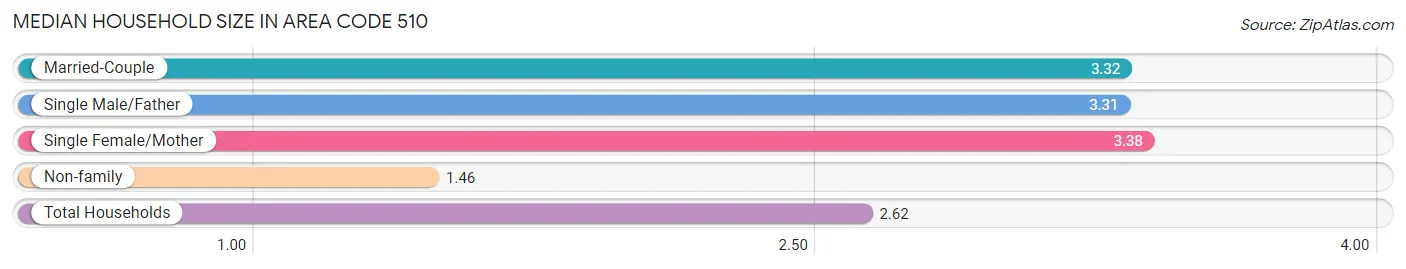
The median household size in Area Code 510 is 2.62 persons per household, with single female/mother households (84,974 | 10.7%) accounting for the largest median household size of 3.37911 persons per household. non-family households (306,404 | 38.7%) represent the smallest median household size with 1.46 persons per household.
| Household Type | # Households | Household Size |
| Married-Couple | 360,226 (45.5%) | 3.32 |
| Single Male/Father | 39,859 (5.0%) | 3.31 |
| Single Female/Mother | 84,974 (10.7%) | 3.38 |
| Non-family | 306,404 (38.7%) | 1.46 |
| Total Households | 791,463 (100.0%) | 2.62 |
Household Size by Marriage Status in Area Code 510
Out of a total of 791,463 households in Area Code 510, 485,059 (61.3%) are family households, while 306,404 (38.7%) are nonfamily households. The most numerous type of family households are 2-person households, comprising 184,896, and the most common type of nonfamily households are 1-person households, comprising 222,074.
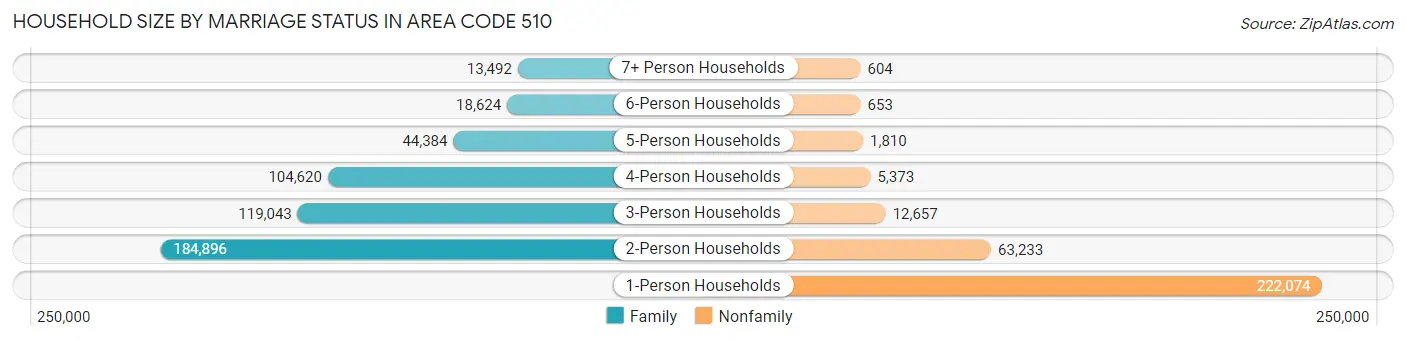
| Household Size | Family Households | Nonfamily Households |
| 1-Person Households | - | 222,074 (28.1%) |
| 2-Person Households | 184,896 (23.4%) | 63,233 (8.0%) |
| 3-Person Households | 119,043 (15.0%) | 12,657 (1.6%) |
| 4-Person Households | 104,620 (13.2%) | 5,373 (0.7%) |
| 5-Person Households | 44,384 (5.6%) | 1,810 (0.2%) |
| 6-Person Households | 18,624 (2.4%) | 653 (0.1%) |
| 7+ Person Households | 13,492 (1.7%) | 604 (0.1%) |
| Total | 485,059 (61.3%) | 306,404 (38.7%) |
Female Fertility in Area Code 510
Fertility by Age in Area Code 510
Average fertility rate in Area Code 510 is 45.7 births per 1,000 women. Women in the age bracket of 20 to 34 years have the highest fertility rate with 59.7 births per 1,000 women. Women in the age bracket of 20 to 34 years acount for 56.1% of all women with births.
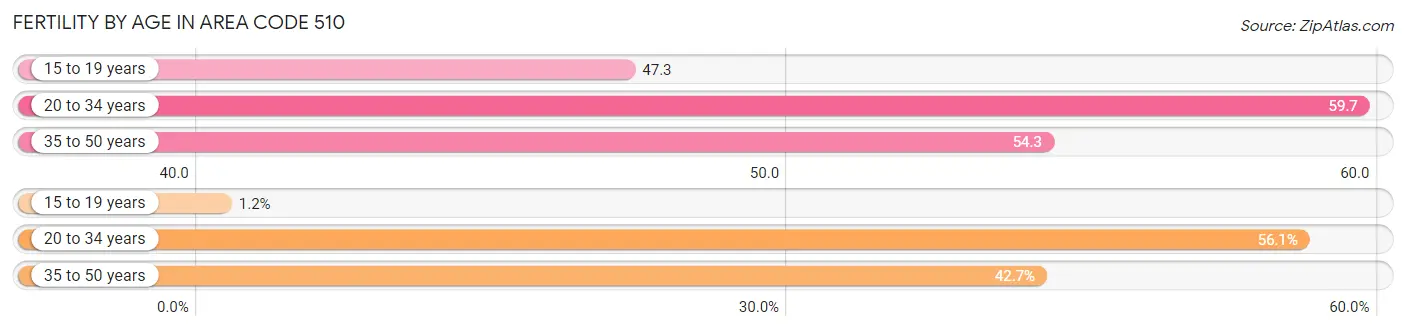
| Age Bracket | Women with Births | Births / 1,000 Women |
| 15 to 19 years | 312 (1.2%) | 47.2 |
| 20 to 34 years | 14,420 (56.1%) | 59.7 |
| 35 to 50 years | 10,980 (42.7%) | 54.3 |
| Total | 25,712 (100.0%) | 45.7 |
Fertility by Age by Marriage Status in Area Code 510
72.9% of women with births (25,712) in Area Code 510 are married. The highest percentage of unmarried women with births falls into 15 to 19 years age bracket with 100.0% of them unmarried at the time of birth, while the lowest percentage of unmarried women with births belong to 35 to 50 years age bracket with 22.3% of them unmarried.
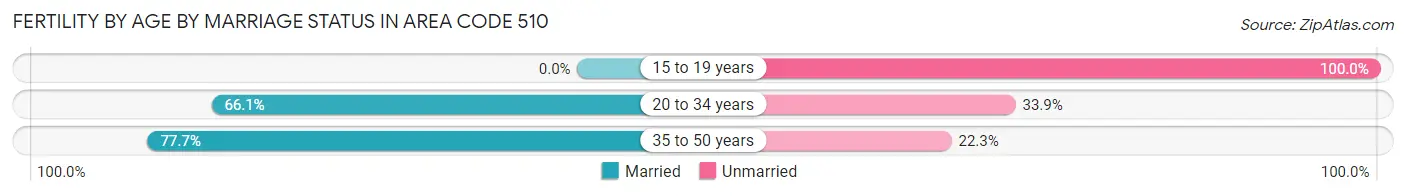
| Age Bracket | Married | Unmarried |
| 15 to 19 years | 0 (0.0%) | 312 (100.0%) |
| 20 to 34 years | 9,537 (66.1%) | 4,883 (33.9%) |
| 35 to 50 years | 8,535 (77.7%) | 2,445 (22.3%) |
| Total | 18,733 (72.9%) | 6,979 (27.1%) |
Fertility by Education in Area Code 510
Average fertility rate in Area Code 510 is 45.7 births per 1,000 women. Women with the education attainment of graduate degree have the highest fertility rate of 76.8 births per 1,000 women, while women with the education attainment of less than high school have the lowest fertility at 41.4 births per 1,000 women. Women with the education attainment of graduate degree represent 30.4% of all women with births.
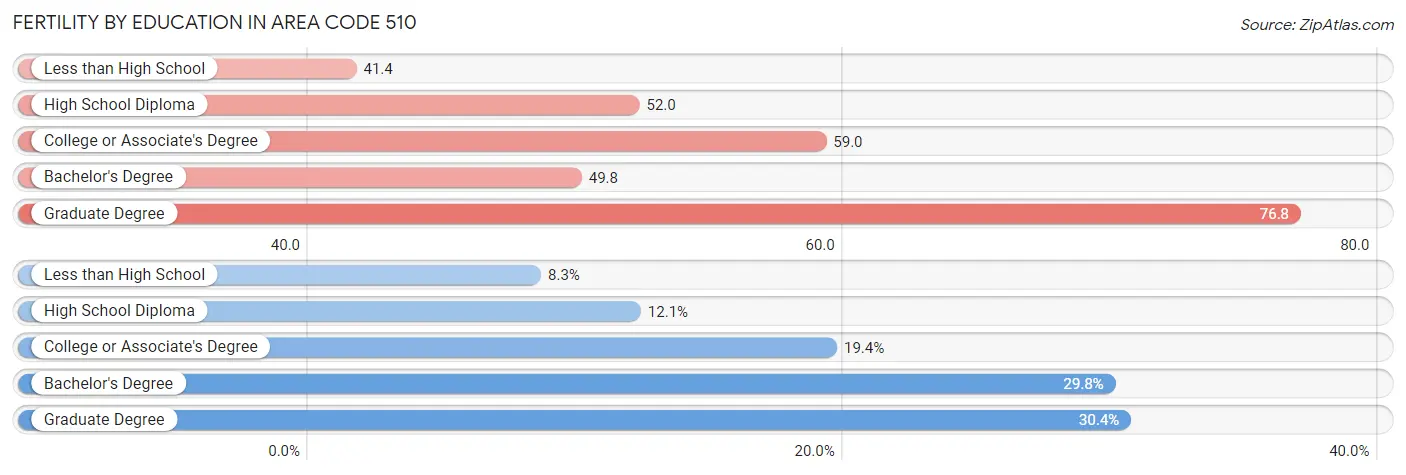
| Educational Attainment | Women with Births | Births / 1,000 Women |
| Less than High School | 2,137 (8.3%) | 41.4 |
| High School Diploma | 3,098 (12.0%) | 52.0 |
| College or Associate's Degree | 4,988 (19.4%) | 59.0 |
| Bachelor's Degree | 7,671 (29.8%) | 49.8 |
| Graduate Degree | 7,818 (30.4%) | 76.8 |
| Total | 25,712 (100.0%) | 45.7 |
Fertility by Education by Marriage Status in Area Code 510
27.1% of women with births in Area Code 510 are unmarried. Women with the educational attainment of graduate degree are most likely to be married with 76.9% of them married at childbirth, while women with the educational attainment of high school diploma are least likely to be married with 67.4% of them unmarried at childbirth.
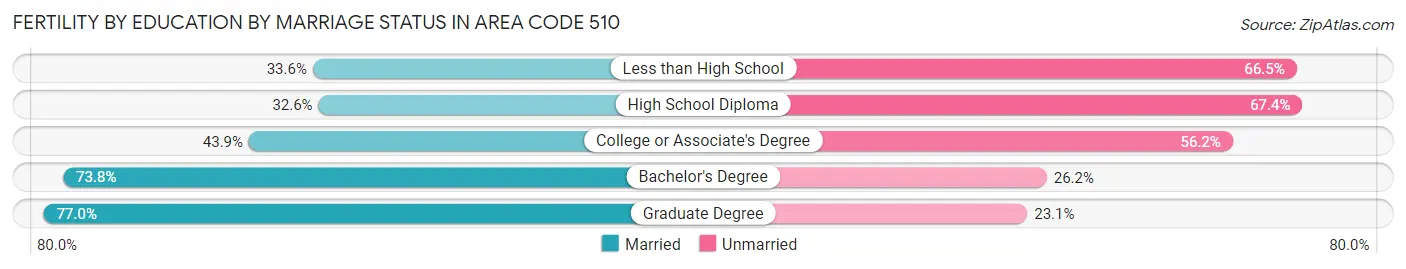
| Educational Attainment | Married | Unmarried |
| Less than High School | 717 (33.6%) | 1,420 (66.4%) |
| High School Diploma | 1,011 (32.6%) | 2,087 (67.4%) |
| College or Associate's Degree | 2,187 (43.9%) | 2,801 (56.1%) |
| Bachelor's Degree | 5,661 (73.8%) | 2,010 (26.2%) |
| Graduate Degree | 6,016 (76.9%) | 1,802 (23.1%) |
| Total | 18,733 (72.9%) | 6,979 (27.1%) |
Employment Characteristics in Area Code 510
Employment by Class of Employer in Area Code 510
Among the 1,108,045 employed individuals in Area Code 510, private company employees (759,538 | 68.5%), not-for-profit organizations (100,496 | 9.1%), and local government employees (76,967 | 7.0%) make up the most common classes of employment.
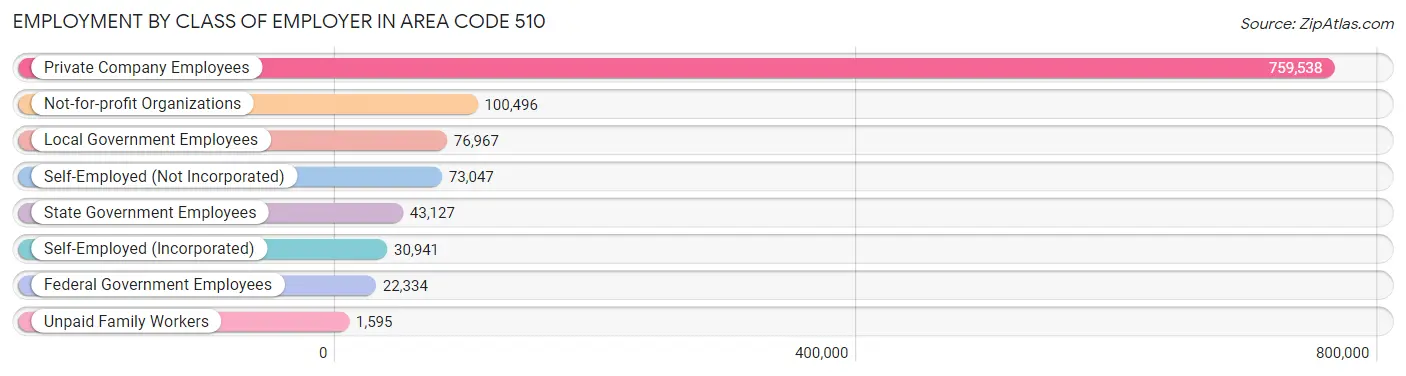
| Employer Class | # Employees | % Employees |
| Private Company Employees | 759,538 | 68.5% |
| Self-Employed (Incorporated) | 30,941 | 2.8% |
| Self-Employed (Not Incorporated) | 73,047 | 6.6% |
| Not-for-profit Organizations | 100,496 | 9.1% |
| Local Government Employees | 76,967 | 7.0% |
| State Government Employees | 43,127 | 3.9% |
| Federal Government Employees | 22,334 | 2.0% |
| Unpaid Family Workers | 1,595 | 0.1% |
| Total | 1,108,045 | 100.0% |
Employment Status by Age in Area Code 510
According to the labor force statistics for Area Code 510, out of the total population over 16 years of age (1,808,241), 66.3% or 1,198,140 individuals are in the labor force, with 6.1% or 73,686 of them unemployed. The age group with the highest labor force participation rate is 25 to 29 years, with 86.7% or 159,620 individuals in the labor force. Within the labor force, the 16 to 19 years age range has the highest percentage of unemployed individuals, with 1,059.2% or 299,658 of them being unemployed.
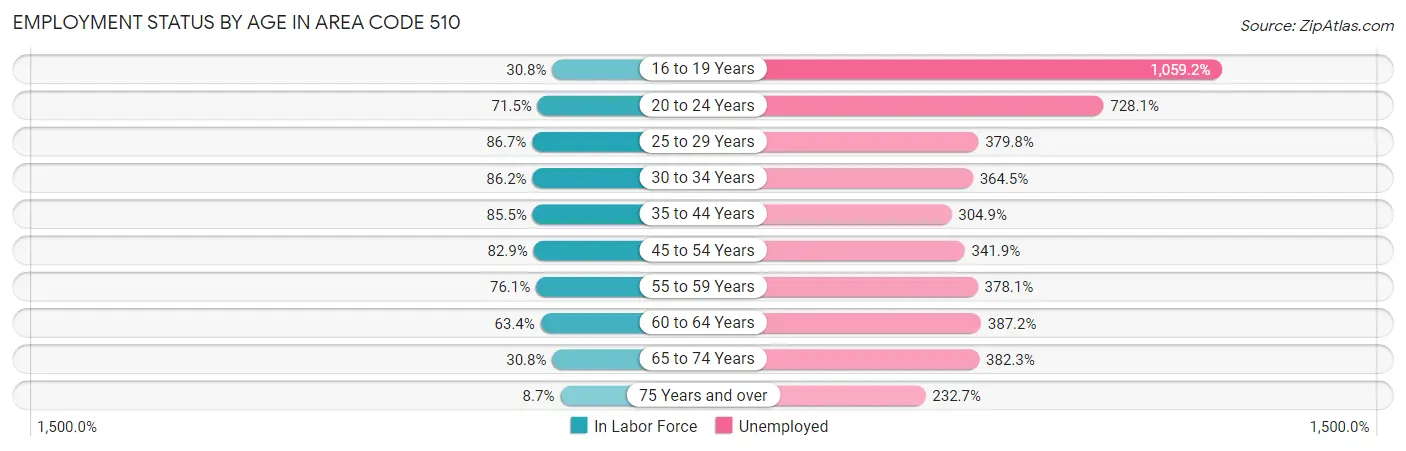
| Age Bracket | In Labor Force | Unemployed |
| 16 to 19 Years | 28,290 (30.8%) | 299,658 (1,059.2%) |
| 20 to 24 Years | 91,315 (71.5%) | 664,879 (728.1%) |
| 25 to 29 Years | 159,615 (86.7%) | 606,237 (379.8%) |
| 30 to 34 Years | 177,322 (86.2%) | 646,339 (364.5%) |
| 35 to 44 Years | 284,618 (85.5%) | 867,773 (304.9%) |
| 45 to 54 Years | 232,434 (82.9%) | 794,702 (341.9%) |
| 55 to 59 Years | 102,331 (76.1%) | 386,906 (378.1%) |
| 60 to 64 Years | 79,043 (63.4%) | 306,078 (387.2%) |
| 65 to 74 Years | 58,798 (30.8%) | 224,800 (382.3%) |
| 75 Years and over | 11,751 (8.7%) | 27,354 (232.7%) |
| Total | 1,198,140 (66.3%) | 73,634 (6.1%) |
Employment Status by Educational Attainment in Area Code 510
According to labor force statistics for Area Code 510, 81.8% of individuals (1,032,942) out of the total population between 25 and 64 years of age (1,262,302) are in the labor force, with 355.1% or 3,667,977 of them being unemployed. The group with the highest labor force participation rate are those with the educational attainment of bachelor's degree or higher, with 88.2% or 592,301 individuals in the labor force. Within the labor force, individuals with college / associate degree education have the highest percentage of unemployment, with 521.0% or 1,078,793 of them being unemployed.
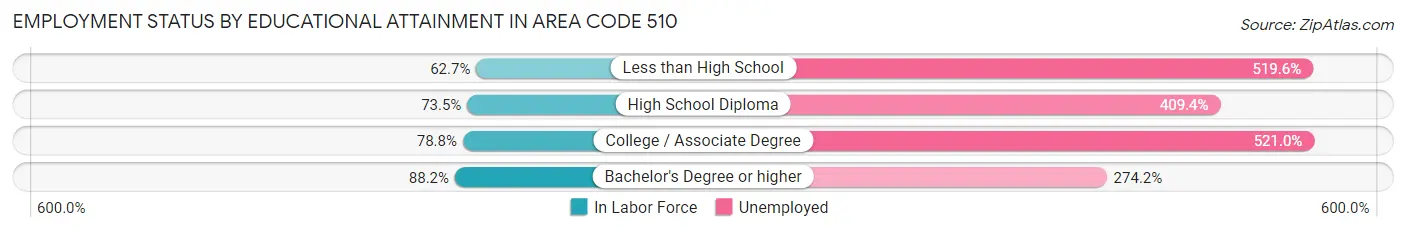
| Educational Attainment | In Labor Force | Unemployed |
| Less than High School | 83,918 (62.7%) | 695,188 (519.6%) |
| High School Diploma | 142,606 (73.5%) | 794,187 (409.4%) |
| College / Associate Degree | 207,069 (78.8%) | 1,369,719 (521.0%) |
| Bachelor's Degree or higher | 592,310 (88.2%) | 1,841,579 (274.2%) |
| Total | 1,032,906 (81.8%) | 4,482,434 (355.1%) |
Employment Occupations by Sex in Area Code 510
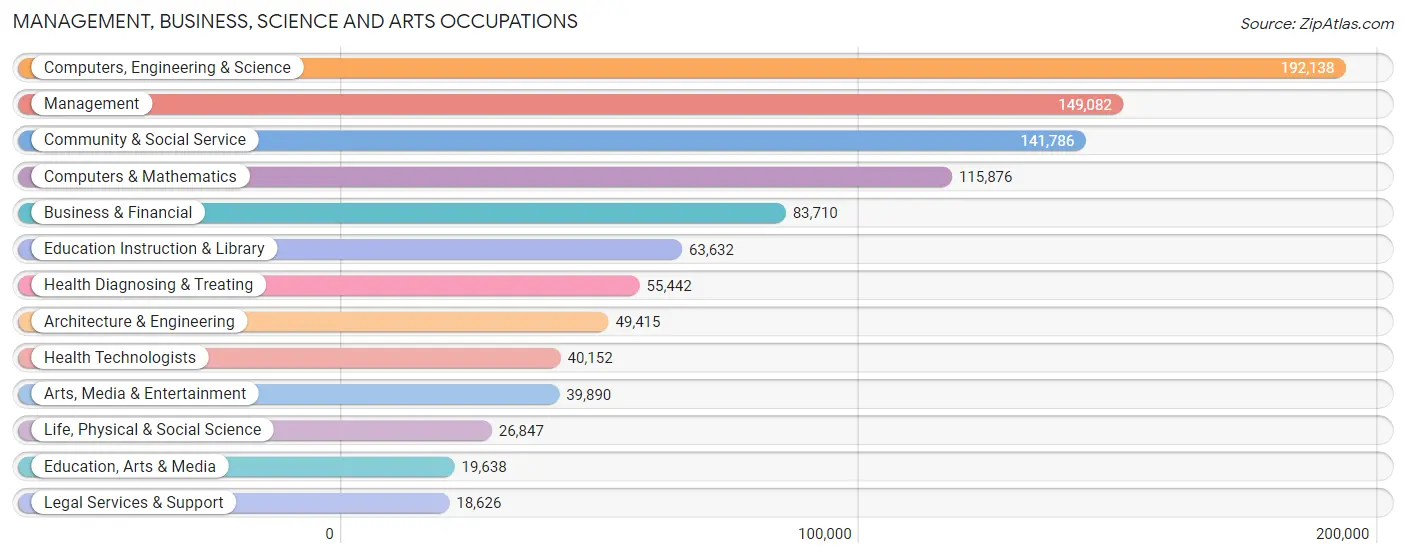
Management, Business, Science and Arts Occupations
The most common Management, Business, Science and Arts occupations in Area Code 510 are Computers, Engineering & Science (192,138 | 16.6%), Management (149,082 | 12.9%), Community & Social Service (141,786 | 12.2%), Computers & Mathematics (115,876 | 10.0%), and Business & Financial (83,710 | 7.2%).
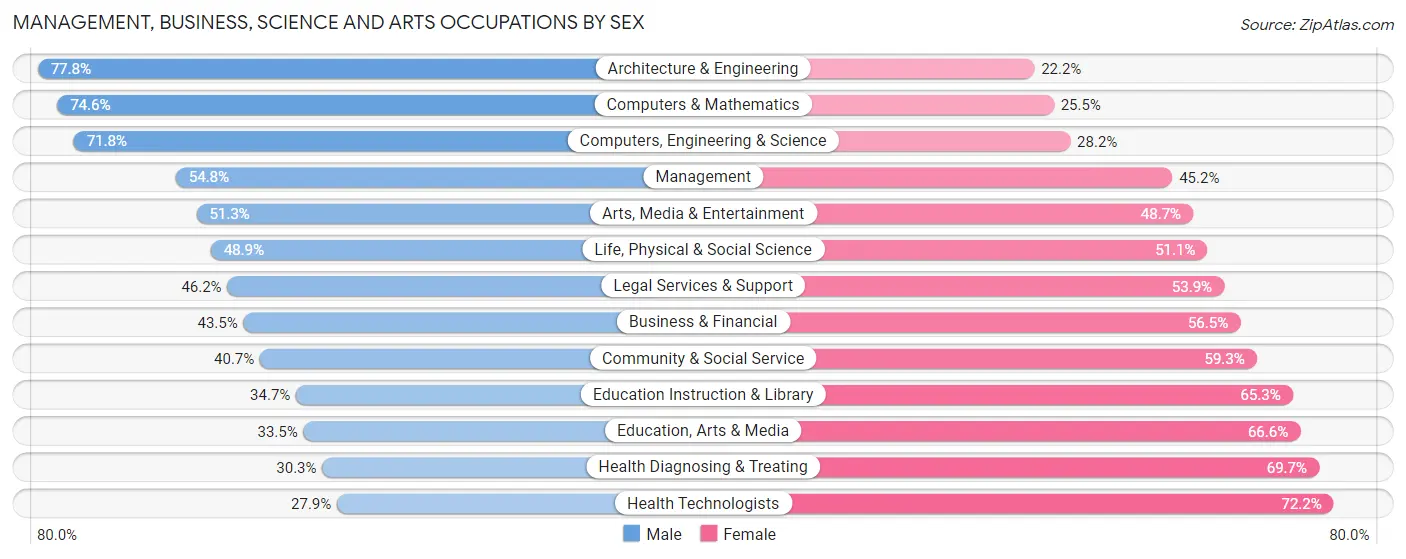
Management, Business, Science and Arts Occupations by Sex
Within the Management, Business, Science and Arts occupations in Area Code 510, the most male-oriented occupations are Architecture & Engineering (77.8%), Computers & Mathematics (74.6%), and Computers, Engineering & Science (71.8%), while the most female-oriented occupations are Health Technologists (72.2%), Health Diagnosing & Treating (69.7%), and Education, Arts & Media (66.5%).
| Occupation | Male | Female |
| Management | 81,631 (54.8%) | 67,451 (45.2%) |
| Business & Financial | 36,378 (43.5%) | 47,332 (56.5%) |
| Computers, Engineering & Science | 137,962 (71.8%) | 54,176 (28.2%) |
| Computers & Mathematics | 86,383 (74.6%) | 29,493 (25.5%) |
| Architecture & Engineering | 38,444 (77.8%) | 10,971 (22.2%) |
| Life, Physical & Social Science | 13,135 (48.9%) | 13,712 (51.1%) |
| Community & Social Service | 57,703 (40.7%) | 84,083 (59.3%) |
| Education, Arts & Media | 6,569 (33.5%) | 13,069 (66.5%) |
| Legal Services & Support | 8,596 (46.2%) | 10,030 (53.8%) |
| Education Instruction & Library | 22,067 (34.7%) | 41,565 (65.3%) |
| Arts, Media & Entertainment | 20,471 (51.3%) | 19,419 (48.7%) |
| Health Diagnosing & Treating | 16,804 (30.3%) | 38,638 (69.7%) |
| Health Technologists | 11,184 (27.9%) | 28,968 (72.2%) |
| Total (Category) | 330,478 (53.1%) | 291,680 (46.9%) |
| Total (Overall) | 625,777 (54.1%) | 531,410 (45.9%) |
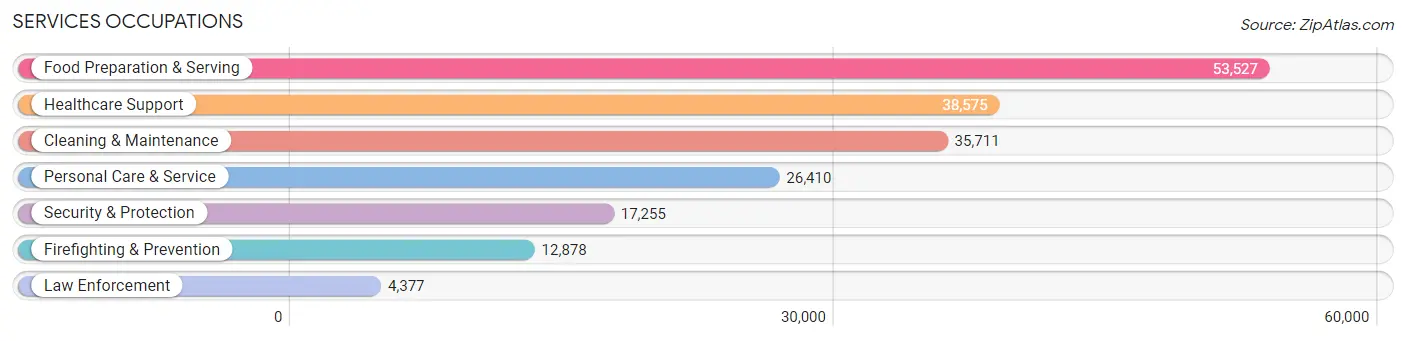
Services Occupations
The most common Services occupations in Area Code 510 are Food Preparation & Serving (53,527 | 4.6%), Healthcare Support (38,575 | 3.3%), Cleaning & Maintenance (35,711 | 3.1%), Personal Care & Service (26,410 | 2.3%), and Security & Protection (17,255 | 1.5%).
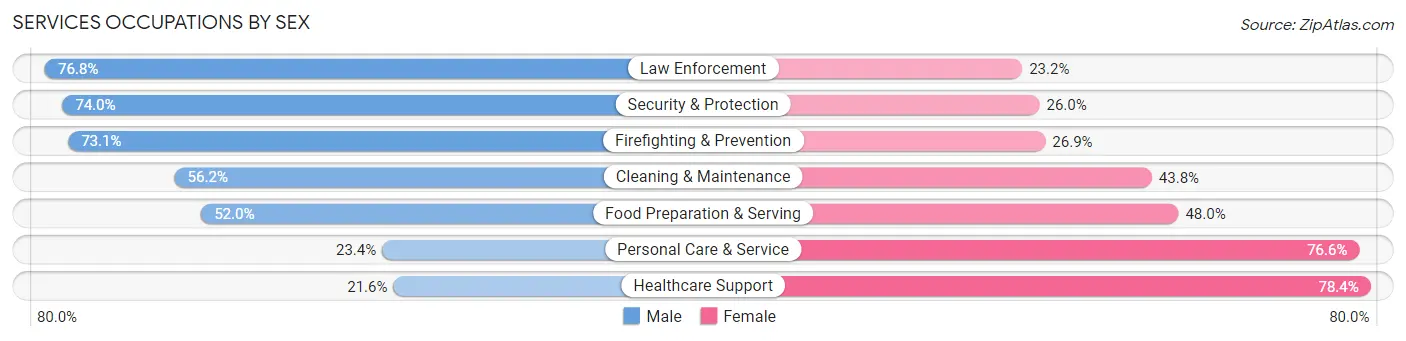
Services Occupations by Sex
Within the Services occupations in Area Code 510, the most male-oriented occupations are Law Enforcement (76.8%), Security & Protection (74.0%), and Firefighting & Prevention (73.1%), while the most female-oriented occupations are Healthcare Support (78.4%), Personal Care & Service (76.6%), and Food Preparation & Serving (48.0%).
| Occupation | Male | Female |
| Healthcare Support | 8,329 (21.6%) | 30,246 (78.4%) |
| Security & Protection | 12,772 (74.0%) | 4,483 (26.0%) |
| Firefighting & Prevention | 9,412 (73.1%) | 3,466 (26.9%) |
| Law Enforcement | 3,360 (76.8%) | 1,017 (23.2%) |
| Food Preparation & Serving | 27,839 (52.0%) | 25,688 (48.0%) |
| Cleaning & Maintenance | 20,075 (56.2%) | 15,636 (43.8%) |
| Personal Care & Service | 6,175 (23.4%) | 20,235 (76.6%) |
| Total (Category) | 75,190 (43.9%) | 96,288 (56.1%) |
| Total (Overall) | 625,777 (54.1%) | 531,410 (45.9%) |
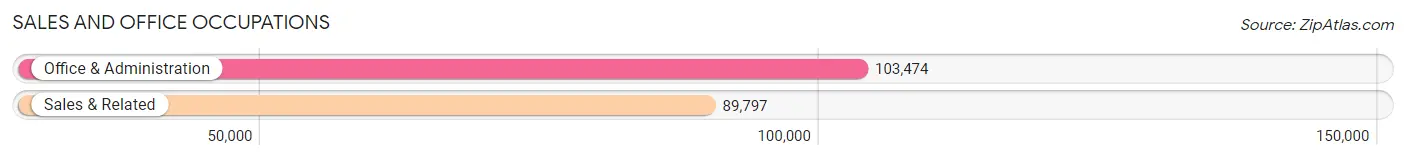
Sales and Office Occupations
The most common Sales and Office occupations in Area Code 510 are Office & Administration (103,474 | 8.9%), and Sales & Related (89,797 | 7.8%).
Sales and Office Occupations by Sex
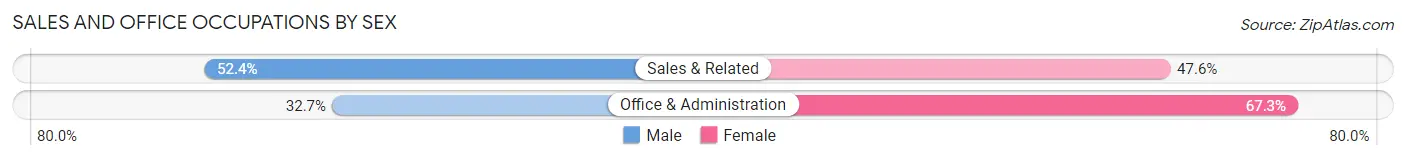
| Occupation | Male | Female |
| Sales & Related | 47,026 (52.4%) | 42,771 (47.6%) |
| Office & Administration | 33,862 (32.7%) | 69,612 (67.3%) |
| Total (Category) | 80,888 (41.8%) | 112,383 (58.2%) |
| Total (Overall) | 625,777 (54.1%) | 531,410 (45.9%) |
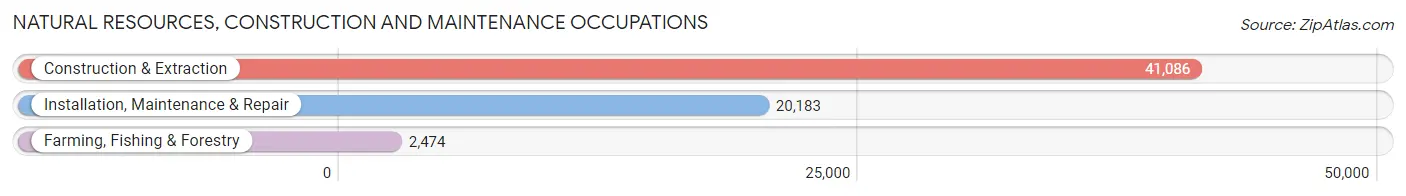
Natural Resources, Construction and Maintenance Occupations
The most common Natural Resources, Construction and Maintenance occupations in Area Code 510 are Construction & Extraction (41,086 | 3.5%), Installation, Maintenance & Repair (20,183 | 1.7%), and Farming, Fishing & Forestry (2,474 | 0.2%).
Natural Resources, Construction and Maintenance Occupations by Sex
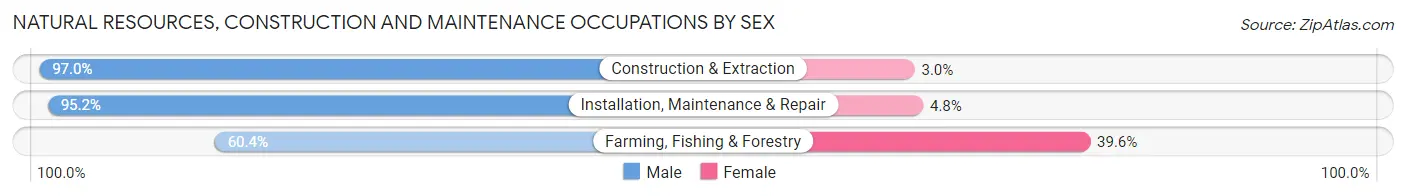
| Occupation | Male | Female |
| Farming, Fishing & Forestry | 1,495 (60.4%) | 979 (39.6%) |
| Construction & Extraction | 39,837 (97.0%) | 1,249 (3.0%) |
| Installation, Maintenance & Repair | 19,213 (95.2%) | 970 (4.8%) |
| Total (Category) | 60,545 (95.0%) | 3,198 (5.0%) |
| Total (Overall) | 625,777 (54.1%) | 531,410 (45.9%) |
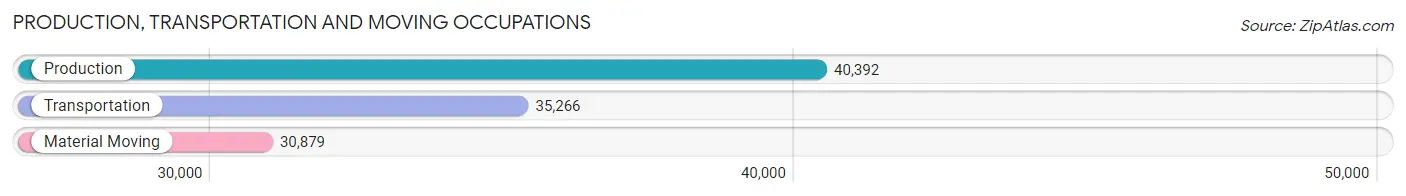
Production, Transportation and Moving Occupations
The most common Production, Transportation and Moving occupations in Area Code 510 are Production (40,392 | 3.5%), Transportation (35,266 | 3.0%), and Material Moving (30,879 | 2.7%).
Production, Transportation and Moving Occupations by Sex
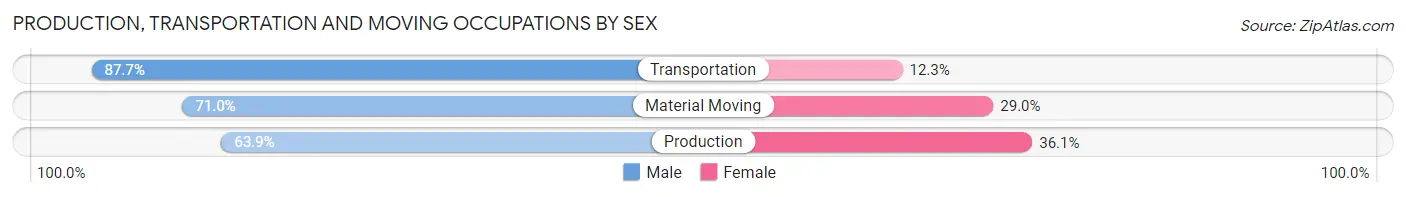
| Occupation | Male | Female |
| Production | 25,810 (63.9%) | 14,582 (36.1%) |
| Transportation | 30,931 (87.7%) | 4,335 (12.3%) |
| Material Moving | 21,935 (71.0%) | 8,944 (29.0%) |
| Total (Category) | 78,676 (73.9%) | 27,861 (26.2%) |
| Total (Overall) | 625,777 (54.1%) | 531,410 (45.9%) |
Employment Industries by Sex in Area Code 510
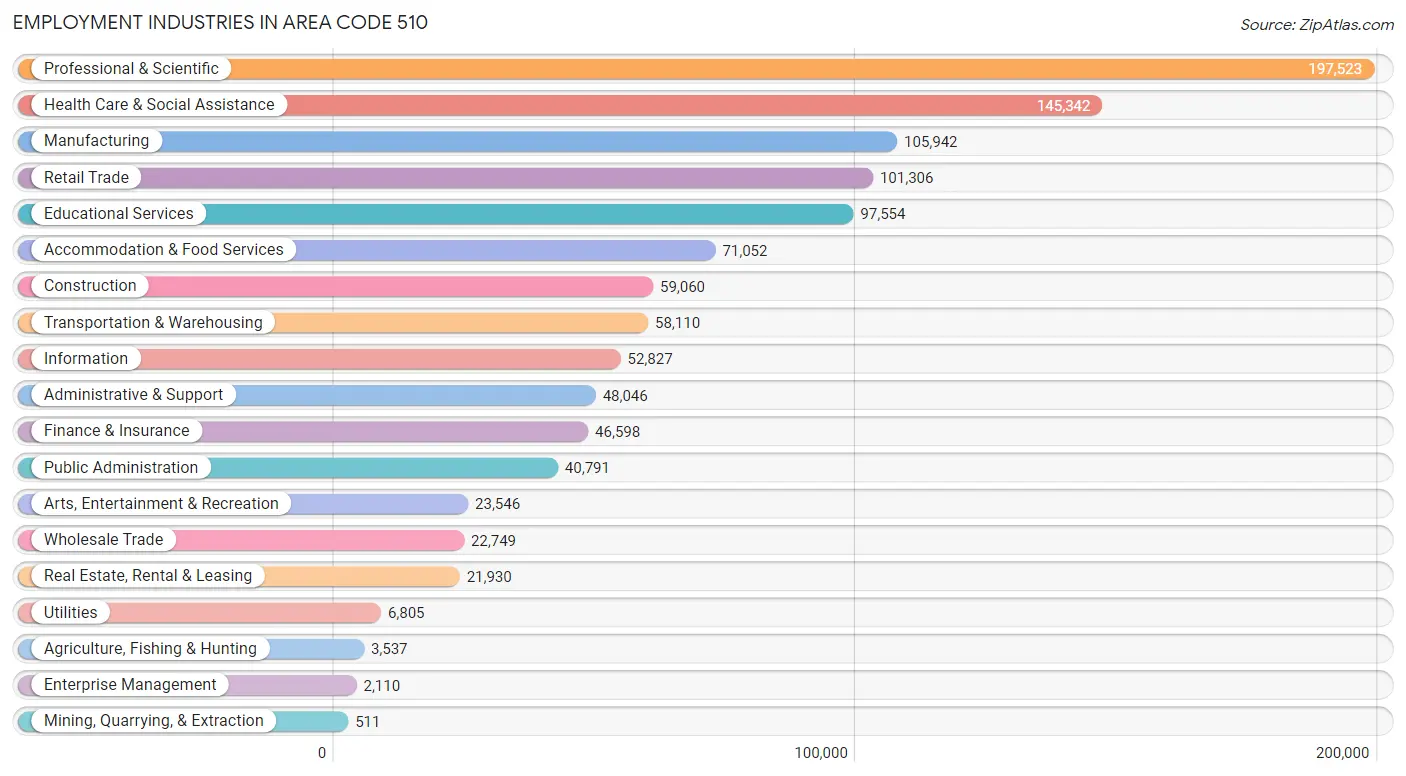
Employment Industries in Area Code 510
The major employment industries in Area Code 510 include Professional & Scientific (197,523 | 17.1%), Health Care & Social Assistance (145,342 | 12.6%), Manufacturing (105,942 | 9.2%), Retail Trade (101,306 | 8.7%), and Educational Services (97,554 | 8.4%).
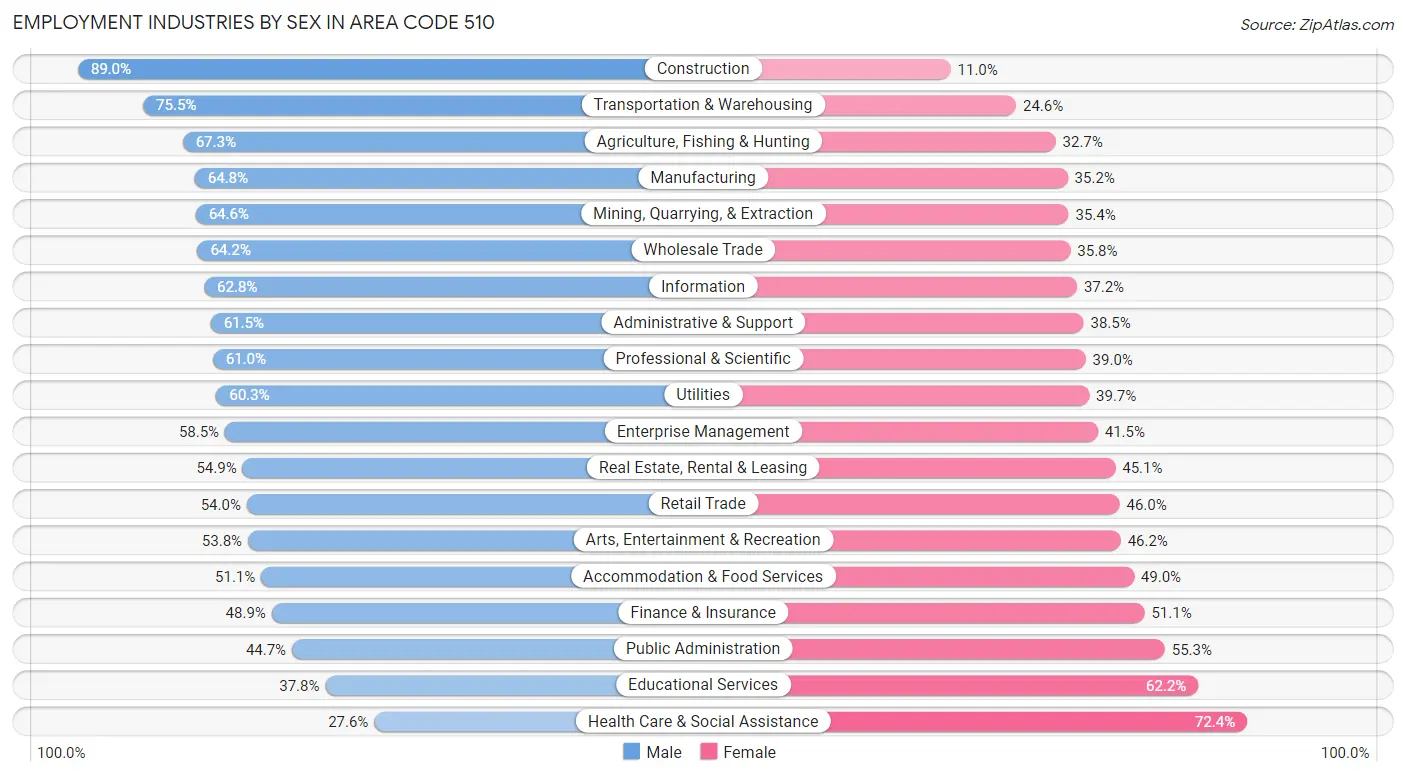
Employment Industries by Sex in Area Code 510
The Area Code 510 industries that see more men than women are Construction (89.0%), Transportation & Warehousing (75.4%), and Agriculture, Fishing & Hunting (67.3%), whereas the industries that tend to have a higher number of women are Health Care & Social Assistance (72.4%), Educational Services (62.2%), and Public Administration (55.3%).
| Industry | Male | Female |
| Agriculture, Fishing & Hunting | 2,379 (67.3%) | 1,158 (32.7%) |
| Mining, Quarrying, & Extraction | 330 (64.6%) | 181 (35.4%) |
| Construction | 52,556 (89.0%) | 6,504 (11.0%) |
| Manufacturing | 68,612 (64.8%) | 37,330 (35.2%) |
| Wholesale Trade | 14,607 (64.2%) | 8,142 (35.8%) |
| Retail Trade | 54,724 (54.0%) | 46,582 (46.0%) |
| Transportation & Warehousing | 43,844 (75.4%) | 14,266 (24.5%) |
| Utilities | 4,105 (60.3%) | 2,700 (39.7%) |
| Information | 33,199 (62.8%) | 19,628 (37.2%) |
| Finance & Insurance | 22,767 (48.9%) | 23,831 (51.1%) |
| Real Estate, Rental & Leasing | 12,039 (54.9%) | 9,891 (45.1%) |
| Professional & Scientific | 120,577 (61.0%) | 76,946 (39.0%) |
| Enterprise Management | 1,235 (58.5%) | 875 (41.5%) |
| Administrative & Support | 29,535 (61.5%) | 18,511 (38.5%) |
| Educational Services | 36,835 (37.8%) | 60,719 (62.2%) |
| Health Care & Social Assistance | 40,173 (27.6%) | 105,169 (72.4%) |
| Arts, Entertainment & Recreation | 12,663 (53.8%) | 10,883 (46.2%) |
| Accommodation & Food Services | 36,275 (51.0%) | 34,777 (48.9%) |
| Public Administration | 18,218 (44.7%) | 22,573 (55.3%) |
| Total | 625,777 (54.1%) | 531,410 (45.9%) |
Education in Area Code 510
School Enrollment in Area Code 510
The most common levels of schooling among the 485,951 students in Area Code 510 are college / undergraduate (127,308 | 26.2%), high school (92,457 | 19.0%), and elementary school (83,844 | 17.2%).
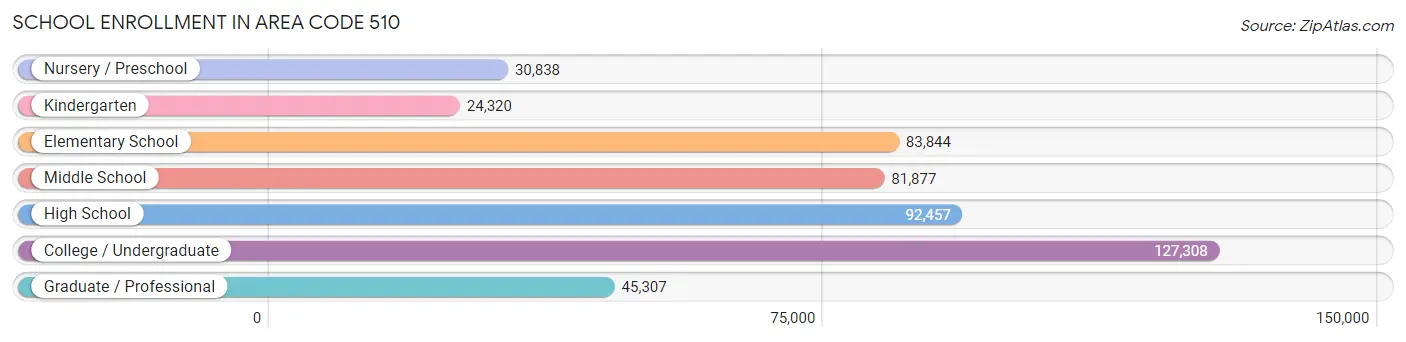
| School Level | # Students | % Students |
| Nursery / Preschool | 30,838 | 6.4% |
| Kindergarten | 24,320 | 5.0% |
| Elementary School | 83,844 | 17.2% |
| Middle School | 81,877 | 16.9% |
| High School | 92,457 | 19.0% |
| College / Undergraduate | 127,308 | 26.2% |
| Graduate / Professional | 45,307 | 9.3% |
| Total | 485,951 | 100.0% |
School Enrollment by Age by Funding Source in Area Code 510
Out of a total of 485,951 students who are enrolled in schools in Area Code 510, 88,235 (18.2%) attend a private institution, while the remaining 397,716 (81.8%) are enrolled in public schools. The age group of 3 to 4 year olds has the highest likelihood of being enrolled in private schools, with 15,106 (60.2% in the age bracket) enrolled. Conversely, the age group of 18 to 19 year olds has the lowest likelihood of being enrolled in a private school, with 35,346 (91.4% in the age bracket) attending a public institution.
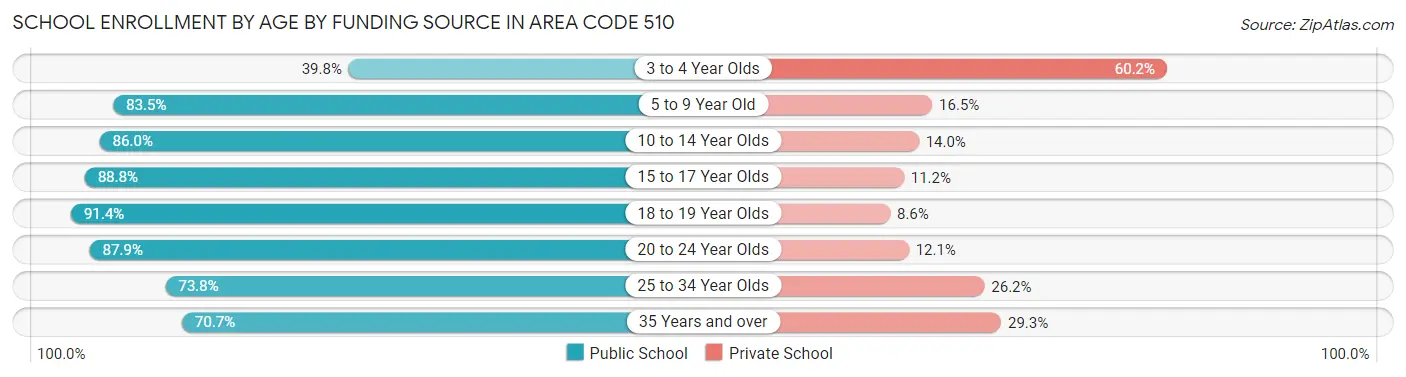
| Age Bracket | Public School | Private School |
| 3 to 4 Year Olds | 9,990 (39.8%) | 15,106 (60.2%) |
| 5 to 9 Year Old | 86,652 (83.5%) | 17,094 (16.5%) |
| 10 to 14 Year Olds | 92,099 (86.0%) | 14,959 (14.0%) |
| 15 to 17 Year Olds | 57,357 (88.8%) | 7,237 (11.2%) |
| 18 to 19 Year Olds | 35,346 (91.4%) | 3,339 (8.6%) |
| 20 to 24 Year Olds | 55,909 (87.9%) | 7,705 (12.1%) |
| 25 to 34 Year Olds | 37,168 (73.8%) | 13,201 (26.2%) |
| 35 Years and over | 23,179 (70.7%) | 9,610 (29.3%) |
| Total | 397,716 (81.8%) | 88,235 (18.2%) |
Educational Attainment by Field of Study in Area Code 510
Business (120,325 | 13.9%), engineering (117,825 | 13.6%), social sciences (99,939 | 11.6%), computers & mathematics (84,697 | 9.8%), and science & technology (63,231 | 7.3%) are the most common fields of study among 865,156 individuals in Area Code 510 who have obtained a bachelor's degree or higher.
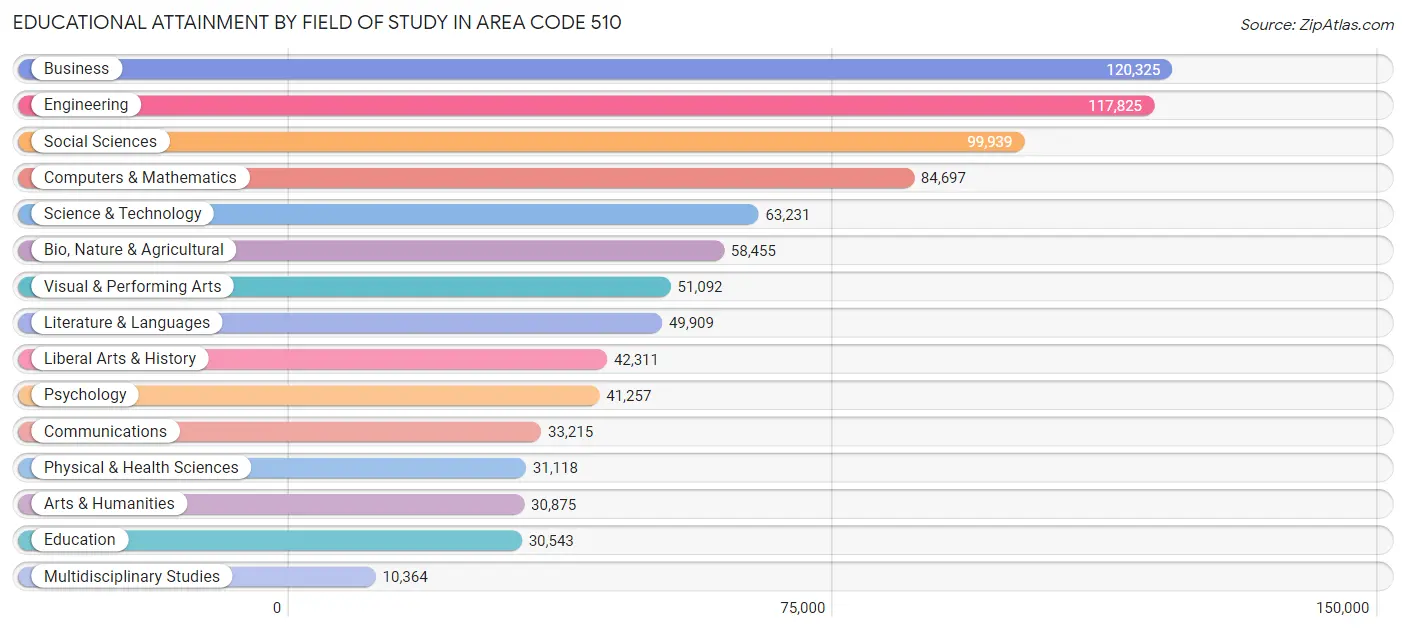
| Field of Study | # Graduates | % Graduates |
| Computers & Mathematics | 84,697 | 9.8% |
| Bio, Nature & Agricultural | 58,455 | 6.8% |
| Physical & Health Sciences | 31,118 | 3.6% |
| Psychology | 41,257 | 4.8% |
| Social Sciences | 99,939 | 11.6% |
| Engineering | 117,825 | 13.6% |
| Multidisciplinary Studies | 10,364 | 1.2% |
| Science & Technology | 63,231 | 7.3% |
| Business | 120,325 | 13.9% |
| Education | 30,543 | 3.5% |
| Literature & Languages | 49,909 | 5.8% |
| Liberal Arts & History | 42,311 | 4.9% |
| Visual & Performing Arts | 51,092 | 5.9% |
| Communications | 33,215 | 3.8% |
| Arts & Humanities | 30,875 | 3.6% |
| Total | 865,156 | 100.0% |
Transportation & Commute in Area Code 510
Vehicle Availability by Sex in Area Code 510
The most prevalent vehicle ownership categories in Area Code 510 are males with 2 vehicles (207,394, accounting for 34.7%) and females with 2 vehicles (172,476, making up 41.3%).
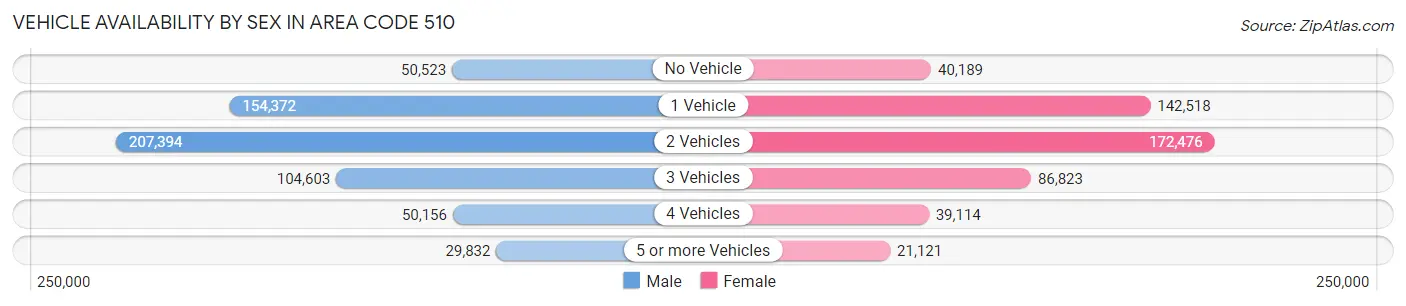
| Vehicles Available | Male | Female |
| No Vehicle | 50,523 (8.5%) | 40,189 (8.0%) |
| 1 Vehicle | 154,372 (25.9%) | 142,518 (28.4%) |
| 2 Vehicles | 207,394 (34.7%) | 172,476 (34.3%) |
| 3 Vehicles | 104,603 (17.5%) | 86,823 (17.3%) |
| 4 Vehicles | 50,156 (8.4%) | 39,114 (7.8%) |
| 5 or more Vehicles | 29,832 (5.0%) | 21,121 (4.2%) |
| Total | 596,880 (100.0%) | 502,241 (100.0%) |
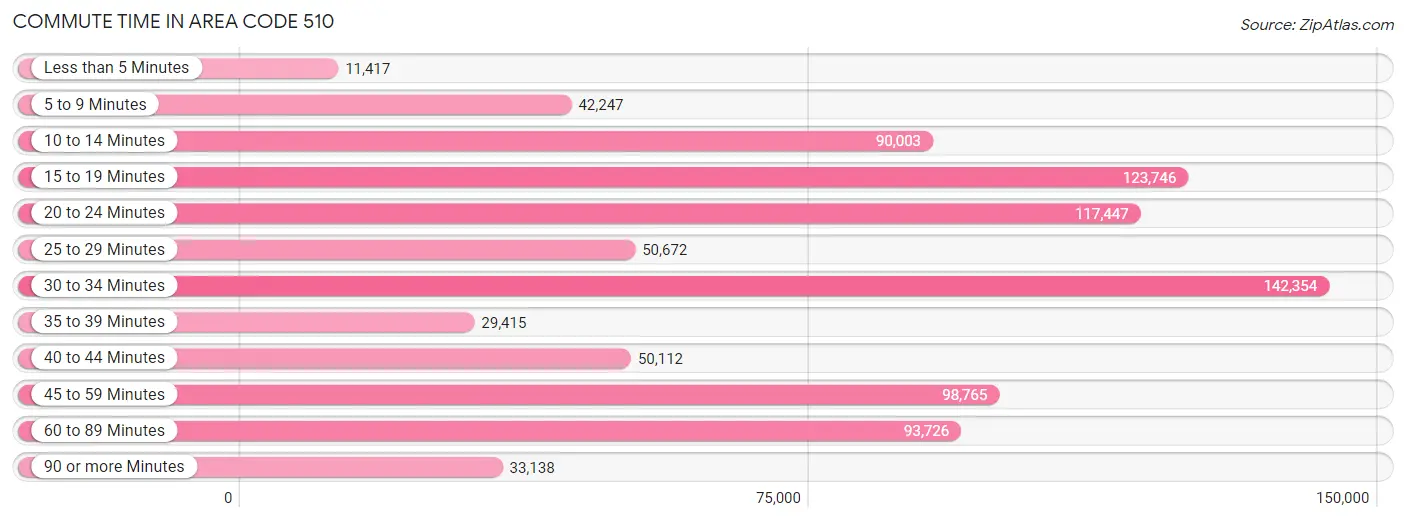
Commute Time in Area Code 510
The most frequently occuring commute durations in Area Code 510 are 30 to 34 minutes (142,354 commuters, 16.1%), 15 to 19 minutes (123,746 commuters, 14.0%), and 20 to 24 minutes (117,447 commuters, 13.3%).
| Commute Time | # Commuters | % Commuters |
| Less than 5 Minutes | 11,417 | 1.3% |
| 5 to 9 Minutes | 42,247 | 4.8% |
| 10 to 14 Minutes | 90,003 | 10.2% |
| 15 to 19 Minutes | 123,746 | 14.0% |
| 20 to 24 Minutes | 117,447 | 13.3% |
| 25 to 29 Minutes | 50,672 | 5.7% |
| 30 to 34 Minutes | 142,354 | 16.1% |
| 35 to 39 Minutes | 29,415 | 3.3% |
| 40 to 44 Minutes | 50,112 | 5.7% |
| 45 to 59 Minutes | 98,765 | 11.2% |
| 60 to 89 Minutes | 93,726 | 10.6% |
| 90 or more Minutes | 33,138 | 3.7% |
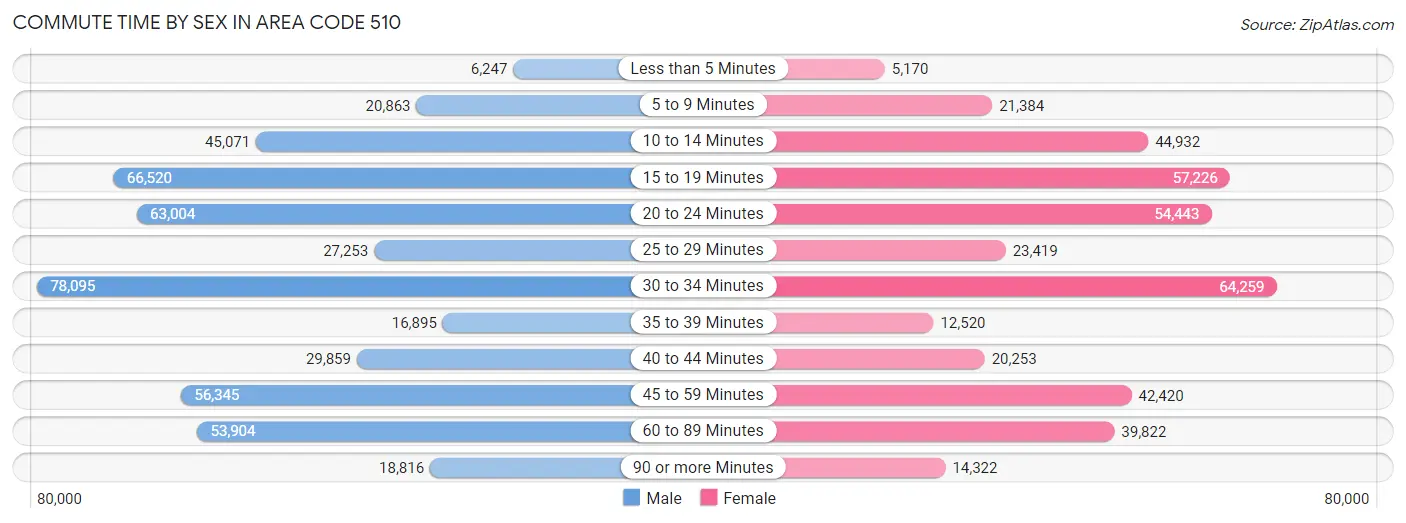
Commute Time by Sex in Area Code 510
The most common commute times in Area Code 510 are 30 to 34 minutes (78,095 commuters, 16.2%) for males and 30 to 34 minutes (64,259 commuters, 16.1%) for females.
| Commute Time | Male | Female |
| Less than 5 Minutes | 6,247 (1.3%) | 5,170 (1.3%) |
| 5 to 9 Minutes | 20,863 (4.3%) | 21,384 (5.3%) |
| 10 to 14 Minutes | 45,071 (9.3%) | 44,932 (11.2%) |
| 15 to 19 Minutes | 66,520 (13.8%) | 57,226 (14.3%) |
| 20 to 24 Minutes | 63,004 (13.1%) | 54,443 (13.6%) |
| 25 to 29 Minutes | 27,253 (5.6%) | 23,419 (5.9%) |
| 30 to 34 Minutes | 78,095 (16.2%) | 64,259 (16.1%) |
| 35 to 39 Minutes | 16,895 (3.5%) | 12,520 (3.1%) |
| 40 to 44 Minutes | 29,859 (6.2%) | 20,253 (5.1%) |
| 45 to 59 Minutes | 56,345 (11.7%) | 42,420 (10.6%) |
| 60 to 89 Minutes | 53,904 (11.2%) | 39,822 (10.0%) |
| 90 or more Minutes | 18,816 (3.9%) | 14,322 (3.6%) |
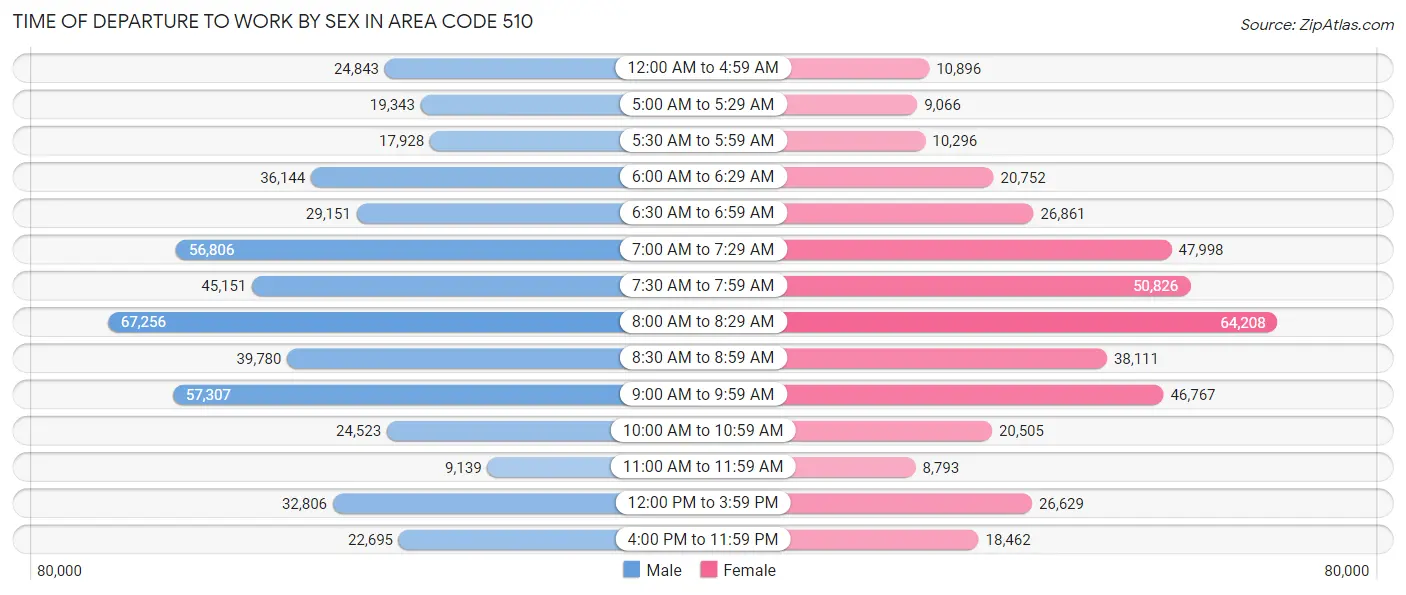
Time of Departure to Work by Sex in Area Code 510
The most frequent times of departure to work in Area Code 510 are 8:00 AM to 8:29 AM (67,256, 13.9%) for males and 8:00 AM to 8:29 AM (64,208, 16.1%) for females.
| Time of Departure | Male | Female |
| 12:00 AM to 4:59 AM | 24,843 (5.1%) | 10,896 (2.7%) |
| 5:00 AM to 5:29 AM | 19,343 (4.0%) | 9,066 (2.3%) |
| 5:30 AM to 5:59 AM | 17,928 (3.7%) | 10,296 (2.6%) |
| 6:00 AM to 6:29 AM | 36,144 (7.5%) | 20,752 (5.2%) |
| 6:30 AM to 6:59 AM | 29,151 (6.0%) | 26,861 (6.7%) |
| 7:00 AM to 7:29 AM | 56,806 (11.8%) | 47,998 (12.0%) |
| 7:30 AM to 7:59 AM | 45,151 (9.3%) | 50,826 (12.7%) |
| 8:00 AM to 8:29 AM | 67,256 (13.9%) | 64,208 (16.1%) |
| 8:30 AM to 8:59 AM | 39,780 (8.2%) | 38,111 (9.5%) |
| 9:00 AM to 9:59 AM | 57,307 (11.9%) | 46,767 (11.7%) |
| 10:00 AM to 10:59 AM | 24,523 (5.1%) | 20,505 (5.1%) |
| 11:00 AM to 11:59 AM | 9,139 (1.9%) | 8,793 (2.2%) |
| 12:00 PM to 3:59 PM | 32,806 (6.8%) | 26,629 (6.7%) |
| 4:00 PM to 11:59 PM | 22,695 (4.7%) | 18,462 (4.6%) |
| Total | 482,872 (100.0%) | 400,170 (100.0%) |
Housing Occupancy in Area Code 510
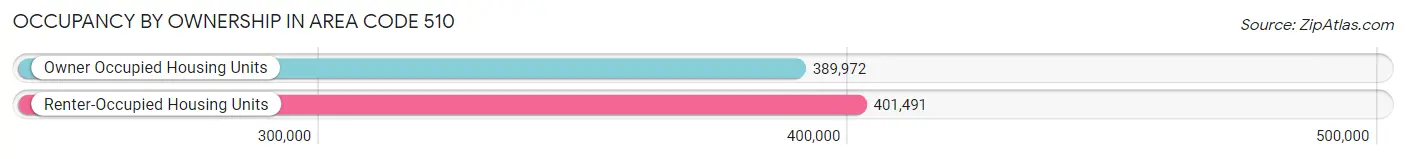
Occupancy by Ownership in Area Code 510
Of the total 791,463 dwellings in Area Code 510, owner-occupied units account for 389,972 (49.3%), while renter-occupied units make up 401,491 (50.7%).
| Occupancy | # Housing Units | % Housing Units |
| Owner Occupied Housing Units | 389,972 | 49.3% |
| Renter-Occupied Housing Units | 401,491 | 50.7% |
| Total Occupied Housing Units | 791,463 | 100.0% |
Occupancy by Household Size in Area Code 510
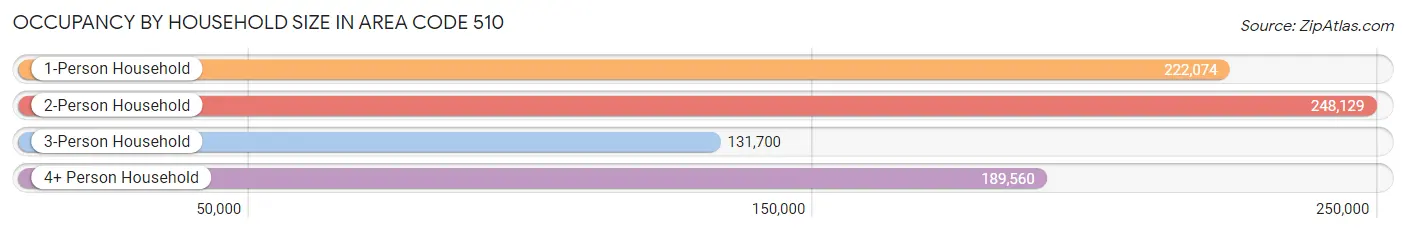
| Household Size | # Housing Units | % Housing Units |
| 1-Person Household | 222,074 | 28.1% |
| 2-Person Household | 248,129 | 31.4% |
| 3-Person Household | 131,700 | 16.6% |
| 4+ Person Household | 189,560 | 23.9% |
| Total Housing Units | 791,463 | 100.0% |
Occupancy by Ownership by Household Size in Area Code 510
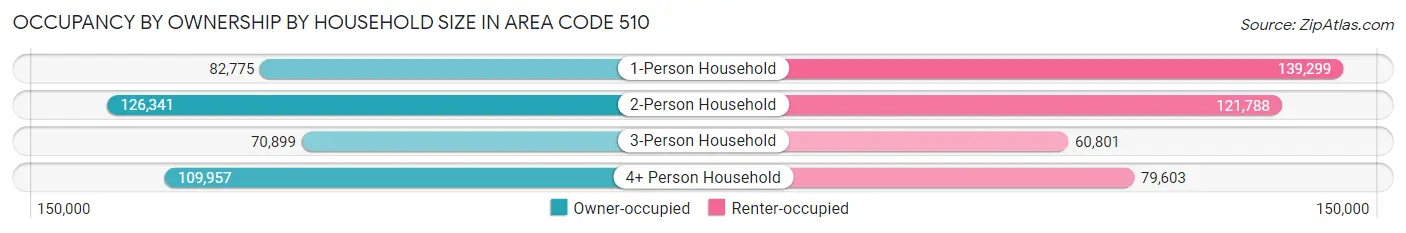
| Household Size | Owner-occupied | Renter-occupied |
| 1-Person Household | 82,775 (37.3%) | 139,299 (62.7%) |
| 2-Person Household | 126,341 (50.9%) | 121,788 (49.1%) |
| 3-Person Household | 70,899 (53.8%) | 60,801 (46.2%) |
| 4+ Person Household | 109,957 (58.0%) | 79,603 (42.0%) |
| Total Housing Units | 389,972 (49.3%) | 401,491 (50.7%) |
Occupancy by Educational Attainment in Area Code 510
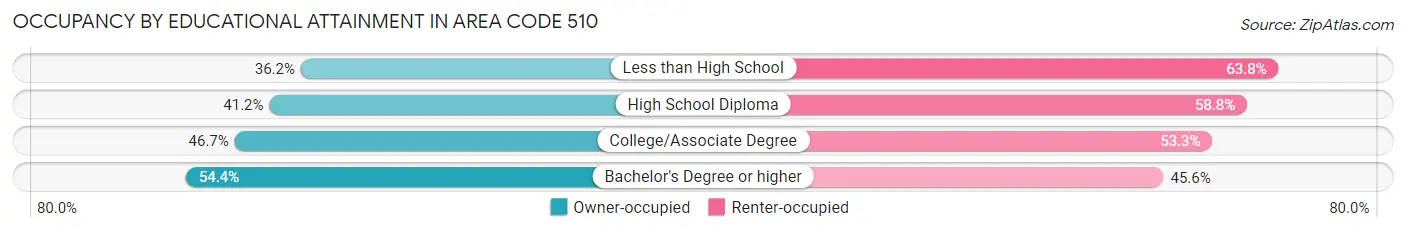
| Household Size | Owner-occupied | Renter-occupied |
| Less than High School | 26,560 (36.2%) | 46,831 (63.8%) |
| High School Diploma | 43,117 (41.2%) | 61,582 (58.8%) |
| College/Associate Degree | 81,680 (46.7%) | 93,262 (53.3%) |
| Bachelor's Degree or higher | 238,615 (54.4%) | 199,816 (45.6%) |
Occupancy by Age of Householder in Area Code 510
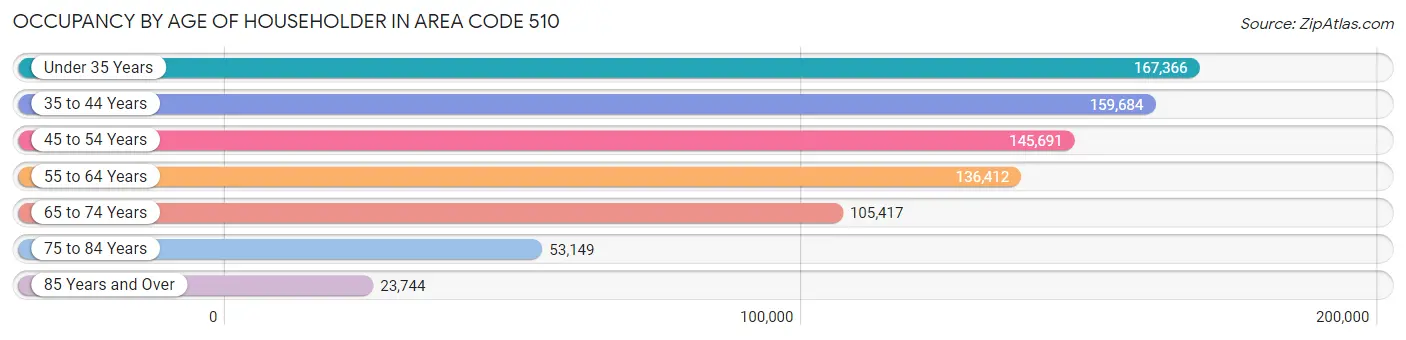
| Age Bracket | # Households | % Households |
| Under 35 Years | 167,366 | 21.1% |
| 35 to 44 Years | 159,684 | 20.2% |
| 45 to 54 Years | 145,691 | 18.4% |
| 55 to 64 Years | 136,412 | 17.2% |
| 65 to 74 Years | 105,417 | 13.3% |
| 75 to 84 Years | 53,149 | 6.7% |
| 85 Years and Over | 23,744 | 3.0% |
| Total | 791,463 | 100.0% |
Housing Finances in Area Code 510
Median Income by Occupancy in Area Code 510
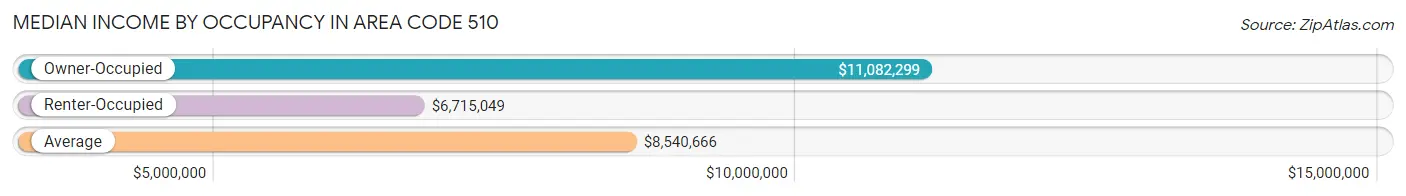
| Occupancy Type | # Households | Median Income |
| Owner-Occupied | 389,972 (49.3%) | $11,082,299 |
| Renter-Occupied | 401,491 (50.7%) | $6,715,049 |
| Average | 791,463 (100.0%) | $8,540,666 |
Occupancy by Householder Income Bracket in Area Code 510
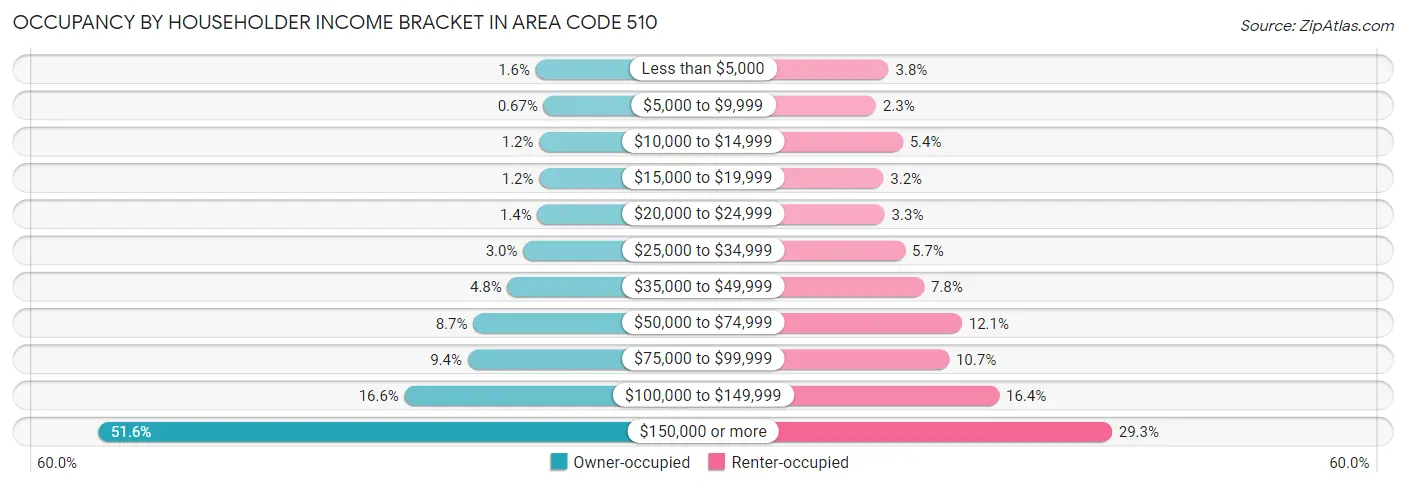
| Income Bracket | Owner-occupied | Renter-occupied |
| Less than $5,000 | 6,151 (1.6%) | 15,187 (3.8%) |
| $5,000 to $9,999 | 2,612 (0.7%) | 9,369 (2.3%) |
| $10,000 to $14,999 | 4,547 (1.2%) | 21,626 (5.4%) |
| $15,000 to $19,999 | 4,555 (1.2%) | 12,775 (3.2%) |
| $20,000 to $24,999 | 5,325 (1.4%) | 13,385 (3.3%) |
| $25,000 to $34,999 | 11,727 (3.0%) | 22,680 (5.7%) |
| $35,000 to $49,999 | 18,717 (4.8%) | 31,400 (7.8%) |
| $50,000 to $74,999 | 34,007 (8.7%) | 48,730 (12.1%) |
| $75,000 to $99,999 | 36,451 (9.3%) | 42,895 (10.7%) |
| $100,000 to $149,999 | 64,584 (16.6%) | 65,857 (16.4%) |
| $150,000 or more | 201,296 (51.6%) | 117,587 (29.3%) |
| Total | 389,972 (100.0%) | 401,491 (100.0%) |
Monthly Housing Cost Tiers in Area Code 510
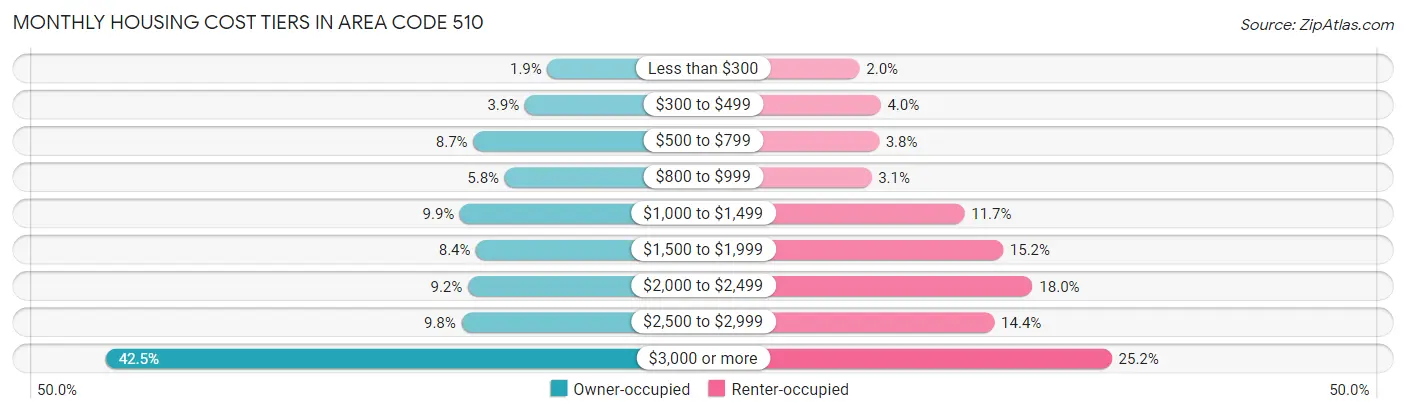
| Monthly Cost | Owner-occupied | Renter-occupied |
| Less than $300 | 7,224 (1.8%) | 8,118 (2.0%) |
| $300 to $499 | 15,330 (3.9%) | 15,898 (4.0%) |
| $500 to $799 | 33,834 (8.7%) | 15,267 (3.8%) |
| $800 to $999 | 22,530 (5.8%) | 12,486 (3.1%) |
| $1,000 to $1,499 | 38,588 (9.9%) | 46,902 (11.7%) |
| $1,500 to $1,999 | 32,779 (8.4%) | 61,129 (15.2%) |
| $2,000 to $2,499 | 35,746 (9.2%) | 72,057 (17.9%) |
| $2,500 to $2,999 | 38,082 (9.8%) | 57,926 (14.4%) |
| $3,000 or more | 165,859 (42.5%) | 101,337 (25.2%) |
| Total | 389,972 (100.0%) | 401,491 (100.0%) |
Physical Housing Characteristics in Area Code 510
Housing Structures in Area Code 510
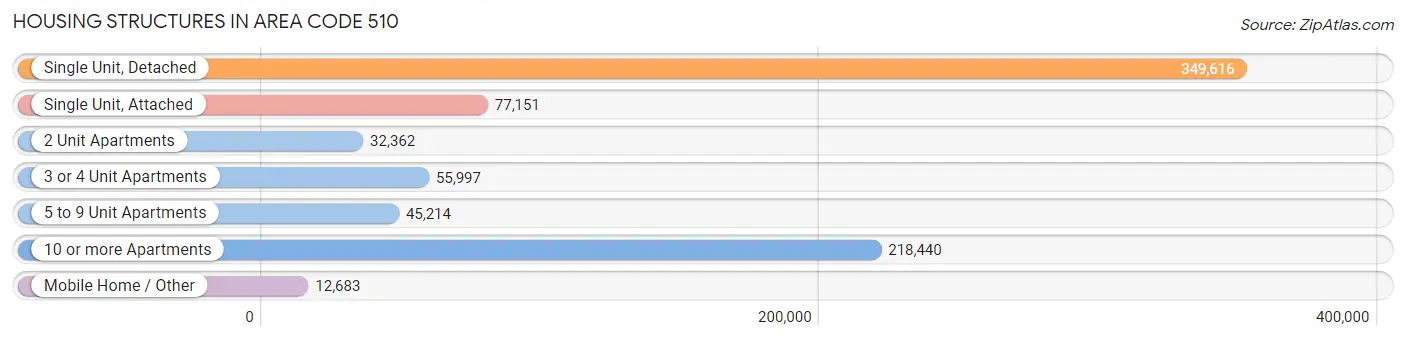
| Structure Type | # Housing Units | % Housing Units |
| Single Unit, Detached | 349,616 | 44.2% |
| Single Unit, Attached | 77,151 | 9.8% |
| 2 Unit Apartments | 32,362 | 4.1% |
| 3 or 4 Unit Apartments | 55,997 | 7.1% |
| 5 to 9 Unit Apartments | 45,214 | 5.7% |
| 10 or more Apartments | 218,440 | 27.6% |
| Mobile Home / Other | 12,683 | 1.6% |
| Total | 791,463 | 100.0% |
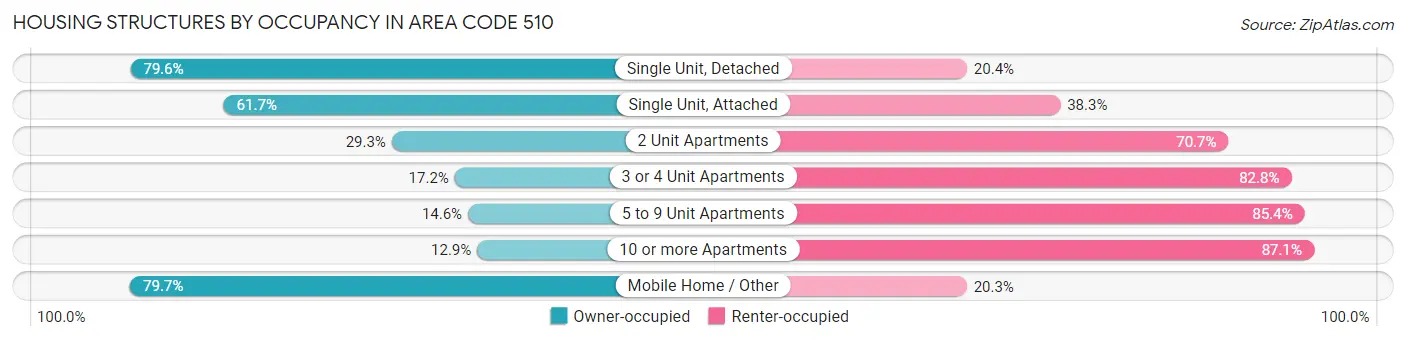
Housing Structures by Occupancy in Area Code 510
| Structure Type | Owner-occupied | Renter-occupied |
| Single Unit, Detached | 278,446 (79.6%) | 71,170 (20.4%) |
| Single Unit, Attached | 47,579 (61.7%) | 29,572 (38.3%) |
| 2 Unit Apartments | 9,487 (29.3%) | 22,875 (70.7%) |
| 3 or 4 Unit Apartments | 9,630 (17.2%) | 46,367 (82.8%) |
| 5 to 9 Unit Apartments | 6,618 (14.6%) | 38,596 (85.4%) |
| 10 or more Apartments | 28,106 (12.9%) | 190,334 (87.1%) |
| Mobile Home / Other | 10,106 (79.7%) | 2,577 (20.3%) |
| Total | 389,972 (49.3%) | 401,491 (50.7%) |
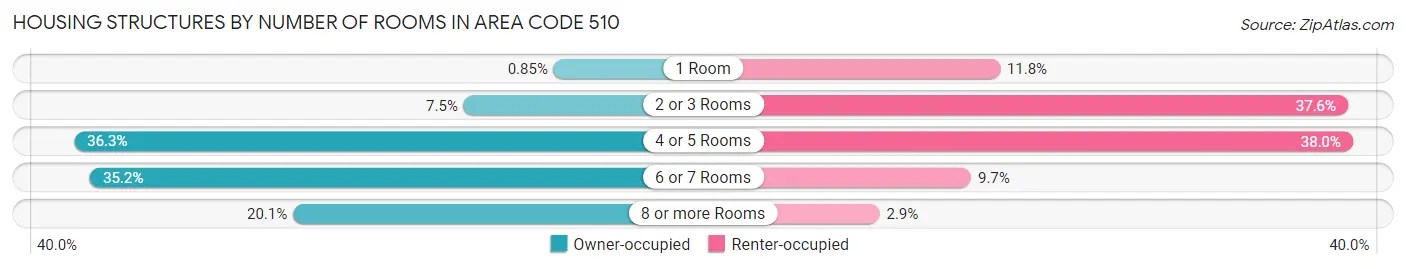
Housing Structures by Number of Rooms in Area Code 510
| Number of Rooms | Owner-occupied | Renter-occupied |
| 1 Room | 3,310 (0.9%) | 47,536 (11.8%) |
| 2 or 3 Rooms | 29,305 (7.5%) | 150,867 (37.6%) |
| 4 or 5 Rooms | 141,730 (36.3%) | 152,381 (38.0%) |
| 6 or 7 Rooms | 137,097 (35.2%) | 38,958 (9.7%) |
| 8 or more Rooms | 78,530 (20.1%) | 11,749 (2.9%) |
| Total | 389,972 (100.0%) | 401,491 (100.0%) |
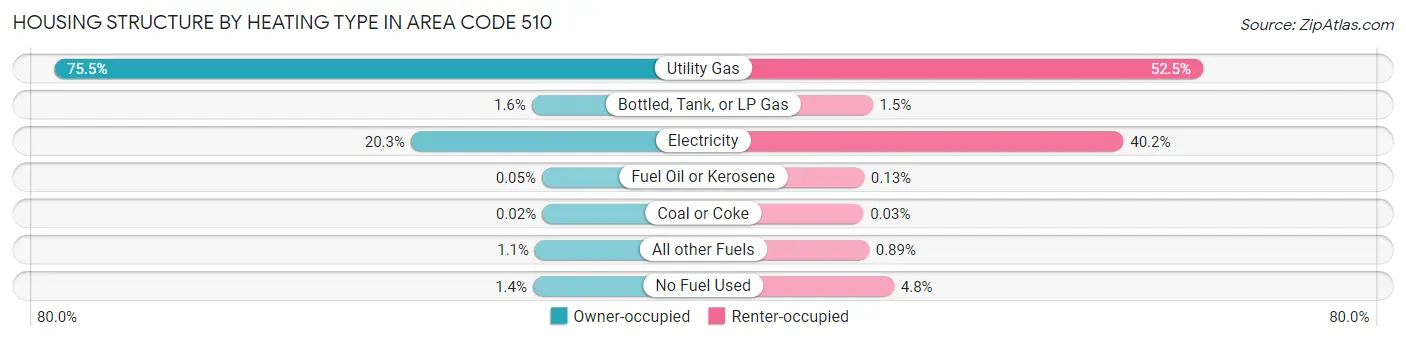
Housing Structure by Heating Type in Area Code 510
| Heating Type | Owner-occupied | Renter-occupied |
| Utility Gas | 294,232 (75.4%) | 210,820 (52.5%) |
| Bottled, Tank, or LP Gas | 6,303 (1.6%) | 5,814 (1.5%) |
| Electricity | 79,159 (20.3%) | 161,530 (40.2%) |
| Fuel Oil or Kerosene | 193 (0.1%) | 516 (0.1%) |
| Coal or Coke | 86 (0.0%) | 117 (0.0%) |
| All other Fuels | 4,385 (1.1%) | 3,588 (0.9%) |
| No Fuel Used | 5,614 (1.4%) | 19,106 (4.8%) |
| Total | 389,972 (100.0%) | 401,491 (100.0%) |
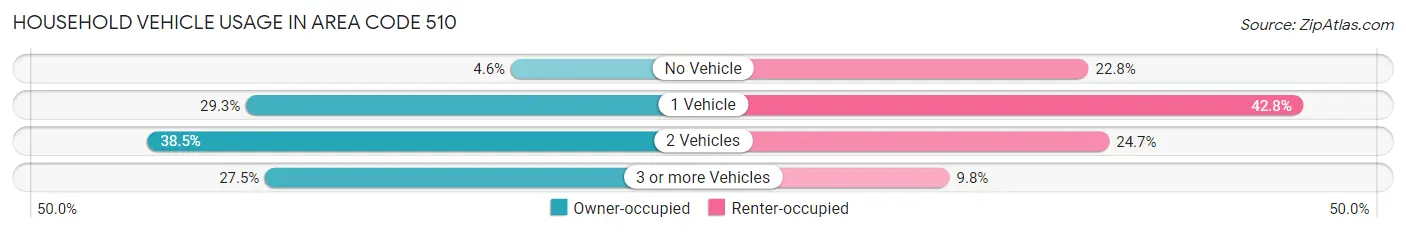
Household Vehicle Usage in Area Code 510
| Vehicles per Household | Owner-occupied | Renter-occupied |
| No Vehicle | 17,952 (4.6%) | 91,328 (22.8%) |
| 1 Vehicle | 114,354 (29.3%) | 171,869 (42.8%) |
| 2 Vehicles | 150,265 (38.5%) | 99,074 (24.7%) |
| 3 or more Vehicles | 107,401 (27.5%) | 39,220 (9.8%) |
| Total | 389,972 (100.0%) | 401,491 (100.0%) |
Real Estate & Mortgages in Area Code 510
Real Estate and Mortgage Overview in Area Code 510
| Characteristic | Without Mortgage | With Mortgage |
| Housing Units | 122,358 | 267,614 |
| Median Property Value | $65,266,501 | $72,474,701 |
| Median Household Income | $7,379,028 | $159,474 |
| Monthly Housing Costs | $65,492 | $163,214 |
| Real Estate Taxes | $372,709 | $4,012 |
Property Value by Mortgage Status in Area Code 510
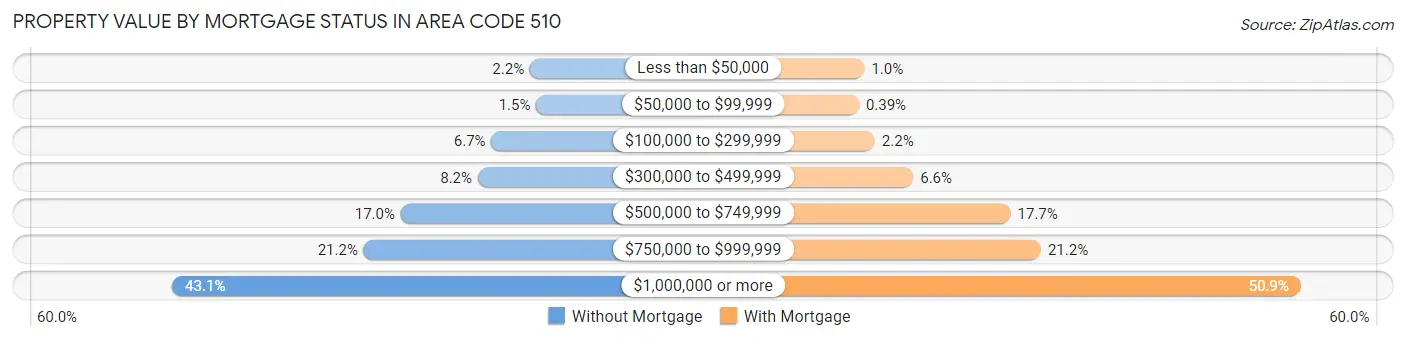
| Property Value | Without Mortgage | With Mortgage |
| Less than $50,000 | 2,746 (2.2%) | 2,725 (1.0%) |
| $50,000 to $99,999 | 1,863 (1.5%) | 1,052 (0.4%) |
| $100,000 to $299,999 | 8,137 (6.7%) | 5,909 (2.2%) |
| $300,000 to $499,999 | 10,032 (8.2%) | 17,670 (6.6%) |
| $500,000 to $749,999 | 20,815 (17.0%) | 47,401 (17.7%) |
| $750,000 to $999,999 | 25,988 (21.2%) | 56,703 (21.2%) |
| $1,000,000 or more | 52,777 (43.1%) | 136,154 (50.9%) |
| Total | 122,358 (100.0%) | 267,614 (100.0%) |
Household Income by Mortgage Status in Area Code 510
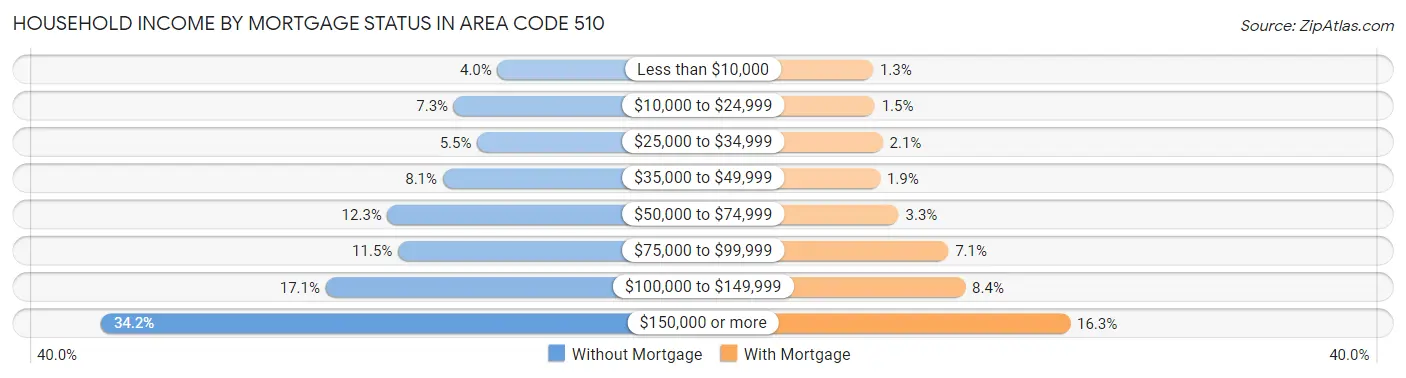
| Household Income | Without Mortgage | With Mortgage |
| Less than $10,000 | 4,846 (4.0%) | 3,557 (1.3%) |
| $10,000 to $24,999 | 8,921 (7.3%) | 3,917 (1.5%) |
| $25,000 to $34,999 | 6,737 (5.5%) | 5,506 (2.1%) |
| $35,000 to $49,999 | 9,951 (8.1%) | 4,990 (1.9%) |
| $50,000 to $74,999 | 15,101 (12.3%) | 8,766 (3.3%) |
| $75,000 to $99,999 | 14,115 (11.5%) | 18,906 (7.1%) |
| $100,000 to $149,999 | 20,865 (17.1%) | 22,336 (8.4%) |
| $150,000 or more | 41,822 (34.2%) | 43,719 (16.3%) |
| Total | 122,358 (100.0%) | 267,614 (100.0%) |
Property Value to Household Income Ratio in Area Code 510
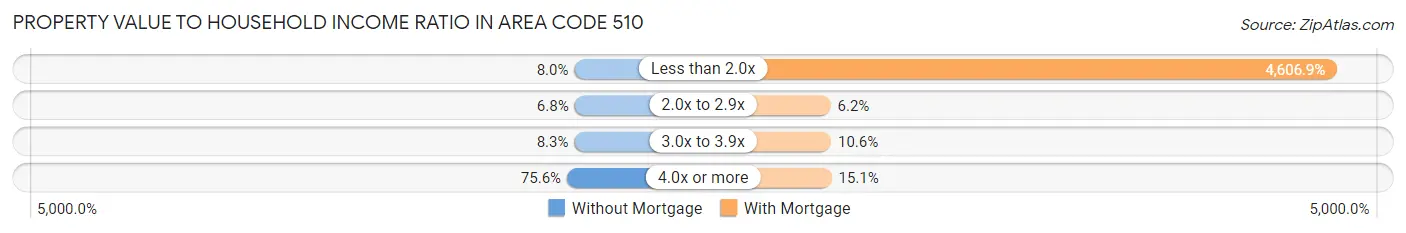
| Value-to-Income Ratio | Without Mortgage | With Mortgage |
| Less than 2.0x | 9,833 (8.0%) | 12,328,775 (4,606.9%) |
| 2.0x to 2.9x | 8,343 (6.8%) | 16,581 (6.2%) |
| 3.0x to 3.9x | 10,116 (8.3%) | 28,409 (10.6%) |
| 4.0x or more | 92,549 (75.6%) | 40,340 (15.1%) |
| Total | 122,358 (100.0%) | 267,614 (100.0%) |
Real Estate Taxes by Mortgage Status in Area Code 510
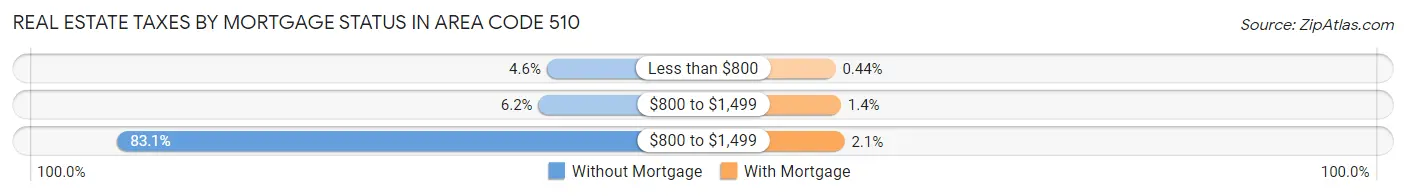
| Property Taxes | Without Mortgage | With Mortgage |
| Less than $800 | 5,660 (4.6%) | 1,178 (0.4%) |
| $800 to $1,499 | 7,531 (6.1%) | 3,816 (1.4%) |
| $800 to $1,499 | 101,615 (83.1%) | 5,602 (2.1%) |
| Total | 122,358 (100.0%) | 267,614 (100.0%) |
Health & Disability in Area Code 510
Health Insurance Coverage by Age in Area Code 510
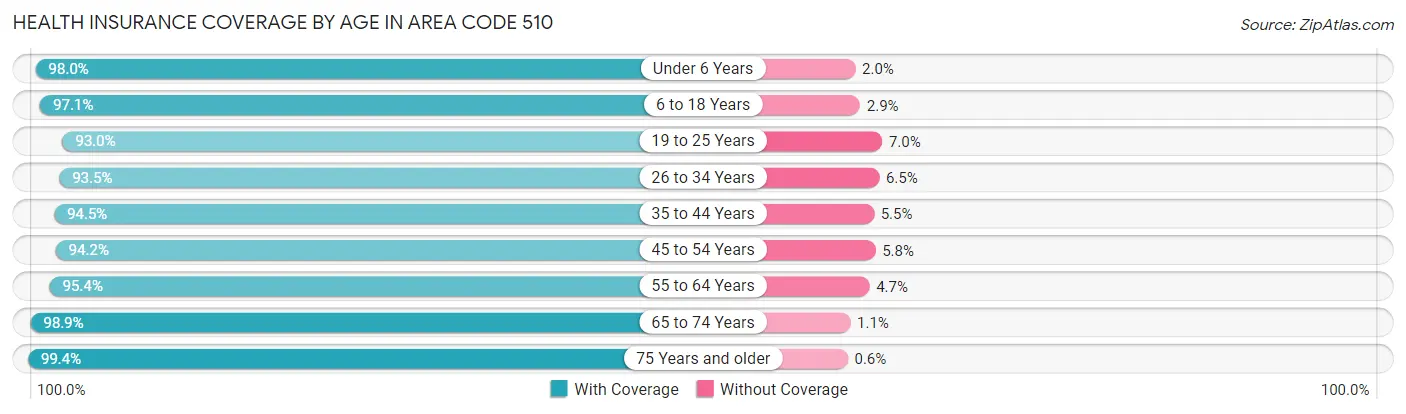
| Age Bracket | With Coverage | Without Coverage |
| Under 6 Years | 132,851 (98.0%) | 2,733 (2.0%) |
| 6 to 18 Years | 278,701 (97.1%) | 8,309 (2.9%) |
| 19 to 25 Years | 169,854 (93.0%) | 12,848 (7.0%) |
| 26 to 34 Years | 331,203 (93.5%) | 22,855 (6.5%) |
| 35 to 44 Years | 313,725 (94.5%) | 18,185 (5.5%) |
| 45 to 54 Years | 263,577 (94.2%) | 16,140 (5.8%) |
| 55 to 64 Years | 246,090 (95.4%) | 11,997 (4.6%) |
| 65 to 74 Years | 186,889 (98.9%) | 2,038 (1.1%) |
| 75 Years and older | 130,899 (99.4%) | 784 (0.6%) |
| Total | 2,053,789 (95.5%) | 95,889 (4.5%) |
Health Insurance Coverage by Citizenship Status in Area Code 510
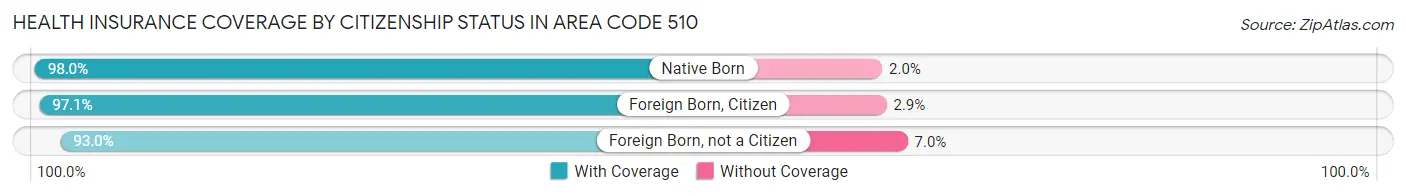
| Citizenship Status | With Coverage | Without Coverage |
| Native Born | 132,851 (98.0%) | 2,733 (2.0%) |
| Foreign Born, Citizen | 278,701 (97.1%) | 8,309 (2.9%) |
| Foreign Born, not a Citizen | 169,854 (93.0%) | 12,848 (7.0%) |
Health Insurance Coverage by Household Income in Area Code 510
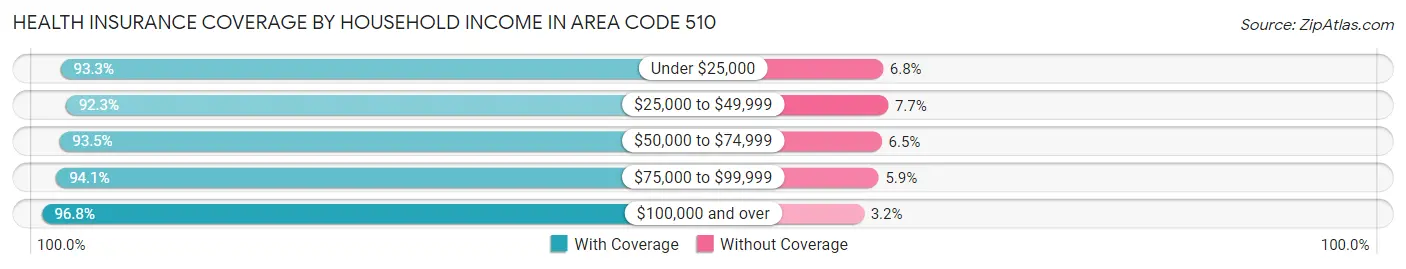
| Household Income | With Coverage | Without Coverage |
| Under $25,000 | 151,545 (93.2%) | 10,974 (6.8%) |
| $25,000 to $49,999 | 175,422 (92.3%) | 14,646 (7.7%) |
| $50,000 to $74,999 | 186,478 (93.5%) | 13,004 (6.5%) |
| $75,000 to $99,999 | 195,635 (94.1%) | 12,334 (5.9%) |
| $100,000 and over | 1,310,513 (96.8%) | 42,927 (3.2%) |
Public vs Private Health Insurance Coverage by Age in Area Code 510
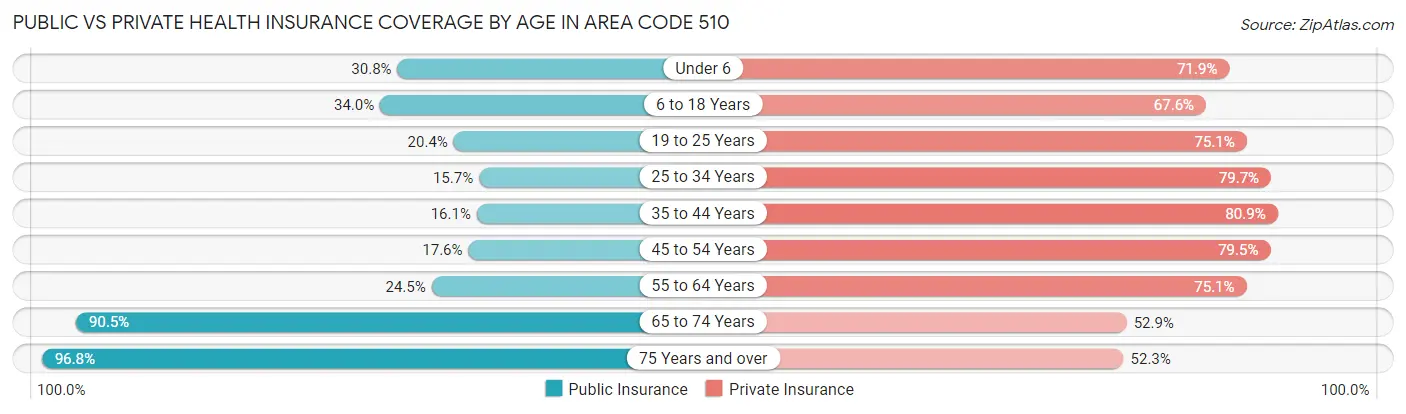
| Age Bracket | Public Insurance | Private Insurance |
| Under 6 | 41,759 (30.8%) | 97,501 (71.9%) |
| 6 to 18 Years | 97,672 (34.0%) | 193,961 (67.6%) |
| 19 to 25 Years | 37,202 (20.4%) | 137,291 (75.1%) |
| 25 to 34 Years | 55,448 (15.7%) | 282,017 (79.6%) |
| 35 to 44 Years | 53,380 (16.1%) | 268,386 (80.9%) |
| 45 to 54 Years | 49,326 (17.6%) | 222,430 (79.5%) |
| 55 to 64 Years | 63,160 (24.5%) | 193,797 (75.1%) |
| 65 to 74 Years | 170,917 (90.5%) | 99,909 (52.9%) |
| 75 Years and over | 127,482 (96.8%) | 68,877 (52.3%) |
| Total | 696,346 (32.4%) | 1,564,169 (72.8%) |
Disability Status by Sex by Age in Area Code 510
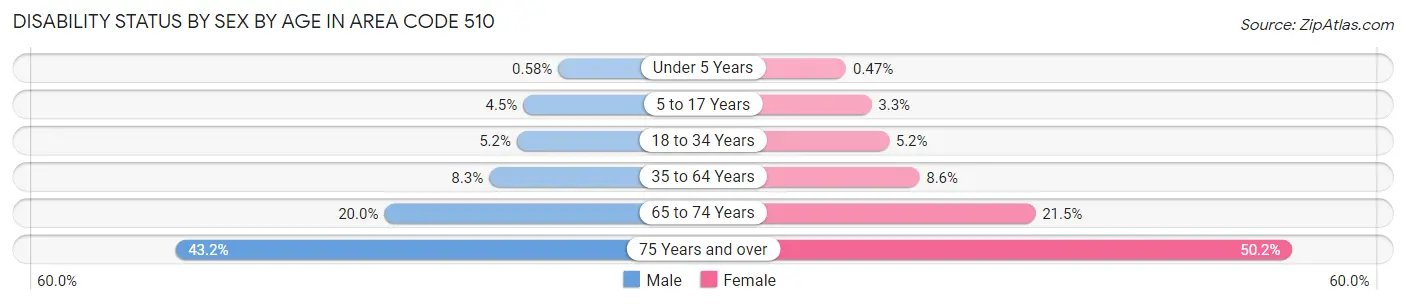
| Age Bracket | Male | Female |
| Under 5 Years | 329 (0.6%) | 258 (0.5%) |
| 5 to 17 Years | 6,561 (4.5%) | 4,549 (3.3%) |
| 18 to 34 Years | 15,053 (5.2%) | 14,254 (5.2%) |
| 35 to 64 Years | 36,918 (8.3%) | 36,584 (8.6%) |
| 65 to 74 Years | 17,586 (20.0%) | 21,704 (21.5%) |
| 75 Years and over | 23,164 (43.2%) | 39,178 (50.2%) |
Disability Class by Sex by Age in Area Code 510
Disability Class: Hearing Difficulty
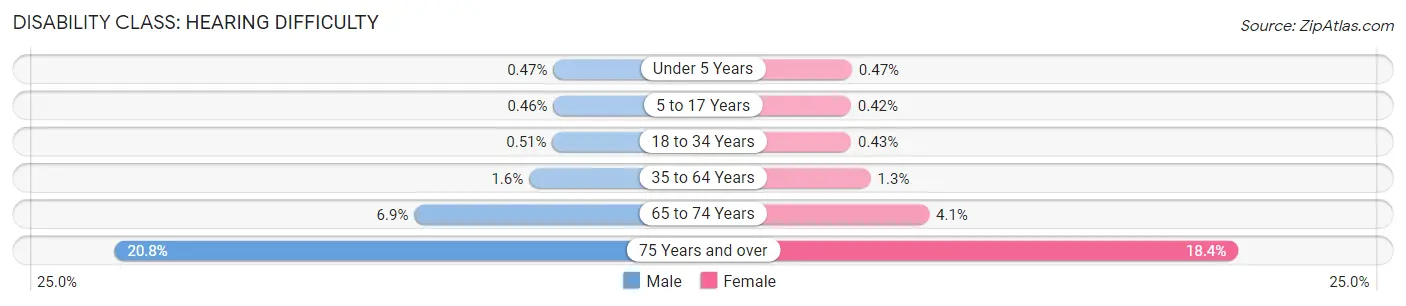
| Age Bracket | Male | Female |
| Under 5 Years | 269 (0.5%) | 258 (0.5%) |
| 5 to 17 Years | 677 (0.5%) | 576 (0.4%) |
| 18 to 34 Years | 1,492 (0.5%) | 1,178 (0.4%) |
| 35 to 64 Years | 7,091 (1.6%) | 5,663 (1.3%) |
| 65 to 74 Years | 6,099 (6.9%) | 4,079 (4.1%) |
| 75 Years and over | 11,165 (20.8%) | 14,361 (18.4%) |
Disability Class: Vision Difficulty
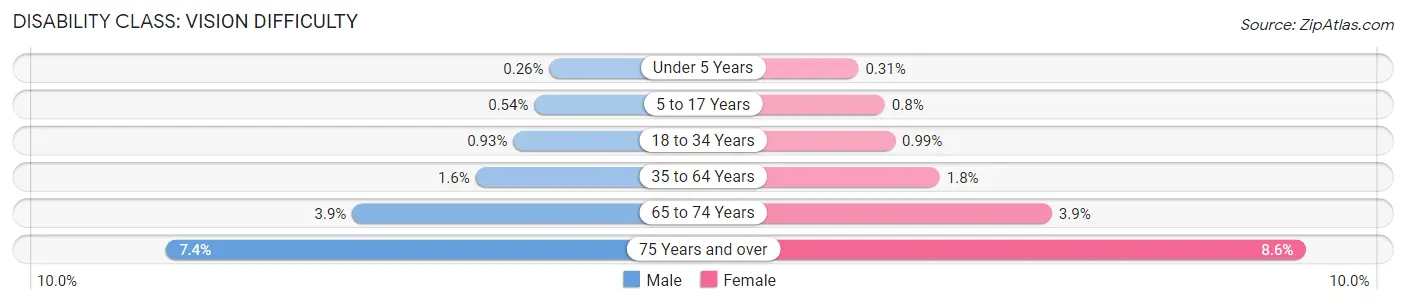
| Age Bracket | Male | Female |
| Under 5 Years | 151 (0.3%) | 170 (0.3%) |
| 5 to 17 Years | 797 (0.5%) | 1,109 (0.8%) |
| 18 to 34 Years | 2,699 (0.9%) | 2,684 (1.0%) |
| 35 to 64 Years | 7,248 (1.6%) | 7,705 (1.8%) |
| 65 to 74 Years | 3,455 (3.9%) | 3,926 (3.9%) |
| 75 Years and over | 3,950 (7.4%) | 6,714 (8.6%) |
Disability Class: Cognitive Difficulty
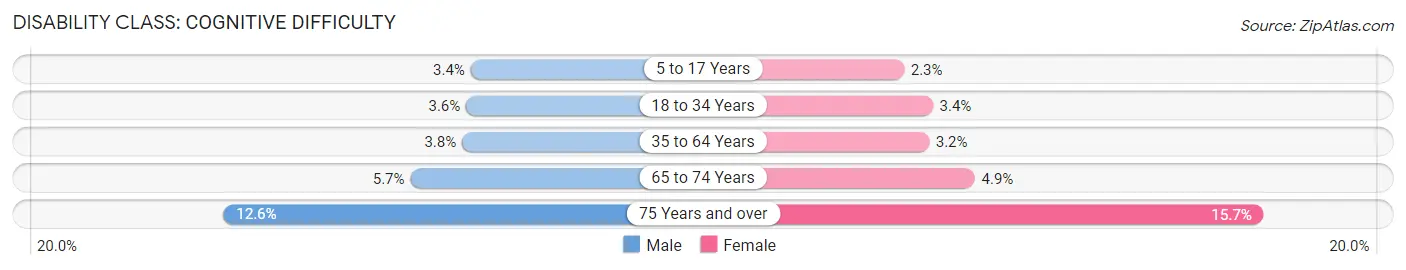
| Age Bracket | Male | Female |
| 5 to 17 Years | 5,044 (3.4%) | 3,180 (2.3%) |
| 18 to 34 Years | 10,497 (3.6%) | 9,175 (3.4%) |
| 35 to 64 Years | 16,769 (3.8%) | 13,705 (3.2%) |
| 65 to 74 Years | 5,011 (5.7%) | 4,970 (4.9%) |
| 75 Years and over | 6,763 (12.6%) | 12,230 (15.7%) |
Disability Class: Ambulatory Difficulty
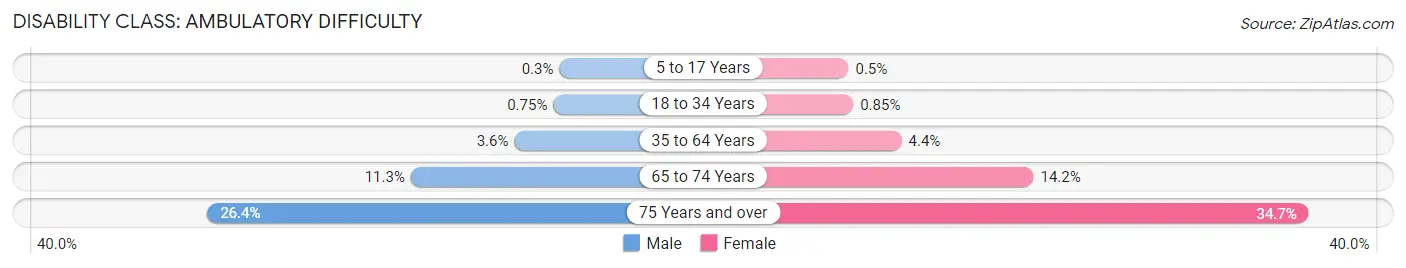
| Age Bracket | Male | Female |
| 5 to 17 Years | 445 (0.3%) | 685 (0.5%) |
| 18 to 34 Years | 2,171 (0.7%) | 2,328 (0.9%) |
| 35 to 64 Years | 16,250 (3.6%) | 18,826 (4.4%) |
| 65 to 74 Years | 9,991 (11.3%) | 14,349 (14.2%) |
| 75 Years and over | 14,172 (26.4%) | 27,055 (34.6%) |
Disability Class: Self-Care Difficulty
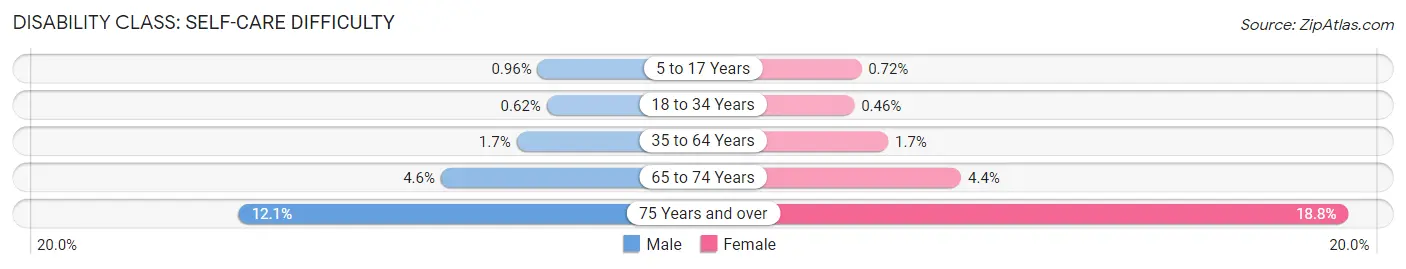
| Age Bracket | Male | Female |
| 5 to 17 Years | 1,401 (1.0%) | 989 (0.7%) |
| 18 to 34 Years | 1,799 (0.6%) | 1,266 (0.5%) |
| 35 to 64 Years | 7,740 (1.7%) | 7,296 (1.7%) |
| 65 to 74 Years | 4,013 (4.5%) | 4,460 (4.4%) |
| 75 Years and over | 6,460 (12.0%) | 14,684 (18.8%) |
Technology Access in Area Code 510
Computing Device Access in Area Code 510
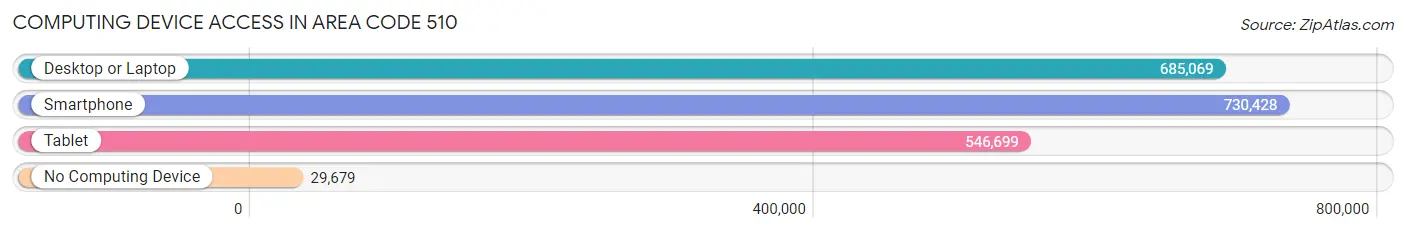
| Device Type | # Households | % Households |
| Desktop or Laptop | 685,069 | 86.6% |
| Smartphone | 730,428 | 92.3% |
| Tablet | 546,699 | 69.1% |
| No Computing Device | 29,679 | 3.7% |
| Total | 791,463 | 100.0% |
Internet Access in Area Code 510
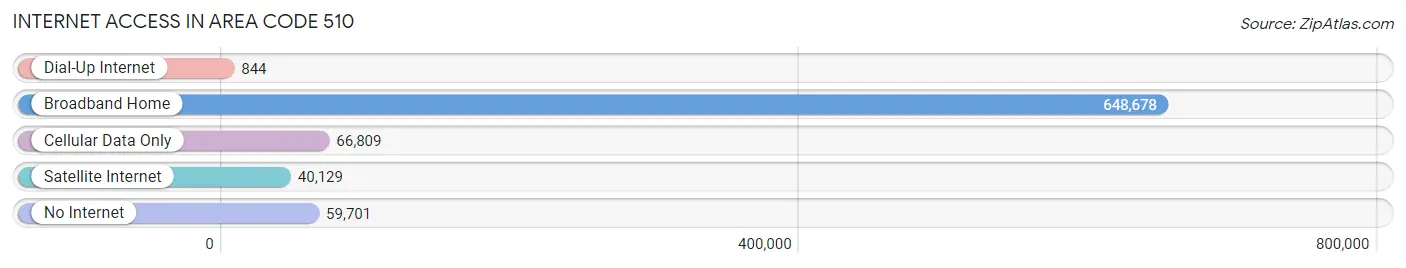
| Internet Type | # Households | % Households |
| Dial-Up Internet | 844 | 0.1% |
| Broadband Home | 648,678 | 82.0% |
| Cellular Data Only | 66,809 | 8.4% |
| Satellite Internet | 40,129 | 5.1% |
| No Internet | 59,701 | 7.5% |
| Total | 791,463 | 100.0% |
Area Code 510 Summary
Geography
Area code 510 is a telephone area code in the North American Numbering Plan (NANP) for the northern part of the East Bay in California. It serves the cities of Oakland, Berkeley, San Leandro, Hayward, Fremont, Richmond, and other parts of Alameda County.
Social
Area code 510 is a vibrant and diverse area, with a wide range of cultures and lifestyles. The area is home to a large number of universities and colleges, as well as a thriving arts and music scene.
Economics
Area code 510 is an economically diverse area, with a mix of industries ranging from technology and finance to manufacturing and retail. The area is home to a number of major corporations, including Oracle, Clorox, and Kaiser Permanente.
Demographics
Area code 510 is home to a diverse population, with a mix of ethnicities and backgrounds. According to the 2010 census, the population of the area is approximately 1.5 million people, with a median age of 36.7 years. The area is also home to a large number of immigrants, with approximately 25% of the population being foreign-born.
Common Questions
What is Per Capita Income in Area Code 510?
Per Capita income in Area Code 510 is $64,875.
What is the Median Family Income in Area Code 510?
Median Family Income in Area Code 510 is $147,076.
What is the Median Household income in Area Code 510?
Median Household Income in Area Code 510 is $123,778.
What is Income or Wage Gap in Area Code 510?
Income or Wage Gap in Area Code 510 is 23.2%.
Women in Area Code 510 earn 76.8 cents for every dollar earned by a man.
What is Family Income Deficit in Area Code 510?
Family Income Deficit in Area Code 510 is $11,028.
Families that are below poverty line in Area Code 510 earn $11,028 less on average than the poverty threshold level.
What is Inequality or Gini Index in Area Code 510?
Inequality or Gini Index in Area Code 510 is 31.76.
What is the Total Population of Area Code 510?
Total Population of Area Code 510 is 2,159,978.
What is the Total Male Population of Area Code 510?
Total Male Population of Area Code 510 is 1,087,327.
What is the Total Female Population of Area Code 510?
Total Female Population of Area Code 510 is 1,072,651.
What is the Ratio of Males per 100 Females in Area Code 510?
There are 101.37 Males per 100 Females in Area Code 510.
What is the Ratio of Females per 100 Males in Area Code 510?
There are 98.65 Females per 100 Males in Area Code 510.
What is the Median Population Age in Area Code 510?
Median Population Age in Area Code 510 is 39.1 Years.
What is the Average Family Size in Area Code 510
Average Family Size in Area Code 510 is 3.2 People.
What is the Average Household Size in Area Code 510
Average Household Size in Area Code 510 is 2.6 People.
How Large is the Labor Force in Area Code 510?
There are 1,198,140 People in the Labor Forcein in Area Code 510.
What is the Percentage of People in the Labor Force in Area Code 510?
66.3% of People are in the Labor Force in Area Code 510.
What is the Unemployment Rate in Area Code 510?
Unemployment Rate in Area Code 510 is 6.1%.