Area Code 408 Map & Demographics
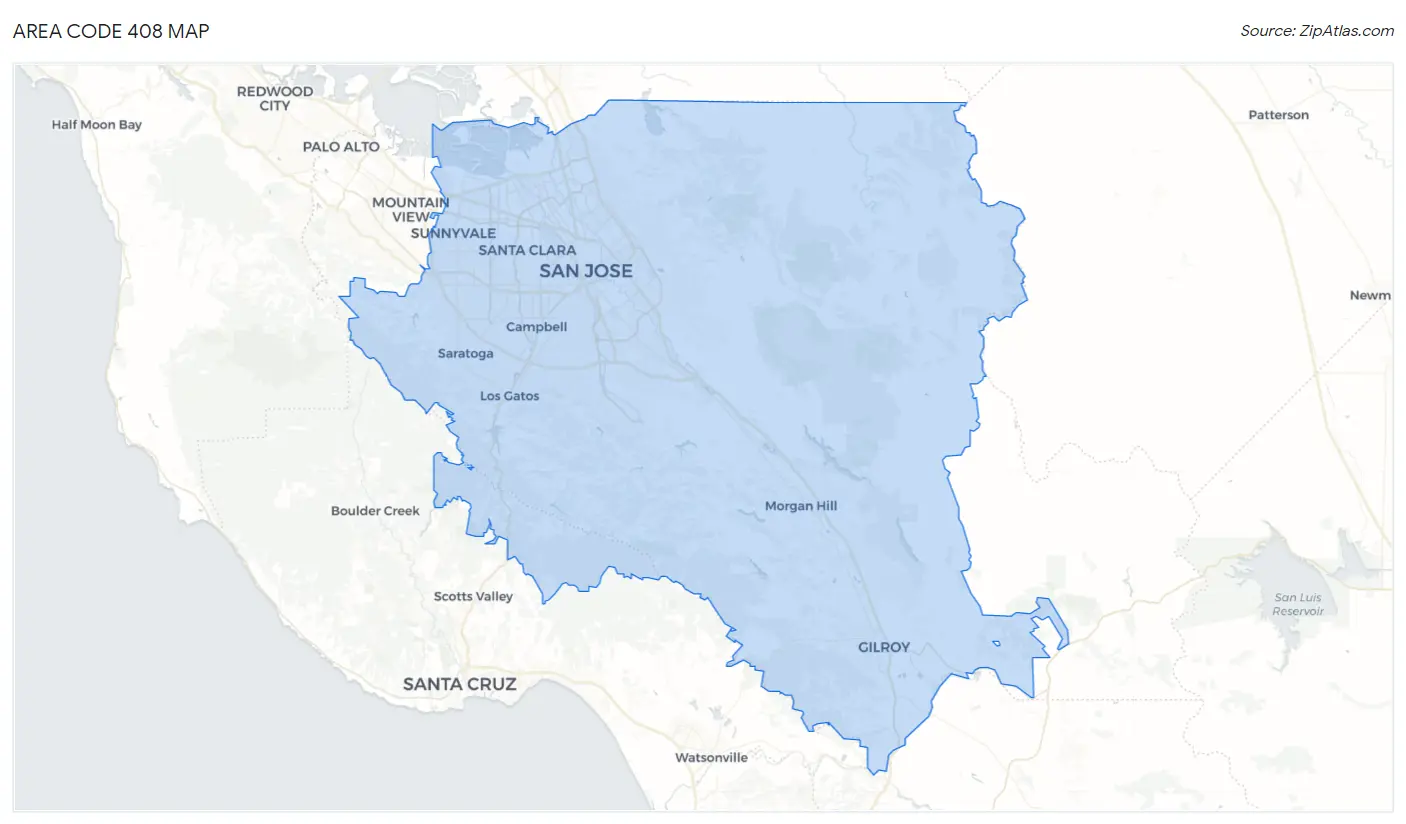
Area Code 408 Map
Area Code 408 Overview
$66,838
PER CAPITA INCOME
$165,965
AVG FAMILY INCOME
$148,979
AVG HOUSEHOLD INCOME
34.5%
WAGE / INCOME GAP [ % ]
65.5¢/ $1
WAGE / INCOME GAP [ $ ]
$11,255
FAMILY INCOME DEFICIT
24.90
INEQUALITY / GINI INDEX
2,205,127
TOTAL POPULATION
1,126,750
MALE POPULATION
1,078,377
FEMALE POPULATION
104.49
MALES / 100 FEMALES
95.71
FEMALES / 100 MALES
39.2
MEDIAN AGE
3.4
AVG FAMILY SIZE
3.0
AVG HOUSEHOLD SIZE
1,176,658
LABOR FORCE [ PEOPLE ]
66.5%
PERCENT IN LABOR FORCE
5.5%
UNEMPLOYMENT RATE
Income in Area Code 408
Income Overview in Area Code 408
Per Capita Income in Area Code 408 is $66,838, while median incomes of families and households are $165,965 and $148,979 respectively.
| Characteristic | Number | Measure |
| Per Capita Income | 2,205,127 | $66,838 |
| Median Family Income | 527,096 | $165,965 |
| Mean Family Income | 527,096 | $11,884,729 |
| Median Household Income | 721,096 | $148,979 |
| Mean Household Income | 721,096 | $10,893,379 |
| Income Deficit | 527,096 | $11,255 |
| Wage / Income Gap (%) | 2,205,127 | 34.50% |
| Wage / Income Gap ($) | 2,205,127 | 65.50¢ per $1 |
| Gini / Inequality Index | 2,205,127 | 24.90 |
Earnings by Sex in Area Code 408
Average Earnings in Area Code 408 are $73,245, $91,196 for men and $56,363 for women, a difference of 38.2%.
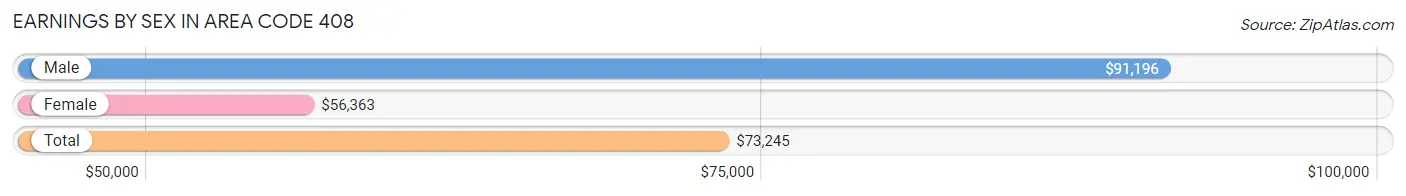
| Sex | Number | Average Earnings |
| Male | 682,138 (55.8%) | $91,196 |
| Female | 540,705 (44.2%) | $56,363 |
| Total | 1,222,843 (100.0%) | $73,245 |
Earnings by Sex by Income Bracket in Area Code 408
The most common earnings brackets in Area Code 408 are $100,000+ for men (281,033 | 41.2%) and $100,000+ for women (140,421 | 26.0%).
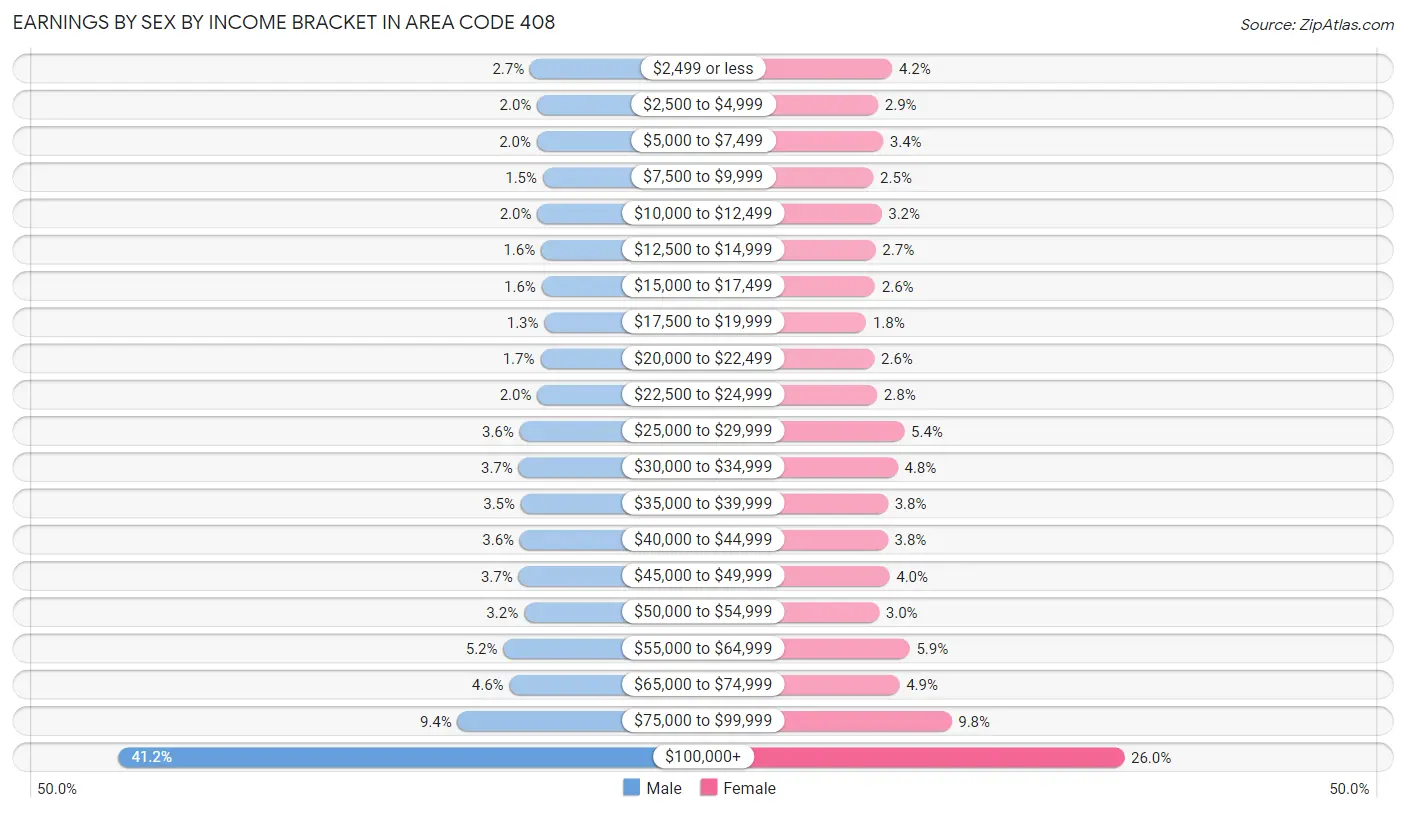
| Income | Male | Female |
| $2,499 or less | 18,053 (2.6%) | 22,930 (4.2%) |
| $2,500 to $4,999 | 13,507 (2.0%) | 15,739 (2.9%) |
| $5,000 to $7,499 | 13,813 (2.0%) | 18,256 (3.4%) |
| $7,500 to $9,999 | 9,880 (1.5%) | 13,333 (2.5%) |
| $10,000 to $12,499 | 13,450 (2.0%) | 17,446 (3.2%) |
| $12,500 to $14,999 | 11,042 (1.6%) | 14,514 (2.7%) |
| $15,000 to $17,499 | 10,615 (1.6%) | 14,214 (2.6%) |
| $17,500 to $19,999 | 8,929 (1.3%) | 9,743 (1.8%) |
| $20,000 to $22,499 | 11,559 (1.7%) | 13,842 (2.6%) |
| $22,500 to $24,999 | 13,420 (2.0%) | 15,230 (2.8%) |
| $25,000 to $29,999 | 24,751 (3.6%) | 29,019 (5.4%) |
| $30,000 to $34,999 | 25,397 (3.7%) | 25,657 (4.8%) |
| $35,000 to $39,999 | 23,919 (3.5%) | 20,722 (3.8%) |
| $40,000 to $44,999 | 24,546 (3.6%) | 20,643 (3.8%) |
| $45,000 to $49,999 | 25,455 (3.7%) | 21,519 (4.0%) |
| $50,000 to $54,999 | 21,932 (3.2%) | 16,242 (3.0%) |
| $55,000 to $64,999 | 35,161 (5.1%) | 31,743 (5.9%) |
| $65,000 to $74,999 | 31,262 (4.6%) | 26,540 (4.9%) |
| $75,000 to $99,999 | 64,414 (9.4%) | 52,952 (9.8%) |
| $100,000+ | 281,033 (41.2%) | 140,421 (26.0%) |
| Total | 682,138 (100.0%) | 540,705 (100.0%) |
Earnings by Sex by Educational Attainment in Area Code 408
Average earnings in Area Code 408 are $5,901,939 for men and $3,688,595 for women, a difference of 37.5%. Men with an educational attainment of graduate degree enjoy the highest average annual earnings of $8,846,047, while those with less than high school education earn the least with $2,215,564. Women with an educational attainment of graduate degree earn the most with the average annual earnings of $5,990,646, while those with less than high school education have the smallest earnings of $1,435,808.
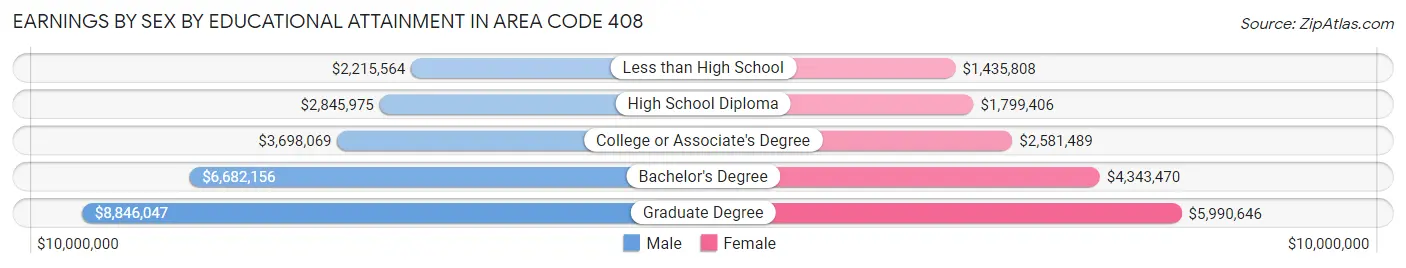
| Educational Attainment | Male Income | Female Income |
| Less than High School | $2,215,564 | $1,435,808 |
| High School Diploma | $2,845,975 | $1,799,406 |
| College or Associate's Degree | $3,698,069 | $2,581,489 |
| Bachelor's Degree | $6,682,156 | $4,343,470 |
| Graduate Degree | $8,846,047 | $5,990,646 |
| Total | $5,901,939 | $3,688,595 |
Family Income in Area Code 408
Family Income Brackets in Area Code 408
According to the Area Code 408 family income data, there are 11,479,097 families falling into the $200,000+ income range, which is the most common income bracket and makes up 2,177.8% of all families. Conversely, the $10,000 to $14,999 income bracket is the least frequent group with only 277,780 families (52.7%) belonging to this category.
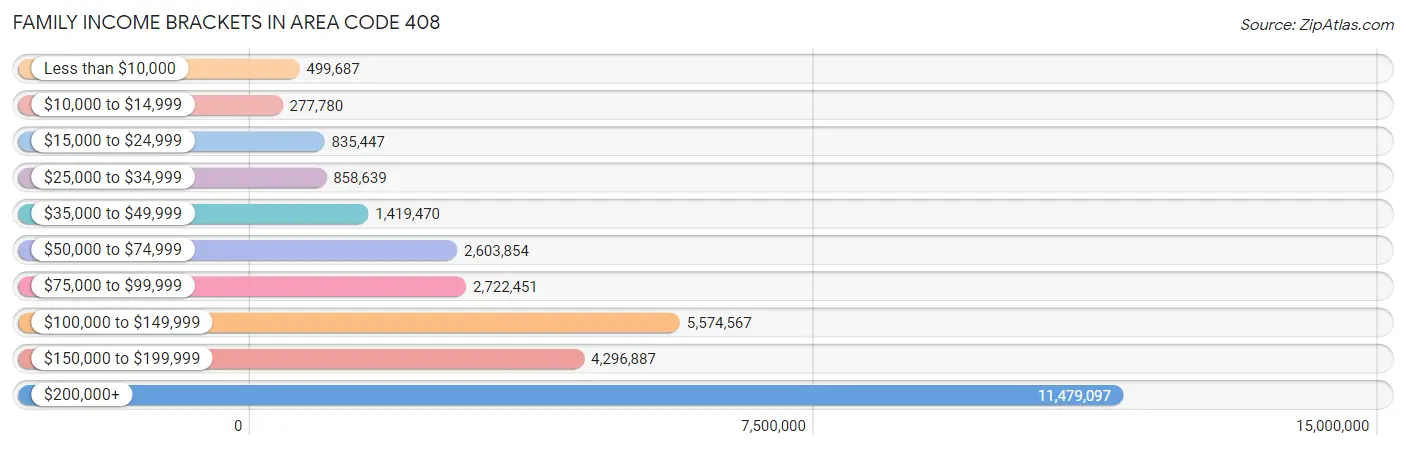
| Income Bracket | # Families | % Families |
| Less than $10,000 | 499,687 | 94.8% |
| $10,000 to $14,999 | 277,780 | 52.7% |
| $15,000 to $24,999 | 835,447 | 158.5% |
| $25,000 to $34,999 | 858,639 | 162.9% |
| $35,000 to $49,999 | 1,419,470 | 269.3% |
| $50,000 to $74,999 | 2,603,854 | 494.0% |
| $75,000 to $99,999 | 2,722,451 | 516.5% |
| $100,000 to $149,999 | 5,574,567 | 1,057.6% |
| $150,000 to $199,999 | 4,296,887 | 815.2% |
| $200,000+ | 11,479,097 | 2,177.8% |
Family Income by Famaliy Size in Area Code 408
7+ person families (14,267 | 2.7%) account for the highest median family income in Area Code 408 with $192,795 per family, while 2-person families (188,276 | 35.7%) have the highest median income of $68,894 per family member.
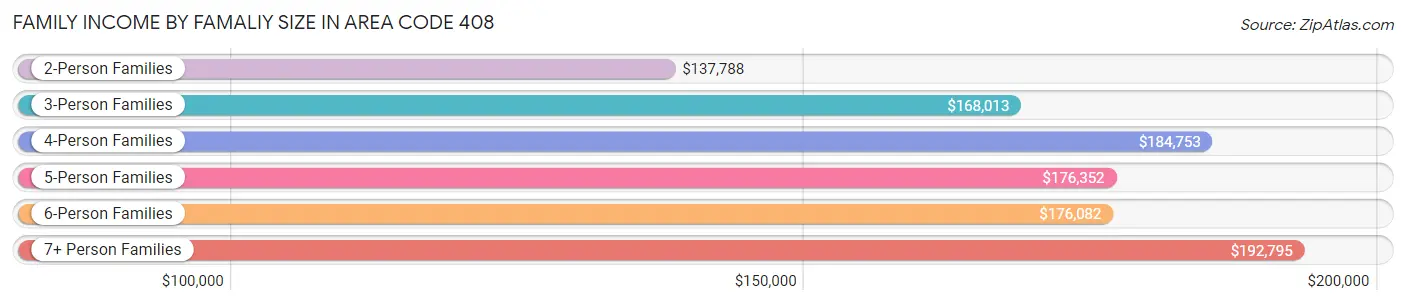
| Income Bracket | # Families | Median Income |
| 2-Person Families | 188,276 (35.7%) | $137,788 |
| 3-Person Families | 130,972 (24.8%) | $168,013 |
| 4-Person Families | 123,359 (23.4%) | $184,753 |
| 5-Person Families | 50,280 (9.5%) | $176,352 |
| 6-Person Families | 19,942 (3.8%) | $176,082 |
| 7+ Person Families | 14,267 (2.7%) | $192,795 |
| Total | 527,096 (100.0%) | $165,965 |
Family Income by Number of Earners in Area Code 408
The median family income in Area Code 408 is $165,965, with families comprising 3+ earners (87,939) having the highest median family income of $198,850, while families with no earners (49,821) have the lowest median family income of $61,759, accounting for 16.7% and 9.5% of families, respectively.
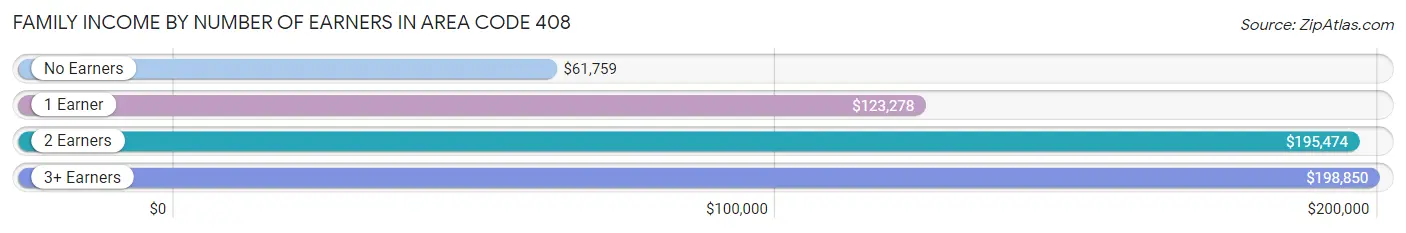
| Number of Earners | # Families | Median Income |
| No Earners | 49,821 (9.5%) | $61,759 |
| 1 Earner | 156,753 (29.7%) | $123,278 |
| 2 Earners | 232,583 (44.1%) | $195,474 |
| 3+ Earners | 87,939 (16.7%) | $198,850 |
| Total | 527,096 (100.0%) | $165,965 |
Household Income in Area Code 408
Household Income Brackets in Area Code 408
With 14,088,774 households falling in the category, the $200,000+ income range is the most frequent in Area Code 408, accounting for 1,953.8% of all households. In contrast, only 809,791 households (112.3%) fall into the $10,000 to $14,999 income bracket, making it the least populous group.
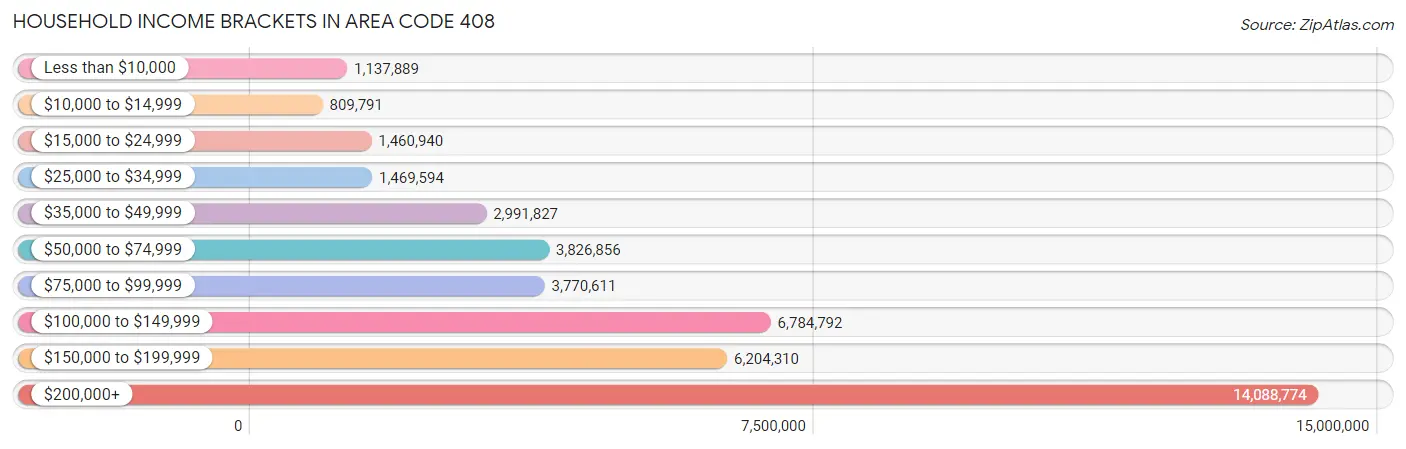
| Income Bracket | # Households | % Households |
| Less than $10,000 | 1,137,889 | 157.8% |
| $10,000 to $14,999 | 809,791 | 112.3% |
| $15,000 to $24,999 | 1,460,940 | 202.6% |
| $25,000 to $34,999 | 1,469,594 | 203.8% |
| $35,000 to $49,999 | 2,991,827 | 414.9% |
| $50,000 to $74,999 | 3,826,856 | 530.7% |
| $75,000 to $99,999 | 3,770,611 | 522.9% |
| $100,000 to $149,999 | 6,784,792 | 940.9% |
| $150,000 to $199,999 | 6,204,310 | 860.4% |
| $200,000+ | 14,088,774 | 1,953.8% |
Household Income by Householder Age in Area Code 408
The median household income in Area Code 408 is $148,979, with the highest median household income of $175,342 found in the 25 to 44 years age bracket for the primary householder. A total of 270,164 households (37.5%) fall into this category. Meanwhile, the 65+ years age bracket for the primary householder has the lowest median household income of $81,902, with 155,103 households (21.5%) in this group.
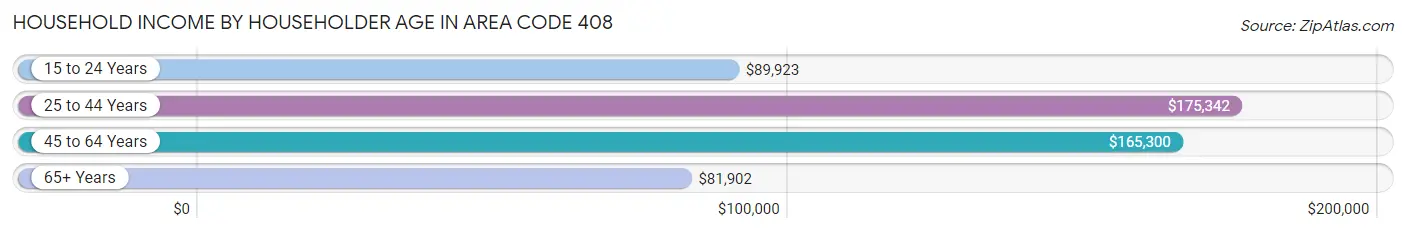
| Income Bracket | # Households | Median Income |
| 15 to 24 Years | 15,613 (2.2%) | $89,923 |
| 25 to 44 Years | 270,164 (37.5%) | $175,342 |
| 45 to 64 Years | 280,216 (38.9%) | $165,300 |
| 65+ Years | 155,103 (21.5%) | $81,902 |
| Total | 721,096 (100.0%) | $148,979 |
Poverty in Area Code 408
Income Below Poverty by Sex and Age in Area Code 408
With 6.9% poverty level for males and 8.5% for females among the residents of Area Code 408, 18 to 24 year old males and 18 to 24 year old females are the most vulnerable to poverty, with 11,702 males (12.2%) and 12,668 females (14.5%) in their respective age groups living below the poverty level.
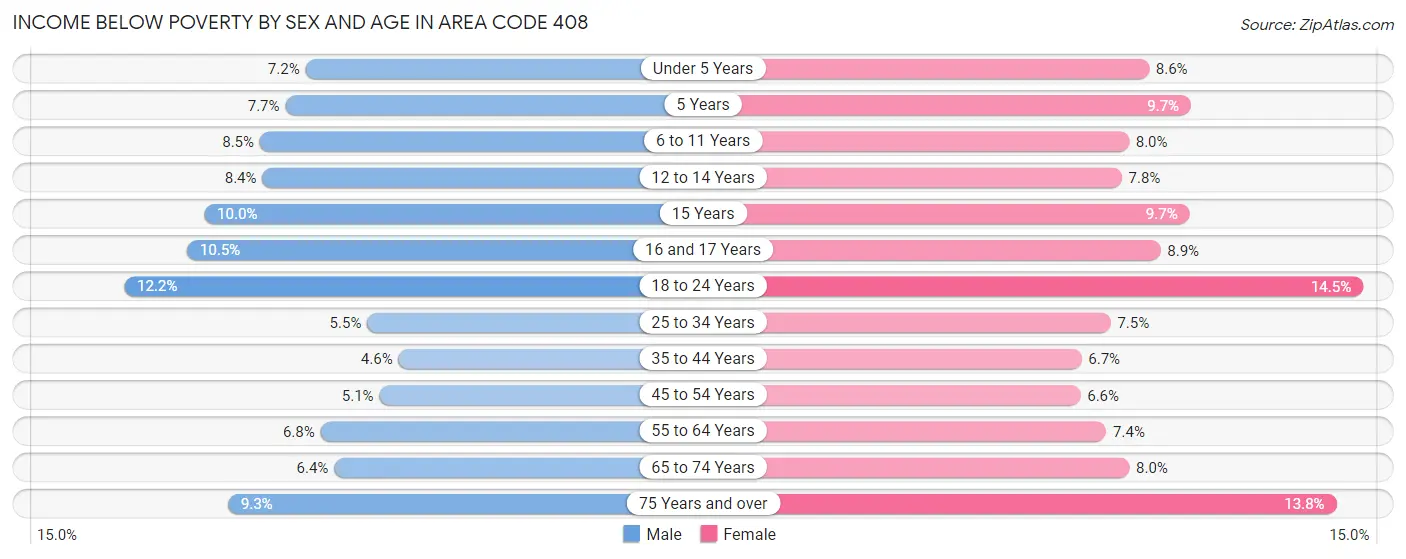
| Age Bracket | Male | Female |
| Under 5 Years | 4,632 (7.2%) | 5,189 (8.6%) |
| 5 Years | 1,003 (7.7%) | 1,168 (9.7%) |
| 6 to 11 Years | 6,983 (8.5%) | 6,313 (8.0%) |
| 12 to 14 Years | 3,809 (8.4%) | 3,293 (7.8%) |
| 15 Years | 1,472 (10.0%) | 1,345 (9.7%) |
| 16 and 17 Years | 3,021 (10.5%) | 2,427 (8.9%) |
| 18 to 24 Years | 11,702 (12.2%) | 12,668 (14.5%) |
| 25 to 34 Years | 10,033 (5.5%) | 11,978 (7.5%) |
| 35 to 44 Years | 7,667 (4.6%) | 10,219 (6.7%) |
| 45 to 54 Years | 7,752 (5.1%) | 9,500 (6.6%) |
| 55 to 64 Years | 9,033 (6.8%) | 9,448 (7.4%) |
| 65 to 74 Years | 5,122 (6.4%) | 7,074 (8.0%) |
| 75 Years and over | 4,917 (9.3%) | 9,988 (13.8%) |
| Total | 77,146 (6.9%) | 90,610 (8.5%) |
Income Above Poverty by Sex and Age in Area Code 408
According to the poverty statistics in Area Code 408, males aged 35 to 44 years and females aged 45 to 54 years are the age groups that are most secure financially, with 95.4% of males and 93.4% of females in these age groups living above the poverty line.
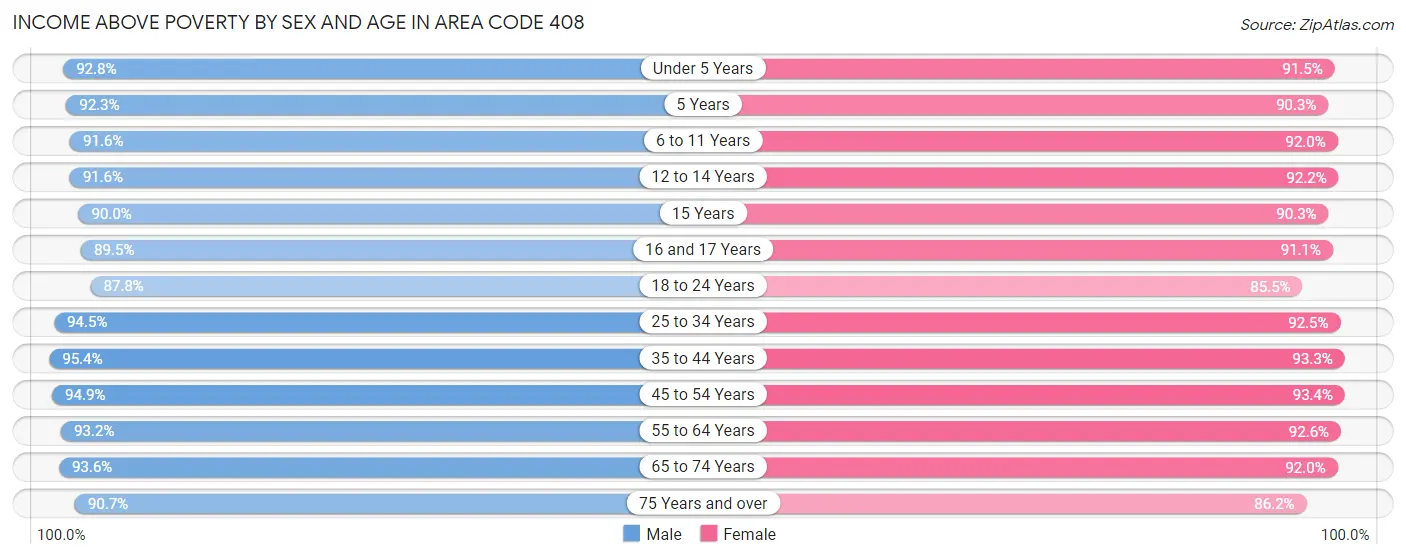
| Age Bracket | Male | Female |
| Under 5 Years | 59,859 (92.8%) | 55,490 (91.4%) |
| 5 Years | 11,961 (92.3%) | 10,848 (90.3%) |
| 6 to 11 Years | 75,694 (91.5%) | 72,661 (92.0%) |
| 12 to 14 Years | 41,634 (91.6%) | 39,002 (92.2%) |
| 15 Years | 13,252 (90.0%) | 12,547 (90.3%) |
| 16 and 17 Years | 25,813 (89.5%) | 24,943 (91.1%) |
| 18 to 24 Years | 83,958 (87.8%) | 74,650 (85.5%) |
| 25 to 34 Years | 173,839 (94.5%) | 148,099 (92.5%) |
| 35 to 44 Years | 159,542 (95.4%) | 142,886 (93.3%) |
| 45 to 54 Years | 143,726 (94.9%) | 133,540 (93.4%) |
| 55 to 64 Years | 124,605 (93.2%) | 118,875 (92.6%) |
| 65 to 74 Years | 75,105 (93.6%) | 81,335 (92.0%) |
| 75 Years and over | 47,726 (90.7%) | 62,560 (86.2%) |
| Total | 1,036,714 (93.1%) | 977,436 (91.5%) |
Income Below Poverty Among Married-Couple Families in Area Code 408
The poverty statistics for married-couple families in Area Code 408 show that 3.2% or 12,936 of the total 407,104 families live below the poverty line. Families with 5 or more children have the highest poverty rate of 15.7%, comprising of 262 families. On the other hand, families with 1 or 2 children have the lowest poverty rate of 2.7%, which includes 4,688 families.
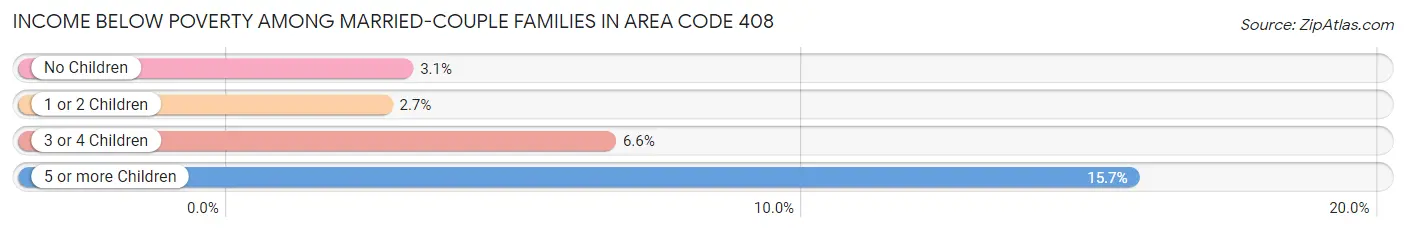
| Children | Above Poverty | Below Poverty |
| No Children | 199,017 (97.0%) | 6,264 (3.0%) |
| 1 or 2 Children | 169,284 (97.3%) | 4,688 (2.7%) |
| 3 or 4 Children | 24,459 (93.4%) | 1,722 (6.6%) |
| 5 or more Children | 1,408 (84.3%) | 262 (15.7%) |
| Total | 394,168 (96.8%) | 12,936 (3.2%) |
Income Below Poverty Among Single-Parent Households in Area Code 408
According to the poverty data in Area Code 408, 6.4% or 2,590 single-father households and 13.4% or 10,606 single-mother households are living below the poverty line. Among single-father households, those with 3 or 4 children have the highest poverty rate, with 521 households (20.9%) experiencing poverty. Likewise, among single-mother households, those with 5 or more children have the highest poverty rate, with 380 households (51.6%) falling below the poverty line.
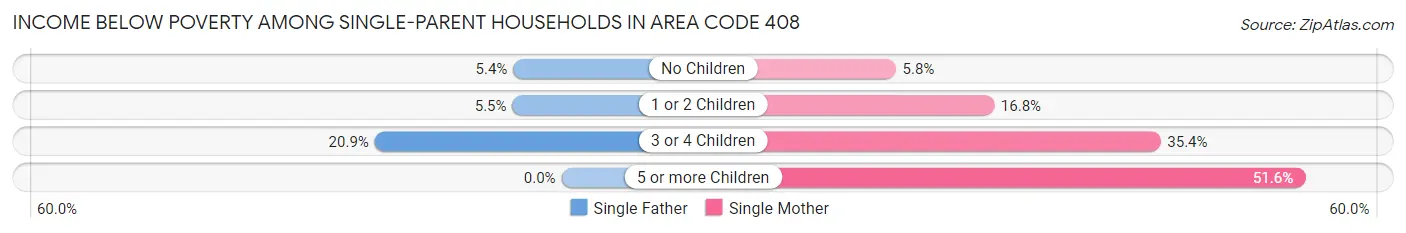
| Children | Single Father | Single Mother |
| No Children | 1,166 (5.4%) | 2,223 (5.8%) |
| 1 or 2 Children | 903 (5.5%) | 5,622 (16.8%) |
| 3 or 4 Children | 521 (20.9%) | 2,381 (35.4%) |
| 5 or more Children | 0 (0.0%) | 380 (51.6%) |
| Total | 2,590 (6.4%) | 10,606 (13.4%) |
Income Below Poverty Among Married-Couple vs Single-Parent Households in Area Code 408
The poverty data for Area Code 408 shows that 12,936 of the married-couple family households (3.2%) and 13,196 of the single-parent households (11.0%) are living below the poverty level. Within the married-couple family households, those with 5 or more children have the highest poverty rate, with 262 households (15.7%) falling below the poverty line. Among the single-parent households, those with 5 or more children have the highest poverty rate, with 380 household (42.0%) living below poverty.
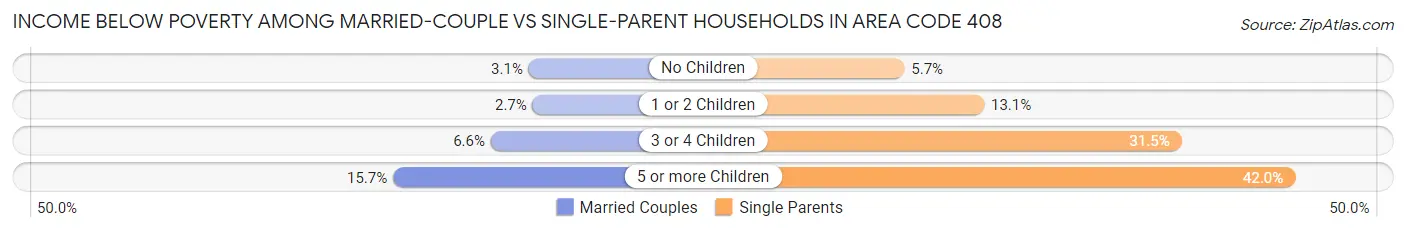
| Children | Married-Couple Families | Single-Parent Households |
| No Children | 6,264 (3.0%) | 3,389 (5.7%) |
| 1 or 2 Children | 4,688 (2.7%) | 6,525 (13.1%) |
| 3 or 4 Children | 1,722 (6.6%) | 2,902 (31.5%) |
| 5 or more Children | 262 (15.7%) | 380 (42.0%) |
| Total | 12,936 (3.2%) | 13,196 (11.0%) |
Race in Area Code 408
The most populous races in Area Code 408 are Asian (801,150 | 36.3%), White / Caucasian (741,921 | 33.7%), and Hispanic or Latino (704,978 | 32.0%).
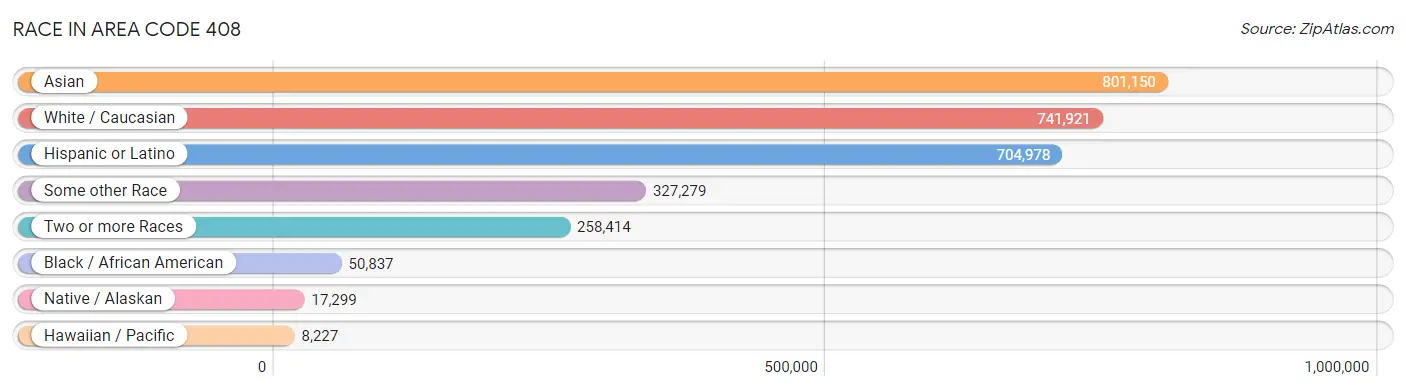
| Race | # Population | % Population |
| Asian | 801,150 | 36.3% |
| Black / African American | 50,837 | 2.3% |
| Hawaiian / Pacific | 8,227 | 0.4% |
| Hispanic or Latino | 704,978 | 32.0% |
| Native / Alaskan | 17,299 | 0.8% |
| White / Caucasian | 741,921 | 33.7% |
| Two or more Races | 258,414 | 11.7% |
| Some other Race | 327,279 | 14.8% |
| Total | 2,205,127 | 100.0% |
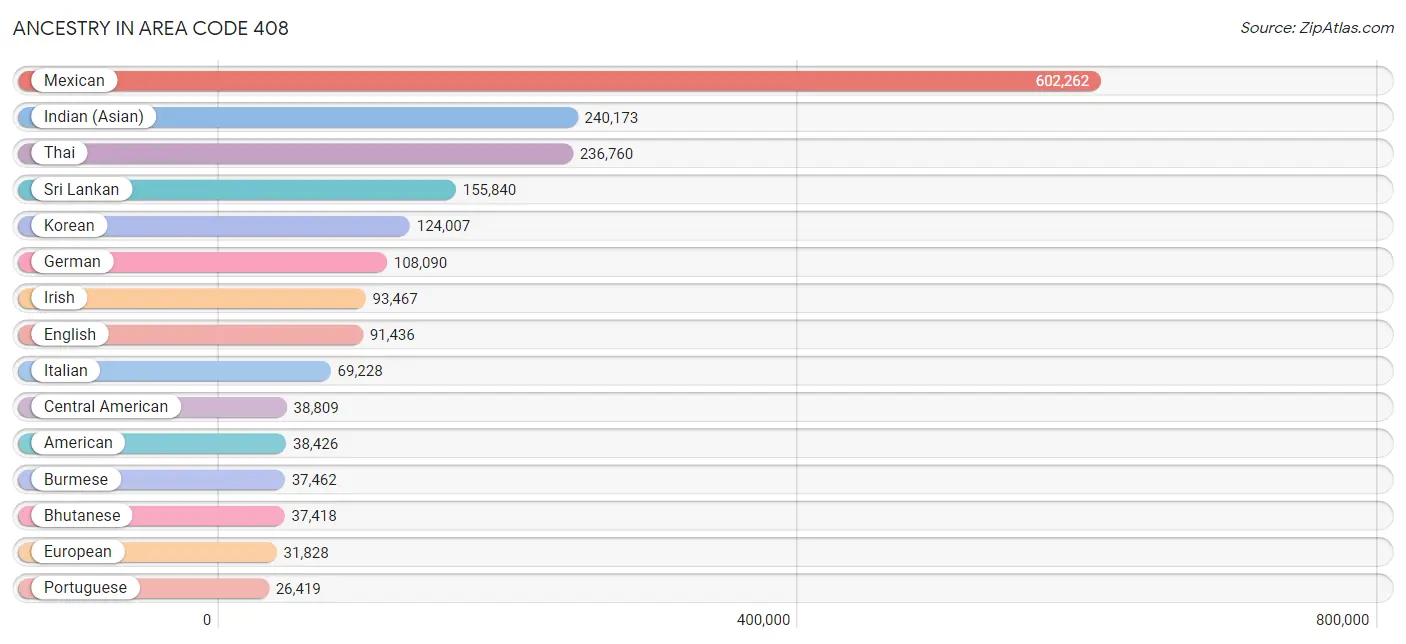
Ancestry in Area Code 408
The most populous ancestries reported in Area Code 408 are Mexican (602,262 | 27.3%), Indian (Asian) (240,173 | 10.9%), Thai (236,760 | 10.7%), Sri Lankan (155,840 | 7.1%), and Korean (124,007 | 5.6%), together accounting for 61.6% of all Area Code 408 residents.
| Ancestry | # Population | % Population |
| Afghan | 3,242 | 0.2% |
| African | 4,081 | 0.2% |
| Alaska Native | 42 | 0.0% |
| Alaskan Athabascan | 21 | 0.0% |
| Albanian | 216 | 0.0% |
| Aleut | 2 | 0.0% |
| Alsatian | 38 | 0.0% |
| American | 38,426 | 1.7% |
| Apache | 2,112 | 0.1% |
| Arab | 15,196 | 0.7% |
| Argentinean | 2,889 | 0.1% |
| Armenian | 3,366 | 0.2% |
| Assyrian / Chaldean / Syriac | 3,460 | 0.2% |
| Australian | 952 | 0.0% |
| Austrian | 3,154 | 0.1% |
| Bangladeshi | 1,227 | 0.1% |
| Barbadian | 73 | 0.0% |
| Basque | 575 | 0.0% |
| Belgian | 927 | 0.0% |
| Belizean | 59 | 0.0% |
| Bhutanese | 37,418 | 1.7% |
| Blackfeet | 864 | 0.0% |
| Bolivian | 548 | 0.0% |
| Brazilian | 3,482 | 0.2% |
| British | 9,881 | 0.4% |
| British West Indian | 80 | 0.0% |
| Bulgarian | 796 | 0.0% |
| Burmese | 37,462 | 1.7% |
| Cajun | 181 | 0.0% |
| Cambodian | 712 | 0.0% |
| Canadian | 2,859 | 0.1% |
| Cape Verdean | 221 | 0.0% |
| Celtic | 312 | 0.0% |
| Central American | 38,809 | 1.8% |
| Central American Indian | 2,237 | 0.1% |
| Cherokee | 3,578 | 0.2% |
| Cheyenne | 10 | 0.0% |
| Chickasaw | 71 | 0.0% |
| Chilean | 2,220 | 0.1% |
| Chinese | 51 | 0.0% |
| Chippewa | 370 | 0.0% |
| Choctaw | 987 | 0.0% |
| Colombian | 6,193 | 0.3% |
| Comanche | 312 | 0.0% |
| Costa Rican | 1,367 | 0.1% |
| Cree | 23 | 0.0% |
| Creek | 206 | 0.0% |
| Croatian | 3,702 | 0.2% |
| Crow | 24 | 0.0% |
| Cuban | 3,458 | 0.2% |
| Czech | 3,848 | 0.2% |
| Czechoslovakian | 893 | 0.0% |
| Danish | 6,470 | 0.3% |
| Delaware | 29 | 0.0% |
| Dominican | 595 | 0.0% |
| Dutch | 11,435 | 0.5% |
| Dutch West Indian | 25 | 0.0% |
| Eastern European | 4,297 | 0.2% |
| Ecuadorian | 917 | 0.0% |
| Egyptian | 2,869 | 0.1% |
| English | 91,436 | 4.2% |
| Estonian | 107 | 0.0% |
| Ethiopian | 4,690 | 0.2% |
| European | 31,828 | 1.4% |
| Fijian | 4 | 0.0% |
| Filipino | 18,545 | 0.8% |
| Finnish | 2,662 | 0.1% |
| French | 23,540 | 1.1% |
| French American Indian | 38 | 0.0% |
| French Canadian | 3,842 | 0.2% |
| German | 108,090 | 4.9% |
| German Russian | 41 | 0.0% |
| Ghanaian | 358 | 0.0% |
| Greek | 5,798 | 0.3% |
| Guamanian / Chamorro | 2,613 | 0.1% |
| Guatemalan | 7,008 | 0.3% |
| Guyanese | 237 | 0.0% |
| Haitian | 399 | 0.0% |
| Honduran | 4,679 | 0.2% |
| Hopi | 36 | 0.0% |
| Houma | 53 | 0.0% |
| Hungarian | 4,216 | 0.2% |
| Icelander | 642 | 0.0% |
| Indian (Asian) | 240,173 | 10.9% |
| Indonesian | 3,246 | 0.2% |
| Inupiat | 459 | 0.0% |
| Iranian | 17,816 | 0.8% |
| Iraqi | 820 | 0.0% |
| Irish | 93,467 | 4.2% |
| Iroquois | 154 | 0.0% |
| Israeli | 2,673 | 0.1% |
| Italian | 69,228 | 3.1% |
| Jamaican | 797 | 0.0% |
| Japanese | 5,004 | 0.2% |
| Jordanian | 708 | 0.0% |
| Kenyan | 610 | 0.0% |
| Kiowa | 20 | 0.0% |
| Korean | 124,007 | 5.6% |
| Laotian | 2,589 | 0.1% |
| Latvian | 532 | 0.0% |
| Lebanese | 3,074 | 0.1% |
| Liberian | 86 | 0.0% |
| Lithuanian | 2,502 | 0.1% |
| Lumbee | 19 | 0.0% |
| Luxembourger | 73 | 0.0% |
| Macedonian | 229 | 0.0% |
| Malaysian | 2,715 | 0.1% |
| Maltese | 601 | 0.0% |
| Menominee | 5 | 0.0% |
| Mexican | 602,262 | 27.3% |
| Mexican American Indian | 9,696 | 0.4% |
| Mongolian | 793 | 0.0% |
| Moroccan | 911 | 0.0% |
| Native Hawaiian | 5,069 | 0.2% |
| Navajo | 1,213 | 0.1% |
| Nepalese | 87 | 0.0% |
| New Zealander | 74 | 0.0% |
| Nicaraguan | 5,118 | 0.2% |
| Nigerian | 1,643 | 0.1% |
| Northern European | 3,844 | 0.2% |
| Norwegian | 13,540 | 0.6% |
| Okinawan | 445 | 0.0% |
| Osage | 15 | 0.0% |
| Ottawa | 238 | 0.0% |
| Paiute | 120 | 0.0% |
| Pakistani | 2,926 | 0.1% |
| Palestinian | 1,697 | 0.1% |
| Panamanian | 900 | 0.0% |
| Paraguayan | 68 | 0.0% |
| Pennsylvania German | 115 | 0.0% |
| Peruvian | 5,037 | 0.2% |
| Pima | 75 | 0.0% |
| Polish | 17,876 | 0.8% |
| Portuguese | 26,419 | 1.2% |
| Potawatomi | 221 | 0.0% |
| Pueblo | 211 | 0.0% |
| Puerto Rican | 11,587 | 0.5% |
| Puget Sound Salish | 9 | 0.0% |
| Romanian | 2,718 | 0.1% |
| Russian | 16,808 | 0.8% |
| Salvadoran | 19,482 | 0.9% |
| Samoan | 2,838 | 0.1% |
| Scandinavian | 3,880 | 0.2% |
| Scotch-Irish | 7,350 | 0.3% |
| Scottish | 17,722 | 0.8% |
| Seminole | 80 | 0.0% |
| Serbian | 739 | 0.0% |
| Shoshone | 22 | 0.0% |
| Sierra Leonean | 291 | 0.0% |
| Sioux | 309 | 0.0% |
| Slavic | 706 | 0.0% |
| Slovak | 1,154 | 0.1% |
| Slovene | 440 | 0.0% |
| Somali | 440 | 0.0% |
| South African | 465 | 0.0% |
| South American | 19,593 | 0.9% |
| South American Indian | 459 | 0.0% |
| Spaniard | 9,951 | 0.4% |
| Spanish | 6,718 | 0.3% |
| Spanish American | 129 | 0.0% |
| Spanish American Indian | 82 | 0.0% |
| Sri Lankan | 155,840 | 7.1% |
| Subsaharan African | 13,678 | 0.6% |
| Sudanese | 73 | 0.0% |
| Swedish | 14,140 | 0.6% |
| Swiss | 4,817 | 0.2% |
| Syrian | 1,265 | 0.1% |
| Taiwanese | 268 | 0.0% |
| Thai | 236,760 | 10.7% |
| Tlingit-Haida | 37 | 0.0% |
| Tohono O'Odham | 274 | 0.0% |
| Tongan | 1,693 | 0.1% |
| Trinidadian and Tobagonian | 343 | 0.0% |
| Tsimshian | 159 | 0.0% |
| Turkish | 3,155 | 0.1% |
| Ugandan | 36 | 0.0% |
| Ukrainian | 6,538 | 0.3% |
| Uruguayan | 324 | 0.0% |
| Ute | 35 | 0.0% |
| Venezuelan | 1,259 | 0.1% |
| Vietnamese | 1,867 | 0.1% |
| Welsh | 5,224 | 0.2% |
| West Indian | 220 | 0.0% |
| Yakama | 7 | 0.0% |
| Yaqui | 874 | 0.0% |
| Yugoslavian | 2,194 | 0.1% |
| Yuman | 45 | 0.0% |
| Yup'ik | 56 | 0.0% |
| Zimbabwean | 14 | 0.0% | View All 189 Rows |
Immigrants in Area Code 408
The most numerous immigrant groups reported in Area Code 408 came from Asia (566,792 | 25.7%), Latin America (242,500 | 11.0%), Central America (223,451 | 10.1%), Mexico (201,327 | 9.1%), and South Central Asia (193,897 | 8.8%), together accounting for 64.7% of all Area Code 408 residents.
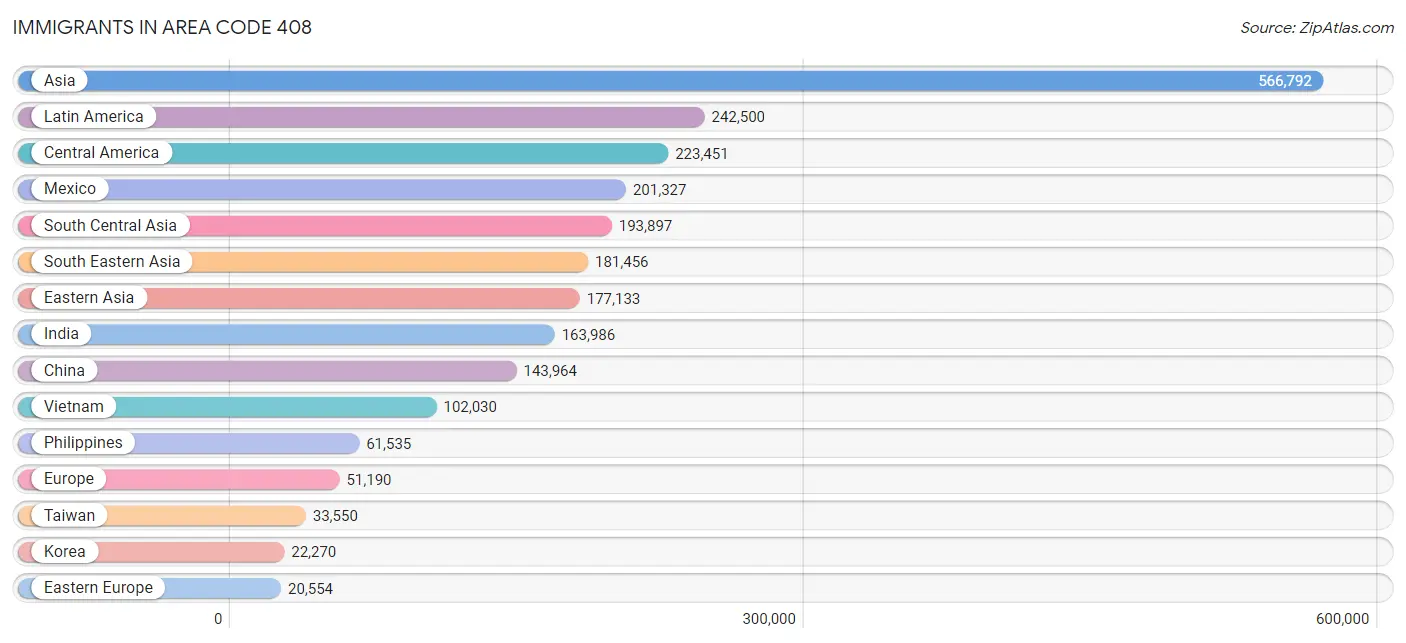
| Immigration Origin | # Population | % Population |
| Afghanistan | 2,312 | 0.1% |
| Africa | 13,030 | 0.6% |
| Albania | 10 | 0.0% |
| Argentina | 1,604 | 0.1% |
| Armenia | 515 | 0.0% |
| Asia | 566,792 | 25.7% |
| Australia | 1,125 | 0.1% |
| Austria | 418 | 0.0% |
| Azores | 1,212 | 0.1% |
| Bangladesh | 2,156 | 0.1% |
| Barbados | 25 | 0.0% |
| Belarus | 1,161 | 0.1% |
| Belgium | 351 | 0.0% |
| Belize | 81 | 0.0% |
| Bolivia | 381 | 0.0% |
| Bosnia and Herzegovina | 1,183 | 0.1% |
| Brazil | 4,306 | 0.2% |
| Bulgaria | 484 | 0.0% |
| Cambodia | 2,277 | 0.1% |
| Cameroon | 389 | 0.0% |
| Canada | 8,194 | 0.4% |
| Caribbean | 1,874 | 0.1% |
| Central America | 223,451 | 10.1% |
| Chile | 1,410 | 0.1% |
| China | 143,964 | 6.5% |
| Colombia | 4,458 | 0.2% |
| Congo | 63 | 0.0% |
| Costa Rica | 341 | 0.0% |
| Croatia | 719 | 0.0% |
| Cuba | 835 | 0.0% |
| Czechoslovakia | 505 | 0.0% |
| Denmark | 245 | 0.0% |
| Dominica | 38 | 0.0% |
| Dominican Republic | 188 | 0.0% |
| Eastern Africa | 7,137 | 0.3% |
| Eastern Asia | 177,133 | 8.0% |
| Eastern Europe | 20,554 | 0.9% |
| Ecuador | 387 | 0.0% |
| Egypt | 1,660 | 0.1% |
| El Salvador | 11,087 | 0.5% |
| England | 2,684 | 0.1% |
| Eritrea | 1,302 | 0.1% |
| Ethiopia | 3,681 | 0.2% |
| Europe | 51,190 | 2.3% |
| Fiji | 1,470 | 0.1% |
| France | 3,222 | 0.2% |
| Germany | 4,894 | 0.2% |
| Ghana | 293 | 0.0% |
| Greece | 917 | 0.0% |
| Grenada | 9 | 0.0% |
| Guatemala | 3,767 | 0.2% |
| Guyana | 163 | 0.0% |
| Haiti | 81 | 0.0% |
| Honduras | 3,455 | 0.2% |
| Hong Kong | 11,811 | 0.5% |
| Hungary | 483 | 0.0% |
| India | 163,986 | 7.4% |
| Indonesia | 2,883 | 0.1% |
| Iran | 16,422 | 0.7% |
| Iraq | 1,203 | 0.1% |
| Ireland | 979 | 0.0% |
| Israel | 3,580 | 0.2% |
| Italy | 1,920 | 0.1% |
| Jamaica | 433 | 0.0% |
| Japan | 10,401 | 0.5% |
| Jordan | 859 | 0.0% |
| Kazakhstan | 487 | 0.0% |
| Kenya | 982 | 0.0% |
| Korea | 22,270 | 1.0% |
| Kuwait | 363 | 0.0% |
| Laos | 1,884 | 0.1% |
| Latin America | 242,500 | 11.0% |
| Latvia | 227 | 0.0% |
| Lebanon | 1,711 | 0.1% |
| Liberia | 79 | 0.0% |
| Lithuania | 384 | 0.0% |
| Malaysia | 3,609 | 0.2% |
| Mexico | 201,327 | 9.1% |
| Micronesia | 32 | 0.0% |
| Middle Africa | 544 | 0.0% |
| Moldova | 409 | 0.0% |
| Morocco | 438 | 0.0% |
| Nepal | 1,719 | 0.1% |
| Netherlands | 1,090 | 0.1% |
| Nicaragua | 2,878 | 0.1% |
| Nigeria | 737 | 0.0% |
| North Macedonia | 61 | 0.0% |
| Northern Africa | 2,598 | 0.1% |
| Northern Europe | 10,649 | 0.5% |
| Norway | 106 | 0.0% |
| Oceania | 3,904 | 0.2% |
| Pakistan | 5,023 | 0.2% |
| Panama | 451 | 0.0% |
| Peru | 3,178 | 0.1% |
| Philippines | 61,535 | 2.8% |
| Poland | 1,457 | 0.1% |
| Portugal | 5,099 | 0.2% |
| Romania | 1,221 | 0.1% |
| Russia | 6,822 | 0.3% |
| Saudi Arabia | 647 | 0.0% |
| Scotland | 409 | 0.0% |
| Serbia | 231 | 0.0% |
| Sierra Leone | 336 | 0.0% |
| Singapore | 1,705 | 0.1% |
| Somalia | 455 | 0.0% |
| South Africa | 803 | 0.0% |
| South America | 17,175 | 0.8% |
| South Central Asia | 193,897 | 8.8% |
| South Eastern Asia | 181,456 | 8.2% |
| Southern Europe | 9,097 | 0.4% |
| Spain | 1,084 | 0.1% |
| Sri Lanka | 1,130 | 0.1% |
| Sudan | 120 | 0.0% |
| Sweden | 993 | 0.1% |
| Switzerland | 738 | 0.0% |
| Syria | 602 | 0.0% |
| Taiwan | 33,550 | 1.5% |
| Thailand | 2,227 | 0.1% |
| Trinidad and Tobago | 224 | 0.0% |
| Turkey | 1,823 | 0.1% |
| Uganda | 162 | 0.0% |
| Ukraine | 3,813 | 0.2% |
| Uruguay | 111 | 0.0% |
| Uzbekistan | 432 | 0.0% |
| Venezuela | 1,012 | 0.1% |
| Vietnam | 102,030 | 4.6% |
| Western Africa | 1,492 | 0.1% |
| Western Asia | 13,515 | 0.6% |
| Western Europe | 10,713 | 0.5% |
| Yemen | 215 | 0.0% |
| Zaire | 38 | 0.0% |
| Zimbabwe | 179 | 0.0% | View All 132 Rows |
Sex and Age in Area Code 408
Sex and Age in Area Code 408
The most populous age groups in Area Code 408 are 30 to 34 Years (95,472 | 8.5%) for men and 30 to 34 Years (83,579 | 7.7%) for women.
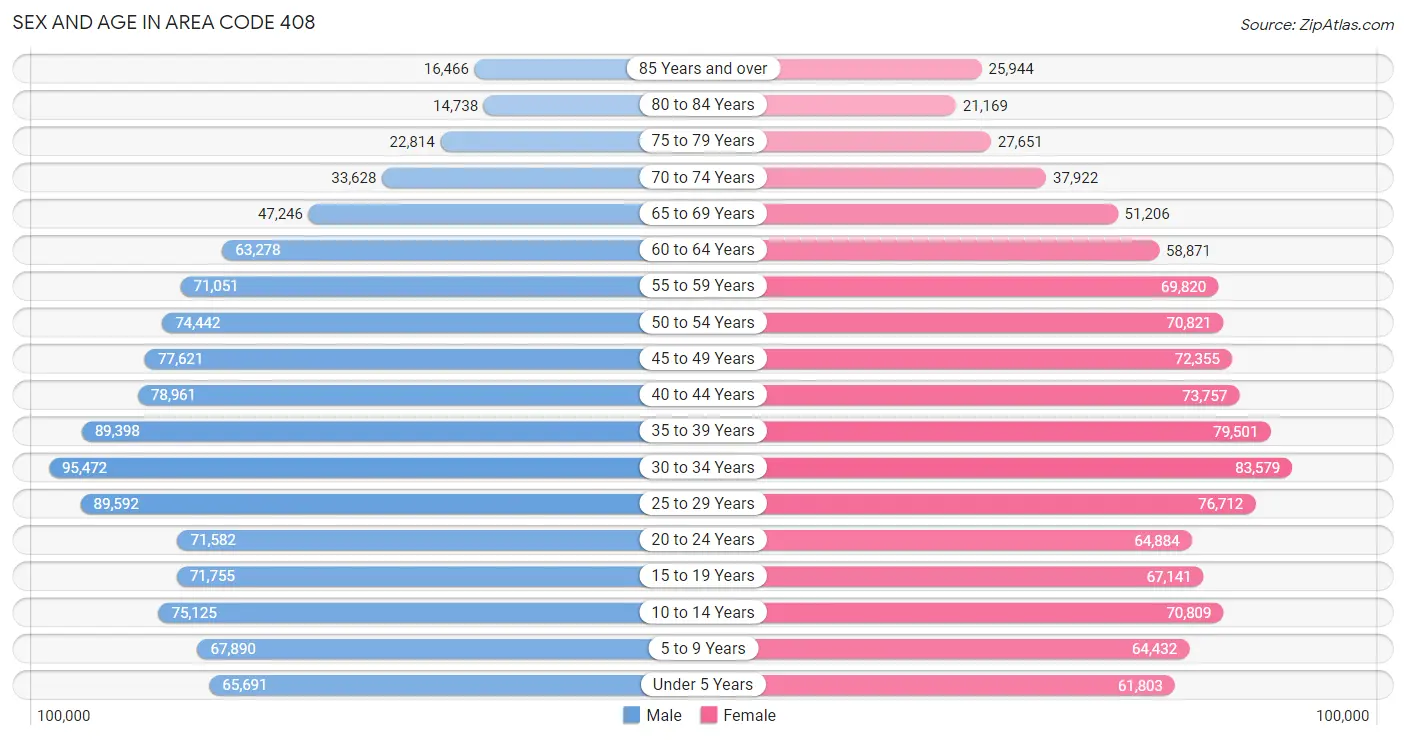
| Age Bracket | Male | Female |
| Under 5 Years | 65,691 (5.8%) | 61,803 (5.7%) |
| 5 to 9 Years | 67,890 (6.0%) | 64,432 (6.0%) |
| 10 to 14 Years | 75,125 (6.7%) | 70,809 (6.6%) |
| 15 to 19 Years | 71,755 (6.4%) | 67,141 (6.2%) |
| 20 to 24 Years | 71,582 (6.4%) | 64,884 (6.0%) |
| 25 to 29 Years | 89,592 (8.0%) | 76,712 (7.1%) |
| 30 to 34 Years | 95,472 (8.5%) | 83,579 (7.7%) |
| 35 to 39 Years | 89,398 (7.9%) | 79,501 (7.4%) |
| 40 to 44 Years | 78,961 (7.0%) | 73,757 (6.8%) |
| 45 to 49 Years | 77,621 (6.9%) | 72,355 (6.7%) |
| 50 to 54 Years | 74,442 (6.6%) | 70,821 (6.6%) |
| 55 to 59 Years | 71,051 (6.3%) | 69,820 (6.5%) |
| 60 to 64 Years | 63,278 (5.6%) | 58,871 (5.5%) |
| 65 to 69 Years | 47,246 (4.2%) | 51,206 (4.8%) |
| 70 to 74 Years | 33,628 (3.0%) | 37,922 (3.5%) |
| 75 to 79 Years | 22,814 (2.0%) | 27,651 (2.6%) |
| 80 to 84 Years | 14,738 (1.3%) | 21,169 (2.0%) |
| 85 Years and over | 16,466 (1.5%) | 25,944 (2.4%) |
| Total | 1,126,750 (100.0%) | 1,078,377 (100.0%) |
Families and Households in Area Code 408
Median Family Size in Area Code 408
The median family size in Area Code 408 is 3.37 persons per family, with married-couple families (407,104 | 77.2%) accounting for the largest median family size of 3.42438 persons per family. On the other hand, single male/father families (40,717 | 7.7%) represent the smallest median family size with 3.17 persons per family.
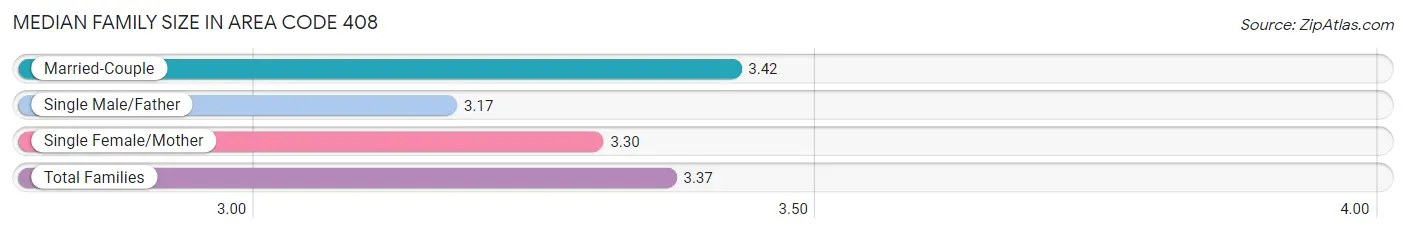
| Family Type | # Families | Family Size |
| Married-Couple | 407,104 (77.2%) | 3.42 |
| Single Male/Father | 40,717 (7.7%) | 3.17 |
| Single Female/Mother | 79,275 (15.0%) | 3.30 |
| Total Families | 527,096 (100.0%) | 3.37 |
Median Household Size in Area Code 408
The median household size in Area Code 408 is 3.00 persons per household, with single female/mother households (79,275 | 11.0%) accounting for the largest median household size of 3.61087 persons per household. non-family households (194,000 | 26.9%) represent the smallest median household size with 1.50 persons per household.
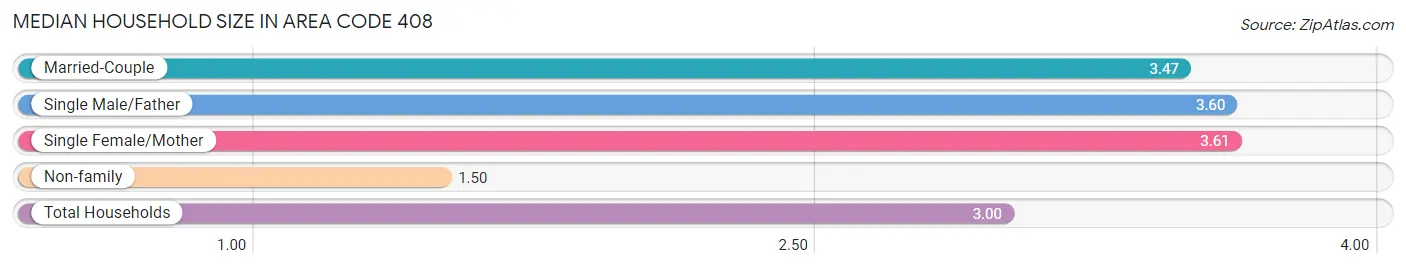
| Household Type | # Households | Household Size |
| Married-Couple | 407,104 (56.5%) | 3.47 |
| Single Male/Father | 40,717 (5.7%) | 3.60 |
| Single Female/Mother | 79,275 (11.0%) | 3.61 |
| Non-family | 194,000 (26.9%) | 1.50 |
| Total Households | 721,096 (100.0%) | 3.00 |
Household Size by Marriage Status in Area Code 408
Out of a total of 721,096 households in Area Code 408, 527,096 (73.1%) are family households, while 194,000 (26.9%) are nonfamily households. The most numerous type of family households are 2-person households, comprising 173,006, and the most common type of nonfamily households are 1-person households, comprising 139,285.
| Household Size | Family Households | Nonfamily Households |
| 1-Person Households | - | 139,285 (19.3%) |
| 2-Person Households | 173,006 (24.0%) | 39,602 (5.5%) |
| 3-Person Households | 131,250 (18.2%) | 8,561 (1.2%) |
| 4-Person Households | 127,172 (17.6%) | 3,654 (0.5%) |
| 5-Person Households | 54,588 (7.6%) | 1,973 (0.3%) |
| 6-Person Households | 22,252 (3.1%) | 501 (0.1%) |
| 7+ Person Households | 18,828 (2.6%) | 424 (0.1%) |
| Total | 527,096 (73.1%) | 194,000 (26.9%) |
Female Fertility in Area Code 408
Fertility by Age in Area Code 408
Average fertility rate in Area Code 408 is 46.3 births per 1,000 women. Women in the age bracket of 20 to 34 years have the highest fertility rate with 66.6 births per 1,000 women. Women in the age bracket of 20 to 34 years acount for 59.3% of all women with births.
| Age Bracket | Women with Births | Births / 1,000 Women |
| 15 to 19 years | 313 (1.3%) | 11.5 |
| 20 to 34 years | 14,647 (59.3%) | 66.6 |
| 35 to 50 years | 9,751 (39.5%) | 43.1 |
| Total | 24,711 (100.0%) | 46.3 |
Fertility by Age by Marriage Status in Area Code 408
80.5% of women with births (24,711) in Area Code 408 are married. The highest percentage of unmarried women with births falls into 15 to 19 years age bracket with 100.0% of them unmarried at the time of birth, while the lowest percentage of unmarried women with births belong to 35 to 50 years age bracket with 18.7% of them unmarried.
| Age Bracket | Married | Unmarried |
| 15 to 19 years | 0 (0.0%) | 313 (100.0%) |
| 20 to 34 years | 11,147 (76.1%) | 3,500 (23.9%) |
| 35 to 50 years | 7,929 (81.3%) | 1,822 (18.7%) |
| Total | 19,881 (80.4%) | 4,830 (19.6%) |
Fertility by Education in Area Code 408
Average fertility rate in Area Code 408 is 46.3 births per 1,000 women. Women with the education attainment of graduate degree have the highest fertility rate of 73.1 births per 1,000 women, while women with the education attainment of less than high school have the lowest fertility at 31.9 births per 1,000 women. Women with the education attainment of bachelor's degree represent 28.6% of all women with births.
| Educational Attainment | Women with Births | Births / 1,000 Women |
| Less than High School | 2,520 (10.2%) | 31.9 |
| High School Diploma | 3,412 (13.8%) | 48.6 |
| College or Associate's Degree | 5,145 (20.8%) | 44.8 |
| Bachelor's Degree | 7,079 (28.6%) | 53.5 |
| Graduate Degree | 6,555 (26.5%) | 73.1 |
| Total | 24,711 (100.0%) | 46.3 |
Fertility by Education by Marriage Status in Area Code 408
19.6% of women with births in Area Code 408 are unmarried. Women with the educational attainment of graduate degree are most likely to be married with 86.2% of them married at childbirth, while women with the educational attainment of less than high school are least likely to be married with 59.8% of them unmarried at childbirth.
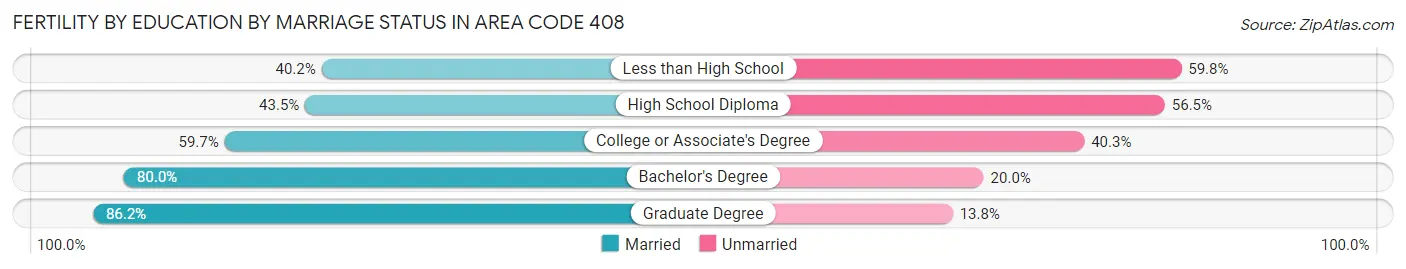
| Educational Attainment | Married | Unmarried |
| Less than High School | 1,012 (40.2%) | 1,508 (59.8%) |
| High School Diploma | 1,483 (43.5%) | 1,929 (56.5%) |
| College or Associate's Degree | 3,072 (59.7%) | 2,073 (40.3%) |
| Bachelor's Degree | 5,662 (80.0%) | 1,417 (20.0%) |
| Graduate Degree | 5,652 (86.2%) | 903 (13.8%) |
| Total | 19,881 (80.4%) | 4,830 (19.6%) |
Employment Characteristics in Area Code 408
Employment by Class of Employer in Area Code 408
Among the 1,092,345 employed individuals in Area Code 408, private company employees (825,879 | 75.6%), local government employees (76,626 | 7.0%), and not-for-profit organizations (65,121 | 6.0%) make up the most common classes of employment.
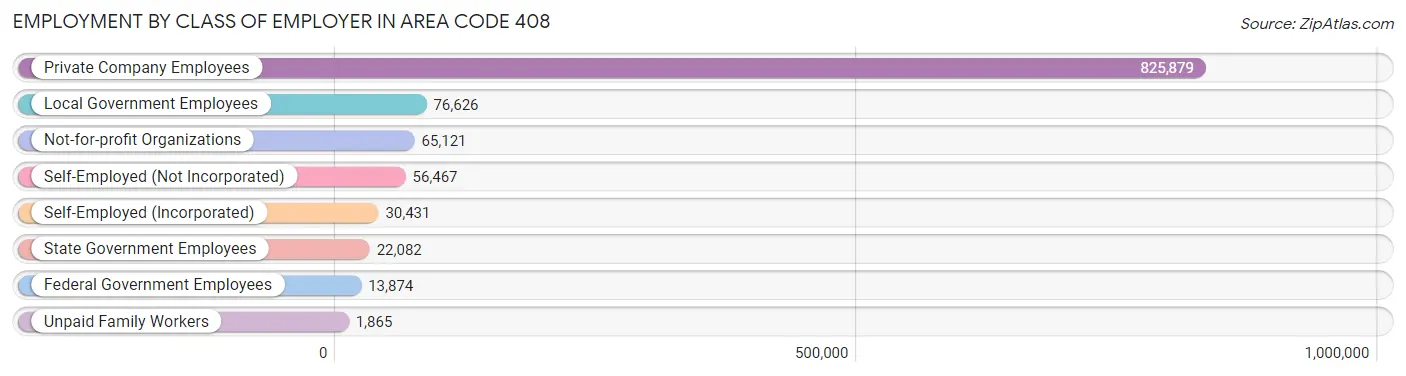
| Employer Class | # Employees | % Employees |
| Private Company Employees | 825,879 | 75.6% |
| Self-Employed (Incorporated) | 30,431 | 2.8% |
| Self-Employed (Not Incorporated) | 56,467 | 5.2% |
| Not-for-profit Organizations | 65,121 | 6.0% |
| Local Government Employees | 76,626 | 7.0% |
| State Government Employees | 22,082 | 2.0% |
| Federal Government Employees | 13,874 | 1.3% |
| Unpaid Family Workers | 1,865 | 0.2% |
| Total | 1,092,345 | 100.0% |
Employment Status by Age in Area Code 408
According to the labor force statistics for Area Code 408, out of the total population over 16 years of age (1,770,720), 66.4% or 1,176,643 individuals are in the labor force, with 5.5% or 64,480 of them unemployed. The age group with the highest labor force participation rate is 30 to 34 years, with 85.5% or 152,999 individuals in the labor force. Within the labor force, the 16 to 19 years age range has the highest percentage of unemployed individuals, with 620.6% or 192,653 of them being unemployed.
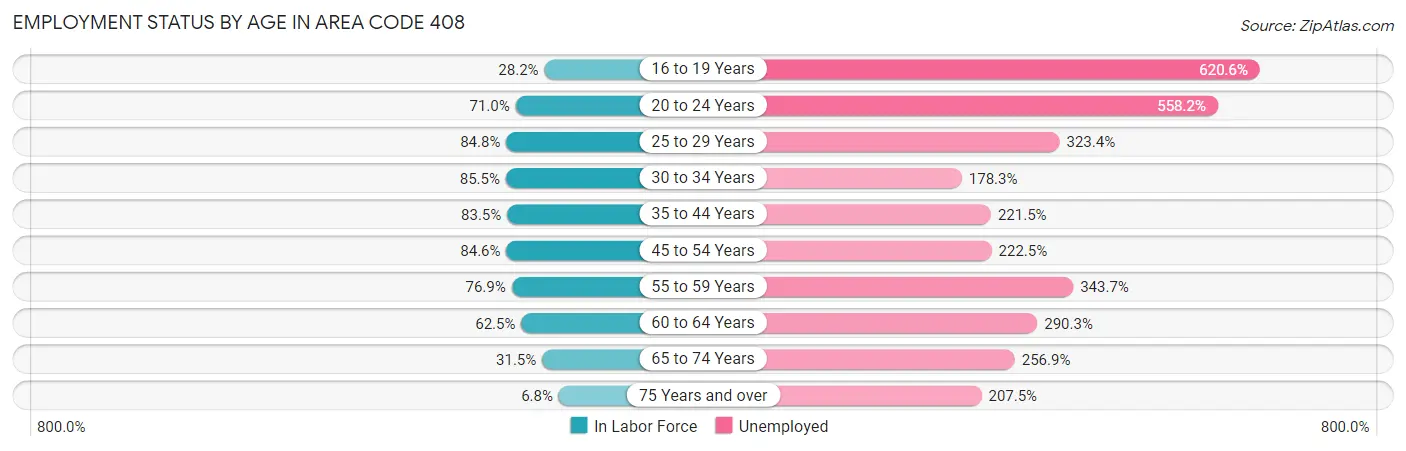
| Age Bracket | In Labor Force | Unemployed |
| 16 to 19 Years | 31,042 (28.2%) | 192,653 (620.6%) |
| 20 to 24 Years | 96,833 (71.0%) | 540,539 (558.2%) |
| 25 to 29 Years | 141,032 (84.8%) | 456,078 (323.4%) |
| 30 to 34 Years | 152,994 (85.5%) | 272,797 (178.3%) |
| 35 to 44 Years | 268,533 (83.5%) | 594,767 (221.5%) |
| 45 to 54 Years | 249,833 (84.6%) | 555,874 (222.5%) |
| 55 to 59 Years | 108,345 (76.9%) | 372,378 (343.7%) |
| 60 to 64 Years | 76,313 (62.5%) | 221,554 (290.3%) |
| 65 to 74 Years | 53,596 (31.5%) | 137,704 (256.9%) |
| 75 Years and over | 8,706 (6.8%) | 18,065 (207.5%) |
| Total | 1,176,658 (66.4%) | 64,431 (5.5%) |
Employment Status by Educational Attainment in Area Code 408
According to labor force statistics for Area Code 408, 81.4% of individuals (997,093) out of the total population between 25 and 64 years of age (1,225,231) are in the labor force, with 277.9% or 2,770,921 of them being unemployed. The group with the highest labor force participation rate are those with the educational attainment of bachelor's degree or higher, with 86.0% or 543,262 individuals in the labor force. Within the labor force, individuals with college / associate degree education have the highest percentage of unemployment, with 383.0% or 794,357 of them being unemployed.
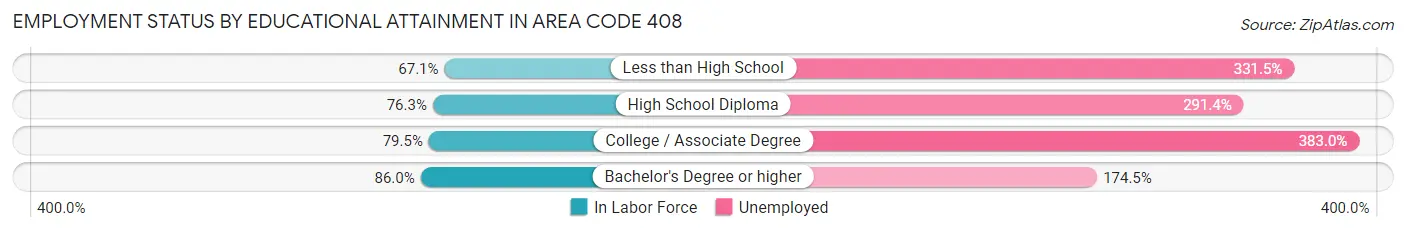
| Educational Attainment | In Labor Force | Unemployed |
| Less than High School | 100,738 (67.1%) | 497,538 (331.5%) |
| High School Diploma | 139,425 (76.3%) | 532,309 (291.4%) |
| College / Associate Degree | 207,412 (79.5%) | 999,316 (383.0%) |
| Bachelor's Degree or higher | 543,232 (86.0%) | 1,102,060 (174.5%) |
| Total | 997,047 (81.4%) | 3,404,917 (277.9%) |
Employment Occupations by Sex in Area Code 408
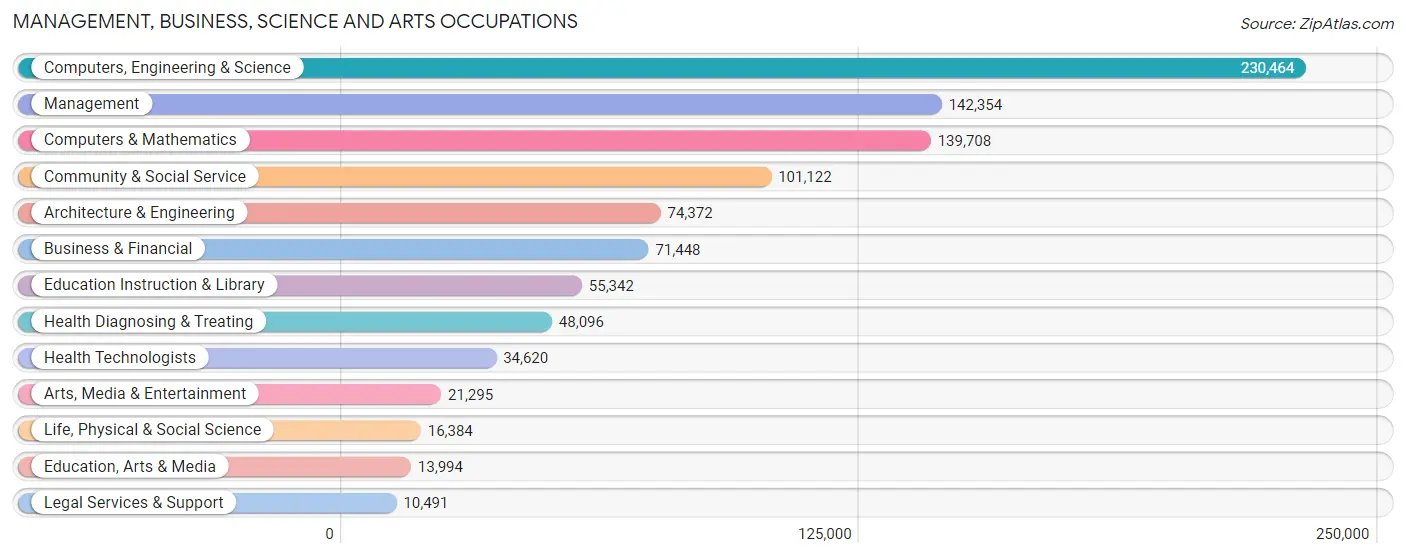
Management, Business, Science and Arts Occupations
The most common Management, Business, Science and Arts occupations in Area Code 408 are Computers, Engineering & Science (230,464 | 20.4%), Management (142,354 | 12.6%), Computers & Mathematics (139,708 | 12.3%), Community & Social Service (101,122 | 8.9%), and Architecture & Engineering (74,372 | 6.6%).
Management, Business, Science and Arts Occupations by Sex
Within the Management, Business, Science and Arts occupations in Area Code 408, the most male-oriented occupations are Architecture & Engineering (79.7%), Computers & Mathematics (74.8%), and Computers, Engineering & Science (74.3%), while the most female-oriented occupations are Health Technologists (73.4%), Education Instruction & Library (72.0%), and Health Diagnosing & Treating (71.7%).
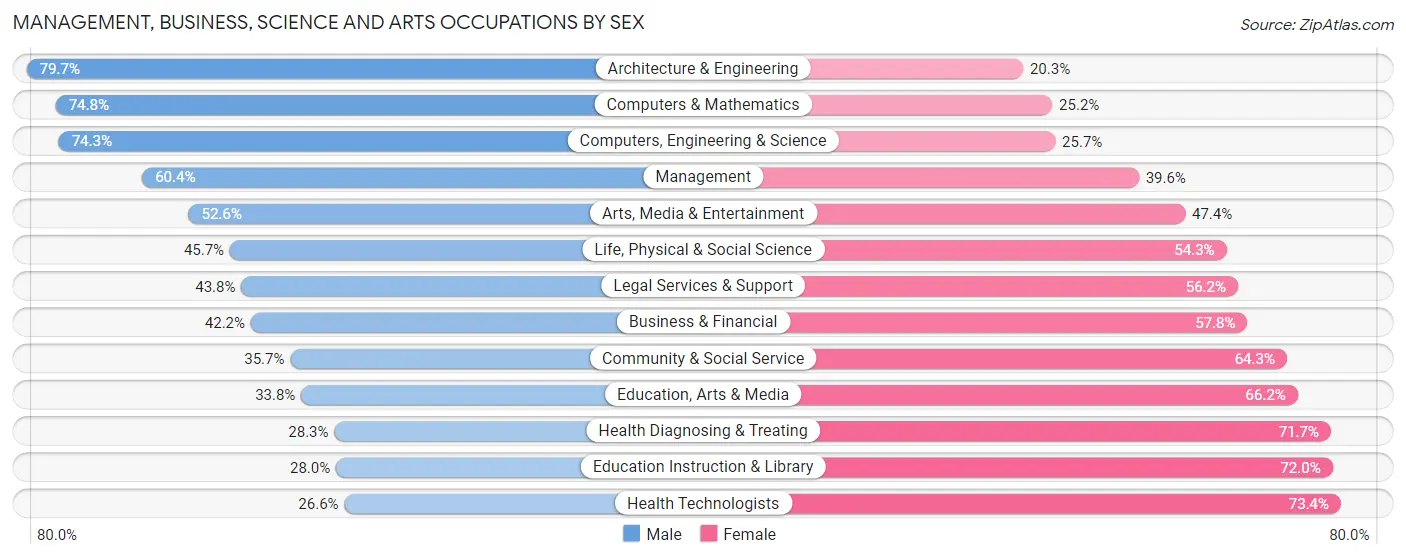
| Occupation | Male | Female |
| Management | 85,922 (60.4%) | 56,432 (39.6%) |
| Business & Financial | 30,183 (42.2%) | 41,265 (57.8%) |
| Computers, Engineering & Science | 171,245 (74.3%) | 59,219 (25.7%) |
| Computers & Mathematics | 104,497 (74.8%) | 35,211 (25.2%) |
| Architecture & Engineering | 59,255 (79.7%) | 15,117 (20.3%) |
| Life, Physical & Social Science | 7,493 (45.7%) | 8,891 (54.3%) |
| Community & Social Service | 36,056 (35.7%) | 65,066 (64.3%) |
| Education, Arts & Media | 4,736 (33.8%) | 9,258 (66.2%) |
| Legal Services & Support | 4,598 (43.8%) | 5,893 (56.2%) |
| Education Instruction & Library | 15,514 (28.0%) | 39,828 (72.0%) |
| Arts, Media & Entertainment | 11,208 (52.6%) | 10,087 (47.4%) |
| Health Diagnosing & Treating | 13,618 (28.3%) | 34,478 (71.7%) |
| Health Technologists | 9,219 (26.6%) | 25,401 (73.4%) |
| Total (Category) | 337,024 (56.8%) | 256,460 (43.2%) |
| Total (Overall) | 637,262 (56.3%) | 494,524 (43.7%) |
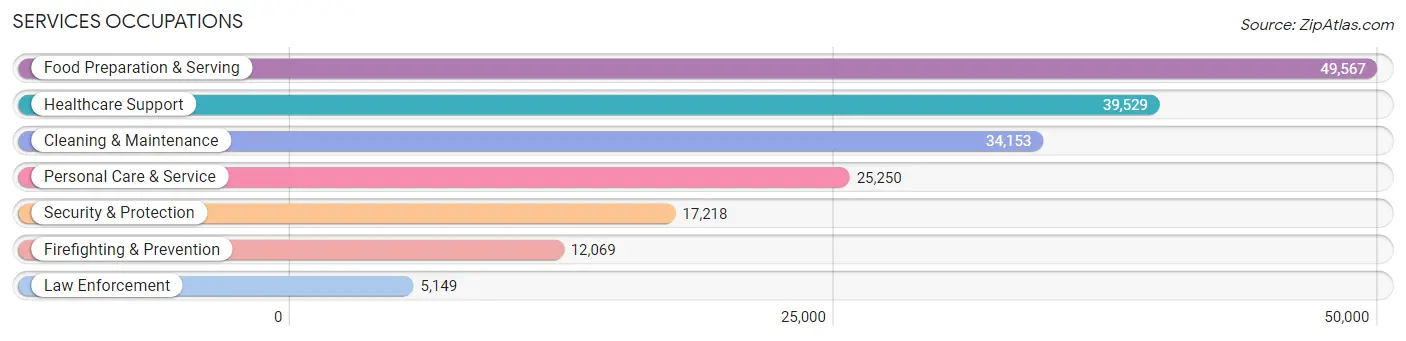
Services Occupations
The most common Services occupations in Area Code 408 are Food Preparation & Serving (49,567 | 4.4%), Healthcare Support (39,529 | 3.5%), Cleaning & Maintenance (34,153 | 3.0%), Personal Care & Service (25,250 | 2.2%), and Security & Protection (17,218 | 1.5%).
Services Occupations by Sex
Within the Services occupations in Area Code 408, the most male-oriented occupations are Law Enforcement (82.0%), Security & Protection (76.9%), and Firefighting & Prevention (74.7%), while the most female-oriented occupations are Personal Care & Service (79.0%), Healthcare Support (78.4%), and Food Preparation & Serving (51.0%).
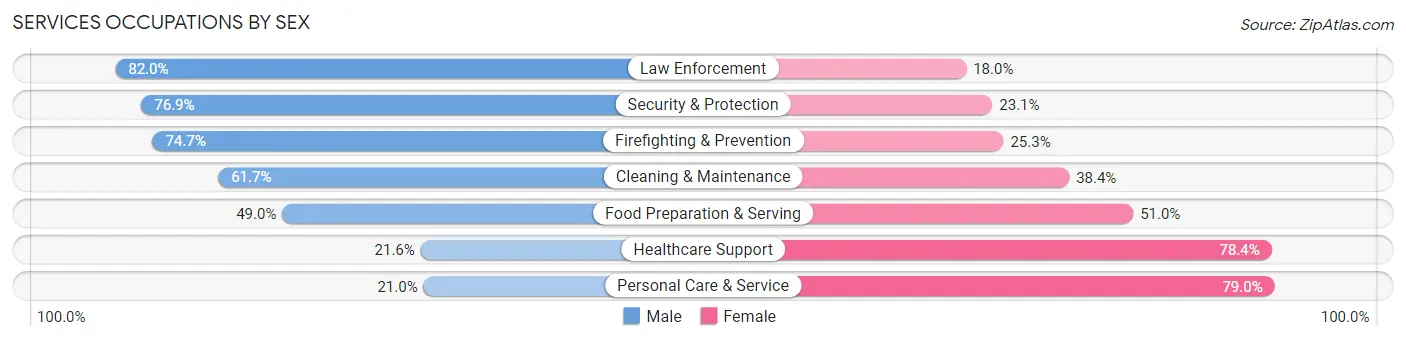
| Occupation | Male | Female |
| Healthcare Support | 8,529 (21.6%) | 31,000 (78.4%) |
| Security & Protection | 13,236 (76.9%) | 3,982 (23.1%) |
| Firefighting & Prevention | 9,012 (74.7%) | 3,057 (25.3%) |
| Law Enforcement | 4,224 (82.0%) | 925 (18.0%) |
| Food Preparation & Serving | 24,280 (49.0%) | 25,287 (51.0%) |
| Cleaning & Maintenance | 21,056 (61.7%) | 13,097 (38.4%) |
| Personal Care & Service | 5,304 (21.0%) | 19,946 (79.0%) |
| Total (Category) | 72,405 (43.7%) | 93,312 (56.3%) |
| Total (Overall) | 637,262 (56.3%) | 494,524 (43.7%) |
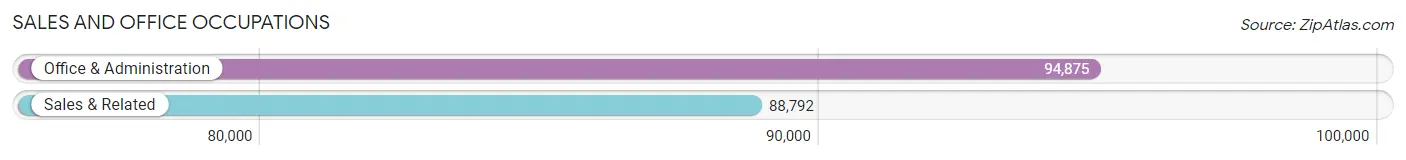
Sales and Office Occupations
The most common Sales and Office occupations in Area Code 408 are Office & Administration (94,875 | 8.4%), and Sales & Related (88,792 | 7.9%).
Sales and Office Occupations by Sex
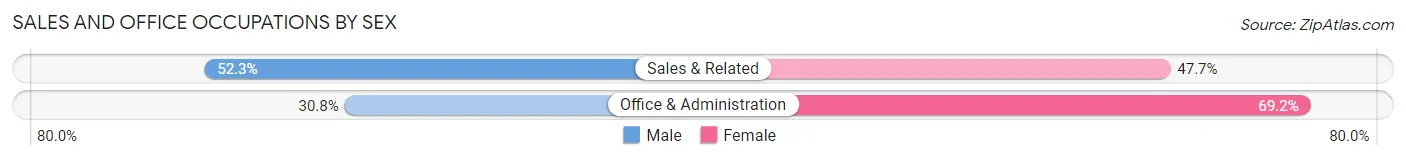
| Occupation | Male | Female |
| Sales & Related | 46,470 (52.3%) | 42,322 (47.7%) |
| Office & Administration | 29,206 (30.8%) | 65,669 (69.2%) |
| Total (Category) | 75,676 (41.2%) | 107,991 (58.8%) |
| Total (Overall) | 637,262 (56.3%) | 494,524 (43.7%) |
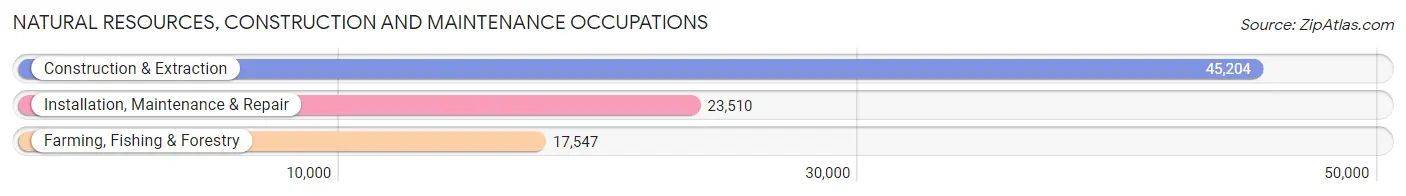
Natural Resources, Construction and Maintenance Occupations
The most common Natural Resources, Construction and Maintenance occupations in Area Code 408 are Construction & Extraction (45,204 | 4.0%), Installation, Maintenance & Repair (23,510 | 2.1%), and Farming, Fishing & Forestry (17,547 | 1.5%).
Natural Resources, Construction and Maintenance Occupations by Sex
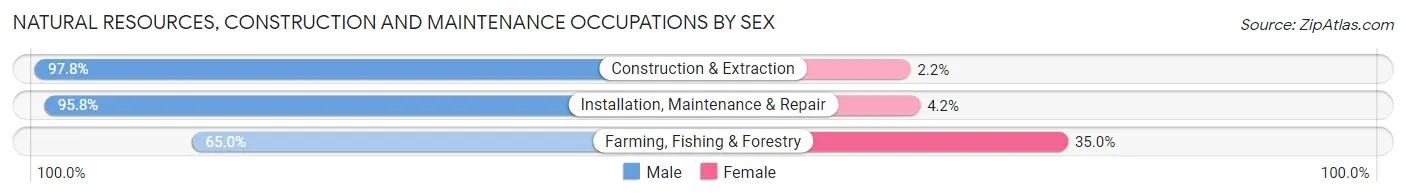
| Occupation | Male | Female |
| Farming, Fishing & Forestry | 11,411 (65.0%) | 6,136 (35.0%) |
| Construction & Extraction | 44,211 (97.8%) | 993 (2.2%) |
| Installation, Maintenance & Repair | 22,515 (95.8%) | 995 (4.2%) |
| Total (Category) | 78,137 (90.6%) | 8,124 (9.4%) |
| Total (Overall) | 637,262 (56.3%) | 494,524 (43.7%) |
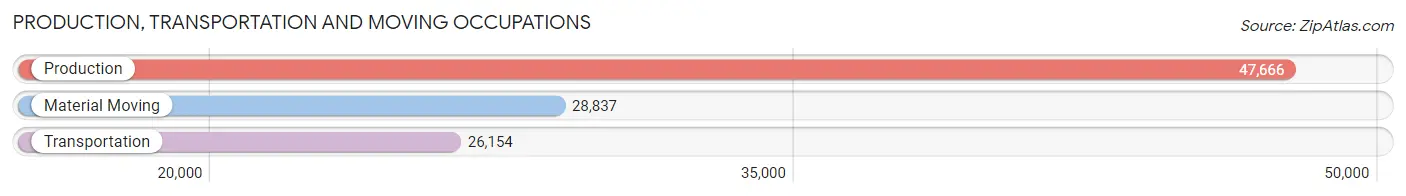
Production, Transportation and Moving Occupations
The most common Production, Transportation and Moving occupations in Area Code 408 are Production (47,666 | 4.2%), Material Moving (28,837 | 2.5%), and Transportation (26,154 | 2.3%).
Production, Transportation and Moving Occupations by Sex
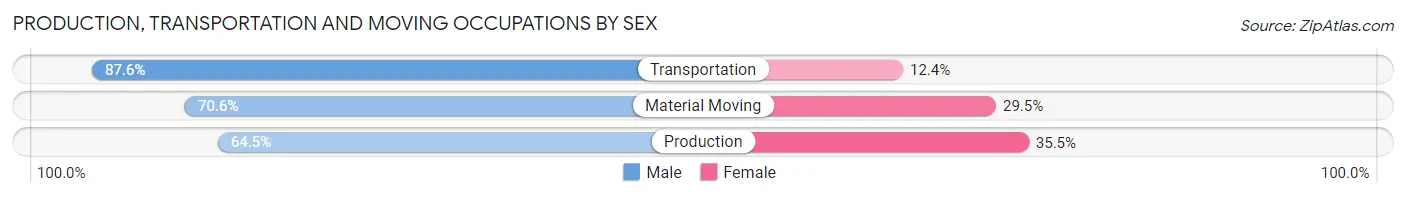
| Occupation | Male | Female |
| Production | 30,761 (64.5%) | 16,905 (35.5%) |
| Transportation | 22,915 (87.6%) | 3,239 (12.4%) |
| Material Moving | 20,344 (70.6%) | 8,493 (29.4%) |
| Total (Category) | 74,020 (72.1%) | 28,637 (27.9%) |
| Total (Overall) | 637,262 (56.3%) | 494,524 (43.7%) |
Employment Industries by Sex in Area Code 408
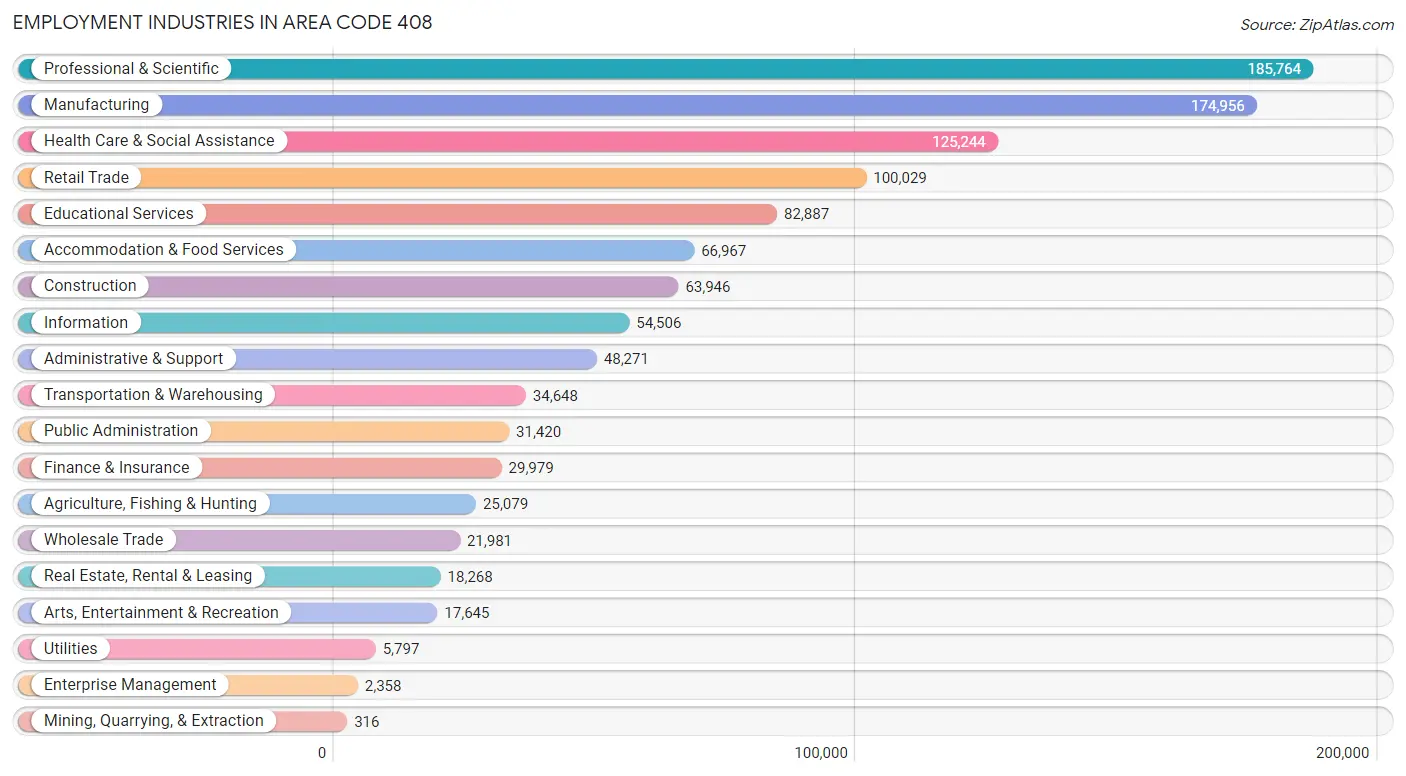
Employment Industries in Area Code 408
The major employment industries in Area Code 408 include Professional & Scientific (185,764 | 16.4%), Manufacturing (174,956 | 15.5%), Health Care & Social Assistance (125,244 | 11.1%), Retail Trade (100,029 | 8.8%), and Educational Services (82,887 | 7.3%).
Employment Industries by Sex in Area Code 408
The Area Code 408 industries that see more men than women are Construction (89.8%), Transportation & Warehousing (77.2%), and Manufacturing (68.9%), whereas the industries that tend to have a higher number of women are Health Care & Social Assistance (74.5%), Educational Services (67.3%), and Finance & Insurance (56.7%).
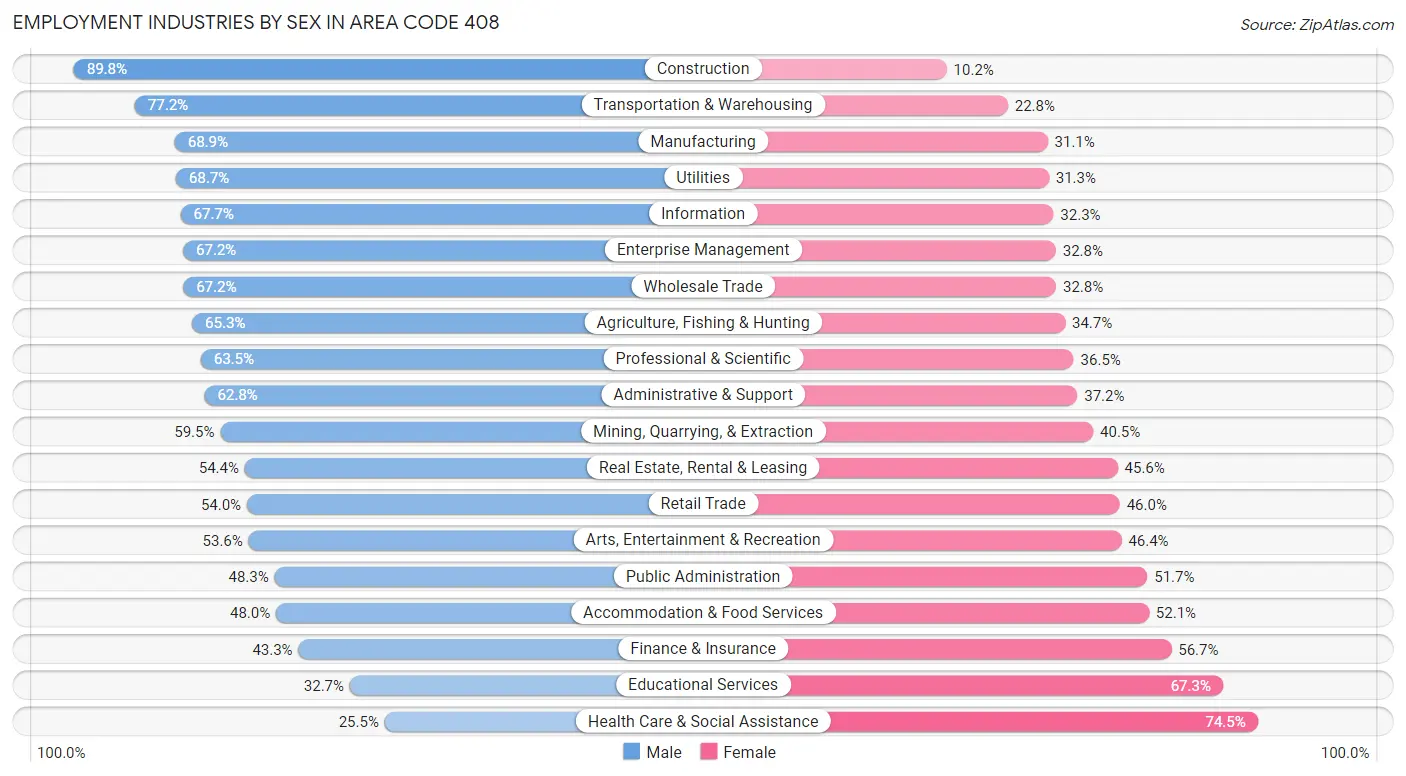
| Industry | Male | Female |
| Agriculture, Fishing & Hunting | 16,379 (65.3%) | 8,700 (34.7%) |
| Mining, Quarrying, & Extraction | 188 (59.5%) | 128 (40.5%) |
| Construction | 57,433 (89.8%) | 6,513 (10.2%) |
| Manufacturing | 120,563 (68.9%) | 54,393 (31.1%) |
| Wholesale Trade | 14,762 (67.2%) | 7,219 (32.8%) |
| Retail Trade | 53,999 (54.0%) | 46,030 (46.0%) |
| Transportation & Warehousing | 26,734 (77.2%) | 7,914 (22.8%) |
| Utilities | 3,981 (68.7%) | 1,816 (31.3%) |
| Information | 36,904 (67.7%) | 17,602 (32.3%) |
| Finance & Insurance | 12,988 (43.3%) | 16,991 (56.7%) |
| Real Estate, Rental & Leasing | 9,942 (54.4%) | 8,326 (45.6%) |
| Professional & Scientific | 118,004 (63.5%) | 67,760 (36.5%) |
| Enterprise Management | 1,585 (67.2%) | 773 (32.8%) |
| Administrative & Support | 30,300 (62.8%) | 17,971 (37.2%) |
| Educational Services | 27,080 (32.7%) | 55,807 (67.3%) |
| Health Care & Social Assistance | 31,883 (25.5%) | 93,361 (74.5%) |
| Arts, Entertainment & Recreation | 9,463 (53.6%) | 8,182 (46.4%) |
| Accommodation & Food Services | 32,111 (47.9%) | 34,856 (52.0%) |
| Public Administration | 15,165 (48.3%) | 16,255 (51.7%) |
| Total | 637,262 (56.3%) | 494,524 (43.7%) |
Education in Area Code 408
School Enrollment in Area Code 408
The most common levels of schooling among the 565,281 students in Area Code 408 are college / undergraduate (131,549 | 23.3%), high school (119,927 | 21.2%), and middle school (110,947 | 19.6%).
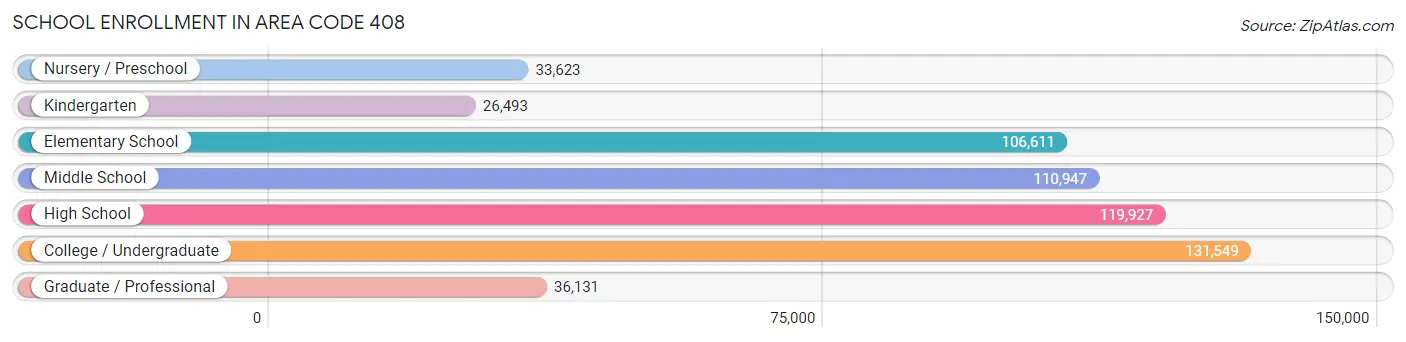
| School Level | # Students | % Students |
| Nursery / Preschool | 33,623 | 5.9% |
| Kindergarten | 26,493 | 4.7% |
| Elementary School | 106,611 | 18.9% |
| Middle School | 110,947 | 19.6% |
| High School | 119,927 | 21.2% |
| College / Undergraduate | 131,549 | 23.3% |
| Graduate / Professional | 36,131 | 6.4% |
| Total | 565,281 | 100.0% |
School Enrollment by Age by Funding Source in Area Code 408
Out of a total of 565,281 students who are enrolled in schools in Area Code 408, 99,025 (17.5%) attend a private institution, while the remaining 466,256 (82.5%) are enrolled in public schools. The age group of 3 to 4 year olds has the highest likelihood of being enrolled in private schools, with 16,943 (60.1% in the age bracket) enrolled. Conversely, the age group of 10 to 14 year olds has the lowest likelihood of being enrolled in a private school, with 126,663 (87.9% in the age bracket) attending a public institution.
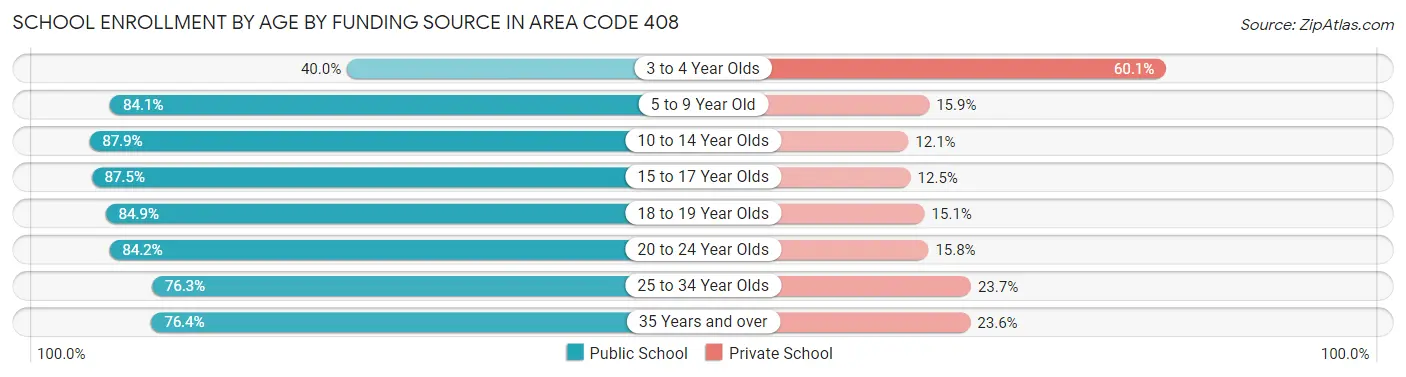
| Age Bracket | Public School | Private School |
| 3 to 4 Year Olds | 11,271 (40.0%) | 16,943 (60.1%) |
| 5 to 9 Year Old | 106,486 (84.1%) | 20,186 (15.9%) |
| 10 to 14 Year Olds | 126,663 (87.9%) | 17,374 (12.1%) |
| 15 to 17 Year Olds | 73,099 (87.5%) | 10,424 (12.5%) |
| 18 to 19 Year Olds | 37,890 (84.9%) | 6,733 (15.1%) |
| 20 to 24 Year Olds | 57,059 (84.2%) | 10,699 (15.8%) |
| 25 to 34 Year Olds | 31,888 (76.3%) | 9,910 (23.7%) |
| 35 Years and over | 21,889 (76.4%) | 6,767 (23.6%) |
| Total | 466,256 (82.5%) | 99,025 (17.5%) |
Educational Attainment by Field of Study in Area Code 408
Engineering (187,213 | 23.7%), business (118,549 | 15.0%), computers & mathematics (101,192 | 12.8%), science & technology (58,510 | 7.4%), and social sciences (54,217 | 6.9%) are the most common fields of study among 789,926 individuals in Area Code 408 who have obtained a bachelor's degree or higher.
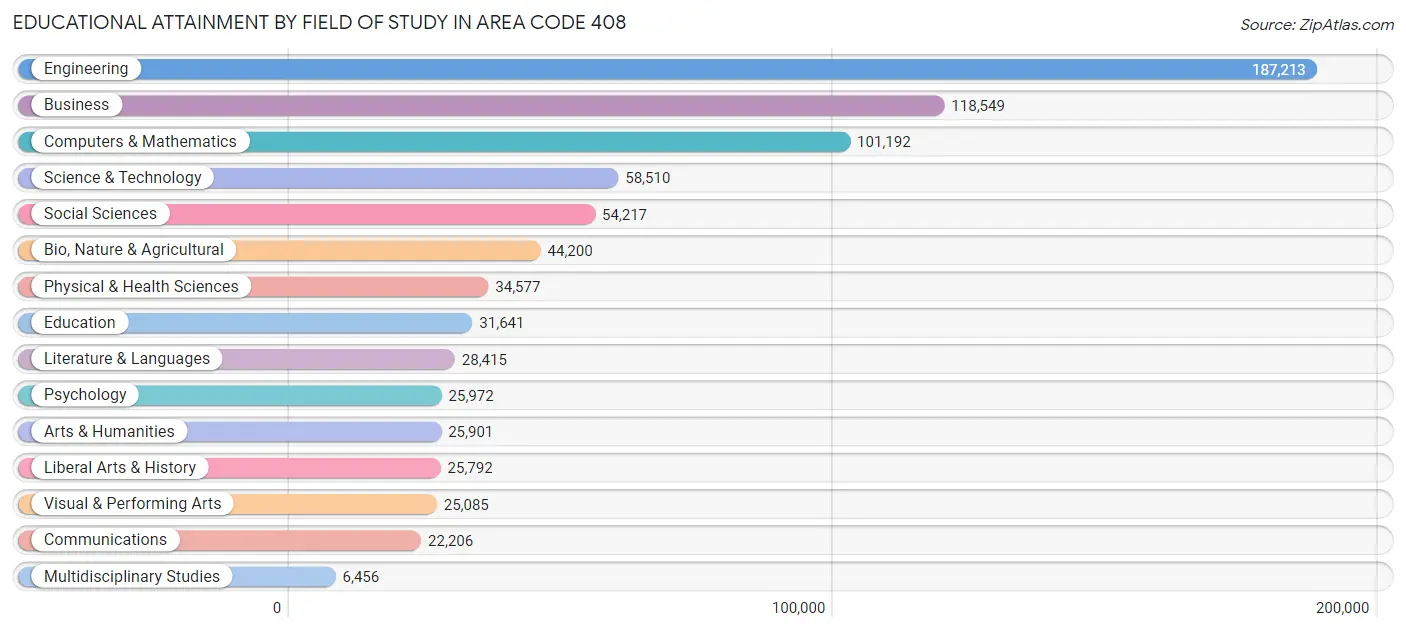
| Field of Study | # Graduates | % Graduates |
| Computers & Mathematics | 101,192 | 12.8% |
| Bio, Nature & Agricultural | 44,200 | 5.6% |
| Physical & Health Sciences | 34,577 | 4.4% |
| Psychology | 25,972 | 3.3% |
| Social Sciences | 54,217 | 6.9% |
| Engineering | 187,213 | 23.7% |
| Multidisciplinary Studies | 6,456 | 0.8% |
| Science & Technology | 58,510 | 7.4% |
| Business | 118,549 | 15.0% |
| Education | 31,641 | 4.0% |
| Literature & Languages | 28,415 | 3.6% |
| Liberal Arts & History | 25,792 | 3.3% |
| Visual & Performing Arts | 25,085 | 3.2% |
| Communications | 22,206 | 2.8% |
| Arts & Humanities | 25,901 | 3.3% |
| Total | 789,926 | 100.0% |
Transportation & Commute in Area Code 408
Vehicle Availability by Sex in Area Code 408
The most prevalent vehicle ownership categories in Area Code 408 are males with 2 vehicles (237,721, accounting for 38.6%) and females with 2 vehicles (179,273, making up 50.6%).
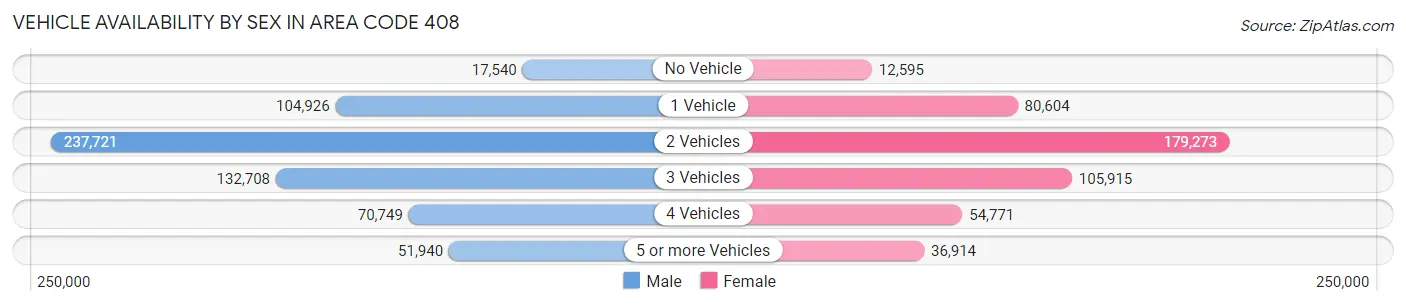
| Vehicles Available | Male | Female |
| No Vehicle | 17,540 (2.9%) | 12,595 (2.7%) |
| 1 Vehicle | 104,926 (17.0%) | 80,604 (17.2%) |
| 2 Vehicles | 237,721 (38.6%) | 179,273 (38.1%) |
| 3 Vehicles | 132,708 (21.6%) | 105,915 (22.5%) |
| 4 Vehicles | 70,749 (11.5%) | 54,771 (11.7%) |
| 5 or more Vehicles | 51,940 (8.4%) | 36,914 (7.9%) |
| Total | 615,584 (100.0%) | 470,072 (100.0%) |
Commute Time in Area Code 408
The most frequently occuring commute durations in Area Code 408 are 20 to 24 minutes (150,089 commuters, 16.7%), 30 to 34 minutes (144,656 commuters, 16.1%), and 15 to 19 minutes (141,360 commuters, 15.7%).
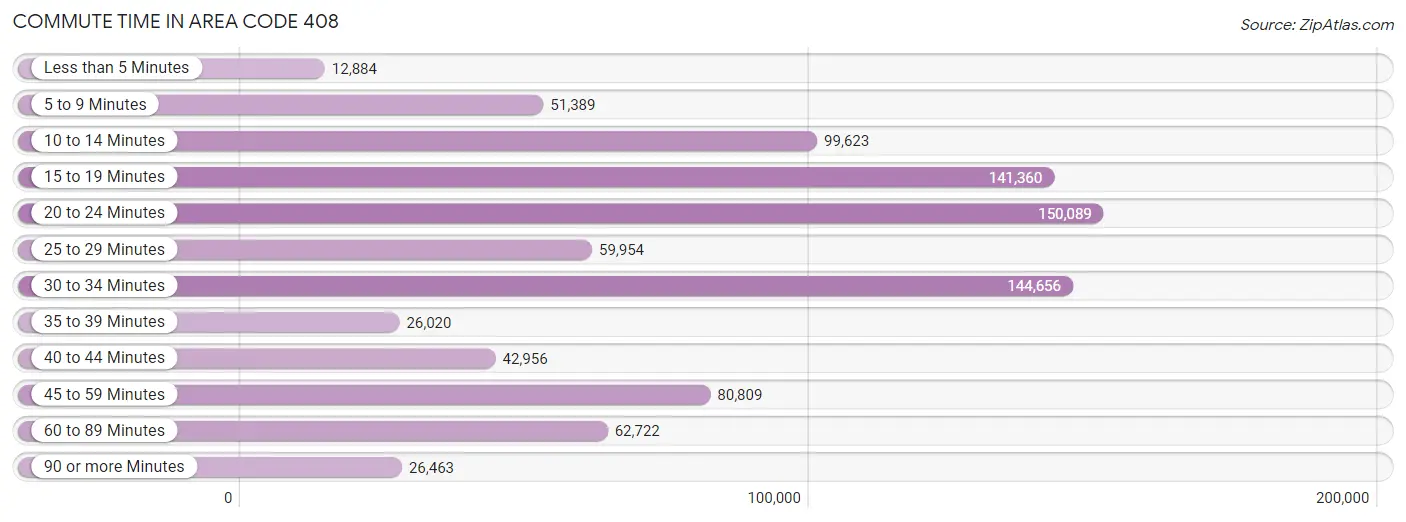
| Commute Time | # Commuters | % Commuters |
| Less than 5 Minutes | 12,884 | 1.4% |
| 5 to 9 Minutes | 51,389 | 5.7% |
| 10 to 14 Minutes | 99,623 | 11.1% |
| 15 to 19 Minutes | 141,360 | 15.7% |
| 20 to 24 Minutes | 150,089 | 16.7% |
| 25 to 29 Minutes | 59,954 | 6.7% |
| 30 to 34 Minutes | 144,656 | 16.1% |
| 35 to 39 Minutes | 26,020 | 2.9% |
| 40 to 44 Minutes | 42,956 | 4.8% |
| 45 to 59 Minutes | 80,809 | 9.0% |
| 60 to 89 Minutes | 62,722 | 7.0% |
| 90 or more Minutes | 26,463 | 2.9% |
Commute Time by Sex in Area Code 408
The most common commute times in Area Code 408 are 20 to 24 minutes (86,570 commuters, 16.9%) for males and 15 to 19 minutes (64,194 commuters, 16.6%) for females.
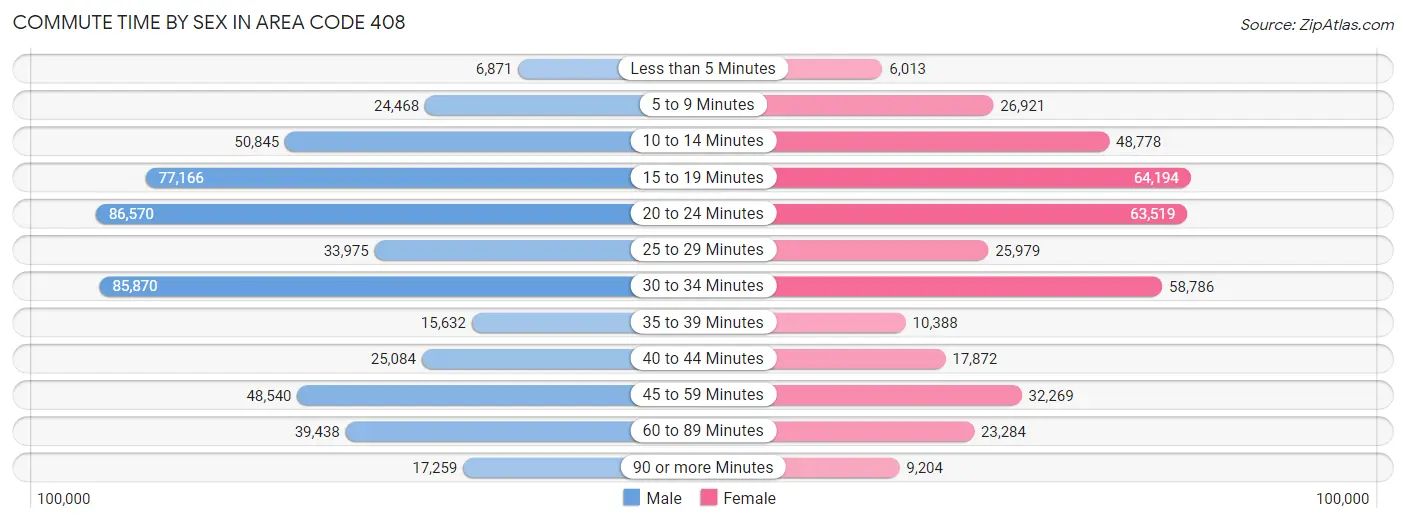
| Commute Time | Male | Female |
| Less than 5 Minutes | 6,871 (1.3%) | 6,013 (1.5%) |
| 5 to 9 Minutes | 24,468 (4.8%) | 26,921 (7.0%) |
| 10 to 14 Minutes | 50,845 (9.9%) | 48,778 (12.6%) |
| 15 to 19 Minutes | 77,166 (15.1%) | 64,194 (16.6%) |
| 20 to 24 Minutes | 86,570 (16.9%) | 63,519 (16.4%) |
| 25 to 29 Minutes | 33,975 (6.6%) | 25,979 (6.7%) |
| 30 to 34 Minutes | 85,870 (16.8%) | 58,786 (15.2%) |
| 35 to 39 Minutes | 15,632 (3.0%) | 10,388 (2.7%) |
| 40 to 44 Minutes | 25,084 (4.9%) | 17,872 (4.6%) |
| 45 to 59 Minutes | 48,540 (9.5%) | 32,269 (8.3%) |
| 60 to 89 Minutes | 39,438 (7.7%) | 23,284 (6.0%) |
| 90 or more Minutes | 17,259 (3.4%) | 9,204 (2.4%) |
Time of Departure to Work by Sex in Area Code 408
The most frequent times of departure to work in Area Code 408 are 8:00 AM to 8:29 AM (69,082, 13.5%) for males and 8:00 AM to 8:29 AM (59,169, 15.3%) for females.
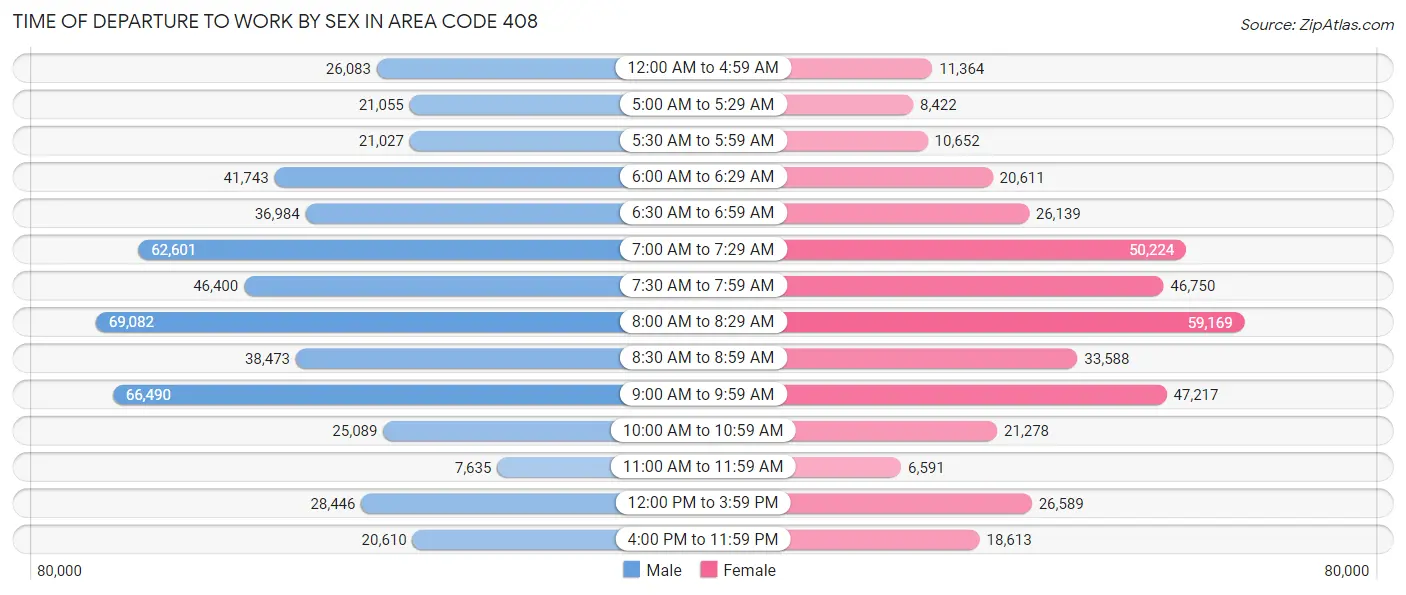
| Time of Departure | Male | Female |
| 12:00 AM to 4:59 AM | 26,083 (5.1%) | 11,364 (2.9%) |
| 5:00 AM to 5:29 AM | 21,055 (4.1%) | 8,422 (2.2%) |
| 5:30 AM to 5:59 AM | 21,027 (4.1%) | 10,652 (2.8%) |
| 6:00 AM to 6:29 AM | 41,743 (8.2%) | 20,611 (5.3%) |
| 6:30 AM to 6:59 AM | 36,984 (7.2%) | 26,139 (6.8%) |
| 7:00 AM to 7:29 AM | 62,601 (12.2%) | 50,224 (13.0%) |
| 7:30 AM to 7:59 AM | 46,400 (9.1%) | 46,750 (12.1%) |
| 8:00 AM to 8:29 AM | 69,082 (13.5%) | 59,169 (15.3%) |
| 8:30 AM to 8:59 AM | 38,473 (7.5%) | 33,588 (8.7%) |
| 9:00 AM to 9:59 AM | 66,490 (13.0%) | 47,217 (12.2%) |
| 10:00 AM to 10:59 AM | 25,089 (4.9%) | 21,278 (5.5%) |
| 11:00 AM to 11:59 AM | 7,635 (1.5%) | 6,591 (1.7%) |
| 12:00 PM to 3:59 PM | 28,446 (5.6%) | 26,589 (6.9%) |
| 4:00 PM to 11:59 PM | 20,610 (4.0%) | 18,613 (4.8%) |
| Total | 511,718 (100.0%) | 387,207 (100.0%) |
Housing Occupancy in Area Code 408
Occupancy by Ownership in Area Code 408
Of the total 721,096 dwellings in Area Code 408, owner-occupied units account for 404,790 (56.1%), while renter-occupied units make up 316,306 (43.9%).
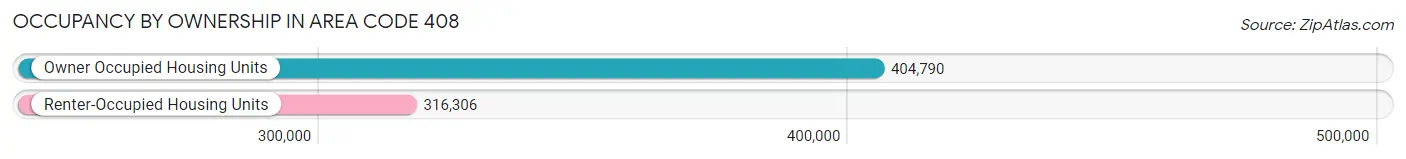
| Occupancy | # Housing Units | % Housing Units |
| Owner Occupied Housing Units | 404,790 | 56.1% |
| Renter-Occupied Housing Units | 316,306 | 43.9% |
| Total Occupied Housing Units | 721,096 | 100.0% |
Occupancy by Household Size in Area Code 408
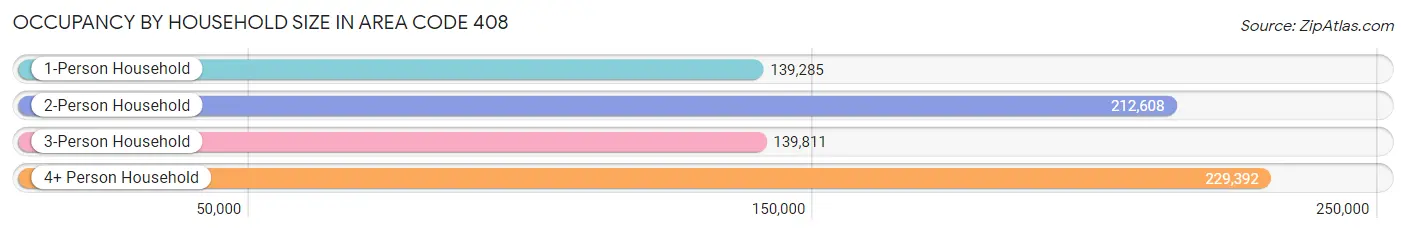
| Household Size | # Housing Units | % Housing Units |
| 1-Person Household | 139,285 | 19.3% |
| 2-Person Household | 212,608 | 29.5% |
| 3-Person Household | 139,811 | 19.4% |
| 4+ Person Household | 229,392 | 31.8% |
| Total Housing Units | 721,096 | 100.0% |
Occupancy by Ownership by Household Size in Area Code 408
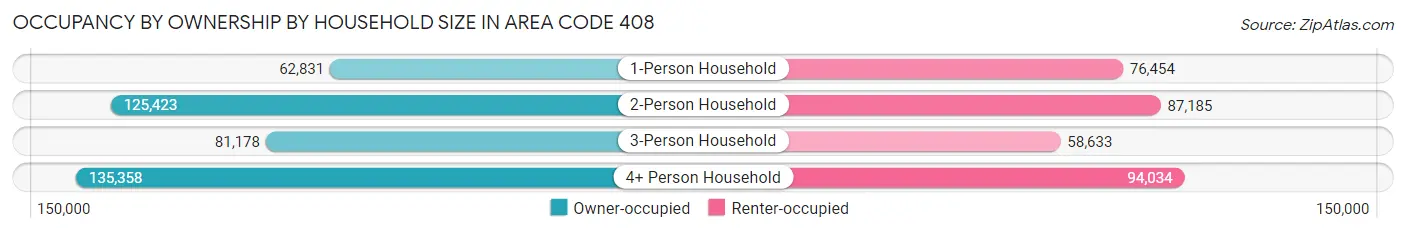
| Household Size | Owner-occupied | Renter-occupied |
| 1-Person Household | 62,831 (45.1%) | 76,454 (54.9%) |
| 2-Person Household | 125,423 (59.0%) | 87,185 (41.0%) |
| 3-Person Household | 81,178 (58.1%) | 58,633 (41.9%) |
| 4+ Person Household | 135,358 (59.0%) | 94,034 (41.0%) |
| Total Housing Units | 404,790 (56.1%) | 316,306 (43.9%) |
Occupancy by Educational Attainment in Area Code 408
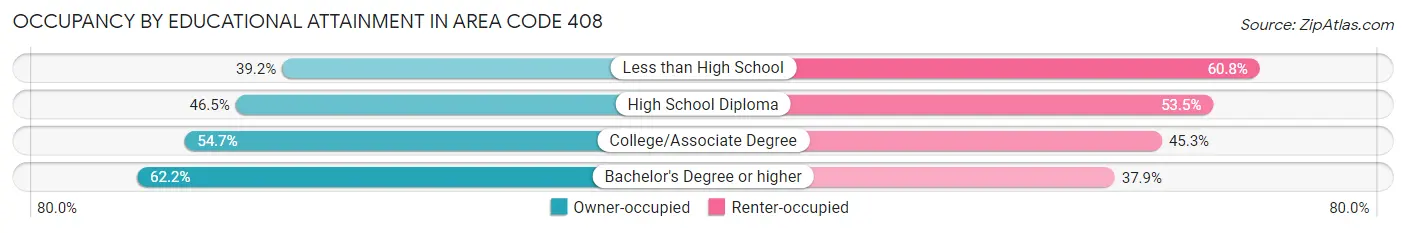
| Household Size | Owner-occupied | Renter-occupied |
| Less than High School | 29,063 (39.2%) | 45,141 (60.8%) |
| High School Diploma | 42,258 (46.5%) | 48,541 (53.5%) |
| College/Associate Degree | 88,898 (54.7%) | 73,697 (45.3%) |
| Bachelor's Degree or higher | 244,571 (62.2%) | 148,927 (37.9%) |
Occupancy by Age of Householder in Area Code 408
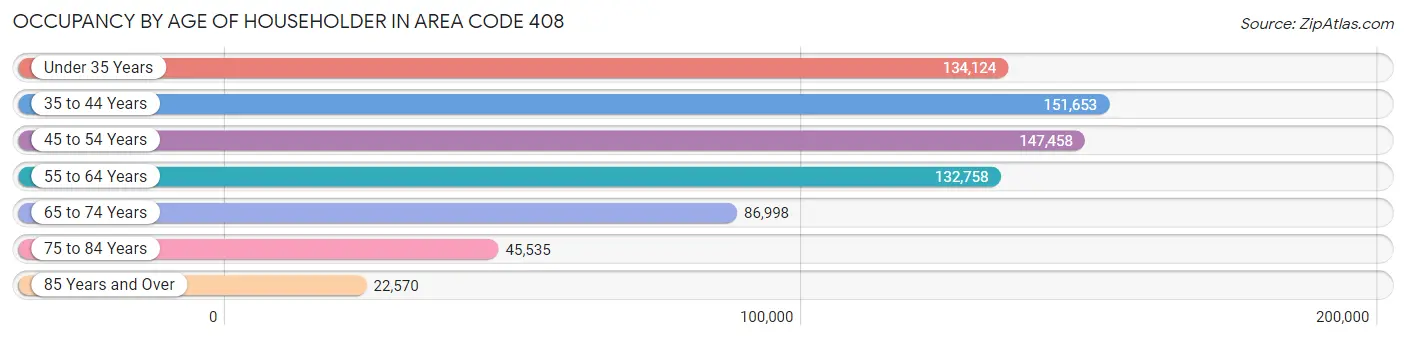
| Age Bracket | # Households | % Households |
| Under 35 Years | 134,124 | 18.6% |
| 35 to 44 Years | 151,653 | 21.0% |
| 45 to 54 Years | 147,458 | 20.4% |
| 55 to 64 Years | 132,758 | 18.4% |
| 65 to 74 Years | 86,998 | 12.1% |
| 75 to 84 Years | 45,535 | 6.3% |
| 85 Years and Over | 22,570 | 3.1% |
| Total | 721,096 | 100.0% |
Housing Finances in Area Code 408
Median Income by Occupancy in Area Code 408
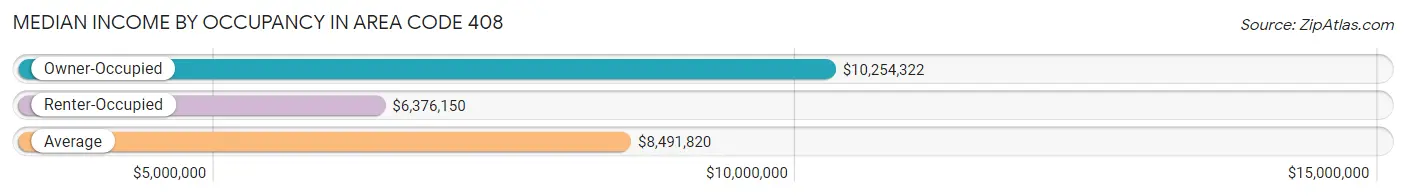
| Occupancy Type | # Households | Median Income |
| Owner-Occupied | 404,790 (56.1%) | $10,254,322 |
| Renter-Occupied | 316,306 (43.9%) | $6,376,150 |
| Average | 721,096 (100.0%) | $8,491,820 |
Occupancy by Householder Income Bracket in Area Code 408

| Income Bracket | Owner-occupied | Renter-occupied |
| Less than $5,000 | 4,812 (1.2%) | 8,206 (2.6%) |
| $5,000 to $9,999 | 2,065 (0.5%) | 4,712 (1.5%) |
| $10,000 to $14,999 | 3,980 (1.0%) | 10,809 (3.4%) |
| $15,000 to $19,999 | 4,519 (1.1%) | 7,322 (2.3%) |
| $20,000 to $24,999 | 5,482 (1.3%) | 8,632 (2.7%) |
| $25,000 to $34,999 | 11,113 (2.8%) | 15,089 (4.8%) |
| $35,000 to $49,999 | 16,116 (4.0%) | 22,356 (7.1%) |
| $50,000 to $74,999 | 30,836 (7.6%) | 38,299 (12.1%) |
| $75,000 to $99,999 | 31,840 (7.9%) | 37,038 (11.7%) |
| $100,000 to $149,999 | 62,310 (15.4%) | 56,474 (17.8%) |
| $150,000 or more | 231,717 (57.2%) | 107,369 (33.9%) |
| Total | 404,790 (100.0%) | 316,306 (100.0%) |
Monthly Housing Cost Tiers in Area Code 408
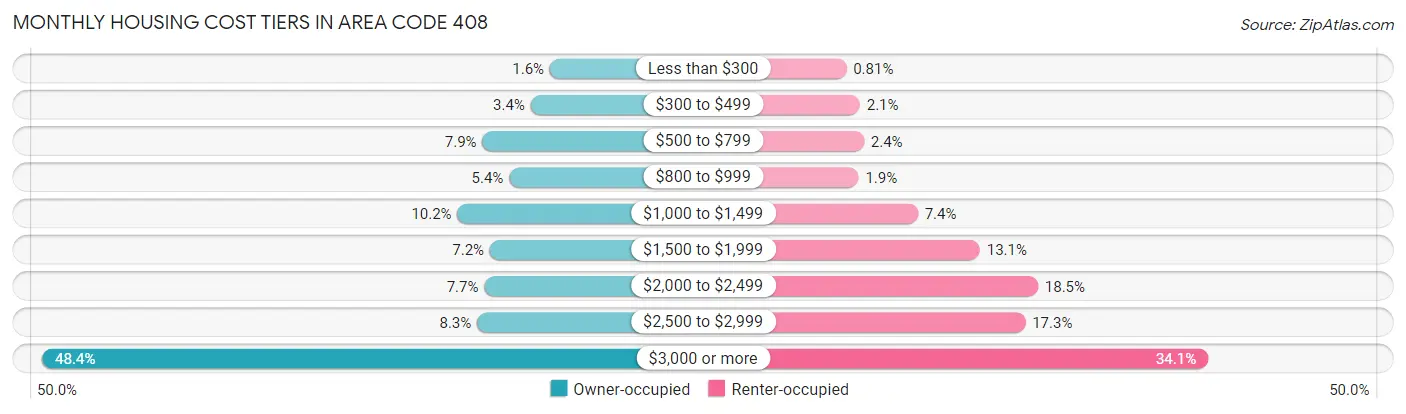
| Monthly Cost | Owner-occupied | Renter-occupied |
| Less than $300 | 6,629 (1.6%) | 2,568 (0.8%) |
| $300 to $499 | 13,816 (3.4%) | 6,512 (2.1%) |
| $500 to $799 | 31,776 (7.9%) | 7,675 (2.4%) |
| $800 to $999 | 21,810 (5.4%) | 6,130 (1.9%) |
| $1,000 to $1,499 | 41,071 (10.2%) | 23,360 (7.4%) |
| $1,500 to $1,999 | 28,988 (7.2%) | 41,470 (13.1%) |
| $2,000 to $2,499 | 31,086 (7.7%) | 58,374 (18.4%) |
| $2,500 to $2,999 | 33,748 (8.3%) | 54,680 (17.3%) |
| $3,000 or more | 195,866 (48.4%) | 107,885 (34.1%) |
| Total | 404,790 (100.0%) | 316,306 (100.0%) |
Physical Housing Characteristics in Area Code 408
Housing Structures in Area Code 408
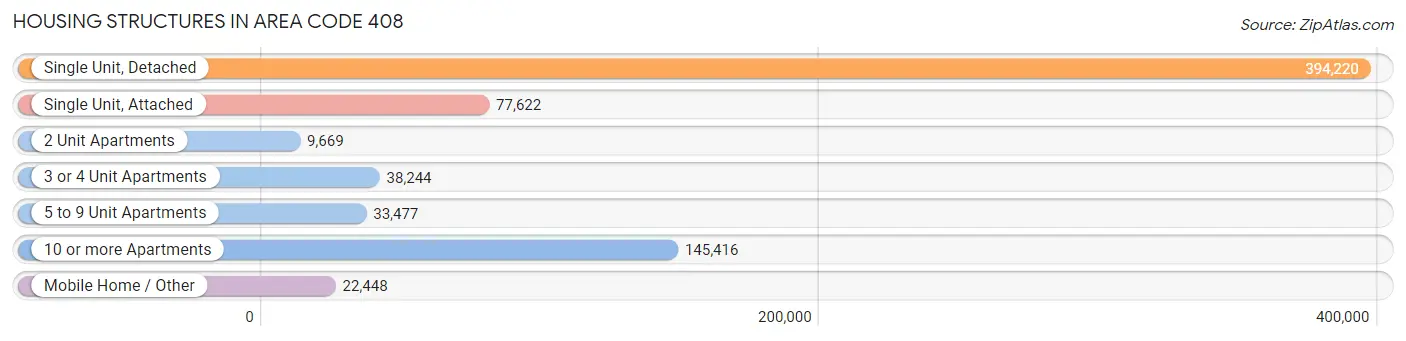
| Structure Type | # Housing Units | % Housing Units |
| Single Unit, Detached | 394,220 | 54.7% |
| Single Unit, Attached | 77,622 | 10.8% |
| 2 Unit Apartments | 9,669 | 1.3% |
| 3 or 4 Unit Apartments | 38,244 | 5.3% |
| 5 to 9 Unit Apartments | 33,477 | 4.6% |
| 10 or more Apartments | 145,416 | 20.2% |
| Mobile Home / Other | 22,448 | 3.1% |
| Total | 721,096 | 100.0% |
Housing Structures by Occupancy in Area Code 408
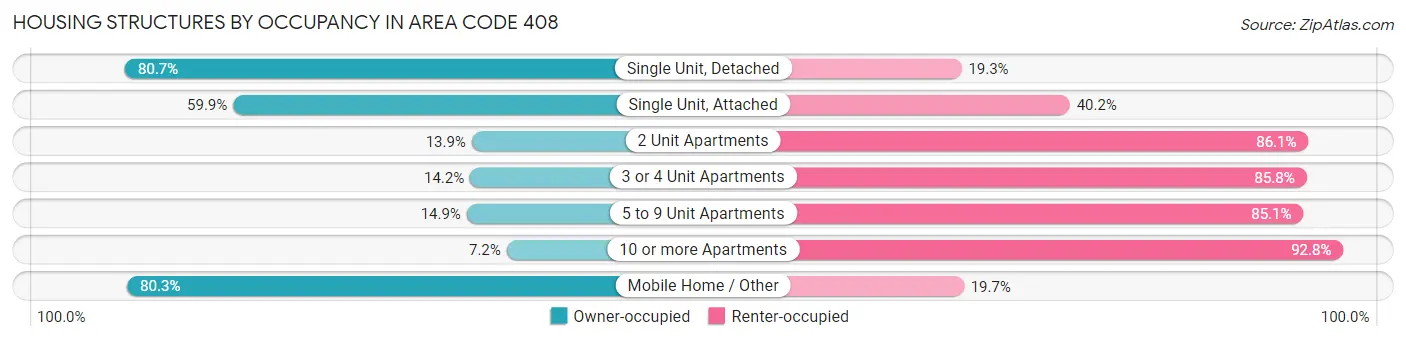
| Structure Type | Owner-occupied | Renter-occupied |
| Single Unit, Detached | 318,088 (80.7%) | 76,132 (19.3%) |
| Single Unit, Attached | 46,458 (59.9%) | 31,164 (40.2%) |
| 2 Unit Apartments | 1,346 (13.9%) | 8,323 (86.1%) |
| 3 or 4 Unit Apartments | 5,446 (14.2%) | 32,798 (85.8%) |
| 5 to 9 Unit Apartments | 4,983 (14.9%) | 28,494 (85.1%) |
| 10 or more Apartments | 10,453 (7.2%) | 134,963 (92.8%) |
| Mobile Home / Other | 18,016 (80.3%) | 4,432 (19.7%) |
| Total | 404,790 (56.1%) | 316,306 (43.9%) |
Housing Structures by Number of Rooms in Area Code 408
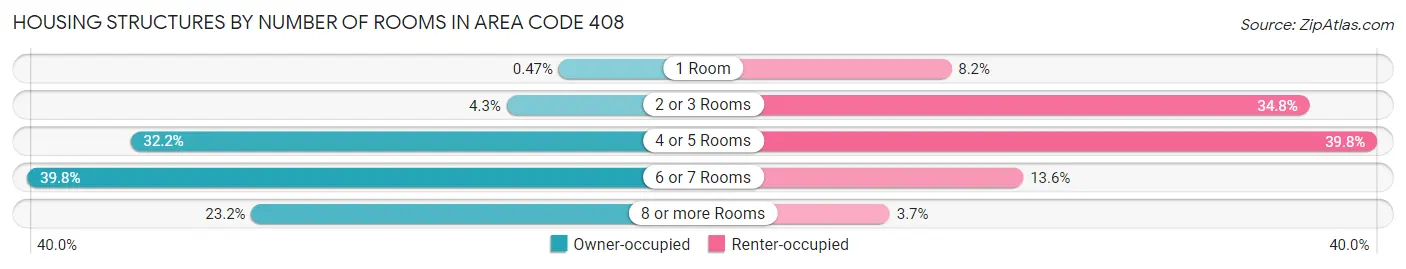
| Number of Rooms | Owner-occupied | Renter-occupied |
| 1 Room | 1,921 (0.5%) | 26,078 (8.2%) |
| 2 or 3 Rooms | 17,522 (4.3%) | 109,913 (34.7%) |
| 4 or 5 Rooms | 130,215 (32.2%) | 125,747 (39.8%) |
| 6 or 7 Rooms | 161,153 (39.8%) | 42,896 (13.6%) |
| 8 or more Rooms | 93,979 (23.2%) | 11,672 (3.7%) |
| Total | 404,790 (100.0%) | 316,306 (100.0%) |
Housing Structure by Heating Type in Area Code 408
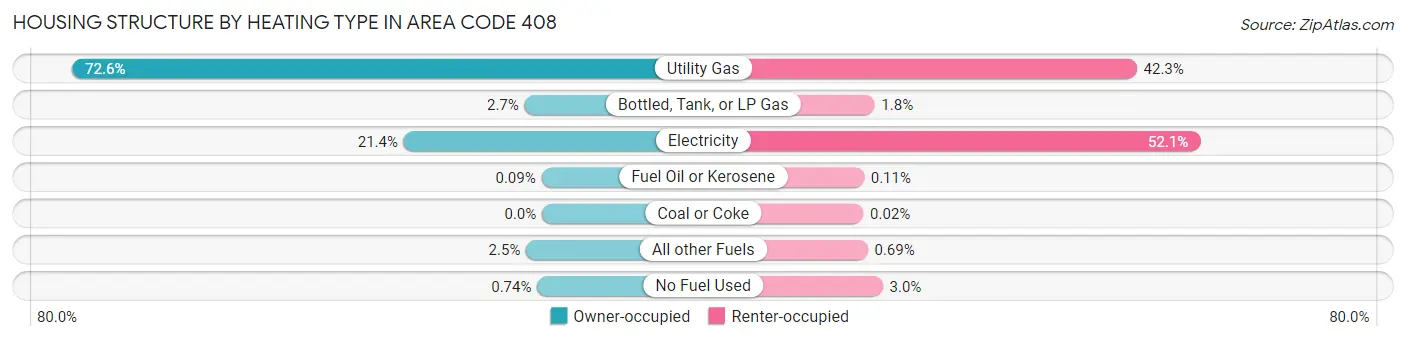
| Heating Type | Owner-occupied | Renter-occupied |
| Utility Gas | 294,044 (72.6%) | 133,765 (42.3%) |
| Bottled, Tank, or LP Gas | 10,943 (2.7%) | 5,560 (1.8%) |
| Electricity | 86,527 (21.4%) | 164,827 (52.1%) |
| Fuel Oil or Kerosene | 359 (0.1%) | 363 (0.1%) |
| Coal or Coke | 0 (0.0%) | 59 (0.0%) |
| All other Fuels | 9,909 (2.5%) | 2,167 (0.7%) |
| No Fuel Used | 3,008 (0.7%) | 9,565 (3.0%) |
| Total | 404,790 (100.0%) | 316,306 (100.0%) |
Household Vehicle Usage in Area Code 408
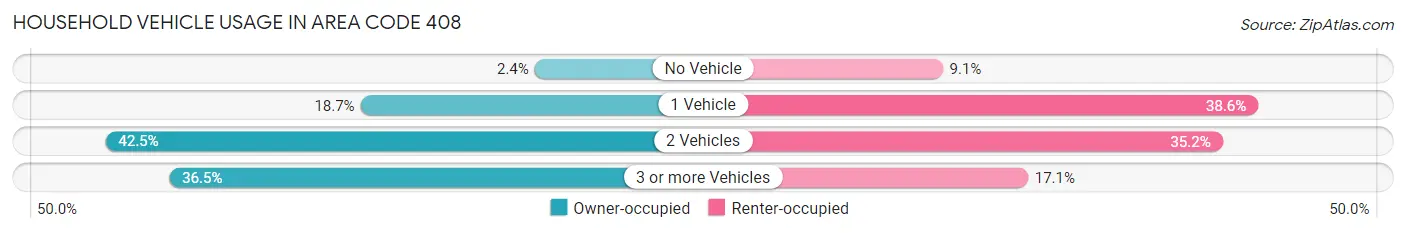
| Vehicles per Household | Owner-occupied | Renter-occupied |
| No Vehicle | 9,659 (2.4%) | 28,842 (9.1%) |
| 1 Vehicle | 75,485 (18.6%) | 122,003 (38.6%) |
| 2 Vehicles | 171,857 (42.5%) | 111,465 (35.2%) |
| 3 or more Vehicles | 147,789 (36.5%) | 53,996 (17.1%) |
| Total | 404,790 (100.0%) | 316,306 (100.0%) |
Real Estate & Mortgages in Area Code 408
Real Estate and Mortgage Overview in Area Code 408
| Characteristic | Without Mortgage | With Mortgage |
| Housing Units | 125,484 | 279,306 |
| Median Property Value | $61,391,205 | $71,752,306 |
| Median Household Income | $6,505,583 | $184,008 |
| Monthly Housing Costs | $54,013 | $193,288 |
| Real Estate Taxes | $307,830 | $3,159 |
Property Value by Mortgage Status in Area Code 408
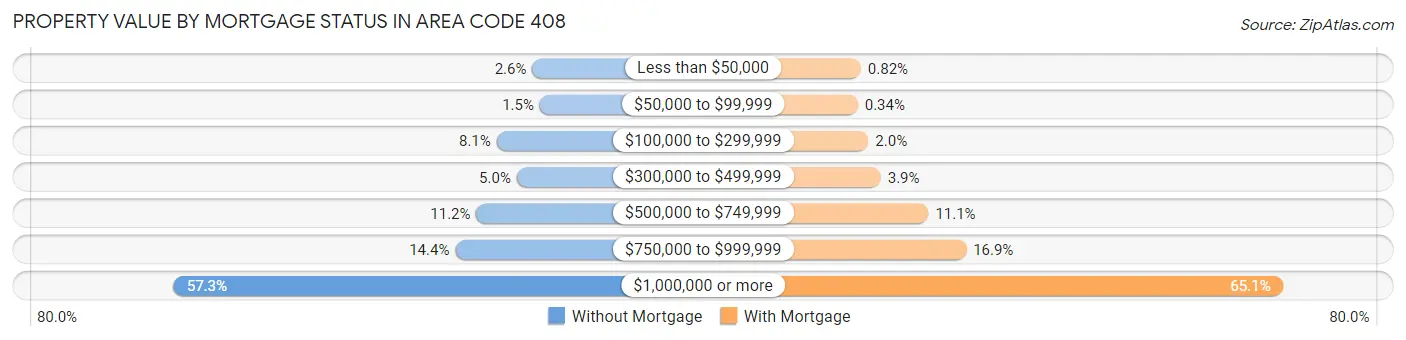
| Property Value | Without Mortgage | With Mortgage |
| Less than $50,000 | 3,307 (2.6%) | 2,302 (0.8%) |
| $50,000 to $99,999 | 1,870 (1.5%) | 939 (0.3%) |
| $100,000 to $299,999 | 10,128 (8.1%) | 5,479 (2.0%) |
| $300,000 to $499,999 | 6,281 (5.0%) | 10,765 (3.8%) |
| $500,000 to $749,999 | 14,000 (11.2%) | 31,023 (11.1%) |
| $750,000 to $999,999 | 18,047 (14.4%) | 47,103 (16.9%) |
| $1,000,000 or more | 71,851 (57.3%) | 181,695 (65.0%) |
| Total | 125,484 (100.0%) | 279,306 (100.0%) |
Household Income by Mortgage Status in Area Code 408
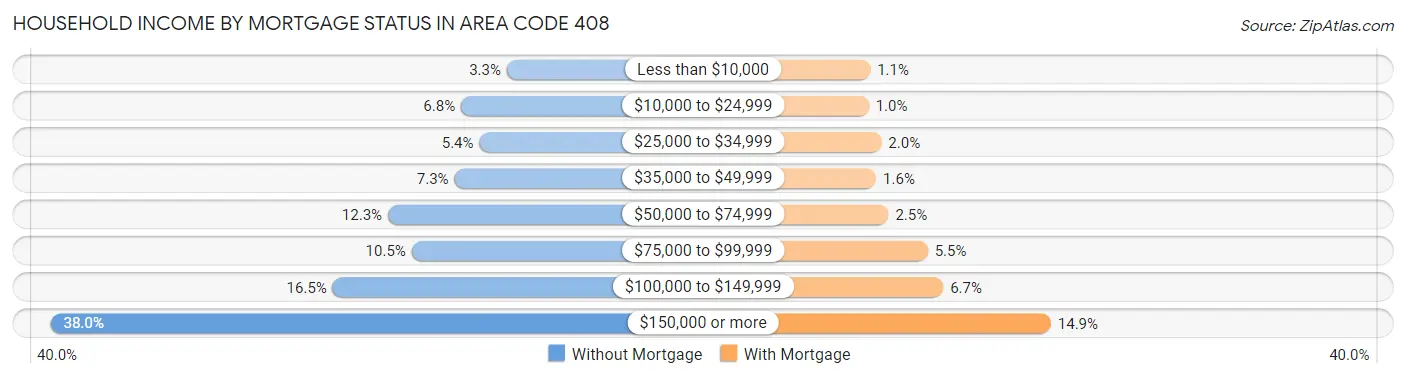
| Household Income | Without Mortgage | With Mortgage |
| Less than $10,000 | 4,095 (3.3%) | 3,123 (1.1%) |
| $10,000 to $24,999 | 8,469 (6.8%) | 2,782 (1.0%) |
| $25,000 to $34,999 | 6,716 (5.3%) | 5,512 (2.0%) |
| $35,000 to $49,999 | 9,102 (7.2%) | 4,397 (1.6%) |
| $50,000 to $74,999 | 15,462 (12.3%) | 7,014 (2.5%) |
| $75,000 to $99,999 | 13,193 (10.5%) | 15,374 (5.5%) |
| $100,000 to $149,999 | 20,738 (16.5%) | 18,647 (6.7%) |
| $150,000 or more | 47,709 (38.0%) | 41,572 (14.9%) |
| Total | 125,484 (100.0%) | 279,306 (100.0%) |
Property Value to Household Income Ratio in Area Code 408
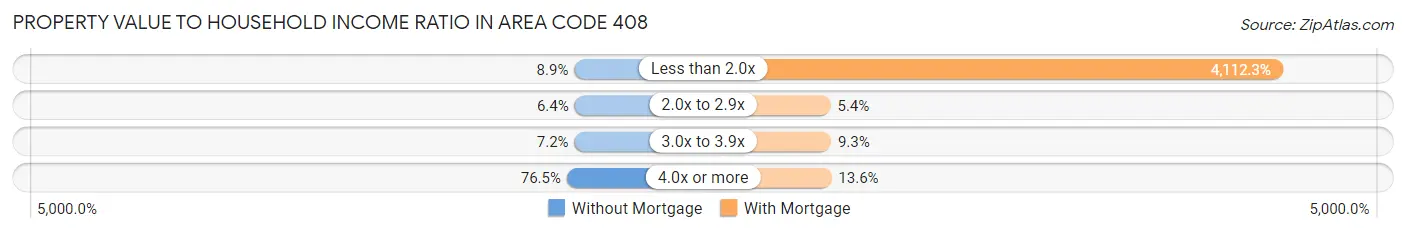
| Value-to-Income Ratio | Without Mortgage | With Mortgage |
| Less than 2.0x | 11,213 (8.9%) | 11,485,836 (4,112.3%) |
| 2.0x to 2.9x | 8,055 (6.4%) | 15,133 (5.4%) |
| 3.0x to 3.9x | 9,058 (7.2%) | 26,050 (9.3%) |
| 4.0x or more | 96,036 (76.5%) | 37,968 (13.6%) |
| Total | 125,484 (100.0%) | 279,306 (100.0%) |
Real Estate Taxes by Mortgage Status in Area Code 408
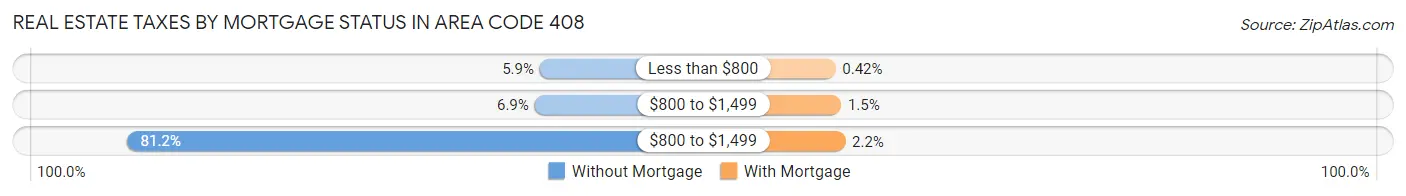
| Property Taxes | Without Mortgage | With Mortgage |
| Less than $800 | 7,409 (5.9%) | 1,175 (0.4%) |
| $800 to $1,499 | 8,592 (6.9%) | 4,054 (1.5%) |
| $800 to $1,499 | 101,872 (81.2%) | 6,133 (2.2%) |
| Total | 125,484 (100.0%) | 279,306 (100.0%) |
Health & Disability in Area Code 408
Health Insurance Coverage by Age in Area Code 408
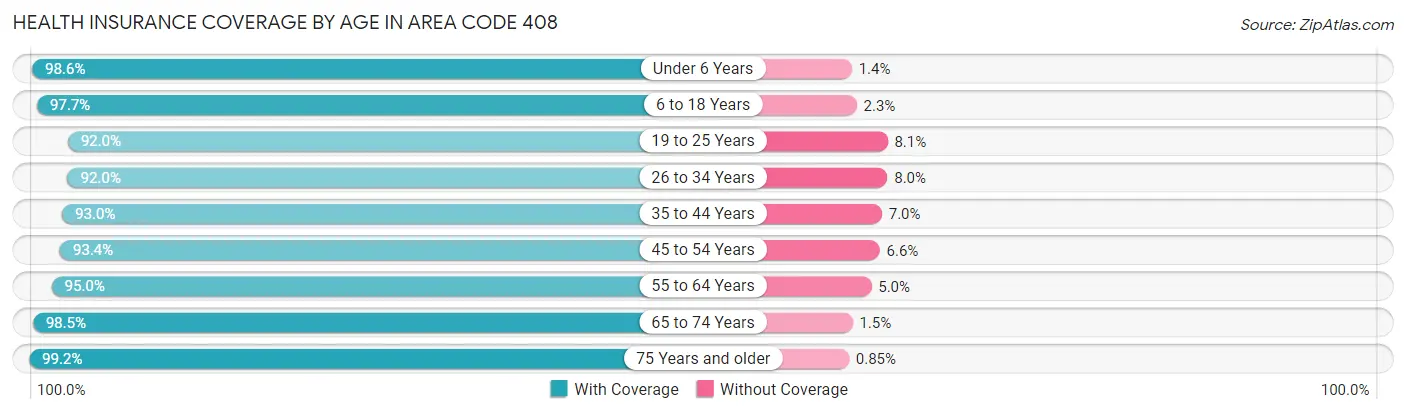
| Age Bracket | With Coverage | Without Coverage |
| Under 6 Years | 150,760 (98.6%) | 2,123 (1.4%) |
| 6 to 18 Years | 358,415 (97.7%) | 8,424 (2.3%) |
| 19 to 25 Years | 176,297 (91.9%) | 15,424 (8.1%) |
| 26 to 34 Years | 287,471 (92.0%) | 25,078 (8.0%) |
| 35 to 44 Years | 297,602 (93.0%) | 22,352 (7.0%) |
| 45 to 54 Years | 275,086 (93.4%) | 19,391 (6.6%) |
| 55 to 64 Years | 248,791 (95.0%) | 13,170 (5.0%) |
| 65 to 74 Years | 166,080 (98.5%) | 2,556 (1.5%) |
| 75 Years and older | 124,127 (99.2%) | 1,064 (0.9%) |
| Total | 2,084,629 (95.0%) | 109,582 (5.0%) |
Health Insurance Coverage by Citizenship Status in Area Code 408
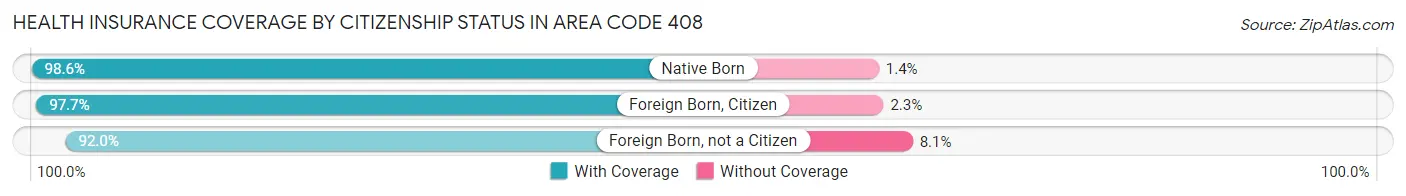
| Citizenship Status | With Coverage | Without Coverage |
| Native Born | 150,760 (98.6%) | 2,123 (1.4%) |
| Foreign Born, Citizen | 358,415 (97.7%) | 8,424 (2.3%) |
| Foreign Born, not a Citizen | 176,297 (91.9%) | 15,424 (8.1%) |
Health Insurance Coverage by Household Income in Area Code 408
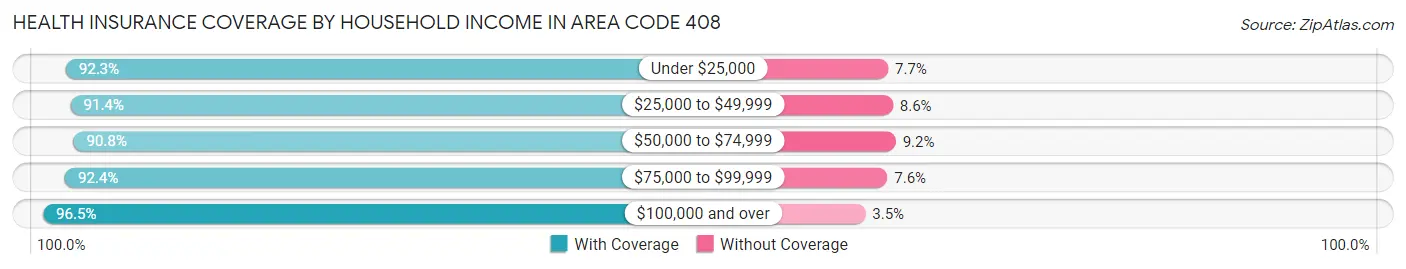
| Household Income | With Coverage | Without Coverage |
| Under $25,000 | 105,118 (92.3%) | 8,815 (7.7%) |
| $25,000 to $49,999 | 146,795 (91.4%) | 13,865 (8.6%) |
| $50,000 to $74,999 | 173,141 (90.8%) | 17,485 (9.2%) |
| $75,000 to $99,999 | 189,428 (92.4%) | 15,564 (7.6%) |
| $100,000 and over | 1,448,336 (96.5%) | 52,260 (3.5%) |
Public vs Private Health Insurance Coverage by Age in Area Code 408
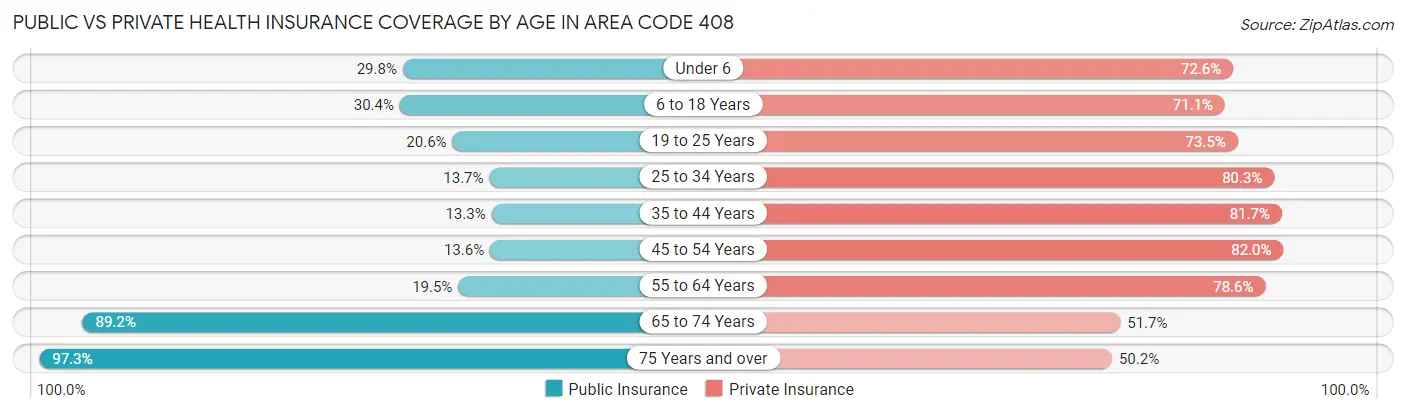
| Age Bracket | Public Insurance | Private Insurance |
| Under 6 | 45,571 (29.8%) | 111,013 (72.6%) |
| 6 to 18 Years | 111,359 (30.4%) | 260,843 (71.1%) |
| 19 to 25 Years | 39,480 (20.6%) | 140,858 (73.5%) |
| 25 to 34 Years | 42,905 (13.7%) | 250,830 (80.2%) |
| 35 to 44 Years | 42,679 (13.3%) | 261,254 (81.7%) |
| 45 to 54 Years | 40,110 (13.6%) | 241,356 (82.0%) |
| 55 to 64 Years | 51,146 (19.5%) | 205,897 (78.6%) |
| 65 to 74 Years | 150,479 (89.2%) | 87,193 (51.7%) |
| 75 Years and over | 121,778 (97.3%) | 62,786 (50.1%) |
| Total | 645,507 (29.4%) | 1,622,030 (73.9%) |
Disability Status by Sex by Age in Area Code 408
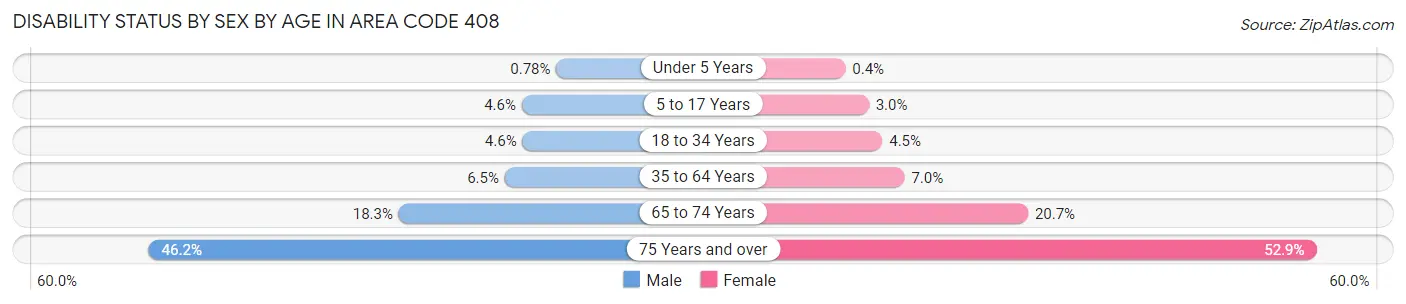
| Age Bracket | Male | Female |
| Under 5 Years | 510 (0.8%) | 245 (0.4%) |
| 5 to 17 Years | 8,638 (4.6%) | 5,301 (3.0%) |
| 18 to 34 Years | 12,867 (4.5%) | 11,305 (4.5%) |
| 35 to 64 Years | 29,490 (6.5%) | 29,609 (7.0%) |
| 65 to 74 Years | 14,709 (18.3%) | 18,326 (20.7%) |
| 75 Years and over | 24,310 (46.2%) | 38,341 (52.8%) |
Disability Class by Sex by Age in Area Code 408
Disability Class: Hearing Difficulty
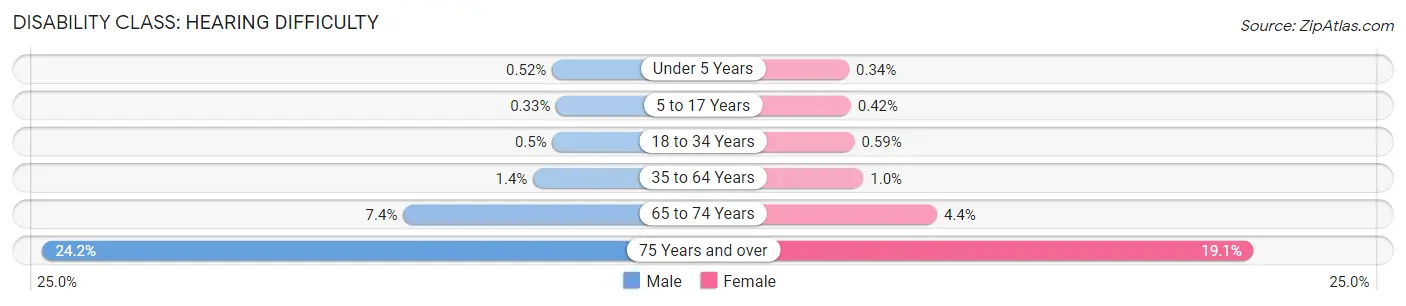
| Age Bracket | Male | Female |
| Under 5 Years | 342 (0.5%) | 208 (0.3%) |
| 5 to 17 Years | 622 (0.3%) | 735 (0.4%) |
| 18 to 34 Years | 1,403 (0.5%) | 1,472 (0.6%) |
| 35 to 64 Years | 6,341 (1.4%) | 4,252 (1.0%) |
| 65 to 74 Years | 5,958 (7.4%) | 3,910 (4.4%) |
| 75 Years and over | 12,716 (24.2%) | 13,864 (19.1%) |
Disability Class: Vision Difficulty
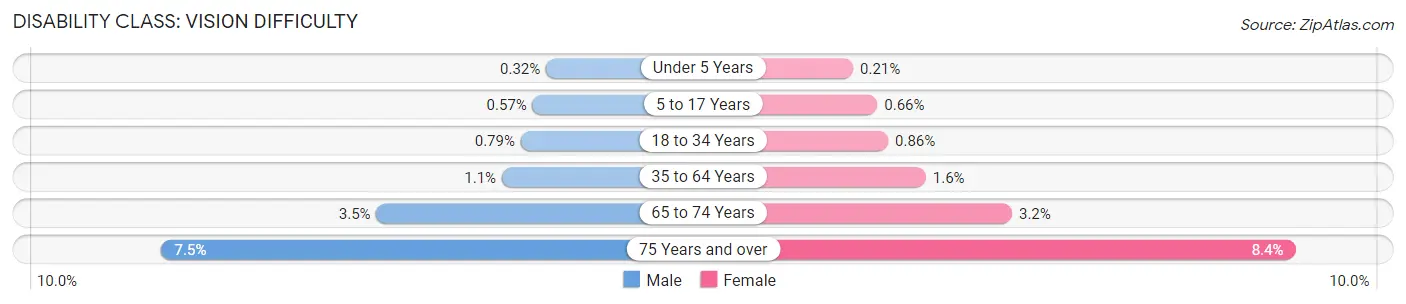
| Age Bracket | Male | Female |
| Under 5 Years | 208 (0.3%) | 132 (0.2%) |
| 5 to 17 Years | 1,069 (0.6%) | 1,163 (0.7%) |
| 18 to 34 Years | 2,237 (0.8%) | 2,144 (0.9%) |
| 35 to 64 Years | 5,164 (1.1%) | 6,616 (1.6%) |
| 65 to 74 Years | 2,783 (3.5%) | 2,795 (3.2%) |
| 75 Years and over | 3,926 (7.5%) | 6,108 (8.4%) |
Disability Class: Cognitive Difficulty
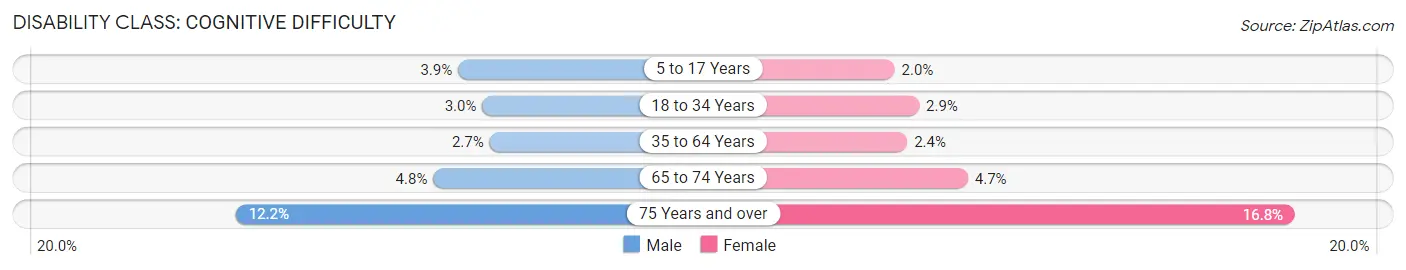
| Age Bracket | Male | Female |
| 5 to 17 Years | 7,294 (3.9%) | 3,462 (2.0%) |
| 18 to 34 Years | 8,513 (3.0%) | 7,194 (2.9%) |
| 35 to 64 Years | 12,376 (2.7%) | 10,299 (2.4%) |
| 65 to 74 Years | 3,876 (4.8%) | 4,138 (4.7%) |
| 75 Years and over | 6,402 (12.2%) | 12,199 (16.8%) |
Disability Class: Ambulatory Difficulty
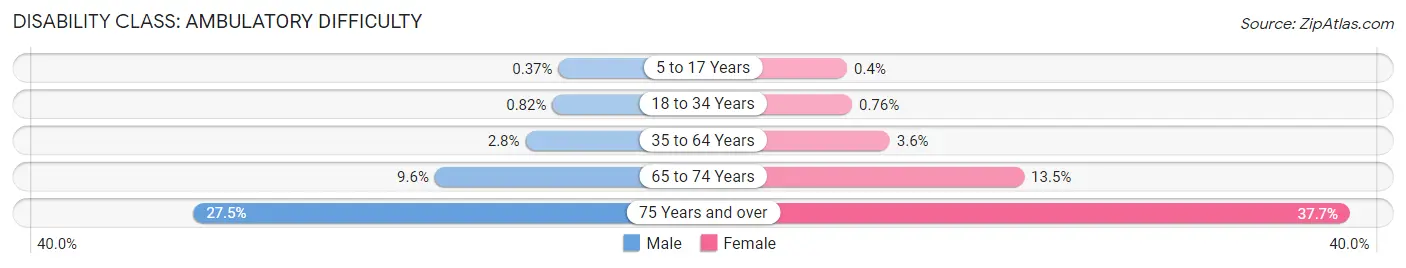
| Age Bracket | Male | Female |
| 5 to 17 Years | 692 (0.4%) | 706 (0.4%) |
| 18 to 34 Years | 2,307 (0.8%) | 1,902 (0.8%) |
| 35 to 64 Years | 12,754 (2.8%) | 15,170 (3.6%) |
| 65 to 74 Years | 7,662 (9.6%) | 11,969 (13.5%) |
| 75 Years and over | 14,468 (27.5%) | 27,364 (37.7%) |
Disability Class: Self-Care Difficulty
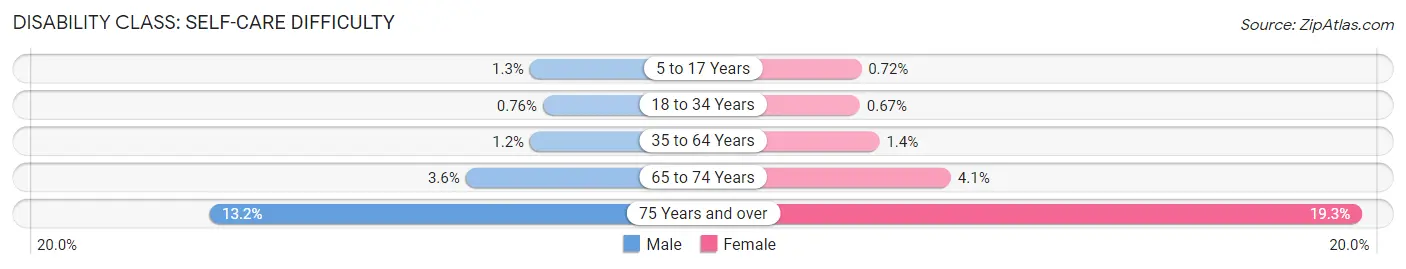
| Age Bracket | Male | Female |
| 5 to 17 Years | 2,328 (1.3%) | 1,266 (0.7%) |
| 18 to 34 Years | 2,140 (0.8%) | 1,683 (0.7%) |
| 35 to 64 Years | 5,619 (1.2%) | 5,933 (1.4%) |
| 65 to 74 Years | 2,912 (3.6%) | 3,577 (4.1%) |
| 75 Years and over | 6,924 (13.2%) | 14,010 (19.3%) |
Technology Access in Area Code 408
Computing Device Access in Area Code 408
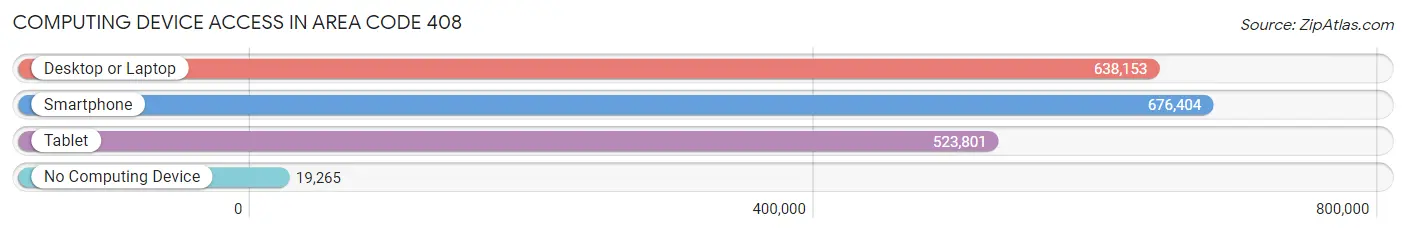
| Device Type | # Households | % Households |
| Desktop or Laptop | 638,153 | 88.5% |
| Smartphone | 676,404 | 93.8% |
| Tablet | 523,801 | 72.6% |
| No Computing Device | 19,265 | 2.7% |
| Total | 721,096 | 100.0% |
Internet Access in Area Code 408
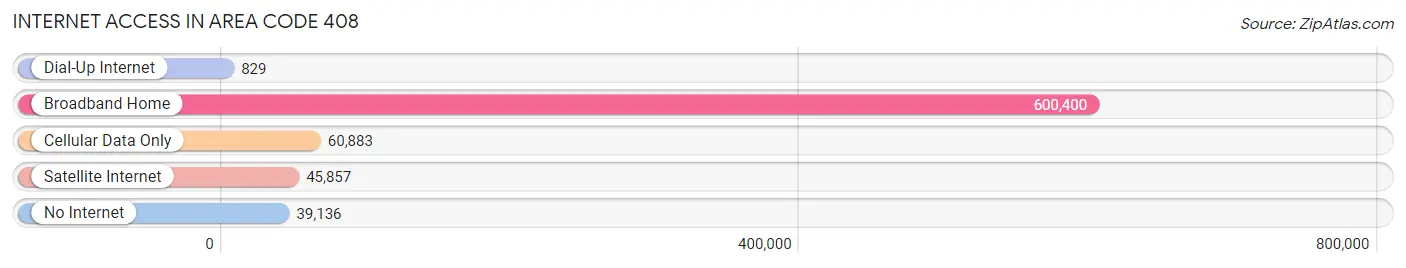
| Internet Type | # Households | % Households |
| Dial-Up Internet | 829 | 0.1% |
| Broadband Home | 600,400 | 83.3% |
| Cellular Data Only | 60,883 | 8.4% |
| Satellite Internet | 45,857 | 6.4% |
| No Internet | 39,136 | 5.4% |
| Total | 721,096 | 100.0% |
Area Code 408 Summary
Geography
Area code 408 is located in the state of California, in the San Francisco Bay Area. It covers the cities of San Jose, Sunnyvale, Santa Clara, and Cupertino.
Social
Area code 408 is home to many tech companies, such as Apple, Google, and Adobe. It is also home to many universities, such as Stanford and Santa Clara University.
Economics
Area code 408 is a major hub for the tech industry, and is home to many of the world's leading tech companies. It is also home to many venture capital firms, and is a major center for venture capital investment.
Demographics
Area code 408 is home to a diverse population, with a large Hispanic population, as well as a large Asian population. The median household income in the area is $90,000, and the median home value is $1.2 million.
Common Questions
What is Per Capita Income in Area Code 408?
Per Capita income in Area Code 408 is $66,838.
What is the Median Family Income in Area Code 408?
Median Family Income in Area Code 408 is $165,965.
What is the Median Household income in Area Code 408?
Median Household Income in Area Code 408 is $148,979.
What is Income or Wage Gap in Area Code 408?
Income or Wage Gap in Area Code 408 is 34.5%.
Women in Area Code 408 earn 65.5 cents for every dollar earned by a man.
What is Family Income Deficit in Area Code 408?
Family Income Deficit in Area Code 408 is $11,255.
Families that are below poverty line in Area Code 408 earn $11,255 less on average than the poverty threshold level.
What is Inequality or Gini Index in Area Code 408?
Inequality or Gini Index in Area Code 408 is 24.90.
What is the Total Population of Area Code 408?
Total Population of Area Code 408 is 2,205,127.
What is the Total Male Population of Area Code 408?
Total Male Population of Area Code 408 is 1,126,750.
What is the Total Female Population of Area Code 408?
Total Female Population of Area Code 408 is 1,078,377.
What is the Ratio of Males per 100 Females in Area Code 408?
There are 104.49 Males per 100 Females in Area Code 408.
What is the Ratio of Females per 100 Males in Area Code 408?
There are 95.71 Females per 100 Males in Area Code 408.
What is the Median Population Age in Area Code 408?
Median Population Age in Area Code 408 is 39.2 Years.
What is the Average Family Size in Area Code 408
Average Family Size in Area Code 408 is 3.4 People.
What is the Average Household Size in Area Code 408
Average Household Size in Area Code 408 is 3.0 People.
How Large is the Labor Force in Area Code 408?
There are 1,176,658 People in the Labor Forcein in Area Code 408.
What is the Percentage of People in the Labor Force in Area Code 408?
66.5% of People are in the Labor Force in Area Code 408.
What is the Unemployment Rate in Area Code 408?
Unemployment Rate in Area Code 408 is 5.5%.