Area Code 669 Map & Demographics
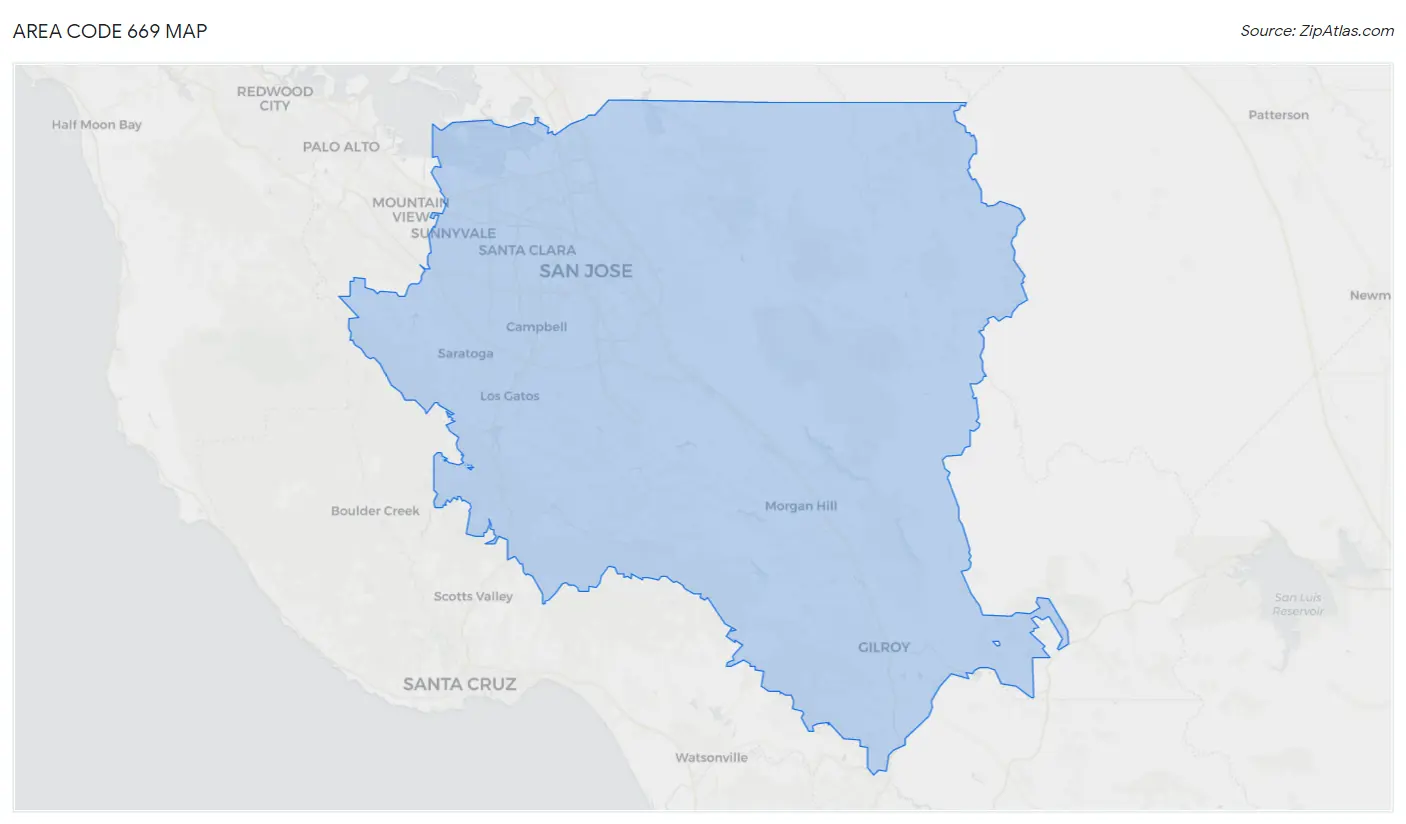
Area Code 669 Map
Area Code 669 Overview
$77,548
PER CAPITA INCOME
$179,206
AVG FAMILY INCOME
$161,915
AVG HOUSEHOLD INCOME
37.1%
WAGE / INCOME GAP [ % ]
62.9¢/ $1
WAGE / INCOME GAP [ $ ]
$11,385
FAMILY INCOME DEFICIT
9.17
INEQUALITY / GINI INDEX
792,267
TOTAL POPULATION
404,084
MALE POPULATION
388,183
FEMALE POPULATION
104.10
MALES / 100 FEMALES
96.06
FEMALES / 100 MALES
38.7
MEDIAN AGE
3.2
AVG FAMILY SIZE
2.8
AVG HOUSEHOLD SIZE
437,363
LABOR FORCE [ PEOPLE ]
68.3%
PERCENT IN LABOR FORCE
4.4%
UNEMPLOYMENT RATE
Income in Area Code 669
Income Overview in Area Code 669
Per Capita Income in Area Code 669 is $77,548, while median incomes of families and households are $179,206 and $161,915 respectively.
| Characteristic | Number | Measure |
| Per Capita Income | 792,267 | $77,548 |
| Median Family Income | 193,667 | $179,206 |
| Mean Family Income | 193,667 | $4,801,198 |
| Median Household Income | 275,442 | $161,915 |
| Mean Household Income | 275,442 | $4,395,449 |
| Income Deficit | 193,667 | $11,385 |
| Wage / Income Gap (%) | 792,267 | 37.06% |
| Wage / Income Gap ($) | 792,267 | 62.94¢ per $1 |
| Gini / Inequality Index | 792,267 | 9.17 |
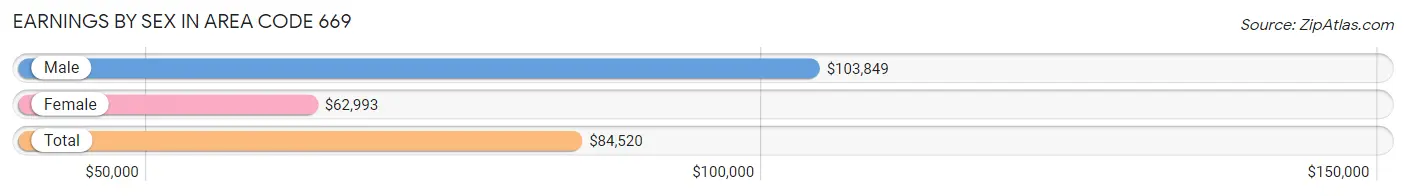
Earnings by Sex in Area Code 669
Average Earnings in Area Code 669 are $84,520, $103,849 for men and $62,993 for women, a difference of 39.3%.
| Sex | Number | Average Earnings |
| Male | 252,445 (56.0%) | $103,849 |
| Female | 198,360 (44.0%) | $62,993 |
| Total | 450,805 (100.0%) | $84,520 |
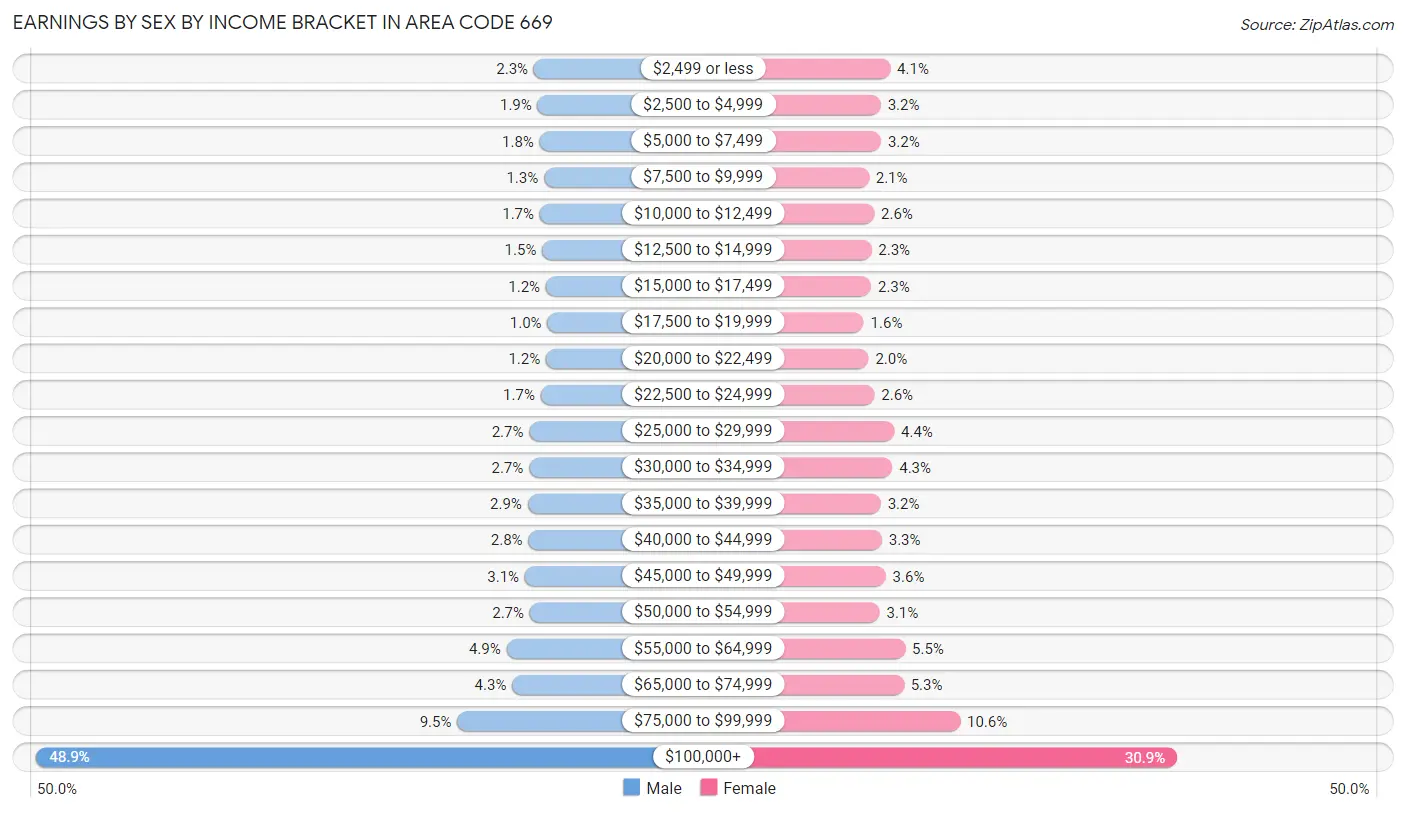
Earnings by Sex by Income Bracket in Area Code 669
The most common earnings brackets in Area Code 669 are $100,000+ for men (123,432 | 48.9%) and $100,000+ for women (61,352 | 30.9%).
| Income | Male | Female |
| $2,499 or less | 5,782 (2.3%) | 8,053 (4.1%) |
| $2,500 to $4,999 | 4,909 (1.9%) | 6,312 (3.2%) |
| $5,000 to $7,499 | 4,419 (1.8%) | 6,343 (3.2%) |
| $7,500 to $9,999 | 3,379 (1.3%) | 4,096 (2.1%) |
| $10,000 to $12,499 | 4,366 (1.7%) | 5,071 (2.6%) |
| $12,500 to $14,999 | 3,800 (1.5%) | 4,566 (2.3%) |
| $15,000 to $17,499 | 2,928 (1.2%) | 4,500 (2.3%) |
| $17,500 to $19,999 | 2,563 (1.0%) | 3,129 (1.6%) |
| $20,000 to $22,499 | 2,913 (1.1%) | 4,026 (2.0%) |
| $22,500 to $24,999 | 4,167 (1.7%) | 5,115 (2.6%) |
| $25,000 to $29,999 | 6,859 (2.7%) | 8,791 (4.4%) |
| $30,000 to $34,999 | 6,906 (2.7%) | 8,446 (4.3%) |
| $35,000 to $39,999 | 7,243 (2.9%) | 6,302 (3.2%) |
| $40,000 to $44,999 | 7,080 (2.8%) | 6,498 (3.3%) |
| $45,000 to $49,999 | 7,889 (3.1%) | 7,223 (3.6%) |
| $50,000 to $54,999 | 6,749 (2.7%) | 6,095 (3.1%) |
| $55,000 to $64,999 | 12,249 (4.9%) | 10,825 (5.5%) |
| $65,000 to $74,999 | 10,906 (4.3%) | 10,567 (5.3%) |
| $75,000 to $99,999 | 23,906 (9.5%) | 21,050 (10.6%) |
| $100,000+ | 123,432 (48.9%) | 61,352 (30.9%) |
| Total | 252,445 (100.0%) | 198,360 (100.0%) |
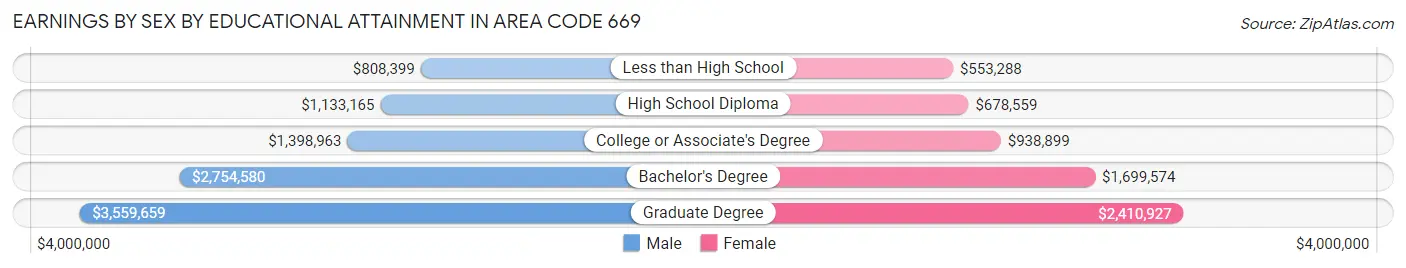
Earnings by Sex by Educational Attainment in Area Code 669
Average earnings in Area Code 669 are $2,413,157 for men and $1,494,692 for women, a difference of 38.1%. Men with an educational attainment of graduate degree enjoy the highest average annual earnings of $3,559,659, while those with less than high school education earn the least with $808,399. Women with an educational attainment of graduate degree earn the most with the average annual earnings of $2,410,927, while those with less than high school education have the smallest earnings of $553,288.
| Educational Attainment | Male Income | Female Income |
| Less than High School | $808,399 | $553,288 |
| High School Diploma | $1,133,165 | $678,559 |
| College or Associate's Degree | $1,398,963 | $938,899 |
| Bachelor's Degree | $2,754,580 | $1,699,574 |
| Graduate Degree | $3,559,659 | $2,410,927 |
| Total | $2,413,157 | $1,494,692 |
Family Income in Area Code 669
Family Income Brackets in Area Code 669
According to the Area Code 669 family income data, there are 1,766,243 families falling into the $200,000+ income range, which is the most common income bracket and makes up 912.0% of all families. Conversely, the $10,000 to $14,999 income bracket is the least frequent group with only 42,994 families (22.2%) belonging to this category.
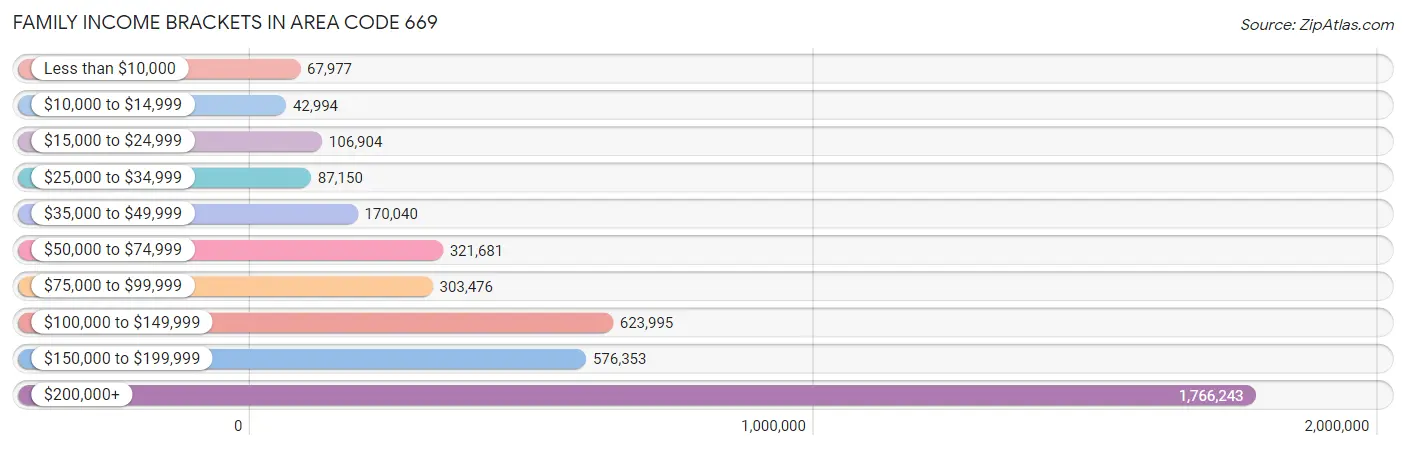
| Income Bracket | # Families | % Families |
| Less than $10,000 | 67,977 | 35.1% |
| $10,000 to $14,999 | 42,994 | 22.2% |
| $15,000 to $24,999 | 106,904 | 55.2% |
| $25,000 to $34,999 | 87,150 | 45.0% |
| $35,000 to $49,999 | 170,040 | 87.8% |
| $50,000 to $74,999 | 321,681 | 166.1% |
| $75,000 to $99,999 | 303,476 | 156.7% |
| $100,000 to $149,999 | 623,995 | 322.2% |
| $150,000 to $199,999 | 576,353 | 297.6% |
| $200,000+ | 1,766,243 | 912.0% |
Family Income by Famaliy Size in Area Code 669
7+ person families (2,898 | 1.5%) account for the highest median family income in Area Code 669 with $211,040 per family, while 2-person families (74,501 | 38.5%) have the highest median income of $74,774 per family member.
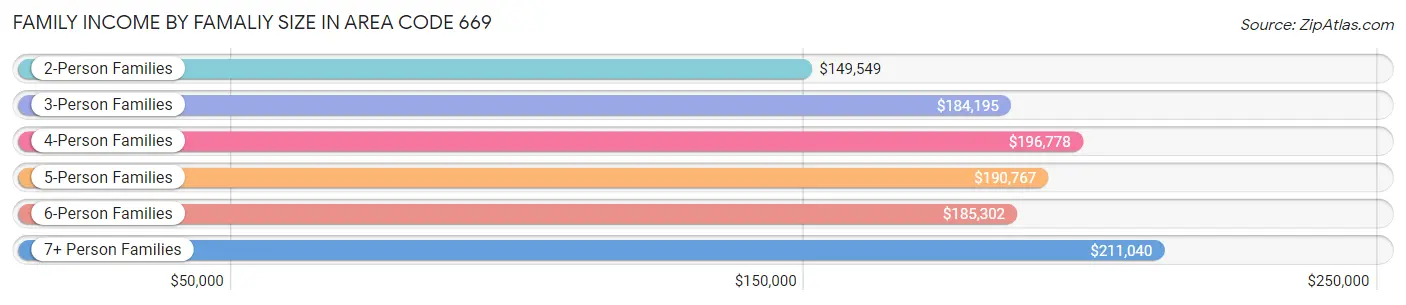
| Income Bracket | # Families | Median Income |
| 2-Person Families | 74,501 (38.5%) | $149,549 |
| 3-Person Families | 49,417 (25.5%) | $184,195 |
| 4-Person Families | 44,846 (23.2%) | $196,778 |
| 5-Person Families | 16,300 (8.4%) | $190,767 |
| 6-Person Families | 5,705 (2.9%) | $185,302 |
| 7+ Person Families | 2,898 (1.5%) | $211,040 |
| Total | 193,667 (100.0%) | $179,206 |
Family Income by Number of Earners in Area Code 669
The median family income in Area Code 669 is $179,206, with families comprising 2 earners (90,078) having the highest median family income of $216,266, while families with no earners (17,492) have the lowest median family income of $66,459, accounting for 46.5% and 9.0% of families, respectively.
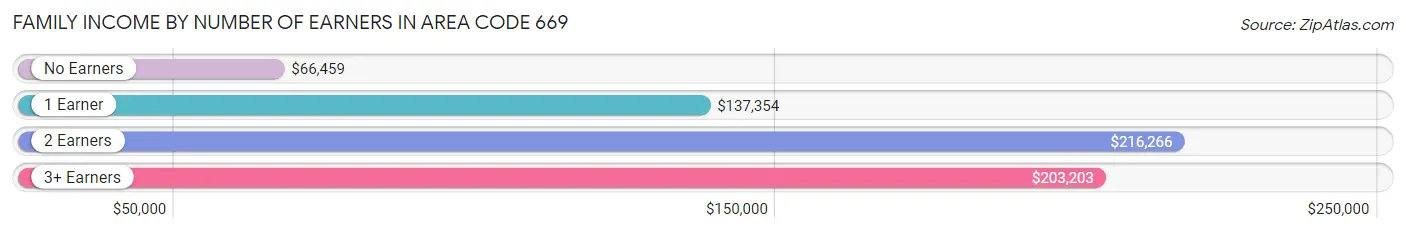
| Number of Earners | # Families | Median Income |
| No Earners | 17,492 (9.0%) | $66,459 |
| 1 Earner | 59,983 (31.0%) | $137,354 |
| 2 Earners | 90,078 (46.5%) | $216,266 |
| 3+ Earners | 26,114 (13.5%) | $203,203 |
| Total | 193,667 (100.0%) | $179,206 |
Household Income in Area Code 669
Household Income Brackets in Area Code 669
With 2,215,655 households falling in the category, the $200,000+ income range is the most frequent in Area Code 669, accounting for 804.4% of all households. In contrast, only 97,506 households (35.4%) fall into the $10,000 to $14,999 income bracket, making it the least populous group.
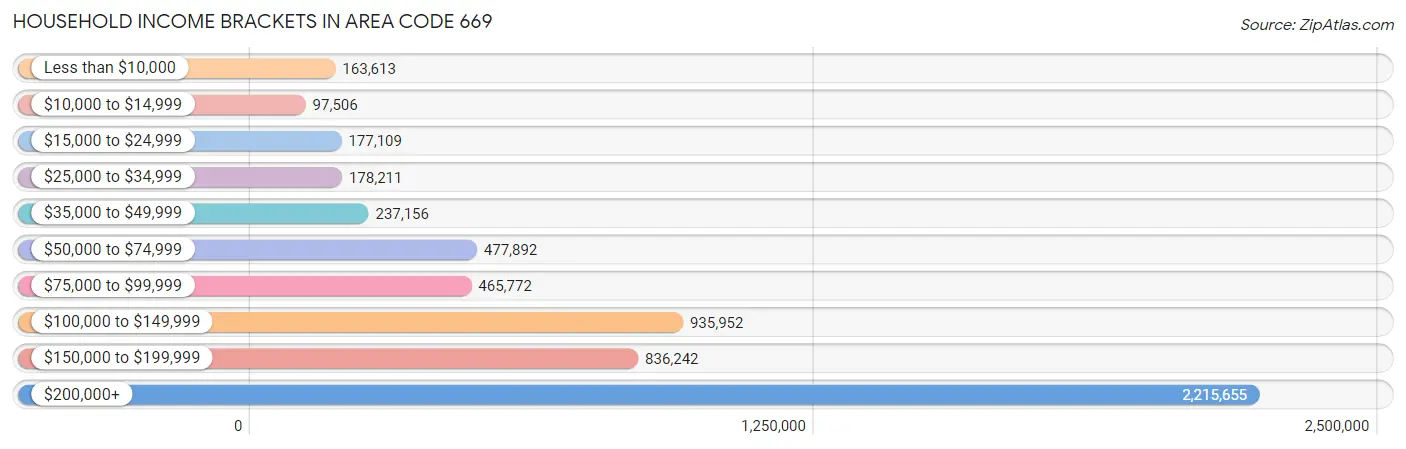
| Income Bracket | # Households | % Households |
| Less than $10,000 | 163,613 | 59.4% |
| $10,000 to $14,999 | 97,506 | 35.4% |
| $15,000 to $24,999 | 177,109 | 64.3% |
| $25,000 to $34,999 | 178,211 | 64.7% |
| $35,000 to $49,999 | 237,156 | 86.1% |
| $50,000 to $74,999 | 477,892 | 173.5% |
| $75,000 to $99,999 | 465,772 | 169.1% |
| $100,000 to $149,999 | 935,952 | 339.8% |
| $150,000 to $199,999 | 836,242 | 303.6% |
| $200,000+ | 2,215,655 | 804.4% |
Household Income by Householder Age in Area Code 669
The median household income in Area Code 669 is $161,915, with the highest median household income of $186,361 found in the 25 to 44 years age bracket for the primary householder. A total of 112,778 households (40.9%) fall into this category. Meanwhile, the 65+ years age bracket for the primary householder has the lowest median household income of $85,149, with 53,469 households (19.4%) in this group.
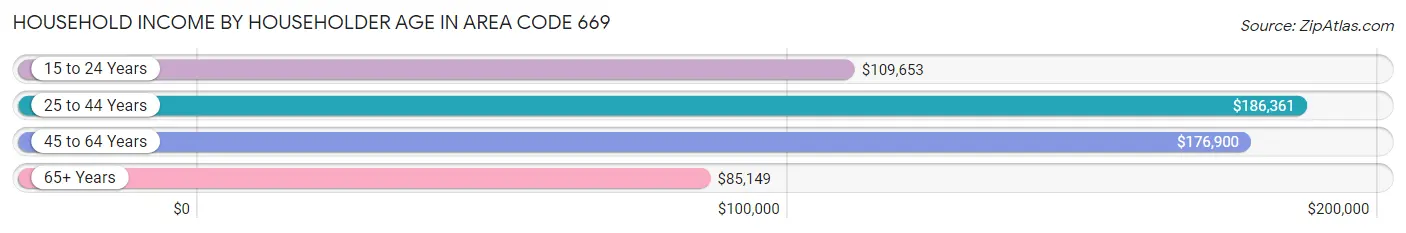
| Income Bracket | # Households | Median Income |
| 15 to 24 Years | 6,810 (2.5%) | $109,653 |
| 25 to 44 Years | 112,778 (40.9%) | $186,361 |
| 45 to 64 Years | 102,385 (37.2%) | $176,900 |
| 65+ Years | 53,469 (19.4%) | $85,149 |
| Total | 275,442 (100.0%) | $161,915 |
Poverty in Area Code 669
Income Below Poverty by Sex and Age in Area Code 669
With 5.9% poverty level for males and 7.4% for females among the residents of Area Code 669, 18 to 24 year old males and 18 to 24 year old females are the most vulnerable to poverty, with 4,002 males (12.3%) and 4,929 females (16.8%) in their respective age groups living below the poverty level.
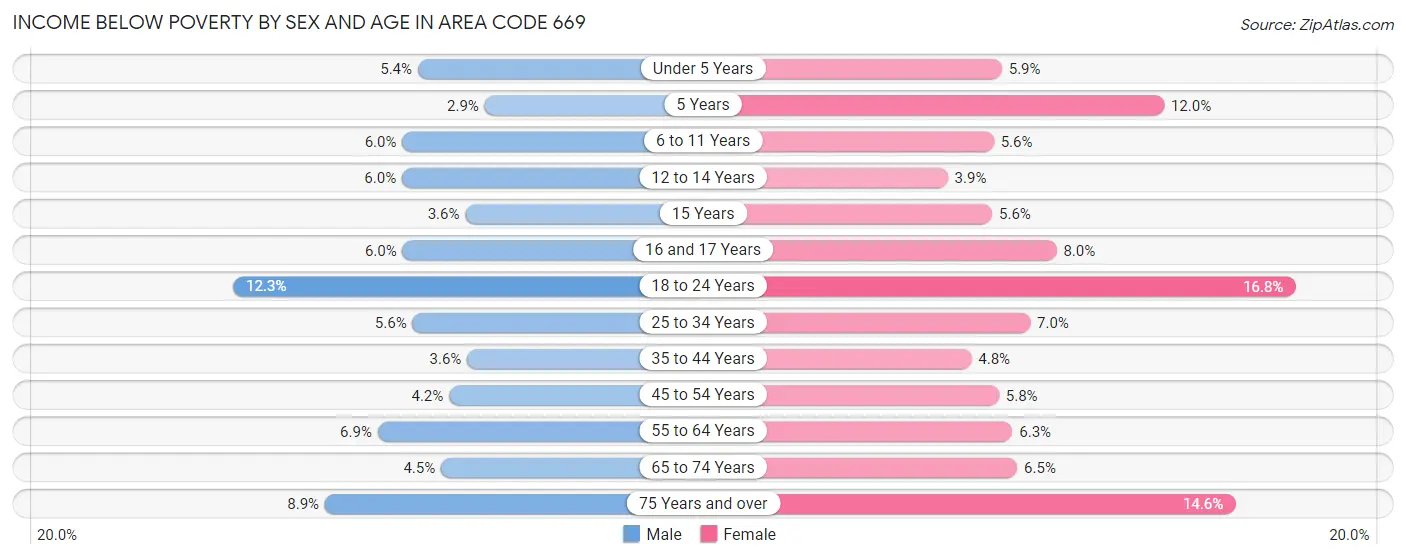
| Age Bracket | Male | Female |
| Under 5 Years | 1,252 (5.4%) | 1,407 (5.9%) |
| 5 Years | 144 (2.9%) | 540 (12.0%) |
| 6 to 11 Years | 1,606 (6.0%) | 1,571 (5.6%) |
| 12 to 14 Years | 914 (6.0%) | 563 (3.9%) |
| 15 Years | 172 (3.6%) | 248 (5.6%) |
| 16 and 17 Years | 562 (6.0%) | 722 (8.0%) |
| 18 to 24 Years | 4,002 (12.3%) | 4,929 (16.8%) |
| 25 to 34 Years | 4,076 (5.6%) | 4,482 (7.0%) |
| 35 to 44 Years | 2,248 (3.6%) | 2,705 (4.8%) |
| 45 to 54 Years | 2,244 (4.2%) | 2,966 (5.8%) |
| 55 to 64 Years | 3,328 (6.9%) | 2,839 (6.3%) |
| 65 to 74 Years | 1,201 (4.5%) | 1,966 (6.5%) |
| 75 Years and over | 1,669 (8.8%) | 3,680 (14.6%) |
| Total | 23,418 (5.9%) | 28,618 (7.4%) |
Income Above Poverty by Sex and Age in Area Code 669
According to the poverty statistics in Area Code 669, males aged 5 years and females aged 12 to 14 years are the age groups that are most secure financially, with 97.1% of males and 96.1% of females in these age groups living above the poverty line.
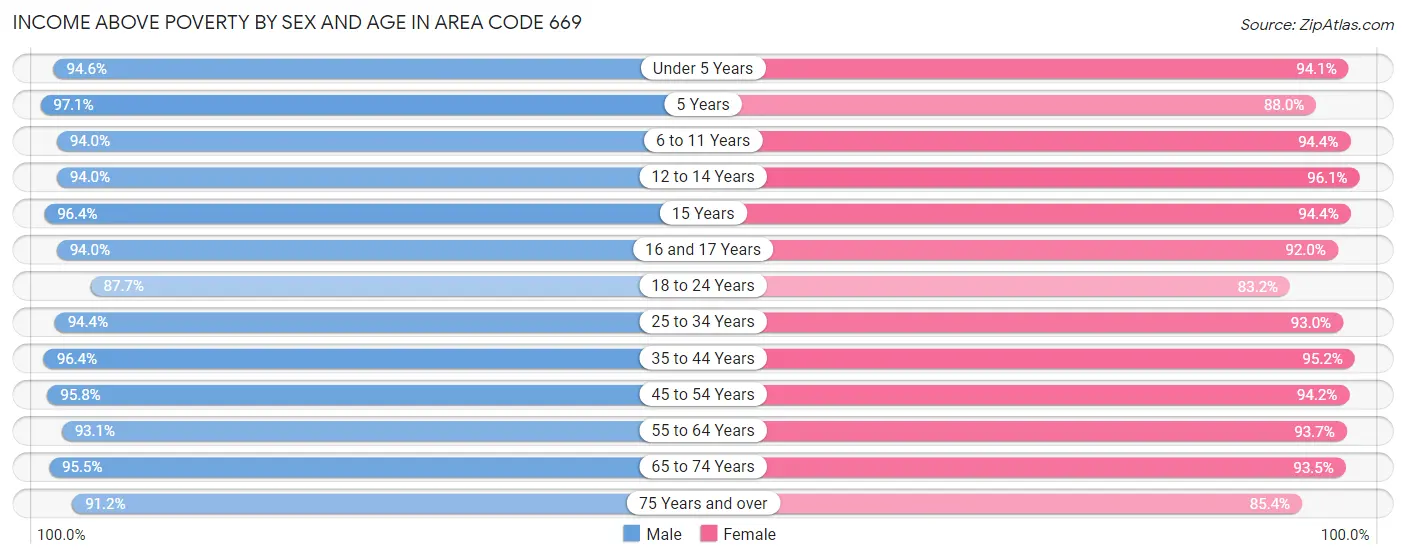
| Age Bracket | Male | Female |
| Under 5 Years | 21,914 (94.6%) | 22,289 (94.1%) |
| 5 Years | 4,783 (97.1%) | 3,974 (88.0%) |
| 6 to 11 Years | 25,270 (94.0%) | 26,276 (94.4%) |
| 12 to 14 Years | 14,336 (94.0%) | 13,778 (96.1%) |
| 15 Years | 4,554 (96.4%) | 4,196 (94.4%) |
| 16 and 17 Years | 8,852 (94.0%) | 8,338 (92.0%) |
| 18 to 24 Years | 28,651 (87.7%) | 24,354 (83.2%) |
| 25 to 34 Years | 68,744 (94.4%) | 59,681 (93.0%) |
| 35 to 44 Years | 60,664 (96.4%) | 53,504 (95.2%) |
| 45 to 54 Years | 50,715 (95.8%) | 47,883 (94.2%) |
| 55 to 64 Years | 45,008 (93.1%) | 42,006 (93.7%) |
| 65 to 74 Years | 25,235 (95.5%) | 28,242 (93.5%) |
| 75 Years and over | 17,187 (91.1%) | 21,525 (85.4%) |
| Total | 375,913 (94.1%) | 356,046 (92.6%) |
Income Below Poverty Among Married-Couple Families in Area Code 669
The poverty statistics for married-couple families in Area Code 669 show that 2.6% or 3,954 of the total 153,972 families live below the poverty line. Families with 5 or more children have the highest poverty rate of 23.5%, comprising of 65 families. On the other hand, families with 1 or 2 children have the lowest poverty rate of 2.4%, which includes 1,587 families.
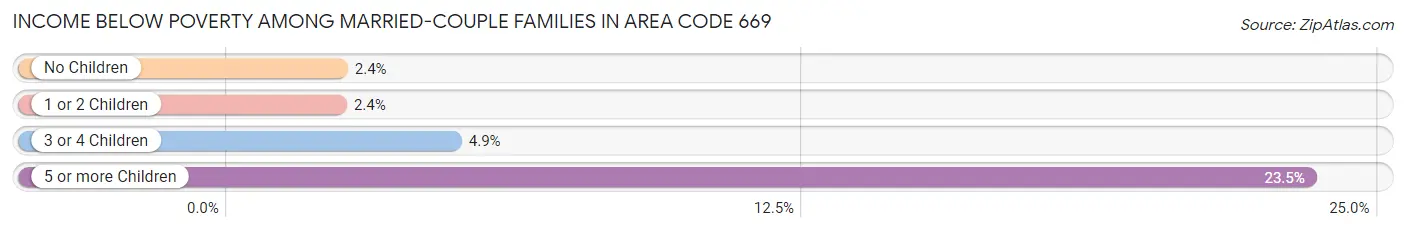
| Children | Above Poverty | Below Poverty |
| No Children | 75,920 (97.6%) | 1,860 (2.4%) |
| 1 or 2 Children | 65,251 (97.6%) | 1,587 (2.4%) |
| 3 or 4 Children | 8,635 (95.1%) | 442 (4.9%) |
| 5 or more Children | 212 (76.5%) | 65 (23.5%) |
| Total | 150,018 (97.4%) | 3,954 (2.6%) |
Income Below Poverty Among Single-Parent Households in Area Code 669
According to the poverty data in Area Code 669, 5.1% or 648 single-father households and 11.2% or 3,031 single-mother households are living below the poverty line. Among single-father households, those with 3 or 4 children have the highest poverty rate, with 52 households (11.5%) experiencing poverty. Likewise, among single-mother households, those with 3 or 4 children have the highest poverty rate, with 348 households (22.1%) falling below the poverty line.
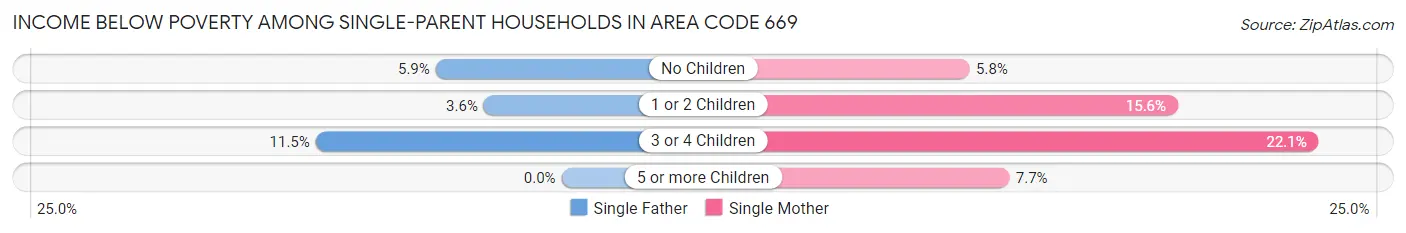
| Children | Single Father | Single Mother |
| No Children | 413 (5.9%) | 765 (5.8%) |
| 1 or 2 Children | 183 (3.6%) | 1,907 (15.6%) |
| 3 or 4 Children | 52 (11.5%) | 348 (22.1%) |
| 5 or more Children | 0 (0.0%) | 11 (7.7%) |
| Total | 648 (5.1%) | 3,031 (11.2%) |
Income Below Poverty Among Married-Couple vs Single-Parent Households in Area Code 669
The poverty data for Area Code 669 shows that 3,954 of the married-couple family households (2.6%) and 3,679 of the single-parent households (9.3%) are living below the poverty level. Within the married-couple family households, those with 5 or more children have the highest poverty rate, with 65 households (23.5%) falling below the poverty line. Among the single-parent households, those with 3 or 4 children have the highest poverty rate, with 400 household (19.7%) living below poverty.
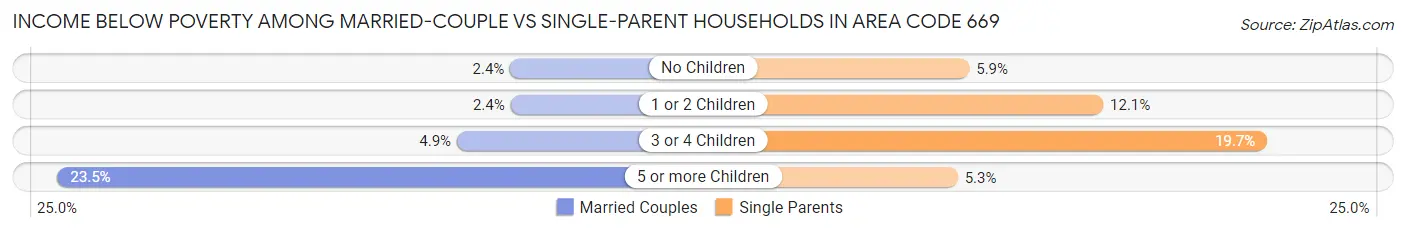
| Children | Married-Couple Families | Single-Parent Households |
| No Children | 1,860 (2.4%) | 1,178 (5.9%) |
| 1 or 2 Children | 1,587 (2.4%) | 2,090 (12.1%) |
| 3 or 4 Children | 442 (4.9%) | 400 (19.7%) |
| 5 or more Children | 65 (23.5%) | 11 (5.3%) |
| Total | 3,954 (2.6%) | 3,679 (9.3%) |
Race in Area Code 669
The most populous races in Area Code 669 are Asian (307,992 | 38.9%), White / Caucasian (288,402 | 36.4%), and Hispanic or Latino (191,377 | 24.2%).
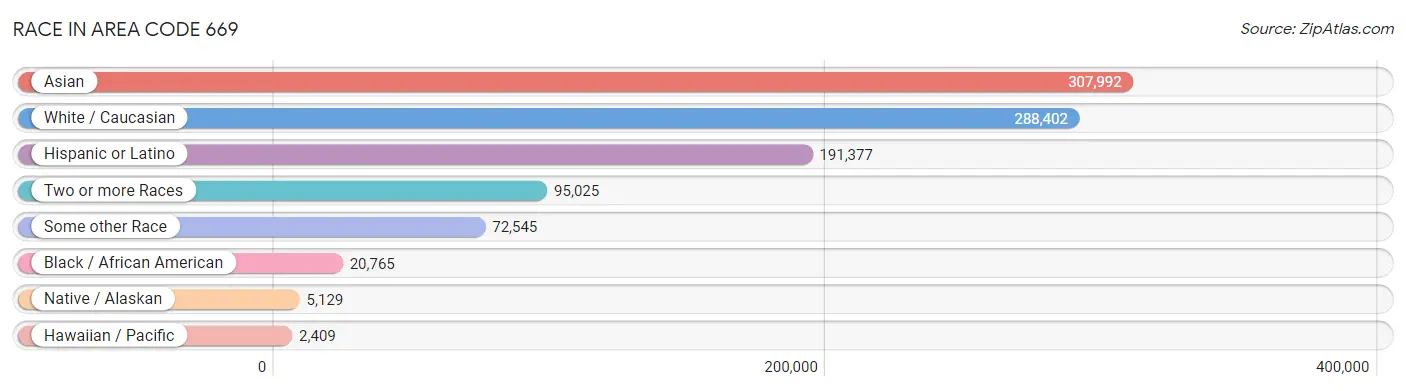
| Race | # Population | % Population |
| Asian | 307,992 | 38.9% |
| Black / African American | 20,765 | 2.6% |
| Hawaiian / Pacific | 2,409 | 0.3% |
| Hispanic or Latino | 191,377 | 24.2% |
| Native / Alaskan | 5,129 | 0.6% |
| White / Caucasian | 288,402 | 36.4% |
| Two or more Races | 95,025 | 12.0% |
| Some other Race | 72,545 | 9.2% |
| Total | 792,267 | 100.0% |
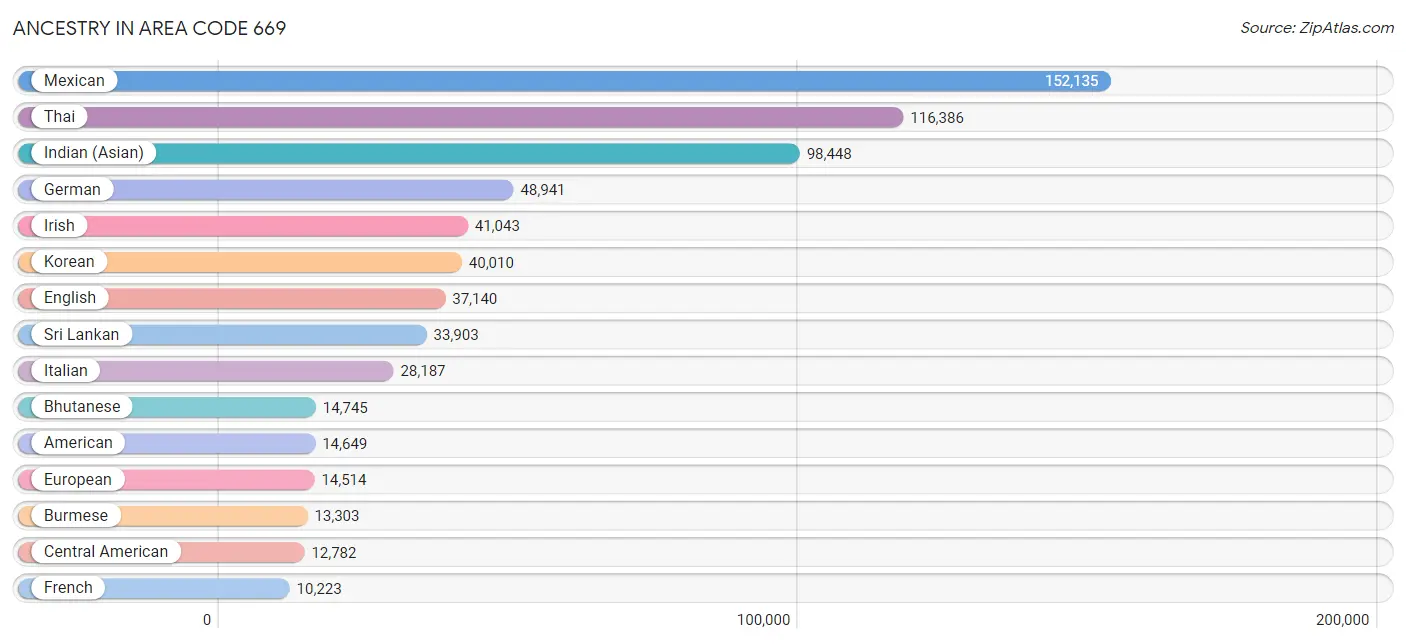
Ancestry in Area Code 669
The most populous ancestries reported in Area Code 669 are Mexican (152,135 | 19.2%), Thai (116,386 | 14.7%), Indian (Asian) (98,448 | 12.4%), German (48,941 | 6.2%), and Irish (41,043 | 5.2%), together accounting for 57.7% of all Area Code 669 residents.
| Ancestry | # Population | % Population |
| Afghan | 2,770 | 0.4% |
| African | 1,456 | 0.2% |
| Alaska Native | 13 | 0.0% |
| Alaskan Athabascan | 10 | 0.0% |
| Albanian | 53 | 0.0% |
| American | 14,649 | 1.8% |
| Apache | 636 | 0.1% |
| Arab | 6,356 | 0.8% |
| Argentinean | 972 | 0.1% |
| Armenian | 1,387 | 0.2% |
| Assyrian / Chaldean / Syriac | 1,225 | 0.2% |
| Australian | 525 | 0.1% |
| Austrian | 1,798 | 0.2% |
| Bangladeshi | 468 | 0.1% |
| Barbadian | 44 | 0.0% |
| Basque | 268 | 0.0% |
| Belgian | 455 | 0.1% |
| Belizean | 24 | 0.0% |
| Bhutanese | 14,745 | 1.9% |
| Blackfeet | 257 | 0.0% |
| Bolivian | 243 | 0.0% |
| Brazilian | 1,857 | 0.2% |
| British | 4,647 | 0.6% |
| British West Indian | 32 | 0.0% |
| Bulgarian | 510 | 0.1% |
| Burmese | 13,303 | 1.7% |
| Cajun | 62 | 0.0% |
| Cambodian | 258 | 0.0% |
| Canadian | 1,119 | 0.1% |
| Cape Verdean | 195 | 0.0% |
| Celtic | 241 | 0.0% |
| Central American | 12,782 | 1.6% |
| Central American Indian | 784 | 0.1% |
| Cherokee | 1,737 | 0.2% |
| Cheyenne | 7 | 0.0% |
| Chickasaw | 18 | 0.0% |
| Chilean | 1,107 | 0.1% |
| Chinese | 31 | 0.0% |
| Chippewa | 122 | 0.0% |
| Choctaw | 312 | 0.0% |
| Colombian | 3,382 | 0.4% |
| Comanche | 228 | 0.0% |
| Costa Rican | 493 | 0.1% |
| Cree | 8 | 0.0% |
| Creek | 23 | 0.0% |
| Croatian | 1,538 | 0.2% |
| Crow | 24 | 0.0% |
| Cuban | 1,437 | 0.2% |
| Czech | 1,565 | 0.2% |
| Czechoslovakian | 274 | 0.0% |
| Danish | 2,746 | 0.4% |
| Delaware | 19 | 0.0% |
| Dominican | 294 | 0.0% |
| Dutch | 4,518 | 0.6% |
| Dutch West Indian | 20 | 0.0% |
| Eastern European | 2,184 | 0.3% |
| Ecuadorian | 191 | 0.0% |
| Egyptian | 841 | 0.1% |
| English | 37,140 | 4.7% |
| Estonian | 41 | 0.0% |
| Ethiopian | 1,833 | 0.2% |
| European | 14,514 | 1.8% |
| Fijian | 4 | 0.0% |
| Filipino | 8,162 | 1.0% |
| Finnish | 1,030 | 0.1% |
| French | 10,223 | 1.3% |
| French American Indian | 25 | 0.0% |
| French Canadian | 1,665 | 0.2% |
| German | 48,941 | 6.2% |
| Ghanaian | 309 | 0.0% |
| Greek | 2,293 | 0.3% |
| Guamanian / Chamorro | 869 | 0.1% |
| Guatemalan | 2,540 | 0.3% |
| Guyanese | 158 | 0.0% |
| Haitian | 162 | 0.0% |
| Honduran | 1,604 | 0.2% |
| Hopi | 36 | 0.0% |
| Hungarian | 1,942 | 0.3% |
| Icelander | 452 | 0.1% |
| Indian (Asian) | 98,448 | 12.4% |
| Indonesian | 1,781 | 0.2% |
| Inupiat | 391 | 0.1% |
| Iranian | 6,797 | 0.9% |
| Iraqi | 493 | 0.1% |
| Irish | 41,043 | 5.2% |
| Iroquois | 70 | 0.0% |
| Israeli | 1,778 | 0.2% |
| Italian | 28,187 | 3.6% |
| Jamaican | 396 | 0.1% |
| Japanese | 2,197 | 0.3% |
| Jordanian | 491 | 0.1% |
| Kenyan | 269 | 0.0% |
| Korean | 40,010 | 5.1% |
| Laotian | 840 | 0.1% |
| Latvian | 242 | 0.0% |
| Lebanese | 981 | 0.1% |
| Liberian | 69 | 0.0% |
| Lithuanian | 736 | 0.1% |
| Lumbee | 19 | 0.0% |
| Luxembourger | 16 | 0.0% |
| Macedonian | 120 | 0.0% |
| Malaysian | 630 | 0.1% |
| Maltese | 469 | 0.1% |
| Mexican | 152,135 | 19.2% |
| Mexican American Indian | 3,530 | 0.4% |
| Mongolian | 343 | 0.0% |
| Moroccan | 557 | 0.1% |
| Native Hawaiian | 2,021 | 0.3% |
| Navajo | 606 | 0.1% |
| Nepalese | 50 | 0.0% |
| New Zealander | 27 | 0.0% |
| Nicaraguan | 1,453 | 0.2% |
| Nigerian | 841 | 0.1% |
| Northern European | 1,556 | 0.2% |
| Norwegian | 5,236 | 0.7% |
| Okinawan | 217 | 0.0% |
| Osage | 11 | 0.0% |
| Ottawa | 12 | 0.0% |
| Paiute | 76 | 0.0% |
| Pakistani | 1,256 | 0.2% |
| Palestinian | 654 | 0.1% |
| Panamanian | 204 | 0.0% |
| Paraguayan | 35 | 0.0% |
| Pennsylvania German | 98 | 0.0% |
| Peruvian | 2,122 | 0.3% |
| Polish | 6,639 | 0.8% |
| Portuguese | 8,537 | 1.1% |
| Potawatomi | 39 | 0.0% |
| Pueblo | 71 | 0.0% |
| Puerto Rican | 5,233 | 0.7% |
| Puget Sound Salish | 9 | 0.0% |
| Romanian | 1,059 | 0.1% |
| Russian | 6,934 | 0.9% |
| Salvadoran | 6,268 | 0.8% |
| Samoan | 765 | 0.1% |
| Scandinavian | 2,010 | 0.3% |
| Scotch-Irish | 3,070 | 0.4% |
| Scottish | 8,491 | 1.1% |
| Seminole | 51 | 0.0% |
| Serbian | 246 | 0.0% |
| Sioux | 69 | 0.0% |
| Slavic | 196 | 0.0% |
| Slovak | 422 | 0.1% |
| Slovene | 227 | 0.0% |
| Somali | 39 | 0.0% |
| South African | 131 | 0.0% |
| South American | 8,930 | 1.1% |
| South American Indian | 282 | 0.0% |
| Spaniard | 3,472 | 0.4% |
| Spanish | 2,749 | 0.4% |
| Spanish American | 39 | 0.0% |
| Spanish American Indian | 20 | 0.0% |
| Sri Lankan | 33,903 | 4.3% |
| Subsaharan African | 5,558 | 0.7% |
| Sudanese | 37 | 0.0% |
| Swedish | 6,035 | 0.8% |
| Swiss | 2,011 | 0.3% |
| Syrian | 430 | 0.1% |
| Taiwanese | 79 | 0.0% |
| Thai | 116,386 | 14.7% |
| Tohono O'Odham | 250 | 0.0% |
| Tongan | 959 | 0.1% |
| Trinidadian and Tobagonian | 160 | 0.0% |
| Tsimshian | 109 | 0.0% |
| Turkish | 1,296 | 0.2% |
| Ugandan | 36 | 0.0% |
| Ukrainian | 3,204 | 0.4% |
| Uruguayan | 115 | 0.0% |
| Ute | 16 | 0.0% |
| Venezuelan | 631 | 0.1% |
| Vietnamese | 830 | 0.1% |
| Welsh | 2,529 | 0.3% |
| West Indian | 84 | 0.0% |
| Yaqui | 412 | 0.1% |
| Yugoslavian | 633 | 0.1% |
| Yuman | 14 | 0.0% |
| Yup'ik | 56 | 0.0% | View All 177 Rows |
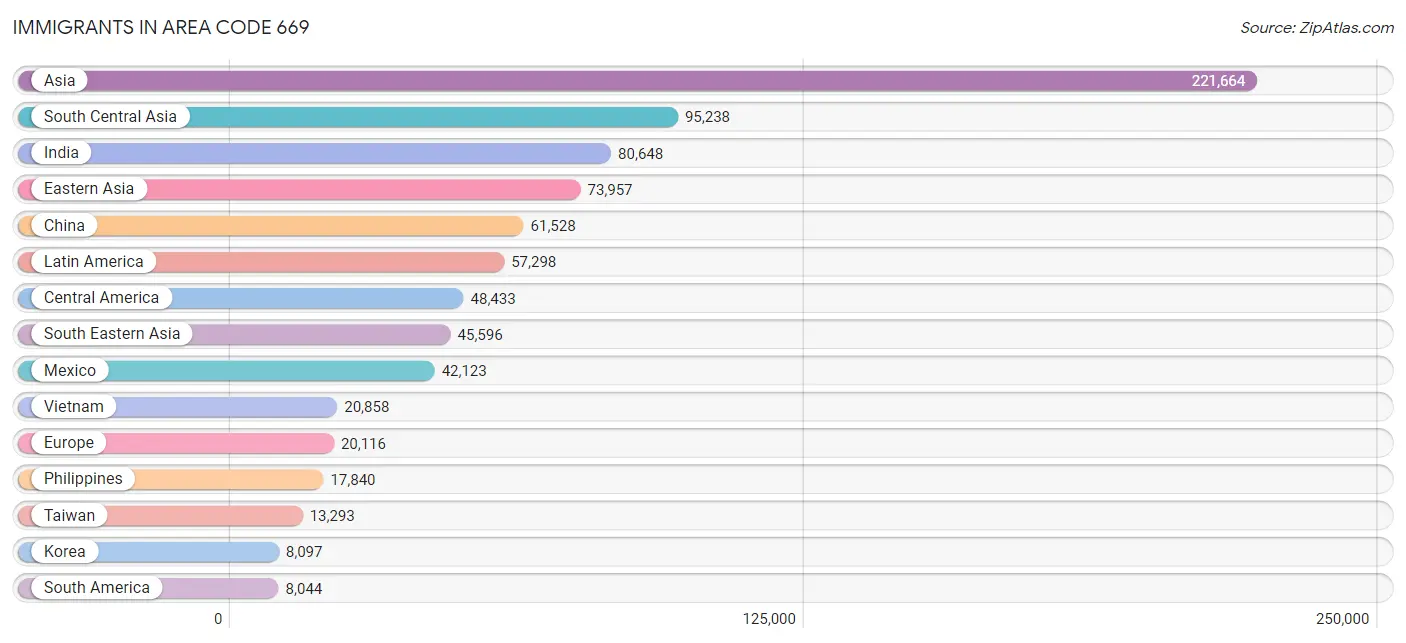
Immigrants in Area Code 669
The most numerous immigrant groups reported in Area Code 669 came from Asia (221,664 | 28.0%), South Central Asia (95,238 | 12.0%), India (80,648 | 10.2%), Eastern Asia (73,957 | 9.3%), and China (61,528 | 7.8%), together accounting for 67.3% of all Area Code 669 residents.
| Immigration Origin | # Population | % Population |
| Afghanistan | 1,825 | 0.2% |
| Africa | 5,011 | 0.6% |
| Argentina | 669 | 0.1% |
| Armenia | 224 | 0.0% |
| Asia | 221,664 | 28.0% |
| Australia | 495 | 0.1% |
| Austria | 243 | 0.0% |
| Azores | 80 | 0.0% |
| Bangladesh | 1,446 | 0.2% |
| Barbados | 13 | 0.0% |
| Belarus | 563 | 0.1% |
| Belgium | 126 | 0.0% |
| Bolivia | 213 | 0.0% |
| Bosnia and Herzegovina | 207 | 0.0% |
| Brazil | 1,949 | 0.3% |
| Bulgaria | 219 | 0.0% |
| Cambodia | 620 | 0.1% |
| Cameroon | 284 | 0.0% |
| Canada | 3,609 | 0.5% |
| Caribbean | 821 | 0.1% |
| Central America | 48,433 | 6.1% |
| Chile | 626 | 0.1% |
| China | 61,528 | 7.8% |
| Colombia | 2,519 | 0.3% |
| Congo | 45 | 0.0% |
| Costa Rica | 224 | 0.0% |
| Croatia | 343 | 0.0% |
| Cuba | 347 | 0.0% |
| Czechoslovakia | 228 | 0.0% |
| Denmark | 141 | 0.0% |
| Dominican Republic | 58 | 0.0% |
| Eastern Africa | 2,569 | 0.3% |
| Eastern Asia | 73,957 | 9.3% |
| Eastern Europe | 7,914 | 1.0% |
| Ecuador | 62 | 0.0% |
| Egypt | 538 | 0.1% |
| El Salvador | 2,898 | 0.4% |
| England | 1,103 | 0.1% |
| Eritrea | 573 | 0.1% |
| Ethiopia | 1,140 | 0.1% |
| Europe | 20,116 | 2.5% |
| Fiji | 250 | 0.0% |
| France | 1,223 | 0.2% |
| Germany | 2,328 | 0.3% |
| Ghana | 251 | 0.0% |
| Greece | 364 | 0.1% |
| Guatemala | 988 | 0.1% |
| Guyana | 103 | 0.0% |
| Haiti | 74 | 0.0% |
| Honduras | 1,128 | 0.1% |
| Hong Kong | 5,181 | 0.6% |
| Hungary | 201 | 0.0% |
| India | 80,648 | 10.2% |
| Indonesia | 928 | 0.1% |
| Iran | 6,046 | 0.8% |
| Iraq | 548 | 0.1% |
| Ireland | 473 | 0.1% |
| Israel | 2,370 | 0.3% |
| Italy | 928 | 0.1% |
| Jamaica | 245 | 0.0% |
| Japan | 4,309 | 0.5% |
| Jordan | 504 | 0.1% |
| Kazakhstan | 189 | 0.0% |
| Kenya | 492 | 0.1% |
| Korea | 8,097 | 1.0% |
| Kuwait | 67 | 0.0% |
| Laos | 354 | 0.0% |
| Latin America | 57,298 | 7.2% |
| Latvia | 120 | 0.0% |
| Lebanon | 635 | 0.1% |
| Liberia | 72 | 0.0% |
| Lithuania | 86 | 0.0% |
| Malaysia | 1,512 | 0.2% |
| Mexico | 42,123 | 5.3% |
| Middle Africa | 329 | 0.0% |
| Moldova | 159 | 0.0% |
| Morocco | 199 | 0.0% |
| Nepal | 1,112 | 0.1% |
| Netherlands | 493 | 0.1% |
| Nicaragua | 872 | 0.1% |
| Nigeria | 395 | 0.1% |
| North Macedonia | 26 | 0.0% |
| Northern Africa | 931 | 0.1% |
| Northern Europe | 4,929 | 0.6% |
| Norway | 42 | 0.0% |
| Oceania | 1,357 | 0.2% |
| Pakistan | 2,957 | 0.4% |
| Panama | 152 | 0.0% |
| Peru | 1,097 | 0.1% |
| Philippines | 17,840 | 2.2% |
| Poland | 336 | 0.0% |
| Portugal | 673 | 0.1% |
| Romania | 413 | 0.1% |
| Russia | 2,580 | 0.3% |
| Saudi Arabia | 327 | 0.0% |
| Scotland | 150 | 0.0% |
| Serbia | 92 | 0.0% |
| Sierra Leone | 17 | 0.0% |
| Singapore | 571 | 0.1% |
| Somalia | 25 | 0.0% |
| South Africa | 314 | 0.0% |
| South America | 8,044 | 1.0% |
| South Central Asia | 95,238 | 12.0% |
| South Eastern Asia | 45,596 | 5.8% |
| Southern Europe | 2,340 | 0.3% |
| Spain | 367 | 0.1% |
| Sri Lanka | 659 | 0.1% |
| Sudan | 56 | 0.0% |
| Sweden | 632 | 0.1% |
| Switzerland | 403 | 0.1% |
| Syria | 118 | 0.0% |
| Taiwan | 13,293 | 1.7% |
| Thailand | 995 | 0.1% |
| Trinidad and Tobago | 75 | 0.0% |
| Turkey | 807 | 0.1% |
| Uganda | 134 | 0.0% |
| Ukraine | 1,922 | 0.2% |
| Uruguay | 58 | 0.0% |
| Uzbekistan | 265 | 0.0% |
| Venezuela | 602 | 0.1% |
| Vietnam | 20,858 | 2.6% |
| Western Africa | 751 | 0.1% |
| Western Asia | 6,530 | 0.8% |
| Western Europe | 4,816 | 0.6% |
| Yemen | 53 | 0.0% |
| Zimbabwe | 30 | 0.0% | View All 126 Rows |
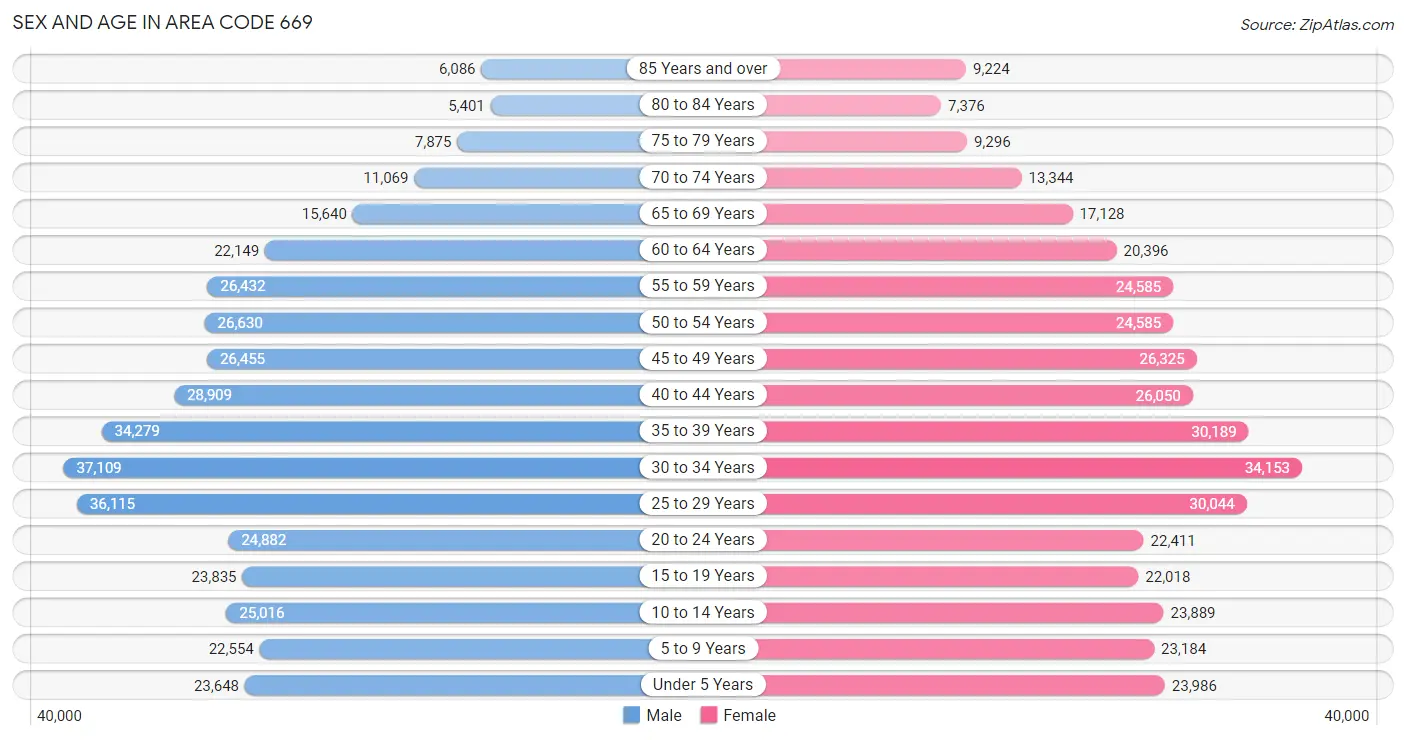
Sex and Age in Area Code 669
Sex and Age in Area Code 669
The most populous age groups in Area Code 669 are 30 to 34 Years (37,109 | 9.2%) for men and 30 to 34 Years (34,153 | 8.8%) for women.
| Age Bracket | Male | Female |
| Under 5 Years | 23,648 (5.9%) | 23,986 (6.2%) |
| 5 to 9 Years | 22,554 (5.6%) | 23,184 (6.0%) |
| 10 to 14 Years | 25,016 (6.2%) | 23,889 (6.1%) |
| 15 to 19 Years | 23,835 (5.9%) | 22,018 (5.7%) |
| 20 to 24 Years | 24,882 (6.2%) | 22,411 (5.8%) |
| 25 to 29 Years | 36,115 (8.9%) | 30,044 (7.7%) |
| 30 to 34 Years | 37,109 (9.2%) | 34,153 (8.8%) |
| 35 to 39 Years | 34,279 (8.5%) | 30,189 (7.8%) |
| 40 to 44 Years | 28,909 (7.1%) | 26,050 (6.7%) |
| 45 to 49 Years | 26,455 (6.6%) | 26,325 (6.8%) |
| 50 to 54 Years | 26,630 (6.6%) | 24,585 (6.3%) |
| 55 to 59 Years | 26,432 (6.5%) | 24,585 (6.3%) |
| 60 to 64 Years | 22,149 (5.5%) | 20,396 (5.2%) |
| 65 to 69 Years | 15,640 (3.9%) | 17,128 (4.4%) |
| 70 to 74 Years | 11,069 (2.7%) | 13,344 (3.4%) |
| 75 to 79 Years | 7,875 (1.9%) | 9,296 (2.4%) |
| 80 to 84 Years | 5,401 (1.3%) | 7,376 (1.9%) |
| 85 Years and over | 6,086 (1.5%) | 9,224 (2.4%) |
| Total | 404,084 (100.0%) | 388,183 (100.0%) |
Families and Households in Area Code 669
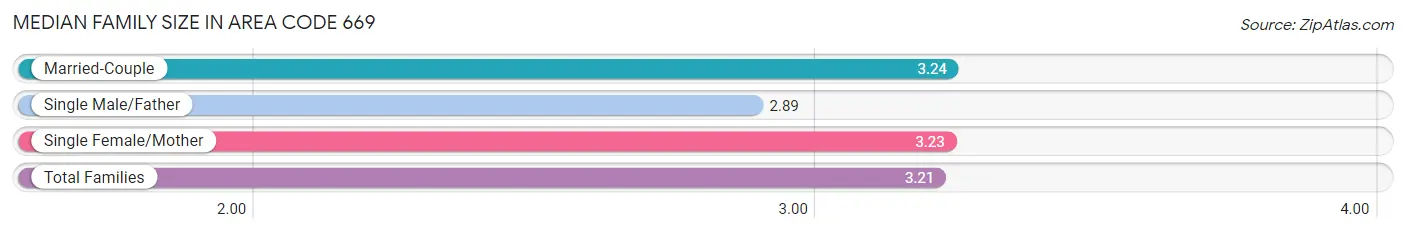
Median Family Size in Area Code 669
The median family size in Area Code 669 is 3.21 persons per family, with married-couple families (153,972 | 79.5%) accounting for the largest median family size of 3.23619 persons per family. On the other hand, single male/father families (12,615 | 6.5%) represent the smallest median family size with 2.89 persons per family.
| Family Type | # Families | Family Size |
| Married-Couple | 153,972 (79.5%) | 3.24 |
| Single Male/Father | 12,615 (6.5%) | 2.89 |
| Single Female/Mother | 27,080 (14.0%) | 3.23 |
| Total Families | 193,667 (100.0%) | 3.21 |
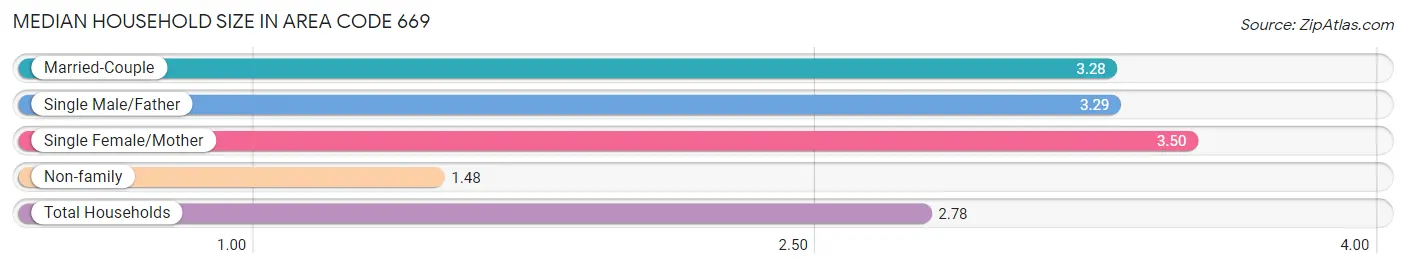
Median Household Size in Area Code 669
The median household size in Area Code 669 is 2.78 persons per household, with single female/mother households (27,080 | 9.8%) accounting for the largest median household size of 3.49523 persons per household. non-family households (81,775 | 29.7%) represent the smallest median household size with 1.48 persons per household.
| Household Type | # Households | Household Size |
| Married-Couple | 153,972 (55.9%) | 3.28 |
| Single Male/Father | 12,615 (4.6%) | 3.29 |
| Single Female/Mother | 27,080 (9.8%) | 3.50 |
| Non-family | 81,775 (29.7%) | 1.48 |
| Total Households | 275,442 (100.0%) | 2.78 |
Household Size by Marriage Status in Area Code 669
Out of a total of 275,442 households in Area Code 669, 193,667 (70.3%) are family households, while 81,775 (29.7%) are nonfamily households. The most numerous type of family households are 2-person households, comprising 69,157, and the most common type of nonfamily households are 1-person households, comprising 57,199.
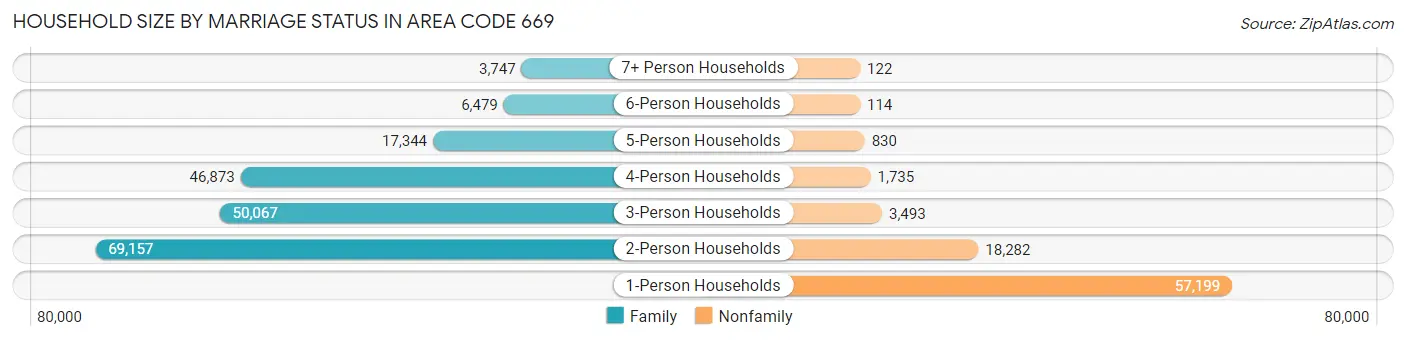
| Household Size | Family Households | Nonfamily Households |
| 1-Person Households | - | 57,199 (20.8%) |
| 2-Person Households | 69,157 (25.1%) | 18,282 (6.6%) |
| 3-Person Households | 50,067 (18.2%) | 3,493 (1.3%) |
| 4-Person Households | 46,873 (17.0%) | 1,735 (0.6%) |
| 5-Person Households | 17,344 (6.3%) | 830 (0.3%) |
| 6-Person Households | 6,479 (2.4%) | 114 (0.0%) |
| 7+ Person Households | 3,747 (1.4%) | 122 (0.0%) |
| Total | 193,667 (70.3%) | 81,775 (29.7%) |
Female Fertility in Area Code 669
Fertility by Age in Area Code 669
Average fertility rate in Area Code 669 is 50.0 births per 1,000 women. Women in the age bracket of 20 to 34 years have the highest fertility rate with 65.6 births per 1,000 women. Women in the age bracket of 20 to 34 years acount for 62.3% of all women with births.
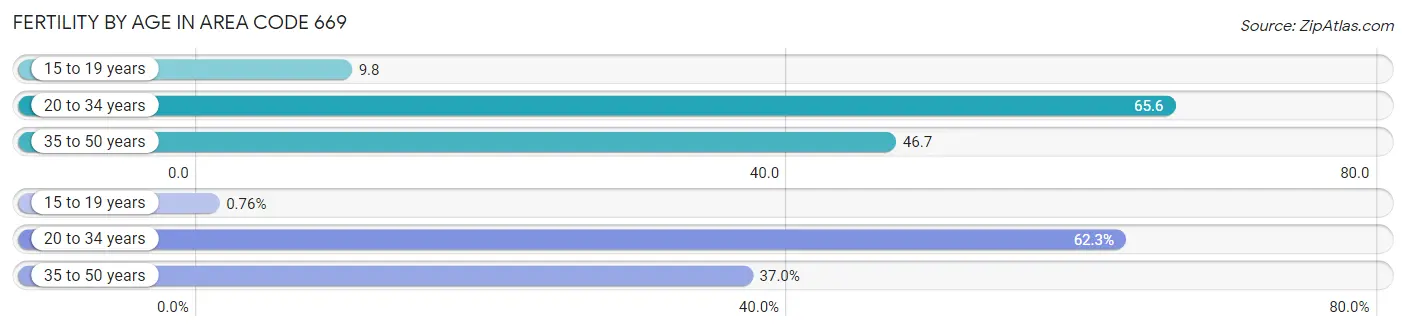
| Age Bracket | Women with Births | Births / 1,000 Women |
| 15 to 19 years | 72 (0.8%) | 9.8 |
| 20 to 34 years | 5,922 (62.3%) | 65.6 |
| 35 to 50 years | 3,514 (37.0%) | 46.7 |
| Total | 9,508 (100.0%) | 50.0 |
Fertility by Age by Marriage Status in Area Code 669
81.0% of women with births (9,508) in Area Code 669 are married. The highest percentage of unmarried women with births falls into 15 to 19 years age bracket with 100.0% of them unmarried at the time of birth, while the lowest percentage of unmarried women with births belong to 20 to 34 years age bracket with 19.2% of them unmarried.
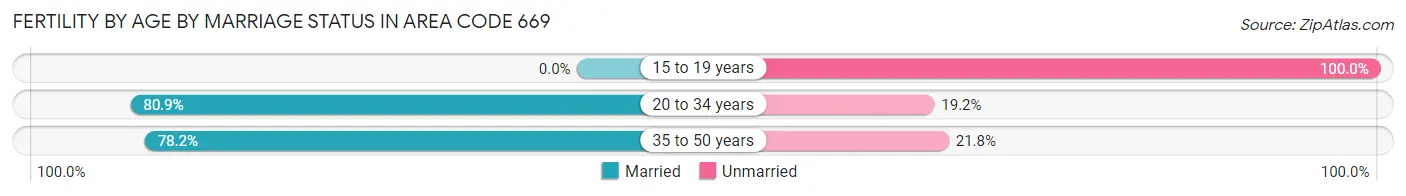
| Age Bracket | Married | Unmarried |
| 15 to 19 years | 0 (0.0%) | 72 (100.0%) |
| 20 to 34 years | 4,788 (80.8%) | 1,134 (19.2%) |
| 35 to 50 years | 2,749 (78.2%) | 765 (21.8%) |
| Total | 7,700 (81.0%) | 1,808 (19.0%) |
Fertility by Education in Area Code 669
Average fertility rate in Area Code 669 is 50.0 births per 1,000 women. Women with the education attainment of graduate degree have the highest fertility rate of 64.6 births per 1,000 women, while women with the education attainment of less than high school have the lowest fertility at 30.1 births per 1,000 women. Women with the education attainment of bachelor's degree represent 33.5% of all women with births.
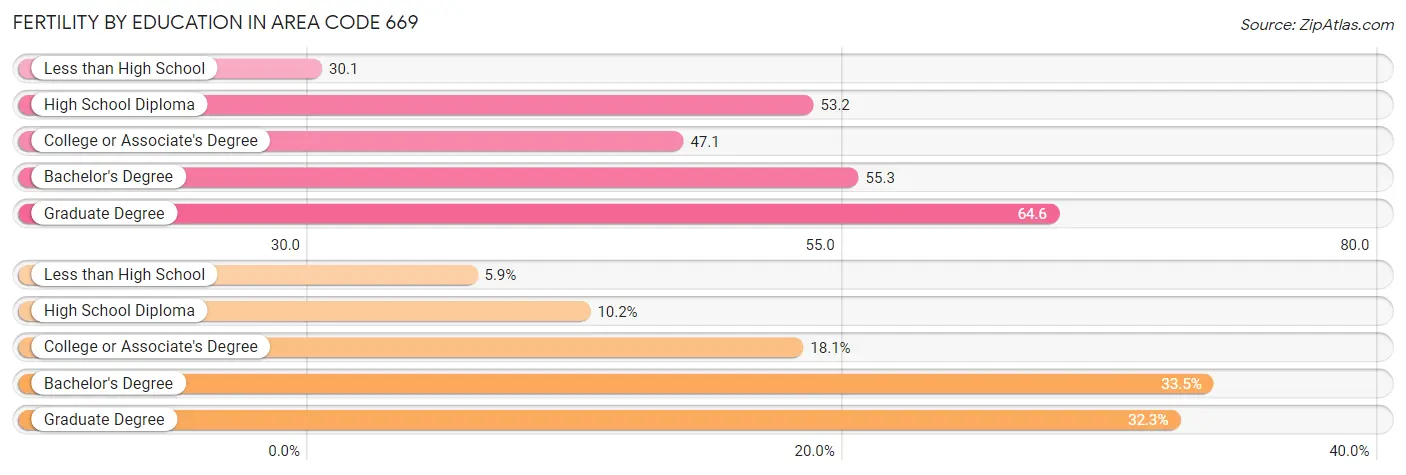
| Educational Attainment | Women with Births | Births / 1,000 Women |
| Less than High School | 564 (5.9%) | 30.1 |
| High School Diploma | 966 (10.2%) | 53.2 |
| College or Associate's Degree | 1,725 (18.1%) | 47.1 |
| Bachelor's Degree | 3,186 (33.5%) | 55.3 |
| Graduate Degree | 3,067 (32.3%) | 64.6 |
| Total | 9,508 (100.0%) | 50.0 |
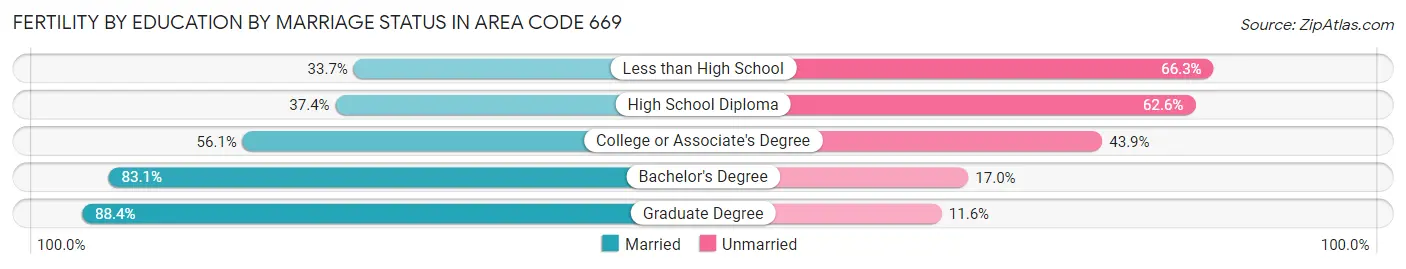
Fertility by Education by Marriage Status in Area Code 669
19.0% of women with births in Area Code 669 are unmarried. Women with the educational attainment of graduate degree are most likely to be married with 88.4% of them married at childbirth, while women with the educational attainment of less than high school are least likely to be married with 66.3% of them unmarried at childbirth.
| Educational Attainment | Married | Unmarried |
| Less than High School | 190 (33.7%) | 374 (66.3%) |
| High School Diploma | 361 (37.4%) | 605 (62.6%) |
| College or Associate's Degree | 967 (56.1%) | 758 (43.9%) |
| Bachelor's Degree | 2,646 (83.1%) | 540 (17.0%) |
| Graduate Degree | 2,711 (88.4%) | 356 (11.6%) |
| Total | 7,700 (81.0%) | 1,808 (19.0%) |
Employment Characteristics in Area Code 669
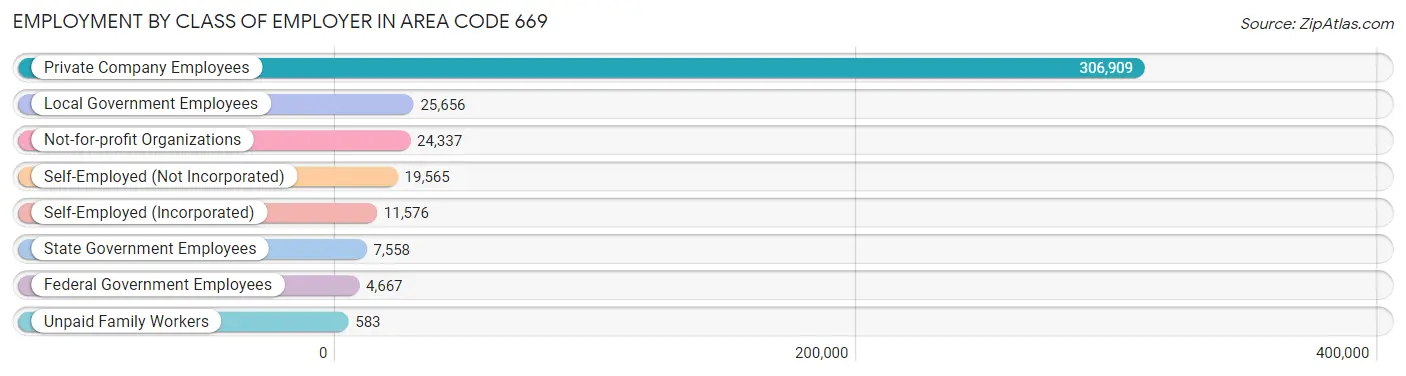
Employment by Class of Employer in Area Code 669
Among the 400,851 employed individuals in Area Code 669, private company employees (306,909 | 76.6%), local government employees (25,656 | 6.4%), and not-for-profit organizations (24,337 | 6.1%) make up the most common classes of employment.
| Employer Class | # Employees | % Employees |
| Private Company Employees | 306,909 | 76.6% |
| Self-Employed (Incorporated) | 11,576 | 2.9% |
| Self-Employed (Not Incorporated) | 19,565 | 4.9% |
| Not-for-profit Organizations | 24,337 | 6.1% |
| Local Government Employees | 25,656 | 6.4% |
| State Government Employees | 7,558 | 1.9% |
| Federal Government Employees | 4,667 | 1.2% |
| Unpaid Family Workers | 583 | 0.2% |
| Total | 400,851 | 100.0% |
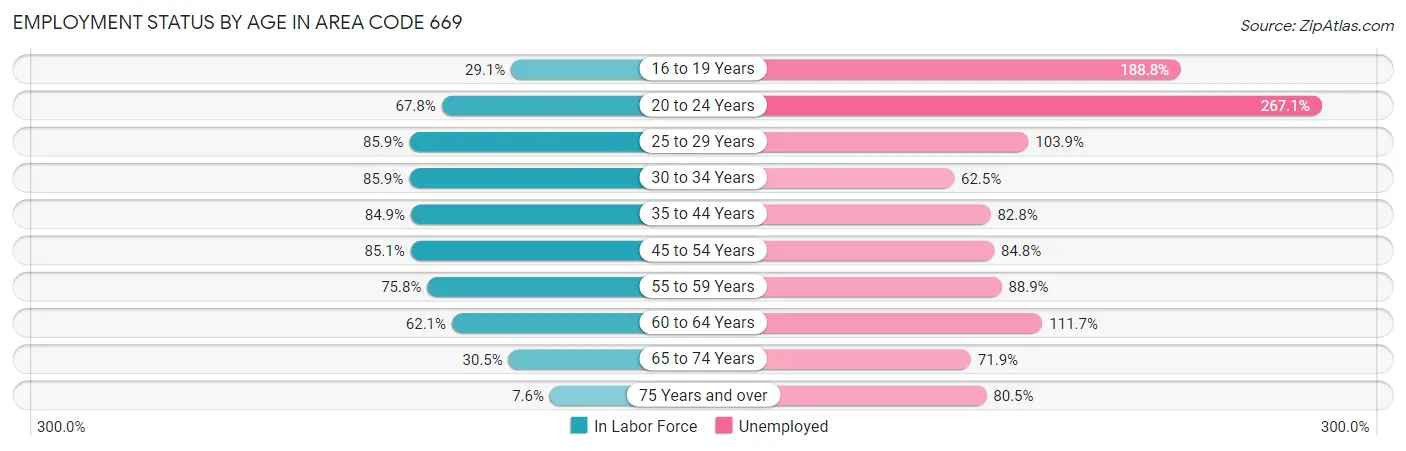
Employment Status by Age in Area Code 669
According to the labor force statistics for Area Code 669, out of the total population over 16 years of age (640,802), 68.2% or 437,347 individuals are in the labor force, with 4.4% or 19,200 of them unemployed. The age group with the highest labor force participation rate is 30 to 34 years, with 85.9% or 61,243 individuals in the labor force. Within the labor force, the 20 to 24 years age range has the highest percentage of unemployed individuals, with 267.1% or 85,696 of them being unemployed.
| Age Bracket | In Labor Force | Unemployed |
| 16 to 19 Years | 10,659 (29.1%) | 20,124 (188.8%) |
| 20 to 24 Years | 32,083 (67.8%) | 85,696 (267.1%) |
| 25 to 29 Years | 56,834 (85.9%) | 59,047 (103.9%) |
| 30 to 34 Years | 61,245 (85.9%) | 38,277 (62.5%) |
| 35 to 44 Years | 101,411 (84.9%) | 83,963 (82.8%) |
| 45 to 54 Years | 88,490 (85.1%) | 75,039 (84.8%) |
| 55 to 59 Years | 38,664 (75.8%) | 34,374 (88.9%) |
| 60 to 64 Years | 26,418 (62.1%) | 29,511 (111.7%) |
| 65 to 74 Years | 17,432 (30.5%) | 12,535 (71.9%) |
| 75 Years and over | 3,417 (7.5%) | 2,751 (80.5%) |
| Total | 437,363 (68.2%) | 19,202 (4.4%) |
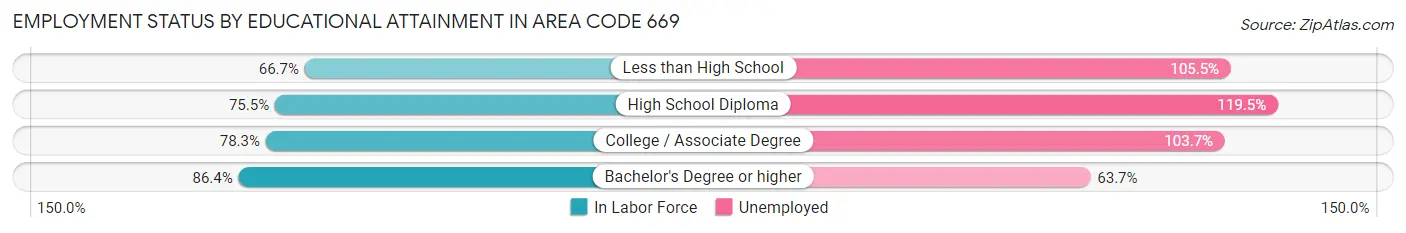
Employment Status by Educational Attainment in Area Code 669
According to labor force statistics for Area Code 669, 82.1% of individuals (373,203) out of the total population between 25 and 64 years of age (454,405) are in the labor force, with 78.6% or 293,338 of them being unemployed. The group with the highest labor force participation rate are those with the educational attainment of bachelor's degree or higher, with 86.4% or 235,341 individuals in the labor force. Within the labor force, individuals with high school diploma education have the highest percentage of unemployment, with 119.5% or 51,951 of them being unemployed.
| Educational Attainment | In Labor Force | Unemployed |
| Less than High School | 22,368 (66.7%) | 35,394 (105.5%) |
| High School Diploma | 43,473 (75.5%) | 68,782 (119.5%) |
| College / Associate Degree | 71,085 (78.3%) | 94,178 (103.7%) |
| Bachelor's Degree or higher | 235,332 (86.4%) | 173,570 (63.7%) |
| Total | 373,196 (82.1%) | 357,162 (78.6%) |
Employment Occupations by Sex in Area Code 669
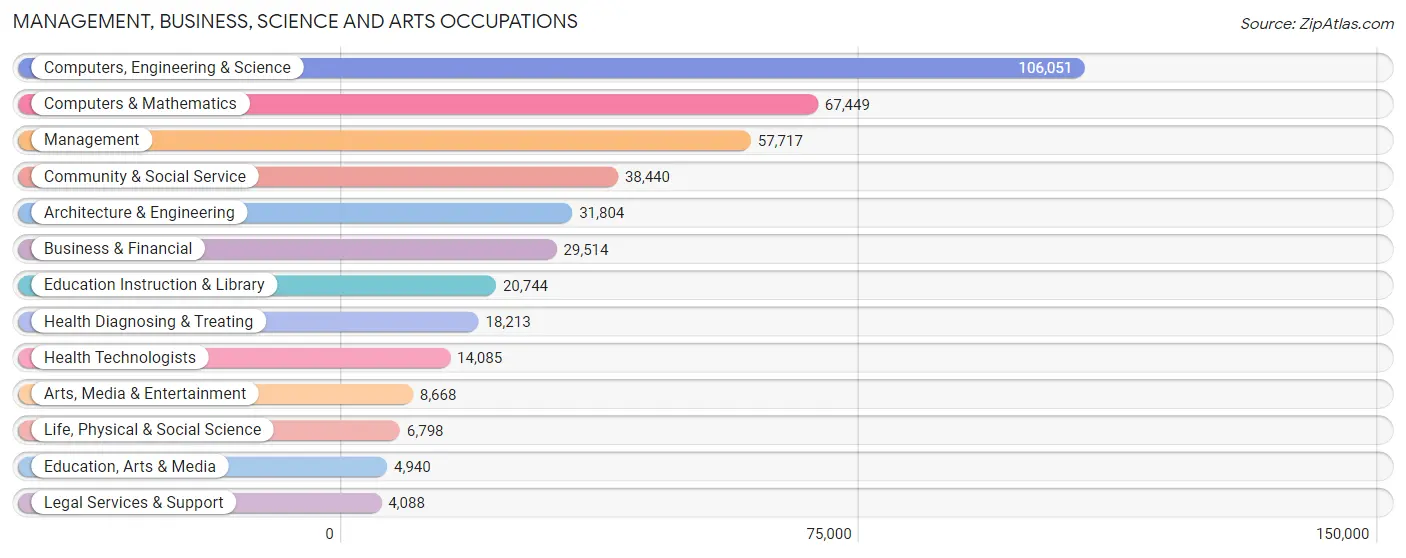
Management, Business, Science and Arts Occupations
The most common Management, Business, Science and Arts occupations in Area Code 669 are Computers, Engineering & Science (106,051 | 25.2%), Computers & Mathematics (67,449 | 16.0%), Management (57,717 | 13.7%), Community & Social Service (38,440 | 9.1%), and Architecture & Engineering (31,804 | 7.6%).
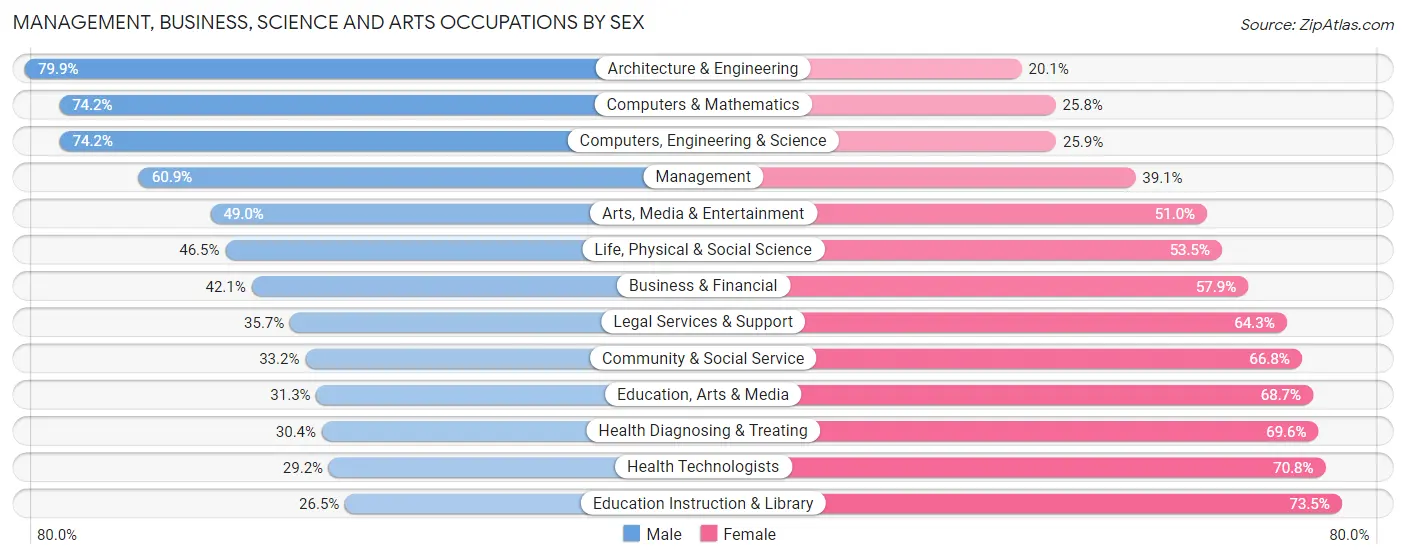
Management, Business, Science and Arts Occupations by Sex
Within the Management, Business, Science and Arts occupations in Area Code 669, the most male-oriented occupations are Architecture & Engineering (79.9%), Computers & Mathematics (74.2%), and Computers, Engineering & Science (74.2%), while the most female-oriented occupations are Education Instruction & Library (73.5%), Health Technologists (70.8%), and Health Diagnosing & Treating (69.6%).
| Occupation | Male | Female |
| Management | 35,163 (60.9%) | 22,554 (39.1%) |
| Business & Financial | 12,435 (42.1%) | 17,079 (57.9%) |
| Computers, Engineering & Science | 78,634 (74.2%) | 27,417 (25.9%) |
| Computers & Mathematics | 50,061 (74.2%) | 17,388 (25.8%) |
| Architecture & Engineering | 25,411 (79.9%) | 6,393 (20.1%) |
| Life, Physical & Social Science | 3,162 (46.5%) | 3,636 (53.5%) |
| Community & Social Service | 12,749 (33.2%) | 25,691 (66.8%) |
| Education, Arts & Media | 1,546 (31.3%) | 3,394 (68.7%) |
| Legal Services & Support | 1,459 (35.7%) | 2,629 (64.3%) |
| Education Instruction & Library | 5,498 (26.5%) | 15,246 (73.5%) |
| Arts, Media & Entertainment | 4,246 (49.0%) | 4,422 (51.0%) |
| Health Diagnosing & Treating | 5,535 (30.4%) | 12,678 (69.6%) |
| Health Technologists | 4,115 (29.2%) | 9,970 (70.8%) |
| Total (Category) | 144,516 (57.8%) | 105,419 (42.2%) |
| Total (Overall) | 237,882 (56.6%) | 182,620 (43.4%) |
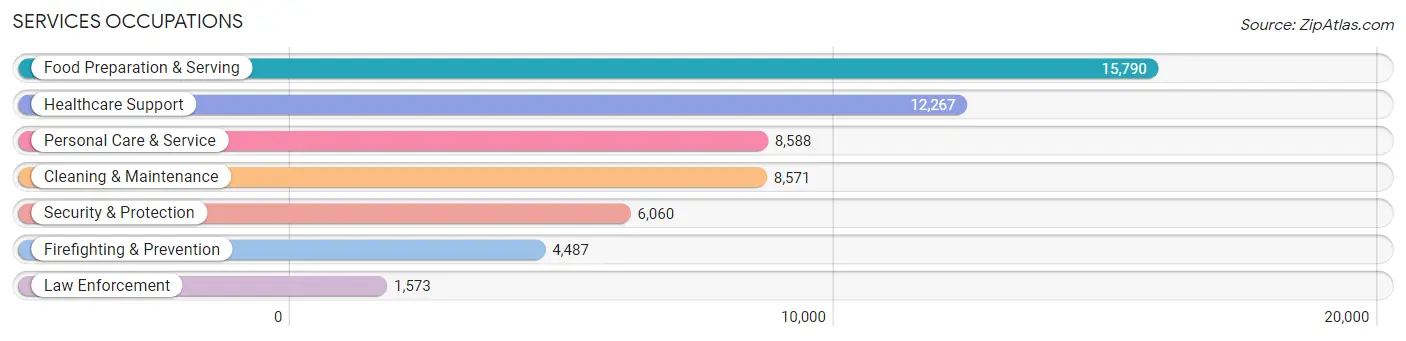
Services Occupations
The most common Services occupations in Area Code 669 are Food Preparation & Serving (15,790 | 3.8%), Healthcare Support (12,267 | 2.9%), Personal Care & Service (8,588 | 2.0%), Cleaning & Maintenance (8,571 | 2.0%), and Security & Protection (6,060 | 1.4%).
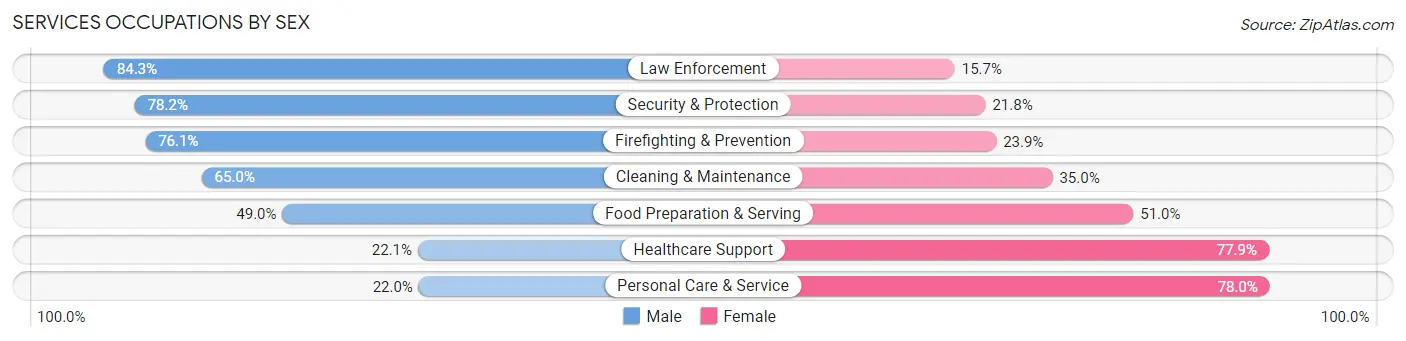
Services Occupations by Sex
Within the Services occupations in Area Code 669, the most male-oriented occupations are Law Enforcement (84.3%), Security & Protection (78.2%), and Firefighting & Prevention (76.1%), while the most female-oriented occupations are Personal Care & Service (78.0%), Healthcare Support (77.9%), and Food Preparation & Serving (51.0%).
| Occupation | Male | Female |
| Healthcare Support | 2,715 (22.1%) | 9,552 (77.9%) |
| Security & Protection | 4,741 (78.2%) | 1,319 (21.8%) |
| Firefighting & Prevention | 3,415 (76.1%) | 1,072 (23.9%) |
| Law Enforcement | 1,326 (84.3%) | 247 (15.7%) |
| Food Preparation & Serving | 7,730 (49.0%) | 8,060 (51.0%) |
| Cleaning & Maintenance | 5,568 (65.0%) | 3,003 (35.0%) |
| Personal Care & Service | 1,886 (22.0%) | 6,702 (78.0%) |
| Total (Category) | 22,640 (44.2%) | 28,636 (55.8%) |
| Total (Overall) | 237,882 (56.6%) | 182,620 (43.4%) |
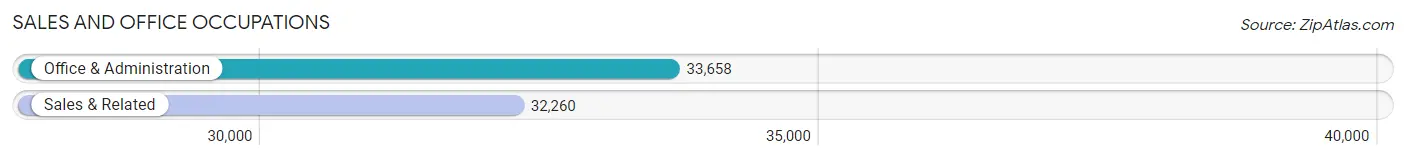
Sales and Office Occupations
The most common Sales and Office occupations in Area Code 669 are Office & Administration (33,658 | 8.0%), and Sales & Related (32,260 | 7.7%).
Sales and Office Occupations by Sex
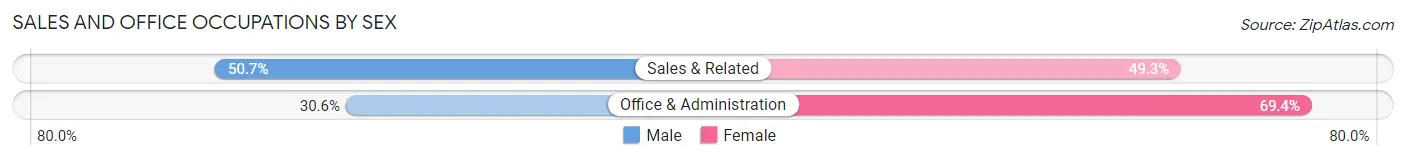
| Occupation | Male | Female |
| Sales & Related | 16,352 (50.7%) | 15,908 (49.3%) |
| Office & Administration | 10,294 (30.6%) | 23,364 (69.4%) |
| Total (Category) | 26,646 (40.4%) | 39,272 (59.6%) |
| Total (Overall) | 237,882 (56.6%) | 182,620 (43.4%) |
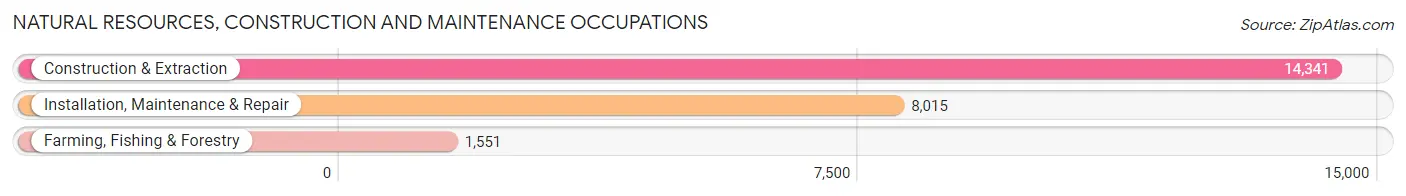
Natural Resources, Construction and Maintenance Occupations
The most common Natural Resources, Construction and Maintenance occupations in Area Code 669 are Construction & Extraction (14,341 | 3.4%), Installation, Maintenance & Repair (8,015 | 1.9%), and Farming, Fishing & Forestry (1,551 | 0.4%).
Natural Resources, Construction and Maintenance Occupations by Sex
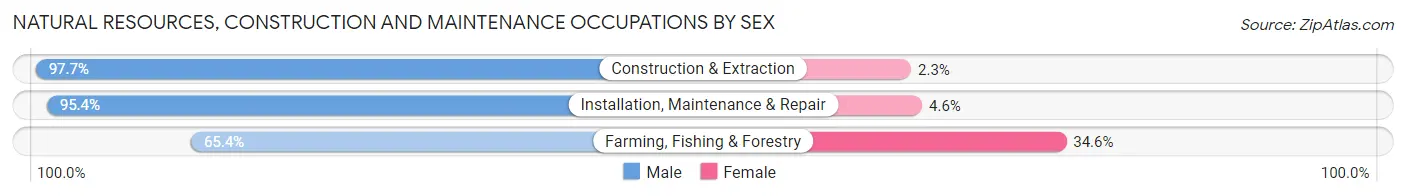
| Occupation | Male | Female |
| Farming, Fishing & Forestry | 1,014 (65.4%) | 537 (34.6%) |
| Construction & Extraction | 14,009 (97.7%) | 332 (2.3%) |
| Installation, Maintenance & Repair | 7,645 (95.4%) | 370 (4.6%) |
| Total (Category) | 22,668 (94.8%) | 1,239 (5.2%) |
| Total (Overall) | 237,882 (56.6%) | 182,620 (43.4%) |
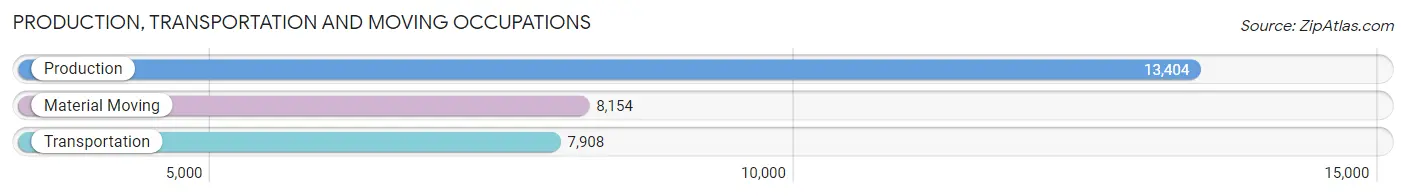
Production, Transportation and Moving Occupations
The most common Production, Transportation and Moving occupations in Area Code 669 are Production (13,404 | 3.2%), Material Moving (8,154 | 1.9%), and Transportation (7,908 | 1.9%).
Production, Transportation and Moving Occupations by Sex
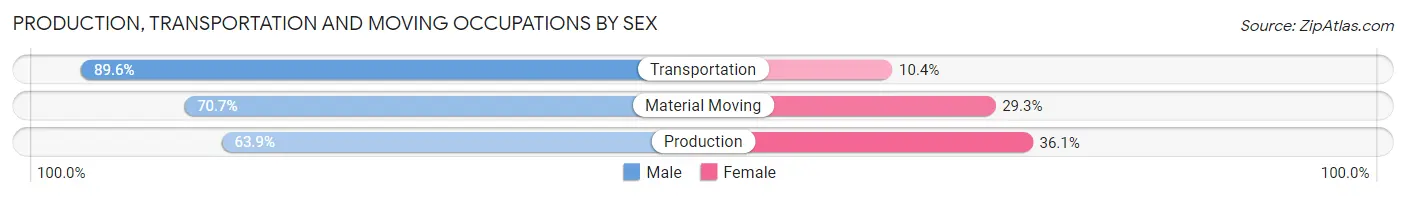
| Occupation | Male | Female |
| Production | 8,560 (63.9%) | 4,844 (36.1%) |
| Transportation | 7,087 (89.6%) | 821 (10.4%) |
| Material Moving | 5,765 (70.7%) | 2,389 (29.3%) |
| Total (Category) | 21,412 (72.7%) | 8,054 (27.3%) |
| Total (Overall) | 237,882 (56.6%) | 182,620 (43.4%) |
Employment Industries by Sex in Area Code 669
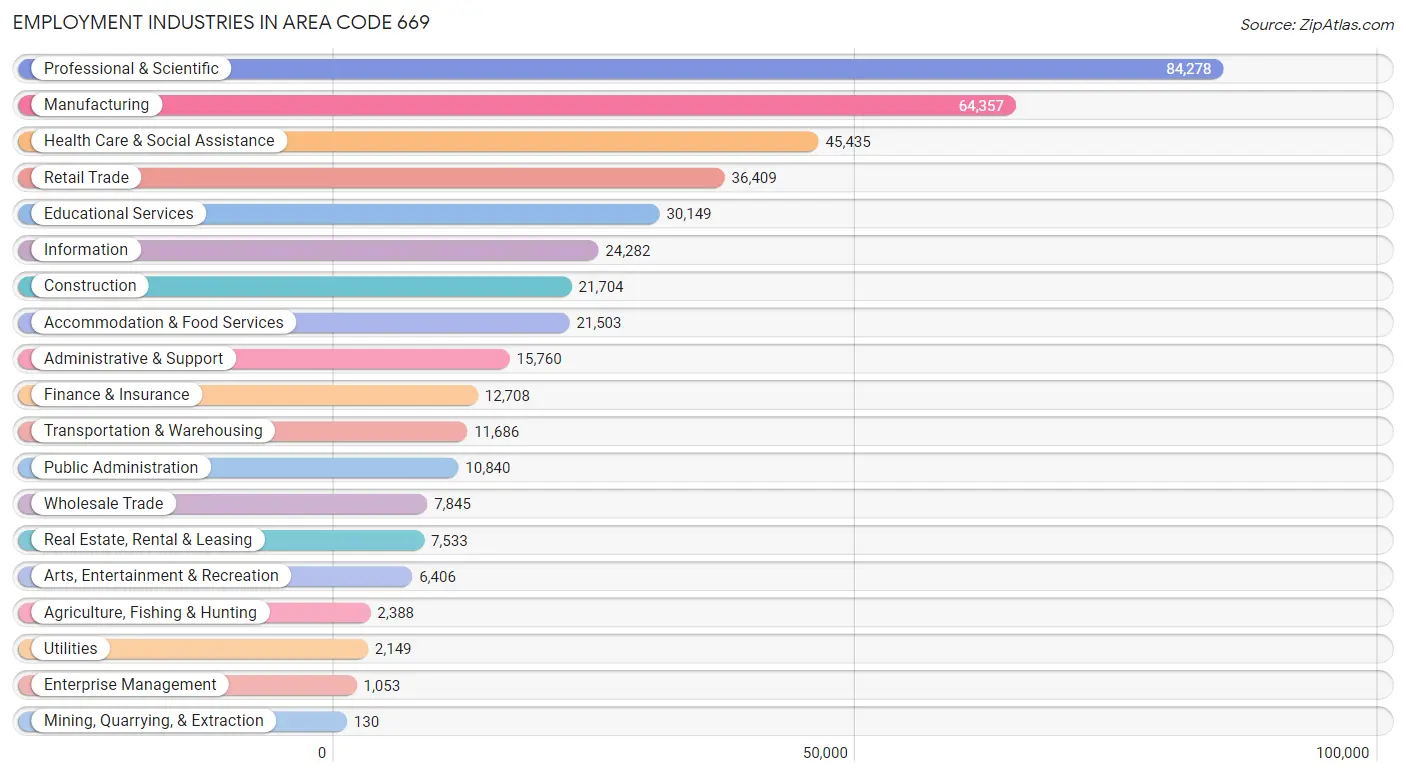
Employment Industries in Area Code 669
The major employment industries in Area Code 669 include Professional & Scientific (84,278 | 20.0%), Manufacturing (64,357 | 15.3%), Health Care & Social Assistance (45,435 | 10.8%), Retail Trade (36,409 | 8.7%), and Educational Services (30,149 | 7.2%).
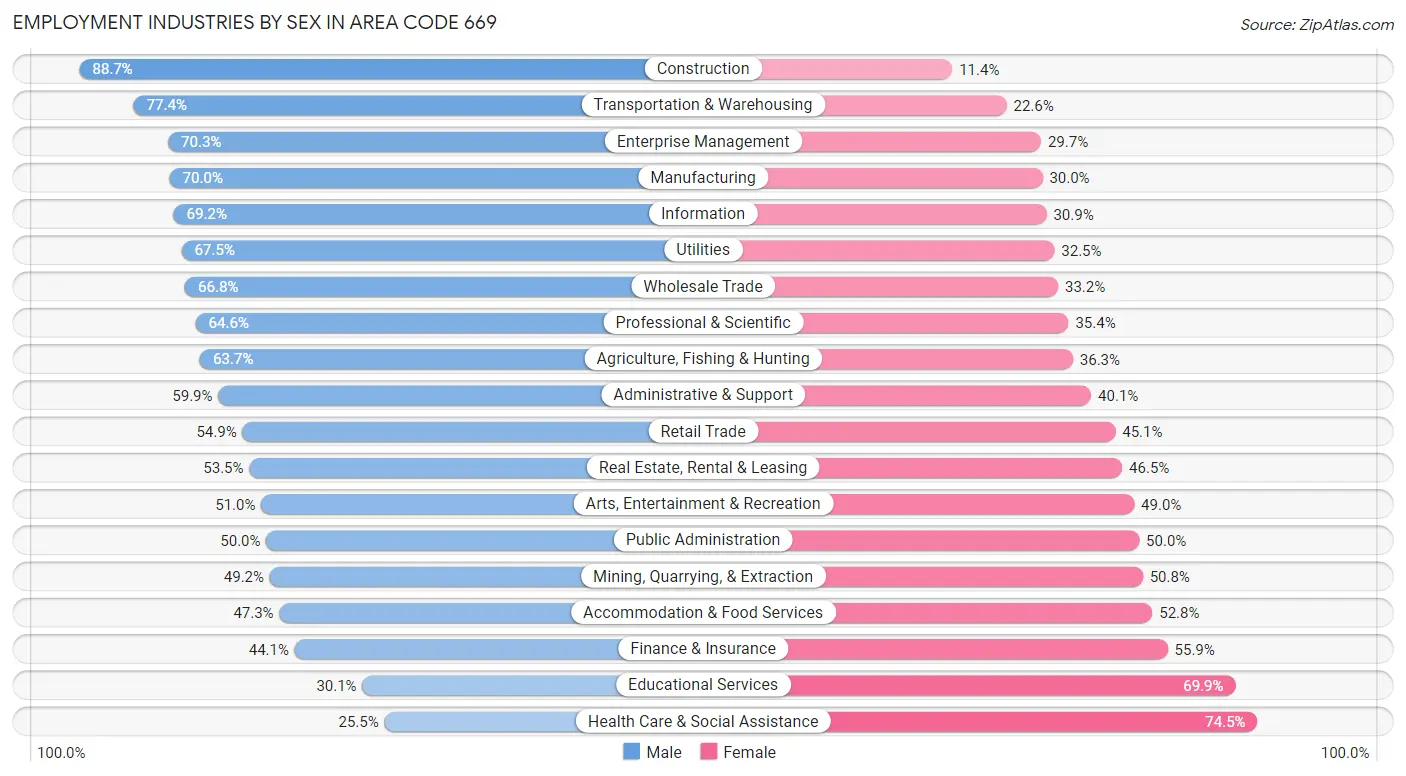
Employment Industries by Sex in Area Code 669
The Area Code 669 industries that see more men than women are Construction (88.6%), Transportation & Warehousing (77.4%), and Enterprise Management (70.3%), whereas the industries that tend to have a higher number of women are Health Care & Social Assistance (74.5%), Educational Services (69.9%), and Finance & Insurance (55.9%).
| Industry | Male | Female |
| Agriculture, Fishing & Hunting | 1,521 (63.7%) | 867 (36.3%) |
| Mining, Quarrying, & Extraction | 64 (49.2%) | 66 (50.8%) |
| Construction | 19,241 (88.6%) | 2,463 (11.4%) |
| Manufacturing | 45,040 (70.0%) | 19,317 (30.0%) |
| Wholesale Trade | 5,237 (66.8%) | 2,608 (33.2%) |
| Retail Trade | 19,988 (54.9%) | 16,421 (45.1%) |
| Transportation & Warehousing | 9,047 (77.4%) | 2,639 (22.6%) |
| Utilities | 1,451 (67.5%) | 698 (32.5%) |
| Information | 16,791 (69.2%) | 7,491 (30.8%) |
| Finance & Insurance | 5,600 (44.1%) | 7,108 (55.9%) |
| Real Estate, Rental & Leasing | 4,029 (53.5%) | 3,504 (46.5%) |
| Professional & Scientific | 54,432 (64.6%) | 29,846 (35.4%) |
| Enterprise Management | 740 (70.3%) | 313 (29.7%) |
| Administrative & Support | 9,440 (59.9%) | 6,320 (40.1%) |
| Educational Services | 9,066 (30.1%) | 21,083 (69.9%) |
| Health Care & Social Assistance | 11,588 (25.5%) | 33,847 (74.5%) |
| Arts, Entertainment & Recreation | 3,267 (51.0%) | 3,139 (49.0%) |
| Accommodation & Food Services | 10,161 (47.2%) | 11,342 (52.7%) |
| Public Administration | 5,416 (50.0%) | 5,424 (50.0%) |
| Total | 237,882 (56.6%) | 182,620 (43.4%) |
Education in Area Code 669
School Enrollment in Area Code 669
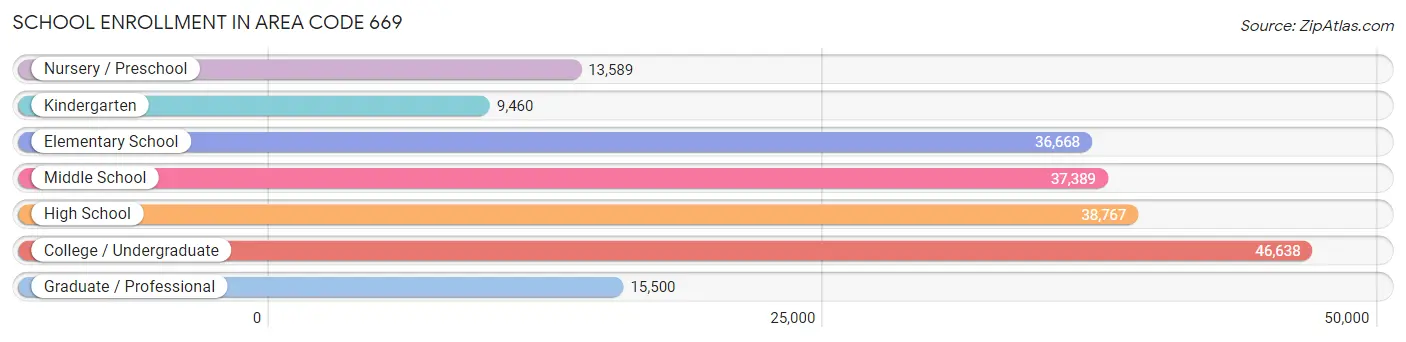
The most common levels of schooling among the 198,011 students in Area Code 669 are college / undergraduate (46,638 | 23.5%), high school (38,767 | 19.6%), and middle school (37,389 | 18.9%).
| School Level | # Students | % Students |
| Nursery / Preschool | 13,589 | 6.9% |
| Kindergarten | 9,460 | 4.8% |
| Elementary School | 36,668 | 18.5% |
| Middle School | 37,389 | 18.9% |
| High School | 38,767 | 19.6% |
| College / Undergraduate | 46,638 | 23.5% |
| Graduate / Professional | 15,500 | 7.8% |
| Total | 198,011 | 100.0% |
School Enrollment by Age by Funding Source in Area Code 669
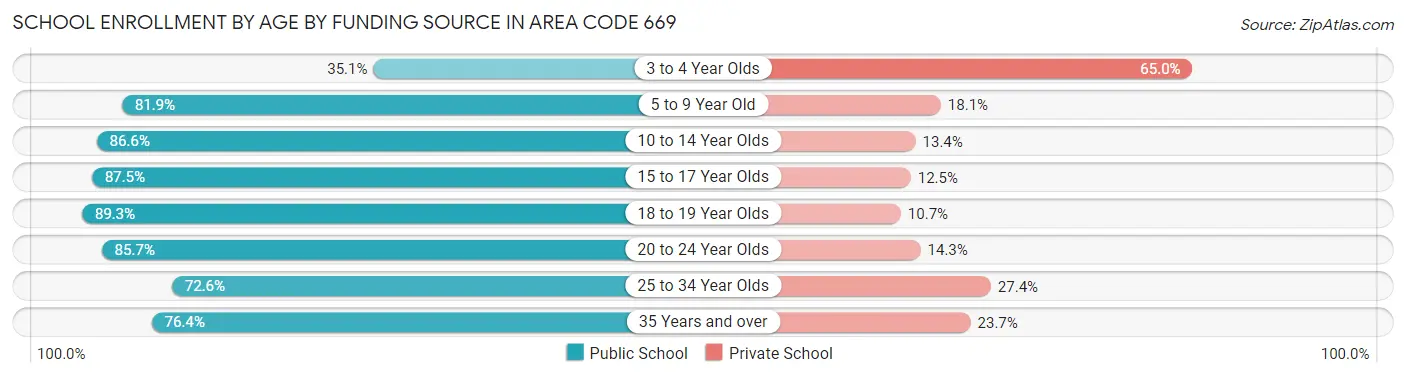
Out of a total of 198,011 students who are enrolled in schools in Area Code 669, 37,594 (19.0%) attend a private institution, while the remaining 160,417 (81.0%) are enrolled in public schools. The age group of 3 to 4 year olds has the highest likelihood of being enrolled in private schools, with 7,464 (64.9% in the age bracket) enrolled. Conversely, the age group of 18 to 19 year olds has the lowest likelihood of being enrolled in a private school, with 13,742 (89.3% in the age bracket) attending a public institution.
| Age Bracket | Public School | Private School |
| 3 to 4 Year Olds | 4,028 (35.0%) | 7,464 (64.9%) |
| 5 to 9 Year Old | 35,854 (81.9%) | 7,929 (18.1%) |
| 10 to 14 Year Olds | 41,737 (86.6%) | 6,460 (13.4%) |
| 15 to 17 Year Olds | 23,925 (87.5%) | 3,422 (12.5%) |
| 18 to 19 Year Olds | 13,742 (89.3%) | 1,640 (10.7%) |
| 20 to 24 Year Olds | 20,522 (85.7%) | 3,432 (14.3%) |
| 25 to 34 Year Olds | 12,472 (72.6%) | 4,713 (27.4%) |
| 35 Years and over | 8,147 (76.3%) | 2,524 (23.6%) |
| Total | 160,417 (81.0%) | 37,594 (19.0%) |
Educational Attainment by Field of Study in Area Code 669
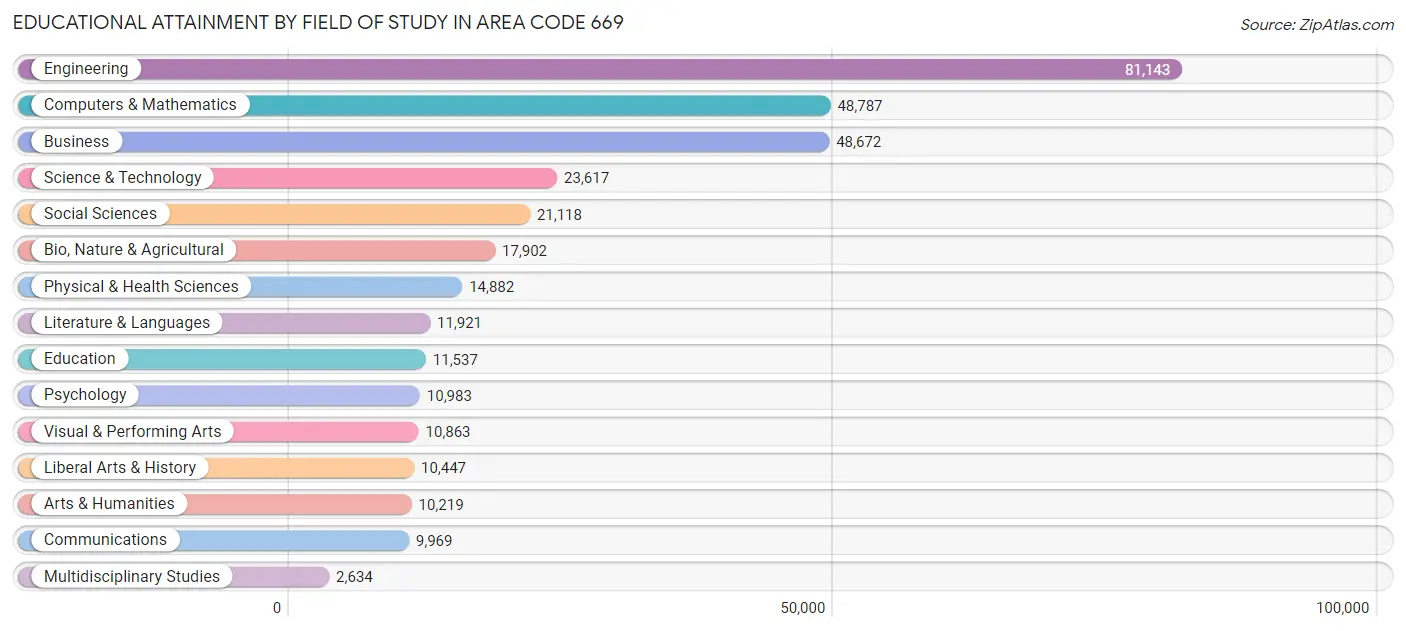
Engineering (81,143 | 24.2%), computers & mathematics (48,787 | 14.6%), business (48,672 | 14.5%), science & technology (23,617 | 7.1%), and social sciences (21,118 | 6.3%) are the most common fields of study among 334,694 individuals in Area Code 669 who have obtained a bachelor's degree or higher.
| Field of Study | # Graduates | % Graduates |
| Computers & Mathematics | 48,787 | 14.6% |
| Bio, Nature & Agricultural | 17,902 | 5.3% |
| Physical & Health Sciences | 14,882 | 4.4% |
| Psychology | 10,983 | 3.3% |
| Social Sciences | 21,118 | 6.3% |
| Engineering | 81,143 | 24.2% |
| Multidisciplinary Studies | 2,634 | 0.8% |
| Science & Technology | 23,617 | 7.1% |
| Business | 48,672 | 14.5% |
| Education | 11,537 | 3.5% |
| Literature & Languages | 11,921 | 3.6% |
| Liberal Arts & History | 10,447 | 3.1% |
| Visual & Performing Arts | 10,863 | 3.3% |
| Communications | 9,969 | 3.0% |
| Arts & Humanities | 10,219 | 3.0% |
| Total | 334,694 | 100.0% |
Transportation & Commute in Area Code 669
Vehicle Availability by Sex in Area Code 669
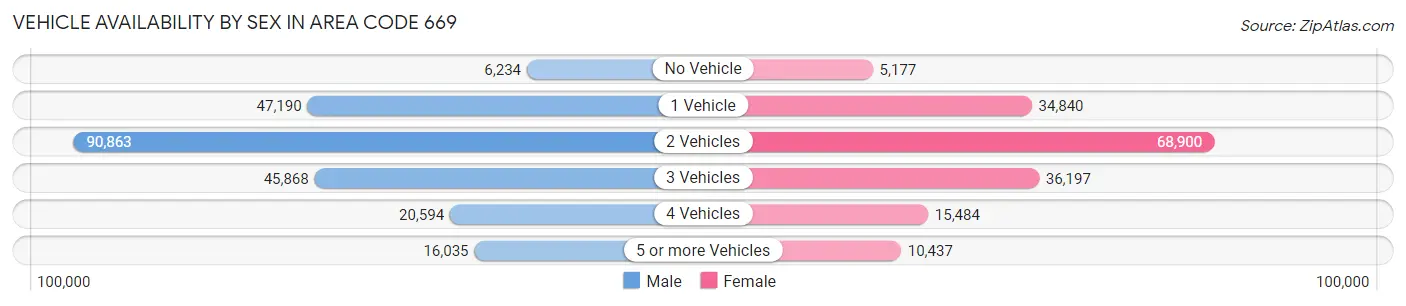
The most prevalent vehicle ownership categories in Area Code 669 are males with 2 vehicles (90,863, accounting for 40.1%) and females with 2 vehicles (68,900, making up 53.1%).
| Vehicles Available | Male | Female |
| No Vehicle | 6,234 (2.8%) | 5,177 (3.0%) |
| 1 Vehicle | 47,190 (20.8%) | 34,840 (20.4%) |
| 2 Vehicles | 90,863 (40.1%) | 68,900 (40.3%) |
| 3 Vehicles | 45,868 (20.2%) | 36,197 (21.2%) |
| 4 Vehicles | 20,594 (9.1%) | 15,484 (9.0%) |
| 5 or more Vehicles | 16,035 (7.1%) | 10,437 (6.1%) |
| Total | 226,784 (100.0%) | 171,035 (100.0%) |
Commute Time in Area Code 669
The most frequently occuring commute durations in Area Code 669 are 15 to 19 minutes (47,459 commuters, 15.0%), 30 to 34 minutes (46,756 commuters, 14.8%), and 20 to 24 minutes (46,243 commuters, 14.6%).
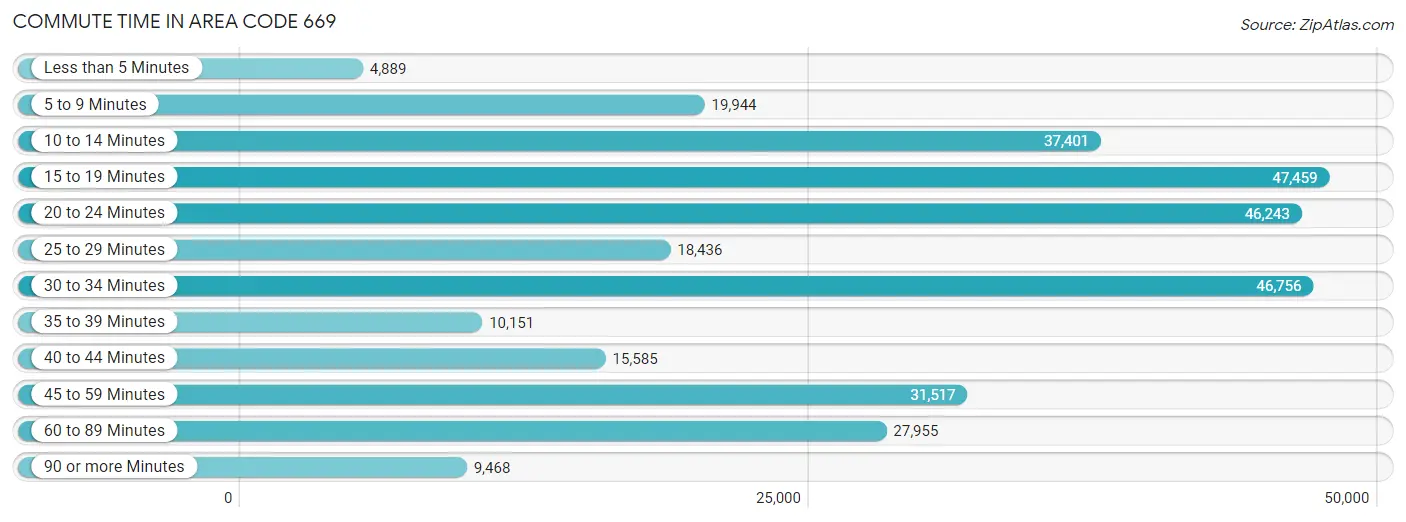
| Commute Time | # Commuters | % Commuters |
| Less than 5 Minutes | 4,889 | 1.5% |
| 5 to 9 Minutes | 19,944 | 6.3% |
| 10 to 14 Minutes | 37,401 | 11.8% |
| 15 to 19 Minutes | 47,459 | 15.0% |
| 20 to 24 Minutes | 46,243 | 14.6% |
| 25 to 29 Minutes | 18,436 | 5.8% |
| 30 to 34 Minutes | 46,756 | 14.8% |
| 35 to 39 Minutes | 10,151 | 3.2% |
| 40 to 44 Minutes | 15,585 | 4.9% |
| 45 to 59 Minutes | 31,517 | 10.0% |
| 60 to 89 Minutes | 27,955 | 8.8% |
| 90 or more Minutes | 9,468 | 3.0% |
Commute Time by Sex in Area Code 669
The most common commute times in Area Code 669 are 30 to 34 minutes (27,563 commuters, 15.3%) for males and 15 to 19 minutes (21,056 commuters, 15.5%) for females.
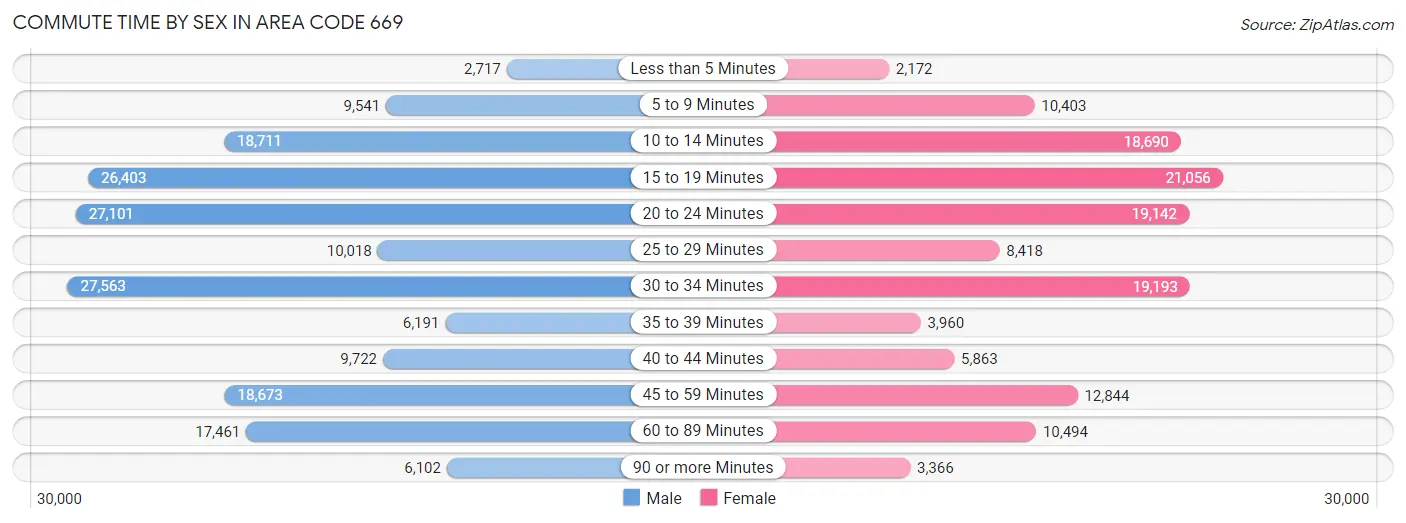
| Commute Time | Male | Female |
| Less than 5 Minutes | 2,717 (1.5%) | 2,172 (1.6%) |
| 5 to 9 Minutes | 9,541 (5.3%) | 10,403 (7.7%) |
| 10 to 14 Minutes | 18,711 (10.4%) | 18,690 (13.8%) |
| 15 to 19 Minutes | 26,403 (14.6%) | 21,056 (15.5%) |
| 20 to 24 Minutes | 27,101 (15.0%) | 19,142 (14.1%) |
| 25 to 29 Minutes | 10,018 (5.6%) | 8,418 (6.2%) |
| 30 to 34 Minutes | 27,563 (15.3%) | 19,193 (14.1%) |
| 35 to 39 Minutes | 6,191 (3.4%) | 3,960 (2.9%) |
| 40 to 44 Minutes | 9,722 (5.4%) | 5,863 (4.3%) |
| 45 to 59 Minutes | 18,673 (10.4%) | 12,844 (9.5%) |
| 60 to 89 Minutes | 17,461 (9.7%) | 10,494 (7.7%) |
| 90 or more Minutes | 6,102 (3.4%) | 3,366 (2.5%) |
Time of Departure to Work by Sex in Area Code 669
The most frequent times of departure to work in Area Code 669 are 8:00 AM to 8:29 AM (26,511, 14.7%) for males and 8:00 AM to 8:29 AM (21,673, 16.0%) for females.
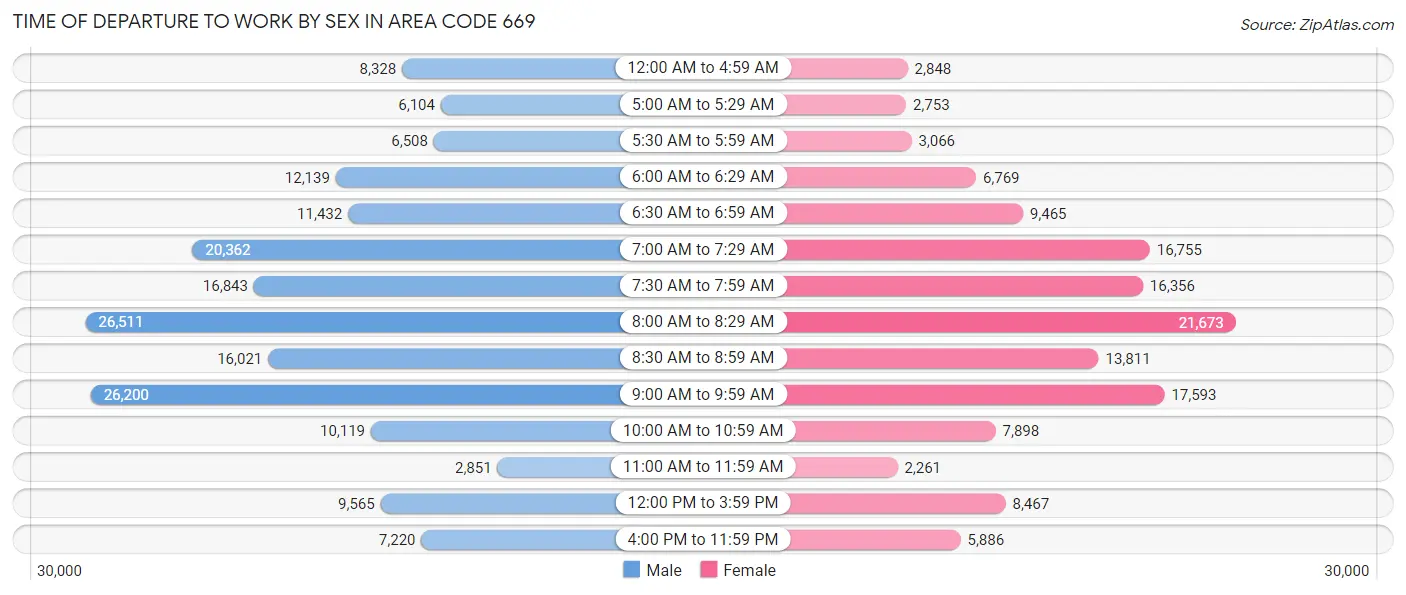
| Time of Departure | Male | Female |
| 12:00 AM to 4:59 AM | 8,328 (4.6%) | 2,848 (2.1%) |
| 5:00 AM to 5:29 AM | 6,104 (3.4%) | 2,753 (2.0%) |
| 5:30 AM to 5:59 AM | 6,508 (3.6%) | 3,066 (2.3%) |
| 6:00 AM to 6:29 AM | 12,139 (6.7%) | 6,769 (5.0%) |
| 6:30 AM to 6:59 AM | 11,432 (6.3%) | 9,465 (7.0%) |
| 7:00 AM to 7:29 AM | 20,362 (11.3%) | 16,755 (12.4%) |
| 7:30 AM to 7:59 AM | 16,843 (9.3%) | 16,356 (12.1%) |
| 8:00 AM to 8:29 AM | 26,511 (14.7%) | 21,673 (16.0%) |
| 8:30 AM to 8:59 AM | 16,021 (8.9%) | 13,811 (10.2%) |
| 9:00 AM to 9:59 AM | 26,200 (14.5%) | 17,593 (13.0%) |
| 10:00 AM to 10:59 AM | 10,119 (5.6%) | 7,898 (5.8%) |
| 11:00 AM to 11:59 AM | 2,851 (1.6%) | 2,261 (1.7%) |
| 12:00 PM to 3:59 PM | 9,565 (5.3%) | 8,467 (6.2%) |
| 4:00 PM to 11:59 PM | 7,220 (4.0%) | 5,886 (4.3%) |
| Total | 180,203 (100.0%) | 135,601 (100.0%) |
Housing Occupancy in Area Code 669
Occupancy by Ownership in Area Code 669
Of the total 275,442 dwellings in Area Code 669, owner-occupied units account for 146,765 (53.3%), while renter-occupied units make up 128,677 (46.7%).
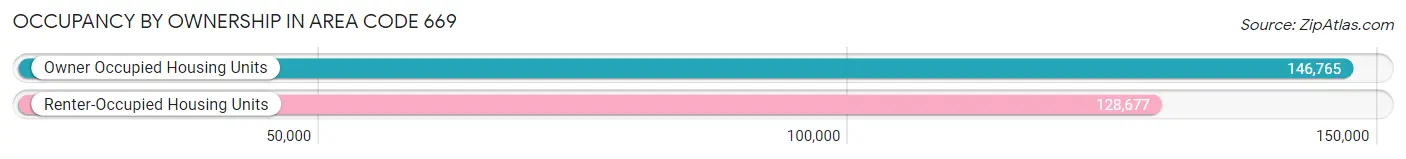
| Occupancy | # Housing Units | % Housing Units |
| Owner Occupied Housing Units | 146,765 | 53.3% |
| Renter-Occupied Housing Units | 128,677 | 46.7% |
| Total Occupied Housing Units | 275,442 | 100.0% |
Occupancy by Household Size in Area Code 669
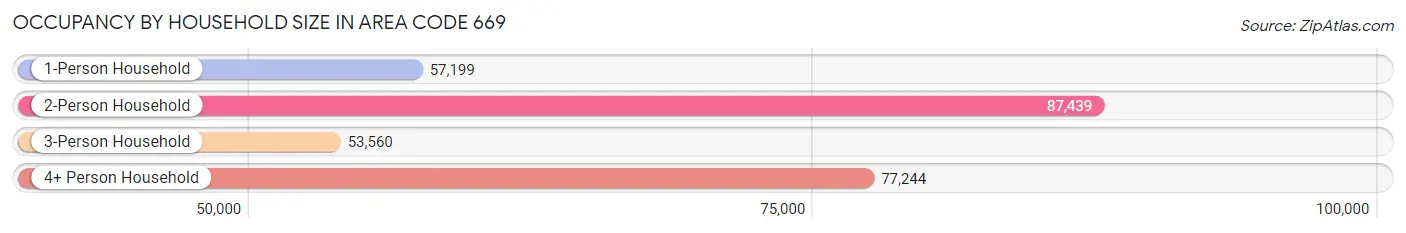
| Household Size | # Housing Units | % Housing Units |
| 1-Person Household | 57,199 | 20.8% |
| 2-Person Household | 87,439 | 31.7% |
| 3-Person Household | 53,560 | 19.5% |
| 4+ Person Household | 77,244 | 28.0% |
| Total Housing Units | 275,442 | 100.0% |
Occupancy by Ownership by Household Size in Area Code 669
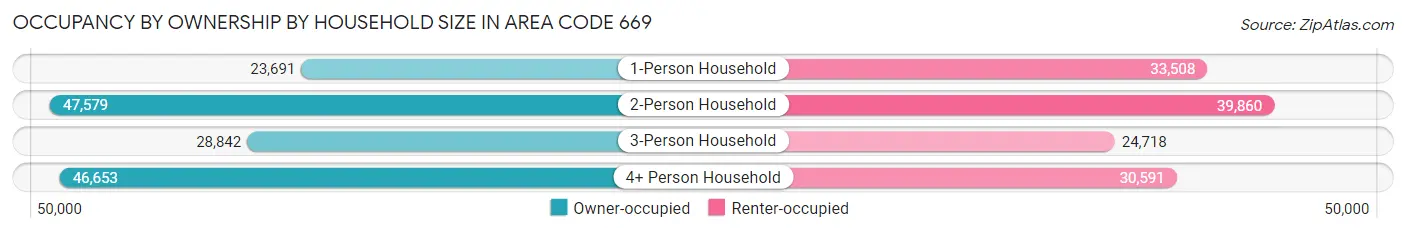
| Household Size | Owner-occupied | Renter-occupied |
| 1-Person Household | 23,691 (41.4%) | 33,508 (58.6%) |
| 2-Person Household | 47,579 (54.4%) | 39,860 (45.6%) |
| 3-Person Household | 28,842 (53.8%) | 24,718 (46.2%) |
| 4+ Person Household | 46,653 (60.4%) | 30,591 (39.6%) |
| Total Housing Units | 146,765 (53.3%) | 128,677 (46.7%) |
Occupancy by Educational Attainment in Area Code 669
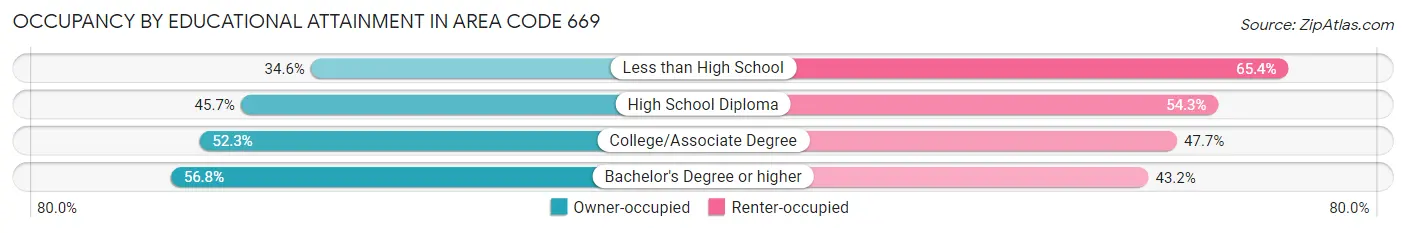
| Household Size | Owner-occupied | Renter-occupied |
| Less than High School | 5,842 (34.6%) | 11,026 (65.4%) |
| High School Diploma | 13,536 (45.7%) | 16,065 (54.3%) |
| College/Associate Degree | 30,730 (52.3%) | 28,061 (47.7%) |
| Bachelor's Degree or higher | 96,657 (56.8%) | 73,525 (43.2%) |
Occupancy by Age of Householder in Area Code 669
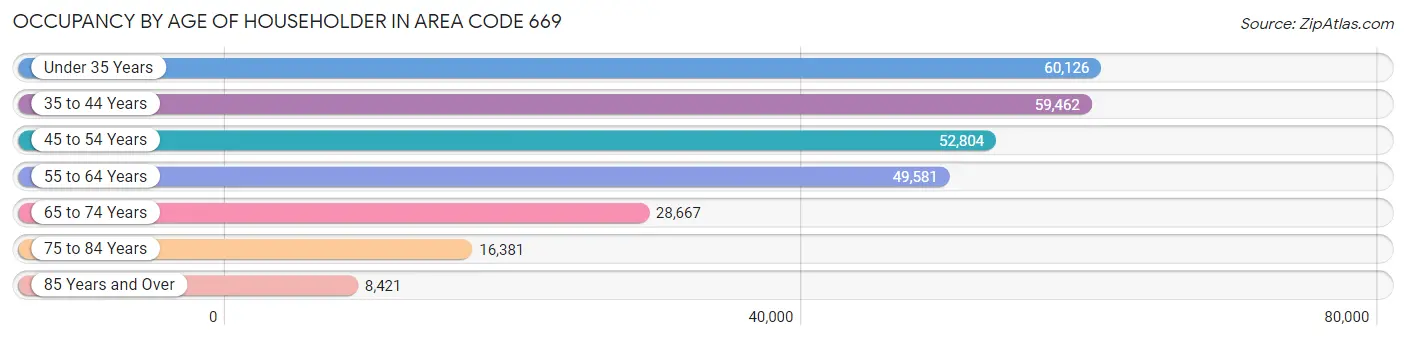
| Age Bracket | # Households | % Households |
| Under 35 Years | 60,126 | 21.8% |
| 35 to 44 Years | 59,462 | 21.6% |
| 45 to 54 Years | 52,804 | 19.2% |
| 55 to 64 Years | 49,581 | 18.0% |
| 65 to 74 Years | 28,667 | 10.4% |
| 75 to 84 Years | 16,381 | 5.9% |
| 85 Years and Over | 8,421 | 3.1% |
| Total | 275,442 | 100.0% |
Housing Finances in Area Code 669
Median Income by Occupancy in Area Code 669
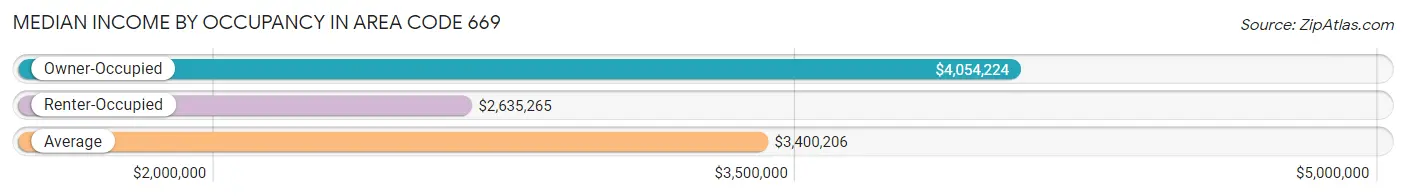
| Occupancy Type | # Households | Median Income |
| Owner-Occupied | 146,765 (53.3%) | $4,054,224 |
| Renter-Occupied | 128,677 (46.7%) | $2,635,265 |
| Average | 275,442 (100.0%) | $3,400,206 |
Occupancy by Householder Income Bracket in Area Code 669
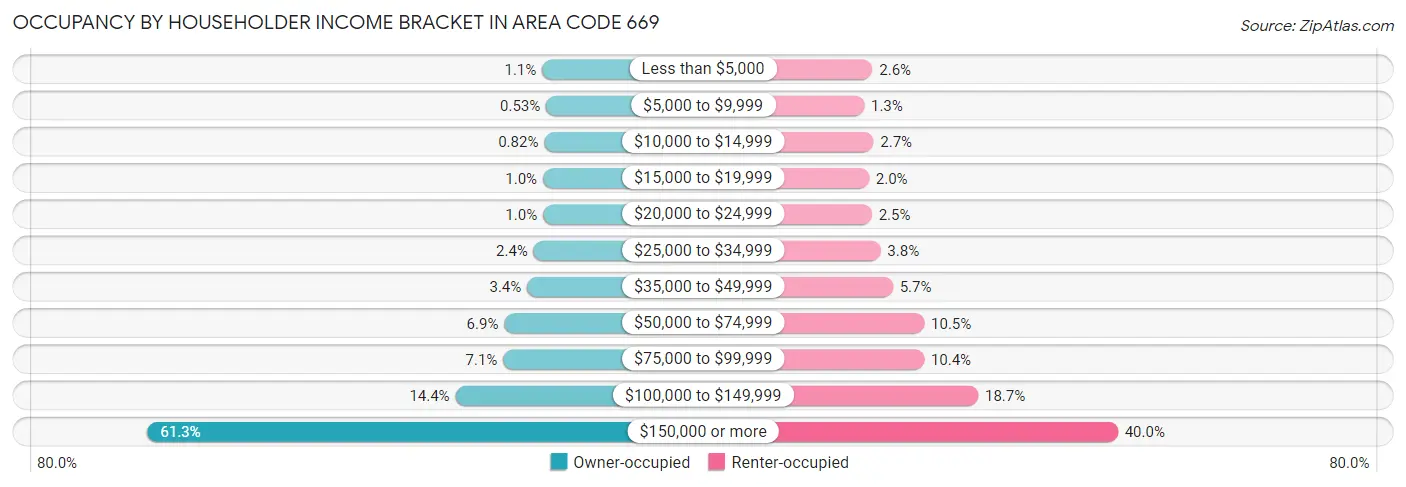
| Income Bracket | Owner-occupied | Renter-occupied |
| Less than $5,000 | 1,667 (1.1%) | 3,291 (2.6%) |
| $5,000 to $9,999 | 779 (0.5%) | 1,661 (1.3%) |
| $10,000 to $14,999 | 1,205 (0.8%) | 3,491 (2.7%) |
| $15,000 to $19,999 | 1,497 (1.0%) | 2,606 (2.0%) |
| $20,000 to $24,999 | 1,486 (1.0%) | 3,180 (2.5%) |
| $25,000 to $34,999 | 3,561 (2.4%) | 4,879 (3.8%) |
| $35,000 to $49,999 | 5,028 (3.4%) | 7,279 (5.7%) |
| $50,000 to $74,999 | 10,136 (6.9%) | 13,452 (10.4%) |
| $75,000 to $99,999 | 10,393 (7.1%) | 13,409 (10.4%) |
| $100,000 to $149,999 | 21,060 (14.3%) | 24,020 (18.7%) |
| $150,000 or more | 89,953 (61.3%) | 51,409 (40.0%) |
| Total | 146,765 (100.0%) | 128,677 (100.0%) |
Monthly Housing Cost Tiers in Area Code 669
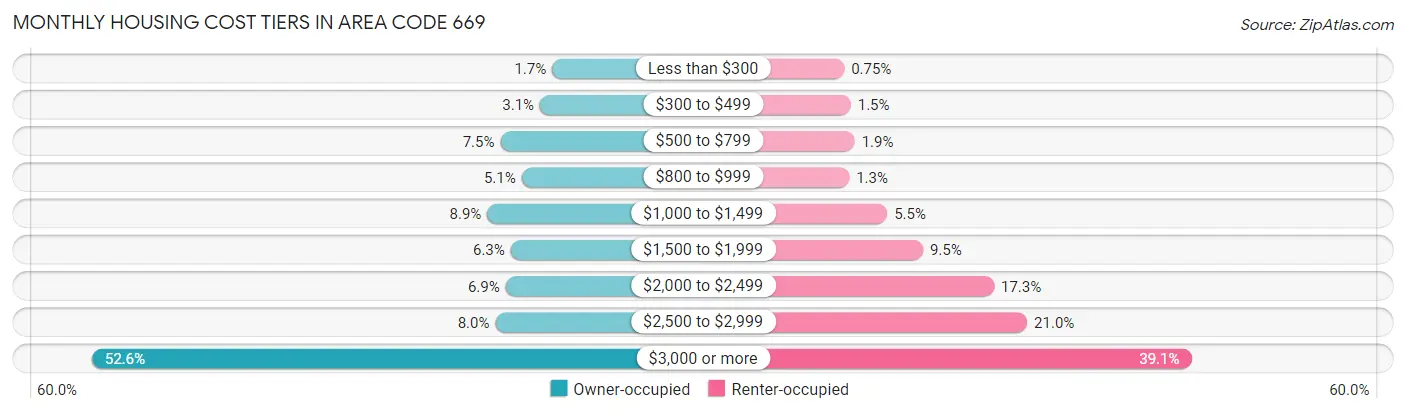
| Monthly Cost | Owner-occupied | Renter-occupied |
| Less than $300 | 2,538 (1.7%) | 969 (0.7%) |
| $300 to $499 | 4,512 (3.1%) | 1,903 (1.5%) |
| $500 to $799 | 10,931 (7.4%) | 2,463 (1.9%) |
| $800 to $999 | 7,485 (5.1%) | 1,679 (1.3%) |
| $1,000 to $1,499 | 13,066 (8.9%) | 7,071 (5.5%) |
| $1,500 to $1,999 | 9,265 (6.3%) | 12,157 (9.5%) |
| $2,000 to $2,499 | 10,080 (6.9%) | 22,261 (17.3%) |
| $2,500 to $2,999 | 11,738 (8.0%) | 26,967 (21.0%) |
| $3,000 or more | 77,150 (52.6%) | 50,302 (39.1%) |
| Total | 146,765 (100.0%) | 128,677 (100.0%) |
Physical Housing Characteristics in Area Code 669
Housing Structures in Area Code 669
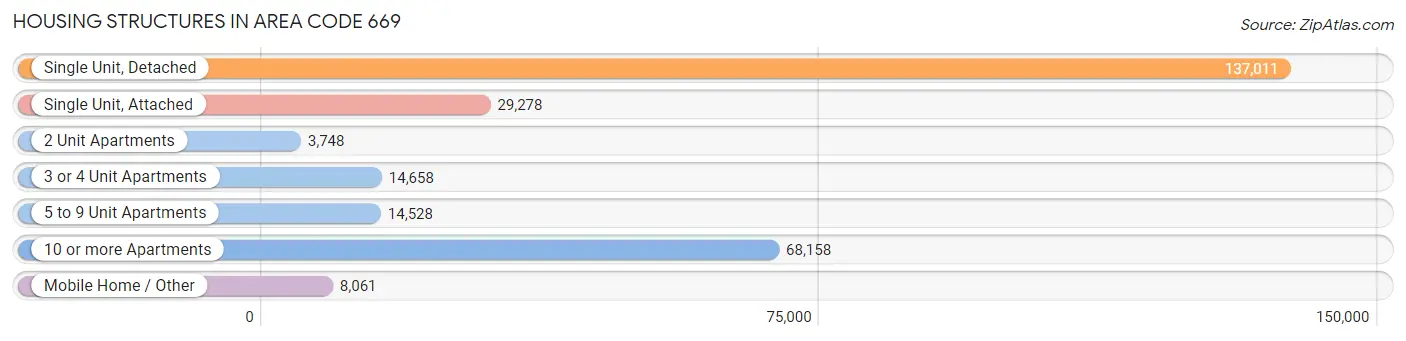
| Structure Type | # Housing Units | % Housing Units |
| Single Unit, Detached | 137,011 | 49.7% |
| Single Unit, Attached | 29,278 | 10.6% |
| 2 Unit Apartments | 3,748 | 1.4% |
| 3 or 4 Unit Apartments | 14,658 | 5.3% |
| 5 to 9 Unit Apartments | 14,528 | 5.3% |
| 10 or more Apartments | 68,158 | 24.7% |
| Mobile Home / Other | 8,061 | 2.9% |
| Total | 275,442 | 100.0% |
Housing Structures by Occupancy in Area Code 669
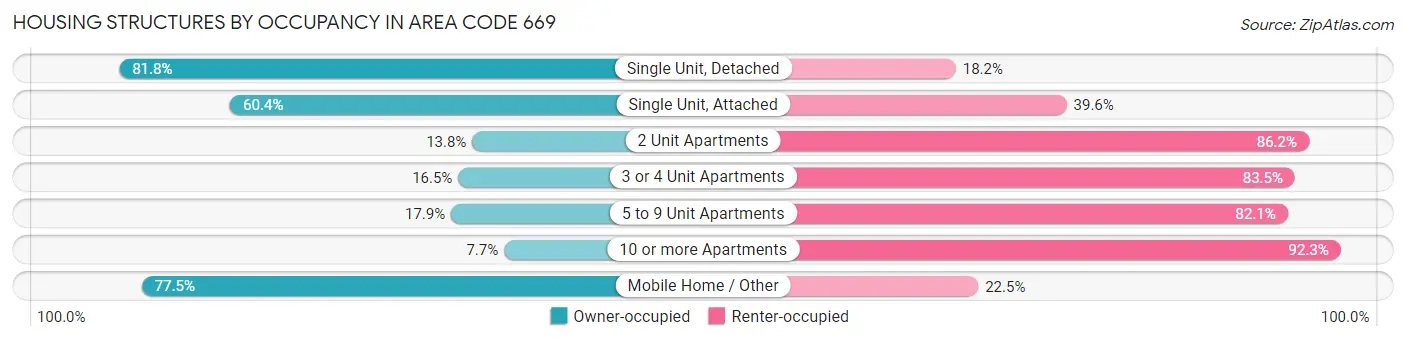
| Structure Type | Owner-occupied | Renter-occupied |
| Single Unit, Detached | 112,042 (81.8%) | 24,969 (18.2%) |
| Single Unit, Attached | 17,697 (60.4%) | 11,581 (39.6%) |
| 2 Unit Apartments | 518 (13.8%) | 3,230 (86.2%) |
| 3 or 4 Unit Apartments | 2,422 (16.5%) | 12,236 (83.5%) |
| 5 to 9 Unit Apartments | 2,601 (17.9%) | 11,927 (82.1%) |
| 10 or more Apartments | 5,241 (7.7%) | 62,917 (92.3%) |
| Mobile Home / Other | 6,244 (77.5%) | 1,817 (22.5%) |
| Total | 146,765 (53.3%) | 128,677 (46.7%) |
Housing Structures by Number of Rooms in Area Code 669
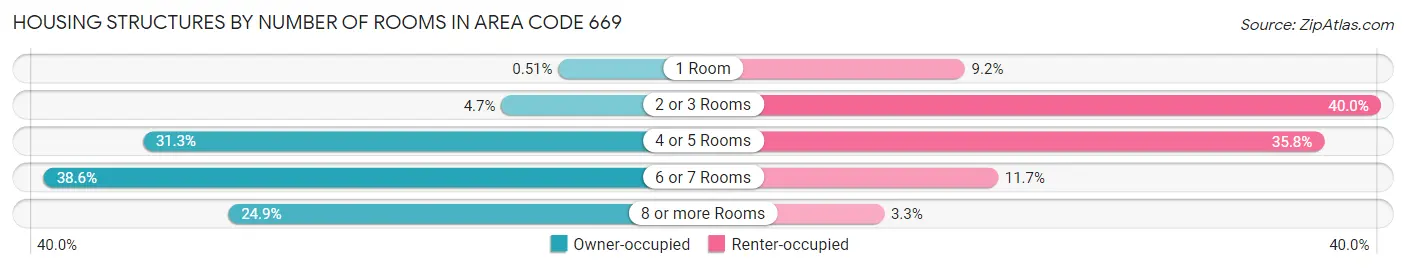
| Number of Rooms | Owner-occupied | Renter-occupied |
| 1 Room | 743 (0.5%) | 11,876 (9.2%) |
| 2 or 3 Rooms | 6,936 (4.7%) | 51,474 (40.0%) |
| 4 or 5 Rooms | 45,882 (31.3%) | 46,098 (35.8%) |
| 6 or 7 Rooms | 56,616 (38.6%) | 15,034 (11.7%) |
| 8 or more Rooms | 36,588 (24.9%) | 4,195 (3.3%) |
| Total | 146,765 (100.0%) | 128,677 (100.0%) |
Housing Structure by Heating Type in Area Code 669
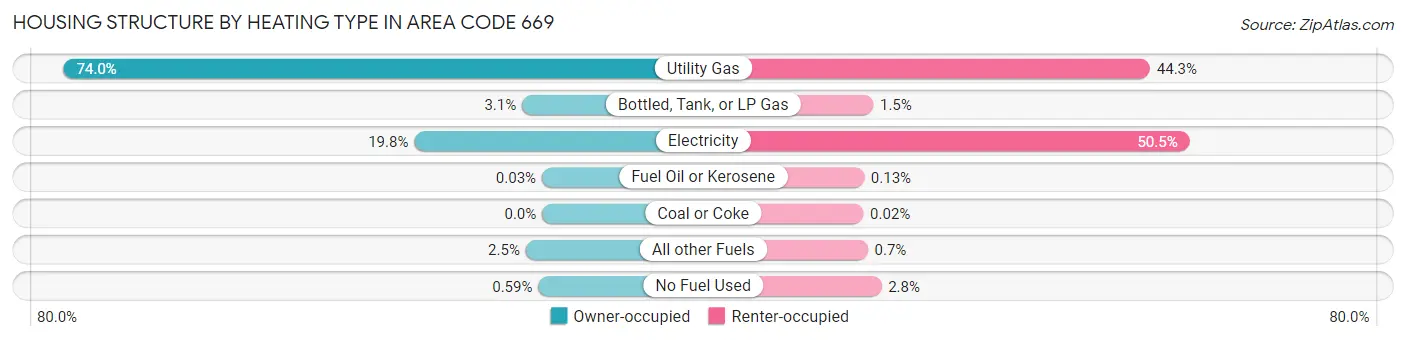
| Heating Type | Owner-occupied | Renter-occupied |
| Utility Gas | 108,592 (74.0%) | 57,054 (44.3%) |
| Bottled, Tank, or LP Gas | 4,545 (3.1%) | 1,988 (1.5%) |
| Electricity | 29,016 (19.8%) | 64,924 (50.5%) |
| Fuel Oil or Kerosene | 39 (0.0%) | 167 (0.1%) |
| Coal or Coke | 0 (0.0%) | 27 (0.0%) |
| All other Fuels | 3,706 (2.5%) | 906 (0.7%) |
| No Fuel Used | 867 (0.6%) | 3,611 (2.8%) |
| Total | 146,765 (100.0%) | 128,677 (100.0%) |
Household Vehicle Usage in Area Code 669
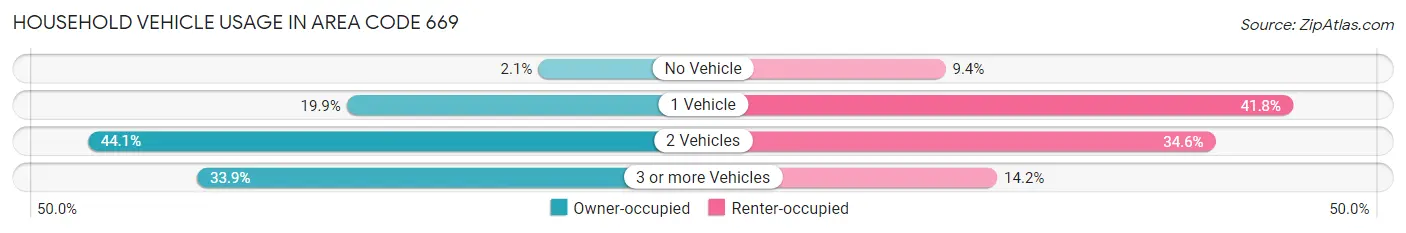
| Vehicles per Household | Owner-occupied | Renter-occupied |
| No Vehicle | 3,024 (2.1%) | 12,085 (9.4%) |
| 1 Vehicle | 29,265 (19.9%) | 53,806 (41.8%) |
| 2 Vehicles | 64,726 (44.1%) | 44,497 (34.6%) |
| 3 or more Vehicles | 49,750 (33.9%) | 18,289 (14.2%) |
| Total | 146,765 (100.0%) | 128,677 (100.0%) |
Real Estate & Mortgages in Area Code 669
Real Estate and Mortgage Overview in Area Code 669
| Characteristic | Without Mortgage | With Mortgage |
| Housing Units | 42,884 | 103,881 |
| Median Property Value | $24,435,203 | $28,002,703 |
| Median Household Income | $2,564,939 | $72,828 |
| Monthly Housing Costs | $21,158 | $76,128 |
| Real Estate Taxes | $116,917 | $1,189 |
Property Value by Mortgage Status in Area Code 669
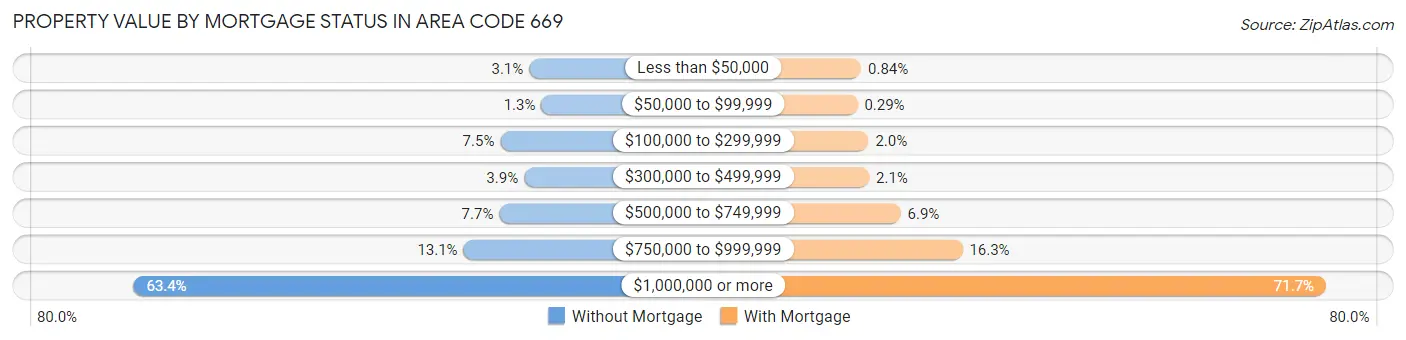
| Property Value | Without Mortgage | With Mortgage |
| Less than $50,000 | 1,339 (3.1%) | 871 (0.8%) |
| $50,000 to $99,999 | 540 (1.3%) | 303 (0.3%) |
| $100,000 to $299,999 | 3,223 (7.5%) | 2,047 (2.0%) |
| $300,000 to $499,999 | 1,671 (3.9%) | 2,141 (2.1%) |
| $500,000 to $749,999 | 3,288 (7.7%) | 7,140 (6.9%) |
| $750,000 to $999,999 | 5,630 (13.1%) | 16,926 (16.3%) |
| $1,000,000 or more | 27,193 (63.4%) | 74,453 (71.7%) |
| Total | 42,884 (100.0%) | 103,881 (100.0%) |
Household Income by Mortgage Status in Area Code 669
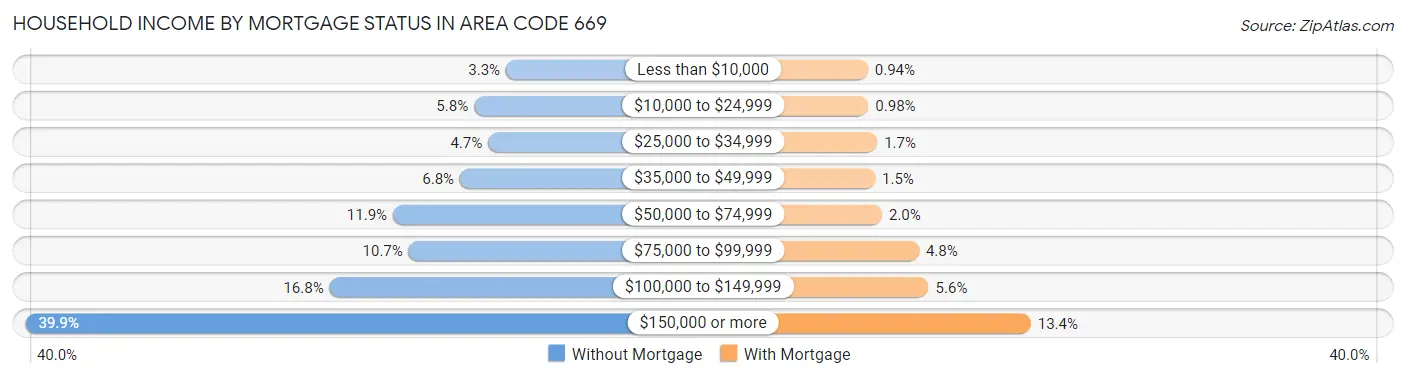
| Household Income | Without Mortgage | With Mortgage |
| Less than $10,000 | 1,426 (3.3%) | 975 (0.9%) |
| $10,000 to $24,999 | 2,471 (5.8%) | 1,020 (1.0%) |
| $25,000 to $34,999 | 2,013 (4.7%) | 1,717 (1.7%) |
| $35,000 to $49,999 | 2,930 (6.8%) | 1,548 (1.5%) |
| $50,000 to $74,999 | 5,122 (11.9%) | 2,098 (2.0%) |
| $75,000 to $99,999 | 4,606 (10.7%) | 5,014 (4.8%) |
| $100,000 to $149,999 | 7,191 (16.8%) | 5,787 (5.6%) |
| $150,000 or more | 17,125 (39.9%) | 13,869 (13.4%) |
| Total | 42,884 (100.0%) | 103,881 (100.0%) |
Property Value to Household Income Ratio in Area Code 669
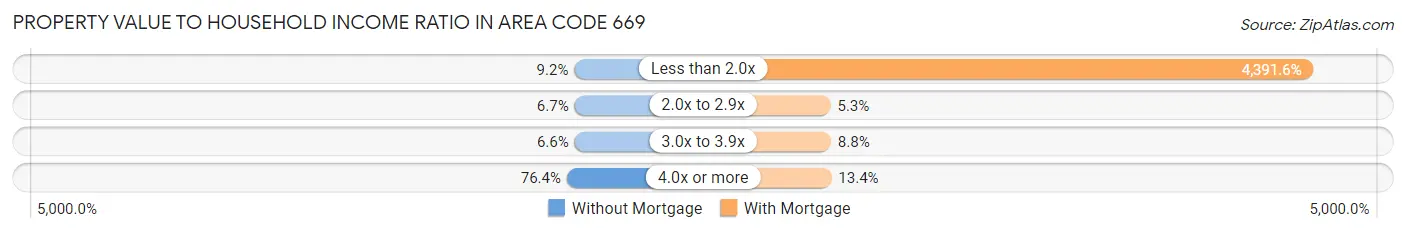
| Value-to-Income Ratio | Without Mortgage | With Mortgage |
| Less than 2.0x | 3,955 (9.2%) | 4,562,024 (4,391.6%) |
| 2.0x to 2.9x | 2,873 (6.7%) | 5,539 (5.3%) |
| 3.0x to 3.9x | 2,812 (6.6%) | 9,150 (8.8%) |
| 4.0x or more | 32,760 (76.4%) | 13,912 (13.4%) |
| Total | 42,884 (100.0%) | 103,881 (100.0%) |
Real Estate Taxes by Mortgage Status in Area Code 669
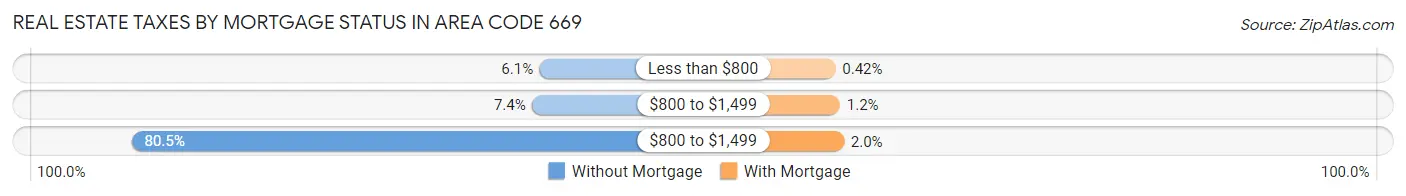
| Property Taxes | Without Mortgage | With Mortgage |
| Less than $800 | 2,593 (6.0%) | 440 (0.4%) |
| $800 to $1,499 | 3,176 (7.4%) | 1,283 (1.2%) |
| $800 to $1,499 | 34,508 (80.5%) | 2,049 (2.0%) |
| Total | 42,884 (100.0%) | 103,881 (100.0%) |
Health & Disability in Area Code 669
Health Insurance Coverage by Age in Area Code 669
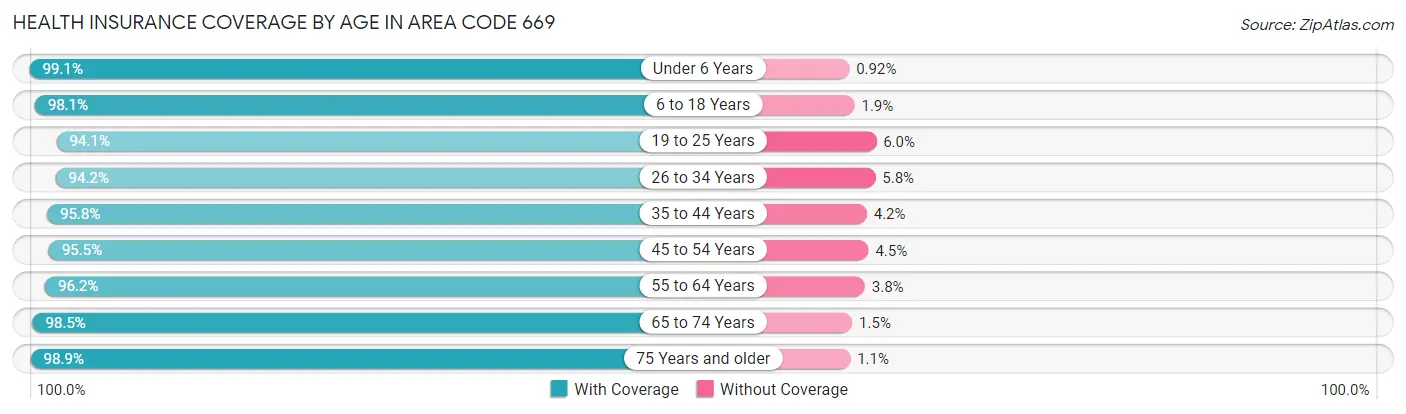
| Age Bracket | With Coverage | Without Coverage |
| Under 6 Years | 56,613 (99.1%) | 525 (0.9%) |
| 6 to 18 Years | 120,169 (98.1%) | 2,334 (1.9%) |
| 19 to 25 Years | 63,534 (94.1%) | 4,021 (5.9%) |
| 26 to 34 Years | 117,730 (94.2%) | 7,240 (5.8%) |
| 35 to 44 Years | 114,003 (95.8%) | 4,990 (4.2%) |
| 45 to 54 Years | 99,126 (95.5%) | 4,677 (4.5%) |
| 55 to 64 Years | 89,616 (96.2%) | 3,565 (3.8%) |
| 65 to 74 Years | 55,809 (98.5%) | 835 (1.5%) |
| 75 Years and older | 43,571 (98.9%) | 490 (1.1%) |
| Total | 760,171 (96.4%) | 28,677 (3.6%) |
Health Insurance Coverage by Citizenship Status in Area Code 669
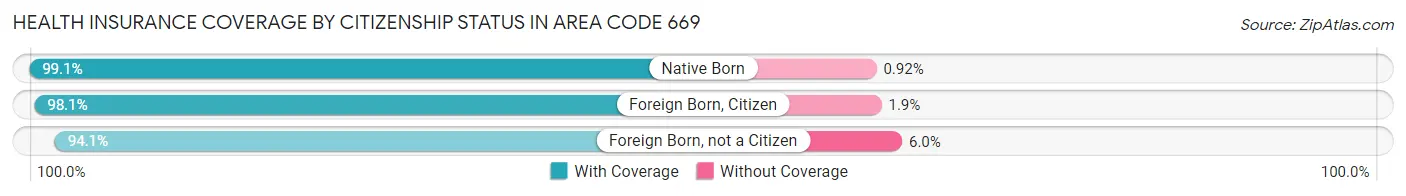
| Citizenship Status | With Coverage | Without Coverage |
| Native Born | 56,613 (99.1%) | 525 (0.9%) |
| Foreign Born, Citizen | 120,169 (98.1%) | 2,334 (1.9%) |
| Foreign Born, not a Citizen | 63,534 (94.1%) | 4,021 (5.9%) |
Health Insurance Coverage by Household Income in Area Code 669
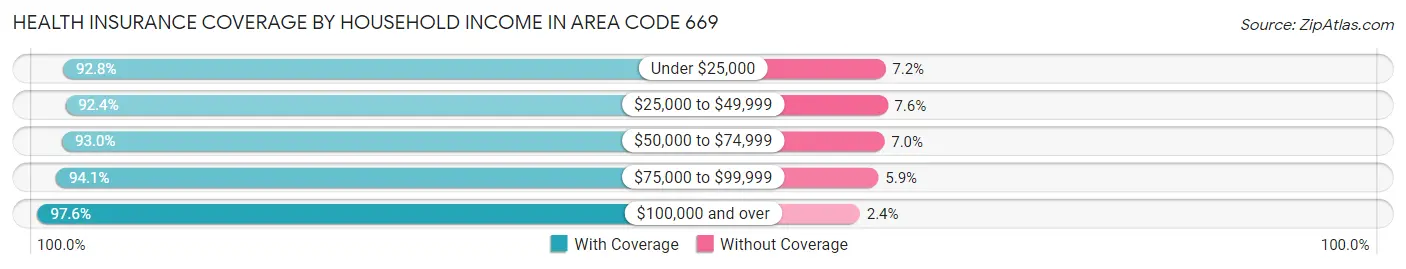
| Household Income | With Coverage | Without Coverage |
| Under $25,000 | 33,785 (92.8%) | 2,631 (7.2%) |
| $25,000 to $49,999 | 44,143 (92.4%) | 3,642 (7.6%) |
| $50,000 to $74,999 | 53,992 (93.0%) | 4,074 (7.0%) |
| $75,000 to $99,999 | 59,554 (94.1%) | 3,743 (5.9%) |
| $100,000 and over | 559,301 (97.6%) | 13,945 (2.4%) |
Public vs Private Health Insurance Coverage by Age in Area Code 669
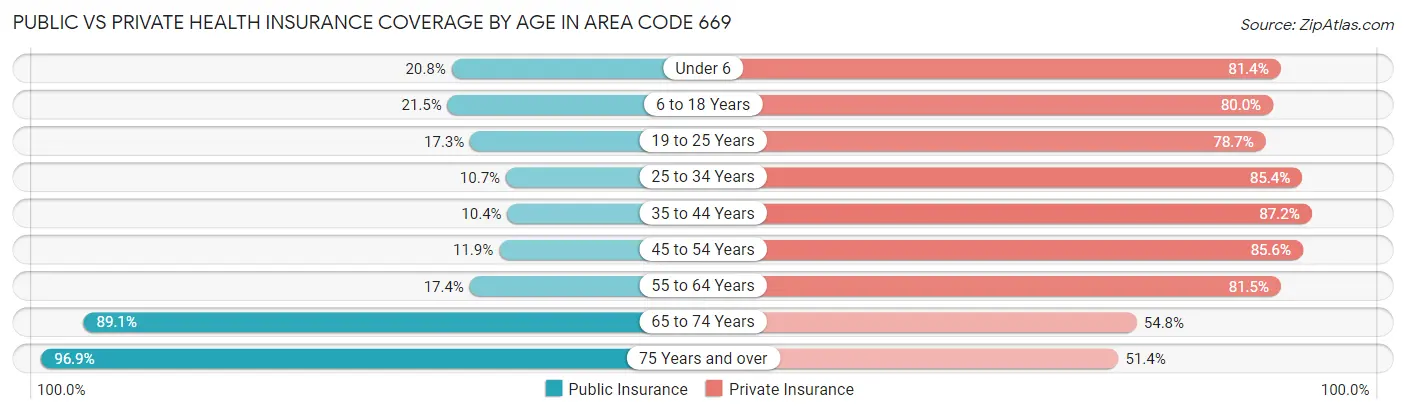
| Age Bracket | Public Insurance | Private Insurance |
| Under 6 | 11,861 (20.8%) | 46,528 (81.4%) |
| 6 to 18 Years | 26,325 (21.5%) | 98,029 (80.0%) |
| 19 to 25 Years | 11,695 (17.3%) | 53,133 (78.6%) |
| 25 to 34 Years | 13,316 (10.7%) | 106,753 (85.4%) |
| 35 to 44 Years | 12,352 (10.4%) | 103,749 (87.2%) |
| 45 to 54 Years | 12,381 (11.9%) | 88,799 (85.6%) |
| 55 to 64 Years | 16,199 (17.4%) | 75,923 (81.5%) |
| 65 to 74 Years | 50,440 (89.0%) | 31,024 (54.8%) |
| 75 Years and over | 42,695 (96.9%) | 22,636 (51.4%) |
| Total | 197,264 (25.0%) | 626,574 (79.4%) |
Disability Status by Sex by Age in Area Code 669
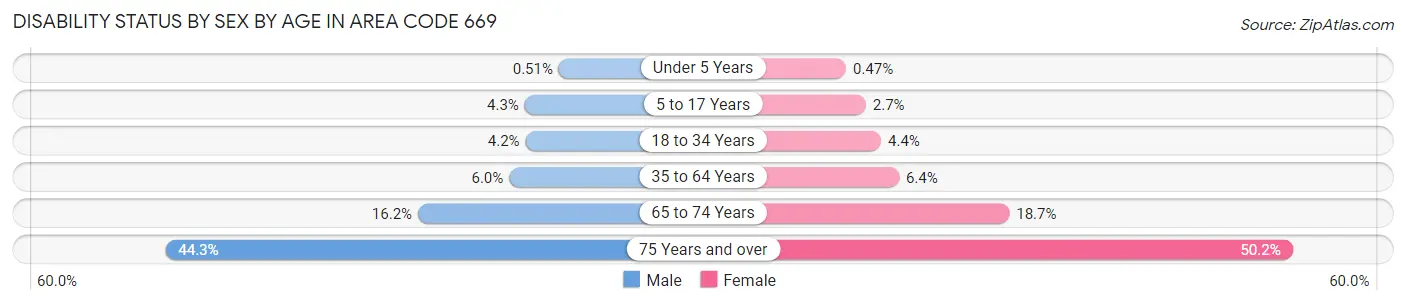
| Age Bracket | Male | Female |
| Under 5 Years | 121 (0.5%) | 113 (0.5%) |
| 5 to 17 Years | 2,658 (4.3%) | 1,623 (2.7%) |
| 18 to 34 Years | 4,524 (4.2%) | 4,168 (4.4%) |
| 35 to 64 Years | 9,907 (6.0%) | 9,669 (6.4%) |
| 65 to 74 Years | 4,282 (16.2%) | 5,635 (18.6%) |
| 75 Years and over | 8,357 (44.3%) | 12,651 (50.2%) |
Disability Class by Sex by Age in Area Code 669
Disability Class: Hearing Difficulty
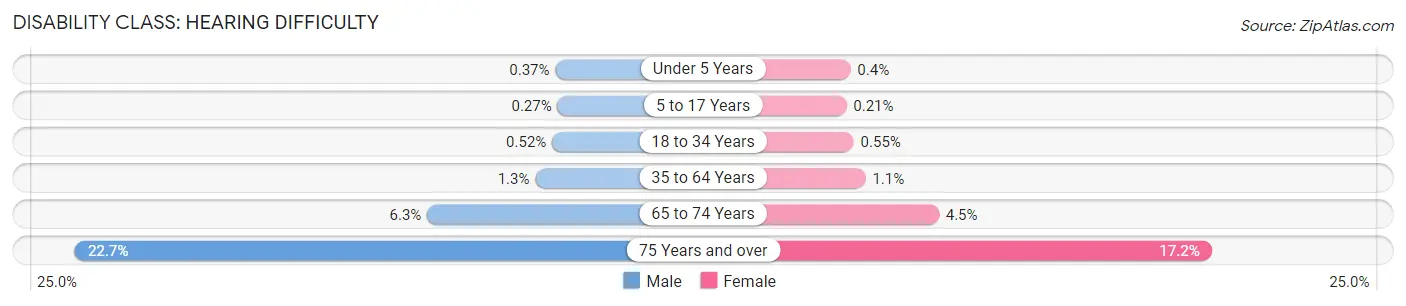
| Age Bracket | Male | Female |
| Under 5 Years | 87 (0.4%) | 97 (0.4%) |
| 5 to 17 Years | 168 (0.3%) | 126 (0.2%) |
| 18 to 34 Years | 557 (0.5%) | 521 (0.5%) |
| 35 to 64 Years | 2,135 (1.3%) | 1,663 (1.1%) |
| 65 to 74 Years | 1,670 (6.3%) | 1,359 (4.5%) |
| 75 Years and over | 4,272 (22.7%) | 4,326 (17.2%) |
Disability Class: Vision Difficulty
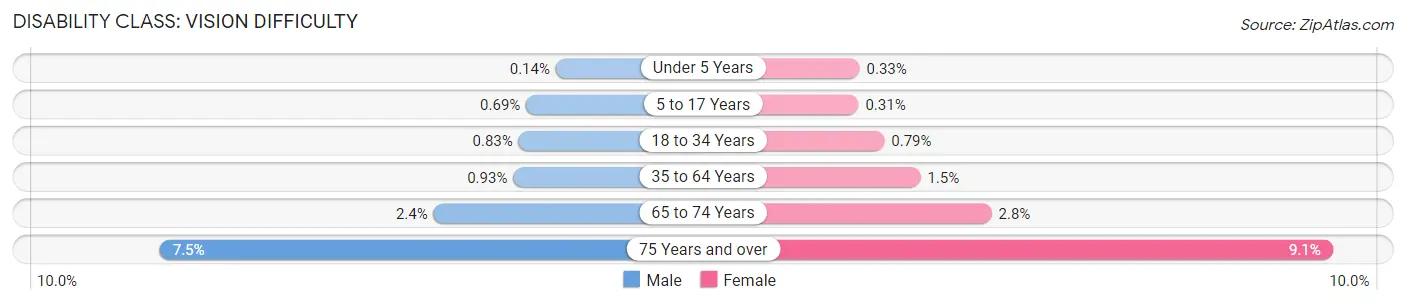
| Age Bracket | Male | Female |
| Under 5 Years | 34 (0.1%) | 79 (0.3%) |
| 5 to 17 Years | 425 (0.7%) | 188 (0.3%) |
| 18 to 34 Years | 886 (0.8%) | 749 (0.8%) |
| 35 to 64 Years | 1,523 (0.9%) | 2,217 (1.5%) |
| 65 to 74 Years | 637 (2.4%) | 839 (2.8%) |
| 75 Years and over | 1,413 (7.5%) | 2,296 (9.1%) |
Disability Class: Cognitive Difficulty
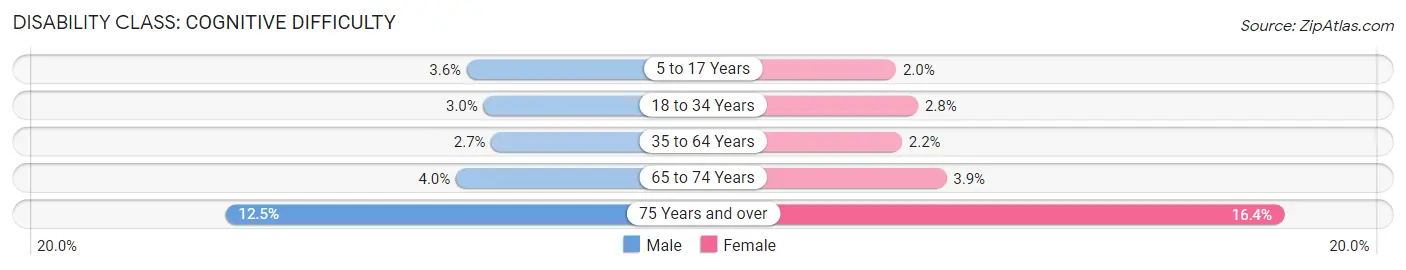
| Age Bracket | Male | Female |
| 5 to 17 Years | 2,207 (3.6%) | 1,219 (2.0%) |
| 18 to 34 Years | 3,171 (3.0%) | 2,689 (2.8%) |
| 35 to 64 Years | 4,380 (2.7%) | 3,390 (2.2%) |
| 65 to 74 Years | 1,053 (4.0%) | 1,172 (3.9%) |
| 75 Years and over | 2,364 (12.5%) | 4,136 (16.4%) |
Disability Class: Ambulatory Difficulty
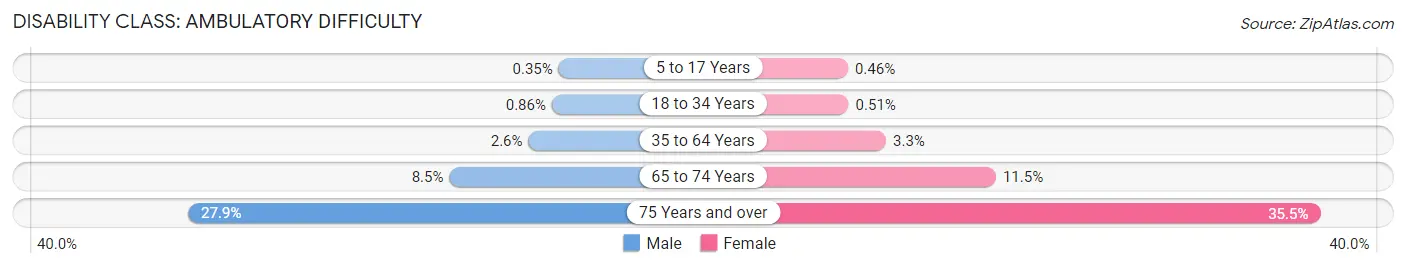
| Age Bracket | Male | Female |
| 5 to 17 Years | 213 (0.4%) | 277 (0.5%) |
| 18 to 34 Years | 919 (0.9%) | 488 (0.5%) |
| 35 to 64 Years | 4,275 (2.6%) | 5,003 (3.3%) |
| 65 to 74 Years | 2,240 (8.5%) | 3,458 (11.5%) |
| 75 Years and over | 5,254 (27.9%) | 8,952 (35.5%) |
Disability Class: Self-Care Difficulty
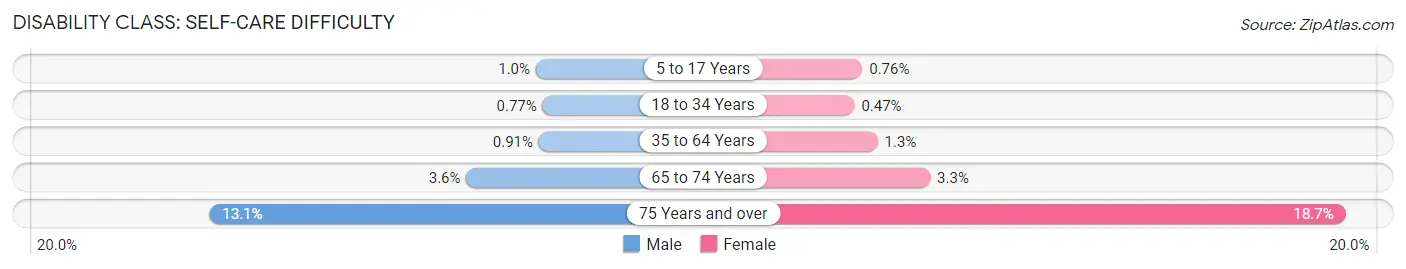
| Age Bracket | Male | Female |
| 5 to 17 Years | 628 (1.0%) | 461 (0.8%) |
| 18 to 34 Years | 822 (0.8%) | 446 (0.5%) |
| 35 to 64 Years | 1,492 (0.9%) | 2,016 (1.3%) |
| 65 to 74 Years | 951 (3.6%) | 990 (3.3%) |
| 75 Years and over | 2,478 (13.1%) | 4,714 (18.7%) |
Technology Access in Area Code 669
Computing Device Access in Area Code 669
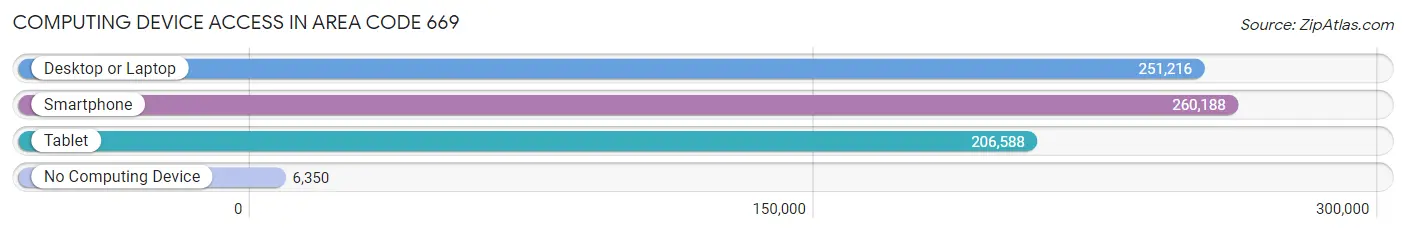
| Device Type | # Households | % Households |
| Desktop or Laptop | 251,216 | 91.2% |
| Smartphone | 260,188 | 94.5% |
| Tablet | 206,588 | 75.0% |
| No Computing Device | 6,350 | 2.3% |
| Total | 275,442 | 100.0% |
Internet Access in Area Code 669
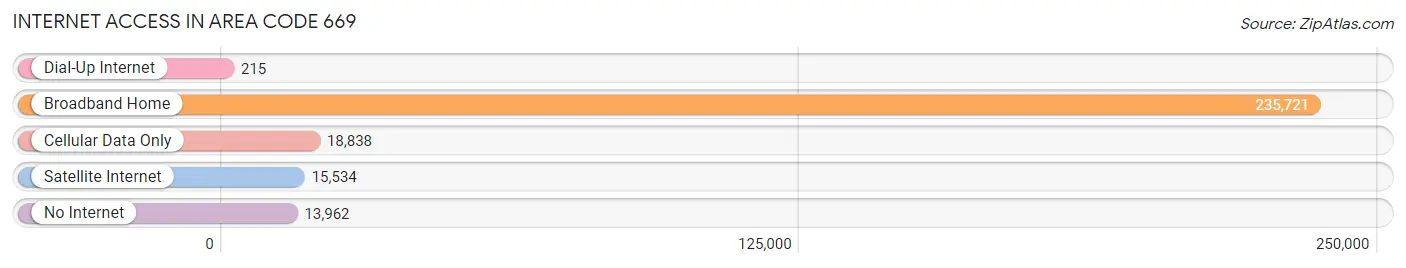
| Internet Type | # Households | % Households |
| Dial-Up Internet | 215 | 0.1% |
| Broadband Home | 235,721 | 85.6% |
| Cellular Data Only | 18,838 | 6.8% |
| Satellite Internet | 15,534 | 5.6% |
| No Internet | 13,962 | 5.1% |
| Total | 275,442 | 100.0% |
Area Code 669 Summary
Geography
Area code 669 is a telephone area code in the North American Numbering Plan (NANP) for the state of California. It was created in a split from area code 408 on November 20, 2012. It serves the San Francisco Bay Area, including the cities of San Jose, Santa Clara, Sunnyvale, and Milpitas.
Social
Area code 669 is a relatively new area code, and as such, it has not yet developed a distinct social identity. However, it is located in the San Francisco Bay Area, which is known for its diverse population and vibrant culture.
Economics
Area code 669 is located in the heart of Silicon Valley, one of the most important technology hubs in the world. This area is home to many of the world's leading technology companies, such as Apple, Google, and Facebook. As such, the area code is associated with a strong economy and high levels of wealth.
Demographics
Area code 669 is located in a highly diverse area. According to the 2010 census, the population of the area is approximately 1.8 million people, with a median age of 36.7 years. The population is composed of a variety of ethnic and racial backgrounds, including White (44.3%), Asian (34.2%), Hispanic or Latino (14.3%), and African American (4.2%).
Common Questions
What is Per Capita Income in Area Code 669?
Per Capita income in Area Code 669 is $77,548.
What is the Median Family Income in Area Code 669?
Median Family Income in Area Code 669 is $179,206.
What is the Median Household income in Area Code 669?
Median Household Income in Area Code 669 is $161,915.
What is Income or Wage Gap in Area Code 669?
Income or Wage Gap in Area Code 669 is 37.1%.
Women in Area Code 669 earn 62.9 cents for every dollar earned by a man.
What is Family Income Deficit in Area Code 669?
Family Income Deficit in Area Code 669 is $11,385.
Families that are below poverty line in Area Code 669 earn $11,385 less on average than the poverty threshold level.
What is Inequality or Gini Index in Area Code 669?
Inequality or Gini Index in Area Code 669 is 9.17.
What is the Total Population of Area Code 669?
Total Population of Area Code 669 is 792,267.
What is the Total Male Population of Area Code 669?
Total Male Population of Area Code 669 is 404,084.
What is the Total Female Population of Area Code 669?
Total Female Population of Area Code 669 is 388,183.
What is the Ratio of Males per 100 Females in Area Code 669?
There are 104.10 Males per 100 Females in Area Code 669.
What is the Ratio of Females per 100 Males in Area Code 669?
There are 96.06 Females per 100 Males in Area Code 669.
What is the Median Population Age in Area Code 669?
Median Population Age in Area Code 669 is 38.7 Years.
What is the Average Family Size in Area Code 669
Average Family Size in Area Code 669 is 3.2 People.
What is the Average Household Size in Area Code 669
Average Household Size in Area Code 669 is 2.8 People.
How Large is the Labor Force in Area Code 669?
There are 437,363 People in the Labor Forcein in Area Code 669.
What is the Percentage of People in the Labor Force in Area Code 669?
68.3% of People are in the Labor Force in Area Code 669.
What is the Unemployment Rate in Area Code 669?
Unemployment Rate in Area Code 669 is 4.4%.