Area Code 925 Map & Demographics
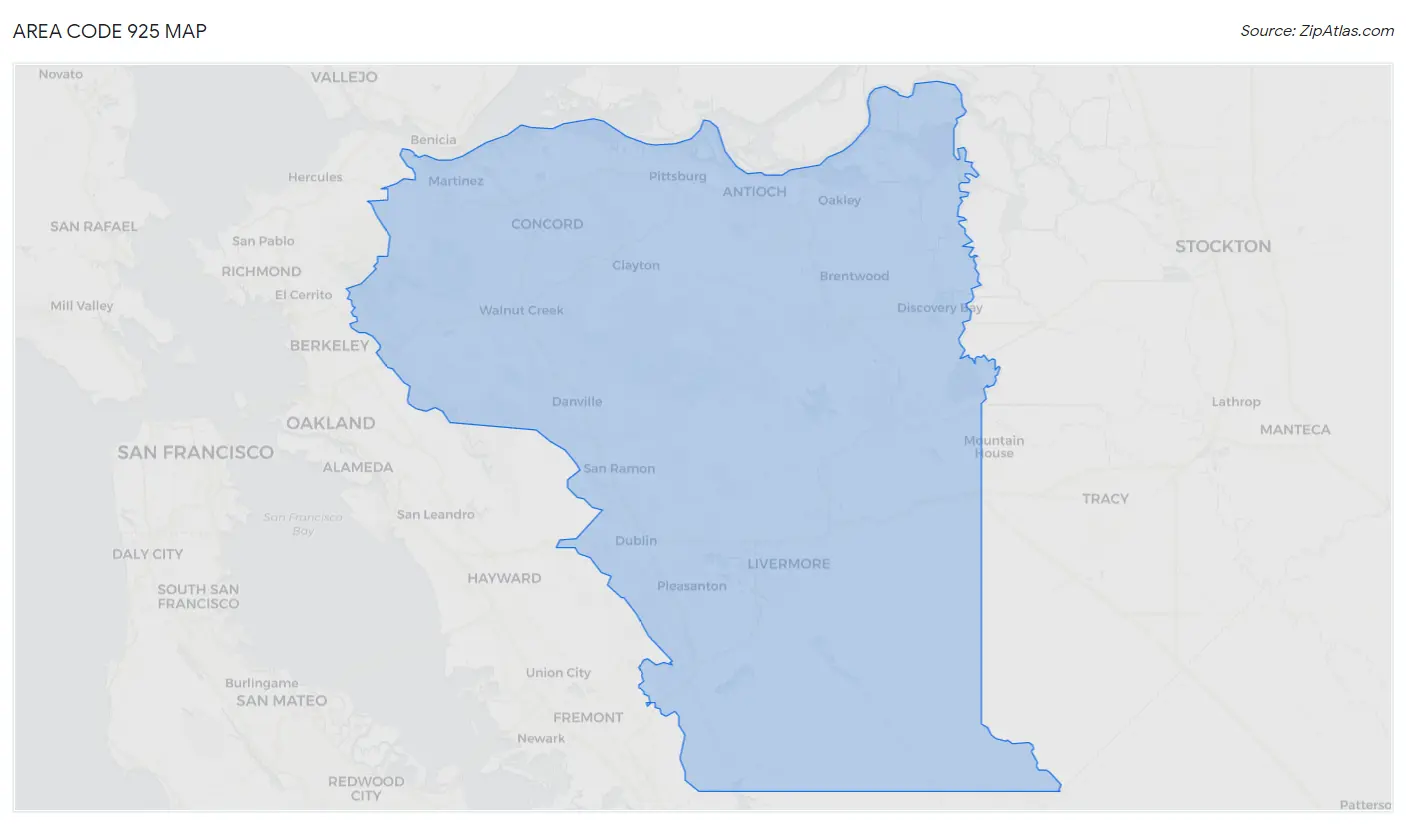
Area Code 925 Map
Area Code 925 Overview
$66,751
PER CAPITA INCOME
$166,997
AVG FAMILY INCOME
$146,912
AVG HOUSEHOLD INCOME
34.9%
WAGE / INCOME GAP [ % ]
65.1¢/ $1
WAGE / INCOME GAP [ $ ]
$10,758
FAMILY INCOME DEFICIT
15.85
INEQUALITY / GINI INDEX
1,485,554
TOTAL POPULATION
738,961
MALE POPULATION
746,593
FEMALE POPULATION
98.98
MALES / 100 FEMALES
101.03
FEMALES / 100 MALES
40.8
MEDIAN AGE
3.3
AVG FAMILY SIZE
2.8
AVG HOUSEHOLD SIZE
764,855
LABOR FORCE [ PEOPLE ]
64.0%
PERCENT IN LABOR FORCE
5.2%
UNEMPLOYMENT RATE
Income in Area Code 925
Income Overview in Area Code 925
Per Capita Income in Area Code 925 is $66,751, while median incomes of families and households are $166,997 and $146,912 respectively.
| Characteristic | Number | Measure |
| Per Capita Income | 1,485,554 | $66,751 |
| Median Family Income | 373,255 | $166,997 |
| Mean Family Income | 373,255 | $7,714,157 |
| Median Household Income | 513,814 | $146,912 |
| Mean Household Income | 513,814 | $6,897,865 |
| Income Deficit | 373,255 | $10,758 |
| Wage / Income Gap (%) | 1,485,554 | 34.89% |
| Wage / Income Gap ($) | 1,485,554 | 65.11¢ per $1 |
| Gini / Inequality Index | 1,485,554 | 15.85 |
Earnings by Sex in Area Code 925
Average Earnings in Area Code 925 are $74,106, $95,100 for men and $57,696 for women, a difference of 39.3%.
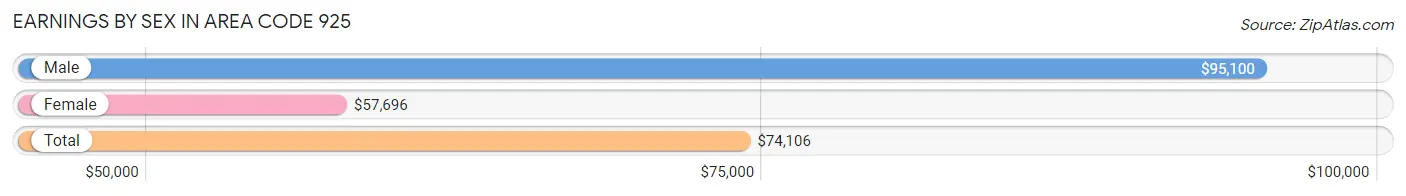
| Sex | Number | Average Earnings |
| Male | 435,697 (53.9%) | $95,100 |
| Female | 372,295 (46.1%) | $57,696 |
| Total | 807,992 (100.0%) | $74,106 |
Earnings by Sex by Income Bracket in Area Code 925
The most common earnings brackets in Area Code 925 are $100,000+ for men (179,914 | 41.3%) and $100,000+ for women (96,013 | 25.8%).
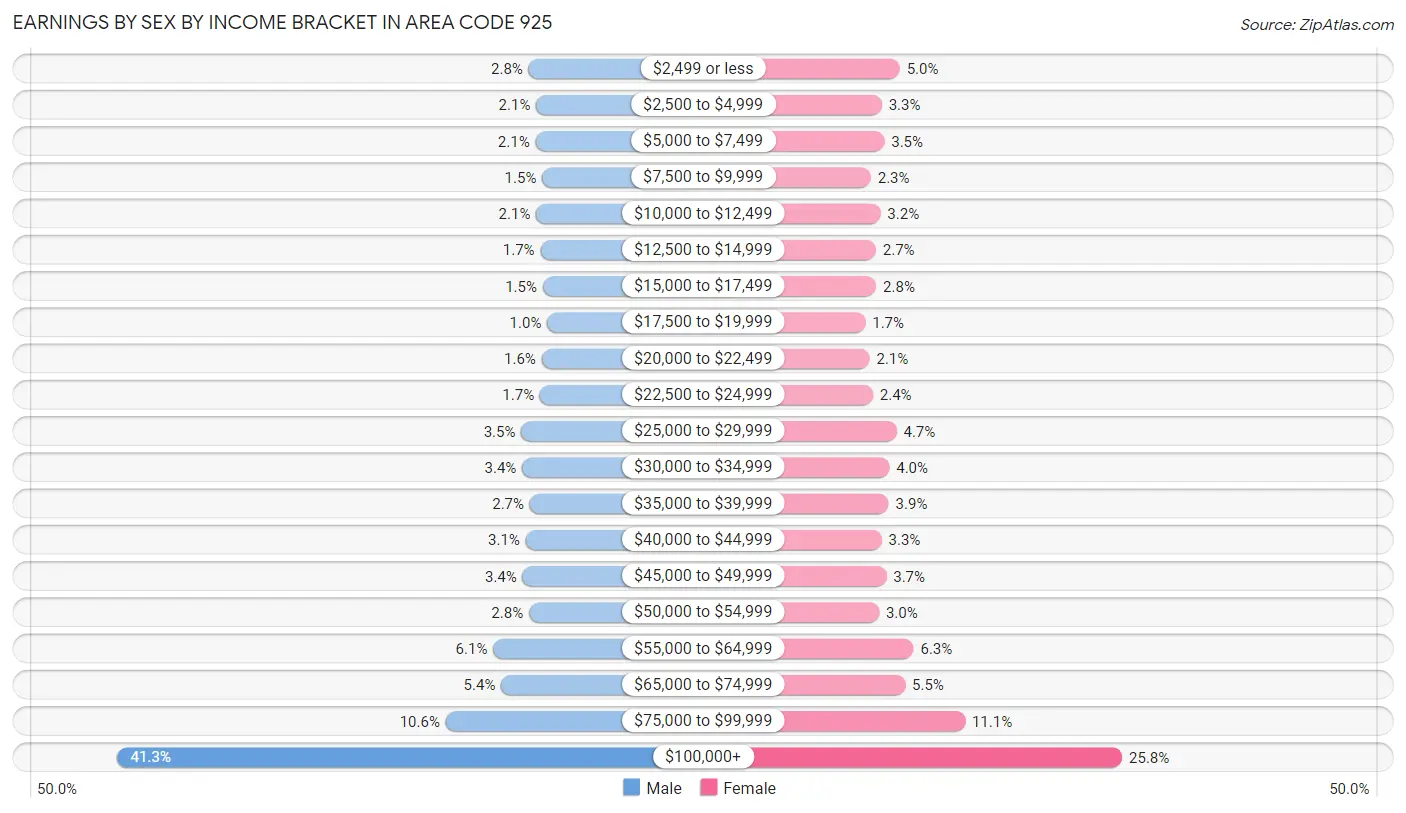
| Income | Male | Female |
| $2,499 or less | 12,094 (2.8%) | 18,473 (5.0%) |
| $2,500 to $4,999 | 9,011 (2.1%) | 12,178 (3.3%) |
| $5,000 to $7,499 | 9,303 (2.1%) | 13,084 (3.5%) |
| $7,500 to $9,999 | 6,596 (1.5%) | 8,362 (2.2%) |
| $10,000 to $12,499 | 9,033 (2.1%) | 11,712 (3.2%) |
| $12,500 to $14,999 | 7,299 (1.7%) | 10,110 (2.7%) |
| $15,000 to $17,499 | 6,340 (1.5%) | 10,224 (2.8%) |
| $17,500 to $19,999 | 4,518 (1.0%) | 6,424 (1.7%) |
| $20,000 to $22,499 | 6,797 (1.6%) | 7,915 (2.1%) |
| $22,500 to $24,999 | 7,508 (1.7%) | 9,075 (2.4%) |
| $25,000 to $29,999 | 15,110 (3.5%) | 17,355 (4.7%) |
| $30,000 to $34,999 | 14,769 (3.4%) | 14,807 (4.0%) |
| $35,000 to $39,999 | 11,618 (2.7%) | 14,596 (3.9%) |
| $40,000 to $44,999 | 13,330 (3.1%) | 12,147 (3.3%) |
| $45,000 to $49,999 | 14,608 (3.4%) | 13,779 (3.7%) |
| $50,000 to $54,999 | 12,002 (2.8%) | 11,220 (3.0%) |
| $55,000 to $64,999 | 26,565 (6.1%) | 23,262 (6.2%) |
| $65,000 to $74,999 | 23,315 (5.3%) | 20,333 (5.5%) |
| $75,000 to $99,999 | 45,967 (10.5%) | 41,226 (11.1%) |
| $100,000+ | 179,914 (41.3%) | 96,013 (25.8%) |
| Total | 435,697 (100.0%) | 372,295 (100.0%) |
Earnings by Sex by Educational Attainment in Area Code 925
Average earnings in Area Code 925 are $3,883,389 for men and $2,492,223 for women, a difference of 35.8%. Men with an educational attainment of graduate degree enjoy the highest average annual earnings of $5,848,249, while those with less than high school education earn the least with $1,270,716. Women with an educational attainment of graduate degree earn the most with the average annual earnings of $3,695,047, while those with less than high school education have the smallest earnings of $697,661.
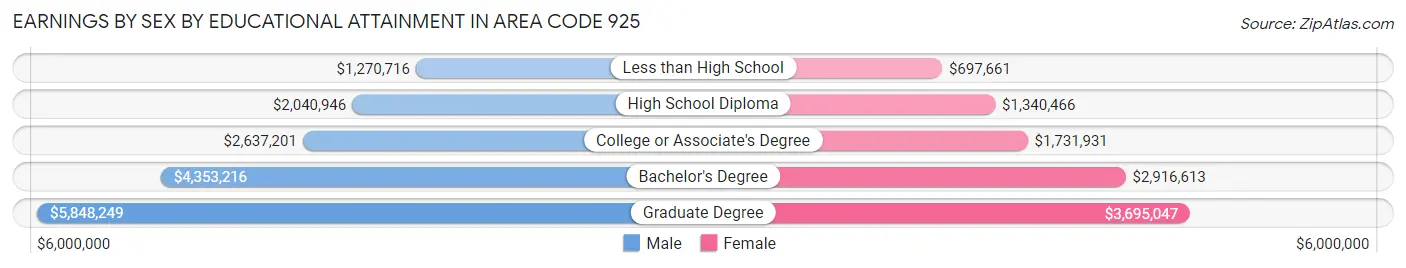
| Educational Attainment | Male Income | Female Income |
| Less than High School | $1,270,716 | $697,661 |
| High School Diploma | $2,040,946 | $1,340,466 |
| College or Associate's Degree | $2,637,201 | $1,731,931 |
| Bachelor's Degree | $4,353,216 | $2,916,613 |
| Graduate Degree | $5,848,249 | $3,695,047 |
| Total | $3,883,389 | $2,492,223 |
Family Income in Area Code 925
Family Income Brackets in Area Code 925
According to the Area Code 925 family income data, there are 5,308,059 families falling into the $200,000+ income range, which is the most common income bracket and makes up 1,422.1% of all families. Conversely, the $10,000 to $14,999 income bracket is the least frequent group with only 129,146 families (34.6%) belonging to this category.
| Income Bracket | # Families | % Families |
| Less than $10,000 | 249,708 | 66.9% |
| $10,000 to $14,999 | 129,146 | 34.6% |
| $15,000 to $24,999 | 297,484 | 79.7% |
| $25,000 to $34,999 | 395,650 | 106.0% |
| $35,000 to $49,999 | 619,977 | 166.1% |
| $50,000 to $74,999 | 1,153,358 | 309.0% |
| $75,000 to $99,999 | 1,239,580 | 332.1% |
| $100,000 to $149,999 | 2,334,337 | 625.4% |
| $150,000 to $199,999 | 2,081,643 | 557.7% |
| $200,000+ | 5,308,059 | 1,422.1% |
Family Income by Famaliy Size in Area Code 925
7+ person families (6,746 | 1.8%) account for the highest median family income in Area Code 925 with $200,076 per family, while 2-person families (141,523 | 37.9%) have the highest median income of $67,791 per family member.
| Income Bracket | # Families | Median Income |
| 2-Person Families | 141,523 (37.9%) | $135,581 |
| 3-Person Families | 90,480 (24.2%) | $179,326 |
| 4-Person Families | 89,002 (23.8%) | $187,921 |
| 5-Person Families | 32,709 (8.8%) | $192,306 |
| 6-Person Families | 12,795 (3.4%) | $193,295 |
| 7+ Person Families | 6,746 (1.8%) | $200,076 |
| Total | 373,255 (100.0%) | $166,997 |
Family Income by Number of Earners in Area Code 925
The median family income in Area Code 925 is $166,997, with families comprising 3+ earners (54,003) having the highest median family income of $211,718, while families with no earners (39,349) have the lowest median family income of $81,072, accounting for 14.5% and 10.5% of families, respectively.
| Number of Earners | # Families | Median Income |
| No Earners | 39,349 (10.5%) | $81,072 |
| 1 Earner | 112,983 (30.3%) | $131,120 |
| 2 Earners | 166,920 (44.7%) | $196,232 |
| 3+ Earners | 54,003 (14.5%) | $211,718 |
| Total | 373,255 (100.0%) | $166,997 |
Household Income in Area Code 925
Household Income Brackets in Area Code 925
With 6,181,182 households falling in the category, the $200,000+ income range is the most frequent in Area Code 925, accounting for 1,203.0% of all households. In contrast, only 411,051 households (80.0%) fall into the $10,000 to $14,999 income bracket, making it the least populous group.
| Income Bracket | # Households | % Households |
| Less than $10,000 | 575,985 | 112.1% |
| $10,000 to $14,999 | 411,051 | 80.0% |
| $15,000 to $24,999 | 608,356 | 118.4% |
| $25,000 to $34,999 | 690,566 | 134.4% |
| $35,000 to $49,999 | 1,008,617 | 196.3% |
| $50,000 to $74,999 | 1,865,145 | 363.0% |
| $75,000 to $99,999 | 1,782,935 | 347.0% |
| $100,000 to $149,999 | 3,208,768 | 624.5% |
| $150,000 to $199,999 | 2,675,943 | 520.8% |
| $200,000+ | 6,181,182 | 1,203.0% |
Household Income by Householder Age in Area Code 925
The median household income in Area Code 925 is $146,912, with the highest median household income of $173,826 found in the 45 to 64 years age bracket for the primary householder. A total of 210,763 households (41.0%) fall into this category. Meanwhile, the 15 to 24 years age bracket for the primary householder has the lowest median household income of $66,121, with 7,382 households (1.4%) in this group.
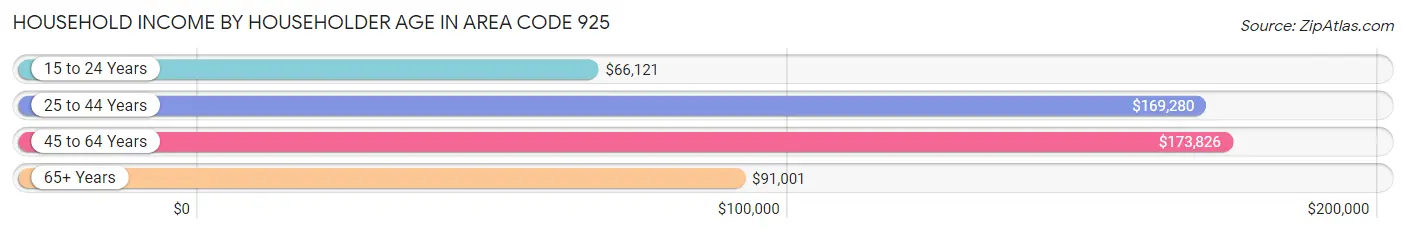
| Income Bracket | # Households | Median Income |
| 15 to 24 Years | 7,382 (1.4%) | $66,121 |
| 25 to 44 Years | 171,180 (33.3%) | $169,280 |
| 45 to 64 Years | 210,763 (41.0%) | $173,826 |
| 65+ Years | 124,489 (24.2%) | $91,001 |
| Total | 513,814 (100.0%) | $146,912 |
Poverty in Area Code 925
Income Below Poverty by Sex and Age in Area Code 925
With 6.6% poverty level for males and 7.8% for females among the residents of Area Code 925, 5 year old males and 75 year old and over females are the most vulnerable to poverty, with 804 males (9.2%) and 6,266 females (11.4%) in their respective age groups living below the poverty level.
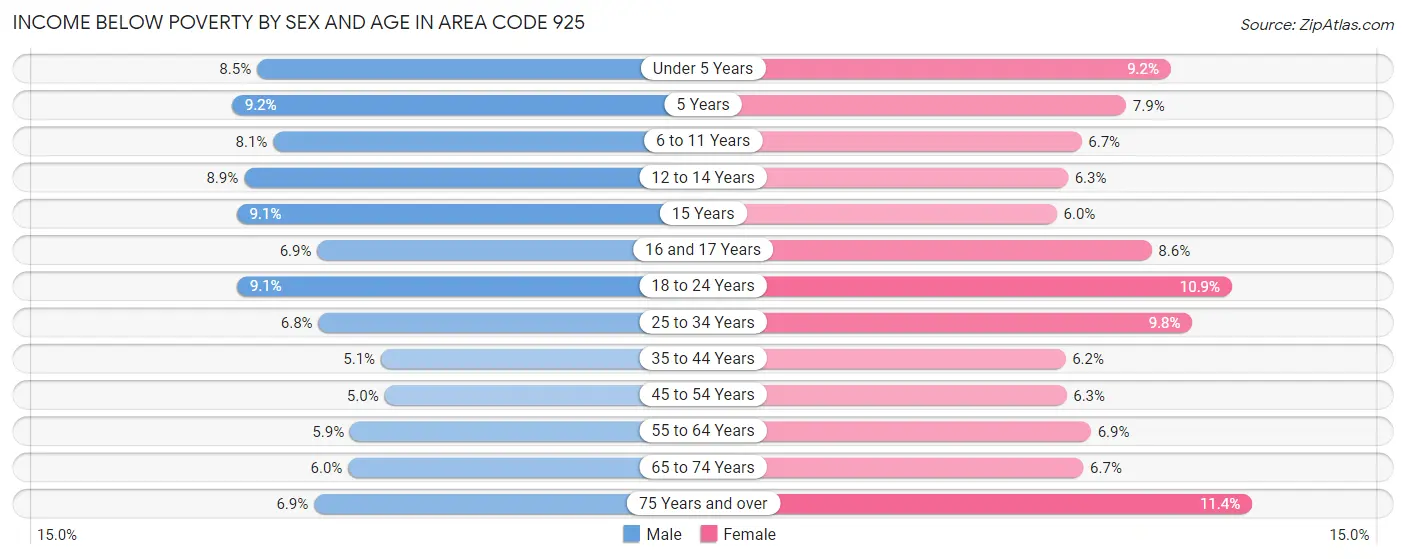
| Age Bracket | Male | Female |
| Under 5 Years | 3,615 (8.5%) | 3,658 (9.2%) |
| 5 Years | 804 (9.2%) | 746 (7.9%) |
| 6 to 11 Years | 4,489 (8.1%) | 3,575 (6.7%) |
| 12 to 14 Years | 2,620 (8.9%) | 1,817 (6.3%) |
| 15 Years | 862 (9.1%) | 557 (6.0%) |
| 16 and 17 Years | 1,421 (6.9%) | 1,677 (8.6%) |
| 18 to 24 Years | 5,139 (9.1%) | 5,817 (10.9%) |
| 25 to 34 Years | 6,872 (6.8%) | 9,407 (9.8%) |
| 35 to 44 Years | 5,583 (5.1%) | 6,673 (6.2%) |
| 45 to 54 Years | 5,209 (5.0%) | 6,384 (6.2%) |
| 55 to 64 Years | 5,701 (5.9%) | 6,673 (6.9%) |
| 65 to 74 Years | 3,620 (6.0%) | 4,615 (6.7%) |
| 75 Years and over | 2,648 (6.9%) | 6,266 (11.4%) |
| Total | 48,583 (6.6%) | 57,865 (7.8%) |
Income Above Poverty by Sex and Age in Area Code 925
According to the poverty statistics in Area Code 925, males aged 45 to 54 years and females aged 15 years are the age groups that are most secure financially, with 95.0% of males and 94.0% of females in these age groups living above the poverty line.
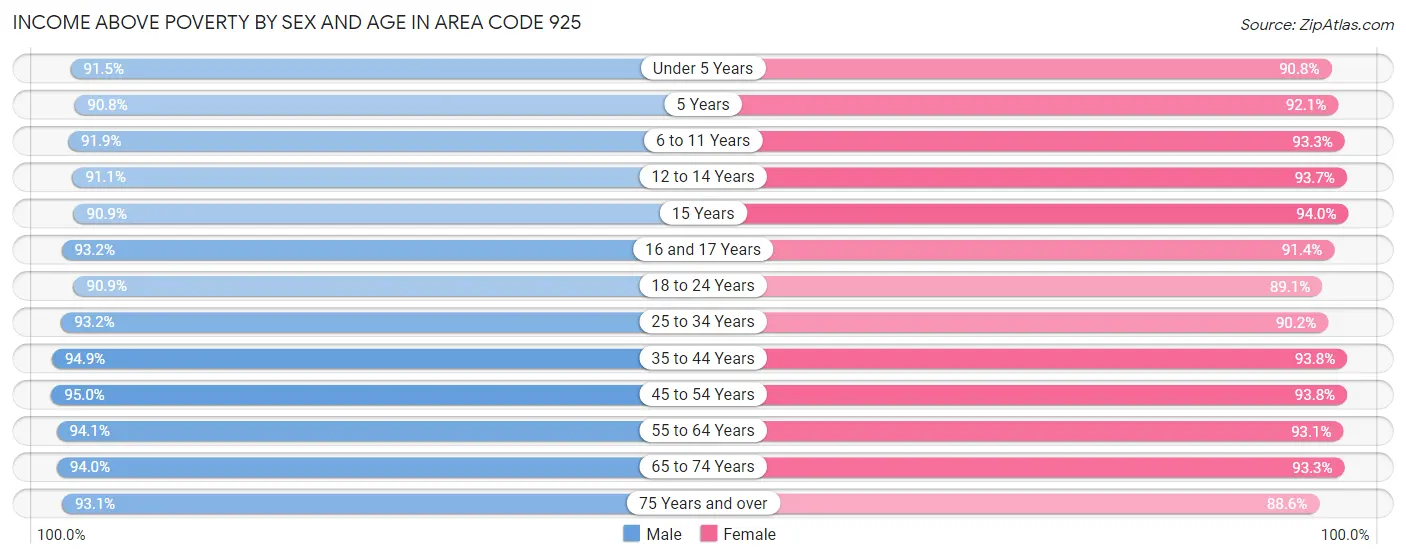
| Age Bracket | Male | Female |
| Under 5 Years | 38,782 (91.5%) | 36,279 (90.8%) |
| 5 Years | 7,909 (90.8%) | 8,689 (92.1%) |
| 6 to 11 Years | 51,055 (91.9%) | 50,039 (93.3%) |
| 12 to 14 Years | 26,851 (91.1%) | 27,085 (93.7%) |
| 15 Years | 8,608 (90.9%) | 8,762 (94.0%) |
| 16 and 17 Years | 19,319 (93.1%) | 17,789 (91.4%) |
| 18 to 24 Years | 51,387 (90.9%) | 47,762 (89.1%) |
| 25 to 34 Years | 93,908 (93.2%) | 86,945 (90.2%) |
| 35 to 44 Years | 104,216 (94.9%) | 100,692 (93.8%) |
| 45 to 54 Years | 99,493 (95.0%) | 95,721 (93.8%) |
| 55 to 64 Years | 90,216 (94.1%) | 89,649 (93.1%) |
| 65 to 74 Years | 56,831 (94.0%) | 64,055 (93.3%) |
| 75 Years and over | 35,530 (93.1%) | 48,589 (88.6%) |
| Total | 684,105 (93.4%) | 682,056 (92.2%) |
Income Below Poverty Among Married-Couple Families in Area Code 925
The poverty statistics for married-couple families in Area Code 925 show that 2.7% or 7,900 of the total 295,003 families live below the poverty line. Families with 5 or more children have the highest poverty rate of 19.3%, comprising of 164 families. On the other hand, families with no children have the lowest poverty rate of 2.2%, which includes 3,344 families.
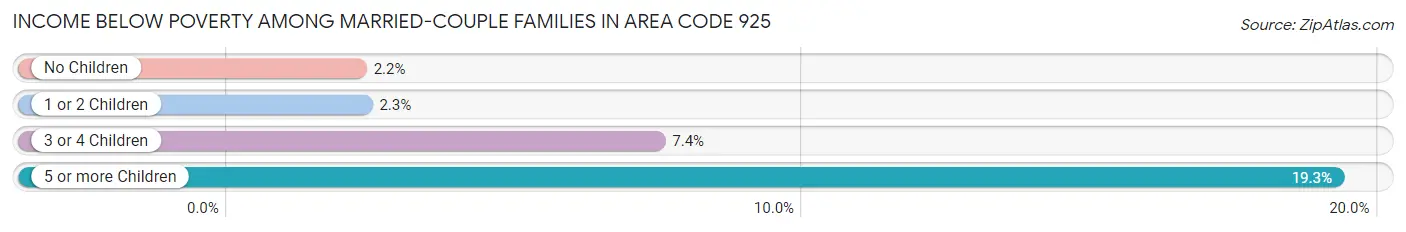
| Children | Above Poverty | Below Poverty |
| No Children | 145,937 (97.8%) | 3,344 (2.2%) |
| 1 or 2 Children | 122,259 (97.7%) | 2,927 (2.3%) |
| 3 or 4 Children | 18,219 (92.6%) | 1,465 (7.4%) |
| 5 or more Children | 688 (80.7%) | 164 (19.3%) |
| Total | 287,103 (97.3%) | 7,900 (2.7%) |
Income Below Poverty Among Single-Parent Households in Area Code 925
According to the poverty data in Area Code 925, 7.5% or 1,839 single-father households and 14.4% or 7,781 single-mother households are living below the poverty line. Among single-father households, those with 5 or more children have the highest poverty rate, with 15 households (37.5%) experiencing poverty. Likewise, among single-mother households, those with 3 or 4 children have the highest poverty rate, with 1,381 households (34.7%) falling below the poverty line.
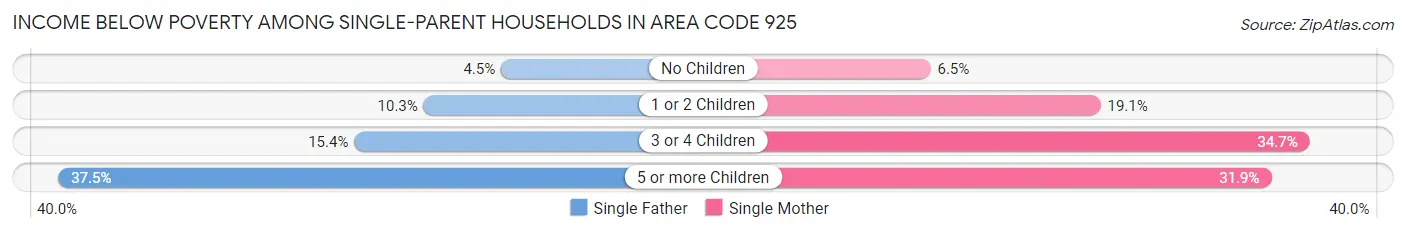
| Children | Single Father | Single Mother |
| No Children | 577 (4.5%) | 1,629 (6.5%) |
| 1 or 2 Children | 1,054 (10.3%) | 4,670 (19.1%) |
| 3 or 4 Children | 193 (15.4%) | 1,381 (34.7%) |
| 5 or more Children | 15 (37.5%) | 101 (31.9%) |
| Total | 1,839 (7.5%) | 7,781 (14.4%) |
Income Below Poverty Among Married-Couple vs Single-Parent Households in Area Code 925
The poverty data for Area Code 925 shows that 7,900 of the married-couple family households (2.7%) and 9,620 of the single-parent households (12.3%) are living below the poverty level. Within the married-couple family households, those with 5 or more children have the highest poverty rate, with 164 households (19.3%) falling below the poverty line. Among the single-parent households, those with 5 or more children have the highest poverty rate, with 116 household (32.5%) living below poverty.
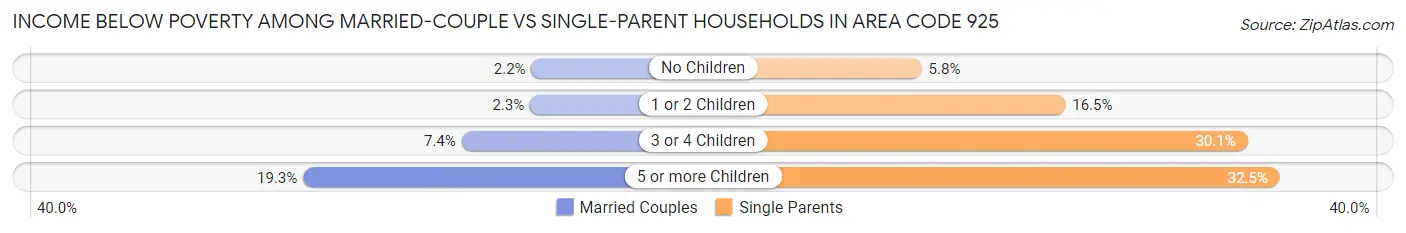
| Children | Married-Couple Families | Single-Parent Households |
| No Children | 3,344 (2.2%) | 2,206 (5.8%) |
| 1 or 2 Children | 2,927 (2.3%) | 5,724 (16.5%) |
| 3 or 4 Children | 1,465 (7.4%) | 1,574 (30.1%) |
| 5 or more Children | 164 (19.3%) | 116 (32.5%) |
| Total | 7,900 (2.7%) | 9,620 (12.3%) |
Race in Area Code 925
The most populous races in Area Code 925 are White / Caucasian (639,772 | 43.1%), Asian (407,503 | 27.4%), and Hispanic or Latino (340,885 | 23.0%).
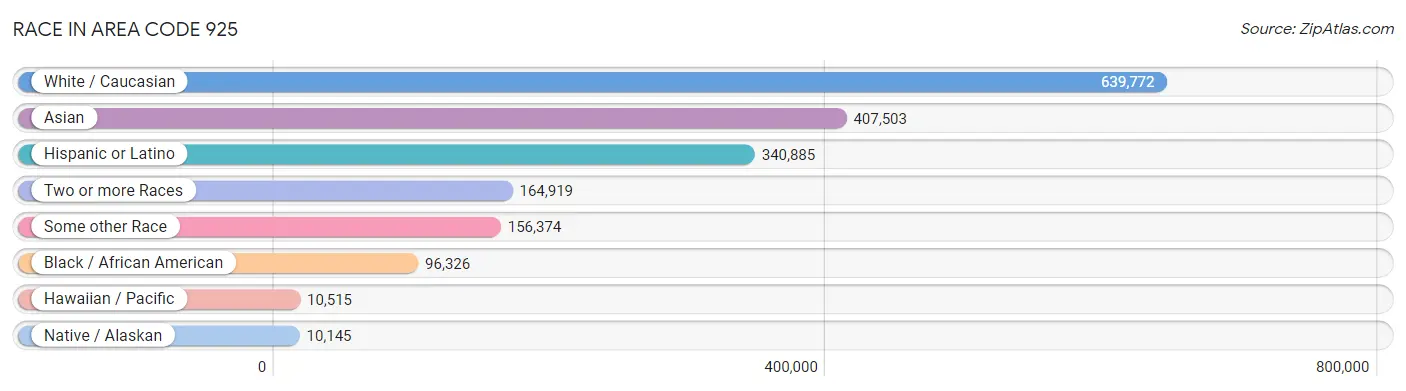
| Race | # Population | % Population |
| Asian | 407,503 | 27.4% |
| Black / African American | 96,326 | 6.5% |
| Hawaiian / Pacific | 10,515 | 0.7% |
| Hispanic or Latino | 340,885 | 23.0% |
| Native / Alaskan | 10,145 | 0.7% |
| White / Caucasian | 639,772 | 43.1% |
| Two or more Races | 164,919 | 11.1% |
| Some other Race | 156,374 | 10.5% |
| Total | 1,485,554 | 100.0% |
Ancestry in Area Code 925
The most populous ancestries reported in Area Code 925 are Mexican (241,629 | 16.3%), Thai (142,456 | 9.6%), Indian (Asian) (123,062 | 8.3%), German (113,894 | 7.7%), and Irish (104,702 | 7.0%), together accounting for 48.9% of all Area Code 925 residents.
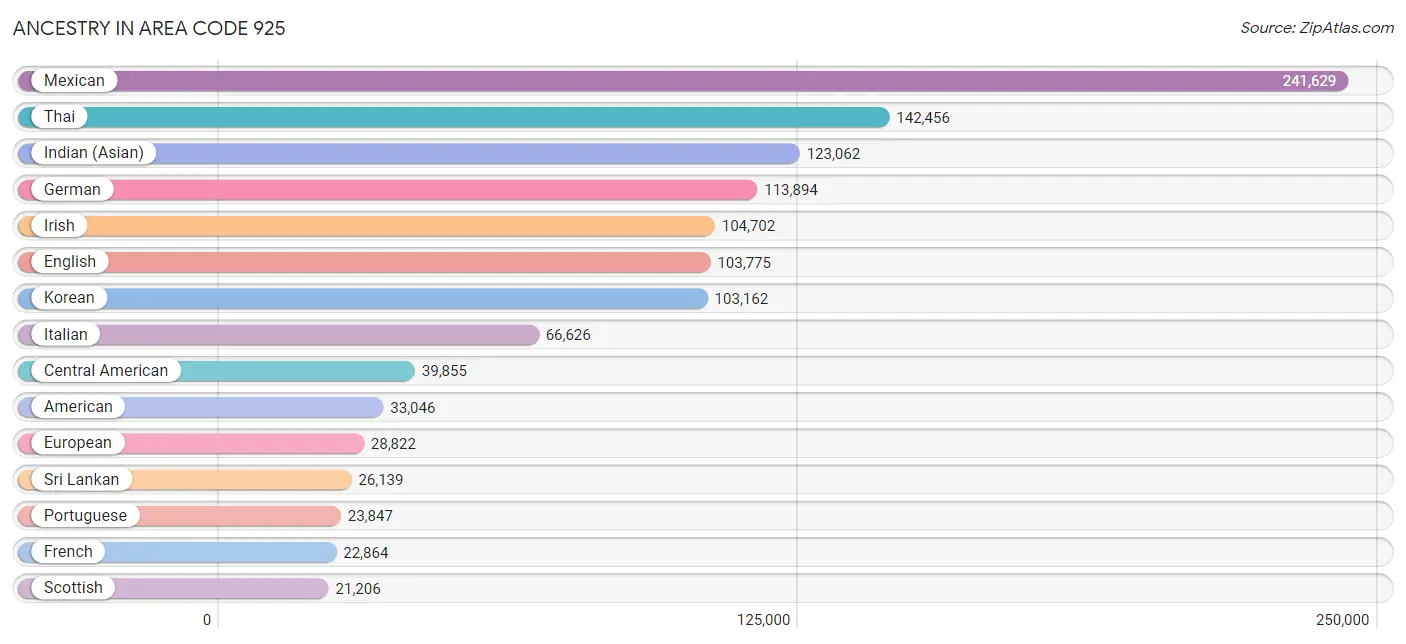
| Ancestry | # Population | % Population |
| Afghan | 10,548 | 0.7% |
| African | 5,171 | 0.4% |
| Alaska Native | 41 | 0.0% |
| Albanian | 196 | 0.0% |
| Aleut | 78 | 0.0% |
| Alsatian | 40 | 0.0% |
| American | 33,046 | 2.2% |
| Apache | 1,257 | 0.1% |
| Arab | 12,742 | 0.9% |
| Arapaho | 9 | 0.0% |
| Argentinean | 1,569 | 0.1% |
| Armenian | 2,501 | 0.2% |
| Assyrian / Chaldean / Syriac | 346 | 0.0% |
| Australian | 1,230 | 0.1% |
| Austrian | 2,597 | 0.2% |
| Bahamian | 12 | 0.0% |
| Bangladeshi | 629 | 0.0% |
| Barbadian | 99 | 0.0% |
| Basque | 615 | 0.0% |
| Belgian | 1,061 | 0.1% |
| Belizean | 363 | 0.0% |
| Bermudan | 11 | 0.0% |
| Bhutanese | 19,853 | 1.3% |
| Blackfeet | 1,534 | 0.1% |
| Bolivian | 730 | 0.1% |
| Brazilian | 1,904 | 0.1% |
| British | 9,516 | 0.6% |
| British West Indian | 45 | 0.0% |
| Bulgarian | 964 | 0.1% |
| Burmese | 20,870 | 1.4% |
| Cajun | 142 | 0.0% |
| Cambodian | 815 | 0.1% |
| Canadian | 2,270 | 0.2% |
| Cape Verdean | 195 | 0.0% |
| Carpatho Rusyn | 39 | 0.0% |
| Celtic | 247 | 0.0% |
| Central American | 39,855 | 2.7% |
| Central American Indian | 2,754 | 0.2% |
| Cherokee | 4,525 | 0.3% |
| Chickasaw | 188 | 0.0% |
| Chilean | 982 | 0.1% |
| Chinese | 41 | 0.0% |
| Chippewa | 145 | 0.0% |
| Choctaw | 1,297 | 0.1% |
| Colombian | 4,688 | 0.3% |
| Comanche | 51 | 0.0% |
| Costa Rican | 713 | 0.1% |
| Cree | 30 | 0.0% |
| Creek | 653 | 0.0% |
| Croatian | 2,241 | 0.2% |
| Crow | 14 | 0.0% |
| Cuban | 2,515 | 0.2% |
| Cypriot | 27 | 0.0% |
| Czech | 2,988 | 0.2% |
| Czechoslovakian | 685 | 0.1% |
| Danish | 7,015 | 0.5% |
| Delaware | 8 | 0.0% |
| Dominican | 1,130 | 0.1% |
| Dutch | 10,270 | 0.7% |
| Dutch West Indian | 42 | 0.0% |
| Eastern European | 4,777 | 0.3% |
| Ecuadorian | 1,057 | 0.1% |
| Egyptian | 2,843 | 0.2% |
| English | 103,775 | 7.0% |
| Estonian | 173 | 0.0% |
| Ethiopian | 2,134 | 0.1% |
| European | 28,822 | 1.9% |
| Fijian | 74 | 0.0% |
| Filipino | 8,068 | 0.5% |
| Finnish | 3,040 | 0.2% |
| French | 22,864 | 1.5% |
| French American Indian | 27 | 0.0% |
| French Canadian | 3,571 | 0.2% |
| German | 113,894 | 7.7% |
| German Russian | 70 | 0.0% |
| Ghanaian | 558 | 0.0% |
| Greek | 5,786 | 0.4% |
| Guamanian / Chamorro | 2,282 | 0.2% |
| Guatemalan | 6,474 | 0.4% |
| Guyanese | 37 | 0.0% |
| Haitian | 714 | 0.1% |
| Honduran | 1,656 | 0.1% |
| Hopi | 80 | 0.0% |
| Houma | 26 | 0.0% |
| Hungarian | 3,692 | 0.3% |
| Icelander | 219 | 0.0% |
| Indian (Asian) | 123,062 | 8.3% |
| Indonesian | 2,530 | 0.2% |
| Inupiat | 28 | 0.0% |
| Iranian | 9,862 | 0.7% |
| Iraqi | 312 | 0.0% |
| Irish | 104,702 | 7.0% |
| Iroquois | 384 | 0.0% |
| Israeli | 773 | 0.1% |
| Italian | 66,626 | 4.5% |
| Jamaican | 2,091 | 0.1% |
| Japanese | 2,215 | 0.2% |
| Jordanian | 392 | 0.0% |
| Kenyan | 468 | 0.0% |
| Korean | 103,162 | 6.9% |
| Laotian | 3,272 | 0.2% |
| Latvian | 397 | 0.0% |
| Lebanese | 1,881 | 0.1% |
| Liberian | 275 | 0.0% |
| Lithuanian | 1,708 | 0.1% |
| Luxembourger | 40 | 0.0% |
| Macedonian | 65 | 0.0% |
| Malaysian | 1,287 | 0.1% |
| Maltese | 488 | 0.0% |
| Mexican | 241,629 | 16.3% |
| Mexican American Indian | 4,459 | 0.3% |
| Mongolian | 566 | 0.0% |
| Moroccan | 565 | 0.0% |
| Native Hawaiian | 5,525 | 0.4% |
| Navajo | 523 | 0.0% |
| Nepalese | 165 | 0.0% |
| New Zealander | 115 | 0.0% |
| Nicaraguan | 8,977 | 0.6% |
| Nigerian | 3,339 | 0.2% |
| Northern European | 3,901 | 0.3% |
| Norwegian | 14,731 | 1.0% |
| Okinawan | 178 | 0.0% |
| Osage | 13 | 0.0% |
| Ottawa | 20 | 0.0% |
| Paiute | 46 | 0.0% |
| Pakistani | 2,134 | 0.1% |
| Palestinian | 923 | 0.1% |
| Panamanian | 1,097 | 0.1% |
| Paraguayan | 59 | 0.0% |
| Pennsylvania German | 275 | 0.0% |
| Peruvian | 8,480 | 0.6% |
| Pima | 62 | 0.0% |
| Polish | 16,200 | 1.1% |
| Portuguese | 23,847 | 1.6% |
| Potawatomi | 47 | 0.0% |
| Pueblo | 239 | 0.0% |
| Puerto Rican | 12,920 | 0.9% |
| Puget Sound Salish | 18 | 0.0% |
| Romanian | 1,916 | 0.1% |
| Russian | 13,012 | 0.9% |
| Salvadoran | 20,646 | 1.4% |
| Samoan | 4,008 | 0.3% |
| Scandinavian | 3,599 | 0.2% |
| Scotch-Irish | 8,572 | 0.6% |
| Scottish | 21,206 | 1.4% |
| Seminole | 193 | 0.0% |
| Senegalese | 44 | 0.0% |
| Serbian | 770 | 0.1% |
| Shoshone | 8 | 0.0% |
| Sioux | 194 | 0.0% |
| Slavic | 606 | 0.0% |
| Slovak | 719 | 0.1% |
| Slovene | 545 | 0.0% |
| South African | 511 | 0.0% |
| South American | 19,188 | 1.3% |
| South American Indian | 517 | 0.0% |
| Soviet Union | 34 | 0.0% |
| Spaniard | 8,197 | 0.5% |
| Spanish | 6,870 | 0.5% |
| Spanish American | 391 | 0.0% |
| Spanish American Indian | 188 | 0.0% |
| Sri Lankan | 26,139 | 1.8% |
| Subsaharan African | 13,914 | 0.9% |
| Sudanese | 176 | 0.0% |
| Swedish | 14,067 | 0.9% |
| Swiss | 4,182 | 0.3% |
| Syrian | 625 | 0.0% |
| Thai | 142,456 | 9.6% |
| Tlingit-Haida | 37 | 0.0% |
| Tohono O'Odham | 130 | 0.0% |
| Tongan | 1,625 | 0.1% |
| Trinidadian and Tobagonian | 278 | 0.0% |
| Turkish | 1,890 | 0.1% |
| U.S. Virgin Islander | 55 | 0.0% |
| Ugandan | 12 | 0.0% |
| Ukrainian | 4,462 | 0.3% |
| Uruguayan | 174 | 0.0% |
| Ute | 49 | 0.0% |
| Venezuelan | 1,130 | 0.1% |
| Vietnamese | 945 | 0.1% |
| Welsh | 6,631 | 0.4% |
| West Indian | 271 | 0.0% |
| Yaqui | 560 | 0.0% |
| Yugoslavian | 1,101 | 0.1% |
| Yup'ik | 19 | 0.0% |
| Zimbabwean | 11 | 0.0% | View All 186 Rows |
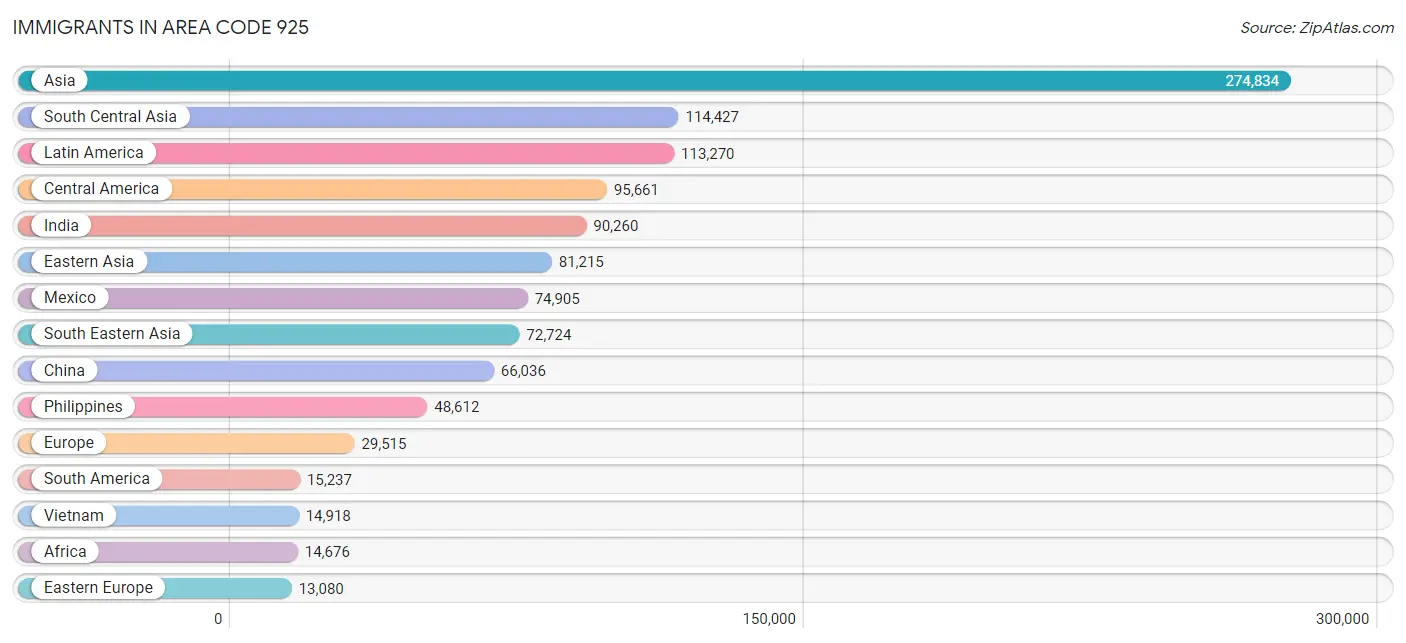
Immigrants in Area Code 925
The most numerous immigrant groups reported in Area Code 925 came from Asia (274,834 | 18.5%), South Central Asia (114,427 | 7.7%), Latin America (113,270 | 7.6%), Central America (95,661 | 6.4%), and India (90,260 | 6.1%), together accounting for 46.3% of all Area Code 925 residents.
| Immigration Origin | # Population | % Population |
| Afghanistan | 8,538 | 0.6% |
| Africa | 14,676 | 1.0% |
| Argentina | 1,005 | 0.1% |
| Armenia | 296 | 0.0% |
| Asia | 274,834 | 18.5% |
| Australia | 939 | 0.1% |
| Austria | 181 | 0.0% |
| Azores | 173 | 0.0% |
| Bangladesh | 1,504 | 0.1% |
| Barbados | 70 | 0.0% |
| Belarus | 684 | 0.1% |
| Belgium | 235 | 0.0% |
| Belize | 139 | 0.0% |
| Bolivia | 312 | 0.0% |
| Bosnia and Herzegovina | 343 | 0.0% |
| Brazil | 2,636 | 0.2% |
| Bulgaria | 779 | 0.1% |
| Cambodia | 627 | 0.0% |
| Cameroon | 595 | 0.0% |
| Canada | 5,153 | 0.4% |
| Caribbean | 2,372 | 0.2% |
| Central America | 95,661 | 6.4% |
| Chile | 653 | 0.0% |
| China | 66,036 | 4.4% |
| Colombia | 2,436 | 0.2% |
| Congo | 51 | 0.0% |
| Costa Rica | 337 | 0.0% |
| Croatia | 480 | 0.0% |
| Cuba | 349 | 0.0% |
| Czechoslovakia | 402 | 0.0% |
| Denmark | 374 | 0.0% |
| Dominican Republic | 223 | 0.0% |
| Eastern Africa | 3,618 | 0.2% |
| Eastern Asia | 81,215 | 5.5% |
| Eastern Europe | 13,080 | 0.9% |
| Ecuador | 366 | 0.0% |
| Egypt | 2,500 | 0.2% |
| El Salvador | 10,488 | 0.7% |
| England | 2,241 | 0.2% |
| Eritrea | 462 | 0.0% |
| Ethiopia | 1,630 | 0.1% |
| Europe | 29,515 | 2.0% |
| Fiji | 3,894 | 0.3% |
| France | 1,447 | 0.1% |
| Germany | 2,952 | 0.2% |
| Ghana | 892 | 0.1% |
| Greece | 395 | 0.0% |
| Guatemala | 4,018 | 0.3% |
| Guyana | 70 | 0.0% |
| Haiti | 376 | 0.0% |
| Honduras | 969 | 0.1% |
| Hong Kong | 8,576 | 0.6% |
| Hungary | 428 | 0.0% |
| India | 90,260 | 6.1% |
| Indonesia | 2,044 | 0.1% |
| Iran | 7,266 | 0.5% |
| Iraq | 417 | 0.0% |
| Ireland | 724 | 0.1% |
| Israel | 1,140 | 0.1% |
| Italy | 926 | 0.1% |
| Jamaica | 1,084 | 0.1% |
| Japan | 2,940 | 0.2% |
| Jordan | 506 | 0.0% |
| Kazakhstan | 456 | 0.0% |
| Kenya | 806 | 0.1% |
| Korea | 11,626 | 0.8% |
| Kuwait | 252 | 0.0% |
| Laos | 599 | 0.0% |
| Latin America | 113,270 | 7.6% |
| Latvia | 199 | 0.0% |
| Lebanon | 853 | 0.1% |
| Liberia | 459 | 0.0% |
| Lithuania | 131 | 0.0% |
| Malaysia | 1,437 | 0.1% |
| Mexico | 74,905 | 5.0% |
| Micronesia | 63 | 0.0% |
| Middle Africa | 1,176 | 0.1% |
| Moldova | 304 | 0.0% |
| Morocco | 414 | 0.0% |
| Nepal | 852 | 0.1% |
| Netherlands | 766 | 0.1% |
| Nicaragua | 4,120 | 0.3% |
| Nigeria | 2,473 | 0.2% |
| Northern Africa | 4,441 | 0.3% |
| Northern Europe | 7,023 | 0.5% |
| Norway | 64 | 0.0% |
| Oceania | 6,534 | 0.4% |
| Pakistan | 4,375 | 0.3% |
| Panama | 625 | 0.0% |
| Peru | 6,449 | 0.4% |
| Philippines | 48,612 | 3.3% |
| Poland | 1,281 | 0.1% |
| Portugal | 1,277 | 0.1% |
| Romania | 797 | 0.1% |
| Russia | 3,637 | 0.2% |
| Saudi Arabia | 307 | 0.0% |
| Scotland | 416 | 0.0% |
| Senegal | 33 | 0.0% |
| Serbia | 87 | 0.0% |
| Sierra Leone | 14 | 0.0% |
| Singapore | 650 | 0.0% |
| South Africa | 807 | 0.1% |
| South America | 15,237 | 1.0% |
| South Central Asia | 114,427 | 7.7% |
| South Eastern Asia | 72,724 | 4.9% |
| Southern Europe | 3,269 | 0.2% |
| Spain | 540 | 0.0% |
| Sri Lanka | 692 | 0.1% |
| Sudan | 125 | 0.0% |
| Sweden | 185 | 0.0% |
| Switzerland | 476 | 0.0% |
| Syria | 76 | 0.0% |
| Taiwan | 12,554 | 0.9% |
| Thailand | 1,390 | 0.1% |
| Trinidad and Tobago | 226 | 0.0% |
| Turkey | 938 | 0.1% |
| Uganda | 283 | 0.0% |
| Ukraine | 2,712 | 0.2% |
| Uruguay | 65 | 0.0% |
| Uzbekistan | 386 | 0.0% |
| Venezuela | 982 | 0.1% |
| Vietnam | 14,918 | 1.0% |
| Western Africa | 4,293 | 0.3% |
| Western Asia | 5,760 | 0.4% |
| Western Europe | 6,057 | 0.4% |
| Yemen | 213 | 0.0% |
| Zaire | 29 | 0.0% |
| Zimbabwe | 32 | 0.0% | View All 128 Rows |
Sex and Age in Area Code 925
Sex and Age in Area Code 925
The most populous age groups in Area Code 925 are 35 to 39 Years (57,248 | 7.7%) for men and 35 to 39 Years (54,716 | 7.3%) for women.
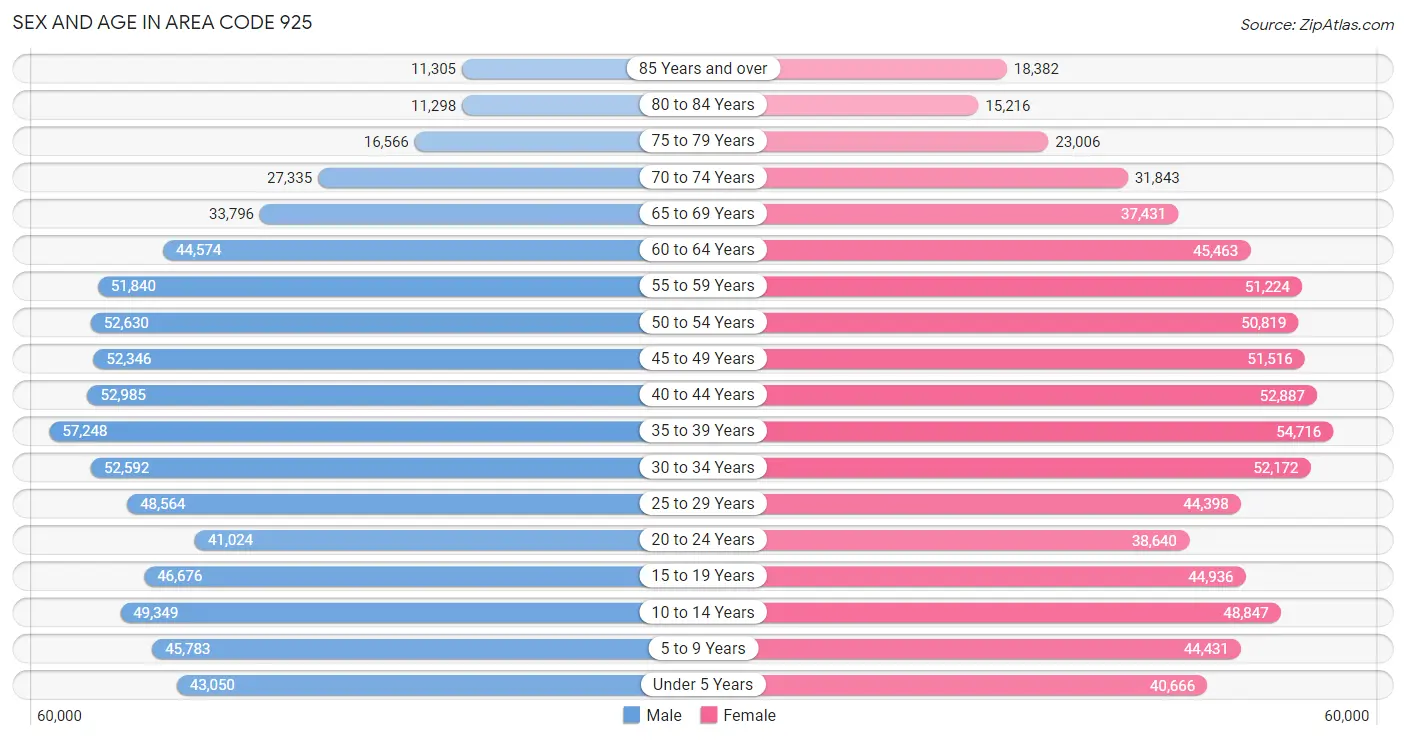
| Age Bracket | Male | Female |
| Under 5 Years | 43,050 (5.8%) | 40,666 (5.4%) |
| 5 to 9 Years | 45,783 (6.2%) | 44,431 (5.9%) |
| 10 to 14 Years | 49,349 (6.7%) | 48,847 (6.5%) |
| 15 to 19 Years | 46,676 (6.3%) | 44,936 (6.0%) |
| 20 to 24 Years | 41,024 (5.6%) | 38,640 (5.2%) |
| 25 to 29 Years | 48,564 (6.6%) | 44,398 (5.9%) |
| 30 to 34 Years | 52,592 (7.1%) | 52,172 (7.0%) |
| 35 to 39 Years | 57,248 (7.7%) | 54,716 (7.3%) |
| 40 to 44 Years | 52,985 (7.2%) | 52,887 (7.1%) |
| 45 to 49 Years | 52,346 (7.1%) | 51,516 (6.9%) |
| 50 to 54 Years | 52,630 (7.1%) | 50,819 (6.8%) |
| 55 to 59 Years | 51,840 (7.0%) | 51,224 (6.9%) |
| 60 to 64 Years | 44,574 (6.0%) | 45,463 (6.1%) |
| 65 to 69 Years | 33,796 (4.6%) | 37,431 (5.0%) |
| 70 to 74 Years | 27,335 (3.7%) | 31,843 (4.3%) |
| 75 to 79 Years | 16,566 (2.2%) | 23,006 (3.1%) |
| 80 to 84 Years | 11,298 (1.5%) | 15,216 (2.0%) |
| 85 Years and over | 11,305 (1.5%) | 18,382 (2.5%) |
| Total | 738,961 (100.0%) | 746,593 (100.0%) |
Families and Households in Area Code 925
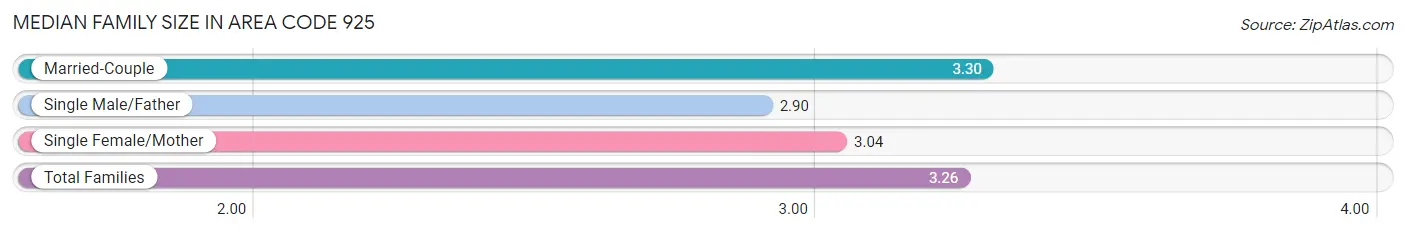
Median Family Size in Area Code 925
The median family size in Area Code 925 is 3.26 persons per family, with married-couple families (295,003 | 79.0%) accounting for the largest median family size of 3.29837 persons per family. On the other hand, single male/father families (24,372 | 6.5%) represent the smallest median family size with 2.90 persons per family.
| Family Type | # Families | Family Size |
| Married-Couple | 295,003 (79.0%) | 3.30 |
| Single Male/Father | 24,372 (6.5%) | 2.90 |
| Single Female/Mother | 53,880 (14.4%) | 3.04 |
| Total Families | 373,255 (100.0%) | 3.26 |
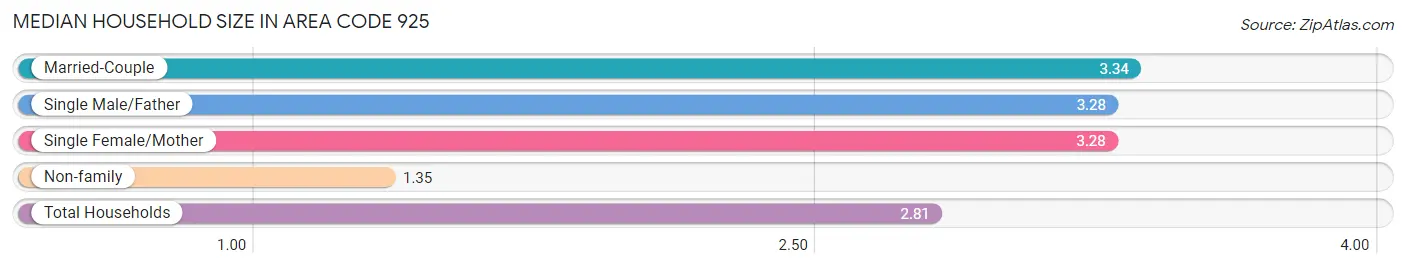
Median Household Size in Area Code 925
The median household size in Area Code 925 is 2.81 persons per household, with married-couple households (295,003 | 57.4%) accounting for the largest median household size of 3.34108 persons per household. non-family households (140,559 | 27.4%) represent the smallest median household size with 1.35 persons per household.
| Household Type | # Households | Household Size |
| Married-Couple | 295,003 (57.4%) | 3.34 |
| Single Male/Father | 24,372 (4.7%) | 3.28 |
| Single Female/Mother | 53,880 (10.5%) | 3.28 |
| Non-family | 140,559 (27.4%) | 1.35 |
| Total Households | 513,814 (100.0%) | 2.81 |
Household Size by Marriage Status in Area Code 925
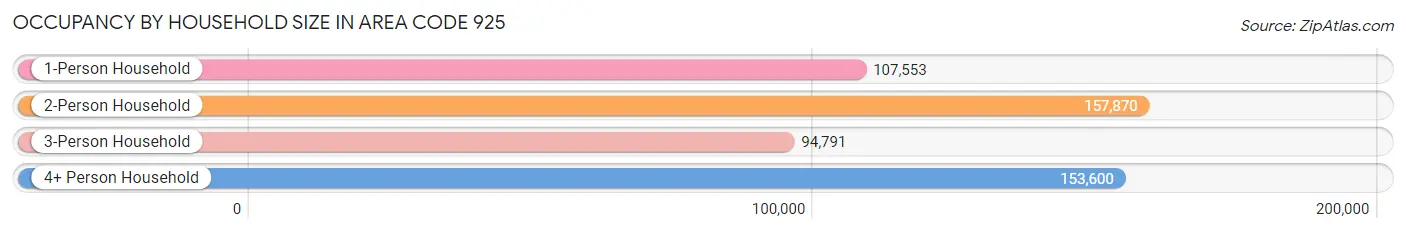
Out of a total of 513,814 households in Area Code 925, 373,255 (72.6%) are family households, while 140,559 (27.4%) are nonfamily households. The most numerous type of family households are 2-person households, comprising 130,983, and the most common type of nonfamily households are 1-person households, comprising 107,553.
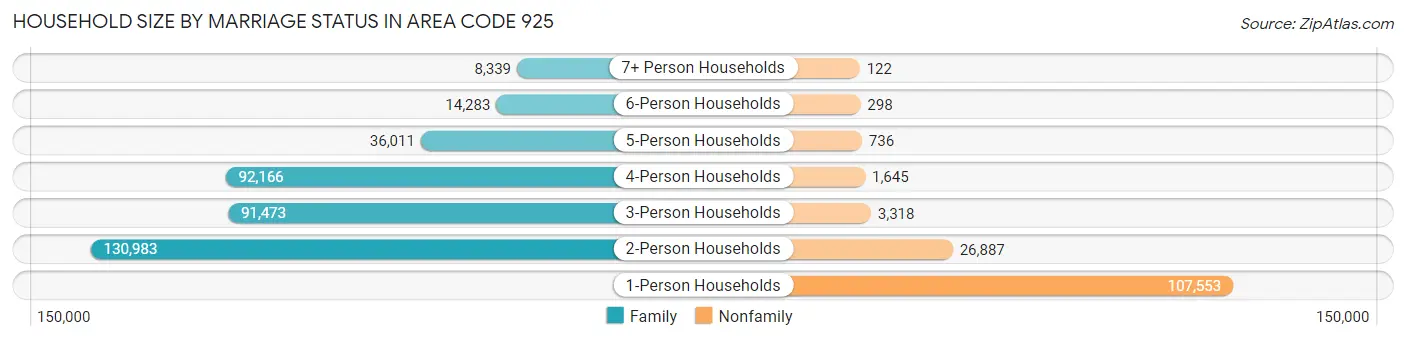
| Household Size | Family Households | Nonfamily Households |
| 1-Person Households | - | 107,553 (20.9%) |
| 2-Person Households | 130,983 (25.5%) | 26,887 (5.2%) |
| 3-Person Households | 91,473 (17.8%) | 3,318 (0.6%) |
| 4-Person Households | 92,166 (17.9%) | 1,645 (0.3%) |
| 5-Person Households | 36,011 (7.0%) | 736 (0.1%) |
| 6-Person Households | 14,283 (2.8%) | 298 (0.1%) |
| 7+ Person Households | 8,339 (1.6%) | 122 (0.0%) |
| Total | 373,255 (72.6%) | 140,559 (27.4%) |
Female Fertility in Area Code 925
Fertility by Age in Area Code 925
Average fertility rate in Area Code 925 is 52.5 births per 1,000 women. Women in the age bracket of 20 to 34 years have the highest fertility rate with 79.9 births per 1,000 women. Women in the age bracket of 20 to 34 years acount for 62.0% of all women with births.
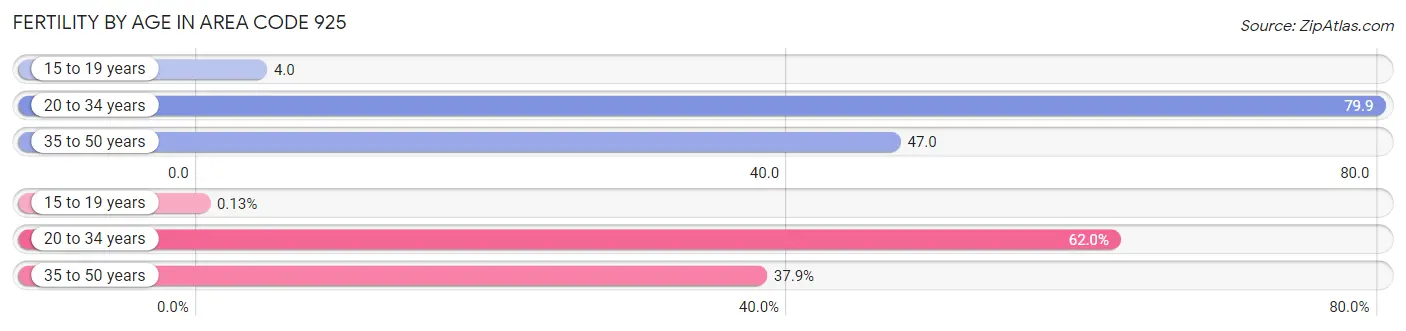
| Age Bracket | Women with Births | Births / 1,000 Women |
| 15 to 19 years | 23 (0.1%) | 4.0 |
| 20 to 34 years | 11,058 (62.0%) | 79.9 |
| 35 to 50 years | 6,770 (37.9%) | 47.0 |
| Total | 17,851 (100.0%) | 52.5 |
Fertility by Age by Marriage Status in Area Code 925
81.0% of women with births (17,851) in Area Code 925 are married. The highest percentage of unmarried women with births falls into 15 to 19 years age bracket with 100.0% of them unmarried at the time of birth, while the lowest percentage of unmarried women with births belong to 35 to 50 years age bracket with 16.7% of them unmarried.
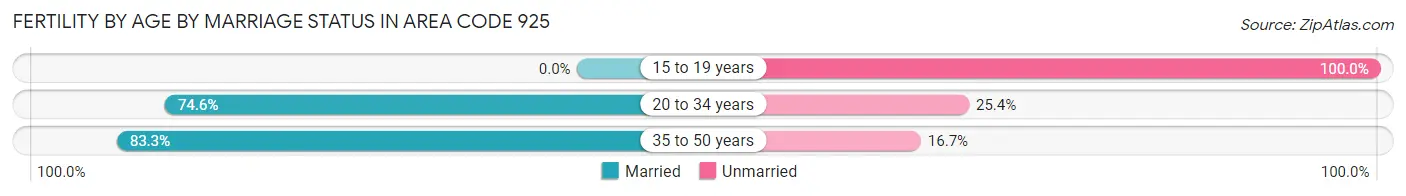
| Age Bracket | Married | Unmarried |
| 15 to 19 years | 0 (0.0%) | 23 (100.0%) |
| 20 to 34 years | 8,245 (74.6%) | 2,813 (25.4%) |
| 35 to 50 years | 5,639 (83.3%) | 1,131 (16.7%) |
| Total | 14,454 (81.0%) | 3,397 (19.0%) |
Fertility by Education in Area Code 925
Average fertility rate in Area Code 925 is 52.5 births per 1,000 women. Women with the education attainment of graduate degree have the highest fertility rate of 74.4 births per 1,000 women, while women with the education attainment of less than high school have the lowest fertility at 29.7 births per 1,000 women. Women with the education attainment of bachelor's degree represent 35.2% of all women with births.
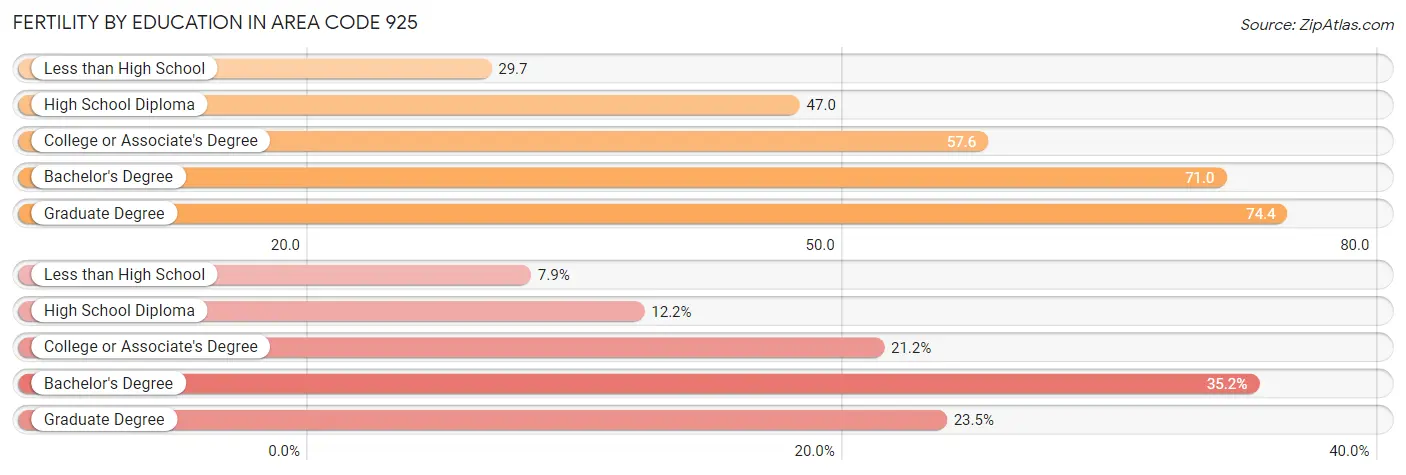
| Educational Attainment | Women with Births | Births / 1,000 Women |
| Less than High School | 1,416 (7.9%) | 29.7 |
| High School Diploma | 2,175 (12.2%) | 47.0 |
| College or Associate's Degree | 3,778 (21.2%) | 57.6 |
| Bachelor's Degree | 6,286 (35.2%) | 71.0 |
| Graduate Degree | 4,196 (23.5%) | 74.4 |
| Total | 17,851 (100.0%) | 52.5 |
Fertility by Education by Marriage Status in Area Code 925
19.0% of women with births in Area Code 925 are unmarried. Women with the educational attainment of bachelor's degree are most likely to be married with 79.0% of them married at childbirth, while women with the educational attainment of high school diploma are least likely to be married with 61.5% of them unmarried at childbirth.
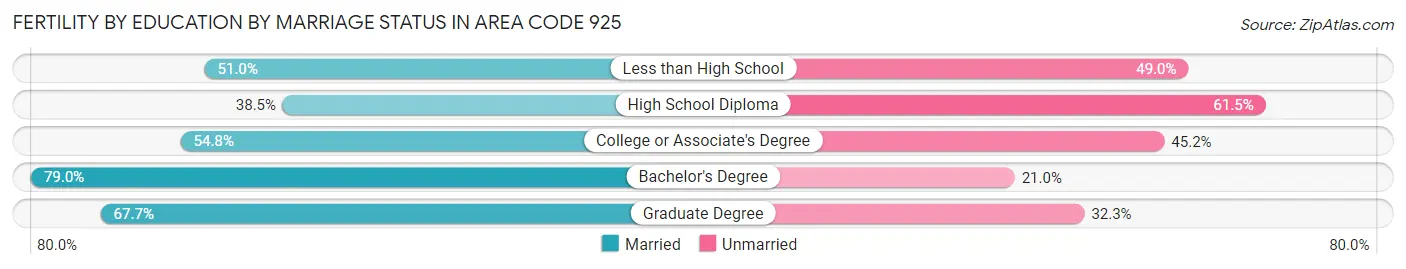
| Educational Attainment | Married | Unmarried |
| Less than High School | 722 (51.0%) | 694 (49.0%) |
| High School Diploma | 838 (38.5%) | 1,337 (61.5%) |
| College or Associate's Degree | 2,072 (54.8%) | 1,706 (45.2%) |
| Bachelor's Degree | 4,964 (79.0%) | 1,322 (21.0%) |
| Graduate Degree | 2,842 (67.7%) | 1,354 (32.3%) |
| Total | 14,454 (81.0%) | 3,397 (19.0%) |
Employment Characteristics in Area Code 925
Employment by Class of Employer in Area Code 925
Among the 712,474 employed individuals in Area Code 925, private company employees (494,576 | 69.4%), local government employees (57,176 | 8.0%), and not-for-profit organizations (53,575 | 7.5%) make up the most common classes of employment.
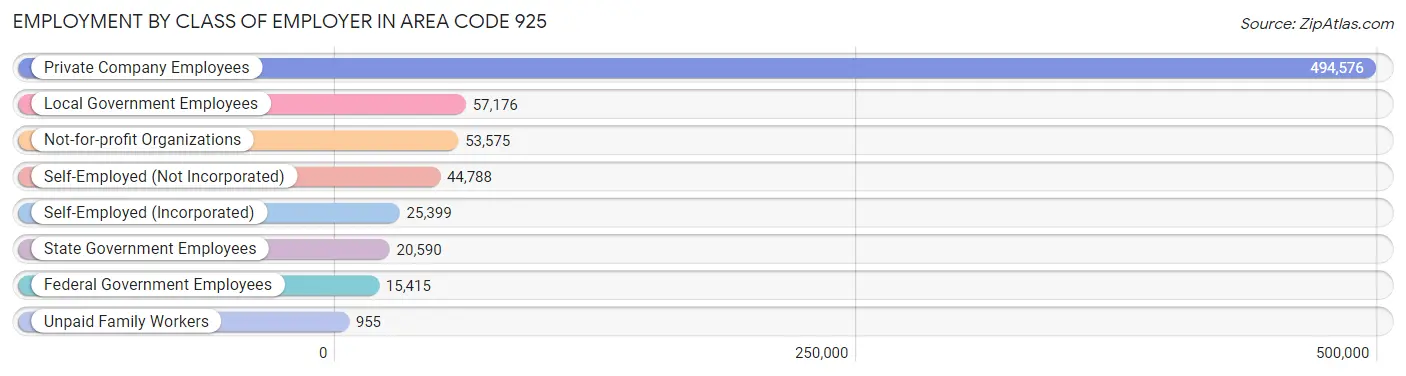
| Employer Class | # Employees | % Employees |
| Private Company Employees | 494,576 | 69.4% |
| Self-Employed (Incorporated) | 25,399 | 3.6% |
| Self-Employed (Not Incorporated) | 44,788 | 6.3% |
| Not-for-profit Organizations | 53,575 | 7.5% |
| Local Government Employees | 57,176 | 8.0% |
| State Government Employees | 20,590 | 2.9% |
| Federal Government Employees | 15,415 | 2.2% |
| Unpaid Family Workers | 955 | 0.1% |
| Total | 712,474 | 100.0% |
Employment Status by Age in Area Code 925
According to the labor force statistics for Area Code 925, out of the total population over 16 years of age (1,194,595), 64.0% or 764,899 individuals are in the labor force, with 5.2% or 39,775 of them unemployed. The age group with the highest labor force participation rate is 35 to 44 years, with 85.1% or 185,378 individuals in the labor force. Within the labor force, the 16 to 19 years age range has the highest percentage of unemployed individuals, with 436.5% or 100,325 of them being unemployed.
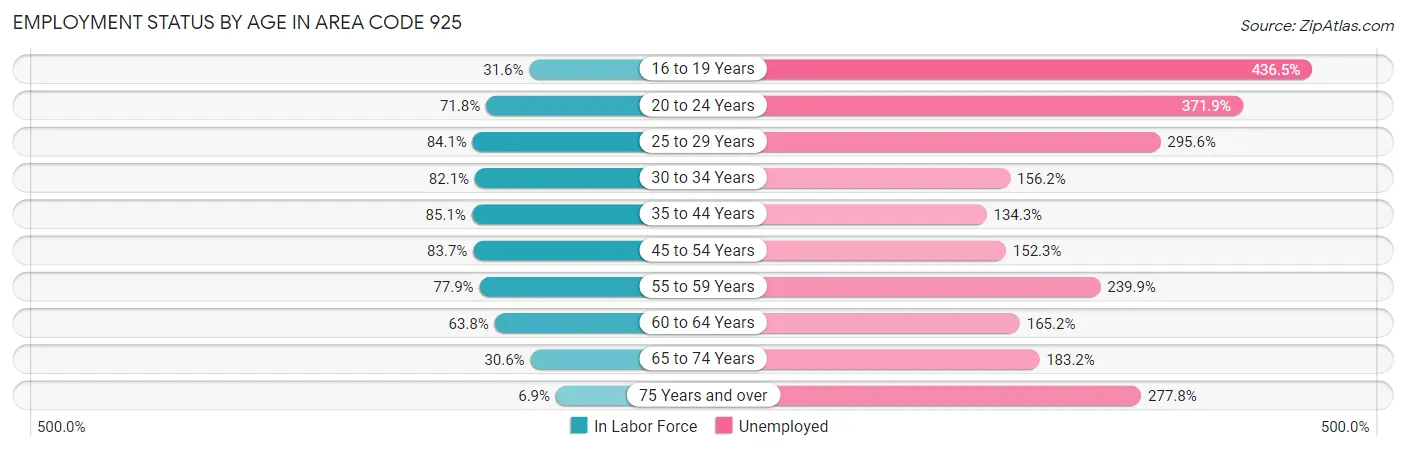
| Age Bracket | In Labor Force | Unemployed |
| 16 to 19 Years | 22,980 (31.6%) | 100,325 (436.5%) |
| 20 to 24 Years | 57,197 (71.8%) | 212,723 (371.9%) |
| 25 to 29 Years | 78,210 (84.1%) | 231,186 (295.6%) |
| 30 to 34 Years | 86,003 (82.1%) | 134,334 (156.2%) |
| 35 to 44 Years | 185,384 (85.1%) | 248,963 (134.3%) |
| 45 to 54 Years | 173,497 (83.7%) | 264,239 (152.3%) |
| 55 to 59 Years | 80,253 (77.9%) | 192,534 (239.9%) |
| 60 to 64 Years | 57,427 (63.8%) | 94,868 (165.2%) |
| 65 to 74 Years | 39,858 (30.6%) | 73,009 (183.2%) |
| 75 Years and over | 6,645 (6.9%) | 18,465 (277.8%) |
| Total | 764,855 (64.0%) | 39,775 (5.2%) |
Employment Status by Educational Attainment in Area Code 925
According to labor force statistics for Area Code 925, 79.6% of individuals (649,189) out of the total population between 25 and 64 years of age (815,974) are in the labor force, with 209.3% or 1,358,753 of them being unemployed. The group with the highest labor force participation rate are those with the educational attainment of bachelor's degree or higher, with 84.2% or 349,623 individuals in the labor force. Within the labor force, individuals with less than high school education have the highest percentage of unemployment, with 299.4% or 125,470 of them being unemployed.
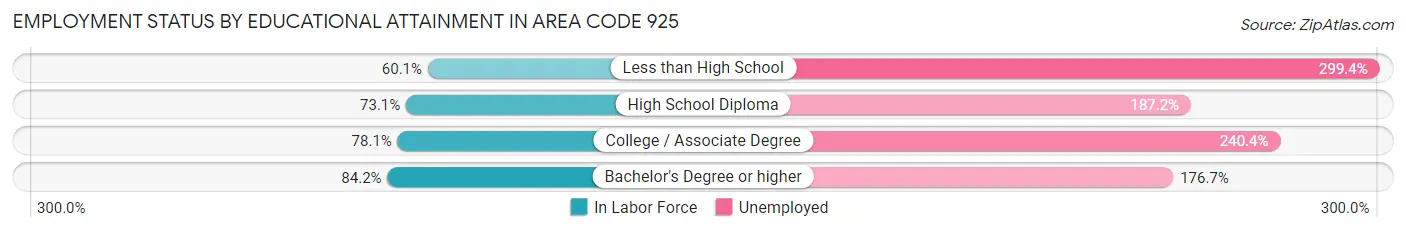
| Educational Attainment | In Labor Force | Unemployed |
| Less than High School | 41,905 (60.1%) | 208,628 (299.4%) |
| High School Diploma | 95,659 (73.1%) | 245,067 (187.2%) |
| College / Associate Degree | 156,334 (78.1%) | 481,163 (240.4%) |
| Bachelor's Degree or higher | 349,634 (84.2%) | 733,710 (176.7%) |
| Total | 649,193 (79.6%) | 1,707,834 (209.3%) |
Employment Occupations by Sex in Area Code 925
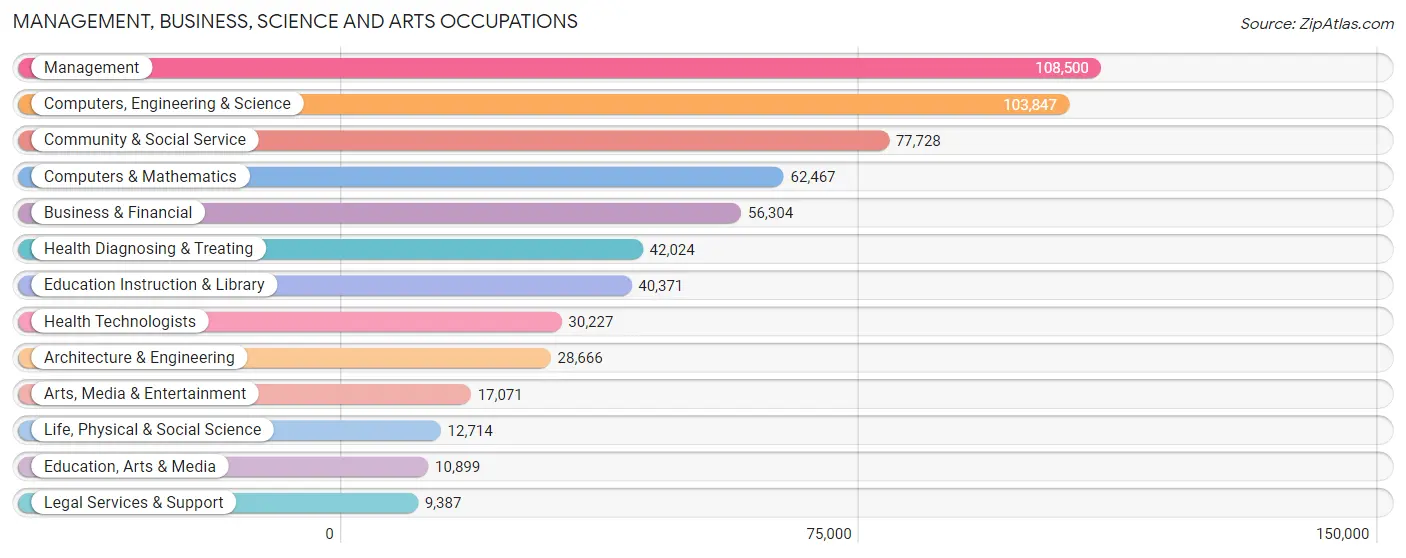
Management, Business, Science and Arts Occupations
The most common Management, Business, Science and Arts occupations in Area Code 925 are Management (108,500 | 14.5%), Computers, Engineering & Science (103,847 | 13.9%), Community & Social Service (77,728 | 10.4%), Computers & Mathematics (62,467 | 8.4%), and Business & Financial (56,304 | 7.5%).
Management, Business, Science and Arts Occupations by Sex
Within the Management, Business, Science and Arts occupations in Area Code 925, the most male-oriented occupations are Architecture & Engineering (81.1%), Computers & Mathematics (74.4%), and Computers, Engineering & Science (73.6%), while the most female-oriented occupations are Education Instruction & Library (73.7%), Health Technologists (72.5%), and Health Diagnosing & Treating (71.1%).
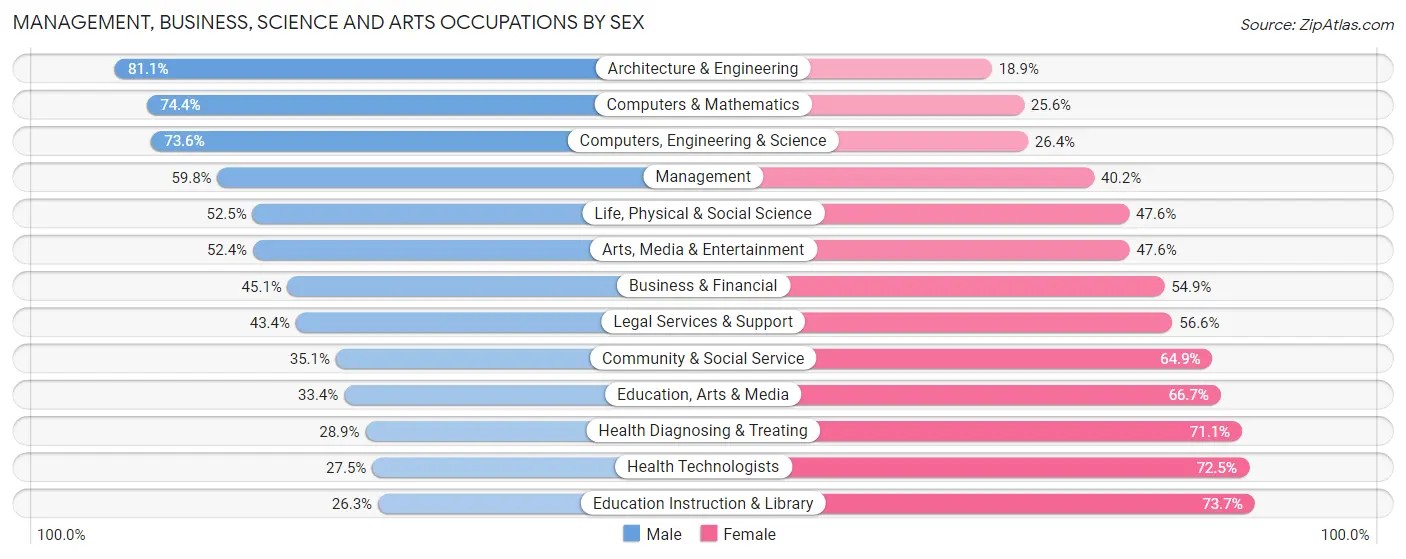
| Occupation | Male | Female |
| Management | 64,846 (59.8%) | 43,654 (40.2%) |
| Business & Financial | 25,412 (45.1%) | 30,892 (54.9%) |
| Computers, Engineering & Science | 76,395 (73.6%) | 27,452 (26.4%) |
| Computers & Mathematics | 46,477 (74.4%) | 15,990 (25.6%) |
| Architecture & Engineering | 23,250 (81.1%) | 5,416 (18.9%) |
| Life, Physical & Social Science | 6,668 (52.4%) | 6,046 (47.5%) |
| Community & Social Service | 27,270 (35.1%) | 50,458 (64.9%) |
| Education, Arts & Media | 3,635 (33.4%) | 7,264 (66.6%) |
| Legal Services & Support | 4,077 (43.4%) | 5,310 (56.6%) |
| Education Instruction & Library | 10,618 (26.3%) | 29,753 (73.7%) |
| Arts, Media & Entertainment | 8,940 (52.4%) | 8,131 (47.6%) |
| Health Diagnosing & Treating | 12,159 (28.9%) | 29,865 (71.1%) |
| Health Technologists | 8,311 (27.5%) | 21,916 (72.5%) |
| Total (Category) | 206,082 (53.1%) | 182,321 (46.9%) |
| Total (Overall) | 405,989 (54.4%) | 340,427 (45.6%) |
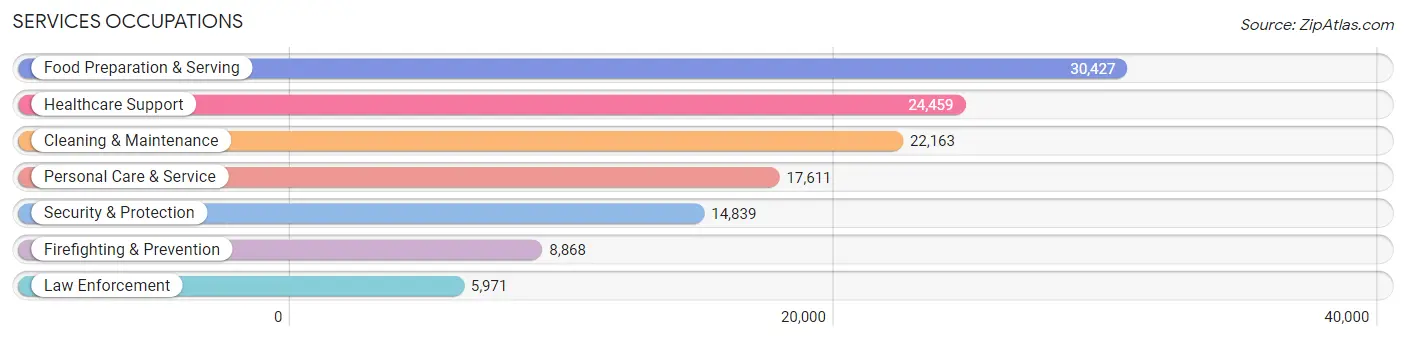
Services Occupations
The most common Services occupations in Area Code 925 are Food Preparation & Serving (30,427 | 4.1%), Healthcare Support (24,459 | 3.3%), Cleaning & Maintenance (22,163 | 3.0%), Personal Care & Service (17,611 | 2.4%), and Security & Protection (14,839 | 2.0%).
Services Occupations by Sex
Within the Services occupations in Area Code 925, the most male-oriented occupations are Law Enforcement (85.8%), Security & Protection (82.4%), and Firefighting & Prevention (80.2%), while the most female-oriented occupations are Personal Care & Service (78.3%), Healthcare Support (77.7%), and Food Preparation & Serving (51.2%).
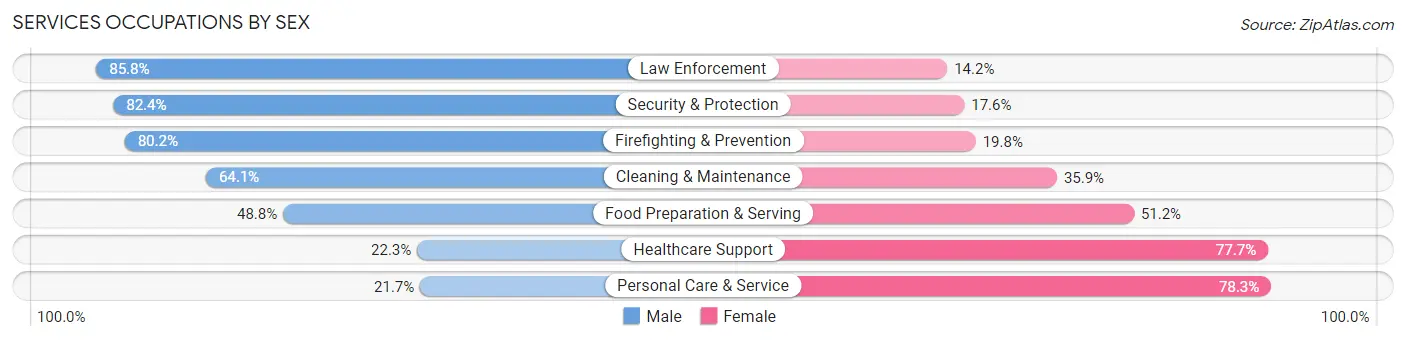
| Occupation | Male | Female |
| Healthcare Support | 5,450 (22.3%) | 19,009 (77.7%) |
| Security & Protection | 12,232 (82.4%) | 2,607 (17.6%) |
| Firefighting & Prevention | 7,109 (80.2%) | 1,759 (19.8%) |
| Law Enforcement | 5,123 (85.8%) | 848 (14.2%) |
| Food Preparation & Serving | 14,859 (48.8%) | 15,568 (51.2%) |
| Cleaning & Maintenance | 14,203 (64.1%) | 7,960 (35.9%) |
| Personal Care & Service | 3,818 (21.7%) | 13,793 (78.3%) |
| Total (Category) | 50,562 (46.2%) | 58,937 (53.8%) |
| Total (Overall) | 405,989 (54.4%) | 340,427 (45.6%) |
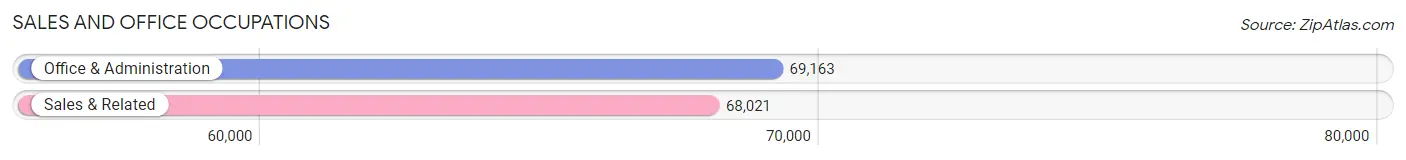
Sales and Office Occupations
The most common Sales and Office occupations in Area Code 925 are Office & Administration (69,163 | 9.3%), and Sales & Related (68,021 | 9.1%).
Sales and Office Occupations by Sex
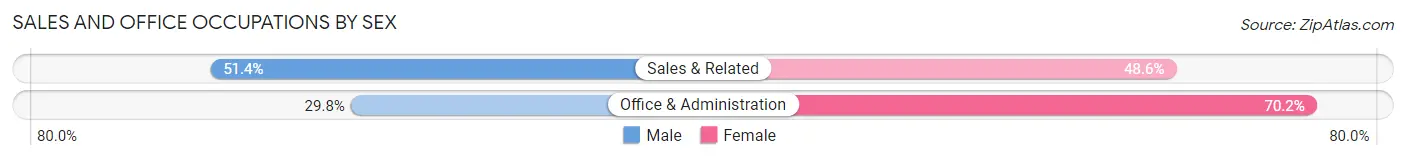
| Occupation | Male | Female |
| Sales & Related | 34,991 (51.4%) | 33,030 (48.6%) |
| Office & Administration | 20,640 (29.8%) | 48,523 (70.2%) |
| Total (Category) | 55,631 (40.6%) | 81,553 (59.5%) |
| Total (Overall) | 405,989 (54.4%) | 340,427 (45.6%) |
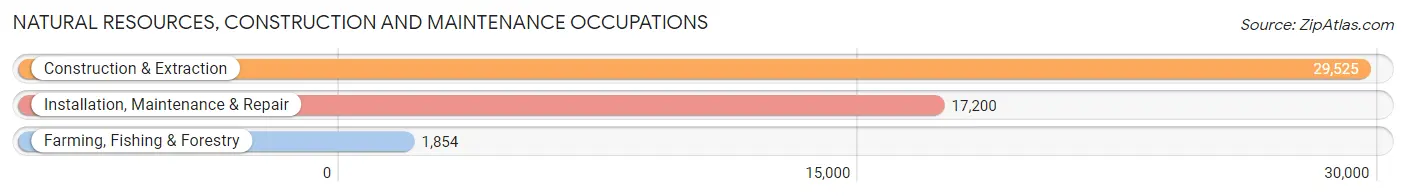
Natural Resources, Construction and Maintenance Occupations
The most common Natural Resources, Construction and Maintenance occupations in Area Code 925 are Construction & Extraction (29,525 | 4.0%), Installation, Maintenance & Repair (17,200 | 2.3%), and Farming, Fishing & Forestry (1,854 | 0.3%).
Natural Resources, Construction and Maintenance Occupations by Sex
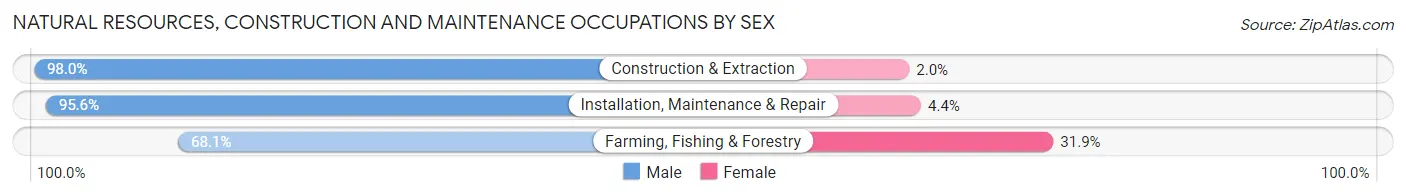
| Occupation | Male | Female |
| Farming, Fishing & Forestry | 1,262 (68.1%) | 592 (31.9%) |
| Construction & Extraction | 28,947 (98.0%) | 578 (2.0%) |
| Installation, Maintenance & Repair | 16,442 (95.6%) | 758 (4.4%) |
| Total (Category) | 46,651 (96.0%) | 1,928 (4.0%) |
| Total (Overall) | 405,989 (54.4%) | 340,427 (45.6%) |
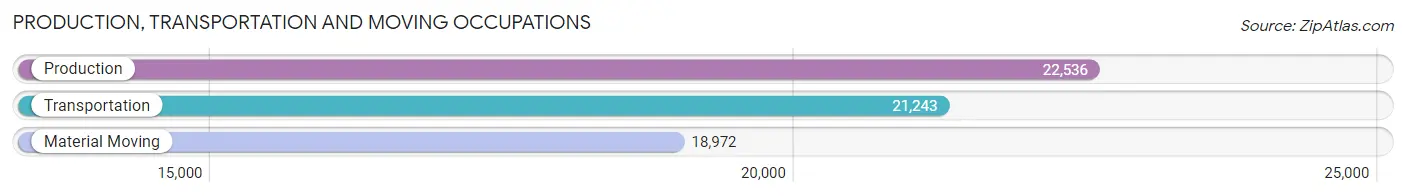
Production, Transportation and Moving Occupations
The most common Production, Transportation and Moving occupations in Area Code 925 are Production (22,536 | 3.0%), Transportation (21,243 | 2.9%), and Material Moving (18,972 | 2.5%).
Production, Transportation and Moving Occupations by Sex
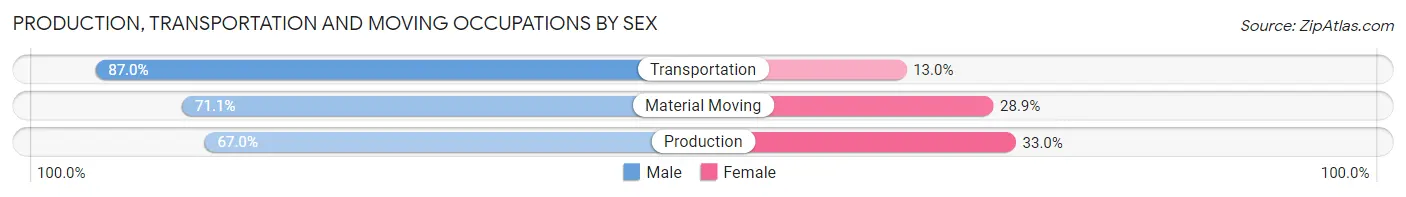
| Occupation | Male | Female |
| Production | 15,089 (67.0%) | 7,447 (33.0%) |
| Transportation | 18,487 (87.0%) | 2,756 (13.0%) |
| Material Moving | 13,487 (71.1%) | 5,485 (28.9%) |
| Total (Category) | 47,063 (75.0%) | 15,688 (25.0%) |
| Total (Overall) | 405,989 (54.4%) | 340,427 (45.6%) |
Employment Industries by Sex in Area Code 925
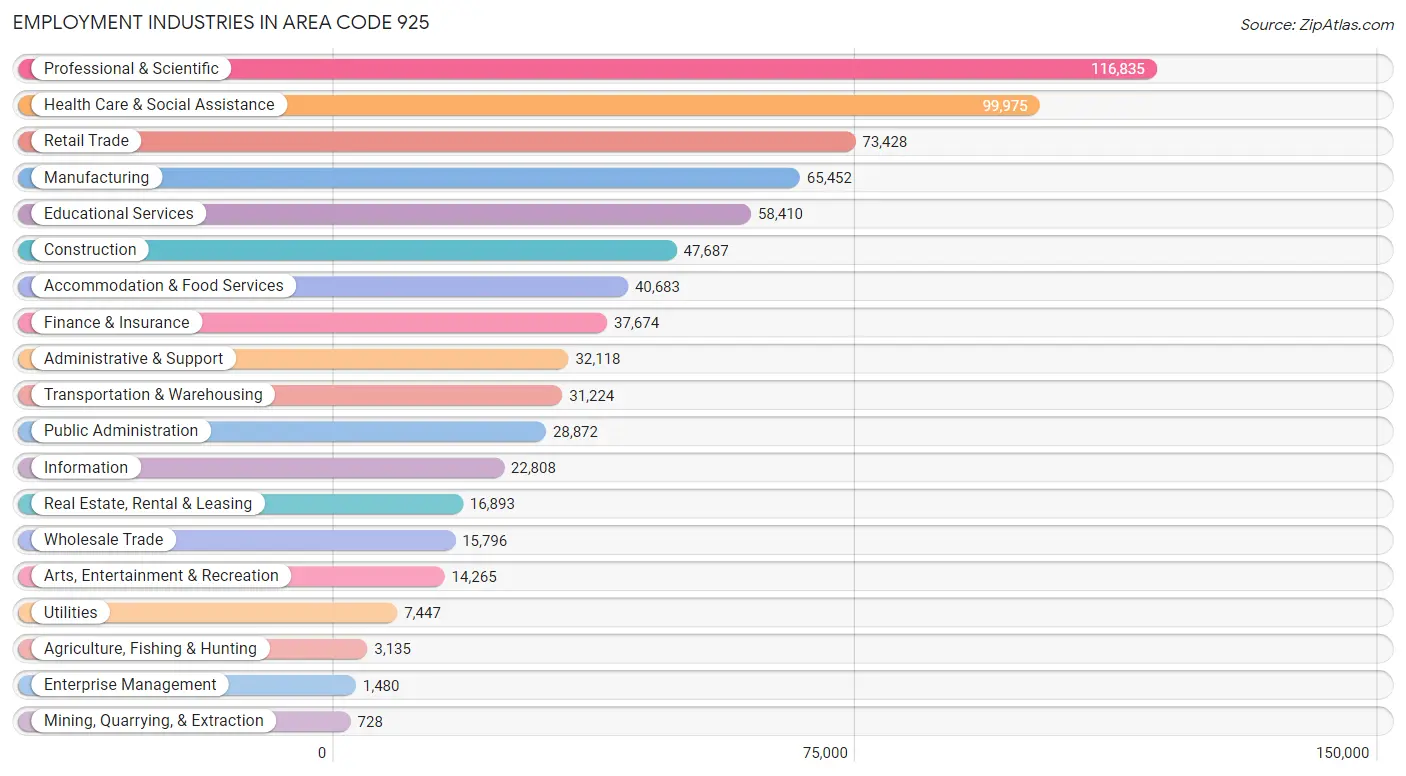
Employment Industries in Area Code 925
The major employment industries in Area Code 925 include Professional & Scientific (116,835 | 15.7%), Health Care & Social Assistance (99,975 | 13.4%), Retail Trade (73,428 | 9.8%), Manufacturing (65,452 | 8.8%), and Educational Services (58,410 | 7.8%).
Employment Industries by Sex in Area Code 925
The Area Code 925 industries that see more men than women are Construction (87.5%), Transportation & Warehousing (77.1%), and Mining, Quarrying, & Extraction (74.7%), whereas the industries that tend to have a higher number of women are Health Care & Social Assistance (72.0%), Educational Services (68.9%), and Finance & Insurance (53.7%).
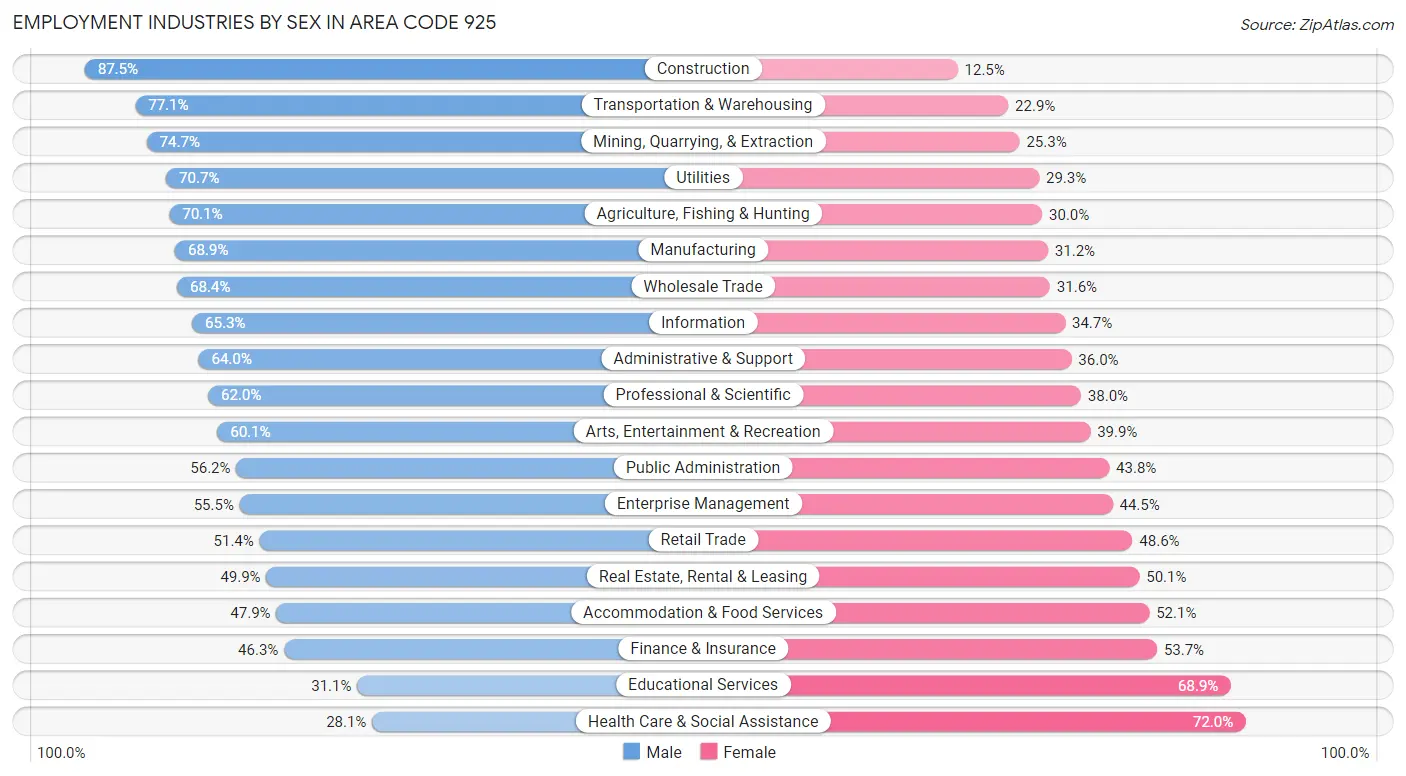
| Industry | Male | Female |
| Agriculture, Fishing & Hunting | 2,196 (70.1%) | 939 (29.9%) |
| Mining, Quarrying, & Extraction | 544 (74.7%) | 184 (25.3%) |
| Construction | 41,747 (87.5%) | 5,940 (12.5%) |
| Manufacturing | 45,062 (68.9%) | 20,390 (31.1%) |
| Wholesale Trade | 10,810 (68.4%) | 4,986 (31.6%) |
| Retail Trade | 37,714 (51.4%) | 35,714 (48.6%) |
| Transportation & Warehousing | 24,068 (77.1%) | 7,156 (22.9%) |
| Utilities | 5,264 (70.7%) | 2,183 (29.3%) |
| Information | 14,897 (65.3%) | 7,911 (34.7%) |
| Finance & Insurance | 17,434 (46.3%) | 20,240 (53.7%) |
| Real Estate, Rental & Leasing | 8,437 (49.9%) | 8,456 (50.1%) |
| Professional & Scientific | 72,459 (62.0%) | 44,376 (38.0%) |
| Enterprise Management | 821 (55.5%) | 659 (44.5%) |
| Administrative & Support | 20,552 (64.0%) | 11,566 (36.0%) |
| Educational Services | 18,186 (31.1%) | 40,224 (68.9%) |
| Health Care & Social Assistance | 28,042 (28.1%) | 71,933 (72.0%) |
| Arts, Entertainment & Recreation | 8,573 (60.1%) | 5,692 (39.9%) |
| Accommodation & Food Services | 19,477 (47.9%) | 21,206 (52.1%) |
| Public Administration | 16,217 (56.2%) | 12,655 (43.8%) |
| Total | 405,989 (54.4%) | 340,427 (45.6%) |
Education in Area Code 925
School Enrollment in Area Code 925
The most common levels of schooling among the 368,937 students in Area Code 925 are high school (81,286 | 22.0%), college / undergraduate (78,811 | 21.4%), and middle school (75,784 | 20.5%).
| School Level | # Students | % Students |
| Nursery / Preschool | 23,180 | 6.3% |
| Kindergarten | 18,871 | 5.1% |
| Elementary School | 70,982 | 19.2% |
| Middle School | 75,784 | 20.5% |
| High School | 81,286 | 22.0% |
| College / Undergraduate | 78,811 | 21.4% |
| Graduate / Professional | 20,023 | 5.4% |
| Total | 368,937 | 100.0% |
School Enrollment by Age by Funding Source in Area Code 925
Out of a total of 368,937 students who are enrolled in schools in Area Code 925, 59,398 (16.1%) attend a private institution, while the remaining 309,539 (83.9%) are enrolled in public schools. The age group of 3 to 4 year olds has the highest likelihood of being enrolled in private schools, with 11,382 (60.9% in the age bracket) enrolled. Conversely, the age group of 15 to 17 year olds has the lowest likelihood of being enrolled in a private school, with 53,081 (91.5% in the age bracket) attending a public institution.
| Age Bracket | Public School | Private School |
| 3 to 4 Year Olds | 7,304 (39.1%) | 11,382 (60.9%) |
| 5 to 9 Year Old | 74,637 (86.4%) | 11,719 (13.6%) |
| 10 to 14 Year Olds | 87,632 (91.0%) | 8,642 (9.0%) |
| 15 to 17 Year Olds | 53,081 (91.5%) | 4,905 (8.5%) |
| 18 to 19 Year Olds | 23,068 (87.1%) | 3,423 (12.9%) |
| 20 to 24 Year Olds | 31,209 (83.5%) | 6,183 (16.5%) |
| 25 to 34 Year Olds | 18,449 (74.5%) | 6,300 (25.5%) |
| 35 Years and over | 14,186 (67.5%) | 6,817 (32.5%) |
| Total | 309,539 (83.9%) | 59,398 (16.1%) |
Educational Attainment by Field of Study in Area Code 925
Business (96,868 | 17.8%), engineering (80,505 | 14.8%), computers & mathematics (52,206 | 9.6%), social sciences (48,244 | 8.8%), and science & technology (45,038 | 8.3%) are the most common fields of study among 545,318 individuals in Area Code 925 who have obtained a bachelor's degree or higher.
| Field of Study | # Graduates | % Graduates |
| Computers & Mathematics | 52,206 | 9.6% |
| Bio, Nature & Agricultural | 36,167 | 6.6% |
| Physical & Health Sciences | 21,593 | 4.0% |
| Psychology | 25,717 | 4.7% |
| Social Sciences | 48,244 | 8.8% |
| Engineering | 80,505 | 14.8% |
| Multidisciplinary Studies | 4,161 | 0.8% |
| Science & Technology | 45,038 | 8.3% |
| Business | 96,868 | 17.8% |
| Education | 24,446 | 4.5% |
| Literature & Languages | 21,973 | 4.0% |
| Liberal Arts & History | 23,440 | 4.3% |
| Visual & Performing Arts | 19,263 | 3.5% |
| Communications | 20,441 | 3.7% |
| Arts & Humanities | 25,256 | 4.6% |
| Total | 545,318 | 100.0% |
Transportation & Commute in Area Code 925
Vehicle Availability by Sex in Area Code 925
The most prevalent vehicle ownership categories in Area Code 925 are males with 2 vehicles (153,153, accounting for 39.5%) and females with 2 vehicles (126,211, making up 47.5%).
| Vehicles Available | Male | Female |
| No Vehicle | 10,121 (2.6%) | 7,666 (2.4%) |
| 1 Vehicle | 58,492 (15.1%) | 56,534 (17.5%) |
| 2 Vehicles | 153,153 (39.5%) | 126,211 (39.2%) |
| 3 Vehicles | 96,469 (24.9%) | 76,185 (23.6%) |
| 4 Vehicles | 44,784 (11.6%) | 36,983 (11.5%) |
| 5 or more Vehicles | 24,703 (6.4%) | 18,493 (5.7%) |
| Total | 387,722 (100.0%) | 322,072 (100.0%) |
Commute Time in Area Code 925
The most frequently occuring commute durations in Area Code 925 are 60 to 89 minutes (81,882 commuters, 14.2%), 15 to 19 minutes (72,584 commuters, 12.6%), and 45 to 59 minutes (69,241 commuters, 12.0%).
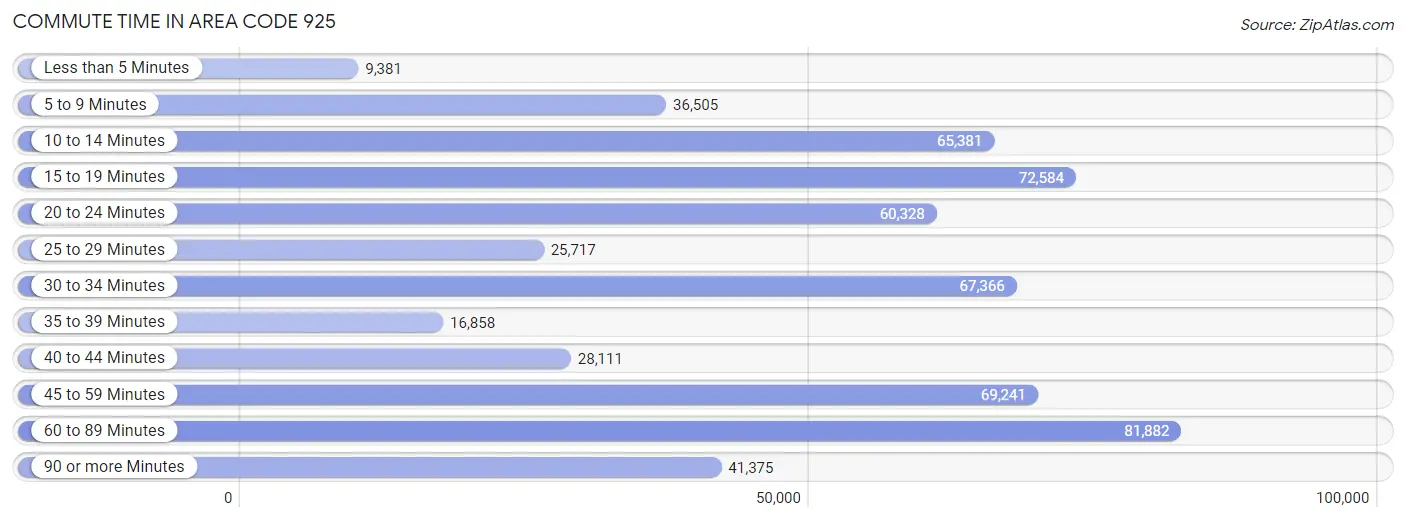
| Commute Time | # Commuters | % Commuters |
| Less than 5 Minutes | 9,381 | 1.6% |
| 5 to 9 Minutes | 36,505 | 6.4% |
| 10 to 14 Minutes | 65,381 | 11.4% |
| 15 to 19 Minutes | 72,584 | 12.6% |
| 20 to 24 Minutes | 60,328 | 10.5% |
| 25 to 29 Minutes | 25,717 | 4.5% |
| 30 to 34 Minutes | 67,366 | 11.7% |
| 35 to 39 Minutes | 16,858 | 2.9% |
| 40 to 44 Minutes | 28,111 | 4.9% |
| 45 to 59 Minutes | 69,241 | 12.0% |
| 60 to 89 Minutes | 81,882 | 14.2% |
| 90 or more Minutes | 41,375 | 7.2% |
Commute Time by Sex in Area Code 925
The most common commute times in Area Code 925 are 60 to 89 minutes (52,009 commuters, 16.4%) for males and 15 to 19 minutes (37,934 commuters, 14.8%) for females.
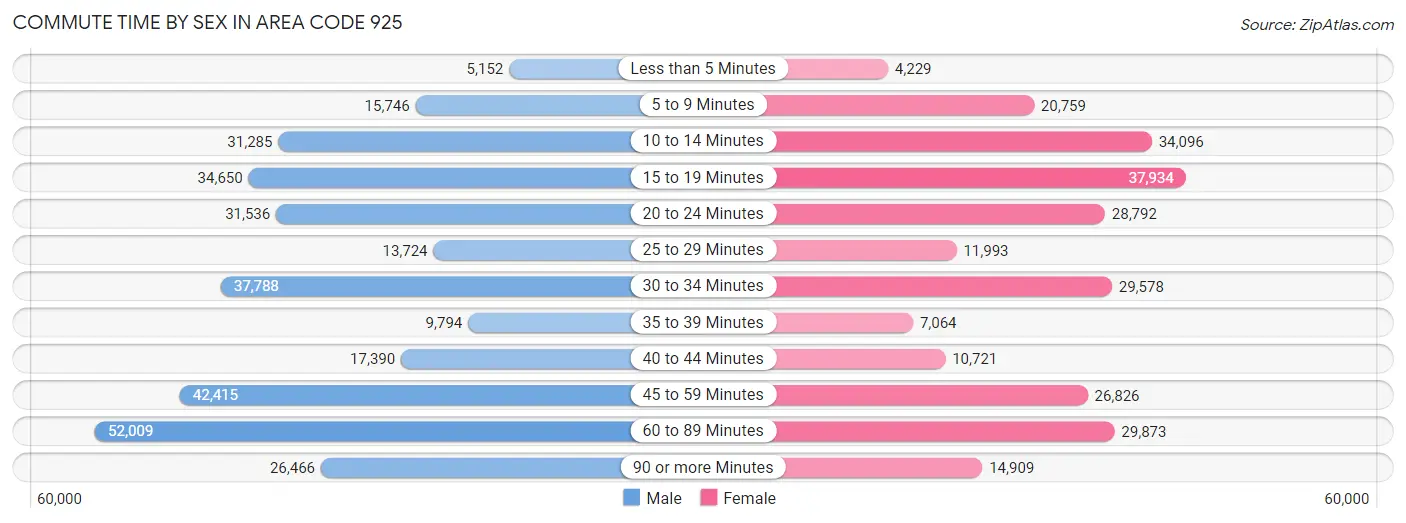
| Commute Time | Male | Female |
| Less than 5 Minutes | 5,152 (1.6%) | 4,229 (1.7%) |
| 5 to 9 Minutes | 15,746 (5.0%) | 20,759 (8.1%) |
| 10 to 14 Minutes | 31,285 (9.8%) | 34,096 (13.3%) |
| 15 to 19 Minutes | 34,650 (10.9%) | 37,934 (14.8%) |
| 20 to 24 Minutes | 31,536 (9.9%) | 28,792 (11.2%) |
| 25 to 29 Minutes | 13,724 (4.3%) | 11,993 (4.7%) |
| 30 to 34 Minutes | 37,788 (11.9%) | 29,578 (11.5%) |
| 35 to 39 Minutes | 9,794 (3.1%) | 7,064 (2.8%) |
| 40 to 44 Minutes | 17,390 (5.5%) | 10,721 (4.2%) |
| 45 to 59 Minutes | 42,415 (13.3%) | 26,826 (10.4%) |
| 60 to 89 Minutes | 52,009 (16.4%) | 29,873 (11.6%) |
| 90 or more Minutes | 26,466 (8.3%) | 14,909 (5.8%) |
Time of Departure to Work by Sex in Area Code 925
The most frequent times of departure to work in Area Code 925 are 8:00 AM to 8:29 AM (40,618, 12.8%) for males and 8:00 AM to 8:29 AM (35,497, 13.8%) for females.
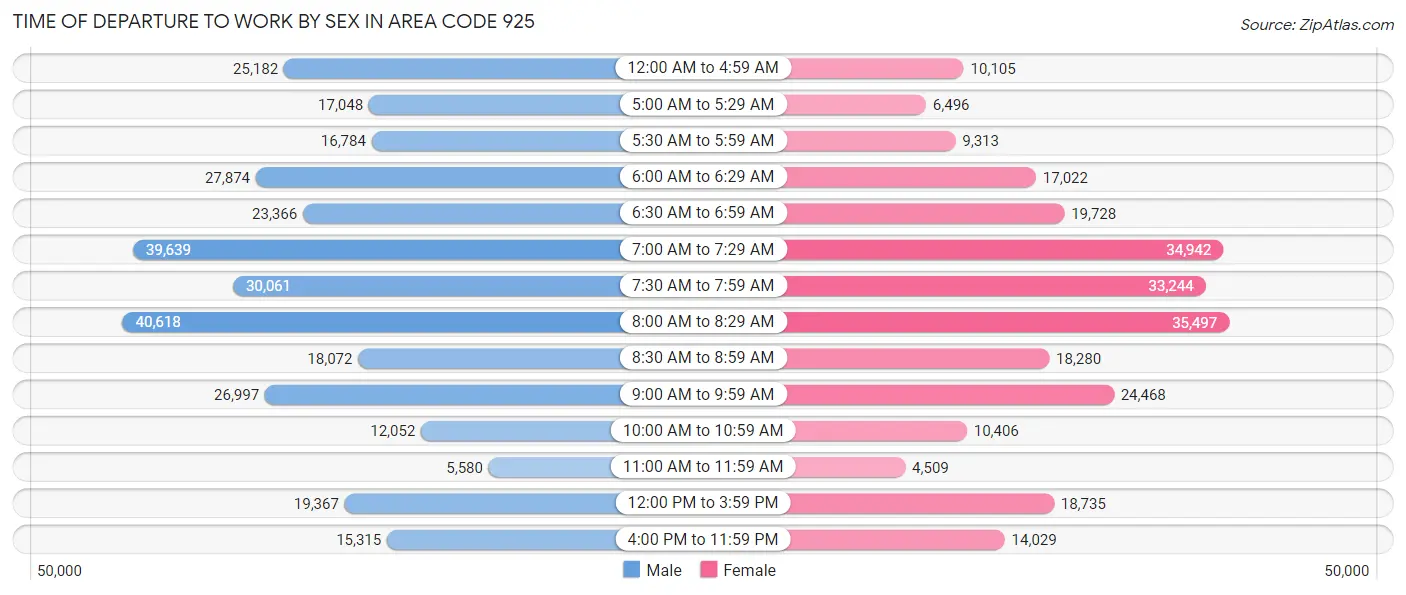
| Time of Departure | Male | Female |
| 12:00 AM to 4:59 AM | 25,182 (7.9%) | 10,105 (3.9%) |
| 5:00 AM to 5:29 AM | 17,048 (5.4%) | 6,496 (2.5%) |
| 5:30 AM to 5:59 AM | 16,784 (5.3%) | 9,313 (3.6%) |
| 6:00 AM to 6:29 AM | 27,874 (8.8%) | 17,022 (6.6%) |
| 6:30 AM to 6:59 AM | 23,366 (7.3%) | 19,728 (7.7%) |
| 7:00 AM to 7:29 AM | 39,639 (12.5%) | 34,942 (13.6%) |
| 7:30 AM to 7:59 AM | 30,061 (9.5%) | 33,244 (13.0%) |
| 8:00 AM to 8:29 AM | 40,618 (12.8%) | 35,497 (13.8%) |
| 8:30 AM to 8:59 AM | 18,072 (5.7%) | 18,280 (7.1%) |
| 9:00 AM to 9:59 AM | 26,997 (8.5%) | 24,468 (9.5%) |
| 10:00 AM to 10:59 AM | 12,052 (3.8%) | 10,406 (4.1%) |
| 11:00 AM to 11:59 AM | 5,580 (1.8%) | 4,509 (1.8%) |
| 12:00 PM to 3:59 PM | 19,367 (6.1%) | 18,735 (7.3%) |
| 4:00 PM to 11:59 PM | 15,315 (4.8%) | 14,029 (5.5%) |
| Total | 317,955 (100.0%) | 256,774 (100.0%) |
Housing Occupancy in Area Code 925
Occupancy by Ownership in Area Code 925
Of the total 513,814 dwellings in Area Code 925, owner-occupied units account for 334,130 (65.0%), while renter-occupied units make up 179,684 (35.0%).
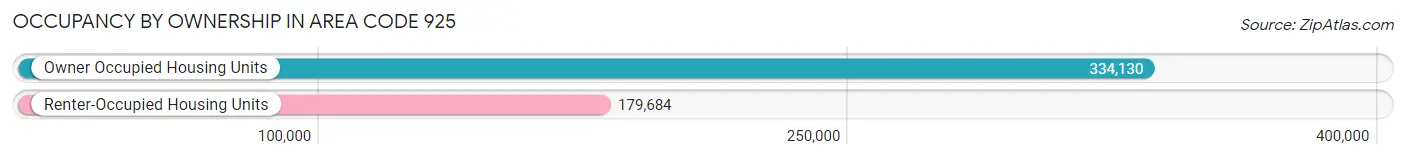
| Occupancy | # Housing Units | % Housing Units |
| Owner Occupied Housing Units | 334,130 | 65.0% |
| Renter-Occupied Housing Units | 179,684 | 35.0% |
| Total Occupied Housing Units | 513,814 | 100.0% |
Occupancy by Household Size in Area Code 925
| Household Size | # Housing Units | % Housing Units |
| 1-Person Household | 107,553 | 20.9% |
| 2-Person Household | 157,870 | 30.7% |
| 3-Person Household | 94,791 | 18.4% |
| 4+ Person Household | 153,600 | 29.9% |
| Total Housing Units | 513,814 | 100.0% |
Occupancy by Ownership by Household Size in Area Code 925
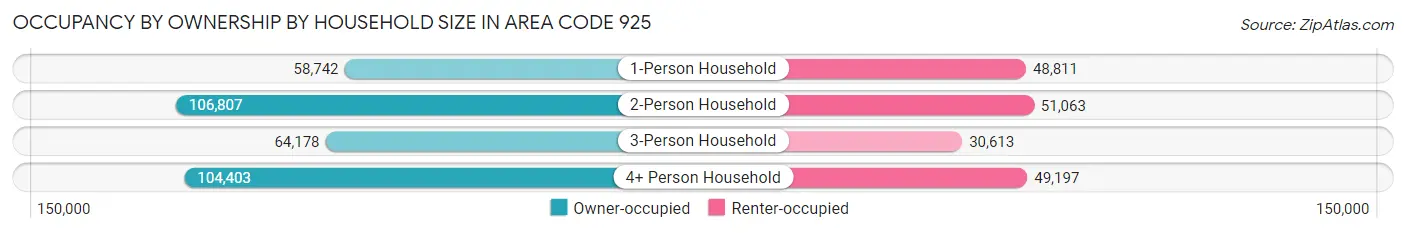
| Household Size | Owner-occupied | Renter-occupied |
| 1-Person Household | 58,742 (54.6%) | 48,811 (45.4%) |
| 2-Person Household | 106,807 (67.7%) | 51,063 (32.3%) |
| 3-Person Household | 64,178 (67.7%) | 30,613 (32.3%) |
| 4+ Person Household | 104,403 (68.0%) | 49,197 (32.0%) |
| Total Housing Units | 334,130 (65.0%) | 179,684 (35.0%) |
Occupancy by Educational Attainment in Area Code 925
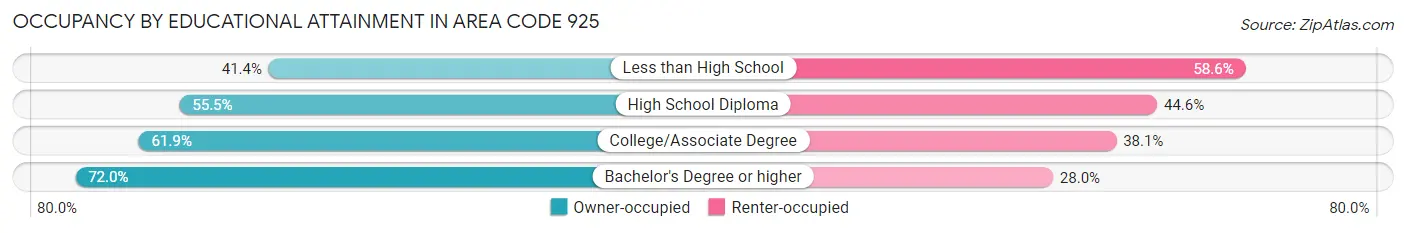
| Household Size | Owner-occupied | Renter-occupied |
| Less than High School | 14,359 (41.4%) | 20,299 (58.6%) |
| High School Diploma | 38,997 (55.4%) | 31,330 (44.6%) |
| College/Associate Degree | 83,077 (61.9%) | 51,065 (38.1%) |
| Bachelor's Degree or higher | 197,697 (72.0%) | 76,990 (28.0%) |
Occupancy by Age of Householder in Area Code 925
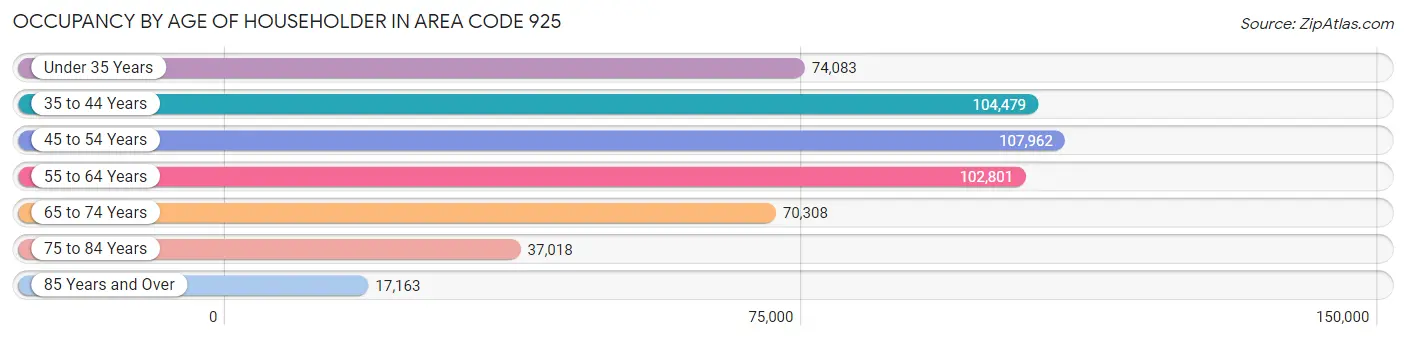
| Age Bracket | # Households | % Households |
| Under 35 Years | 74,083 | 14.4% |
| 35 to 44 Years | 104,479 | 20.3% |
| 45 to 54 Years | 107,962 | 21.0% |
| 55 to 64 Years | 102,801 | 20.0% |
| 65 to 74 Years | 70,308 | 13.7% |
| 75 to 84 Years | 37,018 | 7.2% |
| 85 Years and Over | 17,163 | 3.3% |
| Total | 513,814 | 100.0% |
Housing Finances in Area Code 925
Median Income by Occupancy in Area Code 925
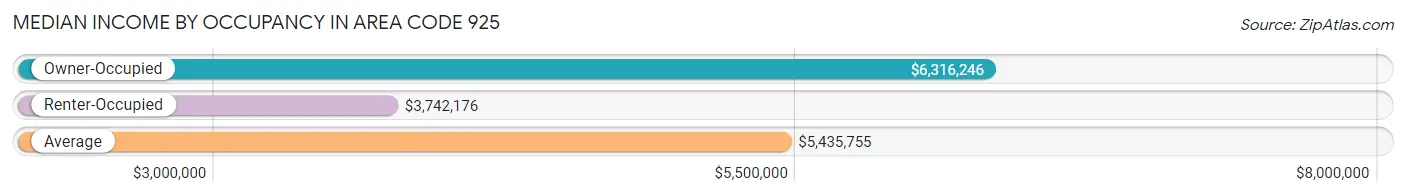
| Occupancy Type | # Households | Median Income |
| Owner-Occupied | 334,130 (65.0%) | $6,316,246 |
| Renter-Occupied | 179,684 (35.0%) | $3,742,176 |
| Average | 513,814 (100.0%) | $5,435,755 |
Occupancy by Householder Income Bracket in Area Code 925
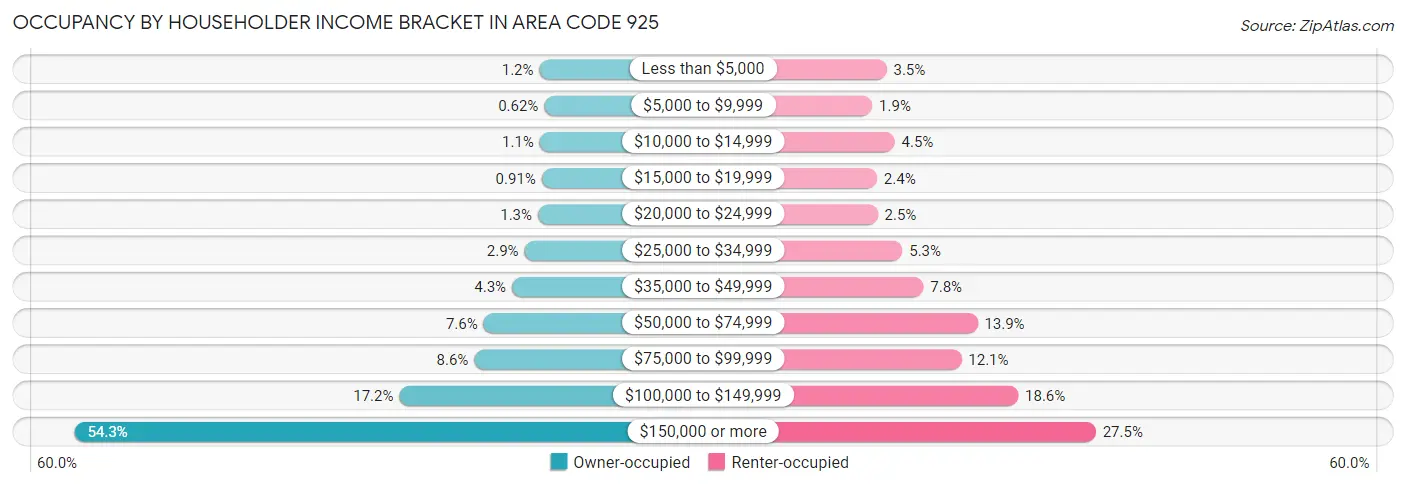
| Income Bracket | Owner-occupied | Renter-occupied |
| Less than $5,000 | 3,894 (1.2%) | 6,364 (3.5%) |
| $5,000 to $9,999 | 2,065 (0.6%) | 3,421 (1.9%) |
| $10,000 to $14,999 | 3,760 (1.1%) | 8,011 (4.5%) |
| $15,000 to $19,999 | 3,050 (0.9%) | 4,392 (2.4%) |
| $20,000 to $24,999 | 4,463 (1.3%) | 4,534 (2.5%) |
| $25,000 to $34,999 | 9,625 (2.9%) | 9,587 (5.3%) |
| $35,000 to $49,999 | 14,410 (4.3%) | 13,920 (7.7%) |
| $50,000 to $74,999 | 25,238 (7.5%) | 25,027 (13.9%) |
| $75,000 to $99,999 | 28,807 (8.6%) | 21,719 (12.1%) |
| $100,000 to $149,999 | 57,388 (17.2%) | 33,392 (18.6%) |
| $150,000 or more | 181,430 (54.3%) | 49,317 (27.5%) |
| Total | 334,130 (100.0%) | 179,684 (100.0%) |
Monthly Housing Cost Tiers in Area Code 925
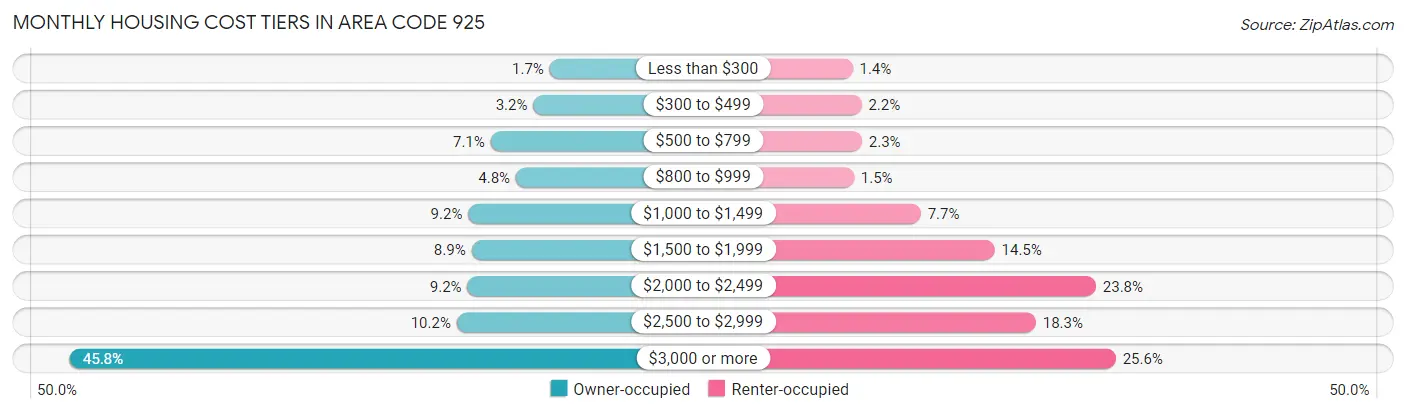
| Monthly Cost | Owner-occupied | Renter-occupied |
| Less than $300 | 5,536 (1.7%) | 2,494 (1.4%) |
| $300 to $499 | 10,583 (3.2%) | 3,967 (2.2%) |
| $500 to $799 | 23,719 (7.1%) | 4,037 (2.2%) |
| $800 to $999 | 15,923 (4.8%) | 2,722 (1.5%) |
| $1,000 to $1,499 | 30,614 (9.2%) | 13,785 (7.7%) |
| $1,500 to $1,999 | 29,620 (8.9%) | 25,994 (14.5%) |
| $2,000 to $2,499 | 30,846 (9.2%) | 42,752 (23.8%) |
| $2,500 to $2,999 | 34,148 (10.2%) | 32,812 (18.3%) |
| $3,000 or more | 153,141 (45.8%) | 46,037 (25.6%) |
| Total | 334,130 (100.0%) | 179,684 (100.0%) |
Physical Housing Characteristics in Area Code 925
Housing Structures in Area Code 925
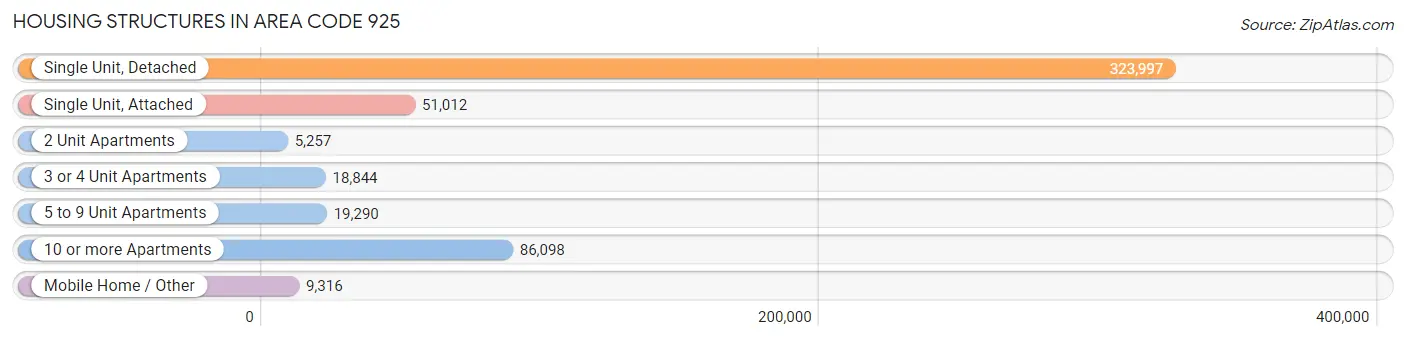
| Structure Type | # Housing Units | % Housing Units |
| Single Unit, Detached | 323,997 | 63.1% |
| Single Unit, Attached | 51,012 | 9.9% |
| 2 Unit Apartments | 5,257 | 1.0% |
| 3 or 4 Unit Apartments | 18,844 | 3.7% |
| 5 to 9 Unit Apartments | 19,290 | 3.7% |
| 10 or more Apartments | 86,098 | 16.8% |
| Mobile Home / Other | 9,316 | 1.8% |
| Total | 513,814 | 100.0% |
Housing Structures by Occupancy in Area Code 925
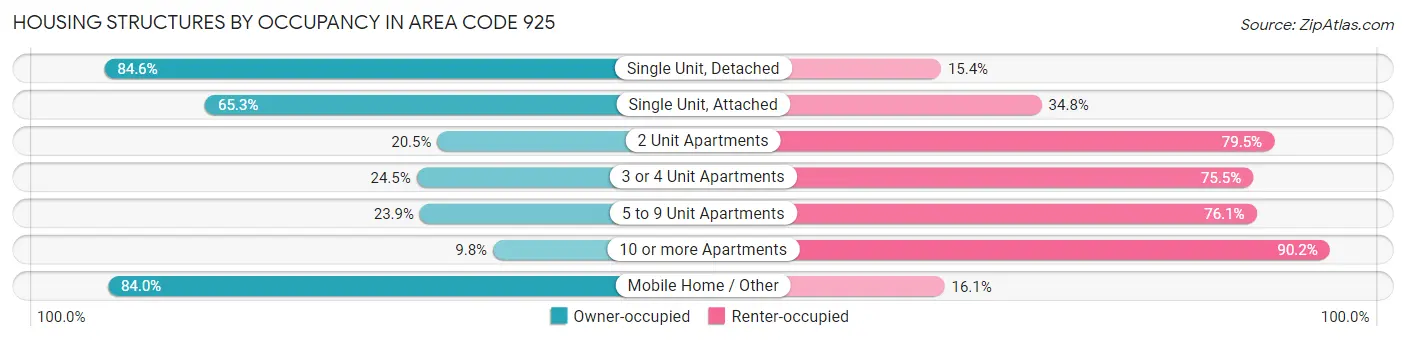
| Structure Type | Owner-occupied | Renter-occupied |
| Single Unit, Detached | 274,244 (84.6%) | 49,753 (15.4%) |
| Single Unit, Attached | 33,283 (65.2%) | 17,729 (34.7%) |
| 2 Unit Apartments | 1,080 (20.5%) | 4,177 (79.5%) |
| 3 or 4 Unit Apartments | 4,624 (24.5%) | 14,220 (75.5%) |
| 5 to 9 Unit Apartments | 4,612 (23.9%) | 14,678 (76.1%) |
| 10 or more Apartments | 8,466 (9.8%) | 77,632 (90.2%) |
| Mobile Home / Other | 7,821 (84.0%) | 1,495 (16.1%) |
| Total | 334,130 (65.0%) | 179,684 (35.0%) |
Housing Structures by Number of Rooms in Area Code 925
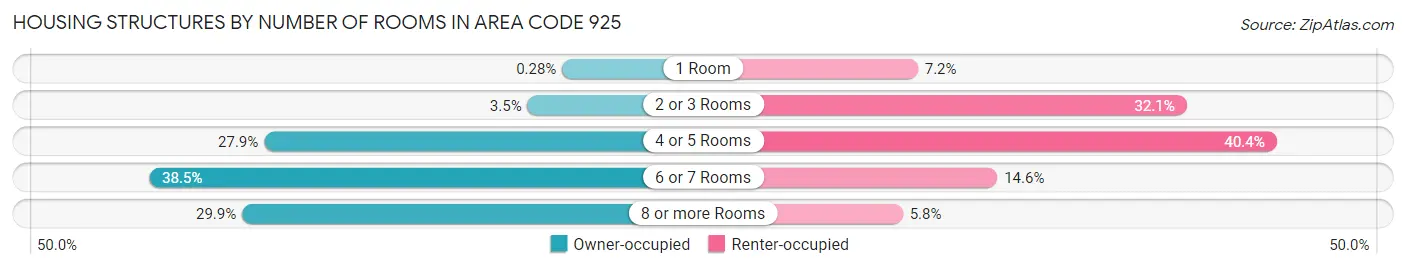
| Number of Rooms | Owner-occupied | Renter-occupied |
| 1 Room | 939 (0.3%) | 12,934 (7.2%) |
| 2 or 3 Rooms | 11,659 (3.5%) | 57,604 (32.1%) |
| 4 or 5 Rooms | 93,051 (27.9%) | 72,563 (40.4%) |
| 6 or 7 Rooms | 128,622 (38.5%) | 26,143 (14.5%) |
| 8 or more Rooms | 99,859 (29.9%) | 10,440 (5.8%) |
| Total | 334,130 (100.0%) | 179,684 (100.0%) |
Housing Structure by Heating Type in Area Code 925
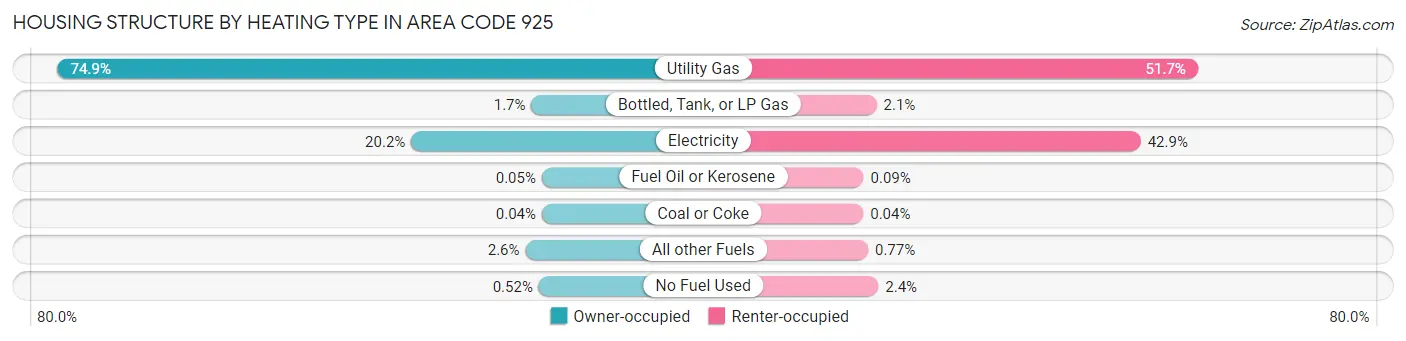
| Heating Type | Owner-occupied | Renter-occupied |
| Utility Gas | 250,248 (74.9%) | 92,938 (51.7%) |
| Bottled, Tank, or LP Gas | 5,559 (1.7%) | 3,748 (2.1%) |
| Electricity | 67,615 (20.2%) | 77,134 (42.9%) |
| Fuel Oil or Kerosene | 180 (0.1%) | 160 (0.1%) |
| Coal or Coke | 138 (0.0%) | 72 (0.0%) |
| All other Fuels | 8,669 (2.6%) | 1,380 (0.8%) |
| No Fuel Used | 1,721 (0.5%) | 4,252 (2.4%) |
| Total | 334,130 (100.0%) | 179,684 (100.0%) |
Household Vehicle Usage in Area Code 925
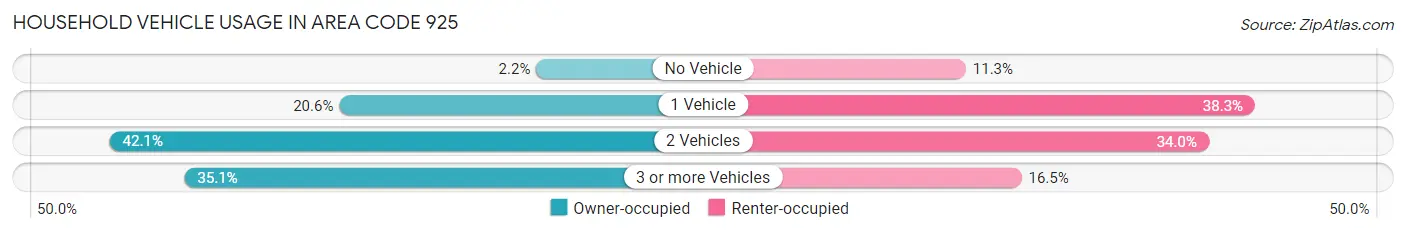
| Vehicles per Household | Owner-occupied | Renter-occupied |
| No Vehicle | 7,468 (2.2%) | 20,286 (11.3%) |
| 1 Vehicle | 68,930 (20.6%) | 68,762 (38.3%) |
| 2 Vehicles | 140,531 (42.1%) | 61,015 (34.0%) |
| 3 or more Vehicles | 117,201 (35.1%) | 29,621 (16.5%) |
| Total | 334,130 (100.0%) | 179,684 (100.0%) |
Real Estate & Mortgages in Area Code 925
Real Estate and Mortgage Overview in Area Code 925
| Characteristic | Without Mortgage | With Mortgage |
| Housing Units | 89,451 | 244,679 |
| Median Property Value | $35,687,900 | $39,524,300 |
| Median Household Income | $4,143,310 | $149,368 |
| Monthly Housing Costs | $35,764 | $151,354 |
| Real Estate Taxes | $191,644 | $3,198 |
Property Value by Mortgage Status in Area Code 925
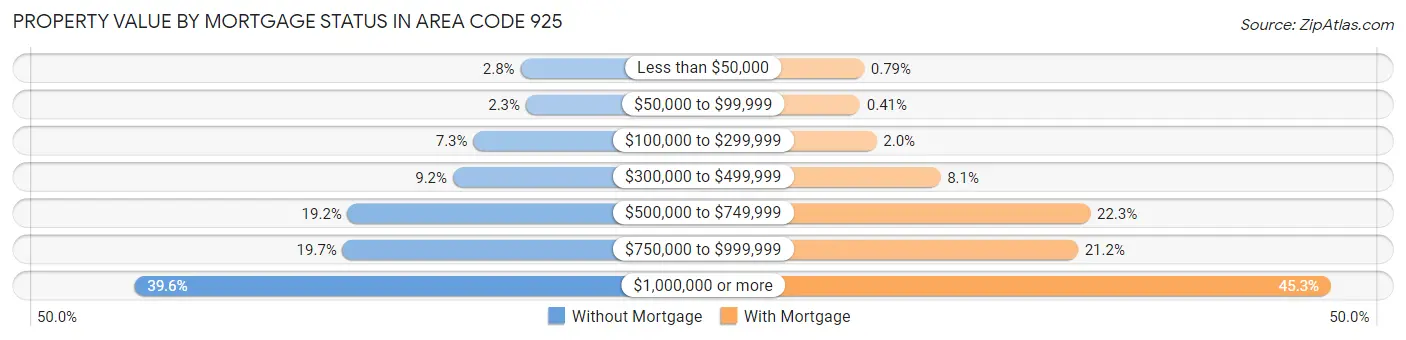
| Property Value | Without Mortgage | With Mortgage |
| Less than $50,000 | 2,487 (2.8%) | 1,934 (0.8%) |
| $50,000 to $99,999 | 2,024 (2.3%) | 999 (0.4%) |
| $100,000 to $299,999 | 6,492 (7.3%) | 4,833 (2.0%) |
| $300,000 to $499,999 | 8,237 (9.2%) | 19,729 (8.1%) |
| $500,000 to $749,999 | 17,199 (19.2%) | 54,648 (22.3%) |
| $750,000 to $999,999 | 17,630 (19.7%) | 51,766 (21.2%) |
| $1,000,000 or more | 35,382 (39.6%) | 110,770 (45.3%) |
| Total | 89,451 (100.0%) | 244,679 (100.0%) |
Household Income by Mortgage Status in Area Code 925
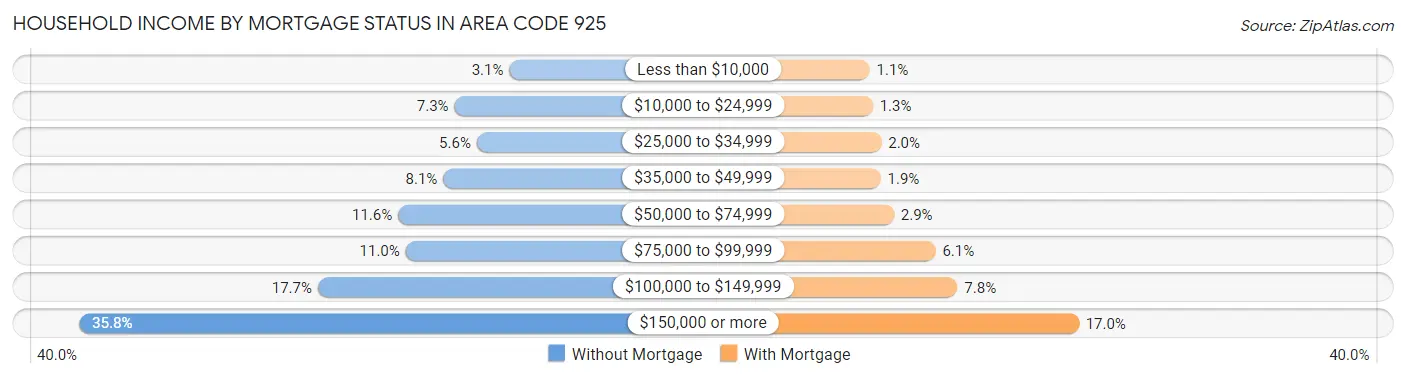
| Household Income | Without Mortgage | With Mortgage |
| Less than $10,000 | 2,745 (3.1%) | 2,627 (1.1%) |
| $10,000 to $24,999 | 6,485 (7.2%) | 3,214 (1.3%) |
| $25,000 to $34,999 | 4,961 (5.6%) | 4,788 (2.0%) |
| $35,000 to $49,999 | 7,257 (8.1%) | 4,664 (1.9%) |
| $50,000 to $74,999 | 10,329 (11.6%) | 7,153 (2.9%) |
| $75,000 to $99,999 | 9,811 (11.0%) | 14,909 (6.1%) |
| $100,000 to $149,999 | 15,801 (17.7%) | 18,996 (7.8%) |
| $150,000 or more | 32,062 (35.8%) | 41,587 (17.0%) |
| Total | 89,451 (100.0%) | 244,679 (100.0%) |
Property Value to Household Income Ratio in Area Code 925
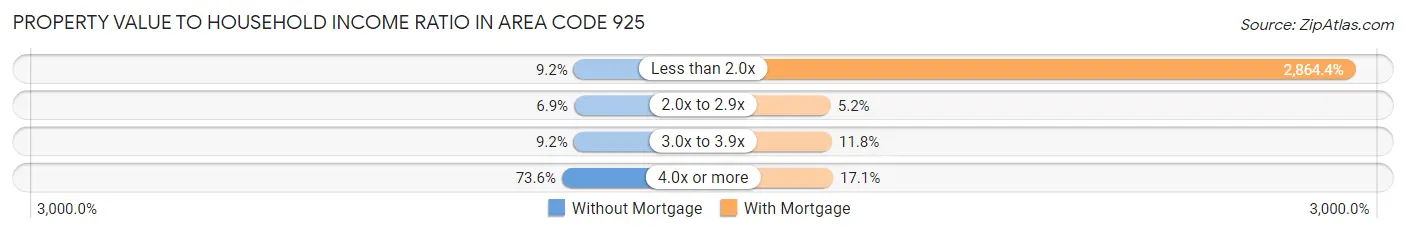
| Value-to-Income Ratio | Without Mortgage | With Mortgage |
| Less than 2.0x | 8,219 (9.2%) | 7,008,684 (2,864.4%) |
| 2.0x to 2.9x | 6,130 (6.9%) | 12,663 (5.2%) |
| 3.0x to 3.9x | 8,198 (9.2%) | 28,829 (11.8%) |
| 4.0x or more | 65,867 (73.6%) | 41,712 (17.1%) |
| Total | 89,451 (100.0%) | 244,679 (100.0%) |
Real Estate Taxes by Mortgage Status in Area Code 925
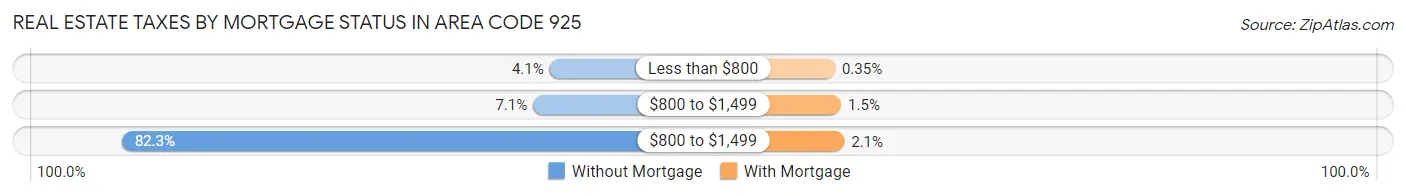
| Property Taxes | Without Mortgage | With Mortgage |
| Less than $800 | 3,684 (4.1%) | 856 (0.4%) |
| $800 to $1,499 | 6,376 (7.1%) | 3,628 (1.5%) |
| $800 to $1,499 | 73,581 (82.3%) | 5,019 (2.1%) |
| Total | 89,451 (100.0%) | 244,679 (100.0%) |
Health & Disability in Area Code 925
Health Insurance Coverage by Age in Area Code 925
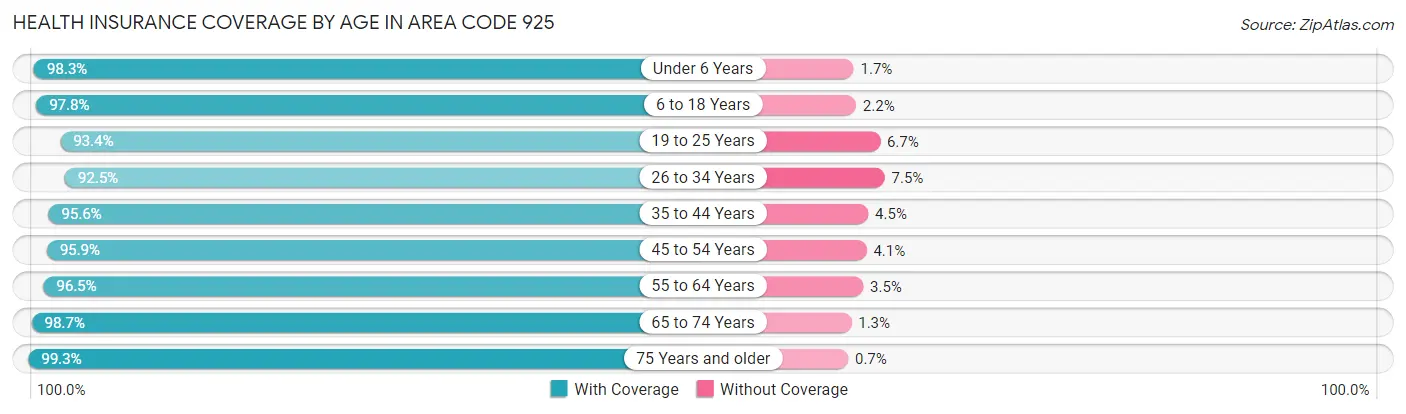
| Age Bracket | With Coverage | Without Coverage |
| Under 6 Years | 100,195 (98.3%) | 1,777 (1.7%) |
| 6 to 18 Years | 242,529 (97.8%) | 5,380 (2.2%) |
| 19 to 25 Years | 103,359 (93.3%) | 7,360 (6.7%) |
| 26 to 34 Years | 165,342 (92.5%) | 13,449 (7.5%) |
| 35 to 44 Years | 207,333 (95.6%) | 9,652 (4.4%) |
| 45 to 54 Years | 198,142 (95.9%) | 8,538 (4.1%) |
| 55 to 64 Years | 185,448 (96.5%) | 6,749 (3.5%) |
| 65 to 74 Years | 127,437 (98.7%) | 1,684 (1.3%) |
| 75 Years and older | 92,381 (99.3%) | 652 (0.7%) |
| Total | 1,422,166 (96.3%) | 55,241 (3.7%) |
Health Insurance Coverage by Citizenship Status in Area Code 925
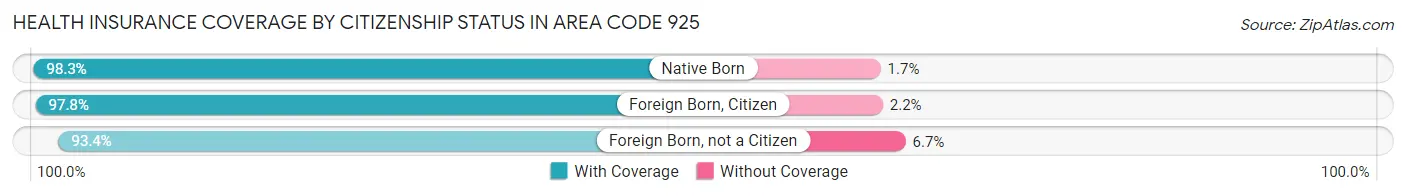
| Citizenship Status | With Coverage | Without Coverage |
| Native Born | 100,195 (98.3%) | 1,777 (1.7%) |
| Foreign Born, Citizen | 242,529 (97.8%) | 5,380 (2.2%) |
| Foreign Born, not a Citizen | 103,359 (93.3%) | 7,360 (6.7%) |
Health Insurance Coverage by Household Income in Area Code 925
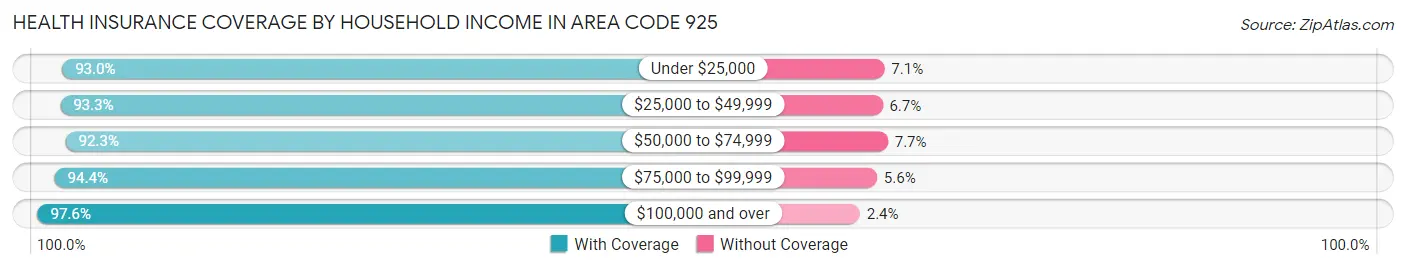
| Household Income | With Coverage | Without Coverage |
| Under $25,000 | 74,729 (92.9%) | 5,669 (7.0%) |
| $25,000 to $49,999 | 97,120 (93.3%) | 6,955 (6.7%) |
| $50,000 to $74,999 | 115,705 (92.3%) | 9,622 (7.7%) |
| $75,000 to $99,999 | 126,137 (94.4%) | 7,535 (5.6%) |
| $100,000 and over | 998,208 (97.6%) | 24,820 (2.4%) |
Public vs Private Health Insurance Coverage by Age in Area Code 925
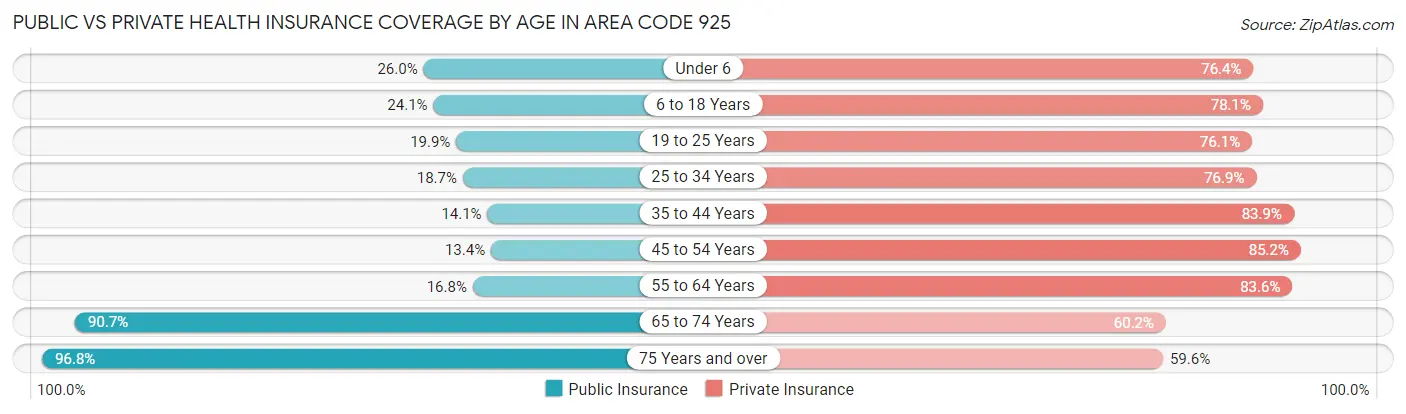
| Age Bracket | Public Insurance | Private Insurance |
| Under 6 | 26,476 (26.0%) | 77,877 (76.4%) |
| 6 to 18 Years | 59,808 (24.1%) | 193,708 (78.1%) |
| 19 to 25 Years | 22,019 (19.9%) | 84,305 (76.1%) |
| 25 to 34 Years | 33,371 (18.7%) | 137,525 (76.9%) |
| 35 to 44 Years | 30,577 (14.1%) | 182,010 (83.9%) |
| 45 to 54 Years | 27,765 (13.4%) | 176,076 (85.2%) |
| 55 to 64 Years | 32,336 (16.8%) | 160,681 (83.6%) |
| 65 to 74 Years | 117,064 (90.7%) | 77,660 (60.2%) |
| 75 Years and over | 90,029 (96.8%) | 55,469 (59.6%) |
| Total | 439,445 (29.7%) | 1,145,311 (77.5%) |
Disability Status by Sex by Age in Area Code 925
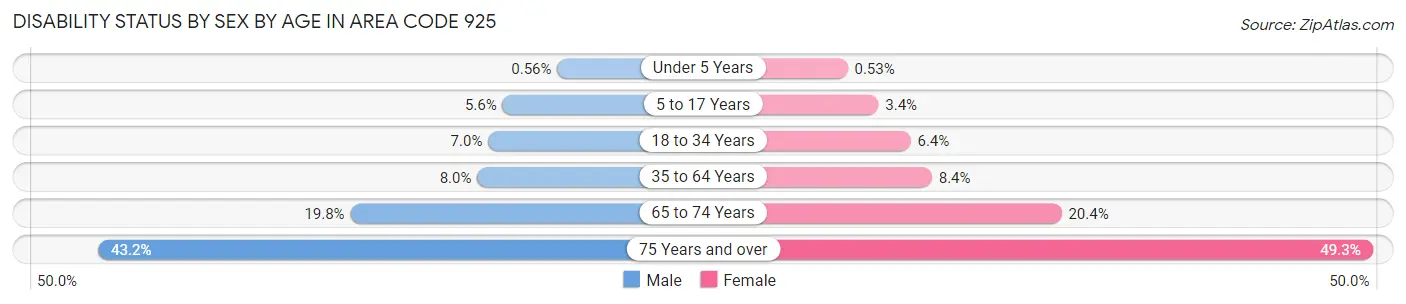
| Age Bracket | Male | Female |
| Under 5 Years | 243 (0.6%) | 214 (0.5%) |
| 5 to 17 Years | 7,071 (5.6%) | 4,141 (3.4%) |
| 18 to 34 Years | 10,966 (7.0%) | 9,627 (6.4%) |
| 35 to 64 Years | 24,785 (8.0%) | 25,542 (8.4%) |
| 65 to 74 Years | 11,945 (19.8%) | 14,000 (20.4%) |
| 75 Years and over | 16,487 (43.2%) | 27,016 (49.2%) |
Disability Class by Sex by Age in Area Code 925
Disability Class: Hearing Difficulty
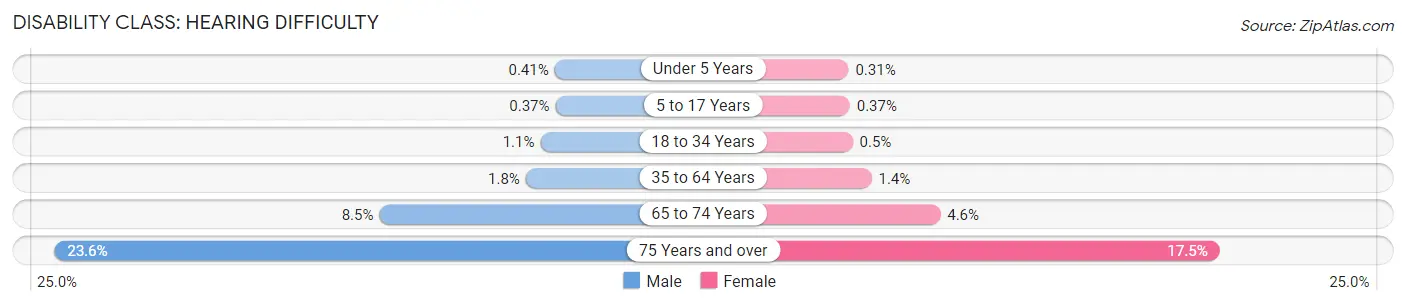
| Age Bracket | Male | Female |
| Under 5 Years | 176 (0.4%) | 127 (0.3%) |
| 5 to 17 Years | 465 (0.4%) | 457 (0.4%) |
| 18 to 34 Years | 1,682 (1.1%) | 762 (0.5%) |
| 35 to 64 Years | 5,413 (1.8%) | 4,228 (1.4%) |
| 65 to 74 Years | 5,160 (8.5%) | 3,137 (4.6%) |
| 75 Years and over | 9,018 (23.6%) | 9,617 (17.5%) |
Disability Class: Vision Difficulty
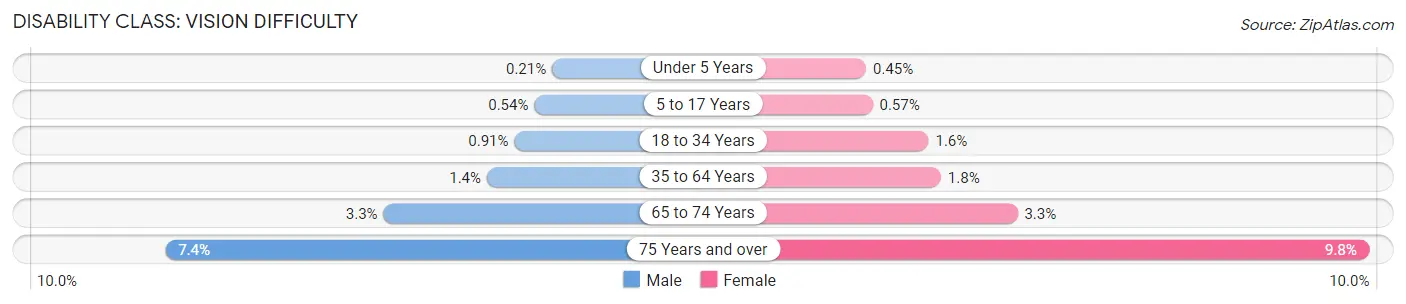
| Age Bracket | Male | Female |
| Under 5 Years | 89 (0.2%) | 185 (0.4%) |
| 5 to 17 Years | 682 (0.5%) | 697 (0.6%) |
| 18 to 34 Years | 1,439 (0.9%) | 2,424 (1.6%) |
| 35 to 64 Years | 4,410 (1.4%) | 5,638 (1.8%) |
| 65 to 74 Years | 2,018 (3.3%) | 2,238 (3.3%) |
| 75 Years and over | 2,821 (7.4%) | 5,364 (9.8%) |
Disability Class: Cognitive Difficulty
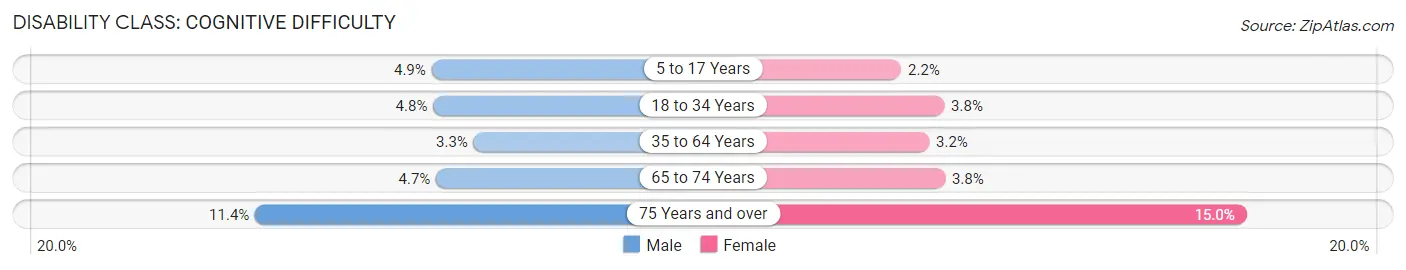
| Age Bracket | Male | Female |
| 5 to 17 Years | 6,129 (4.9%) | 2,683 (2.2%) |
| 18 to 34 Years | 7,604 (4.8%) | 5,730 (3.8%) |
| 35 to 64 Years | 10,324 (3.3%) | 9,910 (3.2%) |
| 65 to 74 Years | 2,855 (4.7%) | 2,631 (3.8%) |
| 75 Years and over | 4,366 (11.4%) | 8,246 (15.0%) |
Disability Class: Ambulatory Difficulty
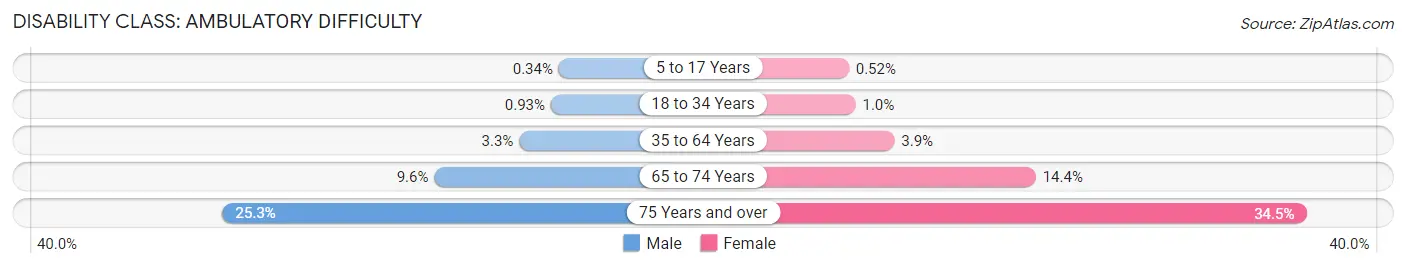
| Age Bracket | Male | Female |
| 5 to 17 Years | 429 (0.3%) | 640 (0.5%) |
| 18 to 34 Years | 1,469 (0.9%) | 1,546 (1.0%) |
| 35 to 64 Years | 10,161 (3.3%) | 11,937 (3.9%) |
| 65 to 74 Years | 5,792 (9.6%) | 9,891 (14.4%) |
| 75 Years and over | 9,661 (25.3%) | 18,913 (34.5%) |
Disability Class: Self-Care Difficulty
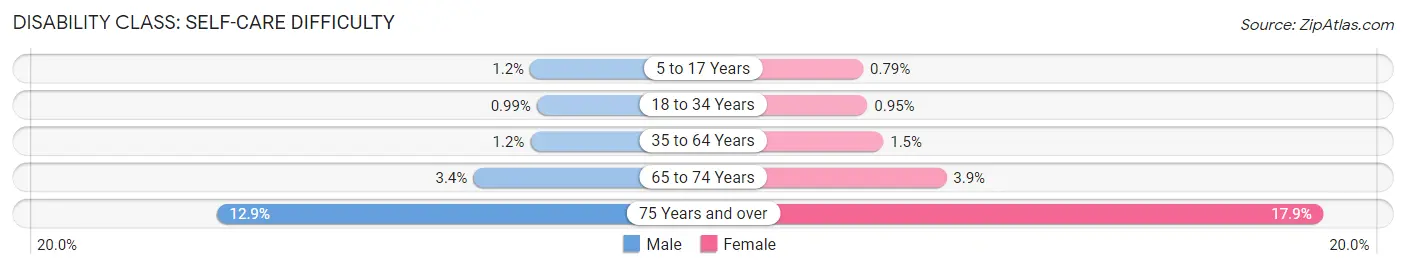
| Age Bracket | Male | Female |
| 5 to 17 Years | 1,550 (1.2%) | 962 (0.8%) |
| 18 to 34 Years | 1,561 (1.0%) | 1,429 (0.9%) |
| 35 to 64 Years | 3,803 (1.2%) | 4,720 (1.5%) |
| 65 to 74 Years | 2,023 (3.4%) | 2,662 (3.9%) |
| 75 Years and over | 4,913 (12.9%) | 9,807 (17.9%) |
Technology Access in Area Code 925
Computing Device Access in Area Code 925
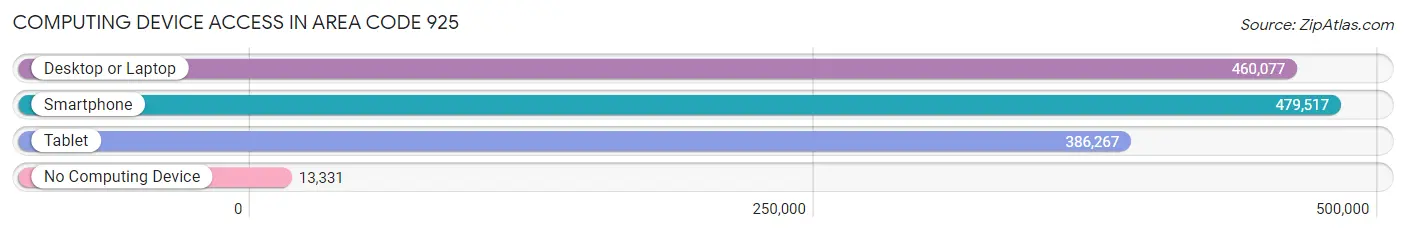
| Device Type | # Households | % Households |
| Desktop or Laptop | 460,077 | 89.5% |
| Smartphone | 479,517 | 93.3% |
| Tablet | 386,267 | 75.2% |
| No Computing Device | 13,331 | 2.6% |
| Total | 513,814 | 100.0% |
Internet Access in Area Code 925
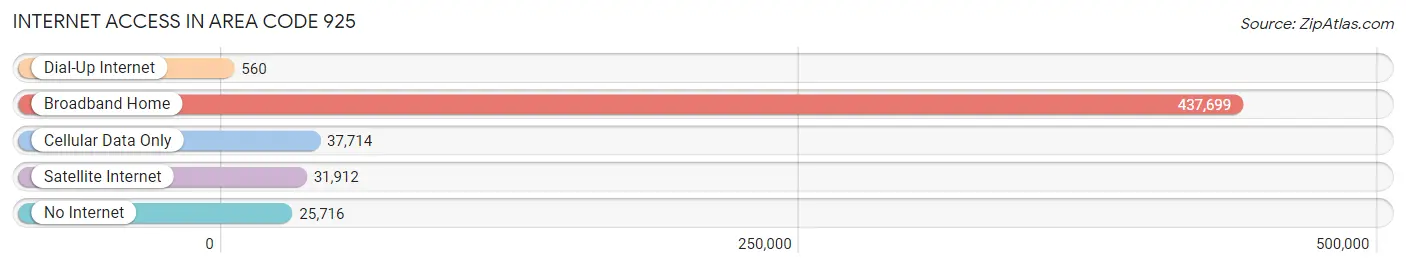
| Internet Type | # Households | % Households |
| Dial-Up Internet | 560 | 0.1% |
| Broadband Home | 437,699 | 85.2% |
| Cellular Data Only | 37,714 | 7.3% |
| Satellite Internet | 31,912 | 6.2% |
| No Internet | 25,716 | 5.0% |
| Total | 513,814 | 100.0% |
Area Code 925 Summary
Geography
Area code 925 is located in the state of California and covers the East Bay region of the San Francisco Bay Area. It includes the cities of Concord, Livermore, Pleasanton, Antioch, Walnut Creek, and San Ramon.
Social
Area code 925 is home to a diverse population of people from all walks of life. The area is known for its vibrant arts and culture scene, with many galleries, museums, and performing arts venues. The area is also home to a number of professional sports teams, including the Oakland Athletics and the Golden State Warriors.
Economics
Area code 925 is a major economic hub in the Bay Area. It is home to a number of large corporations, including Chevron, Safeway, and Oracle. The area is also home to a number of universities and colleges, including the University of California, Berkeley and California State University, East Bay.
Demographics
Area code 925 is home to a diverse population of people from all walks of life. According to the 2010 census, the population of the area was 1,037,817. The median household income was $77,836, and the median age was 37.7 years. The area is also home to a large Hispanic population, with nearly 30% of the population identifying as Hispanic or Latino.
Common Questions
What is Per Capita Income in Area Code 925?
Per Capita income in Area Code 925 is $66,751.
What is the Median Family Income in Area Code 925?
Median Family Income in Area Code 925 is $166,997.
What is the Median Household income in Area Code 925?
Median Household Income in Area Code 925 is $146,912.
What is Income or Wage Gap in Area Code 925?
Income or Wage Gap in Area Code 925 is 34.9%.
Women in Area Code 925 earn 65.1 cents for every dollar earned by a man.
What is Family Income Deficit in Area Code 925?
Family Income Deficit in Area Code 925 is $10,758.
Families that are below poverty line in Area Code 925 earn $10,758 less on average than the poverty threshold level.
What is Inequality or Gini Index in Area Code 925?
Inequality or Gini Index in Area Code 925 is 15.85.
What is the Total Population of Area Code 925?
Total Population of Area Code 925 is 1,485,554.
What is the Total Male Population of Area Code 925?
Total Male Population of Area Code 925 is 738,961.
What is the Total Female Population of Area Code 925?
Total Female Population of Area Code 925 is 746,593.
What is the Ratio of Males per 100 Females in Area Code 925?
There are 98.98 Males per 100 Females in Area Code 925.
What is the Ratio of Females per 100 Males in Area Code 925?
There are 101.03 Females per 100 Males in Area Code 925.
What is the Median Population Age in Area Code 925?
Median Population Age in Area Code 925 is 40.8 Years.
What is the Average Family Size in Area Code 925
Average Family Size in Area Code 925 is 3.3 People.
What is the Average Household Size in Area Code 925
Average Household Size in Area Code 925 is 2.8 People.
How Large is the Labor Force in Area Code 925?
There are 764,855 People in the Labor Forcein in Area Code 925.
What is the Percentage of People in the Labor Force in Area Code 925?
64.0% of People are in the Labor Force in Area Code 925.
What is the Unemployment Rate in Area Code 925?
Unemployment Rate in Area Code 925 is 5.2%.