Area Code 415 Map & Demographics
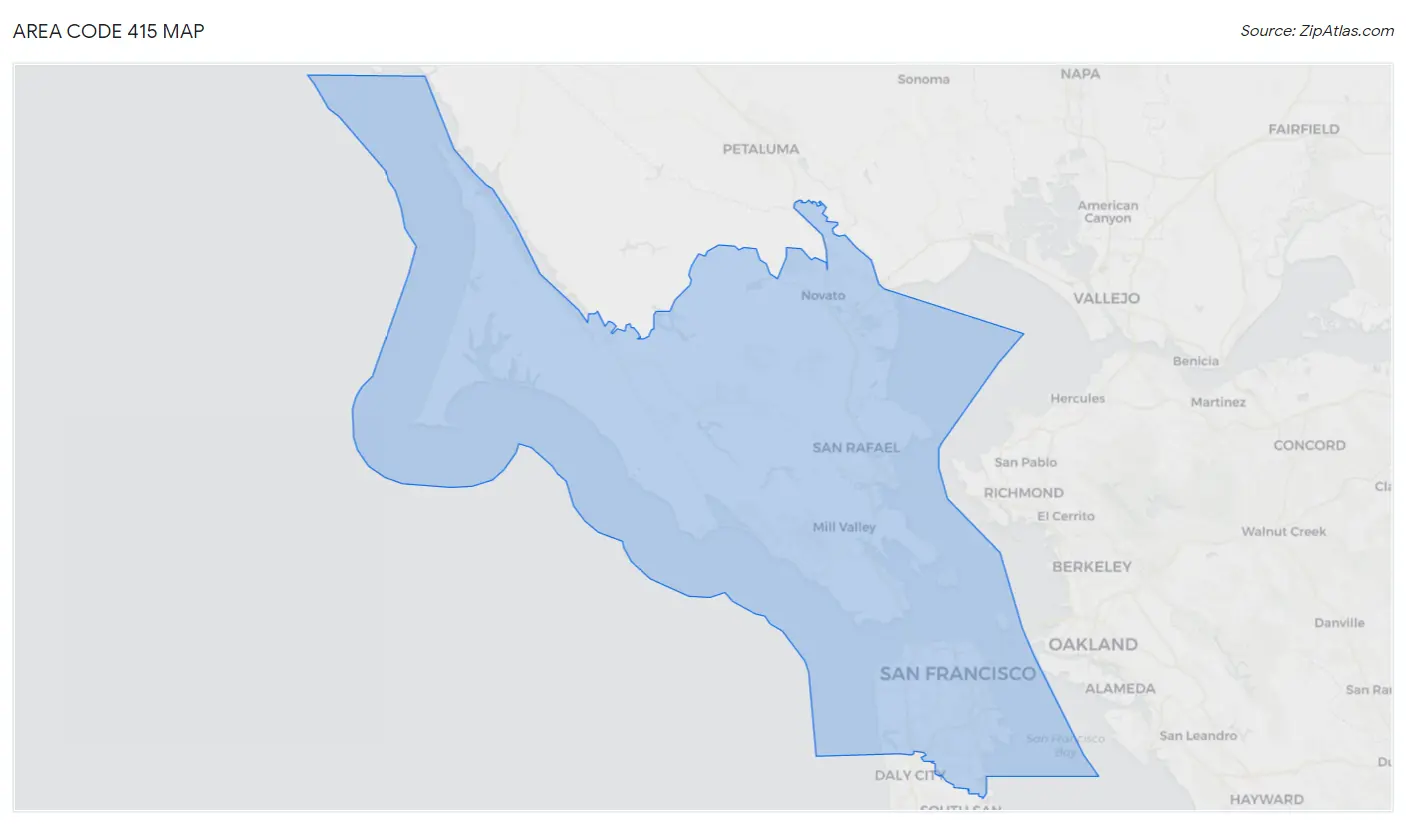
Area Code 415 Map
Area Code 415 Overview
$90,373
PER CAPITA INCOME
$174,799
AVG FAMILY INCOME
$137,282
AVG HOUSEHOLD INCOME
25.9%
WAGE / INCOME GAP [ % ]
74.1¢/ $1
WAGE / INCOME GAP [ $ ]
$10,975
FAMILY INCOME DEFICIT
24.22
INEQUALITY / GINI INDEX
1,180,600
TOTAL POPULATION
598,811
MALE POPULATION
581,789
FEMALE POPULATION
102.93
MALES / 100 FEMALES
97.16
FEMALES / 100 MALES
44.2
MEDIAN AGE
2.9
AVG FAMILY SIZE
2.3
AVG HOUSEHOLD SIZE
693,267
LABOR FORCE [ PEOPLE ]
67.7%
PERCENT IN LABOR FORCE
6.1%
UNEMPLOYMENT RATE
Income in Area Code 415
Income Overview in Area Code 415
Per Capita Income in Area Code 415 is $90,373, while median incomes of families and households are $174,799 and $137,282 respectively.
| Characteristic | Number | Measure |
| Per Capita Income | 1,180,600 | $90,373 |
| Median Family Income | 248,863 | $174,799 |
| Mean Family Income | 248,863 | $11,695,281 |
| Median Household Income | 500,302 | $137,282 |
| Mean Household Income | 500,302 | $9,640,132 |
| Income Deficit | 248,863 | $10,975 |
| Wage / Income Gap (%) | 1,180,600 | 25.94% |
| Wage / Income Gap ($) | 1,180,600 | 74.06¢ per $1 |
| Gini / Inequality Index | 1,180,600 | 24.22 |
Earnings by Sex in Area Code 415
Average Earnings in Area Code 415 are $77,196, $94,057 for men and $67,901 for women, a difference of 27.8%.
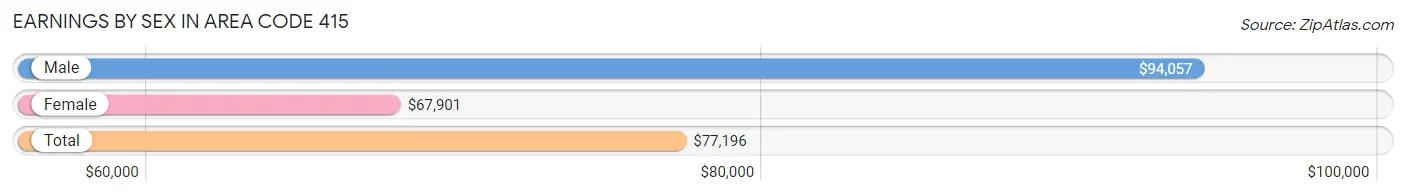
| Sex | Number | Average Earnings |
| Male | 389,284 (53.5%) | $94,057 |
| Female | 338,869 (46.5%) | $67,901 |
| Total | 728,153 (100.0%) | $77,196 |
Earnings by Sex by Income Bracket in Area Code 415
The most common earnings brackets in Area Code 415 are $100,000+ for men (173,705 | 44.6%) and $100,000+ for women (116,230 | 34.3%).
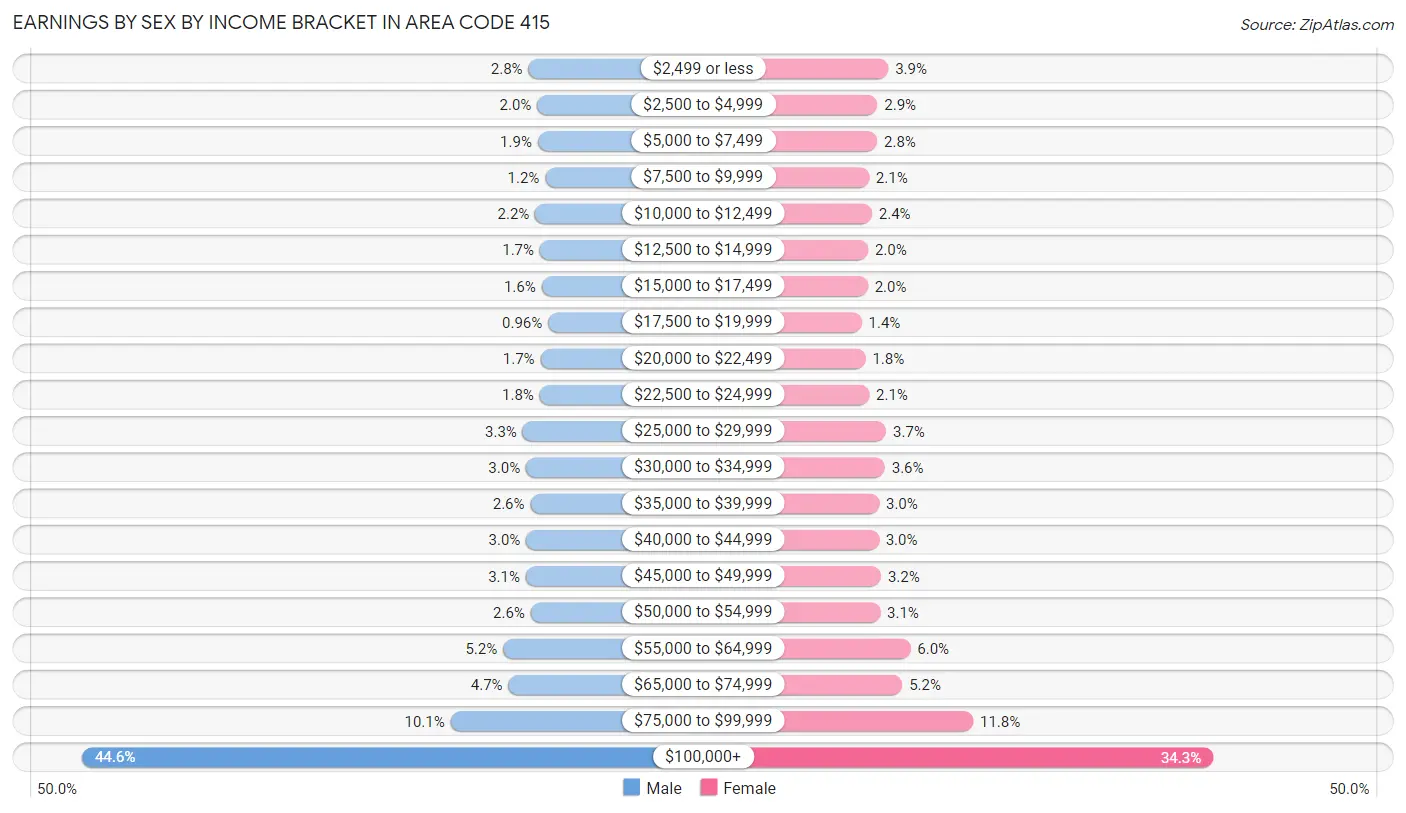
| Income | Male | Female |
| $2,499 or less | 10,887 (2.8%) | 13,160 (3.9%) |
| $2,500 to $4,999 | 7,692 (2.0%) | 9,695 (2.9%) |
| $5,000 to $7,499 | 7,513 (1.9%) | 9,621 (2.8%) |
| $7,500 to $9,999 | 4,771 (1.2%) | 7,015 (2.1%) |
| $10,000 to $12,499 | 8,455 (2.2%) | 7,975 (2.4%) |
| $12,500 to $14,999 | 6,735 (1.7%) | 6,700 (2.0%) |
| $15,000 to $17,499 | 6,131 (1.6%) | 6,625 (2.0%) |
| $17,500 to $19,999 | 3,733 (1.0%) | 4,717 (1.4%) |
| $20,000 to $22,499 | 6,541 (1.7%) | 5,929 (1.8%) |
| $22,500 to $24,999 | 6,795 (1.8%) | 7,066 (2.1%) |
| $25,000 to $29,999 | 12,987 (3.3%) | 12,458 (3.7%) |
| $30,000 to $34,999 | 11,813 (3.0%) | 12,059 (3.6%) |
| $35,000 to $39,999 | 10,180 (2.6%) | 10,234 (3.0%) |
| $40,000 to $44,999 | 11,700 (3.0%) | 10,128 (3.0%) |
| $45,000 to $49,999 | 11,876 (3.0%) | 10,857 (3.2%) |
| $50,000 to $54,999 | 10,075 (2.6%) | 10,556 (3.1%) |
| $55,000 to $64,999 | 20,176 (5.2%) | 20,157 (5.9%) |
| $65,000 to $74,999 | 18,210 (4.7%) | 17,597 (5.2%) |
| $75,000 to $99,999 | 39,309 (10.1%) | 40,090 (11.8%) |
| $100,000+ | 173,705 (44.6%) | 116,230 (34.3%) |
| Total | 389,284 (100.0%) | 338,869 (100.0%) |
Earnings by Sex by Educational Attainment in Area Code 415
Average earnings in Area Code 415 are $4,785,476 for men and $3,420,209 for women, a difference of 28.5%. Men with an educational attainment of graduate degree enjoy the highest average annual earnings of $6,836,958, while those with less than high school education earn the least with $1,097,989. Women with an educational attainment of graduate degree earn the most with the average annual earnings of $4,894,850, while those with less than high school education have the smallest earnings of $631,811.
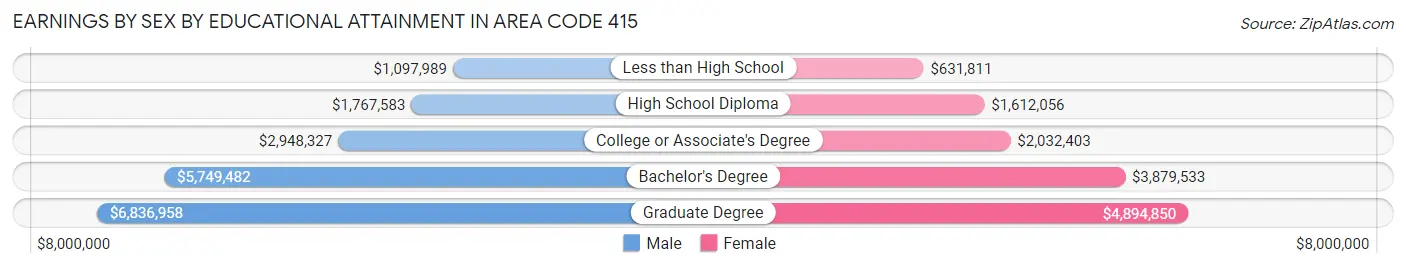
| Educational Attainment | Male Income | Female Income |
| Less than High School | $1,097,989 | $631,811 |
| High School Diploma | $1,767,583 | $1,612,056 |
| College or Associate's Degree | $2,948,327 | $2,032,403 |
| Bachelor's Degree | $5,749,482 | $3,879,533 |
| Graduate Degree | $6,836,958 | $4,894,850 |
| Total | $4,785,476 | $3,420,209 |
Family Income in Area Code 415
Family Income Brackets in Area Code 415
According to the Area Code 415 family income data, there are 5,126,827 families falling into the $200,000+ income range, which is the most common income bracket and makes up 2,060.1% of all families. Conversely, the $10,000 to $14,999 income bracket is the least frequent group with only 173,209 families (69.6%) belonging to this category.
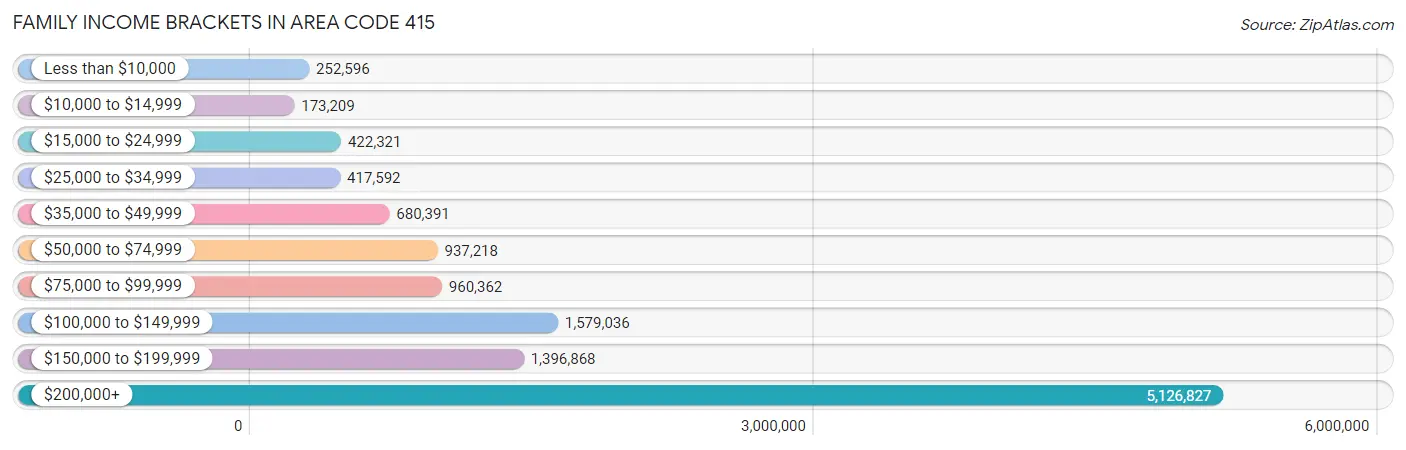
| Income Bracket | # Families | % Families |
| Less than $10,000 | 252,596 | 101.5% |
| $10,000 to $14,999 | 173,209 | 69.6% |
| $15,000 to $24,999 | 422,321 | 169.7% |
| $25,000 to $34,999 | 417,592 | 167.8% |
| $35,000 to $49,999 | 680,391 | 273.4% |
| $50,000 to $74,999 | 937,218 | 376.6% |
| $75,000 to $99,999 | 960,362 | 385.9% |
| $100,000 to $149,999 | 1,579,036 | 634.5% |
| $150,000 to $199,999 | 1,396,868 | 561.3% |
| $200,000+ | 5,126,827 | 2,060.1% |
Family Income by Famaliy Size in Area Code 415
4-person families (45,120 | 18.1%) account for the highest median family income in Area Code 415 with $204,478 per family, while 2-person families (125,059 | 50.2%) have the highest median income of $77,719 per family member.
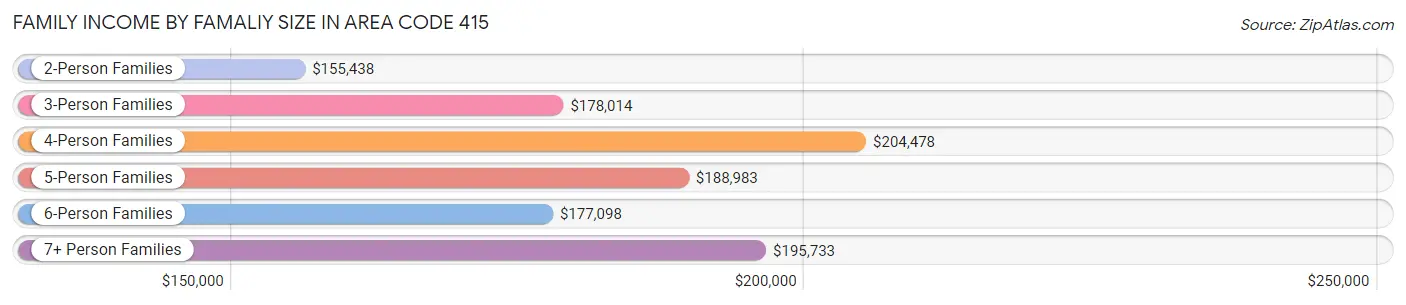
| Income Bracket | # Families | Median Income |
| 2-Person Families | 125,059 (50.2%) | $155,438 |
| 3-Person Families | 54,673 (22.0%) | $178,014 |
| 4-Person Families | 45,120 (18.1%) | $204,478 |
| 5-Person Families | 15,364 (6.2%) | $188,983 |
| 6-Person Families | 5,040 (2.0%) | $177,098 |
| 7+ Person Families | 3,607 (1.5%) | $195,733 |
| Total | 248,863 (100.0%) | $174,799 |
Family Income by Number of Earners in Area Code 415
The median family income in Area Code 415 is $174,799, with families comprising 2 earners (122,521) having the highest median family income of $211,948, while families with no earners (31,580) have the lowest median family income of $73,108, accounting for 49.2% and 12.7% of families, respectively.
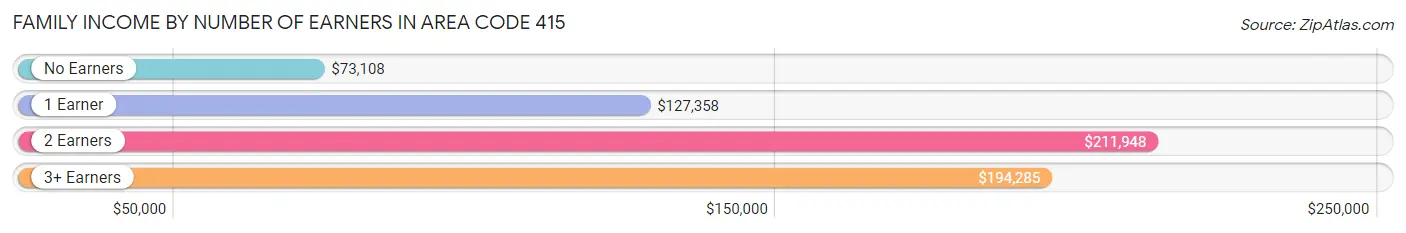
| Number of Earners | # Families | Median Income |
| No Earners | 31,580 (12.7%) | $73,108 |
| 1 Earner | 67,317 (27.1%) | $127,358 |
| 2 Earners | 122,521 (49.2%) | $211,948 |
| 3+ Earners | 27,445 (11.0%) | $194,285 |
| Total | 248,863 (100.0%) | $174,799 |
Household Income in Area Code 415
Household Income Brackets in Area Code 415
With 8,287,503 households falling in the category, the $200,000+ income range is the most frequent in Area Code 415, accounting for 1,656.5% of all households. In contrast, only 928,060 households (185.5%) fall into the $10,000 to $14,999 income bracket, making it the least populous group.
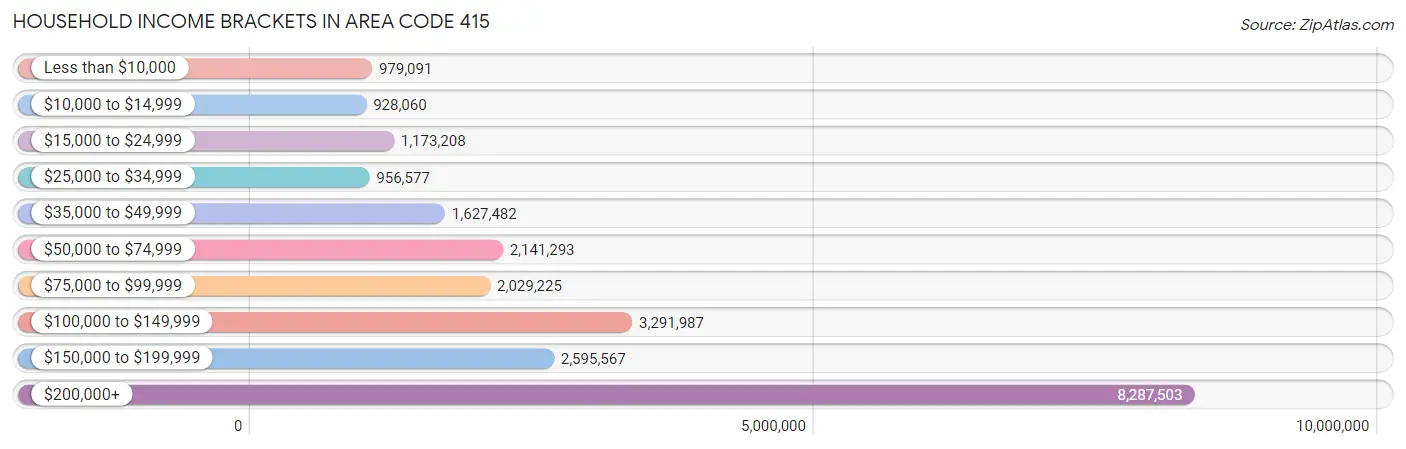
| Income Bracket | # Households | % Households |
| Less than $10,000 | 979,091 | 195.7% |
| $10,000 to $14,999 | 928,060 | 185.5% |
| $15,000 to $24,999 | 1,173,208 | 234.5% |
| $25,000 to $34,999 | 956,577 | 191.2% |
| $35,000 to $49,999 | 1,627,482 | 325.3% |
| $50,000 to $74,999 | 2,141,293 | 428.0% |
| $75,000 to $99,999 | 2,029,225 | 405.6% |
| $100,000 to $149,999 | 3,291,987 | 658.0% |
| $150,000 to $199,999 | 2,595,567 | 518.8% |
| $200,000+ | 8,287,503 | 1,656.5% |
Household Income by Householder Age in Area Code 415
The median household income in Area Code 415 is $137,282, with the highest median household income of $186,913 found in the 25 to 44 years age bracket for the primary householder. A total of 187,908 households (37.6%) fall into this category. Meanwhile, the 65+ years age bracket for the primary householder has the lowest median household income of $83,304, with 129,685 households (25.9%) in this group.
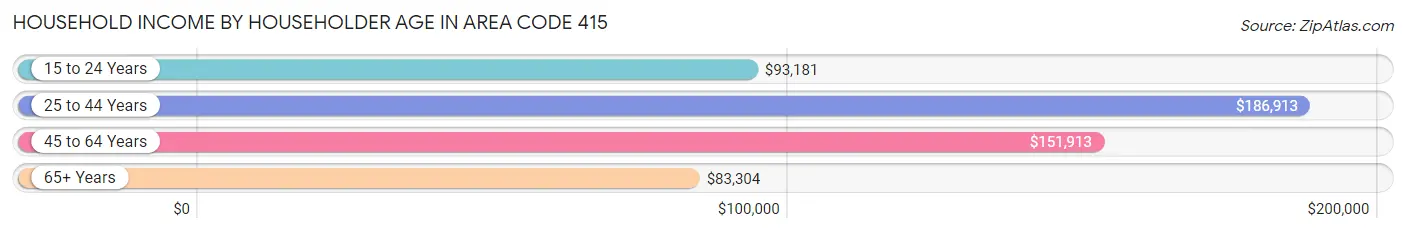
| Income Bracket | # Households | Median Income |
| 15 to 24 Years | 11,828 (2.4%) | $93,181 |
| 25 to 44 Years | 187,908 (37.6%) | $186,913 |
| 45 to 64 Years | 170,881 (34.2%) | $151,913 |
| 65+ Years | 129,685 (25.9%) | $83,304 |
| Total | 500,302 (100.0%) | $137,282 |
Poverty in Area Code 415
Income Below Poverty by Sex and Age in Area Code 415
With 9.5% poverty level for males and 10.3% for females among the residents of Area Code 415, 15 year old males and 18 to 24 year old females are the most vulnerable to poverty, with 773 males (17.0%) and 6,992 females (20.3%) in their respective age groups living below the poverty level.
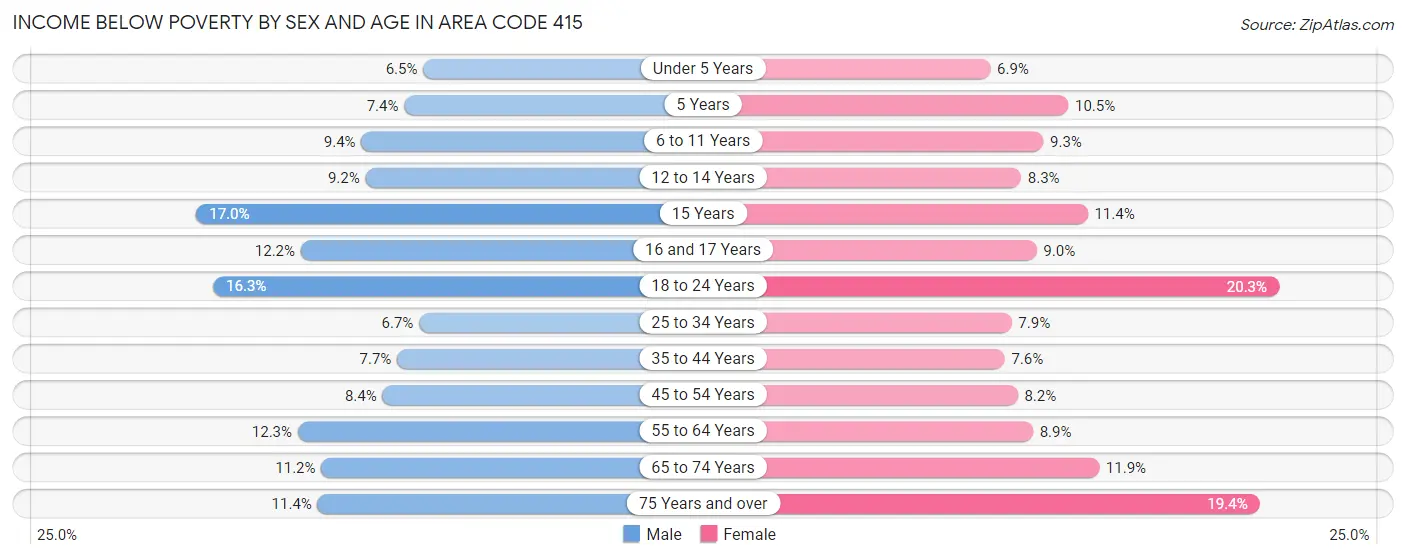
| Age Bracket | Male | Female |
| Under 5 Years | 1,629 (6.5%) | 1,698 (6.9%) |
| 5 Years | 337 (7.4%) | 494 (10.5%) |
| 6 to 11 Years | 2,710 (9.4%) | 2,487 (9.3%) |
| 12 to 14 Years | 1,362 (9.2%) | 1,211 (8.3%) |
| 15 Years | 773 (17.0%) | 558 (11.4%) |
| 16 and 17 Years | 1,215 (12.2%) | 843 (9.0%) |
| 18 to 24 Years | 5,711 (16.3%) | 6,992 (20.3%) |
| 25 to 34 Years | 7,821 (6.7%) | 8,527 (7.9%) |
| 35 to 44 Years | 7,316 (7.7%) | 6,430 (7.5%) |
| 45 to 54 Years | 7,148 (8.4%) | 6,074 (8.2%) |
| 55 to 64 Years | 9,354 (12.3%) | 6,284 (8.9%) |
| 65 to 74 Years | 6,396 (11.2%) | 7,382 (11.9%) |
| 75 Years and over | 4,318 (11.4%) | 10,319 (19.4%) |
| Total | 56,090 (9.5%) | 59,299 (10.3%) |
Income Above Poverty by Sex and Age in Area Code 415
According to the poverty statistics in Area Code 415, males aged under 5 years and females aged under 5 years are the age groups that are most secure financially, with 93.5% of males and 93.1% of females in these age groups living above the poverty line.
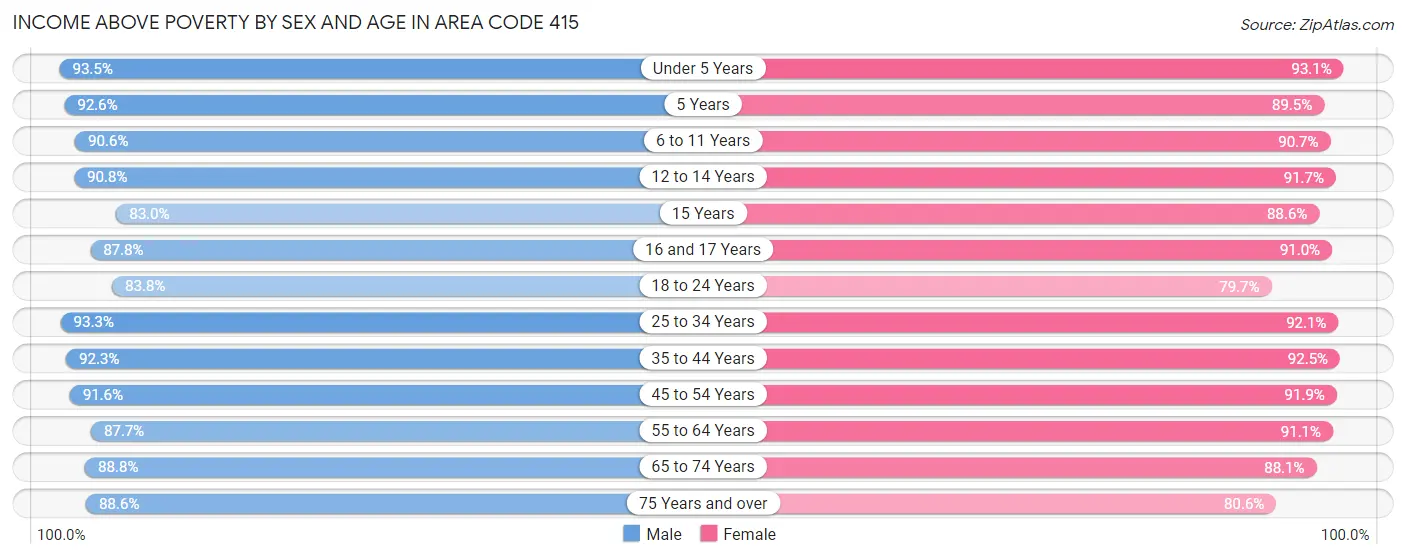
| Age Bracket | Male | Female |
| Under 5 Years | 23,418 (93.5%) | 22,975 (93.1%) |
| 5 Years | 4,227 (92.6%) | 4,212 (89.5%) |
| 6 to 11 Years | 26,224 (90.6%) | 24,151 (90.7%) |
| 12 to 14 Years | 13,469 (90.8%) | 13,359 (91.7%) |
| 15 Years | 3,765 (83.0%) | 4,336 (88.6%) |
| 16 and 17 Years | 8,758 (87.8%) | 8,488 (91.0%) |
| 18 to 24 Years | 29,436 (83.8%) | 27,478 (79.7%) |
| 25 to 34 Years | 109,068 (93.3%) | 99,875 (92.1%) |
| 35 to 44 Years | 87,615 (92.3%) | 78,739 (92.4%) |
| 45 to 54 Years | 78,031 (91.6%) | 68,436 (91.8%) |
| 55 to 64 Years | 66,544 (87.7%) | 64,651 (91.1%) |
| 65 to 74 Years | 50,538 (88.8%) | 54,495 (88.1%) |
| 75 Years and over | 33,543 (88.6%) | 42,926 (80.6%) |
| Total | 534,636 (90.5%) | 514,121 (89.7%) |
Income Below Poverty Among Married-Couple Families in Area Code 415
The poverty statistics for married-couple families in Area Code 415 show that 3.1% or 5,989 of the total 191,286 families live below the poverty line. Families with 3 or 4 children have the highest poverty rate of 7.6%, comprising of 633 families. On the other hand, families with 5 or more children have the lowest poverty rate of 2.2%, which includes 9 families.
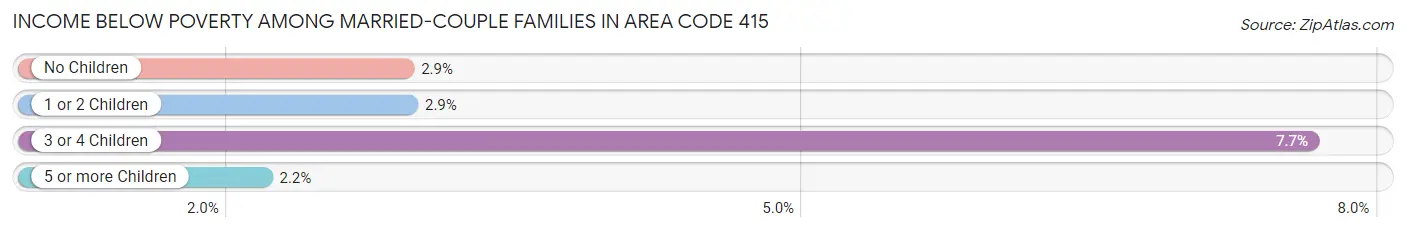
| Children | Above Poverty | Below Poverty |
| No Children | 114,473 (97.1%) | 3,446 (2.9%) |
| 1 or 2 Children | 62,775 (97.1%) | 1,901 (2.9%) |
| 3 or 4 Children | 7,645 (92.3%) | 633 (7.6%) |
| 5 or more Children | 404 (97.8%) | 9 (2.2%) |
| Total | 185,297 (96.9%) | 5,989 (3.1%) |
Income Below Poverty Among Single-Parent Households in Area Code 415
According to the poverty data in Area Code 415, 7.2% or 1,296 single-father households and 15.6% or 6,154 single-mother households are living below the poverty line. Among single-father households, those with 3 or 4 children have the highest poverty rate, with 58 households (12.4%) experiencing poverty. Likewise, among single-mother households, those with 3 or 4 children have the highest poverty rate, with 499 households (29.6%) falling below the poverty line.
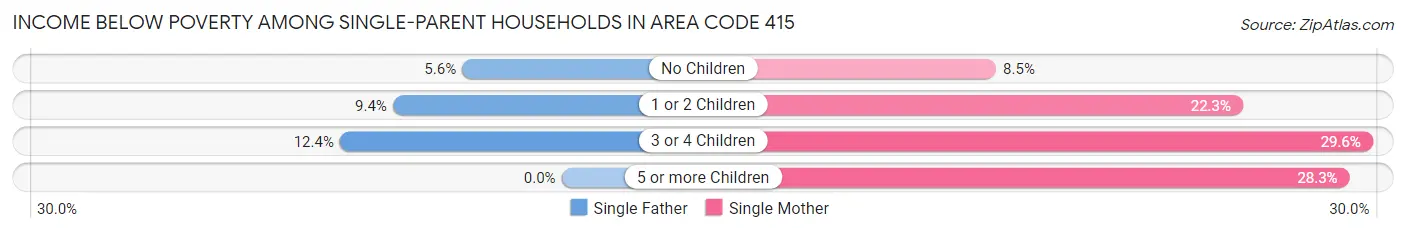
| Children | Single Father | Single Mother |
| No Children | 601 (5.6%) | 1,726 (8.5%) |
| 1 or 2 Children | 637 (9.4%) | 3,916 (22.3%) |
| 3 or 4 Children | 58 (12.4%) | 499 (29.6%) |
| 5 or more Children | 0 (0.0%) | 13 (28.3%) |
| Total | 1,296 (7.2%) | 6,154 (15.6%) |
Income Below Poverty Among Married-Couple vs Single-Parent Households in Area Code 415
The poverty data for Area Code 415 shows that 5,989 of the married-couple family households (3.1%) and 7,450 of the single-parent households (12.9%) are living below the poverty level. Within the married-couple family households, those with 3 or 4 children have the highest poverty rate, with 633 households (7.6%) falling below the poverty line. Among the single-parent households, those with 5 or more children have the highest poverty rate, with 13 household (28.3%) living below poverty.
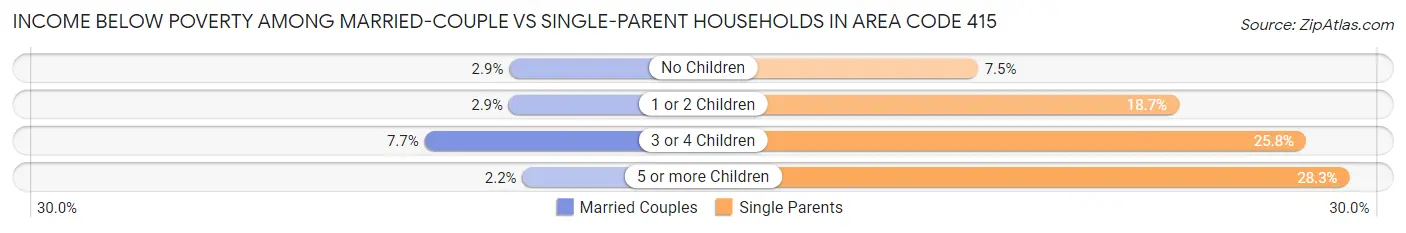
| Children | Married-Couple Families | Single-Parent Households |
| No Children | 3,446 (2.9%) | 2,327 (7.5%) |
| 1 or 2 Children | 1,901 (2.9%) | 4,553 (18.7%) |
| 3 or 4 Children | 633 (7.6%) | 557 (25.8%) |
| 5 or more Children | 9 (2.2%) | 13 (28.3%) |
| Total | 5,989 (3.1%) | 7,450 (12.9%) |
Race in Area Code 415
The most populous races in Area Code 415 are White / Caucasian (574,221 | 48.6%), Asian (329,958 | 28.0%), and Hispanic or Latino (182,624 | 15.5%).
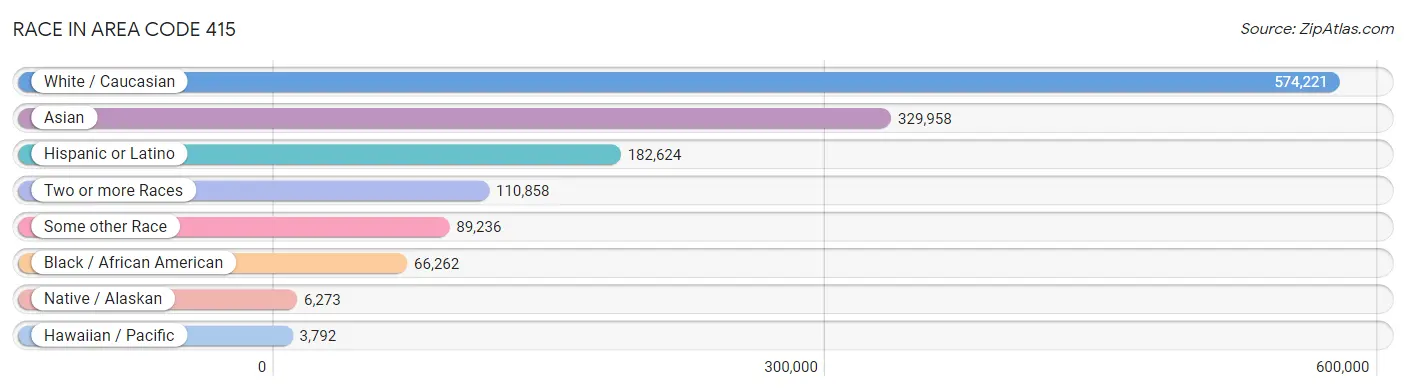
| Race | # Population | % Population |
| Asian | 329,958 | 28.0% |
| Black / African American | 66,262 | 5.6% |
| Hawaiian / Pacific | 3,792 | 0.3% |
| Hispanic or Latino | 182,624 | 15.5% |
| Native / Alaskan | 6,273 | 0.5% |
| White / Caucasian | 574,221 | 48.6% |
| Two or more Races | 110,858 | 9.4% |
| Some other Race | 89,236 | 7.6% |
| Total | 1,180,600 | 100.0% |
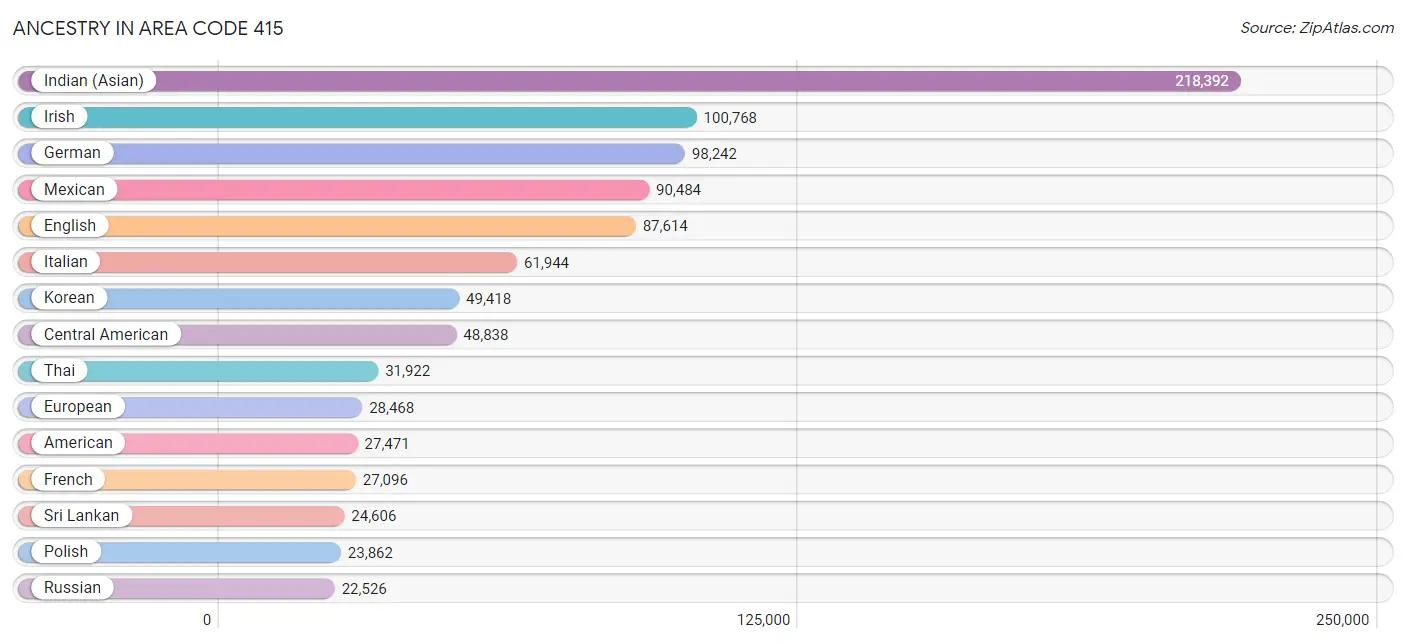
Ancestry in Area Code 415
The most populous ancestries reported in Area Code 415 are Indian (Asian) (218,392 | 18.5%), Irish (100,768 | 8.5%), German (98,242 | 8.3%), Mexican (90,484 | 7.7%), and English (87,614 | 7.4%), together accounting for 50.4% of all Area Code 415 residents.
| Ancestry | # Population | % Population |
| Afghan | 292 | 0.0% |
| African | 3,406 | 0.3% |
| Alaska Native | 69 | 0.0% |
| Albanian | 315 | 0.0% |
| Aleut | 27 | 0.0% |
| Alsatian | 90 | 0.0% |
| American | 27,471 | 2.3% |
| Apache | 1,271 | 0.1% |
| Arab | 12,816 | 1.1% |
| Arapaho | 8 | 0.0% |
| Argentinean | 1,856 | 0.2% |
| Armenian | 2,744 | 0.2% |
| Assyrian / Chaldean / Syriac | 574 | 0.1% |
| Australian | 1,511 | 0.1% |
| Austrian | 4,059 | 0.3% |
| Bangladeshi | 326 | 0.0% |
| Barbadian | 107 | 0.0% |
| Basque | 724 | 0.1% |
| Belgian | 1,738 | 0.2% |
| Belizean | 94 | 0.0% |
| Bermudan | 77 | 0.0% |
| Bhutanese | 21,929 | 1.9% |
| Blackfeet | 395 | 0.0% |
| Bolivian | 381 | 0.0% |
| Brazilian | 3,618 | 0.3% |
| British | 11,253 | 0.9% |
| British West Indian | 134 | 0.0% |
| Bulgarian | 758 | 0.1% |
| Burmese | 18,810 | 1.6% |
| Cajun | 115 | 0.0% |
| Cambodian | 794 | 0.1% |
| Canadian | 3,138 | 0.3% |
| Cape Verdean | 271 | 0.0% |
| Celtic | 181 | 0.0% |
| Central American | 48,838 | 4.1% |
| Central American Indian | 2,400 | 0.2% |
| Cherokee | 2,349 | 0.2% |
| Cheyenne | 22 | 0.0% |
| Chickasaw | 200 | 0.0% |
| Chilean | 1,336 | 0.1% |
| Chinese | 242 | 0.0% |
| Chippewa | 588 | 0.1% |
| Choctaw | 700 | 0.1% |
| Colombian | 2,948 | 0.3% |
| Comanche | 69 | 0.0% |
| Costa Rican | 842 | 0.1% |
| Cree | 53 | 0.0% |
| Creek | 137 | 0.0% |
| Croatian | 2,777 | 0.2% |
| Crow | 63 | 0.0% |
| Cuban | 2,849 | 0.2% |
| Cypriot | 15 | 0.0% |
| Czech | 3,919 | 0.3% |
| Czechoslovakian | 621 | 0.1% |
| Danish | 5,290 | 0.4% |
| Delaware | 86 | 0.0% |
| Dominican | 667 | 0.1% |
| Dutch | 8,837 | 0.7% |
| Dutch West Indian | 87 | 0.0% |
| Eastern European | 9,926 | 0.8% |
| Ecuadorian | 1,332 | 0.1% |
| Egyptian | 1,480 | 0.1% |
| English | 87,614 | 7.4% |
| Estonian | 131 | 0.0% |
| Ethiopian | 3,169 | 0.3% |
| European | 28,468 | 2.4% |
| Fijian | 26 | 0.0% |
| Filipino | 5,297 | 0.4% |
| Finnish | 2,621 | 0.2% |
| French | 27,096 | 2.3% |
| French American Indian | 45 | 0.0% |
| French Canadian | 3,840 | 0.3% |
| German | 98,242 | 8.3% |
| German Russian | 10 | 0.0% |
| Ghanaian | 175 | 0.0% |
| Greek | 7,380 | 0.6% |
| Guamanian / Chamorro | 930 | 0.1% |
| Guatemalan | 15,158 | 1.3% |
| Guyanese | 240 | 0.0% |
| Haitian | 496 | 0.0% |
| Honduran | 3,424 | 0.3% |
| Hopi | 68 | 0.0% |
| Hungarian | 4,979 | 0.4% |
| Icelander | 268 | 0.0% |
| Indian (Asian) | 218,392 | 18.5% |
| Indonesian | 1,017 | 0.1% |
| Inupiat | 5 | 0.0% |
| Iranian | 5,683 | 0.5% |
| Iraqi | 666 | 0.1% |
| Irish | 100,768 | 8.5% |
| Iroquois | 219 | 0.0% |
| Israeli | 906 | 0.1% |
| Italian | 61,944 | 5.2% |
| Jamaican | 1,798 | 0.2% |
| Japanese | 2,926 | 0.3% |
| Jordanian | 473 | 0.0% |
| Kenyan | 593 | 0.1% |
| Kiowa | 15 | 0.0% |
| Korean | 49,418 | 4.2% |
| Laotian | 1,388 | 0.1% |
| Latvian | 766 | 0.1% |
| Lebanese | 2,876 | 0.2% |
| Liberian | 153 | 0.0% |
| Lithuanian | 4,042 | 0.3% |
| Lumbee | 20 | 0.0% |
| Luxembourger | 111 | 0.0% |
| Macedonian | 256 | 0.0% |
| Malaysian | 1,000 | 0.1% |
| Maltese | 341 | 0.0% |
| Menominee | 6 | 0.0% |
| Mexican | 90,484 | 7.7% |
| Mexican American Indian | 2,465 | 0.2% |
| Mongolian | 751 | 0.1% |
| Moroccan | 633 | 0.1% |
| Native Hawaiian | 2,395 | 0.2% |
| Navajo | 563 | 0.1% |
| Nepalese | 15 | 0.0% |
| New Zealander | 248 | 0.0% |
| Nicaraguan | 8,755 | 0.7% |
| Nigerian | 2,335 | 0.2% |
| Northern European | 5,637 | 0.5% |
| Norwegian | 12,324 | 1.0% |
| Okinawan | 193 | 0.0% |
| Osage | 30 | 0.0% |
| Ottawa | 16 | 0.0% |
| Paiute | 104 | 0.0% |
| Pakistani | 3,509 | 0.3% |
| Palestinian | 887 | 0.1% |
| Panamanian | 883 | 0.1% |
| Paraguayan | 136 | 0.0% |
| Pennsylvania German | 116 | 0.0% |
| Peruvian | 5,692 | 0.5% |
| Pima | 18 | 0.0% |
| Polish | 23,862 | 2.0% |
| Portuguese | 6,754 | 0.6% |
| Potawatomi | 169 | 0.0% |
| Pueblo | 141 | 0.0% |
| Puerto Rican | 7,369 | 0.6% |
| Puget Sound Salish | 6 | 0.0% |
| Romanian | 2,111 | 0.2% |
| Russian | 22,526 | 1.9% |
| Salvadoran | 19,562 | 1.7% |
| Samoan | 2,035 | 0.2% |
| Scandinavian | 2,672 | 0.2% |
| Scotch-Irish | 6,688 | 0.6% |
| Scottish | 19,271 | 1.6% |
| Seminole | 144 | 0.0% |
| Senegalese | 29 | 0.0% |
| Serbian | 943 | 0.1% |
| Sierra Leonean | 27 | 0.0% |
| Sioux | 311 | 0.0% |
| Slavic | 402 | 0.0% |
| Slovak | 1,287 | 0.1% |
| Slovene | 1,034 | 0.1% |
| Somali | 18 | 0.0% |
| South African | 849 | 0.1% |
| South American | 15,380 | 1.3% |
| South American Indian | 264 | 0.0% |
| Soviet Union | 74 | 0.0% |
| Spaniard | 5,312 | 0.4% |
| Spanish | 4,159 | 0.4% |
| Spanish American | 79 | 0.0% |
| Spanish American Indian | 68 | 0.0% |
| Sri Lankan | 24,606 | 2.1% |
| Subsaharan African | 12,252 | 1.0% |
| Sudanese | 136 | 0.0% |
| Swedish | 14,470 | 1.2% |
| Swiss | 4,519 | 0.4% |
| Syrian | 948 | 0.1% |
| Taiwanese | 25 | 0.0% |
| Thai | 31,922 | 2.7% |
| Tlingit-Haida | 57 | 0.0% |
| Tohono O'Odham | 8 | 0.0% |
| Tongan | 542 | 0.1% |
| Trinidadian and Tobagonian | 151 | 0.0% |
| Turkish | 2,201 | 0.2% |
| U.S. Virgin Islander | 2 | 0.0% |
| Ugandan | 174 | 0.0% |
| Ukrainian | 7,769 | 0.7% |
| Uruguayan | 356 | 0.0% |
| Ute | 14 | 0.0% |
| Venezuelan | 1,239 | 0.1% |
| Vietnamese | 403 | 0.0% |
| Welsh | 5,294 | 0.4% |
| West Indian | 402 | 0.0% |
| Yaqui | 118 | 0.0% |
| Yugoslavian | 384 | 0.0% |
| Yuman | 1 | 0.0% |
| Yup'ik | 17 | 0.0% |
| Zimbabwean | 91 | 0.0% | View All 190 Rows |
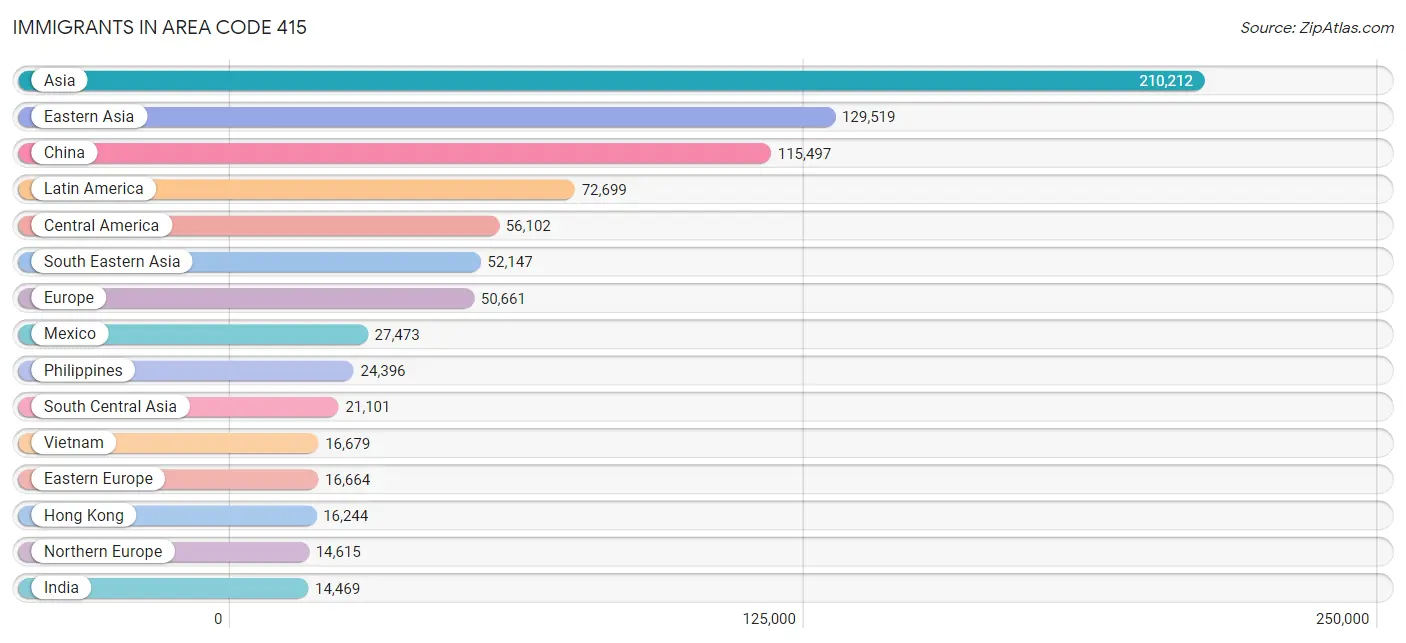
Immigrants in Area Code 415
The most numerous immigrant groups reported in Area Code 415 came from Asia (210,212 | 17.8%), Eastern Asia (129,519 | 11.0%), China (115,497 | 9.8%), Latin America (72,699 | 6.2%), and Central America (56,102 | 4.8%), together accounting for 49.5% of all Area Code 415 residents.
| Immigration Origin | # Population | % Population |
| Afghanistan | 158 | 0.0% |
| Africa | 8,470 | 0.7% |
| Albania | 71 | 0.0% |
| Argentina | 1,160 | 0.1% |
| Armenia | 392 | 0.0% |
| Asia | 210,212 | 17.8% |
| Australia | 2,347 | 0.2% |
| Austria | 496 | 0.0% |
| Azores | 225 | 0.0% |
| Bahamas | 55 | 0.0% |
| Bangladesh | 482 | 0.0% |
| Barbados | 72 | 0.0% |
| Belarus | 671 | 0.1% |
| Belgium | 1,083 | 0.1% |
| Belize | 148 | 0.0% |
| Bolivia | 180 | 0.0% |
| Bosnia and Herzegovina | 143 | 0.0% |
| Brazil | 4,764 | 0.4% |
| Bulgaria | 460 | 0.0% |
| Cabo Verde | 80 | 0.0% |
| Cambodia | 1,749 | 0.2% |
| Cameroon | 121 | 0.0% |
| Canada | 7,799 | 0.7% |
| Caribbean | 2,167 | 0.2% |
| Central America | 56,102 | 4.8% |
| Chile | 571 | 0.1% |
| China | 115,497 | 9.8% |
| Colombia | 1,832 | 0.2% |
| Costa Rica | 304 | 0.0% |
| Croatia | 181 | 0.0% |
| Cuba | 688 | 0.1% |
| Czechoslovakia | 249 | 0.0% |
| Denmark | 465 | 0.0% |
| Dominican Republic | 203 | 0.0% |
| Eastern Africa | 3,153 | 0.3% |
| Eastern Asia | 129,519 | 11.0% |
| Eastern Europe | 16,664 | 1.4% |
| Ecuador | 263 | 0.0% |
| Egypt | 623 | 0.1% |
| El Salvador | 11,456 | 1.0% |
| England | 3,162 | 0.3% |
| Eritrea | 768 | 0.1% |
| Ethiopia | 1,255 | 0.1% |
| Europe | 50,661 | 4.3% |
| Fiji | 581 | 0.1% |
| France | 5,554 | 0.5% |
| Germany | 4,821 | 0.4% |
| Ghana | 71 | 0.0% |
| Greece | 564 | 0.1% |
| Grenada | 33 | 0.0% |
| Guatemala | 9,704 | 0.8% |
| Guyana | 123 | 0.0% |
| Haiti | 109 | 0.0% |
| Honduras | 2,467 | 0.2% |
| Hong Kong | 16,244 | 1.4% |
| Hungary | 579 | 0.1% |
| India | 14,469 | 1.2% |
| Indonesia | 1,110 | 0.1% |
| Iran | 3,281 | 0.3% |
| Iraq | 287 | 0.0% |
| Ireland | 3,609 | 0.3% |
| Israel | 1,121 | 0.1% |
| Italy | 2,745 | 0.2% |
| Jamaica | 791 | 0.1% |
| Japan | 5,339 | 0.4% |
| Jordan | 406 | 0.0% |
| Kazakhstan | 284 | 0.0% |
| Kenya | 659 | 0.1% |
| Korea | 8,239 | 0.7% |
| Kuwait | 123 | 0.0% |
| Laos | 429 | 0.0% |
| Latin America | 72,699 | 6.2% |
| Latvia | 174 | 0.0% |
| Lebanon | 669 | 0.1% |
| Liberia | 292 | 0.0% |
| Lithuania | 177 | 0.0% |
| Malaysia | 1,365 | 0.1% |
| Mexico | 27,473 | 2.3% |
| Middle Africa | 142 | 0.0% |
| Moldova | 431 | 0.0% |
| Morocco | 442 | 0.0% |
| Nepal | 759 | 0.1% |
| Netherlands | 973 | 0.1% |
| Nicaragua | 4,156 | 0.4% |
| Nigeria | 816 | 0.1% |
| North Macedonia | 90 | 0.0% |
| Northern Africa | 1,966 | 0.2% |
| Northern Europe | 14,615 | 1.2% |
| Norway | 319 | 0.0% |
| Oceania | 4,803 | 0.4% |
| Pakistan | 907 | 0.1% |
| Panama | 391 | 0.0% |
| Peru | 3,775 | 0.3% |
| Philippines | 24,396 | 2.1% |
| Poland | 994 | 0.1% |
| Portugal | 396 | 0.0% |
| Romania | 611 | 0.1% |
| Russia | 5,731 | 0.5% |
| Saudi Arabia | 189 | 0.0% |
| Scotland | 448 | 0.0% |
| Senegal | 43 | 0.0% |
| Serbia | 193 | 0.0% |
| Sierra Leone | 67 | 0.0% |
| Singapore | 859 | 0.1% |
| Somalia | 86 | 0.0% |
| South Africa | 1,272 | 0.1% |
| South America | 14,430 | 1.2% |
| South Central Asia | 21,101 | 1.8% |
| South Eastern Asia | 52,147 | 4.4% |
| Southern Europe | 5,504 | 0.5% |
| Spain | 1,765 | 0.2% |
| Sri Lanka | 548 | 0.1% |
| Sudan | 72 | 0.0% |
| Sweden | 702 | 0.1% |
| Switzerland | 715 | 0.1% |
| Syria | 322 | 0.0% |
| Taiwan | 6,051 | 0.5% |
| Thailand | 2,401 | 0.2% |
| Trinidad and Tobago | 115 | 0.0% |
| Turkey | 1,461 | 0.1% |
| Uganda | 61 | 0.0% |
| Ukraine | 4,646 | 0.4% |
| Uruguay | 328 | 0.0% |
| Uzbekistan | 183 | 0.0% |
| Venezuela | 1,130 | 0.1% |
| Vietnam | 16,679 | 1.4% |
| West Indies | 4 | 0.0% |
| Western Africa | 1,826 | 0.2% |
| Western Asia | 7,128 | 0.6% |
| Western Europe | 13,697 | 1.2% |
| Yemen | 1,279 | 0.1% |
| Zaire | 15 | 0.0% |
| Zimbabwe | 72 | 0.0% | View All 133 Rows |
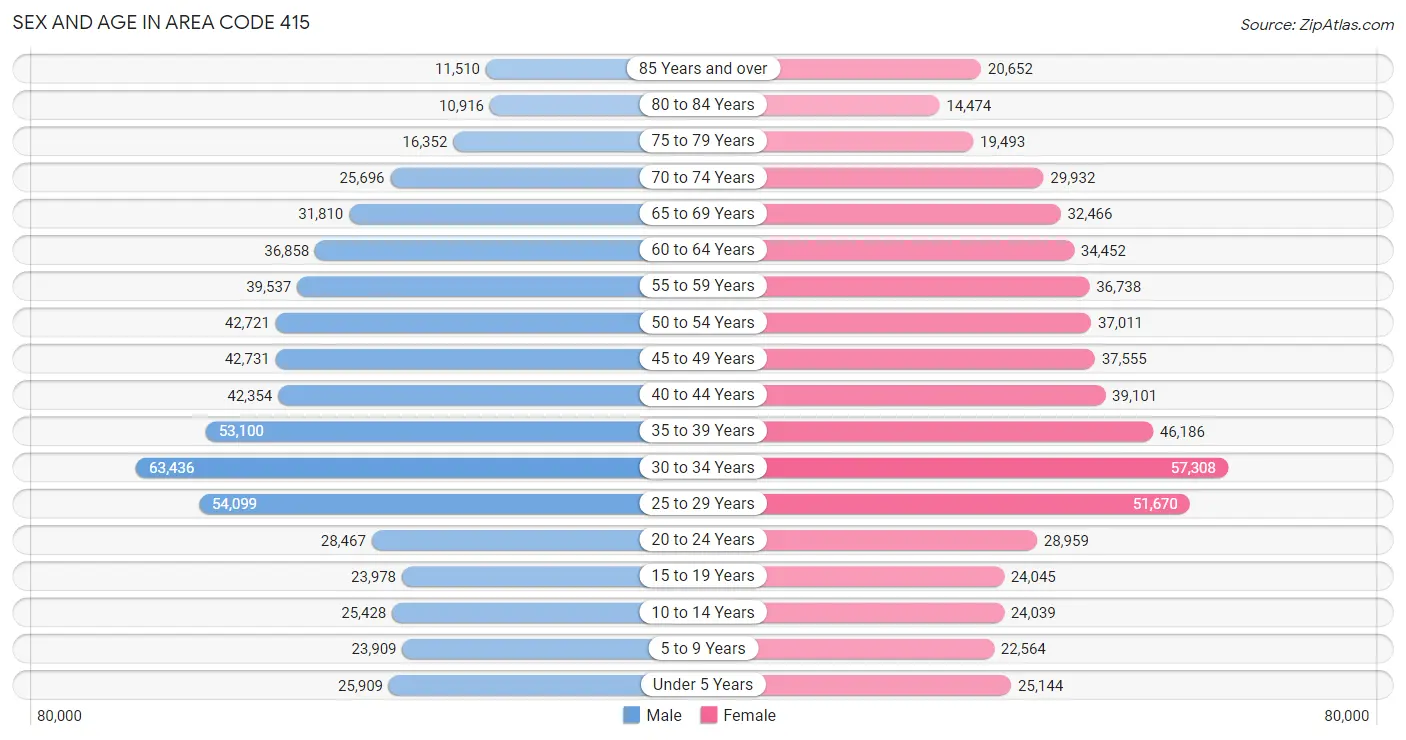
Sex and Age in Area Code 415
Sex and Age in Area Code 415
The most populous age groups in Area Code 415 are 30 to 34 Years (63,436 | 10.6%) for men and 30 to 34 Years (57,308 | 9.9%) for women.
| Age Bracket | Male | Female |
| Under 5 Years | 25,909 (4.3%) | 25,144 (4.3%) |
| 5 to 9 Years | 23,909 (4.0%) | 22,564 (3.9%) |
| 10 to 14 Years | 25,428 (4.3%) | 24,039 (4.1%) |
| 15 to 19 Years | 23,978 (4.0%) | 24,045 (4.1%) |
| 20 to 24 Years | 28,467 (4.8%) | 28,959 (5.0%) |
| 25 to 29 Years | 54,099 (9.0%) | 51,670 (8.9%) |
| 30 to 34 Years | 63,436 (10.6%) | 57,308 (9.9%) |
| 35 to 39 Years | 53,100 (8.9%) | 46,186 (7.9%) |
| 40 to 44 Years | 42,354 (7.1%) | 39,101 (6.7%) |
| 45 to 49 Years | 42,731 (7.1%) | 37,555 (6.5%) |
| 50 to 54 Years | 42,721 (7.1%) | 37,011 (6.4%) |
| 55 to 59 Years | 39,537 (6.6%) | 36,738 (6.3%) |
| 60 to 64 Years | 36,858 (6.2%) | 34,452 (5.9%) |
| 65 to 69 Years | 31,810 (5.3%) | 32,466 (5.6%) |
| 70 to 74 Years | 25,696 (4.3%) | 29,932 (5.1%) |
| 75 to 79 Years | 16,352 (2.7%) | 19,493 (3.4%) |
| 80 to 84 Years | 10,916 (1.8%) | 14,474 (2.5%) |
| 85 Years and over | 11,510 (1.9%) | 20,652 (3.5%) |
| Total | 598,811 (100.0%) | 581,789 (100.0%) |
Families and Households in Area Code 415
Median Family Size in Area Code 415
The median family size in Area Code 415 is 2.92 persons per family, with single female/mother families (39,549 | 15.9%) accounting for the largest median family size of 2.93893 persons per family. On the other hand, single male/father families (18,028 | 7.2%) represent the smallest median family size with 2.71 persons per family.
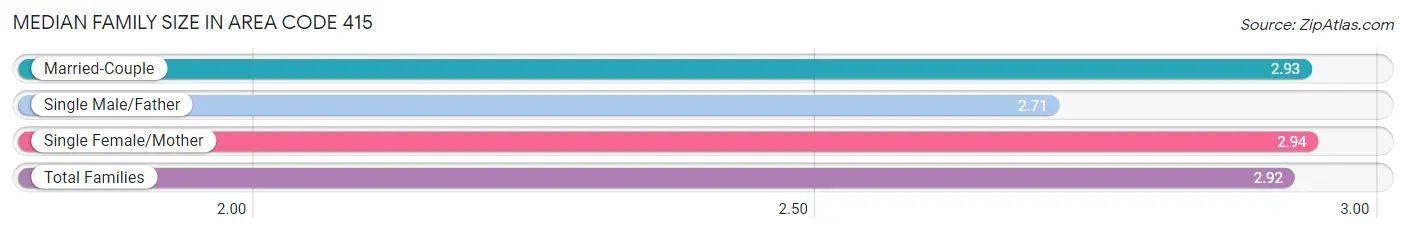
| Family Type | # Families | Family Size |
| Married-Couple | 191,286 (76.9%) | 2.93 |
| Single Male/Father | 18,028 (7.2%) | 2.71 |
| Single Female/Mother | 39,549 (15.9%) | 2.94 |
| Total Families | 248,863 (100.0%) | 2.92 |
Median Household Size in Area Code 415
The median household size in Area Code 415 is 2.28 persons per household, with single female/mother households (39,549 | 7.9%) accounting for the largest median household size of 3.18553 persons per household. non-family households (251,439 | 50.3%) represent the smallest median household size with 1.41 persons per household.
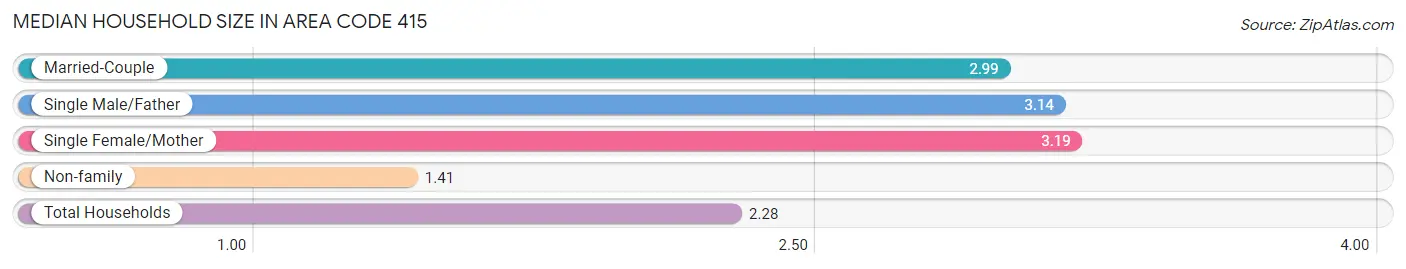
| Household Type | # Households | Household Size |
| Married-Couple | 191,286 (38.2%) | 2.99 |
| Single Male/Father | 18,028 (3.6%) | 3.14 |
| Single Female/Mother | 39,549 (7.9%) | 3.19 |
| Non-family | 251,439 (50.3%) | 1.41 |
| Total Households | 500,302 (100.0%) | 2.28 |
Household Size by Marriage Status in Area Code 415
Out of a total of 500,302 households in Area Code 415, 248,863 (49.7%) are family households, while 251,439 (50.3%) are nonfamily households. The most numerous type of family households are 2-person households, comprising 116,335, and the most common type of nonfamily households are 1-person households, comprising 180,697.
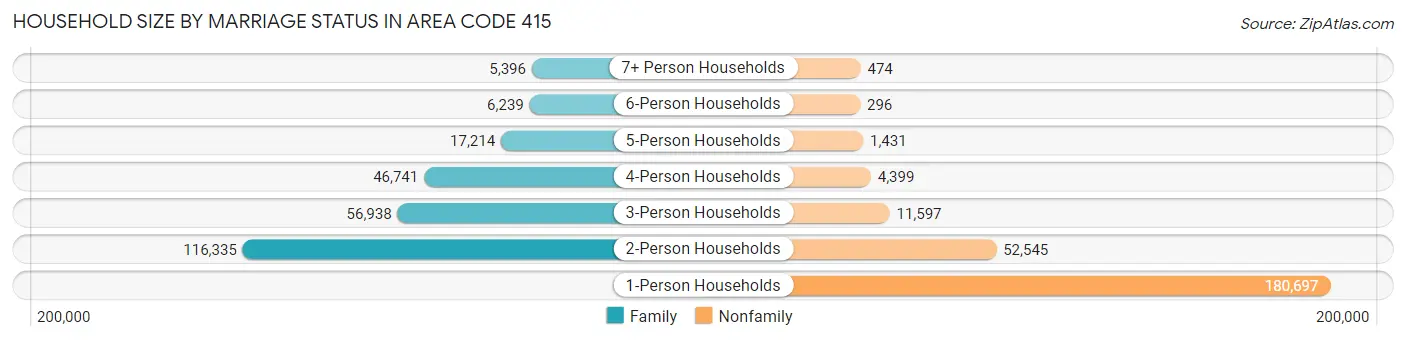
| Household Size | Family Households | Nonfamily Households |
| 1-Person Households | - | 180,697 (36.1%) |
| 2-Person Households | 116,335 (23.3%) | 52,545 (10.5%) |
| 3-Person Households | 56,938 (11.4%) | 11,597 (2.3%) |
| 4-Person Households | 46,741 (9.3%) | 4,399 (0.9%) |
| 5-Person Households | 17,214 (3.4%) | 1,431 (0.3%) |
| 6-Person Households | 6,239 (1.3%) | 296 (0.1%) |
| 7+ Person Households | 5,396 (1.1%) | 474 (0.1%) |
| Total | 248,863 (49.7%) | 251,439 (50.3%) |
Female Fertility in Area Code 415
Fertility by Age in Area Code 415
Average fertility rate in Area Code 415 is 52.0 births per 1,000 women. Women in the age bracket of 35 to 50 years have the highest fertility rate with 56.5 births per 1,000 women. Women in the age bracket of 35 to 50 years acount for 52.8% of all women with births.
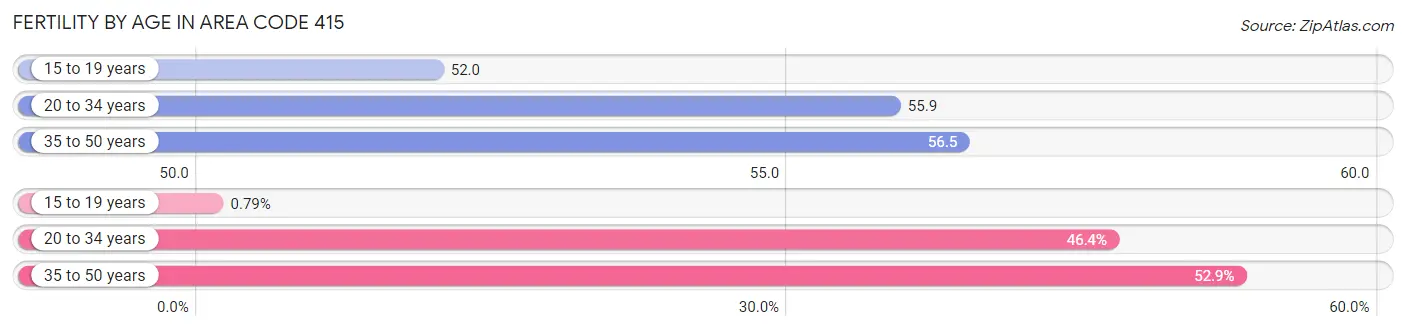
| Age Bracket | Women with Births | Births / 1,000 Women |
| 15 to 19 years | 89 (0.8%) | 52.0 |
| 20 to 34 years | 5,194 (46.4%) | 55.9 |
| 35 to 50 years | 5,921 (52.8%) | 56.5 |
| Total | 11,204 (100.0%) | 52.0 |
Fertility by Age by Marriage Status in Area Code 415
77.5% of women with births (11,204) in Area Code 415 are married. The highest percentage of unmarried women with births falls into 15 to 19 years age bracket with 100.0% of them unmarried at the time of birth, while the lowest percentage of unmarried women with births belong to 35 to 50 years age bracket with 23.3% of them unmarried.
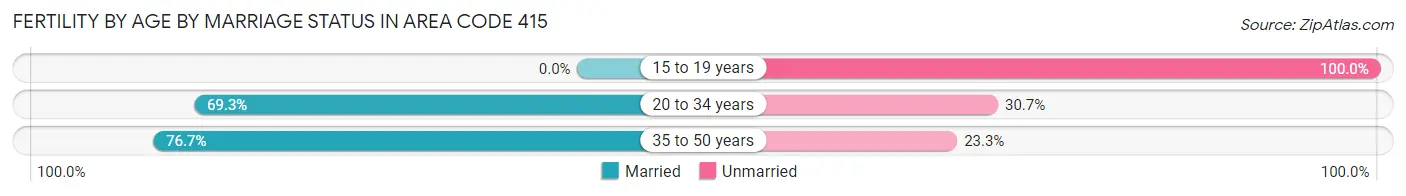
| Age Bracket | Married | Unmarried |
| 15 to 19 years | 0 (0.0%) | 89 (100.0%) |
| 20 to 34 years | 3,600 (69.3%) | 1,594 (30.7%) |
| 35 to 50 years | 4,542 (76.7%) | 1,379 (23.3%) |
| Total | 8,686 (77.5%) | 2,518 (22.5%) |
Fertility by Education in Area Code 415
Average fertility rate in Area Code 415 is 52.0 births per 1,000 women. Women with the education attainment of high school diploma have the highest fertility rate of 102.5 births per 1,000 women, while women with the education attainment of bachelor's degree have the lowest fertility at 41.3 births per 1,000 women. Women with the education attainment of bachelor's degree represent 35.4% of all women with births.
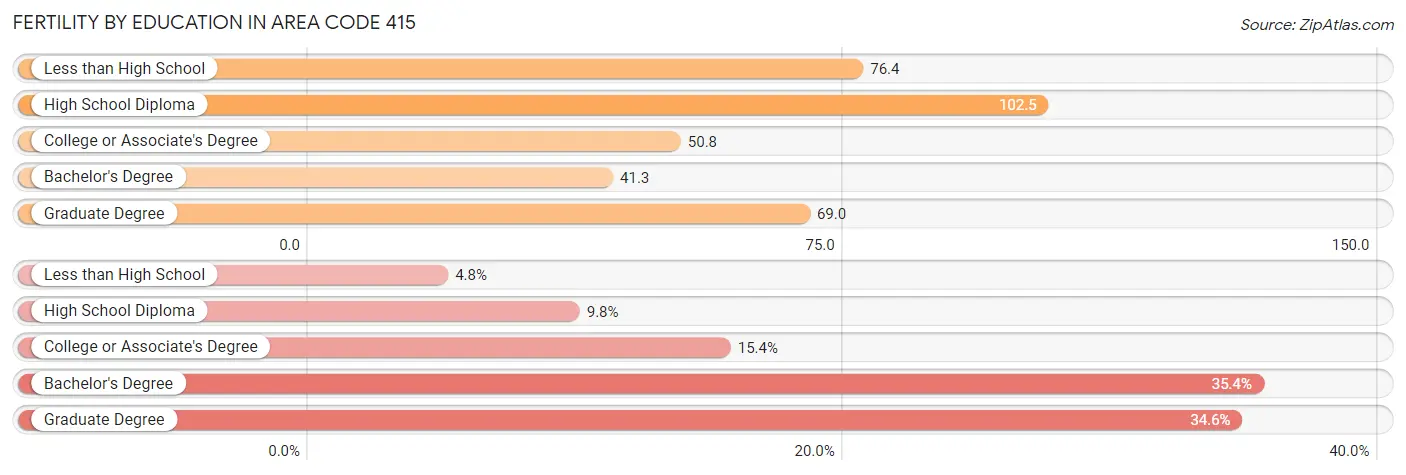
| Educational Attainment | Women with Births | Births / 1,000 Women |
| Less than High School | 541 (4.8%) | 76.4 |
| High School Diploma | 1,094 (9.8%) | 102.5 |
| College or Associate's Degree | 1,728 (15.4%) | 50.8 |
| Bachelor's Degree | 3,965 (35.4%) | 41.3 |
| Graduate Degree | 3,876 (34.6%) | 69.0 |
| Total | 11,204 (100.0%) | 52.0 |
Fertility by Education by Marriage Status in Area Code 415
22.5% of women with births in Area Code 415 are unmarried. Women with the educational attainment of bachelor's degree are most likely to be married with 75.7% of them married at childbirth, while women with the educational attainment of less than high school are least likely to be married with 85.0% of them unmarried at childbirth.
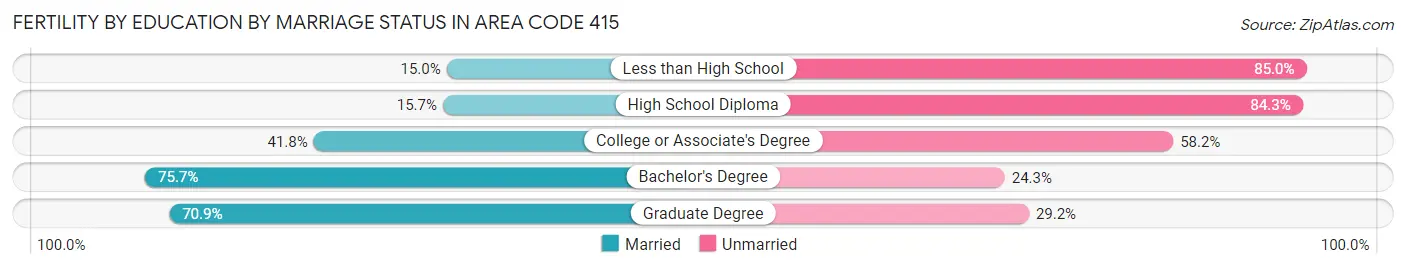
| Educational Attainment | Married | Unmarried |
| Less than High School | 81 (15.0%) | 460 (85.0%) |
| High School Diploma | 172 (15.7%) | 922 (84.3%) |
| College or Associate's Degree | 722 (41.8%) | 1,006 (58.2%) |
| Bachelor's Degree | 3,002 (75.7%) | 963 (24.3%) |
| Graduate Degree | 2,746 (70.9%) | 1,130 (29.1%) |
| Total | 8,686 (77.5%) | 2,518 (22.5%) |
Employment Characteristics in Area Code 415
Employment by Class of Employer in Area Code 415
Among the 654,904 employed individuals in Area Code 415, private company employees (434,326 | 66.3%), not-for-profit organizations (60,526 | 9.2%), and self-employed (not incorporated) (53,805 | 8.2%) make up the most common classes of employment.
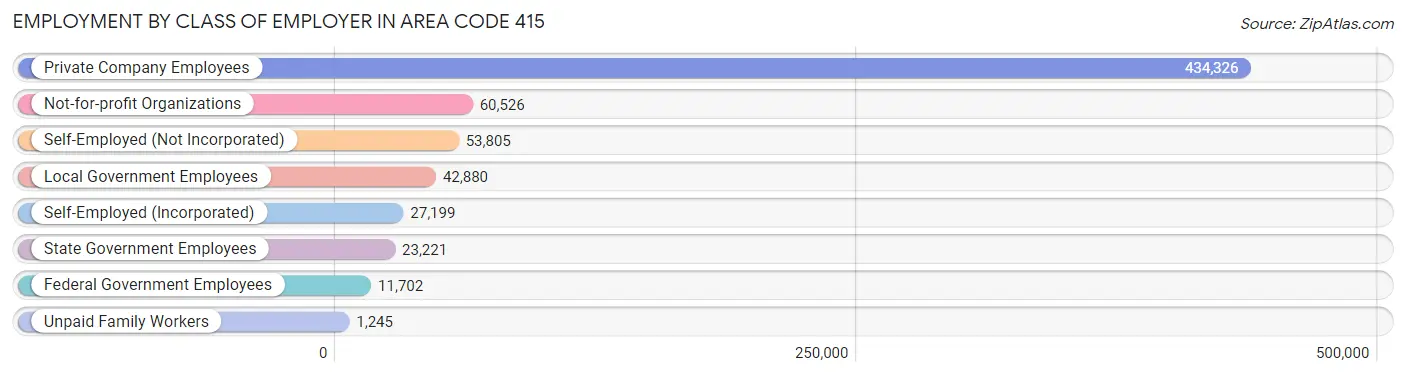
| Employer Class | # Employees | % Employees |
| Private Company Employees | 434,326 | 66.3% |
| Self-Employed (Incorporated) | 27,199 | 4.2% |
| Self-Employed (Not Incorporated) | 53,805 | 8.2% |
| Not-for-profit Organizations | 60,526 | 9.2% |
| Local Government Employees | 42,880 | 6.6% |
| State Government Employees | 23,221 | 3.5% |
| Federal Government Employees | 11,702 | 1.8% |
| Unpaid Family Workers | 1,245 | 0.2% |
| Total | 654,904 | 100.0% |
Employment Status by Age in Area Code 415
According to the labor force statistics for Area Code 415, out of the total population over 16 years of age (1,024,154), 67.7% or 693,250 individuals are in the labor force, with 6.1% or 42,496 of them unemployed. The age group with the highest labor force participation rate is 25 to 29 years, with 90.7% or 95,901 individuals in the labor force. Within the labor force, the 16 to 19 years age range has the highest percentage of unemployed individuals, with 660.4% or 78,456 of them being unemployed.
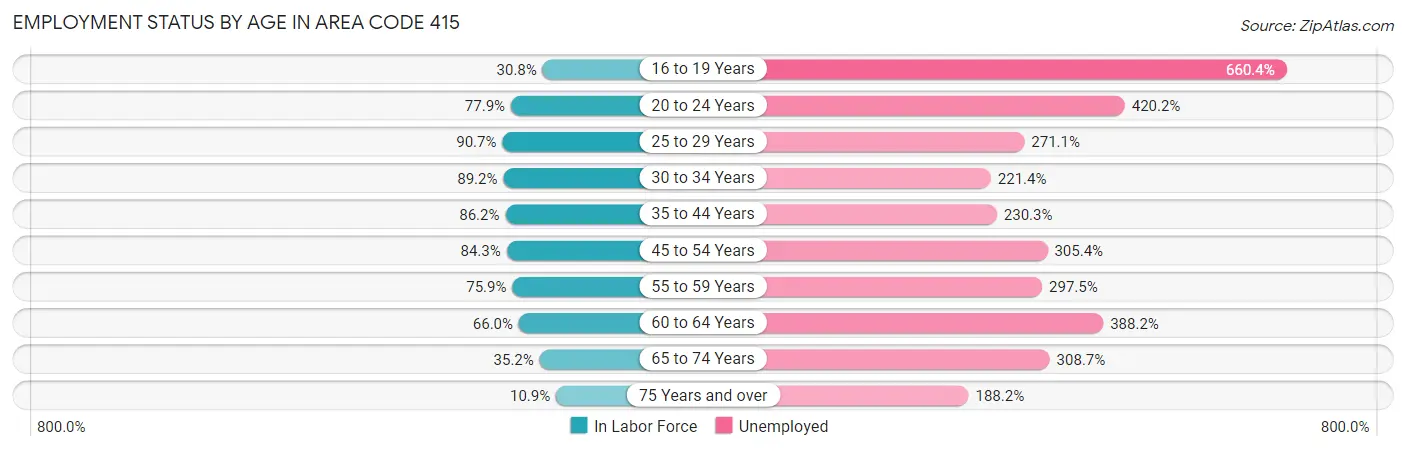
| Age Bracket | In Labor Force | Unemployed |
| 16 to 19 Years | 11,880 (30.8%) | 78,456 (660.4%) |
| 20 to 24 Years | 44,720 (77.9%) | 187,905 (420.2%) |
| 25 to 29 Years | 95,903 (90.7%) | 259,988 (271.1%) |
| 30 to 34 Years | 107,739 (89.2%) | 238,536 (221.4%) |
| 35 to 44 Years | 155,718 (86.2%) | 358,637 (230.3%) |
| 45 to 54 Years | 134,915 (84.3%) | 412,018 (305.4%) |
| 55 to 59 Years | 57,867 (75.9%) | 172,163 (297.5%) |
| 60 to 64 Years | 47,096 (66.0%) | 182,815 (388.2%) |
| 65 to 74 Years | 42,229 (35.2%) | 130,364 (308.7%) |
| 75 Years and over | 10,149 (10.9%) | 19,106 (188.2%) |
| Total | 693,267 (67.7%) | 42,465 (6.1%) |
Employment Status by Educational Attainment in Area Code 415
According to labor force statistics for Area Code 415, 83.8% of individuals (599,050) out of the total population between 25 and 64 years of age (714,857) are in the labor force, with 268.7% or 1,609,647 of them being unemployed. The group with the highest labor force participation rate are those with the educational attainment of bachelor's degree or higher, with 87.7% or 405,802 individuals in the labor force. Within the labor force, individuals with college / associate degree education have the highest percentage of unemployment, with 425.5% or 416,471 of them being unemployed.
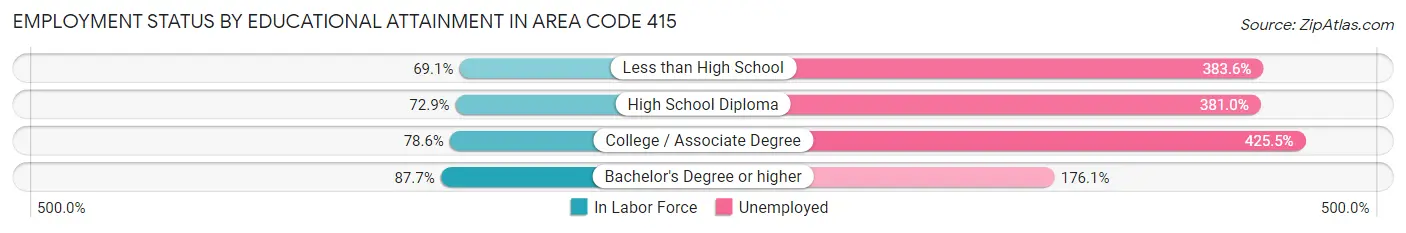
| Educational Attainment | In Labor Force | Unemployed |
| Less than High School | 37,368 (69.1%) | 207,328 (383.6%) |
| High School Diploma | 53,789 (72.9%) | 280,968 (381.0%) |
| College / Associate Degree | 97,883 (78.6%) | 529,999 (425.5%) |
| Bachelor's Degree or higher | 405,790 (87.7%) | 814,471 (176.1%) |
| Total | 599,065 (83.8%) | 1,920,821 (268.7%) |
Employment Occupations by Sex in Area Code 415
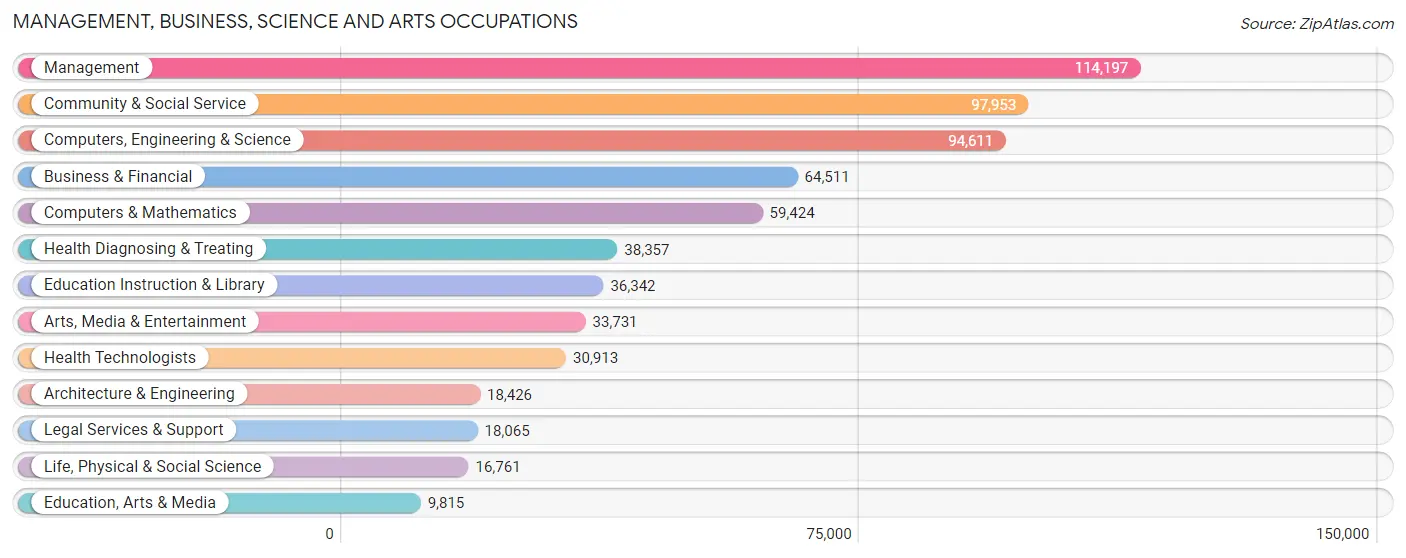
Management, Business, Science and Arts Occupations
The most common Management, Business, Science and Arts occupations in Area Code 415 are Management (114,197 | 17.1%), Community & Social Service (97,953 | 14.6%), Computers, Engineering & Science (94,611 | 14.1%), Business & Financial (64,511 | 9.7%), and Computers & Mathematics (59,424 | 8.9%).
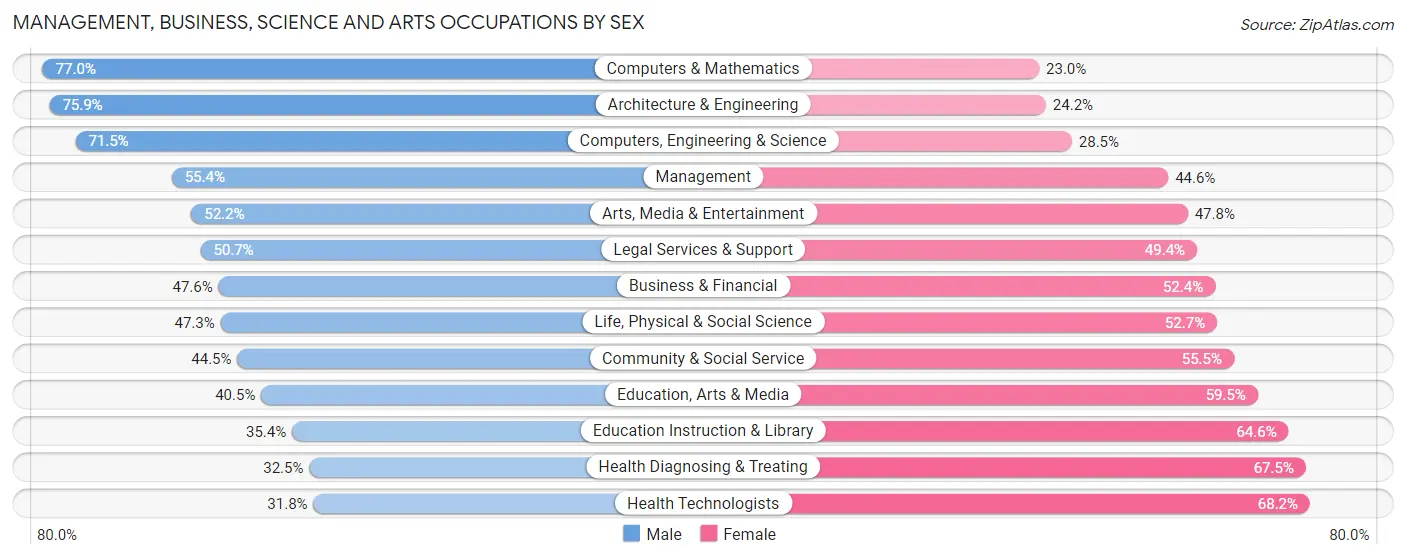
Management, Business, Science and Arts Occupations by Sex
Within the Management, Business, Science and Arts occupations in Area Code 415, the most male-oriented occupations are Computers & Mathematics (77.0%), Architecture & Engineering (75.8%), and Computers, Engineering & Science (71.5%), while the most female-oriented occupations are Health Technologists (68.2%), Health Diagnosing & Treating (67.5%), and Education Instruction & Library (64.6%).
| Occupation | Male | Female |
| Management | 63,308 (55.4%) | 50,889 (44.6%) |
| Business & Financial | 30,732 (47.6%) | 33,779 (52.4%) |
| Computers, Engineering & Science | 67,652 (71.5%) | 26,959 (28.5%) |
| Computers & Mathematics | 45,747 (77.0%) | 13,677 (23.0%) |
| Architecture & Engineering | 13,977 (75.8%) | 4,449 (24.1%) |
| Life, Physical & Social Science | 7,928 (47.3%) | 8,833 (52.7%) |
| Community & Social Service | 43,579 (44.5%) | 54,374 (55.5%) |
| Education, Arts & Media | 3,976 (40.5%) | 5,839 (59.5%) |
| Legal Services & Support | 9,150 (50.6%) | 8,915 (49.3%) |
| Education Instruction & Library | 12,853 (35.4%) | 23,489 (64.6%) |
| Arts, Media & Entertainment | 17,600 (52.2%) | 16,131 (47.8%) |
| Health Diagnosing & Treating | 12,461 (32.5%) | 25,896 (67.5%) |
| Health Technologists | 9,831 (31.8%) | 21,082 (68.2%) |
| Total (Category) | 217,732 (53.1%) | 191,897 (46.9%) |
| Total (Overall) | 356,847 (53.4%) | 311,637 (46.6%) |
Services Occupations
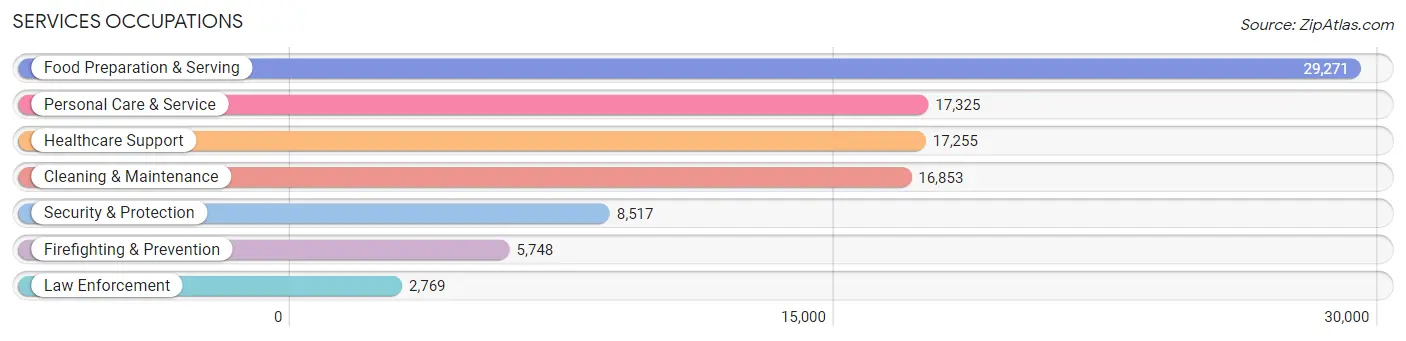
The most common Services occupations in Area Code 415 are Food Preparation & Serving (29,271 | 4.4%), Personal Care & Service (17,325 | 2.6%), Healthcare Support (17,255 | 2.6%), Cleaning & Maintenance (16,853 | 2.5%), and Security & Protection (8,517 | 1.3%).
Services Occupations by Sex
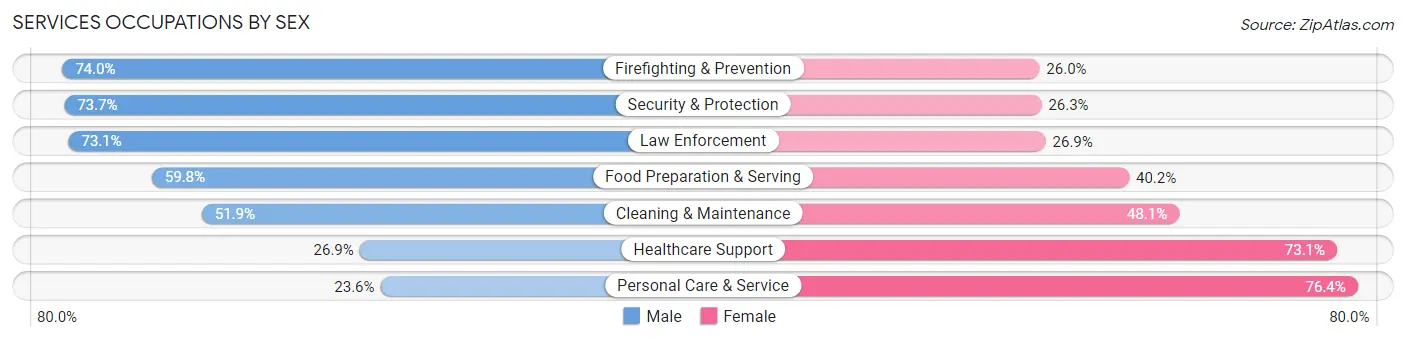
Within the Services occupations in Area Code 415, the most male-oriented occupations are Firefighting & Prevention (74.0%), Security & Protection (73.7%), and Law Enforcement (73.1%), while the most female-oriented occupations are Personal Care & Service (76.4%), Healthcare Support (73.1%), and Cleaning & Maintenance (48.1%).
| Occupation | Male | Female |
| Healthcare Support | 4,647 (26.9%) | 12,608 (73.1%) |
| Security & Protection | 6,279 (73.7%) | 2,238 (26.3%) |
| Firefighting & Prevention | 4,256 (74.0%) | 1,492 (26.0%) |
| Law Enforcement | 2,023 (73.1%) | 746 (26.9%) |
| Food Preparation & Serving | 17,517 (59.8%) | 11,754 (40.2%) |
| Cleaning & Maintenance | 8,752 (51.9%) | 8,101 (48.1%) |
| Personal Care & Service | 4,096 (23.6%) | 13,229 (76.4%) |
| Total (Category) | 41,291 (46.3%) | 47,930 (53.7%) |
| Total (Overall) | 356,847 (53.4%) | 311,637 (46.6%) |
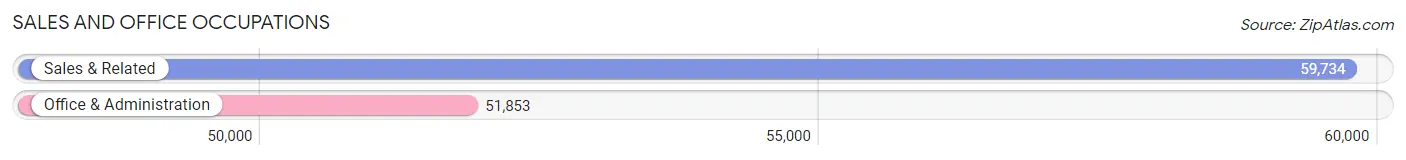
Sales and Office Occupations
The most common Sales and Office occupations in Area Code 415 are Sales & Related (59,734 | 8.9%), and Office & Administration (51,853 | 7.8%).
Sales and Office Occupations by Sex
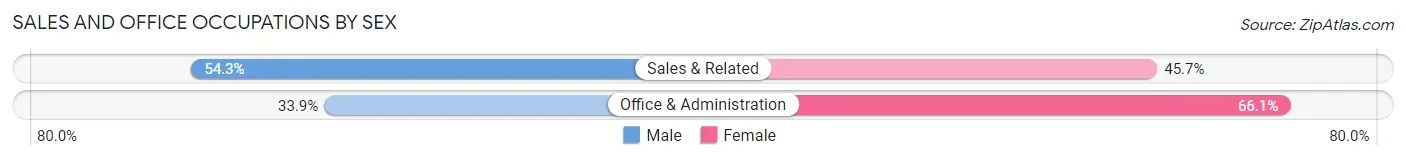
| Occupation | Male | Female |
| Sales & Related | 32,460 (54.3%) | 27,274 (45.7%) |
| Office & Administration | 17,594 (33.9%) | 34,259 (66.1%) |
| Total (Category) | 50,054 (44.9%) | 61,533 (55.1%) |
| Total (Overall) | 356,847 (53.4%) | 311,637 (46.6%) |
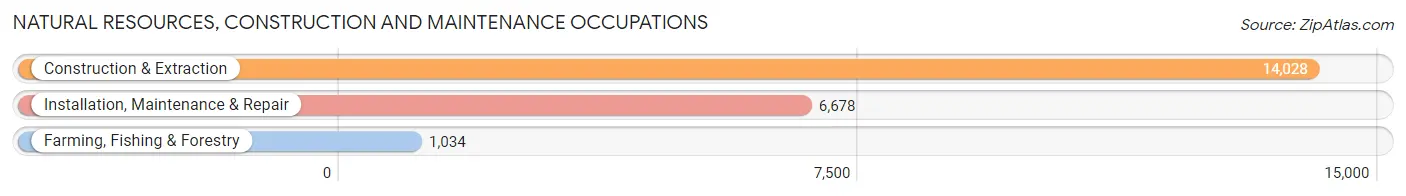
Natural Resources, Construction and Maintenance Occupations
The most common Natural Resources, Construction and Maintenance occupations in Area Code 415 are Construction & Extraction (14,028 | 2.1%), Installation, Maintenance & Repair (6,678 | 1.0%), and Farming, Fishing & Forestry (1,034 | 0.2%).
Natural Resources, Construction and Maintenance Occupations by Sex
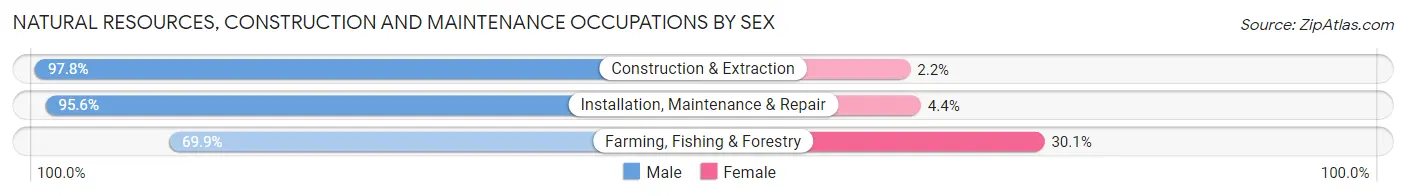
| Occupation | Male | Female |
| Farming, Fishing & Forestry | 723 (69.9%) | 311 (30.1%) |
| Construction & Extraction | 13,723 (97.8%) | 305 (2.2%) |
| Installation, Maintenance & Repair | 6,386 (95.6%) | 292 (4.4%) |
| Total (Category) | 20,832 (95.8%) | 908 (4.2%) |
| Total (Overall) | 356,847 (53.4%) | 311,637 (46.6%) |
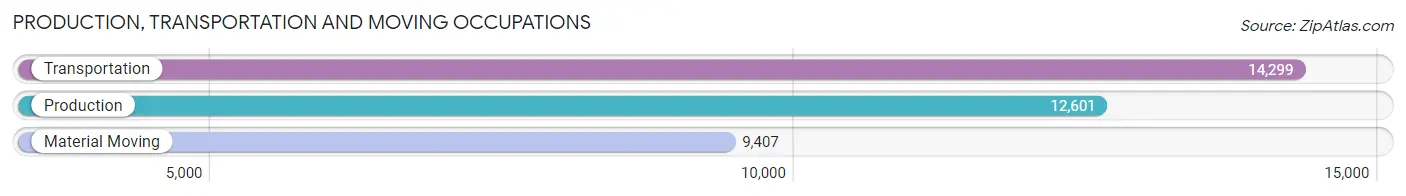
Production, Transportation and Moving Occupations
The most common Production, Transportation and Moving occupations in Area Code 415 are Transportation (14,299 | 2.1%), Production (12,601 | 1.9%), and Material Moving (9,407 | 1.4%).
Production, Transportation and Moving Occupations by Sex
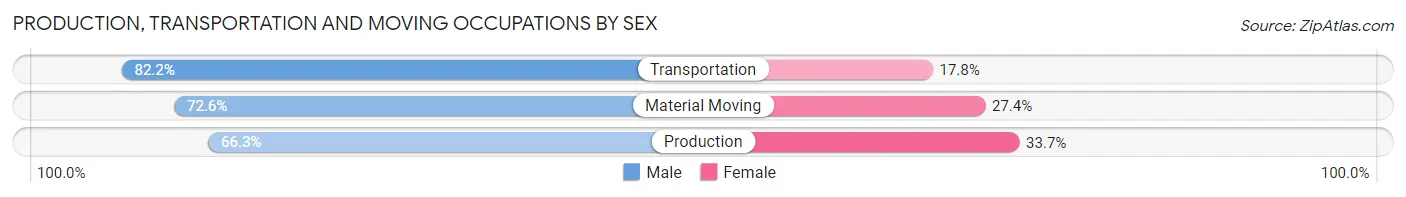
| Occupation | Male | Female |
| Production | 8,356 (66.3%) | 4,245 (33.7%) |
| Transportation | 11,755 (82.2%) | 2,544 (17.8%) |
| Material Moving | 6,827 (72.6%) | 2,580 (27.4%) |
| Total (Category) | 26,938 (74.2%) | 9,369 (25.8%) |
| Total (Overall) | 356,847 (53.4%) | 311,637 (46.6%) |
Employment Industries by Sex in Area Code 415
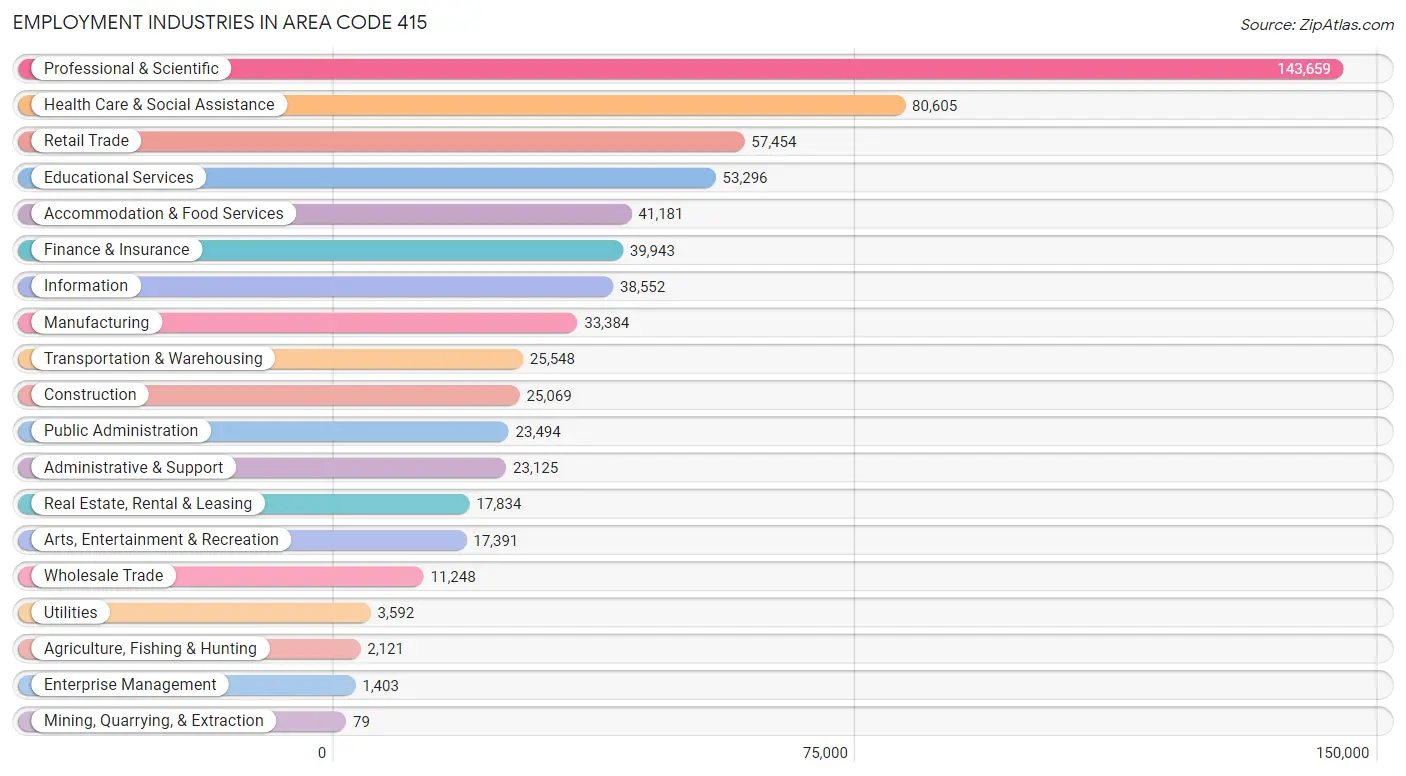
Employment Industries in Area Code 415
The major employment industries in Area Code 415 include Professional & Scientific (143,659 | 21.5%), Health Care & Social Assistance (80,605 | 12.1%), Retail Trade (57,454 | 8.6%), Educational Services (53,296 | 8.0%), and Accommodation & Food Services (41,181 | 6.2%).
Employment Industries by Sex in Area Code 415
The Area Code 415 industries that see more men than women are Construction (87.0%), Transportation & Warehousing (73.6%), and Agriculture, Fishing & Hunting (66.8%), whereas the industries that tend to have a higher number of women are Health Care & Social Assistance (69.1%), Educational Services (62.5%), and Public Administration (51.4%).
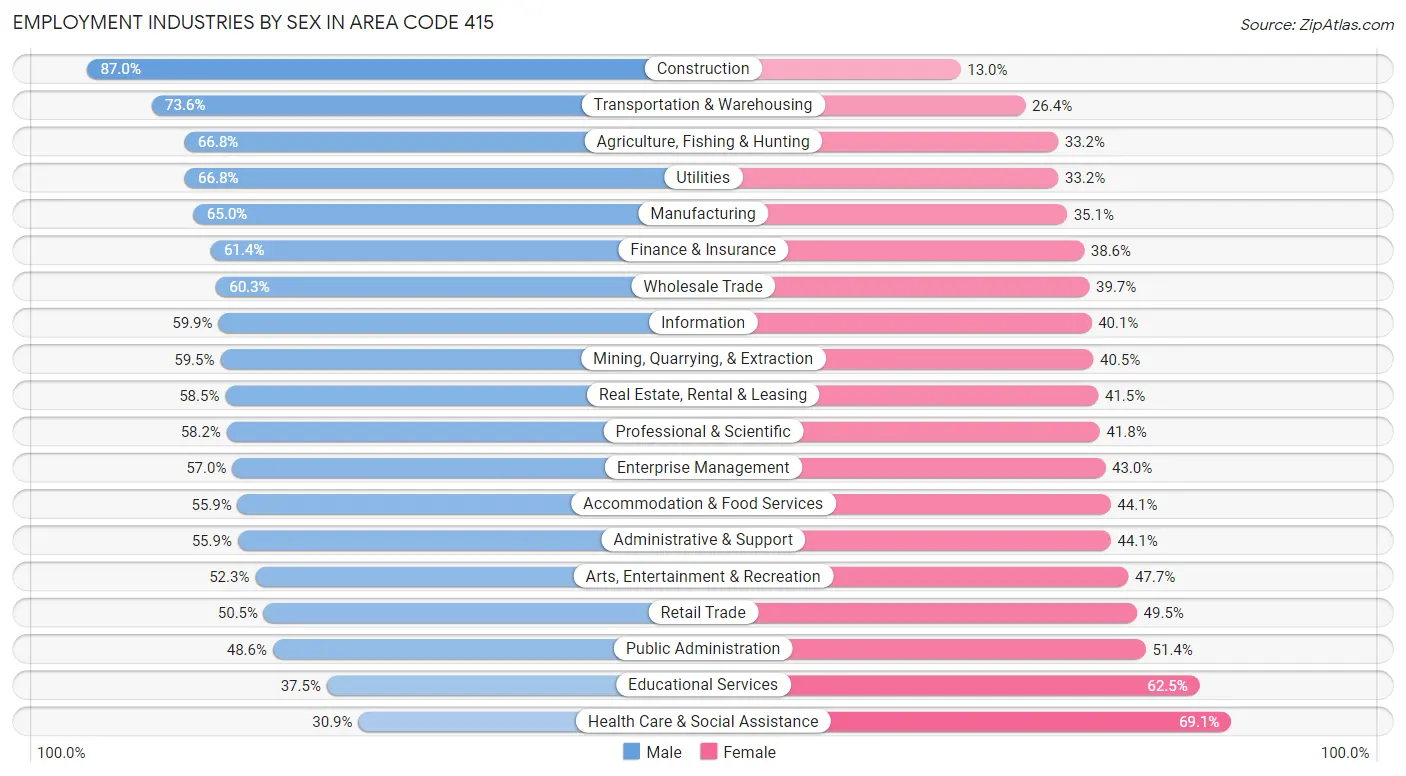
| Industry | Male | Female |
| Agriculture, Fishing & Hunting | 1,417 (66.8%) | 704 (33.2%) |
| Mining, Quarrying, & Extraction | 47 (59.5%) | 32 (40.5%) |
| Construction | 21,804 (87.0%) | 3,265 (13.0%) |
| Manufacturing | 21,682 (64.9%) | 11,702 (35.0%) |
| Wholesale Trade | 6,785 (60.3%) | 4,463 (39.7%) |
| Retail Trade | 29,005 (50.5%) | 28,449 (49.5%) |
| Transportation & Warehousing | 18,803 (73.6%) | 6,745 (26.4%) |
| Utilities | 2,398 (66.8%) | 1,194 (33.2%) |
| Information | 23,087 (59.9%) | 15,465 (40.1%) |
| Finance & Insurance | 24,528 (61.4%) | 15,415 (38.6%) |
| Real Estate, Rental & Leasing | 10,428 (58.5%) | 7,406 (41.5%) |
| Professional & Scientific | 83,572 (58.2%) | 60,087 (41.8%) |
| Enterprise Management | 800 (57.0%) | 603 (43.0%) |
| Administrative & Support | 12,922 (55.9%) | 10,203 (44.1%) |
| Educational Services | 19,965 (37.5%) | 33,331 (62.5%) |
| Health Care & Social Assistance | 24,925 (30.9%) | 55,680 (69.1%) |
| Arts, Entertainment & Recreation | 9,089 (52.3%) | 8,302 (47.7%) |
| Accommodation & Food Services | 23,034 (55.9%) | 18,147 (44.1%) |
| Public Administration | 11,424 (48.6%) | 12,070 (51.4%) |
| Total | 356,847 (53.4%) | 311,637 (46.6%) |
Education in Area Code 415
School Enrollment in Area Code 415
The most common levels of schooling among the 224,689 students in Area Code 415 are college / undergraduate (58,664 | 26.1%), high school (40,272 | 17.9%), and middle school (37,272 | 16.6%).
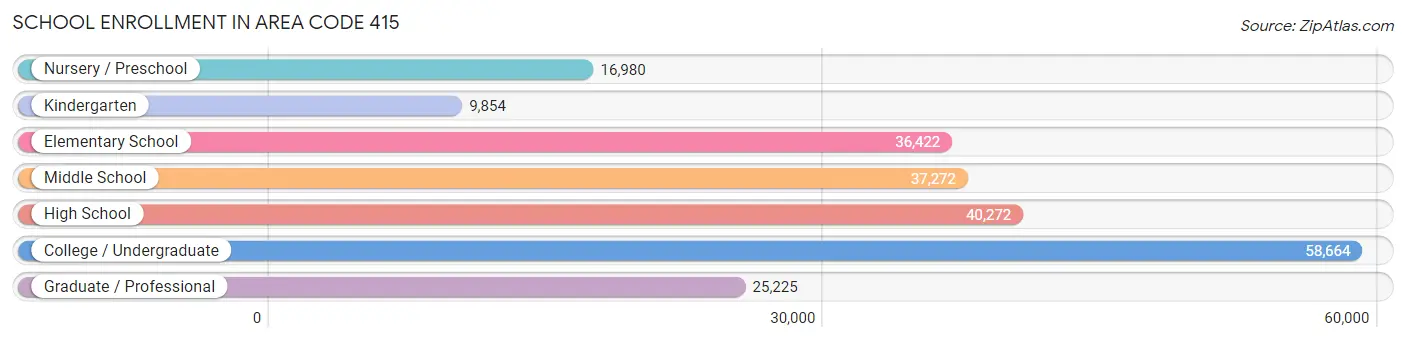
| School Level | # Students | % Students |
| Nursery / Preschool | 16,980 | 7.6% |
| Kindergarten | 9,854 | 4.4% |
| Elementary School | 36,422 | 16.2% |
| Middle School | 37,272 | 16.6% |
| High School | 40,272 | 17.9% |
| College / Undergraduate | 58,664 | 26.1% |
| Graduate / Professional | 25,225 | 11.2% |
| Total | 224,689 | 100.0% |
School Enrollment by Age by Funding Source in Area Code 415
Out of a total of 224,689 students who are enrolled in schools in Area Code 415, 67,135 (29.9%) attend a private institution, while the remaining 157,554 (70.1%) are enrolled in public schools. The age group of 3 to 4 year olds has the highest likelihood of being enrolled in private schools, with 9,283 (66.8% in the age bracket) enrolled. Conversely, the age group of 15 to 17 year olds has the lowest likelihood of being enrolled in a private school, with 22,101 (77.4% in the age bracket) attending a public institution.
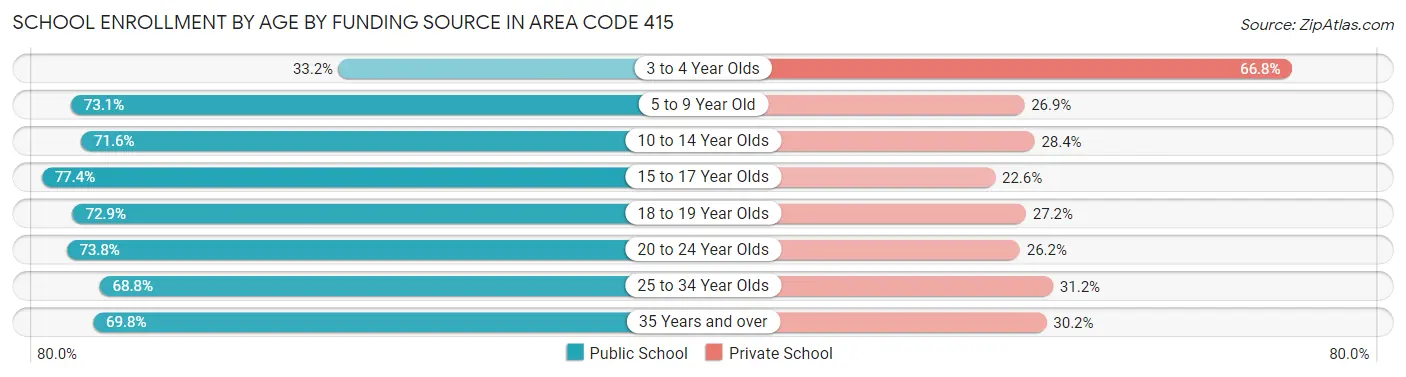
| Age Bracket | Public School | Private School |
| 3 to 4 Year Olds | 4,606 (33.2%) | 9,283 (66.8%) |
| 5 to 9 Year Old | 32,655 (73.1%) | 12,014 (26.9%) |
| 10 to 14 Year Olds | 34,596 (71.6%) | 13,742 (28.4%) |
| 15 to 17 Year Olds | 22,101 (77.4%) | 6,440 (22.6%) |
| 18 to 19 Year Olds | 12,263 (72.9%) | 4,571 (27.2%) |
| 20 to 24 Year Olds | 19,439 (73.8%) | 6,914 (26.2%) |
| 25 to 34 Year Olds | 17,552 (68.8%) | 7,951 (31.2%) |
| 35 Years and over | 14,352 (69.8%) | 6,210 (30.2%) |
| Total | 157,554 (70.1%) | 67,135 (29.9%) |
Educational Attainment by Field of Study in Area Code 415
Business (96,012 | 15.5%), social sciences (85,242 | 13.8%), engineering (53,668 | 8.7%), bio, nature & agricultural (45,963 | 7.4%), and visual & performing arts (45,318 | 7.3%) are the most common fields of study among 617,474 individuals in Area Code 415 who have obtained a bachelor's degree or higher.
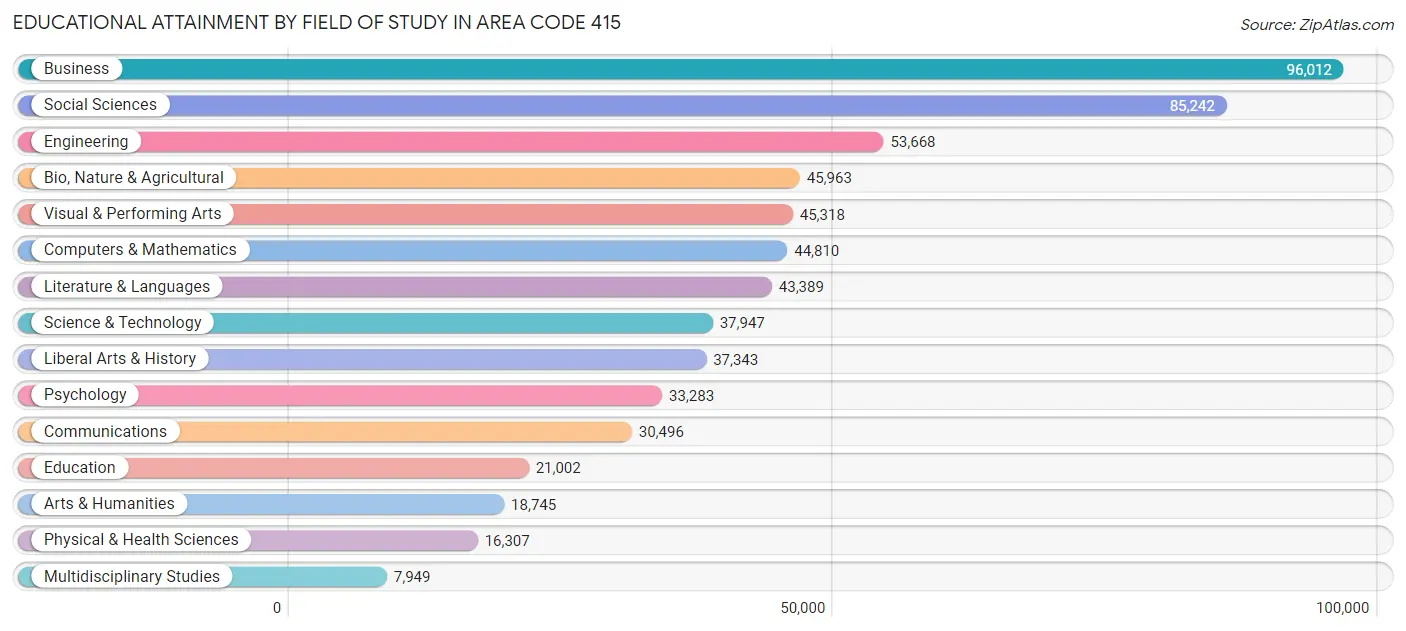
| Field of Study | # Graduates | % Graduates |
| Computers & Mathematics | 44,810 | 7.3% |
| Bio, Nature & Agricultural | 45,963 | 7.4% |
| Physical & Health Sciences | 16,307 | 2.6% |
| Psychology | 33,283 | 5.4% |
| Social Sciences | 85,242 | 13.8% |
| Engineering | 53,668 | 8.7% |
| Multidisciplinary Studies | 7,949 | 1.3% |
| Science & Technology | 37,947 | 6.1% |
| Business | 96,012 | 15.5% |
| Education | 21,002 | 3.4% |
| Literature & Languages | 43,389 | 7.0% |
| Liberal Arts & History | 37,343 | 6.0% |
| Visual & Performing Arts | 45,318 | 7.3% |
| Communications | 30,496 | 4.9% |
| Arts & Humanities | 18,745 | 3.0% |
| Total | 617,474 | 100.0% |
Transportation & Commute in Area Code 415
Vehicle Availability by Sex in Area Code 415
The most prevalent vehicle ownership categories in Area Code 415 are males with 1 vehicle (124,612, accounting for 35.8%) and females with 1 vehicle (116,957, making up 41.4%).
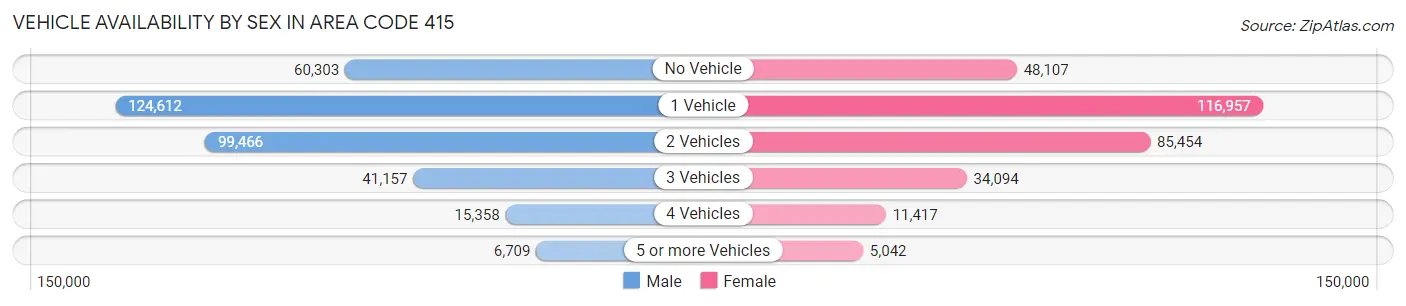
| Vehicles Available | Male | Female |
| No Vehicle | 60,303 (17.3%) | 48,107 (16.0%) |
| 1 Vehicle | 124,612 (35.8%) | 116,957 (38.9%) |
| 2 Vehicles | 99,466 (28.6%) | 85,454 (28.4%) |
| 3 Vehicles | 41,157 (11.8%) | 34,094 (11.3%) |
| 4 Vehicles | 15,358 (4.4%) | 11,417 (3.8%) |
| 5 or more Vehicles | 6,709 (1.9%) | 5,042 (1.7%) |
| Total | 347,605 (100.0%) | 301,071 (100.0%) |
Commute Time in Area Code 415
The most frequently occuring commute durations in Area Code 415 are 30 to 34 minutes (89,636 commuters, 18.0%), 20 to 24 minutes (68,069 commuters, 13.7%), and 15 to 19 minutes (63,796 commuters, 12.8%).
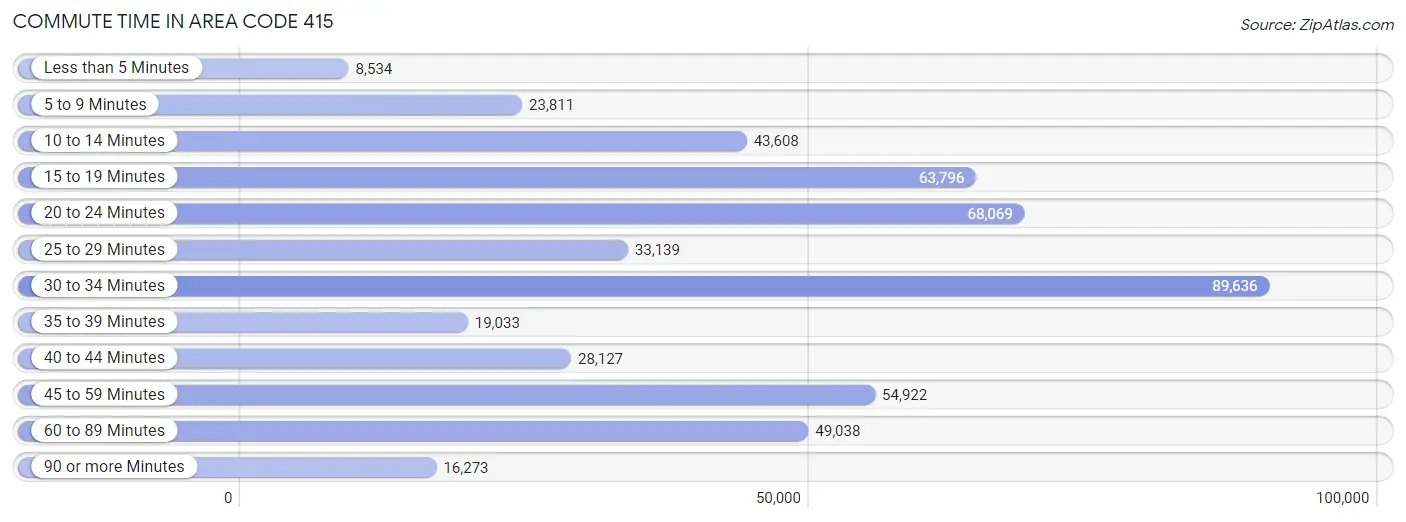
| Commute Time | # Commuters | % Commuters |
| Less than 5 Minutes | 8,534 | 1.7% |
| 5 to 9 Minutes | 23,811 | 4.8% |
| 10 to 14 Minutes | 43,608 | 8.8% |
| 15 to 19 Minutes | 63,796 | 12.8% |
| 20 to 24 Minutes | 68,069 | 13.7% |
| 25 to 29 Minutes | 33,139 | 6.7% |
| 30 to 34 Minutes | 89,636 | 18.0% |
| 35 to 39 Minutes | 19,033 | 3.8% |
| 40 to 44 Minutes | 28,127 | 5.7% |
| 45 to 59 Minutes | 54,922 | 11.0% |
| 60 to 89 Minutes | 49,038 | 9.9% |
| 90 or more Minutes | 16,273 | 3.3% |
Commute Time by Sex in Area Code 415
The most common commute times in Area Code 415 are 30 to 34 minutes (47,010 commuters, 17.6%) for males and 30 to 34 minutes (42,626 commuters, 18.4%) for females.
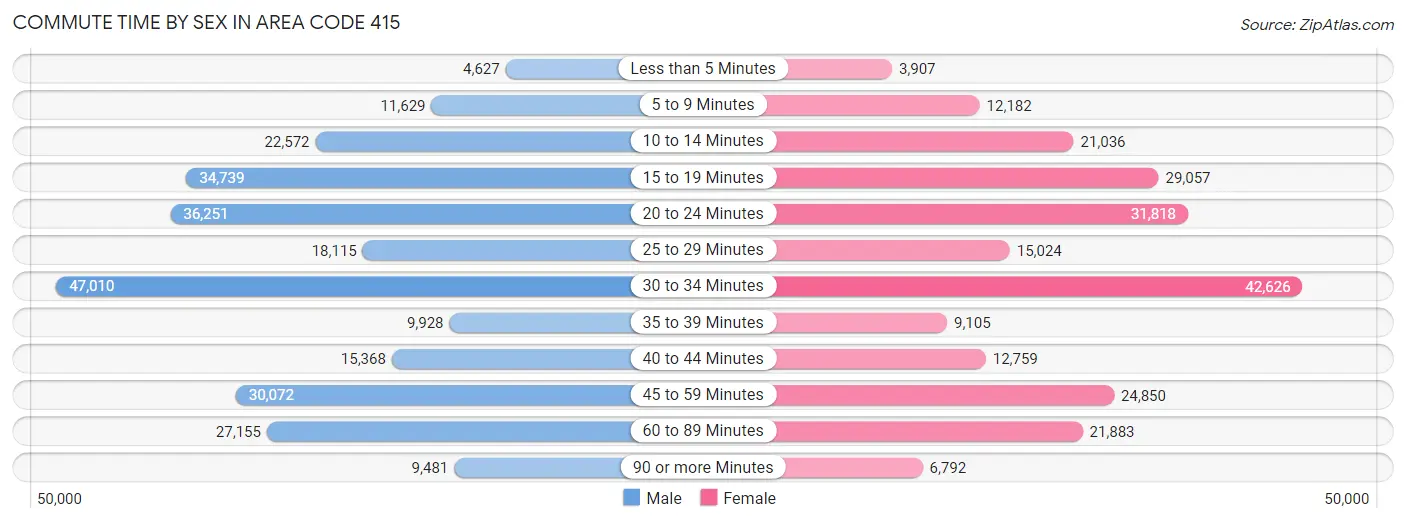
| Commute Time | Male | Female |
| Less than 5 Minutes | 4,627 (1.7%) | 3,907 (1.7%) |
| 5 to 9 Minutes | 11,629 (4.4%) | 12,182 (5.3%) |
| 10 to 14 Minutes | 22,572 (8.5%) | 21,036 (9.1%) |
| 15 to 19 Minutes | 34,739 (13.0%) | 29,057 (12.6%) |
| 20 to 24 Minutes | 36,251 (13.6%) | 31,818 (13.8%) |
| 25 to 29 Minutes | 18,115 (6.8%) | 15,024 (6.5%) |
| 30 to 34 Minutes | 47,010 (17.6%) | 42,626 (18.4%) |
| 35 to 39 Minutes | 9,928 (3.7%) | 9,105 (3.9%) |
| 40 to 44 Minutes | 15,368 (5.8%) | 12,759 (5.5%) |
| 45 to 59 Minutes | 30,072 (11.3%) | 24,850 (10.8%) |
| 60 to 89 Minutes | 27,155 (10.2%) | 21,883 (9.5%) |
| 90 or more Minutes | 9,481 (3.5%) | 6,792 (2.9%) |
Time of Departure to Work by Sex in Area Code 415
The most frequent times of departure to work in Area Code 415 are 8:00 AM to 8:29 AM (43,139, 16.2%) for males and 8:00 AM to 8:29 AM (43,363, 18.8%) for females.
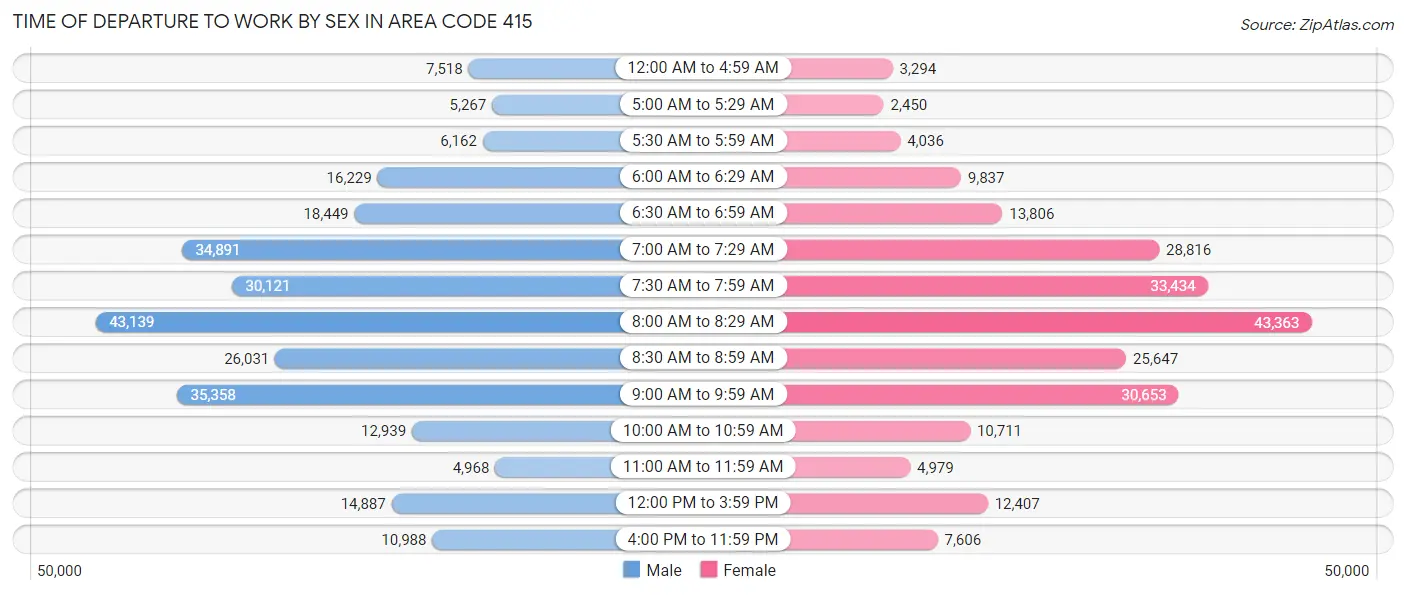
| Time of Departure | Male | Female |
| 12:00 AM to 4:59 AM | 7,518 (2.8%) | 3,294 (1.4%) |
| 5:00 AM to 5:29 AM | 5,267 (2.0%) | 2,450 (1.1%) |
| 5:30 AM to 5:59 AM | 6,162 (2.3%) | 4,036 (1.8%) |
| 6:00 AM to 6:29 AM | 16,229 (6.1%) | 9,837 (4.3%) |
| 6:30 AM to 6:59 AM | 18,449 (6.9%) | 13,806 (6.0%) |
| 7:00 AM to 7:29 AM | 34,891 (13.1%) | 28,816 (12.5%) |
| 7:30 AM to 7:59 AM | 30,121 (11.3%) | 33,434 (14.5%) |
| 8:00 AM to 8:29 AM | 43,139 (16.2%) | 43,363 (18.8%) |
| 8:30 AM to 8:59 AM | 26,031 (9.8%) | 25,647 (11.1%) |
| 9:00 AM to 9:59 AM | 35,358 (13.3%) | 30,653 (13.3%) |
| 10:00 AM to 10:59 AM | 12,939 (4.9%) | 10,711 (4.6%) |
| 11:00 AM to 11:59 AM | 4,968 (1.9%) | 4,979 (2.2%) |
| 12:00 PM to 3:59 PM | 14,887 (5.6%) | 12,407 (5.4%) |
| 4:00 PM to 11:59 PM | 10,988 (4.1%) | 7,606 (3.3%) |
| Total | 266,947 (100.0%) | 231,039 (100.0%) |
Housing Occupancy in Area Code 415
Occupancy by Ownership in Area Code 415
Of the total 500,302 dwellings in Area Code 415, owner-occupied units account for 215,346 (43.0%), while renter-occupied units make up 284,956 (57.0%).
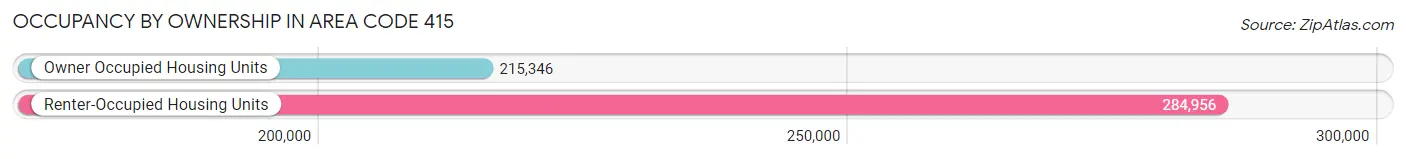
| Occupancy | # Housing Units | % Housing Units |
| Owner Occupied Housing Units | 215,346 | 43.0% |
| Renter-Occupied Housing Units | 284,956 | 57.0% |
| Total Occupied Housing Units | 500,302 | 100.0% |
Occupancy by Household Size in Area Code 415
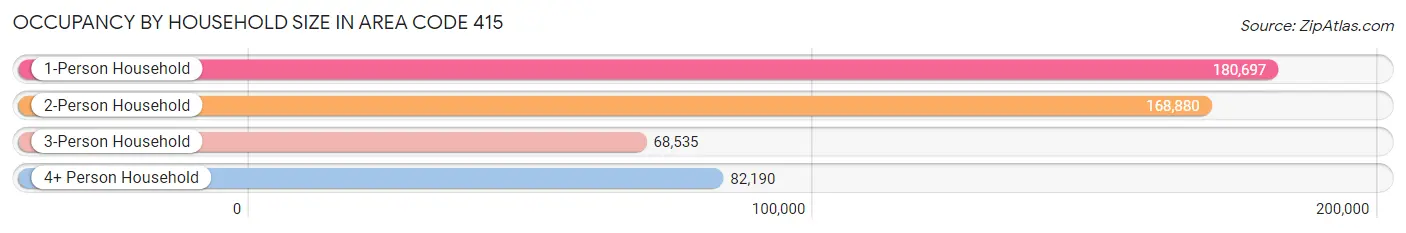
| Household Size | # Housing Units | % Housing Units |
| 1-Person Household | 180,697 | 36.1% |
| 2-Person Household | 168,880 | 33.8% |
| 3-Person Household | 68,535 | 13.7% |
| 4+ Person Household | 82,190 | 16.4% |
| Total Housing Units | 500,302 | 100.0% |
Occupancy by Ownership by Household Size in Area Code 415
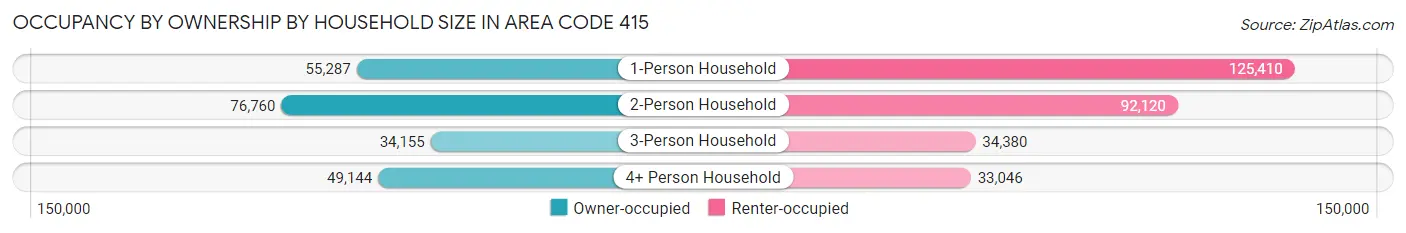
| Household Size | Owner-occupied | Renter-occupied |
| 1-Person Household | 55,287 (30.6%) | 125,410 (69.4%) |
| 2-Person Household | 76,760 (45.5%) | 92,120 (54.5%) |
| 3-Person Household | 34,155 (49.8%) | 34,380 (50.2%) |
| 4+ Person Household | 49,144 (59.8%) | 33,046 (40.2%) |
| Total Housing Units | 215,346 (43.0%) | 284,956 (57.0%) |
Occupancy by Educational Attainment in Area Code 415
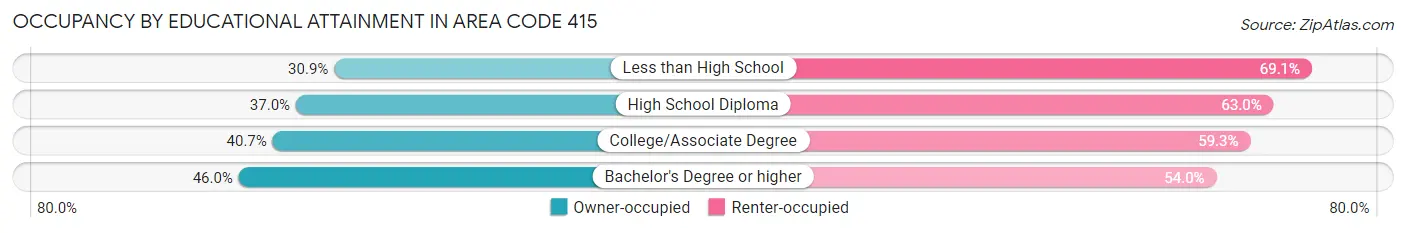
| Household Size | Owner-occupied | Renter-occupied |
| Less than High School | 12,024 (30.9%) | 26,890 (69.1%) |
| High School Diploma | 16,851 (37.0%) | 28,733 (63.0%) |
| College/Associate Degree | 37,460 (40.7%) | 54,669 (59.3%) |
| Bachelor's Degree or higher | 149,011 (46.0%) | 174,664 (54.0%) |
Occupancy by Age of Householder in Area Code 415
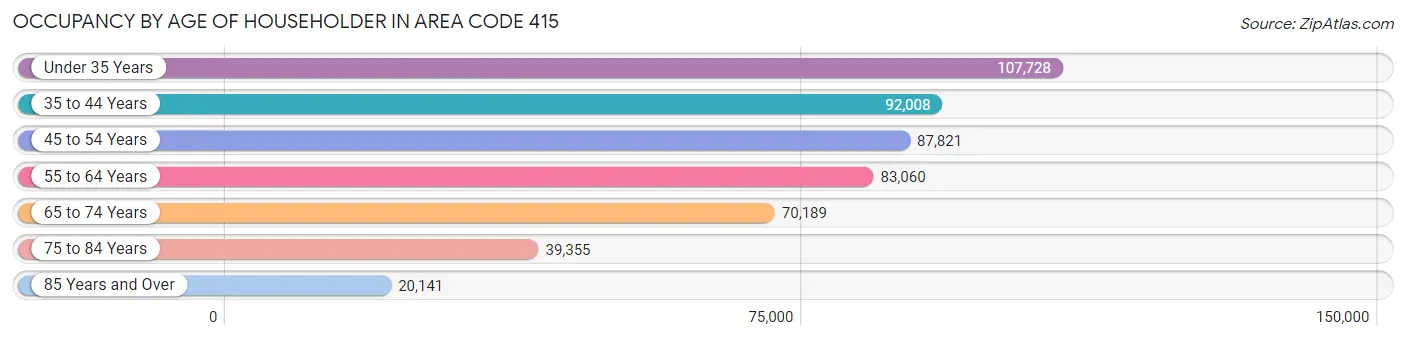
| Age Bracket | # Households | % Households |
| Under 35 Years | 107,728 | 21.5% |
| 35 to 44 Years | 92,008 | 18.4% |
| 45 to 54 Years | 87,821 | 17.5% |
| 55 to 64 Years | 83,060 | 16.6% |
| 65 to 74 Years | 70,189 | 14.0% |
| 75 to 84 Years | 39,355 | 7.9% |
| 85 Years and Over | 20,141 | 4.0% |
| Total | 500,302 | 100.0% |
Housing Finances in Area Code 415
Median Income by Occupancy in Area Code 415
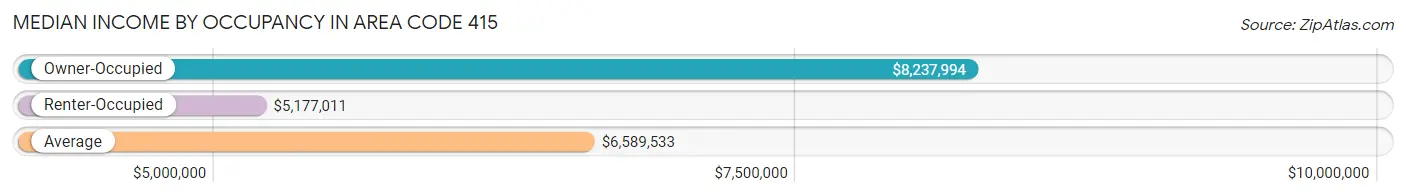
| Occupancy Type | # Households | Median Income |
| Owner-Occupied | 215,346 (43.0%) | $8,237,994 |
| Renter-Occupied | 284,956 (57.0%) | $5,177,011 |
| Average | 500,302 (100.0%) | $6,589,533 |
Occupancy by Householder Income Bracket in Area Code 415
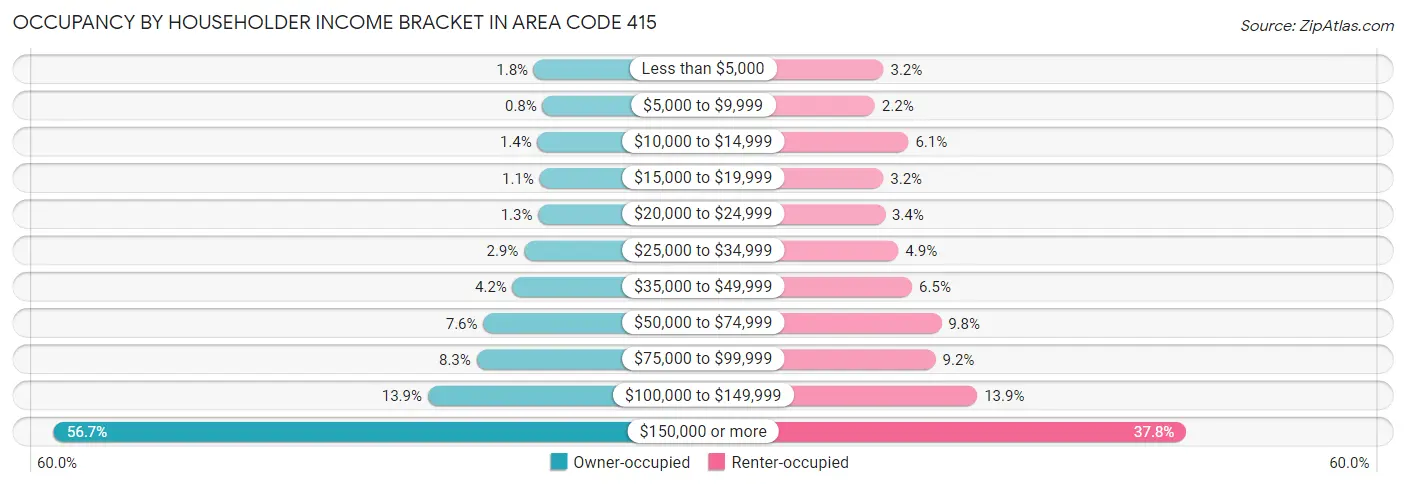
| Income Bracket | Owner-occupied | Renter-occupied |
| Less than $5,000 | 3,856 (1.8%) | 9,125 (3.2%) |
| $5,000 to $9,999 | 1,714 (0.8%) | 6,286 (2.2%) |
| $10,000 to $14,999 | 2,964 (1.4%) | 17,251 (6.0%) |
| $15,000 to $19,999 | 2,444 (1.1%) | 9,056 (3.2%) |
| $20,000 to $24,999 | 2,784 (1.3%) | 9,583 (3.4%) |
| $25,000 to $34,999 | 6,277 (2.9%) | 13,960 (4.9%) |
| $35,000 to $49,999 | 9,090 (4.2%) | 18,440 (6.5%) |
| $50,000 to $74,999 | 16,291 (7.6%) | 27,888 (9.8%) |
| $75,000 to $99,999 | 17,960 (8.3%) | 26,079 (9.1%) |
| $100,000 to $149,999 | 29,977 (13.9%) | 39,638 (13.9%) |
| $150,000 or more | 121,989 (56.7%) | 107,650 (37.8%) |
| Total | 215,346 (100.0%) | 284,956 (100.0%) |
Monthly Housing Cost Tiers in Area Code 415
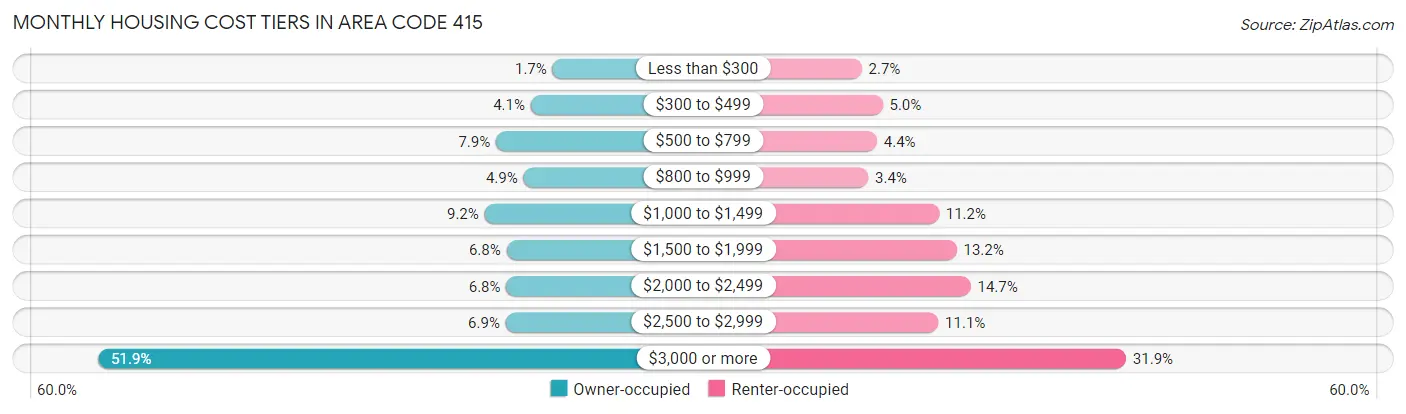
| Monthly Cost | Owner-occupied | Renter-occupied |
| Less than $300 | 3,587 (1.7%) | 7,617 (2.7%) |
| $300 to $499 | 8,778 (4.1%) | 14,191 (5.0%) |
| $500 to $799 | 17,045 (7.9%) | 12,436 (4.4%) |
| $800 to $999 | 10,507 (4.9%) | 9,654 (3.4%) |
| $1,000 to $1,499 | 19,774 (9.2%) | 31,919 (11.2%) |
| $1,500 to $1,999 | 14,568 (6.8%) | 37,488 (13.2%) |
| $2,000 to $2,499 | 14,596 (6.8%) | 41,931 (14.7%) |
| $2,500 to $2,999 | 14,754 (6.9%) | 31,702 (11.1%) |
| $3,000 or more | 111,737 (51.9%) | 90,810 (31.9%) |
| Total | 215,346 (100.0%) | 284,956 (100.0%) |
Physical Housing Characteristics in Area Code 415
Housing Structures in Area Code 415
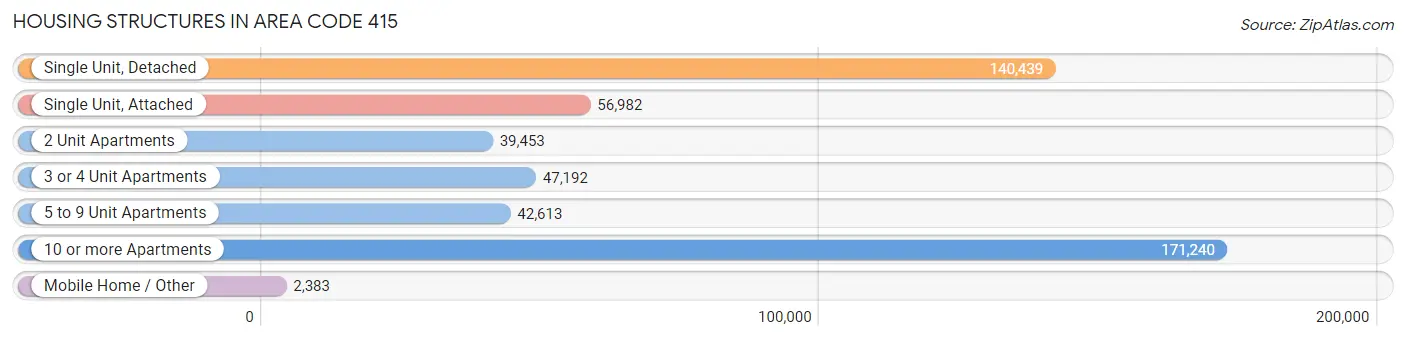
| Structure Type | # Housing Units | % Housing Units |
| Single Unit, Detached | 140,439 | 28.1% |
| Single Unit, Attached | 56,982 | 11.4% |
| 2 Unit Apartments | 39,453 | 7.9% |
| 3 or 4 Unit Apartments | 47,192 | 9.4% |
| 5 to 9 Unit Apartments | 42,613 | 8.5% |
| 10 or more Apartments | 171,240 | 34.2% |
| Mobile Home / Other | 2,383 | 0.5% |
| Total | 500,302 | 100.0% |
Housing Structures by Occupancy in Area Code 415
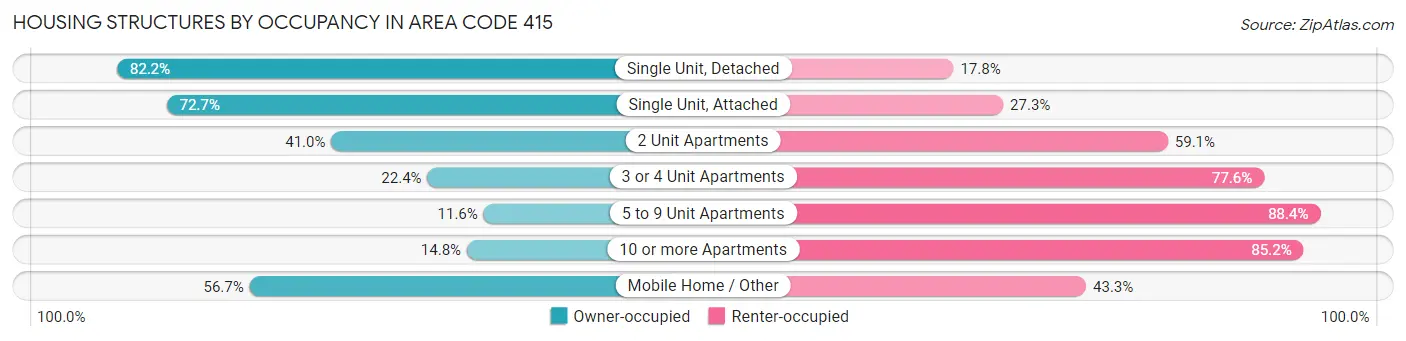
| Structure Type | Owner-occupied | Renter-occupied |
| Single Unit, Detached | 115,479 (82.2%) | 24,960 (17.8%) |
| Single Unit, Attached | 41,402 (72.7%) | 15,580 (27.3%) |
| 2 Unit Apartments | 16,155 (40.9%) | 23,298 (59.1%) |
| 3 or 4 Unit Apartments | 10,589 (22.4%) | 36,603 (77.6%) |
| 5 to 9 Unit Apartments | 4,951 (11.6%) | 37,662 (88.4%) |
| 10 or more Apartments | 25,419 (14.8%) | 145,821 (85.2%) |
| Mobile Home / Other | 1,351 (56.7%) | 1,032 (43.3%) |
| Total | 215,346 (43.0%) | 284,956 (57.0%) |
Housing Structures by Number of Rooms in Area Code 415
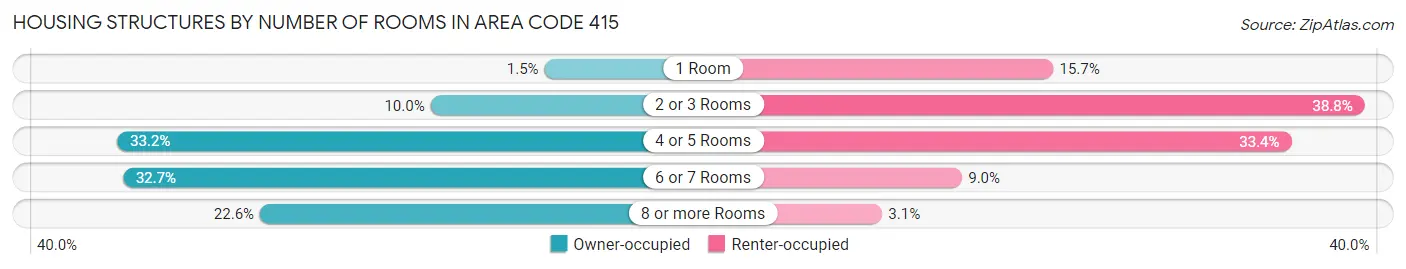
| Number of Rooms | Owner-occupied | Renter-occupied |
| 1 Room | 3,310 (1.5%) | 44,832 (15.7%) |
| 2 or 3 Rooms | 21,479 (10.0%) | 110,609 (38.8%) |
| 4 or 5 Rooms | 71,414 (33.2%) | 95,183 (33.4%) |
| 6 or 7 Rooms | 70,505 (32.7%) | 25,597 (9.0%) |
| 8 or more Rooms | 48,638 (22.6%) | 8,735 (3.1%) |
| Total | 215,346 (100.0%) | 284,956 (100.0%) |
Housing Structure by Heating Type in Area Code 415
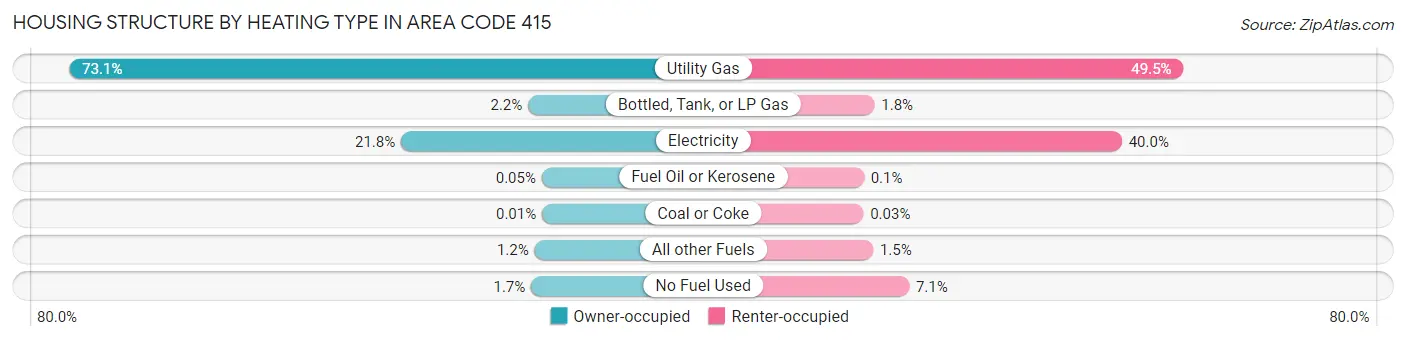
| Heating Type | Owner-occupied | Renter-occupied |
| Utility Gas | 157,433 (73.1%) | 141,105 (49.5%) |
| Bottled, Tank, or LP Gas | 4,641 (2.2%) | 4,973 (1.8%) |
| Electricity | 46,957 (21.8%) | 113,942 (40.0%) |
| Fuel Oil or Kerosene | 108 (0.1%) | 285 (0.1%) |
| Coal or Coke | 29 (0.0%) | 80 (0.0%) |
| All other Fuels | 2,510 (1.2%) | 4,351 (1.5%) |
| No Fuel Used | 3,668 (1.7%) | 20,220 (7.1%) |
| Total | 215,346 (100.0%) | 284,956 (100.0%) |
Household Vehicle Usage in Area Code 415
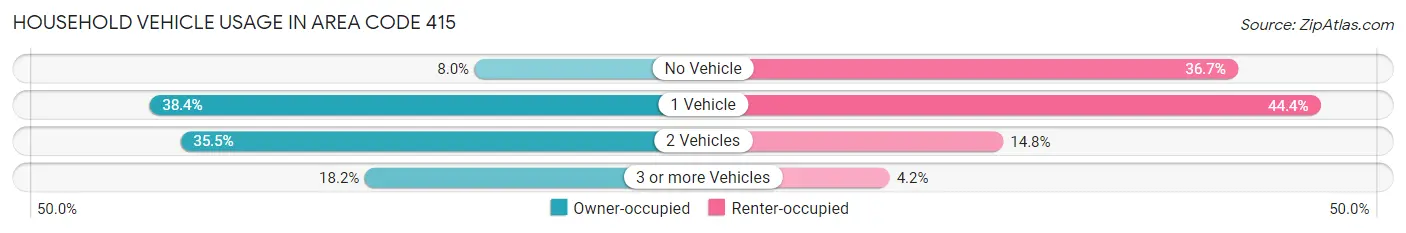
| Vehicles per Household | Owner-occupied | Renter-occupied |
| No Vehicle | 17,152 (8.0%) | 104,438 (36.6%) |
| 1 Vehicle | 82,617 (38.4%) | 126,454 (44.4%) |
| 2 Vehicles | 76,368 (35.5%) | 42,144 (14.8%) |
| 3 or more Vehicles | 39,209 (18.2%) | 11,920 (4.2%) |
| Total | 215,346 (100.0%) | 284,956 (100.0%) |
Real Estate & Mortgages in Area Code 415
Real Estate and Mortgage Overview in Area Code 415
| Characteristic | Without Mortgage | With Mortgage |
| Housing Units | 73,994 | 141,352 |
| Median Property Value | $63,823,405 | $67,080,305 |
| Median Household Income | $5,285,634 | $94,320 |
| Monthly Housing Costs | $53,494 | $107,468 |
| Real Estate Taxes | $313,517 | $1,932 |
Property Value by Mortgage Status in Area Code 415
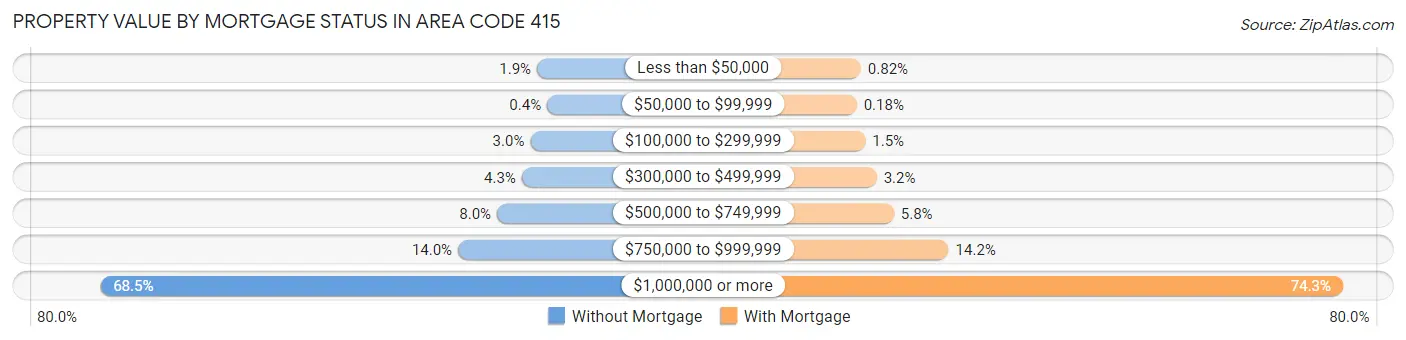
| Property Value | Without Mortgage | With Mortgage |
| Less than $50,000 | 1,426 (1.9%) | 1,159 (0.8%) |
| $50,000 to $99,999 | 298 (0.4%) | 260 (0.2%) |
| $100,000 to $299,999 | 2,184 (2.9%) | 2,102 (1.5%) |
| $300,000 to $499,999 | 3,142 (4.3%) | 4,570 (3.2%) |
| $500,000 to $749,999 | 5,945 (8.0%) | 8,249 (5.8%) |
| $750,000 to $999,999 | 10,337 (14.0%) | 20,058 (14.2%) |
| $1,000,000 or more | 50,662 (68.5%) | 104,954 (74.3%) |
| Total | 73,994 (100.0%) | 141,352 (100.0%) |
Household Income by Mortgage Status in Area Code 415
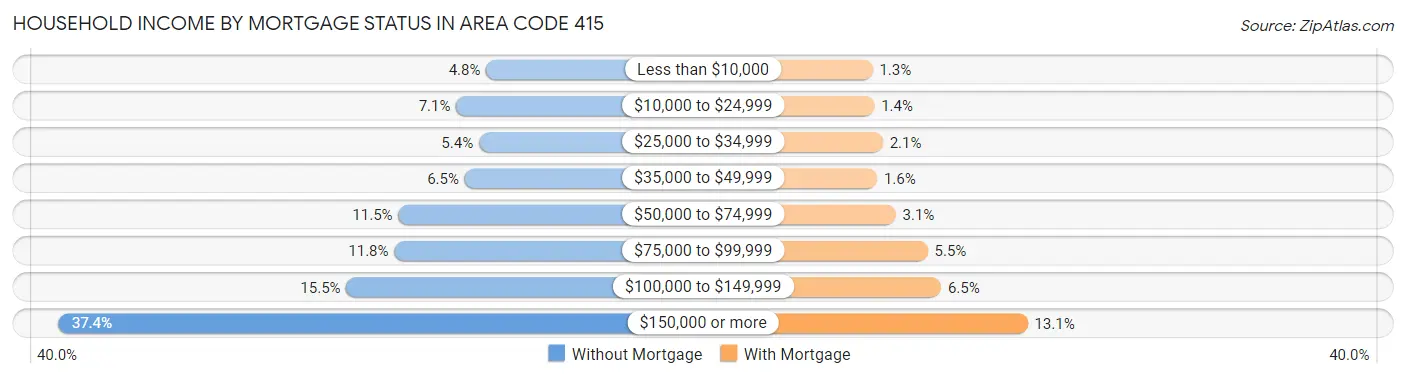
| Household Income | Without Mortgage | With Mortgage |
| Less than $10,000 | 3,566 (4.8%) | 1,820 (1.3%) |
| $10,000 to $24,999 | 5,261 (7.1%) | 2,004 (1.4%) |
| $25,000 to $34,999 | 3,980 (5.4%) | 2,931 (2.1%) |
| $35,000 to $49,999 | 4,781 (6.5%) | 2,297 (1.6%) |
| $50,000 to $74,999 | 8,524 (11.5%) | 4,309 (3.0%) |
| $75,000 to $99,999 | 8,757 (11.8%) | 7,767 (5.5%) |
| $100,000 to $149,999 | 11,456 (15.5%) | 9,203 (6.5%) |
| $150,000 or more | 27,669 (37.4%) | 18,521 (13.1%) |
| Total | 73,994 (100.0%) | 141,352 (100.0%) |
Property Value to Household Income Ratio in Area Code 415
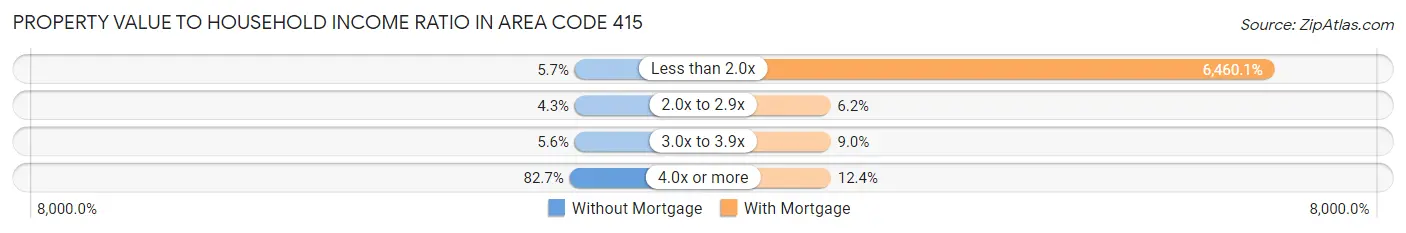
| Value-to-Income Ratio | Without Mortgage | With Mortgage |
| Less than 2.0x | 4,227 (5.7%) | 9,131,460 (6,460.1%) |
| 2.0x to 2.9x | 3,201 (4.3%) | 8,710 (6.2%) |
| 3.0x to 3.9x | 4,137 (5.6%) | 12,781 (9.0%) |
| 4.0x or more | 61,220 (82.7%) | 17,525 (12.4%) |
| Total | 73,994 (100.0%) | 141,352 (100.0%) |
Real Estate Taxes by Mortgage Status in Area Code 415
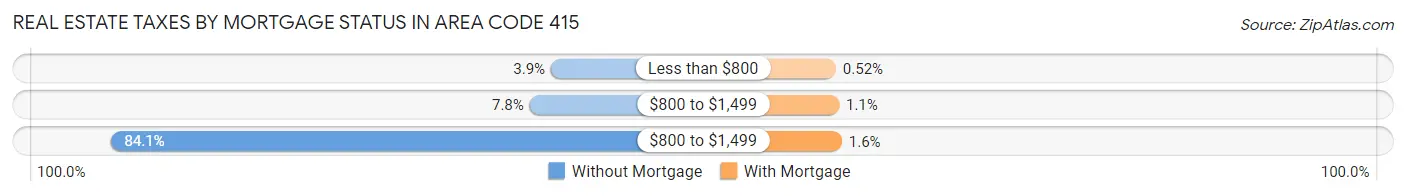
| Property Taxes | Without Mortgage | With Mortgage |
| Less than $800 | 2,860 (3.9%) | 731 (0.5%) |
| $800 to $1,499 | 5,739 (7.8%) | 1,537 (1.1%) |
| $800 to $1,499 | 62,255 (84.1%) | 2,270 (1.6%) |
| Total | 73,994 (100.0%) | 141,352 (100.0%) |
Health & Disability in Area Code 415
Health Insurance Coverage by Age in Area Code 415
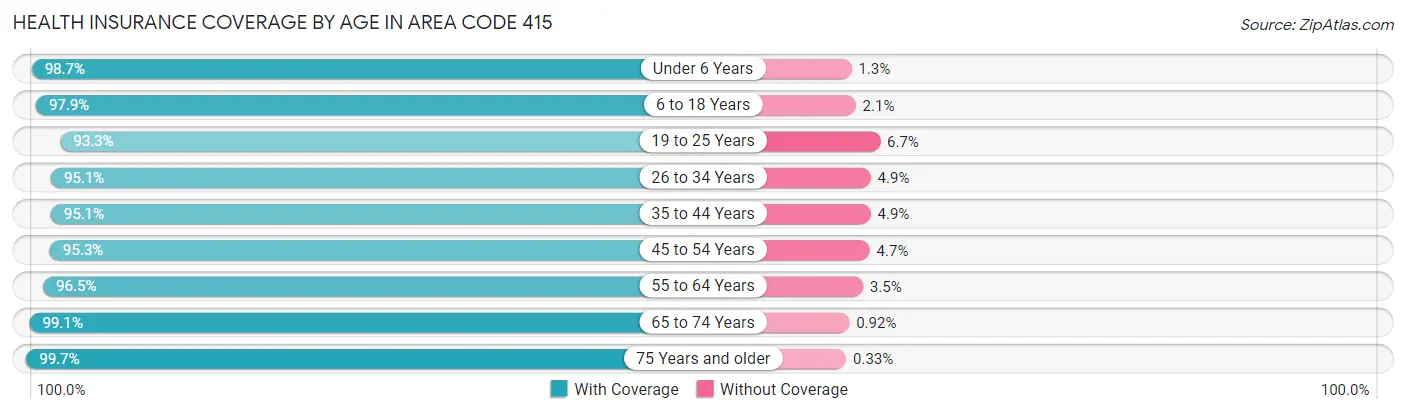
| Age Bracket | With Coverage | Without Coverage |
| Under 6 Years | 59,654 (98.7%) | 807 (1.3%) |
| 6 to 18 Years | 124,182 (97.9%) | 2,690 (2.1%) |
| 19 to 25 Years | 78,491 (93.3%) | 5,609 (6.7%) |
| 26 to 34 Years | 196,216 (95.1%) | 10,155 (4.9%) |
| 35 to 44 Years | 171,355 (95.1%) | 8,832 (4.9%) |
| 45 to 54 Years | 152,124 (95.3%) | 7,550 (4.7%) |
| 55 to 64 Years | 141,734 (96.5%) | 5,099 (3.5%) |
| 65 to 74 Years | 117,715 (99.1%) | 1,096 (0.9%) |
| 75 Years and older | 90,806 (99.7%) | 300 (0.3%) |
| Total | 1,132,277 (96.4%) | 42,138 (3.6%) |
Health Insurance Coverage by Citizenship Status in Area Code 415
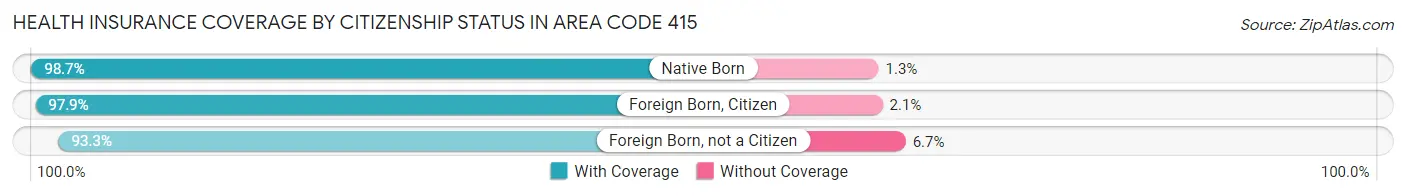
| Citizenship Status | With Coverage | Without Coverage |
| Native Born | 59,654 (98.7%) | 807 (1.3%) |
| Foreign Born, Citizen | 124,182 (97.9%) | 2,690 (2.1%) |
| Foreign Born, not a Citizen | 78,491 (93.3%) | 5,609 (6.7%) |
Health Insurance Coverage by Household Income in Area Code 415
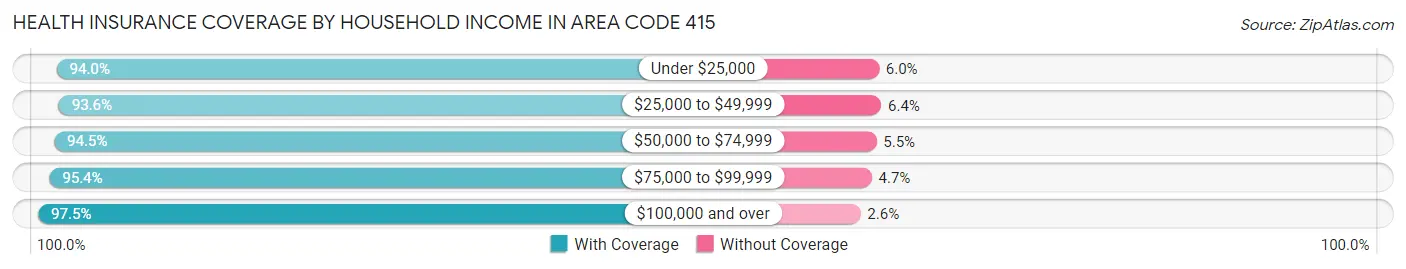
| Household Income | With Coverage | Without Coverage |
| Under $25,000 | 91,125 (94.0%) | 5,817 (6.0%) |
| $25,000 to $49,999 | 83,475 (93.6%) | 5,726 (6.4%) |
| $50,000 to $74,999 | 87,118 (94.5%) | 5,098 (5.5%) |
| $75,000 to $99,999 | 90,495 (95.4%) | 4,412 (4.6%) |
| $100,000 and over | 757,811 (97.5%) | 19,848 (2.5%) |
Public vs Private Health Insurance Coverage by Age in Area Code 415
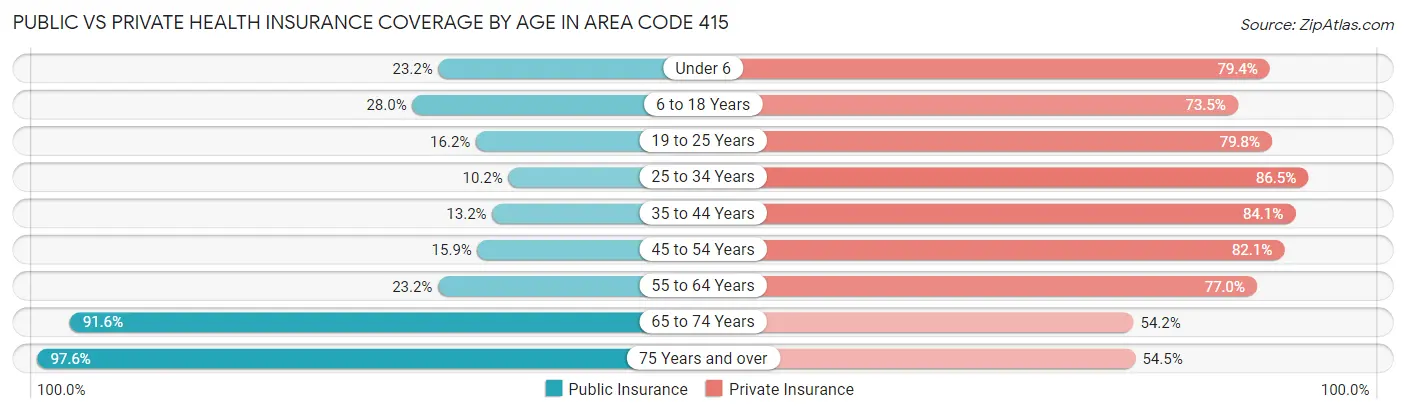
| Age Bracket | Public Insurance | Private Insurance |
| Under 6 | 14,006 (23.2%) | 48,013 (79.4%) |
| 6 to 18 Years | 35,529 (28.0%) | 93,214 (73.5%) |
| 19 to 25 Years | 13,609 (16.2%) | 67,116 (79.8%) |
| 25 to 34 Years | 20,965 (10.2%) | 178,563 (86.5%) |
| 35 to 44 Years | 23,739 (13.2%) | 151,569 (84.1%) |
| 45 to 54 Years | 25,404 (15.9%) | 131,045 (82.1%) |
| 55 to 64 Years | 34,113 (23.2%) | 113,088 (77.0%) |
| 65 to 74 Years | 108,835 (91.6%) | 64,340 (54.1%) |
| 75 Years and over | 88,927 (97.6%) | 49,659 (54.5%) |
| Total | 365,127 (31.1%) | 896,607 (76.3%) |
Disability Status by Sex by Age in Area Code 415
| Age Bracket | Male | Female |
| Under 5 Years | 158 (0.6%) | 53 (0.2%) |
| 5 to 17 Years | 2,443 (3.8%) | 1,958 (3.2%) |
| 18 to 34 Years | 7,457 (4.8%) | 6,720 (4.6%) |
| 35 to 64 Years | 22,700 (8.9%) | 17,244 (7.5%) |
| 65 to 74 Years | 12,032 (21.1%) | 12,792 (20.7%) |
| 75 Years and over | 15,479 (40.9%) | 26,400 (49.6%) |
Disability Class by Sex by Age in Area Code 415
Disability Class: Hearing Difficulty
| Age Bracket | Male | Female |
| Under 5 Years | 121 (0.5%) | 53 (0.2%) |
| 5 to 17 Years | 188 (0.3%) | 336 (0.5%) |
| 18 to 34 Years | 718 (0.5%) | 647 (0.4%) |
| 35 to 64 Years | 4,364 (1.7%) | 2,891 (1.3%) |
| 65 to 74 Years | 4,601 (8.1%) | 2,666 (4.3%) |
| 75 Years and over | 7,886 (20.8%) | 9,901 (18.6%) |
Disability Class: Vision Difficulty
| Age Bracket | Male | Female |
| Under 5 Years | 147 (0.6%) | 0 (0.0%) |
| 5 to 17 Years | 427 (0.7%) | 437 (0.7%) |
| 18 to 34 Years | 1,638 (1.1%) | 1,155 (0.8%) |
| 35 to 64 Years | 4,346 (1.7%) | 3,690 (1.6%) |
| 65 to 74 Years | 2,585 (4.5%) | 2,096 (3.4%) |
| 75 Years and over | 2,533 (6.7%) | 4,597 (8.6%) |
Disability Class: Cognitive Difficulty
| Age Bracket | Male | Female |
| 5 to 17 Years | 1,762 (2.8%) | 1,368 (2.2%) |
| 18 to 34 Years | 4,687 (3.0%) | 4,392 (3.0%) |
| 35 to 64 Years | 11,363 (4.4%) | 7,153 (3.1%) |
| 65 to 74 Years | 3,601 (6.3%) | 2,659 (4.3%) |
| 75 Years and over | 4,047 (10.7%) | 9,237 (17.3%) |
Disability Class: Ambulatory Difficulty
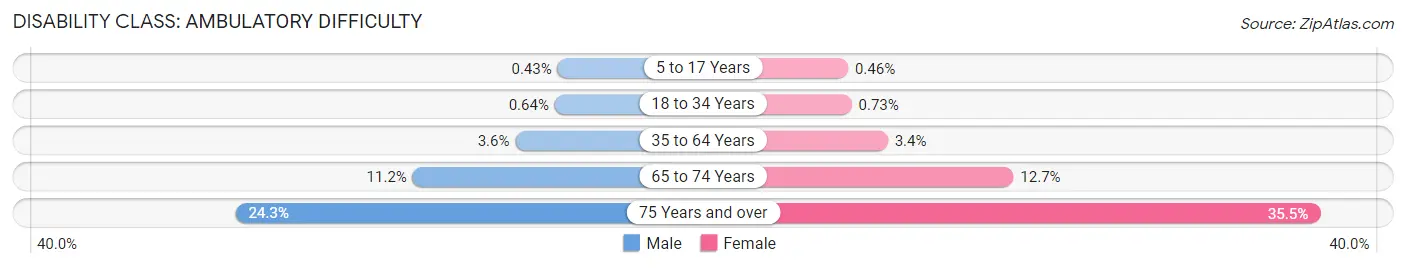
| Age Bracket | Male | Female |
| 5 to 17 Years | 272 (0.4%) | 282 (0.5%) |
| 18 to 34 Years | 993 (0.6%) | 1,073 (0.7%) |
| 35 to 64 Years | 9,140 (3.6%) | 7,873 (3.4%) |
| 65 to 74 Years | 6,370 (11.2%) | 7,882 (12.7%) |
| 75 Years and over | 9,214 (24.3%) | 18,902 (35.5%) |
Disability Class: Self-Care Difficulty
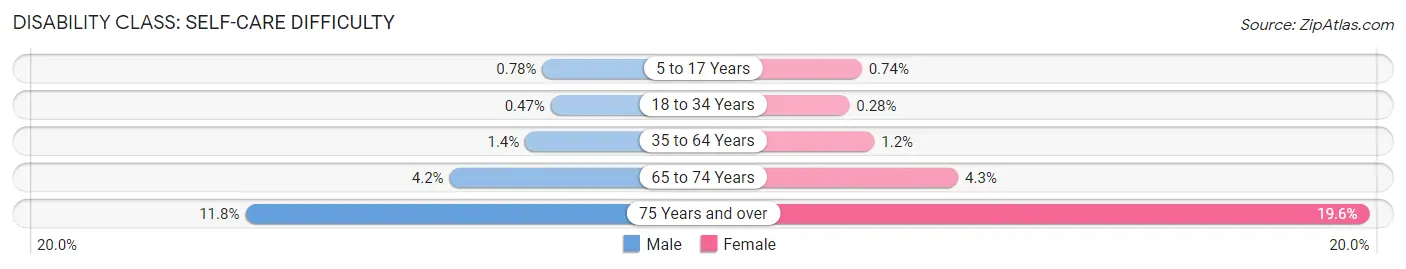
| Age Bracket | Male | Female |
| 5 to 17 Years | 497 (0.8%) | 452 (0.7%) |
| 18 to 34 Years | 734 (0.5%) | 418 (0.3%) |
| 35 to 64 Years | 3,631 (1.4%) | 2,802 (1.2%) |
| 65 to 74 Years | 2,411 (4.2%) | 2,675 (4.3%) |
| 75 Years and over | 4,473 (11.8%) | 10,424 (19.6%) |
Technology Access in Area Code 415
Computing Device Access in Area Code 415
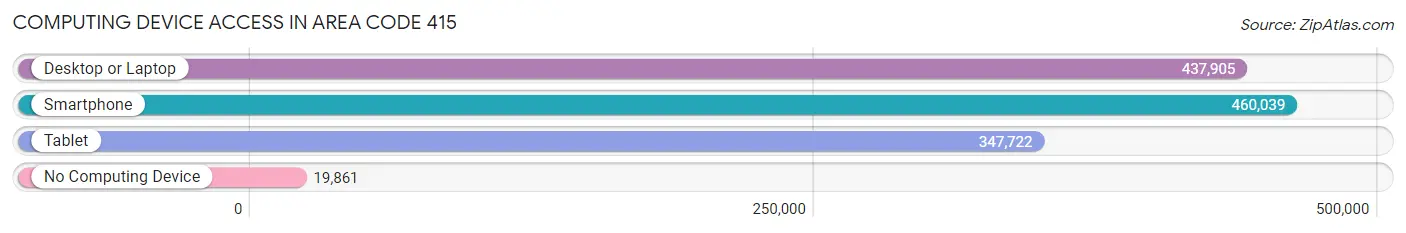
| Device Type | # Households | % Households |
| Desktop or Laptop | 437,905 | 87.5% |
| Smartphone | 460,039 | 91.9% |
| Tablet | 347,722 | 69.5% |
| No Computing Device | 19,861 | 4.0% |
| Total | 500,302 | 100.0% |
Internet Access in Area Code 415
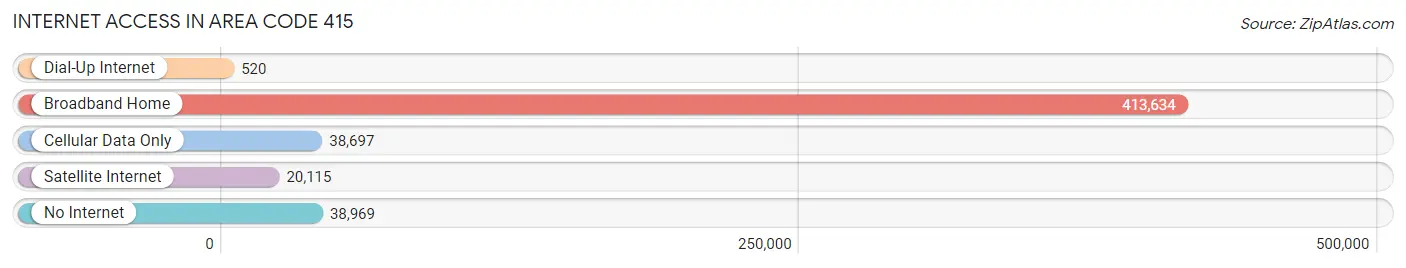
| Internet Type | # Households | % Households |
| Dial-Up Internet | 520 | 0.1% |
| Broadband Home | 413,634 | 82.7% |
| Cellular Data Only | 38,697 | 7.7% |
| Satellite Internet | 20,115 | 4.0% |
| No Internet | 38,969 | 7.8% |
| Total | 500,302 | 100.0% |
Area Code 415 Summary
Geography
Area code 415 is a telephone area code in the North American Numbering Plan (NANP) for the city of San Francisco and its northern suburbs in Marin County, California. It serves San Francisco and its northern suburbs, including the cities of San Rafael, Mill Valley, Sausalito, and Tiburon.
Social
Area code 415 is a major cultural hub in the Bay Area. It is home to many of the city's most iconic landmarks, including the Golden Gate Bridge, Alcatraz Island, and the Palace of Fine Arts. It is also home to a vibrant nightlife, with many bars, clubs, and restaurants.
Economics
Area code 415 is a major economic center in the Bay Area. It is home to many of the city's largest employers, including Salesforce, Uber, and Airbnb. It is also home to a number of tech startups, venture capital firms, and financial institutions.
Demographics
Area code 415 is home to a diverse population. According to the U.S. Census Bureau, the population of the area code is approximately 1.2 million people. The population is largely composed of young professionals, with a median age of 36. The area is also home to a large number of immigrants, with approximately 40% of the population being foreign-born.
Common Questions
What is Per Capita Income in Area Code 415?
Per Capita income in Area Code 415 is $90,373.
What is the Median Family Income in Area Code 415?
Median Family Income in Area Code 415 is $174,799.
What is the Median Household income in Area Code 415?
Median Household Income in Area Code 415 is $137,282.
What is Income or Wage Gap in Area Code 415?
Income or Wage Gap in Area Code 415 is 25.9%.
Women in Area Code 415 earn 74.1 cents for every dollar earned by a man.
What is Family Income Deficit in Area Code 415?
Family Income Deficit in Area Code 415 is $10,975.
Families that are below poverty line in Area Code 415 earn $10,975 less on average than the poverty threshold level.
What is Inequality or Gini Index in Area Code 415?
Inequality or Gini Index in Area Code 415 is 24.22.
What is the Total Population of Area Code 415?
Total Population of Area Code 415 is 1,180,600.
What is the Total Male Population of Area Code 415?
Total Male Population of Area Code 415 is 598,811.
What is the Total Female Population of Area Code 415?
Total Female Population of Area Code 415 is 581,789.
What is the Ratio of Males per 100 Females in Area Code 415?
There are 102.93 Males per 100 Females in Area Code 415.
What is the Ratio of Females per 100 Males in Area Code 415?
There are 97.16 Females per 100 Males in Area Code 415.
What is the Median Population Age in Area Code 415?
Median Population Age in Area Code 415 is 44.2 Years.
What is the Average Family Size in Area Code 415
Average Family Size in Area Code 415 is 2.9 People.
What is the Average Household Size in Area Code 415
Average Household Size in Area Code 415 is 2.3 People.
How Large is the Labor Force in Area Code 415?
There are 693,267 People in the Labor Forcein in Area Code 415.
What is the Percentage of People in the Labor Force in Area Code 415?
67.7% of People are in the Labor Force in Area Code 415.
What is the Unemployment Rate in Area Code 415?
Unemployment Rate in Area Code 415 is 6.1%.