Cities with the Highest Percentage of Luxembourger Population in Michigan

RELATED REPORTS & OPTIONS

Luxembourger
Population
Families and Households
Female Fertility
Female Fertility (Unmarried)
Race (Community Size)
Race (Percentage)
Ancestry (Community Size)
AfghanAfricanAlaska NativeAlaskan AthabascanAlbanianAleutAlsatianAmericanApacheArabArapahoArgentineanArmenianAssyrian / Chaldean / SyriacAustralianAustrianBahamianBangladeshiBarbadianBasqueBelgianBelizeanBermudanBhutaneseBlackfeetBolivianBrazilianBritishBritish West IndianBulgarianBurmeseCajunCambodianCanadianCape VerdeanCarpatho RusynCelticCentral AmericanCentral American IndianCherokeeCheyenneChickasawChileanChineseChippewaChoctawColombianColvilleComancheCosta RicanCreeCreekCroatianCrowCubanCypriotCzechCzechoslovakianDanishDelawareDominicanDutchDutch West IndianEastern EuropeanEcuadorianEgyptianEnglishEstonianEthiopianEuropeanFijianFilipinoFinnishFrenchFrench American IndianFrench CanadianGermanGerman RussianGhanaianGreekGuamanian / ChamorroGuatemalanGuyaneseHaitianHmongHonduranHopiHoumaHungarianIcelanderIndian (Asian)IndonesianInupiatIranianIraqiIrishIroquoisIsraeliItalianJamaicanJapaneseJordanianKenyanKiowaKoreanLaotianLatvianLebaneseLiberianLithuanianLumbeeLuxembourgerMacedonianMalaysianMalteseMarshalleseMenomineeMexicanMexican American IndianMongolianMoroccanNative HawaiianNavajoNepaleseNew ZealanderNicaraguanNigerianNorthern EuropeanNorwegianOkinawanOsageOttawaPaiutePakistaniPalestinianPanamanianParaguayanPennsylvania GermanPeruvianPimaPolishPortuguesePotawatomiPuebloPuerto RicanPuget Sound SalishRomanianRussianSalvadoranSamoanScandinavianScotch-IrishScottishSeminoleSenegaleseSerbianShoshoneSierra LeoneanSiouxSlavicSlovakSloveneSomaliSouth AfricanSouth AmericanSouth American IndianSoviet UnionSpaniardSpanishSpanish AmericanSpanish American IndianSri LankanSubsaharan AfricanSudaneseSwedishSwissSyrianTaiwaneseThaiTlingit-HaidaTohono O'OdhamTonganTrinidadian and TobagonianTsimshianTurkishU.S. Virgin IslanderUgandanUkrainianUruguayanUteVenezuelanVietnameseWelshWest IndianYakamaYaquiYugoslavianYumanYup'ikZimbabwean
Ancestry (Percentage)
AfghanAfricanAlaska NativeAlaskan AthabascanAlbanianAleutAlsatianAmericanApacheArabArapahoArgentineanArmenianAssyrian / Chaldean / SyriacAustralianAustrianBahamianBangladeshiBarbadianBasqueBelgianBelizeanBermudanBhutaneseBlackfeetBolivianBrazilianBritishBritish West IndianBulgarianBurmeseCajunCambodianCanadianCape VerdeanCarpatho RusynCelticCentral AmericanCentral American IndianCherokeeCheyenneChickasawChileanChineseChippewaChoctawColombianColvilleComancheCosta RicanCreeCreekCroatianCrowCubanCypriotCzechCzechoslovakianDanishDelawareDominicanDutchDutch West IndianEastern EuropeanEcuadorianEgyptianEnglishEstonianEthiopianEuropeanFijianFilipinoFinnishFrenchFrench American IndianFrench CanadianGermanGerman RussianGhanaianGreekGuamanian / ChamorroGuatemalanGuyaneseHaitianHmongHonduranHopiHoumaHungarianIcelanderIndian (Asian)IndonesianInupiatIranianIraqiIrishIroquoisIsraeliItalianJamaicanJapaneseJordanianKenyanKiowaKoreanLaotianLatvianLebaneseLiberianLithuanianLumbeeLuxembourgerMacedonianMalaysianMalteseMarshalleseMenomineeMexicanMexican American IndianMongolianMoroccanNative HawaiianNavajoNepaleseNew ZealanderNicaraguanNigerianNorthern EuropeanNorwegianOkinawanOsageOttawaPaiutePakistaniPalestinianPanamanianParaguayanPennsylvania GermanPeruvianPimaPolishPortuguesePotawatomiPuebloPuerto RicanPuget Sound SalishRomanianRussianSalvadoranSamoanScandinavianScotch-IrishScottishSeminoleSenegaleseSerbianShoshoneSierra LeoneanSiouxSlavicSlovakSloveneSomaliSouth AfricanSouth AmericanSouth American IndianSoviet UnionSpaniardSpanishSpanish AmericanSpanish American IndianSri LankanSubsaharan AfricanSudaneseSwedishSwissSyrianTaiwaneseThaiTlingit-HaidaTohono O'OdhamTonganTrinidadian and TobagonianTsimshianTurkishU.S. Virgin IslanderUgandanUkrainianUruguayanUteVenezuelanVietnameseWelshWest IndianYakamaYaquiYugoslavianYumanYup'ikZimbabwean
Immigrant Origin (Total)
AfghanistanAfricaAlbaniaArgentinaArmeniaAsiaAustraliaAustriaAzoresBahamasBangladeshBarbadosBelarusBelgiumBelizeBoliviaBosnia and HerzegovinaBrazilBulgariaBurma / MyanmarCabo VerdeCambodiaCameroonCanadaCaribbeanCentral AmericaChileChinaColombiaCongoCosta RicaCroatiaCubaCzechoslovakiaDenmarkDominicaDominican RepublicEastern AfricaEastern AsiaEastern EuropeEcuadorEgyptEl SalvadorEnglandEritreaEthiopiaEuropeFijiFranceGermanyGhanaGreeceGrenadaGuatemalaGuyanaHaitiHondurasHong KongHungaryIndiaIndonesiaIranIraqIrelandIsraelItalyJamaicaJapanJordanKazakhstanKenyaKoreaKuwaitLaosLatin AmericaLatviaLebanonLiberiaLithuaniaMalaysiaMexicoMicronesiaMiddle AfricaMoldovaMoroccoNepalNetherlandsNicaraguaNigeriaNorth MacedoniaNorthern AfricaNorthern EuropeNorwayOceaniaPakistanPanamaPeruPhilippinesPolandPortugalRomaniaRussiaSaudi ArabiaScotlandSenegalSerbiaSierra LeoneSingaporeSomaliaSouth AfricaSouth AmericaSouth Central AsiaSouth Eastern AsiaSouthern EuropeSpainSri LankaSt. Vincent and the GrenadinesSudanSwedenSwitzerlandSyriaTaiwanThailandTrinidad and TobagoTurkeyUgandaUkraineUruguayUzbekistanVenezuelaVietnamWest IndiesWestern AfricaWestern AsiaWestern EuropeYemenZaireZimbabwe
Immigrant Origin (Percentage)
AfghanistanAfricaAlbaniaArgentinaArmeniaAsiaAustraliaAustriaAzoresBahamasBangladeshBarbadosBelarusBelgiumBelizeBoliviaBosnia and HerzegovinaBrazilBulgariaBurma / MyanmarCabo VerdeCambodiaCameroonCanadaCaribbeanCentral AmericaChileChinaColombiaCongoCosta RicaCroatiaCubaCzechoslovakiaDenmarkDominicaDominican RepublicEastern AfricaEastern AsiaEastern EuropeEcuadorEgyptEl SalvadorEnglandEritreaEthiopiaEuropeFijiFranceGermanyGhanaGreeceGrenadaGuatemalaGuyanaHaitiHondurasHong KongHungaryIndiaIndonesiaIranIraqIrelandIsraelItalyJamaicaJapanJordanKazakhstanKenyaKoreaKuwaitLaosLatin AmericaLatviaLebanonLiberiaLithuaniaMalaysiaMexicoMicronesiaMiddle AfricaMoldovaMoroccoNepalNetherlandsNicaraguaNigeriaNorth MacedoniaNorthern AfricaNorthern EuropeNorwayOceaniaPakistanPanamaPeruPhilippinesPolandPortugalRomaniaRussiaSaudi ArabiaScotlandSenegalSerbiaSierra LeoneSingaporeSomaliaSouth AfricaSouth AmericaSouth Central AsiaSouth Eastern AsiaSouthern EuropeSpainSri LankaSt. Vincent and the GrenadinesSudanSwedenSwitzerlandSyriaTaiwanThailandTrinidad and TobagoTurkeyUgandaUkraineUruguayUzbekistanVenezuelaVietnamWest IndiesWestern AfricaWestern AsiaWestern EuropeYemenZaireZimbabwe
Income
Income (Families)
Income (Households)
Poverty
Poverty (Families)
Unemployment
Employment Occupations
Employment Industries
Employer Class
Commute Time
Commute Means
School Enrollment
Education by Degree Field
Occupancy
Finances
Physical Characteristics
Michigan
Compare Cities
Comparison Subject

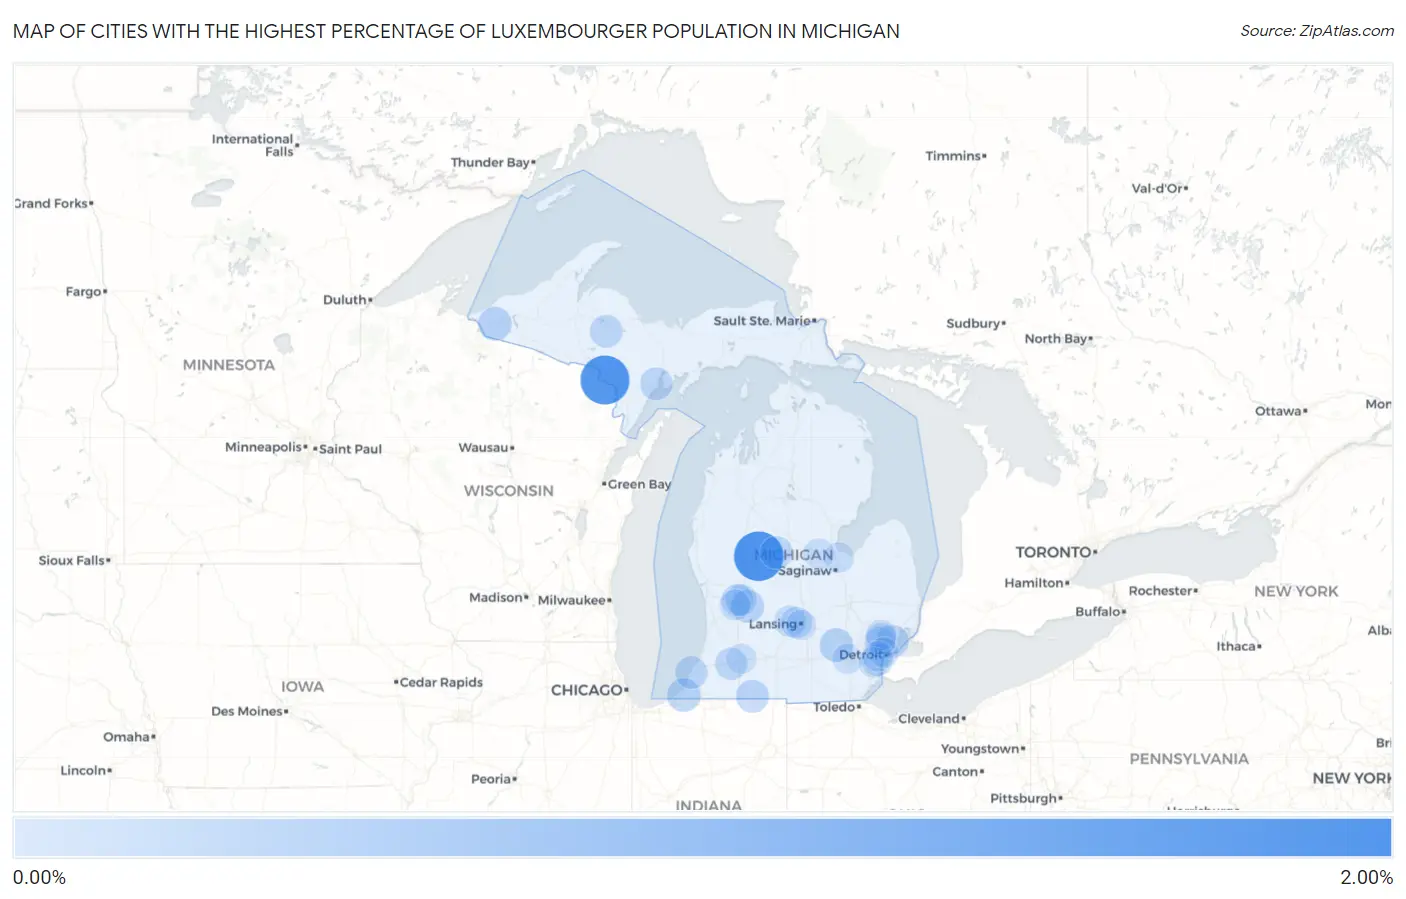
Map of Cities with the Highest Percentage of Luxembourger Population in Michigan

0.00%
2.00%
Cities with the Highest Percentage of Luxembourger Population in Michigan Map

Cities with the Highest Percentage of Luxembourger Population in Michigan

City Luxembourger vs State vs National
1.Canadian Lakes1.55%0.0078%(+1.54)#10.013%(+1.54)#68
2.Quinnesec1.51%0.0078%(+1.50)#20.013%(+1.49)#71
3.Wakefield0.26%0.0078%(+0.250)#30.013%(+0.245)#419
4.Pinckney0.26%0.0078%(+0.249)#40.013%(+0.244)#422
5.Three Oaks0.25%0.0078%(+0.241)#50.013%(+0.236)#438
6.Forest Hills0.23%0.0078%(+0.217)#60.013%(+0.212)#480
7.Sturgis0.20%0.0078%(+0.191)#70.013%(+0.186)#518
8.Lake Isabella0.19%0.0078%(+0.186)#80.013%(+0.181)#527
9.Republic0.19%0.0078%(+0.180)#90.013%(+0.175)#536
10.Escanaba0.19%0.0078%(+0.178)#100.013%(+0.173)#543
11.Roseville0.19%0.0078%(+0.178)#110.013%(+0.173)#544
12.St Joseph0.18%0.0078%(+0.171)#120.013%(+0.166)#558
13.Mattawan0.16%0.0078%(+0.148)#130.013%(+0.143)#601
14.Comstock Park0.13%0.0078%(+0.117)#140.013%(+0.113)#673
15.Grand Ledge0.10%0.0078%(+0.095)#150.013%(+0.090)#723
16.Allen Park0.099%0.0078%(+0.091)#160.013%(+0.086)#734
17.Northview0.097%0.0078%(+0.089)#170.013%(+0.085)#738
18.Waverly0.076%0.0078%(+0.068)#180.013%(+0.063)#811
19.Walker0.064%0.0078%(+0.056)#190.013%(+0.051)#864
20.Huntington Woods0.063%0.0078%(+0.055)#200.013%(+0.050)#867
21.Clawson0.053%0.0078%(+0.045)#210.013%(+0.040)#925
22.Troy0.033%0.0078%(+0.026)#220.013%(+0.021)#1,033
23.Midland0.028%0.0078%(+0.021)#230.013%(+0.016)#1,072
24.Bay City0.018%0.0078%(+0.011)#240.013%(+0.006)#1,165
25.Lansing0.018%0.0078%(+0.010)#250.013%(+0.005)#1,173
26.Ann Arbor0.014%0.0078%(+0.006)#260.013%(+0.001)#1,219
27.Taylor0.013%0.0078%(+0.005)#270.013%(+0.000)#1,233
28.Kalamazoo0.011%0.0078%(+0.003)#280.013%(-0.002)#1,255
29.Dearborn0.0046%0.0078%(-0.003)#290.013%(-0.008)#1,332
30.Detroit0.00078%0.0078%(-0.007)#300.013%(-0.012)#1,376

Common Questions

What are the Top 10 Cities with the Highest Percentage of Luxembourger Population in Michigan?
Top 10 Cities with the Highest Percentage of Luxembourger Population in Michigan are:
#1
1.55%
#2
1.51%
#3
0.26%
#4
0.26%
#5
0.25%
#6
0.23%
#7
0.20%
#8
0.19%
#9
0.19%
#10
0.19%
What city has the Highest Percentage of Luxembourger Population in Michigan?
Canadian Lakes has the Highest Percentage of Luxembourger Population in Michigan with 1.55%.
What is the Percentage of Luxembourger Population in the State of Michigan?
Percentage of Luxembourger Population in Michigan is 0.0078%.
What is the Percentage of Luxembourger Population in the United States?
Percentage of Luxembourger Population in the United States is 0.013%.