Cities with the Highest Percentage of Luxembourger Population in Colorado

RELATED REPORTS & OPTIONS

Luxembourger
Population
Families and Households
Female Fertility
Female Fertility (Unmarried)
Race (Community Size)
Race (Percentage)
Ancestry (Community Size)
AfghanAfricanAlaska NativeAlaskan AthabascanAlbanianAleutAlsatianAmericanApacheArabArapahoArgentineanArmenianAssyrian / Chaldean / SyriacAustralianAustrianBahamianBangladeshiBarbadianBasqueBelgianBelizeanBermudanBhutaneseBlackfeetBolivianBrazilianBritishBritish West IndianBulgarianBurmeseCajunCambodianCanadianCape VerdeanCarpatho RusynCelticCentral AmericanCentral American IndianCherokeeCheyenneChickasawChileanChineseChippewaChoctawColombianColvilleComancheCosta RicanCreeCreekCroatianCrowCubanCypriotCzechCzechoslovakianDanishDelawareDominicanDutchDutch West IndianEastern EuropeanEcuadorianEgyptianEnglishEstonianEthiopianEuropeanFijianFilipinoFinnishFrenchFrench American IndianFrench CanadianGermanGerman RussianGhanaianGreekGuamanian / ChamorroGuatemalanGuyaneseHaitianHmongHonduranHopiHoumaHungarianIcelanderIndian (Asian)IndonesianInupiatIranianIraqiIrishIroquoisIsraeliItalianJamaicanJapaneseJordanianKenyanKiowaKoreanLaotianLatvianLebaneseLiberianLithuanianLumbeeLuxembourgerMacedonianMalaysianMalteseMarshalleseMenomineeMexicanMexican American IndianMongolianMoroccanNative HawaiianNavajoNepaleseNew ZealanderNicaraguanNigerianNorthern EuropeanNorwegianOkinawanOsageOttawaPaiutePakistaniPalestinianPanamanianParaguayanPennsylvania GermanPeruvianPimaPolishPortuguesePotawatomiPuebloPuerto RicanPuget Sound SalishRomanianRussianSalvadoranSamoanScandinavianScotch-IrishScottishSeminoleSenegaleseSerbianShoshoneSierra LeoneanSiouxSlavicSlovakSloveneSomaliSouth AfricanSouth AmericanSouth American IndianSoviet UnionSpaniardSpanishSpanish AmericanSpanish American IndianSri LankanSubsaharan AfricanSudaneseSwedishSwissSyrianTaiwaneseThaiTlingit-HaidaTohono O'OdhamTonganTrinidadian and TobagonianTsimshianTurkishU.S. Virgin IslanderUgandanUkrainianUruguayanUteVenezuelanVietnameseWelshWest IndianYakamaYaquiYugoslavianYumanYup'ikZimbabwean
Ancestry (Percentage)
AfghanAfricanAlaska NativeAlaskan AthabascanAlbanianAleutAlsatianAmericanApacheArabArapahoArgentineanArmenianAssyrian / Chaldean / SyriacAustralianAustrianBahamianBangladeshiBarbadianBasqueBelgianBelizeanBermudanBhutaneseBlackfeetBolivianBrazilianBritishBritish West IndianBulgarianBurmeseCajunCambodianCanadianCape VerdeanCarpatho RusynCelticCentral AmericanCentral American IndianCherokeeCheyenneChickasawChileanChineseChippewaChoctawColombianColvilleComancheCosta RicanCreeCreekCroatianCrowCubanCypriotCzechCzechoslovakianDanishDelawareDominicanDutchDutch West IndianEastern EuropeanEcuadorianEgyptianEnglishEstonianEthiopianEuropeanFijianFilipinoFinnishFrenchFrench American IndianFrench CanadianGermanGerman RussianGhanaianGreekGuamanian / ChamorroGuatemalanGuyaneseHaitianHmongHonduranHopiHoumaHungarianIcelanderIndian (Asian)IndonesianInupiatIranianIraqiIrishIroquoisIsraeliItalianJamaicanJapaneseJordanianKenyanKiowaKoreanLaotianLatvianLebaneseLiberianLithuanianLumbeeLuxembourgerMacedonianMalaysianMalteseMarshalleseMenomineeMexicanMexican American IndianMongolianMoroccanNative HawaiianNavajoNepaleseNew ZealanderNicaraguanNigerianNorthern EuropeanNorwegianOkinawanOsageOttawaPaiutePakistaniPalestinianPanamanianParaguayanPennsylvania GermanPeruvianPimaPolishPortuguesePotawatomiPuebloPuerto RicanPuget Sound SalishRomanianRussianSalvadoranSamoanScandinavianScotch-IrishScottishSeminoleSenegaleseSerbianShoshoneSierra LeoneanSiouxSlavicSlovakSloveneSomaliSouth AfricanSouth AmericanSouth American IndianSoviet UnionSpaniardSpanishSpanish AmericanSpanish American IndianSri LankanSubsaharan AfricanSudaneseSwedishSwissSyrianTaiwaneseThaiTlingit-HaidaTohono O'OdhamTonganTrinidadian and TobagonianTsimshianTurkishU.S. Virgin IslanderUgandanUkrainianUruguayanUteVenezuelanVietnameseWelshWest IndianYakamaYaquiYugoslavianYumanYup'ikZimbabwean
Immigrant Origin (Total)
AfghanistanAfricaAlbaniaArgentinaArmeniaAsiaAustraliaAustriaAzoresBahamasBangladeshBarbadosBelarusBelgiumBelizeBoliviaBosnia and HerzegovinaBrazilBulgariaBurma / MyanmarCabo VerdeCambodiaCameroonCanadaCaribbeanCentral AmericaChileChinaColombiaCongoCosta RicaCroatiaCubaCzechoslovakiaDenmarkDominicaDominican RepublicEastern AfricaEastern AsiaEastern EuropeEcuadorEgyptEl SalvadorEnglandEritreaEthiopiaEuropeFijiFranceGermanyGhanaGreeceGrenadaGuatemalaGuyanaHaitiHondurasHong KongHungaryIndiaIndonesiaIranIraqIrelandIsraelItalyJamaicaJapanJordanKazakhstanKenyaKoreaKuwaitLaosLatin AmericaLatviaLebanonLiberiaLithuaniaMalaysiaMexicoMicronesiaMiddle AfricaMoldovaMoroccoNepalNetherlandsNicaraguaNigeriaNorth MacedoniaNorthern AfricaNorthern EuropeNorwayOceaniaPakistanPanamaPeruPhilippinesPolandPortugalRomaniaRussiaSaudi ArabiaScotlandSenegalSerbiaSierra LeoneSingaporeSomaliaSouth AfricaSouth AmericaSouth Central AsiaSouth Eastern AsiaSouthern EuropeSpainSri LankaSt. Vincent and the GrenadinesSudanSwedenSwitzerlandSyriaTaiwanThailandTrinidad and TobagoTurkeyUgandaUkraineUruguayUzbekistanVenezuelaVietnamWest IndiesWestern AfricaWestern AsiaWestern EuropeYemenZaireZimbabwe
Immigrant Origin (Percentage)
AfghanistanAfricaAlbaniaArgentinaArmeniaAsiaAustraliaAustriaAzoresBahamasBangladeshBarbadosBelarusBelgiumBelizeBoliviaBosnia and HerzegovinaBrazilBulgariaBurma / MyanmarCabo VerdeCambodiaCameroonCanadaCaribbeanCentral AmericaChileChinaColombiaCongoCosta RicaCroatiaCubaCzechoslovakiaDenmarkDominicaDominican RepublicEastern AfricaEastern AsiaEastern EuropeEcuadorEgyptEl SalvadorEnglandEritreaEthiopiaEuropeFijiFranceGermanyGhanaGreeceGrenadaGuatemalaGuyanaHaitiHondurasHong KongHungaryIndiaIndonesiaIranIraqIrelandIsraelItalyJamaicaJapanJordanKazakhstanKenyaKoreaKuwaitLaosLatin AmericaLatviaLebanonLiberiaLithuaniaMalaysiaMexicoMicronesiaMiddle AfricaMoldovaMoroccoNepalNetherlandsNicaraguaNigeriaNorth MacedoniaNorthern AfricaNorthern EuropeNorwayOceaniaPakistanPanamaPeruPhilippinesPolandPortugalRomaniaRussiaSaudi ArabiaScotlandSenegalSerbiaSierra LeoneSingaporeSomaliaSouth AfricaSouth AmericaSouth Central AsiaSouth Eastern AsiaSouthern EuropeSpainSri LankaSt. Vincent and the GrenadinesSudanSwedenSwitzerlandSyriaTaiwanThailandTrinidad and TobagoTurkeyUgandaUkraineUruguayUzbekistanVenezuelaVietnamWest IndiesWestern AfricaWestern AsiaWestern EuropeYemenZaireZimbabwe
Income
Income (Families)
Income (Households)
Poverty
Poverty (Families)
Unemployment
Employment Occupations
Employment Industries
Employer Class
Commute Time
Commute Means
School Enrollment
Education by Degree Field
Occupancy
Finances
Physical Characteristics
Colorado
Compare Cities
Comparison Subject

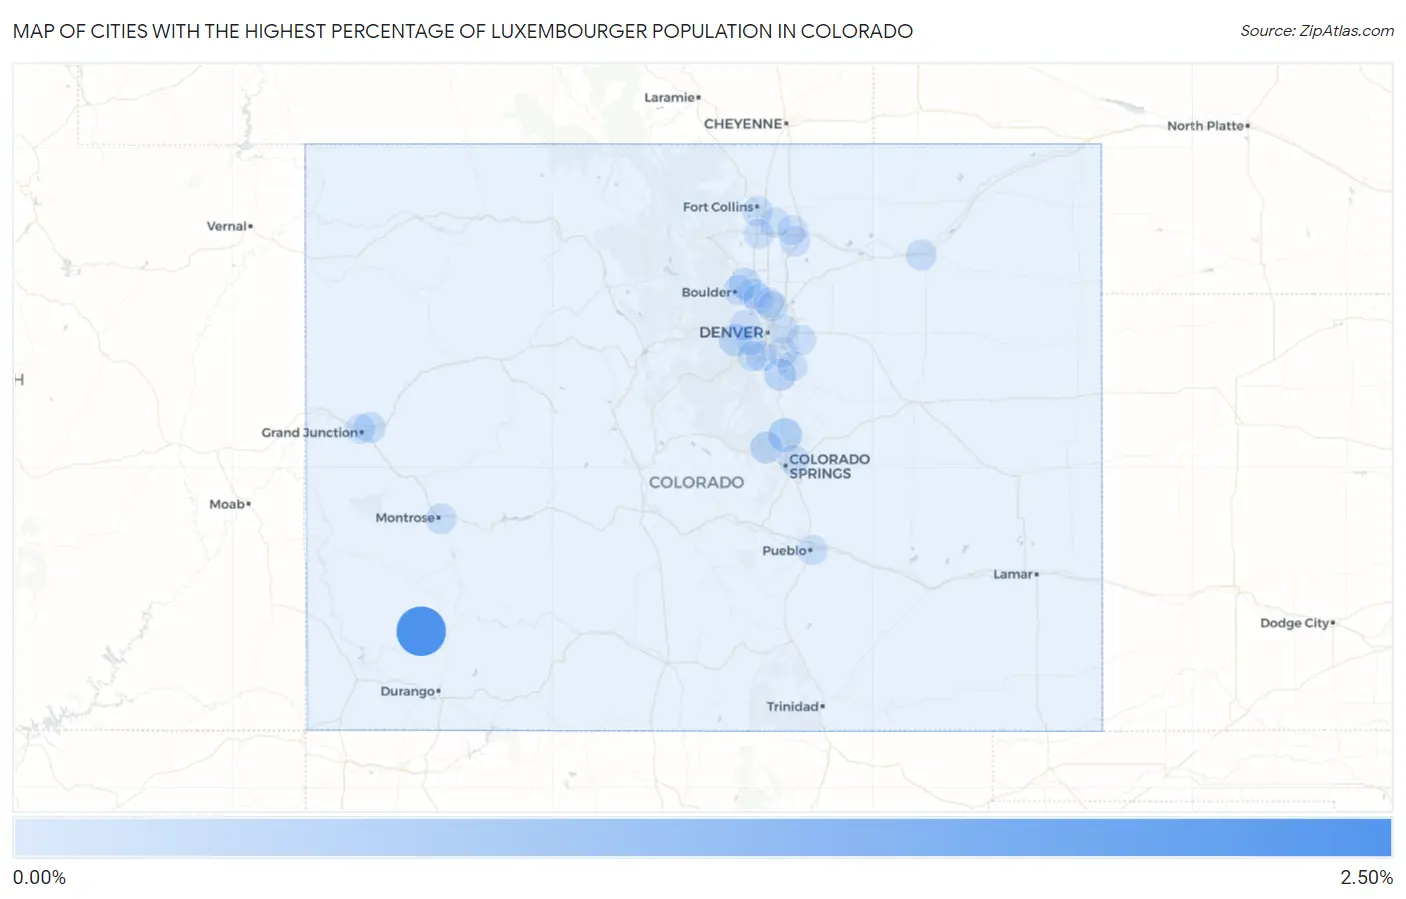
Map of Cities with the Highest Percentage of Luxembourger Population in Colorado

0.00%
2.50%
Cities with the Highest Percentage of Luxembourger Population in Colorado Map

Cities with the Highest Percentage of Luxembourger Population in Colorado

City Luxembourger vs State vs National
1.Rico2.36%0.020%(+2.34)#10.013%(+2.34)#38
2.Sterling Ranch0.47%0.020%(+0.454)#20.013%(+0.461)#239
3.Gleneagle0.42%0.020%(+0.401)#30.013%(+0.408)#274
4.Genesee0.25%0.020%(+0.228)#40.013%(+0.234)#441
5.Cascade Chipita Park0.23%0.020%(+0.211)#50.013%(+0.218)#471
6.Castle Pines0.22%0.020%(+0.201)#60.013%(+0.207)#490
7.Gunbarrel0.20%0.020%(+0.178)#70.013%(+0.185)#521
8.Fruitvale0.100%0.020%(+0.080)#80.013%(+0.087)#730
9.Brush0.094%0.020%(+0.075)#90.013%(+0.082)#751
10.Montrose0.074%0.020%(+0.054)#100.013%(+0.061)#821
11.Littleton0.064%0.020%(+0.044)#110.013%(+0.051)#862
12.Fairmount0.058%0.020%(+0.038)#120.013%(+0.045)#890
13.Evans0.054%0.020%(+0.035)#130.013%(+0.042)#913
14.Lafayette0.053%0.020%(+0.033)#140.013%(+0.040)#924
15.Fort Collins0.050%0.020%(+0.031)#150.013%(+0.038)#936
16.Centennial0.045%0.020%(+0.025)#160.013%(+0.032)#963
17.Colorado Springs0.043%0.020%(+0.024)#170.013%(+0.031)#973
18.Boulder0.038%0.020%(+0.018)#180.013%(+0.025)#1,000
19.Pueblo0.037%0.020%(+0.017)#190.013%(+0.024)#1,008
20.Windsor0.021%0.020%(+0.001)#200.013%(+0.008)#1,144
21.Lakewood0.020%0.020%(+0.000)#210.013%(+0.007)#1,150
22.Greeley0.019%0.020%(-0.000)#220.013%(+0.007)#1,155
23.Denver0.018%0.020%(-0.001)#230.013%(+0.006)#1,164
24.Ken Caryl0.018%0.020%(-0.002)#240.013%(+0.005)#1,169
25.Broomfield0.018%0.020%(-0.002)#250.013%(+0.005)#1,177
26.Northglenn0.013%0.020%(-0.006)#260.013%(+0.000)#1,225
27.Parker0.012%0.020%(-0.008)#270.013%(-0.001)#1,245
28.Loveland0.012%0.020%(-0.008)#280.013%(-0.001)#1,246
29.Grand Junction0.0091%0.020%(-0.010)#290.013%(-0.004)#1,282
30.Thornton0.0035%0.020%(-0.016)#300.013%(-0.009)#1,350
31.Aurora0.0013%0.020%(-0.018)#310.013%(-0.011)#1,372

Common Questions

What are the Top 10 Cities with the Highest Percentage of Luxembourger Population in Colorado?
Top 10 Cities with the Highest Percentage of Luxembourger Population in Colorado are:
#1
2.36%
#2
0.42%
#3
0.25%
#4
0.23%
#5
0.22%
#6
0.20%
#7
0.100%
#8
0.094%
#9
0.074%
#10
0.064%
What city has the Highest Percentage of Luxembourger Population in Colorado?
Rico has the Highest Percentage of Luxembourger Population in Colorado with 2.36%.
What is the Percentage of Luxembourger Population in the State of Colorado?
Percentage of Luxembourger Population in Colorado is 0.020%.
What is the Percentage of Luxembourger Population in the United States?
Percentage of Luxembourger Population in the United States is 0.013%.