Pennside, PA Map & Demographics
Pennside Map
Pennside Overview
$36,087
PER CAPITA INCOME
$88,925
AVG FAMILY INCOME
$74,388
AVG HOUSEHOLD INCOME
7.0%
WAGE / INCOME GAP [ % ]
93.0¢/ $1
WAGE / INCOME GAP [ $ ]
0.39
INEQUALITY / GINI INDEX
5,235
TOTAL POPULATION
2,612
MALE POPULATION
2,623
FEMALE POPULATION
99.58
MALES / 100 FEMALES
100.42
FEMALES / 100 MALES
39.8
MEDIAN AGE
3.1
AVG FAMILY SIZE
2.5
AVG HOUSEHOLD SIZE
3,105
LABOR FORCE [ PEOPLE ]
72.2%
PERCENT IN LABOR FORCE
4.0%
UNEMPLOYMENT RATE
Income in Pennside
Income Overview in Pennside
Per Capita Income in Pennside is $36,087, while median incomes of families and households are $88,925 and $74,388 respectively.
| Characteristic | Number | Measure |
| Per Capita Income | 5,235 | $36,087 |
| Median Family Income | 1,383 | $88,925 |
| Mean Family Income | 1,383 | $102,304 |
| Median Household Income | 2,054 | $74,388 |
| Mean Household Income | 2,054 | $91,384 |
| Income Deficit | 1,383 | $0 |
| Wage / Income Gap (%) | 5,235 | 7.03% |
| Wage / Income Gap ($) | 5,235 | 92.97¢ per $1 |
| Gini / Inequality Index | 5,235 | 0.39 |
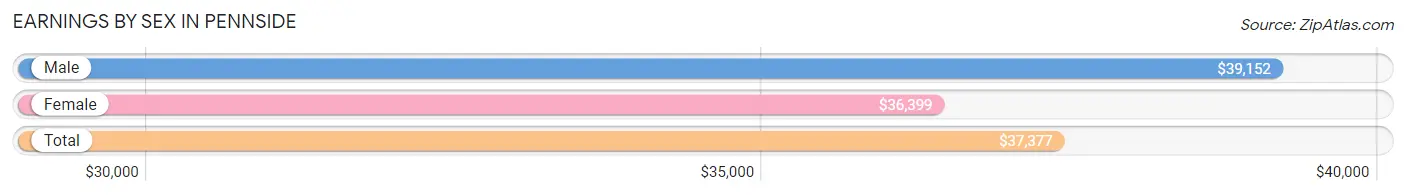
Earnings by Sex in Pennside
Average Earnings in Pennside are $37,377, $39,152 for men and $36,399 for women, a difference of 7.0%.
| Sex | Number | Average Earnings |
| Male | 1,637 (51.2%) | $39,152 |
| Female | 1,561 (48.8%) | $36,399 |
| Total | 3,198 (100.0%) | $37,377 |
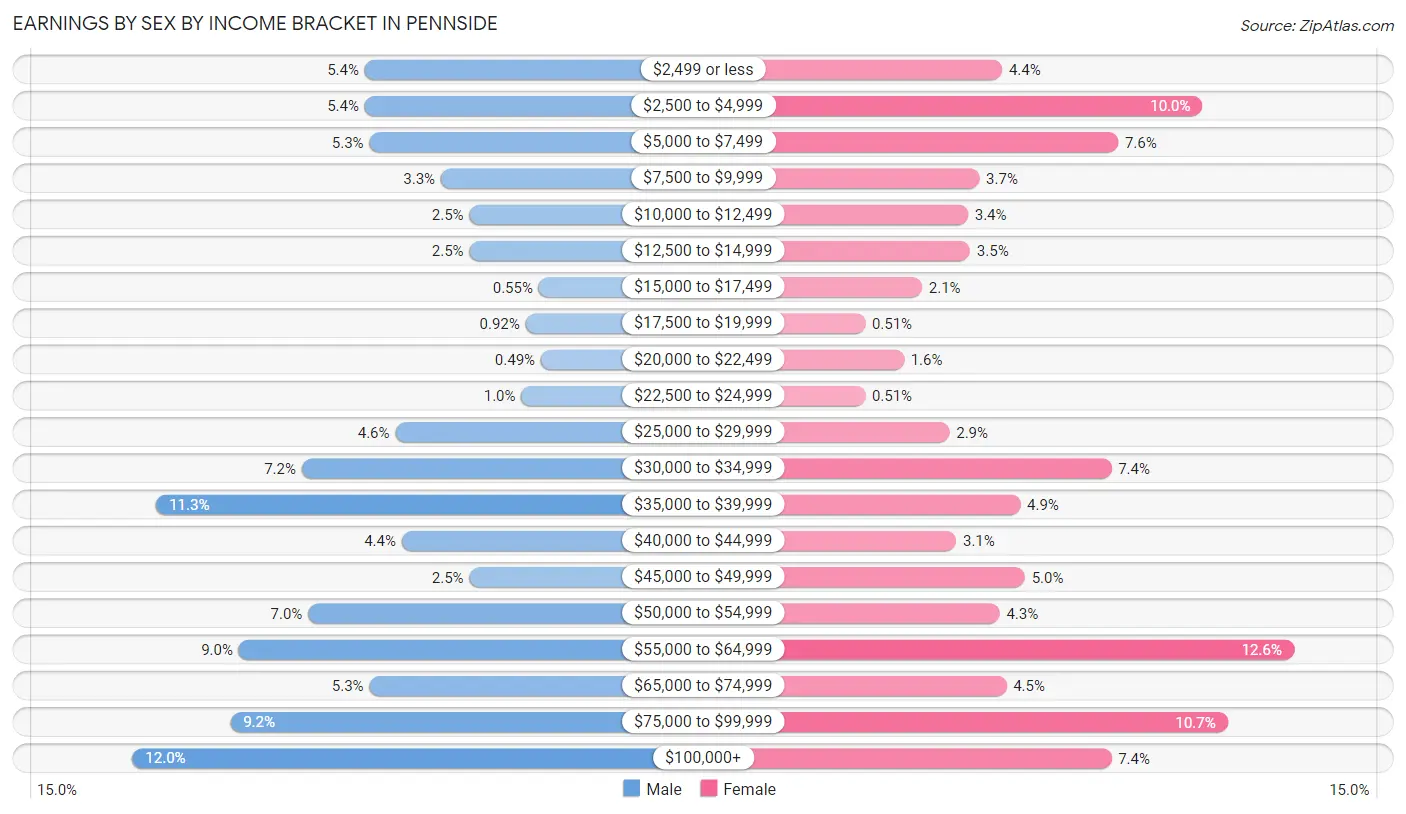
Earnings by Sex by Income Bracket in Pennside
The most common earnings brackets in Pennside are $100,000+ for men (196 | 12.0%) and $55,000 to $64,999 for women (196 | 12.6%).
| Income | Male | Female |
| $2,499 or less | 89 (5.4%) | 68 (4.4%) |
| $2,500 to $4,999 | 89 (5.4%) | 156 (10.0%) |
| $5,000 to $7,499 | 87 (5.3%) | 119 (7.6%) |
| $7,500 to $9,999 | 54 (3.3%) | 58 (3.7%) |
| $10,000 to $12,499 | 41 (2.5%) | 53 (3.4%) |
| $12,500 to $14,999 | 41 (2.5%) | 54 (3.5%) |
| $15,000 to $17,499 | 9 (0.5%) | 33 (2.1%) |
| $17,500 to $19,999 | 15 (0.9%) | 8 (0.5%) |
| $20,000 to $22,499 | 8 (0.5%) | 25 (1.6%) |
| $22,500 to $24,999 | 17 (1.0%) | 8 (0.5%) |
| $25,000 to $29,999 | 75 (4.6%) | 45 (2.9%) |
| $30,000 to $34,999 | 118 (7.2%) | 116 (7.4%) |
| $35,000 to $39,999 | 185 (11.3%) | 76 (4.9%) |
| $40,000 to $44,999 | 72 (4.4%) | 48 (3.1%) |
| $45,000 to $49,999 | 41 (2.5%) | 78 (5.0%) |
| $50,000 to $54,999 | 115 (7.0%) | 67 (4.3%) |
| $55,000 to $64,999 | 147 (9.0%) | 196 (12.6%) |
| $65,000 to $74,999 | 87 (5.3%) | 70 (4.5%) |
| $75,000 to $99,999 | 151 (9.2%) | 167 (10.7%) |
| $100,000+ | 196 (12.0%) | 116 (7.4%) |
| Total | 1,637 (100.0%) | 1,561 (100.0%) |
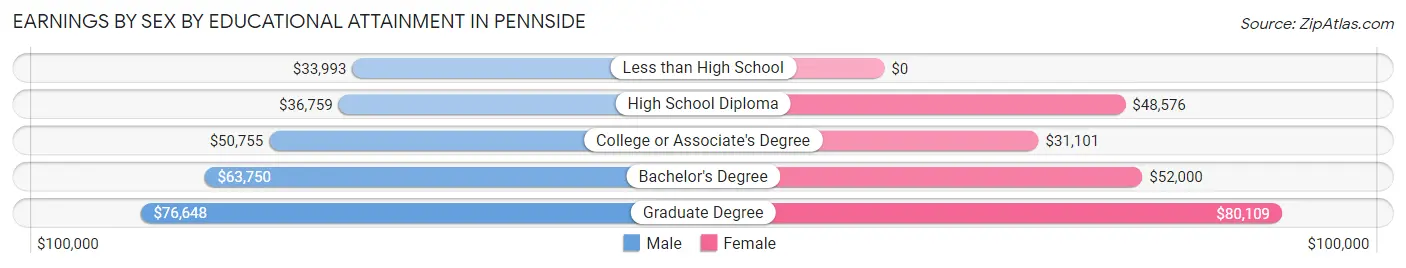
Earnings by Sex by Educational Attainment in Pennside
Average earnings in Pennside are $44,074 for men and $45,885 for women, a difference of 4.0%. Men with an educational attainment of graduate degree enjoy the highest average annual earnings of $76,648, while those with less than high school education earn the least with $33,993. Women with an educational attainment of graduate degree earn the most with the average annual earnings of $80,109, while those with college or associate's degree education have the smallest earnings of $31,101.
| Educational Attainment | Male Income | Female Income |
| Less than High School | $33,993 | $0 |
| High School Diploma | $36,759 | $48,576 |
| College or Associate's Degree | $50,755 | $31,101 |
| Bachelor's Degree | $63,750 | $52,000 |
| Graduate Degree | $76,648 | $80,109 |
| Total | $44,074 | $45,885 |
Family Income in Pennside
Family Income Brackets in Pennside
According to the Pennside family income data, there are 307 families falling into the $100,000 to $149,999 income range, which is the most common income bracket and makes up 22.2% of all families.
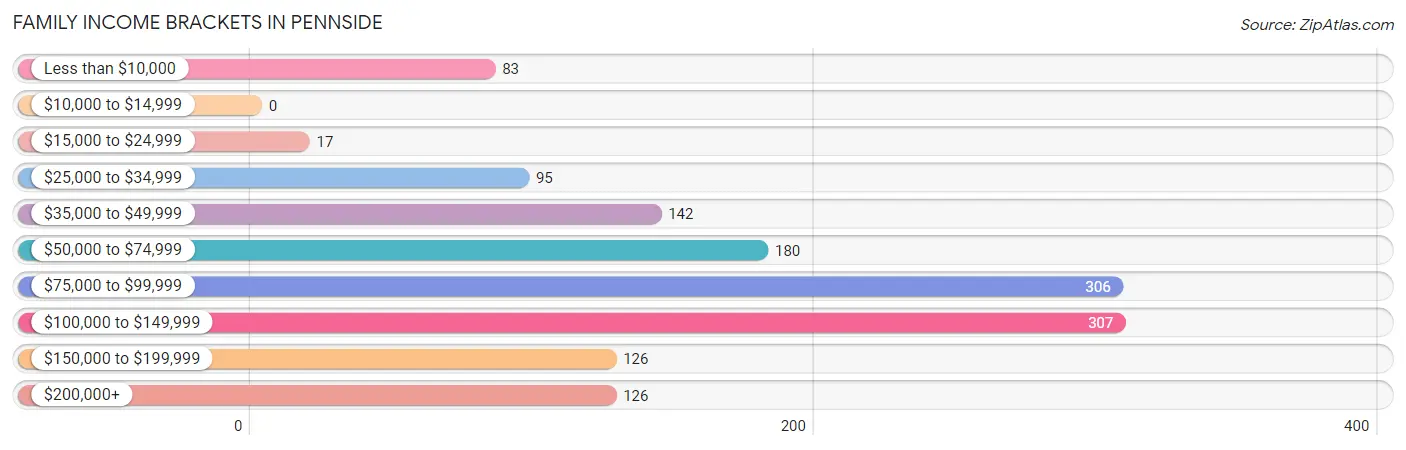
| Income Bracket | # Families | % Families |
| Less than $10,000 | 83 | 6.0% |
| $10,000 to $14,999 | 0 | 0.0% |
| $15,000 to $24,999 | 17 | 1.2% |
| $25,000 to $34,999 | 95 | 6.9% |
| $35,000 to $49,999 | 142 | 10.3% |
| $50,000 to $74,999 | 180 | 13.0% |
| $75,000 to $99,999 | 306 | 22.1% |
| $100,000 to $149,999 | 307 | 22.2% |
| $150,000 to $199,999 | 126 | 9.1% |
| $200,000+ | 126 | 9.1% |
Family Income by Famaliy Size in Pennside
4-person families (266 | 19.2%) account for the highest median family income in Pennside with $147,250 per family, while 4-person families (266 | 19.2%) have the highest median income of $36,812 per family member.
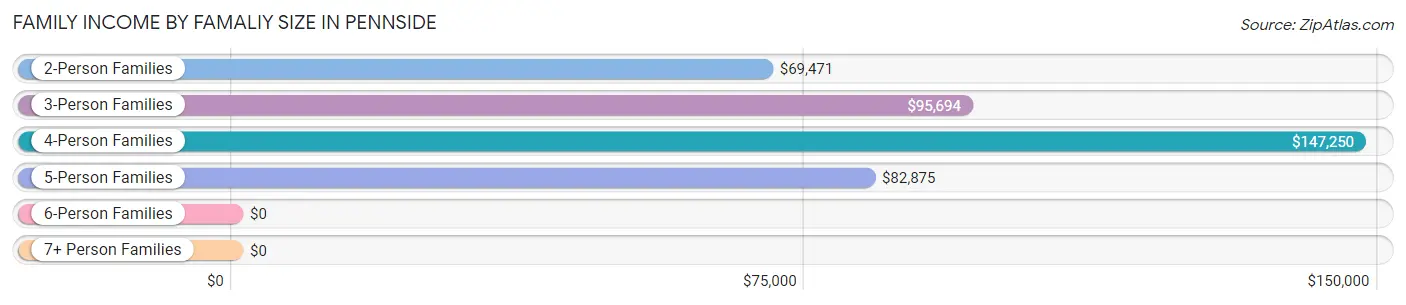
| Income Bracket | # Families | Median Income |
| 2-Person Families | 705 (51.0%) | $69,471 |
| 3-Person Families | 205 (14.8%) | $95,694 |
| 4-Person Families | 266 (19.2%) | $147,250 |
| 5-Person Families | 137 (9.9%) | $82,875 |
| 6-Person Families | 61 (4.4%) | $0 |
| 7+ Person Families | 9 (0.6%) | $0 |
| Total | 1,383 (100.0%) | $88,925 |
Family Income by Number of Earners in Pennside
The median family income in Pennside is $88,925, with families comprising 3+ earners (282) having the highest median family income of $150,962, while families with no earners (142) have the lowest median family income of $42,273, accounting for 20.4% and 10.3% of families, respectively.
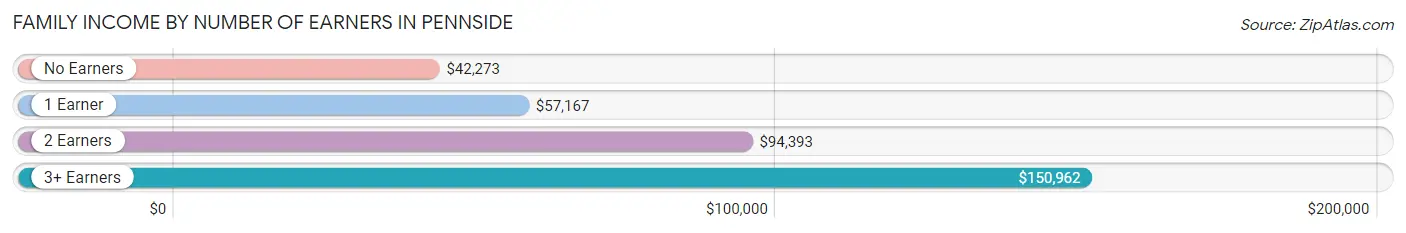
| Number of Earners | # Families | Median Income |
| No Earners | 142 (10.3%) | $42,273 |
| 1 Earner | 454 (32.8%) | $57,167 |
| 2 Earners | 505 (36.5%) | $94,393 |
| 3+ Earners | 282 (20.4%) | $150,962 |
| Total | 1,383 (100.0%) | $88,925 |
Household Income in Pennside
Household Income Brackets in Pennside
With 417 households falling in the category, the $100,000 to $149,999 income range is the most frequent in Pennside, accounting for 20.3% of all households. In contrast, only 16 households (0.8%) fall into the $10,000 to $14,999 income bracket, making it the least populous group.
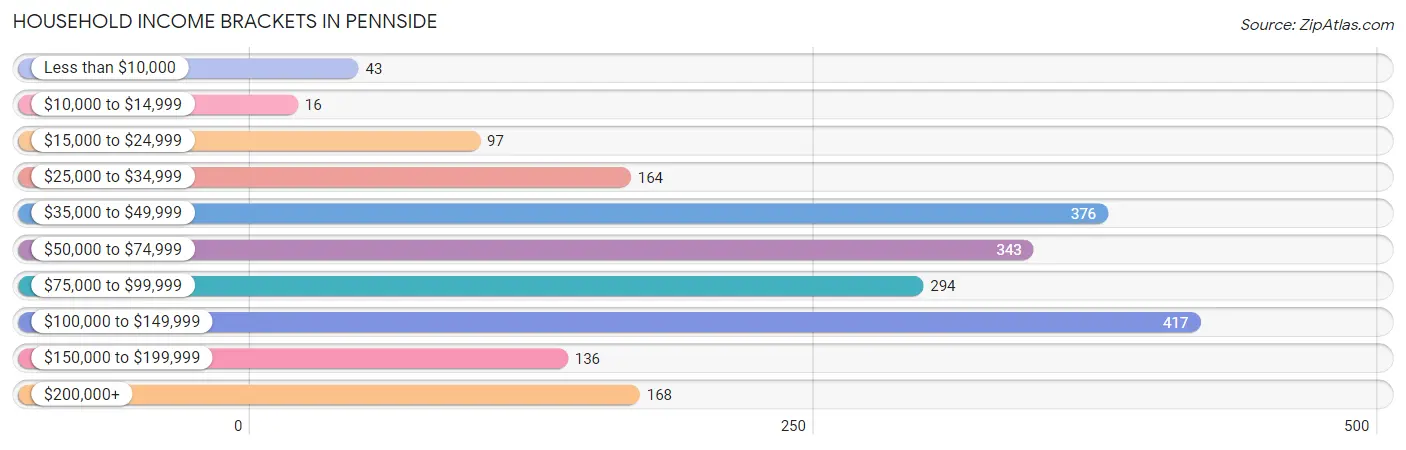
| Income Bracket | # Households | % Households |
| Less than $10,000 | 43 | 2.1% |
| $10,000 to $14,999 | 16 | 0.8% |
| $15,000 to $24,999 | 97 | 4.7% |
| $25,000 to $34,999 | 164 | 8.0% |
| $35,000 to $49,999 | 376 | 18.3% |
| $50,000 to $74,999 | 343 | 16.7% |
| $75,000 to $99,999 | 294 | 14.3% |
| $100,000 to $149,999 | 417 | 20.3% |
| $150,000 to $199,999 | 136 | 6.6% |
| $200,000+ | 168 | 8.2% |
Household Income by Householder Age in Pennside
The median household income in Pennside is $74,388, with the highest median household income of $93,865 found in the 45 to 64 years age bracket for the primary householder. A total of 895 households (43.6%) fall into this category.
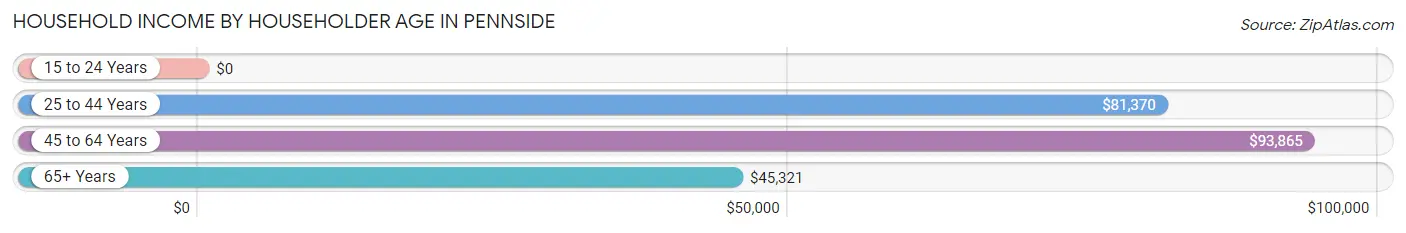
| Income Bracket | # Households | Median Income |
| 15 to 24 Years | 0 (0.0%) | $0 |
| 25 to 44 Years | 621 (30.2%) | $81,370 |
| 45 to 64 Years | 895 (43.6%) | $93,865 |
| 65+ Years | 538 (26.2%) | $45,321 |
| Total | 2,054 (100.0%) | $74,388 |
Poverty in Pennside
Income Below Poverty by Sex and Age in Pennside
With 11.9% poverty level for males and 10.6% for females among the residents of Pennside, 15 year old males and 6 to 11 year old females are the most vulnerable to poverty, with 43 males (78.2%) and 39 females (32.0%) in their respective age groups living below the poverty level.
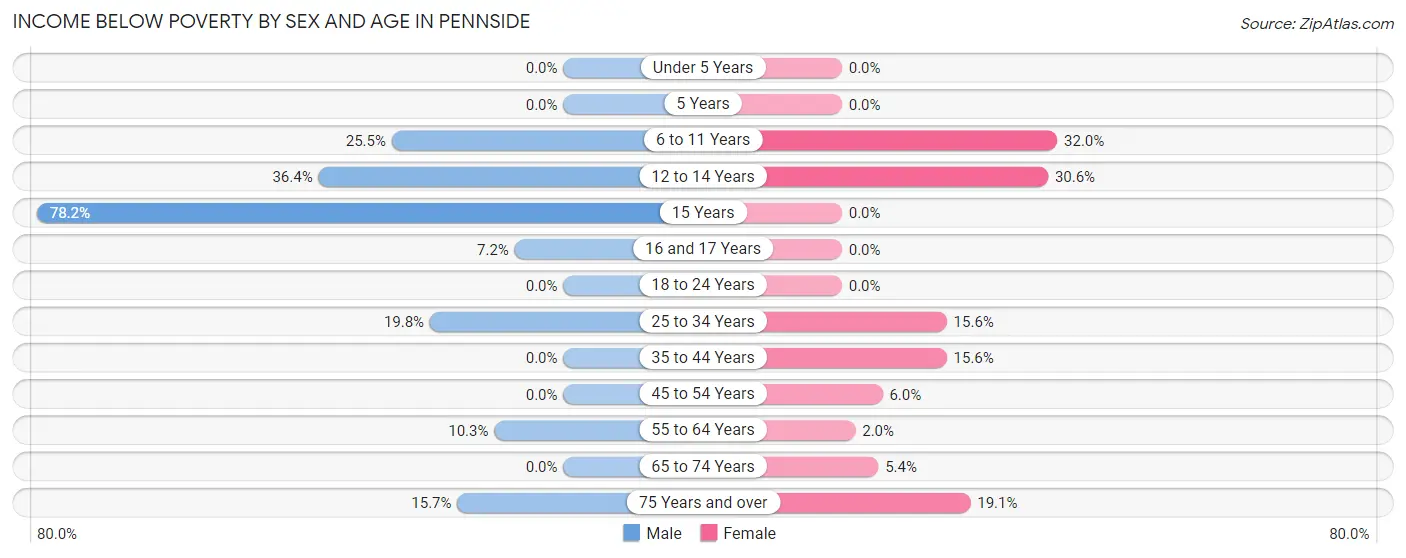
| Age Bracket | Male | Female |
| Under 5 Years | 0 (0.0%) | 0 (0.0%) |
| 5 Years | 0 (0.0%) | 0 (0.0%) |
| 6 to 11 Years | 41 (25.5%) | 39 (32.0%) |
| 12 to 14 Years | 40 (36.4%) | 45 (30.6%) |
| 15 Years | 43 (78.2%) | 0 (0.0%) |
| 16 and 17 Years | 6 (7.2%) | 0 (0.0%) |
| 18 to 24 Years | 0 (0.0%) | 0 (0.0%) |
| 25 to 34 Years | 104 (19.8%) | 71 (15.6%) |
| 35 to 44 Years | 0 (0.0%) | 54 (15.6%) |
| 45 to 54 Years | 0 (0.0%) | 16 (6.0%) |
| 55 to 64 Years | 45 (10.2%) | 9 (2.0%) |
| 65 to 74 Years | 0 (0.0%) | 14 (5.4%) |
| 75 Years and over | 31 (15.7%) | 29 (19.1%) |
| Total | 310 (11.9%) | 277 (10.6%) |
Income Above Poverty by Sex and Age in Pennside
According to the poverty statistics in Pennside, males aged under 5 years and females aged under 5 years are the age groups that are most secure financially, with 100.0% of males and 100.0% of females in these age groups living above the poverty line.
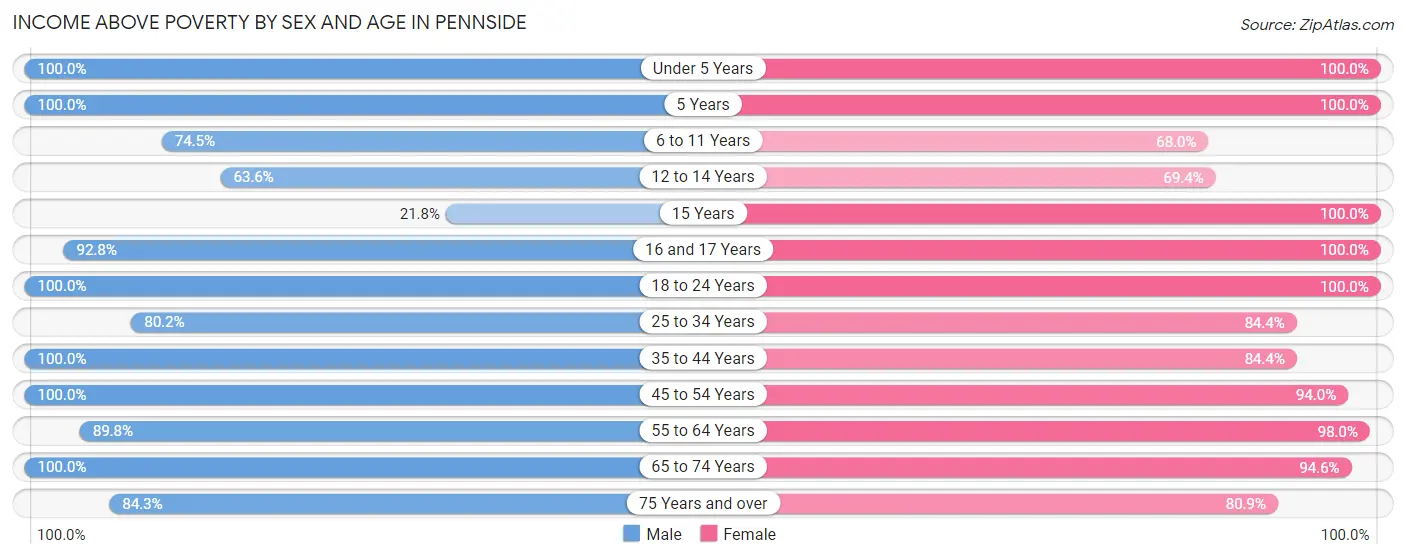
| Age Bracket | Male | Female |
| Under 5 Years | 140 (100.0%) | 61 (100.0%) |
| 5 Years | 29 (100.0%) | 21 (100.0%) |
| 6 to 11 Years | 120 (74.5%) | 83 (68.0%) |
| 12 to 14 Years | 70 (63.6%) | 102 (69.4%) |
| 15 Years | 12 (21.8%) | 89 (100.0%) |
| 16 and 17 Years | 77 (92.8%) | 93 (100.0%) |
| 18 to 24 Years | 104 (100.0%) | 161 (100.0%) |
| 25 to 34 Years | 421 (80.2%) | 385 (84.4%) |
| 35 to 44 Years | 188 (100.0%) | 293 (84.4%) |
| 45 to 54 Years | 318 (100.0%) | 249 (94.0%) |
| 55 to 64 Years | 394 (89.7%) | 441 (98.0%) |
| 65 to 74 Years | 263 (100.0%) | 245 (94.6%) |
| 75 Years and over | 166 (84.3%) | 123 (80.9%) |
| Total | 2,302 (88.1%) | 2,346 (89.4%) |
Income Below Poverty Among Married-Couple Families in Pennside
The poverty statistics for married-couple families in Pennside show that 6.5% or 64 of the total 981 families live below the poverty line. Families with 3 or 4 children have the highest poverty rate of 31.1%, comprising of 41 families. On the other hand, families with 1 or 2 children have the lowest poverty rate of 0.0%, which includes 0 families.
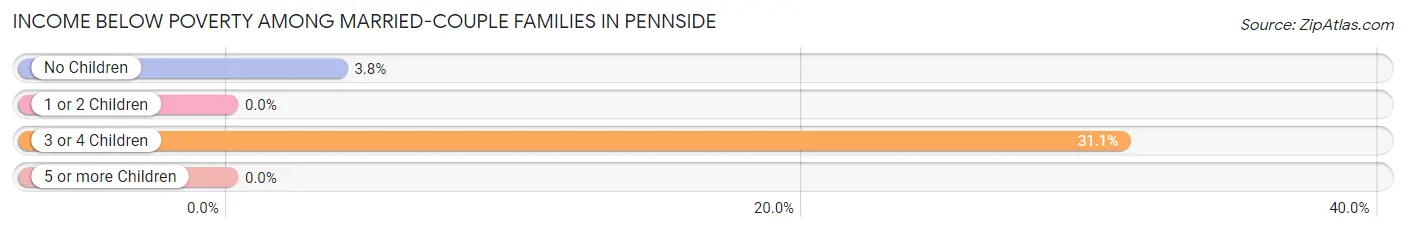
| Children | Above Poverty | Below Poverty |
| No Children | 580 (96.2%) | 23 (3.8%) |
| 1 or 2 Children | 246 (100.0%) | 0 (0.0%) |
| 3 or 4 Children | 91 (68.9%) | 41 (31.1%) |
| 5 or more Children | 0 (0.0%) | 0 (0.0%) |
| Total | 917 (93.5%) | 64 (6.5%) |
Income Below Poverty Among Single-Parent Households in Pennside
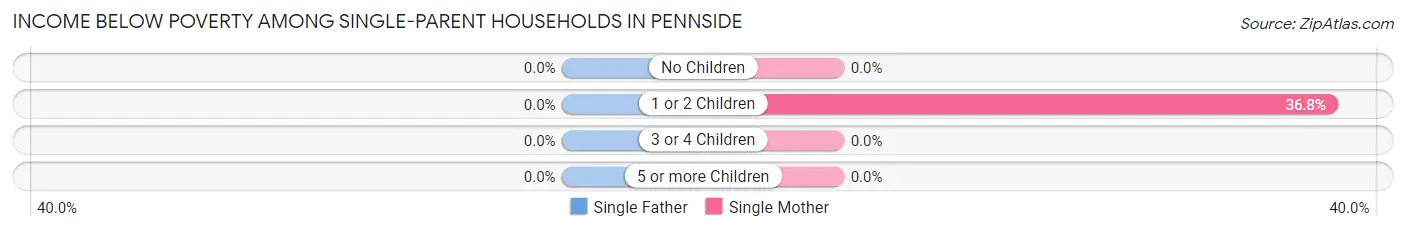
| Children | Single Father | Single Mother |
| No Children | 0 (0.0%) | 0 (0.0%) |
| 1 or 2 Children | 0 (0.0%) | 60 (36.8%) |
| 3 or 4 Children | 0 (0.0%) | 0 (0.0%) |
| 5 or more Children | 0 (0.0%) | 0 (0.0%) |
| Total | 0 (0.0%) | 60 (20.3%) |
Income Below Poverty Among Married-Couple vs Single-Parent Households in Pennside
The poverty data for Pennside shows that 64 of the married-couple family households (6.5%) and 60 of the single-parent households (14.9%) are living below the poverty level. Within the married-couple family households, those with 3 or 4 children have the highest poverty rate, with 41 households (31.1%) falling below the poverty line. Among the single-parent households, those with 1 or 2 children have the highest poverty rate, with 60 household (30.9%) living below poverty.
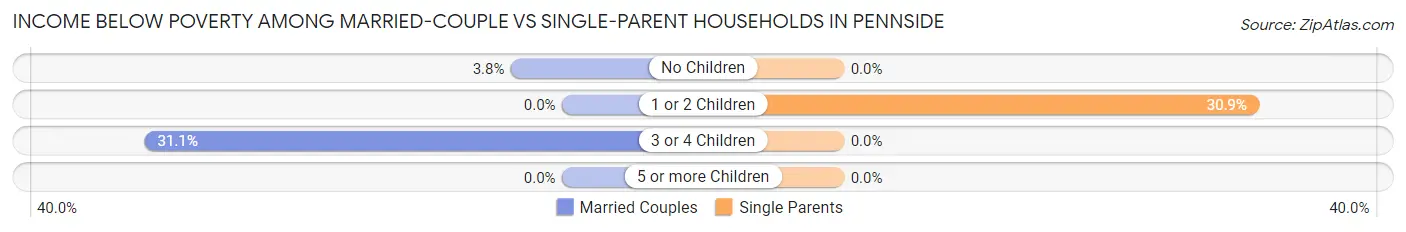
| Children | Married-Couple Families | Single-Parent Households |
| No Children | 23 (3.8%) | 0 (0.0%) |
| 1 or 2 Children | 0 (0.0%) | 60 (30.9%) |
| 3 or 4 Children | 41 (31.1%) | 0 (0.0%) |
| 5 or more Children | 0 (0.0%) | 0 (0.0%) |
| Total | 64 (6.5%) | 60 (14.9%) |
Race in Pennside
The most populous races in Pennside are White / Caucasian (4,110 | 78.5%), Hispanic or Latino (1,025 | 19.6%), and Two or more Races (742 | 14.2%).
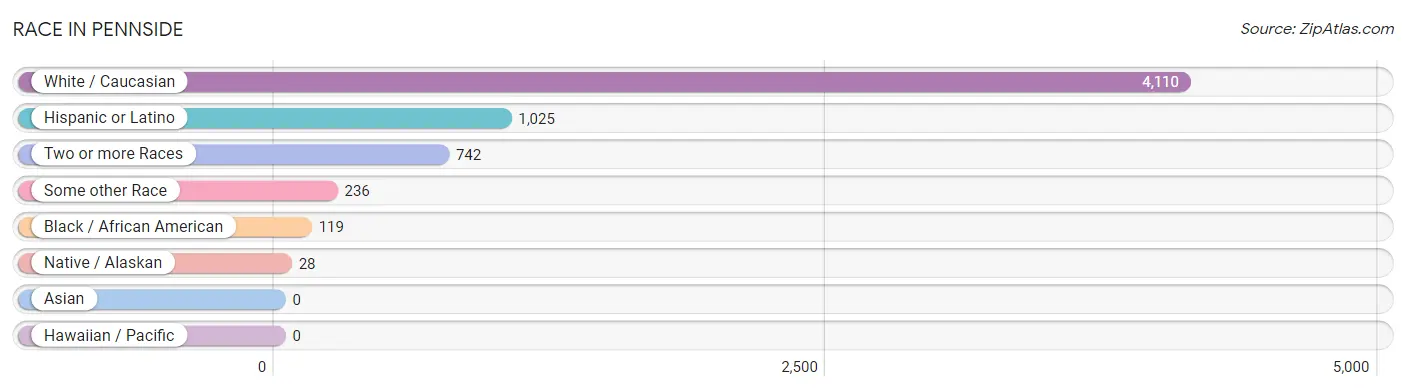
| Race | # Population | % Population |
| Asian | 0 | 0.0% |
| Black / African American | 119 | 2.3% |
| Hawaiian / Pacific | 0 | 0.0% |
| Hispanic or Latino | 1,025 | 19.6% |
| Native / Alaskan | 28 | 0.5% |
| White / Caucasian | 4,110 | 78.5% |
| Two or more Races | 742 | 14.2% |
| Some other Race | 236 | 4.5% |
| Total | 5,235 | 100.0% |
Ancestry in Pennside
The most populous ancestries reported in Pennside are German (1,414 | 27.0%), Italian (728 | 13.9%), Irish (516 | 9.9%), Polish (447 | 8.5%), and Dominican (370 | 7.1%), together accounting for 66.4% of all Pennside residents.
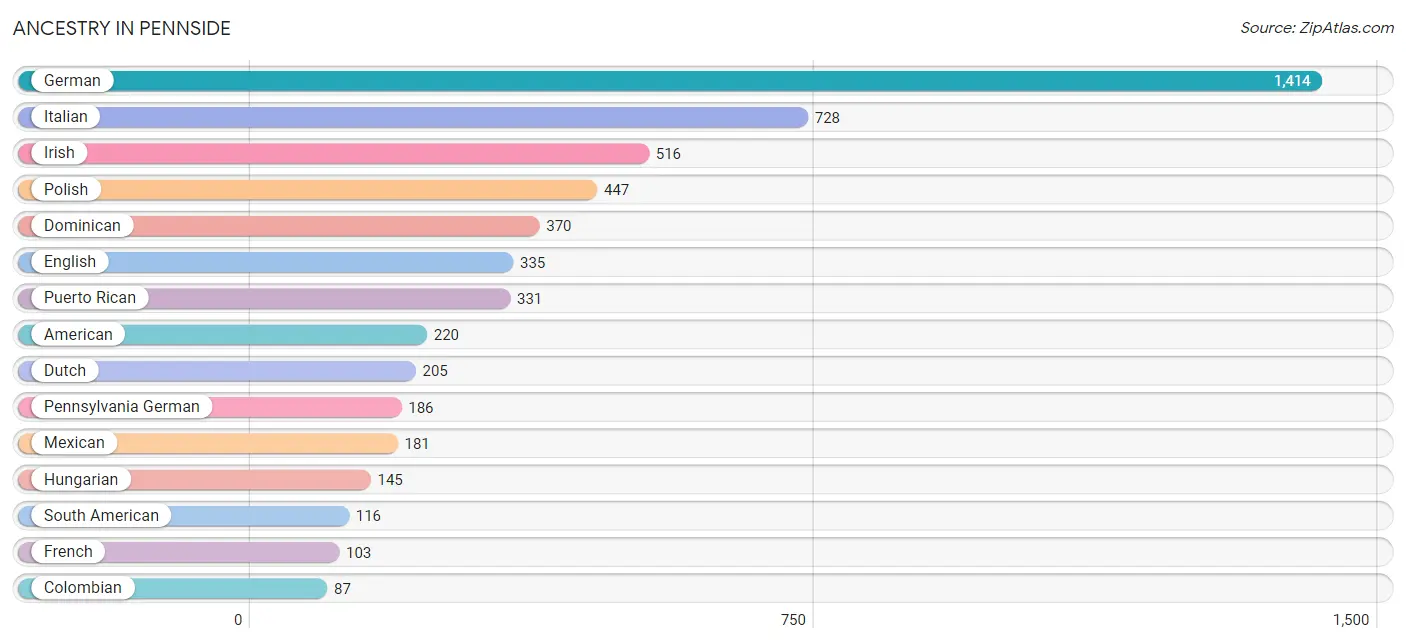
| Ancestry | # Population | % Population |
| African | 12 | 0.2% |
| American | 220 | 4.2% |
| Austrian | 30 | 0.6% |
| British | 6 | 0.1% |
| Central American | 27 | 0.5% |
| Central American Indian | 21 | 0.4% |
| Colombian | 87 | 1.7% |
| Dominican | 370 | 7.1% |
| Dutch | 205 | 3.9% |
| Ecuadorian | 29 | 0.5% |
| English | 335 | 6.4% |
| European | 27 | 0.5% |
| French | 103 | 2.0% |
| French Canadian | 34 | 0.6% |
| German | 1,414 | 27.0% |
| Greek | 11 | 0.2% |
| Hungarian | 145 | 2.8% |
| Indian (Asian) | 65 | 1.2% |
| Irish | 516 | 9.9% |
| Italian | 728 | 13.9% |
| Korean | 16 | 0.3% |
| Lithuanian | 6 | 0.1% |
| Mexican | 181 | 3.5% |
| Nicaraguan | 27 | 0.5% |
| Northern European | 7 | 0.1% |
| Pennsylvania German | 186 | 3.5% |
| Polish | 447 | 8.5% |
| Portuguese | 5 | 0.1% |
| Puerto Rican | 331 | 6.3% |
| Romanian | 54 | 1.0% |
| Russian | 14 | 0.3% |
| Scotch-Irish | 57 | 1.1% |
| Scottish | 60 | 1.1% |
| Slovak | 30 | 0.6% |
| South American | 116 | 2.2% |
| Subsaharan African | 12 | 0.2% |
| Swedish | 5 | 0.1% |
| Thai | 65 | 1.2% |
| Trinidadian and Tobagonian | 34 | 0.6% |
| Ukrainian | 18 | 0.3% |
| Welsh | 50 | 1.0% | View All 41 Rows |
Immigrants in Pennside
The most numerous immigrant groups reported in Pennside came from Latin America (379 | 7.2%), Caribbean (262 | 5.0%), Dominican Republic (253 | 4.8%), Colombia (87 | 1.7%), and South America (87 | 1.7%), together accounting for 20.4% of all Pennside residents.
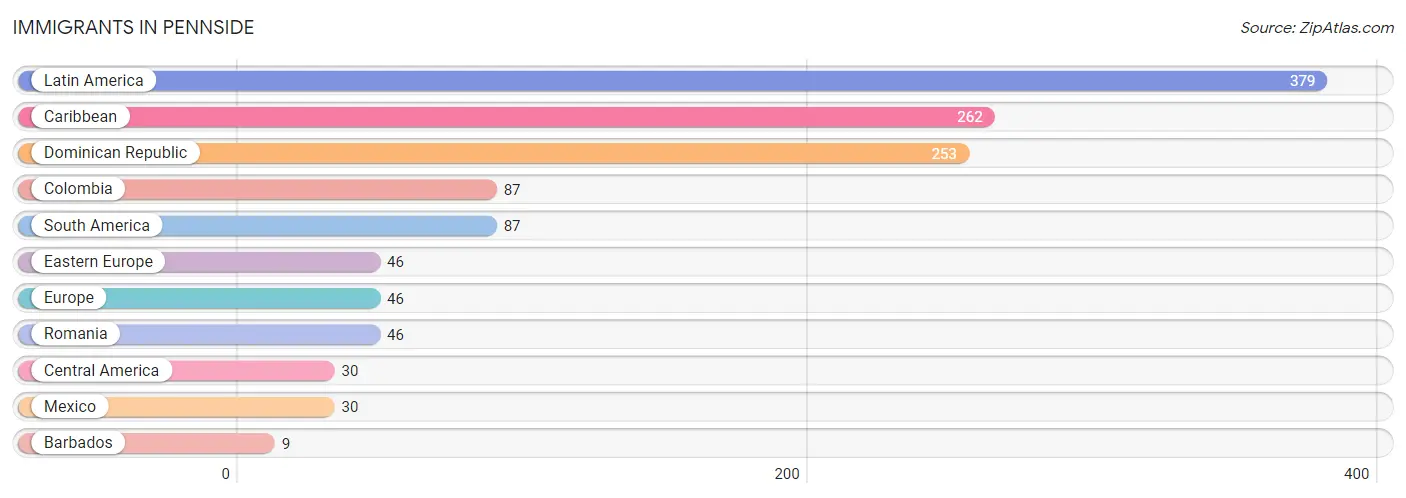
| Immigration Origin | # Population | % Population |
| Barbados | 9 | 0.2% |
| Caribbean | 262 | 5.0% |
| Central America | 30 | 0.6% |
| Colombia | 87 | 1.7% |
| Dominican Republic | 253 | 4.8% |
| Eastern Europe | 46 | 0.9% |
| Europe | 46 | 0.9% |
| Latin America | 379 | 7.2% |
| Mexico | 30 | 0.6% |
| Romania | 46 | 0.9% |
| South America | 87 | 1.7% | View All 11 Rows |
Sex and Age in Pennside
Sex and Age in Pennside
The most populous age groups in Pennside are 30 to 34 Years (264 | 10.1%) for men and 60 to 64 Years (309 | 11.8%) for women.
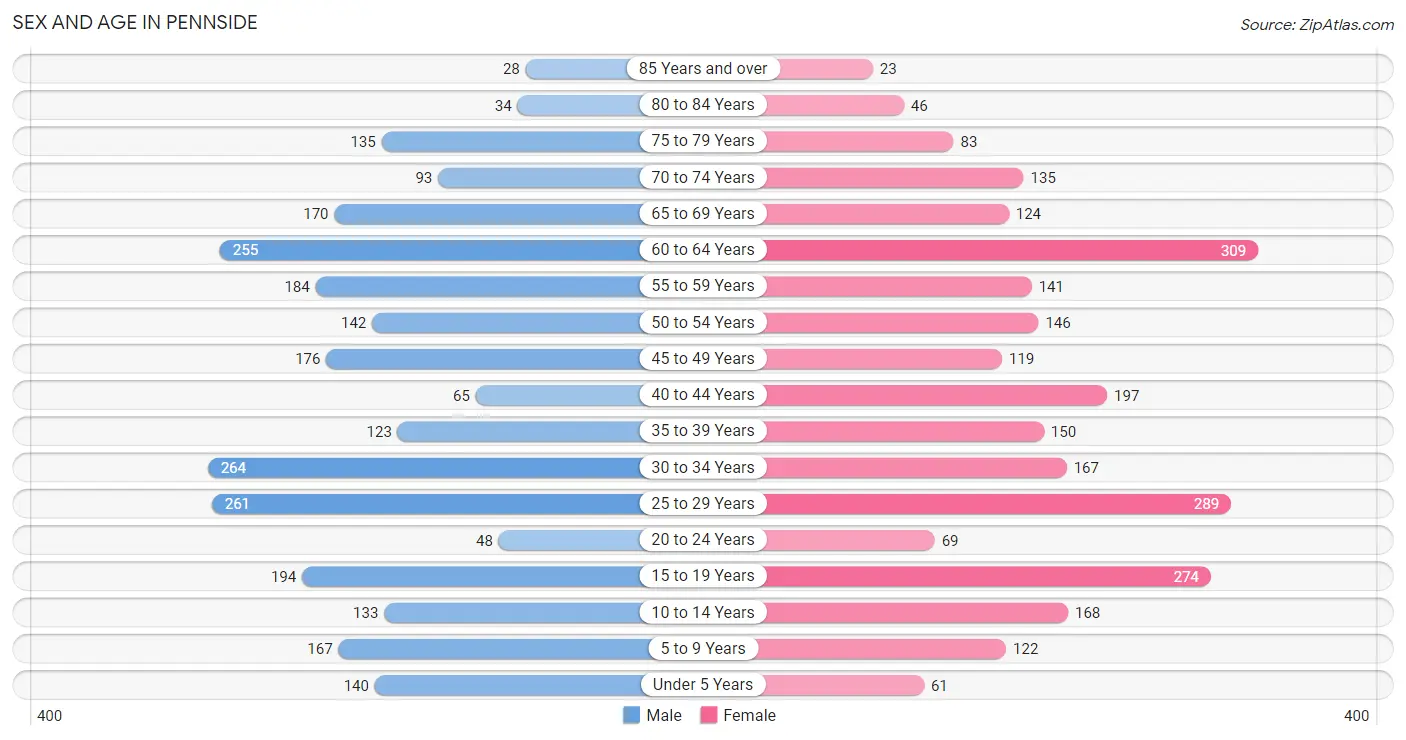
| Age Bracket | Male | Female |
| Under 5 Years | 140 (5.4%) | 61 (2.3%) |
| 5 to 9 Years | 167 (6.4%) | 122 (4.6%) |
| 10 to 14 Years | 133 (5.1%) | 168 (6.4%) |
| 15 to 19 Years | 194 (7.4%) | 274 (10.4%) |
| 20 to 24 Years | 48 (1.8%) | 69 (2.6%) |
| 25 to 29 Years | 261 (10.0%) | 289 (11.0%) |
| 30 to 34 Years | 264 (10.1%) | 167 (6.4%) |
| 35 to 39 Years | 123 (4.7%) | 150 (5.7%) |
| 40 to 44 Years | 65 (2.5%) | 197 (7.5%) |
| 45 to 49 Years | 176 (6.7%) | 119 (4.5%) |
| 50 to 54 Years | 142 (5.4%) | 146 (5.6%) |
| 55 to 59 Years | 184 (7.0%) | 141 (5.4%) |
| 60 to 64 Years | 255 (9.8%) | 309 (11.8%) |
| 65 to 69 Years | 170 (6.5%) | 124 (4.7%) |
| 70 to 74 Years | 93 (3.6%) | 135 (5.1%) |
| 75 to 79 Years | 135 (5.2%) | 83 (3.2%) |
| 80 to 84 Years | 34 (1.3%) | 46 (1.8%) |
| 85 Years and over | 28 (1.1%) | 23 (0.9%) |
| Total | 2,612 (100.0%) | 2,623 (100.0%) |
Families and Households in Pennside
Median Family Size in Pennside
The median family size in Pennside is 3.06 persons per family, with married-couple families (981 | 70.9%) accounting for the largest median family size of 3.3 persons per family. On the other hand, single male/father families (106 | 7.7%) represent the smallest median family size with 2.42 persons per family.
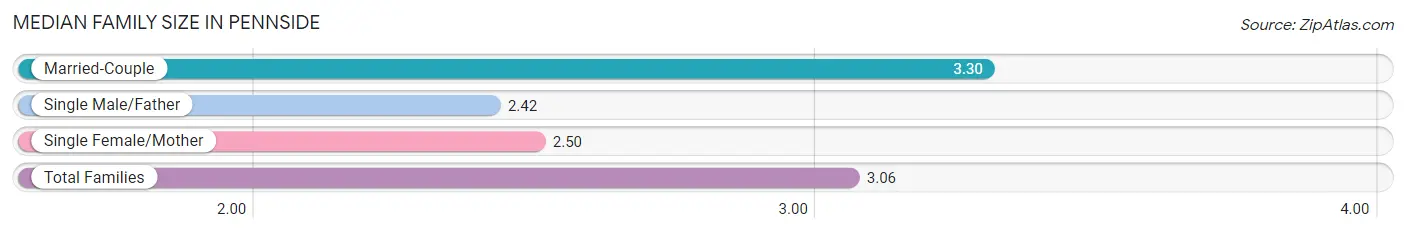
| Family Type | # Families | Family Size |
| Married-Couple | 981 (70.9%) | 3.30 |
| Single Male/Father | 106 (7.7%) | 2.42 |
| Single Female/Mother | 296 (21.4%) | 2.50 |
| Total Families | 1,383 (100.0%) | 3.06 |
Median Household Size in Pennside
The median household size in Pennside is 2.55 persons per household, with married-couple households (981 | 47.8%) accounting for the largest median household size of 3.4 persons per household. non-family households (671 | 32.7%) represent the smallest median household size with 1.12 persons per household.
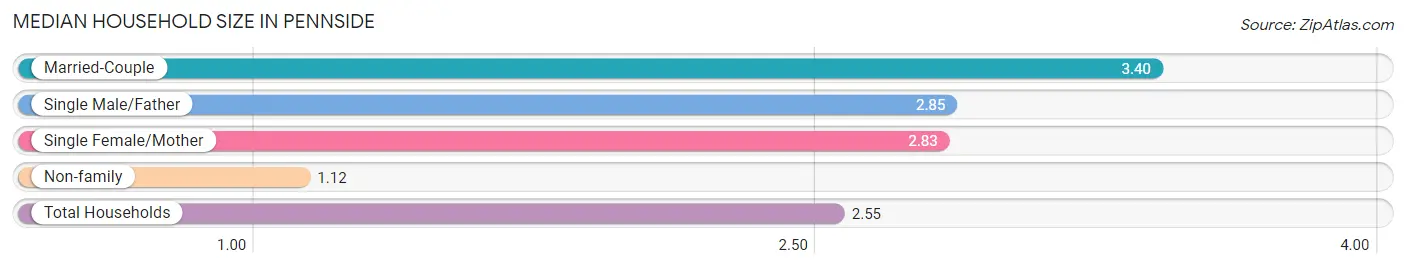
| Household Type | # Households | Household Size |
| Married-Couple | 981 (47.8%) | 3.40 |
| Single Male/Father | 106 (5.2%) | 2.85 |
| Single Female/Mother | 296 (14.4%) | 2.83 |
| Non-family | 671 (32.7%) | 1.12 |
| Total Households | 2,054 (100.0%) | 2.55 |
Household Size by Marriage Status in Pennside
Out of a total of 2,054 households in Pennside, 1,383 (67.3%) are family households, while 671 (32.7%) are nonfamily households. The most numerous type of family households are 2-person households, comprising 547, and the most common type of nonfamily households are 1-person households, comprising 600.
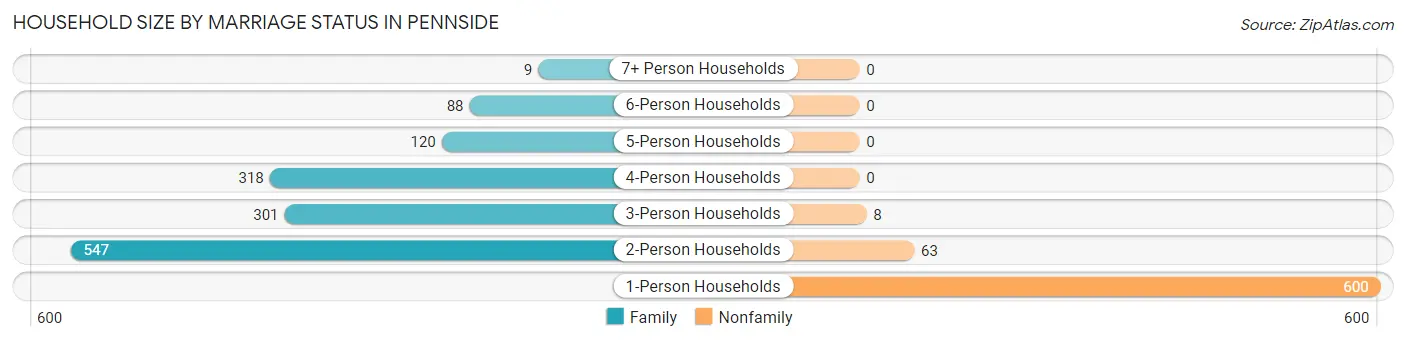
| Household Size | Family Households | Nonfamily Households |
| 1-Person Households | - | 600 (29.2%) |
| 2-Person Households | 547 (26.6%) | 63 (3.1%) |
| 3-Person Households | 301 (14.6%) | 8 (0.4%) |
| 4-Person Households | 318 (15.5%) | 0 (0.0%) |
| 5-Person Households | 120 (5.8%) | 0 (0.0%) |
| 6-Person Households | 88 (4.3%) | 0 (0.0%) |
| 7+ Person Households | 9 (0.4%) | 0 (0.0%) |
| Total | 1,383 (67.3%) | 671 (32.7%) |
Female Fertility in Pennside
Fertility by Age in Pennside
Average fertility rate in Pennside is 80.0 births per 1,000 women. Women in the age bracket of 20 to 34 years have the highest fertility rate with 133.0 births per 1,000 women. Women in the age bracket of 20 to 34 years acount for 66.0% of all women with births.
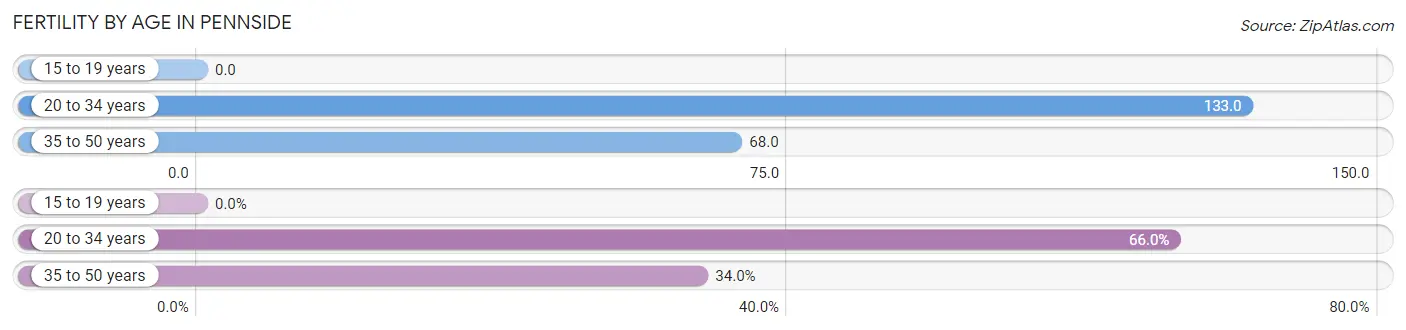
| Age Bracket | Women with Births | Births / 1,000 Women |
| 15 to 19 years | 0 (0.0%) | 0.0 |
| 20 to 34 years | 70 (66.0%) | 133.0 |
| 35 to 50 years | 36 (34.0%) | 68.0 |
| Total | 106 (100.0%) | 80.0 |
Fertility by Age by Marriage Status in Pennside
25.5% of women with births (106) in Pennside are married. The highest percentage of unmarried women with births falls into 20 to 34 years age bracket with 100.0% of them unmarried at the time of birth, while the lowest percentage of unmarried women with births belong to 35 to 50 years age bracket with 25.0% of them unmarried.
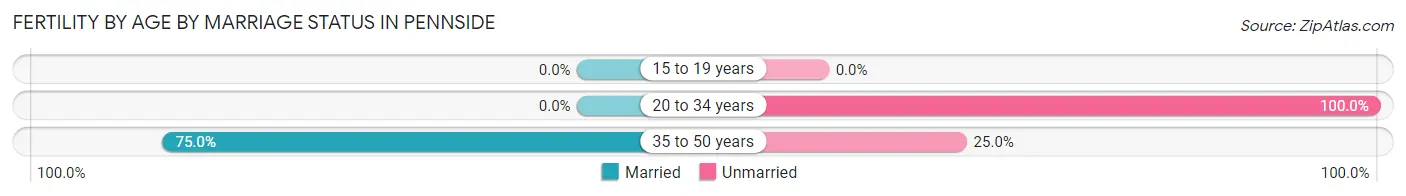
| Age Bracket | Married | Unmarried |
| 15 to 19 years | 0 (0.0%) | 0 (0.0%) |
| 20 to 34 years | 0 (0.0%) | 70 (100.0%) |
| 35 to 50 years | 27 (75.0%) | 9 (25.0%) |
| Total | 27 (25.5%) | 79 (74.5%) |
Fertility by Education in Pennside
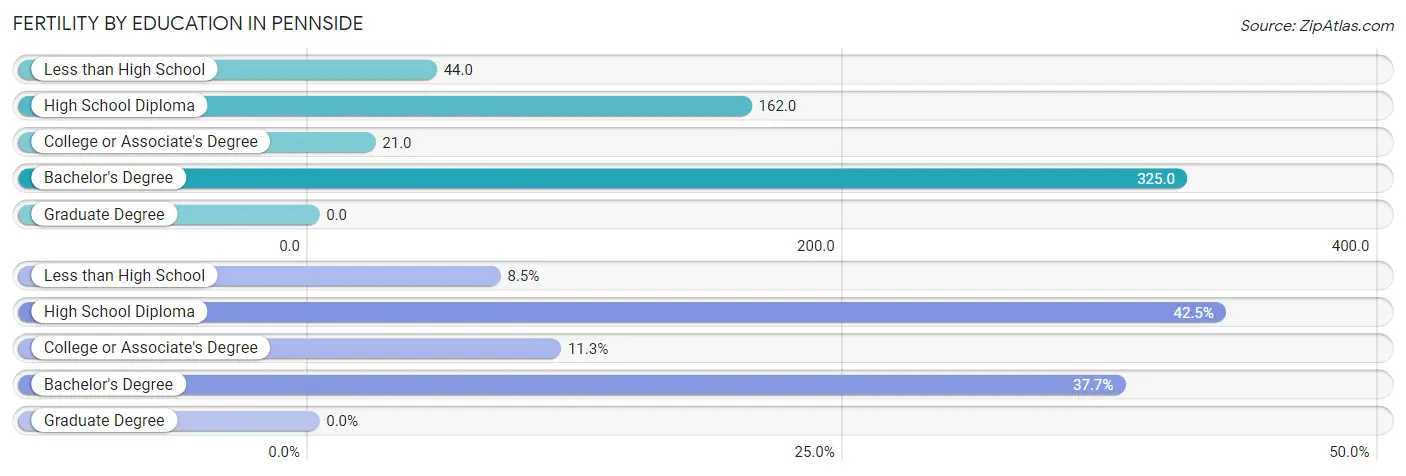
| Educational Attainment | Women with Births | Births / 1,000 Women |
| Less than High School | 9 (8.5%) | 44.0 |
| High School Diploma | 45 (42.4%) | 162.0 |
| College or Associate's Degree | 12 (11.3%) | 21.0 |
| Bachelor's Degree | 40 (37.7%) | 325.0 |
| Graduate Degree | 0 (0.0%) | 0.0 |
| Total | 106 (100.0%) | 80.0 |
Fertility by Education by Marriage Status in Pennside
74.5% of women with births in Pennside are unmarried. Women with the educational attainment of high school diploma are most likely to be married with 60.0% of them married at childbirth, while women with the educational attainment of less than high school are least likely to be married with 100.0% of them unmarried at childbirth.
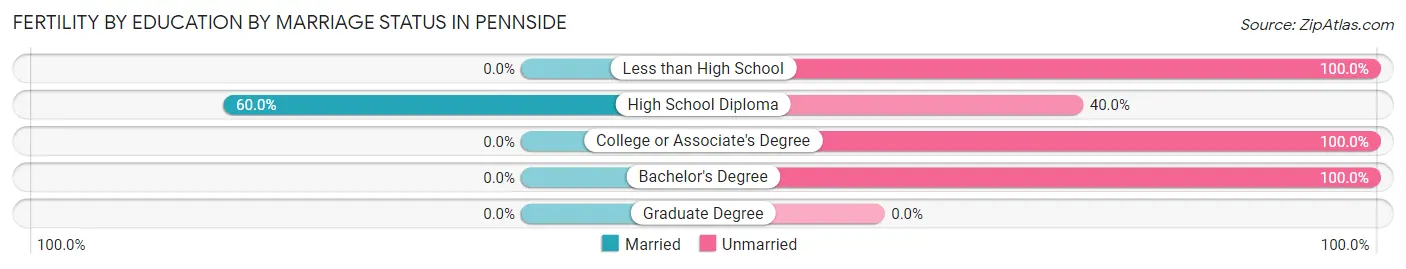
| Educational Attainment | Married | Unmarried |
| Less than High School | 0 (0.0%) | 9 (100.0%) |
| High School Diploma | 27 (60.0%) | 18 (40.0%) |
| College or Associate's Degree | 0 (0.0%) | 12 (100.0%) |
| Bachelor's Degree | 0 (0.0%) | 40 (100.0%) |
| Graduate Degree | 0 (0.0%) | 0 (0.0%) |
| Total | 27 (25.5%) | 79 (74.5%) |
Employment Characteristics in Pennside
Employment by Class of Employer in Pennside
Among the 2,955 employed individuals in Pennside, private company employees (2,313 | 78.3%), not-for-profit organizations (239 | 8.1%), and local government employees (169 | 5.7%) make up the most common classes of employment.
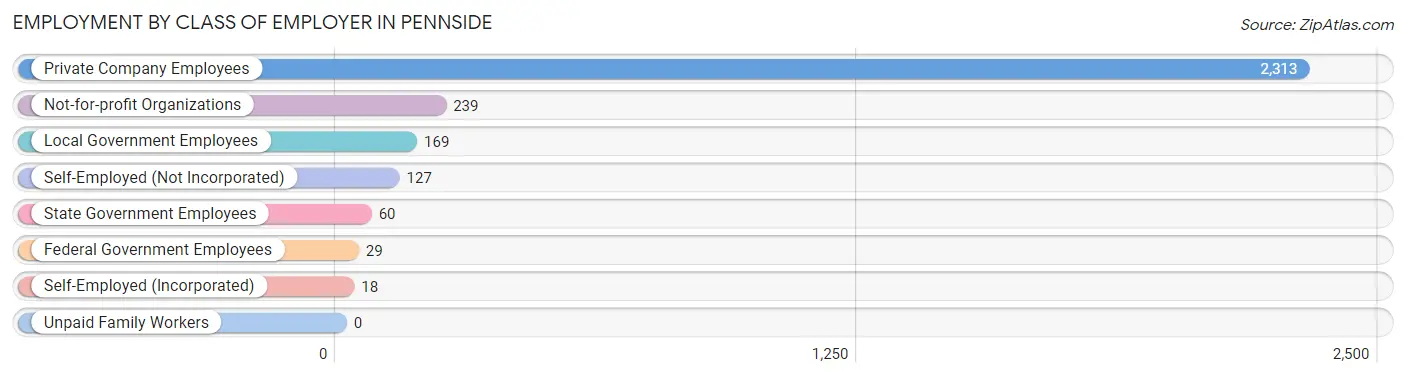
| Employer Class | # Employees | % Employees |
| Private Company Employees | 2,313 | 78.3% |
| Self-Employed (Incorporated) | 18 | 0.6% |
| Self-Employed (Not Incorporated) | 127 | 4.3% |
| Not-for-profit Organizations | 239 | 8.1% |
| Local Government Employees | 169 | 5.7% |
| State Government Employees | 60 | 2.0% |
| Federal Government Employees | 29 | 1.0% |
| Unpaid Family Workers | 0 | 0.0% |
| Total | 2,955 | 100.0% |
Employment Status by Age in Pennside
According to the labor force statistics for Pennside, out of the total population over 16 years of age (4,300), 72.2% or 3,105 individuals are in the labor force, with 4.0% or 124 of them unemployed. The age group with the highest labor force participation rate is 55 to 59 years, with 100.0% or 325 individuals in the labor force. Within the labor force, the 16 to 19 years age range has the highest percentage of unemployed individuals, with 14.1% or 34 of them being unemployed.
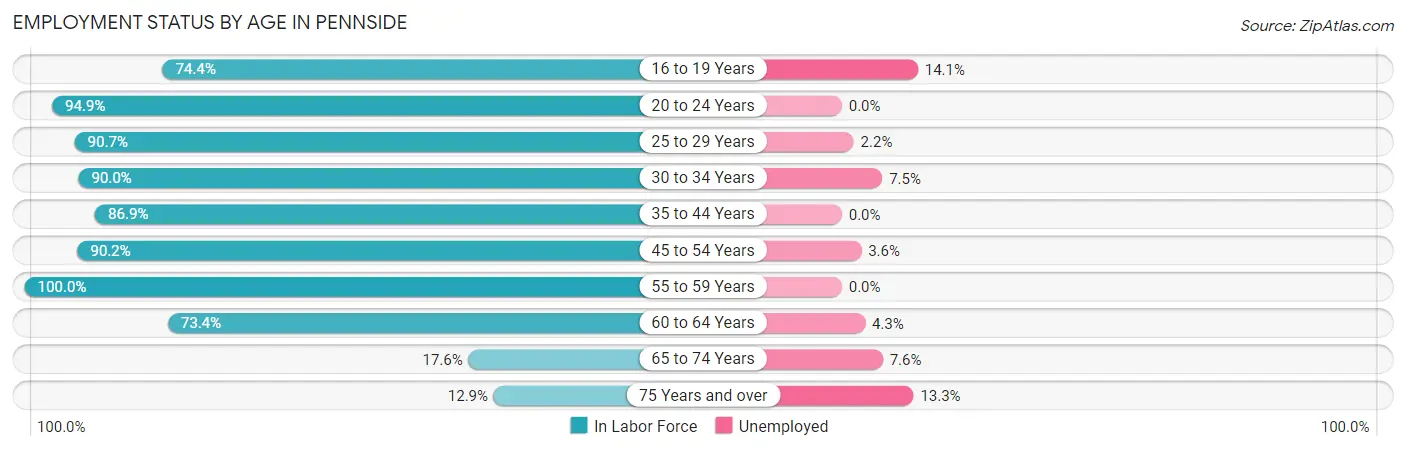
| Age Bracket | In Labor Force | Unemployed |
| 16 to 19 Years | 241 (74.4%) | 34 (14.1%) |
| 20 to 24 Years | 111 (94.9%) | 0 (0.0%) |
| 25 to 29 Years | 499 (90.7%) | 11 (2.2%) |
| 30 to 34 Years | 388 (90.0%) | 29 (7.5%) |
| 35 to 44 Years | 465 (86.9%) | 0 (0.0%) |
| 45 to 54 Years | 526 (90.2%) | 19 (3.6%) |
| 55 to 59 Years | 325 (100.0%) | 0 (0.0%) |
| 60 to 64 Years | 414 (73.4%) | 18 (4.3%) |
| 65 to 74 Years | 92 (17.6%) | 7 (7.6%) |
| 75 Years and over | 45 (12.9%) | 6 (13.3%) |
| Total | 3,105 (72.2%) | 124 (4.0%) |
Employment Status by Educational Attainment in Pennside
According to labor force statistics for Pennside, 87.6% of individuals (2,617) out of the total population between 25 and 64 years of age (2,988) are in the labor force, with 2.9% or 76 of them being unemployed. The group with the highest labor force participation rate are those with the educational attainment of bachelor's degree or higher, with 94.1% or 561 individuals in the labor force. Within the labor force, individuals with less than high school education have the highest percentage of unemployment, with 7.4% or 14 of them being unemployed.
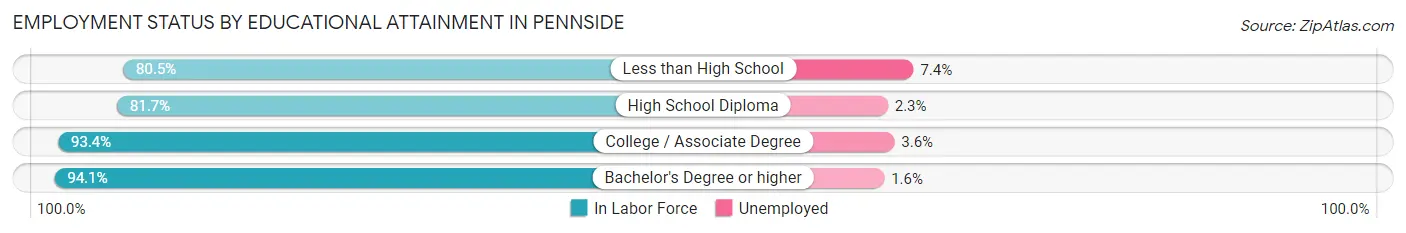
| Educational Attainment | In Labor Force | Unemployed |
| Less than High School | 190 (80.5%) | 17 (7.4%) |
| High School Diploma | 1,034 (81.7%) | 29 (2.3%) |
| College / Associate Degree | 832 (93.4%) | 32 (3.6%) |
| Bachelor's Degree or higher | 561 (94.1%) | 10 (1.6%) |
| Total | 2,617 (87.6%) | 87 (2.9%) |
Employment Occupations by Sex in Pennside
Management, Business, Science and Arts Occupations
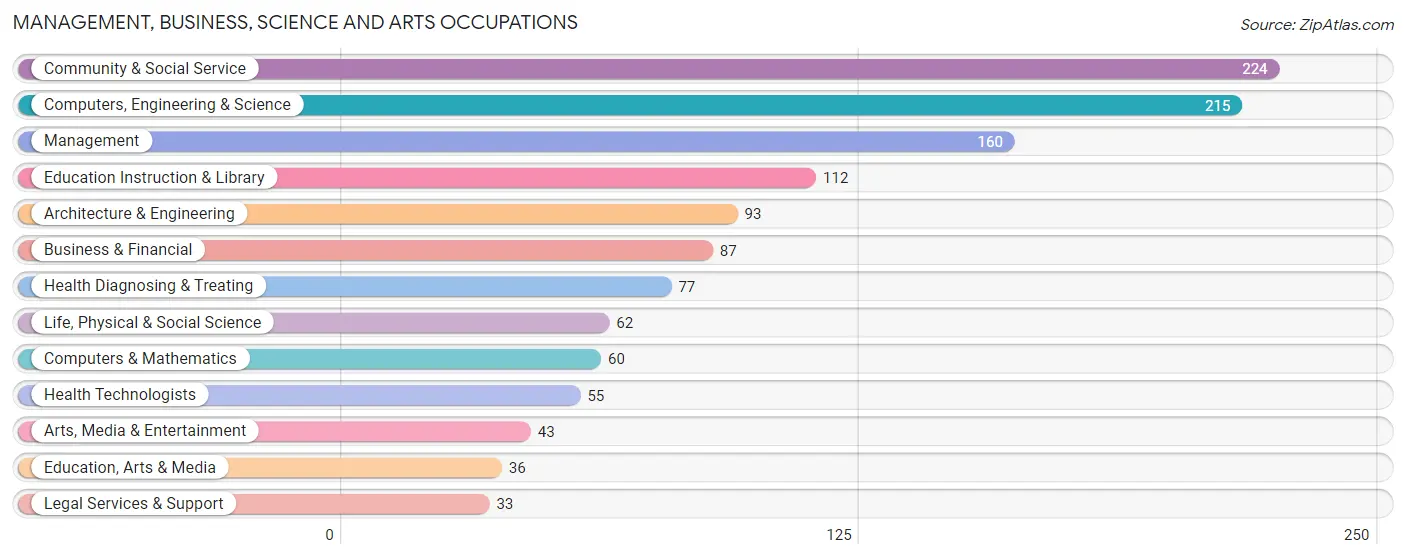
The most common Management, Business, Science and Arts occupations in Pennside are Community & Social Service (224 | 7.5%), Computers, Engineering & Science (215 | 7.2%), Management (160 | 5.4%), Education Instruction & Library (112 | 3.8%), and Architecture & Engineering (93 | 3.1%).
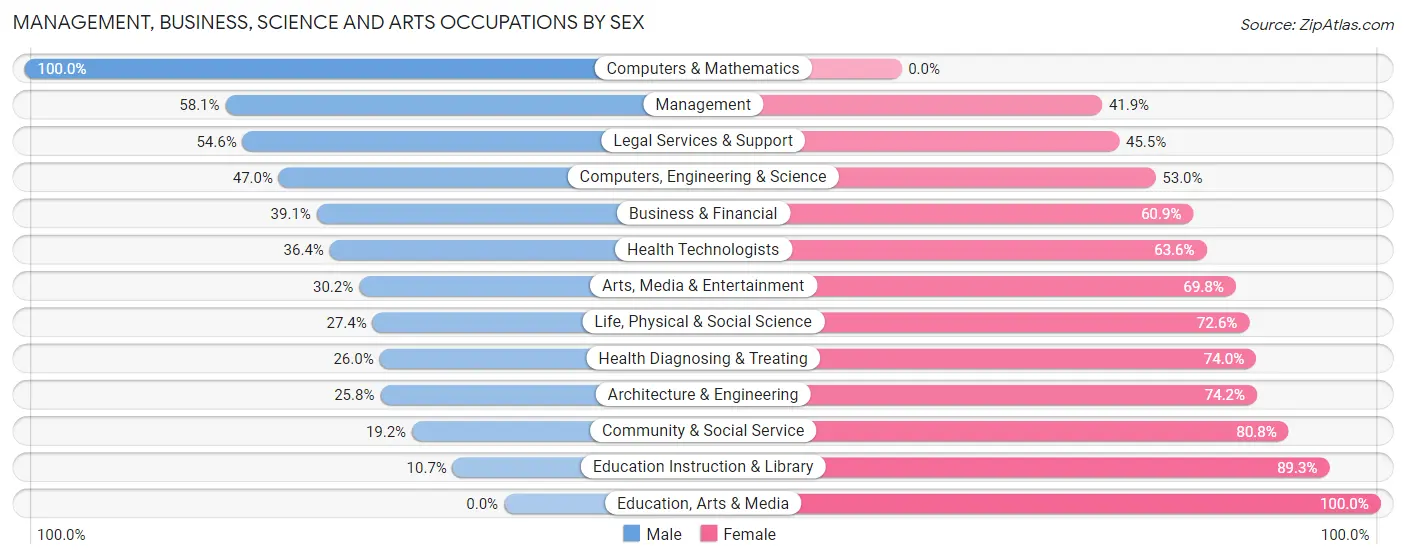
Management, Business, Science and Arts Occupations by Sex
Within the Management, Business, Science and Arts occupations in Pennside, the most male-oriented occupations are Computers & Mathematics (100.0%), Management (58.1%), and Legal Services & Support (54.5%), while the most female-oriented occupations are Education, Arts & Media (100.0%), Education Instruction & Library (89.3%), and Community & Social Service (80.8%).
| Occupation | Male | Female |
| Management | 93 (58.1%) | 67 (41.9%) |
| Business & Financial | 34 (39.1%) | 53 (60.9%) |
| Computers, Engineering & Science | 101 (47.0%) | 114 (53.0%) |
| Computers & Mathematics | 60 (100.0%) | 0 (0.0%) |
| Architecture & Engineering | 24 (25.8%) | 69 (74.2%) |
| Life, Physical & Social Science | 17 (27.4%) | 45 (72.6%) |
| Community & Social Service | 43 (19.2%) | 181 (80.8%) |
| Education, Arts & Media | 0 (0.0%) | 36 (100.0%) |
| Legal Services & Support | 18 (54.5%) | 15 (45.5%) |
| Education Instruction & Library | 12 (10.7%) | 100 (89.3%) |
| Arts, Media & Entertainment | 13 (30.2%) | 30 (69.8%) |
| Health Diagnosing & Treating | 20 (26.0%) | 57 (74.0%) |
| Health Technologists | 20 (36.4%) | 35 (63.6%) |
| Total (Category) | 291 (38.1%) | 472 (61.9%) |
| Total (Overall) | 1,524 (51.1%) | 1,458 (48.9%) |
Services Occupations
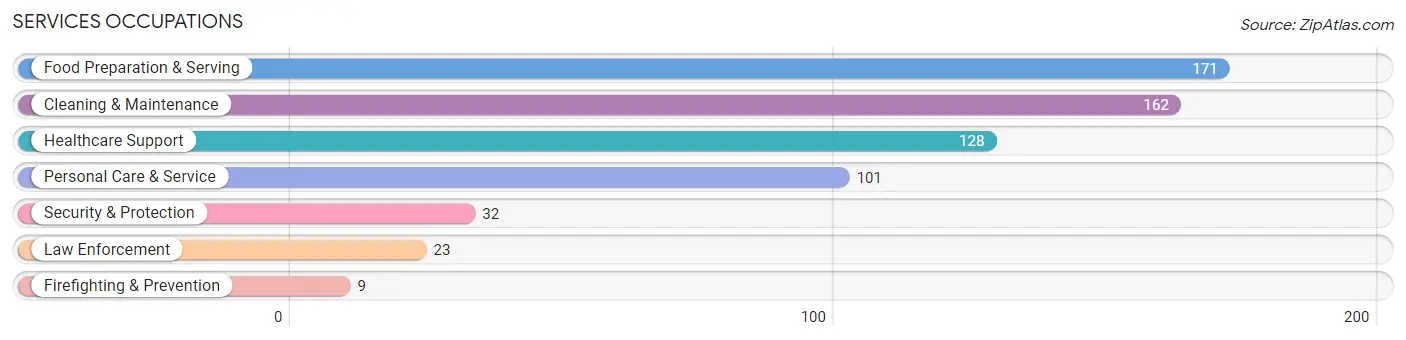
The most common Services occupations in Pennside are Food Preparation & Serving (171 | 5.7%), Cleaning & Maintenance (162 | 5.4%), Healthcare Support (128 | 4.3%), Personal Care & Service (101 | 3.4%), and Security & Protection (32 | 1.1%).
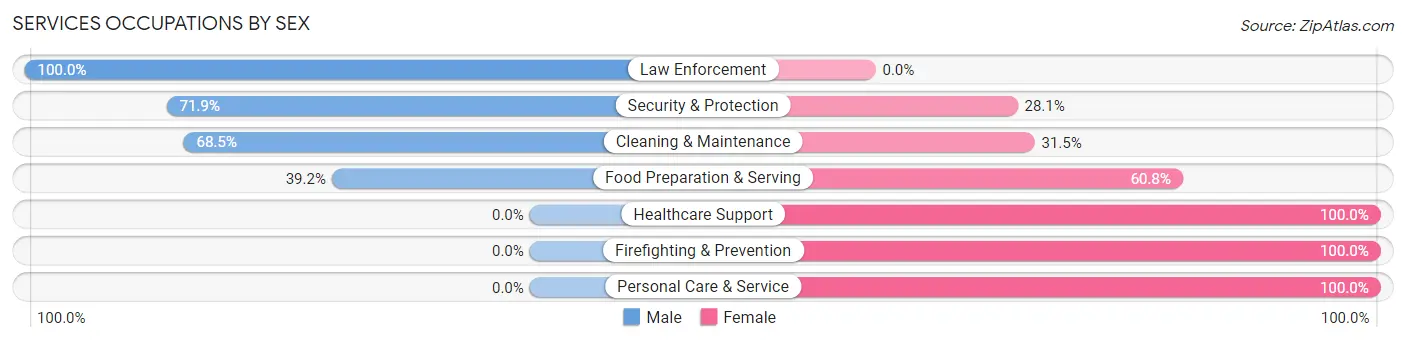
Services Occupations by Sex
Within the Services occupations in Pennside, the most male-oriented occupations are Law Enforcement (100.0%), Security & Protection (71.9%), and Cleaning & Maintenance (68.5%), while the most female-oriented occupations are Healthcare Support (100.0%), Firefighting & Prevention (100.0%), and Personal Care & Service (100.0%).
| Occupation | Male | Female |
| Healthcare Support | 0 (0.0%) | 128 (100.0%) |
| Security & Protection | 23 (71.9%) | 9 (28.1%) |
| Firefighting & Prevention | 0 (0.0%) | 9 (100.0%) |
| Law Enforcement | 23 (100.0%) | 0 (0.0%) |
| Food Preparation & Serving | 67 (39.2%) | 104 (60.8%) |
| Cleaning & Maintenance | 111 (68.5%) | 51 (31.5%) |
| Personal Care & Service | 0 (0.0%) | 101 (100.0%) |
| Total (Category) | 201 (33.8%) | 393 (66.2%) |
| Total (Overall) | 1,524 (51.1%) | 1,458 (48.9%) |
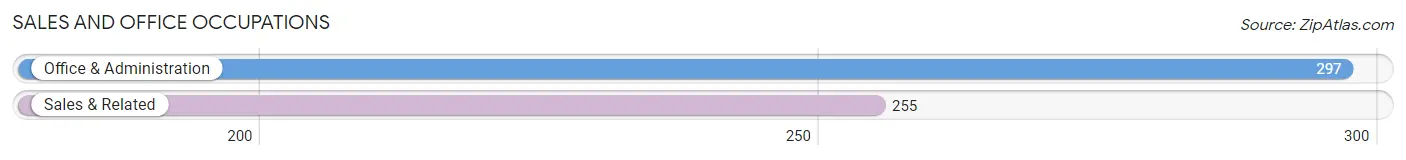
Sales and Office Occupations
The most common Sales and Office occupations in Pennside are Office & Administration (297 | 10.0%), and Sales & Related (255 | 8.6%).
Sales and Office Occupations by Sex
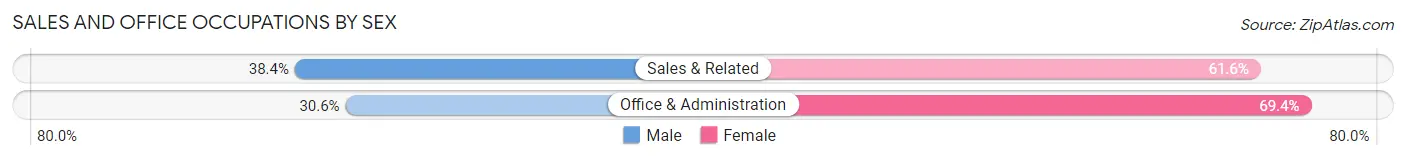
| Occupation | Male | Female |
| Sales & Related | 98 (38.4%) | 157 (61.6%) |
| Office & Administration | 91 (30.6%) | 206 (69.4%) |
| Total (Category) | 189 (34.2%) | 363 (65.8%) |
| Total (Overall) | 1,524 (51.1%) | 1,458 (48.9%) |
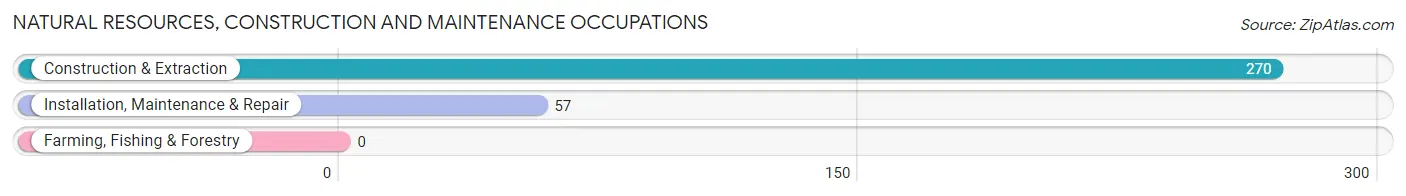
Natural Resources, Construction and Maintenance Occupations
The most common Natural Resources, Construction and Maintenance occupations in Pennside are Construction & Extraction (270 | 9.0%), and Installation, Maintenance & Repair (57 | 1.9%).
Natural Resources, Construction and Maintenance Occupations by Sex
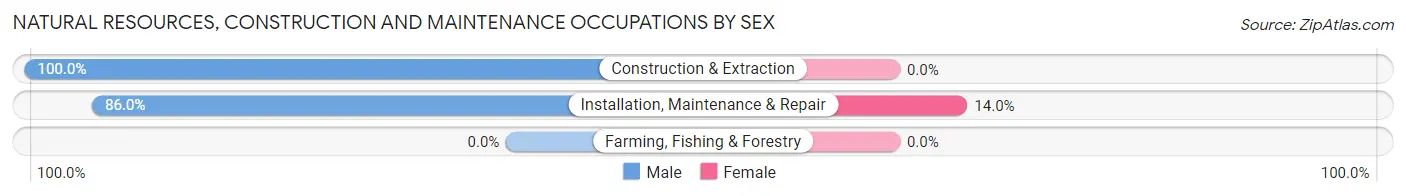
| Occupation | Male | Female |
| Farming, Fishing & Forestry | 0 (0.0%) | 0 (0.0%) |
| Construction & Extraction | 270 (100.0%) | 0 (0.0%) |
| Installation, Maintenance & Repair | 49 (86.0%) | 8 (14.0%) |
| Total (Category) | 319 (97.6%) | 8 (2.5%) |
| Total (Overall) | 1,524 (51.1%) | 1,458 (48.9%) |
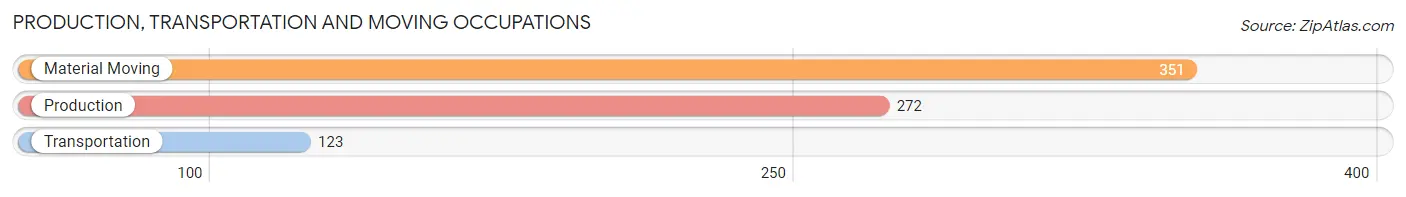
Production, Transportation and Moving Occupations
The most common Production, Transportation and Moving occupations in Pennside are Material Moving (351 | 11.8%), Production (272 | 9.1%), and Transportation (123 | 4.1%).
Production, Transportation and Moving Occupations by Sex
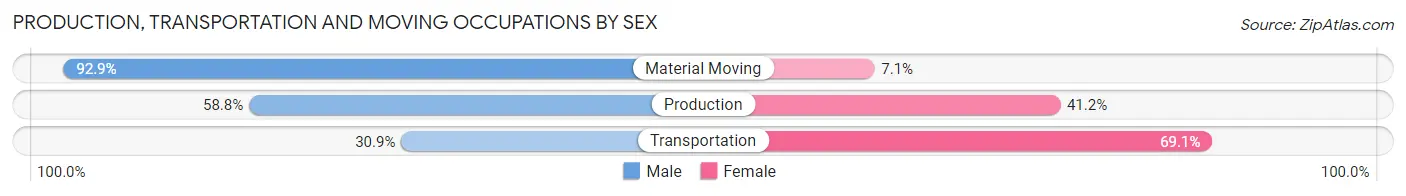
| Occupation | Male | Female |
| Production | 160 (58.8%) | 112 (41.2%) |
| Transportation | 38 (30.9%) | 85 (69.1%) |
| Material Moving | 326 (92.9%) | 25 (7.1%) |
| Total (Category) | 524 (70.2%) | 222 (29.8%) |
| Total (Overall) | 1,524 (51.1%) | 1,458 (48.9%) |
Employment Industries by Sex in Pennside
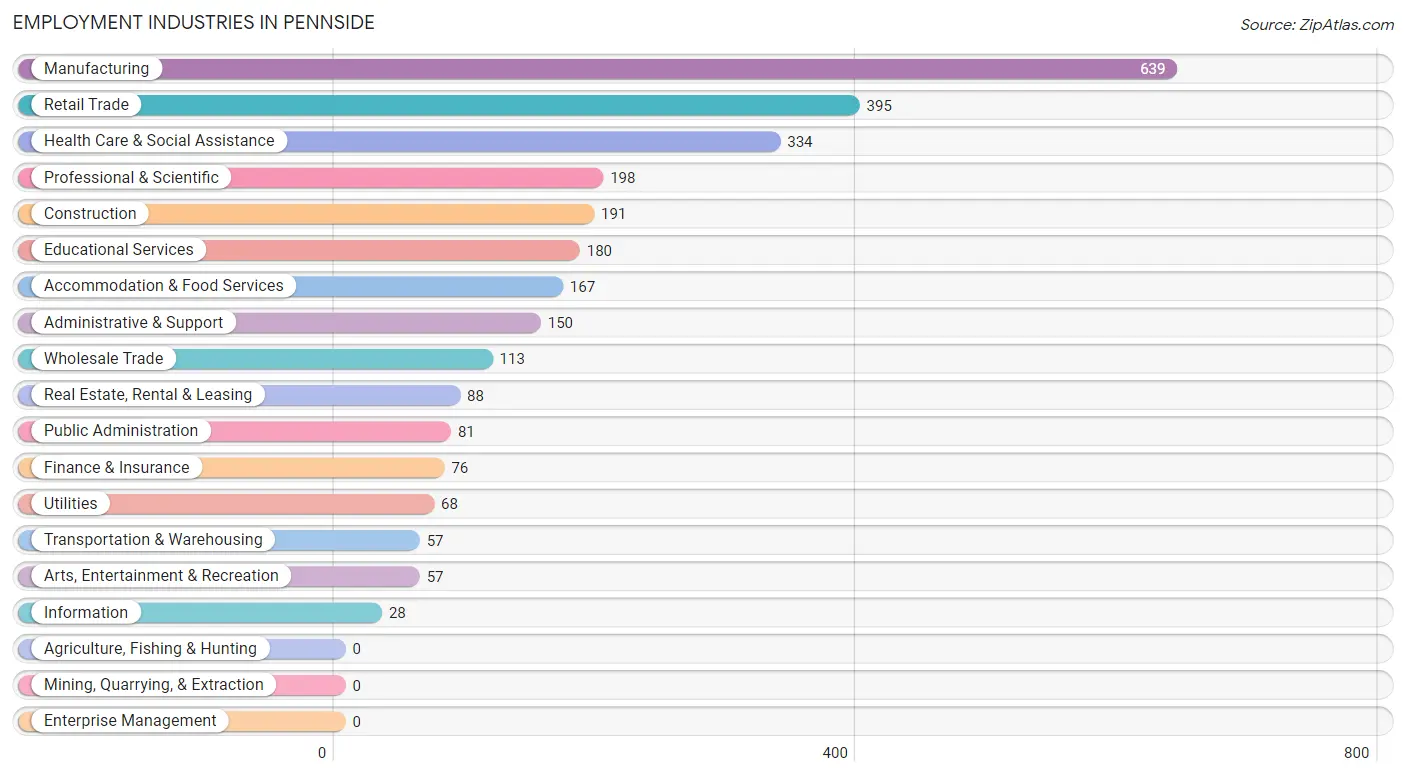
Employment Industries in Pennside
The major employment industries in Pennside include Manufacturing (639 | 21.4%), Retail Trade (395 | 13.3%), Health Care & Social Assistance (334 | 11.2%), Professional & Scientific (198 | 6.6%), and Construction (191 | 6.4%).
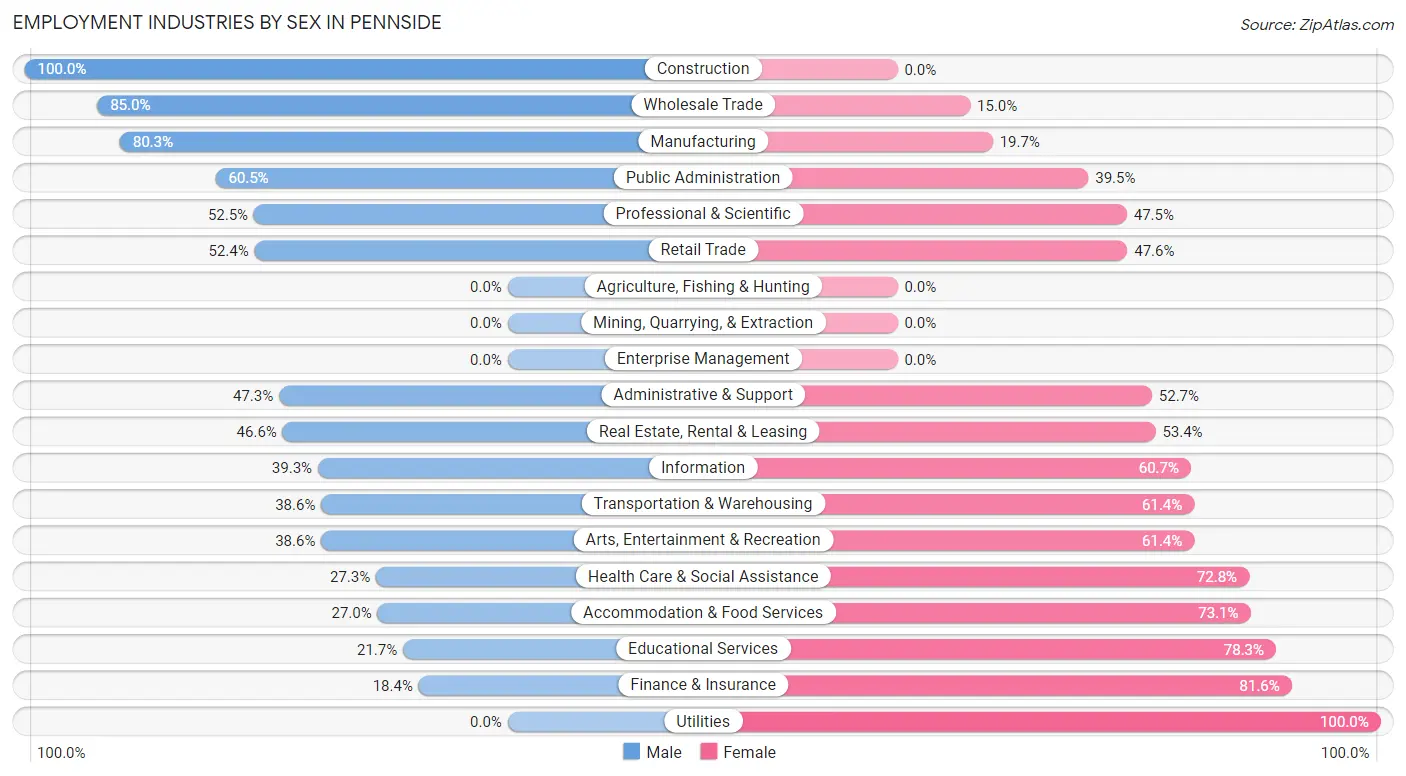
Employment Industries by Sex in Pennside
The Pennside industries that see more men than women are Construction (100.0%), Wholesale Trade (85.0%), and Manufacturing (80.3%), whereas the industries that tend to have a higher number of women are Utilities (100.0%), Finance & Insurance (81.6%), and Educational Services (78.3%).
| Industry | Male | Female |
| Agriculture, Fishing & Hunting | 0 (0.0%) | 0 (0.0%) |
| Mining, Quarrying, & Extraction | 0 (0.0%) | 0 (0.0%) |
| Construction | 191 (100.0%) | 0 (0.0%) |
| Manufacturing | 513 (80.3%) | 126 (19.7%) |
| Wholesale Trade | 96 (85.0%) | 17 (15.0%) |
| Retail Trade | 207 (52.4%) | 188 (47.6%) |
| Transportation & Warehousing | 22 (38.6%) | 35 (61.4%) |
| Utilities | 0 (0.0%) | 68 (100.0%) |
| Information | 11 (39.3%) | 17 (60.7%) |
| Finance & Insurance | 14 (18.4%) | 62 (81.6%) |
| Real Estate, Rental & Leasing | 41 (46.6%) | 47 (53.4%) |
| Professional & Scientific | 104 (52.5%) | 94 (47.5%) |
| Enterprise Management | 0 (0.0%) | 0 (0.0%) |
| Administrative & Support | 71 (47.3%) | 79 (52.7%) |
| Educational Services | 39 (21.7%) | 141 (78.3%) |
| Health Care & Social Assistance | 91 (27.3%) | 243 (72.8%) |
| Arts, Entertainment & Recreation | 22 (38.6%) | 35 (61.4%) |
| Accommodation & Food Services | 45 (27.0%) | 122 (73.1%) |
| Public Administration | 49 (60.5%) | 32 (39.5%) |
| Total | 1,524 (51.1%) | 1,458 (48.9%) |
Education in Pennside
School Enrollment in Pennside
The most common levels of schooling among the 1,257 students in Pennside are high school (379 | 30.1%), middle school (293 | 23.3%), and college / undergraduate (220 | 17.5%).
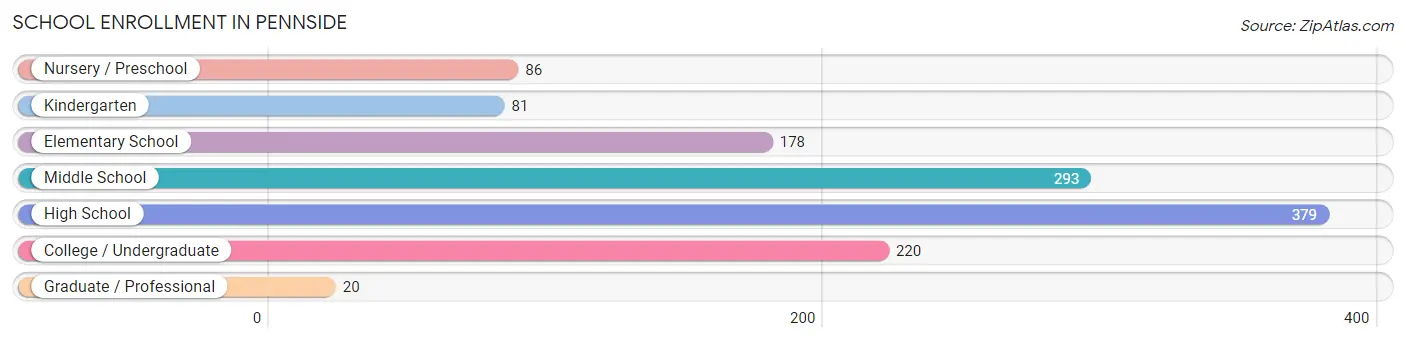
| School Level | # Students | % Students |
| Nursery / Preschool | 86 | 6.8% |
| Kindergarten | 81 | 6.4% |
| Elementary School | 178 | 14.2% |
| Middle School | 293 | 23.3% |
| High School | 379 | 30.1% |
| College / Undergraduate | 220 | 17.5% |
| Graduate / Professional | 20 | 1.6% |
| Total | 1,257 | 100.0% |
School Enrollment by Age by Funding Source in Pennside
Out of a total of 1,257 students who are enrolled in schools in Pennside, 151 (12.0%) attend a private institution, while the remaining 1,106 (88.0%) are enrolled in public schools. The age group of 3 to 4 year olds has the highest likelihood of being enrolled in private schools, with 54 (65.1% in the age bracket) enrolled. Conversely, the age group of 15 to 17 year olds has the lowest likelihood of being enrolled in a private school, with 312 (97.5% in the age bracket) attending a public institution.
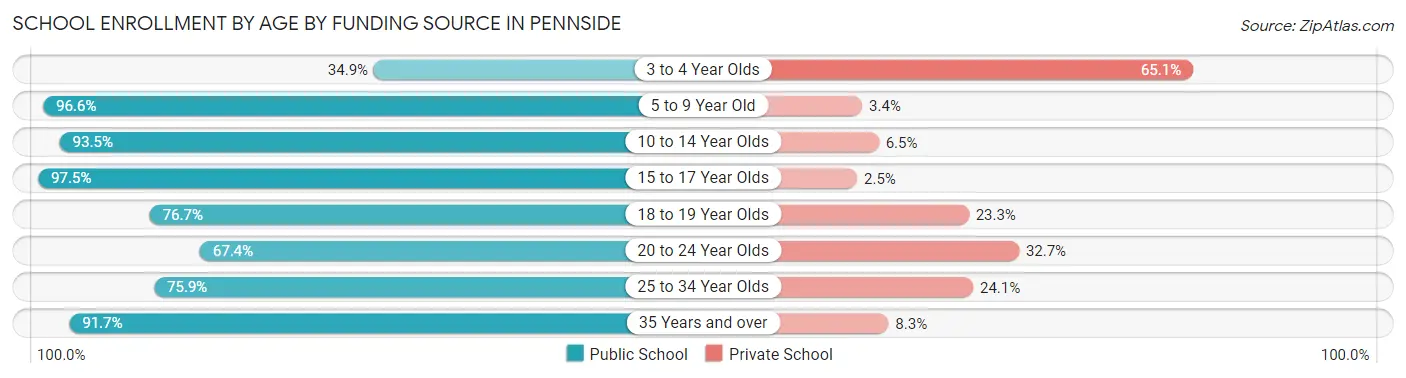
| Age Bracket | Public School | Private School |
| 3 to 4 Year Olds | 29 (34.9%) | 54 (65.1%) |
| 5 to 9 Year Old | 253 (96.6%) | 9 (3.4%) |
| 10 to 14 Year Olds | 272 (93.5%) | 19 (6.5%) |
| 15 to 17 Year Olds | 312 (97.5%) | 8 (2.5%) |
| 18 to 19 Year Olds | 56 (76.7%) | 17 (23.3%) |
| 20 to 24 Year Olds | 33 (67.3%) | 16 (32.7%) |
| 25 to 34 Year Olds | 63 (75.9%) | 20 (24.1%) |
| 35 Years and over | 88 (91.7%) | 8 (8.3%) |
| Total | 1,106 (88.0%) | 151 (12.0%) |
Educational Attainment by Field of Study in Pennside
Business (178 | 20.1%), social sciences (123 | 13.9%), arts & humanities (104 | 11.7%), education (90 | 10.1%), and bio, nature & agricultural (82 | 9.2%) are the most common fields of study among 888 individuals in Pennside who have obtained a bachelor's degree or higher.
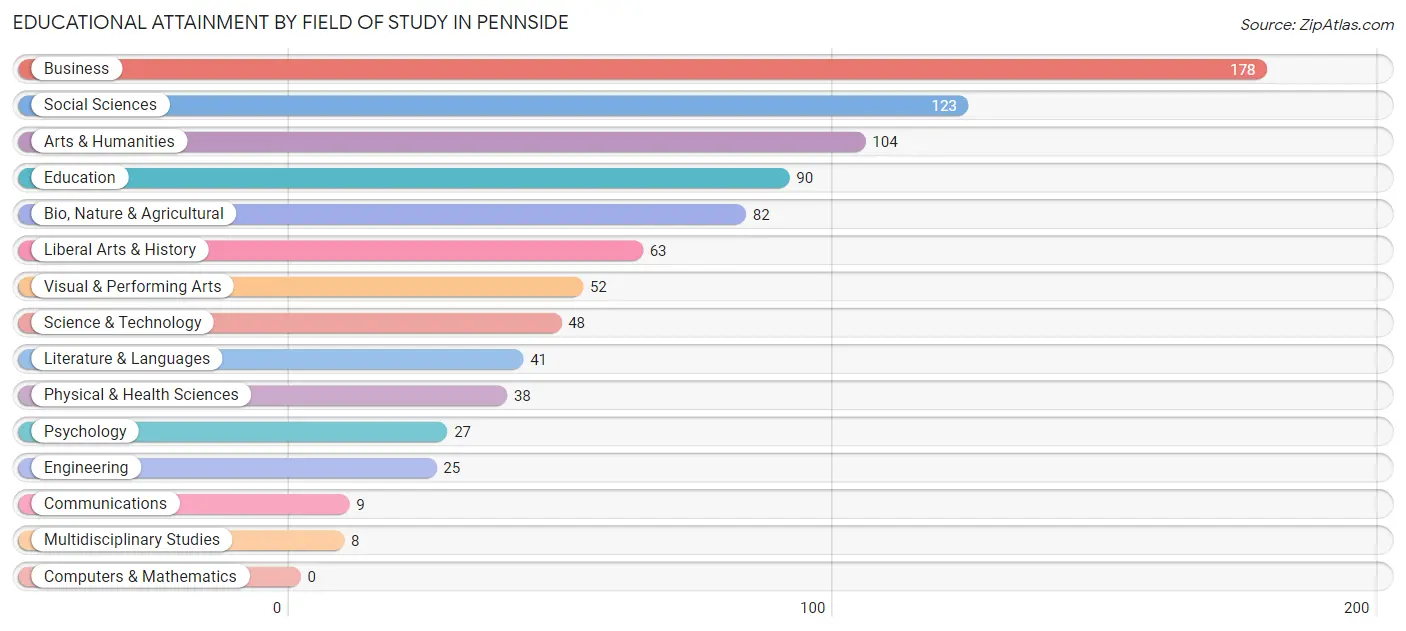
| Field of Study | # Graduates | % Graduates |
| Computers & Mathematics | 0 | 0.0% |
| Bio, Nature & Agricultural | 82 | 9.2% |
| Physical & Health Sciences | 38 | 4.3% |
| Psychology | 27 | 3.0% |
| Social Sciences | 123 | 13.9% |
| Engineering | 25 | 2.8% |
| Multidisciplinary Studies | 8 | 0.9% |
| Science & Technology | 48 | 5.4% |
| Business | 178 | 20.1% |
| Education | 90 | 10.1% |
| Literature & Languages | 41 | 4.6% |
| Liberal Arts & History | 63 | 7.1% |
| Visual & Performing Arts | 52 | 5.9% |
| Communications | 9 | 1.0% |
| Arts & Humanities | 104 | 11.7% |
| Total | 888 | 100.0% |
Transportation & Commute in Pennside
Vehicle Availability by Sex in Pennside
The most prevalent vehicle ownership categories in Pennside are males with 2 vehicles (488, accounting for 32.0%) and females with 2 vehicles (428, making up 34.1%).
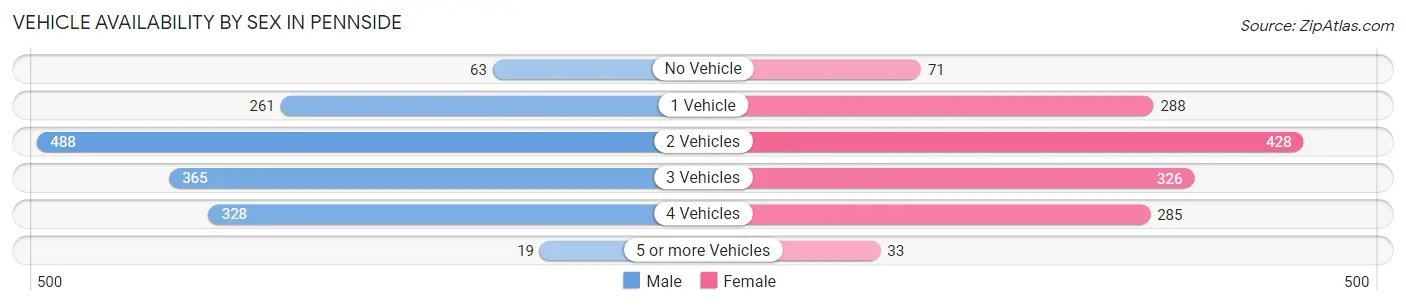
| Vehicles Available | Male | Female |
| No Vehicle | 63 (4.1%) | 71 (5.0%) |
| 1 Vehicle | 261 (17.1%) | 288 (20.1%) |
| 2 Vehicles | 488 (32.0%) | 428 (29.9%) |
| 3 Vehicles | 365 (23.9%) | 326 (22.8%) |
| 4 Vehicles | 328 (21.5%) | 285 (19.9%) |
| 5 or more Vehicles | 19 (1.3%) | 33 (2.3%) |
| Total | 1,524 (100.0%) | 1,431 (100.0%) |
Commute Time in Pennside
The most frequently occuring commute durations in Pennside are 30 to 34 minutes (440 commuters, 15.6%), 20 to 24 minutes (420 commuters, 14.9%), and 10 to 14 minutes (386 commuters, 13.7%).
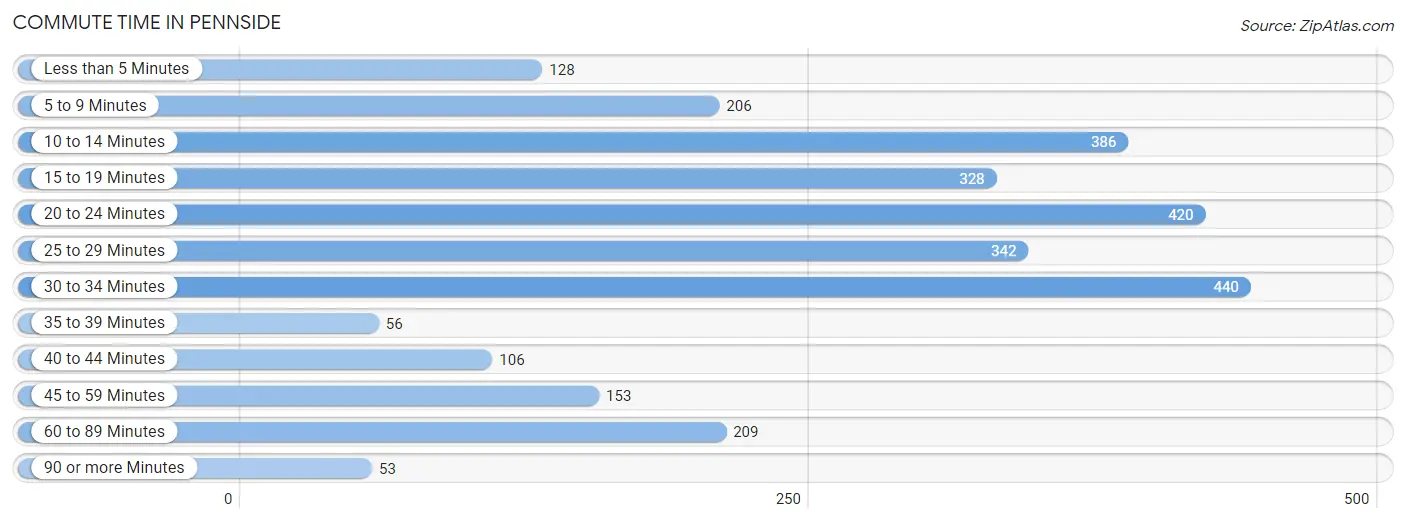
| Commute Time | # Commuters | % Commuters |
| Less than 5 Minutes | 128 | 4.5% |
| 5 to 9 Minutes | 206 | 7.3% |
| 10 to 14 Minutes | 386 | 13.7% |
| 15 to 19 Minutes | 328 | 11.6% |
| 20 to 24 Minutes | 420 | 14.9% |
| 25 to 29 Minutes | 342 | 12.1% |
| 30 to 34 Minutes | 440 | 15.6% |
| 35 to 39 Minutes | 56 | 2.0% |
| 40 to 44 Minutes | 106 | 3.7% |
| 45 to 59 Minutes | 153 | 5.4% |
| 60 to 89 Minutes | 209 | 7.4% |
| 90 or more Minutes | 53 | 1.9% |
Commute Time by Sex in Pennside
The most common commute times in Pennside are 30 to 34 minutes (244 commuters, 16.4%) for males and 20 to 24 minutes (216 commuters, 16.1%) for females.
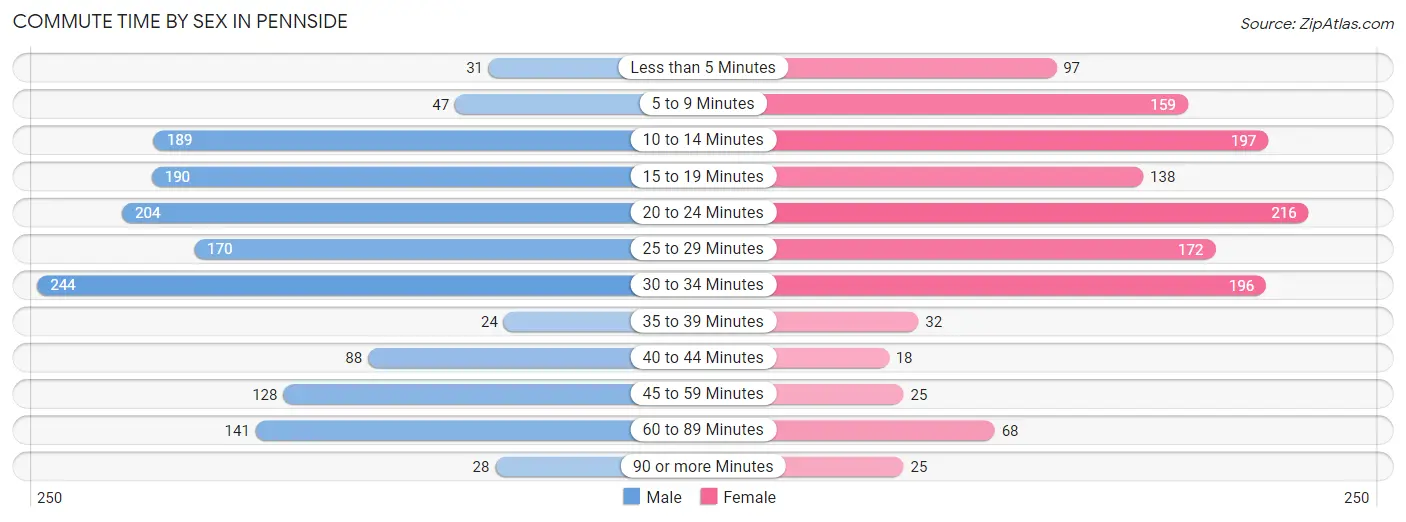
| Commute Time | Male | Female |
| Less than 5 Minutes | 31 (2.1%) | 97 (7.2%) |
| 5 to 9 Minutes | 47 (3.2%) | 159 (11.8%) |
| 10 to 14 Minutes | 189 (12.7%) | 197 (14.7%) |
| 15 to 19 Minutes | 190 (12.8%) | 138 (10.3%) |
| 20 to 24 Minutes | 204 (13.8%) | 216 (16.1%) |
| 25 to 29 Minutes | 170 (11.5%) | 172 (12.8%) |
| 30 to 34 Minutes | 244 (16.4%) | 196 (14.6%) |
| 35 to 39 Minutes | 24 (1.6%) | 32 (2.4%) |
| 40 to 44 Minutes | 88 (5.9%) | 18 (1.3%) |
| 45 to 59 Minutes | 128 (8.6%) | 25 (1.9%) |
| 60 to 89 Minutes | 141 (9.5%) | 68 (5.1%) |
| 90 or more Minutes | 28 (1.9%) | 25 (1.9%) |
Time of Departure to Work by Sex in Pennside
The most frequent times of departure to work in Pennside are 12:00 PM to 3:59 PM (336, 22.6%) for males and 7:30 AM to 7:59 AM (273, 20.3%) for females.
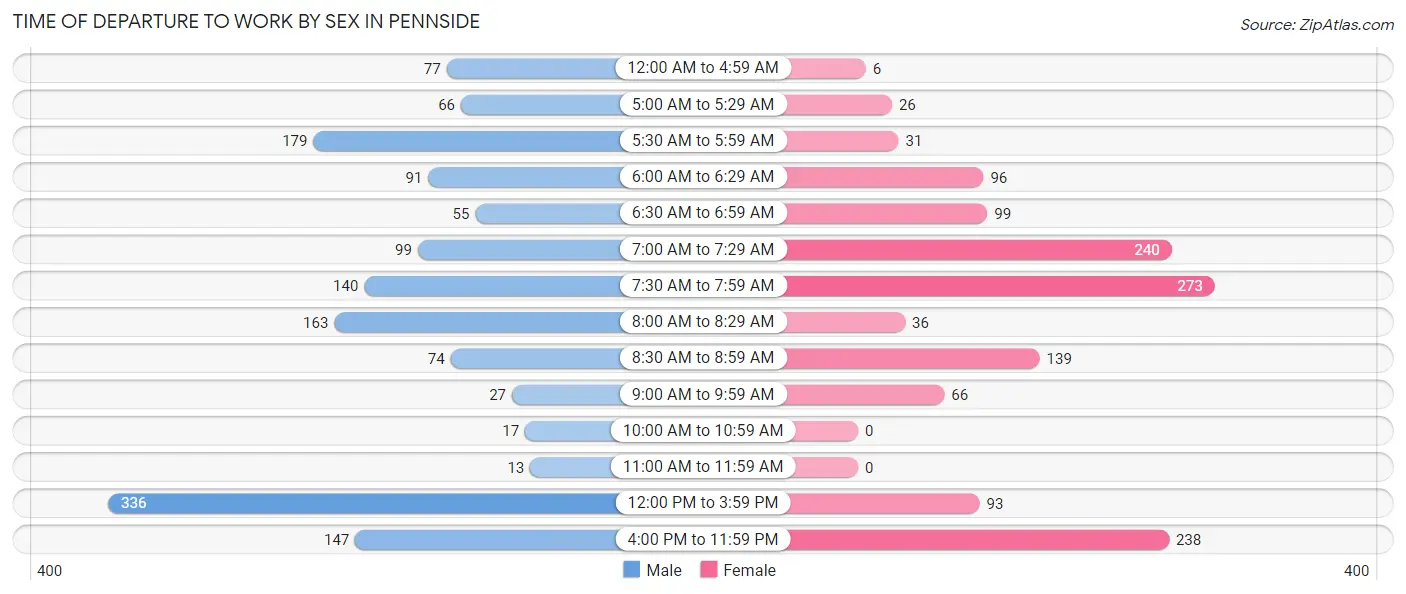
| Time of Departure | Male | Female |
| 12:00 AM to 4:59 AM | 77 (5.2%) | 6 (0.4%) |
| 5:00 AM to 5:29 AM | 66 (4.4%) | 26 (1.9%) |
| 5:30 AM to 5:59 AM | 179 (12.1%) | 31 (2.3%) |
| 6:00 AM to 6:29 AM | 91 (6.1%) | 96 (7.1%) |
| 6:30 AM to 6:59 AM | 55 (3.7%) | 99 (7.4%) |
| 7:00 AM to 7:29 AM | 99 (6.7%) | 240 (17.9%) |
| 7:30 AM to 7:59 AM | 140 (9.4%) | 273 (20.3%) |
| 8:00 AM to 8:29 AM | 163 (11.0%) | 36 (2.7%) |
| 8:30 AM to 8:59 AM | 74 (5.0%) | 139 (10.3%) |
| 9:00 AM to 9:59 AM | 27 (1.8%) | 66 (4.9%) |
| 10:00 AM to 10:59 AM | 17 (1.1%) | 0 (0.0%) |
| 11:00 AM to 11:59 AM | 13 (0.9%) | 0 (0.0%) |
| 12:00 PM to 3:59 PM | 336 (22.6%) | 93 (6.9%) |
| 4:00 PM to 11:59 PM | 147 (9.9%) | 238 (17.7%) |
| Total | 1,484 (100.0%) | 1,343 (100.0%) |
Housing Occupancy in Pennside
Occupancy by Ownership in Pennside
Of the total 2,054 dwellings in Pennside, owner-occupied units account for 1,623 (79.0%), while renter-occupied units make up 431 (21.0%).
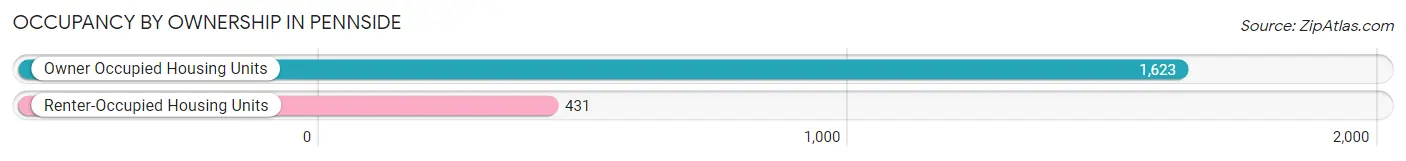
| Occupancy | # Housing Units | % Housing Units |
| Owner Occupied Housing Units | 1,623 | 79.0% |
| Renter-Occupied Housing Units | 431 | 21.0% |
| Total Occupied Housing Units | 2,054 | 100.0% |
Occupancy by Household Size in Pennside
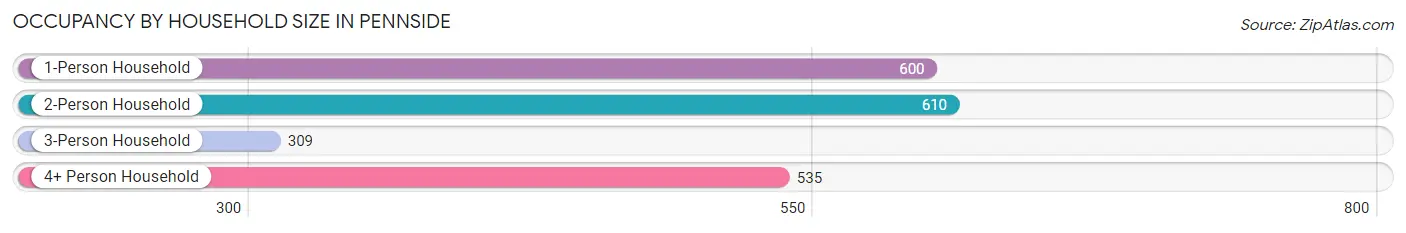
| Household Size | # Housing Units | % Housing Units |
| 1-Person Household | 600 | 29.2% |
| 2-Person Household | 610 | 29.7% |
| 3-Person Household | 309 | 15.0% |
| 4+ Person Household | 535 | 26.1% |
| Total Housing Units | 2,054 | 100.0% |
Occupancy by Ownership by Household Size in Pennside
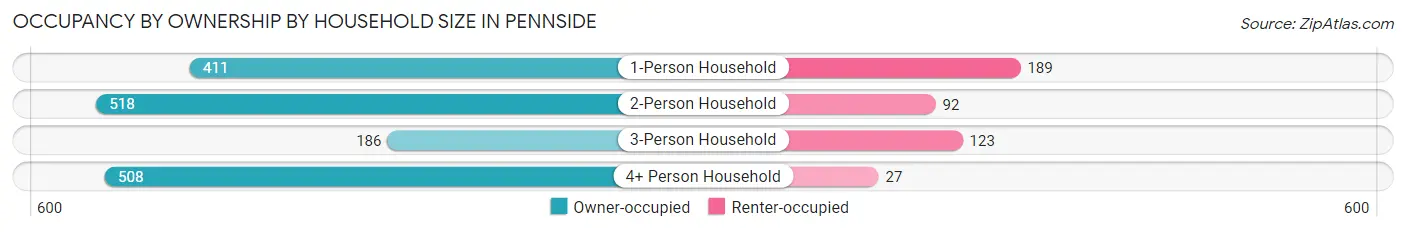
| Household Size | Owner-occupied | Renter-occupied |
| 1-Person Household | 411 (68.5%) | 189 (31.5%) |
| 2-Person Household | 518 (84.9%) | 92 (15.1%) |
| 3-Person Household | 186 (60.2%) | 123 (39.8%) |
| 4+ Person Household | 508 (95.0%) | 27 (5.1%) |
| Total Housing Units | 1,623 (79.0%) | 431 (21.0%) |
Occupancy by Educational Attainment in Pennside
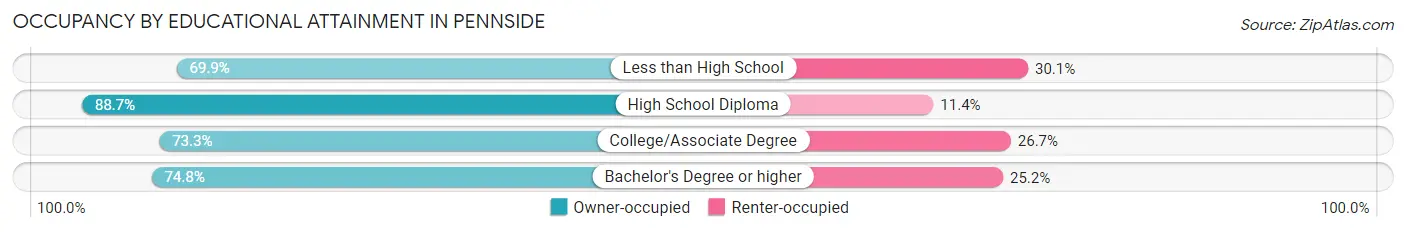
| Household Size | Owner-occupied | Renter-occupied |
| Less than High School | 123 (69.9%) | 53 (30.1%) |
| High School Diploma | 672 (88.6%) | 86 (11.4%) |
| College/Associate Degree | 486 (73.3%) | 177 (26.7%) |
| Bachelor's Degree or higher | 342 (74.8%) | 115 (25.2%) |
Occupancy by Age of Householder in Pennside
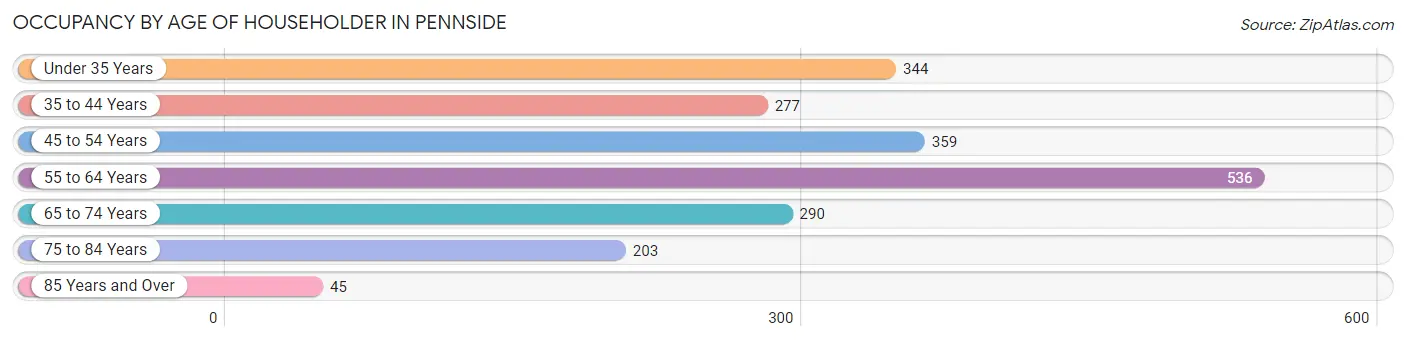
| Age Bracket | # Households | % Households |
| Under 35 Years | 344 | 16.8% |
| 35 to 44 Years | 277 | 13.5% |
| 45 to 54 Years | 359 | 17.5% |
| 55 to 64 Years | 536 | 26.1% |
| 65 to 74 Years | 290 | 14.1% |
| 75 to 84 Years | 203 | 9.9% |
| 85 Years and Over | 45 | 2.2% |
| Total | 2,054 | 100.0% |
Housing Finances in Pennside
Median Income by Occupancy in Pennside
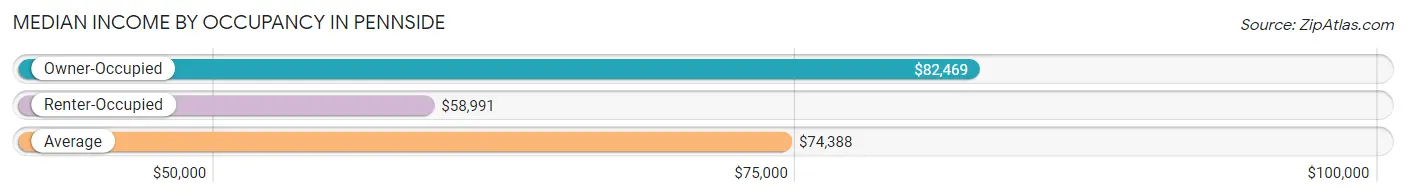
| Occupancy Type | # Households | Median Income |
| Owner-Occupied | 1,623 (79.0%) | $82,469 |
| Renter-Occupied | 431 (21.0%) | $58,991 |
| Average | 2,054 (100.0%) | $74,388 |
Occupancy by Householder Income Bracket in Pennside
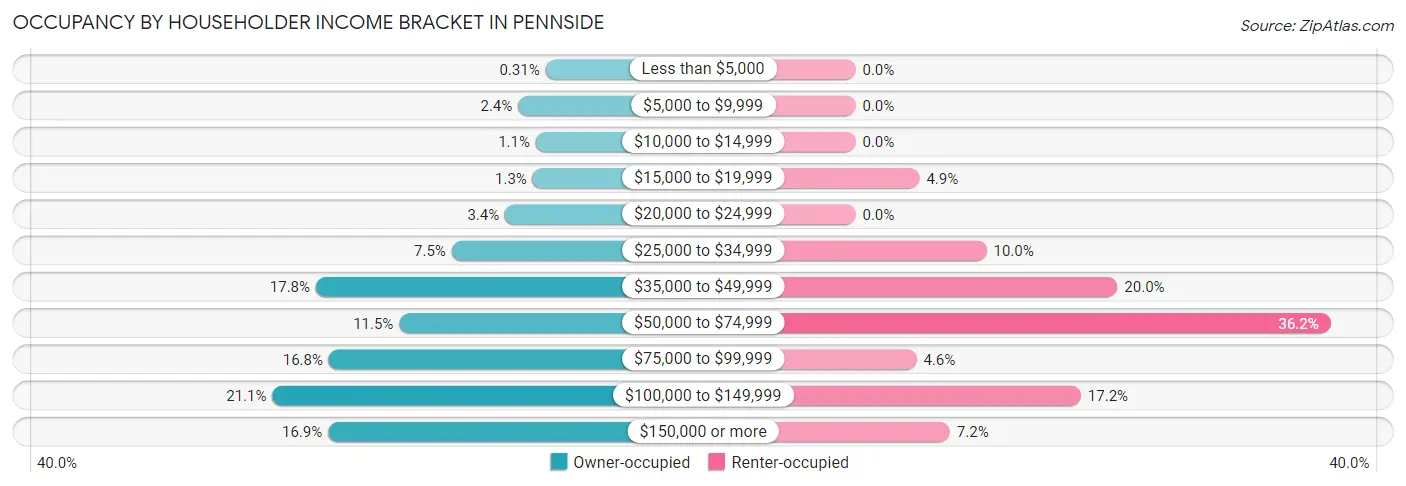
| Income Bracket | Owner-occupied | Renter-occupied |
| Less than $5,000 | 5 (0.3%) | 0 (0.0%) |
| $5,000 to $9,999 | 39 (2.4%) | 0 (0.0%) |
| $10,000 to $14,999 | 17 (1.1%) | 0 (0.0%) |
| $15,000 to $19,999 | 21 (1.3%) | 21 (4.9%) |
| $20,000 to $24,999 | 55 (3.4%) | 0 (0.0%) |
| $25,000 to $34,999 | 121 (7.5%) | 43 (10.0%) |
| $35,000 to $49,999 | 289 (17.8%) | 86 (20.0%) |
| $50,000 to $74,999 | 186 (11.5%) | 156 (36.2%) |
| $75,000 to $99,999 | 273 (16.8%) | 20 (4.6%) |
| $100,000 to $149,999 | 343 (21.1%) | 74 (17.2%) |
| $150,000 or more | 274 (16.9%) | 31 (7.2%) |
| Total | 1,623 (100.0%) | 431 (100.0%) |
Monthly Housing Cost Tiers in Pennside
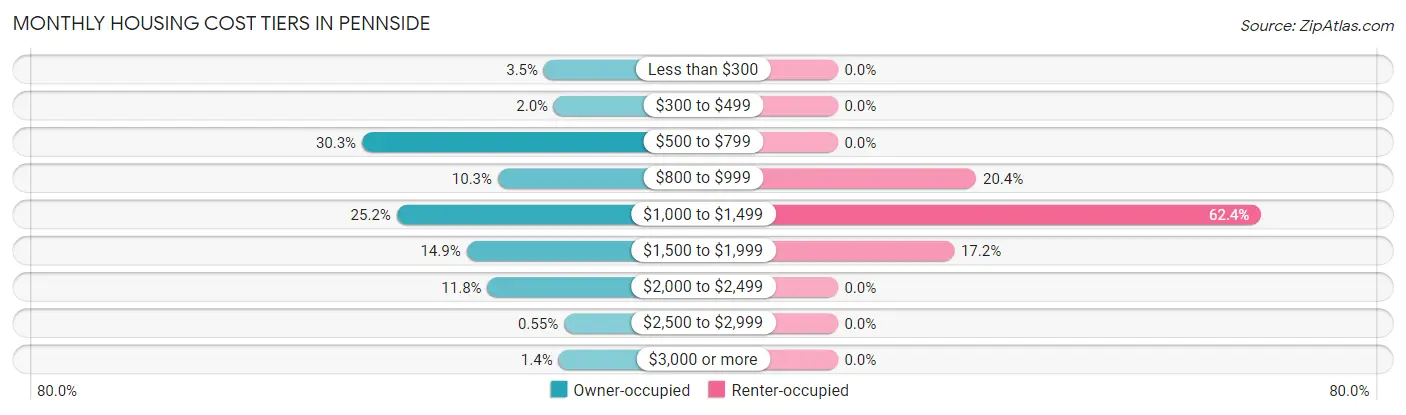
| Monthly Cost | Owner-occupied | Renter-occupied |
| Less than $300 | 57 (3.5%) | 0 (0.0%) |
| $300 to $499 | 33 (2.0%) | 0 (0.0%) |
| $500 to $799 | 492 (30.3%) | 0 (0.0%) |
| $800 to $999 | 167 (10.3%) | 88 (20.4%) |
| $1,000 to $1,499 | 409 (25.2%) | 269 (62.4%) |
| $1,500 to $1,999 | 242 (14.9%) | 74 (17.2%) |
| $2,000 to $2,499 | 192 (11.8%) | 0 (0.0%) |
| $2,500 to $2,999 | 9 (0.5%) | 0 (0.0%) |
| $3,000 or more | 22 (1.4%) | 0 (0.0%) |
| Total | 1,623 (100.0%) | 431 (100.0%) |
Physical Housing Characteristics in Pennside
Housing Structures in Pennside
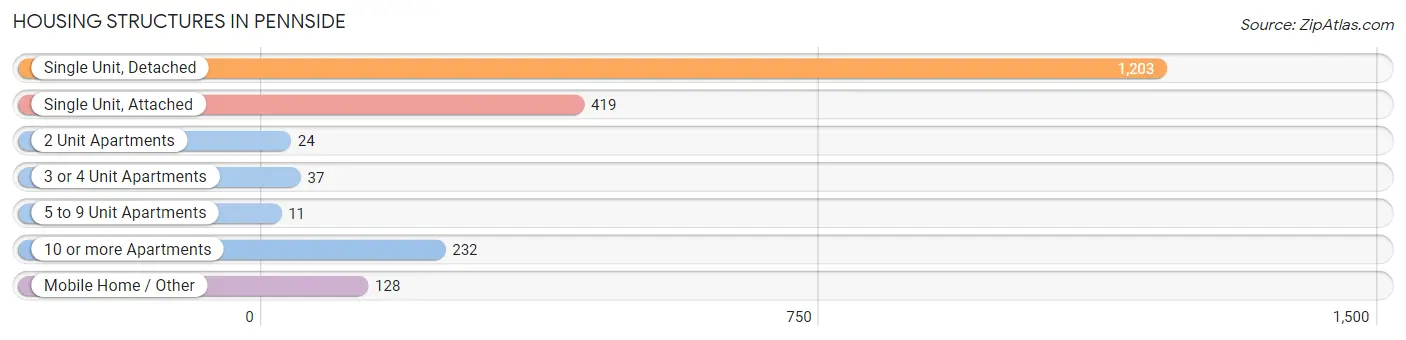
| Structure Type | # Housing Units | % Housing Units |
| Single Unit, Detached | 1,203 | 58.6% |
| Single Unit, Attached | 419 | 20.4% |
| 2 Unit Apartments | 24 | 1.2% |
| 3 or 4 Unit Apartments | 37 | 1.8% |
| 5 to 9 Unit Apartments | 11 | 0.5% |
| 10 or more Apartments | 232 | 11.3% |
| Mobile Home / Other | 128 | 6.2% |
| Total | 2,054 | 100.0% |
Housing Structures by Occupancy in Pennside
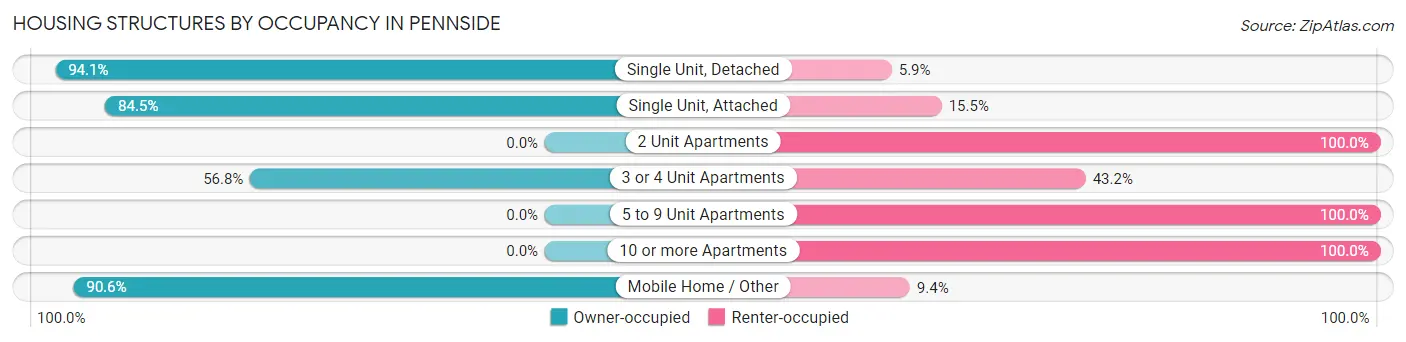
| Structure Type | Owner-occupied | Renter-occupied |
| Single Unit, Detached | 1,132 (94.1%) | 71 (5.9%) |
| Single Unit, Attached | 354 (84.5%) | 65 (15.5%) |
| 2 Unit Apartments | 0 (0.0%) | 24 (100.0%) |
| 3 or 4 Unit Apartments | 21 (56.8%) | 16 (43.2%) |
| 5 to 9 Unit Apartments | 0 (0.0%) | 11 (100.0%) |
| 10 or more Apartments | 0 (0.0%) | 232 (100.0%) |
| Mobile Home / Other | 116 (90.6%) | 12 (9.4%) |
| Total | 1,623 (79.0%) | 431 (21.0%) |
Housing Structures by Number of Rooms in Pennside
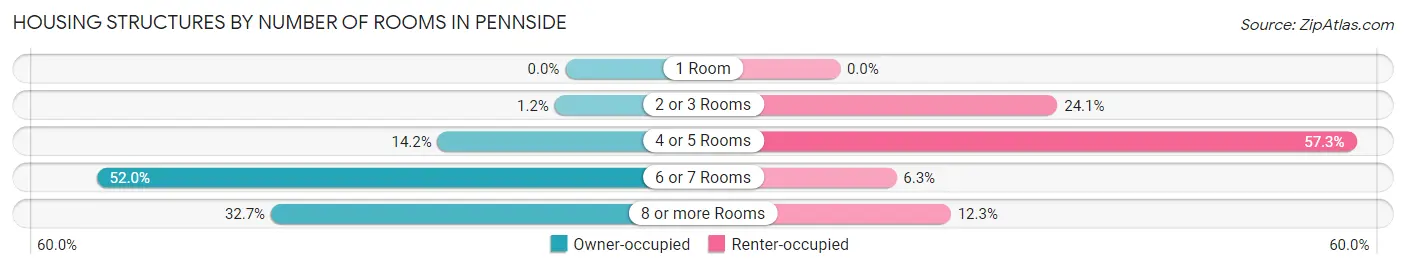
| Number of Rooms | Owner-occupied | Renter-occupied |
| 1 Room | 0 (0.0%) | 0 (0.0%) |
| 2 or 3 Rooms | 19 (1.2%) | 104 (24.1%) |
| 4 or 5 Rooms | 230 (14.2%) | 247 (57.3%) |
| 6 or 7 Rooms | 844 (52.0%) | 27 (6.3%) |
| 8 or more Rooms | 530 (32.7%) | 53 (12.3%) |
| Total | 1,623 (100.0%) | 431 (100.0%) |
Housing Structure by Heating Type in Pennside
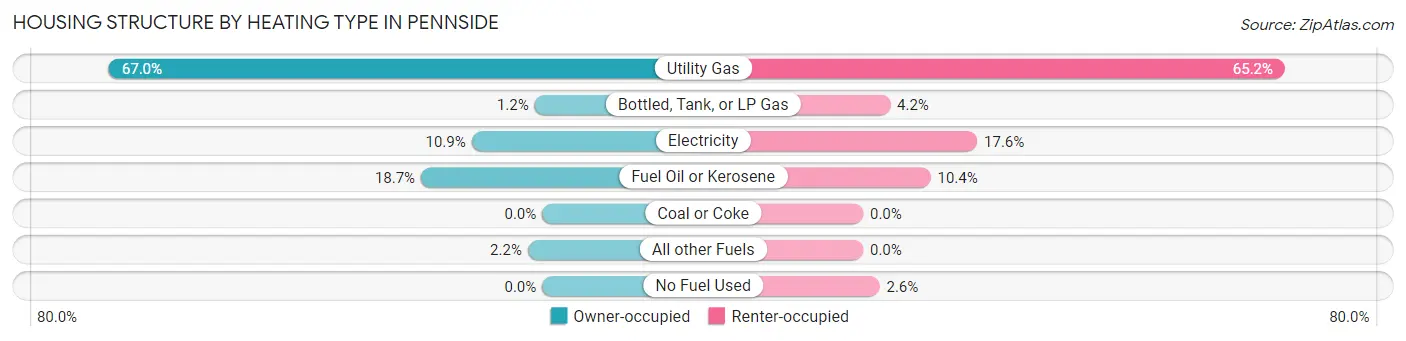
| Heating Type | Owner-occupied | Renter-occupied |
| Utility Gas | 1,087 (67.0%) | 281 (65.2%) |
| Bottled, Tank, or LP Gas | 19 (1.2%) | 18 (4.2%) |
| Electricity | 177 (10.9%) | 76 (17.6%) |
| Fuel Oil or Kerosene | 304 (18.7%) | 45 (10.4%) |
| Coal or Coke | 0 (0.0%) | 0 (0.0%) |
| All other Fuels | 36 (2.2%) | 0 (0.0%) |
| No Fuel Used | 0 (0.0%) | 11 (2.5%) |
| Total | 1,623 (100.0%) | 431 (100.0%) |
Household Vehicle Usage in Pennside
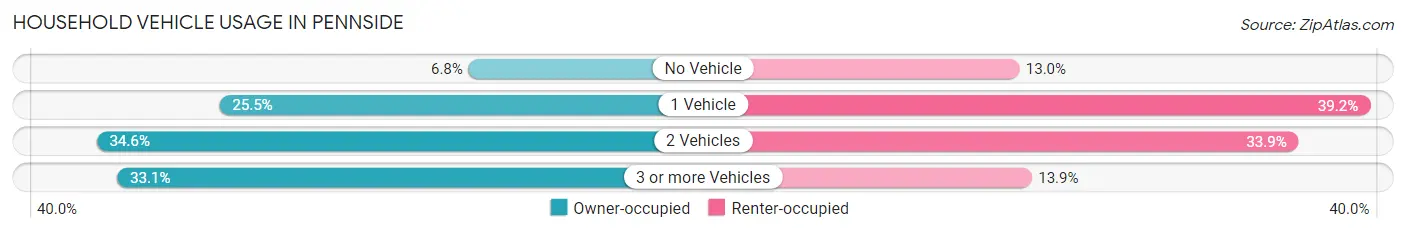
| Vehicles per Household | Owner-occupied | Renter-occupied |
| No Vehicle | 111 (6.8%) | 56 (13.0%) |
| 1 Vehicle | 413 (25.5%) | 169 (39.2%) |
| 2 Vehicles | 562 (34.6%) | 146 (33.9%) |
| 3 or more Vehicles | 537 (33.1%) | 60 (13.9%) |
| Total | 1,623 (100.0%) | 431 (100.0%) |
Real Estate & Mortgages in Pennside
Real Estate and Mortgage Overview in Pennside
| Characteristic | Without Mortgage | With Mortgage |
| Housing Units | 683 | 940 |
| Median Property Value | $163,500 | $180,700 |
| Median Household Income | $46,955 | $242 |
| Monthly Housing Costs | $661 | $22 |
| Real Estate Taxes | $5,077 | $0 |
Property Value by Mortgage Status in Pennside
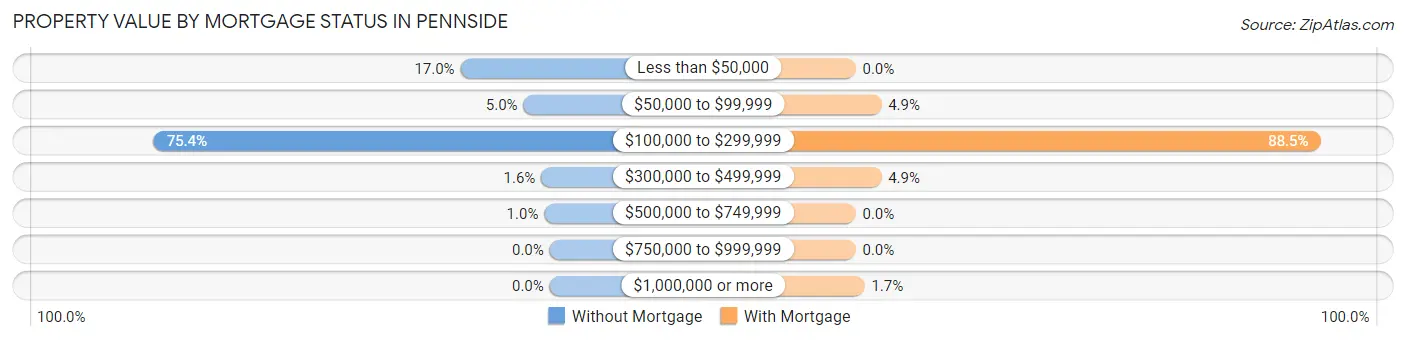
| Property Value | Without Mortgage | With Mortgage |
| Less than $50,000 | 116 (17.0%) | 0 (0.0%) |
| $50,000 to $99,999 | 34 (5.0%) | 46 (4.9%) |
| $100,000 to $299,999 | 515 (75.4%) | 832 (88.5%) |
| $300,000 to $499,999 | 11 (1.6%) | 46 (4.9%) |
| $500,000 to $749,999 | 7 (1.0%) | 0 (0.0%) |
| $750,000 to $999,999 | 0 (0.0%) | 0 (0.0%) |
| $1,000,000 or more | 0 (0.0%) | 16 (1.7%) |
| Total | 683 (100.0%) | 940 (100.0%) |
Household Income by Mortgage Status in Pennside
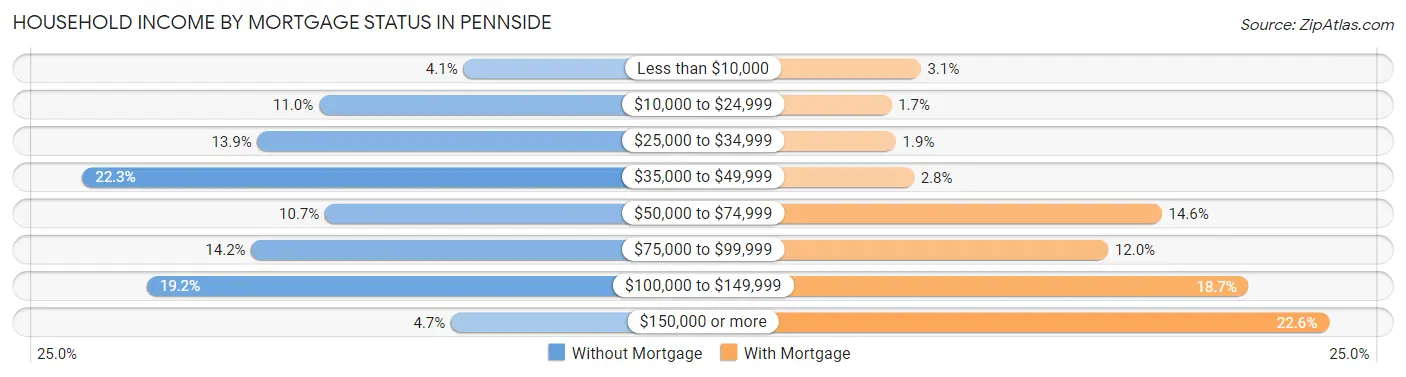
| Household Income | Without Mortgage | With Mortgage |
| Less than $10,000 | 28 (4.1%) | 29 (3.1%) |
| $10,000 to $24,999 | 75 (11.0%) | 16 (1.7%) |
| $25,000 to $34,999 | 95 (13.9%) | 18 (1.9%) |
| $35,000 to $49,999 | 152 (22.3%) | 26 (2.8%) |
| $50,000 to $74,999 | 73 (10.7%) | 137 (14.6%) |
| $75,000 to $99,999 | 97 (14.2%) | 113 (12.0%) |
| $100,000 to $149,999 | 131 (19.2%) | 176 (18.7%) |
| $150,000 or more | 32 (4.7%) | 212 (22.6%) |
| Total | 683 (100.0%) | 940 (100.0%) |
Property Value to Household Income Ratio in Pennside
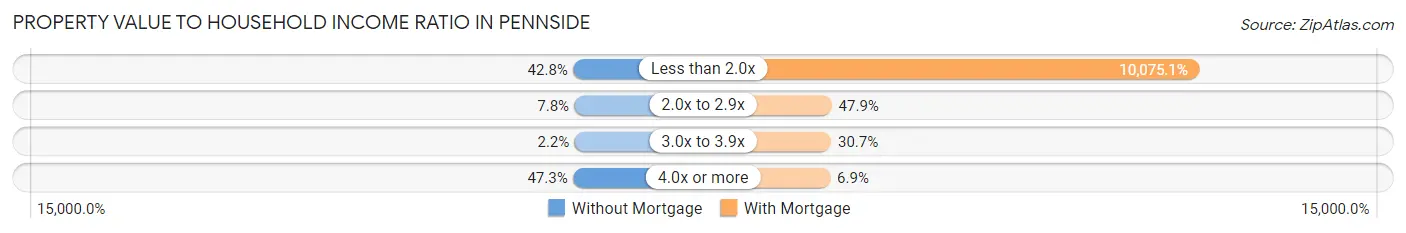
| Value-to-Income Ratio | Without Mortgage | With Mortgage |
| Less than 2.0x | 292 (42.7%) | 94,706 (10,075.1%) |
| 2.0x to 2.9x | 53 (7.8%) | 450 (47.9%) |
| 3.0x to 3.9x | 15 (2.2%) | 289 (30.7%) |
| 4.0x or more | 323 (47.3%) | 65 (6.9%) |
| Total | 683 (100.0%) | 940 (100.0%) |
Real Estate Taxes by Mortgage Status in Pennside
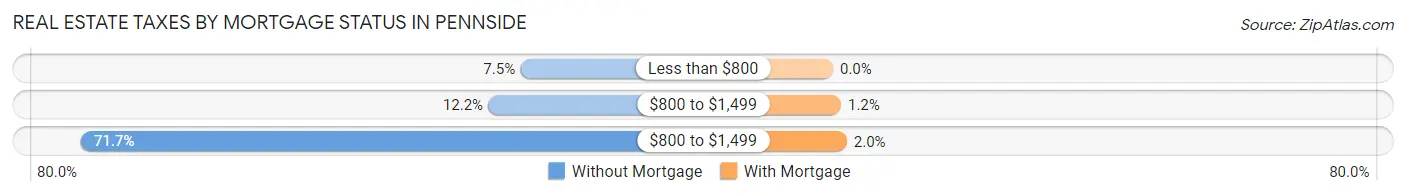
| Property Taxes | Without Mortgage | With Mortgage |
| Less than $800 | 51 (7.5%) | 0 (0.0%) |
| $800 to $1,499 | 83 (12.1%) | 11 (1.2%) |
| $800 to $1,499 | 490 (71.7%) | 19 (2.0%) |
| Total | 683 (100.0%) | 940 (100.0%) |
Health & Disability in Pennside
Health Insurance Coverage by Age in Pennside
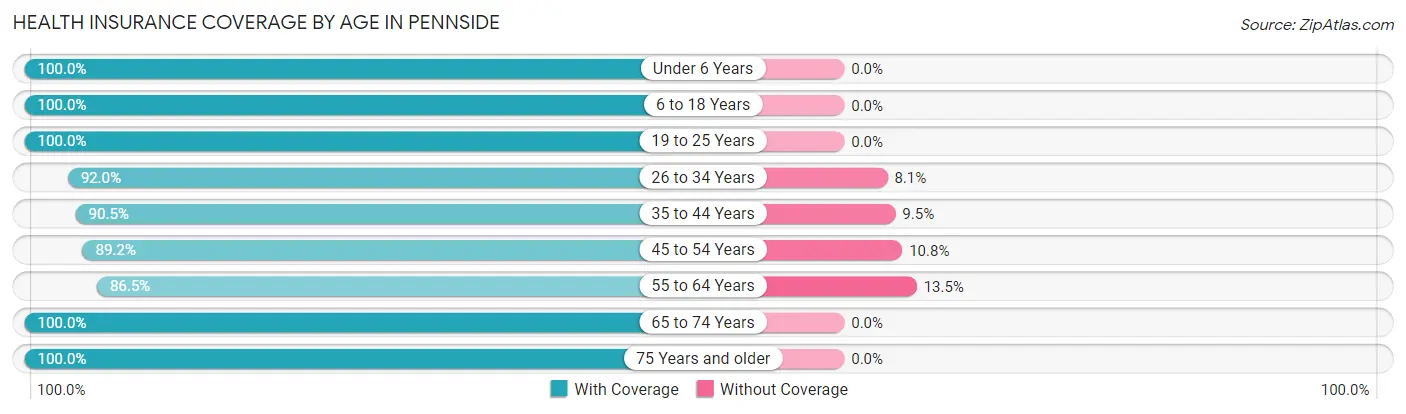
| Age Bracket | With Coverage | Without Coverage |
| Under 6 Years | 251 (100.0%) | 0 (0.0%) |
| 6 to 18 Years | 887 (100.0%) | 0 (0.0%) |
| 19 to 25 Years | 287 (100.0%) | 0 (0.0%) |
| 26 to 34 Years | 857 (91.9%) | 75 (8.1%) |
| 35 to 44 Years | 484 (90.5%) | 51 (9.5%) |
| 45 to 54 Years | 520 (89.2%) | 63 (10.8%) |
| 55 to 64 Years | 769 (86.5%) | 120 (13.5%) |
| 65 to 74 Years | 522 (100.0%) | 0 (0.0%) |
| 75 Years and older | 349 (100.0%) | 0 (0.0%) |
| Total | 4,926 (94.1%) | 309 (5.9%) |
Health Insurance Coverage by Citizenship Status in Pennside
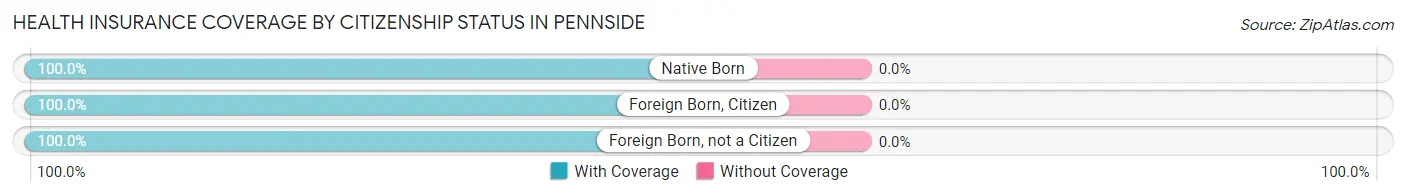
| Citizenship Status | With Coverage | Without Coverage |
| Native Born | 251 (100.0%) | 0 (0.0%) |
| Foreign Born, Citizen | 887 (100.0%) | 0 (0.0%) |
| Foreign Born, not a Citizen | 287 (100.0%) | 0 (0.0%) |
Health Insurance Coverage by Household Income in Pennside
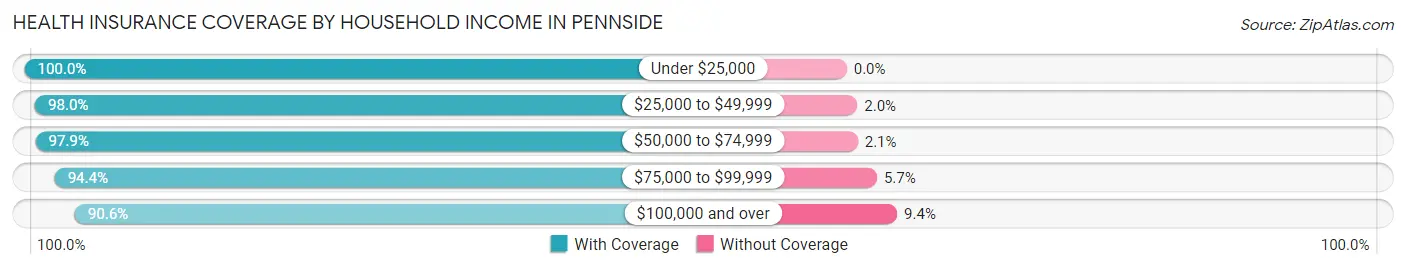
| Household Income | With Coverage | Without Coverage |
| Under $25,000 | 198 (100.0%) | 0 (0.0%) |
| $25,000 to $49,999 | 989 (98.0%) | 20 (2.0%) |
| $50,000 to $74,999 | 759 (97.9%) | 16 (2.1%) |
| $75,000 to $99,999 | 835 (94.4%) | 50 (5.7%) |
| $100,000 and over | 2,143 (90.6%) | 223 (9.4%) |
Public vs Private Health Insurance Coverage by Age in Pennside
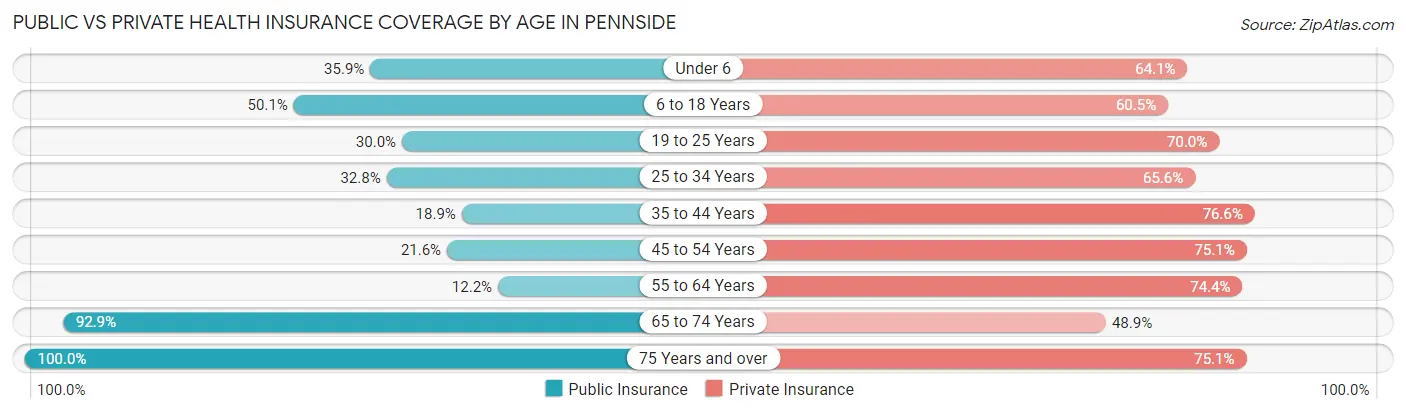
| Age Bracket | Public Insurance | Private Insurance |
| Under 6 | 90 (35.9%) | 161 (64.1%) |
| 6 to 18 Years | 444 (50.1%) | 537 (60.5%) |
| 19 to 25 Years | 86 (30.0%) | 201 (70.0%) |
| 25 to 34 Years | 306 (32.8%) | 611 (65.6%) |
| 35 to 44 Years | 101 (18.9%) | 410 (76.6%) |
| 45 to 54 Years | 126 (21.6%) | 438 (75.1%) |
| 55 to 64 Years | 108 (12.1%) | 661 (74.4%) |
| 65 to 74 Years | 485 (92.9%) | 255 (48.8%) |
| 75 Years and over | 349 (100.0%) | 262 (75.1%) |
| Total | 2,095 (40.0%) | 3,536 (67.5%) |
Disability Status by Sex by Age in Pennside
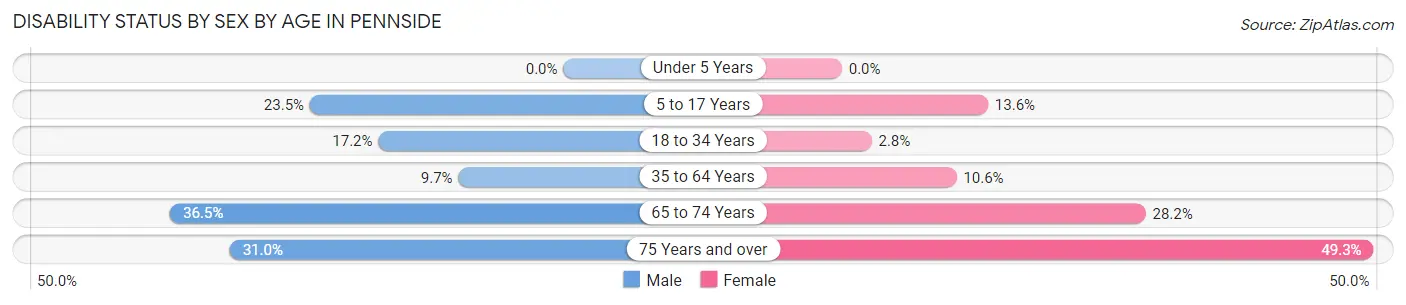
| Age Bracket | Male | Female |
| Under 5 Years | 0 (0.0%) | 0 (0.0%) |
| 5 to 17 Years | 103 (23.5%) | 64 (13.6%) |
| 18 to 34 Years | 108 (17.2%) | 17 (2.8%) |
| 35 to 64 Years | 92 (9.7%) | 113 (10.6%) |
| 65 to 74 Years | 96 (36.5%) | 73 (28.2%) |
| 75 Years and over | 61 (31.0%) | 75 (49.3%) |
Disability Class by Sex by Age in Pennside
Disability Class: Hearing Difficulty
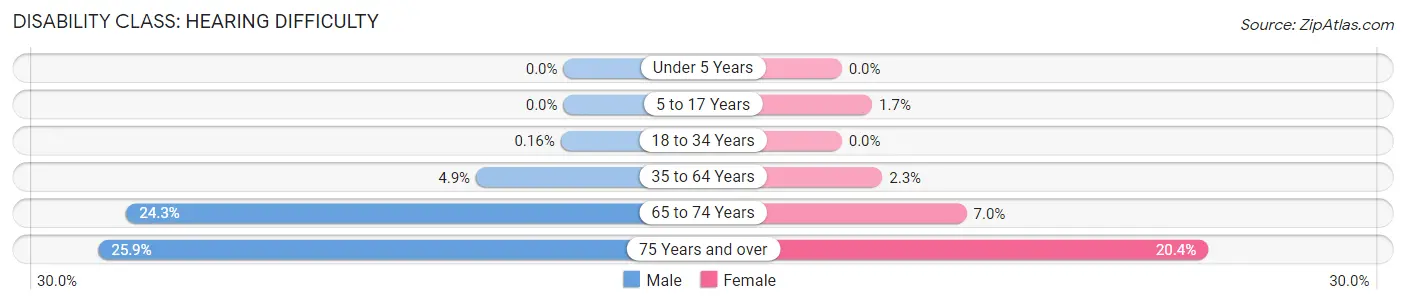
| Age Bracket | Male | Female |
| Under 5 Years | 0 (0.0%) | 0 (0.0%) |
| 5 to 17 Years | 0 (0.0%) | 8 (1.7%) |
| 18 to 34 Years | 1 (0.2%) | 0 (0.0%) |
| 35 to 64 Years | 46 (4.9%) | 24 (2.3%) |
| 65 to 74 Years | 64 (24.3%) | 18 (7.0%) |
| 75 Years and over | 51 (25.9%) | 31 (20.4%) |
Disability Class: Vision Difficulty
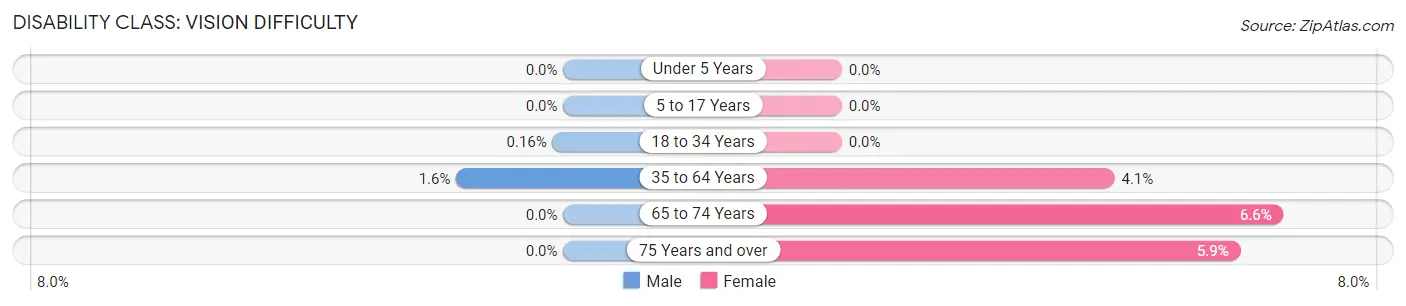
| Age Bracket | Male | Female |
| Under 5 Years | 0 (0.0%) | 0 (0.0%) |
| 5 to 17 Years | 0 (0.0%) | 0 (0.0%) |
| 18 to 34 Years | 1 (0.2%) | 0 (0.0%) |
| 35 to 64 Years | 15 (1.6%) | 43 (4.1%) |
| 65 to 74 Years | 0 (0.0%) | 17 (6.6%) |
| 75 Years and over | 0 (0.0%) | 9 (5.9%) |
Disability Class: Cognitive Difficulty
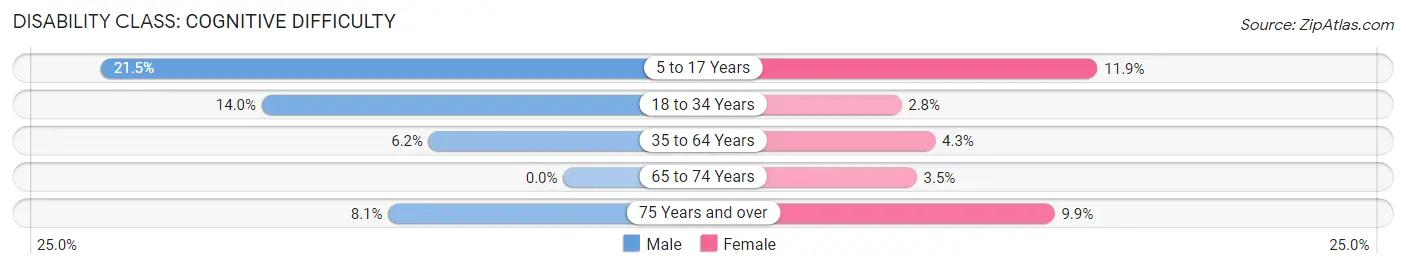
| Age Bracket | Male | Female |
| 5 to 17 Years | 94 (21.5%) | 56 (11.9%) |
| 18 to 34 Years | 88 (14.0%) | 17 (2.8%) |
| 35 to 64 Years | 59 (6.2%) | 46 (4.3%) |
| 65 to 74 Years | 0 (0.0%) | 9 (3.5%) |
| 75 Years and over | 16 (8.1%) | 15 (9.9%) |
Disability Class: Ambulatory Difficulty
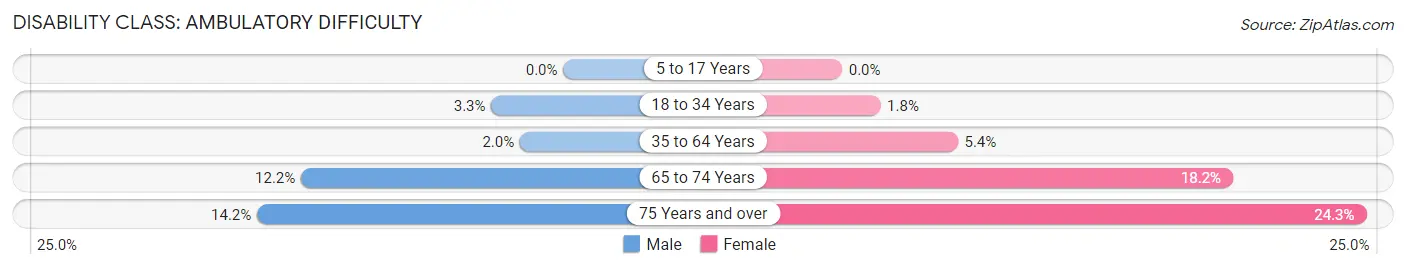
| Age Bracket | Male | Female |
| 5 to 17 Years | 0 (0.0%) | 0 (0.0%) |
| 18 to 34 Years | 21 (3.3%) | 11 (1.8%) |
| 35 to 64 Years | 19 (2.0%) | 57 (5.4%) |
| 65 to 74 Years | 32 (12.2%) | 47 (18.1%) |
| 75 Years and over | 28 (14.2%) | 37 (24.3%) |
Disability Class: Self-Care Difficulty
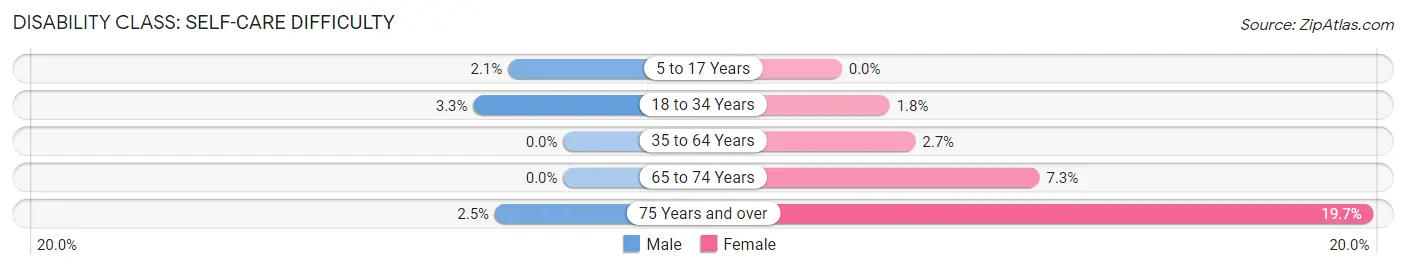
| Age Bracket | Male | Female |
| 5 to 17 Years | 9 (2.1%) | 0 (0.0%) |
| 18 to 34 Years | 21 (3.3%) | 11 (1.8%) |
| 35 to 64 Years | 0 (0.0%) | 29 (2.7%) |
| 65 to 74 Years | 0 (0.0%) | 19 (7.3%) |
| 75 Years and over | 5 (2.5%) | 30 (19.7%) |
Technology Access in Pennside
Computing Device Access in Pennside
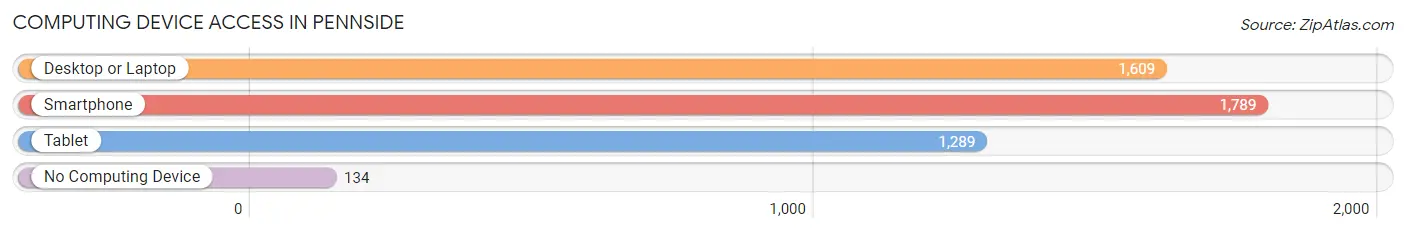
| Device Type | # Households | % Households |
| Desktop or Laptop | 1,609 | 78.3% |
| Smartphone | 1,789 | 87.1% |
| Tablet | 1,289 | 62.8% |
| No Computing Device | 134 | 6.5% |
| Total | 2,054 | 100.0% |
Internet Access in Pennside
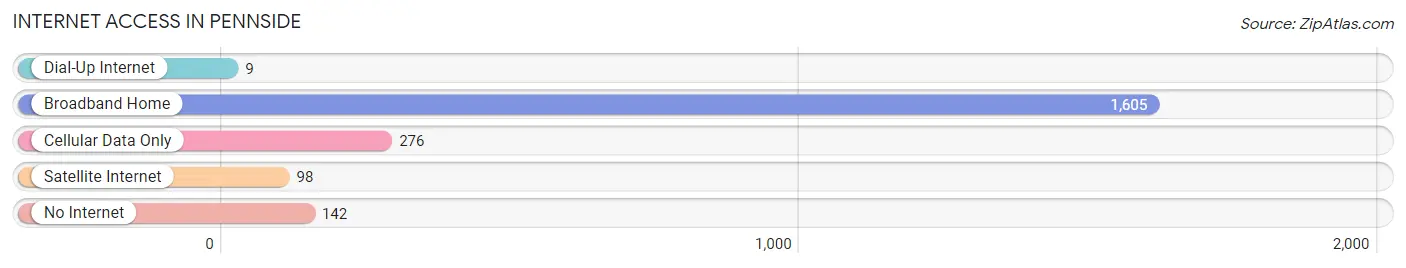
| Internet Type | # Households | % Households |
| Dial-Up Internet | 9 | 0.4% |
| Broadband Home | 1,605 | 78.1% |
| Cellular Data Only | 276 | 13.4% |
| Satellite Internet | 98 | 4.8% |
| No Internet | 142 | 6.9% |
| Total | 2,054 | 100.0% |
Pennside Summary
Pennside is a small borough located in Berks County, Pennsylvania. It is situated in the southeastern corner of the county, just north of the city of Reading. The borough is bordered by the Schuylkill River to the east, the city of Reading to the south, and the boroughs of West Reading and Wyomissing to the west and north, respectively. As of the 2010 census, the population of Pennside was 2,845.
History
The area that is now Pennside was originally inhabited by the Lenape Native Americans. The first European settlers arrived in the area in the late 17th century, and the area was officially established as a borough in 1851. The borough was named after the Penn family, who were prominent landowners in the area.
In the late 19th century, Pennside was a thriving industrial center, with several factories and mills located in the borough. The most prominent of these was the Reading Iron Works, which was founded in 1871 and employed hundreds of workers. The Reading Iron Works closed in the early 20th century, but the borough continued to be a center of industry, with several smaller factories and mills operating in the area.
Geography
Pennside is located in southeastern Berks County, just north of the city of Reading. The borough is bordered by the Schuylkill River to the east, the city of Reading to the south, and the boroughs of West Reading and Wyomissing to the west and north, respectively. The borough has a total area of 0.7 square miles, all of which is land.
Economy
Pennside is a primarily residential community, with no major industries or businesses located in the borough. The majority of the borough’s residents are employed in the nearby cities of Reading and Wyomissing. The borough does have a few small businesses, including a few restaurants, a convenience store, and a few small retail stores.
Demographics
As of the 2010 census, the population of Pennside was 2,845. The racial makeup of the borough was 94.3% White, 2.2% African American, 0.3% Native American, 0.7% Asian, 0.1% Pacific Islander, 1.2% from other races, and 1.2% from two or more races. Hispanic or Latino of any race were 3.2% of the population.
The median household income in Pennside was $45,938, and the median family income was $51,964. The per capita income for the borough was $20,945. About 8.2% of families and 10.2% of the population were below the poverty line, including 14.2% of those under age 18 and 6.2% of those age 65 or over.
Common Questions
What is Per Capita Income in Pennside?
Per Capita income in Pennside is $36,087.
What is the Median Family Income in Pennside?
Median Family Income in Pennside is $88,925.
What is the Median Household income in Pennside?
Median Household Income in Pennside is $74,388.
What is Income or Wage Gap in Pennside?
Income or Wage Gap in Pennside is 7.0%.
Women in Pennside earn 93.0 cents for every dollar earned by a man.
What is Inequality or Gini Index in Pennside?
Inequality or Gini Index in Pennside is 0.39.
What is the Total Population of Pennside?
Total Population of Pennside is 5,235.
What is the Total Male Population of Pennside?
Total Male Population of Pennside is 2,612.
What is the Total Female Population of Pennside?
Total Female Population of Pennside is 2,623.
What is the Ratio of Males per 100 Females in Pennside?
There are 99.58 Males per 100 Females in Pennside.
What is the Ratio of Females per 100 Males in Pennside?
There are 100.42 Females per 100 Males in Pennside.
What is the Median Population Age in Pennside?
Median Population Age in Pennside is 39.8 Years.
What is the Average Family Size in Pennside
Average Family Size in Pennside is 3.1 People.
What is the Average Household Size in Pennside
Average Household Size in Pennside is 2.5 People.
How Large is the Labor Force in Pennside?
There are 3,105 People in the Labor Forcein in Pennside.
What is the Percentage of People in the Labor Force in Pennside?
72.2% of People are in the Labor Force in Pennside.
What is the Unemployment Rate in Pennside?
Unemployment Rate in Pennside is 4.0%.