Hudson, PA Map & Demographics
Hudson Map
Hudson Overview
$40,815
PER CAPITA INCOME
$57,109
AVG FAMILY INCOME
$55,779
AVG HOUSEHOLD INCOME
56.6%
WAGE / INCOME GAP [ % ]
43.4¢/ $1
WAGE / INCOME GAP [ $ ]
0.42
INEQUALITY / GINI INDEX
1,463
TOTAL POPULATION
806
MALE POPULATION
657
FEMALE POPULATION
122.68
MALES / 100 FEMALES
81.51
FEMALES / 100 MALES
45.1
MEDIAN AGE
2.5
AVG FAMILY SIZE
1.8
AVG HOUSEHOLD SIZE
807
LABOR FORCE [ PEOPLE ]
66.4%
PERCENT IN LABOR FORCE
2.9%
UNEMPLOYMENT RATE
Hudson Area Codes
Income in Hudson
Income Overview in Hudson
Per Capita Income in Hudson is $40,815, while median incomes of families and households are $57,109 and $55,779 respectively.
| Characteristic | Number | Measure |
| Per Capita Income | 1,463 | $40,815 |
| Median Family Income | 359 | $57,109 |
| Mean Family Income | 359 | $86,660 |
| Median Household Income | 805 | $55,779 |
| Mean Household Income | 805 | $69,822 |
| Income Deficit | 359 | $0 |
| Wage / Income Gap (%) | 1,463 | 56.60% |
| Wage / Income Gap ($) | 1,463 | 43.40¢ per $1 |
| Gini / Inequality Index | 1,463 | 0.42 |
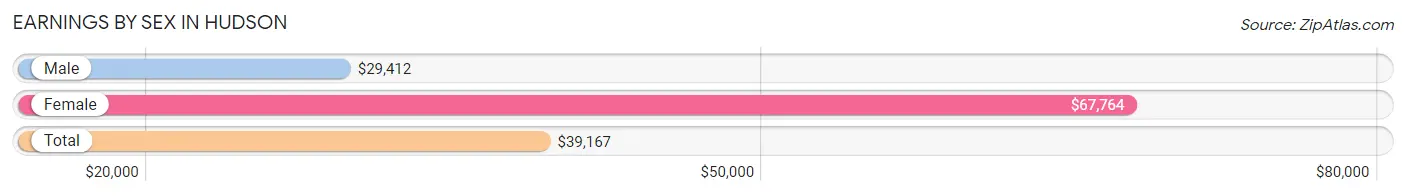
Earnings by Sex in Hudson
Average Earnings in Hudson are $39,167, $29,412 for men and $67,764 for women, a difference of 56.6%.
| Sex | Number | Average Earnings |
| Male | 542 (58.2%) | $29,412 |
| Female | 390 (41.8%) | $67,764 |
| Total | 932 (100.0%) | $39,167 |
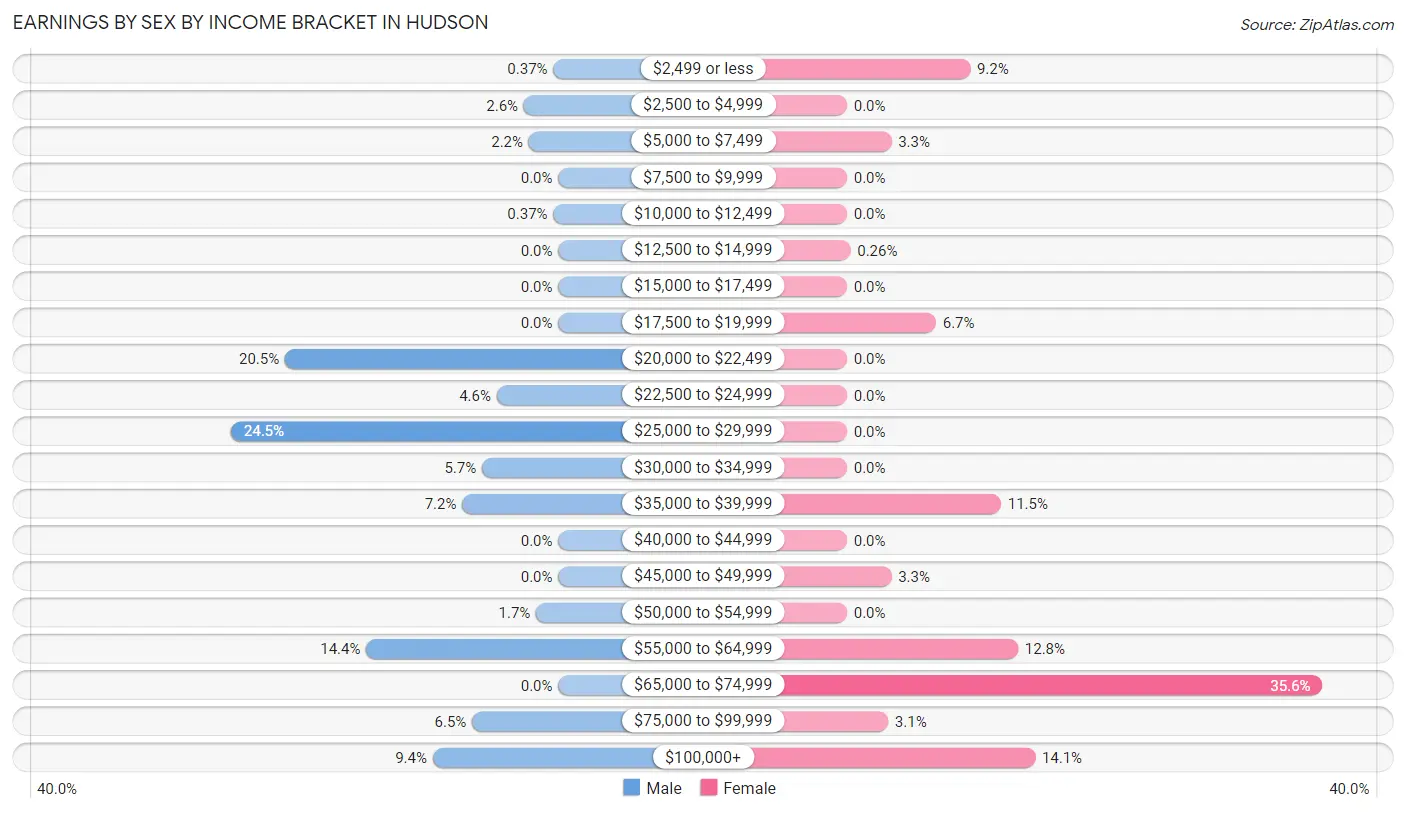
Earnings by Sex by Income Bracket in Hudson
The most common earnings brackets in Hudson are $25,000 to $29,999 for men (133 | 24.5%) and $65,000 to $74,999 for women (139 | 35.6%).
| Income | Male | Female |
| $2,499 or less | 2 (0.4%) | 36 (9.2%) |
| $2,500 to $4,999 | 14 (2.6%) | 0 (0.0%) |
| $5,000 to $7,499 | 12 (2.2%) | 13 (3.3%) |
| $7,500 to $9,999 | 0 (0.0%) | 0 (0.0%) |
| $10,000 to $12,499 | 2 (0.4%) | 0 (0.0%) |
| $12,500 to $14,999 | 0 (0.0%) | 1 (0.3%) |
| $15,000 to $17,499 | 0 (0.0%) | 0 (0.0%) |
| $17,500 to $19,999 | 0 (0.0%) | 26 (6.7%) |
| $20,000 to $22,499 | 111 (20.5%) | 0 (0.0%) |
| $22,500 to $24,999 | 25 (4.6%) | 0 (0.0%) |
| $25,000 to $29,999 | 133 (24.5%) | 0 (0.0%) |
| $30,000 to $34,999 | 31 (5.7%) | 0 (0.0%) |
| $35,000 to $39,999 | 39 (7.2%) | 45 (11.5%) |
| $40,000 to $44,999 | 0 (0.0%) | 0 (0.0%) |
| $45,000 to $49,999 | 0 (0.0%) | 13 (3.3%) |
| $50,000 to $54,999 | 9 (1.7%) | 0 (0.0%) |
| $55,000 to $64,999 | 78 (14.4%) | 50 (12.8%) |
| $65,000 to $74,999 | 0 (0.0%) | 139 (35.6%) |
| $75,000 to $99,999 | 35 (6.5%) | 12 (3.1%) |
| $100,000+ | 51 (9.4%) | 55 (14.1%) |
| Total | 542 (100.0%) | 390 (100.0%) |
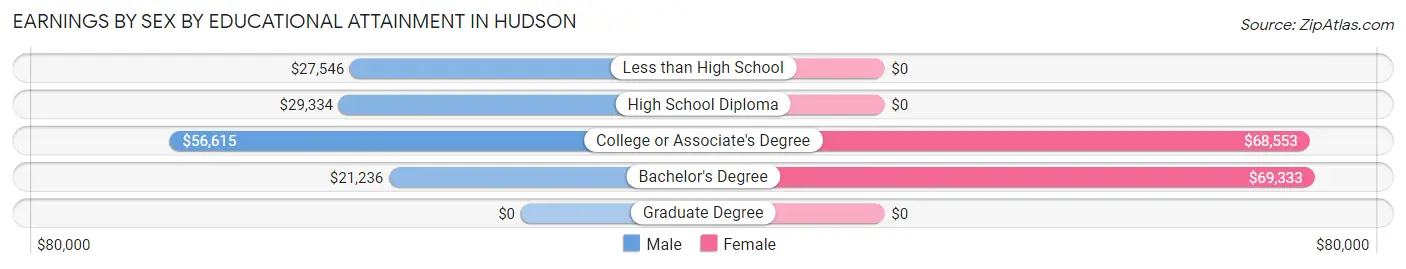
Earnings by Sex by Educational Attainment in Hudson
Average earnings in Hudson are $29,433 for men and $67,764 for women, a difference of 56.6%. Men with an educational attainment of college or associate's degree enjoy the highest average annual earnings of $56,615, while those with bachelor's degree education earn the least with $21,236. Women with an educational attainment of bachelor's degree earn the most with the average annual earnings of $69,333, while those with college or associate's degree education have the smallest earnings of $68,553.
| Educational Attainment | Male Income | Female Income |
| Less than High School | $27,546 | $0 |
| High School Diploma | $29,334 | $0 |
| College or Associate's Degree | $56,615 | $68,553 |
| Bachelor's Degree | $21,236 | $69,333 |
| Graduate Degree | - | - |
| Total | $29,433 | $67,764 |
Family Income in Hudson
Family Income Brackets in Hudson
According to the Hudson family income data, there are 148 families falling into the $50,000 to $74,999 income range, which is the most common income bracket and makes up 41.2% of all families.
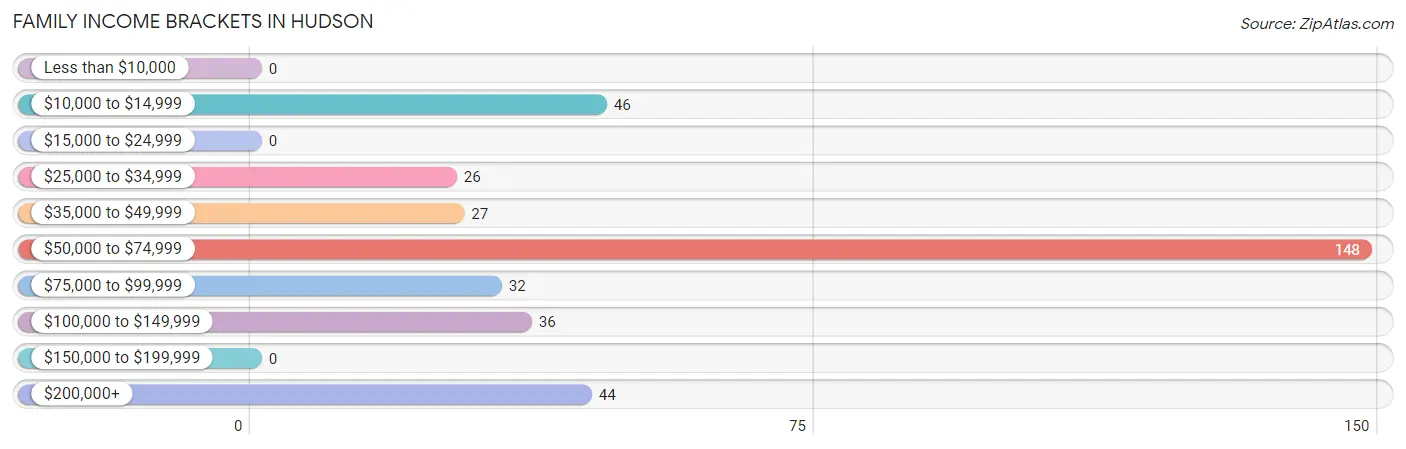
| Income Bracket | # Families | % Families |
| Less than $10,000 | 0 | 0.0% |
| $10,000 to $14,999 | 46 | 12.8% |
| $15,000 to $24,999 | 0 | 0.0% |
| $25,000 to $34,999 | 26 | 7.2% |
| $35,000 to $49,999 | 27 | 7.5% |
| $50,000 to $74,999 | 148 | 41.2% |
| $75,000 to $99,999 | 32 | 8.9% |
| $100,000 to $149,999 | 36 | 10.0% |
| $150,000 to $199,999 | 0 | 0.0% |
| $200,000+ | 44 | 12.3% |
Family Income by Famaliy Size in Hudson
2-person families (277 | 77.2%) account for the highest median family income in Hudson with $57,391 per family, while 2-person families (277 | 77.2%) have the highest median income of $28,696 per family member.
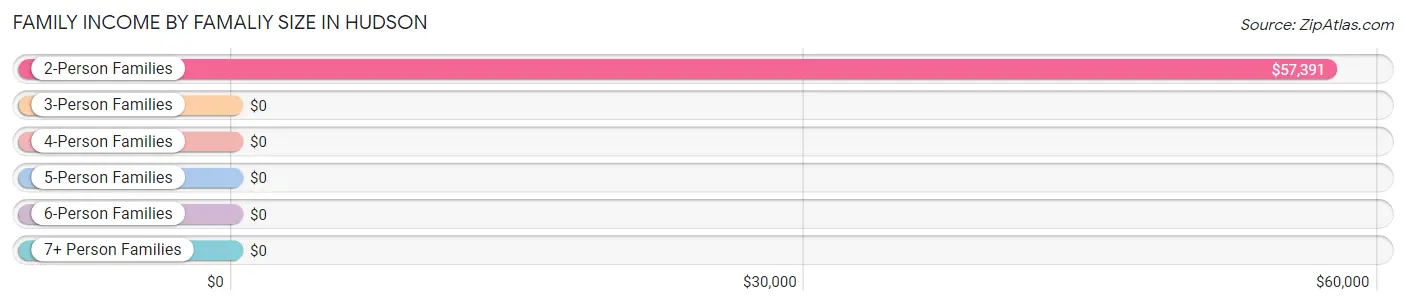
| Income Bracket | # Families | Median Income |
| 2-Person Families | 277 (77.2%) | $57,391 |
| 3-Person Families | 60 (16.7%) | $0 |
| 4-Person Families | 7 (1.9%) | $0 |
| 5-Person Families | 15 (4.2%) | $0 |
| 6-Person Families | 0 (0.0%) | $0 |
| 7+ Person Families | 0 (0.0%) | $0 |
| Total | 359 (100.0%) | $57,109 |
Family Income by Number of Earners in Hudson
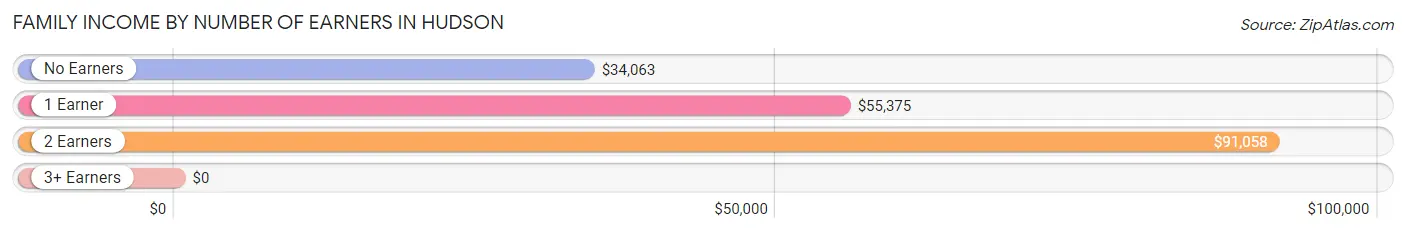
| Number of Earners | # Families | Median Income |
| No Earners | 35 (9.8%) | $34,063 |
| 1 Earner | 150 (41.8%) | $55,375 |
| 2 Earners | 173 (48.2%) | $91,058 |
| 3+ Earners | 1 (0.3%) | $0 |
| Total | 359 (100.0%) | $57,109 |
Household Income in Hudson
Household Income Brackets in Hudson
With 226 households falling in the category, the $50,000 to $74,999 income range is the most frequent in Hudson, accounting for 28.1% of all households.
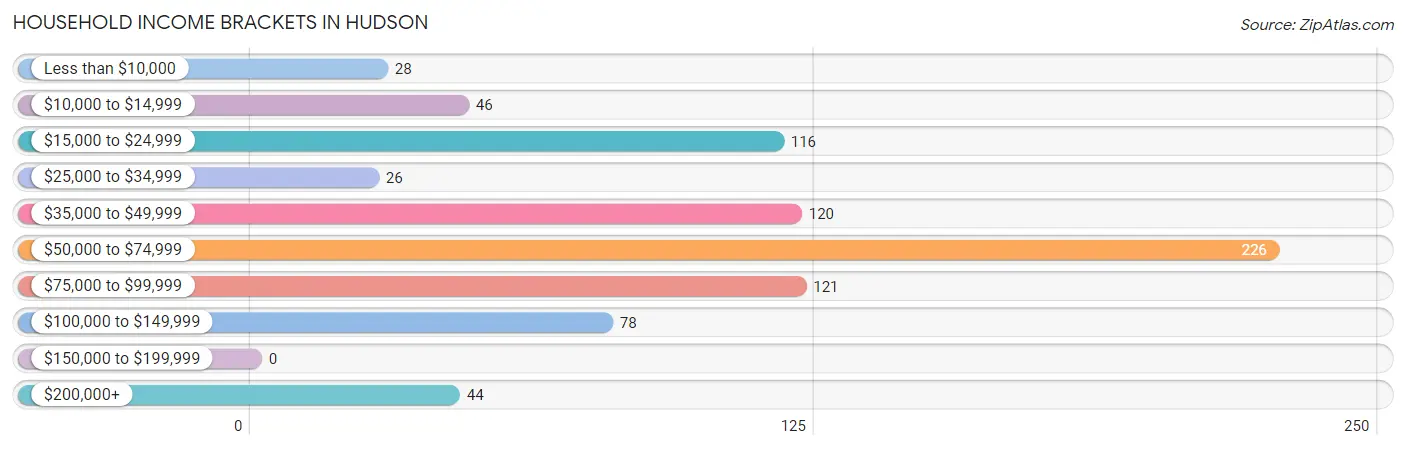
| Income Bracket | # Households | % Households |
| Less than $10,000 | 28 | 3.5% |
| $10,000 to $14,999 | 46 | 5.7% |
| $15,000 to $24,999 | 116 | 14.4% |
| $25,000 to $34,999 | 26 | 3.2% |
| $35,000 to $49,999 | 120 | 14.9% |
| $50,000 to $74,999 | 226 | 28.1% |
| $75,000 to $99,999 | 121 | 15.0% |
| $100,000 to $149,999 | 78 | 9.7% |
| $150,000 to $199,999 | 0 | 0.0% |
| $200,000+ | 44 | 5.5% |
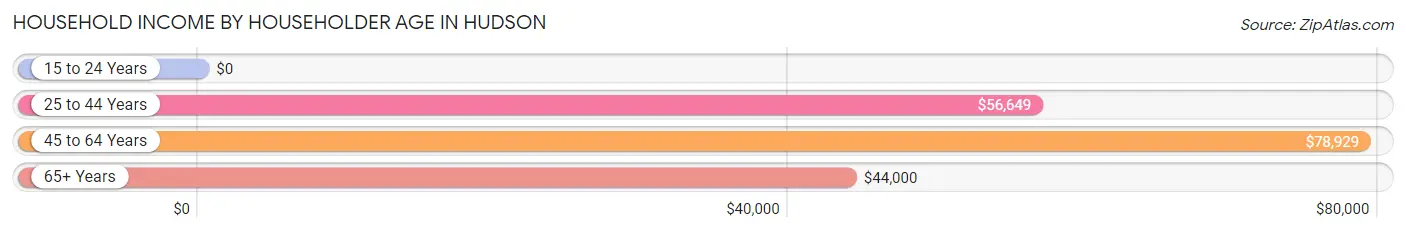
Household Income by Householder Age in Hudson
The median household income in Hudson is $55,779, with the highest median household income of $78,929 found in the 45 to 64 years age bracket for the primary householder. A total of 348 households (43.2%) fall into this category.
| Income Bracket | # Households | Median Income |
| 15 to 24 Years | 0 (0.0%) | $0 |
| 25 to 44 Years | 249 (30.9%) | $56,649 |
| 45 to 64 Years | 348 (43.2%) | $78,929 |
| 65+ Years | 208 (25.8%) | $44,000 |
| Total | 805 (100.0%) | $55,779 |
Poverty in Hudson
Income Below Poverty by Sex and Age in Hudson
With 20.8% poverty level for males and 13.7% for females among the residents of Hudson, under 5 year old males and under 5 year old females are the most vulnerable to poverty, with 37 males (100.0%) and 17 females (100.0%) in their respective age groups living below the poverty level.
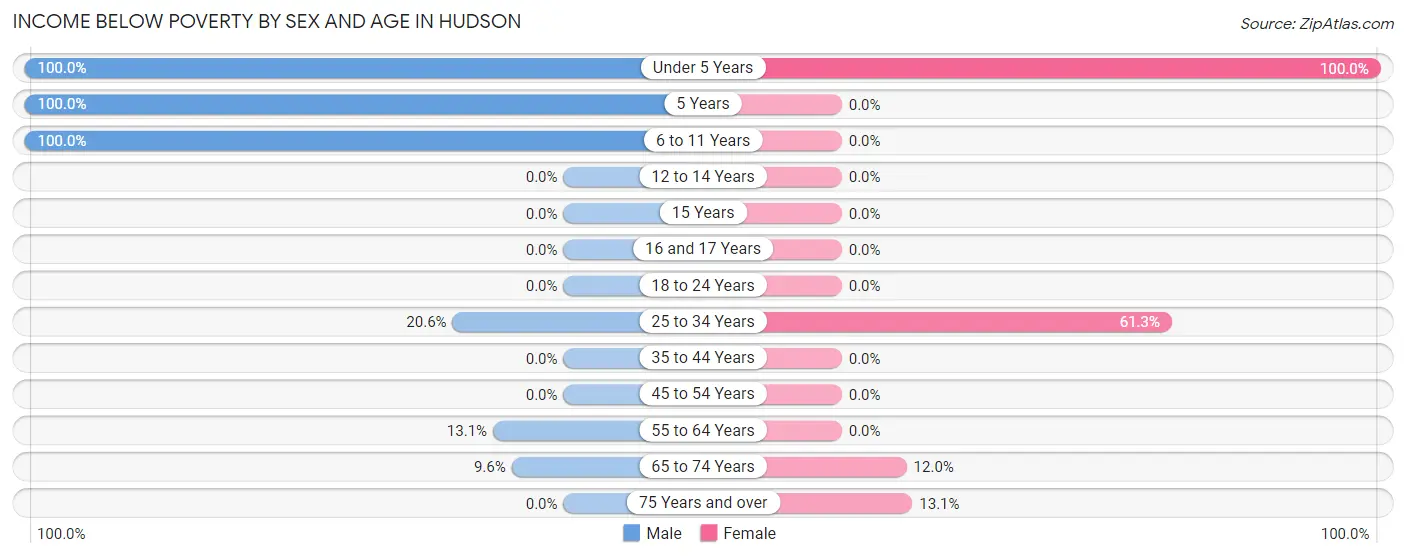
| Age Bracket | Male | Female |
| Under 5 Years | 37 (100.0%) | 17 (100.0%) |
| 5 Years | 41 (100.0%) | 0 (0.0%) |
| 6 to 11 Years | 42 (100.0%) | 0 (0.0%) |
| 12 to 14 Years | 0 (0.0%) | 0 (0.0%) |
| 15 Years | 0 (0.0%) | 0 (0.0%) |
| 16 and 17 Years | 0 (0.0%) | 0 (0.0%) |
| 18 to 24 Years | 0 (0.0%) | 0 (0.0%) |
| 25 to 34 Years | 14 (20.6%) | 49 (61.3%) |
| 35 to 44 Years | 0 (0.0%) | 0 (0.0%) |
| 45 to 54 Years | 0 (0.0%) | 0 (0.0%) |
| 55 to 64 Years | 17 (13.1%) | 0 (0.0%) |
| 65 to 74 Years | 10 (9.6%) | 13 (12.0%) |
| 75 Years and over | 0 (0.0%) | 11 (13.1%) |
| Total | 161 (20.8%) | 90 (13.7%) |
Income Above Poverty by Sex and Age in Hudson
According to the poverty statistics in Hudson, males aged 12 to 14 years and females aged 6 to 11 years are the age groups that are most secure financially, with 100.0% of males and 100.0% of females in these age groups living above the poverty line.
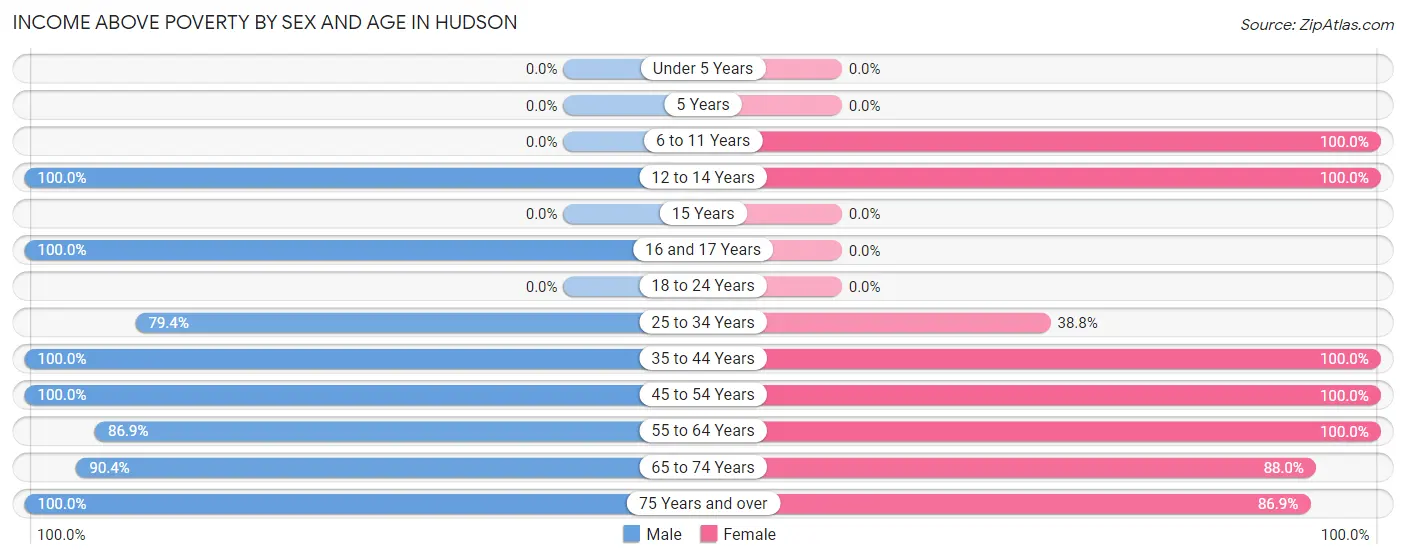
| Age Bracket | Male | Female |
| Under 5 Years | 0 (0.0%) | 0 (0.0%) |
| 5 Years | 0 (0.0%) | 0 (0.0%) |
| 6 to 11 Years | 0 (0.0%) | 10 (100.0%) |
| 12 to 14 Years | 2 (100.0%) | 64 (100.0%) |
| 15 Years | 0 (0.0%) | 0 (0.0%) |
| 16 and 17 Years | 2 (100.0%) | 0 (0.0%) |
| 18 to 24 Years | 0 (0.0%) | 0 (0.0%) |
| 25 to 34 Years | 54 (79.4%) | 31 (38.8%) |
| 35 to 44 Years | 267 (100.0%) | 58 (100.0%) |
| 45 to 54 Years | 53 (100.0%) | 168 (100.0%) |
| 55 to 64 Years | 113 (86.9%) | 68 (100.0%) |
| 65 to 74 Years | 94 (90.4%) | 95 (88.0%) |
| 75 Years and over | 26 (100.0%) | 73 (86.9%) |
| Total | 611 (79.1%) | 567 (86.3%) |
Income Below Poverty Among Married-Couple Families in Hudson
The poverty statistics for married-couple families in Hudson show that 10.3% or 24 of the total 234 families live below the poverty line. Families with 3 or 4 children have the highest poverty rate of 93.3%, comprising of 14 families. On the other hand, families with 1 or 2 children have the lowest poverty rate of 0.0%, which includes 0 families.
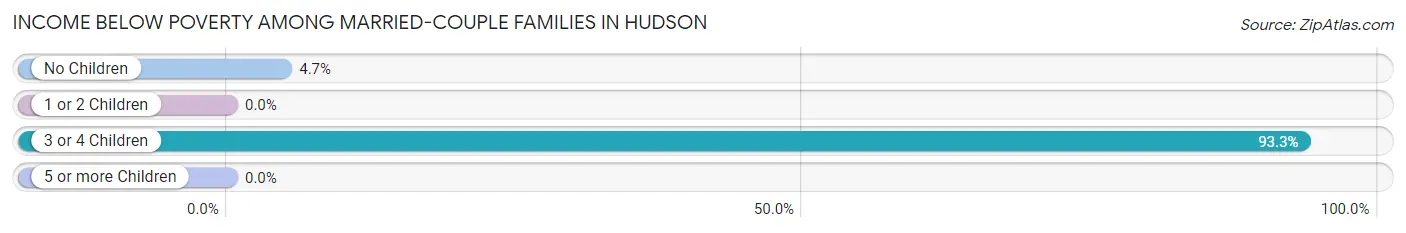
| Children | Above Poverty | Below Poverty |
| No Children | 202 (95.3%) | 10 (4.7%) |
| 1 or 2 Children | 7 (100.0%) | 0 (0.0%) |
| 3 or 4 Children | 1 (6.7%) | 14 (93.3%) |
| 5 or more Children | 0 (0.0%) | 0 (0.0%) |
| Total | 210 (89.7%) | 24 (10.3%) |
Income Below Poverty Among Single-Parent Households in Hudson
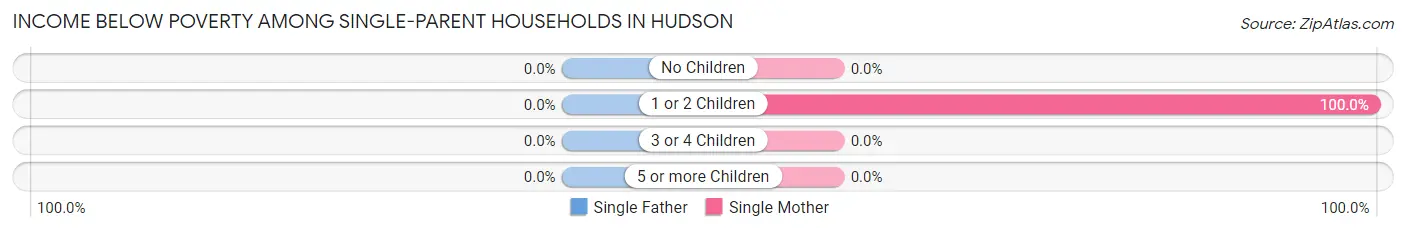
| Children | Single Father | Single Mother |
| No Children | 0 (0.0%) | 0 (0.0%) |
| 1 or 2 Children | 0 (0.0%) | 36 (100.0%) |
| 3 or 4 Children | 0 (0.0%) | 0 (0.0%) |
| 5 or more Children | 0 (0.0%) | 0 (0.0%) |
| Total | 0 (0.0%) | 36 (60.0%) |
Income Below Poverty Among Married-Couple vs Single-Parent Households in Hudson
The poverty data for Hudson shows that 24 of the married-couple family households (10.3%) and 36 of the single-parent households (28.8%) are living below the poverty level. Within the married-couple family households, those with 3 or 4 children have the highest poverty rate, with 14 households (93.3%) falling below the poverty line. Among the single-parent households, those with 1 or 2 children have the highest poverty rate, with 36 household (35.6%) living below poverty.
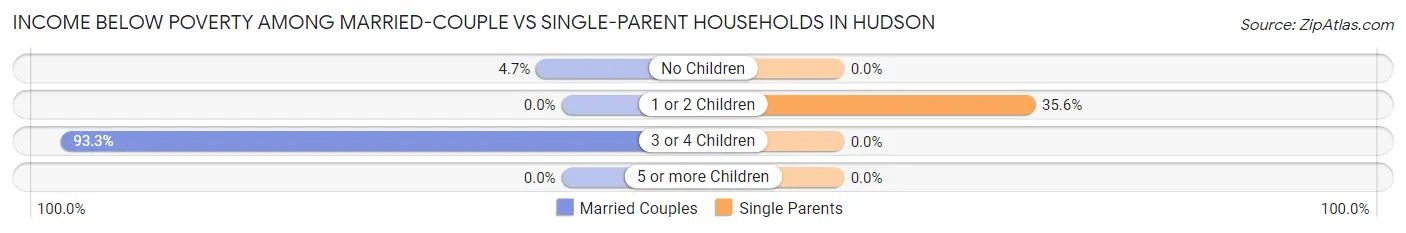
| Children | Married-Couple Families | Single-Parent Households |
| No Children | 10 (4.7%) | 0 (0.0%) |
| 1 or 2 Children | 0 (0.0%) | 36 (35.6%) |
| 3 or 4 Children | 14 (93.3%) | 0 (0.0%) |
| 5 or more Children | 0 (0.0%) | 0 (0.0%) |
| Total | 24 (10.3%) | 36 (28.8%) |
Race in Hudson
The most populous races in Hudson are White / Caucasian (1,011 | 69.1%), Hispanic or Latino (262 | 17.9%), and Some other Race (198 | 13.5%).
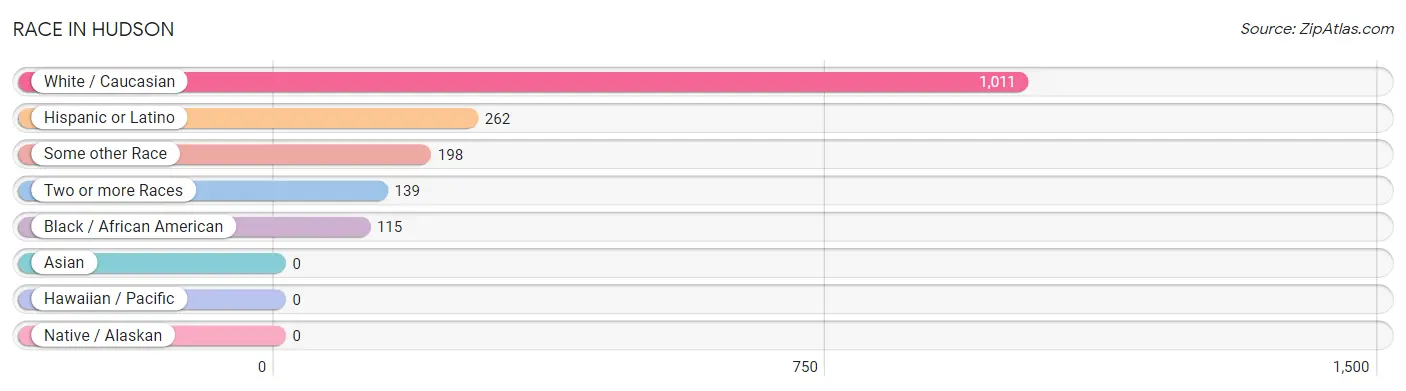
| Race | # Population | % Population |
| Asian | 0 | 0.0% |
| Black / African American | 115 | 7.9% |
| Hawaiian / Pacific | 0 | 0.0% |
| Hispanic or Latino | 262 | 17.9% |
| Native / Alaskan | 0 | 0.0% |
| White / Caucasian | 1,011 | 69.1% |
| Two or more Races | 139 | 9.5% |
| Some other Race | 198 | 13.5% |
| Total | 1,463 | 100.0% |
Ancestry in Hudson
The most populous ancestries reported in Hudson are Italian (360 | 24.6%), Polish (322 | 22.0%), Irish (233 | 15.9%), Puerto Rican (178 | 12.2%), and German (125 | 8.5%), together accounting for 83.3% of all Hudson residents.
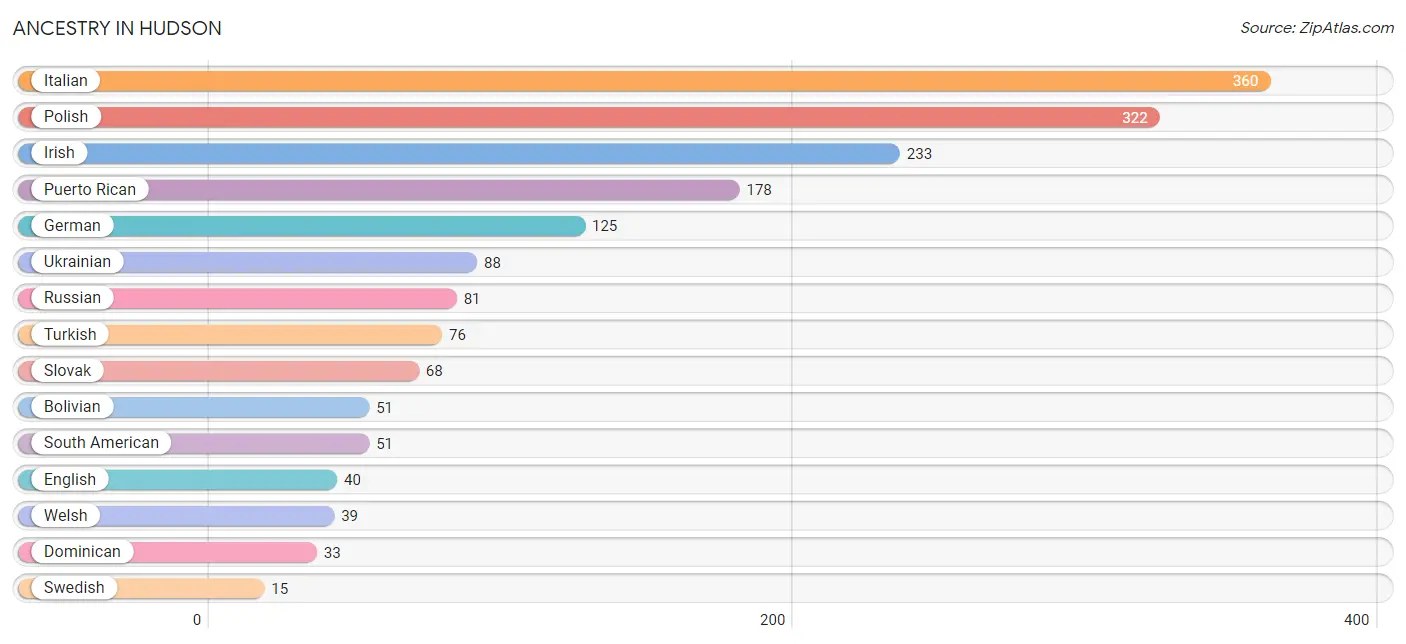
| Ancestry | # Population | % Population |
| Blackfeet | 8 | 0.5% |
| Bolivian | 51 | 3.5% |
| Dominican | 33 | 2.3% |
| English | 40 | 2.7% |
| German | 125 | 8.5% |
| Irish | 233 | 15.9% |
| Italian | 360 | 24.6% |
| Polish | 322 | 22.0% |
| Puerto Rican | 178 | 12.2% |
| Russian | 81 | 5.5% |
| Slovak | 68 | 4.6% |
| South American | 51 | 3.5% |
| Swedish | 15 | 1.0% |
| Turkish | 76 | 5.2% |
| Ukrainian | 88 | 6.0% |
| Welsh | 39 | 2.7% | View All 16 Rows |
Immigrants in Hudson
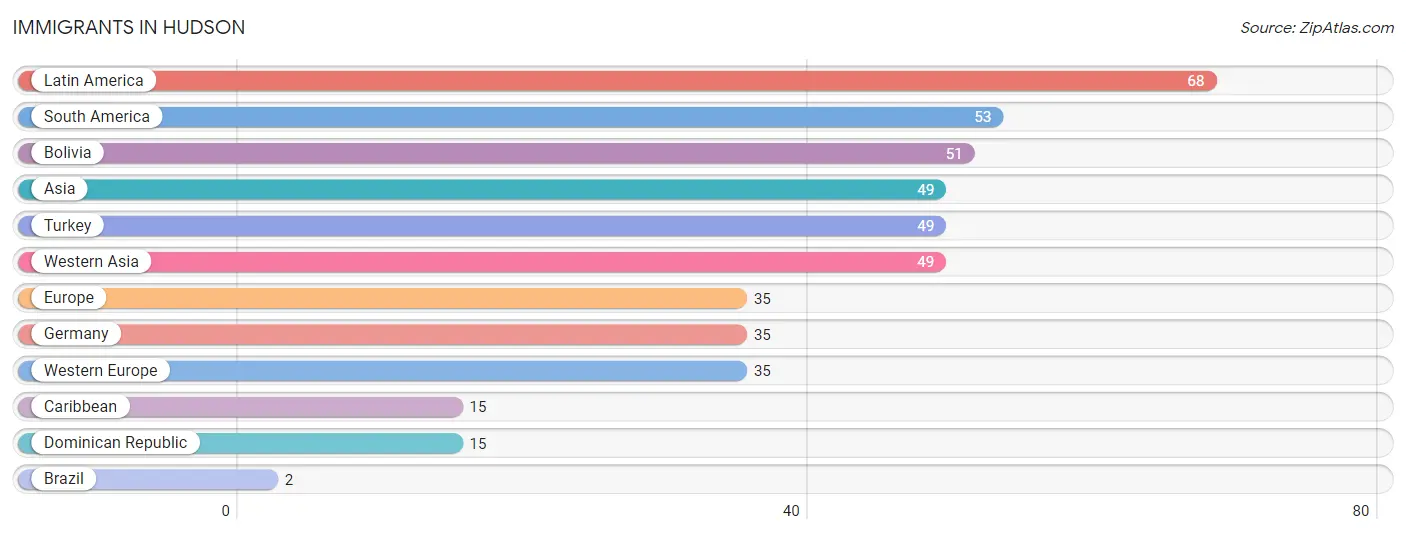
The most numerous immigrant groups reported in Hudson came from Latin America (68 | 4.6%), South America (53 | 3.6%), Bolivia (51 | 3.5%), Asia (49 | 3.4%), and Turkey (49 | 3.4%), together accounting for 18.5% of all Hudson residents.
| Immigration Origin | # Population | % Population |
| Asia | 49 | 3.4% |
| Bolivia | 51 | 3.5% |
| Brazil | 2 | 0.1% |
| Caribbean | 15 | 1.0% |
| Dominican Republic | 15 | 1.0% |
| Europe | 35 | 2.4% |
| Germany | 35 | 2.4% |
| Latin America | 68 | 4.6% |
| South America | 53 | 3.6% |
| Turkey | 49 | 3.4% |
| Western Asia | 49 | 3.4% |
| Western Europe | 35 | 2.4% | View All 12 Rows |
Sex and Age in Hudson
Sex and Age in Hudson
The most populous age groups in Hudson are 35 to 39 Years (152 | 18.9%) for men and 65 to 69 Years (96 | 14.6%) for women.
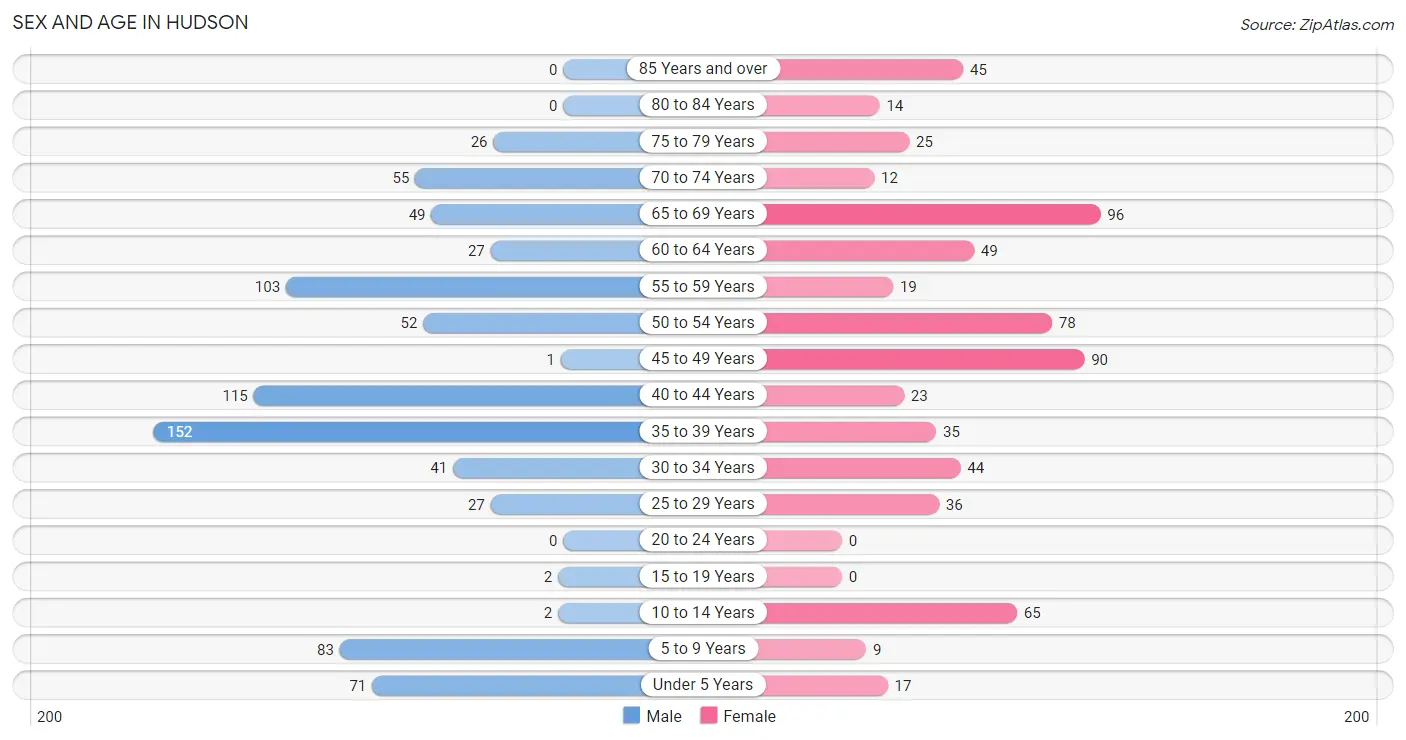
| Age Bracket | Male | Female |
| Under 5 Years | 71 (8.8%) | 17 (2.6%) |
| 5 to 9 Years | 83 (10.3%) | 9 (1.4%) |
| 10 to 14 Years | 2 (0.3%) | 65 (9.9%) |
| 15 to 19 Years | 2 (0.3%) | 0 (0.0%) |
| 20 to 24 Years | 0 (0.0%) | 0 (0.0%) |
| 25 to 29 Years | 27 (3.4%) | 36 (5.5%) |
| 30 to 34 Years | 41 (5.1%) | 44 (6.7%) |
| 35 to 39 Years | 152 (18.9%) | 35 (5.3%) |
| 40 to 44 Years | 115 (14.3%) | 23 (3.5%) |
| 45 to 49 Years | 1 (0.1%) | 90 (13.7%) |
| 50 to 54 Years | 52 (6.5%) | 78 (11.9%) |
| 55 to 59 Years | 103 (12.8%) | 19 (2.9%) |
| 60 to 64 Years | 27 (3.4%) | 49 (7.5%) |
| 65 to 69 Years | 49 (6.1%) | 96 (14.6%) |
| 70 to 74 Years | 55 (6.8%) | 12 (1.8%) |
| 75 to 79 Years | 26 (3.2%) | 25 (3.8%) |
| 80 to 84 Years | 0 (0.0%) | 14 (2.1%) |
| 85 Years and over | 0 (0.0%) | 45 (6.9%) |
| Total | 806 (100.0%) | 657 (100.0%) |
Families and Households in Hudson
Median Family Size in Hudson
The median family size in Hudson is 2.48 persons per family, with single female/mother families (60 | 16.7%) accounting for the largest median family size of 3.17 persons per family. On the other hand, single male/father families (65 | 18.1%) represent the smallest median family size with 1.98 persons per family.
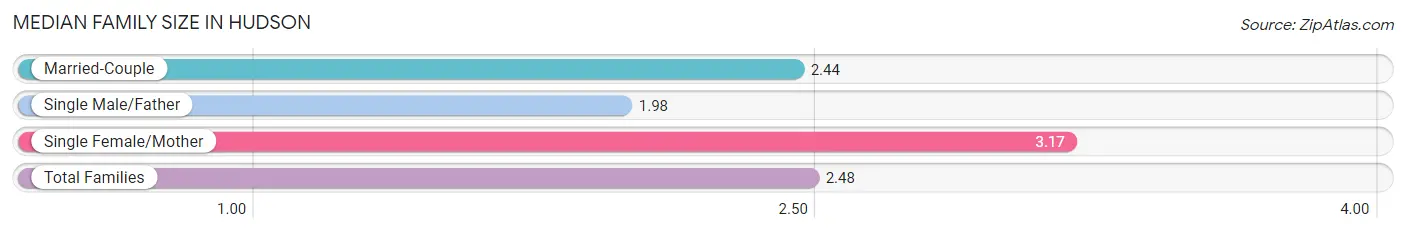
| Family Type | # Families | Family Size |
| Married-Couple | 234 (65.2%) | 2.44 |
| Single Male/Father | 65 (18.1%) | 1.98 |
| Single Female/Mother | 60 (16.7%) | 3.17 |
| Total Families | 359 (100.0%) | 2.48 |
Median Household Size in Hudson
The median household size in Hudson is 1.81 persons per household, with single female/mother households (60 | 7.4%) accounting for the largest median household size of 3.17 persons per household. non-family households (446 | 55.4%) represent the smallest median household size with 1.21 persons per household.
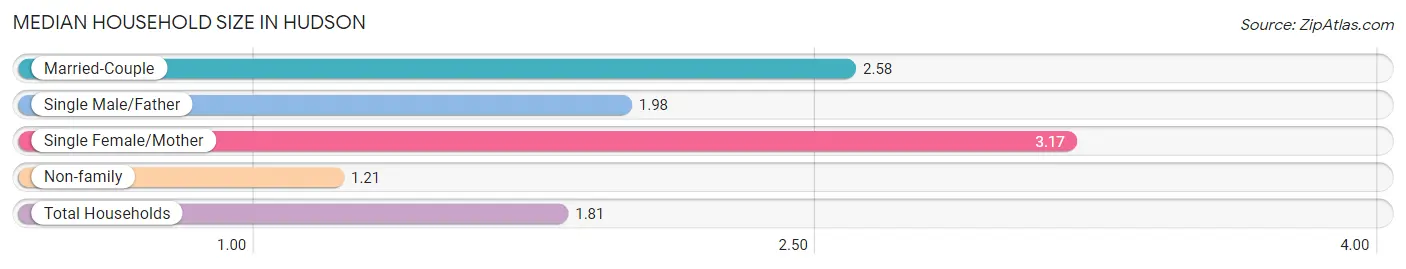
| Household Type | # Households | Household Size |
| Married-Couple | 234 (29.1%) | 2.58 |
| Single Male/Father | 65 (8.1%) | 1.98 |
| Single Female/Mother | 60 (7.4%) | 3.17 |
| Non-family | 446 (55.4%) | 1.21 |
| Total Households | 805 (100.0%) | 1.81 |
Household Size by Marriage Status in Hudson
Out of a total of 805 households in Hudson, 359 (44.6%) are family households, while 446 (55.4%) are nonfamily households. The most numerous type of family households are 2-person households, comprising 242, and the most common type of nonfamily households are 1-person households, comprising 357.
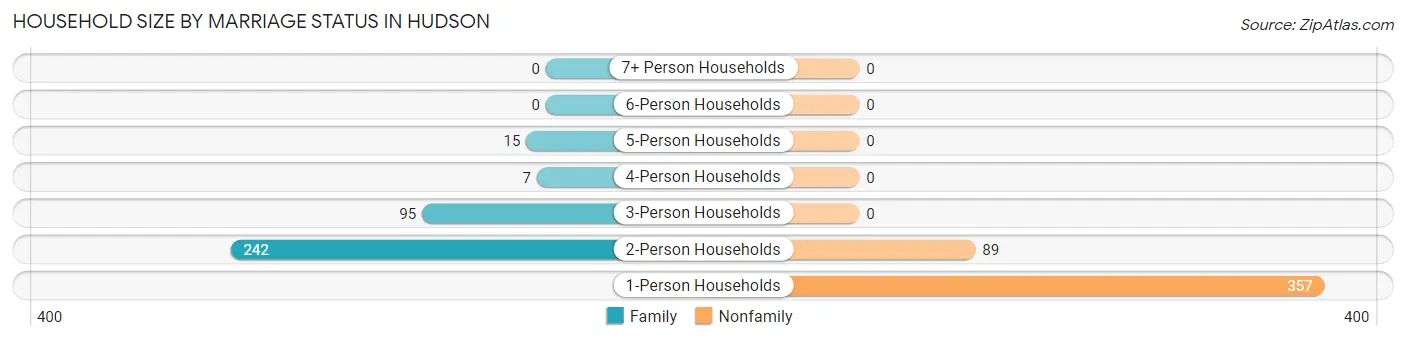
| Household Size | Family Households | Nonfamily Households |
| 1-Person Households | - | 357 (44.4%) |
| 2-Person Households | 242 (30.1%) | 89 (11.1%) |
| 3-Person Households | 95 (11.8%) | 0 (0.0%) |
| 4-Person Households | 7 (0.9%) | 0 (0.0%) |
| 5-Person Households | 15 (1.9%) | 0 (0.0%) |
| 6-Person Households | 0 (0.0%) | 0 (0.0%) |
| 7+ Person Households | 0 (0.0%) | 0 (0.0%) |
| Total | 359 (44.6%) | 446 (55.4%) |
Female Fertility in Hudson
Fertility by Age in Hudson
Average fertility rate in Hudson is 118.0 births per 1,000 women. Women in the age bracket of 20 to 34 years have the highest fertility rate with 450.0 births per 1,000 women. Women in the age bracket of 20 to 34 years acount for 100.0% of all women with births.
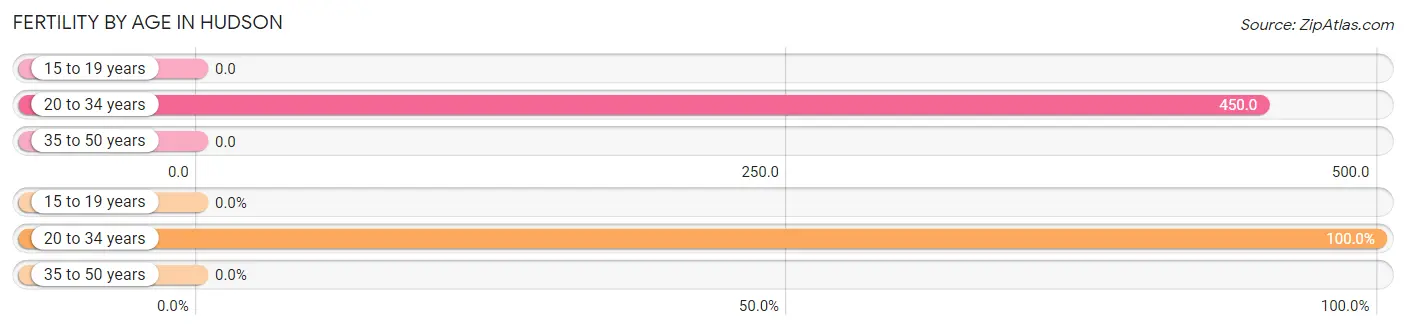
| Age Bracket | Women with Births | Births / 1,000 Women |
| 15 to 19 years | 0 (0.0%) | 0.0 |
| 20 to 34 years | 36 (100.0%) | 450.0 |
| 35 to 50 years | 0 (0.0%) | 0.0 |
| Total | 36 (100.0%) | 118.0 |
Fertility by Age by Marriage Status in Hudson
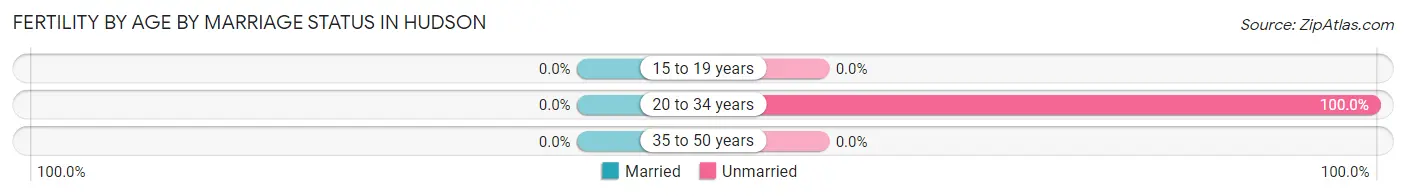
| Age Bracket | Married | Unmarried |
| 15 to 19 years | 0 (0.0%) | 0 (0.0%) |
| 20 to 34 years | 0 (0.0%) | 36 (100.0%) |
| 35 to 50 years | 0 (0.0%) | 0 (0.0%) |
| Total | 0 (0.0%) | 36 (100.0%) |
Fertility by Education in Hudson
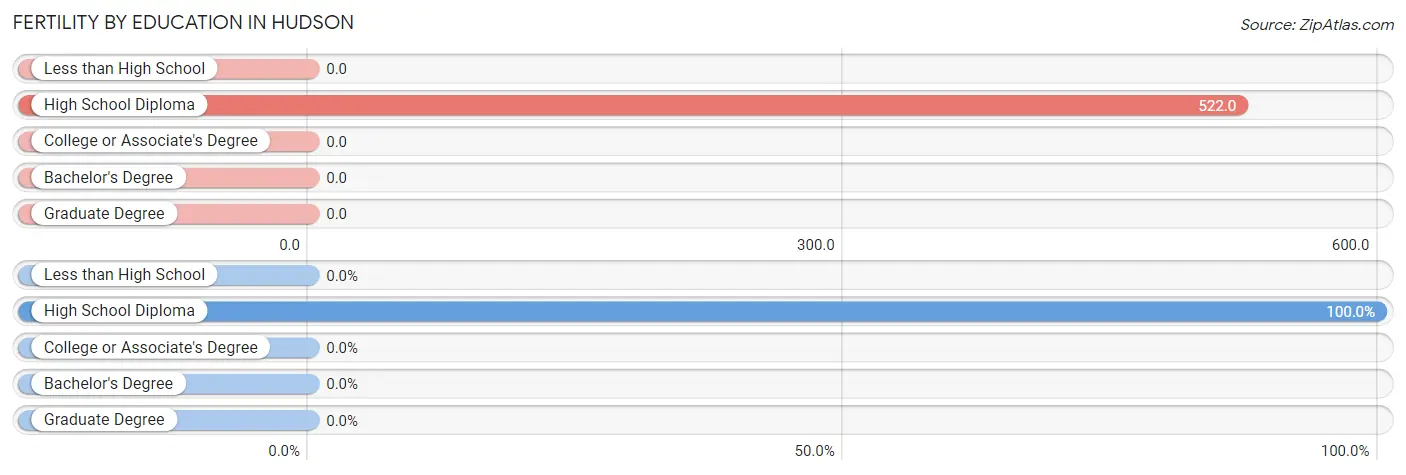
| Educational Attainment | Women with Births | Births / 1,000 Women |
| Less than High School | 0 (0.0%) | 0.0 |
| High School Diploma | 36 (100.0%) | 522.0 |
| College or Associate's Degree | 0 (0.0%) | 0.0 |
| Bachelor's Degree | 0 (0.0%) | 0.0 |
| Graduate Degree | 0 (0.0%) | 0.0 |
| Total | 36 (100.0%) | 118.0 |
Fertility by Education by Marriage Status in Hudson
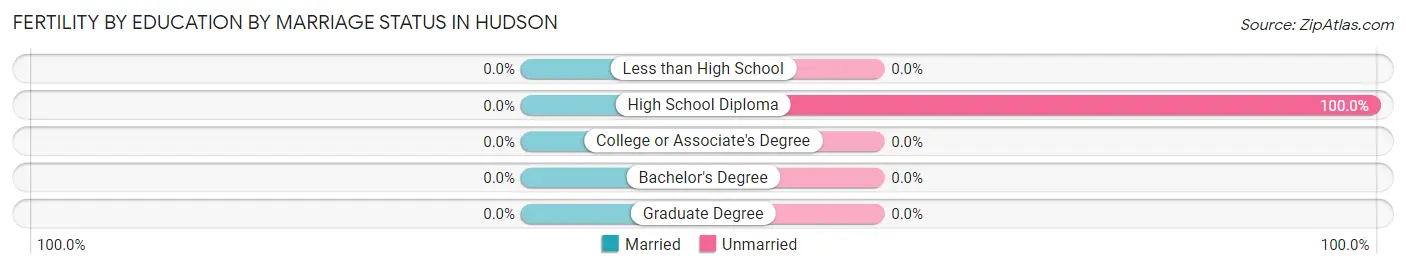
| Educational Attainment | Married | Unmarried |
| Less than High School | 0 (0.0%) | 0 (0.0%) |
| High School Diploma | 0 (0.0%) | 36 (100.0%) |
| College or Associate's Degree | 0 (0.0%) | 0 (0.0%) |
| Bachelor's Degree | 0 (0.0%) | 0 (0.0%) |
| Graduate Degree | 0 (0.0%) | 0 (0.0%) |
| Total | 0 (0.0%) | 36 (100.0%) |
Employment Characteristics in Hudson
Employment by Class of Employer in Hudson
Among the 784 employed individuals in Hudson, private company employees (347 | 44.3%), federal government employees (198 | 25.3%), and not-for-profit organizations (94 | 12.0%) make up the most common classes of employment.
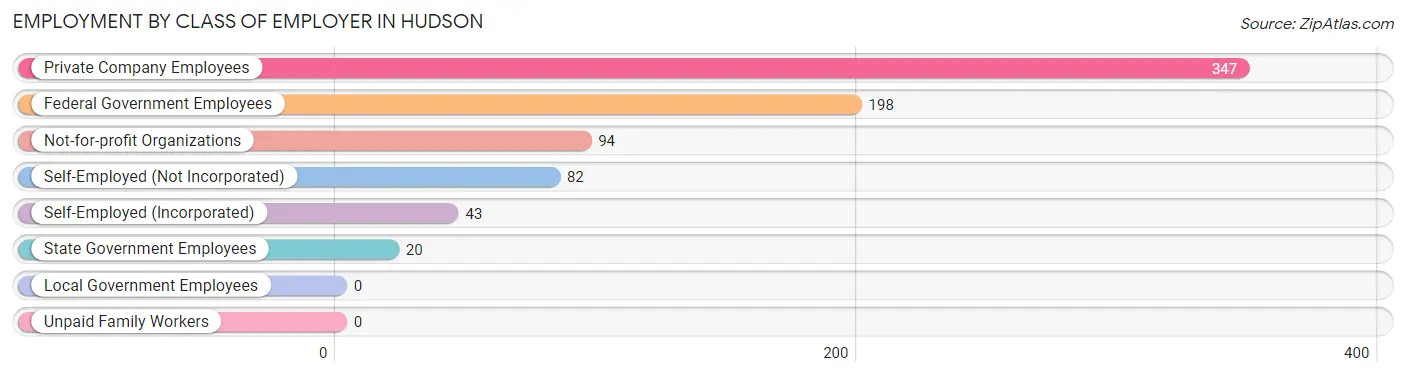
| Employer Class | # Employees | % Employees |
| Private Company Employees | 347 | 44.3% |
| Self-Employed (Incorporated) | 43 | 5.5% |
| Self-Employed (Not Incorporated) | 82 | 10.5% |
| Not-for-profit Organizations | 94 | 12.0% |
| Local Government Employees | 0 | 0.0% |
| State Government Employees | 20 | 2.5% |
| Federal Government Employees | 198 | 25.3% |
| Unpaid Family Workers | 0 | 0.0% |
| Total | 784 | 100.0% |
Employment Status by Age in Hudson
According to the labor force statistics for Hudson, out of the total population over 16 years of age (1,216), 66.4% or 807 individuals are in the labor force, with 2.9% or 23 of them unemployed. The age group with the highest labor force participation rate is 16 to 19 years, with 100.0% or 2 individuals in the labor force. Within the labor force, the 55 to 59 years age range has the highest percentage of unemployed individuals, with 55.6% or 15 of them being unemployed.
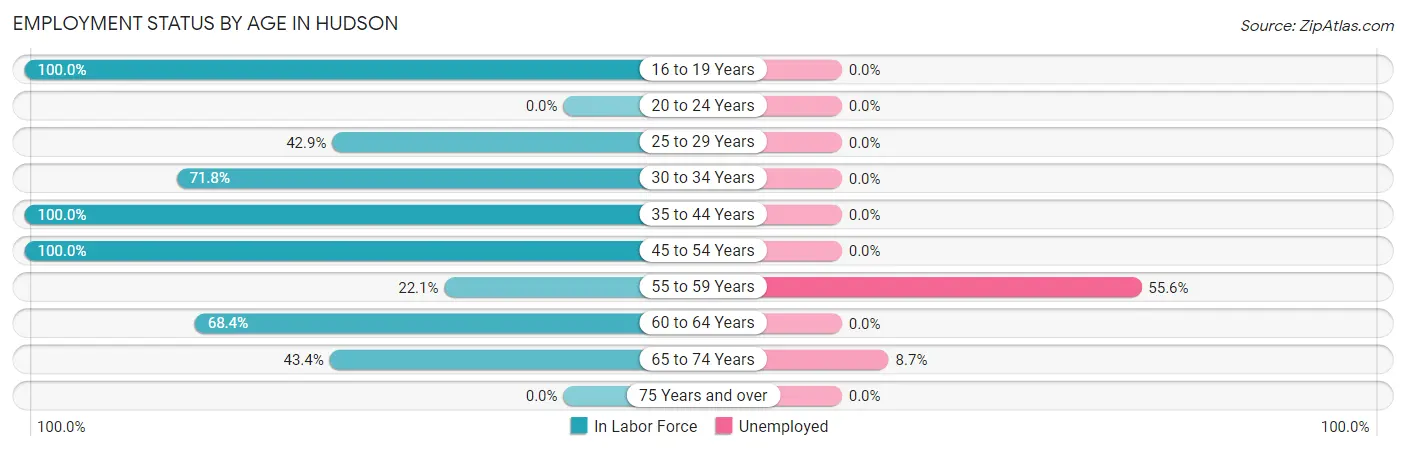
| Age Bracket | In Labor Force | Unemployed |
| 16 to 19 Years | 2 (100.0%) | 0 (0.0%) |
| 20 to 24 Years | 0 (0.0%) | 0 (0.0%) |
| 25 to 29 Years | 27 (42.9%) | 0 (0.0%) |
| 30 to 34 Years | 61 (71.8%) | 0 (0.0%) |
| 35 to 44 Years | 325 (100.0%) | 0 (0.0%) |
| 45 to 54 Years | 221 (100.0%) | 0 (0.0%) |
| 55 to 59 Years | 27 (22.1%) | 15 (55.6%) |
| 60 to 64 Years | 52 (68.4%) | 0 (0.0%) |
| 65 to 74 Years | 92 (43.4%) | 8 (8.7%) |
| 75 Years and over | 0 (0.0%) | 0 (0.0%) |
| Total | 807 (66.4%) | 23 (2.9%) |
Employment Status by Educational Attainment in Hudson
According to labor force statistics for Hudson, 79.9% of individuals (713) out of the total population between 25 and 64 years of age (892) are in the labor force, with 2.1% or 15 of them being unemployed. The group with the highest labor force participation rate are those with the educational attainment of college / associate degree, with 100.0% or 326 individuals in the labor force. Within the labor force, individuals with bachelor's degree or higher education have the highest percentage of unemployment, with 8.5% or 15 of them being unemployed.
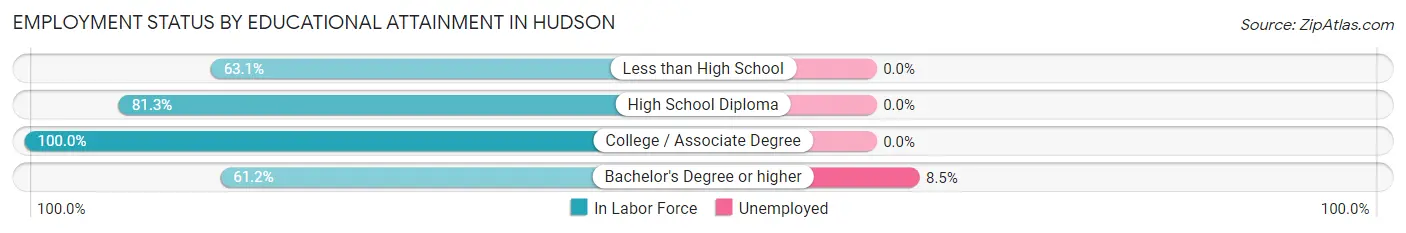
| Educational Attainment | In Labor Force | Unemployed |
| Less than High School | 53 (63.1%) | 0 (0.0%) |
| High School Diploma | 157 (81.3%) | 0 (0.0%) |
| College / Associate Degree | 326 (100.0%) | 0 (0.0%) |
| Bachelor's Degree or higher | 177 (61.2%) | 25 (8.5%) |
| Total | 713 (79.9%) | 19 (2.1%) |
Employment Occupations by Sex in Hudson
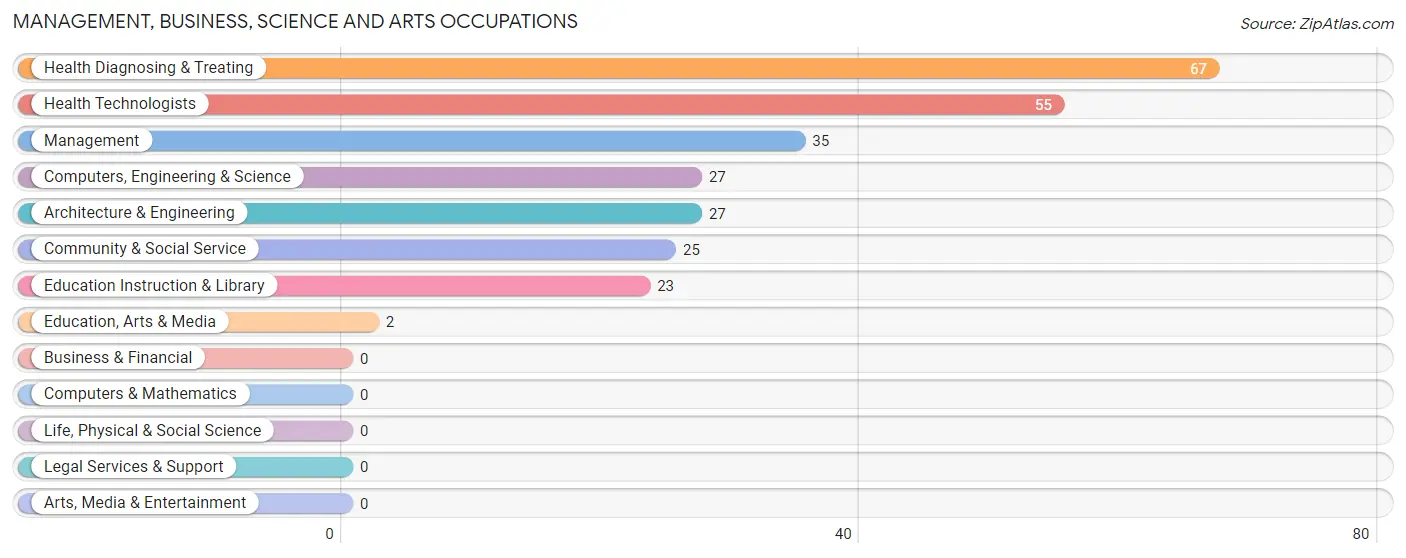
Management, Business, Science and Arts Occupations
The most common Management, Business, Science and Arts occupations in Hudson are Health Diagnosing & Treating (67 | 8.6%), Health Technologists (55 | 7.0%), Management (35 | 4.5%), Computers, Engineering & Science (27 | 3.4%), and Architecture & Engineering (27 | 3.4%).
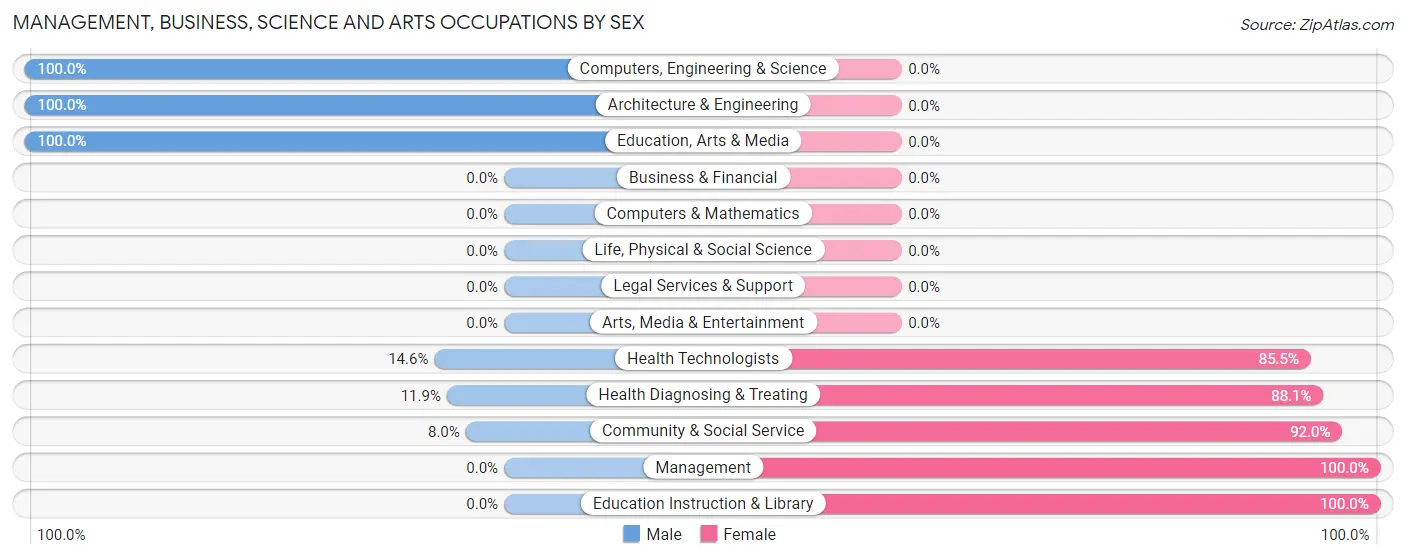
Management, Business, Science and Arts Occupations by Sex
Within the Management, Business, Science and Arts occupations in Hudson, the most male-oriented occupations are Computers, Engineering & Science (100.0%), Architecture & Engineering (100.0%), and Education, Arts & Media (100.0%), while the most female-oriented occupations are Management (100.0%), Education Instruction & Library (100.0%), and Community & Social Service (92.0%).
| Occupation | Male | Female |
| Management | 0 (0.0%) | 35 (100.0%) |
| Business & Financial | 0 (0.0%) | 0 (0.0%) |
| Computers, Engineering & Science | 27 (100.0%) | 0 (0.0%) |
| Computers & Mathematics | 0 (0.0%) | 0 (0.0%) |
| Architecture & Engineering | 27 (100.0%) | 0 (0.0%) |
| Life, Physical & Social Science | 0 (0.0%) | 0 (0.0%) |
| Community & Social Service | 2 (8.0%) | 23 (92.0%) |
| Education, Arts & Media | 2 (100.0%) | 0 (0.0%) |
| Legal Services & Support | 0 (0.0%) | 0 (0.0%) |
| Education Instruction & Library | 0 (0.0%) | 23 (100.0%) |
| Arts, Media & Entertainment | 0 (0.0%) | 0 (0.0%) |
| Health Diagnosing & Treating | 8 (11.9%) | 59 (88.1%) |
| Health Technologists | 8 (14.5%) | 47 (85.5%) |
| Total (Category) | 37 (24.0%) | 117 (76.0%) |
| Total (Overall) | 442 (56.4%) | 342 (43.6%) |
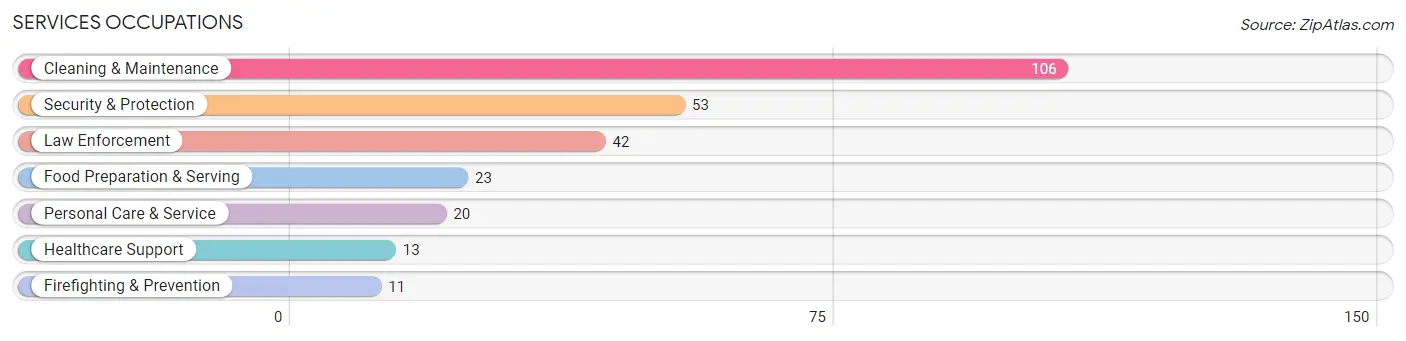
Services Occupations
The most common Services occupations in Hudson are Cleaning & Maintenance (106 | 13.5%), Security & Protection (53 | 6.8%), Law Enforcement (42 | 5.4%), Food Preparation & Serving (23 | 2.9%), and Personal Care & Service (20 | 2.5%).
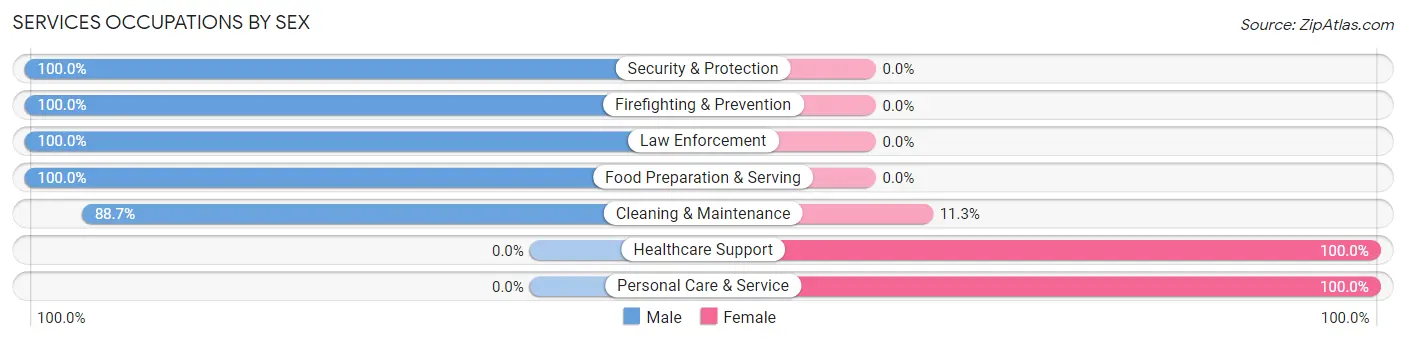
Services Occupations by Sex
Within the Services occupations in Hudson, the most male-oriented occupations are Security & Protection (100.0%), Firefighting & Prevention (100.0%), and Law Enforcement (100.0%), while the most female-oriented occupations are Healthcare Support (100.0%), Personal Care & Service (100.0%), and Cleaning & Maintenance (11.3%).
| Occupation | Male | Female |
| Healthcare Support | 0 (0.0%) | 13 (100.0%) |
| Security & Protection | 53 (100.0%) | 0 (0.0%) |
| Firefighting & Prevention | 11 (100.0%) | 0 (0.0%) |
| Law Enforcement | 42 (100.0%) | 0 (0.0%) |
| Food Preparation & Serving | 23 (100.0%) | 0 (0.0%) |
| Cleaning & Maintenance | 94 (88.7%) | 12 (11.3%) |
| Personal Care & Service | 0 (0.0%) | 20 (100.0%) |
| Total (Category) | 170 (79.1%) | 45 (20.9%) |
| Total (Overall) | 442 (56.4%) | 342 (43.6%) |
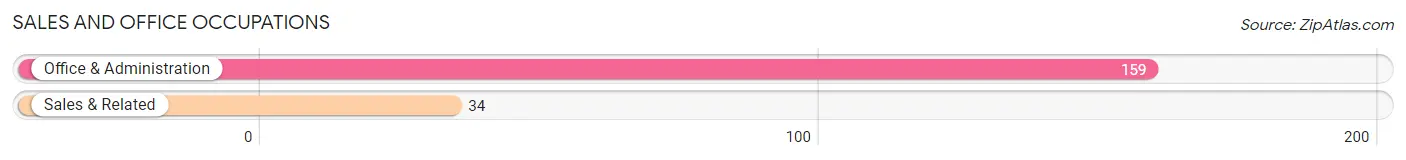
Sales and Office Occupations
The most common Sales and Office occupations in Hudson are Office & Administration (159 | 20.3%), and Sales & Related (34 | 4.3%).
Sales and Office Occupations by Sex
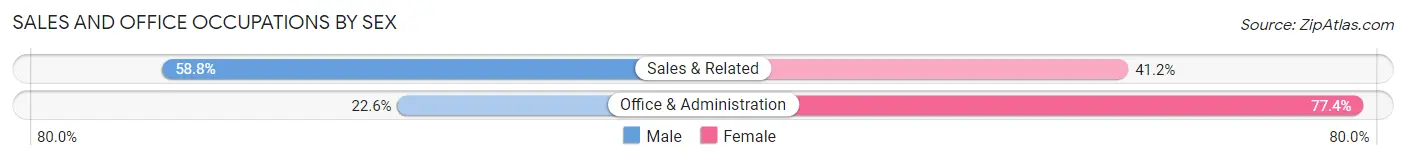
| Occupation | Male | Female |
| Sales & Related | 20 (58.8%) | 14 (41.2%) |
| Office & Administration | 36 (22.6%) | 123 (77.4%) |
| Total (Category) | 56 (29.0%) | 137 (71.0%) |
| Total (Overall) | 442 (56.4%) | 342 (43.6%) |
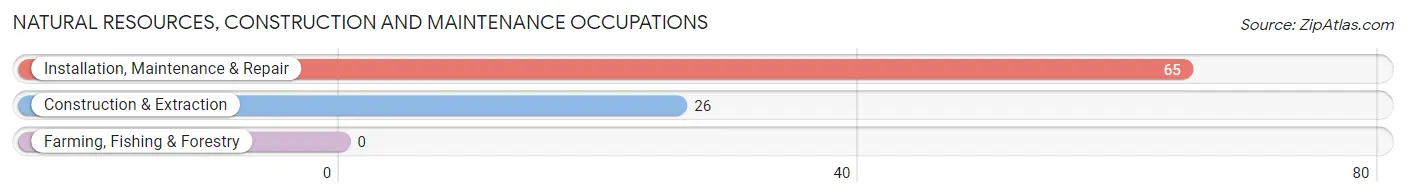
Natural Resources, Construction and Maintenance Occupations
The most common Natural Resources, Construction and Maintenance occupations in Hudson are Installation, Maintenance & Repair (65 | 8.3%), and Construction & Extraction (26 | 3.3%).
Natural Resources, Construction and Maintenance Occupations by Sex
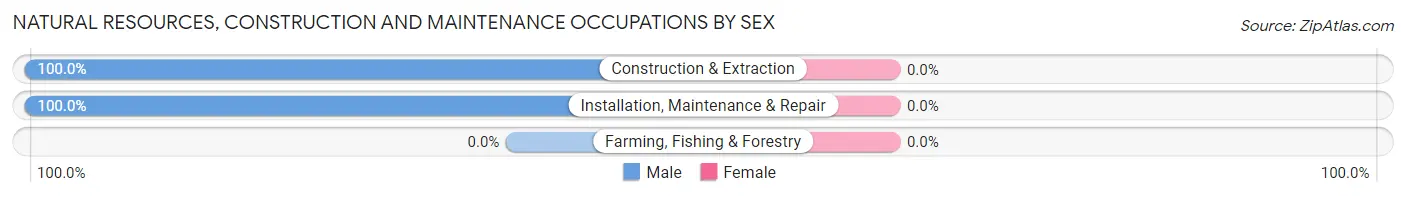
| Occupation | Male | Female |
| Farming, Fishing & Forestry | 0 (0.0%) | 0 (0.0%) |
| Construction & Extraction | 26 (100.0%) | 0 (0.0%) |
| Installation, Maintenance & Repair | 65 (100.0%) | 0 (0.0%) |
| Total (Category) | 91 (100.0%) | 0 (0.0%) |
| Total (Overall) | 442 (56.4%) | 342 (43.6%) |
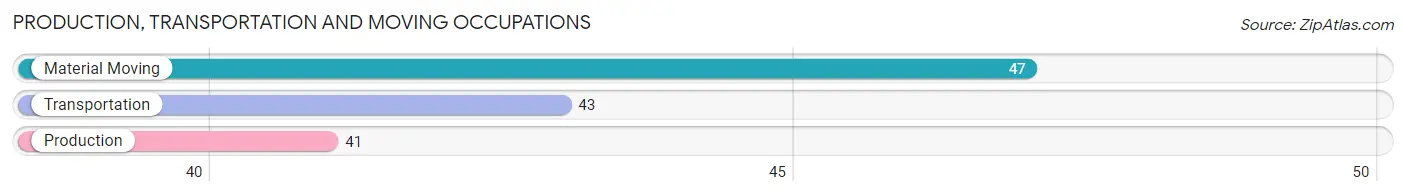
Production, Transportation and Moving Occupations
The most common Production, Transportation and Moving occupations in Hudson are Material Moving (47 | 6.0%), Transportation (43 | 5.5%), and Production (41 | 5.2%).
Production, Transportation and Moving Occupations by Sex
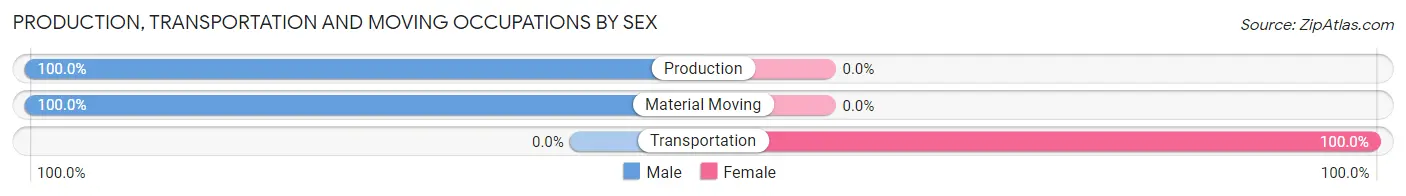
| Occupation | Male | Female |
| Production | 41 (100.0%) | 0 (0.0%) |
| Transportation | 0 (0.0%) | 43 (100.0%) |
| Material Moving | 47 (100.0%) | 0 (0.0%) |
| Total (Category) | 88 (67.2%) | 43 (32.8%) |
| Total (Overall) | 442 (56.4%) | 342 (43.6%) |
Employment Industries by Sex in Hudson
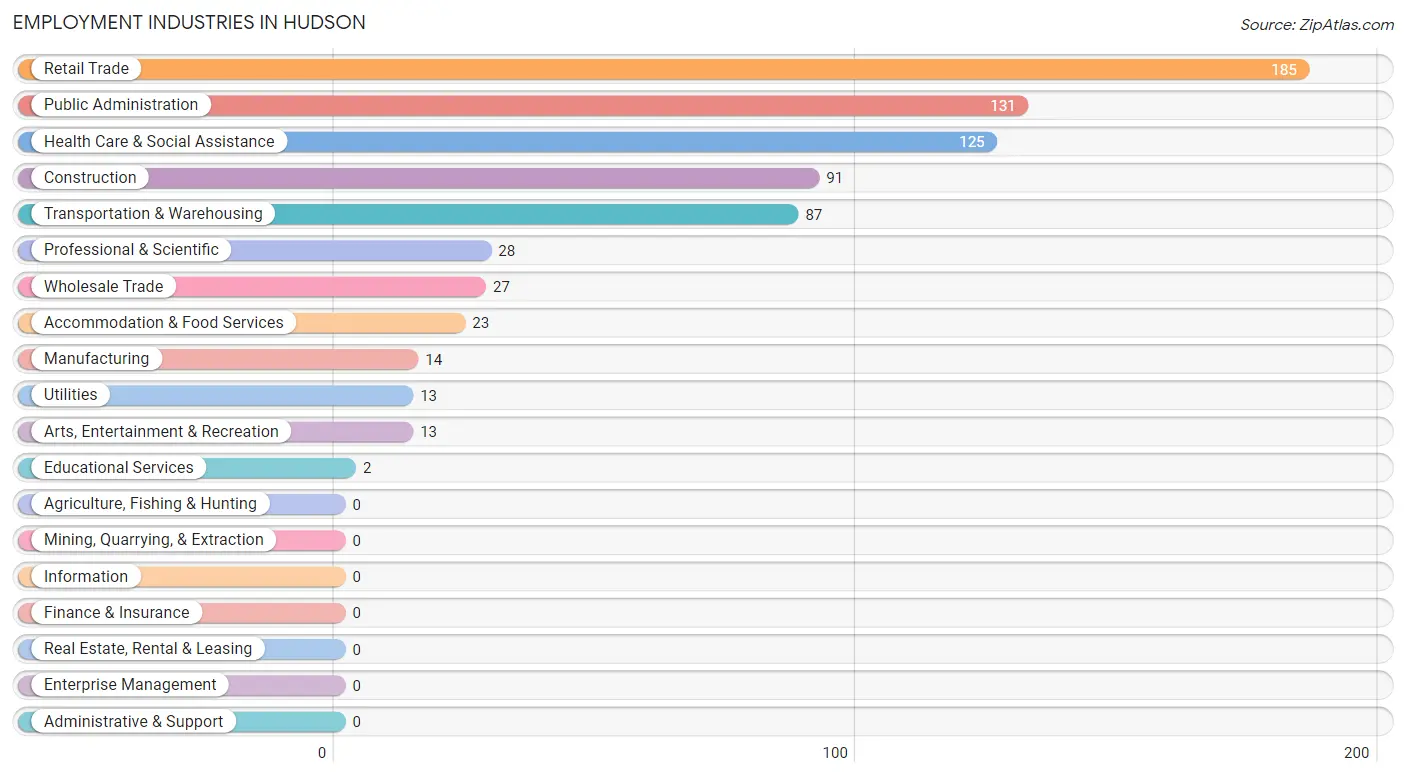
Employment Industries in Hudson
The major employment industries in Hudson include Retail Trade (185 | 23.6%), Public Administration (131 | 16.7%), Health Care & Social Assistance (125 | 15.9%), Construction (91 | 11.6%), and Transportation & Warehousing (87 | 11.1%).
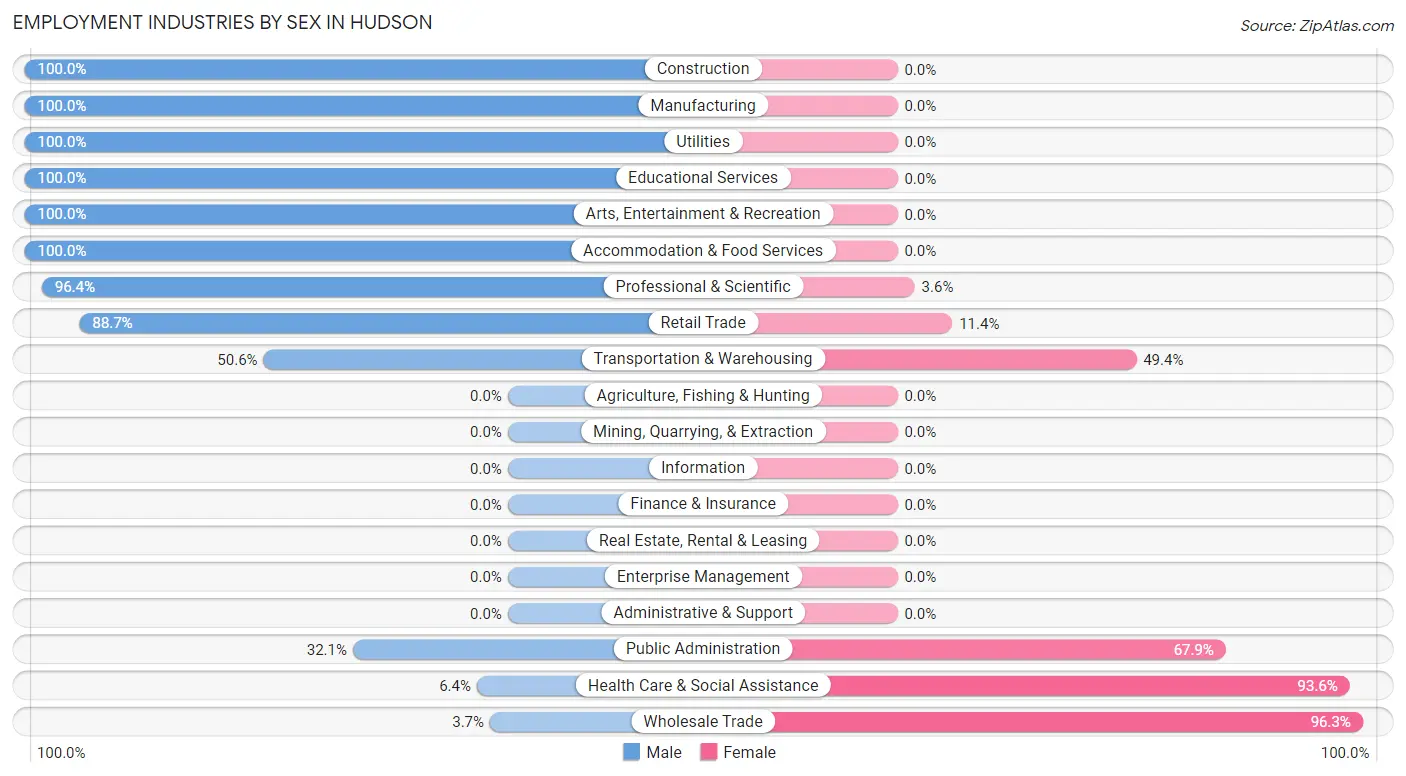
Employment Industries by Sex in Hudson
The Hudson industries that see more men than women are Construction (100.0%), Manufacturing (100.0%), and Utilities (100.0%), whereas the industries that tend to have a higher number of women are Wholesale Trade (96.3%), Health Care & Social Assistance (93.6%), and Public Administration (67.9%).
| Industry | Male | Female |
| Agriculture, Fishing & Hunting | 0 (0.0%) | 0 (0.0%) |
| Mining, Quarrying, & Extraction | 0 (0.0%) | 0 (0.0%) |
| Construction | 91 (100.0%) | 0 (0.0%) |
| Manufacturing | 14 (100.0%) | 0 (0.0%) |
| Wholesale Trade | 1 (3.7%) | 26 (96.3%) |
| Retail Trade | 164 (88.6%) | 21 (11.4%) |
| Transportation & Warehousing | 44 (50.6%) | 43 (49.4%) |
| Utilities | 13 (100.0%) | 0 (0.0%) |
| Information | 0 (0.0%) | 0 (0.0%) |
| Finance & Insurance | 0 (0.0%) | 0 (0.0%) |
| Real Estate, Rental & Leasing | 0 (0.0%) | 0 (0.0%) |
| Professional & Scientific | 27 (96.4%) | 1 (3.6%) |
| Enterprise Management | 0 (0.0%) | 0 (0.0%) |
| Administrative & Support | 0 (0.0%) | 0 (0.0%) |
| Educational Services | 2 (100.0%) | 0 (0.0%) |
| Health Care & Social Assistance | 8 (6.4%) | 117 (93.6%) |
| Arts, Entertainment & Recreation | 13 (100.0%) | 0 (0.0%) |
| Accommodation & Food Services | 23 (100.0%) | 0 (0.0%) |
| Public Administration | 42 (32.1%) | 89 (67.9%) |
| Total | 442 (56.4%) | 342 (43.6%) |
Education in Hudson
School Enrollment in Hudson
The most common levels of schooling among the 197 students in Hudson are middle school (66 | 33.5%), kindergarten (62 | 31.5%), and college / undergraduate (36 | 18.3%).
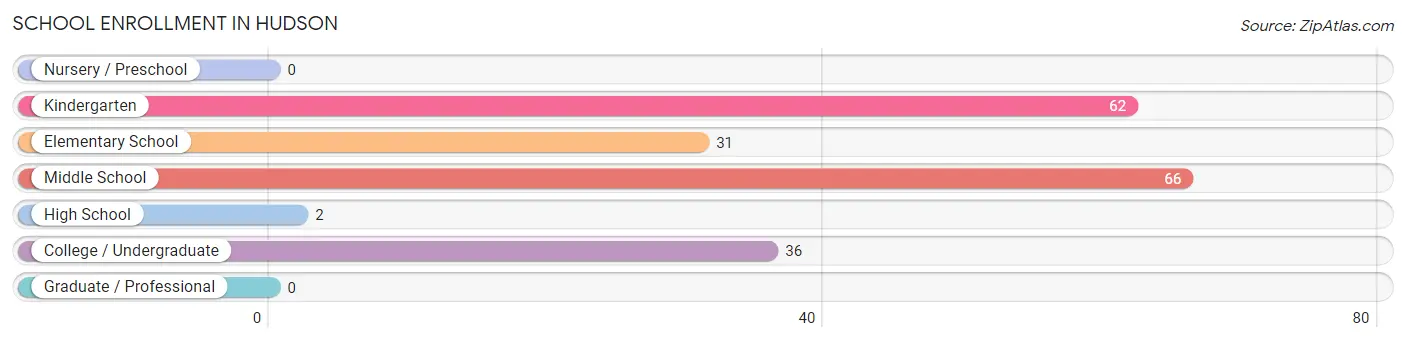
| School Level | # Students | % Students |
| Nursery / Preschool | 0 | 0.0% |
| Kindergarten | 62 | 31.5% |
| Elementary School | 31 | 15.7% |
| Middle School | 66 | 33.5% |
| High School | 2 | 1.0% |
| College / Undergraduate | 36 | 18.3% |
| Graduate / Professional | 0 | 0.0% |
| Total | 197 | 100.0% |
School Enrollment by Age by Funding Source in Hudson
Out of a total of 197 students who are enrolled in schools in Hudson, 69 (35.0%) attend a private institution, while the remaining 128 (65.0%) are enrolled in public schools. The age group of 10 to 14 year olds has the highest likelihood of being enrolled in private schools, with 67 (100.0% in the age bracket) enrolled. Conversely, the age group of 5 to 9 year old has the lowest likelihood of being enrolled in a private school, with 92 (100.0% in the age bracket) attending a public institution.
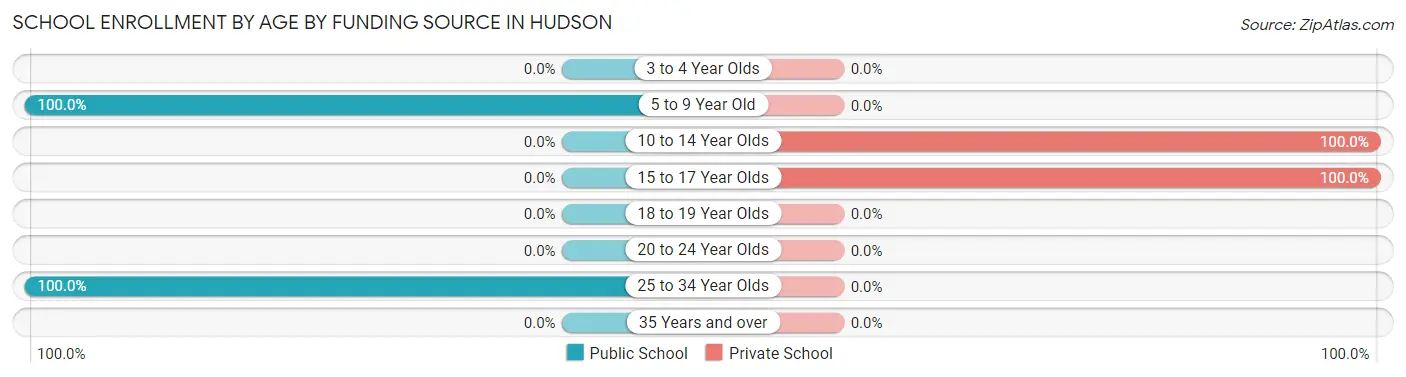
| Age Bracket | Public School | Private School |
| 3 to 4 Year Olds | 0 (0.0%) | 0 (0.0%) |
| 5 to 9 Year Old | 92 (100.0%) | 0 (0.0%) |
| 10 to 14 Year Olds | 0 (0.0%) | 67 (100.0%) |
| 15 to 17 Year Olds | 0 (0.0%) | 2 (100.0%) |
| 18 to 19 Year Olds | 0 (0.0%) | 0 (0.0%) |
| 20 to 24 Year Olds | 0 (0.0%) | 0 (0.0%) |
| 25 to 34 Year Olds | 36 (100.0%) | 0 (0.0%) |
| 35 Years and over | 0 (0.0%) | 0 (0.0%) |
| Total | 128 (65.0%) | 69 (35.0%) |
Educational Attainment by Field of Study in Hudson
Science & technology (123 | 32.1%), bio, nature & agricultural (88 | 23.0%), business (74 | 19.3%), engineering (51 | 13.3%), and physical & health sciences (43 | 11.2%) are the most common fields of study among 383 individuals in Hudson who have obtained a bachelor's degree or higher.
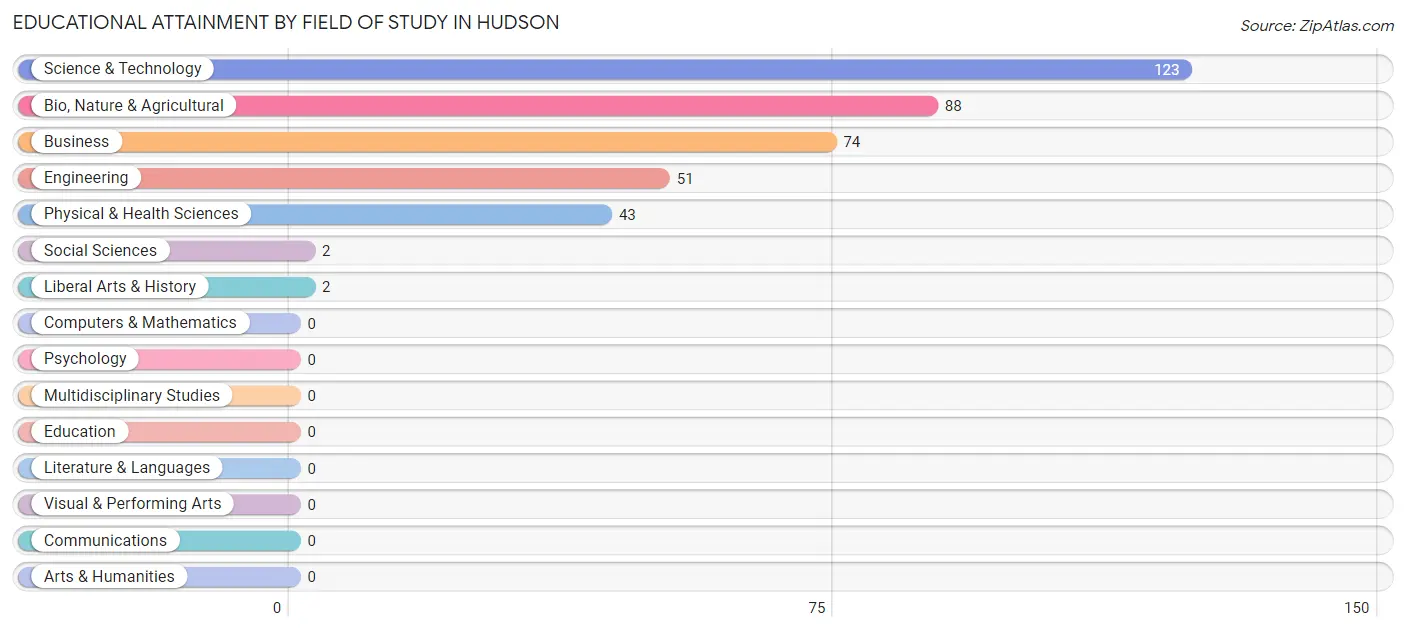
| Field of Study | # Graduates | % Graduates |
| Computers & Mathematics | 0 | 0.0% |
| Bio, Nature & Agricultural | 88 | 23.0% |
| Physical & Health Sciences | 43 | 11.2% |
| Psychology | 0 | 0.0% |
| Social Sciences | 2 | 0.5% |
| Engineering | 51 | 13.3% |
| Multidisciplinary Studies | 0 | 0.0% |
| Science & Technology | 123 | 32.1% |
| Business | 74 | 19.3% |
| Education | 0 | 0.0% |
| Literature & Languages | 0 | 0.0% |
| Liberal Arts & History | 2 | 0.5% |
| Visual & Performing Arts | 0 | 0.0% |
| Communications | 0 | 0.0% |
| Arts & Humanities | 0 | 0.0% |
| Total | 383 | 100.0% |
Transportation & Commute in Hudson
Vehicle Availability by Sex in Hudson
The most prevalent vehicle ownership categories in Hudson are males with 2 vehicles (215, accounting for 48.9%) and females with 2 vehicles (251, making up 62.9%).
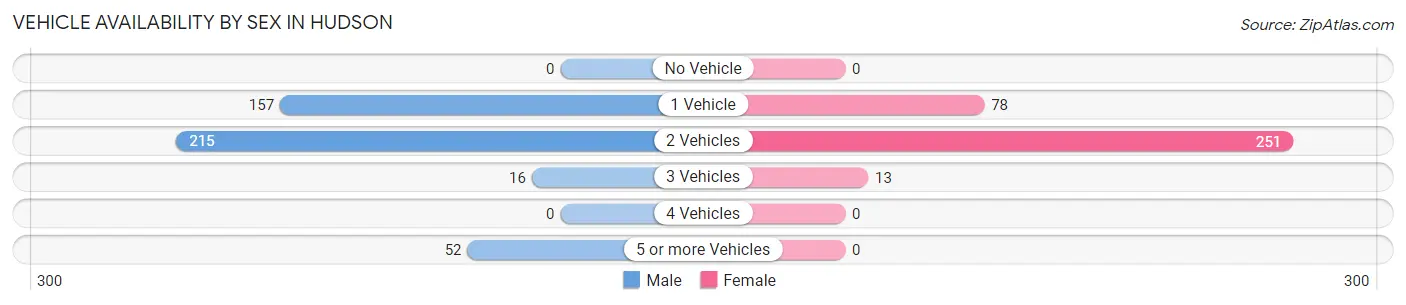
| Vehicles Available | Male | Female |
| No Vehicle | 0 (0.0%) | 0 (0.0%) |
| 1 Vehicle | 157 (35.7%) | 78 (22.8%) |
| 2 Vehicles | 215 (48.9%) | 251 (73.4%) |
| 3 Vehicles | 16 (3.6%) | 13 (3.8%) |
| 4 Vehicles | 0 (0.0%) | 0 (0.0%) |
| 5 or more Vehicles | 52 (11.8%) | 0 (0.0%) |
| Total | 440 (100.0%) | 342 (100.0%) |
Commute Time in Hudson
The most frequently occuring commute durations in Hudson are 15 to 19 minutes (129 commuters, 19.8%), 10 to 14 minutes (122 commuters, 18.7%), and 20 to 24 minutes (81 commuters, 12.4%).
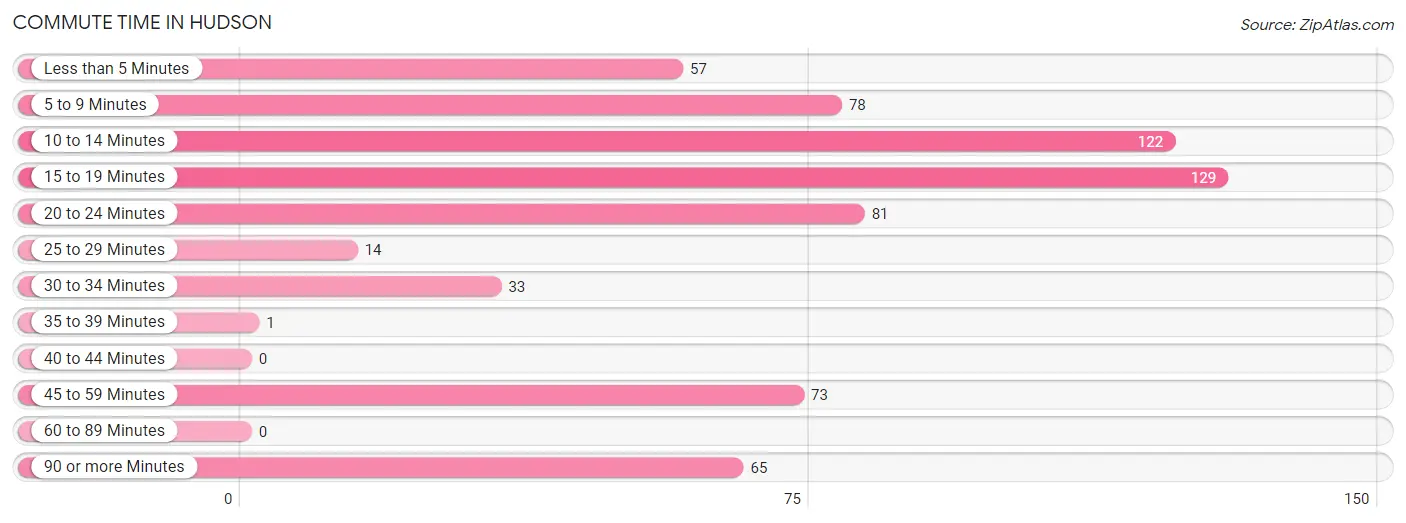
| Commute Time | # Commuters | % Commuters |
| Less than 5 Minutes | 57 | 8.7% |
| 5 to 9 Minutes | 78 | 11.9% |
| 10 to 14 Minutes | 122 | 18.7% |
| 15 to 19 Minutes | 129 | 19.8% |
| 20 to 24 Minutes | 81 | 12.4% |
| 25 to 29 Minutes | 14 | 2.1% |
| 30 to 34 Minutes | 33 | 5.1% |
| 35 to 39 Minutes | 1 | 0.2% |
| 40 to 44 Minutes | 0 | 0.0% |
| 45 to 59 Minutes | 73 | 11.2% |
| 60 to 89 Minutes | 0 | 0.0% |
| 90 or more Minutes | 65 | 10.0% |
Commute Time by Sex in Hudson
The most common commute times in Hudson are 15 to 19 minutes (104 commuters, 23.6%) for males and 5 to 9 minutes (58 commuters, 27.2%) for females.
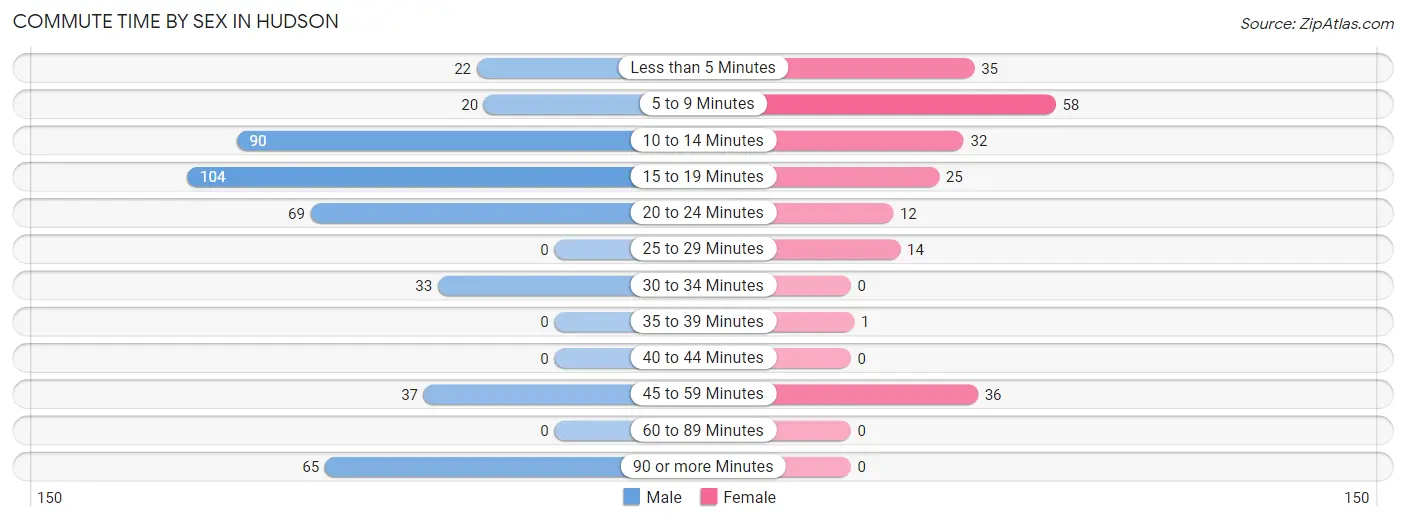
| Commute Time | Male | Female |
| Less than 5 Minutes | 22 (5.0%) | 35 (16.4%) |
| 5 to 9 Minutes | 20 (4.5%) | 58 (27.2%) |
| 10 to 14 Minutes | 90 (20.4%) | 32 (15.0%) |
| 15 to 19 Minutes | 104 (23.6%) | 25 (11.7%) |
| 20 to 24 Minutes | 69 (15.7%) | 12 (5.6%) |
| 25 to 29 Minutes | 0 (0.0%) | 14 (6.6%) |
| 30 to 34 Minutes | 33 (7.5%) | 0 (0.0%) |
| 35 to 39 Minutes | 0 (0.0%) | 1 (0.5%) |
| 40 to 44 Minutes | 0 (0.0%) | 0 (0.0%) |
| 45 to 59 Minutes | 37 (8.4%) | 36 (16.9%) |
| 60 to 89 Minutes | 0 (0.0%) | 0 (0.0%) |
| 90 or more Minutes | 65 (14.8%) | 0 (0.0%) |
Time of Departure to Work by Sex in Hudson
The most frequent times of departure to work in Hudson are 7:00 AM to 7:29 AM (169, 38.4%) for males and 8:00 AM to 8:29 AM (62, 29.1%) for females.
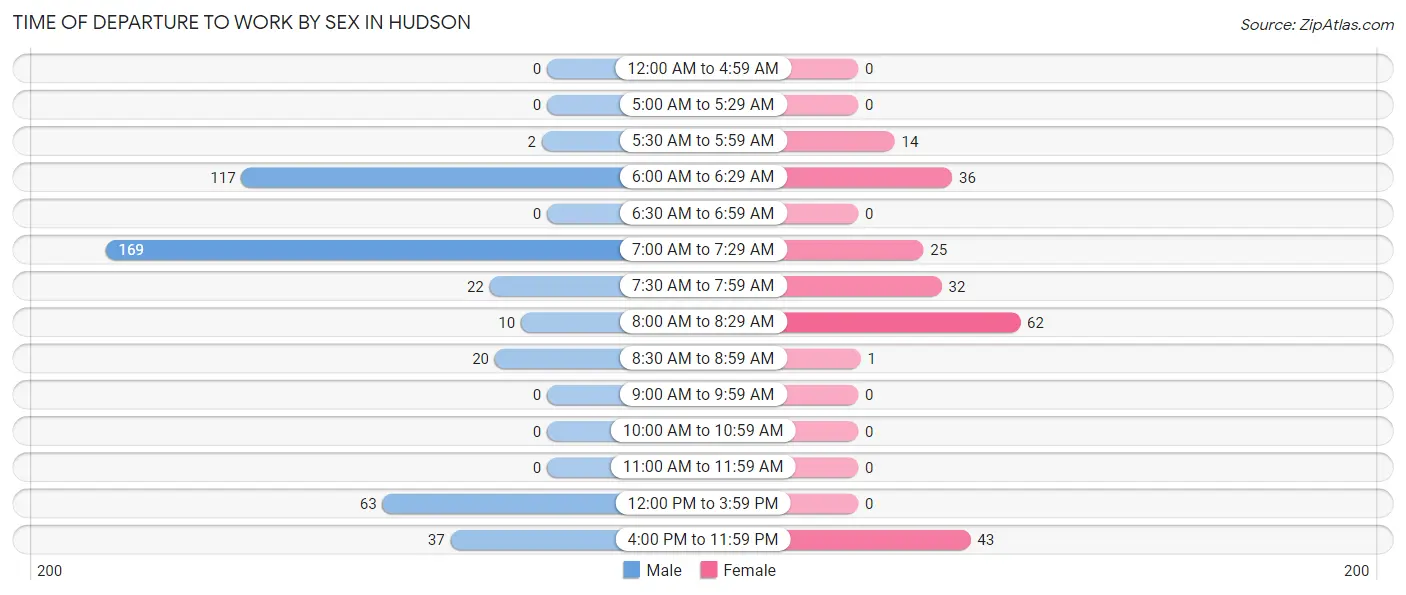
| Time of Departure | Male | Female |
| 12:00 AM to 4:59 AM | 0 (0.0%) | 0 (0.0%) |
| 5:00 AM to 5:29 AM | 0 (0.0%) | 0 (0.0%) |
| 5:30 AM to 5:59 AM | 2 (0.4%) | 14 (6.6%) |
| 6:00 AM to 6:29 AM | 117 (26.6%) | 36 (16.9%) |
| 6:30 AM to 6:59 AM | 0 (0.0%) | 0 (0.0%) |
| 7:00 AM to 7:29 AM | 169 (38.4%) | 25 (11.7%) |
| 7:30 AM to 7:59 AM | 22 (5.0%) | 32 (15.0%) |
| 8:00 AM to 8:29 AM | 10 (2.3%) | 62 (29.1%) |
| 8:30 AM to 8:59 AM | 20 (4.5%) | 1 (0.5%) |
| 9:00 AM to 9:59 AM | 0 (0.0%) | 0 (0.0%) |
| 10:00 AM to 10:59 AM | 0 (0.0%) | 0 (0.0%) |
| 11:00 AM to 11:59 AM | 0 (0.0%) | 0 (0.0%) |
| 12:00 PM to 3:59 PM | 63 (14.3%) | 0 (0.0%) |
| 4:00 PM to 11:59 PM | 37 (8.4%) | 43 (20.2%) |
| Total | 440 (100.0%) | 213 (100.0%) |
Housing Occupancy in Hudson
Occupancy by Ownership in Hudson
Of the total 805 dwellings in Hudson, owner-occupied units account for 539 (67.0%), while renter-occupied units make up 266 (33.0%).
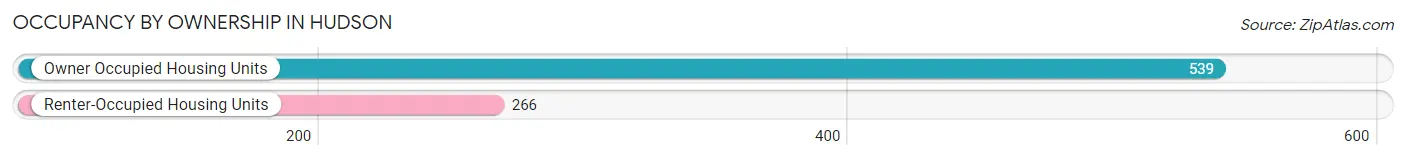
| Occupancy | # Housing Units | % Housing Units |
| Owner Occupied Housing Units | 539 | 67.0% |
| Renter-Occupied Housing Units | 266 | 33.0% |
| Total Occupied Housing Units | 805 | 100.0% |
Occupancy by Household Size in Hudson
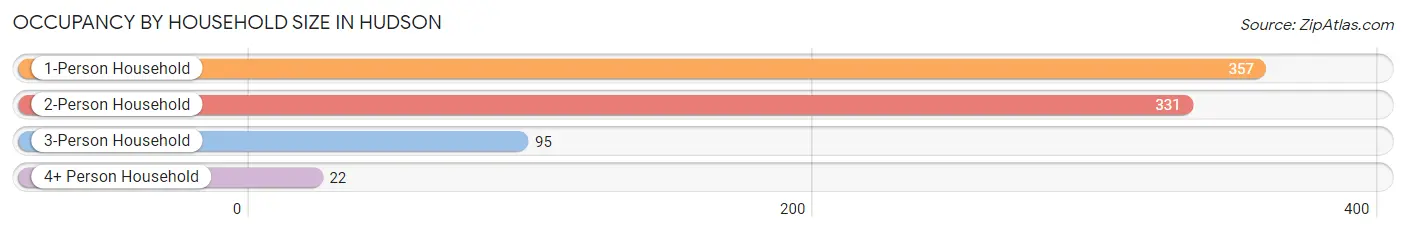
| Household Size | # Housing Units | % Housing Units |
| 1-Person Household | 357 | 44.4% |
| 2-Person Household | 331 | 41.1% |
| 3-Person Household | 95 | 11.8% |
| 4+ Person Household | 22 | 2.7% |
| Total Housing Units | 805 | 100.0% |
Occupancy by Ownership by Household Size in Hudson
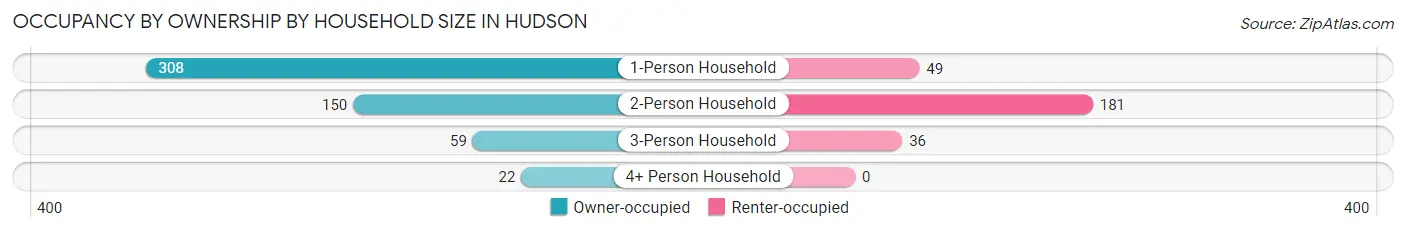
| Household Size | Owner-occupied | Renter-occupied |
| 1-Person Household | 308 (86.3%) | 49 (13.7%) |
| 2-Person Household | 150 (45.3%) | 181 (54.7%) |
| 3-Person Household | 59 (62.1%) | 36 (37.9%) |
| 4+ Person Household | 22 (100.0%) | 0 (0.0%) |
| Total Housing Units | 539 (67.0%) | 266 (33.0%) |
Occupancy by Educational Attainment in Hudson
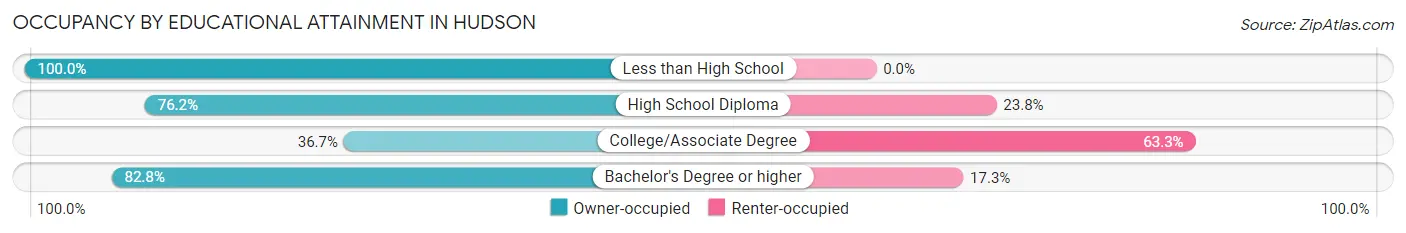
| Household Size | Owner-occupied | Renter-occupied |
| Less than High School | 84 (100.0%) | 0 (0.0%) |
| High School Diploma | 115 (76.2%) | 36 (23.8%) |
| College/Associate Degree | 105 (36.7%) | 181 (63.3%) |
| Bachelor's Degree or higher | 235 (82.8%) | 49 (17.2%) |
Occupancy by Age of Householder in Hudson
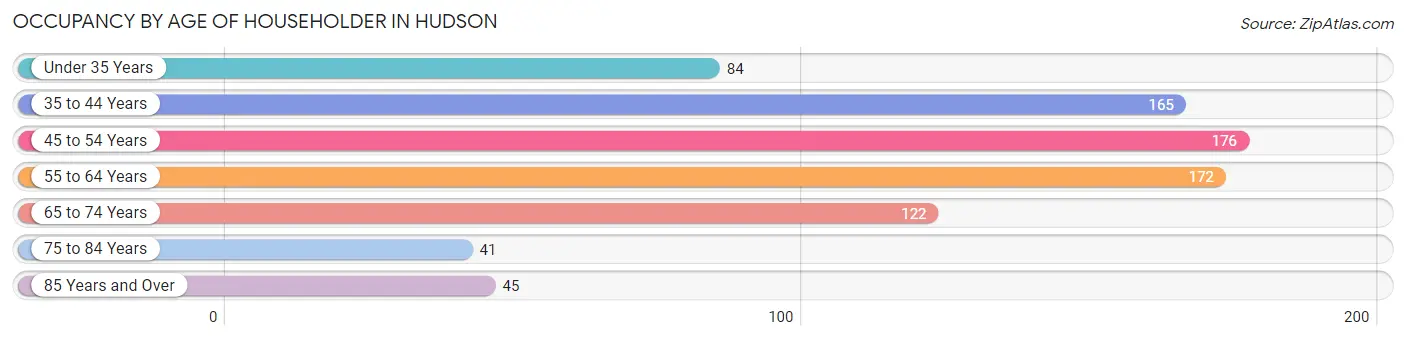
| Age Bracket | # Households | % Households |
| Under 35 Years | 84 | 10.4% |
| 35 to 44 Years | 165 | 20.5% |
| 45 to 54 Years | 176 | 21.9% |
| 55 to 64 Years | 172 | 21.4% |
| 65 to 74 Years | 122 | 15.2% |
| 75 to 84 Years | 41 | 5.1% |
| 85 Years and Over | 45 | 5.6% |
| Total | 805 | 100.0% |
Housing Finances in Hudson
Median Income by Occupancy in Hudson
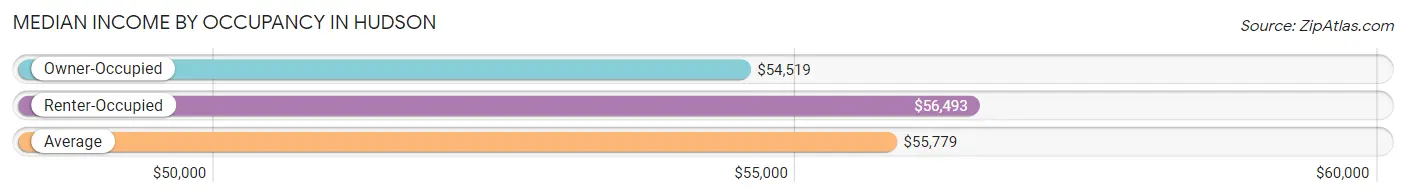
| Occupancy Type | # Households | Median Income |
| Owner-Occupied | 539 (67.0%) | $54,519 |
| Renter-Occupied | 266 (33.0%) | $56,493 |
| Average | 805 (100.0%) | $55,779 |
Occupancy by Householder Income Bracket in Hudson
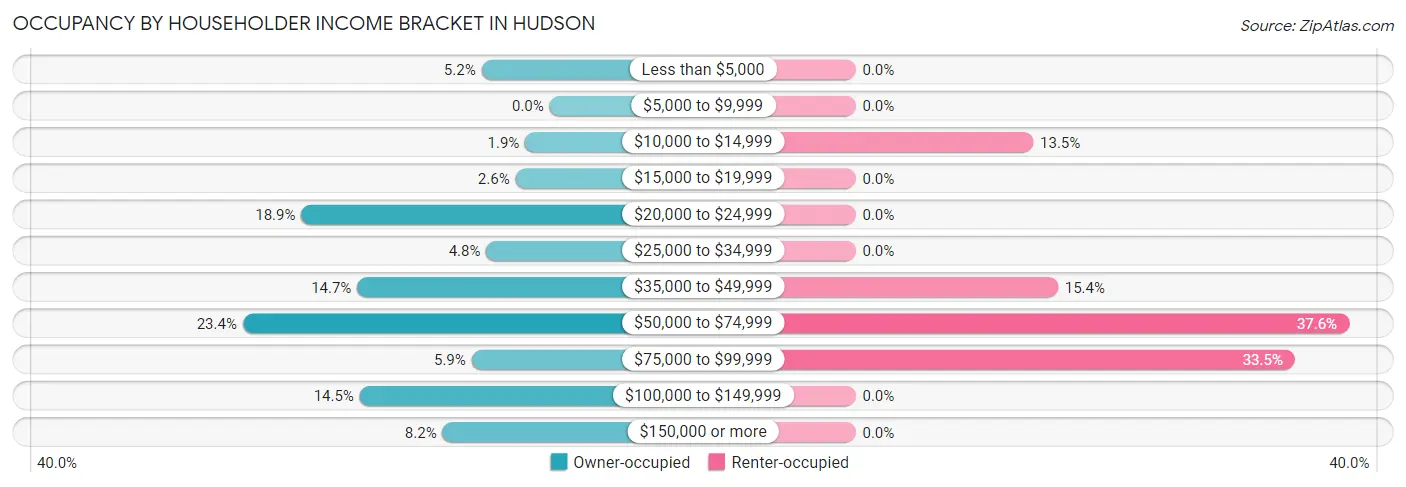
| Income Bracket | Owner-occupied | Renter-occupied |
| Less than $5,000 | 28 (5.2%) | 0 (0.0%) |
| $5,000 to $9,999 | 0 (0.0%) | 0 (0.0%) |
| $10,000 to $14,999 | 10 (1.9%) | 36 (13.5%) |
| $15,000 to $19,999 | 14 (2.6%) | 0 (0.0%) |
| $20,000 to $24,999 | 102 (18.9%) | 0 (0.0%) |
| $25,000 to $34,999 | 26 (4.8%) | 0 (0.0%) |
| $35,000 to $49,999 | 79 (14.7%) | 41 (15.4%) |
| $50,000 to $74,999 | 126 (23.4%) | 100 (37.6%) |
| $75,000 to $99,999 | 32 (5.9%) | 89 (33.5%) |
| $100,000 to $149,999 | 78 (14.5%) | 0 (0.0%) |
| $150,000 or more | 44 (8.2%) | 0 (0.0%) |
| Total | 539 (100.0%) | 266 (100.0%) |
Monthly Housing Cost Tiers in Hudson
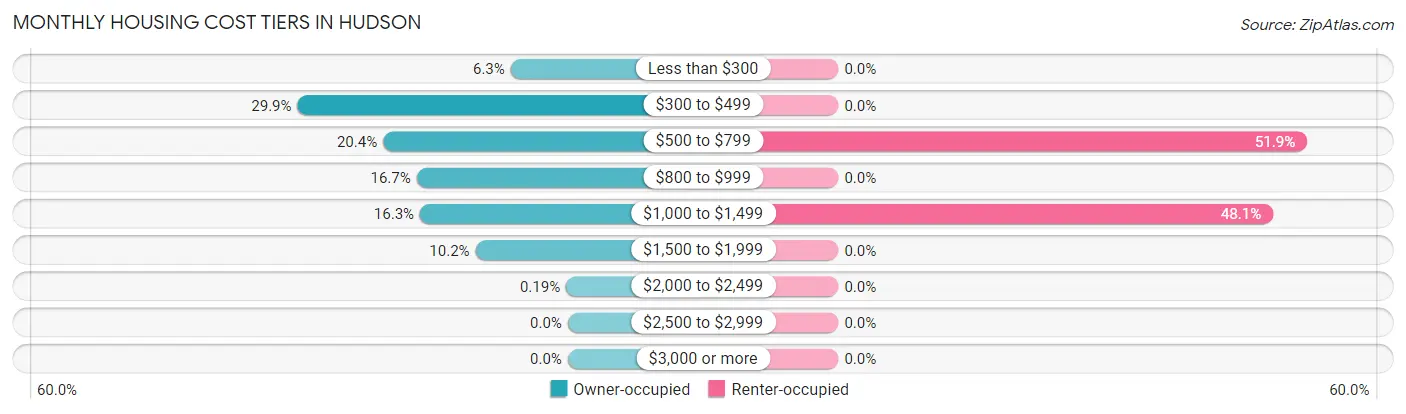
| Monthly Cost | Owner-occupied | Renter-occupied |
| Less than $300 | 34 (6.3%) | 0 (0.0%) |
| $300 to $499 | 161 (29.9%) | 0 (0.0%) |
| $500 to $799 | 110 (20.4%) | 138 (51.9%) |
| $800 to $999 | 90 (16.7%) | 0 (0.0%) |
| $1,000 to $1,499 | 88 (16.3%) | 128 (48.1%) |
| $1,500 to $1,999 | 55 (10.2%) | 0 (0.0%) |
| $2,000 to $2,499 | 1 (0.2%) | 0 (0.0%) |
| $2,500 to $2,999 | 0 (0.0%) | 0 (0.0%) |
| $3,000 or more | 0 (0.0%) | 0 (0.0%) |
| Total | 539 (100.0%) | 266 (100.0%) |
Physical Housing Characteristics in Hudson
Housing Structures in Hudson
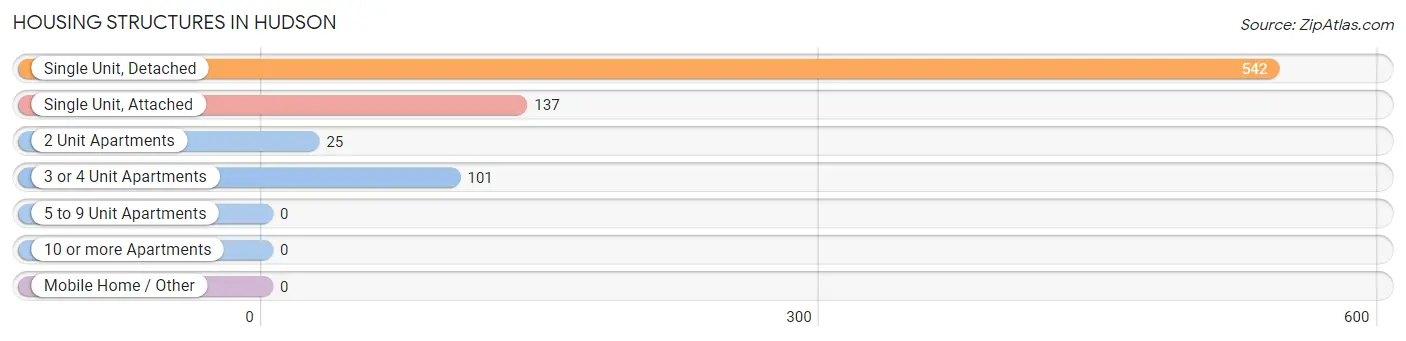
| Structure Type | # Housing Units | % Housing Units |
| Single Unit, Detached | 542 | 67.3% |
| Single Unit, Attached | 137 | 17.0% |
| 2 Unit Apartments | 25 | 3.1% |
| 3 or 4 Unit Apartments | 101 | 12.6% |
| 5 to 9 Unit Apartments | 0 | 0.0% |
| 10 or more Apartments | 0 | 0.0% |
| Mobile Home / Other | 0 | 0.0% |
| Total | 805 | 100.0% |
Housing Structures by Occupancy in Hudson
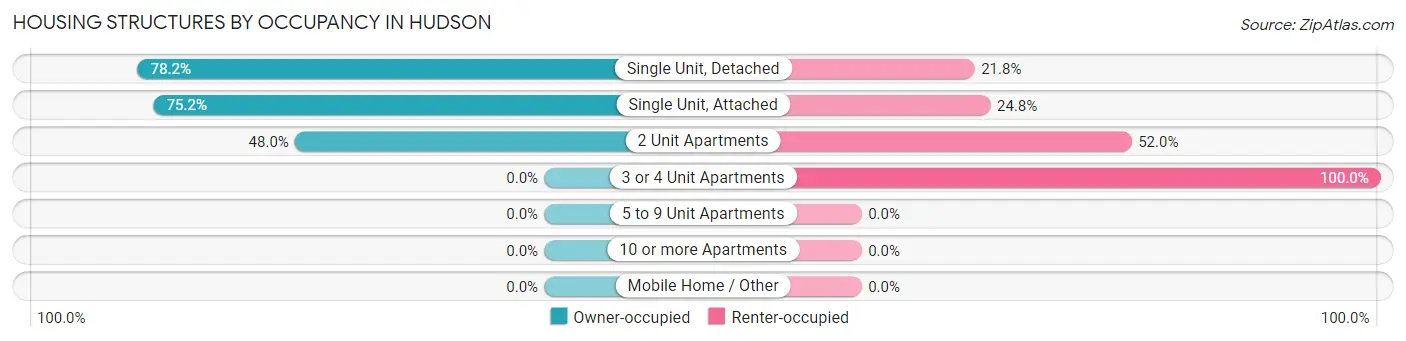
| Structure Type | Owner-occupied | Renter-occupied |
| Single Unit, Detached | 424 (78.2%) | 118 (21.8%) |
| Single Unit, Attached | 103 (75.2%) | 34 (24.8%) |
| 2 Unit Apartments | 12 (48.0%) | 13 (52.0%) |
| 3 or 4 Unit Apartments | 0 (0.0%) | 101 (100.0%) |
| 5 to 9 Unit Apartments | 0 (0.0%) | 0 (0.0%) |
| 10 or more Apartments | 0 (0.0%) | 0 (0.0%) |
| Mobile Home / Other | 0 (0.0%) | 0 (0.0%) |
| Total | 539 (67.0%) | 266 (33.0%) |
Housing Structures by Number of Rooms in Hudson
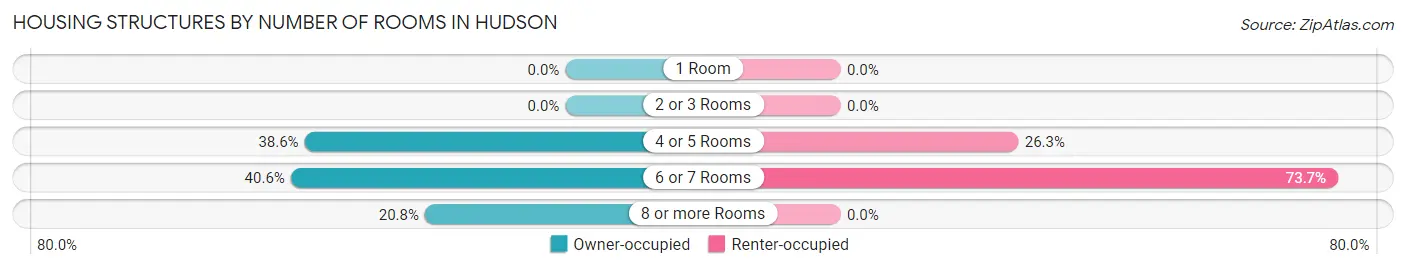
| Number of Rooms | Owner-occupied | Renter-occupied |
| 1 Room | 0 (0.0%) | 0 (0.0%) |
| 2 or 3 Rooms | 0 (0.0%) | 0 (0.0%) |
| 4 or 5 Rooms | 208 (38.6%) | 70 (26.3%) |
| 6 or 7 Rooms | 219 (40.6%) | 196 (73.7%) |
| 8 or more Rooms | 112 (20.8%) | 0 (0.0%) |
| Total | 539 (100.0%) | 266 (100.0%) |
Housing Structure by Heating Type in Hudson
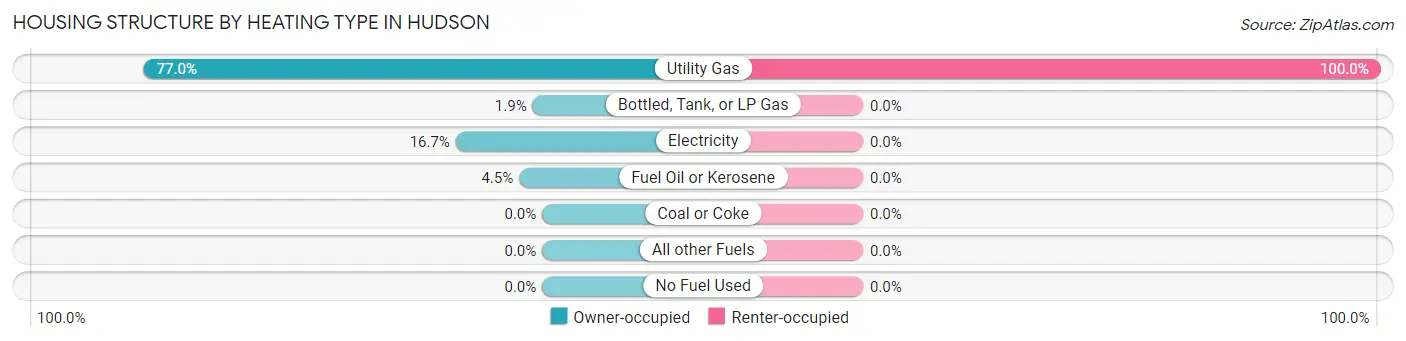
| Heating Type | Owner-occupied | Renter-occupied |
| Utility Gas | 415 (77.0%) | 266 (100.0%) |
| Bottled, Tank, or LP Gas | 10 (1.9%) | 0 (0.0%) |
| Electricity | 90 (16.7%) | 0 (0.0%) |
| Fuel Oil or Kerosene | 24 (4.4%) | 0 (0.0%) |
| Coal or Coke | 0 (0.0%) | 0 (0.0%) |
| All other Fuels | 0 (0.0%) | 0 (0.0%) |
| No Fuel Used | 0 (0.0%) | 0 (0.0%) |
| Total | 539 (100.0%) | 266 (100.0%) |
Household Vehicle Usage in Hudson
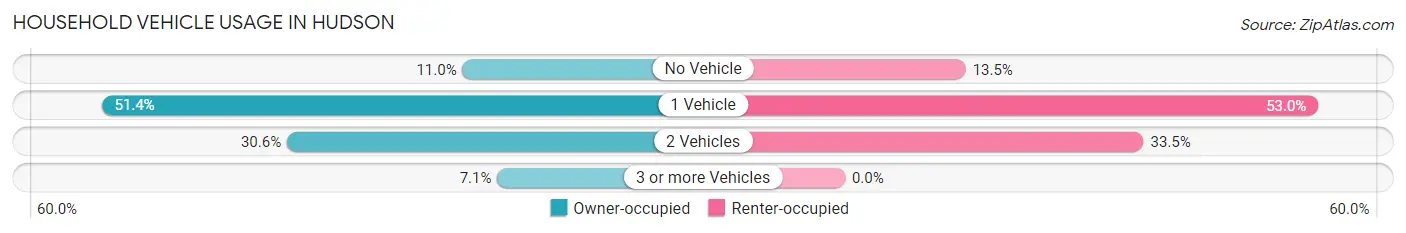
| Vehicles per Household | Owner-occupied | Renter-occupied |
| No Vehicle | 59 (11.0%) | 36 (13.5%) |
| 1 Vehicle | 277 (51.4%) | 141 (53.0%) |
| 2 Vehicles | 165 (30.6%) | 89 (33.5%) |
| 3 or more Vehicles | 38 (7.0%) | 0 (0.0%) |
| Total | 539 (100.0%) | 266 (100.0%) |
Real Estate & Mortgages in Hudson
Real Estate and Mortgage Overview in Hudson
| Characteristic | Without Mortgage | With Mortgage |
| Housing Units | 326 | 213 |
| Median Property Value | $106,000 | $154,600 |
| Median Household Income | $43,056 | $36 |
| Monthly Housing Costs | $478 | $0 |
| Real Estate Taxes | $1,663 | $0 |
Property Value by Mortgage Status in Hudson
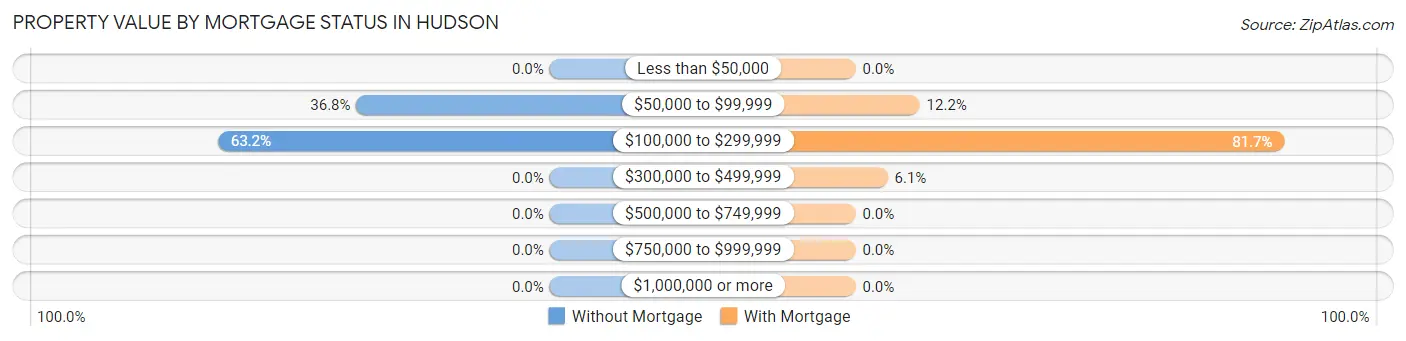
| Property Value | Without Mortgage | With Mortgage |
| Less than $50,000 | 0 (0.0%) | 0 (0.0%) |
| $50,000 to $99,999 | 120 (36.8%) | 26 (12.2%) |
| $100,000 to $299,999 | 206 (63.2%) | 174 (81.7%) |
| $300,000 to $499,999 | 0 (0.0%) | 13 (6.1%) |
| $500,000 to $749,999 | 0 (0.0%) | 0 (0.0%) |
| $750,000 to $999,999 | 0 (0.0%) | 0 (0.0%) |
| $1,000,000 or more | 0 (0.0%) | 0 (0.0%) |
| Total | 326 (100.0%) | 213 (100.0%) |
Household Income by Mortgage Status in Hudson
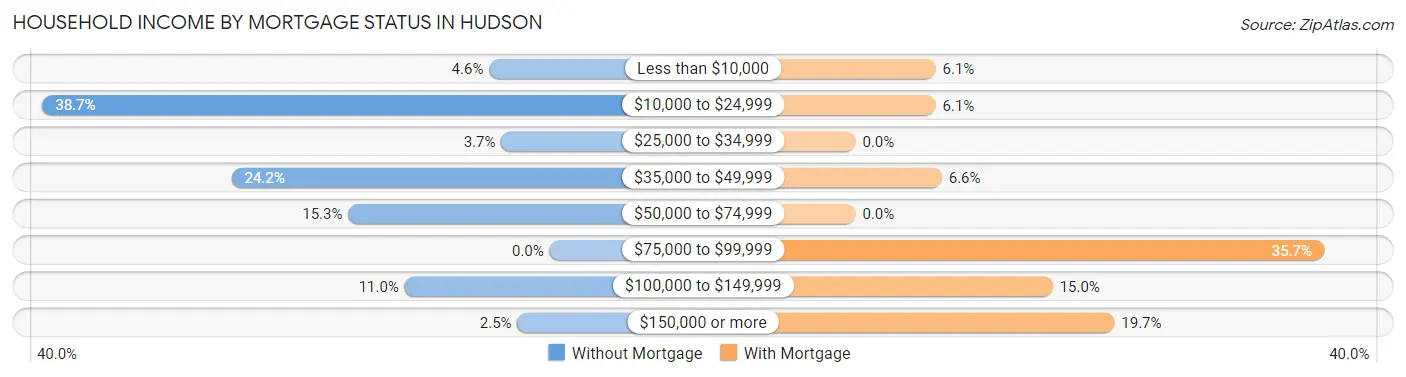
| Household Income | Without Mortgage | With Mortgage |
| Less than $10,000 | 15 (4.6%) | 13 (6.1%) |
| $10,000 to $24,999 | 126 (38.7%) | 13 (6.1%) |
| $25,000 to $34,999 | 12 (3.7%) | 0 (0.0%) |
| $35,000 to $49,999 | 79 (24.2%) | 14 (6.6%) |
| $50,000 to $74,999 | 50 (15.3%) | 0 (0.0%) |
| $75,000 to $99,999 | 0 (0.0%) | 76 (35.7%) |
| $100,000 to $149,999 | 36 (11.0%) | 32 (15.0%) |
| $150,000 or more | 8 (2.5%) | 42 (19.7%) |
| Total | 326 (100.0%) | 213 (100.0%) |
Property Value to Household Income Ratio in Hudson
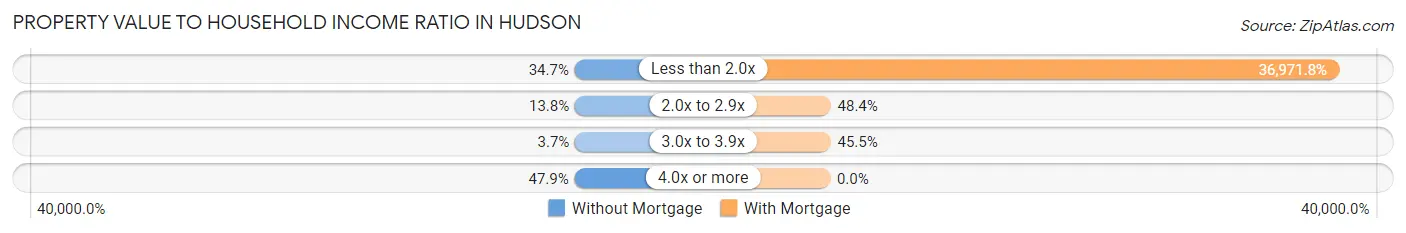
| Value-to-Income Ratio | Without Mortgage | With Mortgage |
| Less than 2.0x | 113 (34.7%) | 78,750 (36,971.8%) |
| 2.0x to 2.9x | 45 (13.8%) | 103 (48.4%) |
| 3.0x to 3.9x | 12 (3.7%) | 97 (45.5%) |
| 4.0x or more | 156 (47.8%) | 0 (0.0%) |
| Total | 326 (100.0%) | 213 (100.0%) |
Real Estate Taxes by Mortgage Status in Hudson
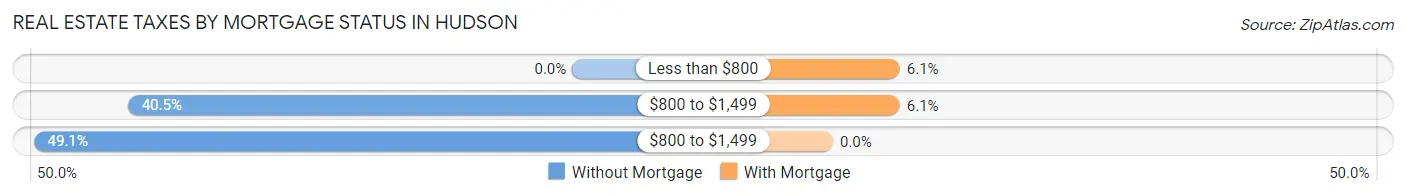
| Property Taxes | Without Mortgage | With Mortgage |
| Less than $800 | 0 (0.0%) | 13 (6.1%) |
| $800 to $1,499 | 132 (40.5%) | 13 (6.1%) |
| $800 to $1,499 | 160 (49.1%) | 0 (0.0%) |
| Total | 326 (100.0%) | 213 (100.0%) |
Health & Disability in Hudson
Health Insurance Coverage by Age in Hudson
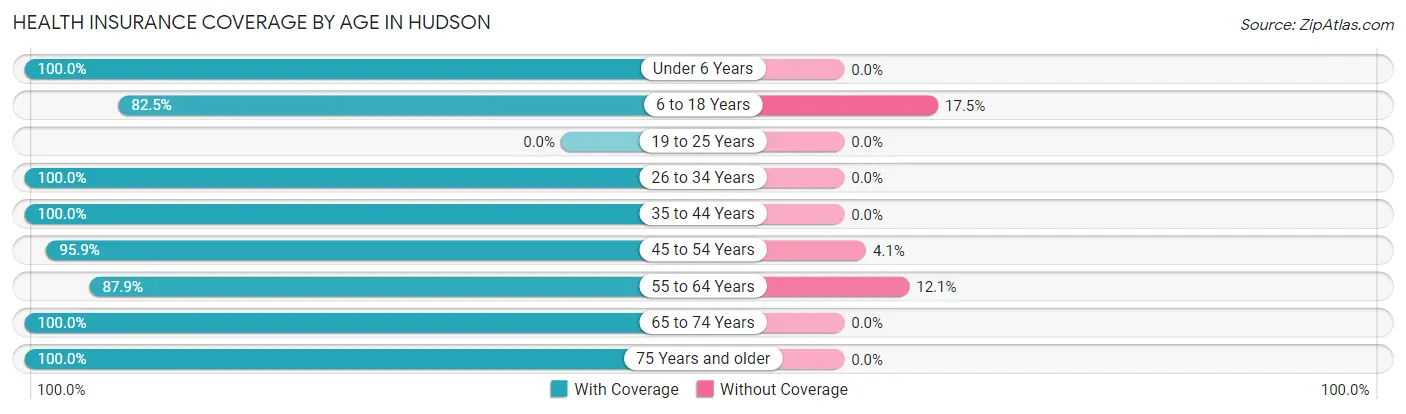
| Age Bracket | With Coverage | Without Coverage |
| Under 6 Years | 129 (100.0%) | 0 (0.0%) |
| 6 to 18 Years | 99 (82.5%) | 21 (17.5%) |
| 19 to 25 Years | 0 (0.0%) | 0 (0.0%) |
| 26 to 34 Years | 148 (100.0%) | 0 (0.0%) |
| 35 to 44 Years | 325 (100.0%) | 0 (0.0%) |
| 45 to 54 Years | 212 (95.9%) | 9 (4.1%) |
| 55 to 64 Years | 174 (87.9%) | 24 (12.1%) |
| 65 to 74 Years | 212 (100.0%) | 0 (0.0%) |
| 75 Years and older | 110 (100.0%) | 0 (0.0%) |
| Total | 1,409 (96.3%) | 54 (3.7%) |
Health Insurance Coverage by Citizenship Status in Hudson
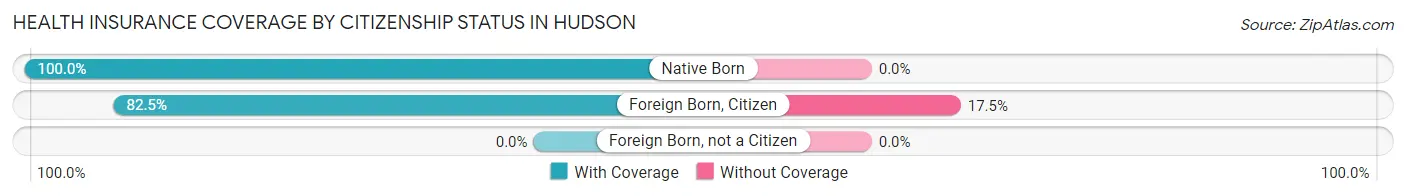
| Citizenship Status | With Coverage | Without Coverage |
| Native Born | 129 (100.0%) | 0 (0.0%) |
| Foreign Born, Citizen | 99 (82.5%) | 21 (17.5%) |
| Foreign Born, not a Citizen | 0 (0.0%) | 0 (0.0%) |
Health Insurance Coverage by Household Income in Hudson
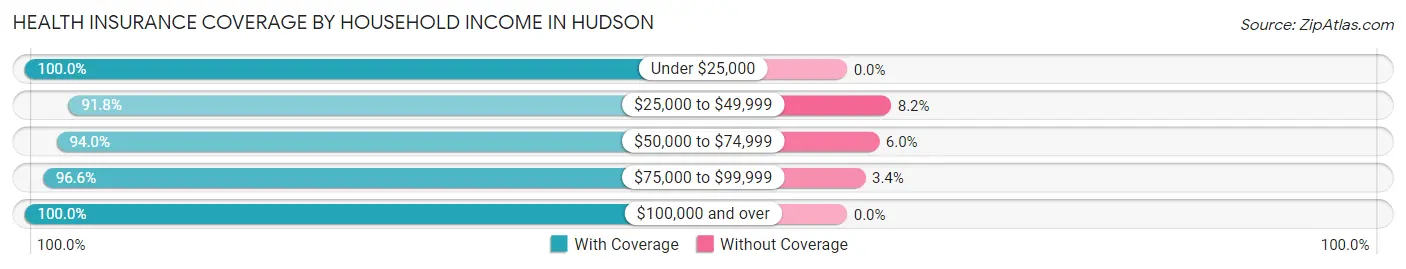
| Household Income | With Coverage | Without Coverage |
| Under $25,000 | 279 (100.0%) | 0 (0.0%) |
| $25,000 to $49,999 | 234 (91.8%) | 21 (8.2%) |
| $50,000 to $74,999 | 376 (94.0%) | 24 (6.0%) |
| $75,000 to $99,999 | 254 (96.6%) | 9 (3.4%) |
| $100,000 and over | 264 (100.0%) | 0 (0.0%) |
Public vs Private Health Insurance Coverage by Age in Hudson
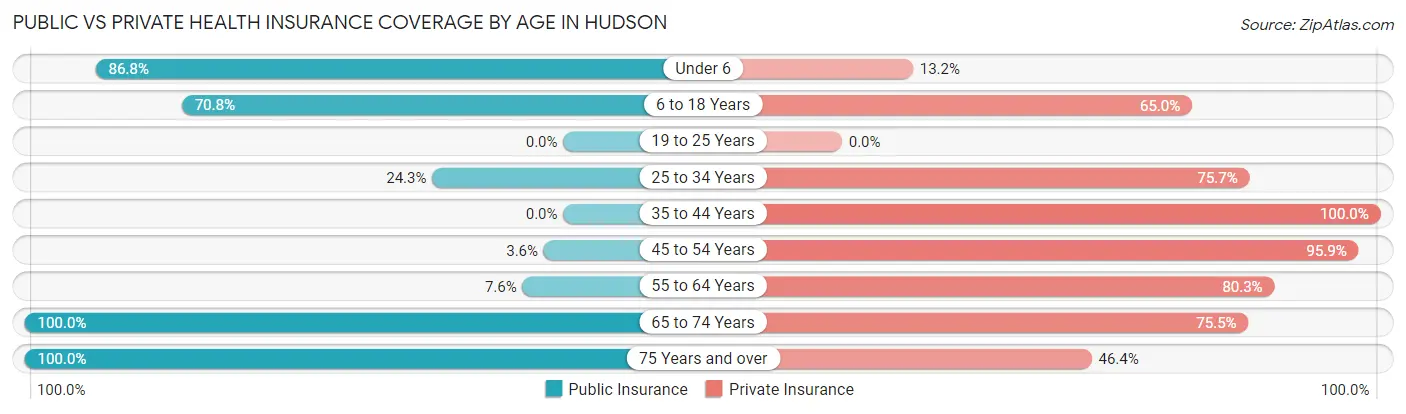
| Age Bracket | Public Insurance | Private Insurance |
| Under 6 | 112 (86.8%) | 17 (13.2%) |
| 6 to 18 Years | 85 (70.8%) | 78 (65.0%) |
| 19 to 25 Years | 0 (0.0%) | 0 (0.0%) |
| 25 to 34 Years | 36 (24.3%) | 112 (75.7%) |
| 35 to 44 Years | 0 (0.0%) | 325 (100.0%) |
| 45 to 54 Years | 8 (3.6%) | 212 (95.9%) |
| 55 to 64 Years | 15 (7.6%) | 159 (80.3%) |
| 65 to 74 Years | 212 (100.0%) | 160 (75.5%) |
| 75 Years and over | 110 (100.0%) | 51 (46.4%) |
| Total | 578 (39.5%) | 1,114 (76.1%) |
Disability Status by Sex by Age in Hudson
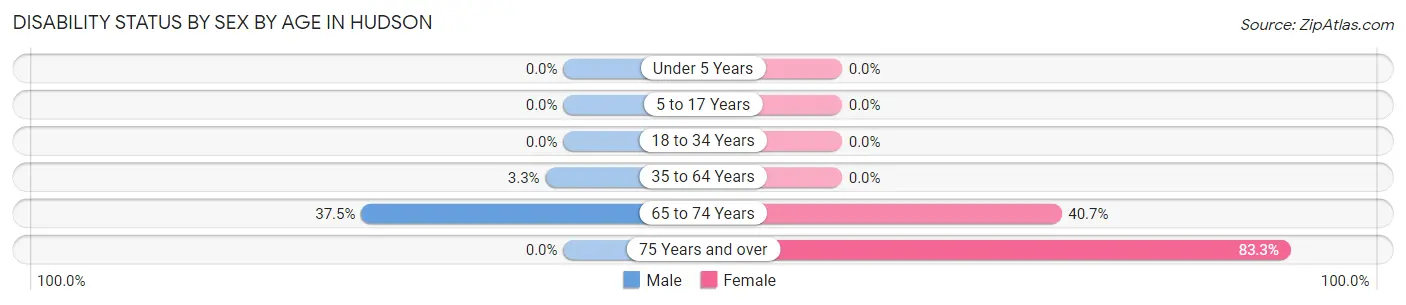
| Age Bracket | Male | Female |
| Under 5 Years | 0 (0.0%) | 0 (0.0%) |
| 5 to 17 Years | 0 (0.0%) | 0 (0.0%) |
| 18 to 34 Years | 0 (0.0%) | 0 (0.0%) |
| 35 to 64 Years | 15 (3.3%) | 0 (0.0%) |
| 65 to 74 Years | 39 (37.5%) | 44 (40.7%) |
| 75 Years and over | 0 (0.0%) | 70 (83.3%) |
Disability Class by Sex by Age in Hudson
Disability Class: Hearing Difficulty
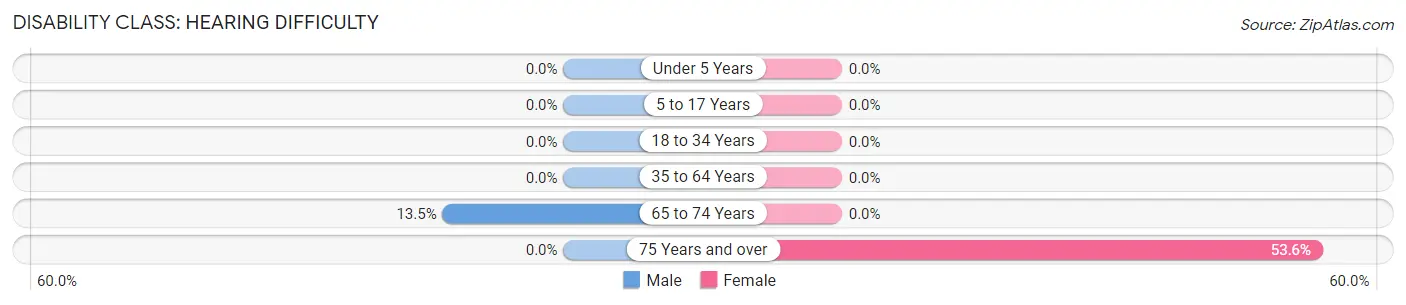
| Age Bracket | Male | Female |
| Under 5 Years | 0 (0.0%) | 0 (0.0%) |
| 5 to 17 Years | 0 (0.0%) | 0 (0.0%) |
| 18 to 34 Years | 0 (0.0%) | 0 (0.0%) |
| 35 to 64 Years | 0 (0.0%) | 0 (0.0%) |
| 65 to 74 Years | 14 (13.5%) | 0 (0.0%) |
| 75 Years and over | 0 (0.0%) | 45 (53.6%) |
Disability Class: Vision Difficulty
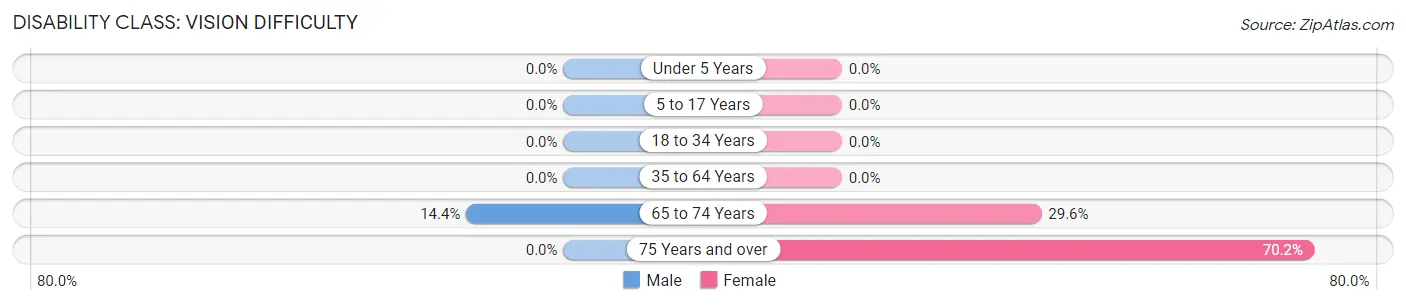
| Age Bracket | Male | Female |
| Under 5 Years | 0 (0.0%) | 0 (0.0%) |
| 5 to 17 Years | 0 (0.0%) | 0 (0.0%) |
| 18 to 34 Years | 0 (0.0%) | 0 (0.0%) |
| 35 to 64 Years | 0 (0.0%) | 0 (0.0%) |
| 65 to 74 Years | 15 (14.4%) | 32 (29.6%) |
| 75 Years and over | 0 (0.0%) | 59 (70.2%) |
Disability Class: Cognitive Difficulty
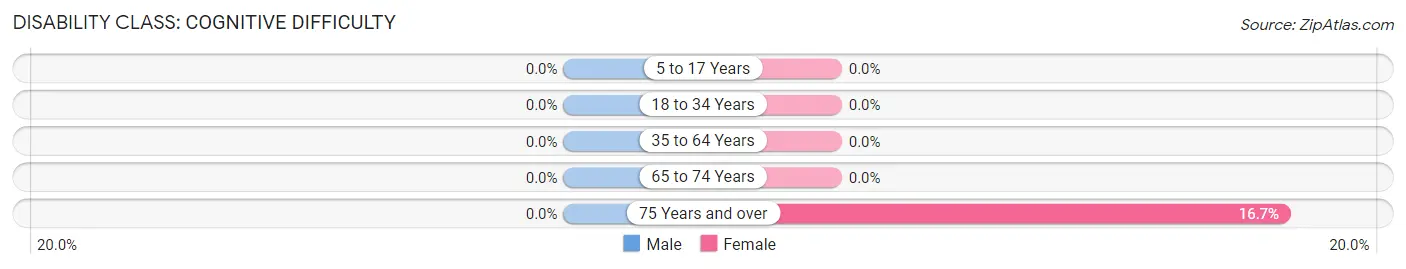
| Age Bracket | Male | Female |
| 5 to 17 Years | 0 (0.0%) | 0 (0.0%) |
| 18 to 34 Years | 0 (0.0%) | 0 (0.0%) |
| 35 to 64 Years | 0 (0.0%) | 0 (0.0%) |
| 65 to 74 Years | 0 (0.0%) | 0 (0.0%) |
| 75 Years and over | 0 (0.0%) | 14 (16.7%) |
Disability Class: Ambulatory Difficulty
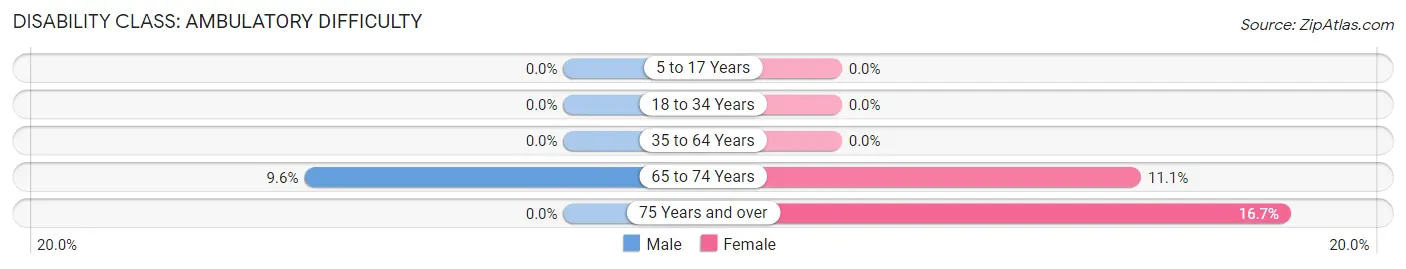
| Age Bracket | Male | Female |
| 5 to 17 Years | 0 (0.0%) | 0 (0.0%) |
| 18 to 34 Years | 0 (0.0%) | 0 (0.0%) |
| 35 to 64 Years | 0 (0.0%) | 0 (0.0%) |
| 65 to 74 Years | 10 (9.6%) | 12 (11.1%) |
| 75 Years and over | 0 (0.0%) | 14 (16.7%) |
Disability Class: Self-Care Difficulty
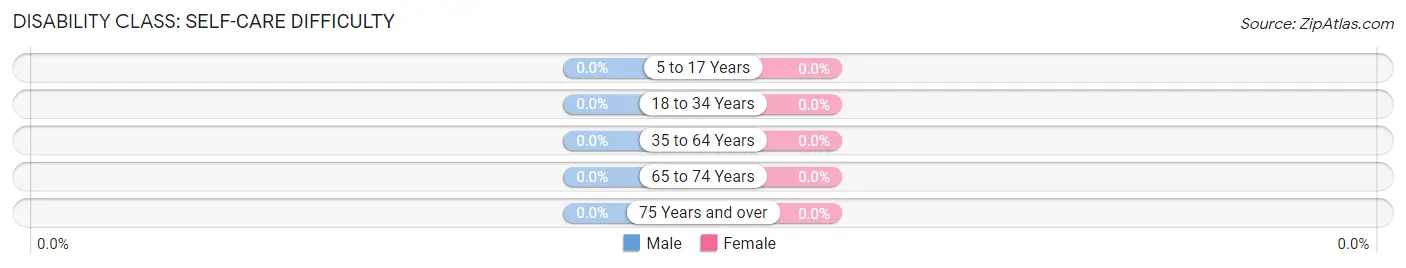
| Age Bracket | Male | Female |
| 5 to 17 Years | 0 (0.0%) | 0 (0.0%) |
| 18 to 34 Years | 0 (0.0%) | 0 (0.0%) |
| 35 to 64 Years | 0 (0.0%) | 0 (0.0%) |
| 65 to 74 Years | 0 (0.0%) | 0 (0.0%) |
| 75 Years and over | 0 (0.0%) | 0 (0.0%) |
Technology Access in Hudson
Computing Device Access in Hudson
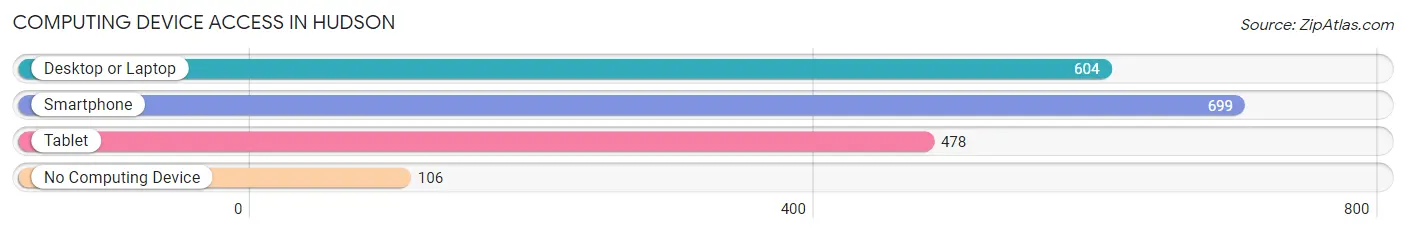
| Device Type | # Households | % Households |
| Desktop or Laptop | 604 | 75.0% |
| Smartphone | 699 | 86.8% |
| Tablet | 478 | 59.4% |
| No Computing Device | 106 | 13.2% |
| Total | 805 | 100.0% |
Internet Access in Hudson
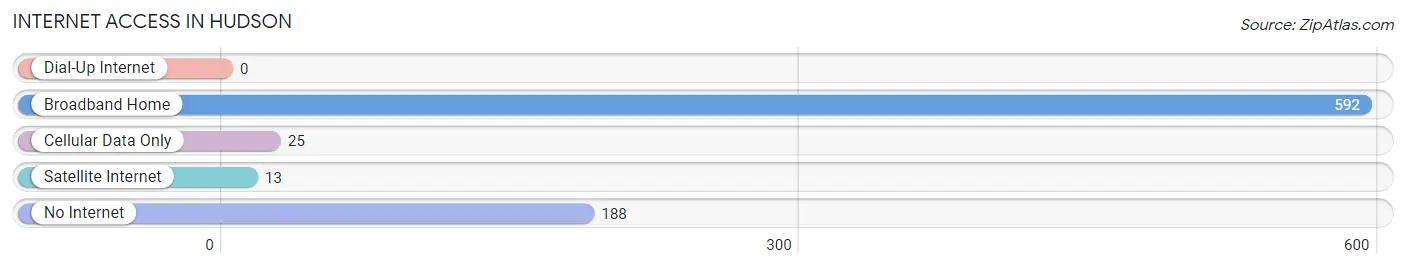
| Internet Type | # Households | % Households |
| Dial-Up Internet | 0 | 0.0% |
| Broadband Home | 592 | 73.5% |
| Cellular Data Only | 25 | 3.1% |
| Satellite Internet | 13 | 1.6% |
| No Internet | 188 | 23.4% |
| Total | 805 | 100.0% |
Hudson Summary
Hudson, Pennsylvania is a small borough located in Luzerne County, Pennsylvania. It is situated in the Wyoming Valley, a region of the Northeastern United States that is known for its rich history and culture. The borough is located approximately 20 miles south of Wilkes-Barre, the county seat. The population of Hudson was 1,845 as of the 2010 census.
Geography
Hudson is located at 41°14'N 75°51'W (41.23, -75.85). It is situated in the Wyoming Valley, a region of the Northeastern United States that is known for its rich history and culture. The borough is located approximately 20 miles south of Wilkes-Barre, the county seat. The borough is situated on the banks of the Susquehanna River, which forms the border between Luzerne and Wyoming counties. The borough is surrounded by the townships of Exeter, Salem, and Jackson.
The terrain of Hudson is mostly flat, with some rolling hills in the surrounding area. The borough is located in the Appalachian Mountains, and the surrounding area is characterized by forests and streams. The climate of Hudson is humid continental, with cold winters and hot, humid summers.
History
Hudson was founded in 1820 by a group of settlers from Connecticut. The borough was named after the Hudson River in New York. The settlers were attracted to the area by the abundance of natural resources, including timber and coal. The borough was incorporated in 1845.
In the late 19th century, Hudson became a major center for the coal mining industry. The borough was home to several coal mines, and the population of the borough grew rapidly. By the early 20th century, Hudson had become a bustling industrial center.
Economy
Hudson’s economy is largely based on the service industry. The borough is home to several restaurants, retail stores, and other businesses. The borough is also home to a number of manufacturing companies, including a paper mill and a plastics factory.
The borough is also home to a number of educational institutions, including a community college and a technical school. The borough is also home to a number of medical facilities, including a hospital and several clinics.
Demographics
As of the 2010 census, the population of Hudson was 1,845. The racial makeup of the borough was 95.3% White, 1.3% African American, 0.3% Native American, 0.7% Asian, 0.1% Pacific Islander, 0.7% from other races, and 1.6% from two or more races. Hispanic or Latino of any race were 2.2% of the population.
The median household income in Hudson was $37,917, and the median family income was $45,938. The per capita income for the borough was $19,945. About 11.2% of families and 13.2% of the population were below the poverty line, including 17.2% of those under age 18 and 8.2% of those age 65 or over.
Conclusion
Hudson, Pennsylvania is a small borough located in Luzerne County, Pennsylvania. It is situated in the Wyoming Valley, a region of the Northeastern United States that is known for its rich history and culture. The borough is located approximately 20 miles south of Wilkes-Barre, the county seat. The population of Hudson was 1,845 as of the 2010 census. The borough’s economy is largely based on the service industry, and it is home to several educational institutions, medical facilities, and manufacturing companies. The racial makeup of the borough was 95.3% White, 1.3% African American, 0.3% Native American, 0.7% Asian, 0.1% Pacific Islander, 0.7% from other races, and 1.6% from two or more races. The median household income in Hudson was $37,917, and the median family income was $45,938. About 11.2% of families and 13.2% of the population were below the poverty line.
Common Questions
What is Per Capita Income in Hudson?
Per Capita income in Hudson is $40,815.
What is the Median Family Income in Hudson?
Median Family Income in Hudson is $57,109.
What is the Median Household income in Hudson?
Median Household Income in Hudson is $55,779.
What is Income or Wage Gap in Hudson?
Income or Wage Gap in Hudson is 56.6%.
Women in Hudson earn 43.4 cents for every dollar earned by a man.
What is Inequality or Gini Index in Hudson?
Inequality or Gini Index in Hudson is 0.42.
What is the Total Population of Hudson?
Total Population of Hudson is 1,463.
What is the Total Male Population of Hudson?
Total Male Population of Hudson is 806.
What is the Total Female Population of Hudson?
Total Female Population of Hudson is 657.
What is the Ratio of Males per 100 Females in Hudson?
There are 122.68 Males per 100 Females in Hudson.
What is the Ratio of Females per 100 Males in Hudson?
There are 81.51 Females per 100 Males in Hudson.
What is the Median Population Age in Hudson?
Median Population Age in Hudson is 45.1 Years.
What is the Average Family Size in Hudson
Average Family Size in Hudson is 2.5 People.
What is the Average Household Size in Hudson
Average Household Size in Hudson is 1.8 People.
How Large is the Labor Force in Hudson?
There are 807 People in the Labor Forcein in Hudson.
What is the Percentage of People in the Labor Force in Hudson?
66.4% of People are in the Labor Force in Hudson.
What is the Unemployment Rate in Hudson?
Unemployment Rate in Hudson is 2.9%.