Indian Mountain Lake, PA Map & Demographics
Indian Mountain Lake Map
Indian Mountain Lake Overview
$29,812
PER CAPITA INCOME
$88,395
AVG FAMILY INCOME
$74,826
AVG HOUSEHOLD INCOME
42.9%
WAGE / INCOME GAP [ % ]
57.1¢/ $1
WAGE / INCOME GAP [ $ ]
0.32
INEQUALITY / GINI INDEX
4,100
TOTAL POPULATION
2,066
MALE POPULATION
2,034
FEMALE POPULATION
101.57
MALES / 100 FEMALES
98.45
FEMALES / 100 MALES
42.6
MEDIAN AGE
3.2
AVG FAMILY SIZE
2.9
AVG HOUSEHOLD SIZE
1,815
LABOR FORCE [ PEOPLE ]
54.7%
PERCENT IN LABOR FORCE
9.7%
UNEMPLOYMENT RATE
Income in Indian Mountain Lake
Income Overview in Indian Mountain Lake
Per Capita Income in Indian Mountain Lake is $29,812, while median incomes of families and households are $88,395 and $74,826 respectively.
| Characteristic | Number | Measure |
| Per Capita Income | 4,100 | $29,812 |
| Median Family Income | 1,159 | $88,395 |
| Mean Family Income | 1,159 | $94,686 |
| Median Household Income | 1,420 | $74,826 |
| Mean Household Income | 1,420 | $84,841 |
| Income Deficit | 1,159 | $0 |
| Wage / Income Gap (%) | 4,100 | 42.95% |
| Wage / Income Gap ($) | 4,100 | 57.05¢ per $1 |
| Gini / Inequality Index | 4,100 | 0.32 |
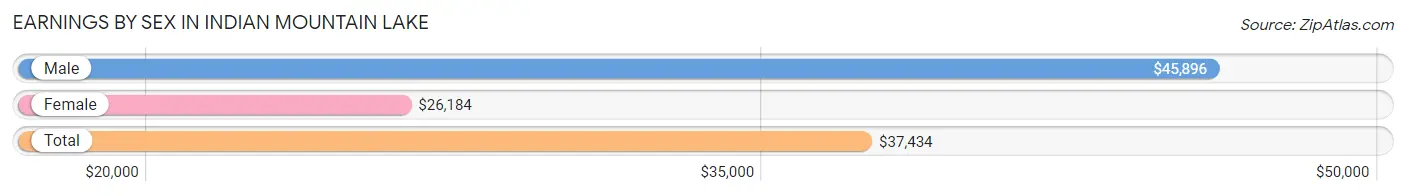
Earnings by Sex in Indian Mountain Lake
Average Earnings in Indian Mountain Lake are $37,434, $45,896 for men and $26,184 for women, a difference of 42.9%.
| Sex | Number | Average Earnings |
| Male | 985 (55.0%) | $45,896 |
| Female | 806 (45.0%) | $26,184 |
| Total | 1,791 (100.0%) | $37,434 |
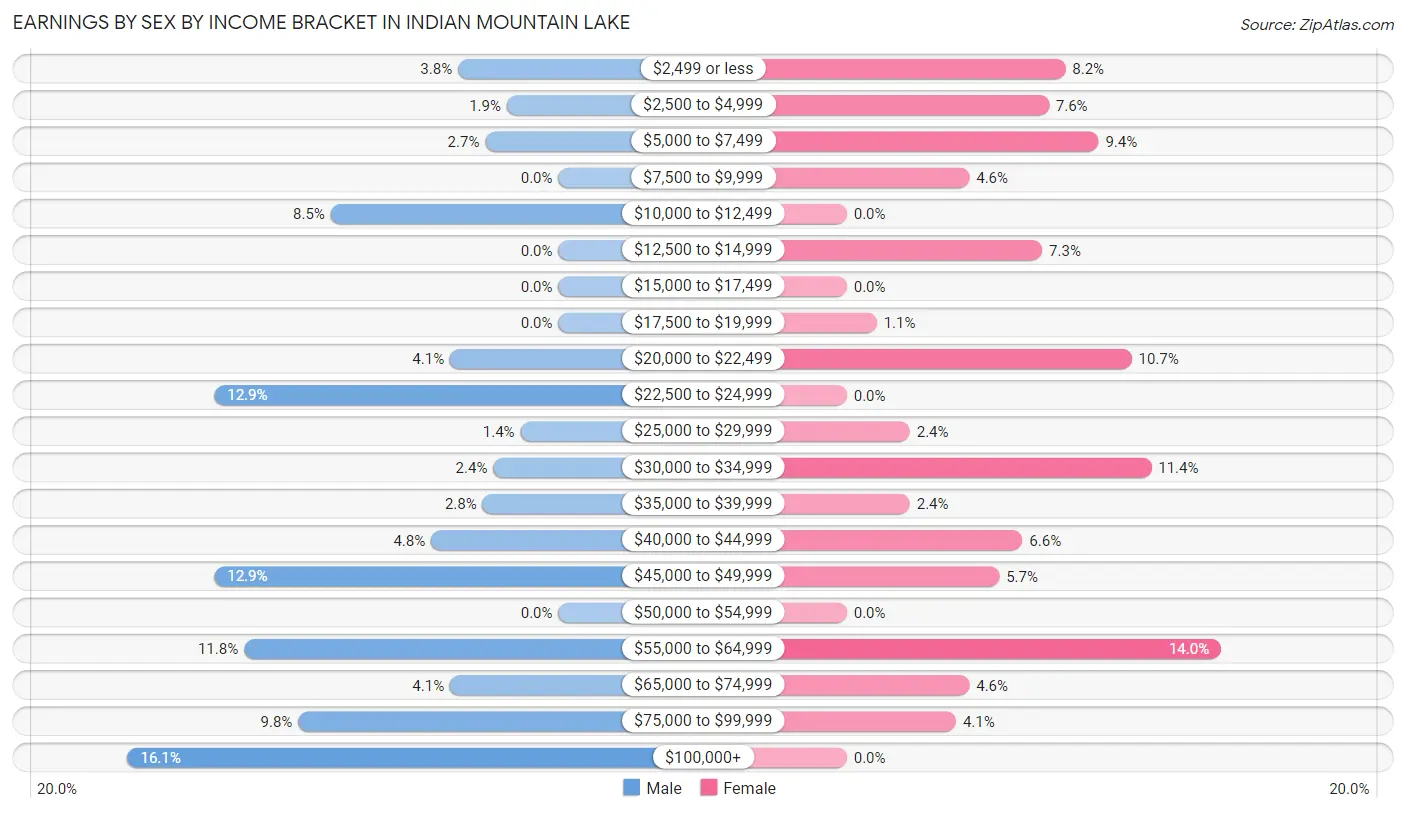
Earnings by Sex by Income Bracket in Indian Mountain Lake
The most common earnings brackets in Indian Mountain Lake are $100,000+ for men (159 | 16.1%) and $55,000 to $64,999 for women (113 | 14.0%).
| Income | Male | Female |
| $2,499 or less | 37 (3.8%) | 66 (8.2%) |
| $2,500 to $4,999 | 19 (1.9%) | 61 (7.6%) |
| $5,000 to $7,499 | 27 (2.7%) | 76 (9.4%) |
| $7,500 to $9,999 | 0 (0.0%) | 37 (4.6%) |
| $10,000 to $12,499 | 84 (8.5%) | 0 (0.0%) |
| $12,500 to $14,999 | 0 (0.0%) | 59 (7.3%) |
| $15,000 to $17,499 | 0 (0.0%) | 0 (0.0%) |
| $17,500 to $19,999 | 0 (0.0%) | 9 (1.1%) |
| $20,000 to $22,499 | 40 (4.1%) | 86 (10.7%) |
| $22,500 to $24,999 | 127 (12.9%) | 0 (0.0%) |
| $25,000 to $29,999 | 14 (1.4%) | 19 (2.4%) |
| $30,000 to $34,999 | 24 (2.4%) | 92 (11.4%) |
| $35,000 to $39,999 | 28 (2.8%) | 19 (2.4%) |
| $40,000 to $44,999 | 47 (4.8%) | 53 (6.6%) |
| $45,000 to $49,999 | 127 (12.9%) | 46 (5.7%) |
| $50,000 to $54,999 | 0 (0.0%) | 0 (0.0%) |
| $55,000 to $64,999 | 116 (11.8%) | 113 (14.0%) |
| $65,000 to $74,999 | 40 (4.1%) | 37 (4.6%) |
| $75,000 to $99,999 | 96 (9.8%) | 33 (4.1%) |
| $100,000+ | 159 (16.1%) | 0 (0.0%) |
| Total | 985 (100.0%) | 806 (100.0%) |
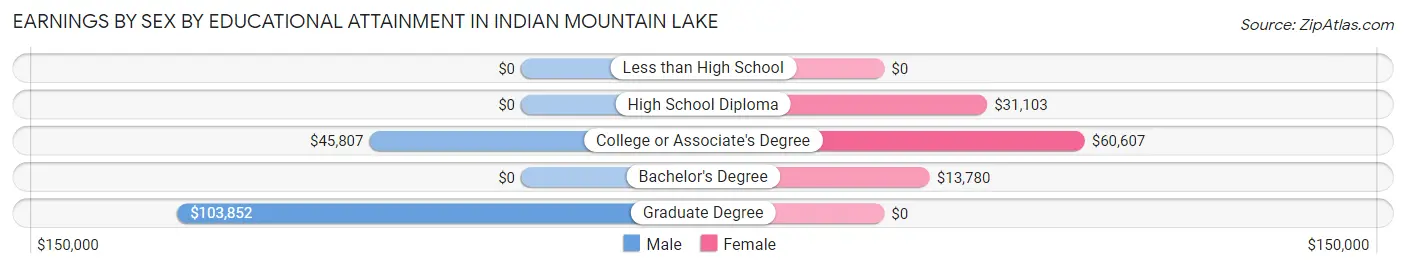
Earnings by Sex by Educational Attainment in Indian Mountain Lake
Average earnings in Indian Mountain Lake are $46,240 for men and $32,656 for women, a difference of 29.4%. Men with an educational attainment of graduate degree enjoy the highest average annual earnings of $103,852, while those with college or associate's degree education earn the least with $45,807. Women with an educational attainment of college or associate's degree earn the most with the average annual earnings of $60,607, while those with bachelor's degree education have the smallest earnings of $13,780.
| Educational Attainment | Male Income | Female Income |
| Less than High School | - | - |
| High School Diploma | - | - |
| College or Associate's Degree | $45,807 | $60,607 |
| Bachelor's Degree | - | - |
| Graduate Degree | $103,852 | $0 |
| Total | $46,240 | $32,656 |
Family Income in Indian Mountain Lake
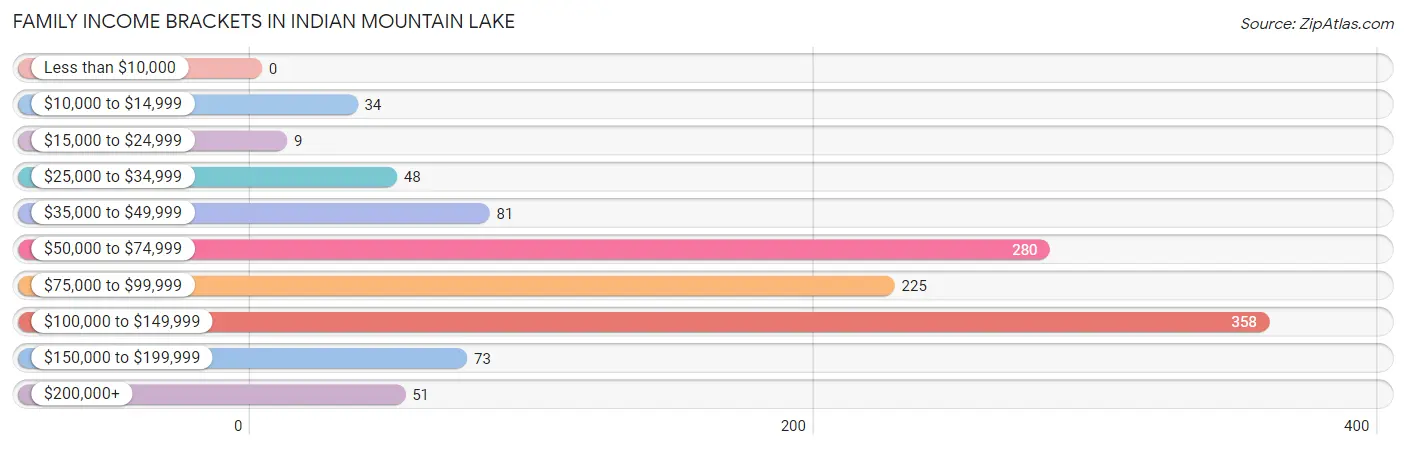
Family Income Brackets in Indian Mountain Lake
According to the Indian Mountain Lake family income data, there are 358 families falling into the $100,000 to $149,999 income range, which is the most common income bracket and makes up 30.9% of all families.
| Income Bracket | # Families | % Families |
| Less than $10,000 | 0 | 0.0% |
| $10,000 to $14,999 | 34 | 2.9% |
| $15,000 to $24,999 | 9 | 0.8% |
| $25,000 to $34,999 | 48 | 4.1% |
| $35,000 to $49,999 | 81 | 7.0% |
| $50,000 to $74,999 | 280 | 24.2% |
| $75,000 to $99,999 | 225 | 19.4% |
| $100,000 to $149,999 | 358 | 30.9% |
| $150,000 to $199,999 | 73 | 6.3% |
| $200,000+ | 51 | 4.4% |
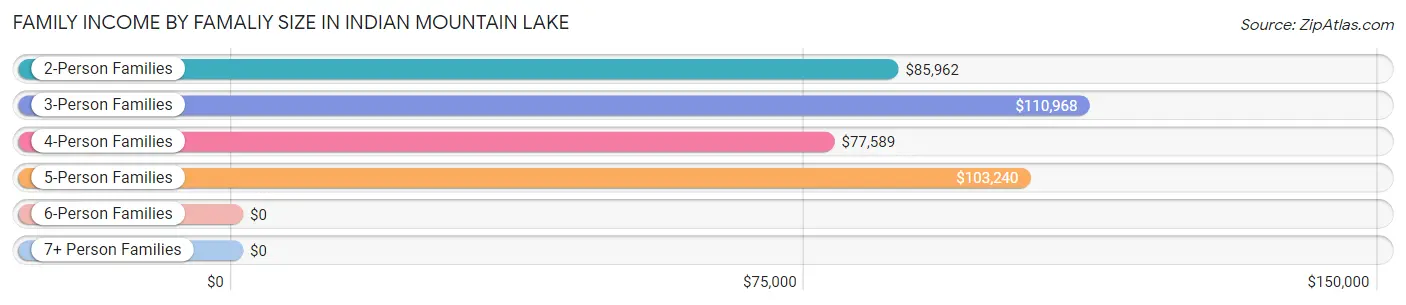
Family Income by Famaliy Size in Indian Mountain Lake
3-person families (218 | 18.8%) account for the highest median family income in Indian Mountain Lake with $110,968 per family, while 2-person families (558 | 48.1%) have the highest median income of $42,981 per family member.
| Income Bracket | # Families | Median Income |
| 2-Person Families | 558 (48.1%) | $85,962 |
| 3-Person Families | 218 (18.8%) | $110,968 |
| 4-Person Families | 185 (16.0%) | $77,589 |
| 5-Person Families | 145 (12.5%) | $103,240 |
| 6-Person Families | 0 (0.0%) | $0 |
| 7+ Person Families | 53 (4.6%) | $0 |
| Total | 1,159 (100.0%) | $88,395 |
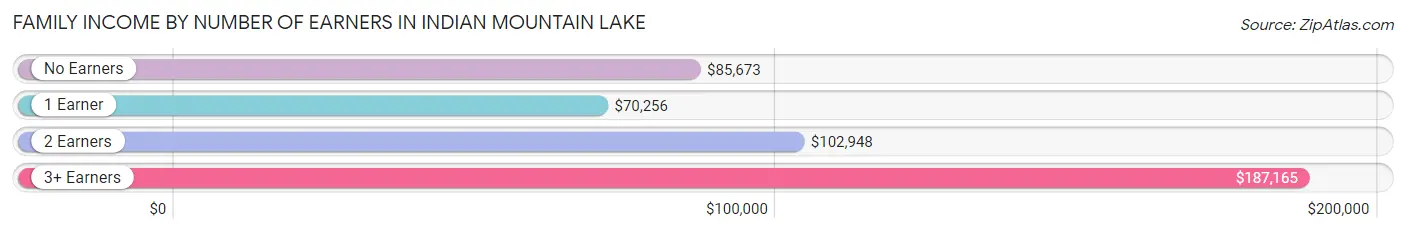
Family Income by Number of Earners in Indian Mountain Lake
The median family income in Indian Mountain Lake is $88,395, with families comprising 3+ earners (113) having the highest median family income of $187,165, while families with 1 earner (388) have the lowest median family income of $70,256, accounting for 9.8% and 33.5% of families, respectively.
| Number of Earners | # Families | Median Income |
| No Earners | 297 (25.6%) | $85,673 |
| 1 Earner | 388 (33.5%) | $70,256 |
| 2 Earners | 361 (31.1%) | $102,948 |
| 3+ Earners | 113 (9.8%) | $187,165 |
| Total | 1,159 (100.0%) | $88,395 |
Household Income in Indian Mountain Lake
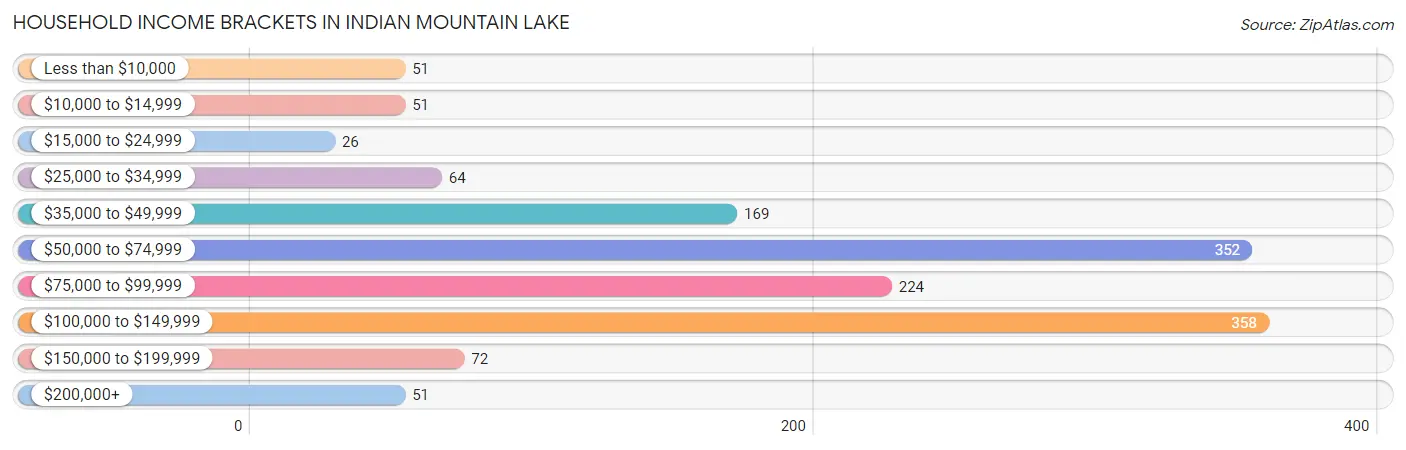
Household Income Brackets in Indian Mountain Lake
With 358 households falling in the category, the $100,000 to $149,999 income range is the most frequent in Indian Mountain Lake, accounting for 25.2% of all households. In contrast, only 26 households (1.8%) fall into the $15,000 to $24,999 income bracket, making it the least populous group.
| Income Bracket | # Households | % Households |
| Less than $10,000 | 51 | 3.6% |
| $10,000 to $14,999 | 51 | 3.6% |
| $15,000 to $24,999 | 26 | 1.8% |
| $25,000 to $34,999 | 64 | 4.5% |
| $35,000 to $49,999 | 169 | 11.9% |
| $50,000 to $74,999 | 352 | 24.8% |
| $75,000 to $99,999 | 224 | 15.8% |
| $100,000 to $149,999 | 358 | 25.2% |
| $150,000 to $199,999 | 72 | 5.1% |
| $200,000+ | 51 | 3.6% |
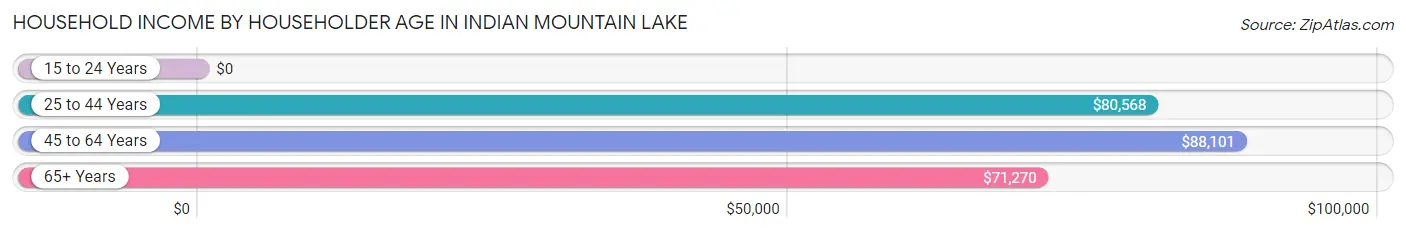
Household Income by Householder Age in Indian Mountain Lake
The median household income in Indian Mountain Lake is $74,826, with the highest median household income of $88,101 found in the 45 to 64 years age bracket for the primary householder. A total of 676 households (47.6%) fall into this category. Meanwhile, the 15 to 24 years age bracket for the primary householder has the lowest median household income of $0, with 19 households (1.3%) in this group.
| Income Bracket | # Households | Median Income |
| 15 to 24 Years | 19 (1.3%) | $0 |
| 25 to 44 Years | 291 (20.5%) | $80,568 |
| 45 to 64 Years | 676 (47.6%) | $88,101 |
| 65+ Years | 434 (30.6%) | $71,270 |
| Total | 1,420 (100.0%) | $74,826 |
Poverty in Indian Mountain Lake
Income Below Poverty by Sex and Age in Indian Mountain Lake
With 7.7% poverty level for males and 10.3% for females among the residents of Indian Mountain Lake, 12 to 14 year old males and 12 to 14 year old females are the most vulnerable to poverty, with 28 males (77.8%) and 32 females (50.8%) in their respective age groups living below the poverty level.
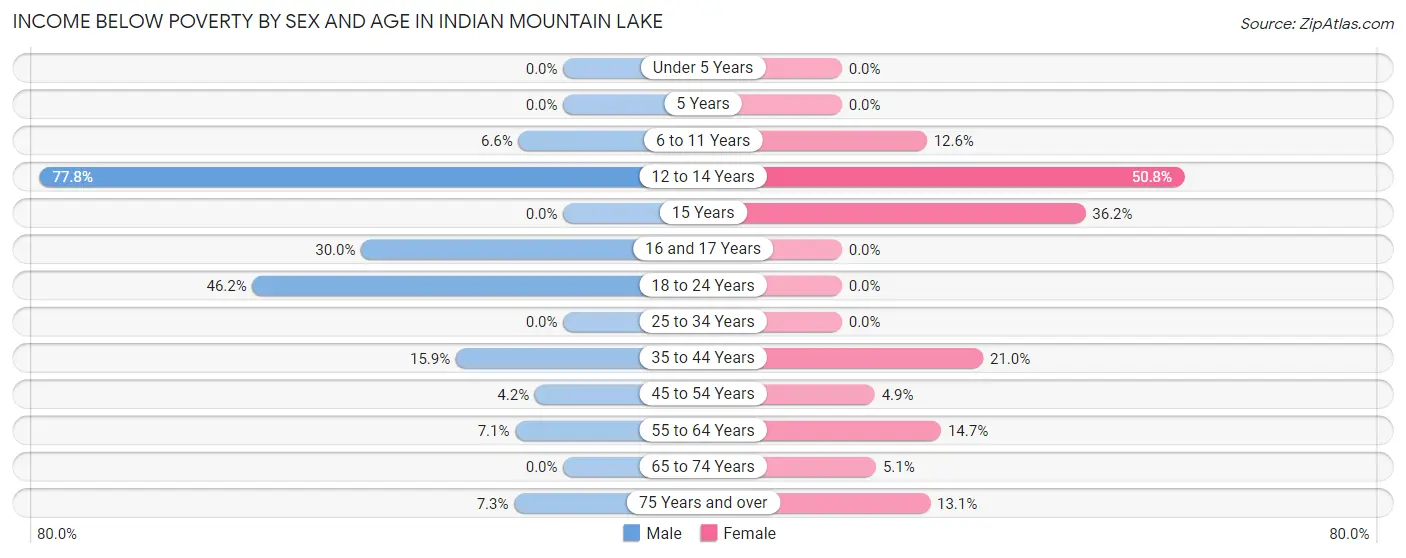
| Age Bracket | Male | Female |
| Under 5 Years | 0 (0.0%) | 0 (0.0%) |
| 5 Years | 0 (0.0%) | 0 (0.0%) |
| 6 to 11 Years | 18 (6.6%) | 14 (12.6%) |
| 12 to 14 Years | 28 (77.8%) | 32 (50.8%) |
| 15 Years | 0 (0.0%) | 17 (36.2%) |
| 16 and 17 Years | 9 (30.0%) | 0 (0.0%) |
| 18 to 24 Years | 30 (46.2%) | 0 (0.0%) |
| 25 to 34 Years | 0 (0.0%) | 0 (0.0%) |
| 35 to 44 Years | 29 (15.9%) | 52 (21.0%) |
| 45 to 54 Years | 8 (4.2%) | 9 (4.9%) |
| 55 to 64 Years | 25 (7.1%) | 57 (14.7%) |
| 65 to 74 Years | 0 (0.0%) | 13 (5.1%) |
| 75 Years and over | 11 (7.3%) | 11 (13.1%) |
| Total | 158 (7.7%) | 205 (10.3%) |
Income Above Poverty by Sex and Age in Indian Mountain Lake
According to the poverty statistics in Indian Mountain Lake, males aged under 5 years and females aged under 5 years are the age groups that are most secure financially, with 100.0% of males and 100.0% of females in these age groups living above the poverty line.
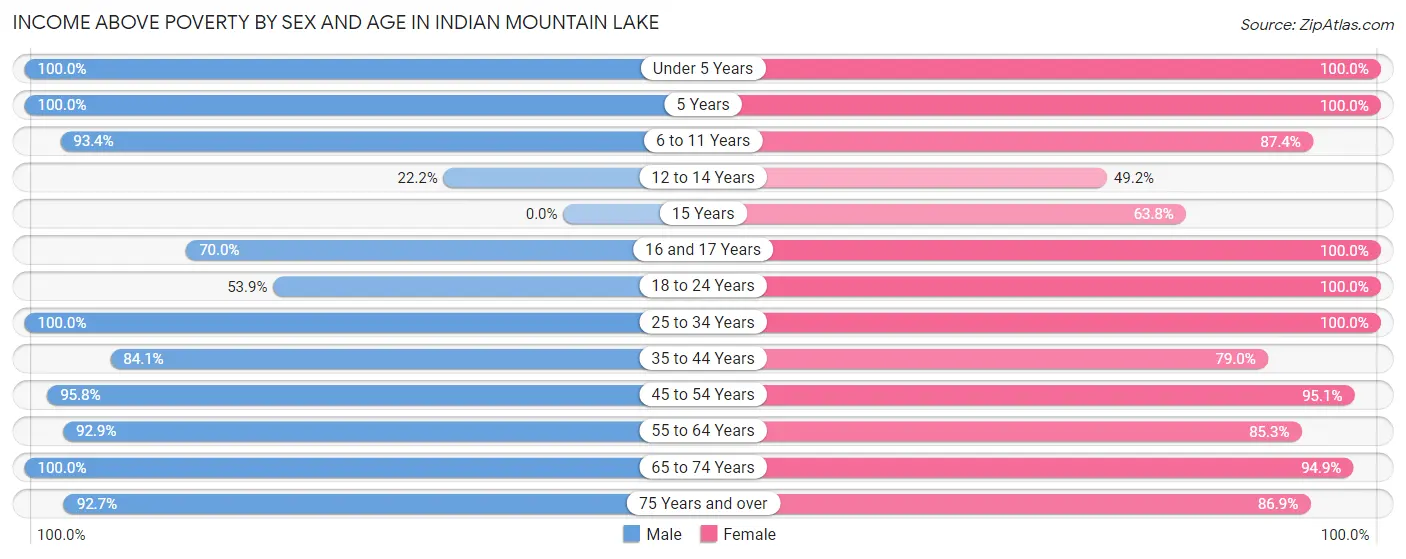
| Age Bracket | Male | Female |
| Under 5 Years | 29 (100.0%) | 132 (100.0%) |
| 5 Years | 12 (100.0%) | 17 (100.0%) |
| 6 to 11 Years | 253 (93.4%) | 97 (87.4%) |
| 12 to 14 Years | 8 (22.2%) | 31 (49.2%) |
| 15 Years | 0 (0.0%) | 30 (63.8%) |
| 16 and 17 Years | 21 (70.0%) | 98 (100.0%) |
| 18 to 24 Years | 35 (53.8%) | 154 (100.0%) |
| 25 to 34 Years | 469 (100.0%) | 203 (100.0%) |
| 35 to 44 Years | 153 (84.1%) | 196 (79.0%) |
| 45 to 54 Years | 182 (95.8%) | 175 (95.1%) |
| 55 to 64 Years | 325 (92.9%) | 330 (85.3%) |
| 65 to 74 Years | 268 (100.0%) | 243 (94.9%) |
| 75 Years and over | 140 (92.7%) | 73 (86.9%) |
| Total | 1,895 (92.3%) | 1,779 (89.7%) |
Income Below Poverty Among Married-Couple Families in Indian Mountain Lake
The poverty statistics for married-couple families in Indian Mountain Lake show that 5.3% or 55 of the total 1,039 families live below the poverty line. Families with 1 or 2 children have the highest poverty rate of 22.6%, comprising of 38 families. On the other hand, families with no children have the lowest poverty rate of 1.6%, which includes 11 families.
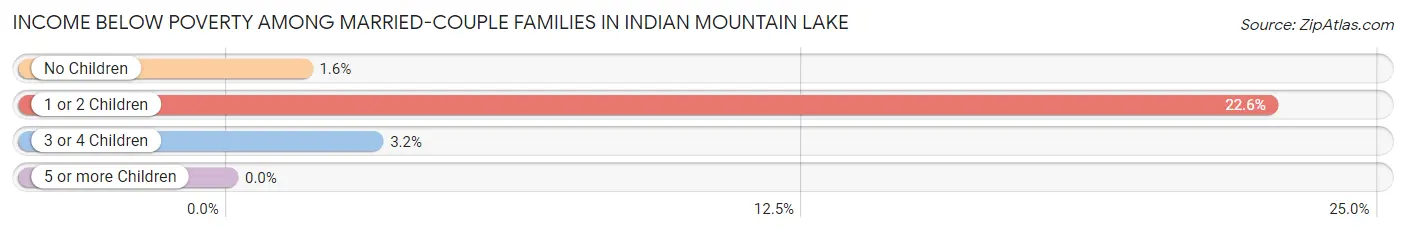
| Children | Above Poverty | Below Poverty |
| No Children | 670 (98.4%) | 11 (1.6%) |
| 1 or 2 Children | 130 (77.4%) | 38 (22.6%) |
| 3 or 4 Children | 184 (96.8%) | 6 (3.2%) |
| 5 or more Children | 0 (0.0%) | 0 (0.0%) |
| Total | 984 (94.7%) | 55 (5.3%) |
Income Below Poverty Among Single-Parent Households in Indian Mountain Lake
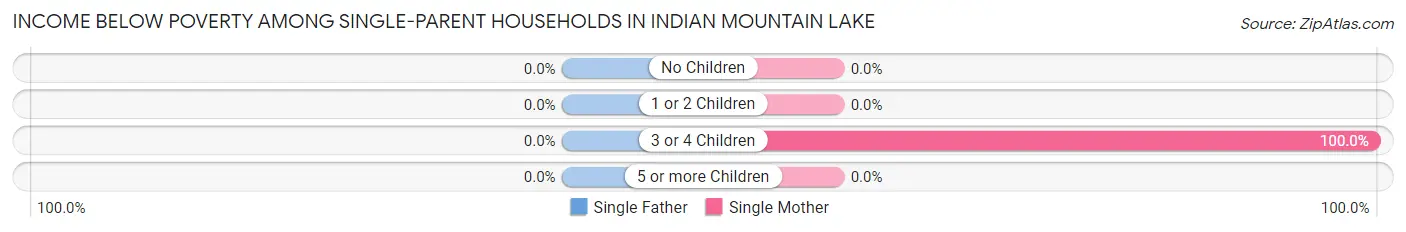
| Children | Single Father | Single Mother |
| No Children | 0 (0.0%) | 0 (0.0%) |
| 1 or 2 Children | 0 (0.0%) | 0 (0.0%) |
| 3 or 4 Children | 0 (0.0%) | 17 (100.0%) |
| 5 or more Children | 0 (0.0%) | 0 (0.0%) |
| Total | 0 (0.0%) | 17 (24.3%) |
Income Below Poverty Among Married-Couple vs Single-Parent Households in Indian Mountain Lake
The poverty data for Indian Mountain Lake shows that 55 of the married-couple family households (5.3%) and 17 of the single-parent households (14.2%) are living below the poverty level. Within the married-couple family households, those with 1 or 2 children have the highest poverty rate, with 38 households (22.6%) falling below the poverty line. Among the single-parent households, those with 3 or 4 children have the highest poverty rate, with 17 household (100.0%) living below poverty.
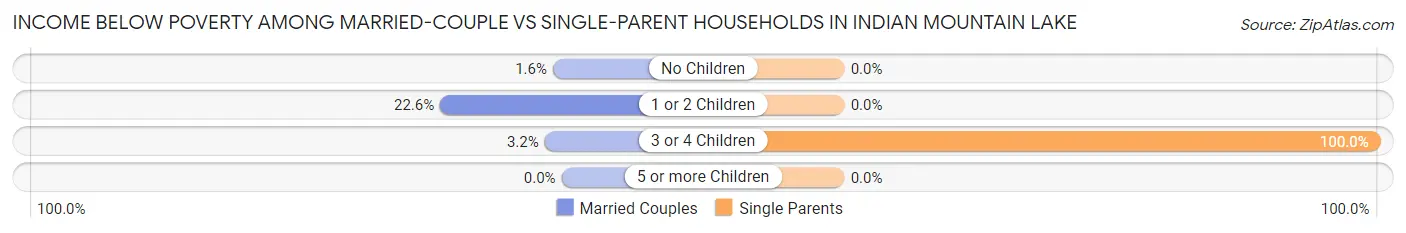
| Children | Married-Couple Families | Single-Parent Households |
| No Children | 11 (1.6%) | 0 (0.0%) |
| 1 or 2 Children | 38 (22.6%) | 0 (0.0%) |
| 3 or 4 Children | 6 (3.2%) | 17 (100.0%) |
| 5 or more Children | 0 (0.0%) | 0 (0.0%) |
| Total | 55 (5.3%) | 17 (14.2%) |
Race in Indian Mountain Lake
The most populous races in Indian Mountain Lake are White / Caucasian (3,209 | 78.3%), Hispanic or Latino (740 | 18.0%), and Black / African American (589 | 14.4%).
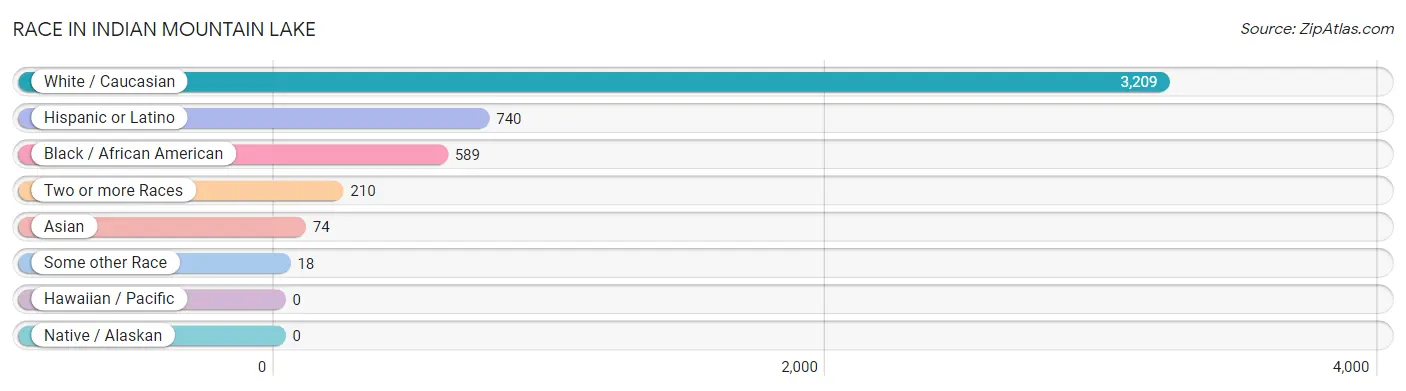
| Race | # Population | % Population |
| Asian | 74 | 1.8% |
| Black / African American | 589 | 14.4% |
| Hawaiian / Pacific | 0 | 0.0% |
| Hispanic or Latino | 740 | 18.0% |
| Native / Alaskan | 0 | 0.0% |
| White / Caucasian | 3,209 | 78.3% |
| Two or more Races | 210 | 5.1% |
| Some other Race | 18 | 0.4% |
| Total | 4,100 | 100.0% |
Ancestry in Indian Mountain Lake
The most populous ancestries reported in Indian Mountain Lake are Italian (684 | 16.7%), Irish (602 | 14.7%), Puerto Rican (562 | 13.7%), German (506 | 12.3%), and Portuguese (349 | 8.5%), together accounting for 65.9% of all Indian Mountain Lake residents.
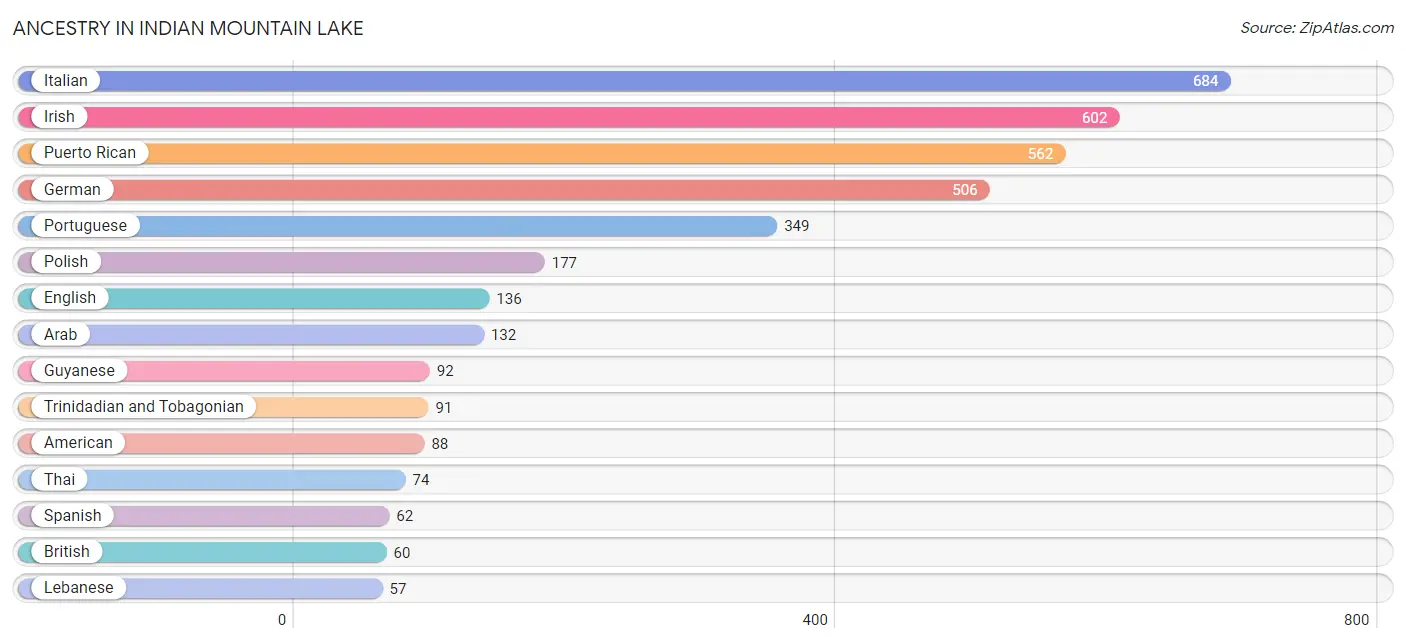
| Ancestry | # Population | % Population |
| African | 43 | 1.1% |
| American | 88 | 2.1% |
| Arab | 132 | 3.2% |
| Austrian | 22 | 0.5% |
| British | 60 | 1.5% |
| Canadian | 19 | 0.5% |
| Central American | 38 | 0.9% |
| Dutch | 20 | 0.5% |
| Ecuadorian | 35 | 0.9% |
| English | 136 | 3.3% |
| Finnish | 18 | 0.4% |
| French | 22 | 0.5% |
| French Canadian | 16 | 0.4% |
| German | 506 | 12.3% |
| Greek | 38 | 0.9% |
| Guyanese | 92 | 2.2% |
| Hungarian | 22 | 0.5% |
| Irish | 602 | 14.7% |
| Italian | 684 | 16.7% |
| Lebanese | 57 | 1.4% |
| Lithuanian | 10 | 0.2% |
| Norwegian | 12 | 0.3% |
| Pennsylvania German | 22 | 0.5% |
| Polish | 177 | 4.3% |
| Portuguese | 349 | 8.5% |
| Puerto Rican | 562 | 13.7% |
| Russian | 41 | 1.0% |
| Salvadoran | 38 | 0.9% |
| Scotch-Irish | 33 | 0.8% |
| Scottish | 57 | 1.4% |
| South American | 35 | 0.9% |
| Spaniard | 32 | 0.8% |
| Spanish | 62 | 1.5% |
| Spanish American | 11 | 0.3% |
| Subsaharan African | 43 | 1.1% |
| Thai | 74 | 1.8% |
| Trinidadian and Tobagonian | 91 | 2.2% |
| Ukrainian | 10 | 0.2% | View All 38 Rows |
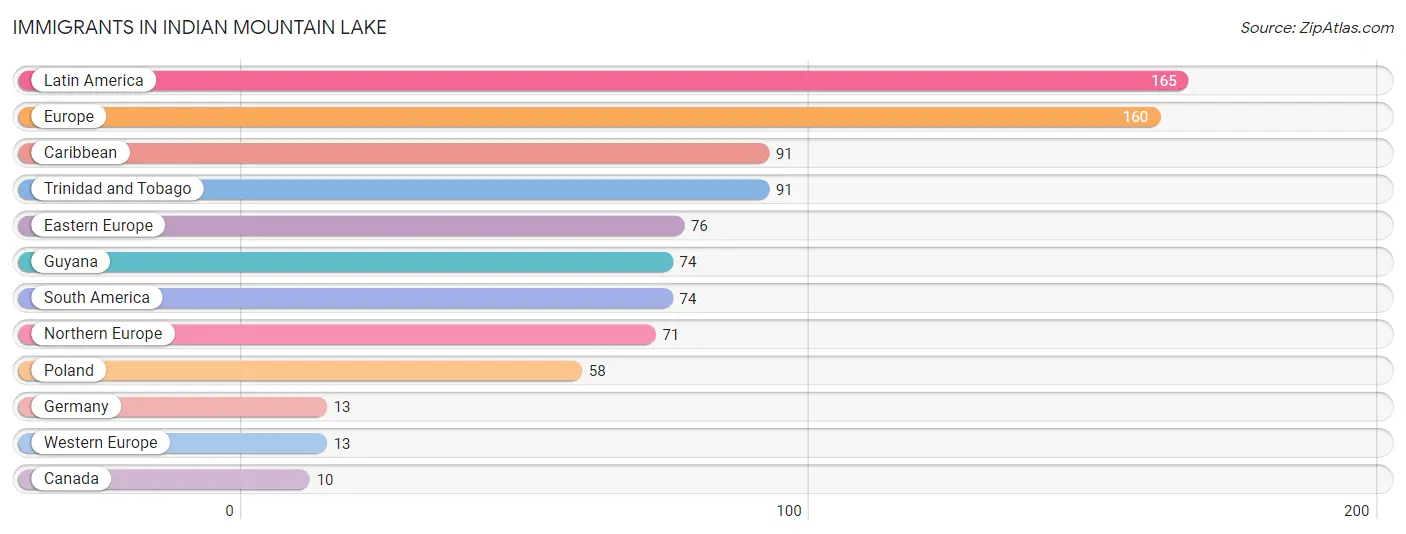
Immigrants in Indian Mountain Lake
The most numerous immigrant groups reported in Indian Mountain Lake came from Latin America (165 | 4.0%), Europe (160 | 3.9%), Caribbean (91 | 2.2%), Trinidad and Tobago (91 | 2.2%), and Eastern Europe (76 | 1.8%), together accounting for 14.2% of all Indian Mountain Lake residents.
| Immigration Origin | # Population | % Population |
| Canada | 10 | 0.2% |
| Caribbean | 91 | 2.2% |
| Eastern Europe | 76 | 1.8% |
| Europe | 160 | 3.9% |
| Germany | 13 | 0.3% |
| Guyana | 74 | 1.8% |
| Latin America | 165 | 4.0% |
| Northern Europe | 71 | 1.7% |
| Poland | 58 | 1.4% |
| South America | 74 | 1.8% |
| Trinidad and Tobago | 91 | 2.2% |
| Western Europe | 13 | 0.3% | View All 12 Rows |
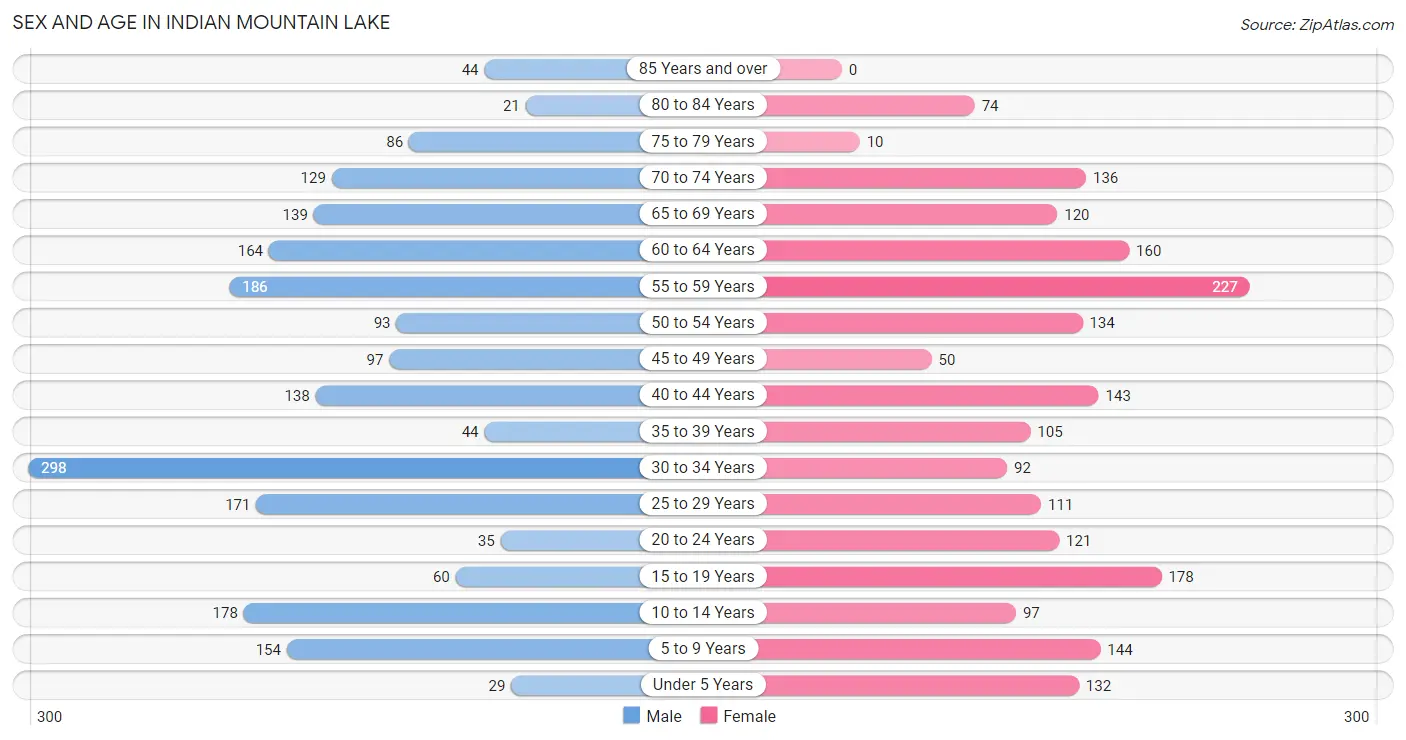
Sex and Age in Indian Mountain Lake
Sex and Age in Indian Mountain Lake
The most populous age groups in Indian Mountain Lake are 30 to 34 Years (298 | 14.4%) for men and 55 to 59 Years (227 | 11.2%) for women.
| Age Bracket | Male | Female |
| Under 5 Years | 29 (1.4%) | 132 (6.5%) |
| 5 to 9 Years | 154 (7.4%) | 144 (7.1%) |
| 10 to 14 Years | 178 (8.6%) | 97 (4.8%) |
| 15 to 19 Years | 60 (2.9%) | 178 (8.7%) |
| 20 to 24 Years | 35 (1.7%) | 121 (5.9%) |
| 25 to 29 Years | 171 (8.3%) | 111 (5.5%) |
| 30 to 34 Years | 298 (14.4%) | 92 (4.5%) |
| 35 to 39 Years | 44 (2.1%) | 105 (5.2%) |
| 40 to 44 Years | 138 (6.7%) | 143 (7.0%) |
| 45 to 49 Years | 97 (4.7%) | 50 (2.5%) |
| 50 to 54 Years | 93 (4.5%) | 134 (6.6%) |
| 55 to 59 Years | 186 (9.0%) | 227 (11.2%) |
| 60 to 64 Years | 164 (7.9%) | 160 (7.9%) |
| 65 to 69 Years | 139 (6.7%) | 120 (5.9%) |
| 70 to 74 Years | 129 (6.2%) | 136 (6.7%) |
| 75 to 79 Years | 86 (4.2%) | 10 (0.5%) |
| 80 to 84 Years | 21 (1.0%) | 74 (3.6%) |
| 85 Years and over | 44 (2.1%) | 0 (0.0%) |
| Total | 2,066 (100.0%) | 2,034 (100.0%) |
Families and Households in Indian Mountain Lake
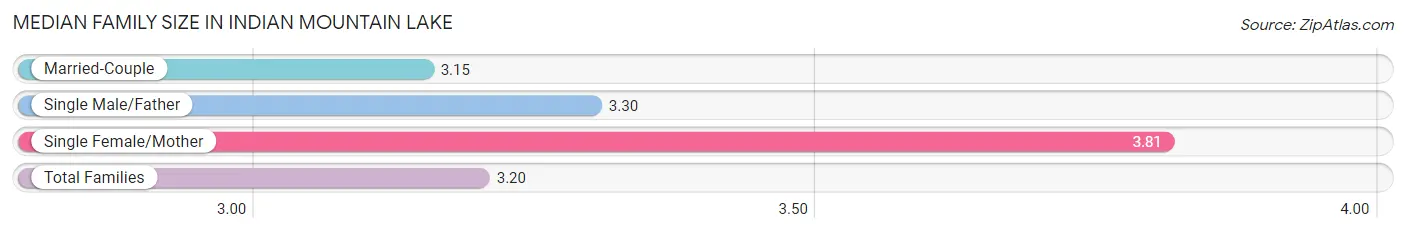
Median Family Size in Indian Mountain Lake
The median family size in Indian Mountain Lake is 3.20 persons per family, with single female/mother families (70 | 6.0%) accounting for the largest median family size of 3.81 persons per family. On the other hand, married-couple families (1,039 | 89.6%) represent the smallest median family size with 3.15 persons per family.
| Family Type | # Families | Family Size |
| Married-Couple | 1,039 (89.6%) | 3.15 |
| Single Male/Father | 50 (4.3%) | 3.30 |
| Single Female/Mother | 70 (6.0%) | 3.81 |
| Total Families | 1,159 (100.0%) | 3.20 |
Median Household Size in Indian Mountain Lake
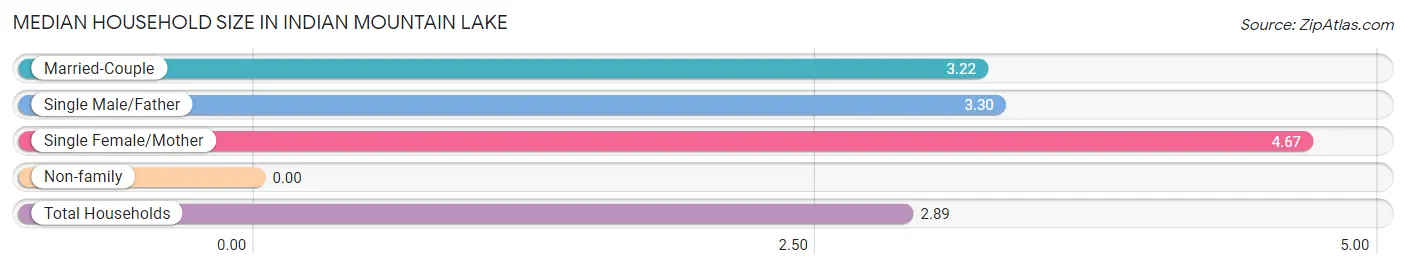
| Household Type | # Households | Household Size |
| Married-Couple | 1,039 (73.2%) | 3.22 |
| Single Male/Father | 50 (3.5%) | 3.30 |
| Single Female/Mother | 70 (4.9%) | 4.67 |
| Non-family | 261 (18.4%) | - |
| Total Households | 1,420 (100.0%) | 2.89 |
Household Size by Marriage Status in Indian Mountain Lake
Out of a total of 1,420 households in Indian Mountain Lake, 1,159 (81.6%) are family households, while 261 (18.4%) are nonfamily households. The most numerous type of family households are 2-person households, comprising 536, and the most common type of nonfamily households are 1-person households, comprising 261.
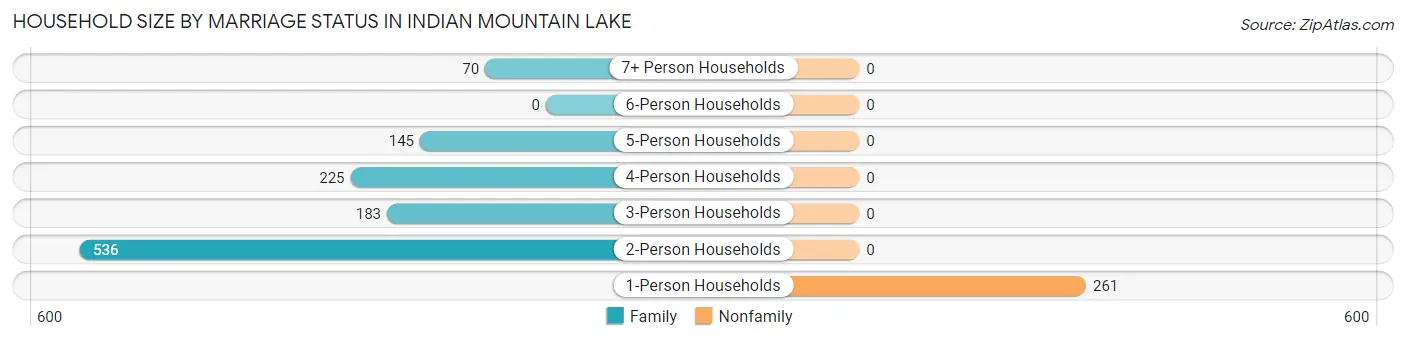
| Household Size | Family Households | Nonfamily Households |
| 1-Person Households | - | 261 (18.4%) |
| 2-Person Households | 536 (37.8%) | 0 (0.0%) |
| 3-Person Households | 183 (12.9%) | 0 (0.0%) |
| 4-Person Households | 225 (15.9%) | 0 (0.0%) |
| 5-Person Households | 145 (10.2%) | 0 (0.0%) |
| 6-Person Households | 0 (0.0%) | 0 (0.0%) |
| 7+ Person Households | 70 (4.9%) | 0 (0.0%) |
| Total | 1,159 (81.6%) | 261 (18.4%) |
Female Fertility in Indian Mountain Lake
Fertility by Age in Indian Mountain Lake
Average fertility rate in Indian Mountain Lake is 38.0 births per 1,000 women. Women in the age bracket of 20 to 34 years have the highest fertility rate with 96.0 births per 1,000 women. Women in the age bracket of 20 to 34 years acount for 100.0% of all women with births.
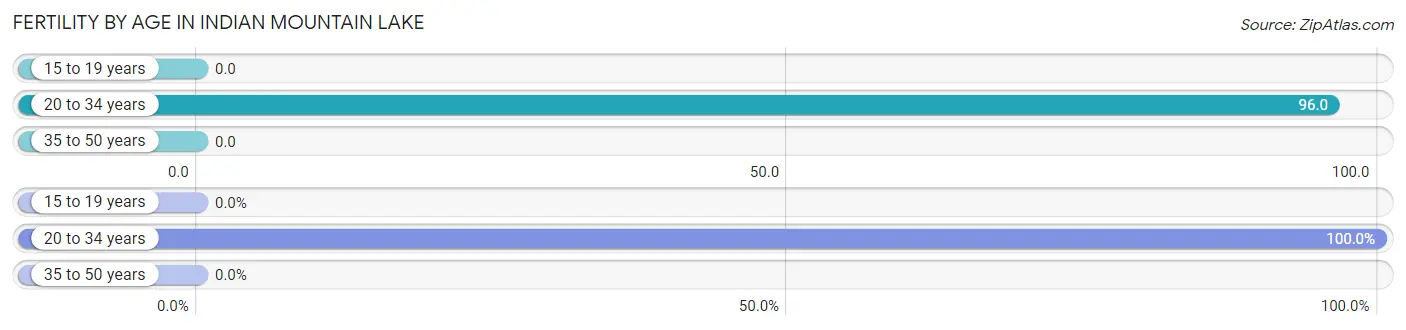
| Age Bracket | Women with Births | Births / 1,000 Women |
| 15 to 19 years | 0 (0.0%) | 0.0 |
| 20 to 34 years | 31 (100.0%) | 96.0 |
| 35 to 50 years | 0 (0.0%) | 0.0 |
| Total | 31 (100.0%) | 38.0 |
Fertility by Age by Marriage Status in Indian Mountain Lake
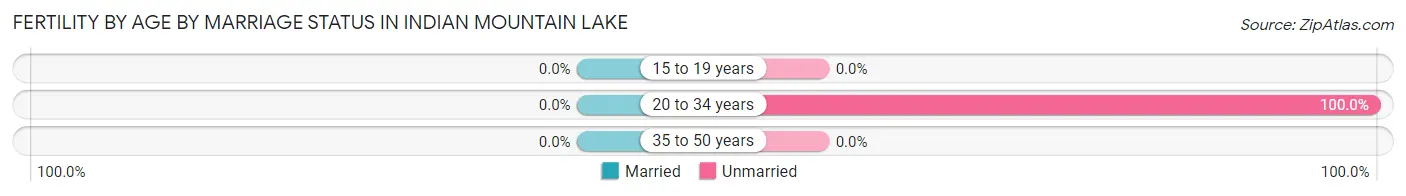
| Age Bracket | Married | Unmarried |
| 15 to 19 years | 0 (0.0%) | 0 (0.0%) |
| 20 to 34 years | 0 (0.0%) | 31 (100.0%) |
| 35 to 50 years | 0 (0.0%) | 0 (0.0%) |
| Total | 0 (0.0%) | 31 (100.0%) |
Fertility by Education in Indian Mountain Lake
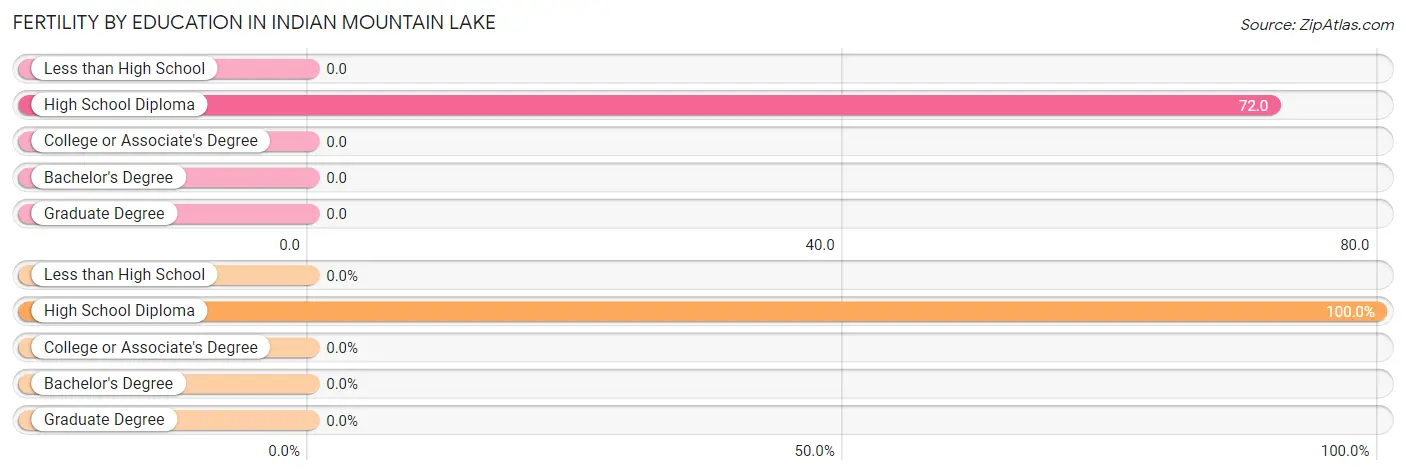
| Educational Attainment | Women with Births | Births / 1,000 Women |
| Less than High School | 0 (0.0%) | 0.0 |
| High School Diploma | 31 (100.0%) | 72.0 |
| College or Associate's Degree | 0 (0.0%) | 0.0 |
| Bachelor's Degree | 0 (0.0%) | 0.0 |
| Graduate Degree | 0 (0.0%) | 0.0 |
| Total | 31 (100.0%) | 38.0 |
Fertility by Education by Marriage Status in Indian Mountain Lake
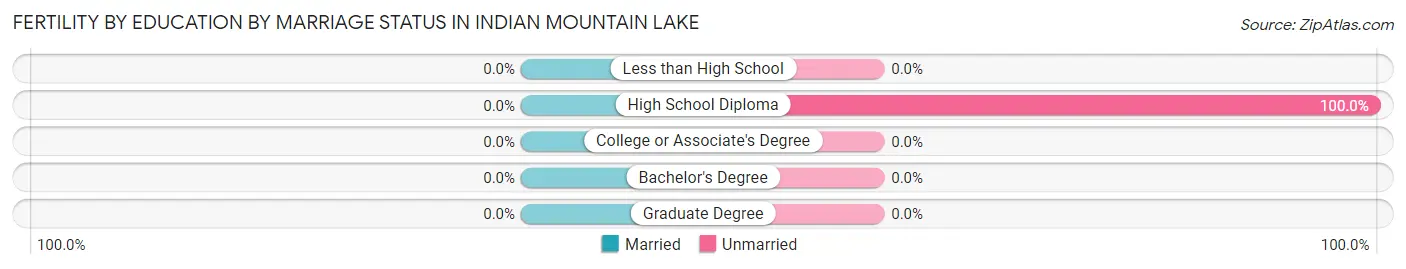
| Educational Attainment | Married | Unmarried |
| Less than High School | 0 (0.0%) | 0 (0.0%) |
| High School Diploma | 0 (0.0%) | 31 (100.0%) |
| College or Associate's Degree | 0 (0.0%) | 0 (0.0%) |
| Bachelor's Degree | 0 (0.0%) | 0 (0.0%) |
| Graduate Degree | 0 (0.0%) | 0 (0.0%) |
| Total | 0 (0.0%) | 31 (100.0%) |
Employment Characteristics in Indian Mountain Lake
Employment by Class of Employer in Indian Mountain Lake
Among the 1,479 employed individuals in Indian Mountain Lake, private company employees (1,089 | 73.6%), not-for-profit organizations (201 | 13.6%), and state government employees (89 | 6.0%) make up the most common classes of employment.
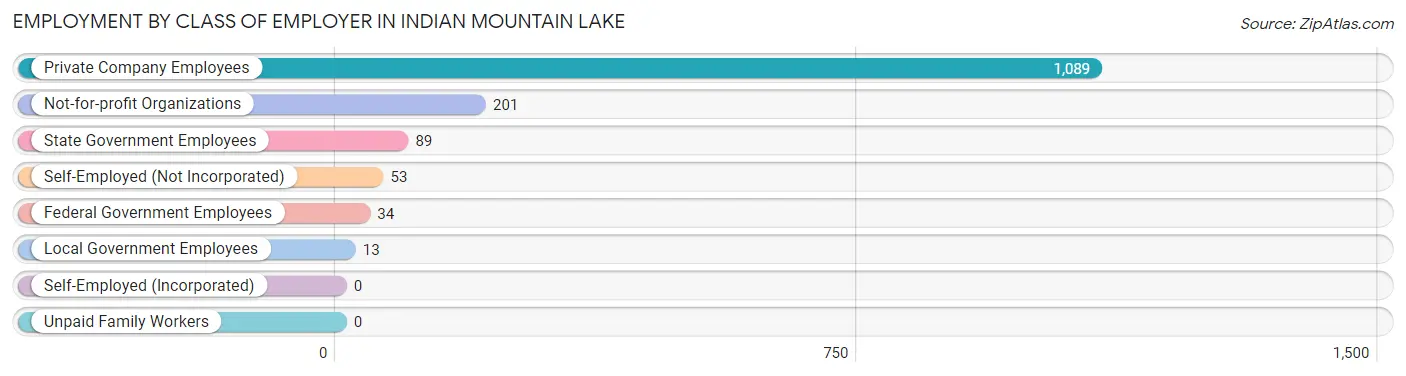
| Employer Class | # Employees | % Employees |
| Private Company Employees | 1,089 | 73.6% |
| Self-Employed (Incorporated) | 0 | 0.0% |
| Self-Employed (Not Incorporated) | 53 | 3.6% |
| Not-for-profit Organizations | 201 | 13.6% |
| Local Government Employees | 13 | 0.9% |
| State Government Employees | 89 | 6.0% |
| Federal Government Employees | 34 | 2.3% |
| Unpaid Family Workers | 0 | 0.0% |
| Total | 1,479 | 100.0% |
Employment Status by Age in Indian Mountain Lake
According to the labor force statistics for Indian Mountain Lake, out of the total population over 16 years of age (3,319), 54.7% or 1,815 individuals are in the labor force, with 9.7% or 176 of them unemployed. The age group with the highest labor force participation rate is 30 to 34 years, with 100.0% or 390 individuals in the labor force. Within the labor force, the 16 to 19 years age range has the highest percentage of unemployed individuals, with 30.3% or 33 of them being unemployed.
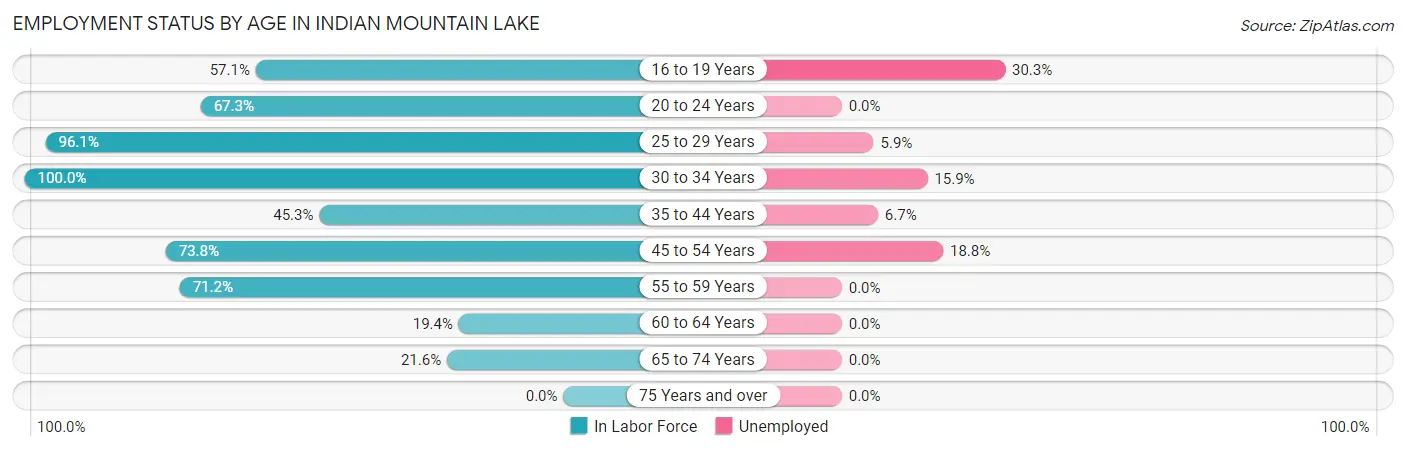
| Age Bracket | In Labor Force | Unemployed |
| 16 to 19 Years | 109 (57.1%) | 33 (30.3%) |
| 20 to 24 Years | 105 (67.3%) | 0 (0.0%) |
| 25 to 29 Years | 271 (96.1%) | 16 (5.9%) |
| 30 to 34 Years | 390 (100.0%) | 62 (15.9%) |
| 35 to 44 Years | 195 (45.3%) | 13 (6.7%) |
| 45 to 54 Years | 276 (73.8%) | 52 (18.8%) |
| 55 to 59 Years | 294 (71.2%) | 0 (0.0%) |
| 60 to 64 Years | 63 (19.4%) | 0 (0.0%) |
| 65 to 74 Years | 113 (21.6%) | 0 (0.0%) |
| 75 Years and over | 0 (0.0%) | 0 (0.0%) |
| Total | 1,815 (54.7%) | 176 (9.7%) |
Employment Status by Educational Attainment in Indian Mountain Lake
According to labor force statistics for Indian Mountain Lake, 67.3% of individuals (1,489) out of the total population between 25 and 64 years of age (2,213) are in the labor force, with 9.6% or 143 of them being unemployed. The group with the highest labor force participation rate are those with the educational attainment of bachelor's degree or higher, with 94.0% or 497 individuals in the labor force. Within the labor force, individuals with high school diploma education have the highest percentage of unemployment, with 12.7% or 74 of them being unemployed.
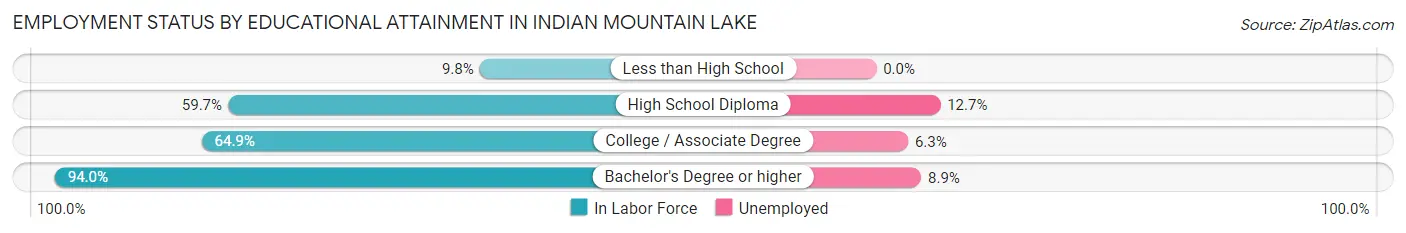
| Educational Attainment | In Labor Force | Unemployed |
| Less than High School | 9 (9.8%) | 0 (0.0%) |
| High School Diploma | 583 (59.7%) | 124 (12.7%) |
| College / Associate Degree | 400 (64.9%) | 39 (6.3%) |
| Bachelor's Degree or higher | 497 (94.0%) | 47 (8.9%) |
| Total | 1,489 (67.3%) | 212 (9.6%) |
Employment Occupations by Sex in Indian Mountain Lake
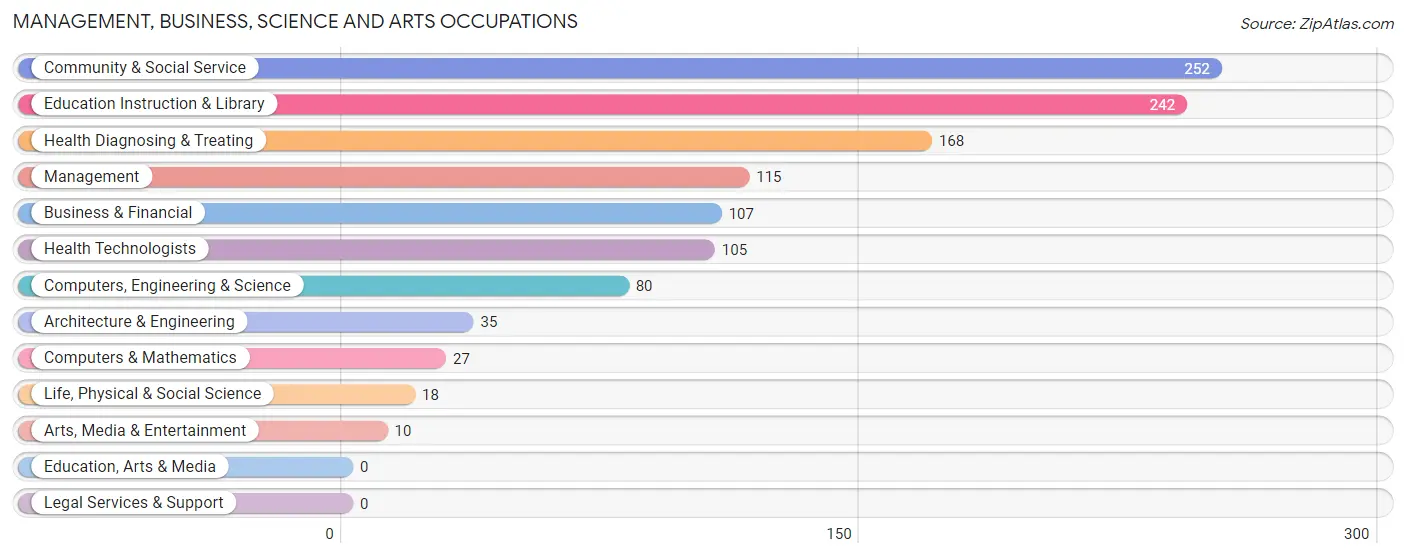
Management, Business, Science and Arts Occupations
The most common Management, Business, Science and Arts occupations in Indian Mountain Lake are Community & Social Service (252 | 15.4%), Education Instruction & Library (242 | 14.8%), Health Diagnosing & Treating (168 | 10.2%), Management (115 | 7.0%), and Business & Financial (107 | 6.5%).
Management, Business, Science and Arts Occupations by Sex
Within the Management, Business, Science and Arts occupations in Indian Mountain Lake, the most male-oriented occupations are Computers, Engineering & Science (100.0%), Computers & Mathematics (100.0%), and Architecture & Engineering (100.0%), while the most female-oriented occupations are Health Diagnosing & Treating (93.4%), Health Technologists (89.5%), and Education Instruction & Library (47.5%).
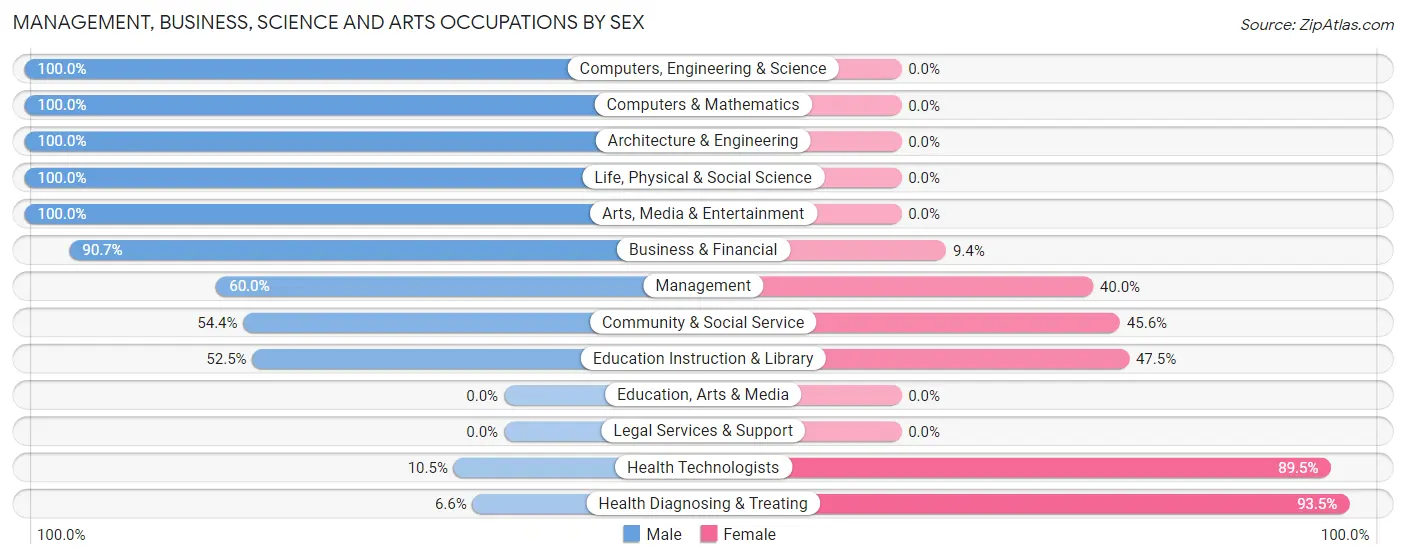
| Occupation | Male | Female |
| Management | 69 (60.0%) | 46 (40.0%) |
| Business & Financial | 97 (90.6%) | 10 (9.3%) |
| Computers, Engineering & Science | 80 (100.0%) | 0 (0.0%) |
| Computers & Mathematics | 27 (100.0%) | 0 (0.0%) |
| Architecture & Engineering | 35 (100.0%) | 0 (0.0%) |
| Life, Physical & Social Science | 18 (100.0%) | 0 (0.0%) |
| Community & Social Service | 137 (54.4%) | 115 (45.6%) |
| Education, Arts & Media | 0 (0.0%) | 0 (0.0%) |
| Legal Services & Support | 0 (0.0%) | 0 (0.0%) |
| Education Instruction & Library | 127 (52.5%) | 115 (47.5%) |
| Arts, Media & Entertainment | 10 (100.0%) | 0 (0.0%) |
| Health Diagnosing & Treating | 11 (6.6%) | 157 (93.4%) |
| Health Technologists | 11 (10.5%) | 94 (89.5%) |
| Total (Category) | 394 (54.6%) | 328 (45.4%) |
| Total (Overall) | 941 (57.4%) | 699 (42.6%) |
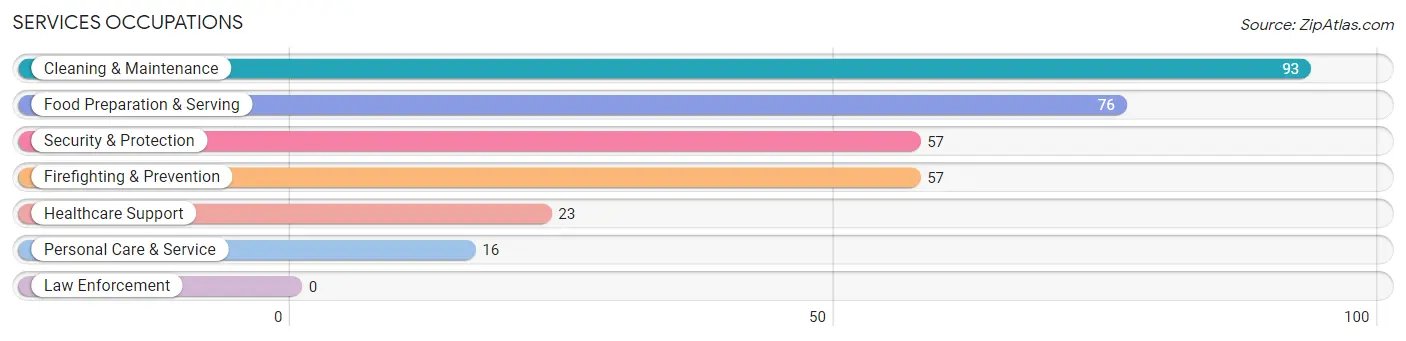
Services Occupations
The most common Services occupations in Indian Mountain Lake are Cleaning & Maintenance (93 | 5.7%), Food Preparation & Serving (76 | 4.6%), Security & Protection (57 | 3.5%), Firefighting & Prevention (57 | 3.5%), and Healthcare Support (23 | 1.4%).
Services Occupations by Sex
Within the Services occupations in Indian Mountain Lake, the most male-oriented occupations are Healthcare Support (100.0%), Security & Protection (100.0%), and Firefighting & Prevention (100.0%), while the most female-oriented occupations are Food Preparation & Serving (100.0%), and Personal Care & Service (100.0%).
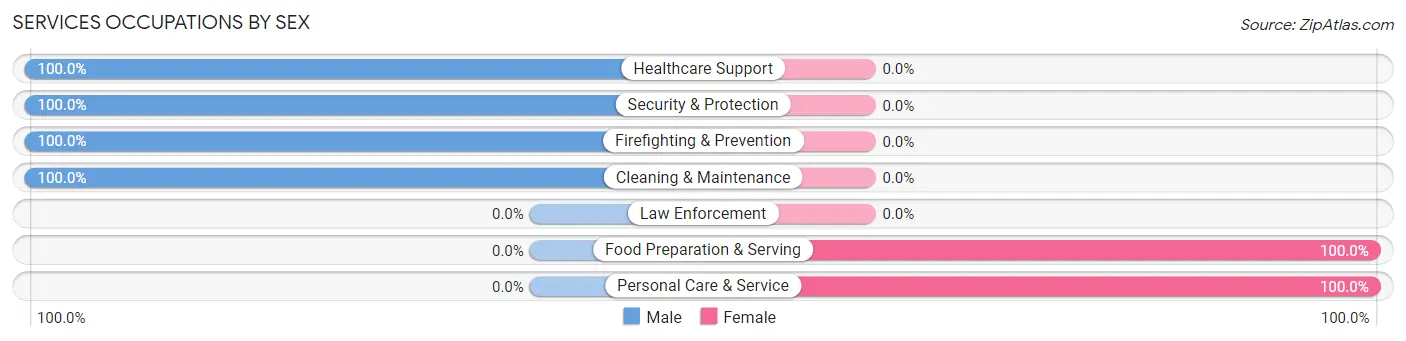
| Occupation | Male | Female |
| Healthcare Support | 23 (100.0%) | 0 (0.0%) |
| Security & Protection | 57 (100.0%) | 0 (0.0%) |
| Firefighting & Prevention | 57 (100.0%) | 0 (0.0%) |
| Law Enforcement | 0 (0.0%) | 0 (0.0%) |
| Food Preparation & Serving | 0 (0.0%) | 76 (100.0%) |
| Cleaning & Maintenance | 93 (100.0%) | 0 (0.0%) |
| Personal Care & Service | 0 (0.0%) | 16 (100.0%) |
| Total (Category) | 173 (65.3%) | 92 (34.7%) |
| Total (Overall) | 941 (57.4%) | 699 (42.6%) |
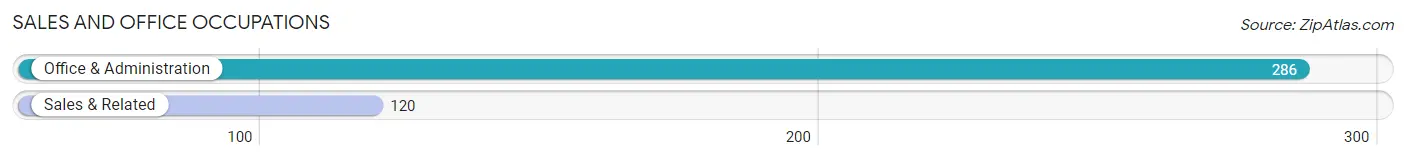
Sales and Office Occupations
The most common Sales and Office occupations in Indian Mountain Lake are Office & Administration (286 | 17.4%), and Sales & Related (120 | 7.3%).
Sales and Office Occupations by Sex
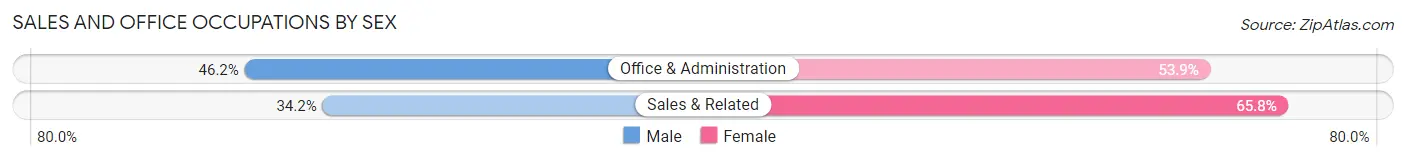
| Occupation | Male | Female |
| Sales & Related | 41 (34.2%) | 79 (65.8%) |
| Office & Administration | 132 (46.2%) | 154 (53.8%) |
| Total (Category) | 173 (42.6%) | 233 (57.4%) |
| Total (Overall) | 941 (57.4%) | 699 (42.6%) |
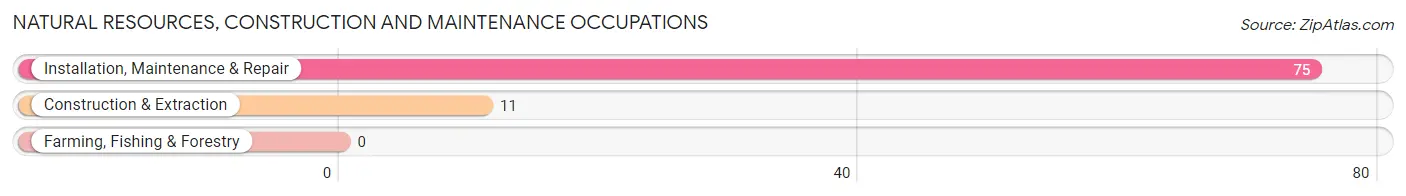
Natural Resources, Construction and Maintenance Occupations
The most common Natural Resources, Construction and Maintenance occupations in Indian Mountain Lake are Installation, Maintenance & Repair (75 | 4.6%), and Construction & Extraction (11 | 0.7%).
Natural Resources, Construction and Maintenance Occupations by Sex
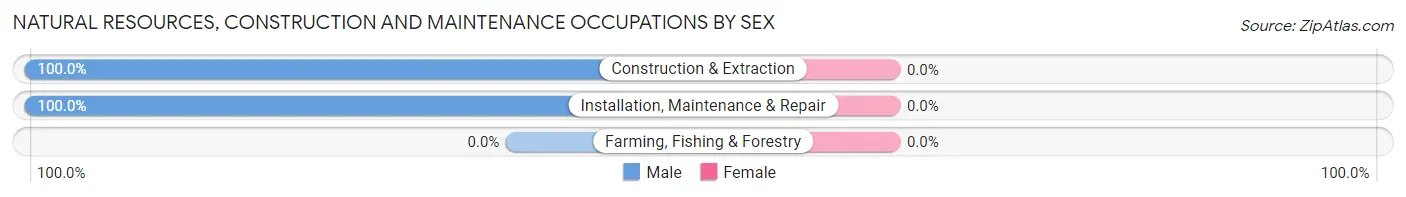
| Occupation | Male | Female |
| Farming, Fishing & Forestry | 0 (0.0%) | 0 (0.0%) |
| Construction & Extraction | 11 (100.0%) | 0 (0.0%) |
| Installation, Maintenance & Repair | 75 (100.0%) | 0 (0.0%) |
| Total (Category) | 86 (100.0%) | 0 (0.0%) |
| Total (Overall) | 941 (57.4%) | 699 (42.6%) |
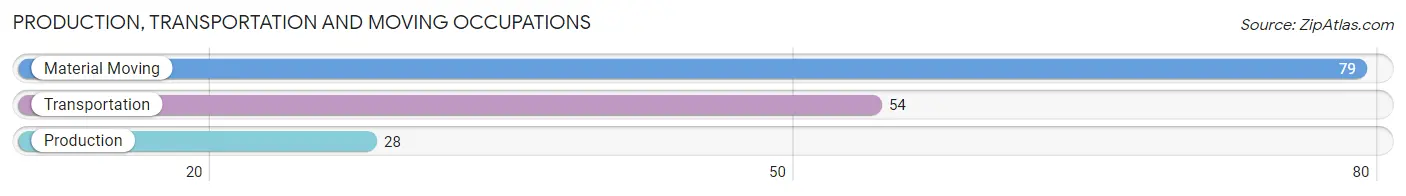
Production, Transportation and Moving Occupations
The most common Production, Transportation and Moving occupations in Indian Mountain Lake are Material Moving (79 | 4.8%), Transportation (54 | 3.3%), and Production (28 | 1.7%).
Production, Transportation and Moving Occupations by Sex
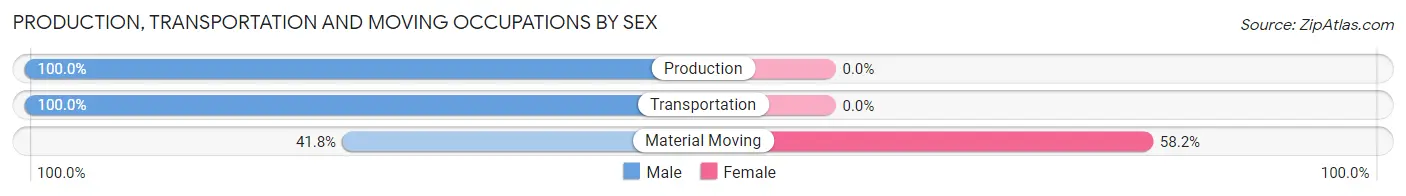
| Occupation | Male | Female |
| Production | 28 (100.0%) | 0 (0.0%) |
| Transportation | 54 (100.0%) | 0 (0.0%) |
| Material Moving | 33 (41.8%) | 46 (58.2%) |
| Total (Category) | 115 (71.4%) | 46 (28.6%) |
| Total (Overall) | 941 (57.4%) | 699 (42.6%) |
Employment Industries by Sex in Indian Mountain Lake
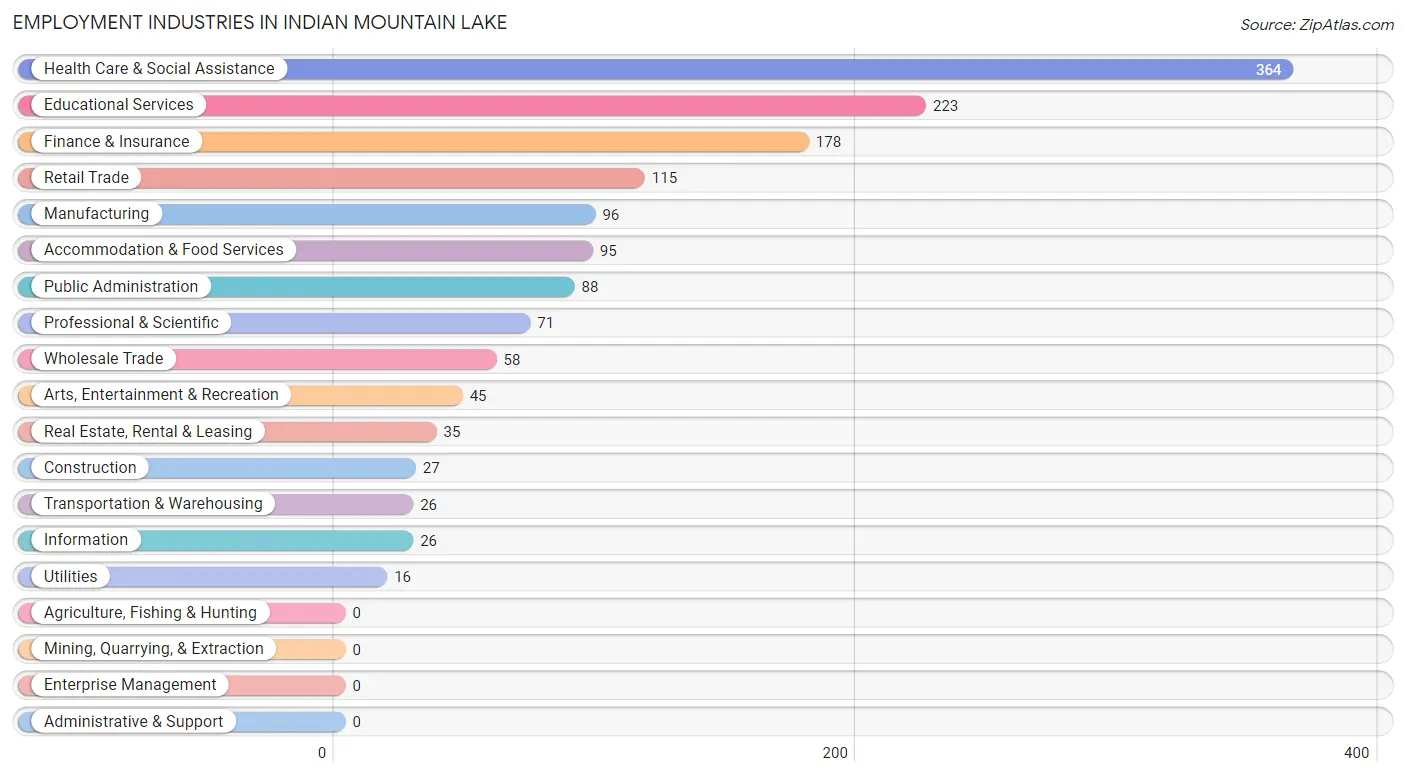
Employment Industries in Indian Mountain Lake
The major employment industries in Indian Mountain Lake include Health Care & Social Assistance (364 | 22.2%), Educational Services (223 | 13.6%), Finance & Insurance (178 | 10.8%), Retail Trade (115 | 7.0%), and Manufacturing (96 | 5.9%).
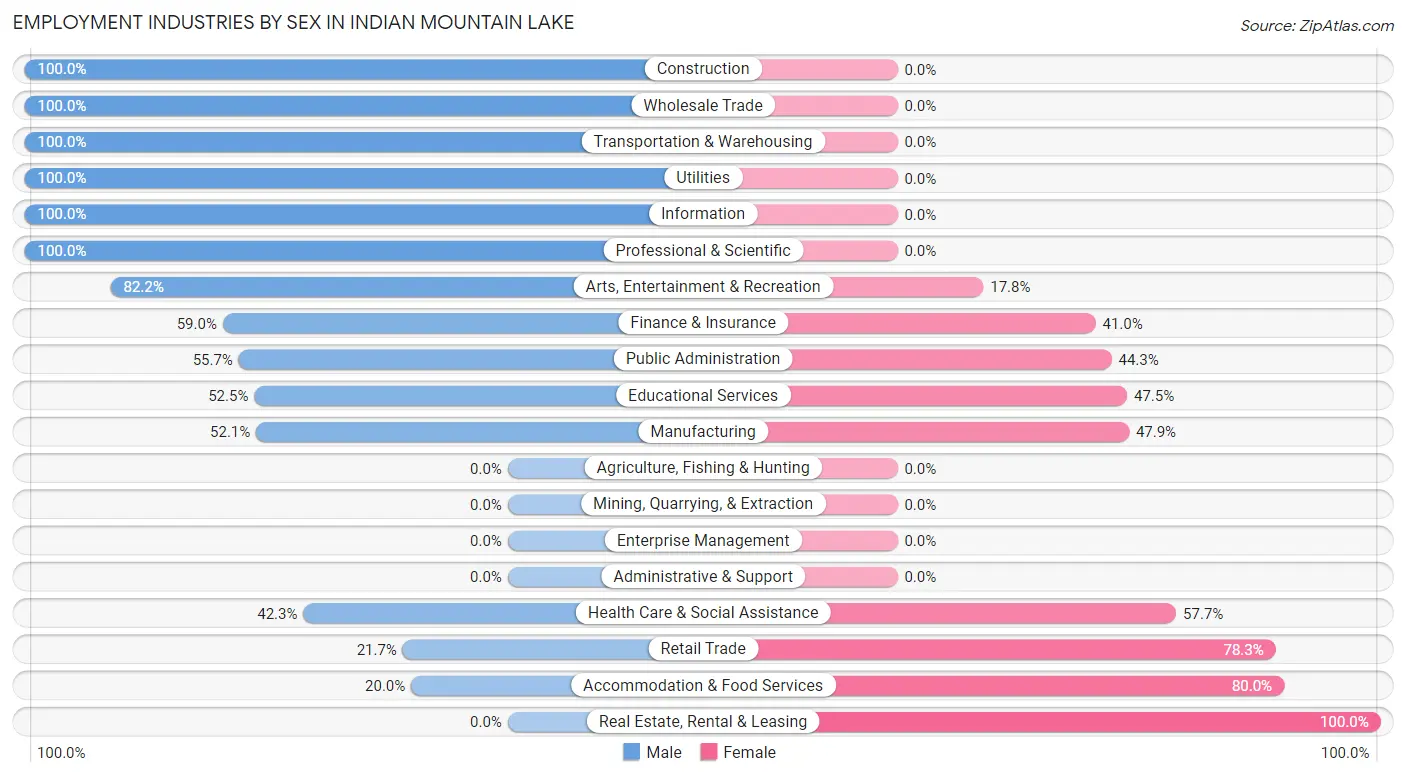
Employment Industries by Sex in Indian Mountain Lake
The Indian Mountain Lake industries that see more men than women are Construction (100.0%), Wholesale Trade (100.0%), and Transportation & Warehousing (100.0%), whereas the industries that tend to have a higher number of women are Real Estate, Rental & Leasing (100.0%), Accommodation & Food Services (80.0%), and Retail Trade (78.3%).
| Industry | Male | Female |
| Agriculture, Fishing & Hunting | 0 (0.0%) | 0 (0.0%) |
| Mining, Quarrying, & Extraction | 0 (0.0%) | 0 (0.0%) |
| Construction | 27 (100.0%) | 0 (0.0%) |
| Manufacturing | 50 (52.1%) | 46 (47.9%) |
| Wholesale Trade | 58 (100.0%) | 0 (0.0%) |
| Retail Trade | 25 (21.7%) | 90 (78.3%) |
| Transportation & Warehousing | 26 (100.0%) | 0 (0.0%) |
| Utilities | 16 (100.0%) | 0 (0.0%) |
| Information | 26 (100.0%) | 0 (0.0%) |
| Finance & Insurance | 105 (59.0%) | 73 (41.0%) |
| Real Estate, Rental & Leasing | 0 (0.0%) | 35 (100.0%) |
| Professional & Scientific | 71 (100.0%) | 0 (0.0%) |
| Enterprise Management | 0 (0.0%) | 0 (0.0%) |
| Administrative & Support | 0 (0.0%) | 0 (0.0%) |
| Educational Services | 117 (52.5%) | 106 (47.5%) |
| Health Care & Social Assistance | 154 (42.3%) | 210 (57.7%) |
| Arts, Entertainment & Recreation | 37 (82.2%) | 8 (17.8%) |
| Accommodation & Food Services | 19 (20.0%) | 76 (80.0%) |
| Public Administration | 49 (55.7%) | 39 (44.3%) |
| Total | 941 (57.4%) | 699 (42.6%) |
Education in Indian Mountain Lake
School Enrollment in Indian Mountain Lake
The most common levels of schooling among the 932 students in Indian Mountain Lake are elementary school (331 | 35.5%), high school (268 | 28.8%), and middle school (150 | 16.1%).
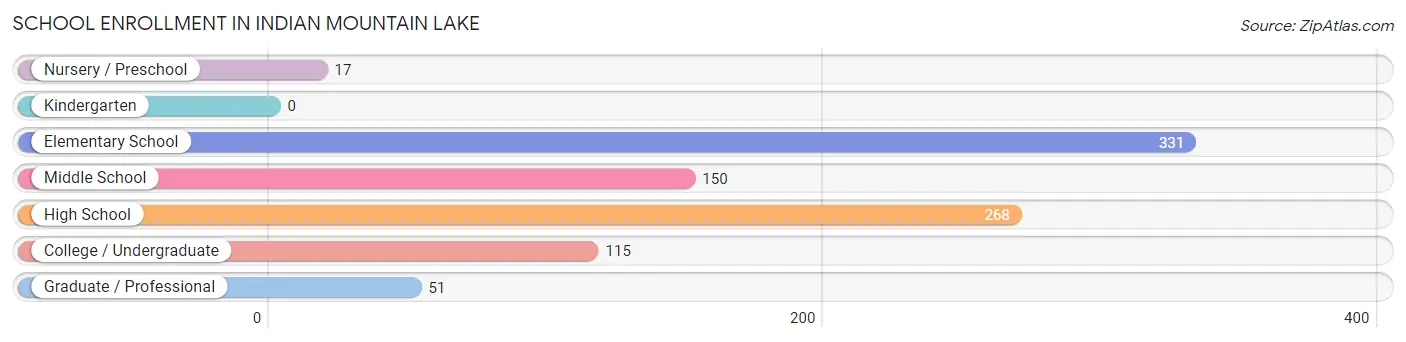
| School Level | # Students | % Students |
| Nursery / Preschool | 17 | 1.8% |
| Kindergarten | 0 | 0.0% |
| Elementary School | 331 | 35.5% |
| Middle School | 150 | 16.1% |
| High School | 268 | 28.8% |
| College / Undergraduate | 115 | 12.3% |
| Graduate / Professional | 51 | 5.5% |
| Total | 932 | 100.0% |
School Enrollment by Age by Funding Source in Indian Mountain Lake
Out of a total of 932 students who are enrolled in schools in Indian Mountain Lake, 131 (14.1%) attend a private institution, while the remaining 801 (85.9%) are enrolled in public schools. The age group of 20 to 24 year olds has the highest likelihood of being enrolled in private schools, with 102 (100.0% in the age bracket) enrolled. Conversely, the age group of 3 to 4 year olds has the lowest likelihood of being enrolled in a private school, with 17 (100.0% in the age bracket) attending a public institution.
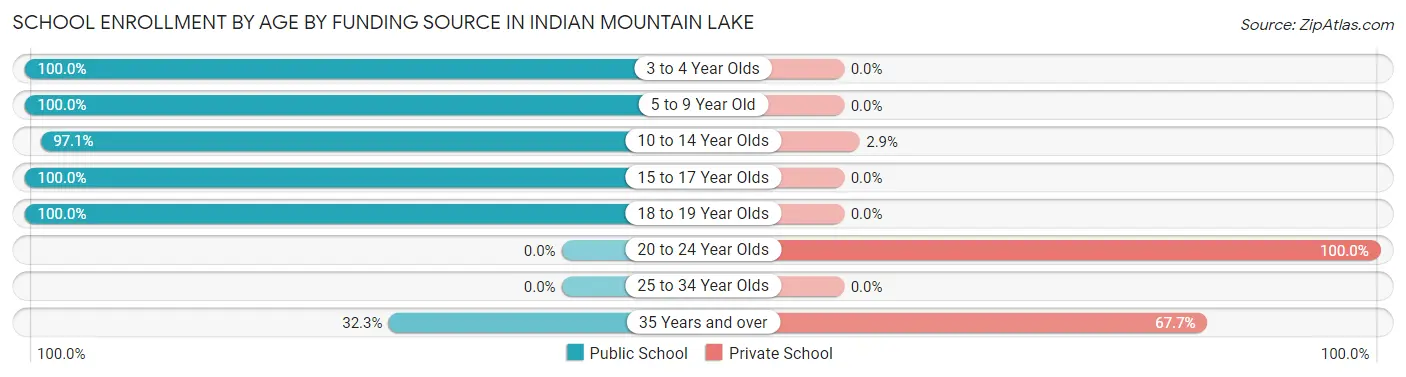
| Age Bracket | Public School | Private School |
| 3 to 4 Year Olds | 17 (100.0%) | 0 (0.0%) |
| 5 to 9 Year Old | 269 (100.0%) | 0 (0.0%) |
| 10 to 14 Year Olds | 267 (97.1%) | 8 (2.9%) |
| 15 to 17 Year Olds | 175 (100.0%) | 0 (0.0%) |
| 18 to 19 Year Olds | 63 (100.0%) | 0 (0.0%) |
| 20 to 24 Year Olds | 0 (0.0%) | 102 (100.0%) |
| 25 to 34 Year Olds | 0 (0.0%) | 0 (0.0%) |
| 35 Years and over | 10 (32.3%) | 21 (67.7%) |
| Total | 801 (85.9%) | 131 (14.1%) |
Educational Attainment by Field of Study in Indian Mountain Lake
Business (290 | 40.5%), liberal arts & history (89 | 12.4%), arts & humanities (75 | 10.5%), education (47 | 6.6%), and literature & languages (47 | 6.6%) are the most common fields of study among 716 individuals in Indian Mountain Lake who have obtained a bachelor's degree or higher.
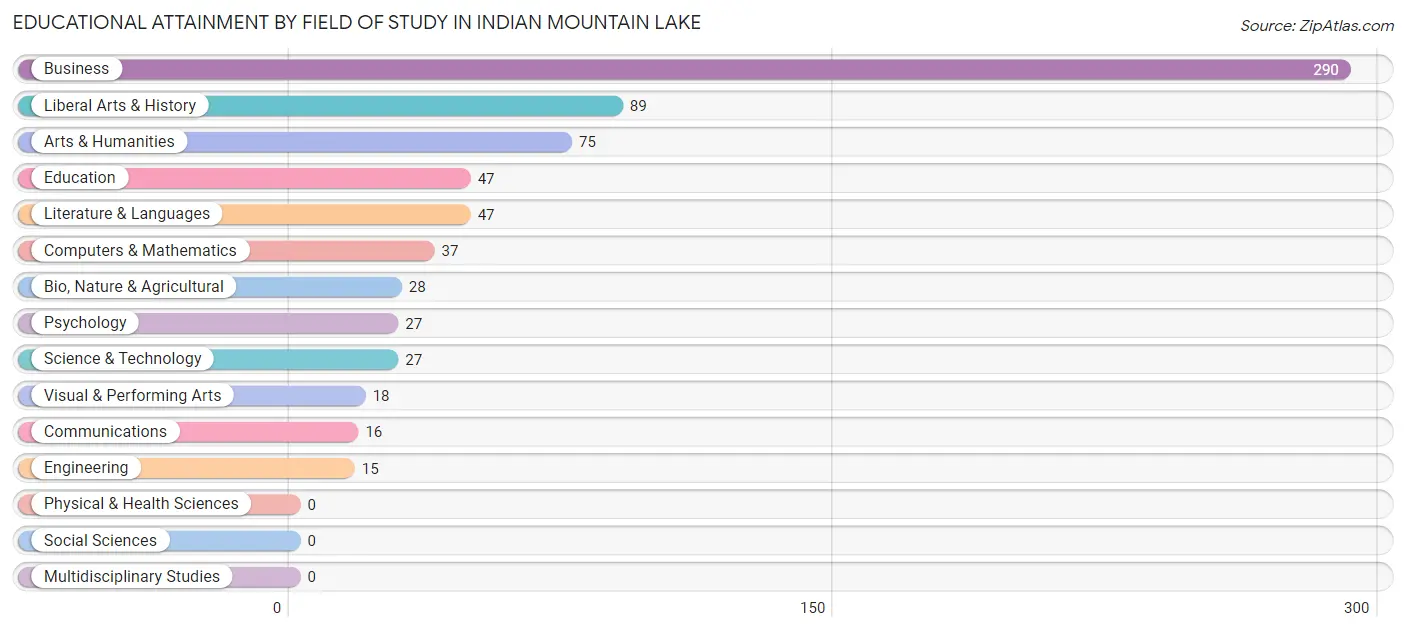
| Field of Study | # Graduates | % Graduates |
| Computers & Mathematics | 37 | 5.2% |
| Bio, Nature & Agricultural | 28 | 3.9% |
| Physical & Health Sciences | 0 | 0.0% |
| Psychology | 27 | 3.8% |
| Social Sciences | 0 | 0.0% |
| Engineering | 15 | 2.1% |
| Multidisciplinary Studies | 0 | 0.0% |
| Science & Technology | 27 | 3.8% |
| Business | 290 | 40.5% |
| Education | 47 | 6.6% |
| Literature & Languages | 47 | 6.6% |
| Liberal Arts & History | 89 | 12.4% |
| Visual & Performing Arts | 18 | 2.5% |
| Communications | 16 | 2.2% |
| Arts & Humanities | 75 | 10.5% |
| Total | 716 | 100.0% |
Transportation & Commute in Indian Mountain Lake
Vehicle Availability by Sex in Indian Mountain Lake
The most prevalent vehicle ownership categories in Indian Mountain Lake are males with 2 vehicles (409, accounting for 46.9%) and females with 2 vehicles (255, making up 67.5%).
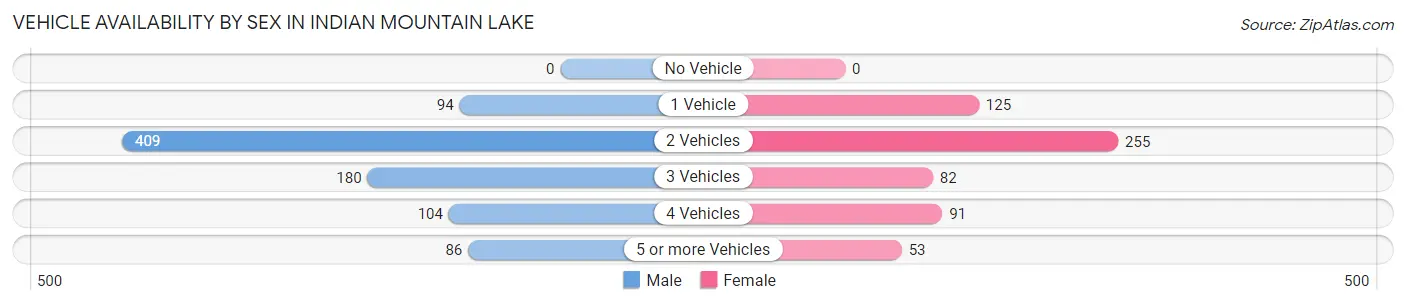
| Vehicles Available | Male | Female |
| No Vehicle | 0 (0.0%) | 0 (0.0%) |
| 1 Vehicle | 94 (10.8%) | 125 (20.6%) |
| 2 Vehicles | 409 (46.9%) | 255 (42.1%) |
| 3 Vehicles | 180 (20.6%) | 82 (13.5%) |
| 4 Vehicles | 104 (11.9%) | 91 (15.0%) |
| 5 or more Vehicles | 86 (9.9%) | 53 (8.7%) |
| Total | 873 (100.0%) | 606 (100.0%) |
Commute Time in Indian Mountain Lake
The most frequently occuring commute durations in Indian Mountain Lake are 60 to 89 minutes (342 commuters, 26.1%), 45 to 59 minutes (154 commuters, 11.8%), and 25 to 29 minutes (151 commuters, 11.5%).
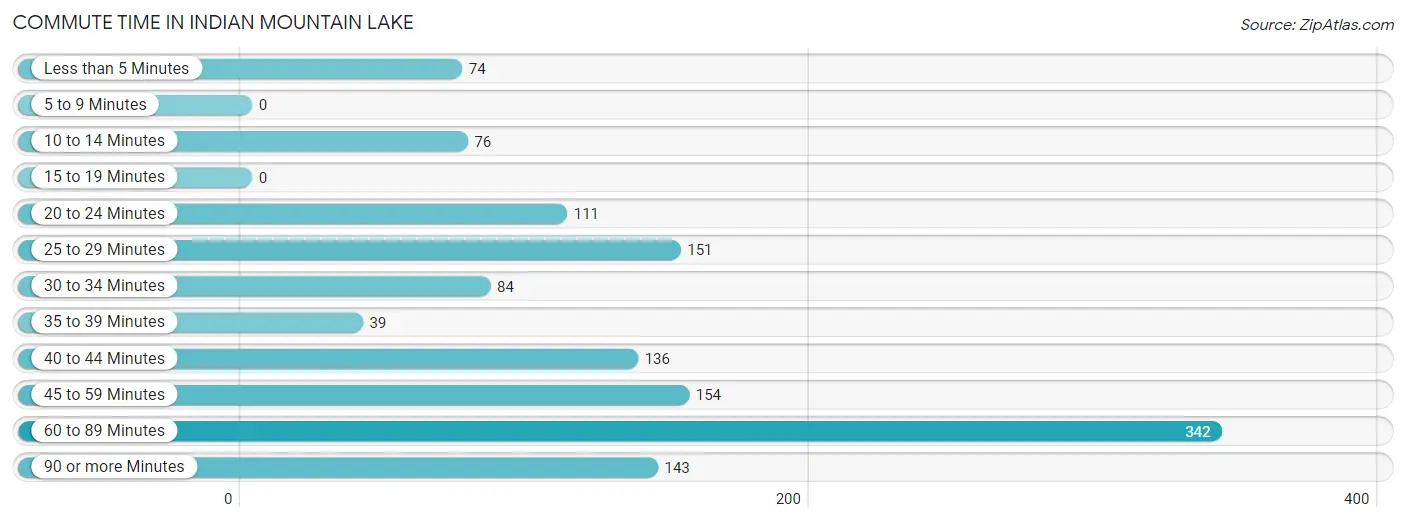
| Commute Time | # Commuters | % Commuters |
| Less than 5 Minutes | 74 | 5.7% |
| 5 to 9 Minutes | 0 | 0.0% |
| 10 to 14 Minutes | 76 | 5.8% |
| 15 to 19 Minutes | 0 | 0.0% |
| 20 to 24 Minutes | 111 | 8.5% |
| 25 to 29 Minutes | 151 | 11.5% |
| 30 to 34 Minutes | 84 | 6.4% |
| 35 to 39 Minutes | 39 | 3.0% |
| 40 to 44 Minutes | 136 | 10.4% |
| 45 to 59 Minutes | 154 | 11.8% |
| 60 to 89 Minutes | 342 | 26.1% |
| 90 or more Minutes | 143 | 10.9% |
Commute Time by Sex in Indian Mountain Lake
The most common commute times in Indian Mountain Lake are 60 to 89 minutes (214 commuters, 27.9%) for males and 45 to 59 minutes (130 commuters, 24.0%) for females.
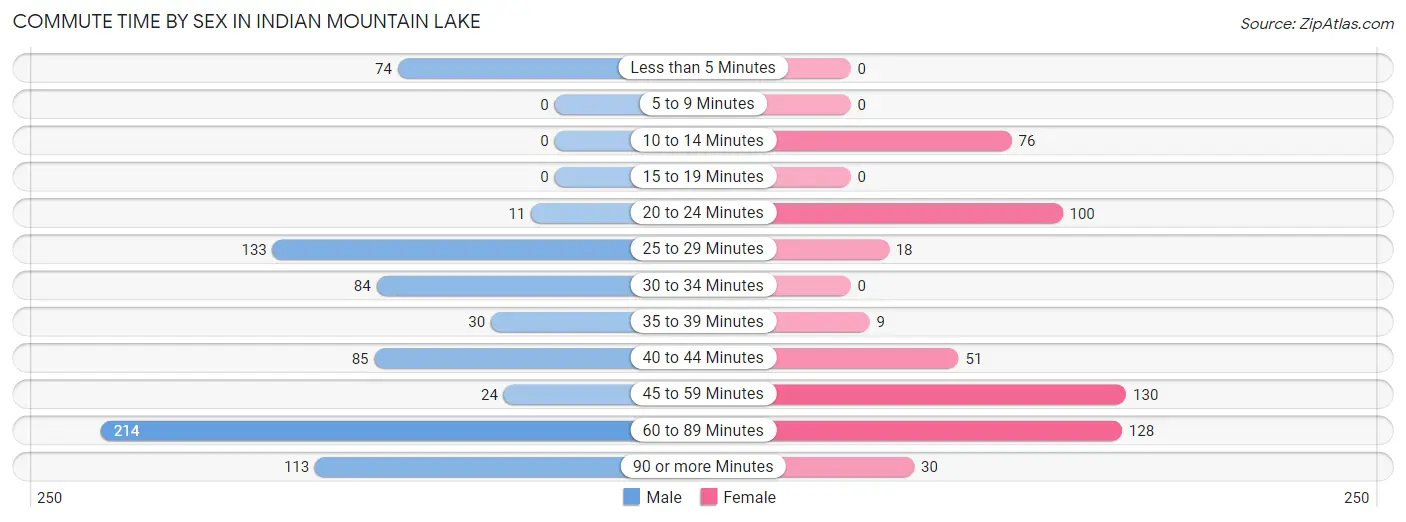
| Commute Time | Male | Female |
| Less than 5 Minutes | 74 (9.6%) | 0 (0.0%) |
| 5 to 9 Minutes | 0 (0.0%) | 0 (0.0%) |
| 10 to 14 Minutes | 0 (0.0%) | 76 (14.0%) |
| 15 to 19 Minutes | 0 (0.0%) | 0 (0.0%) |
| 20 to 24 Minutes | 11 (1.4%) | 100 (18.4%) |
| 25 to 29 Minutes | 133 (17.3%) | 18 (3.3%) |
| 30 to 34 Minutes | 84 (10.9%) | 0 (0.0%) |
| 35 to 39 Minutes | 30 (3.9%) | 9 (1.7%) |
| 40 to 44 Minutes | 85 (11.1%) | 51 (9.4%) |
| 45 to 59 Minutes | 24 (3.1%) | 130 (24.0%) |
| 60 to 89 Minutes | 214 (27.9%) | 128 (23.6%) |
| 90 or more Minutes | 113 (14.7%) | 30 (5.5%) |
Time of Departure to Work by Sex in Indian Mountain Lake
The most frequent times of departure to work in Indian Mountain Lake are 6:00 AM to 6:29 AM (177, 23.1%) for males and 12:00 PM to 3:59 PM (136, 25.1%) for females.
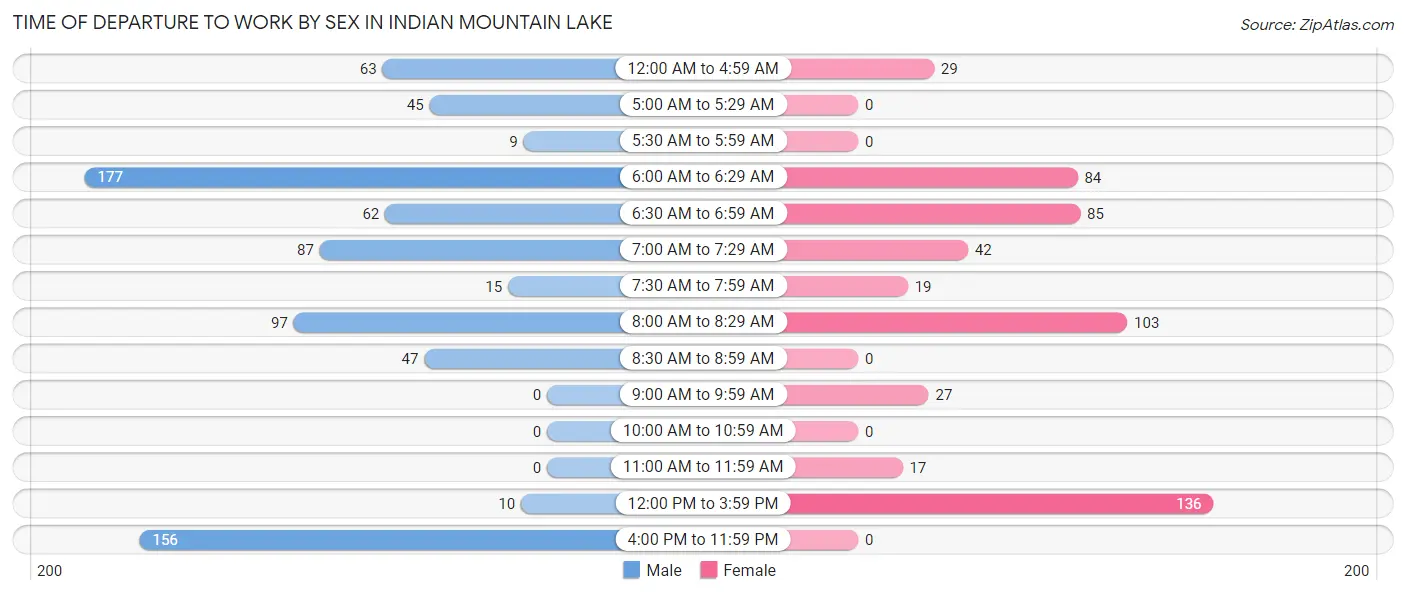
| Time of Departure | Male | Female |
| 12:00 AM to 4:59 AM | 63 (8.2%) | 29 (5.3%) |
| 5:00 AM to 5:29 AM | 45 (5.9%) | 0 (0.0%) |
| 5:30 AM to 5:59 AM | 9 (1.2%) | 0 (0.0%) |
| 6:00 AM to 6:29 AM | 177 (23.1%) | 84 (15.5%) |
| 6:30 AM to 6:59 AM | 62 (8.1%) | 85 (15.7%) |
| 7:00 AM to 7:29 AM | 87 (11.3%) | 42 (7.7%) |
| 7:30 AM to 7:59 AM | 15 (1.9%) | 19 (3.5%) |
| 8:00 AM to 8:29 AM | 97 (12.6%) | 103 (19.0%) |
| 8:30 AM to 8:59 AM | 47 (6.1%) | 0 (0.0%) |
| 9:00 AM to 9:59 AM | 0 (0.0%) | 27 (5.0%) |
| 10:00 AM to 10:59 AM | 0 (0.0%) | 0 (0.0%) |
| 11:00 AM to 11:59 AM | 0 (0.0%) | 17 (3.1%) |
| 12:00 PM to 3:59 PM | 10 (1.3%) | 136 (25.1%) |
| 4:00 PM to 11:59 PM | 156 (20.3%) | 0 (0.0%) |
| Total | 768 (100.0%) | 542 (100.0%) |
Housing Occupancy in Indian Mountain Lake
Occupancy by Ownership in Indian Mountain Lake
Of the total 1,420 dwellings in Indian Mountain Lake, owner-occupied units account for 1,216 (85.6%), while renter-occupied units make up 204 (14.4%).
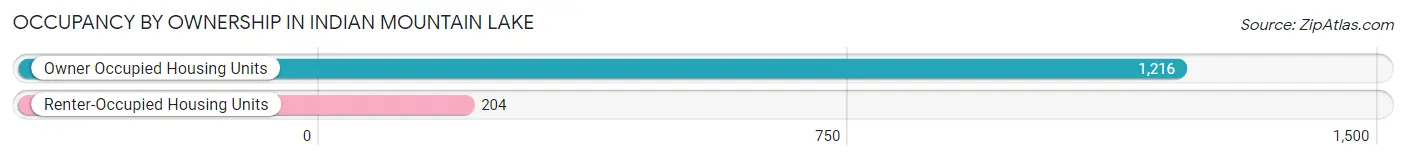
| Occupancy | # Housing Units | % Housing Units |
| Owner Occupied Housing Units | 1,216 | 85.6% |
| Renter-Occupied Housing Units | 204 | 14.4% |
| Total Occupied Housing Units | 1,420 | 100.0% |
Occupancy by Household Size in Indian Mountain Lake
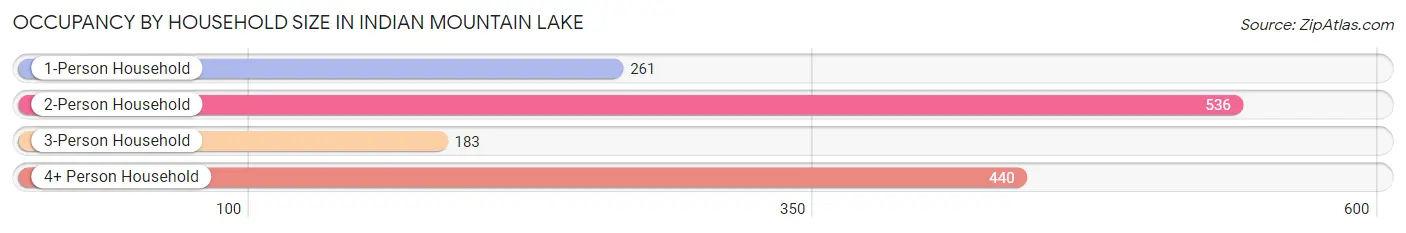
| Household Size | # Housing Units | % Housing Units |
| 1-Person Household | 261 | 18.4% |
| 2-Person Household | 536 | 37.8% |
| 3-Person Household | 183 | 12.9% |
| 4+ Person Household | 440 | 31.0% |
| Total Housing Units | 1,420 | 100.0% |
Occupancy by Ownership by Household Size in Indian Mountain Lake
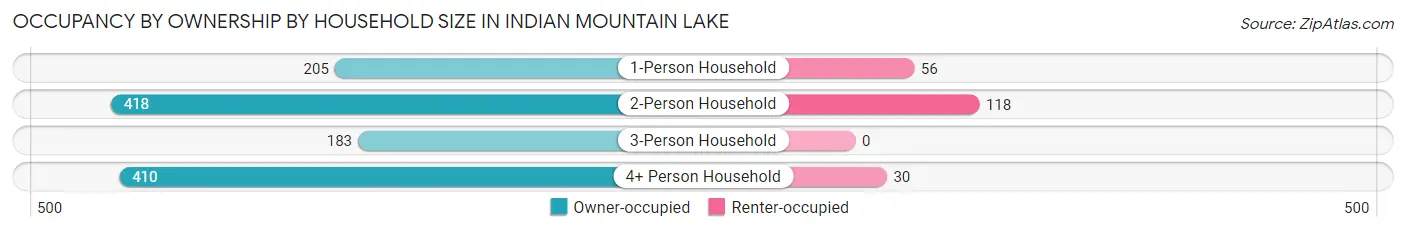
| Household Size | Owner-occupied | Renter-occupied |
| 1-Person Household | 205 (78.5%) | 56 (21.5%) |
| 2-Person Household | 418 (78.0%) | 118 (22.0%) |
| 3-Person Household | 183 (100.0%) | 0 (0.0%) |
| 4+ Person Household | 410 (93.2%) | 30 (6.8%) |
| Total Housing Units | 1,216 (85.6%) | 204 (14.4%) |
Occupancy by Educational Attainment in Indian Mountain Lake
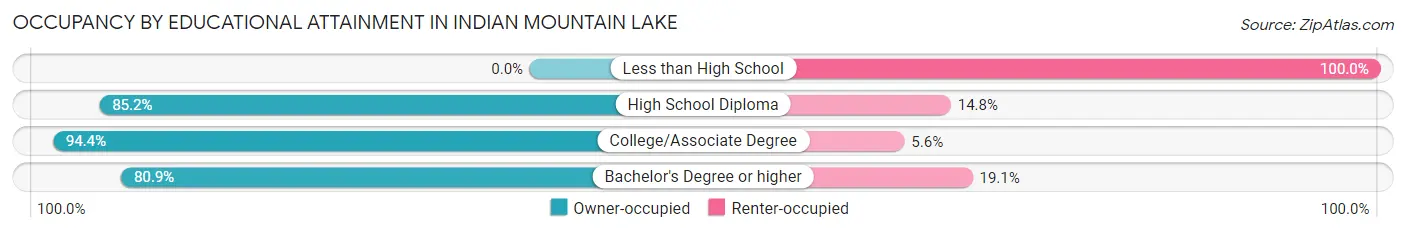
| Household Size | Owner-occupied | Renter-occupied |
| Less than High School | 0 (0.0%) | 27 (100.0%) |
| High School Diploma | 524 (85.2%) | 91 (14.8%) |
| College/Associate Degree | 438 (94.4%) | 26 (5.6%) |
| Bachelor's Degree or higher | 254 (80.9%) | 60 (19.1%) |
Occupancy by Age of Householder in Indian Mountain Lake
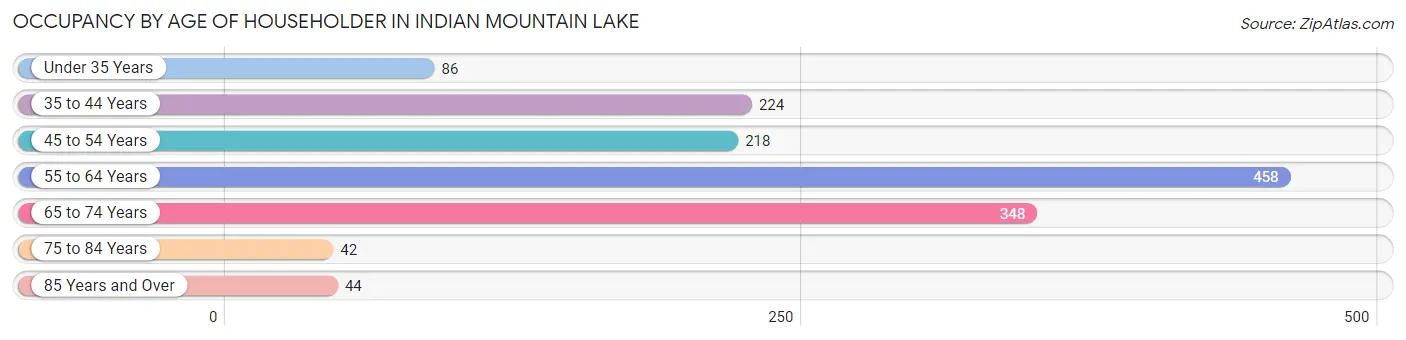
| Age Bracket | # Households | % Households |
| Under 35 Years | 86 | 6.1% |
| 35 to 44 Years | 224 | 15.8% |
| 45 to 54 Years | 218 | 15.3% |
| 55 to 64 Years | 458 | 32.3% |
| 65 to 74 Years | 348 | 24.5% |
| 75 to 84 Years | 42 | 3.0% |
| 85 Years and Over | 44 | 3.1% |
| Total | 1,420 | 100.0% |
Housing Finances in Indian Mountain Lake
Median Income by Occupancy in Indian Mountain Lake
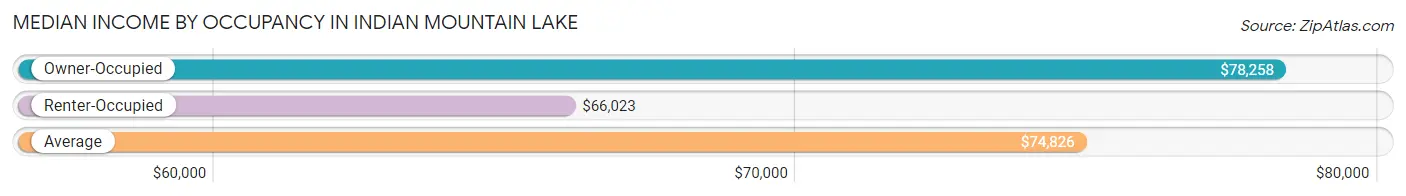
| Occupancy Type | # Households | Median Income |
| Owner-Occupied | 1,216 (85.6%) | $78,258 |
| Renter-Occupied | 204 (14.4%) | $66,023 |
| Average | 1,420 (100.0%) | $74,826 |
Occupancy by Householder Income Bracket in Indian Mountain Lake
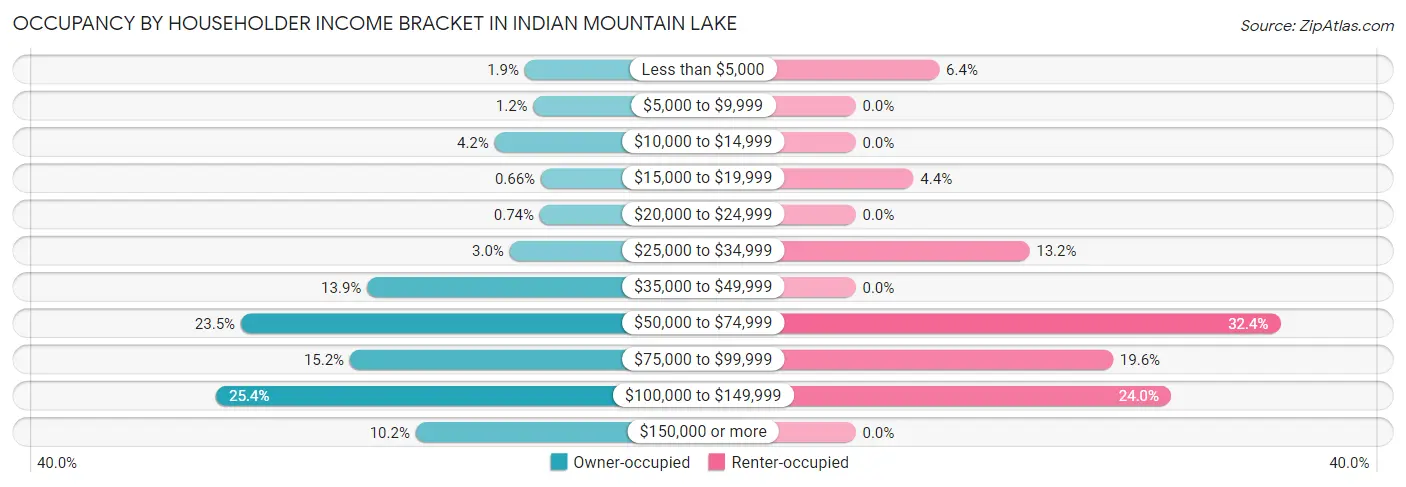
| Income Bracket | Owner-occupied | Renter-occupied |
| Less than $5,000 | 23 (1.9%) | 13 (6.4%) |
| $5,000 to $9,999 | 15 (1.2%) | 0 (0.0%) |
| $10,000 to $14,999 | 51 (4.2%) | 0 (0.0%) |
| $15,000 to $19,999 | 8 (0.7%) | 9 (4.4%) |
| $20,000 to $24,999 | 9 (0.7%) | 0 (0.0%) |
| $25,000 to $34,999 | 37 (3.0%) | 27 (13.2%) |
| $35,000 to $49,999 | 169 (13.9%) | 0 (0.0%) |
| $50,000 to $74,999 | 286 (23.5%) | 66 (32.4%) |
| $75,000 to $99,999 | 185 (15.2%) | 40 (19.6%) |
| $100,000 to $149,999 | 309 (25.4%) | 49 (24.0%) |
| $150,000 or more | 124 (10.2%) | 0 (0.0%) |
| Total | 1,216 (100.0%) | 204 (100.0%) |
Monthly Housing Cost Tiers in Indian Mountain Lake
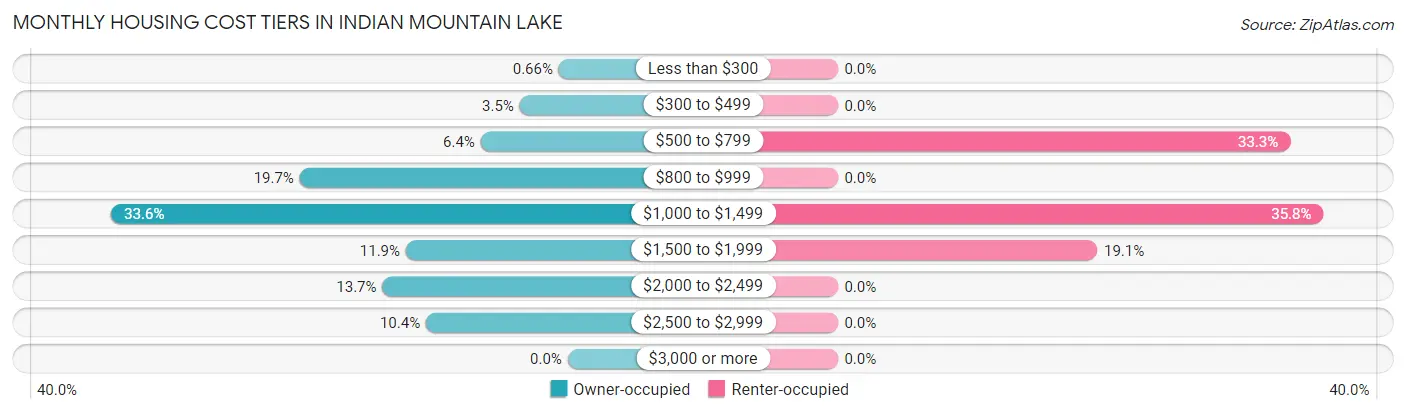
| Monthly Cost | Owner-occupied | Renter-occupied |
| Less than $300 | 8 (0.7%) | 0 (0.0%) |
| $300 to $499 | 43 (3.5%) | 0 (0.0%) |
| $500 to $799 | 78 (6.4%) | 68 (33.3%) |
| $800 to $999 | 240 (19.7%) | 0 (0.0%) |
| $1,000 to $1,499 | 409 (33.6%) | 73 (35.8%) |
| $1,500 to $1,999 | 145 (11.9%) | 39 (19.1%) |
| $2,000 to $2,499 | 166 (13.7%) | 0 (0.0%) |
| $2,500 to $2,999 | 127 (10.4%) | 0 (0.0%) |
| $3,000 or more | 0 (0.0%) | 0 (0.0%) |
| Total | 1,216 (100.0%) | 204 (100.0%) |
Physical Housing Characteristics in Indian Mountain Lake
Housing Structures in Indian Mountain Lake
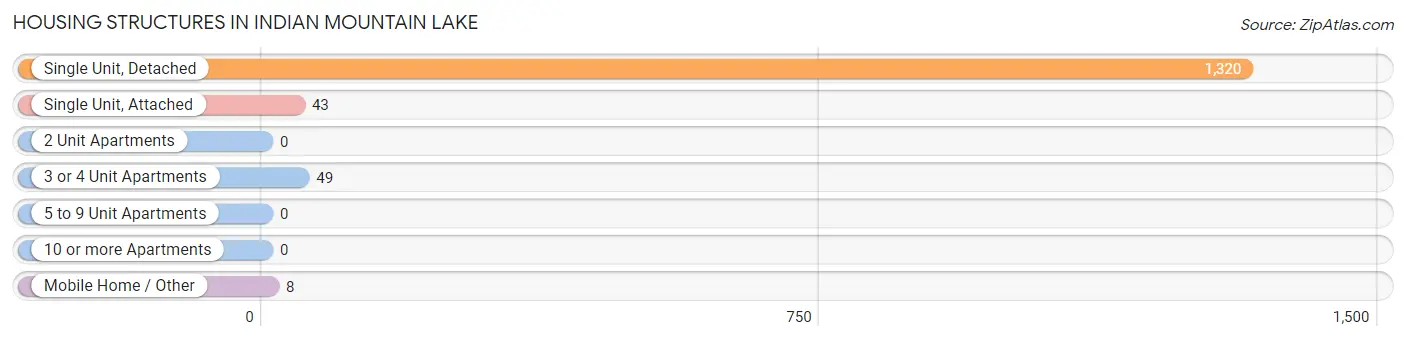
| Structure Type | # Housing Units | % Housing Units |
| Single Unit, Detached | 1,320 | 93.0% |
| Single Unit, Attached | 43 | 3.0% |
| 2 Unit Apartments | 0 | 0.0% |
| 3 or 4 Unit Apartments | 49 | 3.5% |
| 5 to 9 Unit Apartments | 0 | 0.0% |
| 10 or more Apartments | 0 | 0.0% |
| Mobile Home / Other | 8 | 0.6% |
| Total | 1,420 | 100.0% |
Housing Structures by Occupancy in Indian Mountain Lake
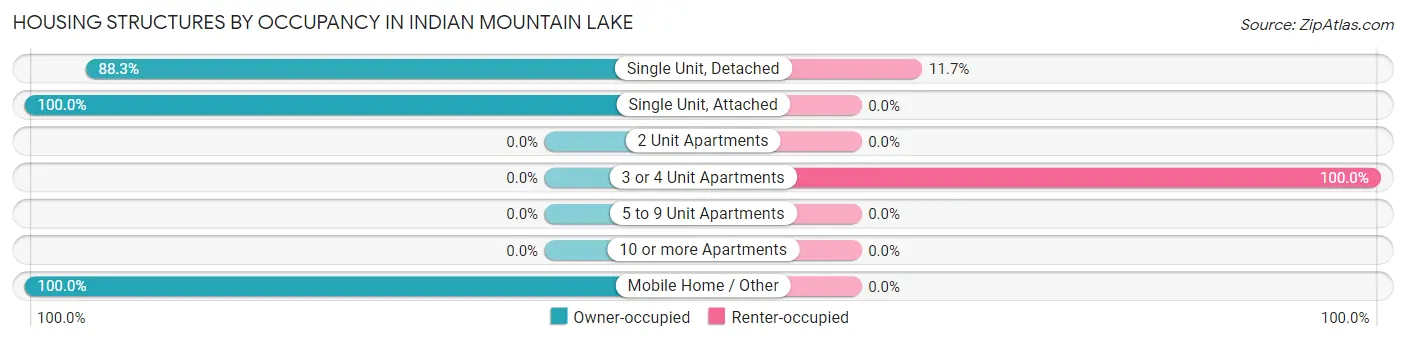
| Structure Type | Owner-occupied | Renter-occupied |
| Single Unit, Detached | 1,165 (88.3%) | 155 (11.7%) |
| Single Unit, Attached | 43 (100.0%) | 0 (0.0%) |
| 2 Unit Apartments | 0 (0.0%) | 0 (0.0%) |
| 3 or 4 Unit Apartments | 0 (0.0%) | 49 (100.0%) |
| 5 to 9 Unit Apartments | 0 (0.0%) | 0 (0.0%) |
| 10 or more Apartments | 0 (0.0%) | 0 (0.0%) |
| Mobile Home / Other | 8 (100.0%) | 0 (0.0%) |
| Total | 1,216 (85.6%) | 204 (14.4%) |
Housing Structures by Number of Rooms in Indian Mountain Lake
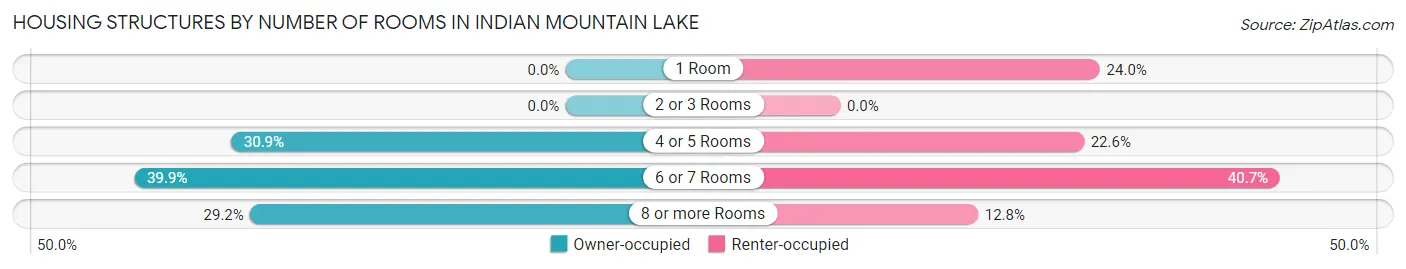
| Number of Rooms | Owner-occupied | Renter-occupied |
| 1 Room | 0 (0.0%) | 49 (24.0%) |
| 2 or 3 Rooms | 0 (0.0%) | 0 (0.0%) |
| 4 or 5 Rooms | 376 (30.9%) | 46 (22.6%) |
| 6 or 7 Rooms | 485 (39.9%) | 83 (40.7%) |
| 8 or more Rooms | 355 (29.2%) | 26 (12.8%) |
| Total | 1,216 (100.0%) | 204 (100.0%) |
Housing Structure by Heating Type in Indian Mountain Lake
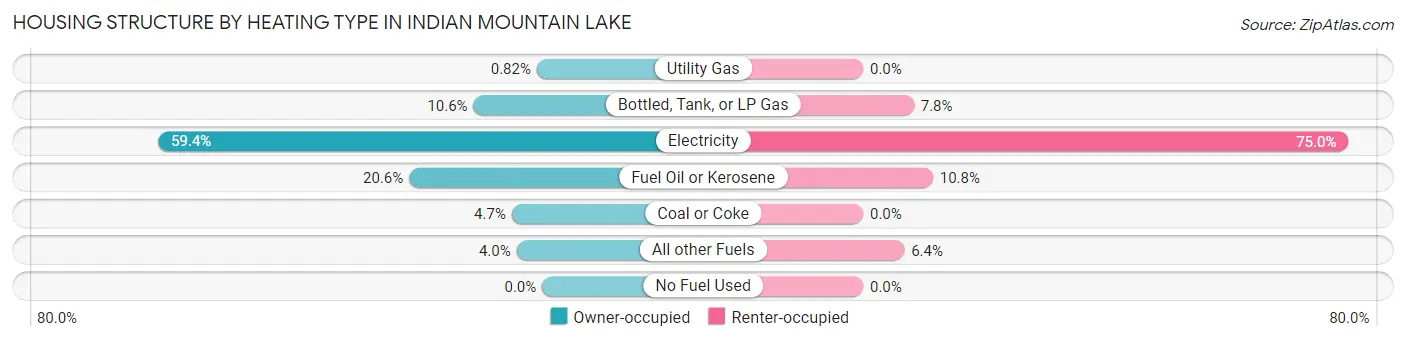
| Heating Type | Owner-occupied | Renter-occupied |
| Utility Gas | 10 (0.8%) | 0 (0.0%) |
| Bottled, Tank, or LP Gas | 129 (10.6%) | 16 (7.8%) |
| Electricity | 722 (59.4%) | 153 (75.0%) |
| Fuel Oil or Kerosene | 250 (20.6%) | 22 (10.8%) |
| Coal or Coke | 57 (4.7%) | 0 (0.0%) |
| All other Fuels | 48 (4.0%) | 13 (6.4%) |
| No Fuel Used | 0 (0.0%) | 0 (0.0%) |
| Total | 1,216 (100.0%) | 204 (100.0%) |
Household Vehicle Usage in Indian Mountain Lake
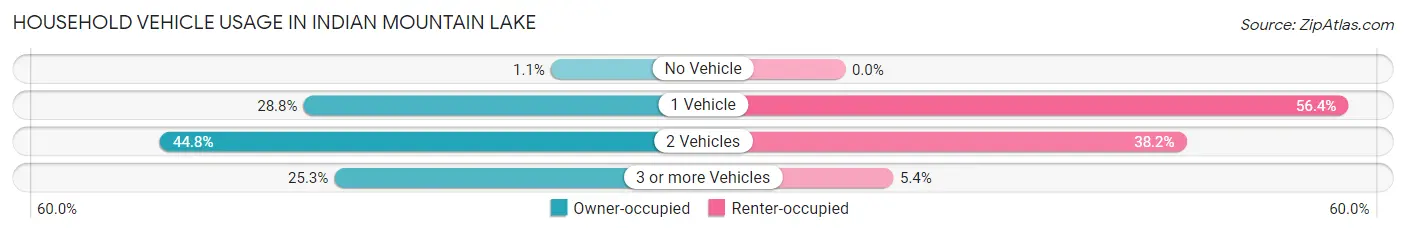
| Vehicles per Household | Owner-occupied | Renter-occupied |
| No Vehicle | 13 (1.1%) | 0 (0.0%) |
| 1 Vehicle | 350 (28.8%) | 115 (56.4%) |
| 2 Vehicles | 545 (44.8%) | 78 (38.2%) |
| 3 or more Vehicles | 308 (25.3%) | 11 (5.4%) |
| Total | 1,216 (100.0%) | 204 (100.0%) |
Real Estate & Mortgages in Indian Mountain Lake
Real Estate and Mortgage Overview in Indian Mountain Lake
| Characteristic | Without Mortgage | With Mortgage |
| Housing Units | 242 | 974 |
| Median Property Value | $221,000 | $172,400 |
| Median Household Income | $85,577 | $110 |
| Monthly Housing Costs | $871 | $0 |
| Real Estate Taxes | $5,739 | $14 |
Property Value by Mortgage Status in Indian Mountain Lake
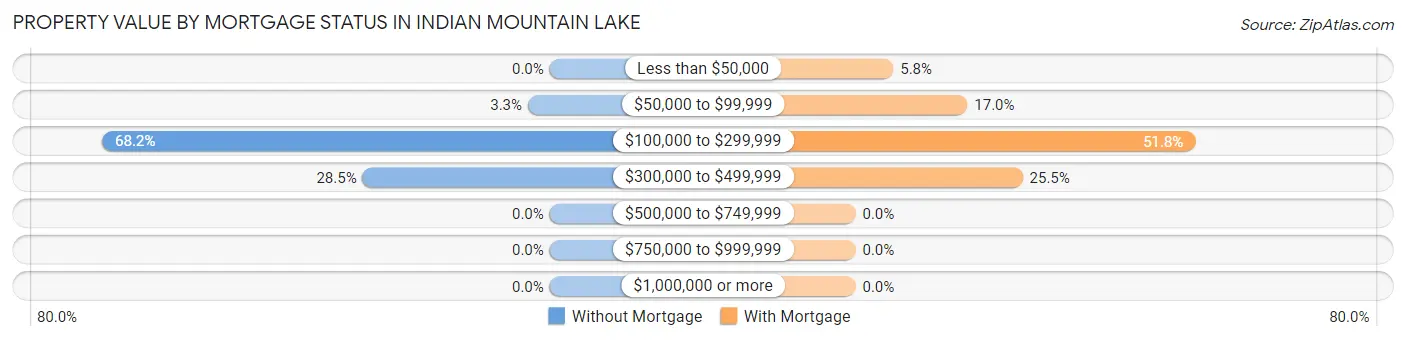
| Property Value | Without Mortgage | With Mortgage |
| Less than $50,000 | 0 (0.0%) | 56 (5.8%) |
| $50,000 to $99,999 | 8 (3.3%) | 166 (17.0%) |
| $100,000 to $299,999 | 165 (68.2%) | 504 (51.7%) |
| $300,000 to $499,999 | 69 (28.5%) | 248 (25.5%) |
| $500,000 to $749,999 | 0 (0.0%) | 0 (0.0%) |
| $750,000 to $999,999 | 0 (0.0%) | 0 (0.0%) |
| $1,000,000 or more | 0 (0.0%) | 0 (0.0%) |
| Total | 242 (100.0%) | 974 (100.0%) |
Household Income by Mortgage Status in Indian Mountain Lake
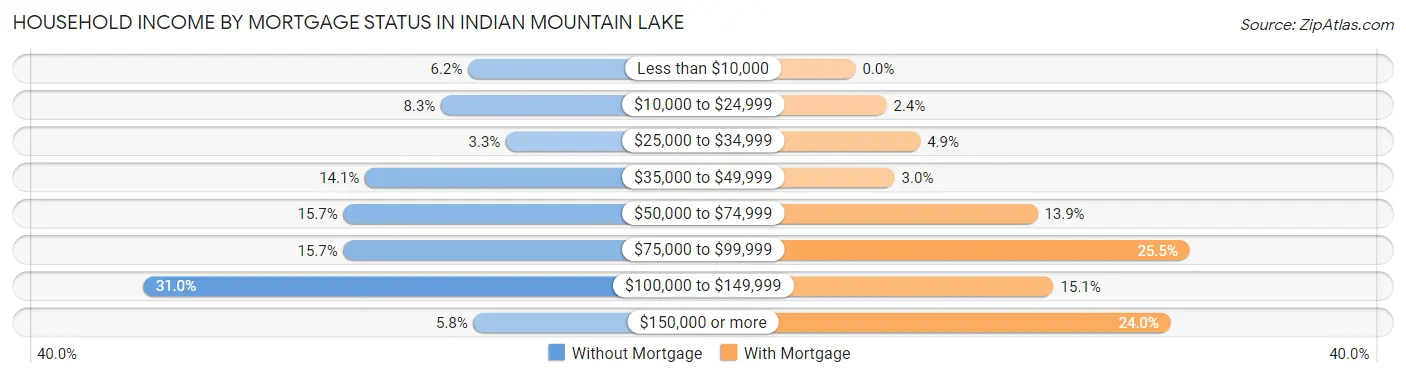
| Household Income | Without Mortgage | With Mortgage |
| Less than $10,000 | 15 (6.2%) | 0 (0.0%) |
| $10,000 to $24,999 | 20 (8.3%) | 23 (2.4%) |
| $25,000 to $34,999 | 8 (3.3%) | 48 (4.9%) |
| $35,000 to $49,999 | 34 (14.1%) | 29 (3.0%) |
| $50,000 to $74,999 | 38 (15.7%) | 135 (13.9%) |
| $75,000 to $99,999 | 38 (15.7%) | 248 (25.5%) |
| $100,000 to $149,999 | 75 (31.0%) | 147 (15.1%) |
| $150,000 or more | 14 (5.8%) | 234 (24.0%) |
| Total | 242 (100.0%) | 974 (100.0%) |
Property Value to Household Income Ratio in Indian Mountain Lake
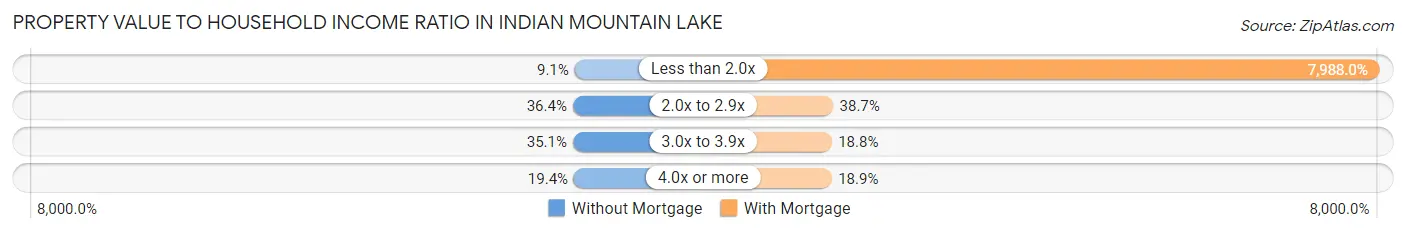
| Value-to-Income Ratio | Without Mortgage | With Mortgage |
| Less than 2.0x | 22 (9.1%) | 77,803 (7,988.0%) |
| 2.0x to 2.9x | 88 (36.4%) | 377 (38.7%) |
| 3.0x to 3.9x | 85 (35.1%) | 183 (18.8%) |
| 4.0x or more | 47 (19.4%) | 184 (18.9%) |
| Total | 242 (100.0%) | 974 (100.0%) |
Real Estate Taxes by Mortgage Status in Indian Mountain Lake
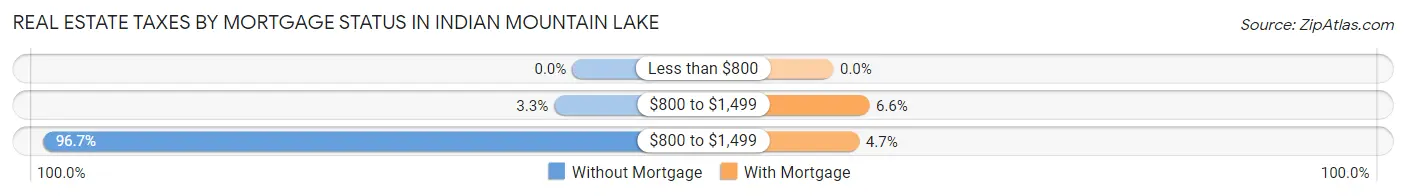
| Property Taxes | Without Mortgage | With Mortgage |
| Less than $800 | 0 (0.0%) | 0 (0.0%) |
| $800 to $1,499 | 8 (3.3%) | 64 (6.6%) |
| $800 to $1,499 | 234 (96.7%) | 46 (4.7%) |
| Total | 242 (100.0%) | 974 (100.0%) |
Health & Disability in Indian Mountain Lake
Health Insurance Coverage by Age in Indian Mountain Lake
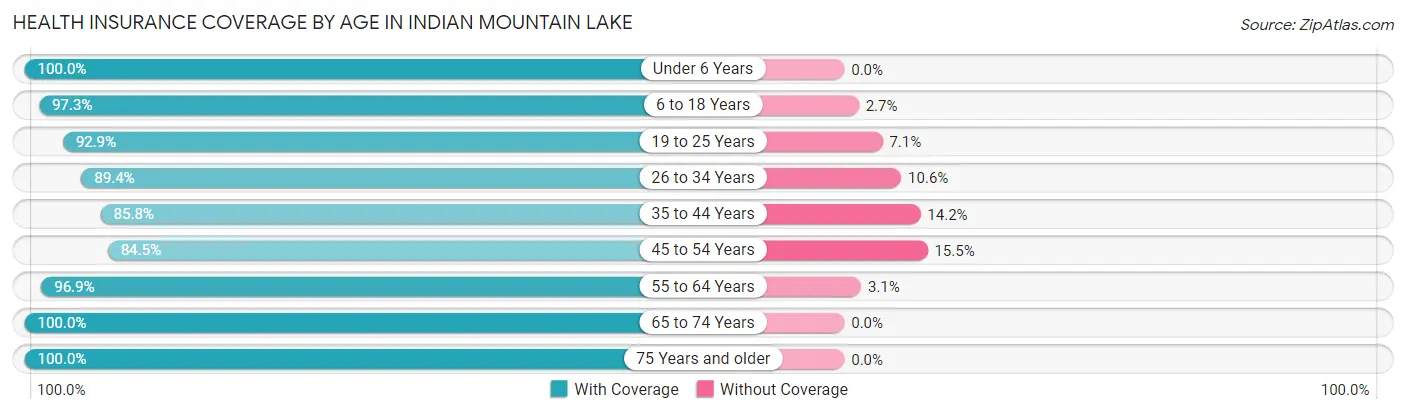
| Age Bracket | With Coverage | Without Coverage |
| Under 6 Years | 190 (100.0%) | 0 (0.0%) |
| 6 to 18 Years | 761 (97.3%) | 21 (2.7%) |
| 19 to 25 Years | 287 (92.9%) | 22 (7.1%) |
| 26 to 34 Years | 464 (89.4%) | 55 (10.6%) |
| 35 to 44 Years | 369 (85.8%) | 61 (14.2%) |
| 45 to 54 Years | 316 (84.5%) | 58 (15.5%) |
| 55 to 64 Years | 714 (96.9%) | 23 (3.1%) |
| 65 to 74 Years | 524 (100.0%) | 0 (0.0%) |
| 75 Years and older | 235 (100.0%) | 0 (0.0%) |
| Total | 3,860 (94.2%) | 240 (5.9%) |
Health Insurance Coverage by Citizenship Status in Indian Mountain Lake
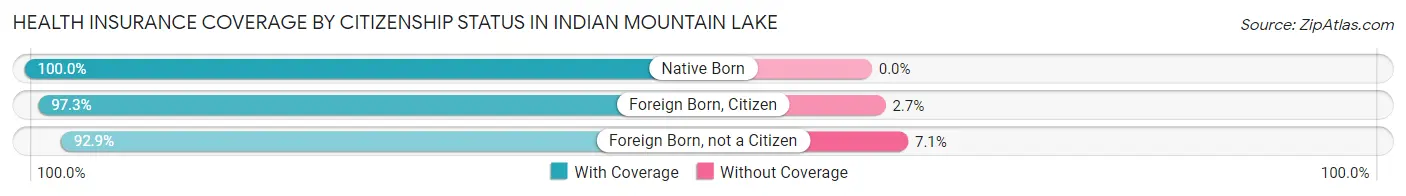
| Citizenship Status | With Coverage | Without Coverage |
| Native Born | 190 (100.0%) | 0 (0.0%) |
| Foreign Born, Citizen | 761 (97.3%) | 21 (2.7%) |
| Foreign Born, not a Citizen | 287 (92.9%) | 22 (7.1%) |
Health Insurance Coverage by Household Income in Indian Mountain Lake
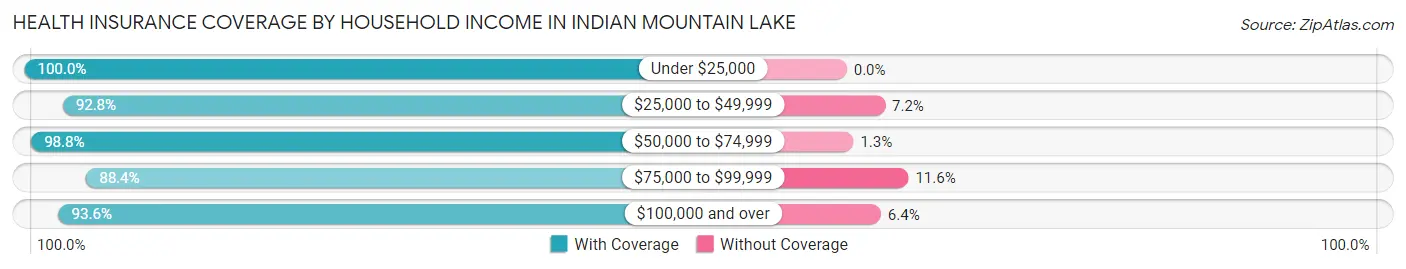
| Household Income | With Coverage | Without Coverage |
| Under $25,000 | 189 (100.0%) | 0 (0.0%) |
| $25,000 to $49,999 | 841 (92.8%) | 65 (7.2%) |
| $50,000 to $74,999 | 869 (98.8%) | 11 (1.3%) |
| $75,000 to $99,999 | 482 (88.4%) | 63 (11.6%) |
| $100,000 and over | 1,479 (93.6%) | 101 (6.4%) |
Public vs Private Health Insurance Coverage by Age in Indian Mountain Lake
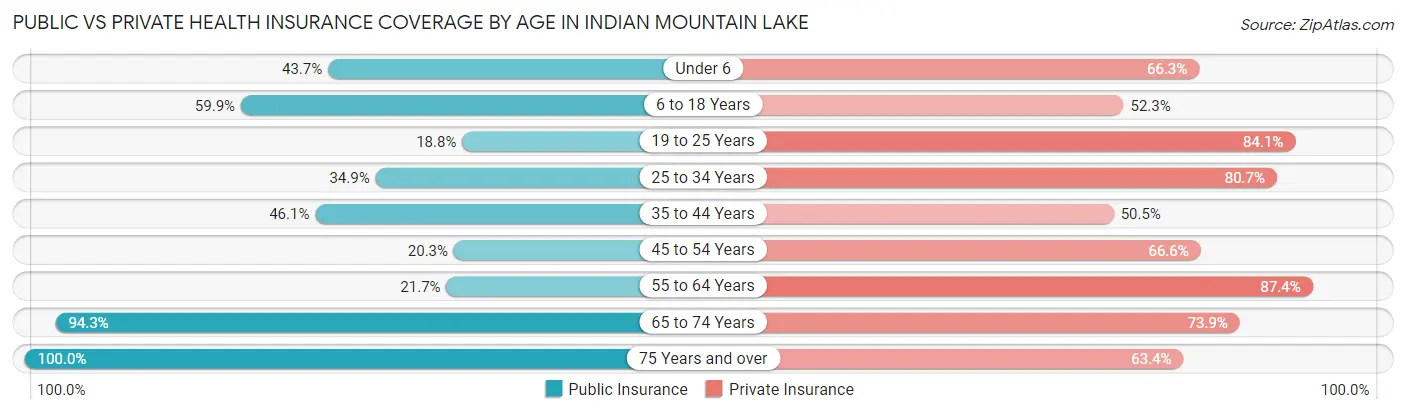
| Age Bracket | Public Insurance | Private Insurance |
| Under 6 | 83 (43.7%) | 126 (66.3%) |
| 6 to 18 Years | 468 (59.9%) | 409 (52.3%) |
| 19 to 25 Years | 58 (18.8%) | 260 (84.1%) |
| 25 to 34 Years | 181 (34.9%) | 419 (80.7%) |
| 35 to 44 Years | 198 (46.1%) | 217 (50.5%) |
| 45 to 54 Years | 76 (20.3%) | 249 (66.6%) |
| 55 to 64 Years | 160 (21.7%) | 644 (87.4%) |
| 65 to 74 Years | 494 (94.3%) | 387 (73.9%) |
| 75 Years and over | 235 (100.0%) | 149 (63.4%) |
| Total | 1,953 (47.6%) | 2,860 (69.8%) |
Disability Status by Sex by Age in Indian Mountain Lake
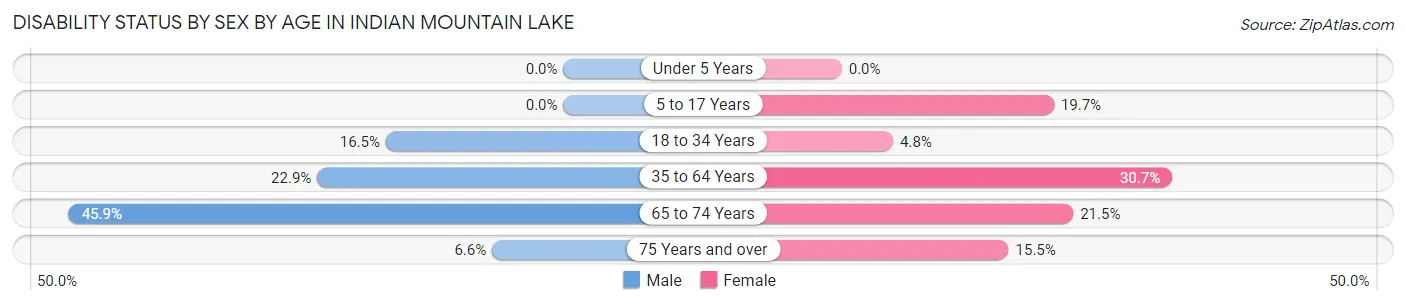
| Age Bracket | Male | Female |
| Under 5 Years | 0 (0.0%) | 0 (0.0%) |
| 5 to 17 Years | 0 (0.0%) | 76 (19.7%) |
| 18 to 34 Years | 88 (16.5%) | 17 (4.8%) |
| 35 to 64 Years | 165 (22.9%) | 251 (30.6%) |
| 65 to 74 Years | 123 (45.9%) | 55 (21.5%) |
| 75 Years and over | 10 (6.6%) | 13 (15.5%) |
Disability Class by Sex by Age in Indian Mountain Lake
Disability Class: Hearing Difficulty
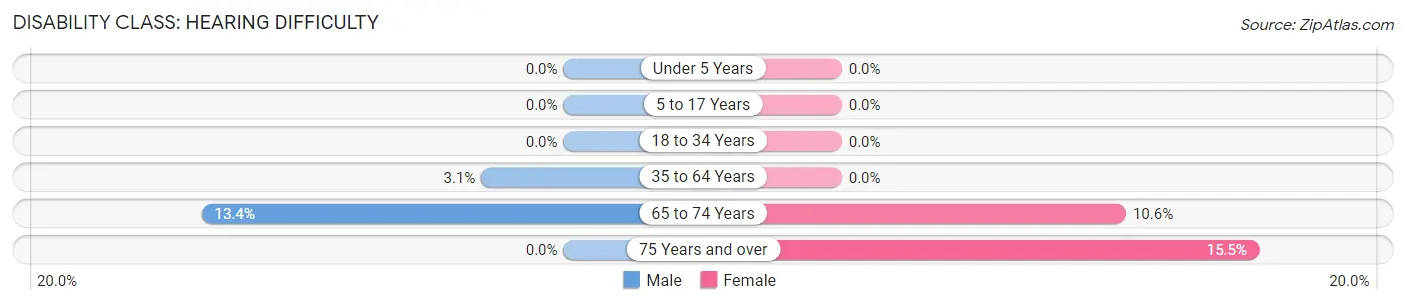
| Age Bracket | Male | Female |
| Under 5 Years | 0 (0.0%) | 0 (0.0%) |
| 5 to 17 Years | 0 (0.0%) | 0 (0.0%) |
| 18 to 34 Years | 0 (0.0%) | 0 (0.0%) |
| 35 to 64 Years | 22 (3.0%) | 0 (0.0%) |
| 65 to 74 Years | 36 (13.4%) | 27 (10.5%) |
| 75 Years and over | 0 (0.0%) | 13 (15.5%) |
Disability Class: Vision Difficulty
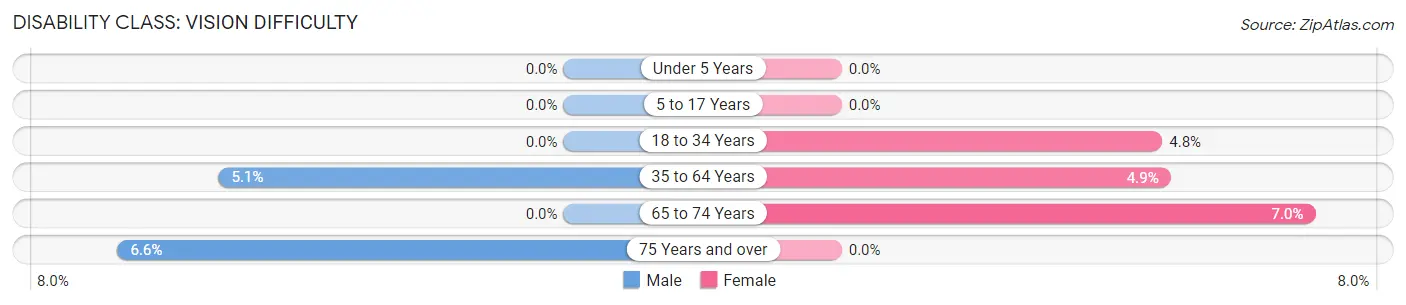
| Age Bracket | Male | Female |
| Under 5 Years | 0 (0.0%) | 0 (0.0%) |
| 5 to 17 Years | 0 (0.0%) | 0 (0.0%) |
| 18 to 34 Years | 0 (0.0%) | 17 (4.8%) |
| 35 to 64 Years | 37 (5.1%) | 40 (4.9%) |
| 65 to 74 Years | 0 (0.0%) | 18 (7.0%) |
| 75 Years and over | 10 (6.6%) | 0 (0.0%) |
Disability Class: Cognitive Difficulty
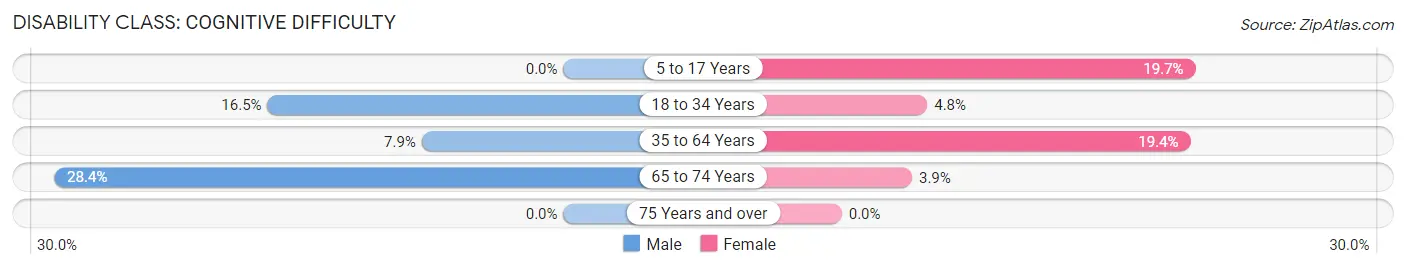
| Age Bracket | Male | Female |
| 5 to 17 Years | 0 (0.0%) | 76 (19.7%) |
| 18 to 34 Years | 88 (16.5%) | 17 (4.8%) |
| 35 to 64 Years | 57 (7.9%) | 159 (19.4%) |
| 65 to 74 Years | 76 (28.4%) | 10 (3.9%) |
| 75 Years and over | 0 (0.0%) | 0 (0.0%) |
Disability Class: Ambulatory Difficulty
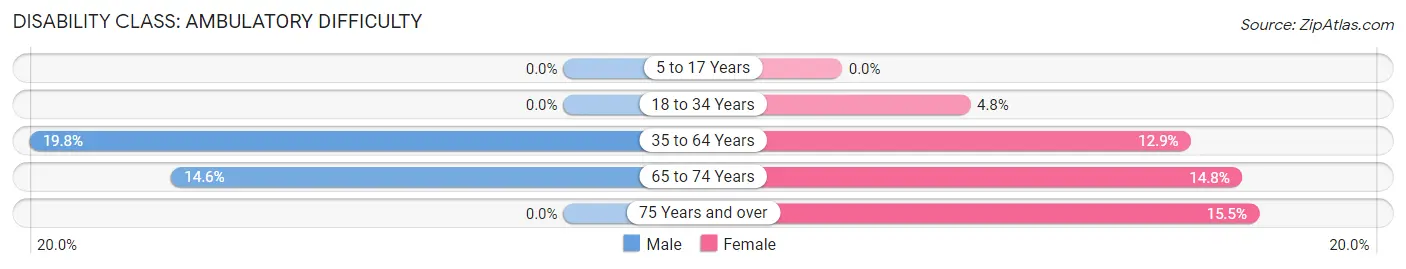
| Age Bracket | Male | Female |
| 5 to 17 Years | 0 (0.0%) | 0 (0.0%) |
| 18 to 34 Years | 0 (0.0%) | 17 (4.8%) |
| 35 to 64 Years | 143 (19.8%) | 106 (12.9%) |
| 65 to 74 Years | 39 (14.5%) | 38 (14.8%) |
| 75 Years and over | 0 (0.0%) | 13 (15.5%) |
Disability Class: Self-Care Difficulty
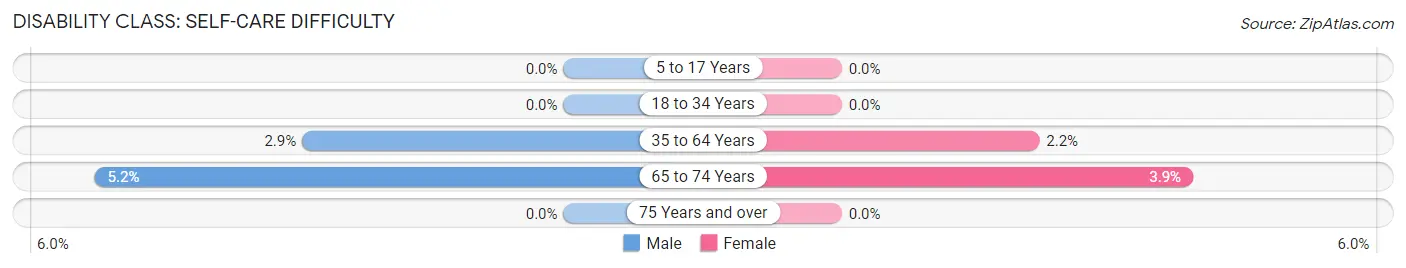
| Age Bracket | Male | Female |
| 5 to 17 Years | 0 (0.0%) | 0 (0.0%) |
| 18 to 34 Years | 0 (0.0%) | 0 (0.0%) |
| 35 to 64 Years | 21 (2.9%) | 18 (2.2%) |
| 65 to 74 Years | 14 (5.2%) | 10 (3.9%) |
| 75 Years and over | 0 (0.0%) | 0 (0.0%) |
Technology Access in Indian Mountain Lake
Computing Device Access in Indian Mountain Lake
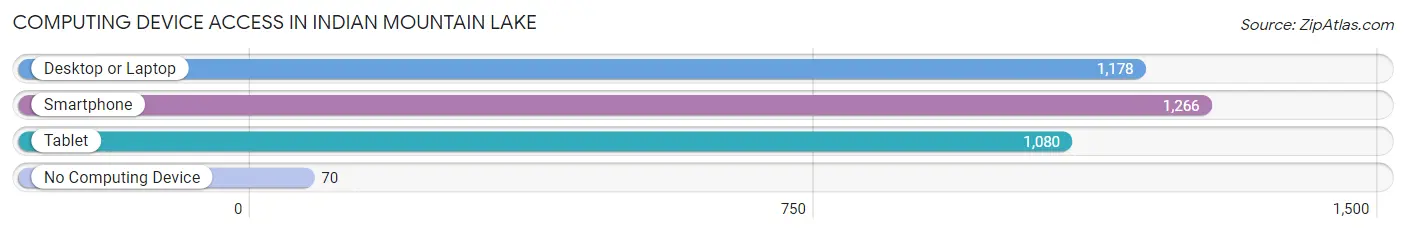
| Device Type | # Households | % Households |
| Desktop or Laptop | 1,178 | 83.0% |
| Smartphone | 1,266 | 89.1% |
| Tablet | 1,080 | 76.1% |
| No Computing Device | 70 | 4.9% |
| Total | 1,420 | 100.0% |
Internet Access in Indian Mountain Lake
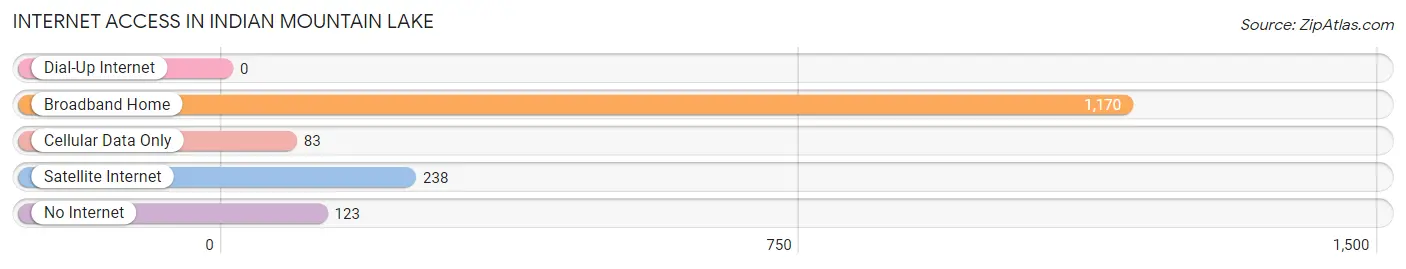
| Internet Type | # Households | % Households |
| Dial-Up Internet | 0 | 0.0% |
| Broadband Home | 1,170 | 82.4% |
| Cellular Data Only | 83 | 5.9% |
| Satellite Internet | 238 | 16.8% |
| No Internet | 123 | 8.7% |
| Total | 1,420 | 100.0% |
Indian Mountain Lake Summary
Introduction
Indian Mountain Lake, Pennsylvania is a small, rural community located in the Pocono Mountains of northeastern Pennsylvania. The community is situated in the heart of the Pocono Mountains, surrounded by lush forests and pristine lakes. The area is known for its natural beauty and outdoor recreation opportunities, and is a popular destination for tourists and outdoor enthusiasts.
History
The area that is now Indian Mountain Lake was first settled in the late 1700s by a group of settlers from the Susquehanna Valley. The settlers were attracted to the area by its abundant natural resources and its proximity to the Delaware River. The settlers established a small farming community and named it Indian Mountain Lake.
The community grew slowly over the next few decades, and by the mid-1800s, it had become a popular destination for tourists and outdoor enthusiasts. The area was known for its natural beauty and outdoor recreation opportunities, and it quickly became a popular destination for vacationers.
In the early 1900s, the area began to experience a period of rapid growth. The population increased significantly, and the community began to develop into a small town. The town was incorporated in 1921, and the name was changed to Indian Mountain Lake.
Geography
Indian Mountain Lake is located in the Pocono Mountains of northeastern Pennsylvania. The community is situated in the heart of the Pocono Mountains, surrounded by lush forests and pristine lakes. The area is known for its natural beauty and outdoor recreation opportunities, and is a popular destination for tourists and outdoor enthusiasts.
The area is home to several lakes, including Indian Mountain Lake, which is the largest lake in the area. The lake is fed by several small streams and is a popular destination for fishing, swimming, and boating. The lake is also home to a variety of wildlife, including bald eagles, ospreys, and beavers.
The area is also home to several state parks, including Promised Land State Park, which is located just outside of Indian Mountain Lake. The park is a popular destination for camping, hiking, and other outdoor activities.
Economy
The economy of Indian Mountain Lake is largely based on tourism and outdoor recreation. The area is known for its natural beauty and outdoor recreation opportunities, and is a popular destination for tourists and outdoor enthusiasts. The area is home to several state parks, including Promised Land State Park, which is a popular destination for camping, hiking, and other outdoor activities.
The area is also home to several small businesses, including restaurants, lodging, and retail stores. The area is also home to several small farms, which produce a variety of fruits and vegetables.
Demographics
As of the 2010 census, the population of Indian Mountain Lake was 1,845. The population is predominantly white (94.3%), with a small percentage of African Americans (2.2%) and Hispanics (2.5%). The median household income is $45,000, and the median age is 44.
Conclusion
Indian Mountain Lake, Pennsylvania is a small, rural community located in the Pocono Mountains of northeastern Pennsylvania. The area is known for its natural beauty and outdoor recreation opportunities, and is a popular destination for tourists and outdoor enthusiasts. The economy of the area is largely based on tourism and outdoor recreation, and the area is home to several small businesses, farms, and state parks. The population of Indian Mountain Lake is predominantly white, with a small percentage of African Americans and Hispanics.
Common Questions
What is Per Capita Income in Indian Mountain Lake?
Per Capita income in Indian Mountain Lake is $29,812.
What is the Median Family Income in Indian Mountain Lake?
Median Family Income in Indian Mountain Lake is $88,395.
What is the Median Household income in Indian Mountain Lake?
Median Household Income in Indian Mountain Lake is $74,826.
What is Income or Wage Gap in Indian Mountain Lake?
Income or Wage Gap in Indian Mountain Lake is 42.9%.
Women in Indian Mountain Lake earn 57.1 cents for every dollar earned by a man.
What is Inequality or Gini Index in Indian Mountain Lake?
Inequality or Gini Index in Indian Mountain Lake is 0.32.
What is the Total Population of Indian Mountain Lake?
Total Population of Indian Mountain Lake is 4,100.
What is the Total Male Population of Indian Mountain Lake?
Total Male Population of Indian Mountain Lake is 2,066.
What is the Total Female Population of Indian Mountain Lake?
Total Female Population of Indian Mountain Lake is 2,034.
What is the Ratio of Males per 100 Females in Indian Mountain Lake?
There are 101.57 Males per 100 Females in Indian Mountain Lake.
What is the Ratio of Females per 100 Males in Indian Mountain Lake?
There are 98.45 Females per 100 Males in Indian Mountain Lake.
What is the Median Population Age in Indian Mountain Lake?
Median Population Age in Indian Mountain Lake is 42.6 Years.
What is the Average Family Size in Indian Mountain Lake
Average Family Size in Indian Mountain Lake is 3.2 People.
What is the Average Household Size in Indian Mountain Lake
Average Household Size in Indian Mountain Lake is 2.9 People.
How Large is the Labor Force in Indian Mountain Lake?
There are 1,815 People in the Labor Forcein in Indian Mountain Lake.
What is the Percentage of People in the Labor Force in Indian Mountain Lake?
54.7% of People are in the Labor Force in Indian Mountain Lake.
What is the Unemployment Rate in Indian Mountain Lake?
Unemployment Rate in Indian Mountain Lake is 9.7%.