Tyler Run, PA Map & Demographics
Tyler Run Map
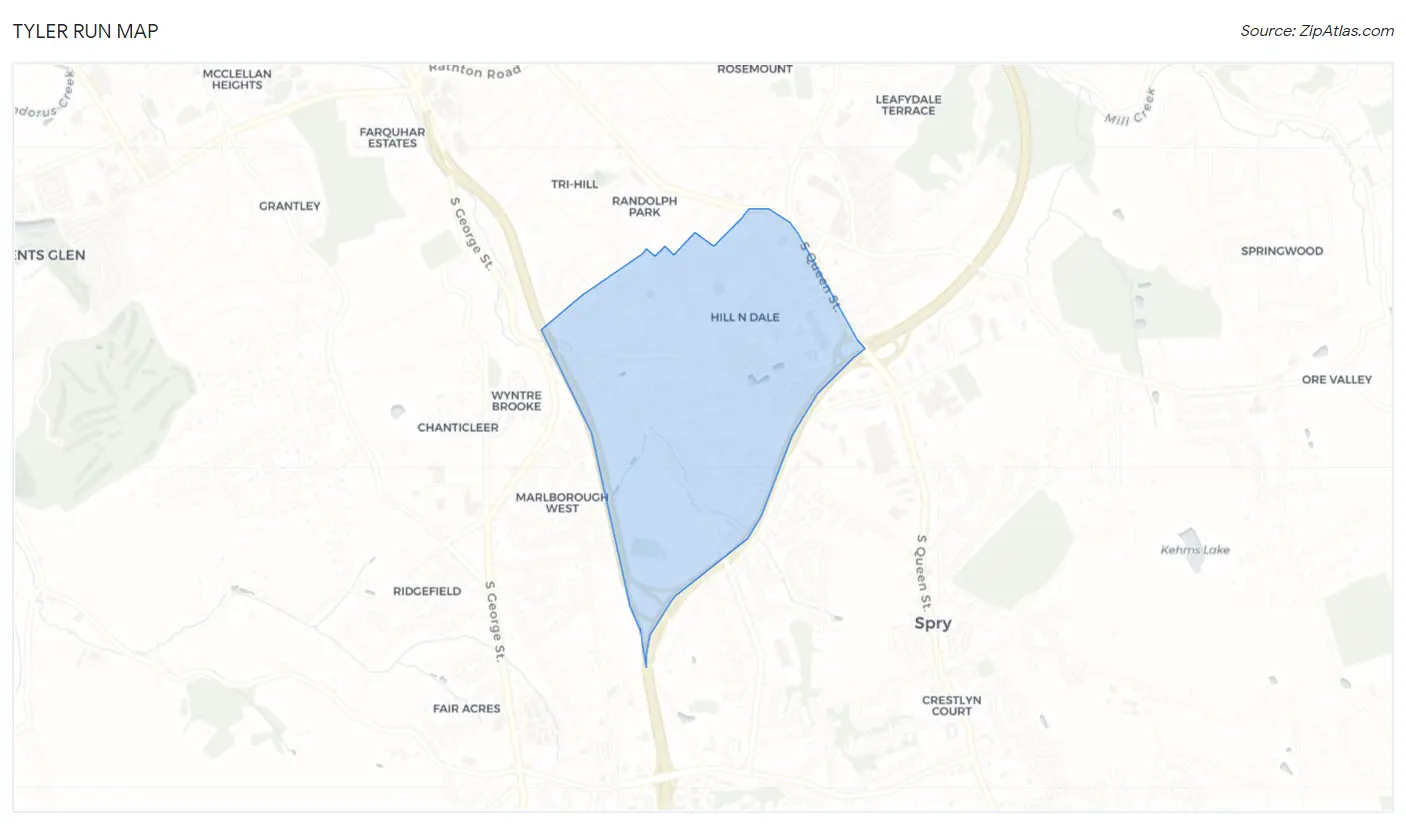
Tyler Run Overview
$39,161
PER CAPITA INCOME
$78,088
AVG FAMILY INCOME
$65,885
AVG HOUSEHOLD INCOME
44.0%
WAGE / INCOME GAP [ % ]
56.0¢/ $1
WAGE / INCOME GAP [ $ ]
0.41
INEQUALITY / GINI INDEX
1,943
TOTAL POPULATION
917
MALE POPULATION
1,026
FEMALE POPULATION
89.38
MALES / 100 FEMALES
111.89
FEMALES / 100 MALES
46.8
MEDIAN AGE
2.8
AVG FAMILY SIZE
2.1
AVG HOUSEHOLD SIZE
886
LABOR FORCE [ PEOPLE ]
56.1%
PERCENT IN LABOR FORCE
5.0%
UNEMPLOYMENT RATE
Income in Tyler Run
Income Overview in Tyler Run
Per Capita Income in Tyler Run is $39,161, while median incomes of families and households are $78,088 and $65,885 respectively.
| Characteristic | Number | Measure |
| Per Capita Income | 1,943 | $39,161 |
| Median Family Income | 492 | $78,088 |
| Mean Family Income | 492 | $98,742 |
| Median Household Income | 916 | $65,885 |
| Mean Household Income | 916 | $81,352 |
| Income Deficit | 492 | $0 |
| Wage / Income Gap (%) | 1,943 | 44.00% |
| Wage / Income Gap ($) | 1,943 | 56.00¢ per $1 |
| Gini / Inequality Index | 1,943 | 0.41 |
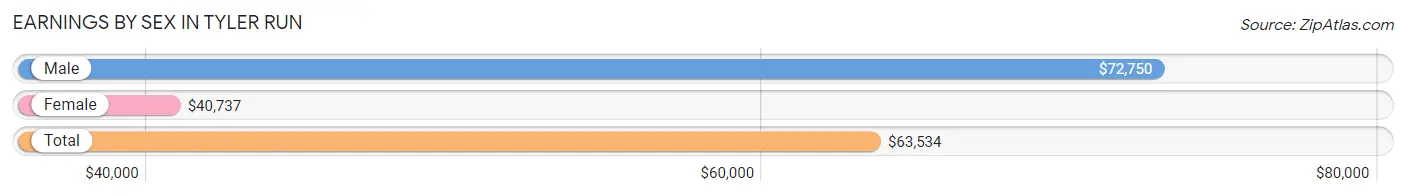
Earnings by Sex in Tyler Run
Average Earnings in Tyler Run are $63,534, $72,750 for men and $40,737 for women, a difference of 44.0%.
| Sex | Number | Average Earnings |
| Male | 524 (55.8%) | $72,750 |
| Female | 415 (44.2%) | $40,737 |
| Total | 939 (100.0%) | $63,534 |
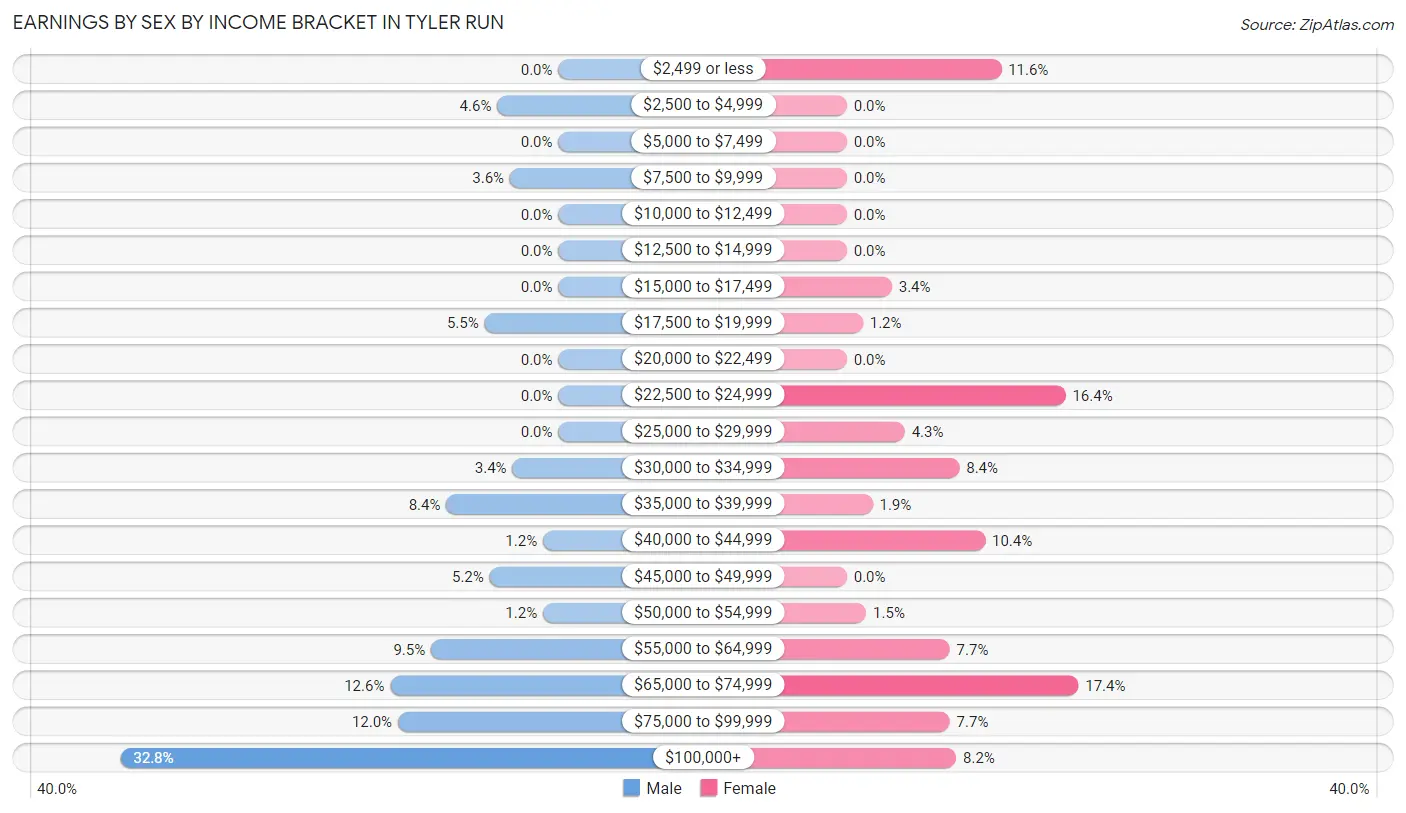
Earnings by Sex by Income Bracket in Tyler Run
The most common earnings brackets in Tyler Run are $100,000+ for men (172 | 32.8%) and $65,000 to $74,999 for women (72 | 17.3%).
| Income | Male | Female |
| $2,499 or less | 0 (0.0%) | 48 (11.6%) |
| $2,500 to $4,999 | 24 (4.6%) | 0 (0.0%) |
| $5,000 to $7,499 | 0 (0.0%) | 0 (0.0%) |
| $7,500 to $9,999 | 19 (3.6%) | 0 (0.0%) |
| $10,000 to $12,499 | 0 (0.0%) | 0 (0.0%) |
| $12,500 to $14,999 | 0 (0.0%) | 0 (0.0%) |
| $15,000 to $17,499 | 0 (0.0%) | 14 (3.4%) |
| $17,500 to $19,999 | 29 (5.5%) | 5 (1.2%) |
| $20,000 to $22,499 | 0 (0.0%) | 0 (0.0%) |
| $22,500 to $24,999 | 0 (0.0%) | 68 (16.4%) |
| $25,000 to $29,999 | 0 (0.0%) | 18 (4.3%) |
| $30,000 to $34,999 | 18 (3.4%) | 35 (8.4%) |
| $35,000 to $39,999 | 44 (8.4%) | 8 (1.9%) |
| $40,000 to $44,999 | 6 (1.1%) | 43 (10.4%) |
| $45,000 to $49,999 | 27 (5.1%) | 0 (0.0%) |
| $50,000 to $54,999 | 6 (1.1%) | 6 (1.5%) |
| $55,000 to $64,999 | 50 (9.5%) | 32 (7.7%) |
| $65,000 to $74,999 | 66 (12.6%) | 72 (17.3%) |
| $75,000 to $99,999 | 63 (12.0%) | 32 (7.7%) |
| $100,000+ | 172 (32.8%) | 34 (8.2%) |
| Total | 524 (100.0%) | 415 (100.0%) |
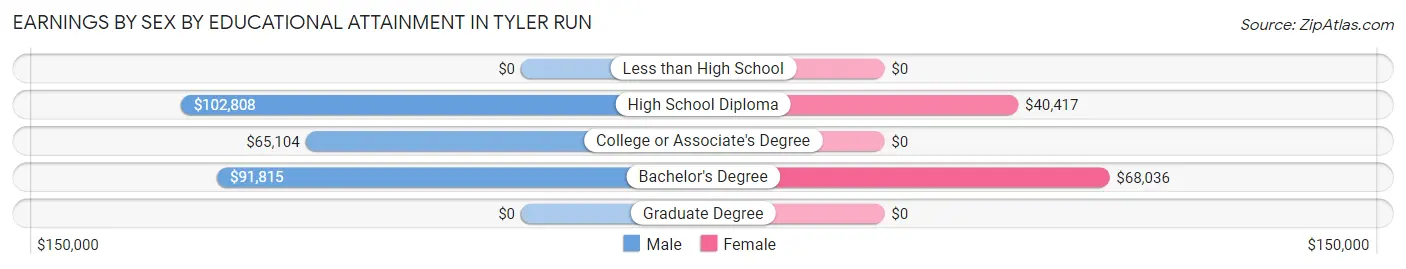
Earnings by Sex by Educational Attainment in Tyler Run
Average earnings in Tyler Run are $73,958 for men and $41,122 for women, a difference of 44.4%. Men with an educational attainment of high school diploma enjoy the highest average annual earnings of $102,808, while those with college or associate's degree education earn the least with $65,104. Women with an educational attainment of bachelor's degree earn the most with the average annual earnings of $68,036, while those with high school diploma education have the smallest earnings of $40,417.
| Educational Attainment | Male Income | Female Income |
| Less than High School | - | - |
| High School Diploma | $102,808 | $40,417 |
| College or Associate's Degree | $65,104 | $0 |
| Bachelor's Degree | $91,815 | $68,036 |
| Graduate Degree | - | - |
| Total | $73,958 | $41,122 |
Family Income in Tyler Run
Family Income Brackets in Tyler Run
According to the Tyler Run family income data, there are 122 families falling into the $25,000 to $34,999 income range, which is the most common income bracket and makes up 24.8% of all families.
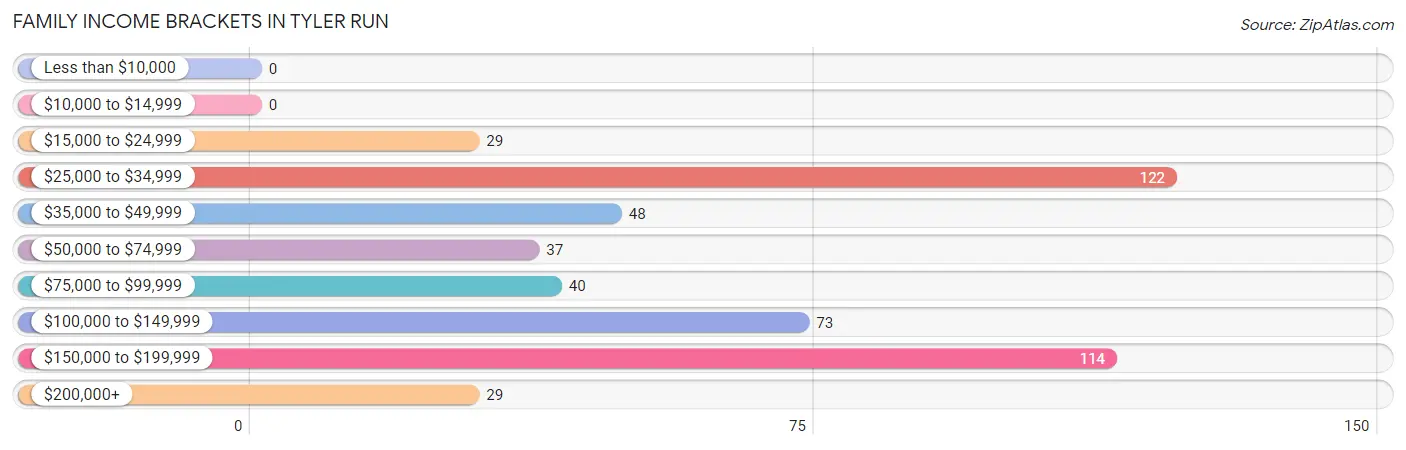
| Income Bracket | # Families | % Families |
| Less than $10,000 | 0 | 0.0% |
| $10,000 to $14,999 | 0 | 0.0% |
| $15,000 to $24,999 | 29 | 5.9% |
| $25,000 to $34,999 | 122 | 24.8% |
| $35,000 to $49,999 | 48 | 9.8% |
| $50,000 to $74,999 | 37 | 7.5% |
| $75,000 to $99,999 | 40 | 8.1% |
| $100,000 to $149,999 | 73 | 14.8% |
| $150,000 to $199,999 | 114 | 23.2% |
| $200,000+ | 29 | 5.9% |
Family Income by Famaliy Size in Tyler Run
2-person families (207 | 42.1%) account for the highest median family income in Tyler Run with $130,417 per family, while 2-person families (207 | 42.1%) have the highest median income of $65,208 per family member.
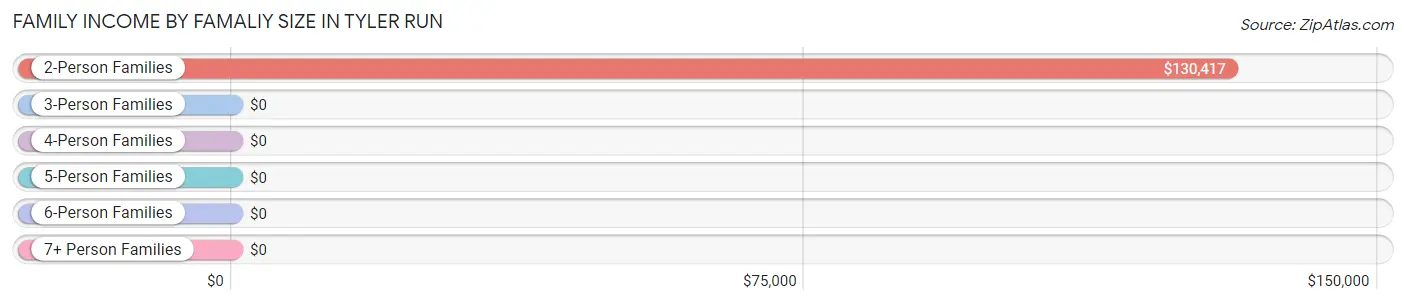
| Income Bracket | # Families | Median Income |
| 2-Person Families | 207 (42.1%) | $130,417 |
| 3-Person Families | 139 (28.2%) | $0 |
| 4-Person Families | 146 (29.7%) | $0 |
| 5-Person Families | 0 (0.0%) | $0 |
| 6-Person Families | 0 (0.0%) | $0 |
| 7+ Person Families | 0 (0.0%) | $0 |
| Total | 492 (100.0%) | $78,088 |
Family Income by Number of Earners in Tyler Run
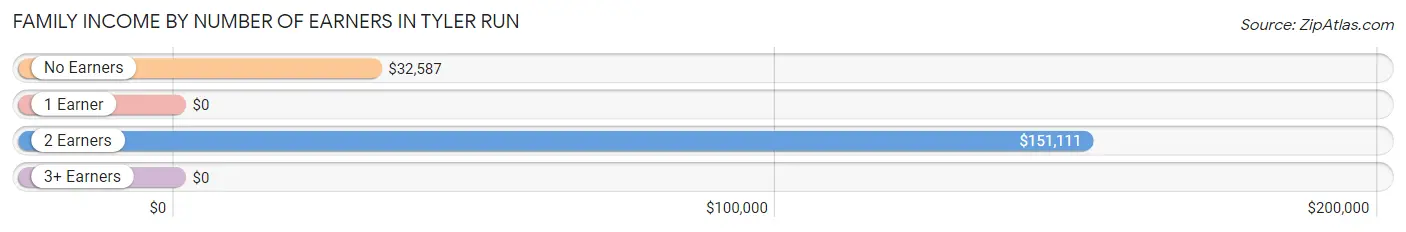
| Number of Earners | # Families | Median Income |
| No Earners | 83 (16.9%) | $32,587 |
| 1 Earner | 159 (32.3%) | $0 |
| 2 Earners | 250 (50.8%) | $151,111 |
| 3+ Earners | 0 (0.0%) | $0 |
| Total | 492 (100.0%) | $78,088 |
Household Income in Tyler Run
Household Income Brackets in Tyler Run
With 198 households falling in the category, the $100,000 to $149,999 income range is the most frequent in Tyler Run, accounting for 21.6% of all households. In contrast, only 11 households (1.2%) fall into the less than $10,000 income bracket, making it the least populous group.
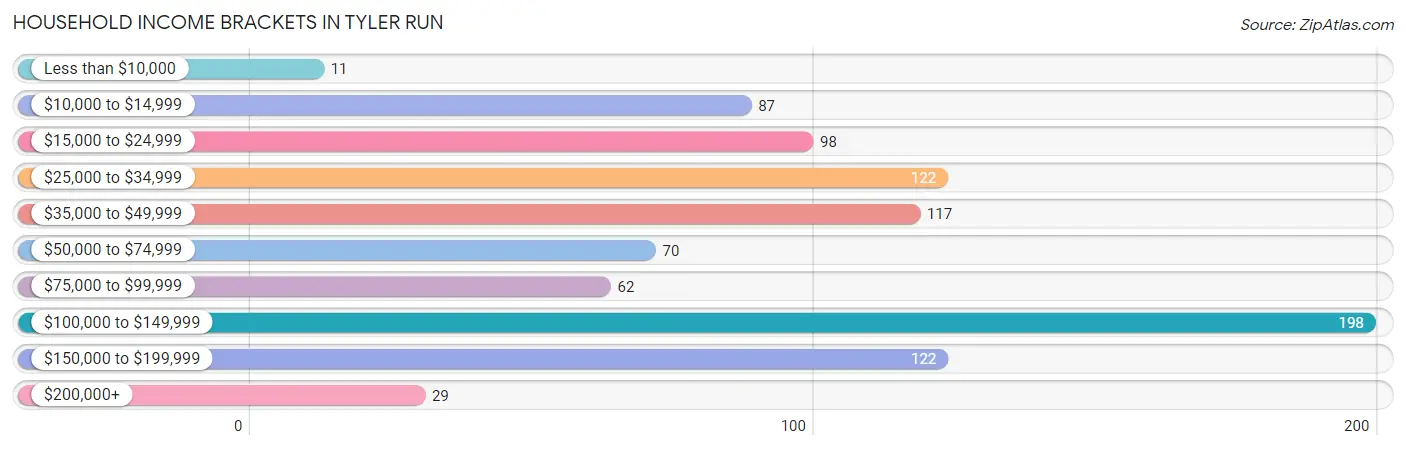
| Income Bracket | # Households | % Households |
| Less than $10,000 | 11 | 1.2% |
| $10,000 to $14,999 | 87 | 9.5% |
| $15,000 to $24,999 | 98 | 10.7% |
| $25,000 to $34,999 | 122 | 13.3% |
| $35,000 to $49,999 | 117 | 12.8% |
| $50,000 to $74,999 | 70 | 7.6% |
| $75,000 to $99,999 | 62 | 6.8% |
| $100,000 to $149,999 | 198 | 21.6% |
| $150,000 to $199,999 | 122 | 13.3% |
| $200,000+ | 29 | 3.2% |
Household Income by Householder Age in Tyler Run
The median household income in Tyler Run is $65,885, with the highest median household income of $130,417 found in the 45 to 64 years age bracket for the primary householder. A total of 193 households (21.1%) fall into this category. Meanwhile, the 15 to 24 years age bracket for the primary householder has the lowest median household income of $0, with 45 households (4.9%) in this group.
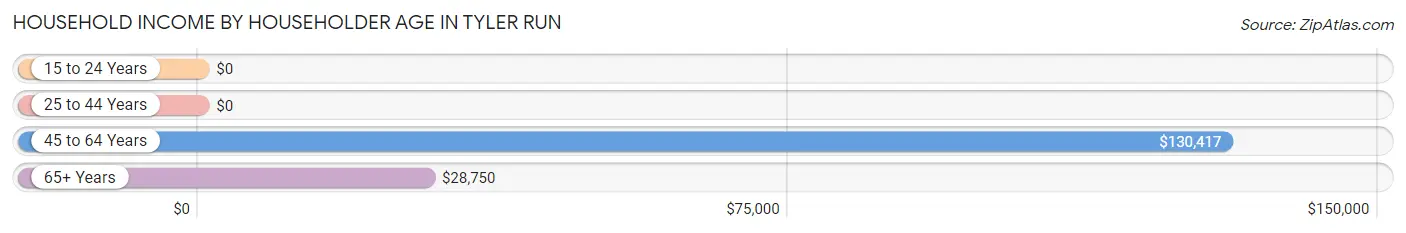
| Income Bracket | # Households | Median Income |
| 15 to 24 Years | 45 (4.9%) | $0 |
| 25 to 44 Years | 305 (33.3%) | $0 |
| 45 to 64 Years | 193 (21.1%) | $130,417 |
| 65+ Years | 373 (40.7%) | $28,750 |
| Total | 916 (100.0%) | $65,885 |
Poverty in Tyler Run
Income Below Poverty by Sex and Age in Tyler Run
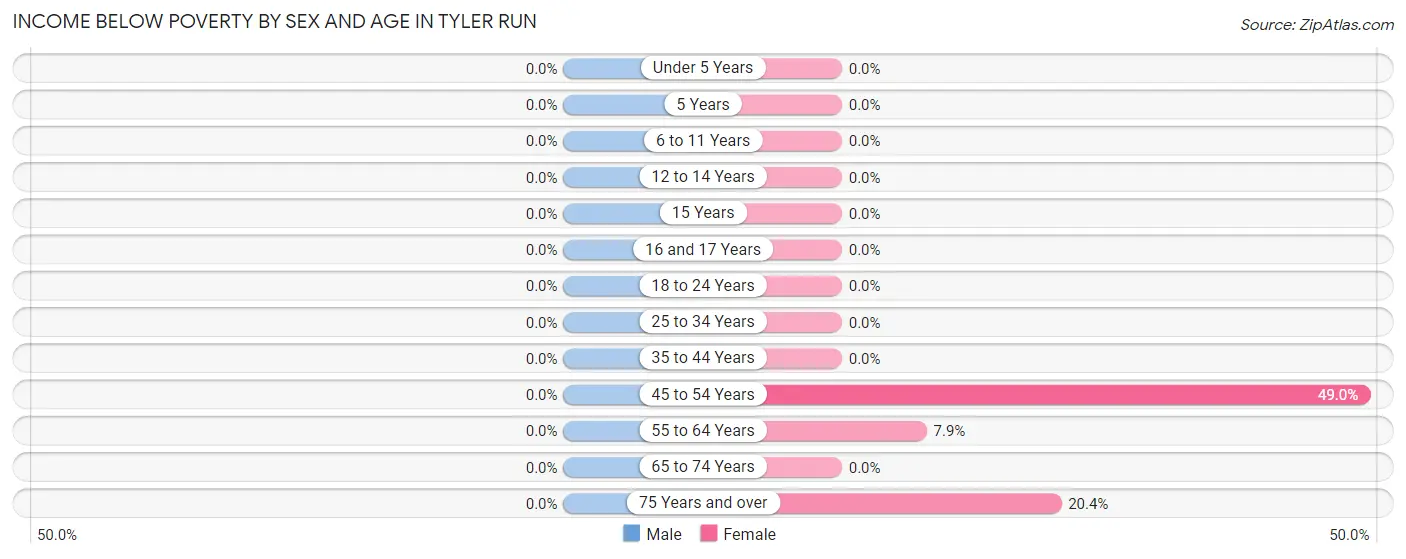
| Age Bracket | Male | Female |
| Under 5 Years | 0 (0.0%) | 0 (0.0%) |
| 5 Years | 0 (0.0%) | 0 (0.0%) |
| 6 to 11 Years | 0 (0.0%) | 0 (0.0%) |
| 12 to 14 Years | 0 (0.0%) | 0 (0.0%) |
| 15 Years | 0 (0.0%) | 0 (0.0%) |
| 16 and 17 Years | 0 (0.0%) | 0 (0.0%) |
| 18 to 24 Years | 0 (0.0%) | 0 (0.0%) |
| 25 to 34 Years | 0 (0.0%) | 0 (0.0%) |
| 35 to 44 Years | 0 (0.0%) | 0 (0.0%) |
| 45 to 54 Years | 0 (0.0%) | 25 (49.0%) |
| 55 to 64 Years | 0 (0.0%) | 10 (7.9%) |
| 65 to 74 Years | 0 (0.0%) | 0 (0.0%) |
| 75 Years and over | 0 (0.0%) | 57 (20.4%) |
| Total | 0 (0.0%) | 92 (9.1%) |
Income Above Poverty by Sex and Age in Tyler Run
According to the poverty statistics in Tyler Run, males aged under 5 years and females aged under 5 years are the age groups that are most secure financially, with 100.0% of males and 100.0% of females in these age groups living above the poverty line.
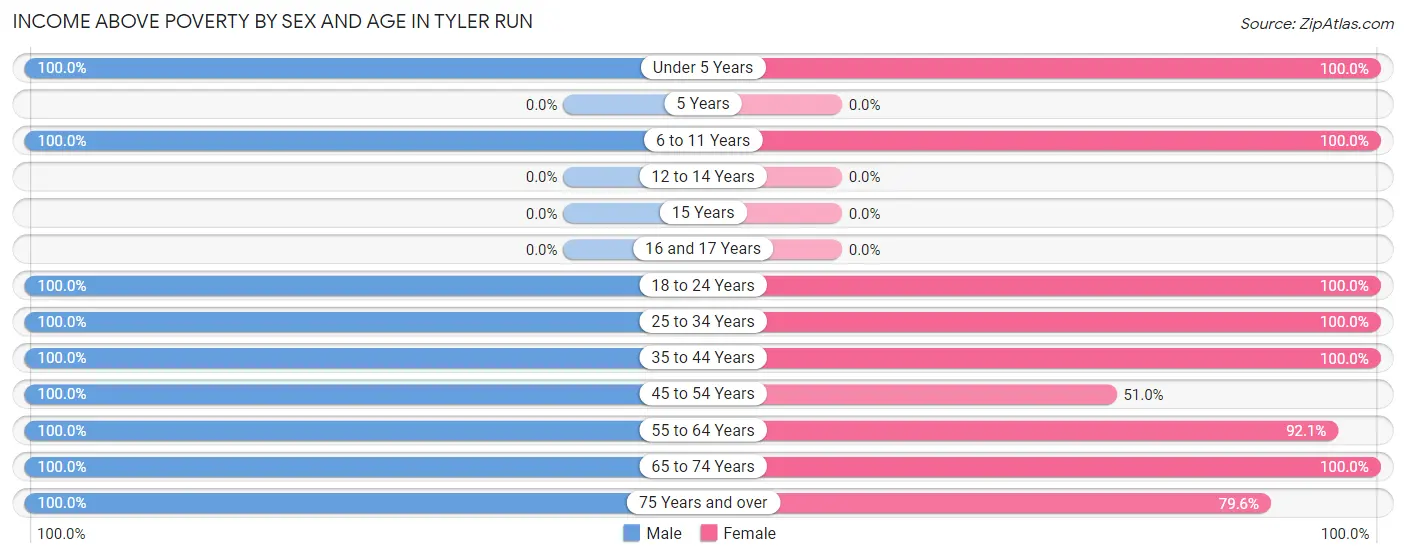
| Age Bracket | Male | Female |
| Under 5 Years | 96 (100.0%) | 66 (100.0%) |
| 5 Years | 0 (0.0%) | 0 (0.0%) |
| 6 to 11 Years | 152 (100.0%) | 50 (100.0%) |
| 12 to 14 Years | 0 (0.0%) | 0 (0.0%) |
| 15 Years | 0 (0.0%) | 0 (0.0%) |
| 16 and 17 Years | 0 (0.0%) | 0 (0.0%) |
| 18 to 24 Years | 45 (100.0%) | 12 (100.0%) |
| 25 to 34 Years | 83 (100.0%) | 135 (100.0%) |
| 35 to 44 Years | 162 (100.0%) | 134 (100.0%) |
| 45 to 54 Years | 73 (100.0%) | 26 (51.0%) |
| 55 to 64 Years | 104 (100.0%) | 117 (92.1%) |
| 65 to 74 Years | 49 (100.0%) | 152 (100.0%) |
| 75 Years and over | 123 (100.0%) | 223 (79.6%) |
| Total | 887 (100.0%) | 915 (90.9%) |
Income Below Poverty Among Married-Couple Families in Tyler Run
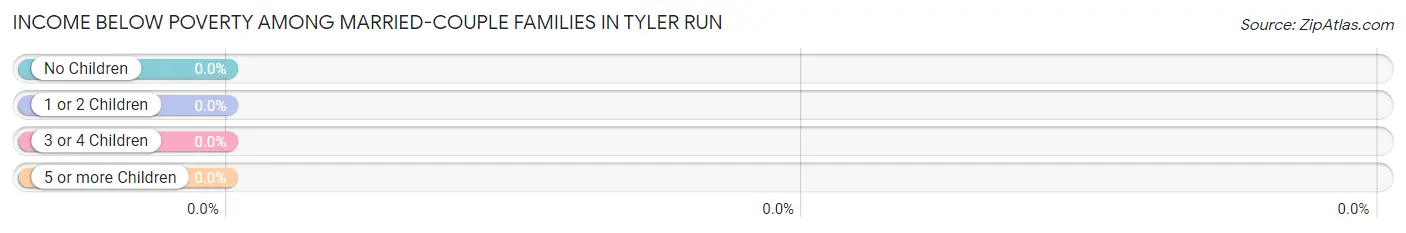
| Children | Above Poverty | Below Poverty |
| No Children | 196 (100.0%) | 0 (0.0%) |
| 1 or 2 Children | 139 (100.0%) | 0 (0.0%) |
| 3 or 4 Children | 0 (0.0%) | 0 (0.0%) |
| 5 or more Children | 0 (0.0%) | 0 (0.0%) |
| Total | 335 (100.0%) | 0 (0.0%) |
Income Below Poverty Among Single-Parent Households in Tyler Run
| Children | Single Father | Single Mother |
| No Children | 0 (0.0%) | 0 (0.0%) |
| 1 or 2 Children | 0 (0.0%) | 0 (0.0%) |
| 3 or 4 Children | 0 (0.0%) | 0 (0.0%) |
| 5 or more Children | 0 (0.0%) | 0 (0.0%) |
| Total | 0 (0.0%) | 0 (0.0%) |
Income Below Poverty Among Married-Couple vs Single-Parent Households in Tyler Run
| Children | Married-Couple Families | Single-Parent Households |
| No Children | 0 (0.0%) | 0 (0.0%) |
| 1 or 2 Children | 0 (0.0%) | 0 (0.0%) |
| 3 or 4 Children | 0 (0.0%) | 0 (0.0%) |
| 5 or more Children | 0 (0.0%) | 0 (0.0%) |
| Total | 0 (0.0%) | 0 (0.0%) |
Race in Tyler Run
The most populous races in Tyler Run are White / Caucasian (1,754 | 90.3%), Hispanic or Latino (413 | 21.3%), and Black / African American (115 | 5.9%).
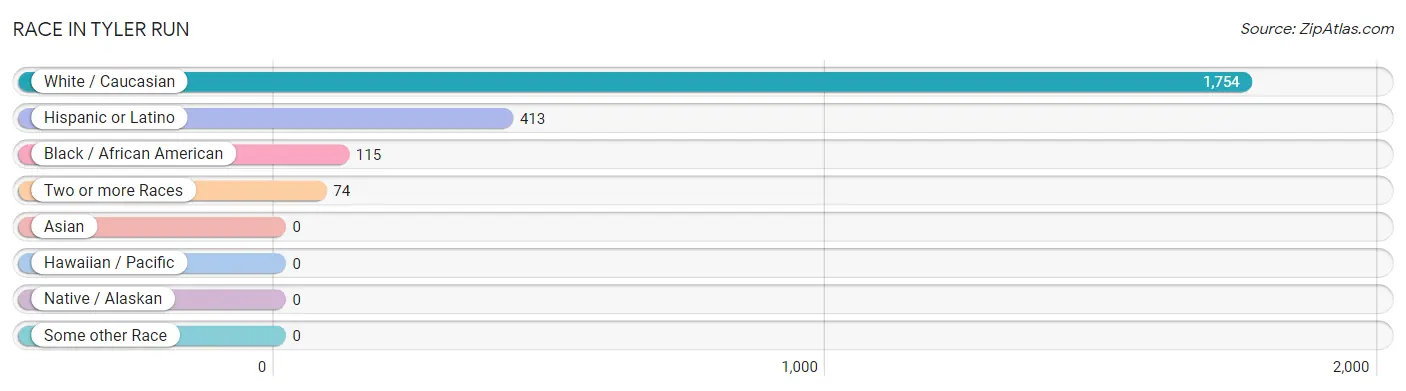
| Race | # Population | % Population |
| Asian | 0 | 0.0% |
| Black / African American | 115 | 5.9% |
| Hawaiian / Pacific | 0 | 0.0% |
| Hispanic or Latino | 413 | 21.3% |
| Native / Alaskan | 0 | 0.0% |
| White / Caucasian | 1,754 | 90.3% |
| Two or more Races | 74 | 3.8% |
| Some other Race | 0 | 0.0% |
| Total | 1,943 | 100.0% |
Ancestry in Tyler Run
The most populous ancestries reported in Tyler Run are German (577 | 29.7%), Irish (309 | 15.9%), American (226 | 11.6%), English (220 | 11.3%), and Italian (191 | 9.8%), together accounting for 78.4% of all Tyler Run residents.
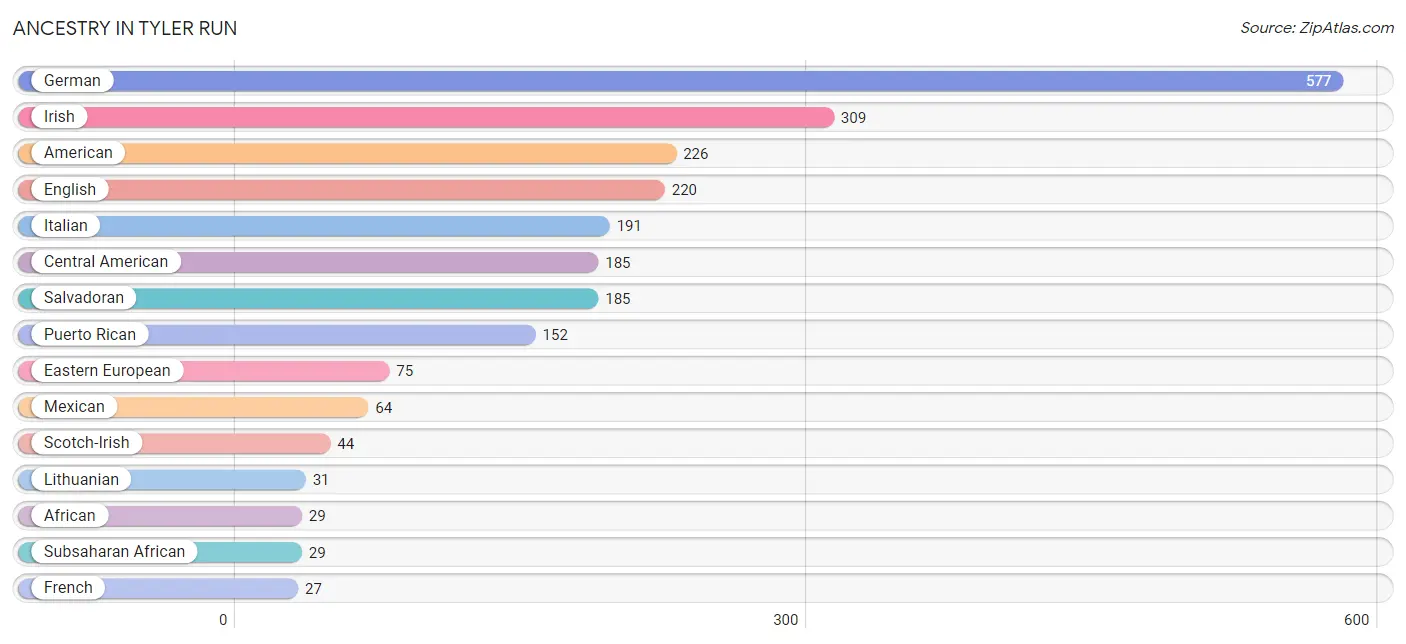
| Ancestry | # Population | % Population |
| African | 29 | 1.5% |
| American | 226 | 11.6% |
| Armenian | 9 | 0.5% |
| Central American | 185 | 9.5% |
| Cuban | 12 | 0.6% |
| Eastern European | 75 | 3.9% |
| English | 220 | 11.3% |
| European | 13 | 0.7% |
| French | 27 | 1.4% |
| German | 577 | 29.7% |
| Irish | 309 | 15.9% |
| Italian | 191 | 9.8% |
| Lithuanian | 31 | 1.6% |
| Mexican | 64 | 3.3% |
| Polish | 18 | 0.9% |
| Puerto Rican | 152 | 7.8% |
| Salvadoran | 185 | 9.5% |
| Scotch-Irish | 44 | 2.3% |
| Scottish | 8 | 0.4% |
| Serbian | 9 | 0.5% |
| Subsaharan African | 29 | 1.5% | View All 21 Rows |
Immigrants in Tyler Run
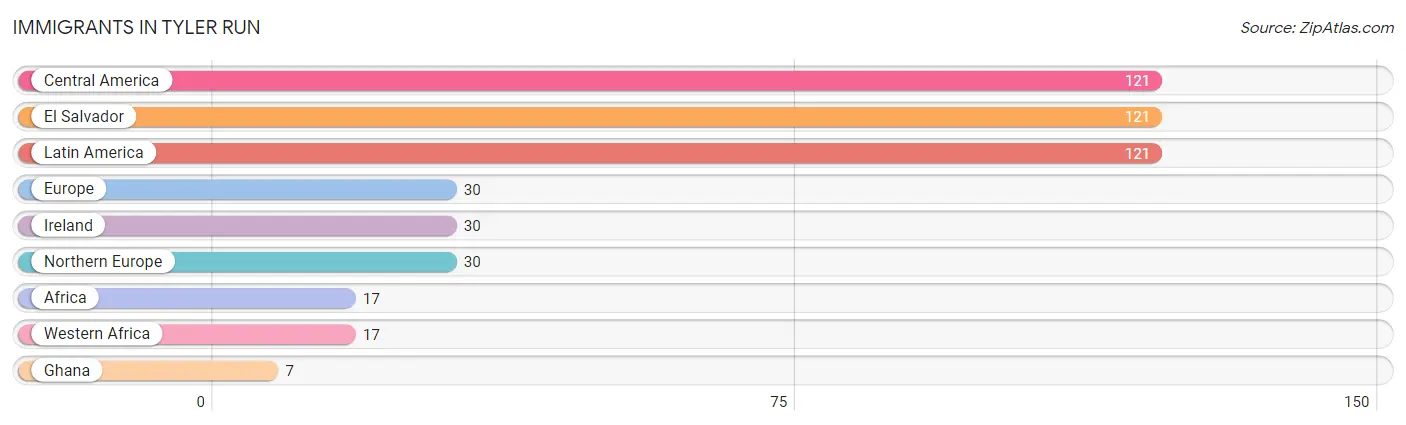
The most numerous immigrant groups reported in Tyler Run came from Central America (121 | 6.2%), El Salvador (121 | 6.2%), Latin America (121 | 6.2%), Europe (30 | 1.5%), and Ireland (30 | 1.5%), together accounting for 21.8% of all Tyler Run residents.
| Immigration Origin | # Population | % Population |
| Africa | 17 | 0.9% |
| Central America | 121 | 6.2% |
| El Salvador | 121 | 6.2% |
| Europe | 30 | 1.5% |
| Ghana | 7 | 0.4% |
| Ireland | 30 | 1.5% |
| Latin America | 121 | 6.2% |
| Northern Europe | 30 | 1.5% |
| Western Africa | 17 | 0.9% | View All 9 Rows |
Sex and Age in Tyler Run
Sex and Age in Tyler Run
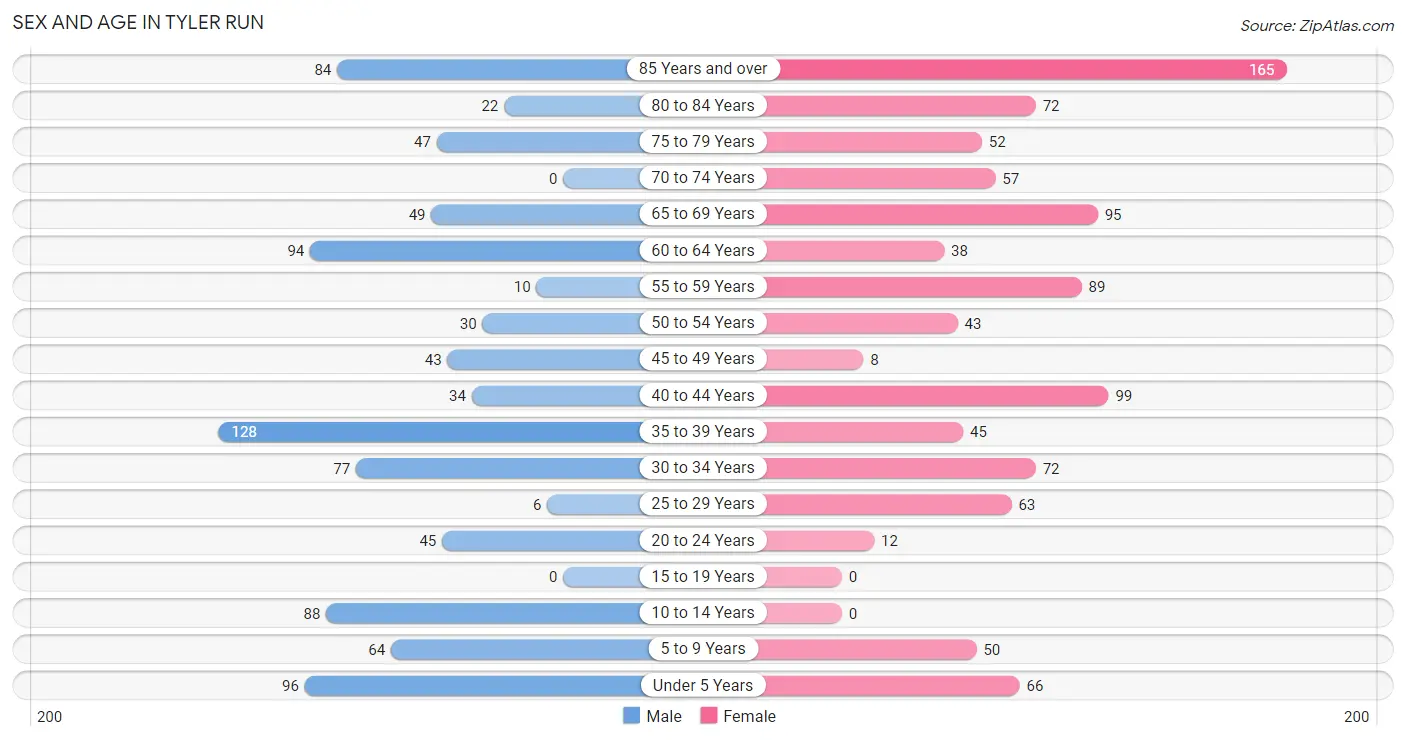
The most populous age groups in Tyler Run are 35 to 39 Years (128 | 14.0%) for men and 85 Years and over (165 | 16.1%) for women.
| Age Bracket | Male | Female |
| Under 5 Years | 96 (10.5%) | 66 (6.4%) |
| 5 to 9 Years | 64 (7.0%) | 50 (4.9%) |
| 10 to 14 Years | 88 (9.6%) | 0 (0.0%) |
| 15 to 19 Years | 0 (0.0%) | 0 (0.0%) |
| 20 to 24 Years | 45 (4.9%) | 12 (1.2%) |
| 25 to 29 Years | 6 (0.6%) | 63 (6.1%) |
| 30 to 34 Years | 77 (8.4%) | 72 (7.0%) |
| 35 to 39 Years | 128 (14.0%) | 45 (4.4%) |
| 40 to 44 Years | 34 (3.7%) | 99 (9.7%) |
| 45 to 49 Years | 43 (4.7%) | 8 (0.8%) |
| 50 to 54 Years | 30 (3.3%) | 43 (4.2%) |
| 55 to 59 Years | 10 (1.1%) | 89 (8.7%) |
| 60 to 64 Years | 94 (10.2%) | 38 (3.7%) |
| 65 to 69 Years | 49 (5.3%) | 95 (9.3%) |
| 70 to 74 Years | 0 (0.0%) | 57 (5.6%) |
| 75 to 79 Years | 47 (5.1%) | 52 (5.1%) |
| 80 to 84 Years | 22 (2.4%) | 72 (7.0%) |
| 85 Years and over | 84 (9.2%) | 165 (16.1%) |
| Total | 917 (100.0%) | 1,026 (100.0%) |
Families and Households in Tyler Run
Median Family Size in Tyler Run
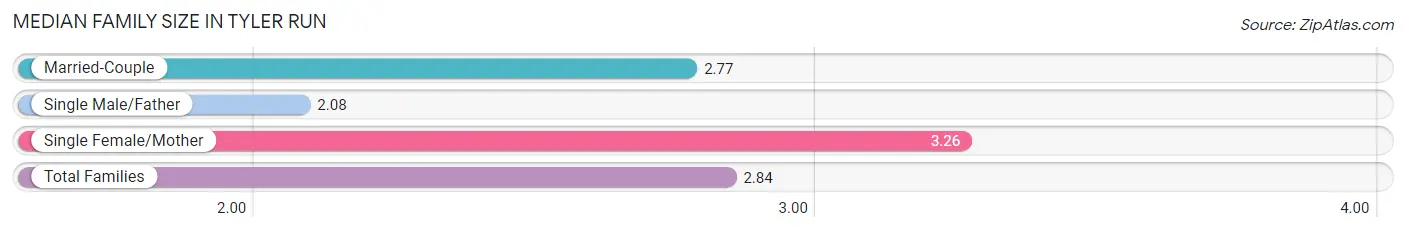
The median family size in Tyler Run is 2.84 persons per family, with single female/mother families (120 | 24.4%) accounting for the largest median family size of 3.26 persons per family. On the other hand, single male/father families (37 | 7.5%) represent the smallest median family size with 2.08 persons per family.
| Family Type | # Families | Family Size |
| Married-Couple | 335 (68.1%) | 2.77 |
| Single Male/Father | 37 (7.5%) | 2.08 |
| Single Female/Mother | 120 (24.4%) | 3.26 |
| Total Families | 492 (100.0%) | 2.84 |
Median Household Size in Tyler Run
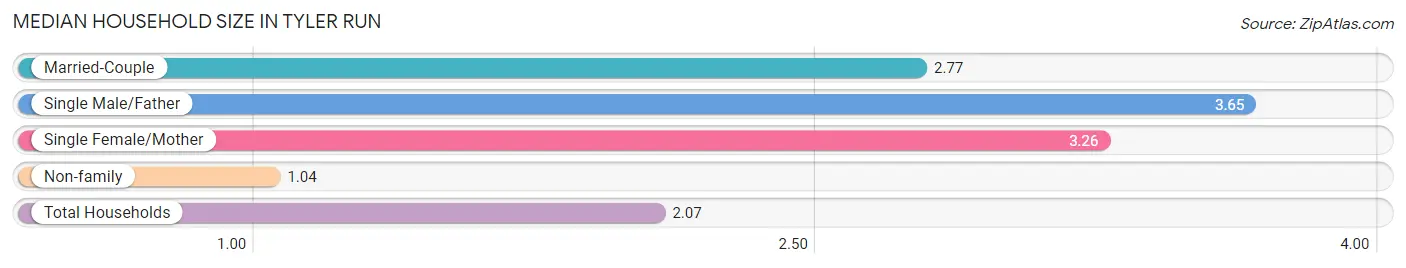
The median household size in Tyler Run is 2.07 persons per household, with single male/father households (37 | 4.0%) accounting for the largest median household size of 3.65 persons per household. non-family households (424 | 46.3%) represent the smallest median household size with 1.04 persons per household.
| Household Type | # Households | Household Size |
| Married-Couple | 335 (36.6%) | 2.77 |
| Single Male/Father | 37 (4.0%) | 3.65 |
| Single Female/Mother | 120 (13.1%) | 3.26 |
| Non-family | 424 (46.3%) | 1.04 |
| Total Households | 916 (100.0%) | 2.07 |
Household Size by Marriage Status in Tyler Run
Out of a total of 916 households in Tyler Run, 492 (53.7%) are family households, while 424 (46.3%) are nonfamily households. The most numerous type of family households are 4-person households, comprising 183, and the most common type of nonfamily households are 1-person households, comprising 405.
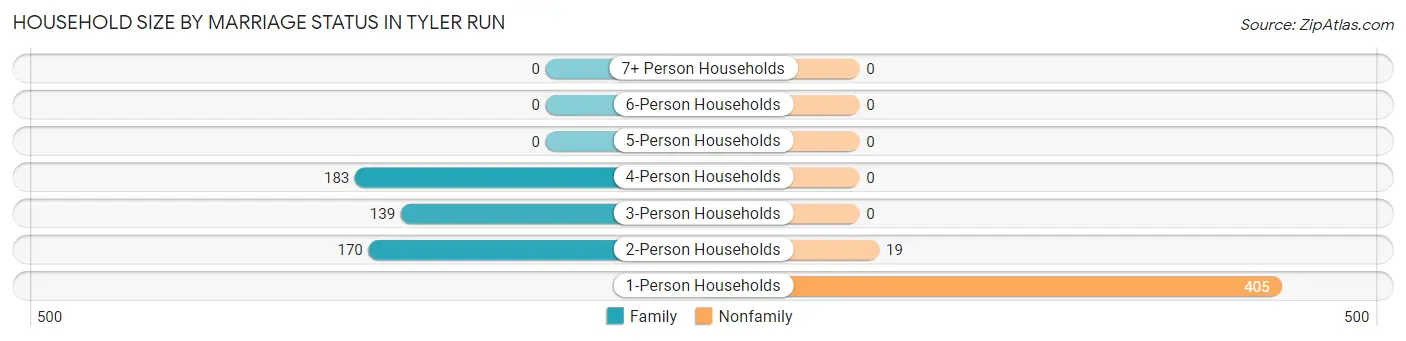
| Household Size | Family Households | Nonfamily Households |
| 1-Person Households | - | 405 (44.2%) |
| 2-Person Households | 170 (18.6%) | 19 (2.1%) |
| 3-Person Households | 139 (15.2%) | 0 (0.0%) |
| 4-Person Households | 183 (20.0%) | 0 (0.0%) |
| 5-Person Households | 0 (0.0%) | 0 (0.0%) |
| 6-Person Households | 0 (0.0%) | 0 (0.0%) |
| 7+ Person Households | 0 (0.0%) | 0 (0.0%) |
| Total | 492 (53.7%) | 424 (46.3%) |
Female Fertility in Tyler Run
Fertility by Age in Tyler Run
Average fertility rate in Tyler Run is 107.0 births per 1,000 women. Women in the age bracket of 20 to 34 years have the highest fertility rate with 116.0 births per 1,000 women. Women in the age bracket of 20 to 34 years acount for 53.1% of all women with births.
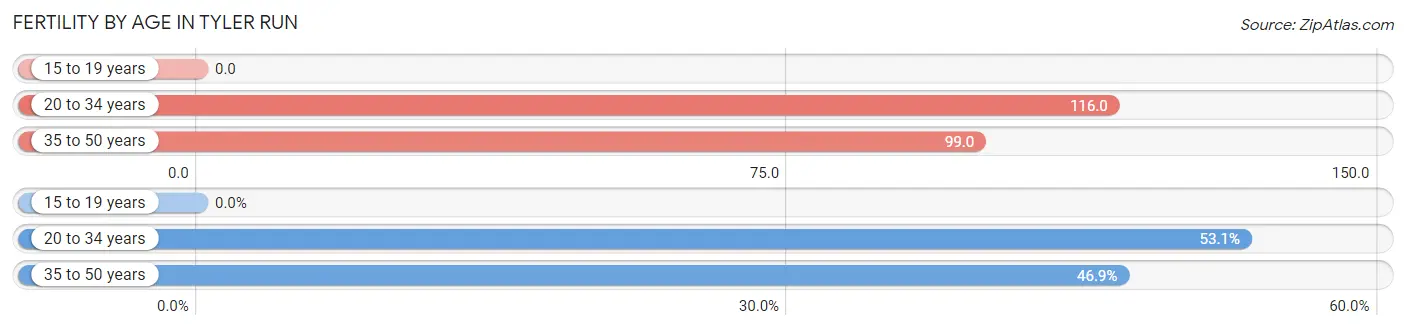
| Age Bracket | Women with Births | Births / 1,000 Women |
| 15 to 19 years | 0 (0.0%) | 0.0 |
| 20 to 34 years | 17 (53.1%) | 116.0 |
| 35 to 50 years | 15 (46.9%) | 99.0 |
| Total | 32 (100.0%) | 107.0 |
Fertility by Age by Marriage Status in Tyler Run
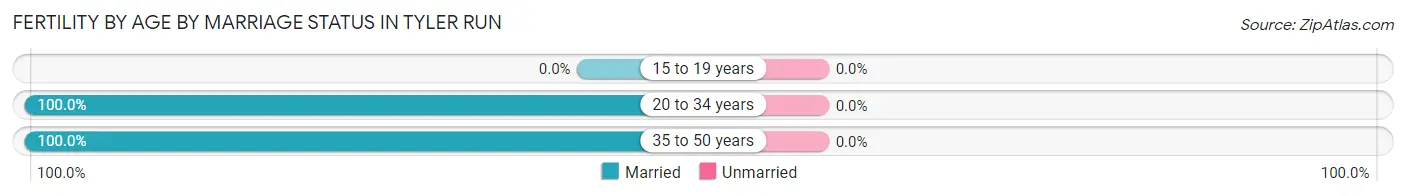
| Age Bracket | Married | Unmarried |
| 15 to 19 years | 0 (0.0%) | 0 (0.0%) |
| 20 to 34 years | 17 (100.0%) | 0 (0.0%) |
| 35 to 50 years | 15 (100.0%) | 0 (0.0%) |
| Total | 32 (100.0%) | 0 (0.0%) |
Fertility by Education in Tyler Run
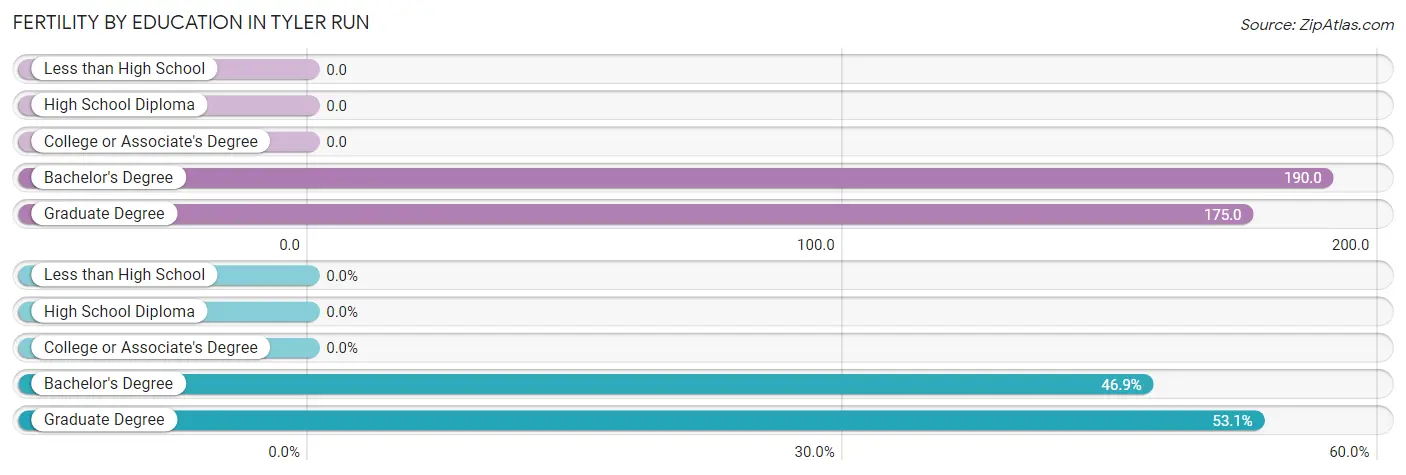
| Educational Attainment | Women with Births | Births / 1,000 Women |
| Less than High School | 0 (0.0%) | 0.0 |
| High School Diploma | 0 (0.0%) | 0.0 |
| College or Associate's Degree | 0 (0.0%) | 0.0 |
| Bachelor's Degree | 15 (46.9%) | 190.0 |
| Graduate Degree | 17 (53.1%) | 175.0 |
| Total | 32 (100.0%) | 107.0 |
Fertility by Education by Marriage Status in Tyler Run
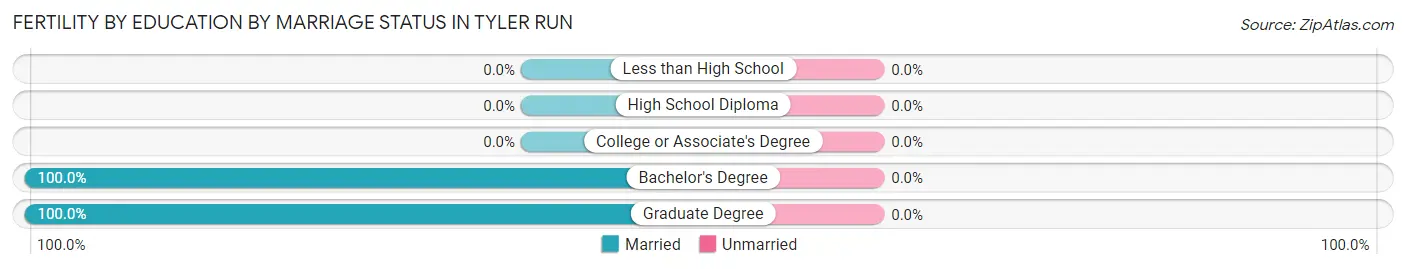
| Educational Attainment | Married | Unmarried |
| Less than High School | 0 (0.0%) | 0 (0.0%) |
| High School Diploma | 0 (0.0%) | 0 (0.0%) |
| College or Associate's Degree | 0 (0.0%) | 0 (0.0%) |
| Bachelor's Degree | 15 (100.0%) | 0 (0.0%) |
| Graduate Degree | 17 (100.0%) | 0 (0.0%) |
| Total | 32 (100.0%) | 0 (0.0%) |
Employment Characteristics in Tyler Run
Employment by Class of Employer in Tyler Run
Among the 818 employed individuals in Tyler Run, private company employees (629 | 76.9%), not-for-profit organizations (106 | 13.0%), and self-employed (not incorporated) (23 | 2.8%) make up the most common classes of employment.
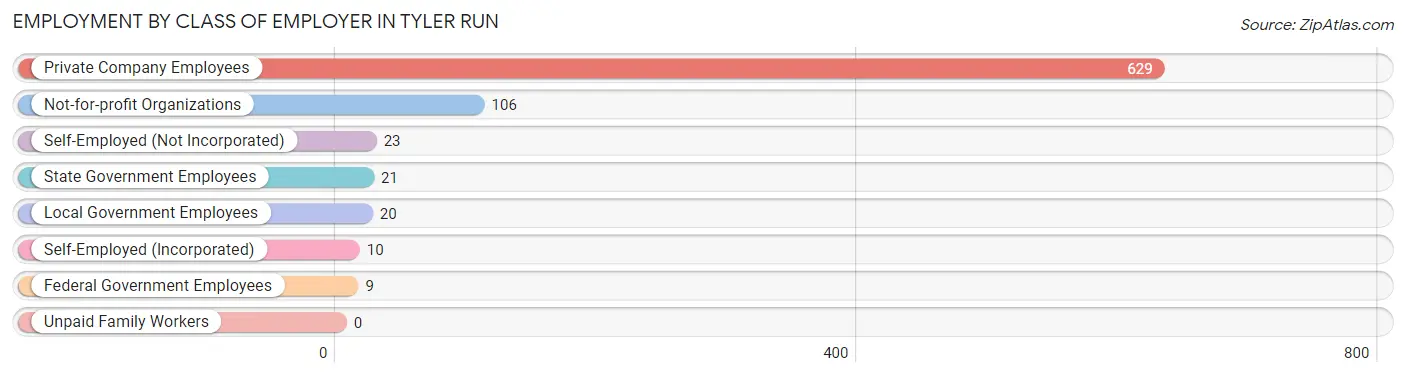
| Employer Class | # Employees | % Employees |
| Private Company Employees | 629 | 76.9% |
| Self-Employed (Incorporated) | 10 | 1.2% |
| Self-Employed (Not Incorporated) | 23 | 2.8% |
| Not-for-profit Organizations | 106 | 13.0% |
| Local Government Employees | 20 | 2.4% |
| State Government Employees | 21 | 2.6% |
| Federal Government Employees | 9 | 1.1% |
| Unpaid Family Workers | 0 | 0.0% |
| Total | 818 | 100.0% |
Employment Status by Age in Tyler Run
According to the labor force statistics for Tyler Run, out of the total population over 16 years of age (1,579), 56.1% or 886 individuals are in the labor force, with 5.0% or 44 of them unemployed. The age group with the highest labor force participation rate is 20 to 24 years, with 100.0% or 57 individuals in the labor force. Within the labor force, the 30 to 34 years age range has the highest percentage of unemployed individuals, with 24.8% or 33 of them being unemployed.
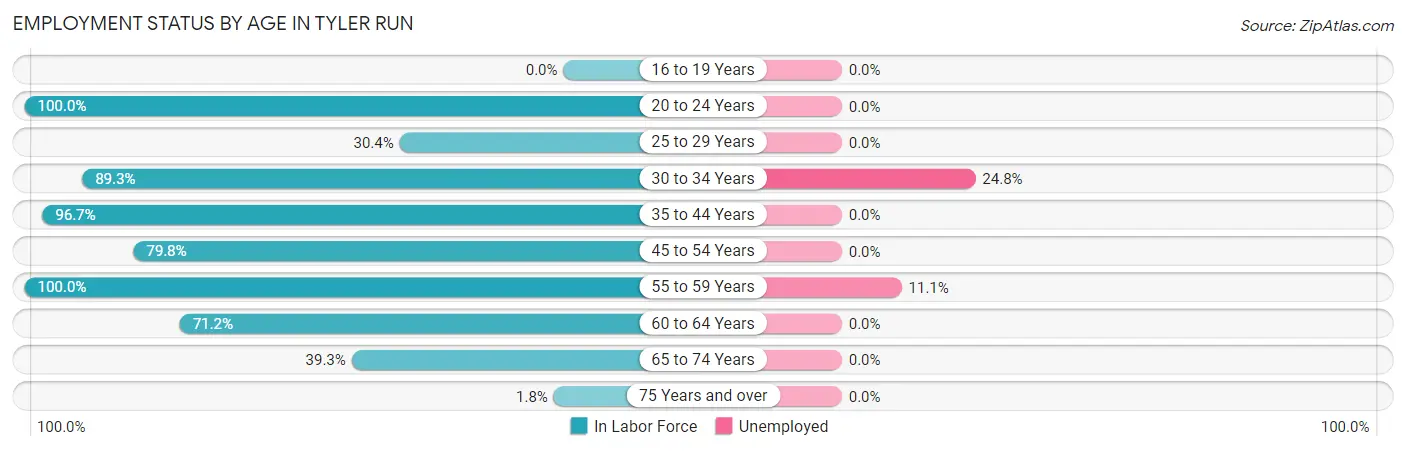
| Age Bracket | In Labor Force | Unemployed |
| 16 to 19 Years | 0 (0.0%) | 0 (0.0%) |
| 20 to 24 Years | 57 (100.0%) | 0 (0.0%) |
| 25 to 29 Years | 21 (30.4%) | 0 (0.0%) |
| 30 to 34 Years | 133 (89.3%) | 33 (24.8%) |
| 35 to 44 Years | 296 (96.7%) | 0 (0.0%) |
| 45 to 54 Years | 99 (79.8%) | 0 (0.0%) |
| 55 to 59 Years | 99 (100.0%) | 11 (11.1%) |
| 60 to 64 Years | 94 (71.2%) | 0 (0.0%) |
| 65 to 74 Years | 79 (39.3%) | 0 (0.0%) |
| 75 Years and over | 8 (1.8%) | 0 (0.0%) |
| Total | 886 (56.1%) | 44 (5.0%) |
Employment Status by Educational Attainment in Tyler Run
According to labor force statistics for Tyler Run, 84.4% of individuals (742) out of the total population between 25 and 64 years of age (879) are in the labor force, with 5.9% or 44 of them being unemployed. The group with the highest labor force participation rate are those with the educational attainment of high school diploma, with 90.5% or 191 individuals in the labor force. Within the labor force, individuals with high school diploma education have the highest percentage of unemployment, with 17.3% or 33 of them being unemployed.
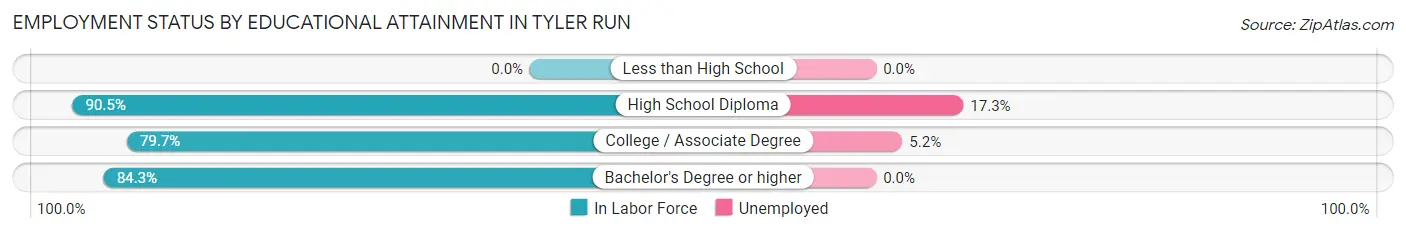
| Educational Attainment | In Labor Force | Unemployed |
| Less than High School | 0 (0.0%) | 0 (0.0%) |
| High School Diploma | 191 (90.5%) | 37 (17.3%) |
| College / Associate Degree | 212 (79.7%) | 14 (5.2%) |
| Bachelor's Degree or higher | 339 (84.3%) | 0 (0.0%) |
| Total | 742 (84.4%) | 52 (5.9%) |
Employment Occupations by Sex in Tyler Run
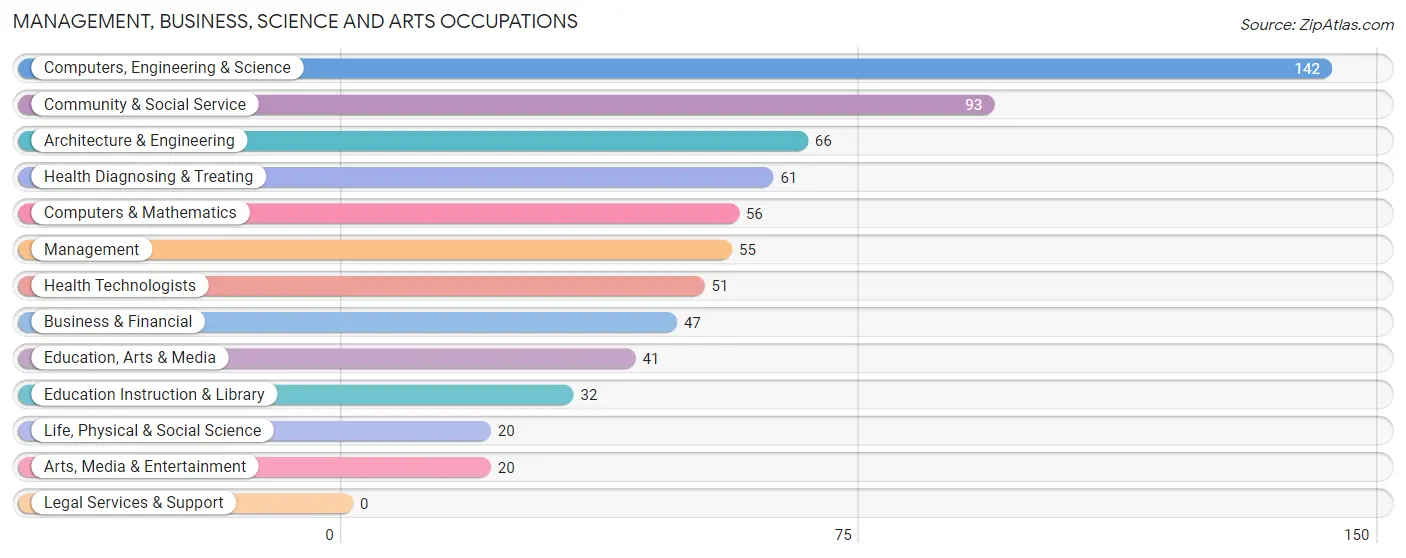
Management, Business, Science and Arts Occupations
The most common Management, Business, Science and Arts occupations in Tyler Run are Computers, Engineering & Science (142 | 16.9%), Community & Social Service (93 | 11.1%), Architecture & Engineering (66 | 7.8%), Health Diagnosing & Treating (61 | 7.2%), and Computers & Mathematics (56 | 6.7%).
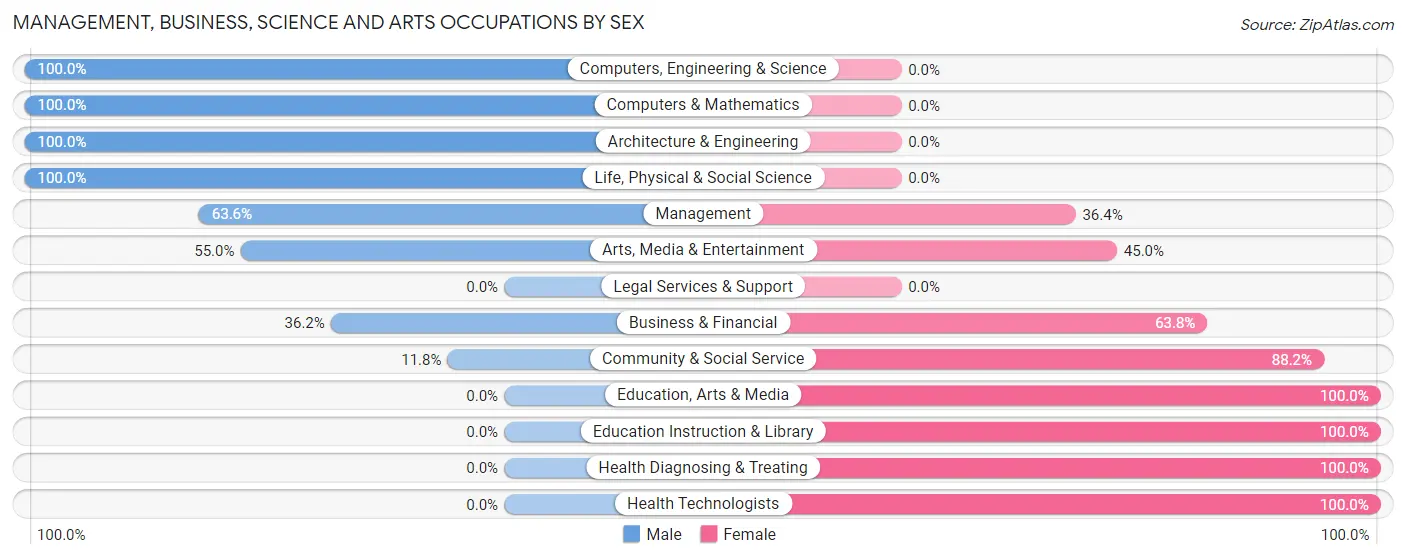
Management, Business, Science and Arts Occupations by Sex
Within the Management, Business, Science and Arts occupations in Tyler Run, the most male-oriented occupations are Computers, Engineering & Science (100.0%), Computers & Mathematics (100.0%), and Architecture & Engineering (100.0%), while the most female-oriented occupations are Education, Arts & Media (100.0%), Education Instruction & Library (100.0%), and Health Diagnosing & Treating (100.0%).
| Occupation | Male | Female |
| Management | 35 (63.6%) | 20 (36.4%) |
| Business & Financial | 17 (36.2%) | 30 (63.8%) |
| Computers, Engineering & Science | 142 (100.0%) | 0 (0.0%) |
| Computers & Mathematics | 56 (100.0%) | 0 (0.0%) |
| Architecture & Engineering | 66 (100.0%) | 0 (0.0%) |
| Life, Physical & Social Science | 20 (100.0%) | 0 (0.0%) |
| Community & Social Service | 11 (11.8%) | 82 (88.2%) |
| Education, Arts & Media | 0 (0.0%) | 41 (100.0%) |
| Legal Services & Support | 0 (0.0%) | 0 (0.0%) |
| Education Instruction & Library | 0 (0.0%) | 32 (100.0%) |
| Arts, Media & Entertainment | 11 (55.0%) | 9 (45.0%) |
| Health Diagnosing & Treating | 0 (0.0%) | 61 (100.0%) |
| Health Technologists | 0 (0.0%) | 51 (100.0%) |
| Total (Category) | 205 (51.5%) | 193 (48.5%) |
| Total (Overall) | 508 (60.3%) | 334 (39.7%) |
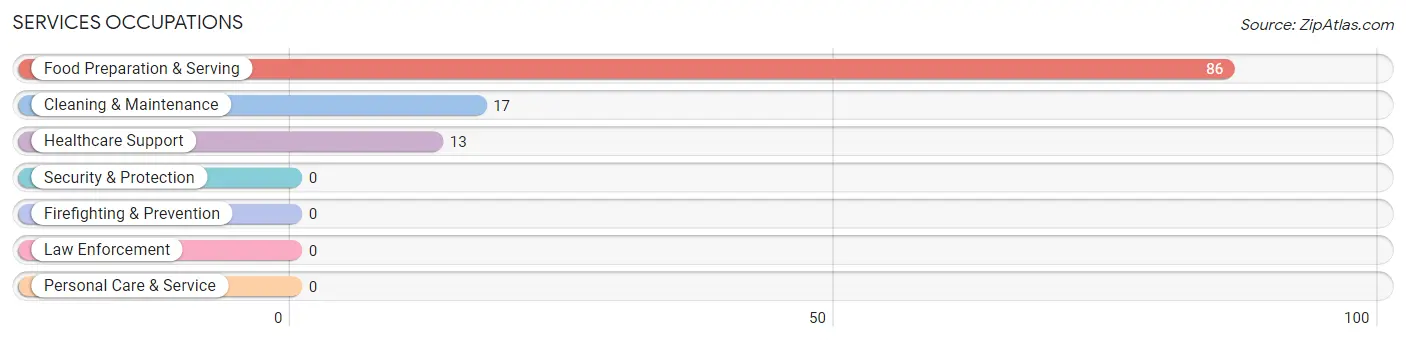
Services Occupations
The most common Services occupations in Tyler Run are Food Preparation & Serving (86 | 10.2%), Cleaning & Maintenance (17 | 2.0%), and Healthcare Support (13 | 1.5%).
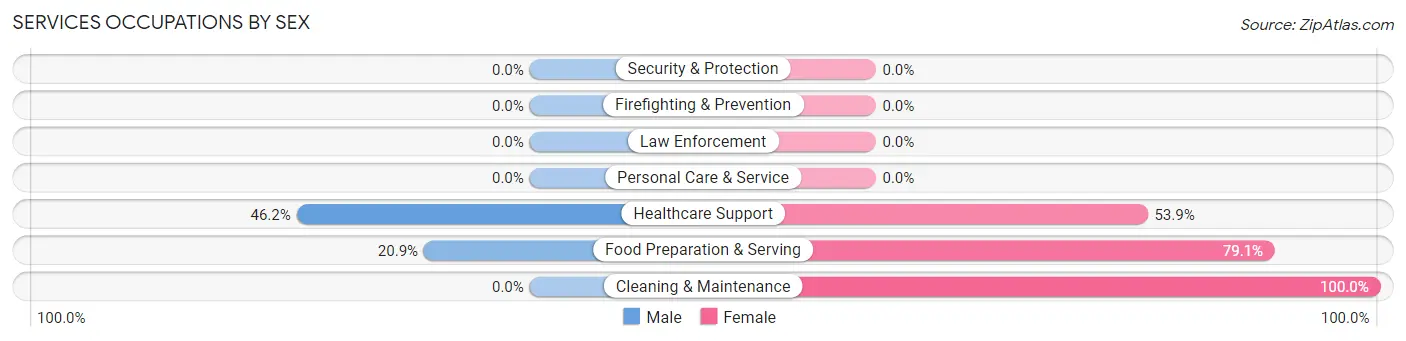
Services Occupations by Sex
Within the Services occupations in Tyler Run, the most male-oriented occupations are Healthcare Support (46.2%), and Food Preparation & Serving (20.9%), while the most female-oriented occupations are Cleaning & Maintenance (100.0%), Food Preparation & Serving (79.1%), and Healthcare Support (53.8%).
| Occupation | Male | Female |
| Healthcare Support | 6 (46.2%) | 7 (53.8%) |
| Security & Protection | 0 (0.0%) | 0 (0.0%) |
| Firefighting & Prevention | 0 (0.0%) | 0 (0.0%) |
| Law Enforcement | 0 (0.0%) | 0 (0.0%) |
| Food Preparation & Serving | 18 (20.9%) | 68 (79.1%) |
| Cleaning & Maintenance | 0 (0.0%) | 17 (100.0%) |
| Personal Care & Service | 0 (0.0%) | 0 (0.0%) |
| Total (Category) | 24 (20.7%) | 92 (79.3%) |
| Total (Overall) | 508 (60.3%) | 334 (39.7%) |
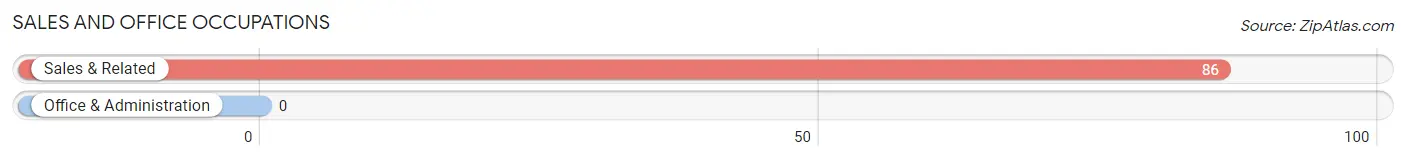
Sales and Office Occupations
The most common Sales and Office occupations in Tyler Run are , and Sales & Related (86 | 10.2%).
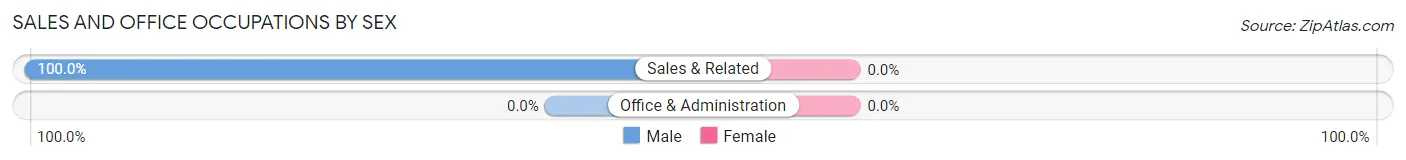
Sales and Office Occupations by Sex
| Occupation | Male | Female |
| Sales & Related | 86 (100.0%) | 0 (0.0%) |
| Office & Administration | 0 (0.0%) | 0 (0.0%) |
| Total (Category) | 86 (100.0%) | 0 (0.0%) |
| Total (Overall) | 508 (60.3%) | 334 (39.7%) |
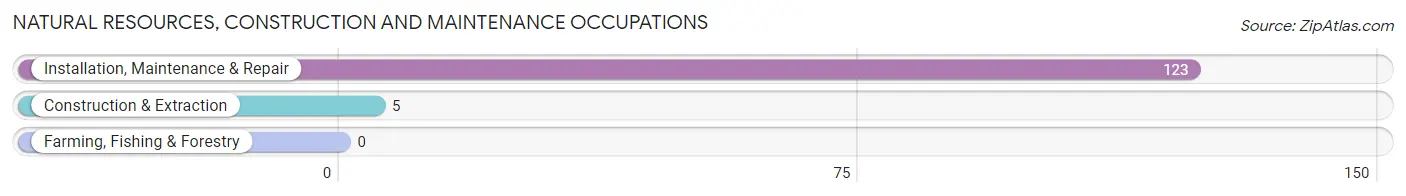
Natural Resources, Construction and Maintenance Occupations
The most common Natural Resources, Construction and Maintenance occupations in Tyler Run are Installation, Maintenance & Repair (123 | 14.6%), and Construction & Extraction (5 | 0.6%).
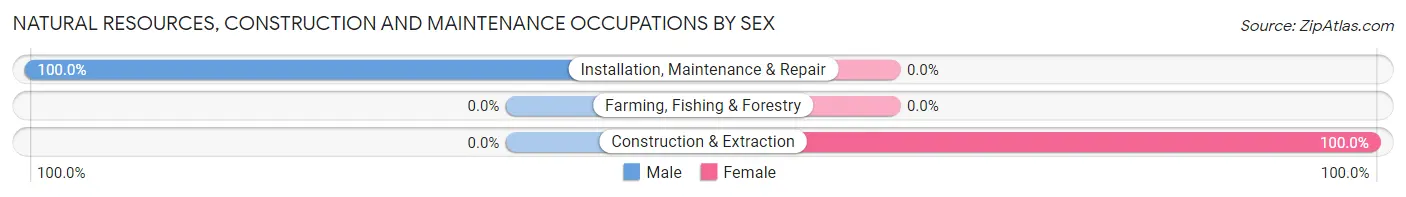
Natural Resources, Construction and Maintenance Occupations by Sex
| Occupation | Male | Female |
| Farming, Fishing & Forestry | 0 (0.0%) | 0 (0.0%) |
| Construction & Extraction | 0 (0.0%) | 5 (100.0%) |
| Installation, Maintenance & Repair | 123 (100.0%) | 0 (0.0%) |
| Total (Category) | 123 (96.1%) | 5 (3.9%) |
| Total (Overall) | 508 (60.3%) | 334 (39.7%) |
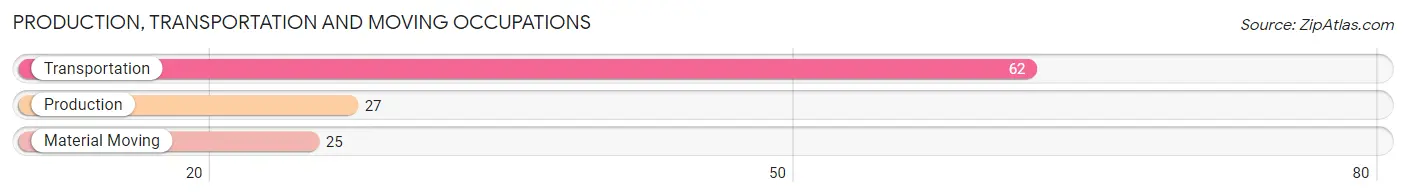
Production, Transportation and Moving Occupations
The most common Production, Transportation and Moving occupations in Tyler Run are Transportation (62 | 7.4%), Production (27 | 3.2%), and Material Moving (25 | 3.0%).
Production, Transportation and Moving Occupations by Sex
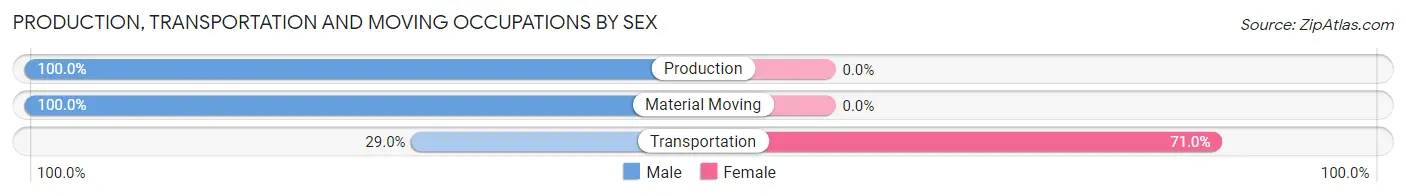
| Occupation | Male | Female |
| Production | 27 (100.0%) | 0 (0.0%) |
| Transportation | 18 (29.0%) | 44 (71.0%) |
| Material Moving | 25 (100.0%) | 0 (0.0%) |
| Total (Category) | 70 (61.4%) | 44 (38.6%) |
| Total (Overall) | 508 (60.3%) | 334 (39.7%) |
Employment Industries by Sex in Tyler Run
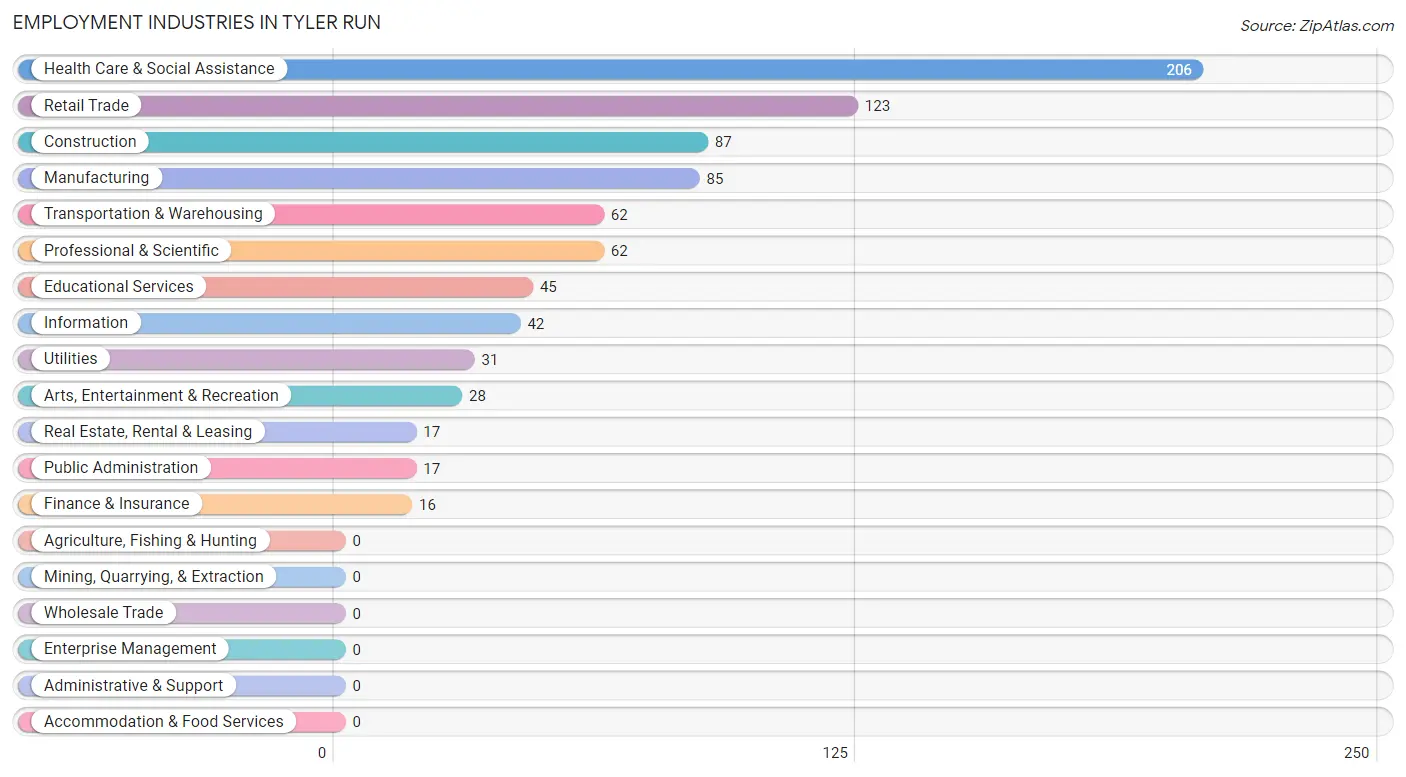
Employment Industries in Tyler Run
The major employment industries in Tyler Run include Health Care & Social Assistance (206 | 24.5%), Retail Trade (123 | 14.6%), Construction (87 | 10.3%), Manufacturing (85 | 10.1%), and Transportation & Warehousing (62 | 7.4%).
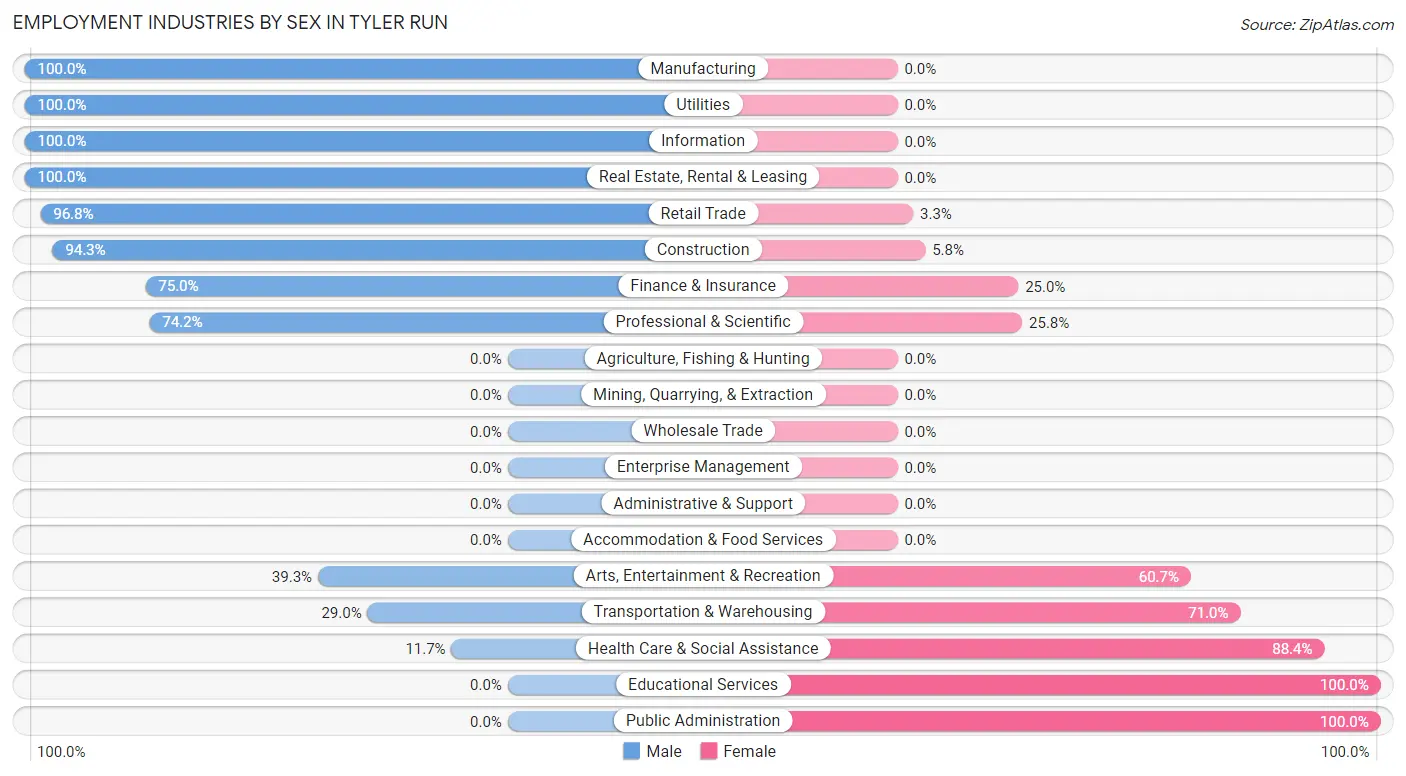
Employment Industries by Sex in Tyler Run
The Tyler Run industries that see more men than women are Manufacturing (100.0%), Utilities (100.0%), and Information (100.0%), whereas the industries that tend to have a higher number of women are Educational Services (100.0%), Public Administration (100.0%), and Health Care & Social Assistance (88.3%).
| Industry | Male | Female |
| Agriculture, Fishing & Hunting | 0 (0.0%) | 0 (0.0%) |
| Mining, Quarrying, & Extraction | 0 (0.0%) | 0 (0.0%) |
| Construction | 82 (94.3%) | 5 (5.8%) |
| Manufacturing | 85 (100.0%) | 0 (0.0%) |
| Wholesale Trade | 0 (0.0%) | 0 (0.0%) |
| Retail Trade | 119 (96.8%) | 4 (3.3%) |
| Transportation & Warehousing | 18 (29.0%) | 44 (71.0%) |
| Utilities | 31 (100.0%) | 0 (0.0%) |
| Information | 42 (100.0%) | 0 (0.0%) |
| Finance & Insurance | 12 (75.0%) | 4 (25.0%) |
| Real Estate, Rental & Leasing | 17 (100.0%) | 0 (0.0%) |
| Professional & Scientific | 46 (74.2%) | 16 (25.8%) |
| Enterprise Management | 0 (0.0%) | 0 (0.0%) |
| Administrative & Support | 0 (0.0%) | 0 (0.0%) |
| Educational Services | 0 (0.0%) | 45 (100.0%) |
| Health Care & Social Assistance | 24 (11.7%) | 182 (88.3%) |
| Arts, Entertainment & Recreation | 11 (39.3%) | 17 (60.7%) |
| Accommodation & Food Services | 0 (0.0%) | 0 (0.0%) |
| Public Administration | 0 (0.0%) | 17 (100.0%) |
| Total | 508 (60.3%) | 334 (39.7%) |
Education in Tyler Run
School Enrollment in Tyler Run
The most common levels of schooling among the 279 students in Tyler Run are elementary school (127 | 45.5%), middle school (75 | 26.9%), and college / undergraduate (32 | 11.5%).
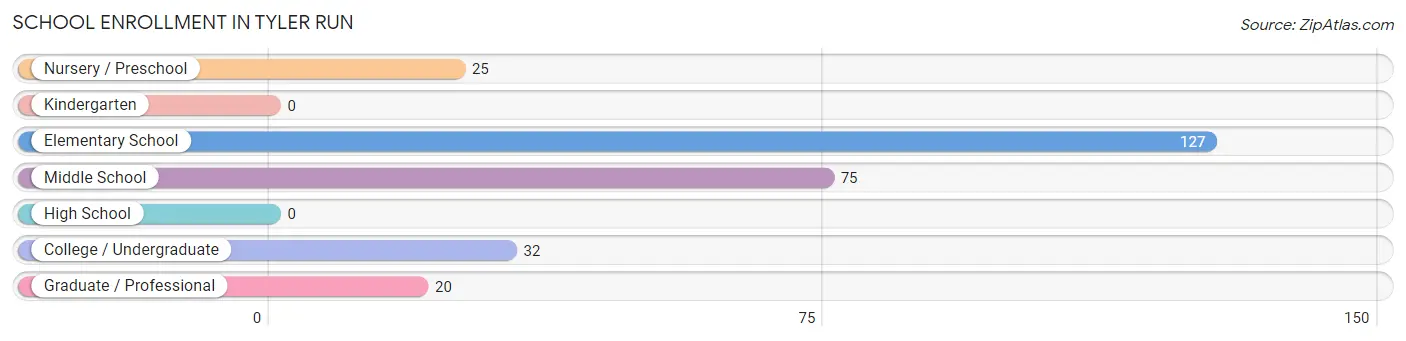
| School Level | # Students | % Students |
| Nursery / Preschool | 25 | 9.0% |
| Kindergarten | 0 | 0.0% |
| Elementary School | 127 | 45.5% |
| Middle School | 75 | 26.9% |
| High School | 0 | 0.0% |
| College / Undergraduate | 32 | 11.5% |
| Graduate / Professional | 20 | 7.2% |
| Total | 279 | 100.0% |
School Enrollment by Age by Funding Source in Tyler Run
Out of a total of 279 students who are enrolled in schools in Tyler Run, 36 (12.9%) attend a private institution, while the remaining 243 (87.1%) are enrolled in public schools. The age group of 3 to 4 year olds has the highest likelihood of being enrolled in private schools, with 25 (100.0% in the age bracket) enrolled. Conversely, the age group of 5 to 9 year old has the lowest likelihood of being enrolled in a private school, with 114 (100.0% in the age bracket) attending a public institution.
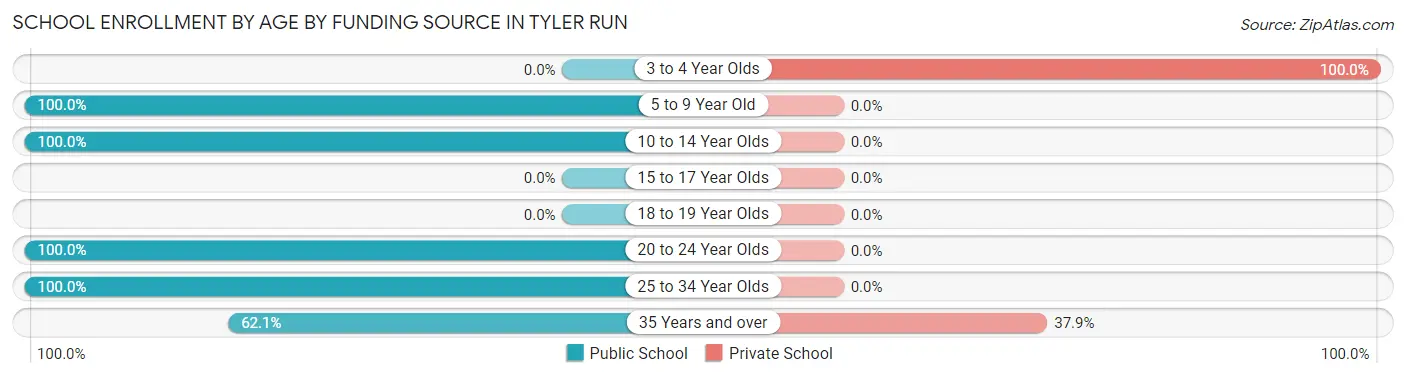
| Age Bracket | Public School | Private School |
| 3 to 4 Year Olds | 0 (0.0%) | 25 (100.0%) |
| 5 to 9 Year Old | 114 (100.0%) | 0 (0.0%) |
| 10 to 14 Year Olds | 88 (100.0%) | 0 (0.0%) |
| 15 to 17 Year Olds | 0 (0.0%) | 0 (0.0%) |
| 18 to 19 Year Olds | 0 (0.0%) | 0 (0.0%) |
| 20 to 24 Year Olds | 8 (100.0%) | 0 (0.0%) |
| 25 to 34 Year Olds | 15 (100.0%) | 0 (0.0%) |
| 35 Years and over | 18 (62.1%) | 11 (37.9%) |
| Total | 243 (87.1%) | 36 (12.9%) |
Educational Attainment by Field of Study in Tyler Run
Education (154 | 25.9%), science & technology (97 | 16.3%), arts & humanities (92 | 15.5%), business (82 | 13.8%), and communications (62 | 10.4%) are the most common fields of study among 595 individuals in Tyler Run who have obtained a bachelor's degree or higher.
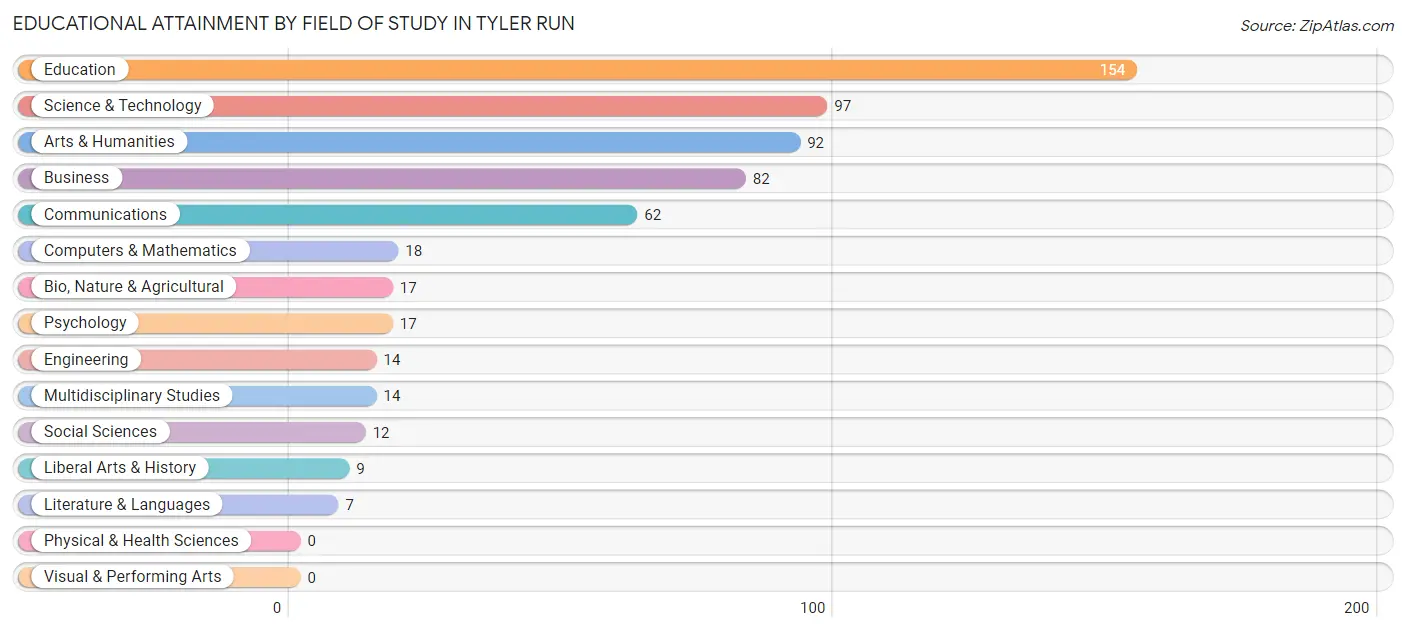
| Field of Study | # Graduates | % Graduates |
| Computers & Mathematics | 18 | 3.0% |
| Bio, Nature & Agricultural | 17 | 2.9% |
| Physical & Health Sciences | 0 | 0.0% |
| Psychology | 17 | 2.9% |
| Social Sciences | 12 | 2.0% |
| Engineering | 14 | 2.4% |
| Multidisciplinary Studies | 14 | 2.4% |
| Science & Technology | 97 | 16.3% |
| Business | 82 | 13.8% |
| Education | 154 | 25.9% |
| Literature & Languages | 7 | 1.2% |
| Liberal Arts & History | 9 | 1.5% |
| Visual & Performing Arts | 0 | 0.0% |
| Communications | 62 | 10.4% |
| Arts & Humanities | 92 | 15.5% |
| Total | 595 | 100.0% |
Transportation & Commute in Tyler Run
Vehicle Availability by Sex in Tyler Run
The most prevalent vehicle ownership categories in Tyler Run are males with 2 vehicles (187, accounting for 36.8%) and females with 2 vehicles (86, making up 60.3%).
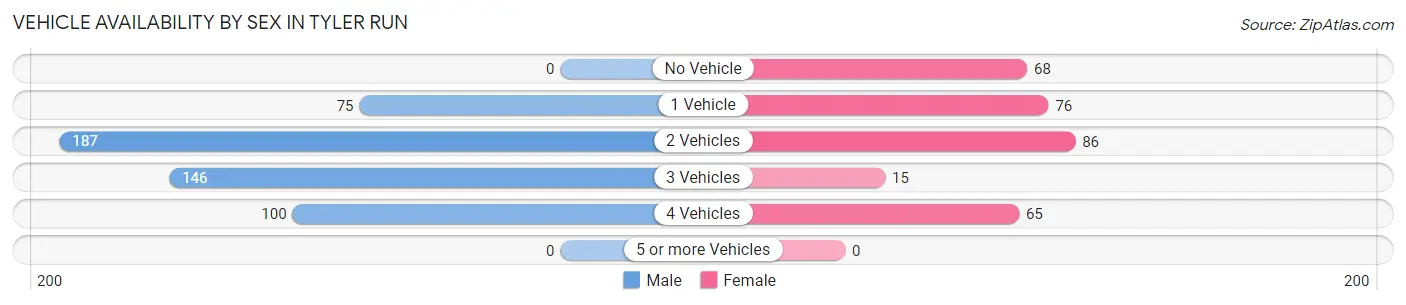
| Vehicles Available | Male | Female |
| No Vehicle | 0 (0.0%) | 68 (21.9%) |
| 1 Vehicle | 75 (14.8%) | 76 (24.5%) |
| 2 Vehicles | 187 (36.8%) | 86 (27.7%) |
| 3 Vehicles | 146 (28.7%) | 15 (4.8%) |
| 4 Vehicles | 100 (19.7%) | 65 (21.0%) |
| 5 or more Vehicles | 0 (0.0%) | 0 (0.0%) |
| Total | 508 (100.0%) | 310 (100.0%) |
Commute Time in Tyler Run
The most frequently occuring commute durations in Tyler Run are 10 to 14 minutes (186 commuters, 23.0%), 40 to 44 minutes (107 commuters, 13.2%), and 60 to 89 minutes (99 commuters, 12.2%).
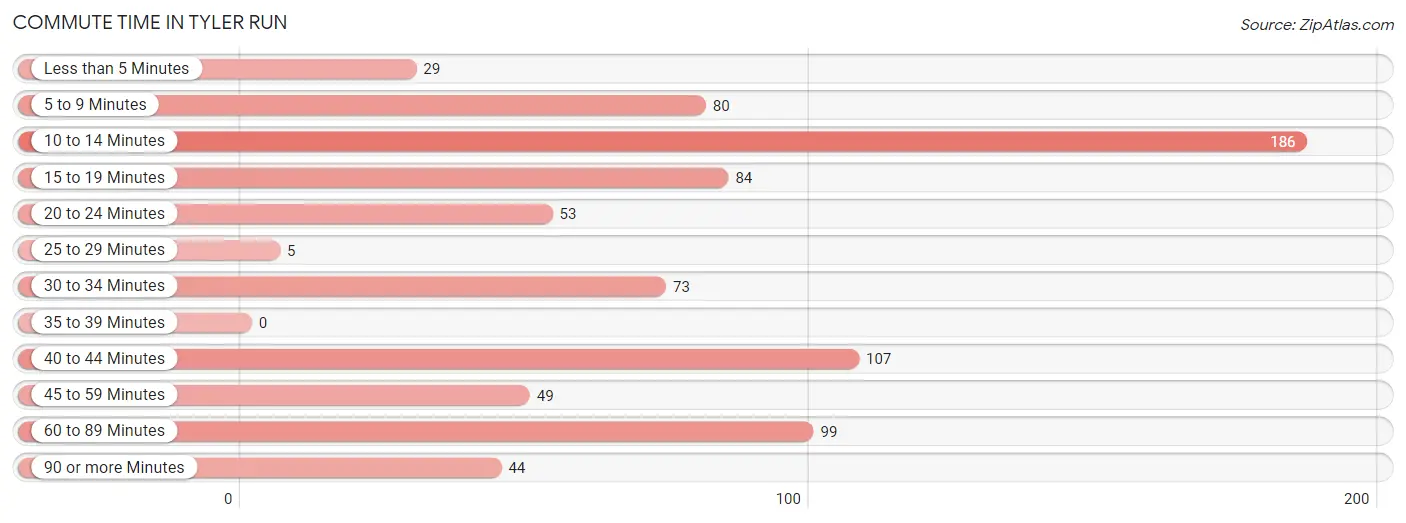
| Commute Time | # Commuters | % Commuters |
| Less than 5 Minutes | 29 | 3.6% |
| 5 to 9 Minutes | 80 | 9.9% |
| 10 to 14 Minutes | 186 | 23.0% |
| 15 to 19 Minutes | 84 | 10.4% |
| 20 to 24 Minutes | 53 | 6.6% |
| 25 to 29 Minutes | 5 | 0.6% |
| 30 to 34 Minutes | 73 | 9.0% |
| 35 to 39 Minutes | 0 | 0.0% |
| 40 to 44 Minutes | 107 | 13.2% |
| 45 to 59 Minutes | 49 | 6.1% |
| 60 to 89 Minutes | 99 | 12.2% |
| 90 or more Minutes | 44 | 5.4% |
Commute Time by Sex in Tyler Run
The most common commute times in Tyler Run are 40 to 44 minutes (97 commuters, 19.1%) for males and 10 to 14 minutes (91 commuters, 30.2%) for females.
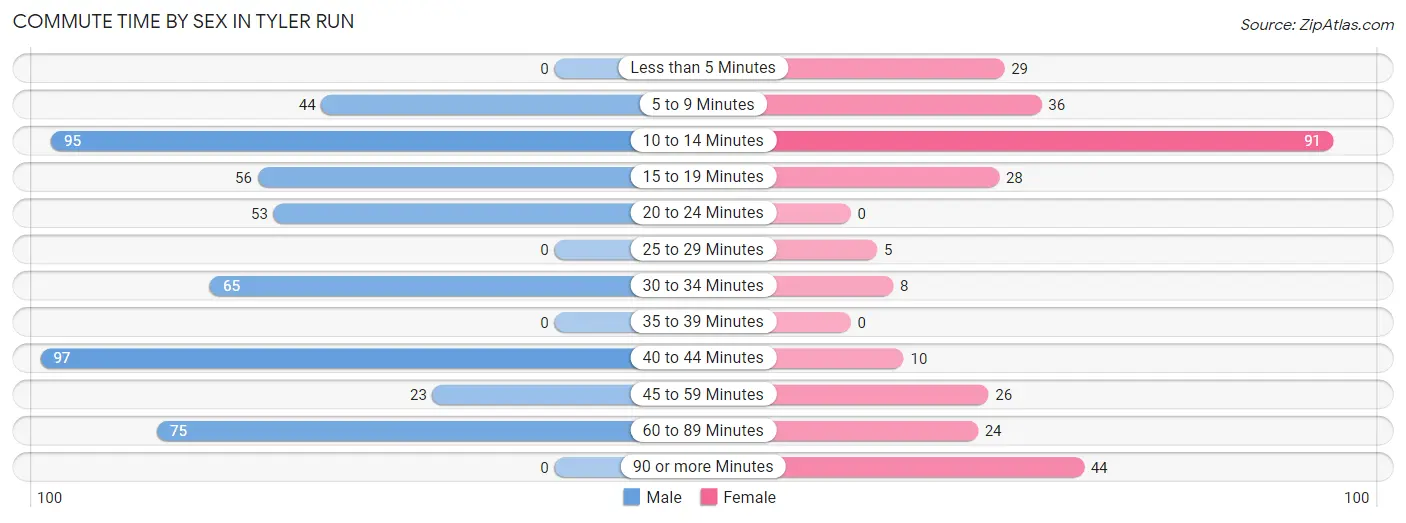
| Commute Time | Male | Female |
| Less than 5 Minutes | 0 (0.0%) | 29 (9.6%) |
| 5 to 9 Minutes | 44 (8.7%) | 36 (12.0%) |
| 10 to 14 Minutes | 95 (18.7%) | 91 (30.2%) |
| 15 to 19 Minutes | 56 (11.0%) | 28 (9.3%) |
| 20 to 24 Minutes | 53 (10.4%) | 0 (0.0%) |
| 25 to 29 Minutes | 0 (0.0%) | 5 (1.7%) |
| 30 to 34 Minutes | 65 (12.8%) | 8 (2.7%) |
| 35 to 39 Minutes | 0 (0.0%) | 0 (0.0%) |
| 40 to 44 Minutes | 97 (19.1%) | 10 (3.3%) |
| 45 to 59 Minutes | 23 (4.5%) | 26 (8.6%) |
| 60 to 89 Minutes | 75 (14.8%) | 24 (8.0%) |
| 90 or more Minutes | 0 (0.0%) | 44 (14.6%) |
Time of Departure to Work by Sex in Tyler Run
The most frequent times of departure to work in Tyler Run are 6:00 AM to 6:29 AM (124, 24.4%) for males and 6:30 AM to 6:59 AM (119, 39.5%) for females.
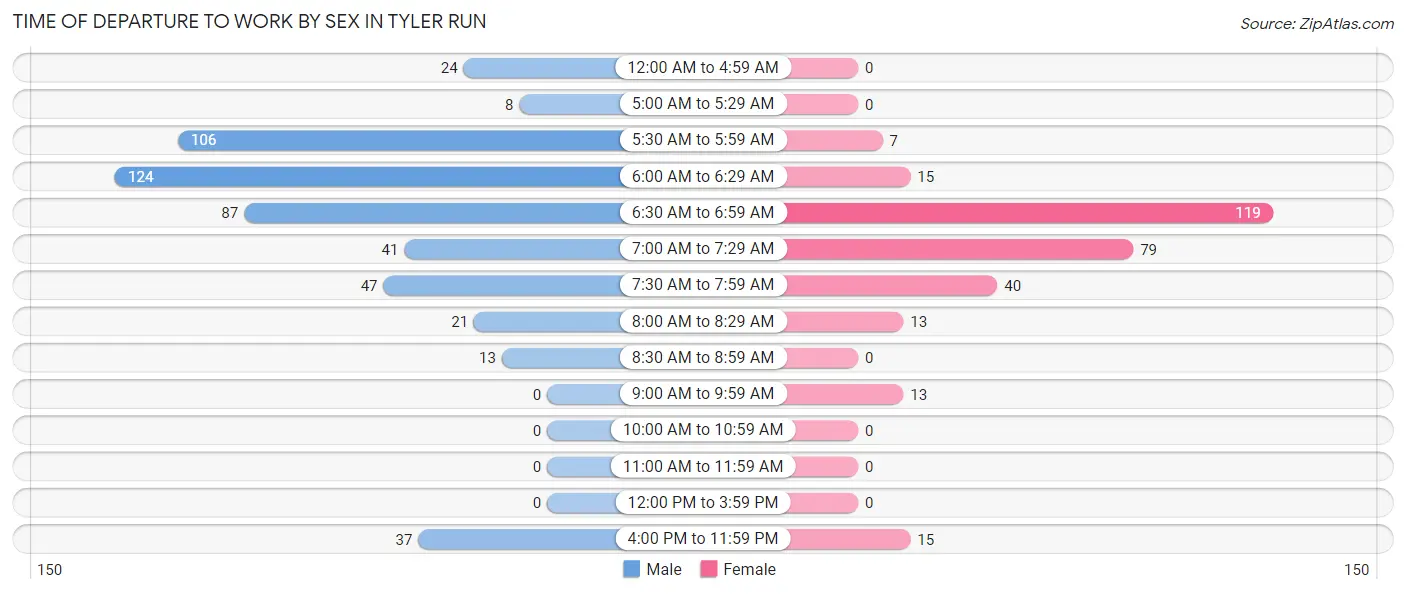
| Time of Departure | Male | Female |
| 12:00 AM to 4:59 AM | 24 (4.7%) | 0 (0.0%) |
| 5:00 AM to 5:29 AM | 8 (1.6%) | 0 (0.0%) |
| 5:30 AM to 5:59 AM | 106 (20.9%) | 7 (2.3%) |
| 6:00 AM to 6:29 AM | 124 (24.4%) | 15 (5.0%) |
| 6:30 AM to 6:59 AM | 87 (17.1%) | 119 (39.5%) |
| 7:00 AM to 7:29 AM | 41 (8.1%) | 79 (26.3%) |
| 7:30 AM to 7:59 AM | 47 (9.2%) | 40 (13.3%) |
| 8:00 AM to 8:29 AM | 21 (4.1%) | 13 (4.3%) |
| 8:30 AM to 8:59 AM | 13 (2.6%) | 0 (0.0%) |
| 9:00 AM to 9:59 AM | 0 (0.0%) | 13 (4.3%) |
| 10:00 AM to 10:59 AM | 0 (0.0%) | 0 (0.0%) |
| 11:00 AM to 11:59 AM | 0 (0.0%) | 0 (0.0%) |
| 12:00 PM to 3:59 PM | 0 (0.0%) | 0 (0.0%) |
| 4:00 PM to 11:59 PM | 37 (7.3%) | 15 (5.0%) |
| Total | 508 (100.0%) | 301 (100.0%) |
Housing Occupancy in Tyler Run
Occupancy by Ownership in Tyler Run
Of the total 916 dwellings in Tyler Run, owner-occupied units account for 699 (76.3%), while renter-occupied units make up 217 (23.7%).
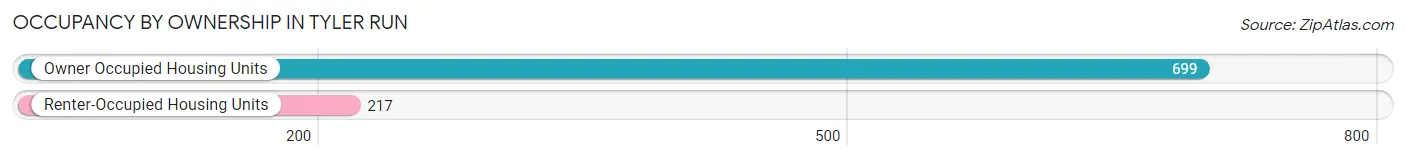
| Occupancy | # Housing Units | % Housing Units |
| Owner Occupied Housing Units | 699 | 76.3% |
| Renter-Occupied Housing Units | 217 | 23.7% |
| Total Occupied Housing Units | 916 | 100.0% |
Occupancy by Household Size in Tyler Run
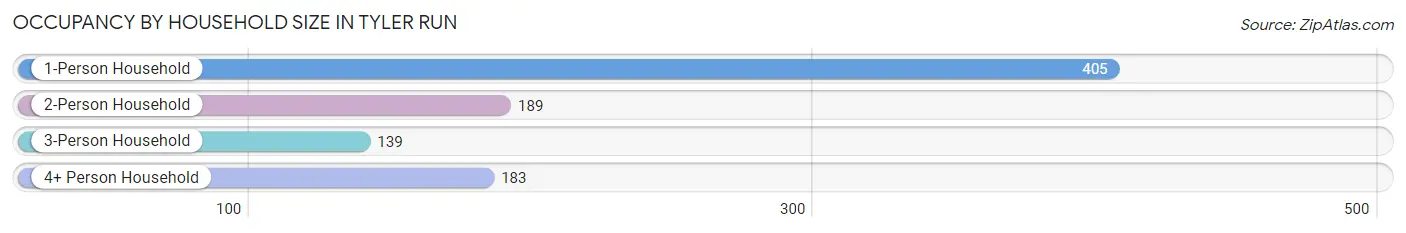
| Household Size | # Housing Units | % Housing Units |
| 1-Person Household | 405 | 44.2% |
| 2-Person Household | 189 | 20.6% |
| 3-Person Household | 139 | 15.2% |
| 4+ Person Household | 183 | 20.0% |
| Total Housing Units | 916 | 100.0% |
Occupancy by Ownership by Household Size in Tyler Run
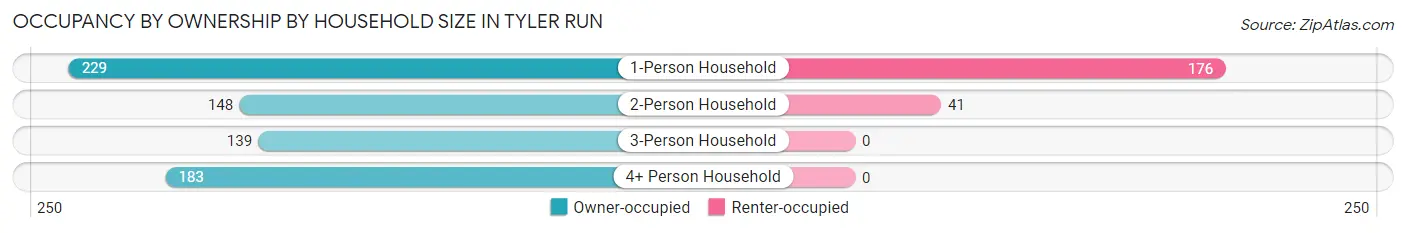
| Household Size | Owner-occupied | Renter-occupied |
| 1-Person Household | 229 (56.5%) | 176 (43.5%) |
| 2-Person Household | 148 (78.3%) | 41 (21.7%) |
| 3-Person Household | 139 (100.0%) | 0 (0.0%) |
| 4+ Person Household | 183 (100.0%) | 0 (0.0%) |
| Total Housing Units | 699 (76.3%) | 217 (23.7%) |
Occupancy by Educational Attainment in Tyler Run
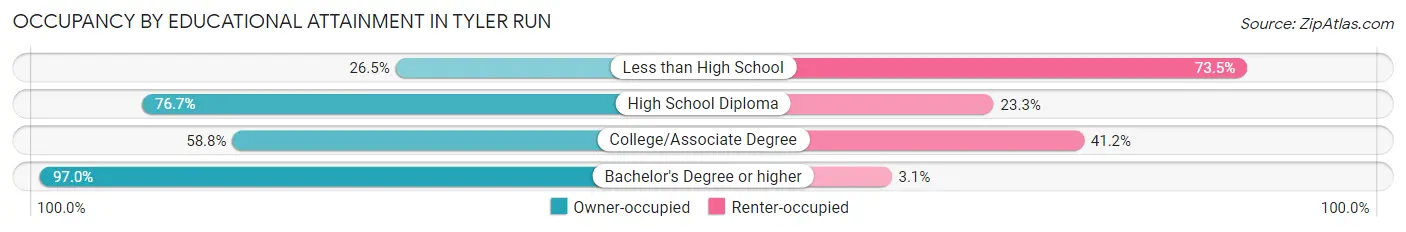
| Household Size | Owner-occupied | Renter-occupied |
| Less than High School | 18 (26.5%) | 50 (73.5%) |
| High School Diploma | 191 (76.7%) | 58 (23.3%) |
| College/Associate Degree | 140 (58.8%) | 98 (41.2%) |
| Bachelor's Degree or higher | 350 (97.0%) | 11 (3.0%) |
Occupancy by Age of Householder in Tyler Run
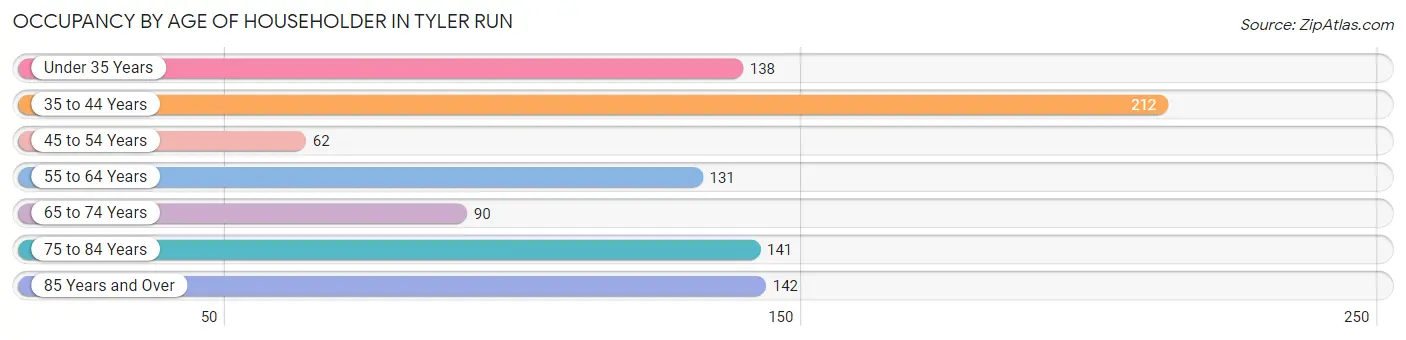
| Age Bracket | # Households | % Households |
| Under 35 Years | 138 | 15.1% |
| 35 to 44 Years | 212 | 23.1% |
| 45 to 54 Years | 62 | 6.8% |
| 55 to 64 Years | 131 | 14.3% |
| 65 to 74 Years | 90 | 9.8% |
| 75 to 84 Years | 141 | 15.4% |
| 85 Years and Over | 142 | 15.5% |
| Total | 916 | 100.0% |
Housing Finances in Tyler Run
Median Income by Occupancy in Tyler Run
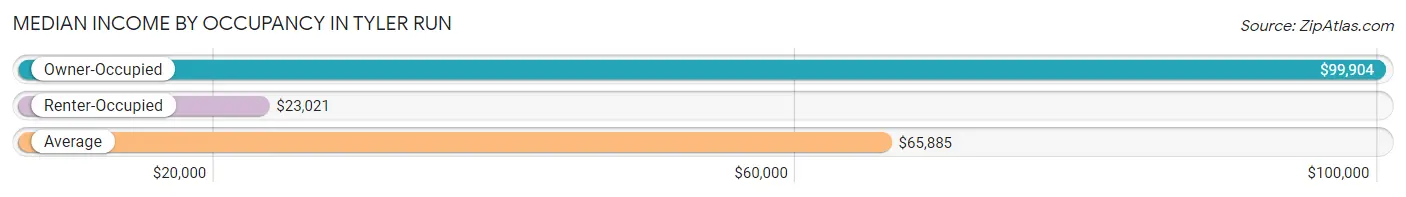
| Occupancy Type | # Households | Median Income |
| Owner-Occupied | 699 (76.3%) | $99,904 |
| Renter-Occupied | 217 (23.7%) | $23,021 |
| Average | 916 (100.0%) | $65,885 |
Occupancy by Householder Income Bracket in Tyler Run
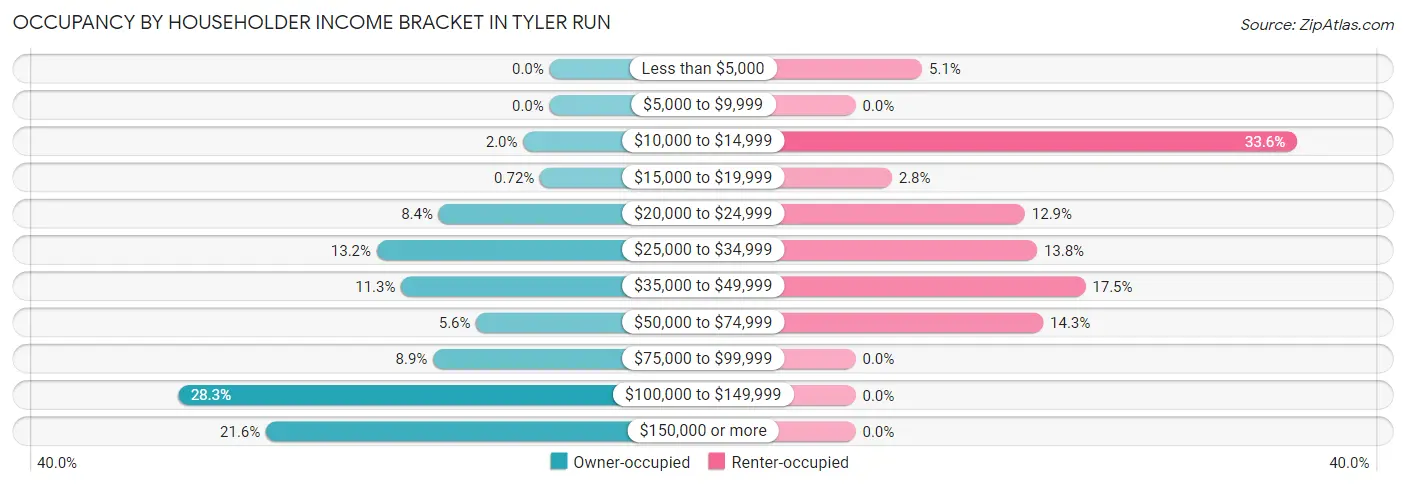
| Income Bracket | Owner-occupied | Renter-occupied |
| Less than $5,000 | 0 (0.0%) | 11 (5.1%) |
| $5,000 to $9,999 | 0 (0.0%) | 0 (0.0%) |
| $10,000 to $14,999 | 14 (2.0%) | 73 (33.6%) |
| $15,000 to $19,999 | 5 (0.7%) | 6 (2.8%) |
| $20,000 to $24,999 | 59 (8.4%) | 28 (12.9%) |
| $25,000 to $34,999 | 92 (13.2%) | 30 (13.8%) |
| $35,000 to $49,999 | 79 (11.3%) | 38 (17.5%) |
| $50,000 to $74,999 | 39 (5.6%) | 31 (14.3%) |
| $75,000 to $99,999 | 62 (8.9%) | 0 (0.0%) |
| $100,000 to $149,999 | 198 (28.3%) | 0 (0.0%) |
| $150,000 or more | 151 (21.6%) | 0 (0.0%) |
| Total | 699 (100.0%) | 217 (100.0%) |
Monthly Housing Cost Tiers in Tyler Run
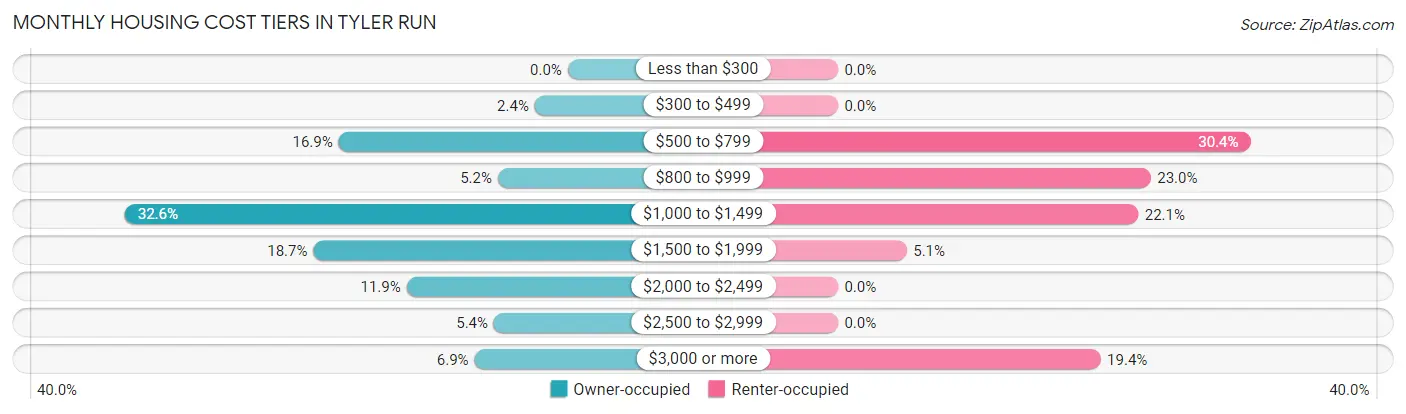
| Monthly Cost | Owner-occupied | Renter-occupied |
| Less than $300 | 0 (0.0%) | 0 (0.0%) |
| $300 to $499 | 17 (2.4%) | 0 (0.0%) |
| $500 to $799 | 118 (16.9%) | 66 (30.4%) |
| $800 to $999 | 36 (5.1%) | 50 (23.0%) |
| $1,000 to $1,499 | 228 (32.6%) | 48 (22.1%) |
| $1,500 to $1,999 | 131 (18.7%) | 11 (5.1%) |
| $2,000 to $2,499 | 83 (11.9%) | 0 (0.0%) |
| $2,500 to $2,999 | 38 (5.4%) | 0 (0.0%) |
| $3,000 or more | 48 (6.9%) | 42 (19.4%) |
| Total | 699 (100.0%) | 217 (100.0%) |
Physical Housing Characteristics in Tyler Run
Housing Structures in Tyler Run
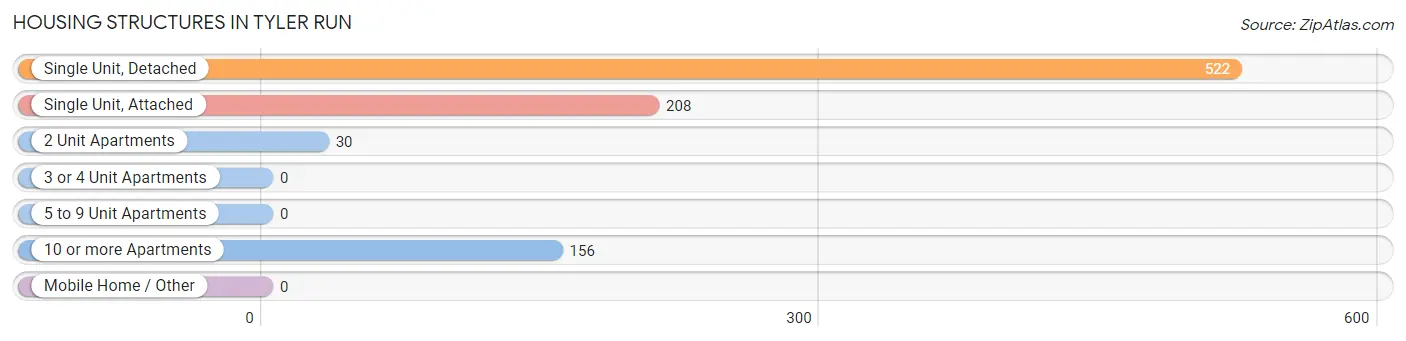
| Structure Type | # Housing Units | % Housing Units |
| Single Unit, Detached | 522 | 57.0% |
| Single Unit, Attached | 208 | 22.7% |
| 2 Unit Apartments | 30 | 3.3% |
| 3 or 4 Unit Apartments | 0 | 0.0% |
| 5 to 9 Unit Apartments | 0 | 0.0% |
| 10 or more Apartments | 156 | 17.0% |
| Mobile Home / Other | 0 | 0.0% |
| Total | 916 | 100.0% |
Housing Structures by Occupancy in Tyler Run
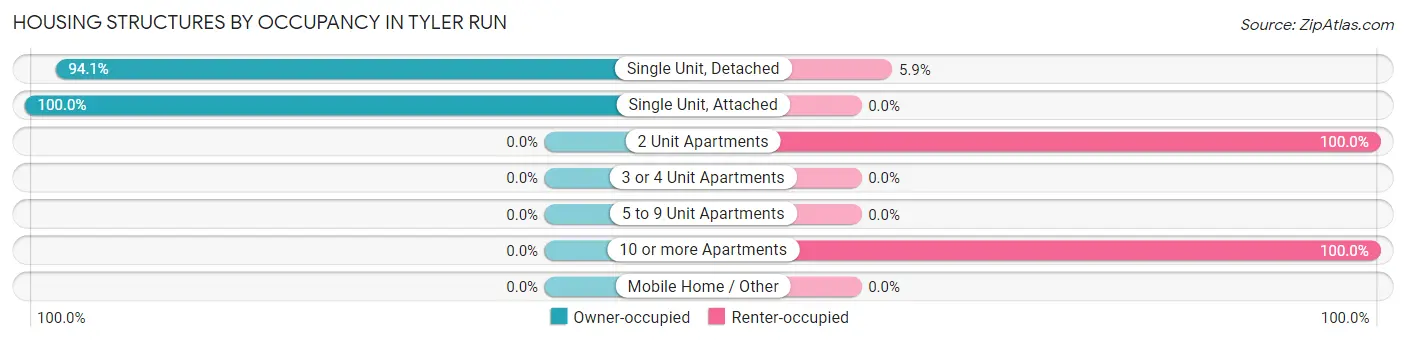
| Structure Type | Owner-occupied | Renter-occupied |
| Single Unit, Detached | 491 (94.1%) | 31 (5.9%) |
| Single Unit, Attached | 208 (100.0%) | 0 (0.0%) |
| 2 Unit Apartments | 0 (0.0%) | 30 (100.0%) |
| 3 or 4 Unit Apartments | 0 (0.0%) | 0 (0.0%) |
| 5 to 9 Unit Apartments | 0 (0.0%) | 0 (0.0%) |
| 10 or more Apartments | 0 (0.0%) | 156 (100.0%) |
| Mobile Home / Other | 0 (0.0%) | 0 (0.0%) |
| Total | 699 (76.3%) | 217 (23.7%) |
Housing Structures by Number of Rooms in Tyler Run
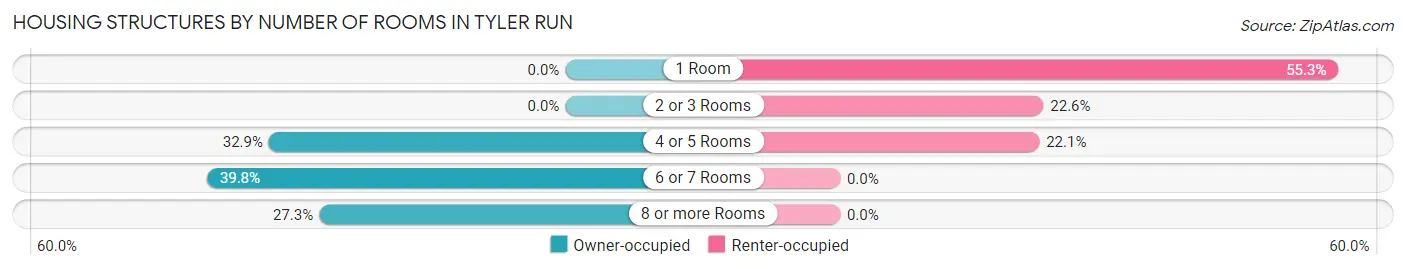
| Number of Rooms | Owner-occupied | Renter-occupied |
| 1 Room | 0 (0.0%) | 120 (55.3%) |
| 2 or 3 Rooms | 0 (0.0%) | 49 (22.6%) |
| 4 or 5 Rooms | 230 (32.9%) | 48 (22.1%) |
| 6 or 7 Rooms | 278 (39.8%) | 0 (0.0%) |
| 8 or more Rooms | 191 (27.3%) | 0 (0.0%) |
| Total | 699 (100.0%) | 217 (100.0%) |
Housing Structure by Heating Type in Tyler Run
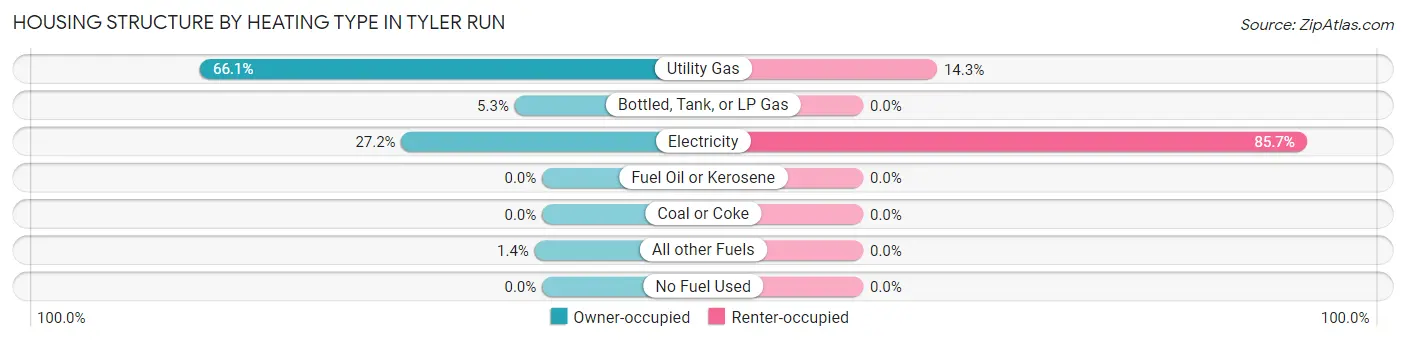
| Heating Type | Owner-occupied | Renter-occupied |
| Utility Gas | 462 (66.1%) | 31 (14.3%) |
| Bottled, Tank, or LP Gas | 37 (5.3%) | 0 (0.0%) |
| Electricity | 190 (27.2%) | 186 (85.7%) |
| Fuel Oil or Kerosene | 0 (0.0%) | 0 (0.0%) |
| Coal or Coke | 0 (0.0%) | 0 (0.0%) |
| All other Fuels | 10 (1.4%) | 0 (0.0%) |
| No Fuel Used | 0 (0.0%) | 0 (0.0%) |
| Total | 699 (100.0%) | 217 (100.0%) |
Household Vehicle Usage in Tyler Run
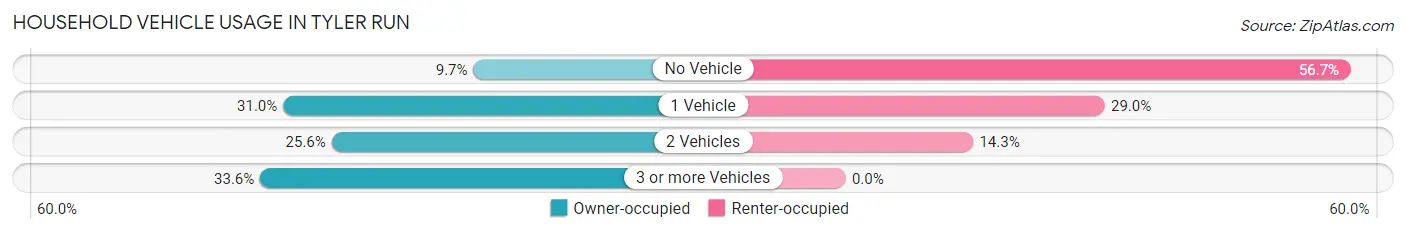
| Vehicles per Household | Owner-occupied | Renter-occupied |
| No Vehicle | 68 (9.7%) | 123 (56.7%) |
| 1 Vehicle | 217 (31.0%) | 63 (29.0%) |
| 2 Vehicles | 179 (25.6%) | 31 (14.3%) |
| 3 or more Vehicles | 235 (33.6%) | 0 (0.0%) |
| Total | 699 (100.0%) | 217 (100.0%) |
Real Estate & Mortgages in Tyler Run
Real Estate and Mortgage Overview in Tyler Run
| Characteristic | Without Mortgage | With Mortgage |
| Housing Units | 230 | 469 |
| Median Property Value | $203,800 | $213,500 |
| Median Household Income | $75,000 | $89 |
| Monthly Housing Costs | $750 | $48 |
| Real Estate Taxes | $4,018 | $0 |
Property Value by Mortgage Status in Tyler Run
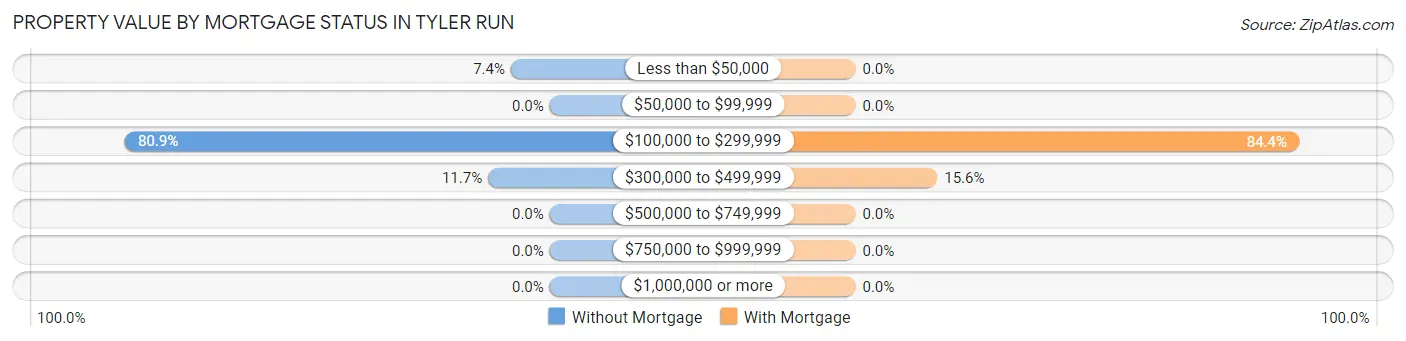
| Property Value | Without Mortgage | With Mortgage |
| Less than $50,000 | 17 (7.4%) | 0 (0.0%) |
| $50,000 to $99,999 | 0 (0.0%) | 0 (0.0%) |
| $100,000 to $299,999 | 186 (80.9%) | 396 (84.4%) |
| $300,000 to $499,999 | 27 (11.7%) | 73 (15.6%) |
| $500,000 to $749,999 | 0 (0.0%) | 0 (0.0%) |
| $750,000 to $999,999 | 0 (0.0%) | 0 (0.0%) |
| $1,000,000 or more | 0 (0.0%) | 0 (0.0%) |
| Total | 230 (100.0%) | 469 (100.0%) |
Household Income by Mortgage Status in Tyler Run
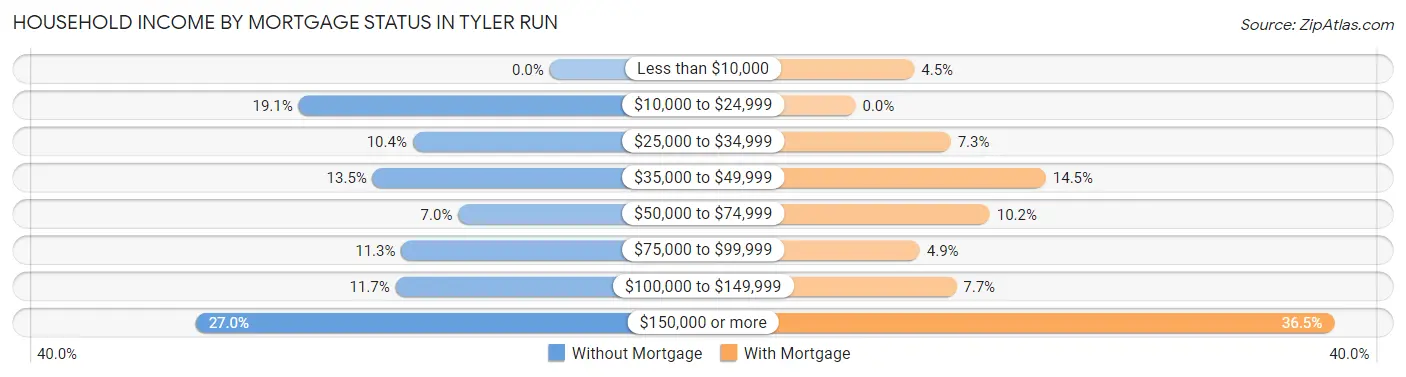
| Household Income | Without Mortgage | With Mortgage |
| Less than $10,000 | 0 (0.0%) | 21 (4.5%) |
| $10,000 to $24,999 | 44 (19.1%) | 0 (0.0%) |
| $25,000 to $34,999 | 24 (10.4%) | 34 (7.2%) |
| $35,000 to $49,999 | 31 (13.5%) | 68 (14.5%) |
| $50,000 to $74,999 | 16 (7.0%) | 48 (10.2%) |
| $75,000 to $99,999 | 26 (11.3%) | 23 (4.9%) |
| $100,000 to $149,999 | 27 (11.7%) | 36 (7.7%) |
| $150,000 or more | 62 (27.0%) | 171 (36.5%) |
| Total | 230 (100.0%) | 469 (100.0%) |
Property Value to Household Income Ratio in Tyler Run
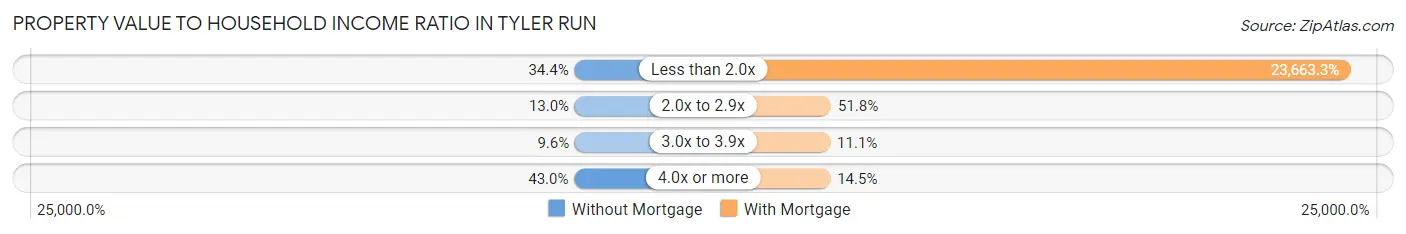
| Value-to-Income Ratio | Without Mortgage | With Mortgage |
| Less than 2.0x | 79 (34.4%) | 110,981 (23,663.3%) |
| 2.0x to 2.9x | 30 (13.0%) | 243 (51.8%) |
| 3.0x to 3.9x | 22 (9.6%) | 52 (11.1%) |
| 4.0x or more | 99 (43.0%) | 68 (14.5%) |
| Total | 230 (100.0%) | 469 (100.0%) |
Real Estate Taxes by Mortgage Status in Tyler Run
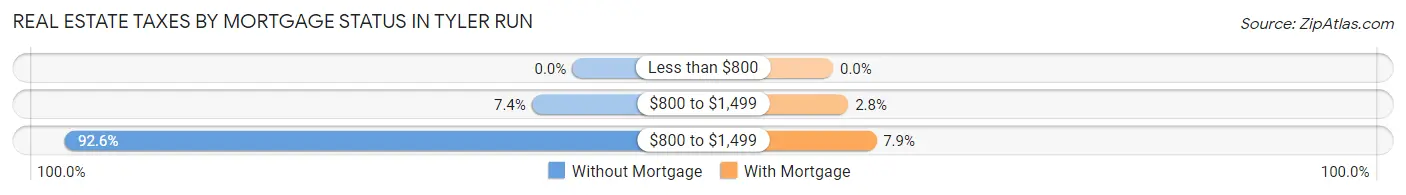
| Property Taxes | Without Mortgage | With Mortgage |
| Less than $800 | 0 (0.0%) | 0 (0.0%) |
| $800 to $1,499 | 17 (7.4%) | 13 (2.8%) |
| $800 to $1,499 | 213 (92.6%) | 37 (7.9%) |
| Total | 230 (100.0%) | 469 (100.0%) |
Health & Disability in Tyler Run
Health Insurance Coverage by Age in Tyler Run
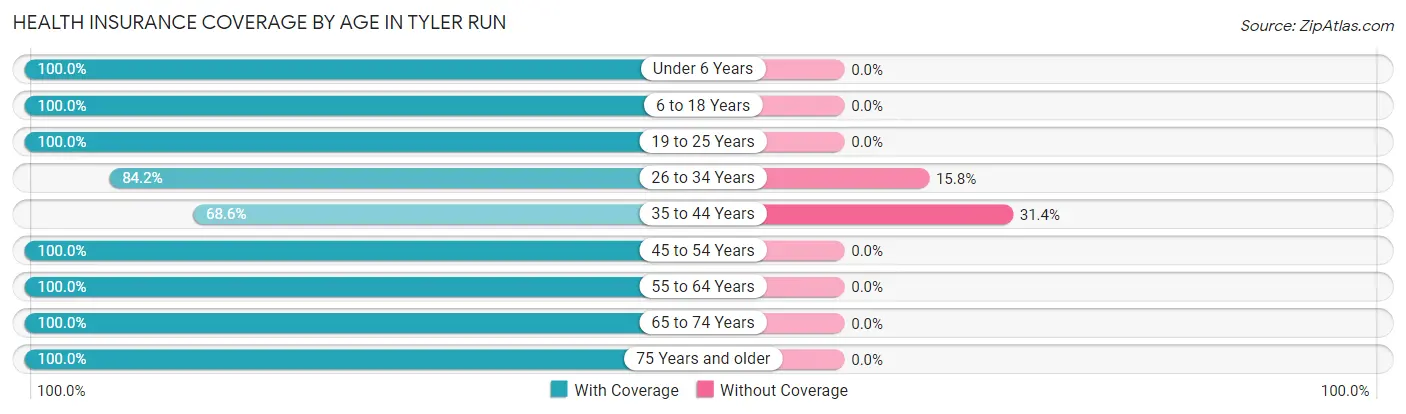
| Age Bracket | With Coverage | Without Coverage |
| Under 6 Years | 162 (100.0%) | 0 (0.0%) |
| 6 to 18 Years | 202 (100.0%) | 0 (0.0%) |
| 19 to 25 Years | 66 (100.0%) | 0 (0.0%) |
| 26 to 34 Years | 176 (84.2%) | 33 (15.8%) |
| 35 to 44 Years | 203 (68.6%) | 93 (31.4%) |
| 45 to 54 Years | 124 (100.0%) | 0 (0.0%) |
| 55 to 64 Years | 231 (100.0%) | 0 (0.0%) |
| 65 to 74 Years | 201 (100.0%) | 0 (0.0%) |
| 75 Years and older | 403 (100.0%) | 0 (0.0%) |
| Total | 1,768 (93.3%) | 126 (6.7%) |
Health Insurance Coverage by Citizenship Status in Tyler Run
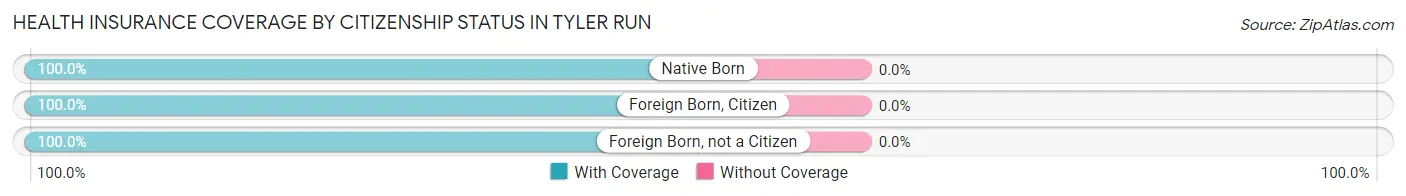
| Citizenship Status | With Coverage | Without Coverage |
| Native Born | 162 (100.0%) | 0 (0.0%) |
| Foreign Born, Citizen | 202 (100.0%) | 0 (0.0%) |
| Foreign Born, not a Citizen | 66 (100.0%) | 0 (0.0%) |
Health Insurance Coverage by Household Income in Tyler Run
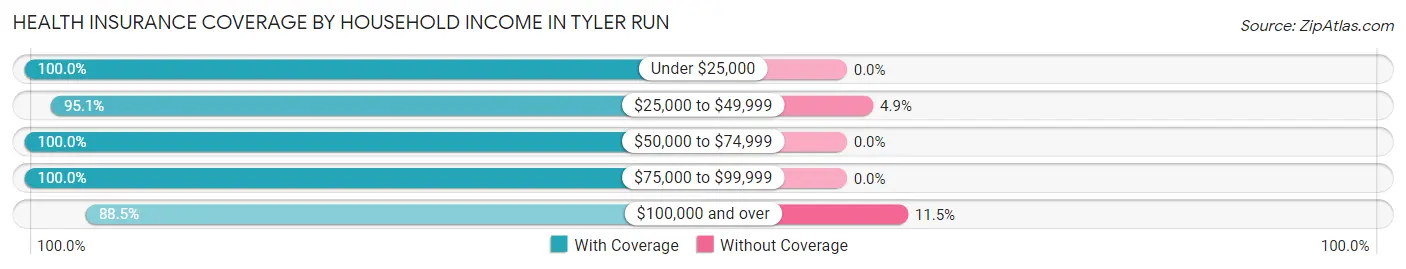
| Household Income | With Coverage | Without Coverage |
| Under $25,000 | 260 (100.0%) | 0 (0.0%) |
| $25,000 to $49,999 | 539 (95.1%) | 28 (4.9%) |
| $50,000 to $74,999 | 70 (100.0%) | 0 (0.0%) |
| $75,000 to $99,999 | 142 (100.0%) | 0 (0.0%) |
| $100,000 and over | 757 (88.5%) | 98 (11.5%) |
Public vs Private Health Insurance Coverage by Age in Tyler Run
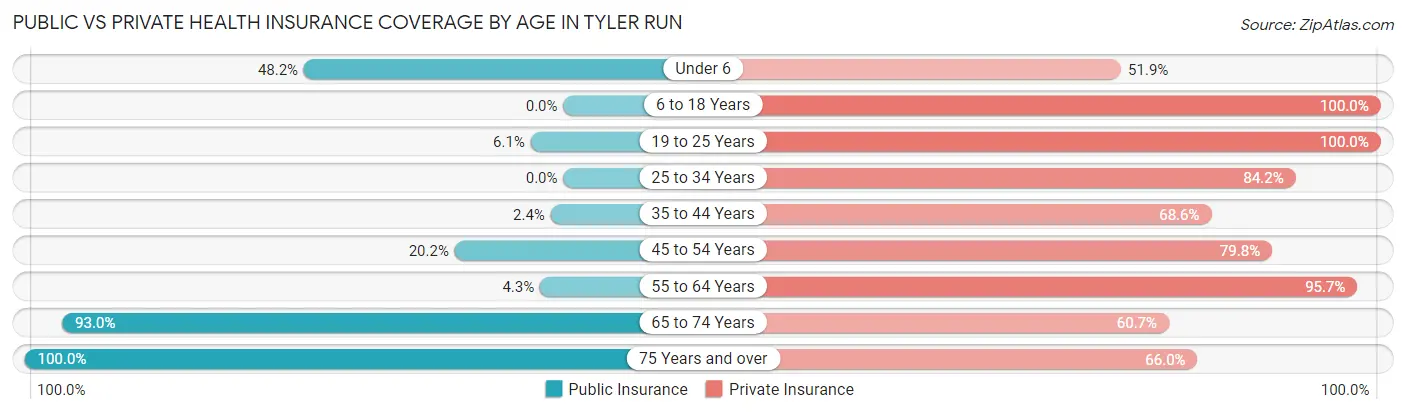
| Age Bracket | Public Insurance | Private Insurance |
| Under 6 | 78 (48.1%) | 84 (51.8%) |
| 6 to 18 Years | 0 (0.0%) | 202 (100.0%) |
| 19 to 25 Years | 4 (6.1%) | 66 (100.0%) |
| 25 to 34 Years | 0 (0.0%) | 176 (84.2%) |
| 35 to 44 Years | 7 (2.4%) | 203 (68.6%) |
| 45 to 54 Years | 25 (20.2%) | 99 (79.8%) |
| 55 to 64 Years | 10 (4.3%) | 221 (95.7%) |
| 65 to 74 Years | 187 (93.0%) | 122 (60.7%) |
| 75 Years and over | 403 (100.0%) | 266 (66.0%) |
| Total | 714 (37.7%) | 1,439 (76.0%) |
Disability Status by Sex by Age in Tyler Run
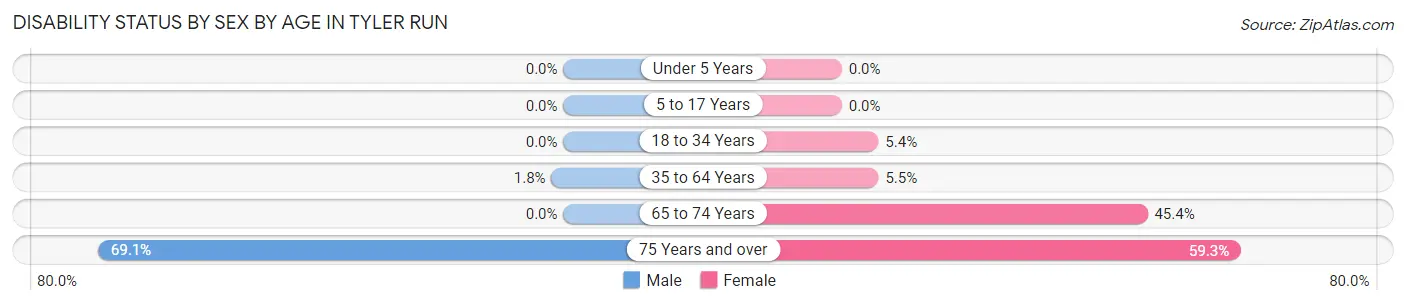
| Age Bracket | Male | Female |
| Under 5 Years | 0 (0.0%) | 0 (0.0%) |
| 5 to 17 Years | 0 (0.0%) | 0 (0.0%) |
| 18 to 34 Years | 0 (0.0%) | 8 (5.4%) |
| 35 to 64 Years | 6 (1.8%) | 17 (5.4%) |
| 65 to 74 Years | 0 (0.0%) | 69 (45.4%) |
| 75 Years and over | 85 (69.1%) | 166 (59.3%) |
Disability Class by Sex by Age in Tyler Run
Disability Class: Hearing Difficulty
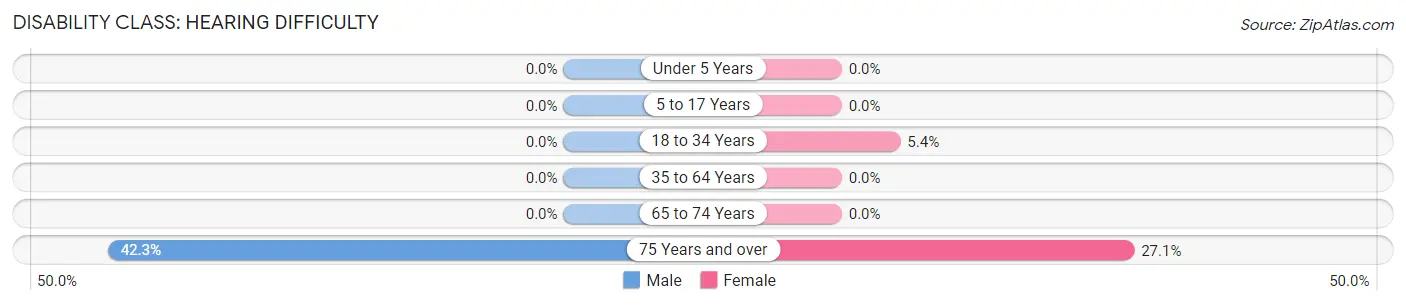
| Age Bracket | Male | Female |
| Under 5 Years | 0 (0.0%) | 0 (0.0%) |
| 5 to 17 Years | 0 (0.0%) | 0 (0.0%) |
| 18 to 34 Years | 0 (0.0%) | 8 (5.4%) |
| 35 to 64 Years | 0 (0.0%) | 0 (0.0%) |
| 65 to 74 Years | 0 (0.0%) | 0 (0.0%) |
| 75 Years and over | 52 (42.3%) | 76 (27.1%) |
Disability Class: Vision Difficulty
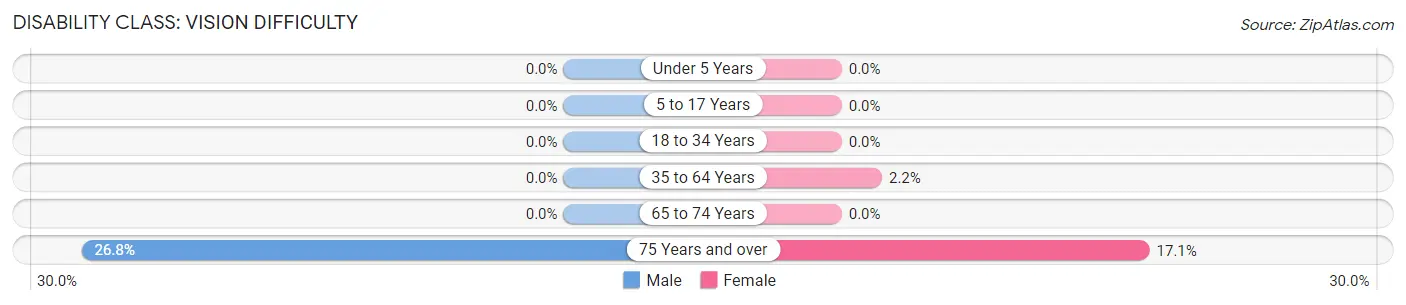
| Age Bracket | Male | Female |
| Under 5 Years | 0 (0.0%) | 0 (0.0%) |
| 5 to 17 Years | 0 (0.0%) | 0 (0.0%) |
| 18 to 34 Years | 0 (0.0%) | 0 (0.0%) |
| 35 to 64 Years | 0 (0.0%) | 7 (2.2%) |
| 65 to 74 Years | 0 (0.0%) | 0 (0.0%) |
| 75 Years and over | 33 (26.8%) | 48 (17.1%) |
Disability Class: Cognitive Difficulty
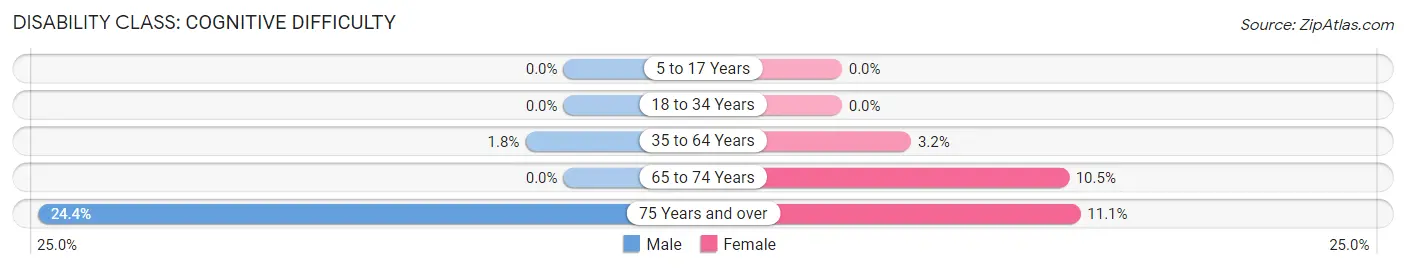
| Age Bracket | Male | Female |
| 5 to 17 Years | 0 (0.0%) | 0 (0.0%) |
| 18 to 34 Years | 0 (0.0%) | 0 (0.0%) |
| 35 to 64 Years | 6 (1.8%) | 10 (3.2%) |
| 65 to 74 Years | 0 (0.0%) | 16 (10.5%) |
| 75 Years and over | 30 (24.4%) | 31 (11.1%) |
Disability Class: Ambulatory Difficulty
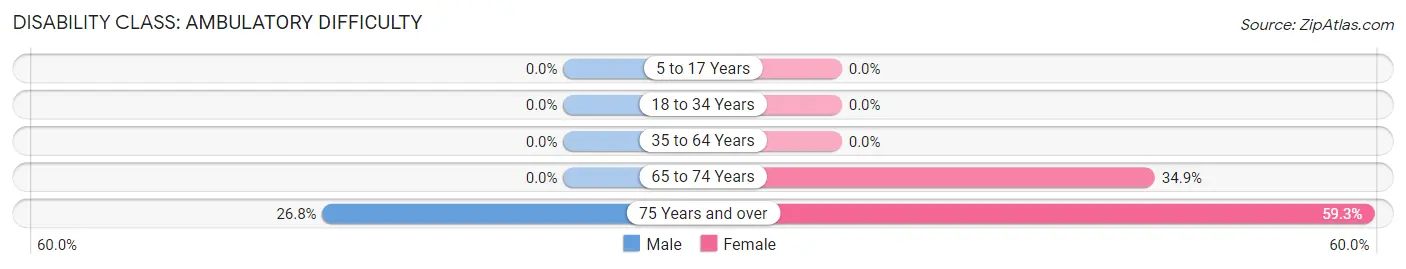
| Age Bracket | Male | Female |
| 5 to 17 Years | 0 (0.0%) | 0 (0.0%) |
| 18 to 34 Years | 0 (0.0%) | 0 (0.0%) |
| 35 to 64 Years | 0 (0.0%) | 0 (0.0%) |
| 65 to 74 Years | 0 (0.0%) | 53 (34.9%) |
| 75 Years and over | 33 (26.8%) | 166 (59.3%) |
Disability Class: Self-Care Difficulty
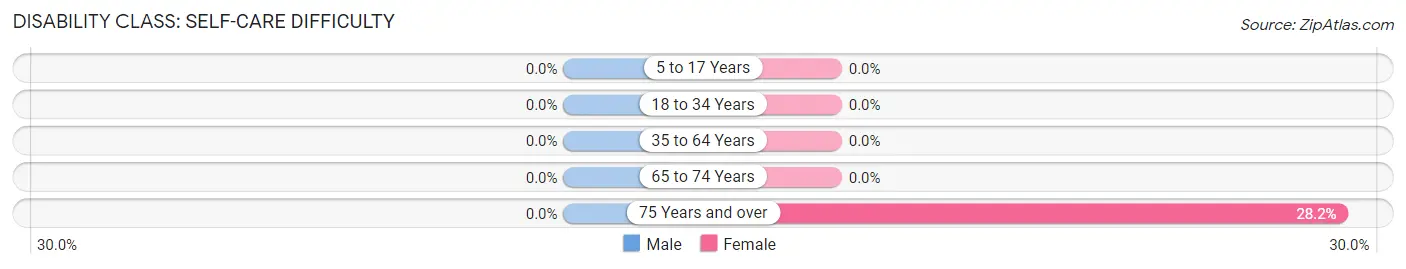
| Age Bracket | Male | Female |
| 5 to 17 Years | 0 (0.0%) | 0 (0.0%) |
| 18 to 34 Years | 0 (0.0%) | 0 (0.0%) |
| 35 to 64 Years | 0 (0.0%) | 0 (0.0%) |
| 65 to 74 Years | 0 (0.0%) | 0 (0.0%) |
| 75 Years and over | 0 (0.0%) | 79 (28.2%) |
Technology Access in Tyler Run
Computing Device Access in Tyler Run
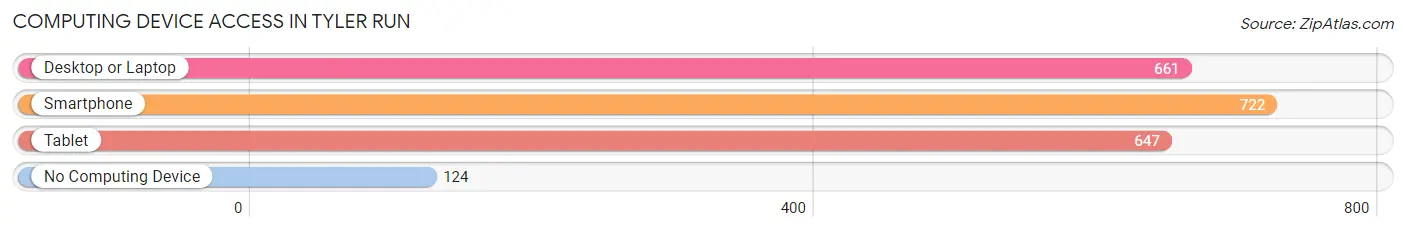
| Device Type | # Households | % Households |
| Desktop or Laptop | 661 | 72.2% |
| Smartphone | 722 | 78.8% |
| Tablet | 647 | 70.6% |
| No Computing Device | 124 | 13.5% |
| Total | 916 | 100.0% |
Internet Access in Tyler Run
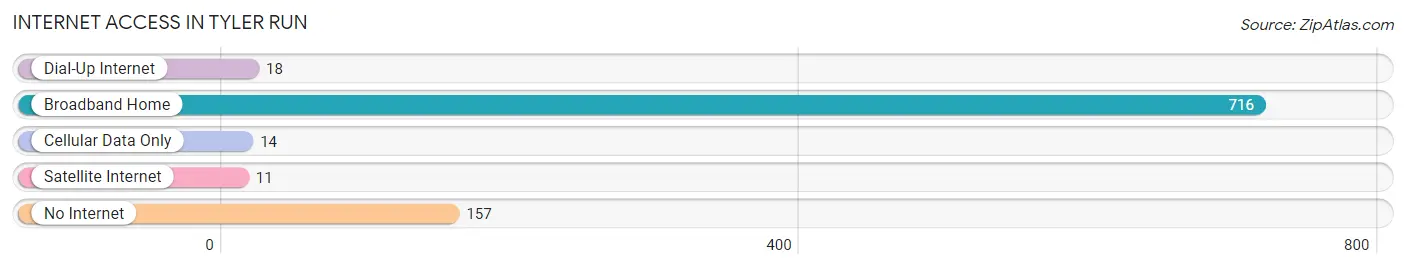
| Internet Type | # Households | % Households |
| Dial-Up Internet | 18 | 2.0% |
| Broadband Home | 716 | 78.2% |
| Cellular Data Only | 14 | 1.5% |
| Satellite Internet | 11 | 1.2% |
| No Internet | 157 | 17.1% |
| Total | 916 | 100.0% |
Tyler Run Summary
Pennsylvania, a state located in the northeastern United States, is a diverse and vibrant state with a rich history, geography, economy, and demographics.
History
Pennsylvania was founded in 1681 by William Penn, a Quaker, who was granted a charter by King Charles II of England. Penn wanted to create a colony that was tolerant of all religions and cultures, and he named the colony after his father, Admiral William Penn. Pennsylvania was the second state to ratify the United States Constitution in 1787, and it was the first state to join the Union.
Pennsylvania has a long and varied history. During the Revolutionary War, Pennsylvania was a major battleground, and it was the site of the Battle of Gettysburg, one of the most important battles of the war. Pennsylvania was also a major center of industry during the Industrial Revolution, and it was home to many of the nation’s first steel mills and factories.
Geography
Pennsylvania is located in the northeastern United States, and it is bordered by New York, New Jersey, Delaware, Maryland, and West Virginia. The state is divided into two regions: the Appalachian Mountains in the east and the Allegheny Plateau in the west. The Appalachian Mountains are home to the highest point in the state, Mount Davis, which stands at 3,213 feet. The Allegheny Plateau is home to the Allegheny National Forest, which is the largest national forest in the eastern United States.
Pennsylvania is home to many rivers, including the Susquehanna, Delaware, and Allegheny. The state also has many lakes, including Lake Erie, Lake Wallenpaupack, and Lake Nockamixon.
Economy
Pennsylvania’s economy is diverse and includes agriculture, manufacturing, and services. The state is a major producer of dairy products, poultry, and eggs, and it is also a major producer of coal, natural gas, and oil. Pennsylvania is also home to many large corporations, including Hershey, PPG Industries, and PNC Financial Services.
The state’s economy is also supported by tourism. Pennsylvania is home to many popular tourist attractions, including the Liberty Bell, Independence Hall, and the Gettysburg National Military Park.
Demographics
Pennsylvania has a population of 12.8 million people, making it the sixth most populous state in the United States. The state is home to many different ethnic and racial groups, including African Americans, Hispanics, Asians, and Native Americans. The largest cities in the state are Philadelphia, Pittsburgh, Allentown, and Erie.
Pennsylvania is also home to many different religions, including Christianity, Judaism, Islam, and Buddhism. The state is also home to many different languages, including English, Spanish, and German.
Conclusion
Pennsylvania is a diverse and vibrant state with a rich history, geography, economy, and demographics. The state is home to many different ethnic and racial groups, religions, and languages, and it is a major producer of dairy products, poultry, and eggs. Pennsylvania is also home to many popular tourist attractions, and it is a major center of industry.
Common Questions
What is Per Capita Income in Tyler Run?
Per Capita income in Tyler Run is $39,161.
What is the Median Family Income in Tyler Run?
Median Family Income in Tyler Run is $78,088.
What is the Median Household income in Tyler Run?
Median Household Income in Tyler Run is $65,885.
What is Income or Wage Gap in Tyler Run?
Income or Wage Gap in Tyler Run is 44.0%.
Women in Tyler Run earn 56.0 cents for every dollar earned by a man.
What is Inequality or Gini Index in Tyler Run?
Inequality or Gini Index in Tyler Run is 0.41.
What is the Total Population of Tyler Run?
Total Population of Tyler Run is 1,943.
What is the Total Male Population of Tyler Run?
Total Male Population of Tyler Run is 917.
What is the Total Female Population of Tyler Run?
Total Female Population of Tyler Run is 1,026.
What is the Ratio of Males per 100 Females in Tyler Run?
There are 89.38 Males per 100 Females in Tyler Run.
What is the Ratio of Females per 100 Males in Tyler Run?
There are 111.89 Females per 100 Males in Tyler Run.
What is the Median Population Age in Tyler Run?
Median Population Age in Tyler Run is 46.8 Years.
What is the Average Family Size in Tyler Run
Average Family Size in Tyler Run is 2.8 People.
What is the Average Household Size in Tyler Run
Average Household Size in Tyler Run is 2.1 People.
How Large is the Labor Force in Tyler Run?
There are 886 People in the Labor Forcein in Tyler Run.
What is the Percentage of People in the Labor Force in Tyler Run?
56.1% of People are in the Labor Force in Tyler Run.
What is the Unemployment Rate in Tyler Run?
Unemployment Rate in Tyler Run is 5.0%.